UNITED STATES
SECURITIES AND EXCHANGE COMMISSION
Washington, D.C. 20549
Form N-CSR
CERTIFIED SHAREHOLDER REPORT OF REGISTERED MANAGEMENT
INVESTMENT COMPANIES
Investment Company Act File Number 811-04550
THE MAINSTAY FUNDS
(Exact name of Registrant as specified in charter)
51 Madison Avenue, New York, NY 10010
(Address of principal executive offices) (Zip code)
J. Kevin Gao, Esq.
30 Hudson Street
Jersey City, New Jersey 07302
(Name and address of agent for service)
Registrant’s telephone number, including area code: (212) 576-7000
Date of fiscal year end: October 31
Date of reporting period: October 31, 2023
FORM N-CSR
| Item 1. | Reports to Stockholders. |
MainStay Candriam Emerging Markets Debt Fund
Message from the President and Annual Report
October 31, 2023
Special Notice:
Beginning in July 2024, new regulations issued by the Securities and Exchange Commission (SEC) will take effect requiring open-end mutual fund companies and ETFs to (1) overhaul the content of their shareholder reports and (2) mail paper copies of the new tailored shareholder reports to shareholders who have not opted to receive these documents electronically.
If you have not yet elected to receive your shareholder reports electronically, please contact your financial intermediary or visit newyorklifeinvestments.com/accounts.
| Not FDIC/NCUA Insured | Not a Deposit | May Lose Value | No Bank Guarantee | Not Insured by Any Government Agency |
This page intentionally left blank
Message from the President
Volatile economic and geopolitical forces drove market behavior during the 12-month reporting period ended October 31, 2023. While equity markets generally gained ground, bond prices trended broadly lower.
Although the war in Ukraine, the outbreak of hostilities in the Middle East and several other notable events affected financial assets, inflation and interest rate trends stood at the forefront of market developments during most of the period. As the reporting period began, high levels of inflation already showed signs of easing in the face of aggressive rate hikes by the U.S. Federal Reserve (the “Fed”). From a peak of 9.1% in June 2022, the annualized U.S. inflation rate dropped to 7.1% in November 2022, and to 3.2% in October 2023. At the same time, the Fed increased the benchmark federal funds rate from 3.75%–4.00% at the beginning of the reporting period to 5.25%–5.50% as of October 31, 2023. As the pace of rate increases slowed during the period, investors hoped for an early shift to a looser monetary policy. However, comments from Fed members late in the period reinforced the central bank’s hawkish stance in response to surprisingly robust U.S. economic growth and rising wage pressures, thus increasing the likelihood that interest rates would stay higher for longer. International developed markets exhibited similar dynamics of elevated inflation and rising interest rates.
Despite the backdrop of high interest rates—along with political dysfunction in Washington D.C. and intensifying global geopolitical instability—equity markets managed to advance, supported by healthy consumer spending trends and persistent domestic economic growth. The S&P 500® Index, a widely regarded benchmark of large-cap U.S. market performance, gained ground, bolstered by the strong performance of energy stocks amid surging petroleum prices and mega-cap, growth-oriented, technology-related shares, which rose as investors flocked to companies creating the infrastructure for developments in artificial intelligence. Smaller-cap stocks and value-oriented shares produced milder returns. Among industry sectors, energy and
information technology posted the strongest gains. Real estate declined most sharply under pressure from rising mortgage rates and weak levels of office occupancy. Developed international markets outperformed U.S. markets, with Europe benefiting during the first half of the period from unexpected economic resilience in the face of rising energy prices and the ongoing war in Ukraine. Emerging markets posted positive results but lagged developed markets, largely due to slow economic growth in China despite the relaxation of pandemic-era lockdowns.
Bond prices were driven lower by rising yields and increasing expectations of high interest rates for an extended period of time. The U.S. yield curve steepened, with the 30-year Treasury yield exceeding 5% for the first time in more than a decade. The yield curve remained inverted, with the 10-year Treasury yield ending the period at 4.88%, compared with 5.07% for the 2-year Treasury yield. Corporate bonds outperformed long-term Treasury bonds, but still trended lower under pressure from rising yields and an uptick in default rates. Among corporates, lower-credit-quality instruments performed slightly better than their higher-credit-quality counterparts, while floating rate securities performed better still.
In the face of today’s uncertain market environment, New York Life Investments remains dedicated to providing the guidance, resources and investment solutions you need to pursue your financial goals.
Thank you for trusting us to help meet your investment needs.
Sincerely,
Kirk C. Lehneis
President
The opinions expressed are as of the date of this report and are subject to change. There is no guarantee that any forecast made will come to pass. This material does not constitute investment advice and is not intended as an endorsement of any specific investment. Past performance is no guarantee of future results.
Not part of the Annual Report
Investors should refer to the Fund’s Summary Prospectus and/or Prospectus and consider the Fund’s investment objectives, strategies, risks, charges and expenses carefully before investing. The Summary Prospectus and/or Prospectus contain this and other information about the Fund. You may obtain copies of the Fund’s Summary Prospectus, Prospectus and Statement of Additional Information, which includes information about The MainStay Funds' Trustees, free of charge, upon request, by calling toll-free 800-624-6782, by writing to NYLIFE Distributors LLC, Attn: MainStay Marketing Department, 30 Hudson Street, Jersey City, NJ 07302 or by sending an e-mail to MainStayShareholderServices@nylim.com. These documents are also available via the MainStay Funds’ website at newyorklifeinvestments.com. Please read the Fund’s Summary Prospectus and/or Prospectus carefully before investing.
Investment and Performance Comparison (Unaudited)
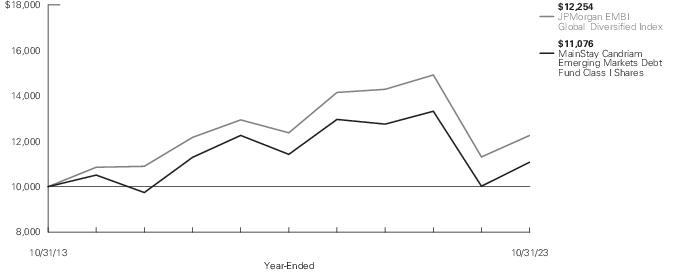
Performance data quoted represents past performance. Past performance is no guarantee of future results. Because of market volatility and other factors, current performance may be lower or higher than the figures shown. Investment return and principal value will fluctuate, and as a result, when shares are redeemed, they may be worth more or less than their original cost. The graph below depicts the historical performance of Class I shares of the Fund. Performance will vary from class to class based on differences in class-specific expenses and sales charges. For performance information current to the most recent month-end, please call 800-624-6782 or visit newyorklifeinvestments.com.
The performance table and graph do not reflect the deduction of taxes that a shareholder would pay on distributions or Fund share redemptions. Total returns reflect maximum applicable sales charges as indicated in the table below, if any, changes in share price, and reinvestment of dividend and capital gain distributions. The graph assumes the initial investment amount shown below and reflects the deduction of all sales charges that would have applied for the period of investment. Performance figures may reflect certain fee waivers and/or expense limitations, without which total returns may have been lower. For more information on share classes and current fee waivers and/or expense limitations (if any), please refer to the Notes to Financial Statements.
| Average Annual Total Returns for the Year-Ended October 31, 2023 |
| Class | Sales Charge | | Inception
Date1 | One
Year | Five
Years | Ten
Years | Gross
Expense
Ratio2 |
| Class A Shares | Maximum 4.50% Initial Sales Charge | With sales charges | 6/1/1998 | 5.25% | -1.82% | 0.29% | 1.36% |
| | | Excluding sales charges | | 10.21 | -0.91 | 0.75 | 1.36 |
| Investor Class Shares3 | Maximum 4.00% Initial Sales Charge | With sales charges | 2/28/2008 | 5.34 | -2.17 | 0.01 | 1.78 |
| | | Excluding sales charges | | 9.73 | -1.26 | 0.48 | 1.78 |
| Class B Shares4 | Maximum 5.00% CDSC | With sales charges | 6/1/1998 | 3.97 | -2.31 | -0.27 | 2.52 |
| | if Redeemed Within the First Six Years of Purchase | Excluding sales charges | | 8.97 | -1.99 | -0.27 | 2.52 |
| Class C Shares | Maximum 1.00% CDSC | With sales charges | 9/1/1998 | 7.96 | -2.01 | -0.28 | 2.52 |
| | if Redeemed Within One Year of Purchase | Excluding sales charges | | 8.96 | -2.01 | -0.28 | 2.52 |
| Class I Shares | No Sales Charge | | 8/31/2007 | 10.52 | -0.61 | 1.03 | 1.12 |
| 1. | Prior to February 28, 2017, the Fund's primary investment strategies were changed. Effective June 21, 2019, the Fund replaced its prior subadvisor and modified its investment objective and principal investment strategies. The performance in the graph and table prior to those dates reflects its prior subadvisor's, investment objective and principal investment strategies. |
| 2. | The gross expense ratios presented reflect the Fund’s “Total Annual Fund Operating Expenses” from the most recent Prospectus, as supplemented, and may differ from other expense ratios disclosed in this report. |
| 3. | Prior to June 30, 2020, the maximum initial sales charge was 4.50%, which is reflected in the applicable average annual total return figures shown. |
| 4. | Class B shares are closed to all new purchases as well as additional investments by existing Class B shareholders and will be converted into Class A or Investor Class shares based on shareholder eligibility on or about February 28, 2024. |
The footnotes on the next page are an integral part of the table and graph and should be carefully read in conjunction with them.
| Benchmark Performance* | One
Year | Five
Years | Ten
Years |
| JPMorgan EMBI Global Diversified Index1 | 8.36% | -0.19% | 2.05% |
| Morningstar Emerging Markets Bond Category Average2 | 9.77 | 0.19 | 1.34 |
| * | Returns for indices reflect no deductions for fees, expenses or taxes, except for foreign withholding taxes where applicable. Results assume reinvestment of all dividends and capital gains. An investment cannot be made directly in an index. |
| 1. | The JPMorgan EMBI Global Diversified Index is the Fund’s primary broad-based securities market index for comparison purposes. The JPMorgan EMBI Global Diversified Index is a market-capitalization weighted, total return index tracking the traded market for U.S. dollar-denominated Brady Bonds, Eurobonds, traded loans and local market debt instruments issued by sovereign and quasi-sovereign entities. |
| 2. | The Morningstar Emerging Markets Bond Category Average is representative of funds that invest more than 65% of their assets in foreign bonds from developing countries. The largest portion of the emerging-markets bond market comes from Latin America, followed by Eastern Europe. Africa, the Middle East, and Asia make up the rest. Results are based on average total returns of similar funds with all dividends and capital gain distributions reinvested. |
The footnotes on the preceding page are an integral part of the table and graph and should be carefully read in conjunction with them.
| 6 | MainStay Candriam Emerging Markets Debt Fund |
Cost in Dollars of a $1,000 Investment in MainStay Candriam Emerging Markets Debt Fund (Unaudited)
The example below is intended to describe the fees and expenses borne by shareholders during the six-month period from May 1, 2023 to October 31, 2023, and the impact of those costs on your investment.
Example
As a shareholder of the Fund you incur two types of costs: (1) transaction costs, including exchange fees and sales charges (loads) on purchases (as applicable), and (2) ongoing costs, including management fees, distribution and/or service (12b-1) fees and other Fund expenses (as applicable). This example is intended to help you understand your ongoing costs (in dollars) of investing in the Fund and to compare these costs with the ongoing costs of investing in other mutual funds. The example is based on an investment of $1,000 made at the beginning of the six-month period and held for the entire period from May 1, 2023 to October 31, 2023.
This example illustrates your Fund’s ongoing costs in two ways:
Actual Expenses
The second and third data columns in the table below provide information about actual account values and actual expenses. You may use the information in these columns, together with the amount you invested, to estimate the expenses that you paid during the six months ended October 31, 2023. Simply divide your account value by $1,000 (for example, an
$8,600 account value divided by $1,000 = 8.6), then multiply the result by the number under the heading entitled “Expenses Paid During Period” to estimate the expenses you paid on your account during this period.
Hypothetical Example for Comparison Purposes
The fourth and fifth data columns in the table below provide information about hypothetical account values and hypothetical expenses based on the Fund’s actual expense ratio and an assumed rate of return of 5% per year before expenses, which is not the Fund’s actual return. The hypothetical account values and expenses may not be used to estimate the actual ending account balances or expenses you paid for the six-month period shown. You may use this information to compare the ongoing costs of investing in the Fund with the ongoing costs of investing in other mutual funds. To do so, compare this 5% hypothetical example with the 5% hypothetical examples that appear in the shareholder reports of the other mutual funds.
Please note that the expenses shown in the table are meant to highlight your ongoing costs only and do not reflect any transactional costs, such as exchange fees or sales charges (loads). Therefore, the fourth and fifth data columns of the table are useful in comparing ongoing costs only and will not help you determine the relative total costs of owning different funds. In addition, if these transactional costs were included, your costs would have been higher.
| Share Class | Beginning
Account
Value
5/1/23 | Ending Account
Value (Based
on Actual
Returns and
Expenses)
10/31/23 | Expenses
Paid
During
Period1 | Ending Account
Value (Based
on Hypothetical
5% Annualized
Return and
Actual Expenses)
10/31/23 | Expenses
Paid
During
Period1 | Net Expense
Ratio
During
Period2 |
| Class A Shares | $1,000.00 | $1,003.70 | $ 5.81 | $1,019.41 | $ 5.85 | 1.15% |
| Investor Class Shares | $1,000.00 | $1,001.40 | $ 8.27 | $1,016.94 | $ 8.34 | 1.64% |
| Class B Shares | $1,000.00 | $ 997.80 | $12.03 | $1,013.16 | $12.13 | 2.39% |
| Class C Shares | $1,000.00 | $ 997.80 | $12.03 | $1,013.16 | $12.13 | 2.39% |
| Class I Shares | $1,000.00 | $1,005.20 | $ 4.30 | $1,020.92 | $ 4.33 | 0.85% |
| 1. | Expenses are equal to the Fund’s annualized expense ratio of each class multiplied by the average account value over the period, divided by 365 and multiplied by 184 (to reflect the six-month period). The table above represents the actual expenses incurred during the six-month period. In addition to the fees and expenses which the Fund bears directly, it also indirectly bears a pro rata share of the fees and expenses of the underlying funds in which it invests. Such indirect expenses are not included in the above-reported expense figures. |
| 2. | Expenses are equal to the Fund's annualized expense ratio to reflect the six-month period. |
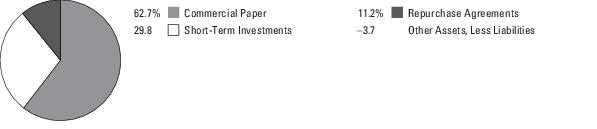
Country Composition as of October 31, 2023 (Unaudited)
| United States | 11.8% |
| Dominican Republic | 8.6 |
| Colombia | 6.9 |
| Romania | 5.5 |
| Chile | 4.3 |
| Mexico | 4.3 |
| Panama | 4.0 |
| Saudi Arabia | 3.7 |
| Brazil | 3.4 |
| Hungary | 3.3 |
| Venezuela | 3.1 |
| Indonesia | 3.1 |
| Turkey | 2.7 |
| Senegal | 2.5 |
| Kazakhstan | 2.1 |
| Ecuador | 2.0 |
| Peru | 2.0 |
| Ghana | 1.9 |
| Ukraine | 1.7 |
| Sri Lanka | 1.6 |
| South Africa | 1.6 |
| Tunisia | 1.5% |
| Angola | 1.5 |
| Croatia | 1.4 |
| Egypt | 1.4 |
| Nigeria | 1.2 |
| Cote D'Ivoire | 1.2 |
| Zambia | 1.2 |
| Tajikistan | 1.0 |
| China | 1.0 |
| Republic of the Congo | 0.9 |
| United Arab Emirates | 0.8 |
| Guatemala | 0.7 |
| Mozambique | 0.7 |
| Argentina | 0.7 |
| Georgia | 0.6 |
| Montenegro | 0.6 |
| Uruguay | 0.4 |
| Other Assets, Less Liabilities | 3.1 |
| | 100.0% |
See Portfolio of Investments beginning on page 12 for specific holdings within these categories. The Fund's holdings are subject to change.
Top Ten Holdings and/or Issuers Held as of October 31, 2023 (excluding short-term investments) (Unaudited)
| 1. | Dominican Republic Government Bond, 4.875%-13.625%, due 1/27/25–1/30/60 |
| 2. | Romanian Government Bond, 2.125%-6.625%, due 3/7/28–2/7/34 |
| 3. | Colombia Government Bond, 4.50%-8.00%, due 1/28/26–5/15/49 |
| 4. | Panama Government Bond, 3.87%-9.375%, due 4/1/29–1/19/63 |
| 5. | Hungary Government Bond, 5.00%-7.625%, due 2/22/27–3/29/41 |
| 6. | Mexico Government Bond, 5.75%-7.75%, due 11/13/42–10/12/10 |
| 7. | Senegal Government Bond, 5.375%-6.25%, due 5/23/33–6/8/37 |
| 8. | Pertamina Persero PT, 5.625%-6.00%, due 5/3/42–5/20/43 |
| 9. | Corp. Nacional del Cobre de Chile, 5.95%-6.30%, due 1/8/34–9/8/53 |
| 10. | KazMunayGas National Co. JSC, 6.375%, due 10/24/48 |
| 8 | MainStay Candriam Emerging Markets Debt Fund |
Portfolio Management Discussion and Analysis (Unaudited)
Questions answered by portfolio managers Diliana Deltcheva, CFA, Christopher Mey, CFA, and Richard Briggs, CFA, of Candriam, the Fund’s Subadvisor
How did MainStay Candriam Emerging Markets Debt Fund perform relative to its benchmark and peer group during the 12 months ended October 31, 2023?
For the 12 months ended October 31, 2023, Class I shares of MainStay Candriam Emerging Markets Debt Fund returned 10.52%, outperforming the 8.36% return of the Fund’s benchmark, the JPMorgan EMBI Global Diversified Index (the "Index"). Over the same period, Class I shares also outperformed the 9.77% return of the Morningstar Emerging Markets Bond Category Average.1
Were there any changes to the Fund during the reporting period?
Effective February 28, 2023, Richard Briggs, CFA, was added as a portfolio manager of the Fund.
What factors affected the Fund’s relative performance during the reporting period?
During the reporting period, inflation and interest-rate trends largely drove the performance of emerging-markets debt securities. The Fund outperformed the Index, primarily due to holdings in state-owned company Petróleos de Venezuela (“PDVSA”), and overweight positions in other distressed credits. Underweight exposures to El Salvador and Turkey, in addition to the overweight position in Argentina, detracted most from relative performance.
During the reporting period, how was the Fund’s performance materially affected by investments in derivatives?
The Fund held a duration2 position one year longer than the Index throughout 2023, via U.S. Treasury futures, based on a view that the Federal Reserve (the "Fed") hiking cycle was priced in and that the U.S. economy would experience disinflation and an orderly slowdown of activity. The position contributed 40 basis points (“bps”) to performance in the first quarter, detracted approximately the same amount from performance in the second quarter, and detracted a further 10 bps in the third quarter. (A basis point is one one-hundredth of a percentage point). (Contributions take weightings and total returns into account.) The year-to-date impact of the long U.S. Treasury futures position is therefore muted at 10 bps. We maintained the position given our view that the Fed had completed its hiking cycle for now, along with a baseline scenario of a soft landing of the U.S. economy in 2024 and easier monetary policy in 2025.
What was the Fund’s duration strategy during the reporting period?
The Fund held a duration position one year longer than that of the Index throughout 2023 via U.S. Treasury futures, based on a view that the Fed hiking cycle was priced in and that the U.S. economy would experience disinflation and an orderly slowdown of activity. Initially, the U.S. Treasury futures position was biased towards the 2-year and 5-year points. After the regional bank crisis in March, which led to material volatility in 2-year U.S. Treasurys, we shifted the position towards the 5-year and ten-year points, with two-thirds expressed via 5-year U.S. Treasury futures.
How was the Fund affected by shifting currency values during the reporting period?
The Fund was not affected by shifting currency values during the reporting period.
During the reporting period, which countries and/or sectors were the strongest positive contributors to the Fund’s relative performance and which countries and/or sectors were particularly weak?
The largest contribution to performance relative to the Index came from the Fund’s legacy position in Venezuelan and PDVSA bonds. Both of these holdings rallied significantly in 2023, with gains accelerating in late October after the United States materially eased sanctions against Venezuela, thereby allowing unlimited oil production and exports for a six-month period, and unconstrained secondary trading of Venezuelan and PDVSA bonds on October 18. Shortly thereafter, the main emerging-markets debt index provider, JP Morgan, announced they were placing Venezuela on watch for possible index re-inclusion in early 2024. Relative value in the distressed high-yield-rated credit space also contributed materially. The Fund’s underweight position in Egypt and overweight positions in defaulted Ghana, Ukraine, and Zambia performed well, as Ghana and Zambia approached finalization of their debt restructuring negotiations with official, bilateral and private creditors. Core overweight positions in Colombia and Romania, in addition to Mexican corporates, also contributed positively to relative returns, as credits with attractive carry and limited volatility generally performed well during 2023.
Conversely, the Fund’s overweight position in Argentina detracted from relative performance on the disappointing and surprise primaries results in August, with libertarian Javier Milei displacing the opposition coalition from the presidential contest in October 2023. The first round of presidential elections did not produce a winner on October 22nd. A contested second round is scheduled to take place on November 19th. Neither of the two presidential
| 1. | See "Investment and Performance Comparison" for other share class returns, which may be higher or lower than Class I share returns, and for more information on benchmark and peer group returns. |
| 2. | Duration is a measure of the price sensitivity of a fixed-income investment to changes in interest rates. Duration is expressed as a number of years and is considered a more accurate sensitivity gauge than average maturity. |
candidates—Sergio Massa (center to center-right, Peronist alliance) and Javier Milei (independent libertarian populist)—have produced credible macroeconomic adjustment programs, and either may suffer from limited support in Congress to implement much-needed reforms to sever the country from its boom and bust growth cycles, fiscal mismanagement, sky-high inflation and default history. The Fund’s overweight position in Tunisia detracted, as the long-awaited International Monetary Fund’s Extended Fund Facility of $1.9 billion did not materialize during the reporting period due to controversial domestic politics. We expect a deal to be concluded at some point in 2024. The country has built-in foreign exchange reserve buffers in 2023, and is able to repay the 2023 and 2024 upcoming maturities. We expect markets to reflect the decline in default risks by the end of 2023. Country selection in high-yield-rated credits also detracted from relative performance. Overweight positions in safer African credits, including Ivory Coast and Senegal, disappointed, as did underweight positions in weaker credits that held up better than expected (El Salvador, Bahrain, Oman and Pakistan) as the CCC-rated3 rally in the third quarter – and on a year-to-date basis – was indiscriminate, with the 5.9% Index weight of CCC-rated credits up by 31% as of the end of the reporting period.
What were some of the Fund’s largest purchases and sales during the reporting period?
We added to the Fund’s position in Argentina in January 2023 (1.5%) and July (0.5%), expecting that the reform-orientated opposition would manage to restore macroeconomic stability. Those expectations did not materialize, as populist Milei, with libertarian leaning and inconsistent macroeconomic adjustment views, appeared as the surprise presidential candidate during the August primaries. Immediately after the August primaries, we reduced the Fund’s exposure in Argentina to neutral (−3%), reducing the position again in October (to −0.5% versus the Index) after the first round of the presidential elections. In September and October, we fully unwound the Fund’s position in Azerbaijan (−2% to −0.59% versus the Index) as the Nagorno-Karabakh conflict flared up again, although political risk premiums in these bonds did not rise sufficiently to compensate for the elevated geopolitical risks. We added to positions in Euro-denominated bonds of Asian (Indonesia and the Philippines),
Eastern European (Hungary, Romania and Serbia) and Latin American (Chile and Peru) sovereigns to benefit from the higher spread4 offered in Euro-denominated versus U.S. dollar-denominated bonds of the same country. As of the end of the reporting period, the Fund had allocated 16.5% of assets to Euro-denominated issuers.
How did the Fund’s country and/or sector weightings change during the reporting period?
While we initially increased the Fund’s U.S. Treasury duration to reflect constructive market sentiment, we decided to close half of the Fund’s Bunds hedge (0.25 years) in hard currency , as we believed European rates were unlikely to disconnect from U.S. rates amid a U.S. slowdown. We also trimmed exposure to Oman (rich BB-rated5 credit), continued executing a relative value strategy in Africa (Mozambique versus Gabon), and reduced exposure to Ecuador (via the blue-bond-backed Eurobond buyback). In other changes, we rotated Fund exposure from Nigeria to Angola, and from U.S. dollar-denominated to Euro-denominated bonds in Romania on relative value considerations. We also reduced exposure to Paraguay (outright), Ecuador and El Salvador in favor of The United Arab Emirates (“UAE”) quasi Mubadala and Oman. During the year, we switched Fund exposure from U.S. dollar-denominated into Euro-denominated bonds in Asian (Indonesia and the Philippines), Eastern European (Hungary, Romania and Serbia) and Latin American (Chile and Peru) sovereign credits across hard currency strategies on relative value. Towards the end the reporting period, we sold holdings in Argentina and Turkey. Finally, we reduced the Fund’s exposure to high beta6 idiosyncratic credits (Argentina, Angola, Nigeria, Iraq and Venezuela).
How was the Fund positioned at the end of the reporting period?
As of October 31, 2023, the Fund maintains underweight energy exposure via investment-grade-rated credits, and overweight exposure in Angola, Ecuador, Venezuela and PDVSA; neutral exposure in Nigeria; and underweight exposure in Azerbaijan, Bahrain, Gabon, Malaysia, Qatar, Oman, Saudi Arabia and UAE.
The Fund maintains exposure to select idiosyncratic, high-yield-rated credits from countries including Ghana,
| 3. | An obligation rated ‘CCC’ by Standard & Poor’s (“S&P”) is deemed by S&P to be currently vulnerable to nonpayment and is dependent upon favorable business, financial and economic conditions for the obligor to meet its financial commitment on the obligation. It is the opinion of S&P that in the event of adverse business, financial or economic conditions, the obligor is not likely to have the capacity to meet its financial commitment on the obligation. When applied to Fund holdings, ratings are based solely on the creditworthiness of the bonds in the portfolio and are not meant to represent the security or safety of the Fund. |
| 4. | The terms “spread” and “yield spread” may refer to the difference in yield between a security or type of security and comparable U.S. Treasury issues. The terms may also refer to the difference in yield between two specific securities or types of securities at a given time. |
| 5. | An obligation rated ‘BB’ by S&P is deemed by S&P to be less vulnerable to nonpayment than other speculative issues. In the opinion of S&P, however, the obligor faces major ongoing uncertainties or exposure to adverse business, financial or economic conditions which could lead to the obligor’s inadequate capacity to meet its financial commitment on the obligation. When applied to Fund holdings, ratings are based solely on the creditworthiness of the bonds in the portfolio and are not meant to represent the security or safety of the Fund. |
| 6. | Beta is a measure of volatility in relation to the market as a whole. A beta higher than 1 indicates that a security or portfolio will tend to exhibit higher volatility than the market. A beta lower than 1 indicates that a security or portfolio will tend to exhibit lower volatility than the market. |
| 10 | MainStay Candriam Emerging Markets Debt Fund |
Mozambique, Tunisia, Ukraine and Zambia, and holds underweight exposure to high-yield credits from Turkey and The Commonwealth of Independent States (Armenia and Uzbekistan), and other distressed frontier credits (El Salvador, Ethiopia, Kenya, Mongolia, Pakistan and Suriname).
The Fund also maintains underweight positions in rich investment-grade-rated credits from countries including China, Peru, the Philippines, Saudi Arabia, Qatar, UAE and Uruguay, and holds overweight exposure to attractively valued BBB-rated7 credits from Hungary, Mexico and Romania, and BB-rated credit from Colombia, Ivory Coast and Dominican Republic.
| 7. | An obligation rated ‘BBB’ by S&P is deemed by S&P to exhibit adequate protection parameters. In the opinion of S&P, however, adverse economic conditions or changing circumstances are more likely to lead to a weakened capacity of the obligor to meet its financial commitment on the obligation. When applied to Fund holdings, ratings are based solely on the creditworthiness of the bonds in the portfolio and are not meant to represent the security or safety of the Fund. |
The opinions expressed are those of the portfolio managers as of the date of this report and are subject to change. There is no guarantee that any forecasts will come to pass. This material does not constitute investment advice and is not intended as an endorsement of any specific investment.
Portfolio of Investments October 31, 2023†^
| | Principal
Amount | Value |
| Long-Term Bonds 85.1% |
| Corporate Bonds 11.2% |
| Brazil 2.1% |
| MARB BondCo plc | | |
| Series Reg S | | |
| 3.95%, due 1/29/31 | $ 500,000 | $ 367,044 |
| Minerva Luxembourg SA | | |
| Series Reg S | | |
| 8.875%, due 9/13/33 (a) | 467,000 | 458,337 |
| Rumo Luxembourg SARL | | |
| Series Reg S | | |
| 4.20%, due 1/18/32 | 500,000 | 384,500 |
| | | 1,209,881 |
| China 1.0% |
| Alibaba Group Holding Ltd. | | |
| 4.20%, due 12/6/47 | 800,000 | 537,583 |
| Georgia 0.6% |
| Georgian Railway JSC | | |
| Series Reg S | | |
| 4.00%, due 6/17/28 | 400,000 | 340,040 |
| Kazakhstan 2.1% |
| KazMunayGas National Co. JSC | | |
| Series Reg S | | |
| 6.375%, due 10/24/48 | 1,500,000 | 1,173,000 |
| Peru 0.5% |
| Lima Metro Line 2 Finance Ltd. | | |
| Series Reg S | | |
| 4.35%, due 4/5/36 | 306,239 | 260,715 |
| Saudi Arabia 3.2% |
| EIG Pearl Holdings SARL | | |
| Series Reg S | | |
| 4.387%, due 11/30/46 | 1,000,000 | 682,420 |
| GACI First Investment Co. | | |
| Series Reg S | | |
| 4.875%, due 2/14/35 | 500,000 | 440,625 |
| Greensaif Pipelines Bidco SARL | | |
| Series Reg S | | |
| 6.129%, due 2/23/38 | 250,000 | 232,739 |
| Series Reg S | | |
| 6.129%, due 2/23/38 | 500,000 | 465,478 |
| | | 1,821,262 |
| | Principal
Amount | Value |
| |
| Turkey 1.0% |
| WE Soda Investments Holding plc | | |
| Series Reg S | | |
| 9.50%, due 10/6/28 | $ 550,000 | $ 548,460 |
| Venezuela 0.7% |
| Petroleos de Venezuela SA | | |
| 5.375%, due 4/12/27 (b)(c)(d) | 3,000,000 | 399,000 |
Total Corporate Bonds
(Cost $7,761,948) | | 6,289,941 |
| Foreign Government Bonds 73.9% |
| Angola 1.5% |
| Angola Government Bond | | |
| Series Reg S | | |
| 8.75%, due 4/14/32 | 800,000 | 621,693 |
| Series Reg S | | |
| 9.125%, due 11/26/49 | 300,000 | 210,000 |
| | | 831,693 |
| Argentina 0.7% |
| Argentina Government Bond | | |
| 3.50%, due 7/9/41 (e) | 1,400,000 | 365,158 |
| Brazil 1.3% |
| Brazil Government Bond (a) | | |
| 4.75%, due 1/14/50 | 300,000 | 200,249 |
| 8.75%, due 2/4/25 | 500,000 | 523,050 |
| | | 723,299 |
| Chile 4.3% |
| Chile Government Bond | | |
| 3.25%, due 9/21/71 | 600,000 | 319,314 |
| 4.125%, due 7/5/34 | 800,000 | 797,131 |
| Corp. Nacional del Cobre de Chile | | |
| Series Reg S | | |
| 5.95%, due 1/8/34 | 1,000,000 | 928,894 |
| Series Reg S | | |
| 6.30%, due 9/8/53 | 455,000 | 393,203 |
| | | 2,438,542 |
| Colombia 6.9% |
| Colombia Government Bond | | |
| 4.50%, due 1/28/26 | 500,000 | 478,078 |
| 5.00%, due 6/15/45 | 300,000 | 191,914 |
| 5.20%, due 5/15/49 | 300,000 | 191,841 |
| 6.125%, due 1/18/41 | 1,000,000 | 762,966 |
| 7.50%, due 2/2/34 | 500,000 | 467,594 |
The notes to the financial statements are an integral part of, and should be read in conjunction with, the financial statements.
| 12 | MainStay Candriam Emerging Markets Debt Fund |
| | Principal
Amount | Value |
| Foreign Government Bonds (continued) |
| Colombia (continued) |
| Colombia Government Bond (continued) | | |
| 8.00%, due 4/20/33 | $ 987,000 | $ 963,803 |
| Ecopetrol SA | | |
| 4.625%, due 11/2/31 | 700,000 | 525,198 |
| 8.875%, due 1/13/33 | 300,000 | 288,121 |
| | | 3,869,515 |
| Cote D'Ivoire 1.2% |
| Ivory Coast Government Bond | | |
| Series Reg S | | |
| 4.875%, due 1/30/32 | EUR 850,000 | 677,911 |
| Croatia 1.4% |
| Croatia Government Bond | | |
| Series Reg S | | |
| 6.00%, due 1/26/24 | $ 800,000 | 799,600 |
| Dominican Republic 8.6% |
| Dominican Republic Government Bond | | |
| Series Reg S | | |
| 4.875%, due 9/23/32 | 300,000 | 242,425 |
| Series Reg S | | |
| 5.30%, due 1/21/41 (a) | 500,000 | 363,960 |
| Series Reg S | | |
| 5.50%, due 1/27/25 | 500,000 | 491,775 |
| Series Reg S | | |
| 5.50%, due 2/22/29 | 300,000 | 273,015 |
| Series Reg S | | |
| 5.875%, due 1/30/60 | 1,000,000 | 708,987 |
| Series Reg S | | |
| 5.95%, due 1/25/27 | 700,000 | 673,486 |
| Series Reg S | | |
| 6.40%, due 6/5/49 (a) | 500,000 | 391,695 |
| Series Reg S | | |
| 6.875%, due 1/29/26 | 1,200,000 | 1,195,364 |
| Series Reg S | | |
| 11.25%, due 9/15/35 | DOP 12,350,000 | 214,201 |
| Series Reg S | | |
| 13.625%, due 2/3/33 | 14,000,000 | 278,904 |
| | | 4,833,812 |
| Ecuador 2.0% |
| Ecuador Government Bond (e) | | |
| Series Reg S | | |
| 2.50%, due 7/31/40 | $ 1,400,000 | 468,228 |
| | Principal
Amount | Value |
| |
| Ecuador (continued) |
| Ecuador Government Bond (e) (continued) | | |
| Series Reg S | | |
| 6.00%, due 7/31/30 | $ 1,325,000 | $ 670,283 |
| | | 1,138,511 |
| Egypt 1.4% |
| Egypt Government Bond | | |
| Series Reg S | | |
| 8.875%, due 5/29/50 | 1,500,000 | 794,280 |
| Ghana 1.9% |
| Ghana Government Bond (b)(d) | | |
| Series Reg S | | |
| 7.75%, due 4/7/29 | 200,000 | 84,536 |
| Series Reg S | | |
| 7.875%, due 2/11/35 | 900,000 | 383,814 |
| Series Reg S | | |
| 8.627%, due 6/16/49 | 1,500,000 | 618,975 |
| | | 1,087,325 |
| Guatemala 0.7% |
| Guatemala Government Bond | | |
| Series Reg S | | |
| 7.05%, due 10/4/32 (a) | 400,000 | 390,663 |
| Hungary 3.3% |
| Hungary Government Bond | | |
| Series Reg S | | |
| 5.00%, due 2/22/27 | EUR 700,000 | 745,308 |
| Series Reg S | | |
| 5.375%, due 9/12/33 | 600,000 | 611,719 |
| 7.625%, due 3/29/41 | $ 500,000 | 511,770 |
| | | 1,868,797 |
| Indonesia 3.1% |
| Indonesia Government Bond | | |
| 4.45%, due 4/15/70 | 500,000 | 364,591 |
| Pertamina Persero PT | | |
| 5.625%, due 5/20/43 (f) | 800,000 | 674,151 |
| Series Reg S | | |
| 6.00%, due 5/3/42 | 800,000 | 699,788 |
| | | 1,738,530 |
| Mexico 4.3% |
| Comision Federal de Electricidad | | |
| Series Reg S | | |
| 3.875%, due 7/26/33 | 500,000 | 362,426 |
The notes to the financial statements are an integral part of, and should be read in conjunction with, the financial statements.
13
Portfolio of Investments October 31, 2023†^ (continued)
| | Principal
Amount | Value |
| Foreign Government Bonds (continued) |
| Mexico (continued) |
Comision Federal de Electricidad
(continued) | | |
| Series Reg S | | |
| 4.677%, due 2/9/51 | $ 700,000 | $ 415,922 |
| Mexico Government Bond | | |
| 5.75%, due 10/12/10 | 400,000 | 306,703 |
| 7.75%, due 11/13/42 | MXN 30,000,000 | 1,328,210 |
| | | 2,413,261 |
| Montenegro 0.6% |
| Montenegro Government Bond | | |
| Series Reg S | | |
| 2.875%, due 12/16/27 | EUR 350,000 | 314,785 |
| Mozambique 0.7% |
| Mozambique Government Bond | | |
| Series Reg S | | |
| 9.00%, due 9/15/31 (e) | $ 500,000 | 385,000 |
| Nigeria 1.2% |
| Nigeria Government Bond | | |
| Series Reg S | | |
| 7.625%, due 11/21/25 | 300,000 | 291,969 |
| Series Reg S | | |
| 7.875%, due 2/16/32 | 500,000 | 400,125 |
| | | 692,094 |
| Panama 4.0% |
| Aeropuerto Internacional de Tocumen SA | | |
| Series Reg S | | |
| 5.125%, due 8/11/61 | 400,000 | 267,541 |
| Panama Government Bond | | |
| 3.87%, due 7/23/60 | 500,000 | 264,509 |
| 4.50%, due 4/1/56 | 400,000 | 242,168 |
| 4.50%, due 1/19/63 | 800,000 | 472,601 |
| 6.40%, due 2/14/35 | 400,000 | 366,762 |
| 6.875%, due 1/31/36 | 417,000 | 392,310 |
| 9.375%, due 4/1/29 | 200,000 | 221,358 |
| | | 2,227,249 |
| Peru 1.5% |
| Peru Government Bond | | |
| 3.23%, due 7/28/21 | 600,000 | 301,941 |
| 3.60%, due 1/15/72 | 400,000 | 226,817 |
| 6.55%, due 3/14/37 | 300,000 | 302,654 |
| | | 831,412 |
| | Principal
Amount | Value |
| |
| Republic of the Congo 0.9% |
| Congo Government Bond | | |
| Series Reg S | | |
| 6.00%, due 6/30/29 (e) | $ 627,000 | $ 504,208 |
| Romania 5.5% |
| Romanian Government Bond | | |
| Series Reg S | | |
| 2.125%, due 3/7/28 | EUR 600,000 | 550,550 |
| Series Reg S | | |
| 3.75%, due 2/7/34 | 1,200,000 | 1,001,450 |
| Series Reg S | | |
| 6.625%, due 9/27/29 (a) | 1,400,000 | 1,523,096 |
| | | 3,075,096 |
| Saudi Arabia 0.5% |
| Saudi Government Bond | | |
| Series Reg S | | |
| 3.45%, due 2/2/61 | $ 500,000 | 289,876 |
| Senegal 2.5% |
| Senegal Government Bond | | |
| Series Reg S | | |
| 5.375%, due 6/8/37 | EUR 1,358,000 | 917,202 |
| Series Reg S | | |
| 6.25%, due 5/23/33 (a) | $ 642,000 | 505,729 |
| | | 1,422,931 |
| South Africa 1.6% |
| South Africa Government Bond | | |
| 4.30%, due 10/12/28 | 300,000 | 258,450 |
| 5.75%, due 9/30/49 | 250,000 | 162,168 |
| 5.875%, due 4/20/32 | 300,000 | 253,071 |
| 7.30%, due 4/20/52 | 250,000 | 194,417 |
| | | 868,106 |
| Sri Lanka 1.6% |
| Sri Lanka Government Bond (b)(d) | | |
| Series Reg S | | |
| 6.20%, due 5/11/27 | 700,000 | 348,040 |
| Series Reg S | | |
| 6.825%, due 7/18/26 | 650,000 | 334,713 |
| Series Reg S | | |
| 7.55%, due 3/28/30 | 400,000 | 198,854 |
| | | 881,607 |
The notes to the financial statements are an integral part of, and should be read in conjunction with, the financial statements.
| 14 | MainStay Candriam Emerging Markets Debt Fund |
| | Principal
Amount | Value |
| Foreign Government Bonds (continued) |
| Tajikistan 1.0% |
| Tajiskistan Government Bond | | |
| Series Reg S | | |
| 7.125%, due 9/14/27 | $ 713,000 | $ 576,817 |
| Tunisia 1.5% |
| Tunisian Republic | | |
| Series Reg S | | |
| 5.625%, due 2/17/24 | EUR 300,000 | 295,432 |
| Series Reg S | | |
| 5.75%, due 1/30/25 | $ 800,000 | 554,096 |
| | | 849,528 |
| Turkey 1.7% |
| Turkey Government Bond | | |
| 5.75%, due 5/11/47 | 1,450,000 | 944,182 |
| Ukraine 1.7% |
| NPC Ukrenergo | | |
| Series Reg S | | |
| 6.875%, due 11/9/28 (b)(d) | 1,150,000 | 304,693 |
| State Agency of Roads of Ukraine | | |
| Series Reg S | | |
| 6.25%, due 6/24/30 (b)(c)(d) | 1,227,000 | 312,934 |
| Ukraine Government Bond | | |
| Series Reg S | | |
| 7.253%, due 3/15/35 (b)(c)(d) | 1,300,000 | 324,953 |
| | | 942,580 |
| United Arab Emirates 0.8% |
| Finance Department Government of Sharjah | | |
| Series Reg S | | |
| 4.00%, due 7/28/50 | 800,000 | 453,200 |
| Uruguay 0.4% |
| Uruguay Government Bond | | |
| 9.75%, due 7/20/33 | UYU 8,542,218 | 211,705 |
| Venezuela 2.4% |
| Petroleos de Venezuela SA (b)(c)(d) | | |
| Series Reg S | | |
| 6.00%, due 5/16/24 | $ 2,500,000 | 317,500 |
| Series Reg S | | |
| 6.00%, due 11/15/26 | 2,500,000 | 311,250 |
| | Principal
Amount | | Value |
| |
| Venezuela (continued) |
| Venezuela Government Bond | | | |
| Series Reg S | | | |
| 9.25%, due 5/7/28 (b)(c)(d) | $ 4,095,000 | | $ 738,832 |
| | | | 1,367,582 |
| Zambia 1.2% |
| Zambia Government Bond | | | |
| Series Reg S | | | |
| 8.97%, due 7/30/27 (b)(d) | 1,081,000 | | 658,059 |
Total Foreign Government Bonds
(Cost $51,899,795) | | | 41,466,914 |
Total Long-Term Bonds
(Cost $59,661,743) | | | 47,756,855 |
| |
| | Shares | | |
| |
| Short-Term Investments 11.8% |
| U.S. Treasury Debt 8.7% |
| U.S. Treasury Bills | | | |
| 5.42%, due 3/14/24 (g) | $ 5,000,000 | | 4,901,110 |
Total U.S. Treasury Debt
(Cost $4,901,304) | | | 4,901,110 |
| Unaffiliated Investment Company 3.1% |
| United States 3.1% |
| Invesco Government & Agency Portfolio, 5.357% (h)(i) | 1,715,818 | | 1,715,818 |
Total Short-Term Investments
(Cost $6,617,122) | | | 6,616,928 |
Total Investments
(Cost $66,278,865) | 96.9% | | 54,373,783 |
| Other Assets, Less Liabilities | 3.1 | | 1,731,980 |
| Net Assets | 100.0% | | $ 56,105,763 |
| † | Percentages indicated are based on Fund net assets. |
| ^ | Industry and country classifications may be different than those used for compliance monitoring purposes. |
| (a) | All or a portion of this security was held on loan. As of October 31, 2023, the aggregate market value of securities on loan was $1,644,616. The Fund received cash collateral with a value of $1,715,818. (See Note 2(J)) |
| (b) | Issue in default. |
| (c) | Illiquid security—As of October 31, 2023, the total market value deemed illiquid under procedures approved by the Board of Trustees was $2,404,469, which represented 4.3% of the Fund’s net assets. (Unaudited) |
| (d) | Issue in non-accrual status. |
The notes to the financial statements are an integral part of, and should be read in conjunction with, the financial statements.
15
Portfolio of Investments October 31, 2023†^ (continued)
| (e) | Step coupon—Rate shown was the rate in effect as of October 31, 2023. |
| (f) | May be sold to institutional investors only under Rule 144A or securities offered pursuant to Section 4(a)(2) of the Securities Act of 1933, as amended. |
| (g) | Interest rate shown represents yield to maturity. |
| (h) | Current yield as of October 31, 2023. |
| (i) | Represents a security purchased with cash collateral received for securities on loan. |
Foreign Currency Forward Contracts
As of October 31, 2023, the Fund held the following foreign currency forward contracts1:
| Currency Purchased | Currency Sold | Counterparty | Settlement
Date | Unrealized
Appreciation
(Depreciation)2 |
| USD | 1,379,198 | MXN | 25,000,000 | Barclays Capital | 12/20/23 | $ 3,697 |
| Total Unrealized Appreciation | 3,697 |
| USD | 8,663,483 | EUR | 8,200,000 | JPMorgan Chase Bank N.A. | 12/20/23 | (33,003) |
| Total Unrealized Depreciation | (33,003) |
| Net Unrealized Depreciation | $ (29,306) |
| 1. | Foreign Currency Forward Contracts are subject to limitations such that they cannot be “sold or repurchased,” although the Fund would be able to exit the transaction through other means, such as through the execution of an offsetting transaction. |
| 2. | As of October 31, 2023, cash in the amount of $570,000 was on deposit with a broker or forward commission merchant for forward transactions. |
Futures Contracts
As of October 31, 2023, the Fund held the following futures contracts1:
| Type | Number of
Contracts | Expiration
Date | Value at
Trade Date | Current
Notional
Amount | Unrealized
Appreciation
(Depreciation)2 |
| Long Contracts | | | | | |
| U.S. Treasury 5 Year Notes | 157 | December 2023 | $ 16,753,998 | $ 16,402,821 | $ (351,177) |
| U.S. Treasury 10 Year Notes | 45 | December 2023 | 4,982,810 | 4,777,734 | (205,076) |
| Net Unrealized Depreciation | | | | | $ (556,253) |
| 1. | As of October 31, 2023, cash in the amount of $327,828 was on deposit with a broker or futures commission merchant for futures transactions. |
| 2. | Represents the difference between the value of the contracts at the time they were opened and the value as of October 31, 2023. |
| Abbreviation(s): |
| DOP—Dominican Republic Peso |
| EUR—Euro |
| MXN—Mexico Peso |
| USD—United States Dollar |
| UYU—Uruguay Peso |
The notes to the financial statements are an integral part of, and should be read in conjunction with, the financial statements.
| 16 | MainStay Candriam Emerging Markets Debt Fund |
The following is a summary of the fair valuations according to the inputs used as of October 31, 2023, for valuing the Fund’s assets and liabilities:
| Description | Quoted
Prices in
Active
Markets for
Identical
Assets
(Level 1) | | Significant
Other
Observable
Inputs
(Level 2) | | Significant
Unobservable
Inputs
(Level 3) | | Total |
| Asset Valuation Inputs | | | | | | | |
| Investments in Securities (a) | | | | | | | |
| Long-Term Bonds | | | | | | | |
| Corporate Bonds | $ — | | $ 6,289,941 | | $ — | | $ 6,289,941 |
| Foreign Government Bonds | — | | 41,466,914 | | — | | 41,466,914 |
| Total Long-Term Bonds | — | | 47,756,855 | | — | | 47,756,855 |
| Short-Term Investments | | | | | | | |
| Unaffiliated Investment Company | 1,715,818 | | — | | — | | 1,715,818 |
| U.S. Treasury Debt | — | | 4,901,110 | | — | | 4,901,110 |
| Total Short-Term Investments | 1,715,818 | | 4,901,110 | | — | | 6,616,928 |
| Total Investments in Securities | 1,715,818 | | 52,657,965 | | — | | 54,373,783 |
| Other Financial Instruments | | | | | | | |
| Foreign Currency Forward Contracts (b) | — | | 3,697 | | — | | 3,697 |
| Total Investments in Securities and Other Financial Instruments | $ 1,715,818 | | $ 52,661,662 | | $ — | | $ 54,377,480 |
| Liability Valuation Inputs | | | | | | | |
| Other Financial Instruments (b) | | | | | | | |
| Foreign Currency Forward Contracts | $ — | | $ (33,003) | | $ — | | $ (33,003) |
| Futures Contracts | (556,253) | | — | | — | | (556,253) |
| Total Other Financial Instruments | $ (556,253) | | $ (33,003) | | $ — | | $ (589,256) |
| (a) | For a complete listing of investments and their industries, see the Portfolio of Investments. |
| (b) | The value listed for these securities reflects unrealized appreciation (depreciation) as shown on the Portfolio of Investments. |
The notes to the financial statements are an integral part of, and should be read in conjunction with, the financial statements.
17
Statement of Assets and Liabilities as of October 31, 2023
| Assets |
Investment in securities, at value
(identified cost $66,278,865) including securities on loan of $1,644,616 | $ 54,373,783 |
| Cash | 480,053 |
Cash denominated in foreign currencies
(identified cost $754,165) | 757,432 |
| Cash collateral on deposit at broker for futures contracts | 327,828 |
| Cash collateral on deposit at broker for forward contracts | 570,000 |
| Receivables: | |
| Fund shares sold | 2,105,307 |
| Interest | 870,379 |
| Variation margin on futures contracts | 744,256 |
| Securities lending | 1,305 |
| Unrealized appreciation on foreign currency forward contracts | 3,697 |
| Other assets | 37,348 |
| Total assets | 60,271,388 |
| Liabilities |
| Cash collateral received for securities on loan | 1,715,818 |
| Payables: | |
| Fund shares redeemed | 2,313,584 |
| Transfer agent (See Note 3) | 29,768 |
| Manager (See Note 3) | 19,757 |
| Custodian | 13,651 |
| Professional fees | 12,613 |
| NYLIFE Distributors (See Note 3) | 12,050 |
| Shareholder communication | 4,456 |
| Trustees | 10 |
| Accrued expenses | 3,439 |
| Distributions payable | 7,476 |
| Unrealized depreciation on foreign currency forward contracts | 33,003 |
| Total liabilities | 4,165,625 |
| Net assets | $ 56,105,763 |
| Composition of Net Assets |
| Shares of beneficial interest outstanding (par value of $.01 per share) unlimited number of shares authorized | $ 77,920 |
| Additional paid-in-capital | 104,409,062 |
| | 104,486,982 |
| Total distributable earnings (loss) | (48,381,219) |
| Net assets | $ 56,105,763 |
| Class A | |
| Net assets applicable to outstanding shares | $43,664,637 |
| Shares of beneficial interest outstanding | 6,072,563 |
| Net asset value per share outstanding | $ 7.19 |
| Maximum sales charge (4.50% of offering price) | 0.34 |
| Maximum offering price per share outstanding | $ 7.53 |
| Investor Class | |
| Net assets applicable to outstanding shares | $ 8,436,144 |
| Shares of beneficial interest outstanding | 1,159,451 |
| Net asset value per share outstanding | $ 7.28 |
| Maximum sales charge (4.00% of offering price) | 0.30 |
| Maximum offering price per share outstanding | $ 7.58 |
| Class B | |
| Net assets applicable to outstanding shares | $ 235,037 |
| Shares of beneficial interest outstanding | 33,497 |
| Net asset value and offering price per share outstanding | $ 7.02 |
| Class C | |
| Net assets applicable to outstanding shares | $ 878,119 |
| Shares of beneficial interest outstanding | 124,916 |
| Net asset value and offering price per share outstanding | $ 7.03 |
| Class I | |
| Net assets applicable to outstanding shares | $ 2,891,826 |
| Shares of beneficial interest outstanding | 401,534 |
| Net asset value and offering price per share outstanding | $ 7.20 |
The notes to the financial statements are an integral part of, and should be read in conjunction with, the financial statements.
| 18 | MainStay Candriam Emerging Markets Debt Fund |
Statement of Operations for the year ended October 31, 2023
| Investment Income (Loss) |
| Income | |
| Interest | $ 4,147,739 |
| Securities lending, net | 20,265 |
| Total income | 4,168,004 |
| Expenses | |
| Manager (See Note 3) | 433,904 |
| Transfer agent (See Note 3) | 157,804 |
| Distribution/Service—Class A (See Note 3) | 119,769 |
| Distribution/Service—Investor Class (See Note 3) | 22,562 |
| Distribution/Service—Class B (See Note 3) | 3,551 |
| Distribution/Service—Class C (See Note 3) | 11,349 |
| Professional fees | 89,652 |
| Registration | 76,565 |
| Custodian | 40,376 |
| Trustees | 1,570 |
| Shareholder communication | 1,003 |
| Miscellaneous | 3,004 |
| Total expenses before waiver/reimbursement | 961,109 |
| Expense waiver/reimbursement from Manager (See Note 3) | (196,352) |
| Reimbursement from prior custodian(a) | (127) |
| Net expenses | 764,630 |
| Net investment income (loss) | 3,403,374 |
| Realized and Unrealized Gain (Loss) |
| Net realized gain (loss) on: | |
| Unaffiliated investment transactions | (7,252,068) |
| Futures transactions | (456,539) |
| Foreign currency transactions | (87,665) |
| Foreign currency forward transactions | 417,650 |
| Net realized gain (loss) | (7,378,622) |
| Net change in unrealized appreciation (depreciation) on: | |
| Unaffiliated investments | 10,881,220 |
| Futures contracts | (557,477) |
| Foreign currency forward contracts | (29,306) |
| Translation of other assets and liabilities in foreign currencies | 4,146 |
| Net change in unrealized appreciation (depreciation) | 10,298,583 |
| Net realized and unrealized gain (loss) | 2,919,961 |
| Net increase (decrease) in net assets resulting from operations | $ 6,323,335 |
| (a) | Represents a refund for overbilling of custody fees. |
The notes to the financial statements are an integral part of, and should be read in conjunction with, the financial statements.
19
Statements of Changes in Net Assets
for the years ended October 31, 2023 and October 31, 2022
| | 2023 | 2022 |
| Increase (Decrease) in Net Assets |
| Operations: | | |
| Net investment income (loss) | $ 3,403,374 | $ 3,647,283 |
| Net realized gain (loss) | (7,378,622) | (13,154,988) |
| Net change in unrealized appreciation (depreciation) | 10,298,583 | (13,895,370) |
| Net increase (decrease) in net assets resulting from operations | 6,323,335 | (23,403,075) |
| Distributions to shareholders: | | |
| Class A | (2,607,140) | (3,612,534) |
| Investor Class | (434,942) | (549,300) |
| Class B | (16,986) | (37,561) |
| Class C | (52,711) | (107,128) |
| Class I | (205,389) | (237,169) |
| | (3,317,168) | (4,543,692) |
| Distributions to shareholders from return of capital: | | |
| Class A | — | (277,063) |
| Investor Class | — | (42,129) |
| Class B | — | (2,881) |
| Class C | — | (8,216) |
| Class I | — | (18,190) |
| | — | (348,479) |
| Total distributions to shareholders | (3,317,168) | (4,892,171) |
| Capital share transactions: | | |
| Net proceeds from sales of shares | 17,806,161 | 12,957,410 |
| Net asset value of shares issued to shareholders in reinvestment of distributions | 3,170,418 | 4,663,688 |
| Cost of shares redeemed | (30,021,359) | (31,448,175) |
| Increase (decrease) in net assets derived from capital share transactions | (9,044,780) | (13,827,077) |
| Net increase (decrease) in net assets | (6,038,613) | (42,122,323) |
| Net Assets |
| Beginning of year | 62,144,376 | 104,266,699 |
| End of year | $ 56,105,763 | $ 62,144,376 |
The notes to the financial statements are an integral part of, and should be read in conjunction with, the financial statements.
| 20 | MainStay Candriam Emerging Markets Debt Fund |
Financial Highlights selected per share data and ratios
| | Year Ended October 31, |
| Class A | 2023 | | 2022 | | 2021 | | 2020 | | 2019 |
| Net asset value at beginning of year | $ 6.88 | | $ 9.73 | | $ 9.81 | | $ 10.46 | | $ 9.71 |
| Net investment income (loss) (a) | 0.41 | | 0.38 | | 0.36 | | 0.47 | | 0.49 |
| Net realized and unrealized gain (loss) | 0.29 | | (2.73) | | 0.04 | | (0.67) | | 0.76 |
| Total from investment operations | 0.70 | | (2.35) | | 0.40 | | (0.20) | | 1.25 |
| Less distributions: | | | | | | | | | |
| From net investment income | (0.39) | | (0.46) | | (0.48) | | (0.45) | | (0.50) |
| Return of capital | — | | (0.04) | | — | | — | | — |
| Total distributions | (0.39) | | (0.50) | | (0.48) | | (0.45) | | (0.50) |
| Net asset value at end of year | $ 7.19 | | $ 6.88 | | $ 9.73 | | $ 9.81 | | $ 10.46 |
| Total investment return (b) | 10.21% | | (24.93)% | | 4.00% | | (1.80)% | | 13.05% |
| Ratios (to average net assets)/Supplemental Data: | | | | | | | | | |
| Net investment income (loss) | 5.57% | | 4.53% | | 3.58% | | 4.70% | | 4.78% |
| Net expenses (c) | 1.15% | | 1.15% | | 1.16% | | 1.17% | | 1.23% |
| Expenses (before waiver/reimbursement) (c) | 1.46% | | 1.36% | | 1.31% | | 1.33% | | 1.26% |
| Portfolio turnover rate | 133% | | 116% | | 112% | | 102% | | 102% |
| Net assets at end of year (in 000’s) | $ 43,665 | | $ 48,053 | | $ 81,092 | | $ 82,874 | | $ 93,472 |
| (a) | Per share data based on average shares outstanding during the year. |
| (b) | Total investment return is calculated exclusive of sales charges and assumes the reinvestment of dividends and distributions. For periods of less than one year, total return is not annualized. |
| (c) | In addition to the fees and expenses which the Fund bears directly, it also indirectly bears a pro-rata share of the fees and expenses of the underlying funds in which it invests. Such indirect expenses are not included in the above expense ratios. |
| | Year Ended October 31, |
| Investor Class | 2023 | | 2022 | | 2021 | | 2020 | | 2019 |
| Net asset value at beginning of year | $ 6.96 | | $ 9.84 | | $ 9.91 | | $ 10.57 | | $ 9.80 |
| Net investment income (loss) (a) | 0.38 | | 0.35 | | 0.33 | | 0.44 | | 0.47 |
| Net realized and unrealized gain (loss) | 0.30 | | (2.77) | | 0.04 | | (0.68) | | 0.77 |
| Total from investment operations | 0.68 | | (2.42) | | 0.37 | | (0.24) | | 1.24 |
| Less distributions: | | | | | | | | | |
| From net investment income | (0.36) | | (0.43) | | (0.44) | | (0.42) | | (0.47) |
| Return of capital | — | | (0.03) | | — | | — | | — |
| Total distributions | (0.36) | | (0.46) | | (0.44) | | (0.42) | | (0.47) |
| Net asset value at end of year | $ 7.28 | | $ 6.96 | | $ 9.84 | | $ 9.91 | | $ 10.57 |
| Total investment return (b) | 9.73% | | (25.27)% | | 3.70% | | (2.20)% | | 12.82% |
| Ratios (to average net assets)/Supplemental Data: | | | | | | | | | |
| Net investment income (loss) | 5.09% | | 4.14% | | 3.21% | | 4.38% | | 4.50% |
| Net expenses (c) | 1.64% | | 1.56% | | 1.53% | | 1.49% | | 1.52% |
| Expenses (before waiver/reimbursement) (c) | 1.95% | | 1.78% | | 1.70% | | 1.66% | | 1.56% |
| Portfolio turnover rate | 133% | | 116% | | 112% | | 102% | | 102% |
| Net assets at end of year (in 000's) | $ 8,436 | | $ 8,670 | | $ 12,806 | | $ 13,801 | | $ 16,024 |
| (a) | Per share data based on average shares outstanding during the year. |
| (b) | Total investment return is calculated exclusive of sales charges and assumes the reinvestment of dividends and distributions. For periods of less than one year, total return is not annualized. |
| (c) | In addition to the fees and expenses which the Fund bears directly, it also indirectly bears a pro-rata share of the fees and expenses of the underlying funds in which it invests. Such indirect expenses are not included in the above expense ratios. |
The notes to the financial statements are an integral part of, and should be read in conjunction with, the financial statements.
21
Financial Highlights selected per share data and ratios
| | Year Ended October 31, |
| Class B | 2023 | | 2022 | | 2021 | | 2020 | | 2019 |
| Net asset value at beginning of year | $ 6.72 | | $ 9.52 | | $ 9.61 | | $ 10.26 | | $ 9.52 |
| Net investment income (loss) (a) | 0.31 | | 0.27 | | 0.24 | | 0.36 | | 0.38 |
| Net realized and unrealized gain (loss) | 0.29 | | (2.67) | | 0.04 | | (0.66) | | 0.75 |
| Total from investment operations | 0.60 | | (2.40) | | 0.28 | | (0.30) | | 1.13 |
| Less distributions: | | | | | | | | | |
| From net investment income | (0.30) | | (0.37) | | (0.37) | | (0.35) | | (0.39) |
| Return of capital | — | | (0.03) | | — | | — | | — |
| Total distributions | (0.30) | | (0.40) | | (0.37) | | (0.35) | | (0.39) |
| Net asset value at end of year | $ 7.02 | | $ 6.72 | | $ 9.52 | | $ 9.61 | | $ 10.26 |
| Total investment return (b) | 8.97% | | (25.85)% | | 2.87% | | (2.91)% | | 12.04% |
| Ratios (to average net assets)/Supplemental Data: | | | | | | | | | |
| Net investment income (loss) | 4.34% | | 3.31% | | 2.49% | | 3.66% | | 3.76% |
| Net expenses (c) | 2.39% | | 2.31% | | 2.28% | | 2.24% | | 2.27% |
| Expenses (before waiver/reimbursement) (c) | 2.71% | | 2.52% | | 2.45% | | 2.40% | | 2.31% |
| Portfolio turnover rate | 133% | | 116% | | 112% | | 102% | | 102% |
| Net assets at end of year (in 000’s) | $ 235 | | $ 426 | | $ 1,129 | | $ 1,789 | | $ 2,663 |
| (a) | Per share data based on average shares outstanding during the year. |
| (b) | Total investment return is calculated exclusive of sales charges and assumes the reinvestment of dividends and distributions. For periods of less than one year, total return is not annualized. |
| (c) | In addition to the fees and expenses which the Fund bears directly, it also indirectly bears a pro-rata share of the fees and expenses of the underlying funds in which it invests. Such indirect expenses are not included in the above expense ratios. |
| | Year Ended October 31, |
| Class C | 2023 | | 2022 | | 2021 | | 2020 | | 2019 |
| Net asset value at beginning of year | $ 6.74 | | $ 9.54 | | $ 9.63 | | $ 10.27 | | $ 9.54 |
| Net investment income (loss) (a) | 0.31 | | 0.27 | | 0.25 | | 0.36 | | 0.38 |
| Net realized and unrealized gain (loss) | 0.28 | | (2.67) | | 0.03 | | (0.66) | | 0.74 |
| Total from investment operations | 0.59 | | (2.40) | | 0.28 | | (0.30) | | 1.12 |
| Less distributions: | | | | | | | | | |
| From net investment income | (0.30) | | (0.37) | | (0.37) | | (0.34) | | (0.39) |
| Return of capital | — | | (0.03) | | — | | — | | — |
| Total distributions | (0.30) | | (0.40) | | (0.37) | | (0.34) | | (0.39) |
| Net asset value at end of year | $ 7.03 | | $ 6.74 | | $ 9.54 | | $ 9.63 | | $ 10.27 |
| Total investment return (b) | 8.96% | | (25.90)% | | 2.87% | | (2.81)% | | 11.91% |
| Ratios (to average net assets)/Supplemental Data: | | | | | | | | | |
| Net investment income (loss) | 4.34% | | 3.31% | | 2.52% | | 3.68% | | 3.78% |
| Net expenses (c) | 2.39% | | 2.31% | | 2.28% | | 2.24% | | 2.27% |
| Expenses (before waiver/reimbursement) (c) | 2.70% | | 2.52% | | 2.45% | | 2.40% | | 2.31% |
| Portfolio turnover rate | 133% | | 116% | | 112% | | 102% | | 102% |
| Net assets at end of year (in 000’s) | $ 878 | | $ 1,358 | | $ 3,511 | | $ 6,365 | | $ 11,150 |
| (a) | Per share data based on average shares outstanding during the year. |
| (b) | Total investment return is calculated exclusive of sales charges and assumes the reinvestment of dividends and distributions. For periods of less than one year, total return is not annualized. |
| (c) | In addition to the fees and expenses which the Fund bears directly, it also indirectly bears a pro-rata share of the fees and expenses of the underlying funds in which it invests. Such indirect expenses are not included in the above expense ratios. |
The notes to the financial statements are an integral part of, and should be read in conjunction with, the financial statements.
| 22 | MainStay Candriam Emerging Markets Debt Fund |
Financial Highlights selected per share data and ratios
| | Year Ended October 31, |
| Class I | 2023 | | 2022 | | 2021 | | 2020 | | 2019 |
| Net asset value at beginning of year | $ 6.89 | | $ 9.75 | | $ 9.82 | | $ 10.48 | | $ 9.72 |
| Net investment income (loss) (a) | 0.43 | | 0.40 | | 0.39 | | 0.51 | | 0.52 |
| Net realized and unrealized gain (loss) | 0.29 | | (2.74) | | 0.05 | | (0.69) | | 0.76 |
| Total from investment operations | 0.72 | | (2.34) | | 0.44 | | (0.18) | | 1.28 |
| Less distributions: | | | | | | | | | |
| From net investment income | (0.41) | | (0.48) | | (0.51) | | (0.48) | | (0.52) |
| Return of capital | — | | (0.04) | | — | | — | | — |
| Total distributions | (0.41) | | (0.52) | | (0.51) | | (0.48) | | (0.52) |
| Net asset value at end of year | $ 7.20 | | $ 6.89 | | $ 9.75 | | $ 9.82 | | $ 10.48 |
| Total investment return (b) | 10.52% | | (24.75)% | | 4.42% | | (1.59)% | | 13.46% |
| Ratios (to average net assets)/Supplemental Data: | | | | | | | | | |
| Net investment income (loss) | 5.88% | | 4.89% | | 3.86% | | 5.09% | | 4.99% |
| Net expenses (c) | 0.85% | | 0.85% | | 0.85% | | 0.85% | | 0.94% |
| Expenses (before waiver/reimbursement) (c) | 1.21% | | 1.12% | | 1.06% | | 1.07% | | 1.01% |
| Portfolio turnover rate | 133% | | 116% | | 112% | | 102% | | 102% |
| Net assets at end of year (in 000’s) | $ 2,892 | | $ 3,637 | | $ 5,729 | | $ 6,687 | | $ 17,100 |
| (a) | Per share data based on average shares outstanding during the year. |
| (b) | Total investment return is calculated exclusive of sales charges and assumes the reinvestment of dividends and distributions. Class I shares are not subject to sales charges. For periods of less than one year, total return is not annualized. |
| (c) | In addition to the fees and expenses which the Fund bears directly, it also indirectly bears a pro-rata share of the fees and expenses of the underlying funds in which it invests. Such indirect expenses are not included in the above expense ratios. |
The notes to the financial statements are an integral part of, and should be read in conjunction with, the financial statements.
23
Notes to Financial Statements
Note 1-Organization and Business
The MainStay Funds (the “Trust”) was organized on January 9, 1986, as a Massachusetts business trust. The Trust is registered under the Investment Company Act of 1940, as amended (the “1940 Act”), as an open-end management investment company, and is comprised of eleven funds (collectively referred to as the "Funds"). These financial statements and notes relate to the MainStay Candriam Emerging Markets Debt Fund (the "Fund"), a “diversified” fund, as that term is defined in the 1940 Act, as interpreted or modified by regulatory authorities having jurisdiction, from time to time.
The following table lists the Fund's share classes that have been registered and commenced operations:
| Class | Commenced Operations |
| Class A | June 1, 1998 |
| Investor Class | February 28, 2008 |
| Class B* | June 1, 1998 |
| Class C | September 1, 1998 |
| Class I | August 31, 2007 |
| * | Class B shares are closed to all new purchases as well as additional investments by existing Class B shareholders and will be converted into Class A or Investor Class shares based on shareholder eligibility on or about February 28, 2024. |
Class B shares of the MainStay Group of Funds are closed to all new purchases as well as additional investments by existing Class B shareholders. Existing Class B shareholders may continue to reinvest dividends and capital gains distributions, as well as exchange their Class B shares for Class B shares of other funds in the MainStay Group of Funds as permitted by the current exchange privileges. Class B shareholders continue to be subject to any applicable contingent deferred sales charge ("CDSC") at the time of redemption. All other features of the Class B shares, including but not limited to the fees and expenses applicable to Class B shares, remain unchanged. Unless redeemed, Class B shareholders will remain in Class B shares of their respective fund until the Class B shares are converted to Class A or Investor Class shares pursuant to the applicable conversion schedule.
Class A and Investor Class shares are offered at net asset value (“NAV”) per share plus an initial sales charge. No initial sales charge applies to investments of $1 million or more (and certain other qualified purchases) in Class A and Investor Class shares. However, a CDSC of 1.00% may be imposed on certain redemptions made within 18 months of the date of purchase on shares that were purchased without an initial sales charge. Class C shares are offered at NAV without an initial sales charge, although a 1.00% CDSC may be imposed on certain redemptions of such shares made within one year of the date of purchase of Class C shares. When Class B shares were offered, they were offered at NAV without an initial sales charge, although a CDSC that declines depending on the number of years a shareholder held its Class B shares may be imposed on certain redemptions of such shares made within six years of the date of purchase of such shares. Class I shares are offered at NAV without a sales charge. Depending upon eligibility, Class B shares convert to either
Class A or Investor Class shares at the end of the calendar quarter eight years after the date they were purchased. In addition, depending upon eligibility, Class C shares convert to either Class A or Investor Class shares at the end of the calendar quarter eight years after the date they were purchased. Additionally, Investor Class shares may convert automatically to Class A shares. Under certain circumstances and as may be permitted by the Trust’s multiple class plan pursuant to Rule 18f-3 under the 1940 Act, specified share classes of the Fund may be converted to one or more other share classes of the Fund as disclosed in the capital share transactions within these Notes. The classes of shares have the same voting (except for issues that relate solely to one class), dividend, liquidation and other rights, and the same terms and conditions, except that under distribution plans pursuant to Rule 12b-1 under the 1940 Act, Class B and Class C shares are subject to higher distribution and/or service fees than Class A and Investor Class shares. Class I shares are not subject to a distribution and/or service fee.
At a meeting held on September 25-26, 2023, the Board of Trustees (the “Board”) of the Trust, after careful consideration of a number of factors and upon the recommendation of the Fund’s investment adviser, New York Life Investment Management LLC (“New York Life Investments” or the "Manager"), approved a proposal to accelerate the conversion of the Fund’s Class B shares into Class A shares, or Investor Class shares, based on shareholder eligibility. Class B shareholders of the Fund will receive Class A shares of the Fund if they hold at least $15,000 of Class B shares of the Fund on or around February 28, 2024; otherwise, Class B shareholders of the Fund will receive Investor Class shares of the relevant Fund.
The Fund's investment objective is to seek total return.
Note 2–Significant Accounting Policies
The Fund is an investment company and accordingly follows the investment company accounting and reporting guidance of the Financial Accounting Standards Board (“FASB”) Accounting Standards Codification Topic 946 Financial Services—Investment Companies. The Fund prepares its financial statements in accordance with generally accepted accounting principles (“GAAP”) in the United States of America and follows the significant accounting policies described below.
(A) Securities Valuation. Investments are usually valued as of the close of regular trading on the New York Stock Exchange (the "Exchange") (usually 4:00 p.m. Eastern time) on each day the Fund is open for business ("valuation date").
Pursuant to Rule 2a-5 under the 1940 Act, the Board has designated New York Life Investments as its Valuation Designee (the "Valuation Designee"). The Valuation Designee is responsible for performing fair valuations relating to all investments in the Fund’s portfolio for which market quotations are not readily available; periodically assessing and managing material valuation risks; establishing and applying fair value methodologies; testing fair valuation methodologies; evaluating and overseeing pricing services; ensuring appropriate segregation of valuation
| 24 | MainStay Candriam Emerging Markets Debt Fund |
and portfolio management functions; providing quarterly, annual and prompt reporting to the Board, as appropriate; identifying potential conflicts of interest; and maintaining appropriate records. The Valuation Designee has established a valuation committee ("Valuation Committee") to assist in carrying out the Valuation Designee’s responsibilities and establish prices of securities for which market quotations are not readily available. The Fund's and the Valuation Designee's policies and procedures ("Valuation Procedures") govern the Valuation Designee’s selection and application of methodologies for determining and calculating the fair value of Fund investments. The Valuation Designee may value the Fund's portfolio securities for which market quotations are not readily available and other Fund assets utilizing inputs from pricing services and other third-party sources. The Valuation Committee meets (in person, via electronic mail or via teleconference) on an ad-hoc basis to determine fair valuations and on a quarterly basis to review fair value events with respect to certain securities for which market quotations are not readily available, including valuation risks and back-testing results, and preview reports to the Board.
The Valuation Committee establishes prices of securities for which market quotations are not readily available based on such methodologies and measurements on a regular basis after considering information that is reasonably available and deemed relevant by the Valuation Committee. The Board shall oversee the Valuation Designee and review fair valuation materials on a prompt, quarterly and annual basis and approve proposed revisions to the Valuation Procedures.
Investments for which market quotations are not readily available are valued at fair value as determined in good faith pursuant to the Valuation Procedures. A market quotation is readily available only when that quotation is a quoted price (unadjusted) in active markets for identical investments that the Fund can access at the measurement date, provided that a quotation will not be readily available if it is not reliable. "Fair value" is defined as the price the Fund would reasonably expect to receive upon selling an asset or liability in an orderly transaction to an independent buyer in the principal or most advantageous market for the asset or liability. Fair value measurements are determined within a framework that establishes a three-tier hierarchy that maximizes the use of observable market data and minimizes the use of unobservable inputs to establish a classification of fair value measurements for disclosure purposes. "Inputs" refer broadly to the assumptions that market participants would use in pricing the asset or liability, including assumptions about risk, such as the risk inherent in a particular valuation technique used to measure fair value using a pricing model and/or the risk inherent in the inputs for the valuation technique. Inputs may be observable or unobservable. Observable inputs reflect the assumptions market participants would use in pricing the asset or liability based on market data obtained from sources independent of the Fund. Unobservable inputs reflect the Fund’s own assumptions about the assumptions market participants would use in pricing the asset or liability based on the information available. The inputs or methodology used for valuing assets or liabilities may not be an indication of the risks associated with investing in those assets or liabilities. The three-tier hierarchy of inputs is summarized below.
| • | Level 1—quoted prices (unadjusted) in active markets for an identical asset or liability |
| • | Level 2—other significant observable inputs (including quoted prices for a similar asset or liability in active markets, interest rates and yield curves, prepayment speeds, credit risk, etc.) |
| • | Level 3—significant unobservable inputs (including the Fund's own assumptions about the assumptions that market participants would use in measuring fair value of an asset or liability) |
The level of an asset or liability within the fair value hierarchy is based on the lowest level of an input, both individually and in the aggregate, that is significant to the fair value measurement. The aggregate value by input level of the Fund’s assets and liabilities as of October 31, 2023, is included at the end of the Portfolio of Investments.
The Fund may use third-party vendor evaluations, whose prices may be derived from one or more of the following standard inputs, among others:
| • Benchmark yields | • Reported trades |
| • Broker/dealer quotes | • Issuer spreads |
| • Two-sided markets | • Benchmark securities |
| • Bids/offers | • Reference data (corporate actions or material event notices) |
| • Industry and economic events | • Comparable bonds |
| • Monthly payment information | |
An asset or liability for which a market quotation is not readily available is valued by methods deemed reasonable in good faith by the Valuation Committee, following the Valuation Procedures to represent fair value. Under these procedures, the Valuation Designee generally uses a market-based approach which may use related or comparable assets or liabilities, recent transactions, market multiples, book values and other relevant information. The Valuation Designee may also use an income-based valuation approach in which the anticipated future cash flows of the asset or liability are discounted to calculate fair value. Discounts may also be applied due to the nature and/or duration of any restrictions on the disposition of the asset or liability. Fair value represents a good faith approximation of the value of a security. Fair value determinations involve the consideration of a number of subjective factors, an analysis of applicable facts and circumstances and the exercise of judgment. As a result, it is possible that the fair value for a security determined in good faith in accordance with the Valuation Procedures may differ from valuations for the same security determined for other funds using their own valuation procedures. Although the Valuation Procedures are designed to value a security at the price the Fund may reasonably expect to receive upon the security's sale in an orderly transaction, there can be no assurance that any fair value determination thereunder would, in fact, approximate the amount that the Fund would actually realize upon the sale of the security or the price at which the security would trade if a reliable market price were readily available. During the year ended October 31, 2023, there were no material changes to the fair value methodologies.
Notes to Financial Statements (continued)
Securities which may be valued in this manner include, but are not limited to: (i) a security for which trading has been halted or suspended or otherwise does not have a readily available market quotation on a given day; (ii) a debt security that has recently gone into default and for which there is not a current market quotation; (iii) a security of an issuer that has entered into a restructuring; (iv) a security that has been delisted from a national exchange; (v) a security subject to trading collars for which no or limited trading takes place; and (vi) a security whose principal market has been temporarily closed at a time when, under normal conditions, it would be open. Securities valued in this manner are generally categorized as Level 2 or 3 in the hierarchy. No securities held by the Fund as of October 31, 2023, were fair valued in such a manner.
Investments in mutual funds, including money market funds, are valued at their respective NAVs at the close of business each day on the valuation date. These securities are generally categorized as Level 1 in the hierarchy.
Futures contracts are valued at the last posted settlement price on the market where such futures are primarily traded. These securities are generally categorized as Level 1 in the hierarchy.
Debt securities (other than convertible and municipal bonds) are valued at the evaluated bid prices (evaluated mean prices in the case of convertible and municipal bonds) supplied by a pricing agent or broker selected by the Valuation Designee, in consultation with the Subadvisor. The evaluations are market-based measurements processed through a pricing application and represents the pricing agent’s good faith determination as to what a holder may receive in an orderly transaction under market conditions. The rules-based logic utilizes valuation techniques that reflect participants’ assumptions and vary by asset class and per methodology, maximizing the use of relevant observable data including quoted prices for similar assets, benchmark yield curves and market corroborated inputs. The evaluated bid or mean prices are deemed by the Valuation Designee, in consultation with the Subadvisor, to be representative of market values at the regular close of trading of the Exchange on each valuation date. Debt securities purchased on a delayed delivery basis are marked to market daily until settlement at the forward settlement date. Debt securities, including corporate bonds, U.S. government and federal agency bonds, municipal bonds, foreign bonds, convertible bonds, asset-backed securities and mortgage-backed securities are generally categorized as Level 2 in the hierarchy.
Foreign currency forward contracts are valued at their fair market values measured on the basis of the mean between the last current bid and ask prices based on dealer or exchange quotations and are generally categorized as Level 2 in the hierarchy.
Temporary cash investments acquired in excess of 60 days to maturity at the time of purchase are valued using the latest bid prices or using valuations based on a matrix system (which considers such factors as security prices, yields, maturities and ratings), both as furnished by independent pricing services. Temporary cash investments that mature in 60 days or less at the time of purchase ("Short-Term Investments") are valued using the amortized cost method of valuation, unless the use of
such method would be inappropriate. The amortized cost method involves valuing a security at its cost on the date of purchase and thereafter assuming a constant amortization to maturity of the difference between such cost and the value on maturity date. Amortized cost approximates the current fair value of a security. Securities valued using the amortized cost method are not valued using quoted prices in an active market and are generally categorized as Level 2 in the hierarchy.
The information above is not intended to reflect an exhaustive list of the methodologies that may be used to value portfolio investments. The Valuation Procedures permit the use of a variety of valuation methodologies in connection with valuing portfolio investments. The methodology used for a specific type of investment may vary based on the market data available or other considerations. The methodologies summarized above may not represent the specific means by which portfolio investments are valued on any particular business day.
A portfolio investment may be classified as an illiquid investment under the Fund's written liquidity risk management program and related procedures (“Liquidity Program”). Illiquidity of an investment might prevent the sale of such investment at a time when the Manager or the Subadvisor might wish to sell, and these investments could have the effect of decreasing the overall level of the Fund's liquidity. Further, the lack of an established secondary market may make it more difficult to value illiquid investments, requiring the Fund to rely on judgments that may be somewhat subjective in measuring value, which could vary materially from the amount that the Fund could realize upon disposition. Difficulty in selling illiquid investments may result in a loss or may be costly to the Fund. An illiquid investment is any investment that the Manager or Subadvisor reasonably expects cannot be sold or disposed of in current market conditions in seven calendar days or less without the sale or disposition significantly changing the market value of the investment. The liquidity classification of each investment will be made using information obtained after reasonable inquiry and taking into account, among other things, relevant market, trading and investment-specific considerations in accordance with the Liquidity Program. Illiquid investments are often fair valued in accordance with the Fund's procedures described above. The liquidity of the Fund's investments was determined as of October 31, 2023, and can change at any time. Illiquid investments as of October 31, 2023, are shown in the Portfolio of Investments.
(B) Income Taxes. The Fund's policy is to comply with the requirements of the Internal Revenue Code of 1986, as amended (the “Internal Revenue Code”), applicable to regulated investment companies and to distribute all of its taxable income to the shareholders of the Fund within the allowable time limits.
The Manager evaluates the Fund’s tax positions to determine if the tax positions taken meet the minimum recognition threshold in connection with accounting for uncertainties in income tax positions taken or expected to be taken for the purposes of measuring and recognizing tax liabilities in the financial statements. Recognition of tax benefits of an uncertain tax position is permitted only to the extent the position is “more
| 26 | MainStay Candriam Emerging Markets Debt Fund |
likely than not” to be sustained assuming examination by taxing authorities. The Manager analyzed the Fund's tax positions taken on federal, state and local income tax returns for all open tax years (for up to three tax years) and has concluded that no provisions for federal, state and local income tax are required in the Fund's financial statements. The Fund's federal, state and local income tax and federal excise tax returns for tax years for which the applicable statutes of limitations have not expired are subject to examination by the Internal Revenue Service and state and local departments of revenue.
(C) Dividends and Distributions to Shareholders. Dividends and distributions are recorded on the ex-dividend date. The Fund intends to declare and pay dividends from net investment income, if any, at least monthly and distributions from net realized capital and currency gains, if any, at least annually. Unless a shareholder elects otherwise, all dividends and distributions are reinvested at NAV in the same class of shares of the Fund. Dividends and distributions to shareholders are determined in accordance with federal income tax regulations and may differ from determinations using GAAP.
(D) Security Transactions and Investment Income. The Fund records security transactions on the trade date. Realized gains and losses on security transactions are determined using the identified cost method. Interest income is accrued as earned using the effective interest rate method. Distributions received from real estate investment trusts may be classified as dividends, capital gains and/or return of capital. Discounts and premiums on securities purchased for the Fund are accreted and amortized, respectively, on the effective interest rate method. Income from payment-in-kind securities, to the extent the Fund held any such securities during the year ended October 31, 2023, is accreted daily based on the effective interest method.
Investment income and realized and unrealized gains and losses on investments of the Fund are allocated pro rata to the separate classes of shares based upon their relative net assets on the date the income is earned or realized and unrealized gains and losses are incurred.
The Fund may place a debt security on non-accrual status and reduce related interest income by ceasing current accruals and writing off all or a portion of any interest receivables when the collection of all or a portion of such interest has become doubtful. A debt security is removed from non-accrual status when the issuer resumes interest payments or when collectability of interest is reasonably assured.
(E) Expenses. Expenses of the Trust are allocated to the individual Funds in proportion to the net assets of the respective Funds when the expenses are incurred, except where direct allocations of expenses can be made. Expenses (other than transfer agent expenses and fees incurred under the shareholder services plans and/or the distribution plans further discussed in Note 3(B)) are allocated to separate classes of shares pro rata based upon their relative net assets on the date the expenses are incurred. The expenses borne by the Fund, including those of related parties to the Fund, are shown in the Statement of Operations.
Additionally, the Fund may invest in mutual funds, which are subject to management fees and other fees that may cause the costs of investing in mutual funds to be greater than the costs of owning the underlying securities directly. These indirect expenses of mutual funds are not included in the amounts shown as expenses in the Statement of Operations or in the expense ratios included in the Financial Highlights.
(F) Use of Estimates. In preparing financial statements in conformity with GAAP, the Manager makes estimates and assumptions that affect the reported amounts and disclosures in the financial statements. Actual results could differ from those estimates and assumptions.
(G) Futures Contracts. A futures contract is an agreement to purchase or sell a specified quantity of an underlying instrument at a specified future date and price, or to make or receive a cash payment based on the value of a financial instrument (e.g., foreign currency, interest rate, security or securities index). The Fund is subject to risks such as market price risk, leverage risk, liquidity risk, counterparty risk, operational risk, legal risk and/or interest rate risk in the normal course of investing in these contracts. Upon entering into a futures contract, the Fund is required to pledge to the broker or futures commission merchant an amount of cash and/or U.S. government securities equal to a certain percentage of the collateral amount, known as the “initial margin.” During the period the futures contract is open, changes in the value of the contract are recognized as unrealized appreciation or depreciation by marking to market such contract on a daily basis to reflect the market value of the contract at the end of each day’s trading. The Fund agrees to receive from or pay to the broker or futures commission merchant an amount of cash equal to the daily fluctuation in the value of the contract. Such receipts or payments are known as “variation margin.” When the futures contract is closed, the Fund records a realized gain or loss equal to the difference between the proceeds from (or cost of) the closing transaction and the Fund's basis in the contract.
The use of futures contracts involves, to varying degrees, elements of market risk in excess of the amount recognized in the Statement of Assets and Liabilities. The contract or notional amounts and variation margin reflect the extent of the Fund's involvement in open futures positions. There are several risks associated with the use of futures contracts as hedging techniques. There can be no assurance that a liquid market will exist at the time when the Fund seeks to close out a futures contract. If no liquid market exists, the Fund would remain obligated to meet margin requirements until the position is closed. Futures contracts may involve a small initial investment relative to the risk assumed, which could result in losses greater than if the Fund did not invest in futures contracts. Futures contracts may be more volatile than direct investments in the instrument underlying the futures and may not correlate to the underlying instrument, causing a given hedge not to achieve its objectives. The Fund's activities in futures contracts have minimal counterparty risk as they are conducted through regulated exchanges that guarantee the futures against default by the counterparty. In the event of a bankruptcy or insolvency of a futures commission merchant that holds margin on behalf of the Fund, the Fund may not be entitled to the return
Notes to Financial Statements (continued)
of the entire margin owed to the Fund, potentially resulting in a loss. The Fund may invest in futures contracts to seek enhanced returns or to reduce the risk of loss by hedging certain of its holdings. The Fund's investment in futures contracts and other derivatives may increase the volatility of the Fund's NAVs and may result in a loss to the Fund. Open futures contracts as of October 31, 2023, are shown in the Portfolio of Investments.
(H) Foreign Currency Forward Contracts. The Fund may enter into foreign currency forward contracts, which are agreements to buy or sell foreign currencies on a specified future date at a specified rate. The Fund is subject to foreign currency exchange rate risk in the normal course of investing in these transactions. During the period the forward contract is open, changes in the value of the contract are recognized as unrealized appreciation or depreciation by marking to market such contract on a daily basis to reflect the market value of the contract at the end of each day’s trading. Cash movement occurs on the settlement date. When the forward contract is closed, the Fund records a realized gain or loss equal to the difference between the proceeds from (or cost of) the closing transaction and the Fund's basis in the contract. The Fund may purchase and sell foreign currency forward contracts for purposes of seeking to enhance portfolio returns and manage portfolio risk more efficiently. Foreign currency forward contracts may also be used to gain exposure to a particular currency or to hedge against the risk of loss due to changing currency exchange rates. Foreign currency forward contracts to purchase or sell a foreign currency may also be used in anticipation of future purchases or sales of securities denominated in foreign currency, even if the specific investments have not yet been selected.
The use of foreign currency forward contracts involves, to varying degrees, elements of risk in excess of the amount recognized in the Statement of Assets and Liabilities, including counterparty risk, market risk, leverage risk, operational risk, legal risk and liquidity risk. Counterparty risk is heightened for these instruments because foreign currency forward contracts are not exchange-traded and therefore no clearinghouse or exchange stands ready to meet the obligations under such contracts. Thus, the Fund faces the risk that its counterparties under such contracts may not perform their obligations. Market risk is the risk that the value of a foreign currency forward contract will depreciate due to unfavorable changes in exchange rates. Liquidity risk arises because the secondary market for foreign currency forward contracts may have less liquidity relative to markets for other securities and financial instruments. Liquidity risk also can arise when forward currency contracts create margin or settlement payment obligations for the Fund. Leverage risk is the risk that a foreign currency forward contract can magnify the Fund's gains and losses. Operational risk refers to risk related to potential operational issues (including documentation issues, settlement issues, systems failures, inadequate controls and human error), and legal risk refers to insufficient documentation, insufficient capacity or authority of the counterparty, or legality or enforceability of a foreign currency forward contract. Risks also arise from the possible movements in the foreign exchange rates underlying these instruments. While the Fund may enter into forward contracts to reduce currency exchange risks, changes in
currency exchange rates may result in poorer overall performance for the Fund than if it had not engaged in such transactions. Exchange rate movements can be large, depending on the currency, and can last for extended periods of time, affecting the value of the Fund's assets. Moreover, there may be an imperfect correlation between the Fund's holdings of securities denominated in a particular currency and forward contracts entered into by the Fund. Such imperfect correlation may prevent the Fund from achieving the intended hedge or expose the Fund to the risk of currency exchange loss. The unrealized appreciation (depreciation) on forward contracts also reflects the Fund's exposure at the valuation date to credit loss in the event of a counterparty’s failure to perform its obligations. Open foreign currency forward contracts as of October 31, 2023, are shown in the Portfolio of Investments.
(I) Foreign Currency Transactions. The Fund's books and records are maintained in U.S. dollars. Prices of securities denominated in foreign currency amounts are translated into U.S. dollars at the mean between the buying and selling rates last quoted by any major U.S. bank at the following dates:
(i) market value of investment securities, other assets and liabilities— at the valuation date; and
(ii) purchases and sales of investment securities, income and expenses—at the date of such transactions.
The assets and liabilities that are denominated in foreign currency amounts are presented at the exchange rates and market values at the close of the period. The realized and unrealized changes in net assets arising from fluctuations in exchange rates and market prices of securities are not separately presented.
Net realized gain (loss) on foreign currency transactions represents net currency gains or losses realized as a result of differences between the amounts of securities sale proceeds or purchase cost, dividends, interest and withholding taxes as recorded on the Fund's books, and the U.S. dollar equivalent amount actually received or paid. Net currency gains or losses from valuing such foreign currency denominated assets and liabilities, other than investments at valuation date exchange rates, are reflected in unrealized foreign exchange gains or losses.
(J) Securities Lending. In order to realize additional income, the Fund may engage in securities lending, subject to the limitations set forth in the 1940 Act and relevant guidance by the staff of the Securities and Exchange Commission (“SEC”). If the Fund engages in securities lending, the Fund will lend through its custodian, JPMorgan Chase Bank, N.A., ("JPMorgan"), acting as securities lending agent on behalf of the Fund. Under the current arrangement, JPMorgan will manage the Fund's collateral in accordance with the securities lending agency agreement between the Fund and JPMorgan, and indemnify the Fund against counterparty risk. The loans will be collateralized by cash (which may be invested in a money market fund) and/or non-cash collateral (which may include U.S. Treasury securities and/or U.S. government agency securities issued or guaranteed by the United States government or its agencies or instrumentalities) at least equal at all times to the market value of the
| 28 | MainStay Candriam Emerging Markets Debt Fund |
securities loaned. Non-cash collateral held at year end is segregated and cannot be transferred by the Fund. The Fund bears the risk of delay in recovery of, or loss of rights in, the securities loaned. The Fund may also record a realized gain or loss on securities deemed sold due to a borrower’s inability to return securities on loan. The Fund bears the risk of any loss on investment of cash collateral. The Fund will receive compensation for lending its securities in the form of fees or it will retain a portion of interest earned on the investment of any cash collateral. The Fund will also continue to receive interest and dividends on the securities loaned and any gain or loss in the market price of the securities loaned that may occur during the term of the loan will be for the account of the Fund. Income earned from securities lending activities, if any, is reflected in the Statement of Operations. Securities on loan as of October 31, 2023, are shown in the Portfolio of Investments.
(K) High Yield and General Debt Securities Risk. The ability of issuers of debt securities held by the Fund to meet their obligations may be affected by, among other things, economic or political developments in a specific country, industry or region. Debt securities are also subject to the risks associated with changes in interest rates. The Fund’s principal investments include high yield debt securities (commonly referred to as “junk bonds”), which are considered speculative because they present a greater risk of loss, including default, than higher quality debt securities. These securities pay investors a premium—a higher interest rate or yield than investment grade debt securities—because of the increased risk of loss. These securities can also be subject to greater price volatility. In times of unusual or adverse market economic or political conditions, these securities may experience higher than normal default rates.
(L) Foreign Securities Risk and Emerging Markets Risk. The ability of issuers of debt securities held by the Fund to meet their obligations may be affected by, among other things, economic or political developments in a specific country, industry or region. Debt securities are also subject to the risks associated with changes in interest rates. The Fund may invest in foreign securities, which carry certain risks that are in addition to the usual risks inherent in domestic securities. Foreign regulatory regimes and securities markets can have less stringent investor protections and disclosure standards and less liquid trading markets than U.S. regulatory regimes and securities markets, and can experience political, social and economic developments that may affect the value of investments in foreign securities. These risks include those resulting from currency fluctuations, future adverse political or economic developments and possible imposition of currency exchange blockages or other foreign governmental laws or restrictions. Economic sanctions and other similar governmental actions or developments could, among other things, effectively restrict or eliminate the Fund’s ability to purchase or sell certain foreign securities or groups of foreign securities, and thus may make the Fund’s investments in such securities less liquid or more difficult to value. The ability of issuers of debt securities held by the Fund to meet their obligations may be affected by, among other things, economic or political developments in a specific country, industry or region.
The risks related to investing in foreign securities are generally greater with respect to securities of companies that conduct their business activities in emerging markets or whose securities are traded principally in emerging markets. The risks of investing in emerging markets include the risks of illiquidity, increased price volatility, smaller market capitalizations, less government regulation, less extensive and less frequent accounting, financial and other reporting requirements, loss resulting from problems in share registration and custody, substantial economic and political disruptions and the nationalization of foreign deposits or assets.
(M) Counterparty Credit Risk. In order to better define its contractual rights and to secure rights that will help the Fund mitigate its counterparty risk, the Fund may enter into an International Swaps and Derivatives Association, Inc. Master Agreement (“ISDA Master Agreement”) or similar agreement with its counterparties. An ISDA Master Agreement is a bilateral agreement between the Fund and a counterparty that governs certain OTC derivatives and typically contains collateral posting terms and netting provisions. Under an ISDA Master Agreement, the Fund may, under certain circumstances, offset with the counterparty certain derivative financial instruments’ payables and/ or receivables with collateral held and/or posted and create one single net payment. The provisions of the ISDA Master Agreement typically permit a single net payment in the event of default including the bankruptcy or insolvency of the counterparty. Bankruptcy or insolvency laws of a particular jurisdiction may restrict or prohibit the right of offset in bankruptcy, insolvency or other events. In addition, certain ISDA Master Agreements may contain provisions for early termination of OTC derivative transactions in the event the net assets of the Fund decline below specific levels or if the Fund fails to meet the terms of its ISDA Master Agreements. The result would cause the Fund to accelerate payment of any net liability owed to the counterparty.
For financial reporting purposes, the Fund does not offset derivative assets and derivative liabilities that are subject to netting arrangements, if any, in the Statement of Assets and Liabilities.
(N) Indemnifications. Under the Trust’s organizational documents, its officers and trustees are indemnified against certain liabilities that may arise out of performance of their duties to the Trust. Additionally, in the normal course of business, the Fund enters into contracts with third-party service providers that contain a variety of representations and warranties and that may provide general indemnifications. The Fund's maximum exposure under these arrangements is unknown, as this would involve future claims that may be made against the Fund that have not yet occurred. The Manager believes that the risk of loss in connection with these potential indemnification obligations is remote. However, there can be no assurance that material liabilities related to such obligations will not arise in the future, which could adversely impact the Fund.
Notes to Financial Statements (continued)
(O) Quantitative Disclosure of Derivative Holdings. The following tables show additional disclosures related to the Fund's derivative and hedging activities, including how such activities are accounted for and their effect on the Fund's financial positions, performance and cash flows.
The Fund entered into futures contracts to hedge against anticipated changes in interest rates that might otherwise have an adverse effect upon the value of the Fund’s securities as well as help manage the duration and yield curve positioning of the portfolio.
The Fund also entered into foreign currency forward contracts to gain exposure to a particular currency or to hedge against the risk of loss due to changing currency exchange rates.
Fair value of derivative instruments as of October 31, 2023:
| Asset Derivatives | Foreign
Exchange
Contracts
Risk | Total |
| Forward Contracts - Unrealized appreciation on foreign currency forward contracts (a) | $3,697 | $3,697 |
| Total Fair Value | $3,697 | $3,697 |
| (a) | Includes cumulative appreciation (depreciation) of futures contracts as reported in the Portfolio of Investments. Only current day’s variation margin is reported within the Statement of Assets and Liabilities. |
| Liability Derivatives | Foreign
Exchange
Contracts
Risk | Interest
Rate
Contracts
Risk | Total |
| Futures Contracts - Net Assets—Net unrealized depreciation on futures contracts (a) | $ — | $(556,253) | $(556,253) |
| Forward Contracts - Unrealized depreciation on foreign currency forward contracts | (33,003) | — | (33,003) |
| Total Fair Value | $(33,003) | $(556,253) | $(589,256) |
| (a) | Includes cumulative appreciation (depreciation) of futures contracts as reported in the Portfolio of Investments. Only current day’s variation margin is reported within the Statement of Assets and Liabilities. |
The effect of derivative instruments on the Statement of Operations for the year ended October 31, 2023:
| Net Realized Gain (Loss) from: | Foreign
Exchange
Contracts
Risk | Interest
Rate
Contracts
Risk | Total |
| Futures Transactions | $ — | $(456,539) | $(456,539) |
| Forward Transactions | 417,650 | — | 417,650 |
| Total Net Realized Gain (Loss) | $417,650 | $(456,539) | $ (38,889) |
| Net Change in Unrealized Appreciation (Depreciation) | Foreign
Exchange
Contracts
Risk | Interest
Rate
Contracts
Risk | Total |
| Futures Contracts | $ — | $(557,477) | $(557,477) |
| Forward Contracts | (29,306) | — | (29,306) |
| Total Net Change in Unrealized Appreciation (Depreciation) | $(29,306) | $(557,477) | $(586,783) |
| Average Notional Amount | Total |
| Futures Contracts Long (a) | $17,277,266 |
| Futures Contracts Short (b) | $ (3,034,767) |
| Forward Contracts Short (a) | $ (7,343,253) |
| (a) | Positions were open eleven months during the reporting period. |
| (b) | Positions were open ten months during the reporting period. |
Note 3–Fees and Related Party Transactions
(A) Manager and Subadvisor. New York Life Investments, a registered investment adviser and an indirect, wholly-owned subsidiary of New York Life Insurance Company ("New York Life"), serves as the Fund's Manager, pursuant to an Amended and Restated Management Agreement (“Management Agreement”). The Manager provides offices, conducts clerical, recordkeeping and bookkeeping services and keeps most of the financial and accounting records required to be maintained by the Fund. Except for the portion of salaries and expenses that are the responsibility of the Fund, the Manager pays the salaries and expenses of all personnel affiliated with the Fund and certain operational expenses of the Fund. The Fund reimburses New York Life Investments in an amount equal to the portion of the compensation of the Chief Compliance Officer attributable to the Fund. Candriam (the "Subadvisor"), a registered investment adviser and an indirect, wholly-owned subsidiary of New York Life, serves as the Subadvisor to the Fund and is responsible for the day-to-day portfolio management of the Fund. Pursuant to the terms of a Subadvisory Agreement ("Subadvisory Agreement") between New York Life Investments and Candriam, New York Life Investments pays for the services of the Subadvisor.
Pursuant to the Management Agreement, the Fund pays the Manager a monthly fee for the services performed and the facilities furnished at an annual rate of the Fund’s average daily net assets as follows: 0.70% to $500 million and 0.65% in excess of $500 million. During the year ended October 31, 2023, the effective management fee rate was 0.70% of the Fund’s average daily net assets, exclusive of any applicable waivers/reimbursements.
New York Life Investments has contractually agreed to waive fees and/or reimburse expenses so that Total Annual Fund Operating Expenses (excluding taxes, interest, litigation, extraordinary expenses, brokerage and other transaction expenses relating to the purchase or sale of portfolio investments and acquired (underlying) fund fees and expenses) do not exceed the following percentages of daily net assets: Class A, 1.15% and Class I, 0.85%. New York Life Investments will apply an
| 30 | MainStay Candriam Emerging Markets Debt Fund |
equivalent waiver or reimbursement, in an equal number of basis points of the Class A shares waiver/reimbursement to the Investor Class, Class B and Class C shares. This agreement will remain in effect until February 28, 2024, and shall renew automatically for one-year terms unless New York Life Investments provides written notice of termination prior to the start of the next term or upon approval of the Board.
During the year ended October 31, 2023, New York Life Investments earned fees from the Fund in the amount of $433,904 and waived fees and/or reimbursed expenses, including the waiver/reimbursement of certain class specific expenses in the amount of $196,352 and paid the Subadvisor fees in the amount of $118,542.
JPMorgan provides sub-administration and sub-accounting services to the Fund pursuant to an agreement with New York Life Investments. These services include calculating the daily NAVs of the Fund, maintaining the general ledger and sub-ledger accounts for the calculation of the Fund's NAVs, and assisting New York Life Investments in conducting various aspects of the Fund's administrative operations. For providing these services to the Fund, JPMorgan is compensated by New York Life Investments.
Pursuant to an agreement between the Trust and New York Life Investments, New York Life Investments is responsible for providing or procuring certain regulatory reporting services for the Fund. The Fund will reimburse New York Life Investments for the actual costs incurred by New York Life Investments in connection with providing or procuring these services for the Fund.
(B) Distribution and Service Fees. The Trust, on behalf of the Fund, has entered into a distribution agreement with NYLIFE Distributors LLC (the “Distributor”), an affiliate of New York Life Investments. The Fund has adopted distribution plans (the “Plans”) in accordance with the provisions of Rule 12b-1 under the 1940 Act.
Pursuant to the Class A and Investor Class Plans, the Distributor receives a monthly fee from the Class A and Investor Class shares at an annual rate of 0.25% of the average daily net assets of the Class A and Investor Class shares for distribution and/or service activities as designated by the Distributor. Pursuant to the Class B and Class C Plans, Class B and Class C shares pay the Distributor a monthly distribution fee at an annual rate of 0.75% of the average daily net assets of the Class B and Class C shares along with a service fee at an annual rate of 0.25% of the average daily net assets of the Class B and Class C shares, for a total 12b-1 fee of 1.00%. Class I shares are not subject to a distribution and/or service fee.
The Plans provide that the distribution and service fees are payable to the Distributor regardless of the amounts actually expended by the Distributor for distribution of the Fund's shares and service activities.
(C) Sales Charges. The Fund was advised by the Distributor that the amount of initial sales charges retained on sales of Class A and Investor Class shares during the year ended October 31, 2023, were $2,744 and $505, respectively.
The Fund was also advised that the Distributor retained CDSCs on redemptions of Class B shares during the year ended October 31, 2023, of $2.
(D) Transfer, Dividend Disbursing and Shareholder Servicing Agent. NYLIM Service Company LLC, an affiliate of New York Life Investments, is the Fund's transfer, dividend disbursing and shareholder servicing agent pursuant to an agreement between NYLIM Service Company LLC and the Trust. NYLIM Service Company LLC has entered into an agreement with SS&C Global Investor & Distribution Solutions, Inc. ("SS&C"), pursuant to which SS&C performs certain transfer agent services on behalf of NYLIM Service Company LLC. New York Life Investments has contractually agreed to limit the transfer agency expenses charged to the Fund’s share classes to a maximum of 0.35% of that share class’s average daily net assets on an annual basis after deducting any applicable Fund or class-level expense reimbursement or small account fees. This agreement will remain in effect until February 28, 2024, and shall renew automatically for one-year terms unless New York Life Investments provides written notice of termination prior to the start of the next term or upon approval of the Board. During the year ended October 31, 2023, transfer agent expenses incurred by the Fund and any reimbursements, pursuant to the aforementioned Transfer Agency expense limitation agreement, were as follows:
| Class | Expense | Waived |
| Class A | $82,574 | $ — |
| Investor Class | 59,232 | 457 |
| Class B | 2,360 | (9) |
| Class C | 7,499 | 13 |
| Class I | 6,139 | — |
(E) Small Account Fee. Shareholders with small accounts adversely impact the cost of providing transfer agency services. In an effort to reduce total transfer agency expenses, the Fund has implemented a small account fee on certain types of accounts. As described in the Fund's prospectus, certain shareholders with an account balance of less than $1,000 ($5,000 for Class A share accounts) are charged an annual per account fee of $20 (assessed semi-annually), the proceeds from which offset transfer agent fees as reflected in the Statement of Operations. This small account fee will not apply to certain types of accounts as described further in the Fund’s prospectus.
Notes to Financial Statements (continued)
Note 4-Federal Income Tax
As of October 31, 2023, the cost and unrealized appreciation (depreciation) of the Fund’s investment portfolio, including applicable derivative contracts and other financial instruments, as determined on a federal income tax basis, were as follows:
| | Federal Tax
Cost | Gross
Unrealized
Appreciation | Gross
Unrealized
(Depreciation) | Net
Unrealized
Appreciation/
(Depreciation) |
| Investments in Securities | $66,359,025 | $331,372 | $(12,316,614) | $(11,985,242) |
As of October 31, 2023, the components of accumulated gain (loss) on a tax basis were as follows:
Ordinary
Income | Accumulated
Capital
and Other
Gain (Loss) | Other
Temporary
Differences | Unrealized
Appreciation
(Depreciation) | Total
Accumulated
Gain (Loss) |
| $1,638,797 | $(34,697,025) | $(3,332,692) | $(11,990,299) | $(48,381,219) |
The difference between book-basis and tax-basis unrealized appreciation (depreciation) is primarily due to wash sales adjustment, mark to market of forwards and mark to market of futures. The other temporary differences are primarily due to interest accruals on defaulted securities.
As of October 31, 2023, for federal income tax purposes, capital loss carryforwards of $34,675,783, as shown in the table below, were available to the extent provided by the regulations to offset future realized gains of the Fund. Accordingly, no capital gains distributions are expected to be paid to shareholders until net gains have been realized in excess of such amounts.
Capital Loss
Available Through | Short-Term
Capital Loss
Amounts (000’s) | Long-Term
Capital Loss
Amounts (000’s) |
| Unlimited | $11,576 | $23,100 |
During the years ended October 31, 2023 and October 31, 2022, the tax character of distributions paid as reflected in the Statements of Changes in Net Assets was as follows:
| | 2023 | 2022 |
| Distributions paid from: | | |
| Ordinary Income | $3,317,168 | $4,543,692 |
| Return of Capital | — | 348,479 |
| Total | $3,317,168 | $4,892,171 |
Note 5–Custodian
JPMorgan is the custodian of cash and securities held by the Fund. Custodial fees are charged to the Fund based on the Fund's net assets and/or the market value of securities held by the Fund and the number of certain transactions incurred by the Fund.
Note 6–Line of Credit
The Fund and certain other funds managed by New York Life Investments maintain a line of credit with a syndicate of banks in order to secure a source of funds for temporary purposes to meet unanticipated or excessive redemption requests.
Effective July 25, 2023, under the credit agreement (the “Credit Agreement”), the aggregate commitment amount is $600,000,000 with an additional uncommitted amount of $100,000,000. The commitment fee is an annual rate of 0.15% of the average commitment amount payable quarterly, regardless of usage, to JPMorgan, who serves as the agent to the syndicate. The commitment fee is allocated among the Fund and certain other funds managed by New York Life Investments based upon their respective net assets and other factors. Interest on any revolving credit loan is charged based upon the Federal Funds Rate, Daily Simple Secured Overnight Financing Rate ("SOFR") + 0.10%, or the Overnight Bank Funding Rate, whichever is higher. The Credit Agreement expires on July 23, 2024, although the Fund, certain other funds managed by New York Life Investments and the syndicate of banks may renew the Credit Agreement for an additional year on the same or different terms or enter into a credit agreement with a different syndicate of banks. Prior to July 25, 2023, the aggregate commitment amount and the commitment fee were the same as those under the current Credit Agreement. During the year ended October 31, 2023, there were no borrowings made or outstanding with respect to the Fund under the Credit Agreement.
Note 7–Interfund Lending Program
Pursuant to an exemptive order issued by the SEC, the Fund, along with certain other funds managed by New York Life Investments, may participate in an interfund lending program. The interfund lending program provides an alternative credit facility that permits the Fund and certain other funds managed by New York Life Investments to lend or borrow money for temporary purposes directly to or from one another, subject to the conditions of the exemptive order. During the year ended October 31, 2023, there were no interfund loans made or outstanding with respect to the Fund.
Note 8–Purchases and Sales of Securities (in 000’s)
During the year ended October 31, 2023, purchases and sales of securities, other than short-term securities, were $73,718 and $86,874, respectively.
| 32 | MainStay Candriam Emerging Markets Debt Fund |
Note 9–Capital Share Transactions
Transactions in capital shares for the years ended October 31, 2023 and October 31, 2022, were as follows:
| Class A | Shares | Amount |
| Year ended October 31, 2023: | | |
| Shares sold | 2,366,984 | $ 17,206,042 |
| Shares issued to shareholders in reinvestment of distributions | 338,349 | 2,471,043 |
| Shares redeemed | (3,672,824) | (26,808,536) |
| Net increase (decrease) in shares outstanding before conversion | (967,491) | (7,131,451) |
| Shares converted into Class A (See Note 1) | 64,955 | 474,372 |
| Shares converted from Class A (See Note 1) | (9,556) | (70,346) |
| Net increase (decrease) | (912,092) | $ (6,727,425) |
| Year ended October 31, 2022: | | |
| Shares sold | 1,316,634 | $ 10,780,850 |
| Shares issued to shareholders in reinvestment of distributions | 441,165 | 3,682,467 |
| Shares redeemed | (3,131,520) | (25,516,770) |
| Net increase (decrease) in shares outstanding before conversion | (1,373,721) | (11,053,453) |
| Shares converted into Class A (See Note 1) | 26,691 | 222,143 |
| Shares converted from Class A (See Note 1) | (813) | (7,369) |
| Net increase (decrease) | (1,347,843) | $(10,838,679) |
| |
| Investor Class | Shares | Amount |
| Year ended October 31, 2023: | | |
| Shares sold | 15,228 | $ 112,580 |
| Shares issued to shareholders in reinvestment of distributions | 57,992 | 428,581 |
| Shares redeemed | (137,037) | (1,014,692) |
| Net increase (decrease) in shares outstanding before conversion | (63,817) | (473,531) |
| Shares converted into Investor Class (See Note 1) | 24,850 | 183,820 |
| Shares converted from Investor Class (See Note 1) | (47,268) | (349,057) |
| Net increase (decrease) | (86,235) | $ (638,768) |
| Year ended October 31, 2022: | | |
| Shares sold | 24,505 | $ 206,699 |
| Shares issued to shareholders in reinvestment of distributions | 69,037 | 581,267 |
| Shares redeemed | (155,502) | (1,297,451) |
| Net increase (decrease) in shares outstanding before conversion | (61,960) | (509,485) |
| Shares converted into Investor Class (See Note 1) | 21,430 | 177,592 |
| Shares converted from Investor Class (See Note 1) | (15,482) | (131,527) |
| Net increase (decrease) | (56,012) | $ (463,420) |
| |
| Class B | Shares | Amount |
| Year ended October 31, 2023: | | |
| Shares sold | 97 | $ 688 |
| Shares issued to shareholders in reinvestment of distributions | 2,248 | 16,010 |
| Shares redeemed | (9,253) | (66,177) |
| Net increase (decrease) in shares outstanding before conversion | (6,908) | (49,479) |
| Shares converted from Class B (See Note 1) | (22,978) | (163,994) |
| Net increase (decrease) | (29,886) | $ (213,473) |
| Year ended October 31, 2022: | | |
| Shares sold | 1,003 | $ 8,854 |
| Shares issued to shareholders in reinvestment of distributions | 4,123 | 34,222 |
| Shares redeemed | (36,379) | (276,405) |
| Net increase (decrease) in shares outstanding before conversion | (31,253) | (233,329) |
| Shares converted from Class B (See Note 1) | (23,894) | (189,763) |
| Net increase (decrease) | (55,147) | $ (423,092) |
| |
| Class C | Shares | Amount |
| Year ended October 31, 2023: | | |
| Shares sold | 4,802 | $ 34,292 |
| Shares issued to shareholders in reinvestment of distributions | 7,379 | 52,643 |
| Shares redeemed | (65,225) | (465,348) |
| Net increase (decrease) in shares outstanding before conversion | (53,044) | (378,413) |
| Shares converted from Class C (See Note 1) | (23,695) | (168,134) |
| Net increase (decrease) | (76,739) | $ (546,547) |
| Year ended October 31, 2022: | | |
| Shares sold | 11,855 | $ 96,489 |
| Shares issued to shareholders in reinvestment of distributions | 13,736 | 114,445 |
| Shares redeemed | (182,507) | (1,497,503) |
| Net increase (decrease) in shares outstanding before conversion | (156,916) | (1,286,569) |
| Shares converted from Class C (See Note 1) | (9,547) | (78,445) |
| Net increase (decrease) | (166,463) | $ (1,365,014) |
| |
Notes to Financial Statements (continued)
| Class I | Shares | Amount |
| Year ended October 31, 2023: | | |
| Shares sold | 61,692 | $ 452,559 |
| Shares issued to shareholders in reinvestment of distributions | 27,637 | 202,141 |
| Shares redeemed | (228,398) | (1,666,606) |
| Net increase (decrease) in shares outstanding before conversion | (139,069) | (1,011,906) |
| Shares converted into Class I (See Note 1) | 12,869 | 93,339 |
| Net increase (decrease) | (126,200) | $ (918,567) |
| Year ended October 31, 2022: | | |
| Shares sold | 238,664 | $ 1,864,518 |
| Shares issued to shareholders in reinvestment of distributions | 30,376 | 251,287 |
| Shares redeemed | (329,923) | (2,860,046) |
| Net increase (decrease) in shares outstanding before conversion | (60,883) | (744,241) |
| Shares converted into Class I (See Note 1) | 812 | 7,369 |
| Net increase (decrease) | (60,071) | $ (736,872) |
Note 10–Other Matters
As of the date of this report, the Fund faces a heightened level of risk associated with current uncertainty, volatility and state of economies, financial markets, rising interest rates, and labor and health conditions around the world. Events such as war, acts of terrorism, recessions, rapid inflation, the imposition of international sanctions, earthquakes, hurricanes, epidemics and pandemics and other unforeseen natural or human disasters may have broad adverse social, political and economic effects on the global economy, which could negatively impact the value of the Fund's investments. Developments that disrupt global economies and financial markets may magnify factors that affect the Fund's performance.
Note 11–Subsequent Events
In connection with the preparation of the financial statements of the Fund as of and for the year ended October 31, 2023, events and transactions subsequent to October 31, 2023, through the date the financial statements were issued, have been evaluated by the Manager for possible adjustment and/or disclosure. No subsequent events requiring financial statement adjustment or disclosure have been identified.
| 34 | MainStay Candriam Emerging Markets Debt Fund |
Report of Independent Registered Public Accounting Firm
To the Shareholders of the Fund and Board of Trustees
The MainStay Funds:
Opinion on the Financial Statements
We have audited the accompanying statement of assets and liabilities of MainStay Candriam Emerging Markets Debt Fund (the Fund), one of the funds constituting The MainStay Funds, including the portfolio of investments, as of October 31, 2023, the related statement of operations for the year then ended, the statements of changes in net assets for each of the years in the two-year period then ended, and the related notes (collectively, the financial statements) and the financial highlights for each of the years in the five-year period then ended. In our opinion, the financial statements and financial highlights present fairly, in all material respects, the financial position of the Fund as of October 31, 2023, the results of its operations for the year then ended, the changes in its net assets for each of the years in the two-year period then ended, and the financial highlights for each of the years in the five-year period then ended, in conformity with U.S. generally accepted accounting principles.
Basis for Opinion
These financial statements and financial highlights are the responsibility of the Fund's management. Our responsibility is to express an opinion on these financial statements and financial highlights based on our audits. We are a public accounting firm registered with the Public Company Accounting Oversight Board (United States) (PCAOB) and are required to be independent with respect to the Fund in accordance with the U.S. federal securities laws and the applicable rules and regulations of the Securities and Exchange Commission and the PCAOB.
We conducted our audits in accordance with the standards of the PCAOB. Those standards require that we plan and perform the audit to obtain reasonable assurance about whether the financial statements and financial highlights are free of material misstatement, whether due to error or fraud. Our audits included performing procedures to assess the risks of material misstatement of the financial statements and financial highlights, whether due to error or fraud, and performing procedures that respond to those risks. Such procedures included examining, on a test basis, evidence regarding the amounts and disclosures in the financial statements and financial highlights. Such procedures also included confirmation of securities owned as of October 31, 2023, by correspondence with custodians and brokers; when replies were not received from brokers, we performed other auditing procedures. Our audits also included evaluating the accounting principles used and significant estimates made by management, as well as evaluating the overall presentation of the financial statements and financial highlights. We believe that our audits provide a reasonable basis for our opinion.

We have served as the auditor of one or more New York Life Investment Management investment companies since 2003.
Philadelphia, Pennsylvania
December 22, 2023
Federal Income Tax Information
(Unaudited)
The Fund is required under the Internal Revenue Code to advise shareholders in a written statement as to the federal tax status of dividends paid by the Fund during such fiscal years.
In February 2024, shareholders will receive an IRS Form 1099-DIV or substitute Form 1099, which will show the federal tax status of the distributions received by shareholders in calendar year 2023. The amounts that will be reported on such 1099-DIV or substitute Form 1099 will be the amounts you are to use on your federal income tax return and will differ from the amounts which we must report for the Fund's fiscal year ended October 31, 2023.
Proxy Voting Policies and Procedures and Proxy Voting Record
The Fund is required to file with the SEC its proxy voting record for the 12-month period ending June 30 on Form N-PX. A description of the policies and procedures that are used to vote proxies relating to portfolio securities of the Fund is available free of charge upon request by calling 800-624-6782 or visiting the SEC’s website at www.sec.gov. The most recent Form N-PX or proxy voting record is available free of charge upon request by calling 800-624-6782; visiting newyorklifeinvestments.com; or visiting the SEC’s website at www.sec.gov.
Shareholder Reports and Quarterly Portfolio Disclosure
The Fund is required to file its complete schedule of portfolio holdings with the SEC 60 days after its first and third fiscal quarter on Form N-PORT. The Fund's holdings report is available free of charge upon request by calling New York Life Investments at 800-624-6782.
| 36 | MainStay Candriam Emerging Markets Debt Fund |
Board of Trustees and Officers (Unaudited)
The Trustees and officers of the Fund are listed below. The Board oversees the MainStay Group of Funds (which consists of MainStay Funds and MainStay Funds Trust), MainStay VP Funds Trust, MainStay MacKay DefinedTerm Municipal Opportunities Fund, MainStay CBRE Global Infrastructure Megatrends Term Fund, the Manager and the Subadvisors, and elects the officers of the Funds who are responsible for the day-to-day operations of the Fund. Information pertaining to the Trustees and officers is set forth below. Each Trustee serves until his or her successor is elected and qualified or until his or her resignation, death or
removal. Under the Board’s retirement policy, unless an exception is made, a Trustee must tender his or her resignation by the end of the calendar year during which he or she reaches the age of 75. Officers are elected annually by the Board. The business address of each Trustee and officer listed below is 51 Madison Avenue, New York, New York 10010. A majority of the Trustees are not “interested persons” (as defined by the 1940 Act and rules adopted by the SEC thereunder) of the Fund (“Independent Trustees”).
| | Name and
Year of Birth | Term of Office,
Position(s) Held and
Length of Service | Principal Occupation(s)
During Past Five Years | Number of
Portfolios in
Fund Complex
Overseen by
Trustee | Other Directorships
Held by Trustee |
| | | | | | |
| | Naïm Abou-Jaoudé*
1966 | MainStay Funds: Trustee
since 2023
MainStay Funds Trust:
Trustee since 2023 | Chief Executive Officer of New York Life Investment Management LLC (since 2023). Chief Executive Officer of Candriam (an affiliate of New York Life Investment Management LLC) (2007 to 2023). | 81 | MainStay VP Funds Trust:
Trustee since 2023 (31 portfolios);
MainStay MacKay DefinedTerm Municipal Opportunities Fund: Trustee
since 2023;
MainStay CBRE Global Infrastructure Megatrends Term Fund: Trustee
since 2023; and
New York Life Investment Management International (Chair) since 2015 |
| * | This Trustee is considered to be an “interested person” of the MainStay Group of Funds, MainStay VP Funds Trust, MainStay CBRE Global Infrastructure Megatrends Term Fund and MainStay MacKay DefinedTerm Municipal Opportunities Fund, within the meaning of the 1940 Act because of his affiliation with New York Life Investment Management LLC and Candriam, as described in detail above in the column entitled “Principal Occupation(s) During Past Five Years.” |
| | |
Board of Trustees and Officers (Unaudited) (continued)
| | Name and
Year of Birth | Term of Office,
Position(s) Held and
Length of Service | Principal Occupation(s)
During Past Five Years | Number of
Portfolios in
Fund Complex
Overseen by
Trustee | Other Directorships
Held by Trustee |
| | | | | | |
| | David H. Chow
1957 | MainStay Funds: Trustee since January 2016, Advisory Board Member (June 2015 to December 2015);MainStay Funds Trust:
Trustee since January 2016, Advisory Board Member (June 2015 to December 2015) | Founder and CEO, DanCourt Management, LLC (since 1999) | 81 | MainStay VP Funds Trust: Trustee since January 2016, Advisory Board Member (June 2015 to December 2015) (31 portfolios);
MainStay MacKay DefinedTerm Municipal Opportunities Fund: Trustee since January 2016, Advisory Board Member (June 2015 to December 2015);
MainStay CBRE Global Infrastructure Megatrends Term Fund: Trustee since 2021;
VanEck Vectors Group of Exchange-Traded Funds: Trustee since 2006 and Independent Chairman of the Board of Trustees from 2008 to 2022 (57 portfolios); and
Berea College of Kentucky: Trustee since 2009, Chair of the Investment Committee since 2018 |
| | Karen Hammond
1956 | MainStay Funds: Trustee since December 2021, Advisory Board Member (June 2021 to December 2021);MainStay Funds Trust:
Trustee since December 2021, Advisory Board Member (June 2021 to December 2021)
| Retired, Managing Director, Devonshire Investors (2007 to 2013); Senior Vice President, Fidelity Management & Research Co. (2005 to 2007); Senior Vice President and Corporate Treasurer, FMR Corp. (2003 to 2005); Chief Operating Officer, Fidelity Investments Japan (2001 to 2003) | 81 | MainStay VP Funds Trust: Trustee since December 2021, Advisory Board Member (June 2021 to December 2021) (31 portfolios);
MainStay MacKay DefinedTerm Municipal Opportunities Fund: Trustee since December 2021, Advisory Board Member (June 2021 to December 2021);
MainStay CBRE Global Infrastructure Megatrends Term Fund: Trustee since December 2021, Advisory Board Member (June 2021 to December 2021);
Two Harbors Investment Corp.: Director since 2018;
Rhode Island State Investment Commission: Member since 2017; and
Blue Cross Blue Shield of Rhode Island: Director since 2019 |
| | Susan B. Kerley
1951 | MainStay Funds: Chair since January 2017 and Trustee since 2007;MainStay Funds Trust:
Chair since January 2017 and Trustee since 1990*** | President, Strategic Management Advisors LLC (since 1990) | 81 | MainStay VP Funds Trust: Chair since January 2017 and Trustee since 2007 (31 portfolios)**;
MainStay MacKay DefinedTerm Municipal Opportunities Fund: Chair since January 2017 and Trustee since 2011;
MainStay CBRE Global Infrastructure Megatrends Term Fund: Trustee since June 2021; and
Legg Mason Partners Funds: Trustee since 1991 (45 portfolios) |
| 38 | MainStay Candriam Emerging Markets Debt Fund |
| | Name and
Year of Birth | Term of Office,
Position(s) Held and
Length of Service | Principal Occupation(s)
During Past Five Years | Number of
Portfolios in
Fund Complex
Overseen by
Trustee | Other Directorships
Held by Trustee |
| | | | | | |
| | Alan R. Latshaw
1951 | MainStay Funds: Trusteesince 2006;MainStay Funds Trust:
Trustee since 2007*** | Retired; Partner, Ernst & Young LLP (2002 to 2003); Partner, Arthur Andersen LLP (1989 to 2002); Consultant to the MainStay Funds Audit and Compliance Committee (2004 to 2006) | 81 | MainStay VP Funds Trust: Trustee since 2007 (31 portfolios)**;
MainStay MacKay DefinedTerm Municipal Opportunities Fund: Trustee since 2011; and
MainStay CBRE Global Infrastructure Megatrends Term Fund: Trustee since June 2021 |
| | Jacques P. Perold
1958 | MainStay Funds: Trustee since January 2016, Advisory Board Member (June 2015to December 2015);MainStay Funds Trust:
Trustee since January 2016, Advisory Board Member (June 2015 to December 2015) | Founder and Chief Executive Officer, CapShift Advisors LLC (since 2018); President, Fidelity Management & Research Company (2009 to 2014); President and Chief Investment Officer, Geode Capital Management, LLC (2001 to 2009) | 81 | MainStay VP Funds Trust: Trustee since January 2016, Advisory Board Member (June 2015 to December 2015) (31 portfolios);
MainStay MacKay DefinedTerm Municipal Opportunities Fund: Trustee since January 2016, Advisory Board Member (June 2015 to December 2015);
MainStay CBRE Global Infrastructure Megatrends Term Fund: Trustee since June 2021;
Allstate Corporation: Director since 2015; and
MSCI Inc.: Director since 2017 |
| | Richard S. Trutanic
1952 | MainStay Funds: Trustee since 1994;MainStay Funds Trust:
Trustee since 2007*** | Chairman and Chief Executive Officer, Somerset & Company (financial advisory firm) (since 2004); Managing Director, The Carlyle Group (private investment firm) (2002 to 2004); Senior Managing Director, Partner and Board Member, Groupe Arnault S.A. (private investment firm) (1999 to 2002) | 81 | MainStay VP Funds Trust: Trustee since 2007 (31 portfolios)**;
MainStay MacKay DefinedTerm Municipal Opportunities Fund: Trustee since 2011; and
MainStay CBRE Global Infrastructure Megatrends Term Fund: Trustee since June 2021 |
| ** | Includes prior service as a Director of MainStay VP Series Fund, Inc., the predecessor to MainStay VP Funds Trust. |
| *** | Includes prior service as a Director/Trustee of certain predecessor entities to MainStay Funds Trust. |
Board of Trustees and Officers (Unaudited) (continued)
| | Name and
Year of Birth | Position(s) Held and
Length of Service | Principal Occupation(s)
During Past Five Years | |
| | | | | |
| | Kirk C. Lehneis
1974 | President, MainStay Funds, MainStay Funds Trust (since 2017) | Chief Operating Officer and Senior Managing Director (since 2016), New York Life Investment Management LLC and New York Life Investment Management Holdings LLC; Member of the Board of Managers (since 2017) and Senior Managing Director (since 2018), NYLIFE Distributors LLC; Chairman of the Board and Senior Managing Director, NYLIM Service Company LLC (since 2017); Trustee, President and Principal Executive Officer of IndexIQ Trust, IndexIQ ETF Trust and IndexIQ Active ETF Trust (since 2018); President, MainStay CBRE Global Infrastructure Megatrends Term Fund (since 2021), MainStay MacKay DefinedTerm Municipal Opportunities Fund and MainStay VP Funds Trust (since 2017)**; Senior Managing Director, Global Product Development (2015 to 2016); Managing Director, Product Development (2010 to 2015), New York Life Investment Management LLC | |
| | Jack R. Benintende
1964 | Treasurer and Principal Financial and Accounting Officer, MainStay Funds (since 2007), MainStay Funds Trust (since 2009) | Managing Director, New York Life Investment Management LLC (since 2007); Treasurer and Principal Financial and Accounting Officer, MainStay CBRE Global Infrastructure Megatrends Term Fund (since 2021), MainStay MacKay DefinedTerm Municipal Opportunities Fund (since 2011) and MainStay VP Funds Trust (since 2007)**; and Assistant Treasurer, New York Life Investment Management Holdings LLC (2008 to 2012) | |
| | J. Kevin Gao
1967 | Secretary and Chief Legal Officer, MainStay Funds and MainStay Funds Trust (since 2010) | Managing Director and Associate General Counsel, New York Life Investment Management LLC (since 2010); Secretary and Chief Legal Officer, MainStay CBRE Global Infrastructure Megatrends Term Fund (since 2021), MainStay MacKay DefinedTerm Municipal Opportunities Fund (since 2011) and MainStay VP Funds Trust (since 2010)** | |
| | Kevin M. Gleason
1967 | Vice President and Chief Compliance Officer, MainStay Funds and MainStay Funds Trust (since June 2022) | Vice President and Chief Compliance Officer, IndexIQ Trust, IndexIQ ETF Trust and Index IQ Active ETF Trust (since June 2022); Vice President and Chief Compliance Officer, MainStay CBRE Global Infrastructure Megatrends Term Fund, MainStay VP Funds Trust and MainStay MacKay DefinedTerm Municipal Opportunities Fund (since June 2022); Senior Vice President, Voya Investment Management and Chief Compliance Officer, Voya Family of Funds (2012 to 2022) | |
| | Scott T. Harrington
1959 | Vice President— Administration, MainStay Funds (since 2005), MainStay Funds Trust (since 2009) | Managing Director, New York Life Investment Management LLC (including predecessor advisory organizations) (since 2000); Member of the Board of Directors, New York Life Trust Company (since 2009); Vice President—Administration, MainStay CBRE Global Infrastructure Megatrends Term Fund (since 2021), MainStay MacKay DefinedTerm Municipal Opportunities Fund (since 2011) and MainStay VP Funds Trust (since 2005)** | |
| * | The officers listed above are considered to be “interested persons” of the MainStay Group of Funds, MainStay VP Funds Trust, MainStay CBRE Global Infrastructure Megatrends Term Fund and MainStay MacKay DefinedTerm Municipal Opportunities Fund within the meaning of the 1940 Act because of their affiliation with the MainStay Group of Funds, New York Life Insurance Company and/or its affiliates, including New York Life Investment Management LLC, New York Life Insurance Company, NYLIM Service Company LLC, NYLIFE Securities LLC and/or NYLIFE Distributors LLC, as described in detail in the column captioned “Principal Occupation(s) During Past Five Years.” Officers are elected annually by the Board. |
| ** | Includes prior service as an Officer of MainStay VP Series Fund, Inc., the predecessor to MainStay VP Funds Trust. |
Officers of the Trust (Who are not Trustees)*
| 40 | MainStay Candriam Emerging Markets Debt Fund |
This page intentionally left blank.
This page intentionally left blank.
Equity
U.S. Equity
MainStay Epoch U.S. Equity Yield Fund
MainStay Fiera SMID Growth Fund
MainStay PineStone U.S. Equity Fund
MainStay S&P 500 Index Fund
MainStay Winslow Large Cap Growth Fund
MainStay WMC Enduring Capital Fund
MainStay WMC Growth Fund
MainStay WMC Small Companies Fund
MainStay WMC Value Fund
International Equity
MainStay Epoch International Choice Fund
MainStay PineStone International Equity Fund
MainStay WMC International Research Equity Fund
Emerging Markets Equity
MainStay Candriam Emerging Markets Equity Fund
Global Equity
MainStay Epoch Capital Growth Fund
MainStay Epoch Global Equity Yield Fund
MainStay PineStone Global Equity Fund
Fixed Income
Taxable Income
MainStay Candriam Emerging Markets Debt Fund
MainStay Floating Rate Fund
MainStay MacKay High Yield Corporate Bond Fund
MainStay MacKay Short Duration High Yield Fund
MainStay MacKay Strategic Bond Fund
MainStay MacKay Total Return Bond Fund
MainStay MacKay U.S. Infrastructure Bond Fund
MainStay Short Term Bond Fund
Tax-Exempt Income
MainStay MacKay California Tax Free Opportunities Fund1
MainStay MacKay High Yield Municipal Bond Fund
MainStay MacKay New York Tax Free Opportunities Fund2
MainStay MacKay Short Term Municipal Fund
MainStay MacKay Strategic Municipal Allocation Fund
MainStay MacKay Tax Free Bond Fund
Money Market
MainStay Money Market Fund
Mixed Asset
MainStay Balanced Fund
MainStay Income Builder Fund
MainStay MacKay Convertible Fund
Speciality
MainStay CBRE Global Infrastructure Fund
MainStay CBRE Real Estate Fund
MainStay Cushing MLP Premier Fund
Asset Allocation
MainStay Conservative Allocation Fund
MainStay Conservative ETF Allocation Fund
MainStay Defensive ETF Allocation Fund
MainStay Equity Allocation Fund
MainStay Equity ETF Allocation Fund
MainStay ESG Multi-Asset Allocation Fund
MainStay Growth Allocation Fund
MainStay Growth ETF Allocation Fund
MainStay Moderate Allocation Fund
MainStay Moderate ETF Allocation Fund
Manager
New York Life Investment Management LLC
New York, New York
Subadvisors
Candriam3
Strassen, Luxembourg
CBRE Investment Management Listed Real Assets LLC
Radnor, Pennsylvania
Cushing Asset Management, LP
Dallas, Texas
Epoch Investment Partners, Inc.
New York, New York
Fiera Capital Inc.
New York, New York
IndexIQ Advisors LLC3
New York, New York
MacKay Shields LLC3
New York, New York
NYL Investors LLC3
New York, New York
PineStone Asset Management Inc.
Montreal, Québec
Wellington Management Company LLP
Boston, Massachusetts
Winslow Capital Management, LLC
Minneapolis, Minnesota
Legal Counsel
Dechert LLP
Washington, District of Columbia
Independent Registered Public Accounting Firm
KPMG LLP
Philadelphia, Pennsylvania
Distributor
NYLIFE Distributors LLC3
Jersey City, New Jersey
Custodian
JPMorgan Chase Bank, N.A.
New York, New York
1.
This Fund is registered for sale in AZ, CA, NV, OR, TX, UT, WA and MI (Class A and Class I shares only), and CO, FL, GA, HI, ID, MA, MD, NH, NJ and NY (Class I shares only).
| 2. | This Fund is registered for sale in CA, CT, DE, FL, MA, NJ, NY and VT. |
| 3. | An affiliate of New York Life Investment Management LLC. |
Not part of the Annual Report
For more information
800-624-6782
newyorklifeinvestments.com
“New York Life Investments” is both a service mark, and the common trade name, of certain investment advisors affiliated with New York Life Insurance Company. The MainStay Funds® are managed by New York Life Investment Management LLC and distributed by NYLIFE Distributors LLC, 30 Hudson Street, Jersey City, NJ 07302, a wholly owned subsidiary of New York Life Insurance Company. NYLIFE Distributors LLC is a Member FINRA/SIPC.
©2023 NYLIFE Distributors LLC. All rights reserved.
| 5013921MS139-23 | MSCEMD11-12/23 |
(NYLIM) NL218
MainStay Income Builder Fund
Message from the President and Annual Report
October 31, 2023
Special Notice:
Beginning in July 2024, new regulations issued by the Securities and Exchange Commission (SEC) will take effect requiring open-end mutual fund companies and ETFs to (1) overhaul the content of their shareholder reports and (2) mail paper copies of the new tailored shareholder reports to shareholders who have not opted to receive these documents electronically.
If you have not yet elected to receive your shareholder reports electronically, please contact your financial intermediary or visit newyorklifeinvestments.com/accounts.
| Not FDIC/NCUA Insured | Not a Deposit | May Lose Value | No Bank Guarantee | Not Insured by Any Government Agency |
This page intentionally left blank
Message from the President
Volatile economic and geopolitical forces drove market behavior during the 12-month reporting period ended October 31, 2023. While equity markets generally gained ground, bond prices trended broadly lower.
Although the war in Ukraine, the outbreak of hostilities in the Middle East and several other notable events affected financial assets, inflation and interest rate trends stood at the forefront of market developments during most of the period. As the reporting period began, high levels of inflation already showed signs of easing in the face of aggressive rate hikes by the U.S. Federal Reserve (the “Fed”). From a peak of 9.1% in June 2022, the annualized U.S. inflation rate dropped to 7.1% in November 2022, and to 3.2% in October 2023. At the same time, the Fed increased the benchmark federal funds rate from 3.75%–4.00% at the beginning of the reporting period to 5.25%–5.50% as of October 31, 2023. As the pace of rate increases slowed during the period, investors hoped for an early shift to a looser monetary policy. However, comments from Fed members late in the period reinforced the central bank’s hawkish stance in response to surprisingly robust U.S. economic growth and rising wage pressures, thus increasing the likelihood that interest rates would stay higher for longer. International developed markets exhibited similar dynamics of elevated inflation and rising interest rates.
Despite the backdrop of high interest rates—along with political dysfunction in Washington D.C. and intensifying global geopolitical instability—equity markets managed to advance, supported by healthy consumer spending trends and persistent domestic economic growth. The S&P 500® Index, a widely regarded benchmark of large-cap U.S. market performance, gained ground, bolstered by the strong performance of energy stocks amid surging petroleum prices and mega-cap, growth-oriented, technology-related shares, which rose as investors flocked to companies creating the infrastructure for developments in artificial intelligence. Smaller-cap stocks and value-oriented shares produced milder returns. Among industry sectors, energy and
information technology posted the strongest gains. Real estate declined most sharply under pressure from rising mortgage rates and weak levels of office occupancy. Developed international markets outperformed U.S. markets, with Europe benefiting during the first half of the period from unexpected economic resilience in the face of rising energy prices and the ongoing war in Ukraine. Emerging markets posted positive results but lagged developed markets, largely due to slow economic growth in China despite the relaxation of pandemic-era lockdowns.
Bond prices were driven lower by rising yields and increasing expectations of high interest rates for an extended period of time. The U.S. yield curve steepened, with the 30-year Treasury yield exceeding 5% for the first time in more than a decade. The yield curve remained inverted, with the 10-year Treasury yield ending the period at 4.88%, compared with 5.07% for the 2-year Treasury yield. Corporate bonds outperformed long-term Treasury bonds, but still trended lower under pressure from rising yields and an uptick in default rates. Among corporates, lower-credit-quality instruments performed slightly better than their higher-credit-quality counterparts, while floating rate securities performed better still.
In the face of today’s uncertain market environment, New York Life Investments remains dedicated to providing the guidance, resources and investment solutions you need to pursue your financial goals.
Thank you for trusting us to help meet your investment needs.
Sincerely,
Kirk C. Lehneis
President
The opinions expressed are as of the date of this report and are subject to change. There is no guarantee that any forecast made will come to pass. This material does not constitute investment advice and is not intended as an endorsement of any specific investment. Past performance is no guarantee of future results.
Not part of the Annual Report
Investors should refer to the Fund’s Summary Prospectus and/or Prospectus and consider the Fund’s investment objectives, strategies, risks, charges and expenses carefully before investing. The Summary Prospectus and/or Prospectus contain this and other information about the Fund. You may obtain copies of the Fund’s Summary Prospectus, Prospectus and Statement of Additional Information, which includes information about The MainStay Funds' Trustees, free of charge, upon request, by calling toll-free 800-624-6782, by writing to NYLIFE Distributors LLC, Attn: MainStay Marketing Department, 30 Hudson Street, Jersey City, NJ 07302 or by sending an e-mail to MainStayShareholderServices@nylim.com. These documents are also available via the MainStay Funds’ website at newyorklifeinvestments.com. Please read the Fund’s Summary Prospectus and/or Prospectus carefully before investing.
Investment and Performance Comparison (Unaudited)
Performance data quoted represents past performance. Past performance is no guarantee of future results. Because of market volatility and other factors, current performance may be lower or higher than the figures shown. Investment return and principal value will fluctuate, and as a result, when shares are redeemed, they may be worth more or less than their original cost. The graph below depicts the historical performance of Class I shares of the Fund. Performance will vary from class to class based on differences in class-specific expenses and sales charges. For performance information current to the most recent month-end, please call 800-624-6782 or visit newyorklifeinvestments.com.
The performance table and graph do not reflect the deduction of taxes that a shareholder would pay on distributions or Fund share redemptions. Total returns reflect maximum applicable sales charges as indicated in the table below, if any, changes in share price, and reinvestment of dividend and capital gain distributions. The graph assumes the initial investment amount shown below and reflects the deduction of all sales charges that would have applied for the period of investment. Performance figures may reflect certain fee waivers and/or expense limitations, without which total returns may have been lower. For more information on share classes and current fee waivers and/or expense limitations (if any), please refer to the Notes to Financial Statements.

| Average Annual Total Returns for the Year-Ended October 31, 2023 |
| Class | Sales Charge | | Inception
Date | One
Year | Five
Years | Ten Years
or Since
Inception | Gross
Expense
Ratio1 |
| Class A Shares2 | Maximum 3.00% Initial Sales Charge | With sales charges | 1/3/1995 | -1.39% | 1.67% | 3.07% | 1.02% |
| | | Excluding sales charges | | 1.66 | 2.82 | 3.65 | 1.02 |
| Investor Class Shares3 | Maximum 2.50% Initial Sales Charge | With sales charges | 2/28/2008 | -1.18 | 1.48 | 2.89 | 1.20 |
| | | Excluding sales charges | | 1.35 | 2.63 | 3.47 | 1.20 |
| Class B Shares4 | Maximum 5.00% CDSC | With sales charges | 12/29/1987 | -4.31 | 1.52 | 2.70 | 1.95 |
| | if Redeemed Within the First Six Years of Purchase | Excluding sales charges | | 0.63 | 1.86 | 2.70 | 1.95 |
| Class C Shares | Maximum 1.00% CDSC | With sales charges | 9/1/1998 | -0.36 | 1.87 | 2.70 | 1.95 |
| | if Redeemed Within One Year of Purchase | Excluding sales charges | | 0.63 | 1.87 | 2.70 | 1.95 |
| Class I Shares | No Sales Charge | | 1/2/2004 | 1.89 | 3.08 | 3.91 | 0.77 |
| Class R2 Shares5 | No Sales Charge | | 2/27/2015 | 1.52 | 2.72 | 2.61 | 1.12 |
| Class R3 Shares5 | No Sales Charge | | 2/29/2016 | 1.25 | 2.46 | 3.93 | 1.37 |
| Class R6 Shares | No Sales Charge | | 2/28/2018 | 1.98 | 3.18 | 2.68 | 0.68 |
| SIMPLE Class Shares | No Sales Charge | | 8/31/2020 | 1.31 | N/A | -0.66 | 1.38 |
| 1. | The gross expense ratios presented reflect the Fund’s “Total Annual Fund Operating Expenses” from the most recent Prospectus, as supplemented, and may differ from other expense ratios disclosed in this report. |
| 2. | Prior to November 4, 2019, the maximum initial sales charge applicable was 5.50%, which is reflected in the applicable average annual total return figures shown. |
| 3. | Prior to June 30, 2020, the maximum initial sales charge was 3.00%, which is reflected in the applicable average annual total return figures shown. |
| 4. | Class B shares are closed to all new purchases as well as additional investments by existing Class B shareholders. |
| 5. | As of October 31, 2023, Class R2 and Class R3 shares are closed to new investors and, upon the close of business on December 29, 2023, Class R2 and Class R3 shares are closed to additional investments by existing shareholders. Additionally, Class R2 and Class R3 shares will be liquidated on or about February 28, 2024 (the "Liquidation Date"). It is expected that the Fund will distribute to remaining shareholders invested in Class R2 or Class R3 shares, on or promptly after the Liquidation Date, a liquidating distribution in cash or cash equivalents equal to the net asset value of such shares. |
The footnotes on the next page are an integral part of the table and graph and should be carefully read in conjunction with them.
| Benchmark Performance* | One
Year | Five
Years | Ten
Years |
| MSCI World Index (Net)1 | 10.48% | 8.27% | 7.53% |
| Bloomberg U.S. Aggregate Bond Index2 | 0.36 | -0.06 | 0.88 |
| Blended Benchmark Index3 | 6.44 | 5.21 | 5.07 |
| Morningstar Global Allocation Category Average4 | 4.11 | 3.31 | 3.15 |
| * | Returns for indices reflect no deductions for fees, expenses or taxes, except for foreign withholding taxes where applicable. Results assume reinvestment of all dividends and capital gains. An investment cannot be made directly in an index. |
| 1. | The MSCI World Index (Net) is the Fund's primary broad-based securities market index for comparison purposes. The MSCI World Index (Net) is a free float-adjusted market capitalization weighted index that is designed to measure the equity market performance of developed markets. |
| 2. | The Fund has selected the Bloomberg U.S. Aggregate Bond Index as a secondary benchmark. The Bloomberg U.S. Aggregate Bond Index measures performance of the investment-grade, U.S. dollar-denominated, fixed-rate taxable bond market, including Treasuries, government-related and corporate securities, mortgage-backed securities (agency fixed-rate and hybrid adjustable-rate mortgage pass-throughs), asset-backed securities and commercial mortgage-backed securities. |
| 3. | The Fund has selected the Blended Benchmark Index as an additional benchmark. The Blended Benchmark Index consists of the 60% MSCI World Index (net) and 40% of the Bloomberg U.S. Aggregate Bond Index, respectively. |
| 4. | Morningstar Global Allocation Category Average funds seek to provide both capital appreciation and income by investing in three major areas: stocks, bonds, and cash. While these funds do explore the whole world, most of them focus on the U.S., Canada, Japan, and the larger markets in Europe. It is rare for such funds to invest more than 10% of their assets in emerging markets. These funds typically have at least 10% of assets in bonds, less than 70% of assets in stocks, and at least 40% of assets in non-U.S. stocks or bonds. |
The footnotes on the preceding page are an integral part of the table and graph and should be carefully read in conjunction with them.
| 6 | MainStay Income Builder Fund |
Cost in Dollars of a $1,000 Investment in MainStay Income Builder Fund (Unaudited)
The example below is intended to describe the fees and expenses borne by shareholders during the six-month period from May 1, 2023 to October 31, 2023, and the impact of those costs on your investment.
Example
As a shareholder of the Fund you incur two types of costs: (1) transaction costs, including exchange fees and sales charges (loads) on purchases (as applicable), and (2) ongoing costs, including management fees, distribution and/or service (12b-1) fees and other Fund expenses (as applicable). This example is intended to help you understand your ongoing costs (in dollars) of investing in the Fund and to compare these costs with the ongoing costs of investing in other mutual funds. The example is based on an investment of $1,000 made at the beginning of the six-month period and held for the entire period from May 1, 2023 to October 31, 2023.
This example illustrates your Fund’s ongoing costs in two ways:
Actual Expenses
The second and third data columns in the table below provide information about actual account values and actual expenses. You may use the information in these columns, together with the amount you invested, to estimate the expenses that you paid during the six months ended October 31, 2023. Simply divide your account value by $1,000 (for example, an
$8,600 account value divided by $1,000 = 8.6), then multiply the result by the number under the heading entitled “Expenses Paid During Period” to estimate the expenses you paid on your account during this period.
Hypothetical Example for Comparison Purposes
The fourth and fifth data columns in the table below provide information about hypothetical account values and hypothetical expenses based on the Fund’s actual expense ratio and an assumed rate of return of 5% per year before expenses, which is not the Fund’s actual return. The hypothetical account values and expenses may not be used to estimate the actual ending account balances or expenses you paid for the six-month period shown. You may use this information to compare the ongoing costs of investing in the Fund with the ongoing costs of investing in other mutual funds. To do so, compare this 5% hypothetical example with the 5% hypothetical examples that appear in the shareholder reports of the other mutual funds.
Please note that the expenses shown in the table are meant to highlight your ongoing costs only and do not reflect any transactional costs, such as exchange fees or sales charges (loads). Therefore, the fourth and fifth data columns of the table are useful in comparing ongoing costs only and will not help you determine the relative total costs of owning different funds. In addition, if these transactional costs were included, your costs would have been higher.
| Share Class | Beginning
Account
Value
5/1/23 | Ending Account
Value (Based
on Actual
Returns and
Expenses)
10/31/23 | Expenses
Paid
During
Period1 | Ending Account
Value (Based
on Hypothetical
5% Annualized
Return and
Actual Expenses)
10/31/23 | Expenses
Paid
During
Period1 | Net Expense
Ratio
During
Period2 |
| Class A Shares | $1,000.00 | $944.10 | $5.05 | $1,020.01 | $ 5.24 | 1.03% |
| Investor Class Shares | $1,000.00 | $942.40 | $6.27 | $1,018.75 | $ 6.51 | 1.28% |
| Class B Shares | $1,000.00 | $939.20 | $9.92 | $1,014.97 | $10.31 | 2.03% |
| Class C Shares | $1,000.00 | $939.10 | $9.92 | $1,014.97 | $10.31 | 2.03% |
| Class I Shares | $1,000.00 | $945.30 | $3.82 | $1,021.27 | $ 3.97 | 0.78% |
| Class R2 Shares | $1,000.00 | $943.60 | $5.54 | $1,019.51 | $ 5.75 | 1.13% |
| Class R3 Shares | $1,000.00 | $942.40 | $6.76 | $1,018.25 | $ 7.02 | 1.38% |
| Class R6 Shares | $1,000.00 | $945.80 | $3.34 | $1,021.78 | $ 3.47 | 0.68% |
| SIMPLE Class Shares | $1,000.00 | $943.10 | $6.07 | $1,018.95 | $ 6.31 | 1.24% |
| 1. | Expenses are equal to the Fund’s annualized expense ratio of each class multiplied by the average account value over the period, divided by 365 and multiplied by 184 (to reflect the six-month period). The table above represents the actual expenses incurred during the six-month period. In addition to the fees and expenses which the Fund bears directly, it also indirectly bears a pro rata share of the fees and expenses of the underlying funds in which it invests. Such indirect expenses are not included in the above-reported expense figures. |
| 2. | Expenses are equal to the Fund's annualized expense ratio to reflect the six-month period. |
Portfolio Composition as of October 31, 2023 (Unaudited)
See Portfolio of Investments beginning on page 13 for specific holdings within these categories. The Fund's holdings are subject to change.
Top Ten Holdings and/or Issuers Held as of October 31, 2023 (excluding short-term investments) (Unaudited)
| 1. | GNMA, (zero coupon)-9.674%, due 7/20/49–10/16/63 |
| 2. | FHLMC STACR REMIC Trust, 7.421%-12.321%, due 8/25/33–1/25/50 |
| 3. | UMBS, 30 Year, 2.50%-6.50%, due 8/1/48–10/1/53 |
| 4. | Microsoft Corp. |
| 5. | Broadcom, Inc. |
| 6. | FHLMC, (zero coupon)-4.50%, due 1/15/41–1/25/55 |
| 7. | Analog Devices, Inc. |
| 8. | International Business Machines Corp. |
| 9. | Cisco Systems, Inc. |
| 10. | UMBS Pool, 30 Year, 3.50%-6.50%, due 7/1/50–11/1/53 |
| 8 | MainStay Income Builder Fund |
Portfolio Management Discussion and Analysis (Unaudited)
Questions answered by portfolio managers Jae S. Yoon, CFA, and Jonathan Swaney of New York Life Investment Management LLC, the Fund’s Manager; Neil Moriarty III, Michael DePalma, Tom Musmanno and Shu-Yang Tan, CFA, of MacKay Shields LLC, the Subadvisor for the fixed-income portion of the Fund; and William W. Priest, CFA,1 Michael A. Welhoelter, CFA, John Tobin, PhD, CFA, and Kera Van Valen, CFA, of Epoch Investment Partners, Inc., the Subadvisor for the equity portion of the Fund.
How did MainStay Income Builder Fund perform relative to its benchmarks and peer group during the 12 months ended October 31, 2023?
For the 12 months ended October 31, 2023, Class I shares of MainStay Income Builder Fund returned 1.89%, underperforming the 10.48% return of the Fund’s primary benchmark, the MSCI World Index (Net). Over the same period, Class I shares outperformed the 0.36% return of the Bloomberg U.S. Aggregate Bond Index, which is the Fund’s secondary benchmark, and underperformed the 6.44% return of the Blended Benchmark Index, which is an additional benchmark of the Fund. For the 12 months ended October 31, 2023, Class I shares of the Fund underperformed the 4.11% return of the Morningstar Global Allocation Category Average.2
Were there any changes to the Fund during the reporting period?
Effective May 9, 2023, Michael DePalma, Tom Musmanno and Shu-Yang Tan, CFA, were added as portfolio managers of the Fund, and Stephen R. Cianci was removed. Please see the supplement dated May 9, 2023, for more information.
What factors affected relative performance in the equity portion of the Fund during the reporting period?
The last twelve months saw sentiment swing several times as investors grappled with the trajectory of interest rates and global growth. While risk appetites trended downward in late 2022, the first quarter of 2023 marked a stark reversal in sentiment, as broad market indices rose sharply on hopes of a soft-landing and disinflation traction. The first half of 2023 saw a sustained rally in U.S. equities fueled by a handful of mega-cap technology-related stocks, dubbed ‘the Magnificent 7,’ which rode a wave of enthusiasm for developments in artificial intelligence (“AI”). However, the third quarter saw sentiment reverse due to persisting macro headwinds.
The equity portion of the Fund lagged the performance of the MSCI World Index (Net), with underperformance heavily concentrated in the first half of 2023, largely due to lack of exposure to the Magnificent 7, many of which do not pay a dividend and so are outside of the Fund’s investable universe. From a factor perspective, exposure to dividend yield and low beta3 were headwinds to relative return.
During the reporting period, which sectors and countries were the strongest positive contributors to the relative performance of the equity portion of the Fund and which sectors and countries were particularly weak?
The strongest contributions to the relative performance of the equity portion of the Fund from a sector perspective came from energy and health care. (Contributions take weightings and total returns into account.) In terms of countries, Germany and France made the strongest contributions. On the negative side, the sectors detracting most significantly included financials and communications services. Banks were responsible for weak relative return in financials, due to the Fund’s exposure to regional U.S. bank holdings during the banking turmoil in the first quarter of 2023. Underperformance in communication services came mostly from lack of exposure to two mega-cap interactive media and services companies with outsized returns. From a country perspective, the United States and Japan were the most significant detractors.
During the reporting period, which individual stocks made the strongest positive contributions to absolute performance in the equity portion of the Fund and which stocks detracted the most?
Top contributors to the absolute performance of the equity portion of the Fund during the reporting period included U.S.-based semiconductor company Broadcom and France-based global energy company TotalEnergies.
Broadcom designs and manufactures digital and analog semiconductors focused on connectivity. The company also develops and maintains software for mainframe applications. Shares outperformed on solid earnings and excitement regarding Broadcom’s networking products, which are used in generative AI systems. The company’s AI-focused sales doubled compared to a year ago, supporting improved medium-term forward growth guidance. Broadcom returns cash to shareholders via an attractive dividend with a target of paying out 50% of free cash flow. The balance of cash generation is used to fund debt reduction, share repurchases and/or accretive mergers and acquisitions.
TotalEnergies explores and produces oil and gas, refines petroleum products, manufactures petrochemicals and operates gas stations. The company has also established a growing presence in electricity generation from renewable sources. Shares outperformed during the reporting period despite falling oil and
| 1. | Effective on or about March 31, 2024, William W. Priest will no longer serve as a portfolio manager for the Fund. |
| 2. | See "Investment and Performance Comparison" for other share class returns, which may be higher or lower than Class I share returns, and for more information on benchmark and peer group returns. |
| 3. | Beta is a measure of volatility in relation to the market as a whole. A beta higher than 1 indicates that a security or portfolio will tend to exhibit higher volatility than the market. A beta lower than 1 indicates that a security or portfolio will tend to exhibit lower volatility than the market. |
gas prices, as the company paid a special dividend in December 2022, announced new projects and partnerships that helped offset the Russian impairments, and benefited from elevated refining margins. Management remains focused on driving cash flow growth from liquified natural gas (LNG) and integrated power, including renewables. TotalEnergies' global scale, strong balance sheet, integrated business model, capital flexibility and cost discipline allow the company to pay a sustainable dividend through commodity price cycles, and reward shareholders with buybacks using excess free cash flow.
Among the most significant detractors from the Fund’s absolute performance during the same period were regional bank Columbia Banking System and crop nutrients producer Nutrien.
With operations in Washington, Oregon, and Northern California, Columbia Banking System benefits from a local low-cost deposit franchise, a diversified loan portfolio and a well-capitalized balance sheet, which should allow it to earn mid-teens returns on equity on a mid-cycle basis. Shares declined along with banking industry peers as the failures of Silicon Valley Bank and Signature Bank caused a crisis of confidence that reverberated throughout the entire sector. Although the crisis may result in higher near-term funding costs and increased retained capital levels for the industry, we believe Columbia's low-cost deposit franchise, coupled with expense synergies from the recent merger with Umpqua Holdings, will generate continued strong earnings and support attractive, growing dividends. We also expect the company to direct excess capital toward share buybacks during periods of normal economic conditions.
Canada-based Nutrien produces crop nutrients, including potash, nitrogen and phosphate, operates an extensive retail network for the distribution of nutrients to growers in the United States, Canada, Australia and Brazil, and provides an expanding suite of value-enhancing services. Shares underperformed after Nutrien reported weaker-than-expected quarterly results and subsequently lowered its full-year guidance, largely due to falling fertilizer (primarily potash and ammonia) prices. Fundamentals remain solid for the agriculture industry, as crop prices are expected to remain elevated, incentivizing farmers to spend on crop nutrients, such as potash, to maximize yield. The company has a transparent shareholder distribution policy that includes an attractive and growing dividend, together with regular share repurchases.
What were some of the largest purchases and sales in the equity portion of the Fund during the reporting period?
New positions initiated during the reporting period included digital services and hardware provider Dell Technologies and midstream energy firm The Williams Companies.
Dell serves the infrastructure marketplace by providing servers and data storage, as well as the consumer and commercial space
with personal computing hardware and peripherals. Growth is driven by an increase in data storage, processing and computing needs, and by share capture through attractive technology and pricing. The company targets a return of 40–60% cash generation back to shareholders, which is managed through a combination of a growing dividend and periodic share repurchases. Additional cash generation is directed to slight debt reduction and tuck-in mergers and acquisitions to broaden its addressable market.
Williams provides natural gas gathering, processing, transportation and storage services; natural gas liquid (NGL) fractionation, transportation and storage; and marketing services to customers in North America. The company generates stable and strong cash flow from largely fee-based contracts. Cash flow growth is driven by a pipeline of attractive new projects and could be boosted by bolt-on acquisitions. Williams rewards its shareholders with an attractive and growing dividend.
The Fund’s most significant sales during the same period included closing its entire positions in regional bank KeyCorp as well as engineering and manufacturing firm Hubbell.
KeyCorp operates branches in 15 states in the Northeast, Midwest and Northwest United States. Although the company has a valuable, low-cost deposit franchise, we believe the slower repricing of KeyCorp’s securities portfolio relative to its peers limits the near-term ability for earnings to inflect higher with interest rates. As higher capital standards for the industry are expected to be imposed by regulators, we anticipate that KeyCorp will need to build equity by retaining a greater proportion of earnings, holding dividends flat, and deferring share repurchases for several years. We exited the Fund’s position to reallocate funds toward other companies in the sector that offer stronger potential for capital returns over the medium term.
Hubbell provides highly engineered utility solutions and electrical products for a broad range of applications, enabling utility, commercial, and industrial customers to operate critical infrastructure safely, reliably, and efficiently. The company has continued to generate robust cash flow in recent periods. However, we believe share price appreciation has constrained the company's shareholder yield potential. We exited the Fund’s position to reallocate capital toward more attractive investment opportunities.
How did sector and country weightings change in the equity portion of the Fund during the reporting period?
During the reporting period, the Fund’s most significant sector allocation changes included increases in information technology and industrials, and decreases in financials and industrials. The Fund's most significant country allocation changes during the reporting period were increases in South Korea and France, and reductions in Canada and Denmark. The Fund’s sector and country allocations are a result of our bottom-up, fundamental
| 10 | MainStay Income Builder Fund |
investment process, and reflect the companies and securities that we confidently believe can collect and distribute sustainable, growing shareholder yield.
How was the equity portion of the Fund positioned at the end of the reporting period?
As of October 31, 2023, the equity portion of the Fund’s largest sector positions on an absolute basis included information technology, health care and industrials, while the smallest sector positions were real estate and materials. Compared to the MSCI World Index (Net), the Fund’s most overweight sector allocation was to utilities, a defensive sector that is typically well-represented in the Fund. The Fund’s most significantly underweight allocations were to the information technology and consumer discretionary sectors.
What factors affected the relative performance of the fixed-income portion of the Fund during the reporting period?
Relative to the Bloomberg U.S. Aggregate Bond Index, the performance of the fixed-income portion of the Fund benefited from overweight exposure to securitized products, high-yield corporates and emerging-markets credit. Performance varied across the ratings spectrum, term structure and asset type. Generally speaking, longer-duration4 assets underperformed shorter-duration assets, lower quality outperformed higher quality within the investment-grade segment of the market, and securitized assets outperformed unsecured credit. Conversely, the Fund’s longer duration profile and underweight exposure to Treasury securities detracted from relative returns.
During the reporting period, were there any market events that materially impacted the performance or liquidity of the fixed-income portion of the Fund?
Although volatility was prevalent throughout the reporting period, there was no single event that adversely impacted the performance or liquidity of the fixed-income portion of the Fund during the reporting period.
During the reporting period, how was the performance of the fixed-income portion of the Fund materially affected by investments in derivatives?
During the reporting period, the fixed-income portion of the Fund used U.S. Treasury futures to manage its duration. The Fund’s
longer duration profile versus the Bloomberg U.S. Aggregate Bond Index detracted from overall returns in a rising rate market.
What was the duration strategy of the fixed-income portion of the Fund during the reporting period?
The fixed-income portion of the Fund maintained a longer duration than the Bloomberg U.S. Aggregate Bond Index throughout the reporting period. While the position was reduced in size during the reporting period, it nonetheless detracted from relative returns. As of October 31, 2023, the overall duration of the Fund was 6.3 years relative to 5.9 years for the Index.
During the reporting period, which sectors were the strongest positive contributors to the relative performance of the fixed-income portion of the Fund and which sectors were particularly weak?
During the reporting period, the relative performance of the fixed-income portion of the Fund benefited from exposure to securitized products, high-grade and high-yield corporates, high yield bonds and emerging-markets credit. Within the Fund’s corporate exposure, financials, utilities and midstream were among the most significant positive contributors to relative performance. The Fund’s underweight exposure to Treasury securities detracted from relative returns.
What were some of the largest purchases and sales in the fixed-income portion of the Fund during the reporting period?
The fixed-income portion of the Fund added exposure to Georgia Power, a fully regulated utility, because we saw attractive value on a risk-adjusted basis. Georgia Power benefits from stable and predictable cash flow generation and strong relationships with its regulators. We favor utilities exposure due to the defensive and predictable credit nature of these issuers and their ability to perform well, particularly in a recessionary environment. The Fund also added a position in Charter Communications, based on attractive valuation. As one of the largest cable and telecommunications providers in the United States, we consider Charter a core high yield holding with solid fundamentals and relatively non-cyclical operations.
We sold the Fund’s position in Howmet Aerospace for relative value reasons as valuations became full. Although Howmet is a strong high-yield credit with an improving trajectory, in our opinion, the valuation already fully reflected any potential future improvement. We also sold the Fund’s QVC holdings following a
| 4. | Duration is a measure of the price sensitivity of a fixed-income investment to changes in interest rates. Duration is expressed as a number of years and is considered a more accurate sensitivity gauge than average maturity. |
periodic credit review of the issuer, in light of worsening earnings trends, coupled with our cautious outlook on cyclical consumer spending.
From a sector positioning perspective, we added to the Fund’s exposure to mortgage-backed securities and trimmed exposure to high-grade and high-yield corporate bonds.
How did the sector weightings of the fixed-income portion of the Fund change during the reporting period?
During the reporting period, the fixed-income portion of the Fund increased its exposure to agency mortgages and non-agency residential mortgage-backed securities. Conversely, the Fund decreased its exposure to U.S. Treasury bonds and high-grade and high-yield corporates.
How was the Fund positioned at the end of the reporting period?
As of October 31, 2023, relative to the Bloomberg U.S. Aggregate Bond Index, the fixed-income portion of the Fund held overweight exposure to commercial mortgage-backed securities, asset-backed securities and residential mortgage-backed securities. As of the same date, the Fund held underweight exposure to U.S. Treasury securities.
The opinions expressed are those of the portfolio managers as of the date of this report and are subject to change. There is no guarantee that any forecasts will come to pass. This material does not constitute investment advice and is not intended as an endorsement of any specific investment.
| 12 | MainStay Income Builder Fund |
Portfolio of Investments October 31, 2023†^
| | Principal
Amount | Value |
| Long-Term Bonds 41.1% |
| Asset-Backed Securities 3.5% |
| Automobile Asset-Backed Securities 1.6% |
| American Credit Acceptance Receivables Trust (a) | | |
| Series 2021-2, Class D | | |
| 1.34%, due 7/13/27 | $ 840,000 | $ 810,132 |
| Series 2021-3, Class D | | |
| 1.34%, due 11/15/27 | 1,865,000 | 1,776,209 |
| Series 2021-2, Class E | | |
| 2.54%, due 7/13/27 | 910,000 | 865,182 |
| Series 2020-4, Class F | | |
| 5.22%, due 8/13/27 | 565,000 | 559,861 |
| Avis Budget Rental Car Funding AESOP LLC | | |
| Series 2021-1A, Class A | | |
| 1.38%, due 8/20/27 (a) | 1,530,000 | 1,349,876 |
| CPS Auto Receivables Trust | | |
| Series 2021-C, Class E | | |
| 3.21%, due 9/15/28 (a) | 375,000 | 347,222 |
| Drive Auto Receivables Trust | | |
| Series 2021-2, Class D | | |
| 1.39%, due 3/15/29 | 1,200,000 | 1,123,874 |
| Exeter Automobile Receivables Trust | | |
| Series 2021-3A, Class D | | |
| 1.55%, due 6/15/27 | 945,000 | 866,067 |
| Series 2021-3A, Class E | | |
| 3.04%, due 12/15/28 (a) | 855,000 | 766,049 |
| Flagship Credit Auto Trust (a) | | |
| Series 2021-1, Class D | | |
| 1.27%, due 3/15/27 | 1,220,000 | 1,120,373 |
| Series 2020-3, Class D | | |
| 2.50%, due 9/15/26 | 580,000 | 544,217 |
| GLS Auto Receivables Issuer Trust (a) | | |
| Series 2021-2A, Class E | | |
| 2.87%, due 5/15/28 | 1,480,000 | 1,351,161 |
| Series 2019-4A, Class D | | |
| 4.09%, due 8/17/26 | 1,125,000 | 1,102,746 |
| Hertz Vehicle Financing III LP | | |
| Series 2021-2A, Class D | | |
| 4.34%, due 12/27/27 (a) | 2,070,000 | 1,793,160 |
| Hertz Vehicle Financing LLC | | |
| Series 2021-1A, Class B | | |
| 1.56%, due 12/26/25 (a) | 1,235,000 | 1,175,164 |
| | | 15,551,293 |
| | Principal
Amount | Value |
| |
| Home Equity Asset-Backed Securities 0.0% ‡ |
| J.P. Morgan Mortgage Acquisition Trust | | |
| Series 2007-HE1, Class AF1 | | |
| 4.285% (1 Month SOFR + 0.214%), due 3/25/47 (b) | $ 289,962 | $ 170,402 |
| Mastr Asset-Backed Securities Trust | | |
| Series 2006-HE4, Class A1 | | |
| 5.539% (1 Month SOFR + 0.214%), due 11/25/36 (b) | 471,703 | 145,322 |
| | | 315,724 |
| Other Asset-Backed Securities 1.9% |
| American Airlines Pass-Through Trust | | |
| Series 2016-2, Class AA | | |
| 3.20%, due 6/15/28 | 473,960 | 417,975 |
| Series 2016-2, Class A | | |
| 3.65%, due 6/15/28 | 1,101,260 | 957,084 |
| British Airways Pass-Through Trust | | |
| Series 2021-1, Class A | | |
| 2.90%, due 3/15/35 (United Kingdom) (a) | 1,870,379 | 1,540,996 |
| CF Hippolyta Issuer LLC (a) | | |
| Series 2021-1A, Class A1 | | |
| 1.53%, due 3/15/61 | 2,521,047 | 2,207,171 |
| Series 2020-1, Class A1 | | |
| 1.69%, due 7/15/60 | 1,236,746 | 1,121,687 |
| Series 2020-1, Class A2 | | |
| 1.99%, due 7/15/60 | 1,222,119 | 1,018,410 |
| CVS Pass-Through Trust | | |
| 5.789%, due 1/10/26 (a) | 54,459 | 53,637 |
| DB Master Finance LLC | | |
| Series 2021-1A, Class A23 | | |
| 2.791%, due 11/20/51 (a) | 1,802,887 | 1,361,512 |
| Home Partners of America Trust (a) | | |
| Series 2021-2, Class A | | |
| 1.901%, due 12/17/26 | 653,173 | 570,453 |
| Series 2021-2, Class B | | |
| 2.302%, due 12/17/26 | 1,299,578 | 1,142,281 |
| Mosaic Solar Loan Trust | | |
| Series 2020-1A, Class A | | |
| 2.10%, due 4/20/46 (a) | 1,527,428 | 1,277,992 |
| Navient Private Education Refi Loan Trust (a) | | |
| Series 2021-BA, Class A | | |
| 0.94%, due 7/15/69 | 478,914 | 406,660 |
| Series 2020-EA, Class A | | |
| 1.69%, due 5/15/69 | 706,350 | 626,969 |
The notes to the financial statements are an integral part of, and should be read in conjunction with, the financial statements.
13
Portfolio of Investments October 31, 2023†^ (continued)
| | Principal
Amount | Value |
| Asset-Backed Securities (continued) |
| Other Asset-Backed Securities (continued) |
| New Economy Assets Phase 1 Sponsor LLC (a) | | |
| Series 2021-1, Class A1 | | |
| 1.91%, due 10/20/61 | $ 1,585,000 | $ 1,355,400 |
| Series 2021-1, Class B1 | | |
| 2.41%, due 10/20/61 | 1,640,000 | 1,366,517 |
| Taco Bell Funding LLC | | |
| Series 2021-1A, Class A23 | | |
| 2.542%, due 8/25/51 (a) | 1,404,975 | 1,055,417 |
| U.S. Airways Pass-Through Trust | | |
| Series 2012-1, Class A | | |
| 5.90%, due 10/1/24 | 834,363 | 830,714 |
| United Airlines Pass-Through Trust | | |
| Series 2020-1, Class A | | |
| 5.875%, due 10/15/27 | 1,274,557 | 1,254,853 |
| | | 18,565,728 |
Total Asset-Backed Securities
(Cost $38,128,913) | | 34,432,745 |
| Corporate Bonds 17.1% |
| Agriculture 0.1% |
| BAT Capital Corp. | | |
| 3.734%, due 9/25/40 (United Kingdom) | 1,005,000 | 637,322 |
| BAT International Finance plc | | |
| 4.448%, due 3/16/28 (United Kingdom) | 615,000 | 566,647 |
| | | 1,203,969 |
| Airlines 0.6% |
| American Airlines, Inc. (a) | | |
| 5.50%, due 4/20/26 | 1,166,667 | 1,134,523 |
| 5.75%, due 4/20/29 | 850,000 | 766,747 |
| Delta Air Lines, Inc. (a) | | |
| 4.50%, due 10/20/25 | 720,000 | 699,823 |
| 4.75%, due 10/20/28 | 2,125,000 | 1,997,461 |
| Mileage Plus Holdings LLC | | |
| 6.50%, due 6/20/27 (a) | 1,395,000 | 1,378,089 |
| | | 5,976,643 |
| Auto Manufacturers 1.1% |
| Ford Motor Credit Co. LLC | | |
| 2.30%, due 2/10/25 | 200,000 | 188,862 |
| 2.70%, due 8/10/26 | 940,000 | 842,556 |
| 4.125%, due 8/17/27 | 1,050,000 | 953,303 |
| 6.80%, due 5/12/28 | 730,000 | 727,914 |
| | Principal
Amount | Value |
| |
| Auto Manufacturers (continued) |
| Ford Motor Credit Co. LLC (continued) | | |
| 6.95%, due 3/6/26 | $ 660,000 | $ 661,139 |
| General Motors Financial Co., Inc. | | |
| 2.35%, due 1/8/31 | 810,000 | 603,122 |
| 2.70%, due 6/10/31 | 2,015,000 | 1,515,331 |
| 4.30%, due 4/6/29 | 1,125,000 | 999,622 |
| Nissan Motor Acceptance Co. LLC (a) | | |
| 1.125%, due 9/16/24 | 1,935,000 | 1,846,219 |
| 1.85%, due 9/16/26 | 3,205,000 | 2,774,391 |
| | | 11,112,459 |
| Banks 6.2% |
| Banco Santander SA | | |
| 5.294%, due 8/18/27 (Spain) | 1,800,000 | 1,717,656 |
| Bank of America Corp. (c) | | |
| 2.087%, due 6/14/29 | 820,000 | 677,029 |
| 2.496%, due 2/13/31 | 1,600,000 | 1,261,119 |
| 2.572%, due 10/20/32 | 1,195,000 | 894,987 |
| Series MM | | |
| 4.30%, due 1/28/25 (d) | 1,424,000 | 1,279,498 |
| Barclays plc (United Kingdom) (b)(d) | | |
| 4.375% (5 Year Treasury Constant Maturity Rate + 3.41%), due 3/15/28 | 2,000,000 | 1,366,938 |
| 8.00% (5 Year Treasury Constant Maturity Rate + 5.431%), due 3/15/29 | 1,035,000 | 915,458 |
| BNP Paribas SA (France) (a) | | |
| 3.052%, due 1/13/31 (c) | 1,170,000 | 942,481 |
| 4.625% (5 Year Treasury Constant Maturity Rate + 3.196%), due 1/12/27 (b)(d) | 1,450,000 | 1,143,404 |
| 4.625% (5 Year Treasury Constant Maturity Rate + 3.34%), due 2/25/31 (b)(d) | 2,090,000 | 1,449,359 |
| 7.75% (5 Year Treasury Constant Maturity Rate + 4.899%), due 8/16/29 (b)(d) | 550,000 | 509,945 |
| BPCE SA (France) (a) | | |
| 2.045%, due 10/19/27 (c) | 1,255,000 | 1,095,254 |
| 5.125%, due 1/18/28 | 420,000 | 400,291 |
| 6.714%, due 10/19/29 (c) | 490,000 | 483,092 |
| Citigroup, Inc. | | |
| 3.668%, due 7/24/28 (c) | 1,180,000 | 1,068,989 |
| 3.98%, due 3/20/30 (c) | 2,370,000 | 2,096,785 |
The notes to the financial statements are an integral part of, and should be read in conjunction with, the financial statements.
| 14 | MainStay Income Builder Fund |
| | Principal
Amount | Value |
| Corporate Bonds (continued) |
| Banks (continued) |
| Citigroup, Inc. (continued) | | |
| Series Y | | |
| 4.15% (5 Year Treasury Constant Maturity Rate + 3.00%), due 11/15/26 (b)(d) | $ 1,760,000 | $ 1,370,362 |
| 6.625%, due 6/15/32 | 770,000 | 762,697 |
| Citizens Bank NA | | |
| 6.064%, due 10/24/25 (c) | 555,000 | 530,731 |
| Citizens Financial Group, Inc. | | |
| 2.638%, due 9/30/32 | 1,720,000 | 1,141,274 |
| Credit Agricole SA | | |
| 4.75% (5 Year Treasury Constant Maturity Rate + 3.237%), due 3/23/29 (France) (a)(b)(d) | 2,340,000 | 1,732,084 |
| Deutsche Bank AG (Germany) | | |
| Series E | | |
| 0.962%, due 11/8/23 | 1,555,000 | 1,553,425 |
| 3.035%, due 5/28/32 (c) | 600,000 | 446,944 |
| 6.589% (SOFR + 1.219%), due 11/16/27 (b) | 1,945,000 | 1,867,055 |
| First Horizon Bank | | |
| 5.75%, due 5/1/30 | 1,555,000 | 1,316,084 |
| First Horizon Corp. | | |
| 4.00%, due 5/26/25 | 2,100,000 | 1,953,420 |
| Freedom Mortgage Corp. | | |
| 7.625%, due 5/1/26 (a) | 790,000 | 727,026 |
| Goldman Sachs Group, Inc. (The) | | |
| 1.431%, due 3/9/27 (c) | 1,255,000 | 1,114,598 |
| 1.948%, due 10/21/27 (c) | 1,435,000 | 1,258,517 |
| 1.992%, due 1/27/32 (c) | 1,165,000 | 854,653 |
| 6.75%, due 10/1/37 | 829,000 | 809,823 |
| HSBC Holdings plc | | |
| 3.973%, due 5/22/30 (United Kingdom) (c) | 1,350,000 | 1,166,375 |
| Intesa Sanpaolo SpA | | |
| 7.00%, due 11/21/25 (Italy) (a) | 585,000 | 587,482 |
| JPMorgan Chase & Co. (c) | | |
| 2.182%, due 6/1/28 | 1,030,000 | 895,373 |
| Series HH | | |
| 4.60%, due 2/1/25 (d) | 257,000 | 239,438 |
| Lloyds Banking Group plc (United Kingdom) | | |
| 4.582%, due 12/10/25 | 1,038,000 | 987,207 |
| 4.65%, due 3/24/26 | 1,690,000 | 1,600,515 |
| 4.976% (1 Year Treasury Constant Maturity Rate + 2.30%), due 8/11/33 (b) | 870,000 | 755,212 |
| | Principal
Amount | Value |
| |
| Banks (continued) |
| Macquarie Group Ltd. | | |
| 2.871%, due 1/14/33 (Australia) (a)(c) | $ 1,925,000 | $ 1,422,625 |
| Mizuho Financial Group, Inc. | | |
| 3.261% (1 Year Treasury Constant Maturity Rate + 1.25%), due 5/22/30 (Japan) (b) | 795,000 | 676,086 |
| Morgan Stanley (c) | | |
| 2.484%, due 9/16/36 | 2,115,000 | 1,496,182 |
| 2.511%, due 10/20/32 | 1,530,000 | 1,144,385 |
| NatWest Group plc | | |
| 3.073% (1 Year Treasury Constant Maturity Rate + 2.55%), due 5/22/28 (United Kingdom) (b) | 3,705,000 | 3,277,254 |
| Santander Holdings USA, Inc. | | |
| 6.499%, due 3/9/29 (c) | 735,000 | 710,873 |
| Societe Generale SA (France) (a)(b)(d) | | |
| 4.75% (5 Year Treasury Constant Maturity Rate + 3.931%), due 5/26/26 | 935,000 | 749,647 |
| 5.375% (5 Year Treasury Constant Maturity Rate + 4.514%), due 11/18/30 | 2,240,000 | 1,606,542 |
| Standard Chartered plc | | |
| 1.822% (1 Year Treasury Constant Maturity Rate + 0.95%), due 11/23/25 (United Kingdom) (a)(b) | 2,510,000 | 2,379,427 |
| UBS Group AG (Switzerland) (a) | | |
| 3.091%, due 5/14/32 (c) | 1,040,000 | 799,921 |
| 4.375% (5 Year Treasury Constant Maturity Rate + 3.313%), due 2/10/31 (b)(d) | 2,350,000 | 1,631,496 |
| 4.751% (1 Year Treasury Constant Maturity Rate + 1.75%), due 5/12/28 (b) | 410,000 | 385,180 |
| 6.442%, due 8/11/28 (c) | 365,000 | 361,199 |
| Wells Fargo & Co. (c) | | |
| 3.35%, due 3/2/33 | 935,000 | 736,188 |
| 5.557%, due 7/25/34 | 665,000 | 608,735 |
| Westpac Banking Corp. | | |
| 3.02% (5 Year Treasury Constant Maturity Rate + 1.53%), due 11/18/36 (Australia) (b) | 1,255,000 | 902,718 |
| | | 59,861,038 |
| Biotechnology 0.0% ‡ |
| Amgen, Inc. | | |
| 5.75%, due 3/2/63 | 540,000 | 467,705 |
The notes to the financial statements are an integral part of, and should be read in conjunction with, the financial statements.
15
Portfolio of Investments October 31, 2023†^ (continued)
| | Principal
Amount | Value |
| Corporate Bonds (continued) |
| Chemicals 0.3% |
| Braskem Netherlands Finance BV | | |
| 4.50%, due 1/10/28 (Brazil) (a) | $ 1,535,000 | $ 1,295,147 |
| Huntsman International LLC | | |
| 4.50%, due 5/1/29 | 1,862,000 | 1,665,437 |
| | | 2,960,584 |
| Commercial Services 0.1% |
| Ashtead Capital, Inc. | | |
| 4.00%, due 5/1/28 (United Kingdom) (a) | 935,000 | 835,803 |
| California Institute of Technology | | |
| 3.65%, due 9/1/2119 | 898,000 | 519,340 |
| | | 1,355,143 |
| Computers 0.4% |
| Dell International LLC | | |
| 3.375%, due 12/15/41 | 2,090,000 | 1,346,368 |
| 5.30%, due 10/1/29 | 810,000 | 772,713 |
| 8.10%, due 7/15/36 | 1,242,000 | 1,347,006 |
| | | 3,466,087 |
| Diversified Financial Services 1.7% |
| AerCap Ireland Capital DAC | | |
| 2.45%, due 10/29/26 (Ireland) | 1,585,000 | 1,409,903 |
| Air Lease Corp. | | |
| 2.30%, due 2/1/25 | 1,915,000 | 1,817,895 |
| 4.25%, due 9/15/24 | 630,000 | 619,076 |
| Aircastle Ltd. | | |
| 5.25% (5 Year Treasury Constant Maturity Rate + 4.41%), due 6/15/26 (a)(b)(d) | 1,150,000 | 901,769 |
| Ally Financial, Inc. | | |
| 6.992%, due 6/13/29 (c) | 550,000 | 525,715 |
| 8.00%, due 11/1/31 | 1,685,000 | 1,644,632 |
| American Express Co. | | |
| 5.625%, due 7/28/34 (c) | 570,000 | 519,492 |
| Aviation Capital Group LLC | | |
| 1.95%, due 1/30/26 (a) | 1,210,000 | 1,088,047 |
| Avolon Holdings Funding Ltd. (Ireland) (a) | | |
| 2.125%, due 2/21/26 | 1,515,000 | 1,351,227 |
| 2.875%, due 2/15/25 | 1,830,000 | 1,729,734 |
| Banco BTG Pactual SA | | |
| 2.75%, due 1/11/26 (Brazil) (a) | 1,050,000 | 966,007 |
| Capital One Financial Corp. | | |
| 6.312%, due 6/8/29 (c) | 1,070,000 | 1,024,496 |
| Nomura Holdings, Inc. | | |
| 5.099%, due 7/3/25 (Japan) | 1,845,000 | 1,809,541 |
| | Principal
Amount | Value |
| |
| Diversified Financial Services (continued) |
| OneMain Finance Corp. | | |
| 3.50%, due 1/15/27 | $ 885,000 | $ 747,825 |
| 6.125%, due 3/15/24 | 270,000 | 269,277 |
| | | 16,424,636 |
| Electric 1.9% |
| AEP Texas, Inc. | | |
| 4.70%, due 5/15/32 | 1,135,000 | 1,007,411 |
| Alabama Power Co. | | |
| 3.00%, due 3/15/52 | 785,000 | 442,713 |
| Arizona Public Service Co. | | |
| 2.20%, due 12/15/31 | 1,930,000 | 1,426,759 |
| Calpine Corp. | | |
| 5.125%, due 3/15/28 (a) | 615,000 | 550,383 |
| Duke Energy Progress LLC | | |
| 5.35%, due 3/15/53 | 535,000 | 455,495 |
| Duquesne Light Holdings, Inc. | | |
| 3.616%, due 8/1/27 (a) | 2,265,000 | 2,011,528 |
| Edison International | | |
| Series B | | |
| 5.00% (5 Year Treasury Constant Maturity Rate + 3.901%), due 12/15/26 (b)(d) | 2,140,000 | 1,904,519 |
| Entergy Louisiana LLC | | |
| 4.00%, due 3/15/33 | 1,615,000 | 1,356,863 |
| Georgia Power Co. | | |
| 4.95%, due 5/17/33 | 310,000 | 282,956 |
| Jersey Central Power & Light Co. | | |
| 2.75%, due 3/1/32 (a) | 1,655,000 | 1,269,177 |
| National Rural Utilities Cooperative Finance Corp. | | |
| 5.80%, due 1/15/33 | 1,065,000 | 1,030,069 |
| Nevada Power Co. | | |
| Series GG | | |
| 5.90%, due 5/1/53 | 530,000 | 482,309 |
| Ohio Power Co. | | |
| Series R | | |
| 2.90%, due 10/1/51 | 1,000,000 | 558,486 |
| Public Service Co. of Oklahoma | | |
| 5.25%, due 1/15/33 | 415,000 | 382,026 |
| Sempra | | |
| 5.50%, due 8/1/33 | 1,115,000 | 1,036,931 |
| Southern California Edison Co. | | |
| 4.00%, due 4/1/47 | 660,000 | 451,760 |
| 5.70%, due 3/1/53 | 795,000 | 691,067 |
| Virginia Electric and Power Co. | | |
| 2.95%, due 11/15/51 | 1,035,000 | 576,677 |
| 5.45%, due 4/1/53 | 480,000 | 409,134 |
The notes to the financial statements are an integral part of, and should be read in conjunction with, the financial statements.
| 16 | MainStay Income Builder Fund |
| | Principal
Amount | Value |
| Corporate Bonds (continued) |
| Electric (continued) |
| WEC Energy Group, Inc. | | |
| 7.739% (3 Month SOFR + 2.374%), due 5/15/67 (b) | $ 1,095,000 | $ 951,992 |
| Xcel Energy, Inc. | | |
| 5.45%, due 8/15/33 | 1,110,000 | 1,034,254 |
| | | 18,312,509 |
| Entertainment 0.1% |
| Warnermedia Holdings, Inc. | | |
| 4.279%, due 3/15/32 | 1,340,000 | 1,111,014 |
| Food 0.3% |
| J M Smucker Co. (The) | | |
| 6.50%, due 11/15/53 | 370,000 | 348,863 |
| JBS USA LUX SA | | |
| 5.75%, due 4/1/33 | 1,690,000 | 1,492,640 |
| Smithfield Foods, Inc. | | |
| 4.25%, due 2/1/27 (a) | 1,180,000 | 1,083,332 |
| | | 2,924,835 |
| Gas 0.2% |
| Brooklyn Union Gas Co. (The) | | |
| 6.388%, due 9/15/33 (a) | 865,000 | 825,896 |
| National Fuel Gas Co. | | |
| 2.95%, due 3/1/31 | 375,000 | 285,061 |
| Southern California Gas Co. | | |
| Series VV | | |
| 4.30%, due 1/15/49 | 845,000 | 605,827 |
| Southern Co. Gas Capital Corp. | | |
| Series 21A | | |
| 3.15%, due 9/30/51 | 1,180,000 | 664,133 |
| | | 2,380,917 |
| Insurance 0.7% |
| Peachtree Corners Funding Trust | | |
| 3.976%, due 2/15/25 (a) | 940,000 | 908,296 |
| Protective Life Corp. | | |
| 8.45%, due 10/15/39 | 1,195,000 | 1,339,295 |
| Reliance Standard Life Global Funding II | | |
| 2.50%, due 10/30/24 (a) | 2,420,000 | 2,325,322 |
| Willis North America, Inc. | | |
| 2.95%, due 9/15/29 | 1,735,000 | 1,454,674 |
| 3.875%, due 9/15/49 | 440,000 | 281,458 |
| | | 6,309,045 |
| | Principal
Amount | Value |
| |
| Lodging 0.3% |
| Las Vegas Sands Corp. | | |
| 3.20%, due 8/8/24 | $ 1,415,000 | $ 1,376,870 |
| Sands China Ltd. | | |
| 5.375%, due 8/8/25 (Macao) (e) | 1,310,000 | 1,267,912 |
| | | 2,644,782 |
| Media 0.1% |
| CCO Holdings LLC | | |
| 4.75%, due 3/1/30 (a) | 580,000 | 478,455 |
| DISH DBS Corp. | | |
| 5.75%, due 12/1/28 (a) | 1,180,000 | 856,975 |
| | | 1,335,430 |
| Miscellaneous—Manufacturing 0.2% |
| Textron Financial Corp. | | |
| 7.361% (3 Month SOFR + 1.997%), due 2/15/42 (a)(b) | 2,720,000 | 2,121,683 |
| Oil & Gas 0.1% |
| Gazprom PJSC Via Gaz Capital SA | | |
| 7.288%, due 8/16/37 (Russia) (a)(f) | 745,000 | 577,375 |
| Packaging & Containers 0.1% |
| Berry Global, Inc. | | |
| 4.875%, due 7/15/26 (a) | 200,000 | 190,838 |
| Owens-Brockway Glass Container, Inc. | | |
| 6.625%, due 5/13/27 (a) | 731,000 | 694,450 |
| | | 885,288 |
| Pharmaceuticals 0.2% |
| Teva Pharmaceutical Finance Netherlands III BV (Israel) | | |
| 3.15%, due 10/1/26 | 575,000 | 506,244 |
| 4.75%, due 5/9/27 | 1,335,000 | 1,212,098 |
| | | 1,718,342 |
| Pipelines 1.0% |
| Cheniere Corpus Christi Holdings LLC | | |
| 2.742%, due 12/31/39 | 1,580,000 | 1,139,083 |
| Columbia Pipelines Operating Co. LLC | | |
| 6.544%, due 11/15/53 (a) | 740,000 | 679,710 |
| DT Midstream, Inc. | | |
| 4.30%, due 4/15/32 (a) | 1,375,000 | 1,158,273 |
| Enbridge, Inc. | | |
| 5.70%, due 3/8/33 (Canada) (g) | 1,075,000 | 1,005,161 |
| Energy Transfer LP | | |
| 5.35%, due 5/15/45 | 1,000,000 | 785,815 |
The notes to the financial statements are an integral part of, and should be read in conjunction with, the financial statements.
17
Portfolio of Investments October 31, 2023†^ (continued)
| | Principal
Amount | Value |
| Corporate Bonds (continued) |
| Pipelines (continued) |
| EnLink Midstream LLC | | |
| 5.625%, due 1/15/28 (a) | $ 565,000 | $ 532,753 |
| Flex Intermediate Holdco LLC | | |
| 3.363%, due 6/30/31 (a) | 2,030,000 | 1,529,932 |
| MPLX LP | | |
| 2.65%, due 8/15/30 | 1,050,000 | 829,499 |
| Transcontinental Gas Pipe Line Co. LLC | | |
| 4.60%, due 3/15/48 | 1,035,000 | 778,809 |
| Venture Global LNG, Inc. | | |
| 9.875%, due 2/1/32 (a) | 630,000 | 638,813 |
| Western Midstream Operating LP | | |
| 5.25%, due 2/1/50 (e) | 860,000 | 635,506 |
| | | 9,713,354 |
| Real Estate Investment Trusts 0.8% |
| American Tower Corp. | | |
| 3.60%, due 1/15/28 | 1,025,000 | 921,427 |
| Digital Realty Trust LP | | |
| 4.45%, due 7/15/28 | 2,255,000 | 2,084,993 |
| GLP Capital LP | | |
| 3.35%, due 9/1/24 | 1,280,000 | 1,243,153 |
| Invitation Homes Operating Partnership LP | | |
| 2.00%, due 8/15/31 | 1,600,000 | 1,152,045 |
| Starwood Property Trust, Inc. (a) | | |
| 3.75%, due 12/31/24 | 1,120,000 | 1,058,400 |
| 4.375%, due 1/15/27 | 940,000 | 806,435 |
| | | 7,266,453 |
| Retail 0.1% |
| AutoNation, Inc. | | |
| 4.75%, due 6/1/30 | 784,000 | 686,686 |
| Nordstrom, Inc. | | |
| 4.25%, due 8/1/31 | 985,000 | 721,591 |
| | | 1,408,277 |
| Software 0.1% |
| Fidelity National Information Services, Inc. | | |
| 5.10%, due 7/15/32 | 655,000 | 604,335 |
| Telecommunications 0.3% |
| Altice France SA | | |
| 5.125%, due 7/15/29 (France) (a) | 2,100,000 | 1,437,789 |
| AT&T, Inc. | | |
| 3.50%, due 9/15/53 | 1,344,000 | 791,414 |
| | Principal
Amount | Value |
| |
| Telecommunications (continued) |
| T-Mobile USA, Inc. | | |
| 2.625%, due 2/15/29 | $ 715,000 | $ 599,424 |
| | | 2,828,627 |
| Trucking & Leasing 0.1% |
| Penske Truck Leasing Co. LP | | |
| 6.05%, due 8/1/28 (a) | 845,000 | 829,018 |
Total Corporate Bonds
(Cost $195,526,203) | | 165,799,548 |
| Foreign Government Bonds 0.3% |
| Chile 0.1% |
| Empresa Nacional del Petroleo | | |
| 3.45%, due 9/16/31 (a) | 1,695,000 | 1,314,905 |
| Colombia 0.2% |
| Colombia Government Bond | | |
| 3.25%, due 4/22/32 | 1,780,000 | 1,273,459 |
| 4.50%, due 1/28/26 | 560,000 | 535,448 |
| | | 1,808,907 |
Total Foreign Government Bonds
(Cost $4,013,987) | | 3,123,812 |
| Loan Assignments 0.1% |
| Diversified/Conglomerate Service 0.1% |
| TruGreen LP (b) | | |
| First Lien Second Refinancing Term Loan | | |
| 9.424% (1 Month SOFR + 4.00%), due 11/2/27 | 746,671 | 698,884 |
| Second Lien Initial Term Loan | | |
| 14.145% (3 Month SOFR + 8.50%), due 11/2/28 | 580,000 | 369,267 |
| | | 1,068,151 |
Total Loan Assignments
(Cost $1,313,716) | | 1,068,151 |
| Mortgage-Backed Securities 16.4% |
| Agency (Collateralized Mortgage Obligations) 8.5% |
| FHLMC | | |
| REMIC, Series 5326, Class QO | | |
| (zero coupon), due 9/25/50 | 1,678,055 | 1,096,553 |
The notes to the financial statements are an integral part of, and should be read in conjunction with, the financial statements.
| 18 | MainStay Income Builder Fund |
| | Principal
Amount | Value |
| Mortgage-Backed Securities (continued) |
| Agency (Collateralized Mortgage Obligations) (continued) |
| FHLMC (continued) | | |
| REMIC, Series 5021, Class SA | | |
| (zero coupon) (SOFR 30A + 3.55%), due 10/25/50 (b)(h) | $ 2,984,480 | $ 30,018 |
| REMIC, Series 5187, Class SA | | |
| (zero coupon) (SOFR 30A + 1.80%), due 1/25/52 (b)(h) | 2,277,950 | 1,337 |
| REMIC, Series 5200, Class SA | | |
| (zero coupon) (SOFR 30A + 3.50%), due 2/25/52 (b)(h) | 437,478 | 3,994 |
| REMIC, Series 5326 | | |
| (zero coupon), due 8/25/53 | 519,034 | 361,347 |
| REMIC, Series 5351, Class DO | | |
| (zero coupon), due 9/25/53 | 990,000 | 663,640 |
| REMIC, Series 5315, Class OQ | | |
| (zero coupon), due 1/25/55 | 841,160 | 653,922 |
| REMIC, Series 5328, Class JY | | |
| 0.25%, due 9/25/50 | 1,563,410 | 963,059 |
| REMIC, Series 4993, Class KS | | |
| 0.615% (SOFR 30A + 5.936%), due 7/25/50 (b)(h) | 3,256,106 | 314,821 |
| REMIC, Series 4994, Class TS | | |
| 0.665% (SOFR 30A + 5.986%), due 7/25/50 (b)(h) | 1,915,479 | 173,222 |
| REMIC, Series 5092, Class XA | | |
| 1.00%, due 1/15/41 | 1,185,107 | 942,531 |
| REMIC, Series 4988, Class BA | | |
| 1.50%, due 6/25/50 | 469,599 | 313,122 |
| REMIC, Series 4120, Class ZA | | |
| 3.00%, due 10/15/42 | 827,285 | 692,613 |
| REMIC, Series 5070, Class PI | | |
| 3.00%, due 8/25/50 (h) | 1,602,781 | 284,273 |
| REMIC, Series 5011, Class MI | | |
| 3.00%, due 9/25/50 (h) | 1,826,149 | 284,029 |
| REMIC, Series 5023, Class LI | | |
| 3.00%, due 10/25/50 (h) | 1,308,793 | 208,107 |
| REMIC, Series 5094, Class IP | | |
| 3.00%, due 4/25/51 (h) | 1,402,040 | 218,209 |
| REMIC, Series 5160 | | |
| 3.00%, due 10/25/51 (h) | 1,603,304 | 196,918 |
| REMIC, Series 4710, Class WZ | | |
| 3.50%, due 8/15/47 | 1,029,620 | 854,966 |
| REMIC, Series 4725, Class WZ | | |
| 3.50%, due 11/15/47 | 1,848,956 | 1,528,652 |
| REMIC, Series 5040 | | |
| 3.50%, due 11/25/50 (h) | 1,141,381 | 183,401 |
| | Principal
Amount | Value |
| |
| Agency (Collateralized Mortgage Obligations) (continued) |
| FHLMC (continued) | | |
| REMIC, Series 5304, Class UB | | |
| 4.00%, due 2/25/52 | $ 1,370,776 | $ 1,192,055 |
| REMIC, Series 5268, Class B | | |
| 4.50%, due 10/25/52 | 2,137,877 | 1,926,420 |
| FHLMC, Strips | | |
| Series 272 | | |
| (zero coupon), due 8/15/42 | 1,119,831 | 791,890 |
| Series 311 | | |
| (zero coupon), due 8/15/43 | 661,282 | 462,938 |
| Series 402 | | |
| (zero coupon), due 9/25/53 | 1,191,954 | 886,943 |
| Series 311, Class S1 | | |
| 0.515% (SOFR 30A + 5.836%), due 8/15/43 (b)(h) | 1,885,970 | 146,760 |
| Series 389, Class C35 | | |
| 2.00%, due 6/15/52 (h) | 2,803,854 | 339,967 |
| FNMA | | |
| REMIC, Series 2022-5, Class SN | | |
| (zero coupon) (SOFR 30A + 1.80%), due 2/25/52 (b)(h) | 1,330,407 | 553 |
| REMIC, Series 2022-3, Class YS | | |
| (zero coupon) (SOFR 30A + 2.55%), due 2/25/52 (b)(h) | 9,214,275 | 17,132 |
| REMIC, Series 2023-45 | | |
| (zero coupon), due 10/25/53 | 991,736 | 687,444 |
| REMIC, Series 2023-24, Class OQ | | |
| (zero coupon), due 7/25/54 | 1,078,864 | 841,869 |
| REMIC, Series 2022-10, Class SA | | |
| 0.429% (SOFR 30A + 5.75%), due 2/25/52 (b)(h) | 1,891,353 | 171,047 |
| REMIC, Series 2021-40, Class SI | | |
| 0.515% (SOFR 30A + 5.836%), due 9/25/47 (b)(h) | 2,295,073 | 163,986 |
| REMIC, Series 2016-57, Class SN | | |
| 0.615% (SOFR 30A + 5.936%), due 6/25/46 (b)(h) | 1,860,145 | 137,152 |
| REMIC, Series 2020-47, Class BD | | |
| 1.50%, due 7/25/50 | 406,804 | 269,921 |
| REMIC, Series 2020-70, Class AD | | |
| 1.50%, due 10/25/50 | 2,138,044 | 1,563,123 |
| REMIC, Series 2021-12, Class JI | | |
| 2.50%, due 3/25/51 (h) | 1,318,395 | 208,369 |
| REMIC, Series 2021-10, Class LI | | |
| 2.50%, due 3/25/51 (h) | 883,612 | 124,807 |
| REMIC, Series 2021-34, Class MI | | |
| 2.50%, due 3/25/51 (h) | 3,713,555 | 420,332 |
The notes to the financial statements are an integral part of, and should be read in conjunction with, the financial statements.
19
Portfolio of Investments October 31, 2023†^ (continued)
| | Principal
Amount | Value |
| Mortgage-Backed Securities (continued) |
| Agency (Collateralized Mortgage Obligations) (continued) |
| FNMA (continued) | | |
| REMIC, Series 2021-54, Class HI | | |
| 2.50%, due 6/25/51 (h) | $ 602,301 | $ 78,286 |
| REMIC, Series 2013-77, Class CY | | |
| 3.00%, due 7/25/43 | 1,277,437 | 1,045,711 |
| REMIC, Series 2021-53, Class GI | | |
| 3.00%, due 7/25/48 (h) | 4,954,717 | 764,269 |
| REMIC, Series 2019-13, Class PE | | |
| 3.00%, due 3/25/49 | 716,189 | 605,153 |
| REMIC, Series 2021-85, Class BI | | |
| 3.00%, due 12/25/51 (h) | 3,535,009 | 580,917 |
| REMIC, Series 2021-12, Class GC | | |
| 3.50%, due 7/25/50 | 1,509,610 | 1,265,753 |
| REMIC, Series 2021-8, Class ID | | |
| 3.50%, due 3/25/51 (h) | 2,342,653 | 465,290 |
| REMIC, Series 2020-10, Class DA | | |
| 3.50%, due 3/25/60 | 1,435,385 | 1,170,832 |
| FNMA, Strips (h) | | |
| REMIC, Series 426, Class C32 | | |
| 1.50%, due 2/25/52 | 4,073,445 | 379,918 |
| REMIC, Series 427, Class C77 | | |
| 2.50%, due 9/25/51 | 3,354,155 | 486,787 |
| GNMA | | |
| Series 2020-1, Class YS | | |
| (zero coupon) (1 Month SOFR + 2.716%), due 1/20/50 (b)(h) | 3,234,263 | 11,007 |
| Series 2023-101, Class KO | | |
| (zero coupon), due 1/20/51 | 2,431,026 | 1,520,678 |
| Series 2021-77, Class SN | | |
| (zero coupon) (1 Month SOFR + 2.486%), due 5/20/51 (b)(h) | 6,678,269 | 18,994 |
| Series 2021-97, Class SA | | |
| (zero coupon) (SOFR 30A + 2.60%), due 6/20/51 (b)(h) | 6,258,917 | 17,418 |
| Series 2021-136, Class SB | | |
| (zero coupon) (SOFR 30A + 3.20%), due 8/20/51 (b)(h) | 16,836,620 | 94,546 |
| Series 2021-158, Class SB | | |
| (zero coupon) (SOFR 30A + 3.70%), due 9/20/51 (b)(h) | 3,613,990 | 48,386 |
| Series 2021-205, Class DS | | |
| (zero coupon) (SOFR 30A + 3.20%), due 11/20/51 (b)(h) | 6,695,764 | 33,208 |
| Series 2022-19, Class SG | | |
| (zero coupon) (SOFR 30A + 2.45%), due 1/20/52 (b)(h) | 5,788,117 | 10,941 |
| | Principal
Amount | Value |
| |
| Agency (Collateralized Mortgage Obligations) (continued) |
| GNMA (continued) | | |
| Series 2022-24, Class SC | | |
| (zero coupon) (SOFR 30A + 2.37%), due 2/20/52 (b)(h) | $ 29,876,237 | $ 43,249 |
| Series 2023-56 | | |
| (zero coupon), due 7/20/52 | 1,529,902 | 1,357,164 |
| Series 2023-66, Class OQ | | |
| (zero coupon), due 7/20/52 | 1,497,028 | 1,095,814 |
| Series 2023-53 | | |
| (zero coupon), due 4/20/53 | 689,532 | 471,186 |
| Series 2023-80, Class SA | | |
| (zero coupon) (SOFR 30A + 5.25%), due 6/20/53 (b)(h) | 6,080,153 | 176,996 |
| Series 2023-60, Class ES | | |
| 0.557% (SOFR 30A + 11.20%), due 4/20/53 (b) | 1,612,392 | 1,395,240 |
| Series 2020-34, Class SC | | |
| 0.596% (1 Month SOFR + 5.936%), due 3/20/50 (b)(h) | 2,452,739 | 217,058 |
| Series 2020-146, Class SA | | |
| 0.846% (1 Month SOFR + 6.186%), due 10/20/50 (b)(h) | 2,356,078 | 232,879 |
| Series 2021-179, Class SA | | |
| 0.846% (1 Month SOFR + 6.186%), due 11/20/50 (b)(h) | 3,110,846 | 295,012 |
| Series 2020-167, Class SN | | |
| 0.846% (1 Month SOFR + 6.186%), due 11/20/50 (b)(h) | 1,042,429 | 96,870 |
| Series 2020-189, Class NS | | |
| 0.846% (1 Month SOFR + 6.186%), due 12/20/50 (b)(h) | 3,484,559 | 354,924 |
| Series 2020-189, Class SU | | |
| 0.846% (1 Month SOFR + 6.186%), due 12/20/50 (b)(h) | 712,053 | 68,864 |
| Series 2021-57, Class SA | | |
| 0.846% (1 Month SOFR + 6.186%), due 3/20/51 (b)(h) | 2,438,302 | 237,509 |
| Series 2021-57, Class SD | | |
| 0.846% (1 Month SOFR + 6.186%), due 3/20/51 (b)(h) | 3,349,262 | 323,382 |
| Series 2021-46, Class TS | | |
| 0.846% (1 Month SOFR + 6.186%), due 3/20/51 (b)(h) | 1,532,470 | 150,868 |
| Series 2021-96, Class NS | | |
| 0.846% (1 Month SOFR + 6.186%), due 6/20/51 (b)(h) | 4,744,155 | 456,234 |
The notes to the financial statements are an integral part of, and should be read in conjunction with, the financial statements.
| 20 | MainStay Income Builder Fund |
| | Principal
Amount | Value |
| Mortgage-Backed Securities (continued) |
| Agency (Collateralized Mortgage Obligations) (continued) |
| GNMA (continued) | | |
| Series 2021-96, Class SN | | |
| 0.846% (1 Month SOFR + 6.186%), due 6/20/51 (b)(h) | $ 2,734,411 | $ 254,032 |
| Series 2021-122, Class HS | | |
| 0.846% (1 Month SOFR + 6.186%), due 7/20/51 (b)(h) | 2,482,062 | 260,864 |
| Series 2022-137, Class S | | |
| 0.846% (1 Month SOFR + 6.186%), due 7/20/51 (b)(h) | 2,804,156 | 268,673 |
| Series 2021-96, Class JS | | |
| 0.896% (1 Month SOFR + 6.236%), due 6/20/51 (b)(h) | 2,200,077 | 181,213 |
| Series 2020-97, Class HB | | |
| 1.00%, due 7/20/50 | 735,876 | 505,354 |
| Series 2020-146, Class YK | | |
| 1.00%, due 10/20/50 | 1,332,276 | 928,828 |
| Series 2020-166, Class CA | | |
| 1.00%, due 11/20/50 | 1,585,920 | 1,088,468 |
| Series 2023-86, Class SE | | |
| 1.329% (SOFR 30A + 6.65%), due 9/20/50 (b)(h) | 1,867,860 | 199,025 |
| Series 2020-165, Class UD | | |
| 1.50%, due 11/20/50 | 571,912 | 403,133 |
| Series 2023-66, Class MP | | |
| 1.657% (SOFR 30A + 12.30%), due 5/20/53 (b) | 1,524,492 | 1,306,098 |
| Series 2021-41, Class FS | | |
| 2.00% (SOFR 30A + 0.20%), due 10/20/50 (b)(h) | 3,479,496 | 379,283 |
| Series 2020-166, Class IC | | |
| 2.00%, due 11/20/50 (h) | 771,528 | 77,034 |
| Series 2020-188 | | |
| 2.00%, due 12/20/50 (h) | 3,644,513 | 367,839 |
| Series 2020-185, Class BI | | |
| 2.00%, due 12/20/50 (h) | 1,572,873 | 171,565 |
| Series 2022-10, Class IC | | |
| 2.00%, due 11/20/51 (h) | 2,269,511 | 263,069 |
| Series 2021-97, Class IN | | |
| 2.50%, due 8/20/49 (h) | 3,960,370 | 421,227 |
| Series 2019-159, Class P | | |
| 2.50%, due 9/20/49 | 1,346,148 | 1,093,204 |
| Series 2022-1, Class IA | | |
| 2.50%, due 6/20/50 (h) | 602,327 | 81,337 |
| Series 2020-122, Class IW | | |
| 2.50%, due 7/20/50 (h) | 1,957,840 | 252,178 |
| | Principal
Amount | Value |
| |
| Agency (Collateralized Mortgage Obligations) (continued) |
| GNMA (continued) | | |
| Series 2020-151, Class TI | | |
| 2.50%, due 10/20/50 (h) | $ 1,813,334 | $ 234,601 |
| Series 2020-173, Class EI | | |
| 2.50%, due 11/20/50 (h) | 2,045,457 | 276,195 |
| Series 2020-188, Class DI | | |
| 2.50%, due 12/20/50 (h) | 4,756,939 | 646,649 |
| Series 2021-1, Class PI | | |
| 2.50%, due 12/20/50 (h) | 1,006,099 | 127,872 |
| Series 2021-83, Class FM | | |
| 2.50% (SOFR 30A + 0.51%), due 5/20/51 (b) | 3,230,083 | 2,390,344 |
| Series 2021-140, Class GF | | |
| 2.50% (1 Month SOFR + 0.764%), due 8/20/51 (b) | 1,081,608 | 800,182 |
| Series 2021-188 | | |
| 2.50%, due 10/20/51 (h) | 3,917,447 | 561,455 |
| Series 2021-177, Class CI | | |
| 2.50%, due 10/20/51 (h) | 2,114,395 | 273,979 |
| Series 2022-83 | | |
| 2.50%, due 11/20/51 (h) | 3,192,322 | 417,327 |
| Series 2021-1, Class IT | | |
| 3.00%, due 1/20/51 (h) | 2,196,302 | 327,863 |
| Series 2021-44, Class IQ | | |
| 3.00%, due 3/20/51 (h) | 3,621,457 | 542,318 |
| Series 2021-74, Class HI | | |
| 3.00%, due 4/20/51 (h) | 381,915 | 56,540 |
| Series 2021-97, Class FA | | |
| 3.00% (SOFR 30A + 0.40%), due 6/20/51 (b) | 764,345 | 616,308 |
| Series 2021-98, Class IN | | |
| 3.00%, due 6/20/51 (h) | 1,457,443 | 258,468 |
| Series 2021-98, Class KI | | |
| 3.00%, due 6/20/51 (h) | 3,886,852 | 631,691 |
| Series 2022-189, Class AT | | |
| 3.00%, due 7/20/51 | 2,278,845 | 1,855,312 |
| Series 2022-207 | | |
| 3.00%, due 8/20/51 (h) | 2,450,821 | 387,461 |
| Series 2021-139, Class IA | | |
| 3.00%, due 8/20/51 (h) | 5,048,041 | 796,716 |
| Series 2021-158, Class NI | | |
| 3.00%, due 9/20/51 (h) | 3,742,899 | 568,398 |
| Series 2021-177, Class IM | | |
| 3.00%, due 10/20/51 (h) | 3,352,784 | 461,006 |
| Series 2023-19, Class CI | | |
| 3.00%, due 11/20/51 (h) | 2,791,624 | 430,834 |
| Series 2022-207, Class NA | | |
| 3.00%, due 1/20/52 | 5,141,269 | 4,122,080 |
The notes to the financial statements are an integral part of, and should be read in conjunction with, the financial statements.
21
Portfolio of Investments October 31, 2023†^ (continued)
| | Principal
Amount | Value |
| Mortgage-Backed Securities (continued) |
| Agency (Collateralized Mortgage Obligations) (continued) |
| GNMA (continued) | | |
| Series 2022-206, Class CN | | |
| 3.00%, due 2/20/52 | $ 3,613,921 | $ 2,924,829 |
| Series 2019-92, Class GF | | |
| 3.50% (1 Month SOFR + 0.804%), due 7/20/49 (b) | 707,195 | 575,313 |
| Series 2019-97, Class FG | | |
| 3.50% (1 Month SOFR + 0.804%), due 8/20/49 (b) | 1,475,074 | 1,199,705 |
| Series 2019-110, Class FG | | |
| 3.50% (1 Month SOFR + 0.764%), due 9/20/49 (b) | 509,315 | 413,891 |
| Series 2019-128, Class KF | | |
| 3.50% (1 Month SOFR + 0.764%), due 10/20/49 (b) | 774,567 | 628,976 |
| Series 2019-128, Class YF | | |
| 3.50% (1 Month SOFR + 0.764%), due 10/20/49 (b) | 1,007,791 | 820,577 |
| Series 2020-5, Class FA | | |
| 3.50% (1 Month SOFR + 0.814%), due 1/20/50 (b) | 1,560,585 | 1,267,878 |
| Series 2023-63, Class MA | | |
| 3.50%, due 5/20/50 | 2,092,801 | 1,782,873 |
| Series 2021-125, Class AF | | |
| 3.50% (SOFR 30A + 0.25%), due 7/20/51 (b) | 1,538,040 | 1,262,787 |
| Series 2021-146, Class IN | | |
| 3.50%, due 8/20/51 (h) | 2,411,302 | 437,308 |
| Series 2023-1, Class HD | | |
| 3.50%, due 1/20/52 | 2,661,114 | 2,259,708 |
| Series 2022-69, Class FA | | |
| 4.50% (SOFR 30A + 0.75%), due 4/20/52 (b) | 852,225 | 756,008 |
| Series 2023-81, Class LA | | |
| 5.00%, due 6/20/52 | 1,009,815 | 955,713 |
| Series 2023-38, Class WT | | |
| 6.768%, due 12/20/51 (i) | 654,308 | 657,670 |
| Series 2023-59, Class YC | | |
| 6.954%, due 9/20/51 (i) | 1,440,031 | 1,483,731 |
| Series 2023-55, Class CG | | |
| 7.496%, due 7/20/51 (i) | 1,607,119 | 1,677,002 |
| Series 2023-55, Class LB | | |
| 7.917%, due 11/20/51 (i) | 1,830,529 | 1,995,569 |
| Series 2019-136, Class YS | | |
| 9.674% (1 Month SOFR + 2.716%), due 11/20/49 (b)(h) | 1,013,535 | 3,180 |
| | | 82,281,526 |
| | Principal
Amount | Value |
| |
| Commercial Mortgage Loans (Collateralized Mortgage Obligations) 3.1% |
| Bayview Commercial Asset Trust | | |
| Series 2006-4A, Class A1 | | |
| 5.784% (1 Month SOFR + 0.459%), due 12/25/36 (a)(b) | $ 36,702 | $ 33,460 |
| BBCMS Mortgage Trust (a)(b) | | |
| Series 2018-TALL, Class C | | |
| 6.653% (1 Month SOFR + 1.318%), due 3/15/37 | 665,000 | 533,663 |
| Series 2018-TALL, Class D | | |
| 6.981% (1 Month SOFR + 1.646%), due 3/15/37 | 430,000 | 326,579 |
| Benchmark Mortgage Trust | | |
| Series 2020-B19, Class A2 | | |
| 1.691%, due 9/15/53 | 1,775,000 | 1,570,221 |
| BX Commercial Mortgage Trust (a)(j) | | |
| Series 2020-VIV2, Class C | | |
| 3.542%, due 3/9/44 | 1,070,000 | 843,668 |
| Series 2020-VIV3, Class B | | |
| 3.544%, due 3/9/44 | 1,007,236 | 815,956 |
| Series 2020-VIVA, Class D | | |
| 3.549%, due 3/11/44 | 170,000 | 131,357 |
| BX Trust (a) | | |
| Series 2019-OC11, Class B | | |
| 3.605%, due 12/9/41 | 250,000 | 207,472 |
| Series 2019-OC11, Class C | | |
| 3.856%, due 12/9/41 | 570,000 | 467,802 |
| Series 2019-OC11, Class D | | |
| 3.944%, due 12/9/41 (j) | 975,000 | 782,575 |
| Series 2021-ARIA, Class E | | |
| 7.693% (1 Month SOFR + 2.359%), due 10/15/36 (b) | 1,980,000 | 1,851,005 |
| Series 2022-PSB, Class B | | |
| 8.283% (1 Month SOFR + 2.949%), due 8/15/39 (b) | 1,275,506 | 1,275,448 |
| Series 2022-PSB, Class C | | |
| 9.032% (1 Month SOFR + 3.697%), due 8/15/39 (b) | 341,021 | 340,982 |
| BXHPP Trust | | |
| Series 2021-FILM, Class B | | |
| 6.348% (1 Month SOFR + 1.014%), due 8/15/36 (a)(b) | 1,280,000 | 1,168,047 |
| Citigroup Commercial Mortgage Trust | | |
| Series 2016-GC36, Class A5 | | |
| 3.616%, due 2/10/49 | 560,000 | 522,333 |
The notes to the financial statements are an integral part of, and should be read in conjunction with, the financial statements.
| 22 | MainStay Income Builder Fund |
| | Principal
Amount | Value |
| Mortgage-Backed Securities (continued) |
| Commercial Mortgage Loans (Collateralized Mortgage Obligations) (continued) |
| DROP Mortgage Trust | | |
| Series 2021-FILE, Class A | | |
| 6.598% (1 Month SOFR + 1.264%), due 10/15/43 (a)(b) | $ 610,000 | $ 566,761 |
| Extended Stay America Trust | | |
| Series 2021-ESH, Class D | | |
| 7.698% (1 Month SOFR + 2.364%), due 7/15/38 (a)(b) | 1,511,023 | 1,484,576 |
| GNMA (h)(j) | | |
| Series 2021-164 | | |
| 0.948%, due 10/16/63 | 3,864,783 | 262,899 |
| Series 2021-108 | | |
| 0.967%, due 6/16/61 | 5,715,980 | 383,604 |
| Series 2020-168, Class IA | | |
| 0.978%, due 12/16/62 | 2,945,498 | 202,489 |
| Series 2021-47 | | |
| 0.992%, due 3/16/61 | 6,895,852 | 471,192 |
| Hudson Yards Mortgage Trust | | |
| Series 2019-30HY, Class A | | |
| 3.228%, due 7/10/39 (a) | 1,640,000 | 1,361,996 |
| Manhattan West Mortgage Trust | | |
| Series 2020-1MW, Class A | | |
| 2.13%, due 9/10/39 (a) | 3,015,000 | 2,557,208 |
| Morgan Stanley Bank of America Merrill Lynch Trust | | |
| Series 2017-C34, Class A4 | | |
| 3.536%, due 11/15/52 | 700,000 | 631,312 |
| Series 2016-C28, Class A4 | | |
| 3.544%, due 1/15/49 | 560,000 | 522,811 |
| Morgan Stanley Capital I Trust | | |
| Series 2015-UBS8, Class A4 | | |
| 3.809%, due 12/15/48 | 860,000 | 807,373 |
| Multifamily Connecticut Avenue Securities Trust (a)(b) | | |
| Series 2019-01, Class M10 | | |
| 8.685% (SOFR 30A + 3.364%), due 10/25/49 | 2,525,969 | 2,432,292 |
| Series 2020-01, Class M10 | | |
| 9.185% (SOFR 30A + 3.864%), due 3/25/50 | 2,020,143 | 1,929,371 |
| One Bryant Park Trust | | |
| Series 2019-OBP, Class A | | |
| 2.516%, due 9/15/54 (a) | 2,350,000 | 1,840,218 |
| | Principal
Amount | Value |
| |
| Commercial Mortgage Loans (Collateralized Mortgage Obligations) (continued) |
| ORL Trust (a)(b) | | |
| Series 2023-GLKS, Class C | | |
| 8.985% (1 Month SOFR + 3.651%), due 10/15/28 | $ 800,000 | $ 796,826 |
| Series 2023-GLKS, Class D | | |
| 9.636% (1 Month SOFR + 4.301%), due 10/15/28 | 470,000 | 468,025 |
| SLG Office Trust (a) | | |
| Series 2021-OVA, Class A | | |
| 2.585%, due 7/15/41 | 705,000 | 534,750 |
| Series 2021-OVA, Class F | | |
| 2.851%, due 7/15/41 | 785,000 | 510,221 |
| Wells Fargo Commercial Mortgage Trust | | |
| Series 2018-AUS, Class A | | |
| 4.058%, due 8/17/36 (a)(j) | 1,745,000 | 1,540,154 |
| | | 30,174,646 |
| Whole Loan (Collateralized Mortgage Obligations) 4.8% |
| CIM Trust | | |
| Series 2021-J2, Class AS | | |
| 0.21%, due 4/25/51 (a)(h)(i) | 41,624,006 | 442,646 |
| Connecticut Avenue Securities Trust (a)(b) | | |
| Series 2022-R01, Class 1M2 | | |
| 7.221% (SOFR 30A + 1.90%), due 12/25/41 | 490,000 | 482,656 |
| Series 2021-R03, Class 1B1 | | |
| 8.071% (SOFR 30A + 2.75%), due 12/25/41 | 1,120,000 | 1,107,646 |
| Series 2021-R01, Class 1B1 | | |
| 8.421% (SOFR 30A + 3.10%), due 10/25/41 | 2,290,000 | 2,282,870 |
| Series 2022-R02, Class 2B1 | | |
| 9.821% (SOFR 30A + 4.50%), due 1/25/42 | 1,865,000 | 1,901,970 |
| Series 2022-R08, Class 1B1 | | |
| 10.921% (SOFR 30A + 5.60%), due 7/25/42 | 365,000 | 391,362 |
| Series 2021-R01, Class 1B2 | | |
| 11.321% (SOFR 30A + 6.00%), due 10/25/41 | 2,070,000 | 2,057,062 |
| FHLMC STACR REMIC Trust (a)(b) | | |
| Series 2021-HQA3, Class M2 | | |
| 7.421% (SOFR 30A + 2.10%), due 9/25/41 | 1,715,000 | 1,665,694 |
The notes to the financial statements are an integral part of, and should be read in conjunction with, the financial statements.
23
Portfolio of Investments October 31, 2023†^ (continued)
| | Principal
Amount | Value |
| Mortgage-Backed Securities (continued) |
| Whole Loan (Collateralized Mortgage Obligations) (continued) |
FHLMC STACR REMIC Trust (a)(b)
(continued) | | |
| Series 2021-HQA4, Class M2 | | |
| 7.671% (SOFR 30A + 2.35%), due 12/25/41 | $ 1,760,000 | $ 1,705,000 |
| Series 2022-DNA1, Class M2 | | |
| 7.821% (SOFR 30A + 2.50%), due 1/25/42 | 1,950,000 | 1,906,125 |
| Series 2021-HQA1, Class B1 | | |
| 8.321% (SOFR 30A + 3.00%), due 8/25/33 | 3,225,000 | 3,178,657 |
| Series 2021-DNA5, Class B1 | | |
| 8.371% (SOFR 30A + 3.05%), due 1/25/34 | 3,315,000 | 3,315,000 |
| Series 2021-HQA2, Class B1 | | |
| 8.471% (SOFR 30A + 3.15%), due 12/25/33 | 1,445,000 | 1,426,938 |
| Series 2021-HQA3, Class B1 | | |
| 8.671% (SOFR 30A + 3.35%), due 9/25/41 | 1,935,000 | 1,920,488 |
| Series 2021-DNA6, Class B1 | | |
| 8.721% (SOFR 30A + 3.40%), due 10/25/41 | 1,235,000 | 1,241,175 |
| Series 2022-DNA1, Class B1 | | |
| 8.721% (SOFR 30A + 3.40%), due 1/25/42 | 510,000 | 504,900 |
| Series 2021-DNA7, Class B1 | | |
| 8.971% (SOFR 30A + 3.65%), due 11/25/41 | 1,655,000 | 1,675,897 |
| Series 2021-HQA4, Class B1 | | |
| 9.071% (SOFR 30A + 3.75%), due 12/25/41 | 550,000 | 546,916 |
| Series 2022-DNA2, Class M2 | | |
| 9.071% (SOFR 30A + 3.75%), due 2/25/42 | 2,470,000 | 2,503,962 |
| Series 2020-HQA1, Class B2 | | |
| 10.535% (SOFR 30A + 5.214%), due 1/25/50 | 1,360,000 | 1,349,136 |
| Series 2022-HQA3, Class M2 | | |
| 10.671% (SOFR 30A + 5.35%), due 8/25/42 | 1,530,000 | 1,616,008 |
| Series 2022-DNA6, Class M2 | | |
| 11.071% (SOFR 30A + 5.75%), due 9/25/42 | 1,375,000 | 1,493,140 |
| Series 2022-HQA1, Class B1 | | |
| 12.321% (SOFR 30A + 7.00%), due 3/25/42 | 1,150,000 | 1,237,963 |
| | Principal
Amount | Value |
| |
| Whole Loan (Collateralized Mortgage Obligations) (continued) |
| FHLMC Structured Agency Credit Risk Debt Notes | | |
| Series 2022-HQA2, Class M2 | | |
| 11.321% (SOFR 30A + 6.00%), due 7/25/42 (a)(b) | $ 1,505,000 | $ 1,627,656 |
| Flagstar Mortgage Trust | | |
| Series 2021-6INV, Class A18 | | |
| 2.50%, due 8/25/51 (a)(i) | 95,813 | 68,195 |
| HarborView Mortgage Loan Trust | | |
| Series 2007-3, Class 2A1A | | |
| 5.848% (1 Month SOFR + 0.514%), due 5/19/47 (b) | 816,951 | 739,742 |
| J.P. Morgan Mortgage Trust | | |
| Series 2021-LTV2, Class A1 | | |
| 2.519%, due 5/25/52 (a)(i) | 801,626 | 603,332 |
| New Residential Mortgage Loan Trust (a) | | |
| Series 2019-5A, Class B7 | | |
| 4.325%, due 8/25/59 (j) | 2,764,135 | 1,510,676 |
| Series 2019-2A, Class B6 | | |
| 4.832%, due 12/25/57 (i) | 938,056 | 553,348 |
| OBX Trust | | |
| Series 2022-NQM1, Class A1 | | |
| 2.305%, due 11/25/61 (a)(i) | 862,490 | 701,519 |
| Onslow Bay Mortgage Loan Trust | | |
| Series 2021-NQM4, Class A1 | | |
| 1.957%, due 10/25/61 (a)(i) | 2,609,491 | 2,013,952 |
| Sequoia Mortgage Trust | | |
| Series 2021-4, Class A1 | | |
| 0.167%, due 6/25/51 (a)(h)(j) | 31,378,936 | 251,386 |
| STACR Trust | | |
| Series 2018-HRP2, Class B1 | | |
| 9.635% (SOFR 30A + 4.314%), due 2/25/47 (a)(b) | 1,900,000 | 2,032,335 |
| | | 46,055,352 |
Total Mortgage-Backed Securities
(Cost $170,693,060) | | 158,511,524 |
| Municipal Bond 0.1% |
| California 0.1% |
| Regents of the University of California Medical Center, Pooled, Revenue Bonds | | |
| Series N | | |
| 3.006%, due 5/15/50 | 1,815,000 | 1,079,864 |
Total Municipal Bond
(Cost $1,815,000) | | 1,079,864 |
The notes to the financial statements are an integral part of, and should be read in conjunction with, the financial statements.
| 24 | MainStay Income Builder Fund |
| | Principal
Amount | Value |
| U.S. Government & Federal Agencies 3.6% |
| Federal Home Loan Mortgage Corporation (Mortgage Pass-Through Securities) 1.3% |
| UMBS Pool, 20 Year | | |
| 5.00%, due 7/1/43 | $ 1,892,481 | $ 1,773,682 |
| UMBS Pool, 30 Year | | |
| 3.50%, due 7/1/50 | 1,119,008 | 948,611 |
| 4.50%, due 10/1/52 | 883,443 | 789,606 |
| 5.50%, due 7/1/53 | 1,730,845 | 1,642,264 |
| 6.00%, due 10/1/53 | 2,787,202 | 2,717,618 |
| 6.50%, due 7/1/53 | 373,157 | 370,993 |
| 6.50%, due 10/1/53 | 2,011,345 | 2,000,846 |
| 6.50%, due 11/1/53 | 2,350,000 | 2,337,002 |
| | | 12,580,622 |
| Federal National Mortgage Association (Mortgage Pass-Through Securities) 2.3% |
| UMBS, 20 Year | | |
| 5.00%, due 5/1/43 | 2,142,252 | 2,008,660 |
| UMBS, 30 Year | | |
| 2.50%, due 6/1/51 | 3,658,361 | 2,827,714 |
| 3.50%, due 7/1/52 | 751,704 | 626,882 |
| 4.00%, due 8/1/48 | 1,526,005 | 1,341,870 |
| 4.00%, due 2/1/49 | 250,645 | 219,654 |
| 4.00%, due 6/1/52 | 881,262 | 762,178 |
| 4.00%, due 6/1/52 | 1,439,585 | 1,244,942 |
| 5.00%, due 11/1/52 | 2,935,124 | 2,708,103 |
| 5.00%, due 3/1/53 | 1,725,927 | 1,591,871 |
| 5.50%, due 2/1/53 | 445,239 | 422,683 |
| 5.50%, due 8/1/53 | 460,160 | 437,100 |
| 6.00%, due 3/1/53 | 227,535 | 222,309 |
| 6.00%, due 8/1/53 | 1,011,906 | 985,551 |
| 6.00%, due 9/1/53 | 1,178,553 | 1,147,790 |
| 6.00%, due 9/1/53 | 4,520,202 | 4,401,849 |
| 6.50%, due 10/1/53 | 975,000 | 971,716 |
| | | 21,920,872 |
| Government National Mortgage Association (Mortgage Pass-Through Securities) 0.0% ‡ |
| GNMA I, Single Family, 30 Year | | |
| 6.50%, due 4/15/29 | 6 | 6 |
| 6.50%, due 8/15/29 | 3 | 3 |
| | | 9 |
Total U.S. Government & Federal Agencies
(Cost $36,226,381) | | 34,501,503 |
Total Long-Term Bonds
(Cost $447,717,260) | | 398,517,147 |
| |
| | Shares | Value |
| |
| Common Stocks 57.1% |
| Aerospace & Defense 1.9% |
| BAE Systems plc (United Kingdom) | 403,824 | $ 5,418,740 |
| General Dynamics Corp. | 15,140 | 3,653,433 |
| Lockheed Martin Corp. | 9,872 | 4,488,206 |
| RTX Corp. | 56,295 | 4,581,850 |
| | | 18,142,229 |
| Air Freight & Logistics 1.2% |
| Deutsche Post AG (Germany) | 140,216 | 5,453,807 |
| Hyundai Glovis Co. Ltd. (Republic of Korea) | 28,145 | 3,565,665 |
| United Parcel Service, Inc., Class B | 18,866 | 2,664,823 |
| | | 11,684,295 |
| Automobile Components 0.3% |
| Cie Generale des Etablissements Michelin SCA (France) | 108,227 | 3,208,710 |
| Automobiles 0.4% |
| Toyota Motor Corp. (Japan) | 236,200 | 4,036,009 |
| Banks 3.5% |
| Bank of America Corp. | 199,166 | 5,246,032 |
| BAWAG Group AG (Austria) (a) | 68,427 | 3,036,565 |
| Columbia Banking System, Inc. | 161,467 | 3,176,056 |
| JPMorgan Chase & Co. | 56,621 | 7,873,716 |
| PNC Financial Services Group, Inc. (The) | 25,735 | 2,945,886 |
| Regions Financial Corp. | 177,016 | 2,572,043 |
| Royal Bank of Canada (Canada) | 34,820 | 2,781,080 |
| Truist Financial Corp. | 102,181 | 2,897,853 |
| U.S. Bancorp | 96,311 | 3,070,395 |
| | | 33,599,626 |
| Beverages 1.9% |
| Coca-Cola Co. (The) | 76,458 | 4,319,113 |
| Coca-Cola Europacific Partners plc (United Kingdom) | 170,996 | 10,004,976 |
| PepsiCo, Inc. | 26,126 | 4,265,853 |
| | | 18,589,942 |
| Biotechnology 0.8% |
| AbbVie, Inc. | 52,247 | 7,376,231 |
| Capital Markets 0.9% |
| BlackRock, Inc. | 4,815 | 2,948,129 |
| Lazard Ltd., Class A | 115,308 | 3,202,103 |
| Schroders plc (United Kingdom) | 649,362 | 2,914,763 |
| | | 9,064,995 |
The notes to the financial statements are an integral part of, and should be read in conjunction with, the financial statements.
25
Portfolio of Investments October 31, 2023†^ (continued)
| | Shares | Value |
| Common Stocks (continued) |
| Chemicals 2.4% |
| Air Products and Chemicals, Inc. | 14,136 | $ 3,992,572 |
| Dow, Inc. | 76,690 | 3,707,195 |
| Linde plc | 20,103 | 7,682,562 |
| LyondellBasell Industries NV, Class A | 46,863 | 4,228,917 |
| Nutrien Ltd. (Canada) | 69,712 | 3,743,534 |
| | | 23,354,780 |
| Commercial Services & Supplies 0.0% ‡ |
| Quad/Graphics, Inc. (k) | 10 | 49 |
| Communications Equipment 1.1% |
| Cisco Systems, Inc. | 208,301 | 10,858,731 |
| Construction & Engineering 0.3% |
| Vinci SA (France) | 29,747 | 3,288,539 |
| Consumer Staples Distribution & Retail 0.9% |
| Walmart, Inc. | 55,605 | 9,086,413 |
| Diversified Telecommunication Services 2.3% |
| BCE, Inc. (Canada) | 85,564 | 3,176,373 |
| Deutsche Telekom AG (Registered) (Germany) | 398,432 | 8,631,869 |
| Orange SA (France) | 386,467 | 4,543,109 |
| TELUS Corp. (Canada) | 185,226 | 2,986,590 |
| Verizon Communications, Inc. | 88,489 | 3,108,618 |
| | | 22,446,559 |
| Electric Utilities 2.5% |
| American Electric Power Co., Inc. | 78,465 | 5,927,246 |
| Duke Energy Corp. | 35,330 | 3,140,484 |
| Entergy Corp. | 35,532 | 3,396,504 |
| Evergy, Inc. | 62,928 | 3,092,282 |
| NextEra Energy, Inc. | 89,071 | 5,192,839 |
| Pinnacle West Capital Corp. | 39,921 | 2,961,340 |
| | | 23,710,695 |
| Electrical Equipment 1.2% |
| Eaton Corp. plc | 28,249 | 5,873,250 |
| Emerson Electric Co. | 61,952 | 5,511,869 |
| | | 11,385,119 |
| Food Products 0.8% |
| Nestle SA (Registered) | 36,907 | 3,978,564 |
| Orkla ASA (Norway) | 495,871 | 3,415,315 |
| | | 7,393,879 |
| | Shares | Value |
| |
| Gas Utilities 0.3% |
| Snam SpA (Italy) | 668,982 | $ 3,064,990 |
| Health Care Equipment & Supplies 0.6% |
| Medtronic plc | 77,552 | 5,472,069 |
| Health Care Providers & Services 1.2% |
| CVS Health Corp. | 46,879 | 3,235,120 |
| UnitedHealth Group, Inc. | 16,459 | 8,814,782 |
| | | 12,049,902 |
| Hotels, Restaurants & Leisure 1.9% |
| McDonald's Corp. | 16,501 | 4,326,067 |
| Restaurant Brands International, Inc. (Canada) | 128,196 | 8,614,771 |
| Vail Resorts, Inc. | 24,685 | 5,239,392 |
| | | 18,180,230 |
| Household Durables 0.3% |
| Garmin Ltd. | 29,462 | 3,020,739 |
| Industrial Conglomerates 0.8% |
| Honeywell International, Inc. | 16,086 | 2,947,920 |
| Siemens AG (Registered) (Germany) | 35,403 | 4,680,991 |
| | | 7,628,911 |
| Insurance 2.7% |
| Allianz SE (Registered) (Germany) | 14,742 | 3,445,711 |
| AXA SA (France) | 143,364 | 4,240,590 |
| Manulife Financial Corp. (Canada) | 272,101 | 4,736,627 |
| MetLife, Inc. | 105,408 | 6,325,534 |
| Muenchener Rueckversicherungs-Gesellschaft AG (Registered) (Germany) | 10,112 | 4,049,764 |
| Travelers Cos., Inc. (The) | 17,340 | 2,903,410 |
| | | 25,701,636 |
| IT Services 1.5% |
| International Business Machines Corp. | 76,710 | 11,095,334 |
| NET One Systems Co. Ltd. (Japan) | 192,100 | 2,909,857 |
| | | 14,005,191 |
| Leisure Products 0.3% |
| Hasbro, Inc. | 70,189 | 3,169,033 |
| Machinery 0.6% |
| Cummins, Inc. | 28,350 | 6,132,105 |
The notes to the financial statements are an integral part of, and should be read in conjunction with, the financial statements.
| 26 | MainStay Income Builder Fund |
| | Shares | Value |
| Common Stocks (continued) |
| Media 0.9% |
| Comcast Corp., Class A | 125,216 | $ 5,170,169 |
| Omnicom Group, Inc. | 42,530 | 3,185,922 |
| | | 8,356,091 |
| Multi-Utilities 0.6% |
| NiSource, Inc. | 119,769 | 3,013,388 |
| WEC Energy Group, Inc. | 37,467 | 3,049,439 |
| | | 6,062,827 |
| Oil, Gas & Consumable Fuels 2.3% |
| Chevron Corp. | 23,720 | 3,456,716 |
| Enterprise Products Partners LP | 113,054 | 2,943,926 |
| MPLX LP | 83,695 | 3,016,368 |
| TotalEnergies SE (France) | 144,352 | 9,653,095 |
| Williams Cos., Inc. (The) | 94,106 | 3,237,246 |
| | | 22,307,351 |
| Personal Care Products 0.3% |
| Unilever plc (United Kingdom) | 63,764 | 3,014,051 |
| Pharmaceuticals 6.3% |
| Astellas Pharma, Inc. (Japan) | 344,000 | 4,312,057 |
| AstraZeneca plc, Sponsored ADR (United Kingdom) | 137,588 | 8,699,689 |
| Bayer AG (Registered) (Germany) | 63,477 | 2,730,929 |
| Bristol-Myers Squibb Co. | 49,960 | 2,574,439 |
| Eli Lilly & Co. | 14,882 | 8,243,586 |
| GSK plc | 176,130 | 3,119,961 |
| Johnson & Johnson | 26,733 | 3,965,573 |
| Merck & Co., Inc. | 56,681 | 5,821,139 |
| Novartis AG (Registered) (Switzerland) | 87,568 | 8,138,294 |
| Pfizer, Inc. | 105,206 | 3,215,095 |
| Roche Holding AG | 11,464 | 2,947,130 |
| Sanofi SA | 84,123 | 7,628,204 |
| | | 61,396,096 |
| Professional Services 0.4% |
| Paychex, Inc. | 33,496 | 3,719,731 |
| Retail REITs 0.3% |
| Realty Income Corp. | 69,348 | 3,285,708 |
| Semiconductors & Semiconductor Equipment 4.7% |
| Analog Devices, Inc. | 70,969 | 11,165,553 |
| Broadcom, Inc. | 15,611 | 13,134,627 |
| KLA Corp. | 19,152 | 8,995,694 |
| | Shares | Value |
| |
| Semiconductors & Semiconductor Equipment (continued) |
| Taiwan Semiconductor Manufacturing Co. Ltd., Sponsored ADR (Taiwan) | 78,054 | $ 6,736,841 |
| Texas Instruments, Inc. | 38,204 | 5,425,350 |
| | | 45,458,065 |
| Software 1.4% |
| Microsoft Corp. | 39,876 | 13,482,474 |
| Specialized REITs 1.1% |
| Iron Mountain, Inc. | 131,099 | 7,744,018 |
| VICI Properties, Inc. | 118,394 | 3,303,193 |
| | | 11,047,211 |
| Specialty Retail 0.7% |
| Best Buy Co., Inc. | 45,345 | 3,029,953 |
| Home Depot, Inc. (The) | 14,136 | 4,024,378 |
| | | 7,054,331 |
| Technology Hardware, Storage & Peripherals 2.6% |
| Apple, Inc. | 61,144 | 10,441,561 |
| Dell Technologies, Inc., Class C | 66,536 | 4,451,924 |
| NetApp, Inc. | 59,872 | 4,357,484 |
| Samsung Electronics Co. Ltd., GDR (Republic of Korea) | 4,669 | 5,817,574 |
| | | 25,068,543 |
| Tobacco 1.4% |
| British American Tobacco plc (United Kingdom) | 100,919 | 3,010,125 |
| Imperial Brands plc (United Kingdom) | 142,618 | 3,035,272 |
| Philip Morris International, Inc. | 78,736 | 7,020,102 |
| | | 13,065,499 |
| Trading Companies & Distributors 0.8% |
| MSC Industrial Direct Co., Inc., Class A | 77,206 | 7,315,269 |
| Wireless Telecommunication Services 0.7% |
| Rogers Communications, Inc., Class B (Canada) | 82,400 | 3,052,974 |
| SK Telecom Co. Ltd. (Republic of Korea) | 100,920 | 3,672,739 |
| | | 6,725,713 |
Total Common Stocks
(Cost $464,105,256) | | 553,010,567 |
The notes to the financial statements are an integral part of, and should be read in conjunction with, the financial statements.
27
Portfolio of Investments October 31, 2023†^ (continued)
| | Shares | | Value |
| Short-Term Investments 0.2% |
| Affiliated Investment Company 0.2% |
| MainStay U.S. Government Liquidity Fund, 5.275% (l) | 1,560,327 | | $ 1,560,327 |
| Unaffiliated Investment Company 0.0% ‡ |
| Invesco Government & Agency Portfolio, 5.357% (l)(m) | 24,125 | | 24,125 |
Total Short-Term Investments
(Cost $1,584,452) | | | 1,584,452 |
Total Investments
(Cost $913,406,968) | 98.4% | | 953,112,166 |
| Other Assets, Less Liabilities | 1.6 | | 15,897,401 |
| Net Assets | 100.0% | | $ 969,009,567 |
| † | Percentages indicated are based on Fund net assets. |
| ^ | Industry classifications may be different than those used for compliance monitoring purposes. |
| ‡ | Less than one-tenth of a percent. |
| (a) | May be sold to institutional investors only under Rule 144A or securities offered pursuant to Section 4(a)(2) of the Securities Act of 1933, as amended. |
| (b) | Floating rate—Rate shown was the rate in effect as of October 31, 2023. |
| (c) | Fixed to floating rate—Rate shown was the rate in effect as of October 31, 2023. |
| (d) | Security is perpetual and, thus, does not have a predetermined maturity date. The date shown, if applicable, reflects the next call date. |
| (e) | Step coupon—Rate shown was the rate in effect as of October 31, 2023. |
| (f) | Illiquid security—As of October 31, 2023, the total market value deemed illiquid under procedures approved by the Board of Trustees was $577,375, which represented 0.1% of the Fund’s net assets. (Unaudited) |
| (g) | All or a portion of this security was held on loan. As of October 31, 2023, the aggregate market value of securities on loan was $23,376. The Fund received cash collateral with a value of $24,125. (See Note 2(L)) |
| (h) | Collateralized Mortgage Obligation Interest Only Strip—Pays a fixed or variable rate of interest based on mortgage loans or mortgage pass-through securities. The principal amount of the underlying pool represents the notional amount on which the current interest was calculated. The value of these stripped securities may be particularly sensitive to changes in prevailing interest rates and are typically more sensitive to changes in prepayment rates than traditional mortgage-backed securities. |
| (i) | Coupon rate may change based on changes of the underlying collateral or prepayments of principal. Rate shown was the rate in effect as of October 31, 2023. |
| (j) | Collateral strip rate—A bond whose interest was based on the weighted net interest rate of the collateral. The coupon rate adjusts periodically based on a predetermined schedule. Rate shown was the rate in effect as of October 31, 2023. |
| (k) | Non-income producing security. |
| (l) | Current yield as of October 31, 2023. |
| (m) | Represents a security purchased with cash collateral received for securities on loan. |
Investments in Affiliates (in 000's)
Investments in issuers considered to be affiliate(s) of the Fund during the year ended October 31, 2023 for purposes of Section 2(a)(3) of the Investment Company Act of 1940, as amended, were as follows:
| Affiliated Investment Companies | Value,
Beginning
of Year | Purchases
at Cost | Proceeds
from
Sales | Net
Realized
Gain/(Loss)
on Sales | Change in
Unrealized
Appreciation/
(Depreciation) | Value,
End of
Year | Dividend
Income | Other
Distributions | Shares
End of
Year |
| MainStay U.S. Government Liquidity Fund | $ 18,110 | $ 424,476 | $ (441,026) | $ — | $ — | $ 1,560 | $ 476 | $ — | 1,560 |
The notes to the financial statements are an integral part of, and should be read in conjunction with, the financial statements.
| 28 | MainStay Income Builder Fund |
Foreign Currency Forward Contracts
As of October 31, 2023, the Fund held the following foreign currency forward contracts1:
| Currency Purchased | Currency Sold | Counterparty | Settlement
Date | Unrealized
Appreciation
(Depreciation) |
| GBP | 36,000 | USD | 43,713 | JPMorgan Chase Bank N.A. | 11/7/23 | $ 44 |
| USD | 5,986,501 | EUR | 5,385,336 | JPMorgan Chase Bank N.A. | 11/7/23 | 287,154 |
| USD | 5,737,752 | EUR | 5,385,336 | JPMorgan Chase Bank N.A. | 2/1/24 | 14,375 |
| USD | 46,488 | GBP | 36,000 | JPMorgan Chase Bank N.A. | 11/7/23 | 2,731 |
| USD | 45,436,968 | JPY | 6,863,607,000 | JPMorgan Chase Bank N.A. | 11/7/23 | 119,865 |
| Total Unrealized Appreciation | 424,169 |
| AUD | 23,293,000 | USD | 15,793,493 | JPMorgan Chase Bank N.A. | 11/7/23 | (1,014,966) |
| AUD | 23,293,000 | USD | 14,821,923 | JPMorgan Chase Bank N.A. | 2/1/24 | (1,112) |
| EUR | 5,385,336 | USD | 5,713,088 | JPMorgan Chase Bank N.A. | 11/7/23 | (13,740) |
| JPY | 6,863,607,000 | USD | 49,723,599 | JPMorgan Chase Bank N.A. | 11/7/23 | (4,406,497) |
| JPY | 6,863,607,000 | USD | 46,098,298 | JPMorgan Chase Bank N.A. | 2/1/24 | (110,979) |
| USD | 14,777,345 | AUD | 23,293,000 | JPMorgan Chase Bank N.A. | 11/7/23 | (1,182) |
| USD | 43,745 | GBP | 36,000 | JPMorgan Chase Bank N.A. | 2/1/24 | (44) |
| Total Unrealized Depreciation | (5,548,520) |
| Net Unrealized Depreciation | $ (5,124,351) |
| 1. | Foreign Currency Forward Contracts are subject to limitations such that they cannot be “sold or repurchased,” although the Fund would be able to exit the transaction through other means, such as through the execution of an offsetting transaction. |
Futures Contracts
As of October 31, 2023, the Fund held the following futures contracts1:
| Type | Number of
Contracts | Expiration
Date | Value at
Trade Date | Current
Notional
Amount | Unrealized
Appreciation
(Depreciation)2 |
| Long Contracts | | | | | |
| E-Mini Energy Select Sector Index | 152 | December 2023 | $ 14,753,424 | $ 13,622,240 | $ (1,131,184) |
| E-Mini Health Care Select Sector Index | 118 | December 2023 | 15,888,807 | 14,910,480 | (978,327) |
| E-Mini Materials Select Sector Index | 195 | December 2023 | 17,045,340 | 15,779,400 | (1,265,940) |
| E-Mini Utilities Select Sector Index | 170 | December 2023 | 10,873,540 | 10,268,000 | (605,540) |
| S&P 500 E-Mini Index | 188 | December 2023 | 42,088,068 | 39,595,150 | (2,492,918) |
| S&P Midcap 400 E-Mini Index | 20 | December 2023 | 5,203,340 | 4,750,200 | (453,140) |
| U.S. Treasury 2 Year Notes | 36 | December 2023 | 7,317,923 | 7,287,187 | (30,736) |
| U.S. Treasury 10 Year Notes | 114 | December 2023 | 12,343,171 | 12,103,594 | (239,577) |
| U.S. Treasury 10 Year Ultra Bonds | 208 | December 2023 | 23,554,422 | 22,636,250 | (918,172) |
| U.S. Treasury Long Bonds | 278 | December 2023 | 32,583,836 | 30,423,625 | (2,160,211) |
| U.S. Treasury Ultra Bonds | 159 | December 2023 | 19,993,611 | 17,897,437 | (2,096,174) |
| Yen Denominated Nikkei 225 Index | 778 | December 2023 | 83,565,604 | 80,469,042 | (3,096,562) |
| Total Long Contracts | | | | | (15,468,481) |
| Short Contracts | | | | | |
| Euro STOXX 50 Index | (810) | December 2023 | (36,728,241) | (34,882,383) | 1,845,858 |
| FTSE 100 Index | (45) | December 2023 | (4,126,189) | (4,008,068) | 118,121 |
| S&P E-Mini Commercial Service Equity Index | (180) | December 2023 | (15,952,140) | (15,311,250) | 640,890 |
| U.S. Treasury 5 Year Notes | (86) | December 2023 | (9,066,666) | (8,984,984) | 81,682 |
| Total Short Contracts | | | | | 2,686,551 |
| Net Unrealized Depreciation | | | | | $ (12,781,930) |
| 1. | As of October 31, 2023, cash in the amount of $15,395,059 was on deposit with a broker or futures commission merchant for futures transactions. |
| 2. | Represents the difference between the value of the contracts at the time they were opened and the value as of October 31, 2023. |
The notes to the financial statements are an integral part of, and should be read in conjunction with, the financial statements.
29
Portfolio of Investments October 31, 2023†^ (continued)
| Abbreviation(s): |
| ADR—American Depositary Receipt |
| AUD—Australia Dollar |
| EUR—Euro |
| FHLMC—Federal Home Loan Mortgage Corp. |
| FNMA—Federal National Mortgage Association |
| FTSE—Financial Times Stock Exchange |
| GBP—British Pound Sterling |
| GDR—Global Depositary Receipt |
| GNMA—Government National Mortgage Association |
| JPY—Japanese Yen |
| REIT—Real Estate Investment Trust |
| REMIC—Real Estate Mortgage Investment Conduit |
| SOFR—Secured Overnight Financing Rate |
| STACR—Structured Agency Credit Risk |
| UMBS—Uniform Mortgage Backed Securities |
| USD—United States Dollar |
The notes to the financial statements are an integral part of, and should be read in conjunction with, the financial statements.
| 30 | MainStay Income Builder Fund |
The following is a summary of the fair valuations according to the inputs used as of October 31, 2023, for valuing the Fund’s assets and liabilities:
| Description | Quoted
Prices in
Active
Markets for
Identical
Assets
(Level 1) | | Significant
Other
Observable
Inputs
(Level 2) | | Significant
Unobservable
Inputs
(Level 3) | | Total |
| Asset Valuation Inputs | | | | | | | |
| Investments in Securities (a) | | | | | | | |
| Long-Term Bonds | | | | | | | |
| Asset-Backed Securities | $ — | | $ 34,432,745 | | $ — | | $ 34,432,745 |
| Corporate Bonds | — | | 165,799,548 | | — | | 165,799,548 |
| Foreign Government Bonds | — | | 3,123,812 | | — | | 3,123,812 |
| Loan Assignments | — | | 1,068,151 | | — | | 1,068,151 |
| Mortgage-Backed Securities | — | | 158,511,524 | | — | | 158,511,524 |
| Municipal Bond | — | | 1,079,864 | | — | | 1,079,864 |
| U.S. Government & Federal Agencies | — | | 34,501,503 | | — | | 34,501,503 |
| Total Long-Term Bonds | — | | 398,517,147 | | — | | 398,517,147 |
| Common Stocks | 553,010,567 | | — | | — | | 553,010,567 |
| Short-Term Investments | | | | | | | |
| Affiliated Investment Company | 1,560,327 | | — | | — | | 1,560,327 |
| Unaffiliated Investment Company | 24,125 | | — | | — | | 24,125 |
| Total Short-Term Investments | 1,584,452 | | — | | — | | 1,584,452 |
| Total Investments in Securities | 554,595,019 | | 398,517,147 | | — | | 953,112,166 |
| Other Financial Instruments (b) | | | | | | | |
| Foreign Currency Forward Contracts | — | | 424,169 | | — | | 424,169 |
| Futures Contracts | 2,686,551 | | — | | — | | 2,686,551 |
| Total Other Financial Instruments | 2,686,551 | | 424,169 | | — | | 3,110,720 |
| Total Investments in Securities and Other Financial Instruments | $ 557,281,570 | | $ 398,941,316 | | $ — | | $ 956,222,886 |
| Liability Valuation Inputs | | | | | | | |
| Other Financial Instruments (b) | | | | | | | |
| Foreign Currency Forward Contracts | $ — | | $ (5,548,520) | | $ — | | $ (5,548,520) |
| Futures Contracts | (15,468,481) | | — | | — | | (15,468,481) |
| Total Other Financial Instruments | $ (15,468,481) | | $ (5,548,520) | | $ — | | $ (21,017,001) |
| (a) | For a complete listing of investments and their industries, see the Portfolio of Investments. |
| (b) | The value listed for these securities reflects unrealized appreciation (depreciation) as shown on the Portfolio of Investments. |
The notes to the financial statements are an integral part of, and should be read in conjunction with, the financial statements.
31
Statement of Assets and Liabilities as of October 31, 2023
| Assets |
Investment in unaffiliated securities, at value
(identified cost $911,846,641) including securities on loan of $23,376 | $ 951,551,839 |
Investment in affiliated investment companies, at value
(identified cost $1,560,327) | 1,560,327 |
Cash denominated in foreign currencies
(identified cost $9,432) | 9,442 |
| Cash collateral on deposit at broker for futures contracts | 15,395,059 |
| Receivables: | |
| Dividends and interest | 4,911,097 |
| Investment securities sold | 2,556,617 |
| Variation margin on futures contracts | 1,869,799 |
| Fund shares sold | 180,534 |
| Securities lending | 2,343 |
| Unrealized appreciation on foreign currency forward contracts | 424,169 |
| Other assets | 104,387 |
| Total assets | 978,565,613 |
| Liabilities |
| Cash collateral received for securities on loan | 24,125 |
| Due to custodian | 348,139 |
| Payables: | |
| Investment securities purchased | 1,239,292 |
| Fund shares redeemed | 1,134,143 |
| Manager (See Note 3) | 534,052 |
| Transfer agent (See Note 3) | 249,724 |
| NYLIFE Distributors (See Note 3) | 190,540 |
| Shareholder communication | 111,327 |
| Custodian | 36,565 |
| Professional fees | 29,931 |
| Trustees | 180 |
| Accrued expenses | 1,056 |
| Distributions payable | 108,452 |
| Unrealized depreciation on foreign currency forward contracts | 5,548,520 |
| Total liabilities | 9,556,046 |
| Net assets | $ 969,009,567 |
| Composition of Net Assets |
| Shares of beneficial interest outstanding (par value of $.01 per share) unlimited number of shares authorized | $ 575,837 |
| Additional paid-in-capital | 1,076,818,988 |
| | 1,077,394,825 |
| Total distributable earnings (loss) | (108,385,258) |
| Net assets | $ 969,009,567 |
| Class A | |
| Net assets applicable to outstanding shares | $595,904,569 |
| Shares of beneficial interest outstanding | 35,539,723 |
| Net asset value per share outstanding | $ 16.77 |
| Maximum sales charge (3.00% of offering price) | 0.52 |
| Maximum offering price per share outstanding | $ 17.29 |
| Investor Class | |
| Net assets applicable to outstanding shares | $ 56,414,755 |
| Shares of beneficial interest outstanding | 3,361,066 |
| Net asset value per share outstanding | $ 16.78 |
| Maximum sales charge (2.50% of offering price) | 0.43 |
| Maximum offering price per share outstanding | $ 17.21 |
| Class B | |
| Net assets applicable to outstanding shares | $ 4,227,390 |
| Shares of beneficial interest outstanding | 249,862 |
| Net asset value and offering price per share outstanding | $ 16.92 |
| Class C | |
| Net assets applicable to outstanding shares | $ 49,577,402 |
| Shares of beneficial interest outstanding | 2,936,653 |
| Net asset value and offering price per share outstanding | $ 16.88 |
| Class I | |
| Net assets applicable to outstanding shares | $255,676,533 |
| Shares of beneficial interest outstanding | 15,069,157 |
| Net asset value and offering price per share outstanding | $ 16.97 |
| Class R2 | |
| Net assets applicable to outstanding shares | $ 884,109 |
| Shares of beneficial interest outstanding | 52,708 |
| Net asset value and offering price per share outstanding | $ 16.77 |
| Class R3 | |
| Net assets applicable to outstanding shares | $ 2,482,402 |
| Shares of beneficial interest outstanding | 148,075 |
| Net asset value and offering price per share outstanding | $ 16.76 |
| Class R6 | |
| Net assets applicable to outstanding shares | $ 3,806,612 |
| Shares of beneficial interest outstanding | 224,299 |
| Net asset value and offering price per share outstanding | $ 16.97 |
| SIMPLE Class | |
| Net assets applicable to outstanding shares | $ 35,795 |
| Shares of beneficial interest outstanding | 2,133 |
| Net asset value and offering price per share outstanding | $ 16.78 |
The notes to the financial statements are an integral part of, and should be read in conjunction with, the financial statements.
| 32 | MainStay Income Builder Fund |
Statement of Operations for the year ended October 31, 2023
| Investment Income (Loss) |
| Income | |
| Interest | $ 22,898,156 |
| Dividends-unaffiliated (net of foreign tax withholding of $997,667) | 21,345,962 |
| Dividends-affiliated | 476,182 |
| Securities lending, net | 154,093 |
| Total income | 44,874,393 |
| Expenses | |
| Manager (See Note 3) | 7,050,575 |
| Distribution/Service—Class A (See Note 3) | 1,657,033 |
| Distribution/Service—Investor Class (See Note 3) | 154,887 |
| Distribution/Service—Class B (See Note 3) | 65,861 |
| Distribution/Service—Class C (See Note 3) | 665,448 |
| Distribution/Service—Class R2 (See Note 3) | 3,216 |
| Distribution/Service—Class R3 (See Note 3) | 12,189 |
| Distribution/Service—SIMPLE Class (See Note 3) | 179 |
| Transfer agent (See Note 3) | 1,480,092 |
| Professional fees | 172,262 |
| Registration | 143,270 |
| Custodian | 127,123 |
| Shareholder communication | 35,961 |
| Trustees | 28,932 |
| Shareholder service (See Note 3) | 3,725 |
| Miscellaneous | 47,929 |
| Total expenses before waiver/reimbursement | 11,648,682 |
| Expense waiver/reimbursement from Manager (See Note 3) | (16,438) |
| Reimbursement from prior custodian(a) | (2,293) |
| Net expenses | 11,629,951 |
| Net investment income (loss) | 33,244,442 |
| Realized and Unrealized Gain (Loss) |
| Net realized gain (loss) on: | |
| Unaffiliated investment transactions | (25,520,313) |
| Futures transactions | (8,928,968) |
| Foreign currency transactions | (607,514) |
| Foreign currency forward transactions | (4,068,368) |
| Net realized gain (loss) | (39,125,163) |
| Net change in unrealized appreciation (depreciation) on: | |
| Unaffiliated investments | 52,283,975 |
| Futures contracts | (12,214,433) |
| Foreign currency forward contracts | (3,029,184) |
| Translation of other assets and liabilities in foreign currencies | (472,804) |
| Net change in unrealized appreciation (depreciation) | 36,567,554 |
| Net realized and unrealized gain (loss) | (2,557,609) |
| Net increase (decrease) in net assets resulting from operations | $ 30,686,833 |
| (a) | Represents a refund for overbilling of custody fees. |
The notes to the financial statements are an integral part of, and should be read in conjunction with, the financial statements.
33
Statements of Changes in Net Assets
for the years ended October 31, 2023 and October 31, 2022
| | 2023 | 2022 |
| Increase (Decrease) in Net Assets |
| Operations: | | |
| Net investment income (loss) | $ 33,244,442 | $ 33,092,042 |
| Net realized gain (loss) | (39,125,163) | (82,264,026) |
| Net change in unrealized appreciation (depreciation) | 36,567,554 | (202,526,363) |
| Net increase (decrease) in net assets resulting from operations | 30,686,833 | (251,698,347) |
| Distributions to shareholders: | | |
| Class A | (18,746,549) | (59,730,525) |
| Investor Class | (1,598,498) | (5,452,199) |
| Class B | (118,720) | (979,036) |
| Class C | (1,191,343) | (8,023,824) |
| Class I | (9,267,066) | (35,876,071) |
| Class R2 | (32,710) | (207,016) |
| Class R3 | (60,772) | (151,022) |
| Class R6 | (389,844) | (8,154,514) |
| SIMPLE Class | (900) | (2,491) |
| | (31,406,402) | (118,576,698) |
| Distributions to shareholders from return of capital: | | |
| Class A | — | (465,612) |
| Investor Class | — | (42,501) |
| Class B | — | (7,632) |
| Class C | — | (62,547) |
| Class I | — | (279,661) |
| Class R2 | — | (1,614) |
| Class R3 | — | (1,177) |
| Class R6 | — | (63,566) |
| SIMPLE Class | — | (19) |
| | — | (924,329) |
| Total distributions to shareholders | (31,406,402) | (119,501,027) |
| Capital share transactions: | | |
| Net proceeds from sales of shares | 86,579,835 | 167,690,377 |
| Net asset value of shares issued to shareholders in reinvestment of distributions | 29,119,425 | 110,787,284 |
| Cost of shares redeemed | (390,559,146) | (328,996,310) |
| Increase (decrease) in net assets derived from capital share transactions | (274,859,886) | (50,518,649) |
| Net increase (decrease) in net assets | (275,579,455) | (421,718,023) |
| Net Assets |
| Beginning of year | 1,244,589,022 | 1,666,307,045 |
| End of year | $ 969,009,567 | $1,244,589,022 |
The notes to the financial statements are an integral part of, and should be read in conjunction with, the financial statements.
| 34 | MainStay Income Builder Fund |
Financial Highlights selected per share data and ratios
| | Year Ended October 31, |
| Class A | 2023 | | 2022 | | 2021 | | 2020 | | 2019 |
| Net asset value at beginning of year | $ 16.97 | | $ 21.75 | | $ 18.61 | | $ 19.96 | | $ 18.51 |
| Net investment income (loss) (a) | 0.53 | | 0.42 | | 0.43 | | 0.44 | | 0.54 |
| Net realized and unrealized gain (loss) | (0.23) | | (3.63) | | 3.22 | | (0.61) | | 1.79 |
| Total from investment operations | 0.30 | | (3.21) | | 3.65 | | (0.17) | | 2.33 |
| Less distributions: | | | | | | | | | |
| From net investment income | (0.50) | | (0.42) | | (0.51) | | (0.42) | | (0.56) |
| From net realized gain on investments | — | | (1.14) | | — | | (0.76) | | (0.32) |
| Return of capital | — | | (0.01) | | — | | — | | — |
| Total distributions | (0.50) | | (1.57) | | (0.51) | | (1.18) | | (0.88) |
| Net asset value at end of year | $ 16.77 | | $ 16.97 | | $ 21.75 | | $ 18.61 | | $ 19.96 |
| Total investment return (b) | 1.66% | | (15.75)% | | 19.74% | | (0.90)% | | 13.09% |
| Ratios (to average net assets)/Supplemental Data: | | | | | | | | | |
| Net investment income (loss) | 2.96% | | 2.24% | | 2.04% | | 2.32% | | 2.83% |
| Net expenses (c) | 1.03% | | 1.02% | | 0.99% | | 1.02% | | 1.02% |
| Portfolio turnover rate | 56% | | 61% | | 57%(d) | | 65%(d) | | 62%(d) |
| Net assets at end of year (in 000’s) | $ 595,905 | | $ 664,734 | | $ 818,764 | | $ 638,250 | | $ 625,049 |
| (a) | Per share data based on average shares outstanding during the year. |
| (b) | Total investment return is calculated exclusive of sales charges and assumes the reinvestment of dividends and distributions. For periods of less than one year, total return is not annualized. |
| (c) | In addition to the fees and expenses which the Fund bears directly, it also indirectly bears a pro-rata share of the fees and expenses of the underlying funds in which it invests. Such indirect expenses are not included in the above expense ratios. |
| (d) | The portfolio turnover rates not including mortgage dollar rolls were 56%, 62%, and 54% for the years ended October 31, 2021, 2020 and 2019, respectively. |
| | Year Ended October 31, |
| Investor Class | 2023 | | 2022 | | 2021 | | 2020 | | 2019 |
| Net asset value at beginning of year | $ 16.99 | | $ 21.77 | | $ 18.62 | | $ 19.98 | | $ 18.52 |
| Net investment income (loss) (a) | 0.48 | | 0.39 | | 0.40 | | 0.41 | | 0.51 |
| Net realized and unrealized gain (loss) | (0.23) | | (3.63) | | 3.22 | | (0.62) | | 1.80 |
| Total from investment operations | 0.25 | | (3.24) | | 3.62 | | (0.21) | | 2.31 |
| Less distributions: | | | | | | | | | |
| From net investment income | (0.46) | | (0.39) | | (0.47) | | (0.39) | | (0.53) |
| From net realized gain on investments | — | | (1.14) | | — | | (0.76) | | (0.32) |
| Return of capital | — | | (0.01) | | — | | — | | — |
| Total distributions | (0.46) | | (1.54) | | (0.47) | | (1.15) | | (0.85) |
| Net asset value at end of year | $ 16.78 | | $ 16.99 | | $ 21.77 | | $ 18.62 | | $ 19.98 |
| Total investment return (b) | 1.35% | | (15.89)% | | 19.56% | | (1.11)% | | 12.98% |
| Ratios (to average net assets)/Supplemental Data: | | | | | | | | | |
| Net investment income (loss) | 2.72% | | 2.05% | | 1.88% | | 2.16% | | 2.70% |
| Net expenses (c) | 1.28% | | 1.20% | | 1.18% | | 1.17% | | 1.16% |
| Expenses (before waiver/reimbursement) (c) | 1.29% | | 1.20% | | 1.18% | | 1.17% | | 1.17% |
| Portfolio turnover rate | 56% | | 61% | | 57%(d) | | 65%(d) | | 62%(d) |
| Net assets at end of year (in 000's) | $ 56,415 | | $ 60,808 | | $ 77,887 | | $ 79,992 | | $ 88,050 |
| (a) | Per share data based on average shares outstanding during the year. |
| (b) | Total investment return is calculated exclusive of sales charges and assumes the reinvestment of dividends and distributions. For periods of less than one year, total return is not annualized. |
| (c) | In addition to the fees and expenses which the Fund bears directly, it also indirectly bears a pro-rata share of the fees and expenses of the underlying funds in which it invests. Such indirect expenses are not included in the above expense ratios. |
| (d) | The portfolio turnover rates not including mortgage dollar rolls were 56%, 62%, and 54% for the years ended October 31, 2021, 2020 and 2019, respectively. |
The notes to the financial statements are an integral part of, and should be read in conjunction with, the financial statements.
35
Financial Highlights selected per share data and ratios
| | Year Ended October 31, |
| Class B | 2023 | | 2022 | | 2021 | | 2020 | | 2019 |
| Net asset value at beginning of year | $ 17.12 | | $ 21.93 | | $ 18.75 | | $ 20.11 | | $ 18.64 |
| Net investment income (loss) (a) | 0.36 | | 0.25 | | 0.24 | | 0.27 | | 0.37 |
| Net realized and unrealized gain (loss) | (0.24) | | (3.67) | | 3.25 | | (0.62) | | 1.81 |
| Total from investment operations | 0.12 | | (3.42) | | 3.49 | | (0.35) | | 2.18 |
| Less distributions: | | | | | | | | | |
| From net investment income | (0.32) | | (0.24) | | (0.31) | | (0.25) | | (0.39) |
| From net realized gain on investments | — | | (1.14) | | — | | (0.76) | | (0.32) |
| Return of capital | — | | (0.01) | | — | | — | | — |
| Total distributions | (0.32) | | (1.39) | | (0.31) | | (1.01) | | (0.71) |
| Net asset value at end of year | $ 16.92 | | $ 17.12 | | $ 21.93 | | $ 18.75 | | $ 20.11 |
| Total investment return (b) | 0.63% | | (16.56)% | | 18.69% | | (1.84)% | | 12.11% |
| Ratios (to average net assets)/Supplemental Data: | | | | | | | | | |
| Net investment income (loss) | 1.98% | | 1.28% | | 1.13% | | 1.42% | | 1.96% |
| Net expenses (c) | 2.03% | | 1.95% | | 1.93% | | 1.92% | | 1.91% |
| Expenses (before waiver/reimbursement) (c) | 2.04% | | 1.95% | | 1.93% | | 1.92% | | 1.92% |
| Portfolio turnover rate | 56% | | 61% | | 57%(d) | | 65%(d) | | 62%(d) |
| Net assets at end of year (in 000’s) | $ 4,227 | | $ 8,591 | | $ 16,789 | | $ 19,409 | | $ 26,396 |
| (a) | Per share data based on average shares outstanding during the year. |
| (b) | Total investment return is calculated exclusive of sales charges and assumes the reinvestment of dividends and distributions. For periods of less than one year, total return is not annualized. |
| (c) | In addition to the fees and expenses which the Fund bears directly, it also indirectly bears a pro-rata share of the fees and expenses of the underlying funds in which it invests. Such indirect expenses are not included in the above expense ratios. |
| (d) | The portfolio turnover rates not including mortgage dollar rolls were 56%, 62%, and 54% for the years ended October 31, 2021, 2020 and 2019, respectively. |
| | Year Ended October 31, |
| Class C | 2023 | | 2022 | | 2021 | | 2020 | | 2019 |
| Net asset value at beginning of year | $ 17.08 | | $ 21.88 | | $ 18.71 | | $ 20.07 | | $ 18.60 |
| Net investment income (loss) (a) | 0.35 | | 0.25 | | 0.24 | | 0.27 | | 0.37 |
| Net realized and unrealized gain (loss) | (0.23) | | (3.66) | | 3.24 | | (0.62) | | 1.81 |
| Total from investment operations | 0.12 | | (3.41) | | 3.48 | | (0.35) | | 2.18 |
| Less distributions: | | | | | | | | | |
| From net investment income | (0.32) | | (0.24) | | (0.31) | | (0.25) | | (0.39) |
| From net realized gain on investments | — | | (1.14) | | — | | (0.76) | | (0.32) |
| Return of capital | — | | (0.01) | | — | | — | | — |
| Total distributions | (0.32) | | (1.39) | | (0.31) | | (1.01) | | (0.71) |
| Net asset value at end of year | $ 16.88 | | $ 17.08 | | $ 21.88 | | $ 18.71 | | $ 20.07 |
| Total investment return (b) | 0.63% | | (16.55)% | | 18.68% | | (1.85)% | | 12.13% |
| Ratios (to average net assets)/Supplemental Data: | | | | | | | | | |
| Net investment income (loss) | 1.98% | | 1.29% | | 1.13% | | 1.42% | | 1.95% |
| Net expenses (c) | 2.03% | | 1.95% | | 1.93% | | 1.92% | | 1.91% |
| Expenses (before waiver/reimbursement) (c) | 2.04% | | 1.95% | | 1.93% | | 1.92% | | 1.92% |
| Portfolio turnover rate | 56% | | 61% | | 57%(d) | | 65%(d) | | 62%(d) |
| Net assets at end of year (in 000’s) | $ 49,577 | | $ 76,894 | | $ 132,596 | | $ 148,220 | | $ 191,737 |
| (a) | Per share data based on average shares outstanding during the year. |
| (b) | Total investment return is calculated exclusive of sales charges and assumes the reinvestment of dividends and distributions. For periods of less than one year, total return is not annualized. |
| (c) | In addition to the fees and expenses which the Fund bears directly, it also indirectly bears a pro-rata share of the fees and expenses of the underlying funds in which it invests. Such indirect expenses are not included in the above expense ratios. |
| (d) | The portfolio turnover rates not including mortgage dollar rolls were 56%, 62%, and 54% for the years ended October 31, 2021, 2020 and 2019, respectively. |
The notes to the financial statements are an integral part of, and should be read in conjunction with, the financial statements.
| 36 | MainStay Income Builder Fund |
Financial Highlights selected per share data and ratios
| | Year Ended October 31, |
| Class I | 2023 | | 2022 | | 2021 | | 2020 | | 2019 |
| Net asset value at beginning of year | $ 17.17 | | $ 21.99 | | $ 18.80 | | $ 20.16 | | $ 18.68 |
| Net investment income (loss) (a) | 0.58 | | 0.48 | | 0.49 | | 0.49 | | 0.59 |
| Net realized and unrealized gain (loss) | (0.23) | | (3.68) | | 3.26 | | (0.62) | | 1.82 |
| Total from investment operations | 0.35 | | (3.20) | | 3.75 | | (0.13) | | 2.41 |
| Less distributions: | | | | | | | | | |
| From net investment income | (0.55) | | (0.47) | | (0.56) | | (0.47) | | (0.61) |
| From net realized gain on investments | — | | (1.14) | | — | | (0.76) | | (0.32) |
| Return of capital | — | | (0.01) | | — | | — | | — |
| Total distributions | (0.55) | | (1.62) | | (0.56) | | (1.23) | | (0.93) |
| Net asset value at end of year | $ 16.97 | | $ 17.17 | | $ 21.99 | | $ 18.80 | | $ 20.16 |
| Total investment return (b) | 1.89% | | (15.55)% | | 20.10% | | (0.69)% | | 13.41% |
| Ratios (to average net assets)/Supplemental Data: | | | | | | | | | |
| Net investment income (loss) | 3.22% | | 2.48% | | 2.30% | | 2.57% | | 3.09% |
| Net expenses (c) | 0.78% | | 0.77% | | 0.74% | | 0.77% | | 0.77% |
| Portfolio turnover rate | 56% | | 61% | | 57%(d) | | 65%(d) | | 62%(d) |
| Net assets at end of year (in 000’s) | $ 255,677 | | $ 339,868 | | $ 505,806 | | $ 448,922 | | $ 484,614 |
| (a) | Per share data based on average shares outstanding during the year. |
| (b) | Total investment return is calculated exclusive of sales charges and assumes the reinvestment of dividends and distributions. Class I shares are not subject to sales charges. For periods of less than one year, total return is not annualized. |
| (c) | In addition to the fees and expenses which the Fund bears directly, it also indirectly bears a pro-rata share of the fees and expenses of the underlying funds in which it invests. Such indirect expenses are not included in the above expense ratios. |
| (d) | The portfolio turnover rates not including mortgage dollar rolls were 56%, 62%, and 54% for the years ended October 31, 2021, 2020 and 2019, respectively. |
| | Year Ended October 31, |
| Class R2 | 2023 | | 2022 | | 2021 | | 2020 | | 2019 |
| Net asset value at beginning of year | $ 16.97 | | $ 21.75 | | $ 18.61 | | $ 19.95 | | $ 18.50 |
| Net investment income (loss) (a) | 0.51 | | 0.41 | | 0.41 | | 0.42 | | 0.52 |
| Net realized and unrealized gain (loss) | (0.23) | | (3.64) | | 3.22 | | (0.59) | | 1.79 |
| Total from investment operations | 0.28 | | (3.23) | | 3.63 | | (0.17) | | 2.31 |
| Less distributions: | | | | | | | | | |
| From net investment income | (0.48) | | (0.40) | | (0.49) | | (0.41) | | (0.54) |
| From net realized gain on investments | — | | (1.14) | | — | | (0.76) | | (0.32) |
| Return of capital | — | | (0.01) | | — | | — | | — |
| Total distributions | (0.48) | | (1.55) | | (0.49) | | (1.17) | | (0.86) |
| Net asset value at end of year | $ 16.77 | | $ 16.97 | | $ 21.75 | | $ 18.61 | | $ 19.95 |
| Total investment return (b) | 1.52% | | (15.84)% | | 19.68% | | (1.00)% | | 12.98% |
| Ratios (to average net assets)/Supplemental Data: | | | | | | | | | |
| Net investment income (loss) | 2.84% | | 2.15% | | 1.96% | | 2.21% | | 2.77% |
| Net expenses (c) | 1.13% | | 1.12% | | 1.09% | | 1.11% | | 1.12% |
| Portfolio turnover rate | 56% | | 61% | | 57%(d) | | 65%(d) | | 62%(d) |
| Net assets at end of year (in 000’s) | $ 884 | | $ 1,713 | | $ 2,961 | | $ 3,044 | | $ 2,524 |
| (a) | Per share data based on average shares outstanding during the year. |
| (b) | Total investment return is calculated exclusive of sales charges and assumes the reinvestment of dividends and distributions. Class R2 shares are not subject to sales charges. For periods of less than one year, total return is not annualized. |
| (c) | In addition to the fees and expenses which the Fund bears directly, it also indirectly bears a pro-rata share of the fees and expenses of the underlying funds in which it invests. Such indirect expenses are not included in the above expense ratios. |
| (d) | The portfolio turnover rates not including mortgage dollar rolls were 56%, 62%, and 54% for the years ended October 31, 2021, 2020 and 2019, respectively. |
The notes to the financial statements are an integral part of, and should be read in conjunction with, the financial statements.
37
Financial Highlights selected per share data and ratios
| | Year Ended October 31, |
| Class R3 | 2023 | | 2022 | | 2021 | | 2020 | | 2019 |
| Net asset value at beginning of year | $ 16.97 | | $ 21.75 | | $ 18.61 | | $ 19.96 | | $ 18.51 |
| Net investment income (loss) (a) | 0.46 | | 0.36 | | 0.36 | | 0.37 | | 0.45 |
| Net realized and unrealized gain (loss) | (0.23) | | (3.64) | | 3.22 | | (0.60) | | 1.82 |
| Total from investment operations | 0.23 | | (3.28) | | 3.58 | | (0.23) | | 2.27 |
| Less distributions: | | | | | | | | | |
| From net investment income | (0.44) | | (0.35) | | (0.44) | | (0.36) | | (0.50) |
| From net realized gain on investments | — | | (1.14) | | — | | (0.76) | | (0.32) |
| Return of capital | — | | (0.01) | | — | | — | | — |
| Total distributions | (0.44) | | (1.50) | | (0.44) | | (1.12) | | (0.82) |
| Net asset value at end of year | $ 16.76 | | $ 16.97 | | $ 21.75 | | $ 18.61 | | $ 19.96 |
| Total investment return (b) | 1.25% | | (16.09)% | | 19.39% | | (1.24)% | | 12.70% |
| Ratios (to average net assets)/Supplemental Data: | | | | | | | | | |
| Net investment income (loss) | 2.60% | | 1.90% | | 1.70% | | 1.97% | | 2.34% |
| Net expenses (c) | 1.38% | | 1.37% | | 1.34% | | 1.37% | | 1.36% |
| Portfolio turnover rate | 56% | | 61% | | 57%(d) | | 65%(d) | | 62%(d) |
| Net assets at end of year (in 000’s) | $ 2,482 | | $ 2,255 | | $ 2,088 | | $ 1,196 | | $ 590 |
| (a) | Per share data based on average shares outstanding during the year. |
| (b) | Total investment return is calculated exclusive of sales charges and assumes the reinvestment of dividends and distributions. Class R3 shares are not subject to sales charges. For periods of less than one year, total return is not annualized. |
| (c) | In addition to the fees and expenses which the Fund bears directly, it also indirectly bears a pro-rata share of the fees and expenses of the underlying funds in which it invests. Such indirect expenses are not included in the above expense ratios. |
| (d) | The portfolio turnover rates not including mortgage dollar rolls were 56%, 62%, and 54% for the years ended October 31, 2021, 2020 and 2019, respectively. |
| | Year Ended October 31, |
| Class R6 | 2023 | | 2022 | | 2021 | | 2020 | | 2019 |
| Net asset value at beginning of year | $ 17.17 | | $ 21.99 | | $ 18.80 | | $ 20.16 | | $ 18.68 |
| Net investment income (loss) (a) | 0.58 | | 0.49 | | 0.51 | | 0.51 | | 0.61 |
| Net realized and unrealized gain (loss) | (0.22) | | (3.67) | | 3.26 | | (0.62) | | 1.82 |
| Total from investment operations | 0.36 | | (3.18) | | 3.77 | | (0.11) | | 2.43 |
| Less distributions: | | | | | | | | | |
| From net investment income | (0.56) | | (0.49) | | (0.58) | | (0.49) | | (0.63) |
| From net realized gain on investments | — | | (1.14) | | — | | (0.76) | | (0.32) |
| Return of capital | — | | (0.01) | | — | | — | | — |
| Total distributions | (0.56) | | (1.64) | | (0.58) | | (1.25) | | (0.95) |
| Net asset value at end of year | $ 16.97 | | $ 17.17 | | $ 21.99 | | $ 18.80 | | $ 20.16 |
| Total investment return (b) | 1.98% | | (15.48)% | | 20.20% | | (0.60)% | | 13.52% |
| Ratios (to average net assets)/Supplemental Data: | | | | | | | | | |
| Net investment income (loss) | 3.27% | | 2.57% | | 2.38% | | 2.67% | | 3.18% |
| Net expenses (c) | 0.69% | | 0.68% | | 0.66% | | 0.67% | | 0.67% |
| Portfolio turnover rate | 56% | | 61% | | 57%(d) | | 65%(d) | | 62%(d) |
| Net assets at end of year (in 000’s) | $ 3,807 | | $ 89,692 | | $ 109,387 | | $ 91,551 | | $ 101,685 |
| (a) | Per share data based on average shares outstanding during the year. |
| (b) | Total investment return is calculated exclusive of sales charges and assumes the reinvestment of dividends and distributions. Class R6 shares are not subject to sales charges. For periods of less than one year, total return is not annualized. |
| (c) | In addition to the fees and expenses which the Fund bears directly, it also indirectly bears a pro-rata share of the fees and expenses of the underlying funds in which it invests. Such indirect expenses are not included in the above expense ratios. |
| (d) | The portfolio turnover rates not including mortgage dollar rolls were 56%, 62%, and 54% for the years ended October 31, 2021, 2020 and 2019, respectively. |
The notes to the financial statements are an integral part of, and should be read in conjunction with, the financial statements.
| 38 | MainStay Income Builder Fund |
Financial Highlights selected per share data and ratios
| | Year Ended October 31, | | August 31, 2020^ through
October 31, |
| SIMPLE Class | 2023 | | 2022 | | 2021 | | 2020 |
| Net asset value at beginning of period | $ 16.99 | | $ 21.78 | | $ 18.62 | | $ 19.33 |
| Net investment income (loss) (a) | 0.47 | | 0.20 | | 0.34 | | 0.04 |
| Net realized and unrealized gain (loss) | (0.23) | | (3.50) | | 3.24 | | (0.69) |
| Total from investment operations | 0.24 | | (3.30) | | 3.58 | | (0.65) |
| Less distributions: | | | | | | | |
| From net investment income | (0.45) | | (0.34) | | (0.42) | | (0.06) |
| From net realized gain on investments | — | | (1.14) | | — | | — |
| Return of capital | — | | (0.01) | | — | | — |
| Total distributions | (0.45) | | (1.49) | | (0.42) | | (0.06) |
| Net asset value at end of period | $ 16.78 | | $ 16.99 | | $ 21.78 | | $ 18.62 |
| Total investment return (b) | 1.31% | | (16.10)% | | 19.26% | | (3.39)% |
| Ratios (to average net assets)/Supplemental Data: | | | | | | | |
| Net investment income (loss) | 2.65% | | 1.06% | | 1.61% | | 1.62%†† |
| Net expenses (c) | 1.32% | | 1.45% | | 1.43% | | 1.43%†† |
| Portfolio turnover rate | 56% | | 61% | | 57%(d) | | 65%(d) |
| Net assets at end of period (in 000’s) | $ 36 | | $ 34 | | $ 29 | | $ 24 |
| ^ | Inception date. |
| †† | Annualized. |
| (a) | Per share data based on average shares outstanding during the period. |
| (b) | Total investment return is calculated exclusive of sales charges and assumes the reinvestment of dividends and distributions. SIMPLE Class shares are not subject to sales charges. For periods of less than one year, total return is not annualized. |
| (c) | In addition to the fees and expenses which the Fund bears directly, it also indirectly bears a pro-rata share of the fees and expenses of the underlying funds in which it invests. Such indirect expenses are not included in the above expense ratios. |
| (d) | The portfolio turnover rates not including mortgage dollar rolls were 56% and 62% for the years ended October 31, 2021 and 2020 respectively. |
The notes to the financial statements are an integral part of, and should be read in conjunction with, the financial statements.
39
Notes to Financial Statements
Note 1-Organization and Business
The MainStay Funds (the “Trust”) was organized on January 9, 1986, as a Massachusetts business trust. The Trust is registered under the Investment Company Act of 1940, as amended (the “1940 Act”), as an open-end management investment company, and is comprised of eleven funds (collectively referred to as the "Funds"). These financial statements and notes relate to the MainStay Income Builder Fund (the "Fund"), a “diversified” fund, as that term is defined in the 1940 Act, as interpreted or modified by regulatory authorities having jurisdiction, from time to time.
The following table lists the Fund's share classes that have been registered and commenced operations:
| Class | Commenced Operations |
| Class A | January 3, 1995 |
| Investor Class | February 28, 2008 |
| Class B | December 29, 1987 |
| Class C | September 1, 1998 |
| Class I | January 2, 2004 |
| Class R2* | February 27, 2015 |
| Class R3* | February 29, 2016 |
| Class R6 | February 28, 2018 |
| SIMPLE Class | August 31, 2020 |
| * | As of October 31, 2023, Class R2 and Class R3 shares are closed to new investors and, upon the close of business on December 29, 2023, Class R2 and Class R3 shares are closed to additional investments by existing shareholders. Additionally, Class R2 and Class R3 shares will be liquidated on or about February 28, 2024 (the "Liquidation Date"). It is expected that the Fund will distribute to remaining shareholders invested in Class R2 or Class R3 shares, on or promptly after the Liquidation Date, a liquidating distribution in cash or cash equivalents equal to the net asset value of such shares. |
Class B shares of the MainStay Group of Funds are closed to all new purchases as well as additional investments by existing Class B shareholders. Existing Class B shareholders may continue to reinvest dividends and capital gains distributions, as well as exchange their Class B shares for Class B shares of other funds in the MainStay Group of Funds as permitted by the current exchange privileges. Class B shareholders continue to be subject to any applicable contingent deferred sales charge ("CDSC") at the time of redemption. All other features of the Class B shares, including but not limited to the fees and expenses applicable to Class B shares, remain unchanged. Unless redeemed, Class B shareholders will remain in Class B shares of their respective fund until the Class B shares are converted to Class A or Investor Class shares pursuant to the applicable conversion schedule.
Class A and Investor Class shares are offered at net asset value (“NAV”) per share plus an initial sales charge. No initial sales charge applies to investments of $250,000 or more (and certain other qualified purchases) in Class A and Investor Class shares. However, a CDSC of 1.00% may be imposed on certain redemptions made within 18 months of the date of purchase on shares that were purchased without an initial sales charge. Class C shares are offered at NAV without an initial sales charge, although a 1.00% CDSC may be imposed on certain redemptions of such
shares made within one year of the date of purchase of Class C shares. When Class B shares were offered, they were offered at NAV without an initial sales charge, although a CDSC that declines depending on the number of years a shareholder has held its Class B shares may be imposed on certain redemptions of such shares made within six years of the date of purchase of such shares. Class I, Class R2, Class R3, Class R6 and SIMPLE Class shares are offered at NAV without a sales charge. Depending upon eligibility, Class B shares convert to either Class A or Investor Class shares at the end of the calendar quarter eight years after the date they were purchased. In addition, depending upon eligibility, Class C shares convert to either Class A or Investor Class shares at the end of the calendar quarter eight years after the date they were purchased. Additionally, Investor Class shares may convert automatically to Class A shares. SIMPLE Class shares convert to Class A shares, or Investor Class shares if you are not eligible to hold Class A shares, at the end of the calendar quarter, ten years after the date they were purchased. Share class conversions are based on the relevant NAVs of the two classes at the time of the conversion, and no sales load or other charge is imposed. Under certain circumstances and as may be permitted by the Trust’s multiple class plan pursuant to Rule 18f-3 under the 1940 Act, specified share classes of the Fund may be converted to one or more other share classes of the Fund as disclosed in the capital share transactions within these Notes. The classes of shares have the same voting (except for issues that relate solely to one class), dividend, liquidation and other rights, and the same terms and conditions, except that under distribution plans pursuant to Rule 12b-1 under the 1940 Act, Class B and Class C shares are subject to higher distribution and/or service fees than Class A, Investor Class, Class R2, Class R3 and SIMPLE Class shares. Class I and Class R6 shares are not subject to a distribution and/or service fee. Class R2 and Class R3 shares are subject to a shareholder service fee, which is in addition to fees paid under the distribution plans for Class R2 and Class R3 shares.
At a meeting held on September 25-26, 2023, the Board of Trustees (the “Board”) of the Trust, after careful consideration of a number of factors and upon the recommendation of the Fund's investment adviser, New York Life Investment Management LLC (“New York Life Investments” or the "Manager"), approved a proposal to liquidate Class R2 and Class R3 shares of the Fund on or about February 28, 2024, pursuant to the terms of a plan of liquidation.
The Fund's investment objective is to seek current income consistent with reasonable opportunity for future growth of capital and income.
Note 2–Significant Accounting Policies
The Fund is an investment company and accordingly follows the investment company accounting and reporting guidance of the Financial Accounting Standards Board (“FASB”) Accounting Standards Codification Topic 946 Financial Services—Investment Companies. The Fund prepares its financial statements in accordance with generally accepted accounting principles (“GAAP”) in the United States of America and follows the significant accounting policies described below.
| 40 | MainStay Income Builder Fund |
(A) Securities Valuation. Investments are usually valued as of the close of regular trading on the New York Stock Exchange (the "Exchange") (usually 4:00 p.m. Eastern time) on each day the Fund is open for business ("valuation date").
Pursuant to Rule 2a-5 under the 1940 Act, the Board has designated New York Life Investments as its Valuation Designee (the "Valuation Designee"). The Valuation Designee is responsible for performing fair valuations relating to all investments in the Fund’s portfolio for which market quotations are not readily available; periodically assessing and managing material valuation risks; establishing and applying fair value methodologies; testing fair valuation methodologies; evaluating and overseeing pricing services; ensuring appropriate segregation of valuation and portfolio management functions; providing quarterly, annual and prompt reporting to the Board, as appropriate; identifying potential conflicts of interest; and maintaining appropriate records. The Valuation Designee has established a valuation committee ("Valuation Committee") to assist in carrying out the Valuation Designee’s responsibilities and establish prices of securities for which market quotations are not readily available. The Fund's and the Valuation Designee's policies and procedures ("Valuation Procedures") govern the Valuation Designee’s selection and application of methodologies for determining and calculating the fair value of Fund investments. The Valuation Designee may value the Fund's portfolio securities for which market quotations are not readily available and other Fund assets utilizing inputs from pricing services and other third-party sources. The Valuation Committee meets (in person, via electronic mail or via teleconference) on an ad-hoc basis to determine fair valuations and on a quarterly basis to review fair value events with respect to certain securities for which market quotations are not readily available, including valuation risks and back-testing results, and preview reports to the Board.
The Valuation Committee establishes prices of securities for which market quotations are not readily available based on such methodologies and measurements on a regular basis after considering information that is reasonably available and deemed relevant by the Valuation Committee. The Board shall oversee the Valuation Designee and review fair valuation materials on a prompt, quarterly and annual basis and approve proposed revisions to the Valuation Procedures.
Investments for which market quotations are not readily available are valued at fair value as determined in good faith pursuant to the Valuation Procedures. A market quotation is readily available only when that quotation is a quoted price (unadjusted) in active markets for identical investments that the Fund can access at the measurement date, provided that a quotation will not be readily available if it is not reliable. "Fair value" is defined as the price the Fund would reasonably expect to receive upon selling an asset or liability in an orderly transaction to an independent buyer in the principal or most advantageous market for the asset or liability. Fair value measurements are determined within a framework that establishes a three-tier hierarchy that maximizes the use of observable market data and minimizes the use of unobservable inputs to establish a classification of fair value measurements for disclosure purposes.
"Inputs" refer broadly to the assumptions that market participants would use in pricing the asset or liability, including assumptions about risk, such as the risk inherent in a particular valuation technique used to measure fair value using a pricing model and/or the risk inherent in the inputs for the valuation technique. Inputs may be observable or unobservable. Observable inputs reflect the assumptions market participants would use in pricing the asset or liability based on market data obtained from sources independent of the Fund. Unobservable inputs reflect the Fund’s own assumptions about the assumptions market participants would use in pricing the asset or liability based on the information available. The inputs or methodology used for valuing assets or liabilities may not be an indication of the risks associated with investing in those assets or liabilities. The three-tier hierarchy of inputs is summarized below.
| • | Level 1—quoted prices (unadjusted) in active markets for an identical asset or liability |
| • | Level 2—other significant observable inputs (including quoted prices for a similar asset or liability in active markets, interest rates and yield curves, prepayment speeds, credit risk, etc.) |
| • | Level 3—significant unobservable inputs (including the Fund's own assumptions about the assumptions that market participants would use in measuring fair value of an asset or liability) |
The level of an asset or liability within the fair value hierarchy is based on the lowest level of an input, both individually and in the aggregate, that is significant to the fair value measurement. The aggregate value by input level of the Fund’s assets and liabilities as of October 31, 2023, is included at the end of the Portfolio of Investments.
The Fund may use third-party vendor evaluations, whose prices may be derived from one or more of the following standard inputs, among others:
| • Broker/dealer quotes | • Benchmark securities |
| • Two-sided markets | • Reference data (corporate actions or material event notices) |
| • Bids/offers | • Monthly payment information |
| • Industry and economic events | • Reported trades |
An asset or liability for which a market quotation is not readily available is valued by methods deemed reasonable in good faith by the Valuation Committee, following the Valuation Procedures to represent fair value. Under these procedures, the Valuation Designee generally uses a market-based approach which may use related or comparable assets or liabilities, recent transactions, market multiples, book values and other relevant information. The Valuation Designee may also use an income-based valuation approach in which the anticipated future cash flows of the asset or liability are discounted to calculate fair value. Discounts may also be applied due to the nature and/or duration of any restrictions on the disposition of the asset or liability. Fair value represents a good faith approximation of the value of a security. Fair value determinations involve the consideration of a number of subjective factors, an analysis of applicable facts and circumstances and the exercise of judgment. As a result, it is possible that the fair value for a
Notes to Financial Statements (continued)
security determined in good faith in accordance with the Valuation Procedures may differ from valuations for the same security determined for other funds using their own valuation procedures. Although the Valuation Procedures are designed to value a security at the price the Fund may reasonably expect to receive upon the security's sale in an orderly transaction, there can be no assurance that any fair value determination thereunder would, in fact, approximate the amount that the Fund would actually realize upon the sale of the security or the price at which the security would trade if a reliable market price were readily available. During the year ended October 31, 2023, there were no material changes to the fair value methodologies.
Securities which may be valued in this manner include, but are not limited to: (i) a security for which trading has been halted or suspended or otherwise does not have a readily available market quotation on a given day; (ii) a debt security that has recently gone into default and for which there is not a current market quotation; (iii) a security of an issuer that has entered into a restructuring; (iv) a security that has been delisted from a national exchange; (v) a security subject to trading collars for which no or limited trading takes place; and (vi) a security whose principal market has been temporarily closed at a time when, under normal conditions, it would be open. Securities valued in this manner are generally categorized as Level 2 or 3 in the hierarchy. As of October 31, 2023, securities that were fair valued in such a manner are shown in the Portfolio of Investments.
Certain securities held by the Fund may principally trade in foreign markets. Events may occur between the time the foreign markets close and the time at which the Fund's NAVs are calculated. These events may include, but are not limited to, situations relating to a single issuer in a market sector, significant fluctuations in U.S. or foreign markets, natural disasters, armed conflicts, governmental actions or other developments not tied directly to the securities markets. Should the Valuation Designee conclude that such events may have affected the accuracy of the last price of such securities reported on the local foreign market, the Valuation Designee may, pursuant to the Valuation Procedures, adjust the value of the local price to reflect the estimated impact on the price of such securities as a result of such events. In this instance, securities are generally categorized as Level 3 in the hierarchy. Additionally, certain foreign equity securities are also fair valued whenever the movement of a particular index exceeds certain thresholds. In such cases, the securities are fair valued by applying factors provided by a third-party vendor in accordance with the Valuation Procedures and are generally categorized as Level 2 in the hierarchy. No foreign equity securities held by the Fund as of October 31, 2023 were fair valued in such a manner.
Equity securities, rights and warrants, if applicable, are valued at the last quoted sales prices as of the close of regular trading on the relevant exchange on each valuation date. Securities that are not traded on the valuation date are valued at the mean of the last quoted bid and ask prices. Prices are normally taken from the principal market in which each security trades. These securities are generally categorized as Level 1 in the hierarchy.
Investments in mutual funds, including money market funds, are valued at their respective NAVs at the close of business each day on the valuation date. These securities are generally categorized as Level 1 in the hierarchy.
Futures contracts are valued at the last posted settlement price on the market where such futures are primarily traded. These securities are generally categorized as Level 1 in the hierarchy.
Municipal debt securities are valued at the evaluated mean prices supplied by a pricing agent or broker selected by the Valuation Designee, in consultation with the Subadvisor. The evaluations are market-based measurements processed through a pricing application and represents the pricing agent's good faith determination as to what a holder may receive in an orderly transaction under market conditions. The rules-based logic utilizes valuation techniques that reflect participants' assumptions and vary by asset class and per methodology, maximizing the use of relevant observable data including quoted prices for similar assets, benchmark yield curves and market corroborated inputs. The evaluated bid or mean prices are deemed by the Valuation Designee, in consultation with the Subadvisor, to be representative of market values, at the regular close of trading of the Exchange on each valuation date. Municipal debt securities purchased on a delayed delivery basis are marked to market daily until settlement at the forward settlement date. Municipal debt securities are generally categorized as Level 2 in the hierarchy.
Debt securities (other than convertible and municipal bonds) are valued at the evaluated bid prices (evaluated mean prices in the case of convertible and municipal bonds) supplied by a pricing agent or broker selected by the Valuation Designee, in consultation with the Subadvisors. The evaluations are market-based measurements processed through a pricing application and represents the pricing agent’s good faith determination as to what a holder may receive in an orderly transaction under market conditions. The rules-based logic utilizes valuation techniques that reflect participants’ assumptions and vary by asset class and per methodology, maximizing the use of relevant observable data including quoted prices for similar assets, benchmark yield curves and market corroborated inputs. The evaluated bid or mean prices are deemed by the Valuation Designee, in consultation with the Subadvisors, to be representative of market values at the regular close of trading of the Exchange on each valuation date. Debt securities purchased on a delayed delivery basis are marked to market daily until settlement at the forward settlement date. Debt securities, including corporate bonds, U.S. government and federal agency bonds, municipal bonds, foreign bonds, convertible bonds, asset-backed securities and mortgage-backed securities are generally categorized as Level 2 in the hierarchy.
Foreign currency forward contracts are valued at their fair market values measured on the basis of the mean between the last current bid and ask prices based on dealer or exchange quotations and are generally categorized as Level 2 in the hierarchy.
Loan assignments, participations and commitments are valued at the average of bid quotations obtained from the engaged independent pricing
| 42 | MainStay Income Builder Fund |
service and are generally categorized as Level 2 in the hierarchy. Certain loan assignments, participations and commitments may be valued by utilizing significant unobservable inputs obtained from the pricing service and are generally categorized as Level 3 in the hierarchy. No securities held by the Fund as of October 31, 2023 were fair valued utilizing significant unobservable inputs obtained from the pricing service.
Temporary cash investments acquired in excess of 60 days to maturity at the time of purchase are valued using the latest bid prices or using valuations based on a matrix system (which considers such factors as security prices, yields, maturities and ratings), both as furnished by independent pricing services. Temporary cash investments that mature in 60 days or less at the time of purchase ("Short-Term Investments") are valued using the amortized cost method of valuation, unless the use of such method would be inappropriate. The amortized cost method involves valuing a security at its cost on the date of purchase and thereafter assuming a constant amortization to maturity of the difference between such cost and the value on maturity date. Amortized cost approximates the current fair value of a security. Securities valued using the amortized cost method are not valued using quoted prices in an active market and are generally categorized as Level 2 in the hierarchy.
The information above is not intended to reflect an exhaustive list of the methodologies that may be used to value portfolio investments. The Valuation Procedures permit the use of a variety of valuation methodologies in connection with valuing portfolio investments. The methodology used for a specific type of investment may vary based on the market data available or other considerations. The methodologies summarized above may not represent the specific means by which portfolio investments are valued on any particular business day.
A portfolio investment may be classified as an illiquid investment under the Fund's written liquidity risk management program and related procedures (“Liquidity Program”). Illiquidity of an investment might prevent the sale of such investment at a time when the Manager or the Subadvisors might wish to sell, and these investments could have the effect of decreasing the overall level of the Fund's liquidity. Further, the lack of an established secondary market may make it more difficult to value illiquid investments, requiring the Fund to rely on judgments that may be somewhat subjective in measuring value, which could vary materially from the amount that the Fund could realize upon disposition. Difficulty in selling illiquid investments may result in a loss or may be costly to the Fund. An illiquid investment is any investment that the Manager or Subadvisors reasonably expects cannot be sold or disposed of in current market conditions in seven calendar days or less without the sale or disposition significantly changing the market value of the investment. The liquidity classification of each investment will be made using information obtained after reasonable inquiry and taking into account, among other things, relevant market, trading and investment-specific considerations in accordance with the Liquidity Program. Illiquid investments are often fair valued in accordance with the Fund's procedures described above. The liquidity of the Fund's investments was determined as of October 31, 2023, and can change at
any time. Illiquid investments as of October 31, 2023, are shown in the Portfolio of Investments.
(B) Income Taxes. The Fund's policy is to comply with the requirements of the Internal Revenue Code of 1986, as amended (the “Internal Revenue Code”), applicable to regulated investment companies and to distribute all of its taxable income to the shareholders of the Fund within the allowable time limits.
The Manager evaluates the Fund’s tax positions to determine if the tax positions taken meet the minimum recognition threshold in connection with accounting for uncertainties in income tax positions taken or expected to be taken for the purposes of measuring and recognizing tax liabilities in the financial statements. Recognition of tax benefits of an uncertain tax position is permitted only to the extent the position is “more likely than not” to be sustained assuming examination by taxing authorities. The Manager analyzed the Fund's tax positions taken on federal, state and local income tax returns for all open tax years (for up to three tax years) and has concluded that no provisions for federal, state and local income tax are required in the Fund's financial statements. The Fund's federal, state and local income tax and federal excise tax returns for tax years for which the applicable statutes of limitations have not expired are subject to examination by the Internal Revenue Service and state and local departments of revenue.
(C) Foreign Taxes. The Fund may be subject to foreign taxes on income and other transaction-based taxes imposed by certain countries in which it invests. A portion of the taxes on gains on investments or currency purchases/repatriation may be reclaimable. The Fund will accrue such taxes and reclaims as applicable, based upon its current interpretation of tax rules and regulations that exist in the markets in which it invests.
The Fund may be subject to taxation on realized capital gains, repatriation proceeds and other transaction-based taxes imposed by certain countries in which it invests. The Fund will accrue such taxes as applicable based upon its current interpretation of tax rules and regulations that exist in the market in which it invests. Capital gains taxes relating to positions still held are reflected as a liability in the Statement of Assets and Liabilities, as well as an adjustment to the Fund's net unrealized appreciation (depreciation). Taxes related to capital gains realized, if any, are reflected as part of net realized gain (loss) in the Statement of Operations. Changes in tax liabilities related to capital gains taxes on unrealized investment gains, if any, are reflected as part of the change in net unrealized appreciation (depreciation) on investments in the Statement of Operations. Transaction-based charges are generally assessed as a percentage of the transaction amount.
(D) Dividends and Distributions to Shareholders. Dividends and distributions are recorded on the ex-dividend date. The Fund intends to declare and pay dividends from net investment income, if any, at least monthly and distributions from net realized capital and currency gains, if any, at least annually. Unless a shareholder elects otherwise, all dividends and distributions are reinvested at NAV in the same class of shares of the
Notes to Financial Statements (continued)
Fund. Dividends and distributions to shareholders are determined in accordance with federal income tax regulations and may differ from determinations using GAAP.
(E) Security Transactions and Investment Income. The Fund records security transactions on the trade date. Realized gains and losses on security transactions are determined using the identified cost method. Dividend income is recognized on the ex-dividend date, net of any foreign tax withheld at the source, and interest income is accrued as earned using the effective interest rate method and includes any realized gains and losses from repayments of principal on mortgage-backed securities. Distributions received from real estate investment trusts may be classified as dividends, capital gains and/or return of capital. Discounts and premiums on securities purchased for the Fund are accreted and amortized, respectively, on the effective interest rate method. Income from payment-in-kind securities, to the extent the Fund held any such securities during the year ended October 31, 2023, is accreted daily based on the effective interest method.
Investment income and realized and unrealized gains and losses on investments of the Fund are allocated pro rata to the separate classes of shares based upon their relative net assets on the date the income is earned or realized and unrealized gains and losses are incurred.
The Fund may place a debt security on non-accrual status and reduce related interest income by ceasing current accruals and writing off all or a portion of any interest receivables when the collection of all or a portion of such interest has become doubtful. A debt security is removed from non-accrual status when the issuer resumes interest payments or when collectability of interest is reasonably assured.
(F) Expenses. Expenses of the Trust are allocated to the individual Funds in proportion to the net assets of the respective Funds when the expenses are incurred, except where direct allocations of expenses can be made. Expenses (other than transfer agent expenses and fees incurred under the shareholder services plans and/or the distribution plans further discussed in Note 3(B)) are allocated to separate classes of shares pro rata based upon their relative net assets on the date the expenses are incurred. The expenses borne by the Fund, including those of related parties to the Fund, are shown in the Statement of Operations.
Additionally, the Fund may invest in mutual funds, which are subject to management fees and other fees that may cause the costs of investing in mutual funds to be greater than the costs of owning the underlying securities directly. These indirect expenses of mutual funds are not included in the amounts shown as expenses in the Statement of Operations or in the expense ratios included in the Financial Highlights.
(G) Use of Estimates. In preparing financial statements in conformity with GAAP, the Manager makes estimates and assumptions that affect the reported amounts and disclosures in the financial statements. Actual results could differ from those estimates and assumptions.
(H) Futures Contracts. A futures contract is an agreement to purchase or sell a specified quantity of an underlying instrument at a specified future date and price, or to make or receive a cash payment based on the value of a financial instrument (e.g., foreign currency, interest rate, security or securities index). The Fund is subject to risks such as market price risk, leverage risk, liquidity risk, counterparty risk, operational risk, legal risk and/or interest rate risk in the normal course of investing in these contracts. Upon entering into a futures contract, the Fund is required to pledge to the broker or futures commission merchant an amount of cash and/or U.S. government securities equal to a certain percentage of the collateral amount, known as the “initial margin.” During the period the futures contract is open, changes in the value of the contract are recognized as unrealized appreciation or depreciation by marking to market such contract on a daily basis to reflect the market value of the contract at the end of each day’s trading. The Fund agrees to receive from or pay to the broker or futures commission merchant an amount of cash equal to the daily fluctuation in the value of the contract. Such receipts or payments are known as “variation margin.” When the futures contract is closed, the Fund records a realized gain or loss equal to the difference between the proceeds from (or cost of) the closing transaction and the Fund's basis in the contract.
The use of futures contracts involves, to varying degrees, elements of market risk in excess of the amount recognized in the Statement of Assets and Liabilities. The contract or notional amounts and variation margin reflect the extent of the Fund's involvement in open futures positions. There are several risks associated with the use of futures contracts as hedging techniques. There can be no assurance that a liquid market will exist at the time when the Fund seeks to close out a futures contract. If no liquid market exists, the Fund would remain obligated to meet margin requirements until the position is closed. Futures contracts may involve a small initial investment relative to the risk assumed, which could result in losses greater than if the Fund did not invest in futures contracts. Futures contracts may be more volatile than direct investments in the instrument underlying the futures and may not correlate to the underlying instrument, causing a given hedge not to achieve its objectives. The Fund's activities in futures contracts have minimal counterparty risk as they are conducted through regulated exchanges that guarantee the futures against default by the counterparty. In the event of a bankruptcy or insolvency of a futures commission merchant that holds margin on behalf of the Fund, the Fund may not be entitled to the return of the entire margin owed to the Fund, potentially resulting in a loss. The Fund may invest in futures contracts to seek enhanced returns or to reduce the risk of loss by hedging certain of its holdings. The Fund's investment in futures contracts and other derivatives may increase the volatility of the Fund's NAVs and may result in a loss to the Fund. Open futures contracts as of October 31, 2023, are shown in the Portfolio of Investments.
(I) Loan Assignments, Participations and Commitments. The Fund may invest in loan assignments and participations ("loans"). Commitments are agreements to make money available to a borrower in a specified amount, at a specified rate and within a specified time. The
| 44 | MainStay Income Builder Fund |
Fund records an investment when the borrower withdraws money on a commitment or when a funded loan is purchased (trade date) and records interest as earned. These loans pay interest at rates that are periodically reset by reference to a base lending rate plus a spread. These base lending rates are generally the prime rate offered by a designated U.S. bank, the Secured Overnight Financing Rate ("SOFR") or an alternative reference rate.
The loans in which the Fund may invest are generally readily marketable, but may be subject to some restrictions on resale. For example, the Fund may be contractually obligated to receive approval from the agent bank and/or borrower prior to the sale of these investments. If the Fund purchases an assignment from a lender, the Fund will generally have direct contractual rights against the borrower in favor of the lender. If the Fund purchases a participation interest either from a lender or a participant, the Fund typically will have established a direct contractual relationship with the seller of the participation interest, but not with the borrower. Consequently, the Fund is subject to the credit risk of the lender or participant who sold the participation interest to the Fund, in addition to the usual credit risk of the borrower. In the event that the borrower, selling participant or intermediate participants become insolvent or enter into bankruptcy, the Fund may incur certain costs and delays in realizing payment, or may suffer a loss of principal and/or interest.
Unfunded commitments represent the remaining obligation of the Fund to the borrower. At any point in time, up to the maturity date of the issue, the borrower may demand the unfunded portion. Unfunded amounts, if any, are marked to market and any unrealized gains or losses are recorded in the Statement of Assets and Liabilities. As of October 31, 2023, the Fund did not hold any unfunded commitments.
(J) Foreign Currency Forward Contracts. The Fund may enter into foreign currency forward contracts, which are agreements to buy or sell foreign currencies on a specified future date at a specified rate. The Fund is subject to foreign currency exchange rate risk in the normal course of investing in these transactions. During the period the forward contract is open, changes in the value of the contract are recognized as unrealized appreciation or depreciation by marking to market such contract on a daily basis to reflect the market value of the contract at the end of each day’s trading. Cash movement occurs on the settlement date. When the forward contract is closed, the Fund records a realized gain or loss equal to the difference between the proceeds from (or cost of) the closing transaction and the Fund's basis in the contract. The Fund may purchase and sell foreign currency forward contracts for purposes of seeking to enhance portfolio returns and manage portfolio risk more efficiently. Foreign currency forward contracts may also be used to gain exposure to a particular currency or to hedge against the risk of loss due to changing currency exchange rates. Foreign currency forward contracts to purchase or sell a foreign currency may also be used in anticipation of future purchases or sales of securities denominated in foreign currency, even if the specific investments have not yet been selected.
The use of foreign currency forward contracts involves, to varying degrees, elements of risk in excess of the amount recognized in the
Statement of Assets and Liabilities, including counterparty risk, market risk, leverage risk, operational risk, legal risk and liquidity risk. Counterparty risk is heightened for these instruments because foreign currency forward contracts are not exchange-traded and therefore no clearinghouse or exchange stands ready to meet the obligations under such contracts. Thus, the Fund faces the risk that its counterparties under such contracts may not perform their obligations. Market risk is the risk that the value of a foreign currency forward contract will depreciate due to unfavorable changes in exchange rates. Liquidity risk arises because the secondary market for foreign currency forward contracts may have less liquidity relative to markets for other securities and financial instruments. Liquidity risk also can arise when forward currency contracts create margin or settlement payment obligations for the Fund. Leverage risk is the risk that a foreign currency forward contract can magnify the Fund's gains and losses. Operational risk refers to risk related to potential operational issues (including documentation issues, settlement issues, systems failures, inadequate controls and human error), and legal risk refers to insufficient documentation, insufficient capacity or authority of the counterparty, or legality or enforceability of a foreign currency forward contract. Risks also arise from the possible movements in the foreign exchange rates underlying these instruments. While the Fund may enter into forward contracts to reduce currency exchange risks, changes in currency exchange rates may result in poorer overall performance for the Fund than if it had not engaged in such transactions. Exchange rate movements can be large, depending on the currency, and can last for extended periods of time, affecting the value of the Fund's assets. Moreover, there may be an imperfect correlation between the Fund's holdings of securities denominated in a particular currency and forward contracts entered into by the Fund. Such imperfect correlation may prevent the Fund from achieving the intended hedge or expose the Fund to the risk of currency exchange loss. The unrealized appreciation (depreciation) on forward contracts also reflects the Fund's exposure at the valuation date to credit loss in the event of a counterparty’s failure to perform its obligations. Open foreign currency forward contracts as of October 31, 2023, are shown in the Portfolio of Investments.
(K) Foreign Currency Transactions. The Fund's books and records are maintained in U.S. dollars. Prices of securities denominated in foreign currency amounts are translated into U.S. dollars at the mean between the buying and selling rates last quoted by any major U.S. bank at the following dates:
(i) market value of investment securities, other assets and liabilities— at the valuation date; and
(ii) purchases and sales of investment securities, income and expenses—at the date of such transactions.
The assets and liabilities that are denominated in foreign currency amounts are presented at the exchange rates and market values at the close of the period. The realized and unrealized changes in net assets arising from fluctuations in exchange rates and market prices of securities are not separately presented.
Notes to Financial Statements (continued)
Net realized gain (loss) on foreign currency transactions represents net currency gains or losses realized as a result of differences between the amounts of securities sale proceeds or purchase cost, dividends, interest and withholding taxes as recorded on the Fund's books, and the U.S. dollar equivalent amount actually received or paid. Net currency gains or losses from valuing such foreign currency denominated assets and liabilities, other than investments at valuation date exchange rates, are reflected in unrealized foreign exchange gains or losses.
(L) Securities Lending. In order to realize additional income, the Fund may engage in securities lending, subject to the limitations set forth in the 1940 Act and relevant guidance by the staff of the Securities and Exchange Commission (“SEC”). If the Fund engages in securities lending, the Fund will lend through its custodian, JPMorgan Chase Bank, N.A., ("JPMorgan"), acting as securities lending agent on behalf of the Fund. Under the current arrangement, JPMorgan will manage the Fund's collateral in accordance with the securities lending agency agreement between the Fund and JPMorgan, and indemnify the Fund against counterparty risk. The loans will be collateralized by cash (which may be invested in a money market fund) and/or non-cash collateral (which may include U.S. Treasury securities and/or U.S. government agency securities issued or guaranteed by the United States government or its agencies or instrumentalities) at least equal at all times to the market value of the securities loaned. Non-cash collateral held at year end is segregated and cannot be transferred by the Fund. The Fund bears the risk of delay in recovery of, or loss of rights in, the securities loaned. The Fund may also record a realized gain or loss on securities deemed sold due to a borrower’s inability to return securities on loan. The Fund bears the risk of any loss on investment of cash collateral. The Fund will receive compensation for lending its securities in the form of fees or it will retain a portion of interest earned on the investment of any cash collateral. The Fund will also continue to receive interest and dividends on the securities loaned and any gain or loss in the market price of the securities loaned that may occur during the term of the loan will be for the account of the Fund. Income earned from securities lending activities, if any, is reflected in the Statement of Operations. Securities on loan as of October 31, 2023, are shown in the Portfolio of Investments.
(M) Dollar Rolls. The Fund may enter into dollar roll transactions in which it sells mortgage-backed securities ("MBS") from its portfolio to a counterparty from whom it simultaneously agrees to buy a similar security on a delayed delivery basis. The Fund generally transfers MBS where the MBS are "to be announced," therefore, the Fund accounts for these transactions as purchases and sales.
When accounted for as purchase and sales, the securities sold in connection with the dollar rolls are removed from the portfolio and a realized gain or loss is recognized. The securities the Fund has agreed to acquire are included at market value in the Portfolio of Investments and liabilities for such purchase commitments are included as payables for investments purchased. During the roll period, the Fund foregoes principal and interest paid on the securities. The Fund is compensated by the difference between the current sales price and the forward price for
the future as well as by the earnings on the cash proceeds of the initial sale. Dollar rolls may be renewed without physical delivery of the securities subject to the contract. Dollar roll transactions involve certain risks, including the risk that the securities returned to the Fund at the end of the roll period, while substantially similar, could be inferior to what was initially sold to the counterparty. During the year ended October 31, 2023, the Fund did not invest in Dollar Rolls.
(N) Debt Securities Risk. The ability of issuers of debt securities held by the Fund to meet their obligations may be affected by, among other things, economic or political developments in a specific country, industry or region. Debt securities are also subject to the risks associated with changes in interest rates.
The Fund may invest in high-yield debt securities (sometimes called “junk bonds”), which are generally considered speculative because they present a greater risk of loss, including default, than higher quality debt securities. These securities pay investors a premium—a higher interest rate or yield than investment grade debt securities—because of the increased risk of loss. These securities can also be subject to greater price volatility. In times of unusual or adverse market, economic or political conditions, these securities may experience higher than normal default rates.
The Fund may invest in foreign securities, which carry certain risks that are in addition to the usual risks inherent in domestic securities. Foreign regulatory regimes and securities markets can have less stringent investor protections and disclosure standards and less liquid trading markets than U.S. regulatory regimes and securities markets, and can experience political, social and economic developments that may affect the value of investments in foreign securities. These risks include those resulting from currency fluctuations, future adverse political or economic developments and possible imposition of currency exchange blockages or other foreign governmental laws or restrictions. Economic sanctions and other similar governmental actions or developments could, among other things, effectively restrict or eliminate the Fund’s ability to purchase or sell certain foreign securities or groups of foreign securities, and thus may make the Fund’s investments in such securities less liquid or more difficult to value. These risks are likely to be greater in emerging markets than in developed markets. The ability of issuers of securities held by the Fund to meet their obligations may be affected by, among other things, economic or political developments in a specific country, industry or region.
The Fund may invest in loans which are usually rated below investment grade and are generally considered speculative because they present a greater risk of loss, including default, than higher rated debt securities. These investments pay investors a higher interest rate than investment grade debt securities because of the increased risk of loss. Although certain loans are collateralized, there is no guarantee that the value of the collateral will be sufficient to repay the loan. In a recession or serious credit event, the value of these investments could decline significantly. As a result, the Fund’s NAVs could go down and you could lose money.
| 46 | MainStay Income Builder Fund |
In addition, loans generally are subject to extended settlement periods that may be longer than seven days. As a result, the Fund may be adversely affected by selling other investments at an unfavorable time and/or under unfavorable conditions or engaging in borrowing transactions, such as borrowing against its credit facility, to raise cash to meet redemption obligations or pursue other investment opportunities.
In certain circumstances, loans may not be deemed to be securities. As a result, the Fund may not have the protection of anti-fraud provisions of the federal securities laws. In such cases, the Fund generally must rely on the contractual provisions in the loan agreement and common-law fraud protections under applicable state law.
(O) Counterparty Credit Risk. In order to better define its contractual rights and to secure rights that will help the Fund mitigate its counterparty risk, the Fund may enter into an International Swaps and Derivatives Association, Inc. Master Agreement (“ISDA Master Agreement”) or similar agreement with its counterparties. An ISDA Master Agreement is a bilateral agreement between the Fund and a counterparty that governs certain OTC derivatives and typically contains collateral posting terms and netting provisions. Under an ISDA Master Agreement, the Fund may, under certain circumstances, offset with the counterparty certain derivative financial instruments’ payables and/ or receivables with collateral held and/or posted and create one single net payment. The provisions of the ISDA Master Agreement typically permit a single net payment in the event of default including the bankruptcy or insolvency of the counterparty. Bankruptcy or insolvency laws of a particular jurisdiction may restrict or prohibit the right of offset in bankruptcy, insolvency or other events. In addition, certain ISDA Master Agreements may contain provisions for early termination of OTC derivative transactions in the event the net assets of the Fund decline below specific levels or if the Fund fails to meet the terms of its ISDA Master Agreements. The result would cause the Fund to accelerate payment of any net liability owed to the counterparty.
For financial reporting purposes, the Fund does not offset derivative assets and derivative liabilities that are subject to netting arrangements, if any, in the Statement of Assets and Liabilities.
(P) LIBOR Replacement Risk. The Fund may invest in certain debt securities, derivatives or other financial instruments that have relied or continue to rely on LIBOR, as a “benchmark” or “reference rate” for various interest rate calculations. As of January 1, 2022, the United Kingdom Financial Conduct Authority ("FCA"), which regulates LIBOR, ceased its active encouragement of banks to provide the quotations needed to sustain most LIBOR rates due to the absence of an active market for interbank unsecured lending and other reasons. In connection with supervisory guidance from U.S. regulators, certain U.S. regulated entities have generally ceased to enter into certain new LIBOR contracts after January 1, 2022. On March 15, 2022, the Adjustable Interest Rate (LIBOR) Act was signed into law. This law provides a statutory fallback mechanism on a nationwide basis to replace LIBOR with a benchmark rate that is selected by the Board of Governors of the Federal Reserve System and based on Secured Overnight Financing Rate ("SOFR") (which
measures the cost of overnight borrowings through repurchase agreement transactions collateralized with U.S. Treasury securities) for tough legacy contracts. On February 27, 2023, the Federal Reserve System’s final rule in connection with this law became effective, establishing benchmark replacements based on SOFR and Term SOFR (a forward-looking measurement of market expectations of SOFR implied from certain derivatives markets) for applicable tough legacy contracts governed by U.S. law. In addition, the FCA has announced that it will require the publication of synthetic LIBOR for the one-month, three-month and six-month U.S. Dollar LIBOR settings after June 30, 2023 through at least September 30, 2024. Certain of the Fund's investments may involve individual tough legacy contracts which may be subject to the Adjustable Interest Rate (LIBOR) Act or synthetic LIBOR and no assurances can be given that these measures will have had the intended effects. Although the transition process away from LIBOR for many instruments has been completed, some LIBOR use is continuing and there are potential effects related to the transition away from LIBOR or continued use of LIBOR on the Fund.
The elimination of LIBOR or changes to other reference rates or any other changes or reforms to the determination or supervision of reference rates could have an adverse impact on the market for, or value of, any securities or payments linked to those reference rates, which may adversely affect the Fund's performance and/or net asset value. It could also lead to a reduction in the interest rates on, and the value of, some LIBOR-based investments and reduce the effectiveness of hedges mitigating risk in connection with LIBOR-based investments. Uncertainty and risk also remain regarding the willingness and ability of issuers and lenders to include enhanced provisions in new and existing contracts or instruments. Consequently, the transition away from LIBOR to other reference rates may lead to increased volatility and illiquidity in markets that are tied to LIBOR, fluctuations in values of LIBOR-related investments or investments in issuers that utilize LIBOR, increased difficulty in borrowing or refinancing and diminished effectiveness of hedging strategies, adversely affecting the Fund's performance. Furthermore, the risks associated with the expected discontinuation of LIBOR and transition may be exacerbated if the work necessary to effect an orderly transition to an alternative reference rate is not completed in a timely manner. The usefulness of LIBOR as a benchmark could deteriorate anytime during this transition period. Any such effects of the transition process, including unforeseen effects, could result in losses to the Fund.
(Q) Indemnifications. Under the Trust’s organizational documents, its officers and trustees are indemnified against certain liabilities that may arise out of performance of their duties to the Trust. Additionally, in the normal course of business, the Fund enters into contracts with third-party service providers that contain a variety of representations and warranties and that may provide general indemnifications. The Fund's maximum exposure under these arrangements is unknown, as this would involve future claims that may be made against the Fund that have not yet occurred. The Manager believes that the risk of loss in connection with these potential indemnification obligations is remote. However, there can
Notes to Financial Statements (continued)
be no assurance that material liabilities related to such obligations will not arise in the future, which could adversely impact the Fund.
(R) Quantitative Disclosure of Derivative Holdings. The following tables show additional disclosures related to the Fund's derivative and hedging activities, including how such activities are accounted for and their effect on the Fund's financial positions, performance and cash flows.
The Fund entered into Treasury futures contracts to hedge against anticipated changes in interest rates that might otherwise have an
adverse effect upon the value of the Fund’s securities. The Fund also entered into domestic and foreign equity index futures contracts to increase the equity sensitivity to the Fund.
Foreign currency forward contracts were used to gain exposure to a particular currency or to hedge against the risk of loss due to changing currency exchange rates. These derivatives are not accounted for as hedging instruments.
Fair value of derivative instruments as of October 31, 2023:
| Asset Derivatives | Foreign
Exchange
Contracts
Risk | Equity
Contracts
Risk | Interest
Rate
Contracts
Risk | Total |
| Futures Contracts - Net Assets—Net unrealized appreciation on futures contracts (a) | $ — | $2,604,869 | $81,682 | $2,686,551 |
| Forward Contracts - Unrealized appreciation on foreign currency forward contracts | 424,169 | — | — | 424,169 |
| Total Fair Value | $424,169 | $2,604,869 | $81,682 | $3,110,720 |
| (a) | Includes cumulative appreciation (depreciation) of futures contracts as reported in the Portfolio of Investments. Only current day’s variation margin is reported within the Statement of Assets and Liabilities. |
| Liability Derivatives | Foreign
Exchange
Contracts
Risk | Equity
Contracts
Risk | Interest
Rate
Contracts
Risk | Total |
| Futures Contracts - Net Assets—Net unrealized depreciation on futures contracts (a) | $ — | $(10,023,611) | $(5,444,870) | $(15,468,481) |
| Forward Contracts - Unrealized depreciation on foreign currency forward contracts | (5,548,520) | — | — | (5,548,520) |
| Total Fair Value | $(5,548,520) | $(10,023,611) | $(5,444,870) | $(21,017,001) |
��
| (a) | Includes cumulative appreciation (depreciation) of futures contracts as reported in the Portfolio of Investments. Only current day’s variation margin is reported within the Statement of Assets and Liabilities. |
The effect of derivative instruments on the Statement of Operations for the year ended October 31, 2023:
| Net Realized Gain (Loss) from: | Foreign
Exchange
Contracts
Risk | Equity
Contracts
Risk | Interest
Rate
Contracts
Risk | Total |
| Futures Transactions | $ — | $2,434,632 | $(11,363,600) | $ (8,928,968) |
| Forward Transactions | (4,068,368) | — | — | (4,068,368) |
| Total Net Realized Gain (Loss) | $(4,068,368) | $2,434,632 | $(11,363,600) | $(12,997,336) |
| Net Change in Unrealized Appreciation (Depreciation) | Foreign
Exchange
Contracts
Risk | Equity
Contracts
Risk | Interest
Rate
Contracts
Risk | Total |
| Futures Contracts | $ — | $(14,437,896) | $2,223,463 | $(12,214,433) |
| Forward Contracts | (3,029,184) | — | — | (3,029,184) |
| Total Net Change in Unrealized Appreciation (Depreciation) | $(3,029,184) | $(14,437,896) | $2,223,463 | $(15,243,617) |
| 48 | MainStay Income Builder Fund |
| Average Notional Amount | Total |
| Futures Contracts Long | $324,689,540 |
| Futures Contracts Short | $ (82,308,560) |
| Forward Contracts Long | $ 67,852,104 |
| Forward Contracts Short | $ (28,983,440) |
Note 3–Fees and Related Party Transactions
(A) Manager and Subadvisors. New York Life Investments, a registered investment adviser and an indirect, wholly-owned subsidiary of New York Life Insurance Company ("New York Life"), serves as the Fund's Manager, pursuant to an Amended and Restated Management Agreement ("Management Agreement"). The Manager provides offices, conducts clerical, recordkeeping and bookkeeping services and keeps most of the financial and accounting records required to be maintained by the Fund. Except for the portion of salaries and expenses that are the responsibility of the Fund, the Manager pays the salaries and expenses of all personnel affiliated with the Fund and certain operational expenses of the Fund. The Fund reimburses New York Life Investments in an amount equal to the portion of the compensation of the Chief Compliance Officer attributable to the Fund. Pursuant to the terms of an Amended and Restated Subadvisory Agreement with New York Life Investments, MacKay Shields LLC ("MacKay Shields" or "Subadvisor"), a registered investment adviser and an indirect, wholly-owned subsidiary of New York Life, serves as a Subadvisor to the Fund and is responsible for the day-to-day portfolio management of the fixed-income portion of the Fund. Pursuant to the terms of an Amended and Restated Subadvisory Agreement with New York Life Investments, Epoch Investment Partners, Inc. (“Epoch” or “Subadvisor” and, together with MacKay Shields, the “Subadvisors”), a registered investment adviser, also serves as a Subadvisor to the Fund and is responsible for the day-to-day portfolio management of the equity portion of the Fund. Asset allocation decisions for the Fund are made by a committee chaired by New York Life Investments in collaboration with MacKay. New York Life Investments pays for the services of the Subadvisors.
Pursuant to the Management Agreement, the Fund pays the Manager a monthly fee for the services performed and the facilities furnished at an annual rate of the Fund’s average daily net assets as follows: 0.64% up to $500 million; 0.60% from $500 million to $1 billion; 0.575% from $1 billion to $5 billion; and 0.565% in excess of $5 billion, plus a fee for fund accounting services previously provided by New York Life Investments under a separate fund accounting agreement furnished at an annual rate of the Fund’s average daily net assets as follows: 0.05% up to $20 million; 0.0333% from $20 million to $100 million; and 0.01% in excess of $100 million. During the year ended October 31, 2023, the effective management fee rate was 0.63%, inclusive of a fee for fund accounting services of 0.01% of the Fund’s average daily net assets.
In addition, New York Life Investments waived fees and/or reimbursed expenses so that Total Annual Fund Operating Expenses (excluding taxes, interest, litigation, extraordinary expenses, brokerage and other transaction expenses relating to the purchase or sale of portfolio
investments, and acquired (underlying) fund fees and expenses) for Class R6 shares did not exceed those of Class I.
During the year ended October 31, 2023, New York Life Investments earned fees from the Fund in the amount of $7,050,575 and waived fees and/or reimbursed expenses in the amount of $16,438 and paid MacKay Shields and Epoch fees of $1,599,603 and $1,968,232, respectively.
JPMorgan provides sub-administration and sub-accounting services to the Fund pursuant to an agreement with New York Life Investments. These services include calculating the daily NAVs of the Fund, maintaining the general ledger and sub-ledger accounts for the calculation of the Fund's NAVs, and assisting New York Life Investments in conducting various aspects of the Fund's administrative operations. For providing these services to the Fund, JPMorgan is compensated by New York Life Investments.
Pursuant to an agreement between the Trust and New York Life Investments, New York Life Investments is responsible for providing or procuring certain regulatory reporting services for the Fund. The Fund will reimburse New York Life Investments for the actual costs incurred by New York Life Investments in connection with providing or procuring these services for the Fund.
(B) Distribution and Service Fees. The Trust, on behalf of the Fund, has entered into a distribution agreement with NYLIFE Distributors LLC (the “Distributor”), an affiliate of New York Life Investments. The Fund has adopted distribution plans (the “Plans”) in accordance with the provisions of Rule 12b-1 under the 1940 Act.
Pursuant to the Class A, Investor Class and Class R2 Plans, the Distributor receives a monthly fee from the Class A, Investor Class and Class R2 shares at an annual rate of 0.25% of the average daily net assets of the Class A, Investor Class and Class R2 shares for distribution and/or service activities as designated by the Distributor. Pursuant to the Class B and Class C Plans, Class B and Class C shares pay the Distributor a monthly distribution fee at an annual rate of 0.75% of the average daily net assets of the Class B and Class C shares, along with a service fee at an annual rate of 0.25% of the average daily net assets of the Class B and Class C shares, for a total 12b-1 fee of 1.00%. Pursuant to the Class R3 and SIMPLE Class Plans, Class R3 and SIMPLE Class shares pay the Distributor a monthly distribution fee at an annual rate of 0.25% of the average daily net assets of the Class R3 and SIMPLE Class shares, along with a service fee at an annual rate of 0.25% of the average daily net assets of the Class R3 and SIMPLE Class shares, for a total 12b-1 fee of 0.50%. Class I and Class R6 shares are not subject to a distribution and/or service fee.
The Plans provide that the distribution and service fees are payable to the Distributor regardless of the amounts actually expended by the Distributor for distribution of the Fund's shares and service activities.
In accordance with the Shareholder Services Plans for the Class R2 and Class R3 shares, the Manager has agreed to provide, through its affiliates or independent third parties, various shareholder and administrative
Notes to Financial Statements (continued)
support services to shareholders of the Class R2 and Class R3 shares. For its services, the Manager, its affiliates or independent third-party service providers are entitled to a shareholder service fee accrued daily and paid monthly at an annual rate of 0.10% of the average daily net assets of the Class R2 and Class R3 shares. This is in addition to any fees paid under the Class R2 and Class R3 Plans.
During the year ended October 31, 2023, shareholder service fees incurred by the Fund were as follows:
| |
| Class R2 | $1,287 |
| Class R3 | 2,438 |
(C) Sales Charges. The Fund was advised by the Distributor that the amount of initial sales charges retained on sales of Class A and Investor Class shares during the year ended October 31, 2023, were $18,749 and $2,827, respectively.
The Fund was also advised that the Distributor retained CDSCs on redemptions of Class A, Class B and Class C shares during the year ended October 31, 2023, of $13,181, $276 and $1,531, respectively.
(D) Transfer, Dividend Disbursing and Shareholder Servicing Agent. NYLIM Service Company LLC, an affiliate of New York Life Investments, is the Fund's transfer, dividend disbursing and shareholder servicing agent pursuant to an agreement between NYLIM Service Company LLC and the Trust. NYLIM Service Company LLC has entered into an agreement with SS&C Global Investor & Distribution Solutions, Inc. ("SS&C"), pursuant to which SS&C performs certain transfer agent services on behalf of NYLIM Service Company LLC. New York Life Investments has contractually agreed to limit the transfer agency expenses charged to the Fund’s share classes to a maximum of 0.35% of that share class’s average daily net assets on an annual basis after deducting any applicable Fund or class-level expense reimbursement or small account fees. This agreement will remain in effect until February 28, 2024, and shall renew automatically for one-year terms unless New York Life Investments provides written notice of termination prior to the start of the next term or upon approval of the Board. During the year ended October 31, 2023, transfer agent expenses incurred by the Fund and any reimbursements, pursuant to the aforementioned Transfer Agency expense limitation agreement, were as follows:
| Class | Expense | Waived |
| Class A | $674,670 | $ — |
| Investor Class | 223,754 | (7,551) |
| Class B | 23,811 | (808) |
| Class C | 240,424 | (8,079) |
| Class I | 312,972 | — |
| Class R2 | 1,321 | — |
| Class R3 | 2,474 | — |
| Class R6 | 615 | — |
| SIMPLE Class | 51 | — |
(E) Small Account Fee. Shareholders with small accounts adversely impact the cost of providing transfer agency services. In an effort to reduce total transfer agency expenses, the Fund has implemented a small account fee on certain types of accounts. As described in the Fund's prospectus, certain shareholders with an account balance of less than $1,000 ($5,000 for Class A share accounts) are charged an annual per account fee of $20 (assessed semi-annually), the proceeds from which offset transfer agent fees as reflected in the Statement of Operations. This small account fee will not apply to certain types of accounts as described further in the Fund’s prospectus.
(F) Capital. As of October 31, 2023, New York Life and its affiliates beneficially held shares of the Fund with the values and percentages of net assets as follows:
| Class R2 | $31,216 | 3.5% |
| Class R6 | 28,997 | 0.8 |
| SIMPLE Class | 24,451 | 68.3 |
Note 4-Federal Income Tax
As of October 31, 2023, the cost and unrealized appreciation (depreciation) of the Fund’s investment portfolio, including applicable derivative contracts and other financial instruments, as determined on a federal income tax basis, were as follows:
| | Federal Tax
Cost | Gross
Unrealized
Appreciation | Gross
Unrealized
(Depreciation) | Net
Unrealized
Appreciation/
(Depreciation) |
| Investments in Securities | $917,416,444 | $115,967,622 | $(80,271,901) | $35,695,721 |
As of October 31, 2023, the components of accumulated gain (loss) on a tax basis were as follows:
Ordinary
Income | Accumulated
Capital
and Other
Gain (Loss) | Other
Temporary
Differences | Unrealized
Appreciation
(Depreciation) | Total
Accumulated
Gain (Loss) |
| $2,197,280 | $(141,562,671) | $(108,452) | $31,088,585 | $(108,385,258) |
The difference between book-basis and tax-basis unrealized appreciation (depreciation) is primarily due to wash sale adjustments, mark to market of futures, mark to market of forwards, partnerships and cumulative bond amortization adjustments.
The following table discloses the current year reclassifications between total distributable earnings (loss) and additional paid-in capital arising from permanent differences; net assets as of October 31, 2023 were not affected.
| | Total
Distributable
Earnings (Loss) | Additional
Paid-In
Capital |
| | $(135,566) | $135,566 |
The reclassifications for the Fund are primarily due to return of capital.
| 50 | MainStay Income Builder Fund |
As of October 31, 2023, for federal income tax purposes, capital loss carryforwards of $141,562,671, as shown in the table below, were available to the extent provided by the regulations to offset future realized gains of the Fund. Accordingly, no capital gains distributions are expected to be paid to shareholders until net gains have been realized in excess of such amounts.
Capital Loss
Available Through | Short-Term
Capital Loss
Amounts (000’s) | Long-Term
Capital Loss
Amounts (000’s) |
| Unlimited | $68,552 | $73,011 |
During the years ended October 31, 2023 and October 31, 2022, the tax character of distributions paid as reflected in the Statements of Changes in Net Assets was as follows:
| | 2023 | 2022 |
| Distributions paid from: | | |
| Ordinary Income | $31,406,402 | $ 66,389,313 |
| Long-Term Capital Gains | — | 52,187,385 |
| Return of Capital | — | 924,329 |
| Total | $31,406,402 | $119,501,027 |
Note 5–Custodian
JPMorgan is the custodian of cash and securities held by the Fund. Custodial fees are charged to the Fund based on the Fund's net assets and/or the market value of securities held by the Fund and the number of certain transactions incurred by the Fund.
Note 6–Line of Credit
The Fund and certain other funds managed by New York Life Investments maintain a line of credit with a syndicate of banks in order to secure a source of funds for temporary purposes to meet unanticipated or excessive redemption requests.
Effective July 25, 2023, under the credit agreement (the “Credit Agreement”), the aggregate commitment amount is $600,000,000 with an additional uncommitted amount of $100,000,000. The commitment fee is an annual rate of 0.15% of the average commitment amount payable quarterly, regardless of usage, to JPMorgan, who serves as the agent to the syndicate. The commitment fee is allocated among the Fund and certain other funds managed by New York Life Investments based upon their respective net assets and other factors. Interest on any revolving credit loan is charged based upon the Federal Funds Rate, Daily Simple Secured Overnight Financing Rate ("SOFR") + 0.10%, or the Overnight Bank Funding Rate, whichever is higher. The Credit Agreement expires on July 23, 2024, although the Fund, certain other funds managed by New York Life Investments and the syndicate of banks may renew the Credit Agreement for an additional year on the same or different terms or enter into a credit agreement with a different syndicate of banks. Prior to July 25, 2023, the aggregate commitment amount and the commitment fee were the same as those under the current Credit
Agreement. During the year ended October 31, 2023, there were no borrowings made or outstanding with respect to the Fund under the Credit Agreement.
Note 7–Interfund Lending Program
Pursuant to an exemptive order issued by the SEC, the Fund, along with certain other funds managed by New York Life Investments, may participate in an interfund lending program. The interfund lending program provides an alternative credit facility that permits the Fund and certain other funds managed by New York Life Investments to lend or borrow money for temporary purposes directly to or from one another, subject to the conditions of the exemptive order. During the year ended October 31, 2023, there were no interfund loans made or outstanding with respect to the Fund.
Note 8–Purchases and Sales of Securities (in 000’s)
During the year ended October 31, 2023, purchases and sales of U.S. government securities were $185,320 and $211,209, respectively. Purchases and sales of securities, other than U.S. government securities and short-term securities, were $426,129 and $679,511, respectively.
Note 9–Capital Share Transactions
Transactions in capital shares for the years ended October 31, 2023 and October 31, 2022, were as follows:
| Class A | Shares | Amount |
| Year ended October 31, 2023: | | |
| Shares sold | 2,516,059 | $ 44,732,737 |
| Shares issued to shareholders in reinvestment of distributions | 1,005,132 | 17,879,452 |
| Shares redeemed | (7,406,928) | (131,321,645) |
| Net increase (decrease) in shares outstanding before conversion | (3,885,737) | (68,709,456) |
| Shares converted into Class A (See Note 1) | 291,472 | 5,184,646 |
| Shares converted from Class A (See Note 1) | (36,894) | (662,235) |
| Net increase (decrease) | (3,631,159) | $ (64,187,045) |
| Year ended October 31, 2022: | | |
| Shares sold | 4,935,609 | $ 96,706,936 |
| Shares issued to shareholders in reinvestment of distributions | 2,860,432 | 57,239,717 |
| Shares redeemed | (6,544,111) | (123,051,601) |
| Net increase (decrease) in shares outstanding before conversion | 1,251,930 | 30,895,052 |
| Shares converted into Class A (See Note 1) | 302,634 | 5,914,240 |
| Shares converted from Class A (See Note 1) | (20,489) | (355,945) |
| Net increase (decrease) | 1,534,075 | $ 36,453,347 |
| |
Notes to Financial Statements (continued)
| Investor Class | Shares | Amount |
| Year ended October 31, 2023: | | |
| Shares sold | 90,287 | $ 1,616,764 |
| Shares issued to shareholders in reinvestment of distributions | 89,388 | 1,591,424 |
| Shares redeemed | (311,892) | (5,555,979) |
| Net increase (decrease) in shares outstanding before conversion | (132,217) | (2,347,791) |
| Shares converted into Investor Class (See Note 1) | 73,402 | 1,313,515 |
| Shares converted from Investor Class (See Note 1) | (159,583) | (2,836,066) |
| Net increase (decrease) | (218,398) | $ (3,870,342) |
| Year ended October 31, 2022: | | |
| Shares sold | 128,019 | $ 2,468,885 |
| Shares issued to shareholders in reinvestment of distributions | 272,544 | 5,471,647 |
| Shares redeemed | (291,315) | (5,532,511) |
| Net increase (decrease) in shares outstanding before conversion | 109,248 | 2,408,021 |
| Shares converted into Investor Class (See Note 1) | 57,030 | 1,086,744 |
| Shares converted from Investor Class (See Note 1) | (163,760) | (3,290,675) |
| Net increase (decrease) | 2,518 | $ 204,090 |
| |
| Class B | Shares | Amount |
| Year ended October 31, 2023: | | |
| Shares sold | 605 | $ 10,870 |
| Shares issued to shareholders in reinvestment of distributions | 5,764 | 103,489 |
| Shares redeemed | (138,480) | (2,470,402) |
| Net increase (decrease) in shares outstanding before conversion | (132,111) | (2,356,043) |
| Shares converted from Class B (See Note 1) | (119,904) | (2,158,112) |
| Net increase (decrease) | (252,015) | $ (4,514,155) |
| Year ended October 31, 2022: | | |
| Shares sold | 10,687 | $ 217,721 |
| Shares issued to shareholders in reinvestment of distributions | 38,866 | 794,933 |
| Shares redeemed | (197,793) | (3,825,274) |
| Net increase (decrease) in shares outstanding before conversion | (148,240) | (2,812,620) |
| Shares converted from Class B (See Note 1) | (115,518) | (2,199,922) |
| Net increase (decrease) | (263,758) | $ (5,012,542) |
| |
| Class C | Shares | Amount |
| Year ended October 31, 2023: | | |
| Shares sold | 159,179 | $ 2,846,128 |
| Shares issued to shareholders in reinvestment of distributions | 63,835 | 1,143,404 |
| Shares redeemed | (1,697,231) | (30,355,059) |
| Net increase (decrease) in shares outstanding before conversion | (1,474,217) | (26,365,527) |
| Shares converted from Class C (See Note 1) | (90,561) | (1,625,127) |
| Net increase (decrease) | (1,564,778) | $ (27,990,654) |
| Year ended October 31, 2022: | | |
| Shares sold | 215,648 | $ 4,232,502 |
| Shares issued to shareholders in reinvestment of distributions | 380,683 | 7,762,048 |
| Shares redeemed | (2,070,323) | (39,389,776) |
| Net increase (decrease) in shares outstanding before conversion | (1,473,992) | (27,395,226) |
| Shares converted from Class C (See Note 1) | (84,014) | (1,597,417) |
| Net increase (decrease) | (1,558,006) | $ (28,992,643) |
| |
| Class I | Shares | Amount |
| Year ended October 31, 2023: | | |
| Shares sold | 1,796,301 | $ 32,376,320 |
| Shares issued to shareholders in reinvestment of distributions | 444,143 | 7,996,518 |
| Shares redeemed | (7,013,152) | (125,777,077) |
| Net increase (decrease) in shares outstanding before conversion | (4,772,708) | (85,404,239) |
| Shares converted into Class I (See Note 1) | 46,598 | 844,048 |
| Shares converted from Class I (See Note 1) | (3,335) | (60,669) |
| Net increase (decrease) | (4,729,445) | $ (84,620,860) |
| Year ended October 31, 2022: | | |
| Shares sold | 2,794,118 | $ 54,209,049 |
| Shares issued to shareholders in reinvestment of distributions | 1,544,583 | 31,269,065 |
| Shares redeemed | (7,570,244) | (144,284,186) |
| Net increase (decrease) in shares outstanding before conversion | (3,231,543) | (58,806,072) |
| Shares converted into Class I (See Note 1) | 28,295 | 491,409 |
| Shares converted from Class I (See Note 1) | (2,909) | (48,434) |
| Net increase (decrease) | (3,206,157) | $ (58,363,097) |
| |
| 52 | MainStay Income Builder Fund |
| Class R2 | Shares | Amount |
| Year ended October 31, 2023: | | |
| Shares sold | 2,805 | $ 50,119 |
| Shares issued to shareholders in reinvestment of distributions | 1,039 | 18,485 |
| Shares redeemed | (52,059) | (910,048) |
| Net increase (decrease) | (48,215) | $ (841,444) |
| Year ended October 31, 2022: | | |
| Shares sold | 10,493 | $ 205,155 |
| Shares issued to shareholders in reinvestment of distributions | 2,953 | 59,140 |
| Shares redeemed | (48,655) | (863,716) |
| Net increase (decrease) | (35,209) | $ (599,421) |
| |
| Class R3 | Shares | Amount |
| Year ended October 31, 2023: | | |
| Shares sold | 43,427 | $ 771,918 |
| Shares issued to shareholders in reinvestment of distributions | 3,348 | 59,503 |
| Shares redeemed | (31,580) | (565,878) |
| Net increase (decrease) | 15,195 | $ 265,543 |
| Year ended October 31, 2022: | | |
| Shares sold | 40,831 | $ 769,068 |
| Shares issued to shareholders in reinvestment of distributions | 7,538 | 150,568 |
| Shares redeemed | (11,447) | (207,471) |
| Net increase (decrease) | 36,922 | $ 712,165 |
| |
| Class R6 | Shares | Amount |
| Year ended October 31, 2023: | | |
| Shares sold | 231,026 | $ 4,169,733 |
| Shares issued to shareholders in reinvestment of distributions | 17,949 | 326,250 |
| Shares redeemed | (5,248,518) | (93,598,773) |
| Net increase (decrease) | (4,999,543) | $ (89,102,790) |
| Year ended October 31, 2022: | | |
| Shares sold | 461,312 | $ 8,868,522 |
| Shares issued to shareholders in reinvestment of distributions | 398,256 | 8,037,656 |
| Shares redeemed | (609,827) | (11,840,855) |
| Net increase (decrease) | 249,741 | $ 5,065,323 |
| |
| SIMPLE Class | Shares | Amount |
| Year ended October 31, 2023: | | |
| Shares sold | 294 | $ 5,246 |
| Shares issued to shareholders in reinvestment of distributions | 50 | 900 |
| Shares redeemed | (235) | (4,285) |
| Net increase (decrease) | 109 | $ 1,861 |
| Year ended October 31, 2022: | | |
| Shares sold | 620 | $ 12,539 |
| Shares issued to shareholders in reinvestment of distributions | 125 | 2,510 |
| Shares redeemed | (44) | (920) |
| Net increase (decrease) | 701 | $ 14,129 |
Note 10–Other Matters
As of the date of this report, the Fund faces a heightened level of risk associated with current uncertainty, volatility and state of economies, financial markets, rising interest rates, and labor and health conditions around the world. Events such as war, acts of terrorism, recessions, rapid inflation, the imposition of international sanctions, earthquakes, hurricanes, epidemics and pandemics and other unforeseen natural or human disasters may have broad adverse social, political and economic effects on the global economy, which could negatively impact the value of the Fund's investments. Developments that disrupt global economies and financial markets may magnify factors that affect the Fund's performance.
Note 11–Subsequent Events
In connection with the preparation of the financial statements of the Fund as of and for the year ended October 31, 2023, events and transactions subsequent to October 31, 2023, through the date the financial statements were issued, have been evaluated by the Manager for possible adjustment and/or disclosure. No subsequent events requiring financial statement adjustment or disclosure have been identified.
Report of Independent Registered Public Accounting Firm
To the Shareholders of the Fund and Board of Trustees
The MainStay Funds:
Opinion on the Financial Statements
We have audited the accompanying statement of assets and liabilities of MainStay Income Builder Fund (the Fund), one of the funds constituting The MainStay Funds, including the portfolio of investments, as of October 31, 2023, the related statement of operations for the year then ended, the statements of changes in net assets for each of the years in the two-year period then ended, and the related notes (collectively, the financial statements) and the financial highlights for each of the years or periods in the five-year period then ended. In our opinion, the financial statements and financial highlights present fairly, in all material respects, the financial position of the Fund as of October 31, 2023, the results of its operations for the year then ended, the changes in its net assets for each of the years in the two-year period then ended, and the financial highlights for each of the years or periods in the five-year period then ended, in conformity with U.S. generally accepted accounting principles.
Basis for Opinion
These financial statements and financial highlights are the responsibility of the Fund's management. Our responsibility is to express an opinion on these financial statements and financial highlights based on our audits. We are a public accounting firm registered with the Public Company Accounting Oversight Board (United States) (PCAOB) and are required to be independent with respect to the Fund in accordance with the U.S. federal securities laws and the applicable rules and regulations of the Securities and Exchange Commission and the PCAOB.
We conducted our audits in accordance with the standards of the PCAOB. Those standards require that we plan and perform the audit to obtain reasonable assurance about whether the financial statements and financial highlights are free of material misstatement, whether due to error or fraud. Our audits included performing procedures to assess the risks of material misstatement of the financial statements and financial highlights, whether due to error or fraud, and performing procedures that respond to those risks. Such procedures included examining, on a test basis, evidence regarding the amounts and disclosures in the financial statements and financial highlights. Such procedures also included confirmation of securities owned as of October 31, 2023, by correspondence with custodians, the transfer agent, agent banks and brokers; when replies were not received from brokers or agent banks, we performed other auditing procedures. Our audits also included evaluating the accounting principles used and significant estimates made by management, as well as evaluating the overall presentation of the financial statements and financial highlights. We believe that our audits provide a reasonable basis for our opinion.

We have served as the auditor of one or more New York Life Investment Management investment companies since 2003.
Philadelphia, Pennsylvania
December 22, 2023
| 54 | MainStay Income Builder Fund |
Federal Income Tax Information
(Unaudited)
The Fund is required under the Internal Revenue Code to advise shareholders in a written statement as to the federal tax status of dividends paid by the Fund during such fiscal years.
For the fiscal year ended October 31, 2023, the Fund designated approximately $16,958,910 under the Internal Revenue Code as qualified dividend income eligible for reduced tax rates.
The dividends paid by the Fund during the fiscal year ended October 31, 2023 should be multiplied by 30.24% to arrive at the amount eligible for the corporate dividend-received deduction.
In February 2024, shareholders will receive an IRS Form 1099-DIV or substitute Form 1099, which will show the federal tax status of the distributions received by shareholders in calendar year 2023. The amounts that will be reported on such 1099-DIV or substitute Form 1099 will be the amounts you are to use on your federal income tax return and will differ from the amounts which we must report for the Fund's fiscal year ended October 31, 2023.
Proxy Voting Policies and Procedures and Proxy Voting Record
The Fund is required to file with the SEC its proxy voting record for the 12-month period ending June 30 on Form N-PX. A description of the policies and procedures that are used to vote proxies relating to portfolio securities of the Fund is available free of charge upon request by calling 800-624-6782 or visiting the SEC’s website at www.sec.gov. The most recent Form N-PX or proxy voting record is available free of charge upon request by calling 800-624-6782; visiting newyorklifeinvestments.com; or visiting the SEC’s website at www.sec.gov.
Shareholder Reports and Quarterly Portfolio Disclosure
The Fund is required to file its complete schedule of portfolio holdings with the SEC 60 days after its first and third fiscal quarter on Form N-PORT. The Fund's holdings report is available free of charge upon request by calling New York Life Investments at 800-624-6782.
Board of Trustees and Officers (Unaudited)
The Trustees and officers of the Fund are listed below. The Board oversees the MainStay Group of Funds (which consists of MainStay Funds and MainStay Funds Trust), MainStay VP Funds Trust, MainStay MacKay DefinedTerm Municipal Opportunities Fund, MainStay CBRE Global Infrastructure Megatrends Term Fund, the Manager and the Subadvisors, and elects the officers of the Funds who are responsible for the day-to-day operations of the Fund. Information pertaining to the Trustees and officers is set forth below. Each Trustee serves until his or her successor is elected and qualified or until his or her resignation, death or
removal. Under the Board’s retirement policy, unless an exception is made, a Trustee must tender his or her resignation by the end of the calendar year during which he or she reaches the age of 75. Officers are elected annually by the Board. The business address of each Trustee and officer listed below is 51 Madison Avenue, New York, New York 10010. A majority of the Trustees are not “interested persons” (as defined by the 1940 Act and rules adopted by the SEC thereunder) of the Fund (“Independent Trustees”).
| | Name and
Year of Birth | Term of Office,
Position(s) Held and
Length of Service | Principal Occupation(s)
During Past Five Years | Number of
Portfolios in
Fund Complex
Overseen by
Trustee | Other Directorships
Held by Trustee |
| | | | | | |
| | Naïm Abou-Jaoudé*
1966 | MainStay Funds: Trustee
since 2023
MainStay Funds Trust:
Trustee since 2023 | Chief Executive Officer of New York Life Investment Management LLC (since 2023). Chief Executive Officer of Candriam (an affiliate of New York Life Investment Management LLC) (2007 to 2023). | 81 | MainStay VP Funds Trust:
Trustee since 2023 (31 portfolios);
MainStay MacKay DefinedTerm Municipal Opportunities Fund: Trustee
since 2023;
MainStay CBRE Global Infrastructure Megatrends Term Fund: Trustee
since 2023; and
New York Life Investment Management International (Chair) since 2015 |
| * | This Trustee is considered to be an “interested person” of the MainStay Group of Funds, MainStay VP Funds Trust, MainStay CBRE Global Infrastructure Megatrends Term Fund and MainStay MacKay DefinedTerm Municipal Opportunities Fund, within the meaning of the 1940 Act because of his affiliation with New York Life Investment Management LLC and Candriam, as described in detail above in the column entitled “Principal Occupation(s) During Past Five Years.” |
| | |
| 56 | MainStay Income Builder Fund |
| | Name and
Year of Birth | Term of Office,
Position(s) Held and
Length of Service | Principal Occupation(s)
During Past Five Years | Number of
Portfolios in
Fund Complex
Overseen by
Trustee | Other Directorships
Held by Trustee |
| | | | | | |
| | David H. Chow
1957 | MainStay Funds: Trustee since January 2016, Advisory Board Member (June 2015 to December 2015);MainStay Funds Trust:
Trustee since January 2016, Advisory Board Member (June 2015 to December 2015) | Founder and CEO, DanCourt Management, LLC (since 1999) | 81 | MainStay VP Funds Trust: Trustee since January 2016, Advisory Board Member (June 2015 to December 2015) (31 portfolios);
MainStay MacKay DefinedTerm Municipal Opportunities Fund: Trustee since January 2016, Advisory Board Member (June 2015 to December 2015);
MainStay CBRE Global Infrastructure Megatrends Term Fund: Trustee since 2021;
VanEck Vectors Group of Exchange-Traded Funds: Trustee since 2006 and Independent Chairman of the Board of Trustees from 2008 to 2022 (57 portfolios); and
Berea College of Kentucky: Trustee since 2009, Chair of the Investment Committee since 2018 |
| | Karen Hammond
1956 | MainStay Funds: Trustee since December 2021, Advisory Board Member (June 2021 to December 2021);MainStay Funds Trust:
Trustee since December 2021, Advisory Board Member (June 2021 to December 2021)
| Retired, Managing Director, Devonshire Investors (2007 to 2013); Senior Vice President, Fidelity Management & Research Co. (2005 to 2007); Senior Vice President and Corporate Treasurer, FMR Corp. (2003 to 2005); Chief Operating Officer, Fidelity Investments Japan (2001 to 2003) | 81 | MainStay VP Funds Trust: Trustee since December 2021, Advisory Board Member (June 2021 to December 2021) (31 portfolios);
MainStay MacKay DefinedTerm Municipal Opportunities Fund: Trustee since December 2021, Advisory Board Member (June 2021 to December 2021);
MainStay CBRE Global Infrastructure Megatrends Term Fund: Trustee since December 2021, Advisory Board Member (June 2021 to December 2021);
Two Harbors Investment Corp.: Director since 2018;
Rhode Island State Investment Commission: Member since 2017; and
Blue Cross Blue Shield of Rhode Island: Director since 2019 |
| | Susan B. Kerley
1951 | MainStay Funds: Chair since January 2017 and Trustee since 2007;MainStay Funds Trust:
Chair since January 2017 and Trustee since 1990*** | President, Strategic Management Advisors LLC (since 1990) | 81 | MainStay VP Funds Trust: Chair since January 2017 and Trustee since 2007 (31 portfolios)**;
MainStay MacKay DefinedTerm Municipal Opportunities Fund: Chair since January 2017 and Trustee since 2011;
MainStay CBRE Global Infrastructure Megatrends Term Fund: Trustee since June 2021; and
Legg Mason Partners Funds: Trustee since 1991 (45 portfolios) |
Board of Trustees and Officers (Unaudited) (continued)
| | Name and
Year of Birth | Term of Office,
Position(s) Held and
Length of Service | Principal Occupation(s)
During Past Five Years | Number of
Portfolios in
Fund Complex
Overseen by
Trustee | Other Directorships
Held by Trustee |
| | | | | | |
| | Alan R. Latshaw
1951 | MainStay Funds: Trusteesince 2006;MainStay Funds Trust:
Trustee since 2007*** | Retired; Partner, Ernst & Young LLP (2002 to 2003); Partner, Arthur Andersen LLP (1989 to 2002); Consultant to the MainStay Funds Audit and Compliance Committee (2004 to 2006) | 81 | MainStay VP Funds Trust: Trustee since 2007 (31 portfolios)**;
MainStay MacKay DefinedTerm Municipal Opportunities Fund: Trustee since 2011; and
MainStay CBRE Global Infrastructure Megatrends Term Fund: Trustee since June 2021 |
| | Jacques P. Perold
1958 | MainStay Funds: Trustee since January 2016, Advisory Board Member (June 2015to December 2015);MainStay Funds Trust:
Trustee since January 2016, Advisory Board Member (June 2015 to December 2015) | Founder and Chief Executive Officer, CapShift Advisors LLC (since 2018); President, Fidelity Management & Research Company (2009 to 2014); President and Chief Investment Officer, Geode Capital Management, LLC (2001 to 2009) | 81 | MainStay VP Funds Trust: Trustee since January 2016, Advisory Board Member (June 2015 to December 2015) (31 portfolios);
MainStay MacKay DefinedTerm Municipal Opportunities Fund: Trustee since January 2016, Advisory Board Member (June 2015 to December 2015);
MainStay CBRE Global Infrastructure Megatrends Term Fund: Trustee since June 2021;
Allstate Corporation: Director since 2015; and
MSCI Inc.: Director since 2017 |
| | Richard S. Trutanic
1952 | MainStay Funds: Trustee since 1994;MainStay Funds Trust:
Trustee since 2007*** | Chairman and Chief Executive Officer, Somerset & Company (financial advisory firm) (since 2004); Managing Director, The Carlyle Group (private investment firm) (2002 to 2004); Senior Managing Director, Partner and Board Member, Groupe Arnault S.A. (private investment firm) (1999 to 2002) | 81 | MainStay VP Funds Trust: Trustee since 2007 (31 portfolios)**;
MainStay MacKay DefinedTerm Municipal Opportunities Fund: Trustee since 2011; and
MainStay CBRE Global Infrastructure Megatrends Term Fund: Trustee since June 2021 |
| ** | Includes prior service as a Director of MainStay VP Series Fund, Inc., the predecessor to MainStay VP Funds Trust. |
| *** | Includes prior service as a Director/Trustee of certain predecessor entities to MainStay Funds Trust. |
| 58 | MainStay Income Builder Fund |
| | Name and
Year of Birth | Position(s) Held and
Length of Service | Principal Occupation(s)
During Past Five Years | |
| | | | | |
| | Kirk C. Lehneis
1974 | President, MainStay Funds, MainStay Funds Trust (since 2017) | Chief Operating Officer and Senior Managing Director (since 2016), New York Life Investment Management LLC and New York Life Investment Management Holdings LLC; Member of the Board of Managers (since 2017) and Senior Managing Director (since 2018), NYLIFE Distributors LLC; Chairman of the Board and Senior Managing Director, NYLIM Service Company LLC (since 2017); Trustee, President and Principal Executive Officer of IndexIQ Trust, IndexIQ ETF Trust and IndexIQ Active ETF Trust (since 2018); President, MainStay CBRE Global Infrastructure Megatrends Term Fund (since 2021), MainStay MacKay DefinedTerm Municipal Opportunities Fund and MainStay VP Funds Trust (since 2017)**; Senior Managing Director, Global Product Development (2015 to 2016); Managing Director, Product Development (2010 to 2015), New York Life Investment Management LLC | |
| | Jack R. Benintende
1964 | Treasurer and Principal Financial and Accounting Officer, MainStay Funds (since 2007), MainStay Funds Trust (since 2009) | Managing Director, New York Life Investment Management LLC (since 2007); Treasurer and Principal Financial and Accounting Officer, MainStay CBRE Global Infrastructure Megatrends Term Fund (since 2021), MainStay MacKay DefinedTerm Municipal Opportunities Fund (since 2011) and MainStay VP Funds Trust (since 2007)**; and Assistant Treasurer, New York Life Investment Management Holdings LLC (2008 to 2012) | |
| | J. Kevin Gao
1967 | Secretary and Chief Legal Officer, MainStay Funds and MainStay Funds Trust (since 2010) | Managing Director and Associate General Counsel, New York Life Investment Management LLC (since 2010); Secretary and Chief Legal Officer, MainStay CBRE Global Infrastructure Megatrends Term Fund (since 2021), MainStay MacKay DefinedTerm Municipal Opportunities Fund (since 2011) and MainStay VP Funds Trust (since 2010)** | |
| | Kevin M. Gleason
1967 | Vice President and Chief Compliance Officer, MainStay Funds and MainStay Funds Trust (since June 2022) | Vice President and Chief Compliance Officer, IndexIQ Trust, IndexIQ ETF Trust and Index IQ Active ETF Trust (since June 2022); Vice President and Chief Compliance Officer, MainStay CBRE Global Infrastructure Megatrends Term Fund, MainStay VP Funds Trust and MainStay MacKay DefinedTerm Municipal Opportunities Fund (since June 2022); Senior Vice President, Voya Investment Management and Chief Compliance Officer, Voya Family of Funds (2012 to 2022) | |
| | Scott T. Harrington
1959 | Vice President— Administration, MainStay Funds (since 2005), MainStay Funds Trust (since 2009) | Managing Director, New York Life Investment Management LLC (including predecessor advisory organizations) (since 2000); Member of the Board of Directors, New York Life Trust Company (since 2009); Vice President—Administration, MainStay CBRE Global Infrastructure Megatrends Term Fund (since 2021), MainStay MacKay DefinedTerm Municipal Opportunities Fund (since 2011) and MainStay VP Funds Trust (since 2005)** | |
| * | The officers listed above are considered to be “interested persons” of the MainStay Group of Funds, MainStay VP Funds Trust, MainStay CBRE Global Infrastructure Megatrends Term Fund and MainStay MacKay DefinedTerm Municipal Opportunities Fund within the meaning of the 1940 Act because of their affiliation with the MainStay Group of Funds, New York Life Insurance Company and/or its affiliates, including New York Life Investment Management LLC, New York Life Insurance Company, NYLIM Service Company LLC, NYLIFE Securities LLC and/or NYLIFE Distributors LLC, as described in detail in the column captioned “Principal Occupation(s) During Past Five Years.” Officers are elected annually by the Board. |
| ** | Includes prior service as an Officer of MainStay VP Series Fund, Inc., the predecessor to MainStay VP Funds Trust. |
Officers of the Trust (Who are not Trustees)*
This page intentionally left blank.
This page intentionally left blank.
This page intentionally left blank.
Equity
U.S. Equity
MainStay Epoch U.S. Equity Yield Fund
MainStay Fiera SMID Growth Fund
MainStay PineStone U.S. Equity Fund
MainStay S&P 500 Index Fund
MainStay Winslow Large Cap Growth Fund
MainStay WMC Enduring Capital Fund
MainStay WMC Growth Fund
MainStay WMC Small Companies Fund
MainStay WMC Value Fund
International Equity
MainStay Epoch International Choice Fund
MainStay PineStone International Equity Fund
MainStay WMC International Research Equity Fund
Emerging Markets Equity
MainStay Candriam Emerging Markets Equity Fund
Global Equity
MainStay Epoch Capital Growth Fund
MainStay Epoch Global Equity Yield Fund
MainStay PineStone Global Equity Fund
Fixed Income
Taxable Income
MainStay Candriam Emerging Markets Debt Fund
MainStay Floating Rate Fund
MainStay MacKay High Yield Corporate Bond Fund
MainStay MacKay Short Duration High Yield Fund
MainStay MacKay Strategic Bond Fund
MainStay MacKay Total Return Bond Fund
MainStay MacKay U.S. Infrastructure Bond Fund
MainStay Short Term Bond Fund
Tax-Exempt Income
MainStay MacKay California Tax Free Opportunities Fund1
MainStay MacKay High Yield Municipal Bond Fund
MainStay MacKay New York Tax Free Opportunities Fund2
MainStay MacKay Short Term Municipal Fund
MainStay MacKay Strategic Municipal Allocation Fund
MainStay MacKay Tax Free Bond Fund
Money Market
MainStay Money Market Fund
Mixed Asset
MainStay Balanced Fund
MainStay Income Builder Fund
MainStay MacKay Convertible Fund
Speciality
MainStay CBRE Global Infrastructure Fund
MainStay CBRE Real Estate Fund
MainStay Cushing MLP Premier Fund
Asset Allocation
MainStay Conservative Allocation Fund
MainStay Conservative ETF Allocation Fund
MainStay Defensive ETF Allocation Fund
MainStay Equity Allocation Fund
MainStay Equity ETF Allocation Fund
MainStay ESG Multi-Asset Allocation Fund
MainStay Growth Allocation Fund
MainStay Growth ETF Allocation Fund
MainStay Moderate Allocation Fund
MainStay Moderate ETF Allocation Fund
Manager
New York Life Investment Management LLC
New York, New York
Subadvisors
Candriam3
Strassen, Luxembourg
CBRE Investment Management Listed Real Assets LLC
Radnor, Pennsylvania
Cushing Asset Management, LP
Dallas, Texas
Epoch Investment Partners, Inc.
New York, New York
Fiera Capital Inc.
New York, New York
IndexIQ Advisors LLC3
New York, New York
MacKay Shields LLC3
New York, New York
NYL Investors LLC3
New York, New York
PineStone Asset Management Inc.
Montreal, Québec
Wellington Management Company LLP
Boston, Massachusetts
Winslow Capital Management, LLC
Minneapolis, Minnesota
Legal Counsel
Dechert LLP
Washington, District of Columbia
Independent Registered Public Accounting Firm
KPMG LLP
Philadelphia, Pennsylvania
Distributor
NYLIFE Distributors LLC3
Jersey City, New Jersey
Custodian
JPMorgan Chase Bank, N.A.
New York, New York
1.
This Fund is registered for sale in AZ, CA, NV, OR, TX, UT, WA and MI (Class A and Class I shares only), and CO, FL, GA, HI, ID, MA, MD, NH, NJ and NY (Class I shares only).
| 2. | This Fund is registered for sale in CA, CT, DE, FL, MA, NJ, NY and VT. |
| 3. | An affiliate of New York Life Investment Management LLC. |
Not part of the Annual Report
For more information
800-624-6782
newyorklifeinvestments.com
“New York Life Investments” is both a service mark, and the common trade name, of certain investment advisors affiliated with New York Life Insurance Company. The MainStay Funds® are managed by New York Life Investment Management LLC and distributed by NYLIFE Distributors LLC, 30 Hudson Street, Jersey City, NJ 07302, a wholly owned subsidiary of New York Life Insurance Company. NYLIFE Distributors LLC is a Member FINRA/SIPC.
©2023 NYLIFE Distributors LLC. All rights reserved.
| 5013889MS139-23 | MSIB11-12/23 |
(NYLIM) NL216
MainStay MacKay Convertible Fund
Message from the President and Annual Report
October 31, 2023
Special Notice:
Beginning in July 2024, new regulations issued by the Securities and Exchange Commission (SEC) will take effect requiring open-end mutual fund companies and ETFs to (1) overhaul the content of their shareholder reports and (2) mail paper copies of the new tailored shareholder reports to shareholders who have not opted to receive these documents electronically.
If you have not yet elected to receive your shareholder reports electronically, please contact your financial intermediary or visit newyorklifeinvestments.com/accounts.
| Not FDIC/NCUA Insured | Not a Deposit | May Lose Value | No Bank Guarantee | Not Insured by Any Government Agency |
This page intentionally left blank
Message from the President
Volatile economic and geopolitical forces drove market behavior during the 12-month reporting period ended October 31, 2023. While equity markets generally gained ground, bond prices trended broadly lower.
Although the war in Ukraine, the outbreak of hostilities in the Middle East and several other notable events affected financial assets, inflation and interest rate trends stood at the forefront of market developments during most of the period. As the reporting period began, high levels of inflation already showed signs of easing in the face of aggressive rate hikes by the U.S. Federal Reserve (the “Fed”). From a peak of 9.1% in June 2022, the annualized U.S. inflation rate dropped to 7.1% in November 2022, and to 3.2% in October 2023. At the same time, the Fed increased the benchmark federal funds rate from 3.75%–4.00% at the beginning of the reporting period to 5.25%–5.50% as of October 31, 2023. As the pace of rate increases slowed during the period, investors hoped for an early shift to a looser monetary policy. However, comments from Fed members late in the period reinforced the central bank’s hawkish stance in response to surprisingly robust U.S. economic growth and rising wage pressures, thus increasing the likelihood that interest rates would stay higher for longer. International developed markets exhibited similar dynamics of elevated inflation and rising interest rates.
Despite the backdrop of high interest rates—along with political dysfunction in Washington D.C. and intensifying global geopolitical instability—equity markets managed to advance, supported by healthy consumer spending trends and persistent domestic economic growth. The S&P 500® Index, a widely regarded benchmark of large-cap U.S. market performance, gained ground, bolstered by the strong performance of energy stocks amid surging petroleum prices and mega-cap, growth-oriented, technology-related shares, which rose as investors flocked to companies creating the infrastructure for developments in artificial intelligence. Smaller-cap stocks and value-oriented shares produced milder returns. Among industry sectors, energy and
information technology posted the strongest gains. Real estate declined most sharply under pressure from rising mortgage rates and weak levels of office occupancy. Developed international markets outperformed U.S. markets, with Europe benefiting during the first half of the period from unexpected economic resilience in the face of rising energy prices and the ongoing war in Ukraine. Emerging markets posted positive results but lagged developed markets, largely due to slow economic growth in China despite the relaxation of pandemic-era lockdowns.
Bond prices were driven lower by rising yields and increasing expectations of high interest rates for an extended period of time. The U.S. yield curve steepened, with the 30-year Treasury yield exceeding 5% for the first time in more than a decade. The yield curve remained inverted, with the 10-year Treasury yield ending the period at 4.88%, compared with 5.07% for the 2-year Treasury yield. Corporate bonds outperformed long-term Treasury bonds, but still trended lower under pressure from rising yields and an uptick in default rates. Among corporates, lower-credit-quality instruments performed slightly better than their higher-credit-quality counterparts, while floating rate securities performed better still.
In the face of today’s uncertain market environment, New York Life Investments remains dedicated to providing the guidance, resources and investment solutions you need to pursue your financial goals.
Thank you for trusting us to help meet your investment needs.
Sincerely,
Kirk C. Lehneis
President
The opinions expressed are as of the date of this report and are subject to change. There is no guarantee that any forecast made will come to pass. This material does not constitute investment advice and is not intended as an endorsement of any specific investment. Past performance is no guarantee of future results.
Not part of the Annual Report
Investors should refer to the Fund’s Summary Prospectus and/or Prospectus and consider the Fund’s investment objectives, strategies, risks, charges and expenses carefully before investing. The Summary Prospectus and/or Prospectus contain this and other information about the Fund. You may obtain copies of the Fund’s Summary Prospectus, Prospectus and Statement of Additional Information, which includes information about The MainStay Funds' Trustees, free of charge, upon request, by calling toll-free 800-624-6782, by writing to NYLIFE Distributors LLC, Attn: MainStay Marketing Department, 30 Hudson Street, Jersey City, NJ 07302 or by sending an e-mail to MainStayShareholderServices@nylim.com. These documents are also available via the MainStay Funds’ website at newyorklifeinvestments.com. Please read the Fund’s Summary Prospectus and/or Prospectus carefully before investing.
Investment and Performance Comparison (Unaudited)
Performance data quoted represents past performance. Past performance is no guarantee of future results. Because of market volatility and other factors, current performance may be lower or higher than the figures shown. Investment return and principal value will fluctuate, and as a result, when shares are redeemed, they may be worth more or less than their original cost. The graph below depicts the historical performance of Class I shares of the Fund. Performance will vary from class to class based on differences in class-specific expenses and sales charges. For performance information current to the most recent month-end, please call 800-624-6782 or visit newyorklifeinvestments.com.
The performance table and graph do not reflect the deduction of taxes that a shareholder would pay on distributions or Fund share redemptions. Total returns reflect maximum applicable sales charges as indicated in the table below, if any, changes in share price, and reinvestment of dividend and capital gain distributions. The graph assumes the initial investment amount shown below and reflects the deduction of all sales charges that would have applied for the period of investment. Performance figures may reflect certain fee waivers and/or expense limitations, without which total returns may have been lower. For more information on share classes and current fee waivers and/or expense limitations (if any), please refer to the Notes to Financial Statements.
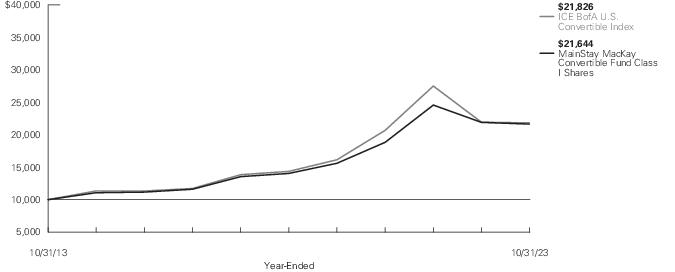
| Average Annual Total Returns for the Year-Ended October 31, 2023 |
| Class | Sales Charge | | Inception
Date | One
Year | Five
Years | Ten
Years | Gross
Expense
Ratio1 |
| Class A Shares | Maximum 5.50% Initial Sales Charge | With sales charges | 1/3/1995 | -6.95% | 7.45% | 7.08% | 0.92% |
| | | Excluding sales charges | | -1.54 | 8.68 | 7.69 | 0.92 |
| Investor Class Shares2 | Maximum 5.00% Initial Sales Charge | With sales charges | 2/28/2008 | -6.68 | 7.23 | 6.88 | 1.11 |
| | | Excluding sales charges | | -1.77 | 8.45 | 7.49 | 1.11 |
| Class B Shares3 | Maximum 5.00% CDSC | With sales charges | 5/1/1986 | -7.23 | 7.35 | 6.69 | 1.86 |
| | if Redeemed Within the First Six Years of Purchase | Excluding sales charges | | -2.51 | 7.65 | 6.69 | 1.86 |
| Class C Shares | Maximum 1.00% CDSC | With sales charges | 9/1/1998 | -3.46 | 7.65 | 6.68 | 1.86 |
| | if Redeemed Within One Year of Purchase | Excluding sales charges | | -2.51 | 7.65 | 6.68 | 1.86 |
| Class I Shares | No Sales Charge | | 11/28/2008 | -1.20 | 9.04 | 8.03 | 0.67 |
| 1. | The gross expense ratios presented reflect the Fund’s “Total Annual Fund Operating Expenses” from the most recent Prospectus, as supplemented, and may differ from other expense ratios disclosed in this report. |
| 2. | Prior to June 30, 2020, the maximum initial sales charge was 5.50%, which is reflected in the applicable average annual total return figures shown. |
| 3. | Class B shares are closed to all new purchases as well as additional investments by existing Class B shareholders. |
The footnotes on the next page are an integral part of the table and graph and should be carefully read in conjunction with them.
| Benchmark Performance* | One
Year | Five
Years | Ten
Years |
| ICE BofA U.S. Convertible Index1 | -0.48% | 8.73% | 8.12% |
| Morningstar Convertibles Category Average2 | -1.23 | 6.87 | 6.50 |
| * | Returns for indices reflect no deductions for fees, expenses or taxes, except for foreign withholding taxes where applicable. Results assume reinvestment of all dividends and capital gains. An investment cannot be made directly in an index. |
| 1. | The ICE BofA U.S. Convertible Index is the Fund’s primary broad–based securities market index for comparison purposes. The ICE BofA U.S. Convertible Index is a market-capitalization weighted index of domestic corporate convertible securities. In order to be included in this Index, bonds and preferred stocks must be convertible only to common stock. |
| 2. | The Morningstar Convertibles Category Average is representative of funds that are designed to offer some of the capital-appreciation potential of stock funds while also supplying some of the safety and yield of bond funds. Results are based on average total returns of similar funds with all dividends and capital gain distributions reinvested. |
The footnotes on the preceding page are an integral part of the table and graph and should be carefully read in conjunction with them.
| 6 | MainStay MacKay Convertible Fund |
Cost in Dollars of a $1,000 Investment in MainStay MacKay Convertible Fund (Unaudited)
The example below is intended to describe the fees and expenses borne by shareholders during the six-month period from May 1, 2023 to October 31, 2023, and the impact of those costs on your investment.
Example
As a shareholder of the Fund you incur two types of costs: (1) transaction costs, including exchange fees and sales charges (loads) on purchases (as applicable), and (2) ongoing costs, including management fees, distribution and/or service (12b-1) fees and other Fund expenses (as applicable). This example is intended to help you understand your ongoing costs (in dollars) of investing in the Fund and to compare these costs with the ongoing costs of investing in other mutual funds. The example is based on an investment of $1,000 made at the beginning of the six-month period and held for the entire period from May 1, 2023 to October 31, 2023.
This example illustrates your Fund’s ongoing costs in two ways:
Actual Expenses
The second and third data columns in the table below provide information about actual account values and actual expenses. You may use the information in these columns, together with the amount you invested, to estimate the expenses that you paid during the six months ended October 31, 2023. Simply divide your account value by $1,000 (for example, an
$8,600 account value divided by $1,000 = 8.6), then multiply the result by the number under the heading entitled “Expenses Paid During Period” to estimate the expenses you paid on your account during this period.
Hypothetical Example for Comparison Purposes
The fourth and fifth data columns in the table below provide information about hypothetical account values and hypothetical expenses based on the Fund’s actual expense ratio and an assumed rate of return of 5% per year before expenses, which is not the Fund’s actual return. The hypothetical account values and expenses may not be used to estimate the actual ending account balances or expenses you paid for the six-month period shown. You may use this information to compare the ongoing costs of investing in the Fund with the ongoing costs of investing in other mutual funds. To do so, compare this 5% hypothetical example with the 5% hypothetical examples that appear in the shareholder reports of the other mutual funds.
Please note that the expenses shown in the table are meant to highlight your ongoing costs only and do not reflect any transactional costs, such as exchange fees or sales charges (loads). Therefore, the fourth and fifth data columns of the table are useful in comparing ongoing costs only and will not help you determine the relative total costs of owning different funds. In addition, if these transactional costs were included, your costs would have been higher.
| Share Class | Beginning
Account
Value
5/1/23 | Ending Account
Value (Based
on Actual
Returns and
Expenses)
10/31/23 | Expenses
Paid
During
Period1 | Ending Account
Value (Based
on Hypothetical
5% Annualized
Return and
Actual Expenses)
10/31/23 | Expenses
Paid
During
Period1 | Net Expense
Ratio
During
Period2 |
| Class A Shares | $1,000.00 | $995.40 | $4.73 | $1,020.47 | $4.79 | 0.94% |
| Investor Class Shares | $1,000.00 | $994.20 | $5.88 | $1,019.31 | $5.96 | 1.17% |
| Class B Shares | $1,000.00 | $990.20 | $9.68 | $1,015.48 | $9.80 | 1.93% |
| Class C Shares | $1,000.00 | $990.20 | $9.68 | $1,015.48 | $9.80 | 1.93% |
| Class I Shares | $1,000.00 | $997.10 | $3.07 | $1,022.13 | $3.11 | 0.61% |
| 1. | Expenses are equal to the Fund’s annualized expense ratio of each class multiplied by the average account value over the period, divided by 365 and multiplied by 184 (to reflect the six-month period). The table above represents the actual expenses incurred during the six-month period. In addition to the fees and expenses which the Fund bears directly, it also indirectly bears a pro rata share of the fees and expenses of the underlying funds in which it invests. Such indirect expenses are not included in the above-reported expense figures. |
| 2. | Expenses are equal to the Fund's annualized expense ratio to reflect the six-month period. |
Portfolio Composition as of October 31, 2023 (Unaudited)
See Portfolio of Investments beginning on page 11 for specific holdings within these categories. The Fund's holdings are subject to change.
Top Ten Holdings and/or Issuers Held as of October 31, 2023 (excluding short-term investments) (Unaudited)
| 1. | EQT Corp., 1.75%, due 5/1/26 |
| 2. | Nice Ltd., (zero coupon), due 9/15/25 |
| 3. | Pioneer Natural Resources Co., 0.25%, due 5/15/25 |
| 4. | Permian Resources Operating LLC, 3.25%, due 4/1/28 |
| 5. | Microchip Technology, Inc., 0.125%, due 11/15/24 |
| 6. | Helix Energy Solutions Group, Inc., 6.75%, due 2/15/26 |
| 7. | BioMarin Pharmaceutical, Inc., 1.25%, due 5/15/27 |
| 8. | Liberty Media Corp., 2.25%-3.75%, due 8/15/27–3/15/28 |
| 9. | Oil States International, Inc., 4.75%, due 4/1/26 |
| 10. | Lantheus Holdings, Inc., 2.625%, due 12/15/27 |
| 8 | MainStay MacKay Convertible Fund |
Portfolio Management Discussion and Analysis (Unaudited)
Questions answered by portfolio manager Edward Silverstein, CFA, of MacKay Shields LLC, the Fund’s Subadvisor.
How did MainStay MacKay Convertible Fund perform relative to its benchmark and peer group during the 12 months ended October 31, 2023?
For the 12 months ended October 31, 2023, Class I shares of MainStay MacKay Convertible Fund returned −1.20%, underperforming the −0.48% return of the Fund’s benchmark, the ICE BofA U.S. Convertible Index (the "Index"). Over the same period, Class I shares outperformed the −1.23% return of the Morningstar Convertibles Category Average.1
What factors affected the Fund’s relative performance during the reporting period?
The Fund underperformed the Index during a period in which there were no overriding market themes that dictated performance; relative returns were largely a function of idiosyncratic winners and losers.
During the reporting period, which sectors were the strongest positive contributors to the Fund’s relative performance and which sectors were particularly weak?
Relative to the Index, the strongest positive contribution to the Fund’s performance came from overweight allocation to and favorable stock selection in the energy sector. (Contributions take weightings and total returns into account.) Underweight exposure to materials also contributed on a relative basis. Conversely, an underweight allocation to and security selection in the financials and information technology sectors undermined relative returns. Additionally, security selection in the industrial sector weakened the relative return.
During the reporting period, which individual stocks made the strongest positive contributions to the Fund’s absolute performance and which stocks detracted the most?
The three strongest contributors to the Fund’s absolute performance included the common shares of Weatherford International and the convertible bonds of Permian Resources and Helix Energy. All three holdings are energy related. The common shares of Weatherford International were received by the Fund as part of a reorganization in 2019. The shares rose more than 120% during the reporting period as the company reported several consecutive quarterly earnings that exceeded analyst expectations. The convertible bonds of exploration and production company Permian Resources rose during the reporting period despite the price of crude oil falling slightly during the same period. Permian Resources announced and consummated several acquisitions during the reporting period that were accretive to earnings and cash flow. The convertible bonds of oil service company Helix Energy rose during the reporting period after the
company reported strong earnings and raised earnings guidance for the full calendar year.
The Fund’s three worst-performing individual holdings in absolute terms were the convertible bonds and convertible preferred shares of Chart Industries, and the convertible bonds of Elevance Health and EQT. The convertible bonds and convertible preferred shares of industrial manufacturer Chart Industries declined during the reporting period after the company announced the acquisition of manufacturer Howden from private equity owners. The acquisition required Chart to assume significant additional debt and diluted the company’s core niche franchise of manufacturing equipment used to supercool natural gas for transport by ship. The convertible bonds of health insurer Elevance Health declined during the reporting period when investors became concerned that insured medical expenses would increase, as elective procedures that had been put off during the pandemic would now be performed. The convertible bonds of natural gas producer EQT fell during the reporting period as near-record warmth during the winter of 2022-23 led to decreased use of natural gas for heating and a decline in commodity prices.
What were some of the Fund’s largest purchases and sales during the reporting period?
During the reporting period, the Fund initiated positions in the convertible bonds of Lantheus Holdings, Rivian Automotive and TransMedics Group. We initiated the Fund’s position in Lantheus Holdings on the initial public offering of the convertible notes. The company has a fast-growing business developing and marketing medical imaging products that are relatively immune to the economic cycle. In addition, we believe the company has a strong balance sheet and generates significant free cash flow. We initiated the Fund’s position in the convertible bonds of Rivian Automotive on the initial public offering of those bonds. Although the company burned through more than $6 billion of cash last year, we believe that burn rate will slow as the company is able to spread its large, fixed costs over a rapidly growing production base. The company’s electric vehicles have been well-received by consumers, and are innovative and relatively unique. The Fund also purchased the convertible bonds of medical equipment manufacturer TransMedics Group, as the company developed a novel protocol for preserving hearts, lungs and liver for storage and transport before transplantation.
During the same period we made several notable sales. We trimmed the Fund’s two largest energy-related holdings, EQT and Pioneer Natural Resources. Both positions grew in size through appreciation since their initial purchase in 2020. As both bonds increased in price, they became very equity sensitive, with little downside protection. In addition to decreasing the position size of each holding, we also wanted to decrease the Fund’s exposure to the energy sector in general. Two very large holdings exited the
| 1. | See "Investment and Performance Comparison" for other share class returns, which may be higher or lower than Class I share returns, and for more information on benchmark and peer group returns. |
Fund through a maturity and a call of the bond by the issuer. The convertible preferred shares of Danaher matured in April, and the convertible bonds of health insurer Elevance Health were called by the issuer in February. Lastly, we sold the Fund’s entire holding of the convertible bonds of pay-TV provider DISH Networks, as we believe the company will have difficulty refinancing its large debt burden when some of its larger maturities come due in 2025. However, we do not anticipate much residual value for the subordinated convertible debt holders in the event that company goes through a financial restructuring.
How did the Fund’s sector weightings change during the reporting period?
During the reporting period, there were no material changes to the Fund’s sector positioning. At the margin, the Fund increased its exposure to the financials, industrials and consumer discretionary sectors, and reduced its exposure to the utilities, information technology and communication services sectors.
How was the Fund positioned at the end of the reporting period?
As of October 31, 2023, the Fund held overweight exposure to the energy, health care and consumer staples sectors. As of the same date, the Fund held underweight exposure to the information technology, financials, utilities, consumer discretionary and communication services sectors.
The opinions expressed are those of the portfolio manager as of the date of this report and are subject to change. There is no guarantee that any forecasts will come to pass. This material does not constitute investment advice and is not intended as an endorsement of any specific investment.
| 10 | MainStay MacKay Convertible Fund |
Portfolio of Investments October 31, 2023†^
| | Principal
Amount | Value |
| Long-Term Bonds 0.8% |
| Corporate Bonds 0.8% |
| Biotechnology 0.5% |
| Bridgebio Pharma, Inc. | | |
| 2.50%, due 3/15/27 | $ 6,975,000 | $ 6,628,689 |
| Hotels, Restaurants & Leisure 0.3% |
| NCL Corp. Ltd. | | |
| 5.375%, due 8/1/25 | 4,670,000 | 4,938,525 |
Total Corporate Bonds
(Cost $11,645,000) | | 11,567,214 |
Total Long-Term Bonds
(Cost $11,645,000) | | 11,567,214 |
| Convertible Securities 88.0% |
| Convertible Bonds 83.7% |
| Automobile Components 1.0% |
| Patrick Industries, Inc. | | |
| 1.75%, due 12/1/28 | 16,362,000 | 15,470,271 |
| Automobiles 2.2% |
| Ford Motor Co. | | |
| (zero coupon), due 3/15/26 | 27,838,000 | 25,541,365 |
| Rivian Automotive, Inc. | | |
| 4.625%, due 3/15/29 (a) | 8,144,000 | 8,604,136 |
| | | 34,145,501 |
| Beverages 1.5% |
| MGP Ingredients, Inc. | | |
| 1.875%, due 11/15/41 | 19,959,000 | 22,632,919 |
| Biotechnology 5.9% |
| Alnylam Pharmaceuticals, Inc. | | |
| 1.00%, due 9/15/27 | 5,460,000 | 4,747,674 |
| BioMarin Pharmaceutical, Inc. | | |
| 1.25%, due 5/15/27 (b) | 34,659,000 | 33,495,949 |
| Exact Sciences Corp. | | |
| 0.375%, due 3/1/28 | 22,800,000 | 18,952,680 |
| Halozyme Therapeutics, Inc. | | |
| 1.00%, due 8/15/28 | 17,827,000 | 15,643,192 |
| Ionis Pharmaceuticals, Inc. | | |
| (zero coupon), due 4/1/26 | 9,349,000 | 9,063,856 |
| Mirum Pharmaceuticals, Inc. | | |
| 4.00%, due 5/1/29 (a) | 6,681,000 | 7,804,243 |
| | | 89,707,594 |
| | Principal
Amount | Value |
| |
| Broadline Retail 1.2% |
| Etsy, Inc. | | |
| 0.25%, due 6/15/28 | $ 25,139,000 | $ 18,577,721 |
| Commercial Services & Supplies 1.0% |
| Tetra Tech, Inc. | | |
| 2.25%, due 8/15/28 (a) | 15,927,000 | 15,488,954 |
| Communications Equipment 2.7% |
| Infinera Corp. | | |
| 2.50%, due 3/1/27 | 7,050,000 | 5,588,642 |
| Lumentum Holdings, Inc. | | |
| 0.50%, due 12/15/26 | 25,385,000 | 20,816,203 |
| Viavi Solutions, Inc. | | |
| 1.00%, due 3/1/24 | 14,679,000 | 14,395,172 |
| | | 40,800,017 |
| Consumer Staples Distribution & Retail 0.6% |
| Chefs' Warehouse, Inc. (The) | | |
| 2.375%, due 12/15/28 (a) | 11,305,000 | 8,727,460 |
| Electric Utilities 1.7% |
| NRG Energy, Inc. | | |
| 2.75%, due 6/1/48 | 23,454,000 | 26,315,388 |
| Electrical Equipment 0.5% |
| Array Technologies, Inc. | | |
| 1.00%, due 12/1/28 | 7,636,000 | 7,361,104 |
| Electronic Equipment, Instruments & Components 0.6% |
| Advanced Energy Industries, Inc. | | |
| 2.50%, due 9/15/28 (a) | 10,404,000 | 9,662,919 |
| Energy Equipment & Services 4.0% |
| Helix Energy Solutions Group, Inc. | | |
| 6.75%, due 2/15/26 | 21,575,000 | 33,775,663 |
| Oil States International, Inc. | | |
| 4.75%, due 4/1/26 | 25,301,000 | 26,602,582 |
| | | 60,378,245 |
| Entertainment 3.0% |
| Liberty Media Corp. | | |
| 2.25%, due 8/15/27 (b) | 13,561,000 | 13,658,936 |
| 3.75%, due 3/15/28 (a) | 13,850,000 | 15,124,200 |
| Live Nation Entertainment, Inc. | | |
| 3.125%, due 1/15/29 (a) | 16,065,000 | 16,169,423 |
| | | 44,952,559 |
The notes to the financial statements are an integral part of, and should be read in conjunction with, the financial statements.
11
Portfolio of Investments October 31, 2023†^ (continued)
| | Principal
Amount | Value |
| Convertible Bonds (continued) |
| Financial Services 2.8% |
| Block, Inc. | | |
| 0.125%, due 3/1/25 | $ 19,416,000 | $ 17,979,216 |
| Euronet Worldwide, Inc. | | |
| 0.75%, due 3/15/49 | 11,900,000 | 11,022,375 |
| Shift4 Payments, Inc. | | |
| (zero coupon), due 12/15/25 | 14,428,000 | 12,985,200 |
| | | 41,986,791 |
| Food Products 0.9% |
| Post Holdings, Inc. | | |
| 2.50%, due 8/15/27 | 14,839,000 | 14,148,986 |
| Ground Transportation 0.8% |
| Uber Technologies, Inc. | | |
| (zero coupon), due 12/15/25 (b) | 13,355,000 | 12,203,484 |
| Health Care Equipment & Supplies 9.7% |
| CONMED Corp. | | |
| 2.25%, due 6/15/27 | 23,095,000 | 21,628,467 |
| Dexcom, Inc. | | |
| 0.25%, due 11/15/25 | 16,375,000 | 15,556,250 |
| Envista Holdings Corp. | | |
| 1.75%, due 8/15/28 (a) | 13,795,000 | 11,946,470 |
| Haemonetics Corp. | | |
| (zero coupon), due 3/1/26 | 9,226,000 | 7,957,883 |
| Integer Holdings Corp. | | |
| 2.125%, due 2/15/28 (a) | 14,032,000 | 15,459,858 |
| Integra LifeSciences Holdings Corp. | | |
| 0.50%, due 8/15/25 | 8,670,000 | 7,846,350 |
| Lantheus Holdings, Inc. | | |
| 2.625%, due 12/15/27 (a) | 23,906,000 | 26,557,744 |
| NuVasive, Inc. | | |
| 0.375%, due 3/15/25 | 8,085,000 | 7,430,115 |
| Omnicell, Inc. | | |
| 0.25%, due 9/15/25 | 9,388,000 | 8,367,055 |
| Shockwave Medical, Inc. | | |
| 1.00%, due 8/15/28 (a) | 13,928,000 | 13,524,088 |
| TransMedics Group, Inc. | | |
| 1.50%, due 6/1/28 (a) | 14,963,000 | 11,564,953 |
| | | 147,839,233 |
| Health Care Technology 0.6% |
| Teladoc Health, Inc. | | |
| 1.25%, due 6/1/27 | 11,764,000 | 9,193,566 |
| | Principal
Amount | Value |
| |
| Hotel & Resort REITs 0.7% |
| Summit Hotel Properties, Inc. | | |
| 1.50%, due 2/15/26 | $ 12,566,000 | $ 10,463,615 |
| Hotels, Restaurants & Leisure 5.1% |
| Booking Holdings, Inc. | | |
| 0.75%, due 5/1/25 | 10,000,000 | 15,288,627 |
| Carnival Corp. | | |
| 5.75%, due 12/1/27 (a) | 10,297,000 | 12,241,997 |
| Cheesecake Factory, Inc. (The) | | |
| 0.375%, due 6/15/26 | 9,208,000 | 7,686,544 |
| Expedia Group, Inc. | | |
| (zero coupon), due 2/15/26 | 2,822,000 | 2,466,286 |
| Marriott Vacations Worldwide Corp. | | |
| (zero coupon), due 1/15/26 | 3,110,000 | 2,680,820 |
| NCL Corp. Ltd. | | |
| 6.00%, due 5/15/24 | 2,849,000 | 3,264,954 |
| Royal Caribbean Cruises Ltd. | | |
| 6.00%, due 8/15/25 | 3,620,000 | 6,626,410 |
| Sabre GLBL, Inc. | | |
| 4.00%, due 4/15/25 | 1,835,000 | 1,662,988 |
| Vail Resorts, Inc. | | |
| (zero coupon), due 1/1/26 (b) | 28,521,000 | 24,938,050 |
| | | 76,856,676 |
| Interactive Media & Services 2.0% |
| Match Group Financeco 2, Inc. | | |
| 0.875%, due 6/15/26 (a) | 12,450,000 | 10,757,538 |
| Snap, Inc. | | |
| (zero coupon), due 5/1/27 | 10,018,000 | 7,518,509 |
| 0.125%, due 3/1/28 | 12,073,000 | 8,239,822 |
| Ziff Davis, Inc. | | |
| 1.75%, due 11/1/26 | 5,220,000 | 4,721,490 |
| | | 31,237,359 |
| IT Services 2.2% |
| Akamai Technologies, Inc. | | |
| 0.375%, due 9/1/27 | 16,529,000 | 16,884,373 |
| MongoDB, Inc. | | |
| 0.25%, due 1/15/26 | 7,075,000 | 12,078,794 |
| Okta, Inc. | | |
| 0.125%, due 9/1/25 | 5,611,000 | 5,024,651 |
| | | 33,987,818 |
| Machinery 1.5% |
| Chart Industries, Inc. | | |
| 1.00%, due 11/15/24 | 7,336,000 | 14,807,716 |
The notes to the financial statements are an integral part of, and should be read in conjunction with, the financial statements.
| 12 | MainStay MacKay Convertible Fund |
| | Principal
Amount | Value |
| Convertible Bonds (continued) |
| Machinery (continued) |
| Greenbrier Cos., Inc. (The) | | |
| 2.875%, due 4/15/28 | $ 8,991,000 | $ 7,810,482 |
| | | 22,618,198 |
| Media 0.6% |
| Liberty Broadband Corp. | | |
| 3.125%, due 3/31/53 (a) | 9,263,000 | 9,234,356 |
| Oil, Gas & Consumable Fuels 8.2% |
| EQT Corp. | | |
| 1.75%, due 5/1/26 | 15,238,000 | 44,220,474 |
| Northern Oil and Gas, Inc. | | |
| 3.625%, due 4/15/29 | 6,400,000 | 7,571,200 |
| Permian Resources Operating LLC | | |
| 3.25%, due 4/1/28 | 14,317,000 | 35,291,161 |
| Pioneer Natural Resources Co. | | |
| 0.25%, due 5/15/25 | 14,549,000 | 37,159,210 |
| | | 124,242,045 |
| Passenger Airlines 2.2% |
| American Airlines Group, Inc. | | |
| 6.50%, due 7/1/25 | 7,040,000 | 7,166,720 |
| Southwest Airlines Co. | | |
| 1.25%, due 5/1/25 (b) | 27,566,000 | 26,249,723 |
| | | 33,416,443 |
| Pharmaceuticals 1.8% |
| Amphastar Pharmaceuticals, Inc. | | |
| 2.00%, due 3/15/29 (a) | 12,724,000 | 12,450,434 |
| Pacira BioSciences, Inc. | | |
| 0.75%, due 8/1/25 | 16,524,000 | 14,892,255 |
| | | 27,342,689 |
| Professional Services 0.4% |
| Parsons Corp. | | |
| 0.25%, due 8/15/25 | 4,641,000 | 6,075,069 |
| Real Estate Management & Development 1.1% |
| Zillow Group, Inc. | | |
| 2.75%, due 5/15/25 (b) | 16,626,000 | 16,185,930 |
| Semiconductors & Semiconductor Equipment 5.5% |
| Enphase Energy, Inc. | | |
| (zero coupon), due 3/1/26 | 15,816,000 | 13,538,496 |
| Impinj, Inc. | | |
| 1.125%, due 5/15/27 | 4,665,000 | 4,320,887 |
| | Principal
Amount | Value |
| |
| Semiconductors & Semiconductor Equipment (continued) |
| Microchip Technology, Inc. | | |
| 0.125%, due 11/15/24 (b) | $ 33,300,000 | $ 33,778,687 |
| ON Semiconductor Corp. | | |
| 0.50%, due 3/1/29 (a) | 23,069,000 | 20,300,720 |
| SolarEdge Technologies, Inc. | | |
| (zero coupon), due 9/15/25 | 7,790,000 | 6,800,670 |
| Wolfspeed, Inc. | | |
| 0.25%, due 2/15/28 | 8,931,000 | 5,577,410 |
| 1.875%, due 12/1/29 (a) | 1,000 | 600 |
| | | 84,317,470 |
| Software 10.8% |
| Bentley Systems, Inc. | | |
| 0.125%, due 1/15/26 | 3,570,000 | 3,400,649 |
| BILL Holdings, Inc. | | |
| (zero coupon), due 12/1/25 | 4,680,000 | 4,451,850 |
| Datadog, Inc. | | |
| 0.125%, due 6/15/25 | 9,636,000 | 10,657,416 |
| Dropbox, Inc. | | |
| (zero coupon), due 3/1/28 | 11,036,000 | 10,256,583 |
| Envestnet, Inc. | | |
| 2.625%, due 12/1/27 (a) | 14,212,000 | 12,222,320 |
| InterDigital, Inc. | | |
| 2.00%, due 6/1/24 | 4,500,000 | 4,606,875 |
| Model N, Inc. | | |
| 1.875%, due 3/15/28 (a) | 10,589,000 | 9,381,854 |
| Nice Ltd. | | |
| (zero coupon), due 9/15/25 | 46,000,000 | 40,940,000 |
| Palo Alto Networks, Inc. | | |
| 0.375%, due 6/1/25 | 9,385,000 | 22,965,095 |
| Q2 Holdings, Inc. | | |
| 0.75%, due 6/1/26 | 4,395,000 | 3,802,692 |
| Rapid7, Inc. | | |
| 1.25%, due 3/15/29 (a) | 6,025,000 | 5,823,163 |
| Splunk, Inc. | | |
| 1.125%, due 9/15/25 | 16,539,000 | 17,804,233 |
| Workiva, Inc. | | |
| 1.25%, due 8/15/28 (a) | 7,850,000 | 7,139,575 |
| Zscaler, Inc. | | |
| 0.125%, due 7/1/25 | 8,613,000 | 10,533,699 |
| | | 163,986,004 |
| Specialty Retail 0.6% |
| Burlington Stores, Inc. | | |
| 1.25%, due 12/15/27 (a) | 9,505,000 | 8,516,480 |
The notes to the financial statements are an integral part of, and should be read in conjunction with, the financial statements.
13
Portfolio of Investments October 31, 2023†^ (continued)
| | Principal
Amount | Value |
| Convertible Bonds (continued) |
| Technology Hardware, Storage & Peripherals 0.3% |
| Seagate HDD Cayman | | |
| 3.50%, due 6/1/28 (a) | $ 4,610,000 | $ 4,801,315 |
Total Convertible Bonds
(Cost $1,281,241,286) | | 1,272,874,179 |
| |
| | Shares | |
| |
| Convertible Preferred Stocks 4.3% |
| Banks 1.7% |
| Bank of America Corp. | |
| Series L | | |
| 7.25% (c) | 12,072 | 12,714,230 |
| Wells Fargo & Co. | |
| Series L | | |
| 7.50% (c) | 11,552 | 12,202,378 |
| | | 24,916,608 |
| Electric Utilities 0.6% |
| NextEra Energy, Inc. | |
| 6.926% | 250,000 | 9,385,000 |
| Financial Services 0.9% |
| Apollo Global Management, Inc. | |
| 6.75% (b) | 289,050 | 13,906,196 |
| Independent Power and Renewable Electricity Producers 0.6% |
| AES Corp. (The) | |
| 6.875% | 147,100 | 8,867,188 |
| Machinery 0.5% |
| Chart Industries, Inc. | |
| Series B | | |
| 6.75% | 163,900 | 8,057,324 |
Total Convertible Preferred Stocks
(Cost $81,135,829) | | 65,132,316 |
Total Convertible Securities
(Cost $1,362,377,115) | | 1,338,006,495 |
| Common Stocks 2.9% |
| Energy Equipment & Services 1.7% |
| Weatherford International plc (d) | 272,914 | 25,405,564 |
| Life Sciences Tools & Services 0.9% |
| Danaher Corp. | 73,404 | 14,095,036 |
| | Shares | | Value |
| |
| Oil, Gas & Consumable Fuels 0.3% |
| Kosmos Energy Ltd. (d) | 731,525 | | $ 5,296,241 |
Total Common Stocks
(Cost $29,034,267) | | | 44,796,841 |
| Short-Term Investments 10.9% |
| Affiliated Investment Company 8.0% |
| MainStay U.S. Government Liquidity Fund, 5.275% (e)(f) | 121,939,037 | | 121,939,037 |
| Unaffiliated Investment Companies 2.9% |
| Goldman Sachs Financial Square Government Fund, 5.356% (f)(g) | 12,000,000 | | 12,000,000 |
| Invesco Government & Agency Portfolio, 5.357% (f)(g) | 10,757,250 | | 10,757,250 |
| RBC U.S. Government Money Market Fund, 5.399% (f)(g) | 1,000,000 | | 1,000,000 |
| State Street Institutional U.S. Government Money Market Fund, 5.358% (f)(g) | 20,000,000 | | 20,000,000 |
| | | | 43,757,250 |
Total Short-Term Investments
(Cost $165,696,287) | | | 165,696,287 |
Total Investments
(Cost $1,568,752,669) | 102.6% | | 1,560,066,837 |
| Other Assets, Less Liabilities | (2.6) | | (40,035,700) |
| Net Assets | 100.0% | | $ 1,520,031,137 |
| † | Percentages indicated are based on Fund net assets. |
| ^ | Industry classifications may be different than those used for compliance monitoring purposes. |
| (a) | May be sold to institutional investors only under Rule 144A or securities offered pursuant to Section 4(a)(2) of the Securities Act of 1933, as amended. |
| (b) | All or a portion of this security was held on loan. As of October 31, 2023, the aggregate market value of securities on loan was $42,867,913. The Fund received cash collateral with a value of $43,757,250. (See Note 2(G)) |
| (c) | Security is perpetual and, thus, does not have a predetermined maturity date. The date shown, if applicable, reflects the next call date. |
| (d) | Non-income producing security. |
| (e) | As of October 31, 2023, the Fund's ownership exceeds 5% of the outstanding shares of the Underlying Fund's share class. |
| (f) | Current yield as of October 31, 2023. |
| (g) | Represents a security purchased with cash collateral received for securities on loan. |
The notes to the financial statements are an integral part of, and should be read in conjunction with, the financial statements.
| 14 | MainStay MacKay Convertible Fund |
Investments in Affiliates (in 000's)
Investments in issuers considered to be affiliate(s) of the Fund during the year ended October 31, 2023 for purposes of Section 2(a)(3) of the Investment Company Act of 1940, as amended, were as follows:
| Affiliated Investment Companies | Value,
Beginning
of Year | Purchases
at Cost | Proceeds
from
Sales | Net
Realized
Gain/(Loss)
on Sales | Change in
Unrealized
Appreciation/
(Depreciation) | Value,
End of
Year | Dividend
Income | Other
Distributions | Shares
End of
Year |
| MainStay U.S. Government Liquidity Fund | $ 90,286 | $ 472,760 | $ (441,107) | $ — | $ — | $ 121,939 | $ 5,509 | $ — | 121,939 |
| Abbreviation(s): |
| REIT—Real Estate Investment Trust |
The following is a summary of the fair valuations according to the inputs used as of October 31, 2023, for valuing the Fund’s assets:
| Description | Quoted
Prices in
Active
Markets for
Identical
Assets
(Level 1) | | Significant
Other
Observable
Inputs
(Level 2) | | Significant
Unobservable
Inputs
(Level 3) | | Total |
| Asset Valuation Inputs | | | | | | | |
| Investments in Securities (a) | | | | | | | |
| Long-Term Bonds | | | | | | | |
| Corporate Bonds | $ — | | $ 11,567,214 | | $ — | | $ 11,567,214 |
| Total Corporate Bonds | — | | 11,567,214 | | — | | 11,567,214 |
| Convertible Securities | | | | | | | |
| Convertible Bonds | — | | 1,272,874,179 | | — | | 1,272,874,179 |
| Convertible Preferred Stocks | 65,132,316 | | — | | — | | 65,132,316 |
| Total Convertible Securities | 65,132,316 | | 1,272,874,179 | | — | | 1,338,006,495 |
| Common Stocks | 44,796,841 | | — | | — | | 44,796,841 |
| Short-Term Investments | | | | | | | |
| Affiliated Investment Company | 121,939,037 | | — | | — | | 121,939,037 |
| Unaffiliated Investment Companies | 43,757,250 | | — | | — | | 43,757,250 |
| Total Short-Term Investments | 165,696,287 | | — | | — | | 165,696,287 |
| Total Investments in Securities | $ 275,625,444 | | $ 1,284,441,393 | | $ — | | $ 1,560,066,837 |
| (a) | For a complete listing of investments and their industries, see the Portfolio of Investments. |
The notes to the financial statements are an integral part of, and should be read in conjunction with, the financial statements.
15
Statement of Assets and Liabilities as of October 31, 2023
| Assets |
Investment in unaffiliated securities, at value
(identified cost $1,446,813,632) including securities on loan of $42,867,913 | $1,438,127,800 |
Investment in affiliated investment companies, at value
(identified cost $121,939,037) | 121,939,037 |
| Receivables: | |
| Dividends and interest | 5,435,413 |
| Fund shares sold | 993,731 |
| Securities lending | 125,214 |
| Other assets | 57,564 |
| Total assets | 1,566,678,759 |
| Liabilities |
| Cash collateral received for securities on loan | 43,757,250 |
| Payables: | |
| Fund shares redeemed | 1,658,503 |
| Manager (See Note 3) | 667,527 |
| Transfer agent (See Note 3) | 330,692 |
| NYLIFE Distributors (See Note 3) | 178,175 |
| Professional fees | 31,446 |
| Shareholder communication | 12,389 |
| Custodian | 11,316 |
| Accrued expenses | 324 |
| Total liabilities | 46,647,622 |
| Net assets | $1,520,031,137 |
| Composition of Net Assets |
| Shares of beneficial interest outstanding (par value of $.01 per share) unlimited number of shares authorized | $ 882,571 |
| Additional paid-in-capital | 1,503,132,386 |
| | 1,504,014,957 |
| Total distributable earnings (loss) | 16,016,180 |
| Net assets | $1,520,031,137 |
| Class A | |
| Net assets applicable to outstanding shares | $643,975,304 |
| Shares of beneficial interest outstanding | 37,423,265 |
| Net asset value per share outstanding | $ 17.21 |
| Maximum sales charge (5.50% of offering price) | 1.00 |
| Maximum offering price per share outstanding | $ 18.21 |
| Investor Class | |
| Net assets applicable to outstanding shares | $ 39,300,988 |
| Shares of beneficial interest outstanding | 2,284,908 |
| Net asset value per share outstanding | $ 17.20 |
| Maximum sales charge (5.00% of offering price) | 0.91 |
| Maximum offering price per share outstanding | $ 18.11 |
| Class B | |
| Net assets applicable to outstanding shares | $ 2,875,552 |
| Shares of beneficial interest outstanding | 171,675 |
| Net asset value and offering price per share outstanding | $ 16.75 |
| Class C | |
| Net assets applicable to outstanding shares | $ 30,340,387 |
| Shares of beneficial interest outstanding | 1,814,490 |
| Net asset value and offering price per share outstanding | $ 16.72 |
| Class I | |
| Net assets applicable to outstanding shares | $803,538,906 |
| Shares of beneficial interest outstanding | 46,562,763 |
| Net asset value and offering price per share outstanding | $ 17.26 |
The notes to the financial statements are an integral part of, and should be read in conjunction with, the financial statements.
| 16 | MainStay MacKay Convertible Fund |
Statement of Operations for the year ended October 31, 2023
| Investment Income (Loss) |
| Income | |
| Interest | $ 16,282,711 |
| Dividends-unaffiliated | 7,113,968 |
| Dividends-affiliated | 5,509,025 |
| Securities lending, net | 2,735,361 |
| Total income | 31,641,065 |
| Expenses | |
| Manager (See Note 3) | 8,851,765 |
| Distribution/Service—Class A (See Note 3) | 1,717,927 |
| Distribution/Service—Investor Class (See Note 3) | 106,118 |
| Distribution/Service—Class B (See Note 3) | 43,879 |
| Distribution/Service—Class C (See Note 3) | 354,304 |
| Transfer agent (See Note 3) | 1,968,412 |
| Professional fees | 187,173 |
| Registration | 131,579 |
| Shareholder communication | 50,073 |
| Trustees | 40,984 |
| Custodian | 33,247 |
| Miscellaneous | 47,396 |
| Total expenses before waiver/reimbursement | 13,532,857 |
| Expense waiver/reimbursement from Manager (See Note 3) | (682,379) |
| Reimbursement from prior custodian(a) | (3,161) |
| Net expenses | 12,847,317 |
| Net investment income (loss) | 18,793,748 |
| Realized and Unrealized Gain (Loss) |
| Net realized gain (loss) on unaffiliated investments | 37,264,047 |
| Net change in unrealized appreciation (depreciation) on unaffiliated investments | (77,962,200) |
| Net realized and unrealized gain (loss) | (40,698,153) |
| Net increase (decrease) in net assets resulting from operations | $(21,904,405) |
| (a) | Represents a refund for overbilling of custody fees. |
The notes to the financial statements are an integral part of, and should be read in conjunction with, the financial statements.
17
Statements of Changes in Net Assets
for the years ended October 31, 2023 and October 31, 2022
| | 2023 | 2022 |
| Increase (Decrease) in Net Assets |
| Operations: | | |
| Net investment income (loss) | $ 18,793,748 | $ 8,774,161 |
| Net realized gain (loss) | 37,264,047 | 42,015,068 |
| Net change in unrealized appreciation (depreciation) | (77,962,200) | (273,994,065) |
| Net increase (decrease) in net assets resulting from operations | (21,904,405) | (223,204,836) |
| Distributions to shareholders: | | |
| Class A | (28,543,013) | (166,284,769) |
| Investor Class | (1,663,727) | (9,946,970) |
| Class B | (165,522) | (1,897,436) |
| Class C | (1,214,881) | (10,369,117) |
| Class I | (36,064,849) | (192,363,201) |
| Total distributions to shareholders | (67,651,992) | (380,861,493) |
| Capital share transactions: | | |
| Net proceeds from sales of shares | 347,611,752 | 509,415,950 |
| Net asset value of shares issued to shareholders in reinvestment of distributions | 63,333,222 | 348,922,823 |
| Cost of shares redeemed | (426,265,819) | (632,144,077) |
| Increase (decrease) in net assets derived from capital share transactions | (15,320,845) | 226,194,696 |
| Net increase (decrease) in net assets | (104,877,242) | (377,871,633) |
| Net Assets |
| Beginning of year | 1,624,908,379 | 2,002,780,012 |
| End of year | $1,520,031,137 | $1,624,908,379 |
The notes to the financial statements are an integral part of, and should be read in conjunction with, the financial statements.
| 18 | MainStay MacKay Convertible Fund |
Financial Highlights selected per share data and ratios
| | Year Ended October 31, |
| Class A | 2023 | | 2022 | | 2021 | | 2020 | | 2019 |
| Net asset value at beginning of year | $ 18.22 | | $ 25.40 | | $ 20.90 | | $ 17.81 | | $ 17.07 |
| Net investment income (loss) (a) | 0.18 | | 0.07 | | 0.05 | | 0.06 | | 0.12 |
| Net realized and unrealized gain (loss) | (0.45) | | (2.50) | | 6.01 | | 3.47 | | 1.60 |
| Total from investment operations | (0.27) | | (2.43) | | 6.06 | | 3.53 | | 1.72 |
| Less distributions: | | | | | | | | | |
| From net investment income | (0.29) | | (0.26) | | (0.13) | | (0.13) | | (0.15) |
| From net realized gain on investments | (0.45) | | (4.49) | | (1.43) | | (0.31) | | (0.83) |
| Total distributions | (0.74) | | (4.75) | | (1.56) | | (0.44) | | (0.98) |
| Net asset value at end of year | $ 17.21 | | $ 18.22 | | $ 25.40 | | $ 20.90 | | $ 17.81 |
| Total investment return (b) | (1.54)% | | (11.12)% | | 30.06% | | 20.27% | | 10.75% |
| Ratios (to average net assets)/Supplemental Data: | | | | | | | | | |
| Net investment income (loss) | 1.03% | | 0.37% | | 0.19% | | 0.33% | | 0.67% |
| Net expenses (c) | 0.94% | | 0.93% | | 0.91% | | 0.96% | | 0.98% |
| Portfolio turnover rate | 33% | | 14% | | 49% | | 46% | | 23% |
| Net assets at end of year (in 000’s) | $ 643,975 | | $ 710,774 | | $ 891,433 | | $ 657,626 | | $ 545,605 |
| (a) | Per share data based on average shares outstanding during the year. |
| (b) | Total investment return is calculated exclusive of sales charges and assumes the reinvestment of dividends and distributions. For periods of less than one year, total return is not annualized. |
| (c) | In addition to the fees and expenses which the Fund bears directly, it also indirectly bears a pro-rata share of the fees and expenses of the underlying funds in which it invests. Such indirect expenses are not included in the above expense ratios. |
| | Year Ended October 31, |
| Investor Class | 2023 | | 2022 | | 2021 | | 2020 | | 2019 |
| Net asset value at beginning of year | $ 18.21 | | $ 25.39 | | $ 20.90 | | $ 17.80 | | $ 17.07 |
| Net investment income (loss) (a) | 0.14 | | 0.03 | | (0.00)‡ | | 0.03 | | 0.09 |
| Net realized and unrealized gain (loss) | (0.45) | | (2.50) | | 6.00 | | 3.47 | | 1.59 |
| Total from investment operations | (0.31) | | (2.47) | | 6.00 | | 3.50 | | 1.68 |
| Less distributions: | | | | | | | | | |
| From net investment income | (0.25) | | (0.22) | | (0.08) | | (0.09) | | (0.12) |
| From net realized gain on investments | (0.45) | | (4.49) | | (1.43) | | (0.31) | | (0.83) |
| Total distributions | (0.70) | | (4.71) | | (1.51) | | (0.40) | | (0.95) |
| Net asset value at end of year | $ 17.20 | | $ 18.21 | | $ 25.39 | | $ 20.90 | | $ 17.80 |
| Total investment return (b) | (1.77)% | | (11.31)% | | 29.77% | | 20.08% | | 10.50% |
| Ratios (to average net assets)/Supplemental Data: | | | | | | | | | |
| Net investment income (loss) | 0.79% | | 0.17% | | (0.01)% | | 0.13% | | 0.51% |
| Net expenses (c) | 1.18% | | 1.12% | | 1.12% | | 1.16% | | 1.15% |
| Expenses (before waiver/reimbursement) (c) | 1.18% | | 1.12% | | 1.12% | | 1.16% | | 1.17% |
| Portfolio turnover rate | 33% | | 14% | | 49% | | 46% | | 23% |
| Net assets at end of year (in 000's) | $ 39,301 | | $ 43,581 | | $ 53,738 | | $ 57,829 | | $ 59,242 |
| ‡ | Less than one cent per share. |
| (a) | Per share data based on average shares outstanding during the year. |
| (b) | Total investment return is calculated exclusive of sales charges and assumes the reinvestment of dividends and distributions. For periods of less than one year, total return is not annualized. |
| (c) | In addition to the fees and expenses which the Fund bears directly, it also indirectly bears a pro-rata share of the fees and expenses of the underlying funds in which it invests. Such indirect expenses are not included in the above expense ratios. |
The notes to the financial statements are an integral part of, and should be read in conjunction with, the financial statements.
19
Financial Highlights selected per share data and ratios
| | Year Ended October 31, |
| Class B | 2023 | | 2022 | | 2021 | | 2020 | | 2019 |
| Net asset value at beginning of year | $ 17.75 | | $ 24.95 | | $ 20.67 | | $ 17.68 | | $ 16.98 |
| Net investment income (loss) (a) | 0.01 | | (0.11) | | (0.18) | | (0.11) | | (0.04) |
| Net realized and unrealized gain (loss) | (0.44) | | (2.45) | | 5.93 | | 3.44 | | 1.60 |
| Total from investment operations | (0.43) | | (2.56) | | 5.75 | | 3.33 | | 1.56 |
| Less distributions: | | | | | | | | | |
| From net investment income | (0.12) | | (0.15) | | (0.04) | | (0.03) | | (0.03) |
| From net realized gain on investments | (0.45) | | (4.49) | | (1.43) | | (0.31) | | (0.83) |
| Total distributions | (0.57) | | (4.64) | | (1.47) | | (0.34) | | (0.86) |
| Net asset value at end of year | $ 16.75 | | $ 17.75 | | $ 24.95 | | $ 20.67 | | $ 17.68 |
| Total investment return (b) | (2.51)% | | (11.97)% | | 28.79% | | 19.15% | | 9.76% |
| Ratios (to average net assets)/Supplemental Data: | | | | | | | | | |
| Net investment income (loss) | 0.04% | | (0.59)% | | (0.76)% | | (0.61)% | | (0.23)% |
| Net expenses (c) | 1.93% | | 1.87% | | 1.87% | | 1.91% | | 1.90% |
| Expenses (before waiver/reimbursement) (c) | 1.93% | | 1.87% | | 1.87% | | 1.91% | | 1.92% |
| Portfolio turnover rate | 33% | | 14% | | 49% | | 46% | | 23% |
| Net assets at end of year (in 000’s) | $ 2,876 | | $ 6,170 | | $ 10,226 | | $ 10,454 | | $ 11,786 |
| (a) | Per share data based on average shares outstanding during the year. |
| (b) | Total investment return is calculated exclusive of sales charges and assumes the reinvestment of dividends and distributions. For periods of less than one year, total return is not annualized. |
| (c) | In addition to the fees and expenses which the Fund bears directly, it also indirectly bears a pro-rata share of the fees and expenses of the underlying funds in which it invests. Such indirect expenses are not included in the above expense ratios. |
| | Year Ended October 31, |
| Class C | 2023 | | 2022 | | 2021 | | 2020 | | 2019 |
| Net asset value at beginning of year | $ 17.72 | | $ 24.92 | | $ 20.64 | | $ 17.65 | | $ 16.96 |
| Net investment income (loss) (a) | 0.01 | | (0.11) | | (0.18) | | (0.11) | | (0.04) |
| Net realized and unrealized gain (loss) | (0.44) | | (2.45) | | 5.93 | | 3.44 | | 1.59 |
| Total from investment operations | (0.43) | | (2.56) | | 5.75 | | 3.33 | | 1.55 |
| Less distributions: | | | | | | | | | |
| From net investment income | (0.12) | | (0.15) | | (0.04) | | (0.03) | | (0.03) |
| From net realized gain on investments | (0.45) | | (4.49) | | (1.43) | | (0.31) | | (0.83) |
| Total distributions | (0.57) | | (4.64) | | (1.47) | | (0.34) | | (0.86) |
| Net asset value at end of year | $ 16.72 | | $ 17.72 | | $ 24.92 | | $ 20.64 | | $ 17.65 |
| Total investment return (b) | (2.51)% | | (11.99)% | | 28.84% | | 19.18% | | 9.71% |
| Ratios (to average net assets)/Supplemental Data: | | | | | | | | | |
| Net investment income (loss) | 0.04% | | (0.58)% | | (0.77)% | | (0.61)% | | (0.23)% |
| Net expenses (c) | 1.93% | | 1.87% | | 1.87% | | 1.91% | | 1.90% |
| Expenses (before waiver/reimbursement) (c) | 1.93% | | 1.87% | | 1.87% | | 1.91% | | 1.92% |
| Portfolio turnover rate | 33% | | 14% | | 49% | | 46% | | 23% |
| Net assets at end of year (in 000’s) | $ 30,340 | | $ 38,837 | | $ 55,754 | | $ 52,999 | | $ 60,891 |
| (a) | Per share data based on average shares outstanding during the year. |
| (b) | Total investment return is calculated exclusive of sales charges and assumes the reinvestment of dividends and distributions. For periods of less than one year, total return is not annualized. |
| (c) | In addition to the fees and expenses which the Fund bears directly, it also indirectly bears a pro-rata share of the fees and expenses of the underlying funds in which it invests. Such indirect expenses are not included in the above expense ratios. |
The notes to the financial statements are an integral part of, and should be read in conjunction with, the financial statements.
| 20 | MainStay MacKay Convertible Fund |
Financial Highlights selected per share data and ratios
| | Year Ended October 31, |
| Class I | 2023 | | 2022 | | 2021 | | 2020 | | 2019 |
| Net asset value at beginning of year | $ 18.27 | | $ 25.46 | | $ 20.95 | | $ 17.85 | | $ 17.11 |
| Net investment income (loss) (a) | 0.24 | | 0.13 | | 0.12 | | 0.13 | | 0.18 |
| Net realized and unrealized gain (loss) | (0.45) | | (2.51) | | 6.02 | | 3.48 | | 1.60 |
| Total from investment operations | (0.21) | | (2.38) | | 6.14 | | 3.61 | | 1.78 |
| Less distributions: | | | | | | | | | |
| From net investment income | (0.35) | | (0.32) | | (0.20) | | (0.20) | | (0.21) |
| From net realized gain on investments | (0.45) | | (4.49) | | (1.43) | | (0.31) | | (0.83) |
| Total distributions | (0.80) | | (4.81) | | (1.63) | | (0.51) | | (1.04) |
| Net asset value at end of year | $ 17.26 | | $ 18.27 | | $ 25.46 | | $ 20.95 | | $ 17.85 |
| Total investment return (b) | (1.20)% | | (10.84)% | | 30.43% | | 20.71% | | 11.14% |
| Ratios (to average net assets)/Supplemental Data: | | | | | | | | | |
| Net investment income (loss) | 1.36% | | 0.69% | | 0.49% | | 0.68% | | 1.04% |
| Net expenses (c) | 0.61% | | 0.61% | | 0.61% | | 0.61% | | 0.61% |
| Expenses (before waiver/reimbursement) (c) | 0.69% | | 0.68% | | 0.66% | | 0.71% | | 0.73% |
| Portfolio turnover rate | 33% | | 14% | | 49% | | 46% | | 23% |
| Net assets at end of year (in 000’s) | $ 803,539 | | $ 825,546 | | $ 991,630 | | $ 852,739 | | $ 773,865 |
| (a) | Per share data based on average shares outstanding during the year. |
| (b) | Total investment return is calculated exclusive of sales charges and assumes the reinvestment of dividends and distributions. Class I shares are not subject to sales charges. For periods of less than one year, total return is not annualized. |
| (c) | In addition to the fees and expenses which the Fund bears directly, it also indirectly bears a pro-rata share of the fees and expenses of the underlying funds in which it invests. Such indirect expenses are not included in the above expense ratios. |
The notes to the financial statements are an integral part of, and should be read in conjunction with, the financial statements.
21
Notes to Financial Statements
Note 1-Organization and Business
The MainStay Funds (the “Trust”) was organized on January 9, 1986, as a Massachusetts business trust. The Trust is registered under the Investment Company Act of 1940, as amended (the “1940 Act”), as an open-end management investment company, and is comprised of eleven funds (collectively referred to as the "Funds"). These financial statements and notes relate to the MainStay MacKay Convertible Fund (the "Fund"), a “diversified” fund, as that term is defined in the 1940 Act, as interpreted or modified by regulatory authorities having jurisdiction, from time to time.
The following table lists the Fund's share classes that have been registered and commenced operations:
| Class | Commenced Operations |
| Class A | January 3, 1995 |
| Investor Class | February 28, 2008 |
| Class B | May 1, 1986 |
| Class C | September 1, 1998 |
| Class I | November 28, 2008 |
Class B shares of the MainStay Group of Funds are closed to all new purchases as well as additional investments by existing Class B shareholders. Existing Class B shareholders may continue to reinvest dividends and capital gains distributions, as well as exchange their Class B shares for Class B shares of other funds in the MainStay Group of Funds as permitted by the current exchange privileges. Class B shareholders continue to be subject to any applicable contingent deferred sales charge ("CDSC") at the time of redemption. All other features of the Class B shares, including but not limited to the fees and expenses applicable to Class B shares, remain unchanged. Unless redeemed, Class B shareholders will remain in Class B shares of their respective fund until the Class B shares are converted to Class A or Investor Class shares pursuant to the applicable conversion schedule.
Class A and Investor Class shares are offered at net asset value (“NAV”) per share plus an initial sales charge. No initial sales charge applies to investments of $1 million or more (and certain other qualified purchases) in Class A and Investor Class shares. However, a CDSC of 1.00% may be imposed on certain redemptions made within 18 months of the date of purchase on shares that were purchased without an initial sales charge. Class C shares are offered at NAV without an initial sales charge, although a 1.00% CDSC may be imposed on certain redemptions of such shares made within one year of the date of purchase of Class C shares. When Class B shares were offered, they were offered at NAV without an initial sales charge, although a CDSC that declines depending on the number of years a shareholder held its Class B shares may be imposed on certain redemptions of such shares made within six years of the date of purchase of such shares. Class I shares are offered at NAV without a sales charge. Depending upon eligibility, Class B shares convert to either Class A or Investor Class shares at the end of the calendar quarter eight years after the date they were purchased. In addition, depending upon eligibility, Class C shares convert to either Class A or Investor Class shares at the end of the calendar quarter eight years after the date they
were purchased. Additionally, Investor Class shares may convert automatically to Class A shares. Under certain circumstances and as may be permitted by the Trust’s multiple class plan pursuant to Rule 18f-3 under the 1940 Act, specified share classes of the Fund may be converted to one or more other share classes of the Fund as disclosed in the capital share transactions within these Notes. The classes of shares have the same voting (except for issues that relate solely to one class), dividend, liquidation and other rights, and the same terms and conditions, except that under distribution plans pursuant to Rule 12b-1 under the 1940 Act, Class B and Class C shares are subject to higher distribution and/or service fees than Class A and Investor Class shares. Class I shares are not subject to a distribution and/or service fee.
The Fund's investment objective is to seek capital appreciation together with current income.
Note 2–Significant Accounting Policies
The Fund is an investment company and accordingly follows the investment company accounting and reporting guidance of the Financial Accounting Standards Board (“FASB”) Accounting Standards Codification Topic 946 Financial Services—Investment Companies. The Fund prepares its financial statements in accordance with generally accepted accounting principles (“GAAP”) in the United States of America and follows the significant accounting policies described below.
(A) Securities Valuation. Investments are usually valued as of the close of regular trading on the New York Stock Exchange (the "Exchange") (usually 4:00 p.m. Eastern time) on each day the Fund is open for business ("valuation date").
Pursuant to Rule 2a-5 under the 1940 Act, the Board of Trustees of the Trust (the "Board") has designated New York Life Investment Management LLC (“New York Life Investments” or the "Manager") as its Valuation Designee (the "Valuation Designee"). The Valuation Designee is responsible for performing fair valuations relating to all investments in the Fund’s portfolio for which market quotations are not readily available; periodically assessing and managing material valuation risks; establishing and applying fair value methodologies; testing fair valuation methodologies; evaluating and overseeing pricing services; ensuring appropriate segregation of valuation and portfolio management functions; providing quarterly, annual and prompt reporting to the Board, as appropriate; identifying potential conflicts of interest; and maintaining appropriate records. The Valuation Designee has established a valuation committee ("Valuation Committee") to assist in carrying out the Valuation Designee’s responsibilities and establish prices of securities for which market quotations are not readily available. The Fund's and the Valuation Designee's policies and procedures ("Valuation Procedures") govern the Valuation Designee’s selection and application of methodologies for determining and calculating the fair value of Fund investments. The Valuation Designee may value the Fund's portfolio securities for which market quotations are not readily available and other Fund assets utilizing inputs from pricing services and other third-party sources. The Valuation Committee meets (in person, via electronic mail or via teleconference) on
| 22 | MainStay MacKay Convertible Fund |
an ad-hoc basis to determine fair valuations and on a quarterly basis to review fair value events with respect to certain securities for which market quotations are not readily available, including valuation risks and back-testing results, and preview reports to the Board.
The Valuation Committee establishes prices of securities for which market quotations are not readily available based on such methodologies and measurements on a regular basis after considering information that is reasonably available and deemed relevant by the Valuation Committee. The Board shall oversee the Valuation Designee and review fair valuation materials on a prompt, quarterly and annual basis and approve proposed revisions to the Valuation Procedures.
Investments for which market quotations are not readily available are valued at fair value as determined in good faith pursuant to the Valuation Procedures. A market quotation is readily available only when that quotation is a quoted price (unadjusted) in active markets for identical investments that the Fund can access at the measurement date, provided that a quotation will not be readily available if it is not reliable. "Fair value" is defined as the price the Fund would reasonably expect to receive upon selling an asset or liability in an orderly transaction to an independent buyer in the principal or most advantageous market for the asset or liability. Fair value measurements are determined within a framework that establishes a three-tier hierarchy that maximizes the use of observable market data and minimizes the use of unobservable inputs to establish a classification of fair value measurements for disclosure purposes. "Inputs" refer broadly to the assumptions that market participants would use in pricing the asset or liability, including assumptions about risk, such as the risk inherent in a particular valuation technique used to measure fair value using a pricing model and/or the risk inherent in the inputs for the valuation technique. Inputs may be observable or unobservable. Observable inputs reflect the assumptions market participants would use in pricing the asset or liability based on market data obtained from sources independent of the Fund. Unobservable inputs reflect the Fund’s own assumptions about the assumptions market participants would use in pricing the asset or liability based on the information available. The inputs or methodology used for valuing assets or liabilities may not be an indication of the risks associated with investing in those assets or liabilities. The three-tier hierarchy of inputs is summarized below.
| • | Level 1—quoted prices (unadjusted) in active markets for an identical asset or liability |
| • | Level 2—other significant observable inputs (including quoted prices for a similar asset or liability in active markets, interest rates and yield curves, prepayment speeds, credit risk, etc.) |
| • | Level 3—significant unobservable inputs (including the Fund's own assumptions about the assumptions that market participants would use in measuring fair value of an asset or liability) |
The level of an asset or liability within the fair value hierarchy is based on the lowest level of an input, both individually and in the aggregate, that is significant to the fair value measurement. The aggregate value by input
level of the Fund’s assets and liabilities as of October 31, 2023, is included at the end of the Portfolio of Investments.
The Fund may use third-party vendor evaluations, whose prices may be derived from one or more of the following standard inputs, among others:
| • Benchmark yields | • Reported trades |
| • Broker/dealer quotes | • Issuer spreads |
| • Two-sided markets | • Benchmark securities |
| • Bids/offers | • Reference data (corporate actions or material event notices) |
| • Industry and economic events | • Comparable bonds |
| • Monthly payment information | |
An asset or liability for which a market quotation is not readily available is valued by methods deemed reasonable in good faith by the Valuation Committee, following the Valuation Procedures to represent fair value. Under these procedures, the Valuation Designee generally uses a market-based approach which may use related or comparable assets or liabilities, recent transactions, market multiples, book values and other relevant information. The Valuation Designee may also use an income-based valuation approach in which the anticipated future cash flows of the asset or liability are discounted to calculate fair value. Discounts may also be applied due to the nature and/or duration of any restrictions on the disposition of the asset or liability. Fair value represents a good faith approximation of the value of a security. Fair value determinations involve the consideration of a number of subjective factors, an analysis of applicable facts and circumstances and the exercise of judgment. As a result, it is possible that the fair value for a security determined in good faith in accordance with the Valuation Procedures may differ from valuations for the same security determined for other funds using their own valuation procedures. Although the Valuation Procedures are designed to value a security at the price the Fund may reasonably expect to receive upon the security's sale in an orderly transaction, there can be no assurance that any fair value determination thereunder would, in fact, approximate the amount that the Fund would actually realize upon the sale of the security or the price at which the security would trade if a reliable market price were readily available. During the year ended October 31, 2023, there were no material changes to the fair value methodologies.
Securities which may be valued in this manner include, but are not limited to: (i) a security for which trading has been halted or suspended or otherwise does not have a readily available market quotation on a given day; (ii) a debt security that has recently gone into default and for which there is not a current market quotation; (iii) a security of an issuer that has entered into a restructuring; (iv) a security that has been delisted from a national exchange; (v) a security subject to trading collars for which no or limited trading takes place; and (vi) a security whose principal market has been temporarily closed at a time when, under normal conditions, it would be open. Securities valued in this manner are generally categorized as Level 2 or 3 in the hierarchy. No securities held by the Fund as of October 31, 2023, were fair valued in such a manner.
Notes to Financial Statements (continued)
Equity securities, rights and warrants, if applicable, are valued at the last quoted sales prices as of the close of regular trading on the relevant exchange on each valuation date. Securities that are not traded on the valuation date are valued at the mean of the last quoted bid and ask prices. Prices are normally taken from the principal market in which each security trades. These securities are generally categorized as Level 1 in the hierarchy.
Certain convertible preferred stocks may be valued utilizing evaluated prices based on market inputs obtained from the pricing vendor and are generally categorized as Level 2 in the hierarchy. Securities that were fair valued in such a manner as of October 31, 2023, are shown in the Portfolio of Investments.
Investments in mutual funds, including money market funds, are valued at their respective NAVs at the close of business each day on the valuation date. These securities are generally categorized as Level 1 in the hierarchy.
Debt securities (other than convertible and municipal bonds) are valued at the evaluated bid prices (evaluated mean prices in the case of convertible and municipal bonds) supplied by a pricing agent or broker selected by the Valuation Designee, in consultation with the Subadvisor. The evaluations are market-based measurements processed through a pricing application and represents the pricing agent’s good faith determination as to what a holder may receive in an orderly transaction under market conditions. The rules-based logic utilizes valuation techniques that reflect participants’ assumptions and vary by asset class and per methodology, maximizing the use of relevant observable data including quoted prices for similar assets, benchmark yield curves and market corroborated inputs. The evaluated bid or mean prices are deemed by the Valuation Designee, in consultation with the Subadvisor, to be representative of market values at the regular close of trading of the Exchange on each valuation date. Debt securities purchased on a delayed delivery basis are marked to market daily until settlement at the forward settlement date. Debt securities, including corporate bonds, U.S. government and federal agency bonds, municipal bonds, foreign bonds, convertible bonds, asset-backed securities and mortgage-backed securities are generally categorized as Level 2 in the hierarchy.
Temporary cash investments acquired in excess of 60 days to maturity at the time of purchase are valued using the latest bid prices or using valuations based on a matrix system (which considers such factors as security prices, yields, maturities and ratings), both as furnished by independent pricing services. Temporary cash investments that mature in 60 days or less at the time of purchase ("Short-Term Investments") are valued using the amortized cost method of valuation, unless the use of such method would be inappropriate. The amortized cost method involves valuing a security at its cost on the date of purchase and thereafter assuming a constant amortization to maturity of the difference between such cost and the value on maturity date. Amortized cost approximates the current fair value of a security. Securities valued using the amortized cost method are not valued using quoted prices in an active market and are generally categorized as Level 2 in the hierarchy.
The information above is not intended to reflect an exhaustive list of the methodologies that may be used to value portfolio investments. The Valuation Procedures permit the use of a variety of valuation methodologies in connection with valuing portfolio investments. The methodology used for a specific type of investment may vary based on the market data available or other considerations. The methodologies summarized above may not represent the specific means by which portfolio investments are valued on any particular business day.
(B) Income Taxes. The Fund's policy is to comply with the requirements of the Internal Revenue Code of 1986, as amended (the “Internal Revenue Code”), applicable to regulated investment companies and to distribute all of its taxable income to the shareholders of the Fund within the allowable time limits.
The Manager evaluates the Fund’s tax positions to determine if the tax positions taken meet the minimum recognition threshold in connection with accounting for uncertainties in income tax positions taken or expected to be taken for the purposes of measuring and recognizing tax liabilities in the financial statements. Recognition of tax benefits of an uncertain tax position is permitted only to the extent the position is “more likely than not” to be sustained assuming examination by taxing authorities. The Manager analyzed the Fund's tax positions taken on federal, state and local income tax returns for all open tax years (for up to three tax years) and has concluded that no provisions for federal, state and local income tax are required in the Fund's financial statements. The Fund's federal, state and local income tax and federal excise tax returns for tax years for which the applicable statutes of limitations have not expired are subject to examination by the Internal Revenue Service and state and local departments of revenue.
(C) Dividends and Distributions to Shareholders. Dividends and distributions are recorded on the ex-dividend date. The Fund intends to declare and pay dividends from net investment income, if any, at least quarterly and distributions from net realized capital and currency gains, if any, at least annually. Unless a shareholder elects otherwise, all dividends and distributions are reinvested at NAV in the same class of shares of the Fund. Dividends and distributions to shareholders are determined in accordance with federal income tax regulations and may differ from determinations using GAAP.
(D) Security Transactions and Investment Income. The Fund records security transactions on the trade date. Realized gains and losses on security transactions are determined using the identified cost method. Dividend income is recognized on the ex-dividend date, net of any foreign tax withheld at the source, and interest income is accrued as earned using the effective interest rate method. Distributions received from real estate investment trusts may be classified as dividends, capital gains and/or return of capital. Discounts and premiums on securities purchased for the Fund are accreted and amortized, respectively, on the effective interest rate method. Premium associated with the conversion feature on a convertible bond is not amortized.
| 24 | MainStay MacKay Convertible Fund |
Investment income and realized and unrealized gains and losses on investments of the Fund are allocated pro rata to the separate classes of shares based upon their relative net assets on the date the income is earned or realized and unrealized gains and losses are incurred.
The Fund may place a debt security on non-accrual status and reduce related interest income by ceasing current accruals and writing off all or a portion of any interest receivables when the collection of all or a portion of such interest has become doubtful. A debt security is removed from non-accrual status when the issuer resumes interest payments or when collectability of interest is reasonably assured.
(E) Expenses. Expenses of the Trust are allocated to the individual Funds in proportion to the net assets of the respective Funds when the expenses are incurred, except where direct allocations of expenses can be made. Expenses (other than transfer agent expenses and fees incurred under the shareholder services plans and/or the distribution plans further discussed in Note 3(B)) are allocated to separate classes of shares pro rata based upon their relative net assets on the date the expenses are incurred. The expenses borne by the Fund, including those of related parties to the Fund, are shown in the Statement of Operations.
Additionally, the Fund may invest in mutual funds, which are subject to management fees and other fees that may cause the costs of investing in mutual funds to be greater than the costs of owning the underlying securities directly. These indirect expenses of mutual funds are not included in the amounts shown as expenses in the Statement of Operations or in the expense ratios included in the Financial Highlights.
(F) Use of Estimates. In preparing financial statements in conformity with GAAP, the Manager makes estimates and assumptions that affect the reported amounts and disclosures in the financial statements. Actual results could differ from those estimates and assumptions.
(G) Securities Lending. In order to realize additional income, the Fund may engage in securities lending, subject to the limitations set forth in the 1940 Act and relevant guidance by the staff of the Securities and Exchange Commission (“SEC”). If the Fund engages in securities lending, the Fund will lend through its custodian, JPMorgan Chase Bank, N.A., ("JPMorgan"), acting as securities lending agent on behalf of the Fund. Under the current arrangement, JPMorgan will manage the Fund's collateral in accordance with the securities lending agency agreement between the Fund and JPMorgan, and indemnify the Fund against counterparty risk. The loans will be collateralized by cash (which may be invested in a money market fund) and/or non-cash collateral (which may include U.S. Treasury securities and/or U.S. government agency securities issued or guaranteed by the United States government or its agencies or instrumentalities) at least equal at all times to the market value of the securities loaned. Non-cash collateral held at year end is segregated and cannot be transferred by the Fund. The Fund bears the risk of delay in recovery of, or loss of rights in, the securities loaned. The Fund may also record a realized gain or loss on securities deemed sold due to a borrower’s inability to return securities on loan. The Fund bears the risk of any loss on investment of cash collateral. The Fund will receive
compensation for lending its securities in the form of fees or it will retain a portion of interest earned on the investment of any cash collateral. The Fund will also continue to receive interest and dividends on the securities loaned and any gain or loss in the market price of the securities loaned that may occur during the term of the loan will be for the account of the Fund. Income earned from securities lending activities, if any, is reflected in the Statement of Operations. Securities on loan as of October 31, 2023, are shown in the Portfolio of Investments.
(H) Debt and Convertible Securities Risk. The ability of issuers of debt securities held by the Fund to meet their obligations may be affected by, among other things, economic or political developments in a specific country, industry or region. Debt securities are also subject to the risks associated with changes in interest rates.
Convertible securities may be subordinate to other securities. In part, the total return for a convertible security depends upon the performance of the underlying stock into which it can be converted. Also, issuers of convertible securities are often not as strong financially as those issuing securities with higher credit ratings, are more likely to encounter financial difficulties and typically are more vulnerable to changes in the economy, such as a recession or a sustained period of rising interest rates, which could affect their ability to make interest and principal payments.
(I) Indemnifications. Under the Trust’s organizational documents, its officers and trustees are indemnified against certain liabilities that may arise out of performance of their duties to the Trust. Additionally, in the normal course of business, the Fund enters into contracts with third-party service providers that contain a variety of representations and warranties and that may provide general indemnifications. The Fund's maximum exposure under these arrangements is unknown, as this would involve future claims that may be made against the Fund that have not yet occurred. The Manager believes that the risk of loss in connection with these potential indemnification obligations is remote. However, there can be no assurance that material liabilities related to such obligations will not arise in the future, which could adversely impact the Fund.
Note 3–Fees and Related Party Transactions
(A) Manager and Subadvisor. New York Life Investments, a registered investment adviser and an indirect, wholly-owned subsidiary of New York Life Insurance Company ("New York Life"), serves as the Fund's Manager, pursuant to an Amended and Restated Management Agreement ("Management Agreement"). The Manager provides offices, conducts clerical, recordkeeping and bookkeeping services and keeps most of the financial and accounting records required to be maintained by the Fund. Except for the portion of salaries and expenses that are the responsibility of the Fund, the Manager pays the salaries and expenses of all personnel affiliated with the Fund and certain operational expenses of the Fund. The Fund reimburses New York Life Investments in an amount equal to the portion of the compensation of the Chief Compliance Officer attributable to the Fund. MacKay Shields LLC ("MacKay Shields" or the "Subadvisor"), a registered investment adviser and an indirect, wholly-owned subsidiary of New York Life, serves as the Subadvisor to the Fund and is responsible
Notes to Financial Statements (continued)
for the day-to-day portfolio management of the Fund. Pursuant to the terms of an Amended and Restated Subadvisory Agreement ("Subadvisory Agreement") between New York Life Investments and MacKay Shields, New York Life Investments pays for the services of the Subadvisor.
Effective February 28, 2023, pursuant to the Management Agreement, the Fund pays the Manager a monthly fee for the services performed and the facilities furnished at an annual rate of the Fund’s average daily net assets as follows: 0.60% up to $500 million; 0.55% from $500 million to $1 billion; 0.50% from $1 billion to $2 billion; and 0.49% in excess of $2 billion.
Prior to February 28, 2023, the Fund paid the Manager a monthly fee for the services performed and the facilities furnished at an annual rate of the Fund’s average daily net assets as follows: 0.60% up to $500 million; 0.55% from $500 million to $1 billion; 0.50% from $1 billion to $2 billion; and 0.49% in excess of $2 billion, plus a fee for fund accounting services previously provided by New York Life Investments under a separate fund accounting agreement furnished at an annual rate of the Fund’s average daily net assets as follows: 0.05% up to $20 million; 0.0333% from $20 million to $100 million; and 0.01% in excess of $100 million. During the year ended October 31, 2023, the effective management fee rate was 0.55%, inclusive of a fee for fund accounting services of less than one-tenth percent of the Fund’s average daily net assets.
New York Life Investments has contractually agreed to waive fees and/or reimburse expenses so that Total Annual Fund Operating Expenses (excluding taxes, interest, litigation, extraordinary expenses, brokerage and other transaction expenses relating to the purchase or sale of portfolio investments and acquired (underlying) fund fees and expenses) of Class I shares do not exceed 0.61% of the Fund's average net assets. This agreement will remain in effect until February 28, 2024, and shall renew automatically for one-year terms unless New York Life Investments provides written notice of termination prior to the start of the next term or upon approval of the Board.
During the year ended October 31, 2023, New York Life Investments earned fees from the Fund in the amount of $8,851,765 and waived fees and/or reimbursed expenses in the amount of $682,379 and paid the Subadvisor fees of $4,053,989.
JPMorgan provides sub-administration and sub-accounting services to the Fund pursuant to an agreement with New York Life Investments. These services include calculating the daily NAVs of the Fund, maintaining the general ledger and sub-ledger accounts for the calculation of the Fund's NAVs, and assisting New York Life Investments in conducting various aspects of the Fund's administrative operations. For providing these services to the Fund, JPMorgan is compensated by New York Life Investments.
Pursuant to an agreement between the Trust and New York Life Investments, New York Life Investments is responsible for providing or procuring certain regulatory reporting services for the Fund. The Fund will
reimburse New York Life Investments for the actual costs incurred by New York Life Investments in connection with providing or procuring these services for the Fund.
(B) Distribution and Service Fees. The Trust, on behalf of the Fund, has entered into a distribution agreement with NYLIFE Distributors LLC (the “Distributor”), an affiliate of New York Life Investments. The Fund has adopted distribution plans (the “Plans”) in accordance with the provisions of Rule 12b-1 under the 1940 Act.
Pursuant to the Class A and Investor Class Plans, the Distributor receives a monthly fee from the Class A and Investor Class shares at an annual rate of 0.25% of the average daily net assets of the Class A and Investor Class shares for distribution and/or service activities as designated by the Distributor. Pursuant to the Class B and Class C Plans, Class B and Class C shares pay the Distributor a monthly distribution fee at an annual rate of 0.75% of the average daily net assets of the Class B and Class C shares along with a service fee at an annual rate of 0.25% of the average daily net assets of the Class B and Class C shares, for a total 12b-1 fee of 1.00%. Class I shares are not subject to a distribution and/or service fee.
The Plans provide that the distribution and service fees are payable to the Distributor regardless of the amounts actually expended by the Distributor for distribution of the Fund's shares and service activities.
(C) Sales Charges. The Fund was advised by the Distributor that the amount of initial sales charges retained on sales of Class A and Investor Class shares during the year ended October 31, 2023, were $75,502 and $6,165, respectively.
The Fund was also advised that the Distributor retained CDSCs on redemptions of Class A, Class B and Class C shares during the year ended October 31, 2023, of $5,365, $516 and $4,912, respectively.
(D) Transfer, Dividend Disbursing and Shareholder Servicing Agent. NYLIM Service Company LLC, an affiliate of New York Life Investments, is the Fund's transfer, dividend disbursing and shareholder servicing agent pursuant to an agreement between NYLIM Service Company LLC and the Trust. NYLIM Service Company LLC has entered into an agreement with SS&C Global Investor & Distribution Solutions, Inc. ("SS&C"), pursuant to which SS&C performs certain transfer agent services on behalf of NYLIM Service Company LLC. New York Life Investments has contractually agreed to limit the transfer agency expenses charged to the Fund’s share classes to a maximum of 0.35% of that share class’s average daily net assets on an annual basis after deducting any applicable Fund or class-level expense reimbursement or small account fees. This agreement will remain in effect until February 28, 2024, and shall renew automatically for one-year terms unless New York Life Investments provides written notice of termination prior to the start of the next term or upon approval of the Board. During the year ended October 31, 2023, transfer agent expenses incurred by the Fund
| 26 | MainStay MacKay Convertible Fund |
and any reimbursements, pursuant to the aforementioned Transfer Agency expense limitation agreement, were as follows:
| Class | Expense | Waived |
| Class A | $758,920 | $— |
| Investor Class | 146,038 | — |
| Class B | 15,120 | — |
| Class C | 121,910 | — |
| Class I | 926,424 | — |
(E) Small Account Fee. Shareholders with small accounts adversely impact the cost of providing transfer agency services. In an effort to reduce total transfer agency expenses, the Fund has implemented a small account fee on certain types of accounts. As described in the Fund's prospectus, certain shareholders with an account balance of less than $1,000 ($5,000 for Class A share accounts) are charged an annual per account fee of $20 (assessed semi-annually), the proceeds from which offset transfer agent fees as reflected in the Statement of Operations. This small account fee will not apply to certain types of accounts as described further in the Fund’s prospectus.
(F) Capital. As of October 31, 2023, New York Life and its affiliates beneficially held shares of the Fund with the values and percentages of net assets as follows:
Note 4-Federal Income Tax
As of October 31, 2023, the cost and unrealized appreciation (depreciation) of the Fund’s investment portfolio, including applicable derivative contracts and other financial instruments, as determined on a federal income tax basis, were as follows:
| | Federal Tax
Cost | Gross
Unrealized
Appreciation | Gross
Unrealized
(Depreciation) | Net
Unrealized
Appreciation/
(Depreciation) |
| Investments in Securities | $1,581,930,931 | $140,651,939 | $(162,516,033) | $(21,864,094) |
As of October 31, 2023, the components of accumulated gain (loss) on a tax basis were as follows:
Ordinary
Income | Accumulated
Capital
and Other
Gain (Loss) | Other
Temporary
Differences | Unrealized
Appreciation
(Depreciation) | Total
Accumulated
Gain (Loss) |
| $48,715,573 | $(9,406,988) | $(1,428,310) | $(21,864,095) | $16,016,180 |
The difference between book-basis and tax-basis unrealized appreciation (depreciation) is primarily due to cumulative convertible bond adjustments. The other temporary differences are primarily due to defaulted bond income accruals.
The following table discloses the current year reclassifications between total distributable earnings (loss) and additional paid-in capital arising
from permanent differences; net assets as of October 31, 2023 were not affected.
| | Total
Distributable
Earnings (Loss) | Additional
Paid-In
Capital |
| | $(1,265,915) | $1,265,915 |
The reclassifications for the Fund are primarily due to equalization.
As of October 31, 2023, for federal income tax purposes, capital loss carryforwards of $9,406,988, as shown in the table below, were available to the extent provided by the regulations to offset future realized gains of the Fund. Accordingly, no capital gains distributions are expected to be paid to shareholders until net gains have been realized in excess of such amounts.
Capital Loss
Available Through | Short-Term
Capital Loss
Amounts (000’s) | Long-Term
Capital Loss
Amounts (000’s) |
| Unlimited | $2,578 | $6,829 |
During the years ended October 31, 2023 and October 31, 2022, the tax character of distributions paid as reflected in the Statements of Changes in Net Assets was as follows:
| | 2023 | 2022 |
| Distributions paid from: | | |
| Ordinary Income | $40,381,747 | $ 65,835,785 |
| Long-Term Capital Gains | 27,270,245 | 315,025,708 |
| Total | $67,651,992 | $380,861,493 |
Note 5–Custodian
JPMorgan is the custodian of cash and securities held by the Fund. Custodial fees are charged to the Fund based on the Fund's net assets and/or the market value of securities held by the Fund and the number of certain transactions incurred by the Fund.
Note 6–Line of Credit
The Fund and certain other funds managed by New York Life Investments maintain a line of credit with a syndicate of banks in order to secure a source of funds for temporary purposes to meet unanticipated or excessive redemption requests.
Effective July 25, 2023, under the credit agreement (the “Credit Agreement”), the aggregate commitment amount is $600,000,000 with an additional uncommitted amount of $100,000,000. The commitment fee is an annual rate of 0.15% of the average commitment amount payable quarterly, regardless of usage, to JPMorgan, who serves as the agent to the syndicate. The commitment fee is allocated among the Fund and certain other funds managed by New York Life Investments based upon their respective net assets and other factors. Interest on any revolving credit loan is charged based upon the Federal Funds Rate, Daily Simple Secured Overnight Financing Rate ("SOFR") + 0.10%, or the Overnight Bank Funding Rate, whichever is higher. The Credit Agreement
Notes to Financial Statements (continued)
expires on July 23, 2024, although the Fund, certain other funds managed by New York Life Investments and the syndicate of banks may renew the Credit Agreement for an additional year on the same or different terms or enter into a credit agreement with a different syndicate of banks. Prior to July 25, 2023, the aggregate commitment amount and the commitment fee were the same as those under the current Credit Agreement. During the year ended October 31, 2023, there were no borrowings made or outstanding with respect to the Fund under the Credit Agreement.
Note 7–Interfund Lending Program
Pursuant to an exemptive order issued by the SEC, the Fund, along with certain other funds managed by New York Life Investments, may participate in an interfund lending program. The interfund lending program provides an alternative credit facility that permits the Fund and certain other funds managed by New York Life Investments to lend or borrow money for temporary purposes directly to or from one another, subject to the conditions of the exemptive order. During the year ended October 31, 2023, there were no interfund loans made or outstanding with respect to the Fund.
Note 8–Purchases and Sales of Securities (in 000’s)
During the year ended October 31, 2023, purchases and sales of securities, other than short-term securities, were $486,627 and $564,589, respectively.
Note 9–Capital Share Transactions
Transactions in capital shares for the years ended October 31, 2023 and October 31, 2022, were as follows:
| Class A | Shares | Amount |
| Year ended October 31, 2023: | | |
| Shares sold | 2,423,754 | $ 43,368,024 |
| Shares issued to shareholders in reinvestment of distributions | 1,580,362 | 27,763,616 |
| Shares redeemed | (5,759,217) | (102,449,513) |
| Net increase (decrease) in shares outstanding before conversion | (1,755,101) | (31,317,873) |
| Shares converted into Class A (See Note 1) | 292,723 | 5,217,744 |
| Shares converted from Class A (See Note 1) | (120,039) | (2,134,796) |
| Net increase (decrease) | (1,582,417) | $ (28,234,925) |
| Year ended October 31, 2022: | | |
| Shares sold | 3,750,826 | $ 74,532,551 |
| Shares issued to shareholders in reinvestment of distributions | 8,083,712 | 160,959,710 |
| Shares redeemed | (7,855,742) | (151,662,870) |
| Net increase (decrease) in shares outstanding before conversion | 3,978,796 | 83,829,391 |
| Shares converted into Class A (See Note 1) | 265,425 | 5,163,988 |
| Shares converted from Class A (See Note 1) | (335,288) | (5,961,835) |
| Net increase (decrease) | 3,908,933 | $ 83,031,544 |
| |
| Investor Class | Shares | Amount |
| Year ended October 31, 2023: | | |
| Shares sold | 79,210 | $ 1,411,033 |
| Shares issued to shareholders in reinvestment of distributions | 94,454 | 1,657,134 |
| Shares redeemed | (216,142) | (3,855,341) |
| Net increase (decrease) in shares outstanding before conversion | (42,478) | (787,174) |
| Shares converted into Investor Class (See Note 1) | 52,216 | 943,603 |
| Shares converted from Investor Class (See Note 1) | (117,435) | (2,079,514) |
| Net increase (decrease) | (107,697) | $ (1,923,085) |
| Year ended October 31, 2022: | | |
| Shares sold | 97,525 | $ 1,926,381 |
| Shares issued to shareholders in reinvestment of distributions | 497,142 | 9,905,355 |
| Shares redeemed | (214,831) | (4,107,217) |
| Net increase (decrease) in shares outstanding before conversion | 379,836 | 7,724,519 |
| Shares converted into Investor Class (See Note 1) | 52,537 | 1,002,519 |
| Shares converted from Investor Class (See Note 1) | (156,412) | (3,098,448) |
| Net increase (decrease) | 275,961 | $ 5,628,590 |
| |
| 28 | MainStay MacKay Convertible Fund |
| Class B | Shares | Amount |
| Year ended October 31, 2023: | | |
| Shares sold | 712 | $ 12,215 |
| Shares issued to shareholders in reinvestment of distributions | 9,324 | 158,942 |
| Shares redeemed | (47,825) | (826,321) |
| Net increase (decrease) in shares outstanding before conversion | (37,789) | (655,164) |
| Shares converted from Class B (See Note 1) | (138,081) | (2,414,958) |
| Net increase (decrease) | (175,870) | $ (3,070,122) |
| Year ended October 31, 2022: | | |
| Shares sold | 4,956 | $ 106,694 |
| Shares issued to shareholders in reinvestment of distributions | 90,227 | 1,763,027 |
| Shares redeemed | (52,530) | (974,121) |
| Net increase (decrease) in shares outstanding before conversion | 42,653 | 895,600 |
| Shares converted from Class B (See Note 1) | (105,008) | (1,946,782) |
| Net increase (decrease) | (62,355) | $ (1,051,182) |
| |
| Class C | Shares | Amount |
| Year ended October 31, 2023: | | |
| Shares sold | 270,449 | $ 4,696,902 |
| Shares issued to shareholders in reinvestment of distributions | 69,055 | 1,175,113 |
| Shares redeemed | (660,914) | (11,384,382) |
| Net increase (decrease) in shares outstanding before conversion | (321,410) | (5,512,367) |
| Shares converted from Class C (See Note 1) | (55,296) | (966,980) |
| Net increase (decrease) | (376,706) | $ (6,479,347) |
| Year ended October 31, 2022: | | |
| Shares sold | 347,776 | $ 6,600,757 |
| Shares issued to shareholders in reinvestment of distributions | 510,200 | 9,953,997 |
| Shares redeemed | (847,078) | (15,740,177) |
| Net increase (decrease) in shares outstanding before conversion | 10,898 | 814,577 |
| Shares converted from Class C (See Note 1) | (57,418) | (1,065,137) |
| Net increase (decrease) | (46,520) | $ (250,560) |
| |
| Class I | Shares | Amount |
| Year ended October 31, 2023: | | |
| Shares sold | 16,680,198 | $ 298,123,578 |
| Shares issued to shareholders in reinvestment of distributions | 1,847,776 | 32,578,417 |
| Shares redeemed | (17,223,174) | (307,750,262) |
| Net increase (decrease) in shares outstanding before conversion | 1,304,800 | 22,951,733 |
| Shares converted into Class I (See Note 1) | 119,564 | 2,132,701 |
| Shares converted from Class I (See Note 1) | (39,362) | (697,800) |
| Net increase (decrease) | 1,385,002 | $ 24,386,634 |
| Year ended October 31, 2022: | | |
| Shares sold | 21,817,856 | $ 426,249,567 |
| Shares issued to shareholders in reinvestment of distributions | 8,343,567 | 166,340,734 |
| Shares redeemed | (24,263,729) | (459,659,692) |
| Net increase (decrease) in shares outstanding before conversion | 5,897,694 | 132,930,609 |
| Shares converted into Class I (See Note 1) | 334,156 | 5,956,868 |
| Shares converted from Class I (See Note 1) | (2,889) | (51,173) |
| Net increase (decrease) | 6,228,961 | $ 138,836,304 |
Note 10–Other Matters
As of the date of this report, the Fund faces a heightened level of risk associated with current uncertainty, volatility and state of economies, financial markets, rising interest rates, and labor and health conditions around the world. Events such as war, acts of terrorism, recessions, rapid inflation, the imposition of international sanctions, earthquakes, hurricanes, epidemics and pandemics and other unforeseen natural or human disasters may have broad adverse social, political and economic effects on the global economy, which could negatively impact the value of the Fund's investments. Developments that disrupt global economies and financial markets may magnify factors that affect the Fund's performance.
Note 11–Subsequent Events
In connection with the preparation of the financial statements of the Fund as of and for the year ended October 31, 2023, events and transactions subsequent to October 31, 2023, through the date the financial statements were issued have been evaluated by the Manager for possible adjustment and/or disclosure. No subsequent events requiring financial statement adjustment or disclosure have been identified, other than the following:
At a meeting held on December 6-7, 2023, the Board approved an additional breakpoint in the management fee of 0.01% at $5 billion. Effective February 28, 2024, the Fund will pay the Manager a monthly fee for the services performed and the facilities furnished at an annual rate of the Fund’s average daily net assets as follows: 0.60% up to $500 million; 0.55% from $500 million to $1 billion; 0.50% from $1 billion to $2 billion; 0.49% from $2 billion to $5 billion; and 0.48% in excess of $5 billion.
Report of Independent Registered Public Accounting Firm
To the Shareholders of the Fund and Board of Trustees
The MainStay Funds:
Opinion on the Financial Statements
We have audited the accompanying statement of assets and liabilities of MainStay MacKay Convertible Fund (the Fund), one of the funds constituting The MainStay Funds, including the portfolio of investments, as of October 31, 2023, the related statement of operations for the year then ended, the statements of changes in net assets for each of the years in the two-year period then ended, and the related notes (collectively, the financial statements) and the financial highlights for each of the years in the five-year period then ended. In our opinion, the financial statements and financial highlights present fairly, in all material respects, the financial position of the Fund as of October 31, 2023, the results of its operations for the year then ended, the changes in its net assets for each of the years in the two-year period then ended, and the financial highlights for each of the years in the five-year period then ended, in conformity with U.S. generally accepted accounting principles.
Basis for Opinion
These financial statements and financial highlights are the responsibility of the Fund's management. Our responsibility is to express an opinion on these financial statements and financial highlights based on our audits. We are a public accounting firm registered with the Public Company Accounting Oversight Board (United States) (PCAOB) and are required to be independent with respect to the Fund in accordance with the U.S. federal securities laws and the applicable rules and regulations of the Securities and Exchange Commission and the PCAOB.
We conducted our audits in accordance with the standards of the PCAOB. Those standards require that we plan and perform the audit to obtain reasonable assurance about whether the financial statements and financial highlights are free of material misstatement, whether due to error or fraud. Our audits included performing procedures to assess the risks of material misstatement of the financial statements and financial highlights, whether due to error or fraud, and performing procedures that respond to those risks. Such procedures included examining, on a test basis, evidence regarding the amounts and disclosures in the financial statements and financial highlights. Such procedures also included confirmation of securities owned as of October 31, 2023, by correspondence with custodians and the transfer agent. Our audits also included evaluating the accounting principles used and significant estimates made by management, as well as evaluating the overall presentation of the financial statements and financial highlights. We believe that our audits provide a reasonable basis for our opinion.

We have served as the auditor of one or more New York Life Investment Management investment companies since 2003.
Philadelphia, Pennsylvania
December 22, 2023
| 30 | MainStay MacKay Convertible Fund |
Federal Income Tax Information
(Unaudited)
The Fund is required under the Internal Revenue Code to advise shareholders in a written statement as to the federal tax status of dividends paid by the Fund during such fiscal years. Accordingly, the Fund paid $27,270,850 as long term capital gain distributions.
For the fiscal year ended October 31, 2023, the Fund designated approximately $10,017,247 under the Internal Revenue Code as qualified dividend income eligible for reduced tax rates.
The dividends paid by the Fund during the fiscal year ended October 31, 2023 should be multiplied by 24.81% to arrive at the amount eligible for the corporate dividend-received deduction.
In February 2024, shareholders will receive an IRS Form 1099-DIV or substitute Form 1099, which will show the federal tax status of the distributions received by shareholders in calendar year 2023. The amounts that will be reported on such 1099-DIV or substitute Form 1099 will be the amounts you are to use on your federal income tax return and will differ from the amounts which we must report for the Fund's fiscal year ended October 31, 2023.
Proxy Voting Policies and Procedures and Proxy Voting Record
The Fund is required to file with the SEC its proxy voting record for the 12-month period ending June 30 on Form N-PX. A description of the policies and procedures that are used to vote proxies relating to portfolio securities of the Fund is available free of charge upon request by calling 800-624-6782 or visiting the SEC’s website at www.sec.gov. The most recent Form N-PX or proxy voting record is available free of charge upon request by calling 800-624-6782; visiting newyorklifeinvestments.com; or visiting the SEC’s website at www.sec.gov.
Shareholder Reports and Quarterly Portfolio Disclosure
The Fund is required to file its complete schedule of portfolio holdings with the SEC 60 days after its first and third fiscal quarter on Form N-PORT. The Fund's holdings report is available free of charge upon request by calling New York Life Investments at 800-624-6782.
Board of Trustees and Officers (Unaudited)
The Trustees and officers of the Fund are listed below. The Board oversees the MainStay Group of Funds (which consists of MainStay Funds and MainStay Funds Trust), MainStay VP Funds Trust, MainStay MacKay DefinedTerm Municipal Opportunities Fund, MainStay CBRE Global Infrastructure Megatrends Term Fund, the Manager and the Subadvisors, and elects the officers of the Funds who are responsible for the day-to-day operations of the Fund. Information pertaining to the Trustees and officers is set forth below. Each Trustee serves until his or her successor is elected and qualified or until his or her resignation, death or
removal. Under the Board’s retirement policy, unless an exception is made, a Trustee must tender his or her resignation by the end of the calendar year during which he or she reaches the age of 75. Officers are elected annually by the Board. The business address of each Trustee and officer listed below is 51 Madison Avenue, New York, New York 10010. A majority of the Trustees are not “interested persons” (as defined by the 1940 Act and rules adopted by the SEC thereunder) of the Fund (“Independent Trustees”).
| | Name and
Year of Birth | Term of Office,
Position(s) Held and
Length of Service | Principal Occupation(s)
During Past Five Years | Number of
Portfolios in
Fund Complex
Overseen by
Trustee | Other Directorships
Held by Trustee |
| | | | | | |
| | Naïm Abou-Jaoudé*
1966 | MainStay Funds: Trustee
since 2023
MainStay Funds Trust:
Trustee since 2023 | Chief Executive Officer of New York Life Investment Management LLC (since 2023). Chief Executive Officer of Candriam (an affiliate of New York Life Investment Management LLC) (2007 to 2023). | 81 | MainStay VP Funds Trust:
Trustee since 2023 (31 portfolios);
MainStay MacKay DefinedTerm Municipal Opportunities Fund: Trustee
since 2023;
MainStay CBRE Global Infrastructure Megatrends Term Fund: Trustee
since 2023; and
New York Life Investment Management International (Chair) since 2015 |
| * | This Trustee is considered to be an “interested person” of the MainStay Group of Funds, MainStay VP Funds Trust, MainStay CBRE Global Infrastructure Megatrends Term Fund and MainStay MacKay DefinedTerm Municipal Opportunities Fund, within the meaning of the 1940 Act because of his affiliation with New York Life Investment Management LLC and Candriam, as described in detail above in the column entitled “Principal Occupation(s) During Past Five Years.” |
| | |
| 32 | MainStay MacKay Convertible Fund |
| | Name and
Year of Birth | Term of Office,
Position(s) Held and
Length of Service | Principal Occupation(s)
During Past Five Years | Number of
Portfolios in
Fund Complex
Overseen by
Trustee | Other Directorships
Held by Trustee |
| | | | | | |
| | David H. Chow
1957 | MainStay Funds: Trustee since January 2016, Advisory Board Member (June 2015 to December 2015);MainStay Funds Trust:
Trustee since January 2016, Advisory Board Member (June 2015 to December 2015) | Founder and CEO, DanCourt Management, LLC (since 1999) | 81 | MainStay VP Funds Trust: Trustee since January 2016, Advisory Board Member (June 2015 to December 2015) (31 portfolios);
MainStay MacKay DefinedTerm Municipal Opportunities Fund: Trustee since January 2016, Advisory Board Member (June 2015 to December 2015);
MainStay CBRE Global Infrastructure Megatrends Term Fund: Trustee since 2021;
VanEck Vectors Group of Exchange-Traded Funds: Trustee since 2006 and Independent Chairman of the Board of Trustees from 2008 to 2022 (57 portfolios); and
Berea College of Kentucky: Trustee since 2009, Chair of the Investment Committee since 2018 |
| | Karen Hammond
1956 | MainStay Funds: Trustee since December 2021, Advisory Board Member (June 2021 to December 2021);MainStay Funds Trust:
Trustee since December 2021, Advisory Board Member (June 2021 to December 2021)
| Retired, Managing Director, Devonshire Investors (2007 to 2013); Senior Vice President, Fidelity Management & Research Co. (2005 to 2007); Senior Vice President and Corporate Treasurer, FMR Corp. (2003 to 2005); Chief Operating Officer, Fidelity Investments Japan (2001 to 2003) | 81 | MainStay VP Funds Trust: Trustee since December 2021, Advisory Board Member (June 2021 to December 2021) (31 portfolios);
MainStay MacKay DefinedTerm Municipal Opportunities Fund: Trustee since December 2021, Advisory Board Member (June 2021 to December 2021);
MainStay CBRE Global Infrastructure Megatrends Term Fund: Trustee since December 2021, Advisory Board Member (June 2021 to December 2021);
Two Harbors Investment Corp.: Director since 2018;
Rhode Island State Investment Commission: Member since 2017; and
Blue Cross Blue Shield of Rhode Island: Director since 2019 |
| | Susan B. Kerley
1951 | MainStay Funds: Chair since January 2017 and Trustee since 2007;MainStay Funds Trust:
Chair since January 2017 and Trustee since 1990*** | President, Strategic Management Advisors LLC (since 1990) | 81 | MainStay VP Funds Trust: Chair since January 2017 and Trustee since 2007 (31 portfolios)**;
MainStay MacKay DefinedTerm Municipal Opportunities Fund: Chair since January 2017 and Trustee since 2011;
MainStay CBRE Global Infrastructure Megatrends Term Fund: Trustee since June 2021; and
Legg Mason Partners Funds: Trustee since 1991 (45 portfolios) |
Board of Trustees and Officers (Unaudited) (continued)
| | Name and
Year of Birth | Term of Office,
Position(s) Held and
Length of Service | Principal Occupation(s)
During Past Five Years | Number of
Portfolios in
Fund Complex
Overseen by
Trustee | Other Directorships
Held by Trustee |
| | | | | | |
| | Alan R. Latshaw
1951 | MainStay Funds: Trusteesince 2006;MainStay Funds Trust:
Trustee since 2007*** | Retired; Partner, Ernst & Young LLP (2002 to 2003); Partner, Arthur Andersen LLP (1989 to 2002); Consultant to the MainStay Funds Audit and Compliance Committee (2004 to 2006) | 81 | MainStay VP Funds Trust: Trustee since 2007 (31 portfolios)**;
MainStay MacKay DefinedTerm Municipal Opportunities Fund: Trustee since 2011; and
MainStay CBRE Global Infrastructure Megatrends Term Fund: Trustee since June 2021 |
| | Jacques P. Perold
1958 | MainStay Funds: Trustee since January 2016, Advisory Board Member (June 2015to December 2015);MainStay Funds Trust:
Trustee since January 2016, Advisory Board Member (June 2015 to December 2015) | Founder and Chief Executive Officer, CapShift Advisors LLC (since 2018); President, Fidelity Management & Research Company (2009 to 2014); President and Chief Investment Officer, Geode Capital Management, LLC (2001 to 2009) | 81 | MainStay VP Funds Trust: Trustee since January 2016, Advisory Board Member (June 2015 to December 2015) (31 portfolios);
MainStay MacKay DefinedTerm Municipal Opportunities Fund: Trustee since January 2016, Advisory Board Member (June 2015 to December 2015);
MainStay CBRE Global Infrastructure Megatrends Term Fund: Trustee since June 2021;
Allstate Corporation: Director since 2015; and
MSCI Inc.: Director since 2017 |
| | Richard S. Trutanic
1952 | MainStay Funds: Trustee since 1994;MainStay Funds Trust:
Trustee since 2007*** | Chairman and Chief Executive Officer, Somerset & Company (financial advisory firm) (since 2004); Managing Director, The Carlyle Group (private investment firm) (2002 to 2004); Senior Managing Director, Partner and Board Member, Groupe Arnault S.A. (private investment firm) (1999 to 2002) | 81 | MainStay VP Funds Trust: Trustee since 2007 (31 portfolios)**;
MainStay MacKay DefinedTerm Municipal Opportunities Fund: Trustee since 2011; and
MainStay CBRE Global Infrastructure Megatrends Term Fund: Trustee since June 2021 |
| ** | Includes prior service as a Director of MainStay VP Series Fund, Inc., the predecessor to MainStay VP Funds Trust. |
| *** | Includes prior service as a Director/Trustee of certain predecessor entities to MainStay Funds Trust. |
| 34 | MainStay MacKay Convertible Fund |
| | Name and
Year of Birth | Position(s) Held and
Length of Service | Principal Occupation(s)
During Past Five Years | |
| | | | | |
| | Kirk C. Lehneis
1974 | President, MainStay Funds, MainStay Funds Trust (since 2017) | Chief Operating Officer and Senior Managing Director (since 2016), New York Life Investment Management LLC and New York Life Investment Management Holdings LLC; Member of the Board of Managers (since 2017) and Senior Managing Director (since 2018), NYLIFE Distributors LLC; Chairman of the Board and Senior Managing Director, NYLIM Service Company LLC (since 2017); Trustee, President and Principal Executive Officer of IndexIQ Trust, IndexIQ ETF Trust and IndexIQ Active ETF Trust (since 2018); President, MainStay CBRE Global Infrastructure Megatrends Term Fund (since 2021), MainStay MacKay DefinedTerm Municipal Opportunities Fund and MainStay VP Funds Trust (since 2017)**; Senior Managing Director, Global Product Development (2015 to 2016); Managing Director, Product Development (2010 to 2015), New York Life Investment Management LLC | |
| | Jack R. Benintende
1964 | Treasurer and Principal Financial and Accounting Officer, MainStay Funds (since 2007), MainStay Funds Trust (since 2009) | Managing Director, New York Life Investment Management LLC (since 2007); Treasurer and Principal Financial and Accounting Officer, MainStay CBRE Global Infrastructure Megatrends Term Fund (since 2021), MainStay MacKay DefinedTerm Municipal Opportunities Fund (since 2011) and MainStay VP Funds Trust (since 2007)**; and Assistant Treasurer, New York Life Investment Management Holdings LLC (2008 to 2012) | |
| | J. Kevin Gao
1967 | Secretary and Chief Legal Officer, MainStay Funds and MainStay Funds Trust (since 2010) | Managing Director and Associate General Counsel, New York Life Investment Management LLC (since 2010); Secretary and Chief Legal Officer, MainStay CBRE Global Infrastructure Megatrends Term Fund (since 2021), MainStay MacKay DefinedTerm Municipal Opportunities Fund (since 2011) and MainStay VP Funds Trust (since 2010)** | |
| | Kevin M. Gleason
1967 | Vice President and Chief Compliance Officer, MainStay Funds and MainStay Funds Trust (since June 2022) | Vice President and Chief Compliance Officer, IndexIQ Trust, IndexIQ ETF Trust and Index IQ Active ETF Trust (since June 2022); Vice President and Chief Compliance Officer, MainStay CBRE Global Infrastructure Megatrends Term Fund, MainStay VP Funds Trust and MainStay MacKay DefinedTerm Municipal Opportunities Fund (since June 2022); Senior Vice President, Voya Investment Management and Chief Compliance Officer, Voya Family of Funds (2012 to 2022) | |
| | Scott T. Harrington
1959 | Vice President— Administration, MainStay Funds (since 2005), MainStay Funds Trust (since 2009) | Managing Director, New York Life Investment Management LLC (including predecessor advisory organizations) (since 2000); Member of the Board of Directors, New York Life Trust Company (since 2009); Vice President—Administration, MainStay CBRE Global Infrastructure Megatrends Term Fund (since 2021), MainStay MacKay DefinedTerm Municipal Opportunities Fund (since 2011) and MainStay VP Funds Trust (since 2005)** | |
| * | The officers listed above are considered to be “interested persons” of the MainStay Group of Funds, MainStay VP Funds Trust, MainStay CBRE Global Infrastructure Megatrends Term Fund and MainStay MacKay DefinedTerm Municipal Opportunities Fund within the meaning of the 1940 Act because of their affiliation with the MainStay Group of Funds, New York Life Insurance Company and/or its affiliates, including New York Life Investment Management LLC, New York Life Insurance Company, NYLIM Service Company LLC, NYLIFE Securities LLC and/or NYLIFE Distributors LLC, as described in detail in the column captioned “Principal Occupation(s) During Past Five Years.” Officers are elected annually by the Board. |
| ** | Includes prior service as an Officer of MainStay VP Series Fund, Inc., the predecessor to MainStay VP Funds Trust. |
Officers of the Trust (Who are not Trustees)*
This page intentionally left blank.
This page intentionally left blank.
This page intentionally left blank.
Equity
U.S. Equity
MainStay Epoch U.S. Equity Yield Fund
MainStay Fiera SMID Growth Fund
MainStay PineStone U.S. Equity Fund
MainStay S&P 500 Index Fund
MainStay Winslow Large Cap Growth Fund
MainStay WMC Enduring Capital Fund
MainStay WMC Growth Fund
MainStay WMC Small Companies Fund
MainStay WMC Value Fund
International Equity
MainStay Epoch International Choice Fund
MainStay PineStone International Equity Fund
MainStay WMC International Research Equity Fund
Emerging Markets Equity
MainStay Candriam Emerging Markets Equity Fund
Global Equity
MainStay Epoch Capital Growth Fund
MainStay Epoch Global Equity Yield Fund
MainStay PineStone Global Equity Fund
Fixed Income
Taxable Income
MainStay Candriam Emerging Markets Debt Fund
MainStay Floating Rate Fund
MainStay MacKay High Yield Corporate Bond Fund
MainStay MacKay Short Duration High Yield Fund
MainStay MacKay Strategic Bond Fund
MainStay MacKay Total Return Bond Fund
MainStay MacKay U.S. Infrastructure Bond Fund
MainStay Short Term Bond Fund
Tax-Exempt Income
MainStay MacKay California Tax Free Opportunities Fund1
MainStay MacKay High Yield Municipal Bond Fund
MainStay MacKay New York Tax Free Opportunities Fund2
MainStay MacKay Short Term Municipal Fund
MainStay MacKay Strategic Municipal Allocation Fund
MainStay MacKay Tax Free Bond Fund
Money Market
MainStay Money Market Fund
Mixed Asset
MainStay Balanced Fund
MainStay Income Builder Fund
MainStay MacKay Convertible Fund
Speciality
MainStay CBRE Global Infrastructure Fund
MainStay CBRE Real Estate Fund
MainStay Cushing MLP Premier Fund
Asset Allocation
MainStay Conservative Allocation Fund
MainStay Conservative ETF Allocation Fund
MainStay Defensive ETF Allocation Fund
MainStay Equity Allocation Fund
MainStay Equity ETF Allocation Fund
MainStay ESG Multi-Asset Allocation Fund
MainStay Growth Allocation Fund
MainStay Growth ETF Allocation Fund
MainStay Moderate Allocation Fund
MainStay Moderate ETF Allocation Fund
Manager
New York Life Investment Management LLC
New York, New York
Subadvisors
Candriam3
Strassen, Luxembourg
CBRE Investment Management Listed Real Assets LLC
Radnor, Pennsylvania
Cushing Asset Management, LP
Dallas, Texas
Epoch Investment Partners, Inc.
New York, New York
Fiera Capital Inc.
New York, New York
IndexIQ Advisors LLC3
New York, New York
MacKay Shields LLC3
New York, New York
NYL Investors LLC3
New York, New York
PineStone Asset Management Inc.
Montreal, Québec
Wellington Management Company LLP
Boston, Massachusetts
Winslow Capital Management, LLC
Minneapolis, Minnesota
Legal Counsel
Dechert LLP
Washington, District of Columbia
Independent Registered Public Accounting Firm
KPMG LLP
Philadelphia, Pennsylvania
Distributor
NYLIFE Distributors LLC3
Jersey City, New Jersey
Custodian
JPMorgan Chase Bank, N.A.
New York, New York
1.
This Fund is registered for sale in AZ, CA, NV, OR, TX, UT, WA and MI (Class A and Class I shares only), and CO, FL, GA, HI, ID, MA, MD, NH, NJ and NY (Class I shares only).
| 2. | This Fund is registered for sale in CA, CT, DE, FL, MA, NJ, NY and VT. |
| 3. | An affiliate of New York Life Investment Management LLC. |
Not part of the Annual Report
For more information
800-624-6782
newyorklifeinvestments.com
“New York Life Investments” is both a service mark, and the common trade name, of certain investment advisors affiliated with New York Life Insurance Company. The MainStay Funds® are managed by New York Life Investment Management LLC and distributed by NYLIFE Distributors LLC, 30 Hudson Street, Jersey City, NJ 07302, a wholly owned subsidiary of New York Life Insurance Company. NYLIFE Distributors LLC is a Member FINRA/SIPC.
©2023 NYLIFE Distributors LLC. All rights reserved.
| 5013891MS139-23 | MSC11-12/23 |
(NYLIM) NL210
MainStay MacKay High Yield Corporate Bond Fund
Message from the President and Annual Report
October 31, 2023
Special Notice:
Beginning in July 2024, new regulations issued by the Securities and Exchange Commission (SEC) will take effect requiring open-end mutual fund companies and ETFs to (1) overhaul the content of their shareholder reports and (2) mail paper copies of the new tailored shareholder reports to shareholders who have not opted to receive these documents electronically.
If you have not yet elected to receive your shareholder reports electronically, please contact your financial intermediary or visit newyorklifeinvestments.com/accounts.
| Not FDIC/NCUA Insured | Not a Deposit | May Lose Value | No Bank Guarantee | Not Insured by Any Government Agency |
This page intentionally left blank
Message from the President
Volatile economic and geopolitical forces drove market behavior during the 12-month reporting period ended October 31, 2023. While equity markets generally gained ground, bond prices trended broadly lower.
Although the war in Ukraine, the outbreak of hostilities in the Middle East and several other notable events affected financial assets, inflation and interest rate trends stood at the forefront of market developments during most of the period. As the reporting period began, high levels of inflation already showed signs of easing in the face of aggressive rate hikes by the U.S. Federal Reserve (the “Fed”). From a peak of 9.1% in June 2022, the annualized U.S. inflation rate dropped to 7.1% in November 2022, and to 3.2% in October 2023. At the same time, the Fed increased the benchmark federal funds rate from 3.75%–4.00% at the beginning of the reporting period to 5.25%–5.50% as of October 31, 2023. As the pace of rate increases slowed during the period, investors hoped for an early shift to a looser monetary policy. However, comments from Fed members late in the period reinforced the central bank’s hawkish stance in response to surprisingly robust U.S. economic growth and rising wage pressures, thus increasing the likelihood that interest rates would stay higher for longer. International developed markets exhibited similar dynamics of elevated inflation and rising interest rates.
Despite the backdrop of high interest rates—along with political dysfunction in Washington D.C. and intensifying global geopolitical instability—equity markets managed to advance, supported by healthy consumer spending trends and persistent domestic economic growth. The S&P 500® Index, a widely regarded benchmark of large-cap U.S. market performance, gained ground, bolstered by the strong performance of energy stocks amid surging petroleum prices and mega-cap, growth-oriented, technology-related shares, which rose as investors flocked to companies creating the infrastructure for developments in artificial intelligence. Smaller-cap stocks and value-oriented shares produced milder returns. Among industry sectors, energy and
information technology posted the strongest gains. Real estate declined most sharply under pressure from rising mortgage rates and weak levels of office occupancy. Developed international markets outperformed U.S. markets, with Europe benefiting during the first half of the period from unexpected economic resilience in the face of rising energy prices and the ongoing war in Ukraine. Emerging markets posted positive results but lagged developed markets, largely due to slow economic growth in China despite the relaxation of pandemic-era lockdowns.
Bond prices were driven lower by rising yields and increasing expectations of high interest rates for an extended period of time. The U.S. yield curve steepened, with the 30-year Treasury yield exceeding 5% for the first time in more than a decade. The yield curve remained inverted, with the 10-year Treasury yield ending the period at 4.88%, compared with 5.07% for the 2-year Treasury yield. Corporate bonds outperformed long-term Treasury bonds, but still trended lower under pressure from rising yields and an uptick in default rates. Among corporates, lower-credit-quality instruments performed slightly better than their higher-credit-quality counterparts, while floating rate securities performed better still.
In the face of today’s uncertain market environment, New York Life Investments remains dedicated to providing the guidance, resources and investment solutions you need to pursue your financial goals.
Thank you for trusting us to help meet your investment needs.
Sincerely,
Kirk C. Lehneis
President
The opinions expressed are as of the date of this report and are subject to change. There is no guarantee that any forecast made will come to pass. This material does not constitute investment advice and is not intended as an endorsement of any specific investment. Past performance is no guarantee of future results.
Not part of the Annual Report
Investors should refer to the Fund’s Summary Prospectus and/or Prospectus and consider the Fund’s investment objectives, strategies, risks, charges and expenses carefully before investing. The Summary Prospectus and/or Prospectus contain this and other information about the Fund. You may obtain copies of the Fund’s Summary Prospectus, Prospectus and Statement of Additional Information, which includes information about The MainStay Funds' Trustees, free of charge, upon request, by calling toll-free 800-624-6782, by writing to NYLIFE Distributors LLC, Attn: MainStay Marketing Department, 30 Hudson Street, Jersey City, NJ 07302 or by sending an e-mail to MainStayShareholderServices@nylim.com. These documents are also available via the MainStay Funds’ website at newyorklifeinvestments.com. Please read the Fund’s Summary Prospectus and/or Prospectus carefully before investing.
Investment and Performance Comparison (Unaudited)
Performance data quoted represents past performance. Past performance is no guarantee of future results. Because of market volatility and other factors, current performance may be lower or higher than the figures shown. Investment return and principal value will fluctuate, and as a result, when shares are redeemed, they may be worth more or less than their original cost. The graph below depicts the historical performance of Class I shares of the Fund. Performance will vary from class to class based on differences in class-specific expenses and sales charges. For performance information current to the most recent month-end, please call 800-624-6782 or visit newyorklifeinvestments.com.
The performance table and graph do not reflect the deduction of taxes that a shareholder would pay on distributions or Fund share redemptions. Total returns reflect maximum applicable sales charges as indicated in the table below, if any, changes in share price, and reinvestment of dividend and capital gain distributions. The graph assumes the initial investment amount shown below and reflects the deduction of all sales charges that would have applied for the period of investment. Performance figures may reflect certain fee waivers and/or expense limitations, without which total returns may have been lower. For more information on share classes and current fee waivers and/or expense limitations (if any), please refer to the Notes to Financial Statements.

| Average Annual Total Returns for the Year-Ended October 31, 2023 |
| Class | Sales Charge | | Inception
Date | One
Year | Five
Years | Ten Years
or Since
Inception | Gross
Expense
Ratio1 |
| Class A Shares | Maximum 4.50% Initial Sales Charge | With sales charges | 1/3/1995 | 1.53% | 2.17% | 3.28% | 0.95% |
| | | Excluding sales charges | | 6.31 | 3.11 | 3.76 | 0.95 |
| Investor Class Shares2 | Maximum 4.00% Initial Sales Charge | With sales charges | 2/28/2008 | 1.63 | 2.00 | 3.18 | 1.09 |
| | | Excluding sales charges | | 5.87 | 2.95 | 3.66 | 1.09 |
| Class B Shares3 | Maximum 5.00% CDSC | With sales charges | 5/1/1986 | 0.12 | 1.85 | 2.89 | 1.84 |
| | if Redeemed Within the First Six Years of Purchase | Excluding sales charges | | 5.12 | 2.17 | 2.89 | 1.84 |
| Class C Shares | Maximum 1.00% CDSC | With sales charges | 9/1/1998 | 4.34 | 2.21 | 2.90 | 1.84 |
| | if Redeemed Within One Year of Purchase | Excluding sales charges | | 5.34 | 2.21 | 2.90 | 1.84 |
| Class I Shares | No Sales Charge | | 1/2/2004 | 6.57 | 3.35 | 4.03 | 0.70 |
| Class R1 Shares4 | No Sales Charge | | 6/29/2012 | 6.48 | 3.24 | 3.91 | 0.80 |
| Class R2 Shares | No Sales Charge | | 5/1/2008 | 6.19 | 3.01 | 3.66 | 1.05 |
| Class R3 Shares | No Sales Charge | | 2/29/2016 | 5.72 | 2.71 | 4.69 | 1.30 |
| Class R6 Shares | No Sales Charge | | 6/17/2013 | 6.54 | 3.46 | 4.14 | 0.57 |
| SIMPLE Class Shares | No Sales Charge | | 8/31/2020 | 6.00 | N/A | 1.31 | 1.27 |
| 1. | The gross expense ratios presented reflect the Fund’s “Total Annual Fund Operating Expenses” from the most recent Prospectus, as supplemented, and may differ from other expense ratios disclosed in this report. |
| 2. | Prior to June 30, 2020, the maximum initial sales charge was 4.50%, which is reflected in the applicable average annual total return figures shown. |
| 3. | Class B shares are closed to all new purchases as well as additional investments by existing Class B shareholders. |
| 4. | As of October 31, 2023, Class R1 shares are closed to new investors and, upon the close of business on December 29, 2023, Class R1 shares are closed to additional investments by existing shareholders. Additionally, Class R1 shares will be liquidated on or about February 28, 2024 (the "Liquidation Date"). It is expected that the Fund will distribute to remaining shareholders invested in Class R1 shares, on or promptly after the Liquidation Date, a liquidating distribution in cash or cash equivalents equal to the net asset value of such shares. |
The footnotes on the next page are an integral part of the table and graph and should be carefully read in conjunction with them.
| Benchmark Performance* | One
Year | Five
Years | Ten
Years |
| ICE BofA U.S. High Yield Constrained Index1 | 5.81% | 2.86% | 3.77% |
| Morningstar High Yield Bond Category Average2 | 5.72 | 2.58 | 3.03 |
| * | Returns for indices reflect no deductions for fees, expenses or taxes, except for foreign withholding taxes where applicable. Results assume reinvestment of all dividends and capital gains. An investment cannot be made directly in an index. |
| 1. | The ICE BofA U.S. High Yield Constrained Index is the Fund's primary broad-based securities market index for comparison purposes. The ICE BofA U.S. High Yield Constrained Index is a market value-weighted index of all domestic and Yankee high-yield bonds, including deferred interest bonds and payment-in-kind securities. Issuers included in the ICE BofA U.S. High Yield Constrained Index have maturities of one year or more and have a credit rating lower than BBB-/Baa3, but are not in default. No single issuer may constitute greater than 2% of the ICE BofA U.S. High Yield Constrained Index. |
| 2. | The Morningstar High Yield Bond Category Average is representative of funds that concentrate on lower-quality bonds, which are riskier than those of higher-quality companies. These funds primarily invest in U.S. high-income debt securities where at least 65% or more of bond assets are not rated or are rated by a major agency such as Standard & Poor’s or Moody’s at the level of BB and below. Results are based on average total returns of similar funds with all dividends and capital gain distributions reinvested. |
The footnotes on the preceding page are an integral part of the table and graph and should be carefully read in conjunction with them.
| 6 | MainStay MacKay High Yield Corporate Bond Fund |
Cost in Dollars of a $1,000 Investment in MainStay MacKay High Yield Corporate Bond Fund (Unaudited)
The example below is intended to describe the fees and expenses borne by shareholders during the six-month period from May 1, 2023 to October 31, 2023, and the impact of those costs on your investment.
Example
As a shareholder of the Fund you incur two types of costs: (1) transaction costs, including exchange fees and sales charges (loads) on purchases (as applicable), and (2) ongoing costs, including management fees, distribution and/or service (12b-1) fees and other Fund expenses (as applicable). This example is intended to help you understand your ongoing costs (in dollars) of investing in the Fund and to compare these costs with the ongoing costs of investing in other mutual funds. The example is based on an investment of $1,000 made at the beginning of the six-month period and held for the entire period from May 1, 2023 to October 31, 2023.
This example illustrates your Fund’s ongoing costs in two ways:
Actual Expenses
The second and third data columns in the table below provide information about actual account values and actual expenses. You may use the information in these columns, together with the amount you invested, to estimate the expenses that you paid during the six months ended October 31, 2023. Simply divide your account value by $1,000 (for example, an
$8,600 account value divided by $1,000 = 8.6), then multiply the result by the number under the heading entitled “Expenses Paid During Period” to estimate the expenses you paid on your account during this period.
Hypothetical Example for Comparison Purposes
The fourth and fifth data columns in the table below provide information about hypothetical account values and hypothetical expenses based on the Fund’s actual expense ratio and an assumed rate of return of 5% per year before expenses, which is not the Fund’s actual return. The hypothetical account values and expenses may not be used to estimate the actual ending account balances or expenses you paid for the six-month period shown. You may use this information to compare the ongoing costs of investing in the Fund with the ongoing costs of investing in other mutual funds. To do so, compare this 5% hypothetical example with the 5% hypothetical examples that appear in the shareholder reports of the other mutual funds.
Please note that the expenses shown in the table are meant to highlight your ongoing costs only and do not reflect any transactional costs, such as exchange fees or sales charges (loads). Therefore, the fourth and fifth data columns of the table are useful in comparing ongoing costs only and will not help you determine the relative total costs of owning different funds. In addition, if these transactional costs were included, your costs would have been higher.
| Share Class | Beginning
Account
Value
5/1/23 | Ending Account
Value (Based
on Actual
Returns and
Expenses)
10/31/23 | Expenses
Paid
During
Period1 | Ending Account
Value (Based
on Hypothetical
5% Annualized
Return and
Actual Expenses)
10/31/23 | Expenses
Paid
During
Period1 | Net Expense
Ratio
During
Period2 |
| Class A Shares | $1,000.00 | $1,002.80 | $4.90 | $1,020.32 | $4.94 | 0.97% |
| Investor Class Shares | $1,000.00 | $ 999.90 | $5.75 | $1,019.46 | $5.80 | 1.14% |
| Class B Shares | $1,000.00 | $ 996.10 | $9.51 | $1,015.68 | $9.60 | 1.89% |
| Class C Shares | $1,000.00 | $ 998.10 | $9.52 | $1,015.68 | $9.60 | 1.89% |
| Class I Shares | $1,000.00 | $1,004.00 | $3.64 | $1,021.58 | $3.67 | 0.72% |
| Class R1 Shares | $1,000.00 | $1,003.50 | $4.14 | $1,021.07 | $4.18 | 0.82% |
| Class R2 Shares | $1,000.00 | $1,002.30 | $5.40 | $1,019.81 | $5.45 | 1.07% |
| Class R3 Shares | $1,000.00 | $1,001.00 | $6.66 | $1,018.55 | $6.72 | 1.32% |
| Class R6 Shares | $1,000.00 | $1,002.80 | $2.83 | $1,022.38 | $2.85 | 0.56% |
| SIMPLE Class Shares | $1,000.00 | $1,001.80 | $5.85 | $1,019.36 | $5.90 | 1.16% |
| 1. | Expenses are equal to the Fund’s annualized expense ratio of each class multiplied by the average account value over the period, divided by 365 and multiplied by 184 (to reflect the six-month period). The table above represents the actual expenses incurred during the six-month period. In addition to the fees and expenses which the Fund bears directly, it also indirectly bears a pro rata share of the fees and expenses of the underlying funds in which it invests. Such indirect expenses are not included in the above-reported expense figures. |
| 2. | Expenses are equal to the Fund's annualized expense ratio to reflect the six-month period. |
Portfolio Composition as of October 31, 2023 (Unaudited)
‡ Less than one-tenth of percent.
See Portfolio of Investments beginning on page 10 for specific holdings within these categories. The Fund's holdings are subject to change.
Top Ten Holdings and/or Issuers Held as of October 31, 2023 (excluding short-term investments) (Unaudited)
| 1. | CCO Holdings LLC, 4.25%-5.375%, due 5/1/27–1/15/34 |
| 2. | TransDigm, Inc., 4.625%-7.50%, due 3/15/26–12/15/30 |
| 3. | Carnival Corp., 4.00%-9.875%, due 3/1/26–8/15/29 |
| 4. | HCA, Inc., 5.375%-7.69%, due 2/1/25–11/6/33 |
| 5. | Yum! Brands, Inc., 3.625%-5.375%, due 1/15/30–4/1/32 |
| 6. | IHO Verwaltungs GmbH, 4.75%-6.375%, due 9/15/26–5/15/29 |
| 7. | Gulfport Energy Corp. |
| 8. | Sprint Capital Corp., 6.875%, due 11/15/28 |
| 9. | VICI Properties LP, 3.875%-5.75%, due 5/1/24–2/15/29 |
| 10. | Churchill Downs, Inc., 4.75%-6.75%, due 4/1/27–5/1/31 |
| 8 | MainStay MacKay High Yield Corporate Bond Fund |
Portfolio Management Discussion and Analysis (Unaudited)
Questions answered byportfolio manager Andrew Susser of MacKay Shields LLC, the Fund’s Subadvisor.
How did MainStay MacKay High Yield Corporate Bond Fund perform relative to its benchmark and peer group during the 12 months ended October 31, 2023?
For the 12 months ended October 31, 2023, Class I shares of MainStay MacKay High Yield Corporate Bond Fund returned 6.57%, outperforming the 5.81% return of the Fund’s benchmark, the ICE BofA U.S. High Yield Constrained Index (the “Index”). Over the same period, Class I shares also outperformed the 5.72% return of the Morningstar High Yield Bond Category Average.1
What factors affected the Fund’s relative performance during the reporting period?
The high-yield market finished 2022 on a strong note, up over 3.7% during the fourth quarter. The market’s positive sentiment continued into 2023, rising by an additional 3.7% during the first quarter. Although the market’s recovery was stalled by concerns over a banking crisis in early March, and sentiment was mixed heading into the second quarter of 2023, quick reaction by bank regulators tempered the markets jitters. In May, Congress’s pending debt-ceiling conundrum again elevated volatility; however, this concern was pushed down the road with a short-term fix. The third quarter of 2023 closed with mixed results, due in large part to the sizeable move in Treasury yields. For the entire reporting period, high yield, in general, produced solid rates of return. Although CCC-rated2 bonds sold off at the end of the reporting period, they remained by far and away the best performers, approximately doubling the return of the overall market.
During the reporting period, the Fund's outperformance relative to the Index was driven by security selection, primarily within the energy and basic industry sectors. Security selection within lower quality CCC-rated securities was strong, and the Fund's underweight detracted as CCC's were the best performers from a credit quality perspective during the period.
During the reporting period, were there any market events that materially impacted the Fund’s performance or liquidity?
There were no market events that impacted the Fund’s liquidity during the reporting period. Performance for the high-yield corporate market was driven primarily by the move in Treasury yields and the strong performance in CCC-rated credits.
What was the Fund’s duration3 strategy during the reporting period?
The Fund’s duration is the result of our bottom-up fundamental analysis and is a residual of the investment process. However, the Fund did maintain a lower duration than the Index throughout the reporting period, which made a modestly positive contribution to returns. (Contributions take weightings and total returns into
account.) As of October 31, 2023, the Fund’s modified duration to worst4 was 3.29 years, while the modified duration to worst of the Index was 3.87 years.
During the reporting period, which sectors were the strongest positive contributors to the Fund’s relative performance and which sectors were particularly weak?
Security selection in and overweight exposure to the energy sector made the largest contribution to the Fund’s relative returns during the reporting period, bolstered by positions in exploration & production and gas distribution. Other positive contributors included an overweight exposure to and selection in basic industry, along with security selection in technology. The most significant detractors included selection in leisure, followed by security selection in financials and retail. Although security selection in CCC-rated credits was strong, underweight exposure detracted from returns as CCC’s were the best performing credit rating during the reporting period.
What were some of the Fund’s largest purchases and sales during the reporting period?
During the reporting period, the Fund initiated positions in offshore oil & gas driller Transocean, electronic gaming company Light and Wonder International and industrial company Chart Industries. During the same period, we closed the Fund’s positions in Carlson Travel, packaged food provider Treehouse Foods and midstream energy company Cheniere. Cheniere had recently been upgraded to investment grade.
How did the Fund’s sector weightings change during the reporting period?
During the reporting period, there were no material changes to the Fund’s sector weightings. On the margin, we slightly increased the Fund’s exposure to the automotive, capital goods and services sectors, while trimming holdings in financials, real estate and telecommunications.
How was the Fund positioned at the end of the reporting period?
As of October 31, 2023, the Fund held overweight exposure relative to the Index in the energy, materials and health care sectors, and underweight exposure to the telecommunications, technology and services sectors.
| 1. | See "Investment and Performance Comparison" for other share class returns, which may be higher or lower than Class I share returns, and for more information on benchmark and peer group returns. |
| 2. | An obligation rated ‘CCC’ by Standard & Poor’s (“S&P”) is deemed by S&P to be currently vulnerable to nonpayment and is dependent upon favorable business, financial and economic conditions for the obligor to meet its financial commitment on the obligation. It is the opinion of S&P that in the event of adverse business, financial or economic conditions, the obligor is not likely to have the capacity to meet its financial commitment on the obligation. When applied to Fund holdings, ratings are based solely on the creditworthiness of the bonds in the portfolio and are not meant to represent the security or safety of the Fund. |
| 3. | Duration is a measure of the price sensitivity of a fixed-income investment to changes in interest rates. Duration is expressed as a number of years and is considered a more accurate sensitivity gauge than average maturity. |
| 4. | Modified duration is inversely related to the approximate percentage change in price for a given change in yield. Duration to worst is the duration of a bond computed using the bond’s nearest call date or maturity. This measure ignores future cash flow fluctuations due to embedded optionality. |
The opinions expressed are those of the portfolio manager as of the date of this report and are subject to change. There is no guarantee that any forecasts will come to pass. This material does not constitute investment advice and is not intended as an endorsement of any specific investment.
Portfolio of Investments October 31, 2023†^
| | Principal
Amount | Value |
| Long-Term Bonds 91.7% |
| Convertible Bonds 1.3% |
| Energy-Alternate Sources 0.1% |
| NextEra Energy Partners LP (a) | | |
| (zero coupon), due 11/15/25 | $ 3,335,000 | $ 2,846,423 |
| 2.50%, due 6/15/26 | 9,500,000 | 8,236,500 |
| | | 11,082,923 |
| Investment Companies 0.1% |
| Ares Capital Corp. | | |
| 4.625%, due 3/1/24 | 9,585,000 | 9,632,925 |
| Media 0.5% |
| DISH Network Corp. | | |
| 2.375%, due 3/15/24 | 37,079,000 | 35,595,840 |
| 3.375%, due 8/15/26 | 30,780,000 | 15,928,650 |
| | | 51,524,490 |
| Oil & Gas 0.4% |
| Gulfport Energy Operating Corp. | | |
| 10.00% (10.00% Cash or 15.00% PIK), due 12/29/49 (b)(c) | 4,201,000 | 36,667,588 |
| Oil & Gas Services 0.2% |
| Forum Energy Technologies, Inc. | | |
| 9.00% (6.25% Cash and 2.75% PIK), due 8/4/25 (c) | 18,220,551 | 17,662,454 |
Total Convertible Bonds
(Cost $106,749,142) | | 126,570,380 |
| Corporate Bonds 84.9% |
| Advertising 1.1% |
| Lamar Media Corp. | | |
| 3.625%, due 1/15/31 | 35,590,000 | 28,767,753 |
| 3.75%, due 2/15/28 | 19,000,000 | 16,828,719 |
| 4.00%, due 2/15/30 | 28,300,000 | 23,944,630 |
| 4.875%, due 1/15/29 | 10,000,000 | 9,168,600 |
| Outfront Media Capital LLC (a) | | |
| 5.00%, due 8/15/27 | 19,500,000 | 17,321,460 |
| 6.25%, due 6/15/25 | 15,216,000 | 15,006,324 |
| | | 111,037,486 |
| Aerospace & Defense 2.0% |
| F-Brasile SpA | | |
| Series XR | | |
| 7.375%, due 8/15/26 (a) | 23,280,000 | 21,627,256 |
| | Principal
Amount | Value |
| |
| Aerospace & Defense (continued) |
| Rolls-Royce plc | | |
| 5.75%, due 10/15/27 (a) | $ 7,000,000 | $ 6,633,024 |
| TransDigm, Inc. | | |
| 4.625%, due 1/15/29 | 25,450,000 | 21,944,008 |
| 4.875%, due 5/1/29 | 18,920,000 | 16,391,974 |
| 5.50%, due 11/15/27 | 5,550,000 | 5,166,797 |
| 6.25%, due 3/15/26 (a) | 84,230,000 | 82,247,195 |
| 6.75%, due 8/15/28 (a) | 27,890,000 | 27,080,725 |
| 6.875%, due 12/15/30 (a) | 10,650,000 | 10,283,214 |
| 7.50%, due 3/15/27 | 11,915,000 | 11,900,415 |
| | | 203,274,608 |
| Airlines 0.5% |
| American Airlines, Inc. (a) | | |
| 5.50%, due 4/20/26 | 11,666,667 | 11,345,233 |
| 5.75%, due 4/20/29 | 11,500,000 | 10,373,630 |
| Delta Air Lines, Inc. | | |
| 4.50%, due 10/20/25 (a) | 4,356,000 | 4,233,928 |
| 7.375%, due 1/15/26 | 7,000,000 | 7,069,650 |
| Mileage Plus Holdings LLC | | |
| 6.50%, due 6/20/27 (a) | 14,182,500 | 14,010,574 |
| | | 47,033,015 |
| Auto Manufacturers 1.7% |
| Ford Holdings LLC | | |
| 9.30%, due 3/1/30 | 30,695,000 | 32,889,079 |
| Ford Motor Credit Co. LLC | | |
| 4.271%, due 1/9/27 | 7,500,000 | 6,939,103 |
| 4.389%, due 1/8/26 | 2,500,000 | 2,369,755 |
| 5.125%, due 6/16/25 | 12,000,000 | 11,676,162 |
| 5.584%, due 3/18/24 | 3,660,000 | 3,643,245 |
| 6.80%, due 5/12/28 | 14,830,000 | 14,787,623 |
| 6.95%, due 6/10/26 | 8,000,000 | 8,020,000 |
| 7.20%, due 6/10/30 | 6,500,000 | 6,495,580 |
| General Motors Financial Co., Inc. | | |
| 4.35%, due 4/9/25 | 5,000,000 | 4,861,468 |
| 5.25%, due 3/1/26 | 10,000,000 | 9,746,061 |
| JB Poindexter & Co., Inc. | | |
| 7.125%, due 4/15/26 (a) | 51,815,000 | 49,406,191 |
| PM General Purchaser LLC | | |
| 9.50%, due 10/1/28 (a) | 16,585,000 | 15,589,900 |
| | | 166,424,167 |
| Auto Parts & Equipment 2.3% |
| Adient Global Holdings Ltd. (a) | | |
| 4.875%, due 8/15/26 | 20,725,000 | 19,301,516 |
| 7.00%, due 4/15/28 | 3,340,000 | 3,287,563 |
| 8.25%, due 4/15/31 | 5,000,000 | 4,866,367 |
The notes to the financial statements are an integral part of, and should be read in conjunction with, the financial statements.
| 10 | MainStay MacKay High Yield Corporate Bond Fund |
| | Principal
Amount | Value |
| Corporate Bonds (continued) |
| Auto Parts & Equipment (continued) |
| Dealer Tire LLC | | |
| 8.00%, due 2/1/28 (a) | $ 20,540,000 | $ 19,265,801 |
| IHO Verwaltungs GmbH (a)(c) | | |
| 4.75% (4.75% Cash or 5.50% PIK), due 9/15/26 | 34,785,000 | 32,326,744 |
| 6.00% (6.00% Cash or 6.75% PIK), due 5/15/27 | 49,074,000 | 45,663,848 |
| 6.375% (6.375% Cash or 7.125% PIK), due 5/15/29 | 40,980,000 | 35,677,356 |
| Real Hero Merger Sub 2, Inc. | | |
| 6.25%, due 2/1/29 (a) | 38,625,000 | 30,725,029 |
| Tenneco, Inc. | | |
| 8.00%, due 11/17/28 (a) | 23,685,000 | 19,007,212 |
| ZF North America Capital, Inc. (a) | | |
| 6.875%, due 4/14/28 | 8,000,000 | 7,752,384 |
| 7.125%, due 4/14/30 | 10,000,000 | 9,700,641 |
| | | 227,574,461 |
| Building Materials 1.5% |
| Builders FirstSource, Inc. | | |
| 6.375%, due 6/15/32 (a) | 10,385,000 | 9,505,086 |
| Emerald Debt Merger Sub LLC | | |
| 6.625%, due 12/15/30 (a) | 29,000,000 | 27,586,250 |
| James Hardie International Finance DAC | | |
| 5.00%, due 1/15/28 (a) | 32,195,000 | 29,716,037 |
| Knife River Corp. | | |
| 7.75%, due 5/1/31 (a) | 16,630,000 | 16,568,025 |
| New Enterprise Stone & Lime Co., Inc. | | |
| 5.25%, due 7/15/28 (a) | 9,500,000 | 8,383,669 |
| PGT Innovations, Inc. | | |
| 4.375%, due 10/1/29 (a) | 17,000,000 | 15,870,775 |
| Summit Materials LLC (a) | | |
| 5.25%, due 1/15/29 | 17,580,000 | 15,918,162 |
| 6.50%, due 3/15/27 | 22,730,000 | 22,104,867 |
| | | 145,652,871 |
| Chemicals 3.0% |
| ASP Unifrax Holdings, Inc. (a) | | |
| 5.25%, due 9/30/28 | 24,160,000 | 16,318,797 |
| 7.50%, due 9/30/29 | 21,280,000 | 11,384,800 |
| Avient Corp. (a) | | |
| 5.75%, due 5/15/25 | 8,550,000 | 8,378,114 |
| 7.125%, due 8/1/30 | 13,745,000 | 13,223,948 |
| CVR Partners LP | | |
| 6.125%, due 6/15/28 (a) | 6,175,000 | 5,449,437 |
| | Principal
Amount | Value |
| |
| Chemicals (continued) |
| GPD Cos., Inc. | | |
| 10.125%, due 4/1/26 (a) | $ 35,822,000 | $ 32,262,471 |
| Innophos Holdings, Inc. | | |
| 9.375%, due 2/15/28 (a) | 30,636,000 | 28,825,099 |
| Iris Holdings, Inc. | | |
| 8.75% (8.75% Cash or 9.50% PIK), due 2/15/26 (a)(c) | 21,105,000 | 18,674,345 |
| Mativ Holdings, Inc. | | |
| 6.875%, due 10/1/26 (a) | 12,500,000 | 11,250,000 |
| NOVA Chemicals Corp. (a) | | |
| 4.875%, due 6/1/24 | 9,810,000 | 9,640,521 |
| 5.25%, due 6/1/27 | 21,100,000 | 17,822,425 |
| Olympus Water US Holding Corp. (a) | | |
| 7.125%, due 10/1/27 | 7,400,000 | 6,813,311 |
| 9.75%, due 11/15/28 | 32,000,000 | 31,254,431 |
| SCIH Salt Holdings, Inc. (a) | | |
| 4.875%, due 5/1/28 | 10,000,000 | 8,633,772 |
| 6.625%, due 5/1/29 | 29,460,000 | 24,694,129 |
| SCIL IV LLC | | |
| 5.375%, due 11/1/26 (a) | 16,000,000 | 14,192,416 |
| SK Invictus Intermediate II SARL | | |
| 5.00%, due 10/30/29 (a) | 41,855,000 | 31,604,001 |
| WR Grace Holdings LLC | | |
| 7.375%, due 3/1/31 (a) | 7,000,000 | 6,483,890 |
| | | 296,905,907 |
| Coal 0.1% |
| Coronado Finance Pty. Ltd. | | |
| 10.75%, due 5/15/26 (a) | 8,720,000 | 9,012,709 |
| Commercial Services 2.2% |
| Alta Equipment Group, Inc. | | |
| 5.625%, due 4/15/26 (a) | 6,075,000 | 5,434,476 |
| Gartner, Inc. (a) | | |
| 3.75%, due 10/1/30 | 19,870,000 | 16,446,193 |
| 4.50%, due 7/1/28 | 5,000,000 | 4,498,592 |
| Graham Holdings Co. | | |
| 5.75%, due 6/1/26 (a) | 39,695,000 | 38,206,437 |
| Korn Ferry | | |
| 4.625%, due 12/15/27 (a) | 10,685,000 | 9,718,749 |
| MPH Acquisition Holdings LLC | | |
| 5.75%, due 11/1/28 (a) | 11,685,000 | 8,710,233 |
| NESCO Holdings II, Inc. | | |
| 5.50%, due 4/15/29 (a) | 34,804,000 | 29,844,430 |
| Service Corp. International | | |
| 3.375%, due 8/15/30 | 9,000,000 | 7,209,765 |
| TriNet Group, Inc. | | |
| 7.125%, due 8/15/31 (a) | 5,000,000 | 4,834,100 |
The notes to the financial statements are an integral part of, and should be read in conjunction with, the financial statements.
11
Portfolio of Investments October 31, 2023†^ (continued)
| | Principal
Amount | Value |
| Corporate Bonds (continued) |
| Commercial Services (continued) |
| United Rentals North America, Inc. | | |
| 3.75%, due 1/15/32 | $ 4,790,000 | $ 3,808,567 |
| 3.875%, due 2/15/31 | 16,675,000 | 13,724,429 |
| 4.875%, due 1/15/28 | 10,700,000 | 9,927,216 |
| 5.25%, due 1/15/30 | 2,500,000 | 2,282,835 |
| Williams Scotsman, Inc. (a) | | |
| 4.625%, due 8/15/28 | 17,860,000 | 15,866,377 |
| 6.125%, due 6/15/25 | 17,550,000 | 17,243,760 |
| 7.375%, due 10/1/31 | 11,515,000 | 11,326,389 |
| WW International, Inc. | | |
| 4.50%, due 4/15/29 (a) | 28,565,000 | 17,853,125 |
| | | 216,935,673 |
| Computers 0.1% |
| McAfee Corp. | | |
| 7.375%, due 2/15/30 (a) | 18,010,000 | 14,407,561 |
| Cosmetics & Personal Care 0.3% |
| Edgewell Personal Care Co. (a) | | |
| 4.125%, due 4/1/29 | 22,500,000 | 18,815,625 |
| 5.50%, due 6/1/28 | 16,505,000 | 15,063,536 |
| | | 33,879,161 |
| Distribution & Wholesale 0.7% |
| G-III Apparel Group Ltd. | | |
| 7.875%, due 8/15/25 (a) | 23,000,000 | 22,789,606 |
| H&E Equipment Services, Inc. | | |
| 3.875%, due 12/15/28 (a) | 7,855,000 | 6,653,465 |
| Ritchie Bros Holdings, Inc. (a) | | |
| 6.75%, due 3/15/28 | 13,290,000 | 13,023,909 |
| 7.75%, due 3/15/31 | 28,245,000 | 28,315,613 |
| | | 70,782,593 |
| Diversified Financial Services 2.1% |
| AG TTMT Escrow Issuer LLC | | |
| 8.625%, due 9/30/27 (a) | 29,250,000 | 29,382,649 |
| Aretec Escrow Issuer 2, Inc. | | |
| 10.00%, due 8/15/30 (a) | 10,600,000 | 10,719,250 |
| Credit Acceptance Corp. | | |
| 5.125%, due 12/31/24 (a) | 15,215,000 | 14,709,943 |
| 6.625%, due 3/15/26 | 32,875,000 | 31,214,855 |
| Enact Holdings, Inc. | | |
| 6.50%, due 8/15/25 (a) | 25,600,000 | 25,145,861 |
| Jefferies Finance LLC | | |
| 5.00%, due 8/15/28 (a) | 37,570,000 | 29,984,091 |
| LPL Holdings, Inc. (a) | | |
| 4.00%, due 3/15/29 | 20,810,000 | 17,893,820 |
| | Principal
Amount | Value |
| |
| Diversified Financial Services (continued) |
| LPL Holdings, Inc. (a) (continued) | | |
| 4.375%, due 5/15/31 | $ 11,000,000 | $ 9,212,823 |
| 4.625%, due 11/15/27 | 15,000,000 | 13,716,715 |
| Osaic Holdings, Inc. | | |
| 10.75%, due 8/1/27 (a) | 3,855,000 | 3,832,865 |
| PennyMac Financial Services, Inc. (a) | | |
| 4.25%, due 2/15/29 | 10,150,000 | 8,290,968 |
| 5.75%, due 9/15/31 | 7,500,000 | 6,115,027 |
| Radian Group, Inc. | | |
| 4.875%, due 3/15/27 | 3,000,000 | 2,784,185 |
| StoneX Group, Inc. | | |
| 8.625%, due 6/15/25 (a) | 9,196,000 | 9,218,990 |
| | | 212,222,042 |
| Electric 2.2% |
| Clearway Energy Operating LLC | | |
| 4.75%, due 3/15/28 (a) | 23,940,000 | 21,369,993 |
| DPL, Inc. | | |
| 4.125%, due 7/1/25 | 20,325,000 | 19,126,789 |
| Keystone Power Pass-Through Holders LLC | | |
| 13.00% (1.00% Cash and 12.00% PIK), due 6/1/24 (a)(b)(c) | 8,864,393 | 5,761,856 |
| Leeward Renewable Energy Operations LLC | | |
| 4.25%, due 7/1/29 (a) | 15,285,000 | 12,482,821 |
| NextEra Energy Operating Partners LP (a) | | |
| 3.875%, due 10/15/26 | 14,542,000 | 13,221,864 |
| 4.50%, due 9/15/27 | 5,000,000 | 4,476,974 |
| NRG Energy, Inc. | | |
| 6.625%, due 1/15/27 | 3,220,000 | 3,125,120 |
| Pattern Energy Operations LP | | |
| 4.50%, due 8/15/28 (a) | 16,565,000 | 14,439,339 |
| PG&E Corp. | | |
| 5.00%, due 7/1/28 | 19,460,000 | 17,629,695 |
| 5.25%, due 7/1/30 | 13,000,000 | 11,386,713 |
| Talen Energy Supply LLC | | |
| 8.625%, due 6/1/30 (a) | 44,295,000 | 45,008,548 |
| TransAlta Corp. | | |
| 7.75%, due 11/15/29 | 14,150,000 | 14,078,016 |
The notes to the financial statements are an integral part of, and should be read in conjunction with, the financial statements.
| 12 | MainStay MacKay High Yield Corporate Bond Fund |
| | Principal
Amount | Value |
| Corporate Bonds (continued) |
| Electric (continued) |
| Vistra Corp. (a)(d)(e) | | |
| 7.00% (5 Year Treasury Constant Maturity Rate + 5.74%), due 12/15/26 | $ 10,280,000 | $ 9,354,800 |
| 8.00% (5 Year Treasury Constant Maturity Rate + 6.93%), due 10/15/26 (b) | 31,800,000 | 30,210,000 |
| | | 221,672,528 |
| Electrical Components & Equipment 0.1% |
| WESCO Distribution, Inc. | | |
| 7.125%, due 6/15/25 (a) | 6,665,000 | 6,661,128 |
| Engineering & Construction 0.4% |
| Great Lakes Dredge & Dock Corp. | | |
| 5.25%, due 6/1/29 (a) | 13,000,000 | 10,627,500 |
| Railworks Holdings LP | | |
| 8.25%, due 11/15/28 (a) | 9,425,000 | 8,963,458 |
| TopBuild Corp. | | |
| 4.125%, due 2/15/32 (a) | 6,500,000 | 5,142,150 |
| Weekley Homes LLC | | |
| 4.875%, due 9/15/28 (a) | 21,580,000 | 18,531,825 |
| | | 43,264,933 |
| Entertainment 3.4% |
| Affinity Interactive | | |
| 6.875%, due 12/15/27 (a) | 13,590,000 | 11,077,019 |
| Allen Media LLC | | |
| 10.50%, due 2/15/28 (a) | 11,130,000 | 5,796,561 |
| Boyne USA, Inc. | | |
| 4.75%, due 5/15/29 (a) | 12,040,000 | 10,482,768 |
| Caesars Entertainment, Inc. | | |
| 7.00%, due 2/15/30 (a) | 19,750,000 | 19,060,587 |
| CCM Merger, Inc. | | |
| 6.375%, due 5/1/26 (a) | 5,000,000 | 4,732,888 |
| CDI Escrow Issuer, Inc. | | |
| 5.75%, due 4/1/30 (a) | 20,000,000 | 17,868,096 |
| Churchill Downs, Inc. (a) | | |
| 4.75%, due 1/15/28 | 53,025,000 | 47,485,218 |
| 5.50%, due 4/1/27 | 38,727,000 | 36,323,904 |
| 6.75%, due 5/1/31 | 12,800,000 | 11,808,000 |
| International Game Technology plc | | |
| 6.25%, due 1/15/27 (a) | 25,700,000 | 25,047,392 |
| Jacobs Entertainment, Inc. (a) | | |
| 6.75%, due 2/15/29 | 25,354,000 | 21,550,900 |
| 6.75%, due 2/15/29 | 8,775,000 | 7,458,750 |
| | Principal
Amount | Value |
| |
| Entertainment (continued) |
| Light & Wonder International, Inc. | | |
| 7.50%, due 9/1/31 (a) | $ 17,500,000 | $ 17,087,499 |
| Live Nation Entertainment, Inc. | | |
| 6.50%, due 5/15/27 (a) | 41,280,000 | 40,274,249 |
| Merlin Entertainments Ltd. | | |
| 5.75%, due 6/15/26 (a) | 35,100,000 | 32,828,972 |
| Midwest Gaming Borrower LLC | | |
| 4.875%, due 5/1/29 (a) | 5,000,000 | 4,162,500 |
| Motion Bondco DAC | | |
| 6.625%, due 11/15/27 (a) | 16,100,000 | 14,409,500 |
| Vail Resorts, Inc. | | |
| 6.25%, due 5/15/25 (a) | 10,095,000 | 10,032,714 |
| | | 337,487,517 |
| Food 1.0% |
| B&G Foods, Inc. | | |
| 5.25%, due 4/1/25 | 9,036,000 | 8,673,332 |
| 8.00%, due 9/15/28 (a) | 14,900,000 | 14,519,926 |
| Kraft Heinz Foods Co. | | |
| 6.50%, due 2/9/40 | 12,500,000 | 12,163,502 |
| Land O'Lakes Capital Trust I | | |
| 7.45%, due 3/15/28 (a) | 18,956,000 | 17,439,520 |
| Nathan's Famous, Inc. | | |
| 6.625%, due 11/1/25 (a) | 2,132,000 | 2,110,680 |
| Simmons Foods, Inc. | | |
| 4.625%, due 3/1/29 (a) | 30,315,000 | 24,625,474 |
| United Natural Foods, Inc. | | |
| 6.75%, due 10/15/28 (a) | 26,018,000 | 20,473,044 |
| | | 100,005,478 |
| Forest Products & Paper 1.1% |
| Glatfelter Corp. | | |
| 4.75%, due 11/15/29 (a) | 4,075,000 | 2,677,397 |
| Mercer International, Inc. | | |
| 5.125%, due 2/1/29 | 59,145,000 | 46,377,239 |
| 5.50%, due 1/15/26 | 6,500,000 | 6,045,000 |
| 12.875%, due 10/1/28 (a) | 16,750,000 | 16,915,741 |
| Smurfit Kappa Treasury Funding DAC | | |
| 7.50%, due 11/20/25 | 36,120,000 | 36,750,402 |
| | | 108,765,779 |
| Gas 0.3% |
| AmeriGas Partners LP | | |
| 5.75%, due 5/20/27 | 11,060,000 | 10,164,536 |
| 5.875%, due 8/20/26 | 25,075,000 | 23,506,561 |
| | | 33,671,097 |
The notes to the financial statements are an integral part of, and should be read in conjunction with, the financial statements.
13
Portfolio of Investments October 31, 2023†^ (continued)
| | Principal
Amount | Value |
| Corporate Bonds (continued) |
| Hand & Machine Tools 0.4% |
| Regal Rexnord Corp. (a) | | |
| 6.05%, due 2/15/26 | $ 7,250,000 | $ 7,131,135 |
| 6.05%, due 4/15/28 | 7,000,000 | 6,696,151 |
| 6.30%, due 2/15/30 | 5,000,000 | 4,704,927 |
| 6.40%, due 4/15/33 | 3,750,000 | 3,440,232 |
| Werner FinCo. LP (a) | | |
| 11.50%, due 6/15/28 | 5,500,000 | 5,553,515 |
| 14.50% (8.75% Cash and 5.75% PIK), due 10/15/28 (b)(c) | 13,254,767 | 10,802,635 |
| | | 38,328,595 |
| Healthcare-Products 1.5% |
| Bausch & Lomb Escrow Corp. | | |
| 8.375%, due 10/1/28 (a) | 32,540,000 | 32,320,355 |
| Garden Spinco Corp. | | |
| 8.625%, due 7/20/30 (a) | 15,500,000 | 15,992,435 |
| Hologic, Inc. (a) | | |
| 3.25%, due 2/15/29 | 39,100,000 | 32,825,209 |
| 4.625%, due 2/1/28 | 10,205,000 | 9,280,446 |
| Teleflex, Inc. | | |
| 4.25%, due 6/1/28 (a) | 43,155,000 | 38,084,335 |
| 4.625%, due 11/15/27 | 3,525,000 | 3,225,375 |
| Varex Imaging Corp. | | |
| 7.875%, due 10/15/27 (a) | 17,202,000 | 16,860,353 |
| | | 148,588,508 |
| Healthcare-Services 4.4% |
| Acadia Healthcare Co., Inc. (a) | | |
| 5.00%, due 4/15/29 | 10,000,000 | 8,916,149 |
| 5.50%, due 7/1/28 | 10,840,000 | 10,007,395 |
| Catalent Pharma Solutions, Inc. (a) | | |
| 3.125%, due 2/15/29 | 23,500,000 | 18,476,875 |
| 3.50%, due 4/1/30 | 9,500,000 | 7,457,500 |
| 5.00%, due 7/15/27 | 13,395,000 | 11,953,028 |
| CHS/Community Health Systems, Inc. | | |
| 5.25%, due 5/15/30 (a) | 10,500,000 | 7,456,617 |
| DaVita, Inc. (a) | | |
| 3.75%, due 2/15/31 | 18,035,000 | 12,963,655 |
| 4.625%, due 6/1/30 | 15,790,000 | 12,374,783 |
| Encompass Health Corp. | | |
| 4.50%, due 2/1/28 | 25,720,000 | 23,187,353 |
| 4.625%, due 4/1/31 | 8,200,000 | 6,825,977 |
| 4.75%, due 2/1/30 | 24,390,000 | 21,077,199 |
| Fortrea Holdings, Inc. | | |
| 7.50%, due 7/1/30 (a) | 6,525,000 | 6,296,625 |
| | Principal
Amount | Value |
| |
| Healthcare-Services (continued) |
| HCA, Inc. | | |
| 5.375%, due 2/1/25 | $ 26,525,000 | $ 26,243,541 |
| 5.875%, due 2/15/26 | 20,750,000 | 20,567,430 |
| 7.50%, due 11/6/33 | 44,975,000 | 45,953,064 |
| 7.58%, due 9/15/25 | 11,020,000 | 11,270,296 |
| 7.69%, due 6/15/25 | 31,650,000 | 32,315,335 |
| IQVIA, Inc. (a) | | |
| 5.00%, due 10/15/26 | 29,113,000 | 27,753,930 |
| 5.00%, due 5/15/27 | 5,000,000 | 4,703,919 |
| 6.50%, due 5/15/30 | 10,750,000 | 10,427,500 |
| LifePoint Health, Inc. (a) | | |
| 5.375%, due 1/15/29 | 17,978,000 | 10,891,941 |
| 11.00%, due 10/15/30 | 19,900,000 | 18,727,446 |
| ModivCare Escrow Issuer, Inc. | | |
| 5.00%, due 10/1/29 (a) | 8,435,000 | 6,147,344 |
| ModivCare, Inc. | | |
| 5.875%, due 11/15/25 (a) | 7,000,000 | 6,615,000 |
| Molina Healthcare, Inc. (a) | | |
| 3.875%, due 11/15/30 | 2,500,000 | 2,039,050 |
| 4.375%, due 6/15/28 | 5,000,000 | 4,450,083 |
| RegionalCare Hospital Partners Holdings, Inc. | | |
| 9.75%, due 12/1/26 (a) | 49,930,000 | 46,683,833 |
| Tenet Healthcare Corp. | | |
| 6.125%, due 6/15/30 | 10,100,000 | 9,347,756 |
| 6.75%, due 5/15/31 (a) | 10,000,000 | 9,496,332 |
| | | 440,626,956 |
| Holding Companies-Diversified 0.8% |
| Benteler International AG | | |
| 10.50%, due 5/15/28 (a) | 42,015,000 | 42,318,924 |
| Stena International SA | | |
| 6.125%, due 2/1/25 (a) | 34,995,000 | 34,295,100 |
| | | 76,614,024 |
| Home Builders 1.9% |
| Adams Homes, Inc. | | |
| 7.50%, due 2/15/25 (a) | 7,527,000 | 7,366,973 |
| Ashton Woods USA LLC | | |
| 6.625%, due 1/15/28 (a) | 415,000 | 379,725 |
| Brookfield Residential Properties, Inc. | | |
| 6.25%, due 9/15/27 (a) | 17,360,000 | 15,103,531 |
| Century Communities, Inc. | | |
| 3.875%, due 8/15/29 (a) | 15,245,000 | 12,302,099 |
| 6.75%, due 6/1/27 | 26,205,000 | 25,297,204 |
| Installed Building Products, Inc. | | |
| 5.75%, due 2/1/28 (a) | 25,430,000 | 22,942,675 |
The notes to the financial statements are an integral part of, and should be read in conjunction with, the financial statements.
| 14 | MainStay MacKay High Yield Corporate Bond Fund |
| | Principal
Amount | Value |
| Corporate Bonds (continued) |
| Home Builders (continued) |
| M/I Homes, Inc. | | |
| 3.95%, due 2/15/30 | $ 5,000,000 | $ 3,977,300 |
| 4.95%, due 2/1/28 | 7,500,000 | 6,705,970 |
| Meritage Homes Corp. | | |
| 3.875%, due 4/15/29 (a) | 17,490,000 | 14,693,874 |
| 5.125%, due 6/6/27 | 8,515,000 | 8,046,675 |
| Shea Homes LP | | |
| 4.75%, due 2/15/28 | 26,925,000 | 23,663,899 |
| 4.75%, due 4/1/29 | 7,875,000 | 6,647,826 |
| STL Holding Co. LLC | | |
| 7.50%, due 2/15/26 (a) | 12,000,000 | 11,220,000 |
| Winnebago Industries, Inc. | | |
| 6.25%, due 7/15/28 (a) | 30,155,000 | 28,355,651 |
| | | 186,703,402 |
| Household Products & Wares 0.2% |
| Central Garden & Pet Co. | | |
| 4.125%, due 10/15/30 | 15,620,000 | 12,739,738 |
| 4.125%, due 4/30/31 (a) | 14,875,000 | 11,833,314 |
| | | 24,573,052 |
| Housewares 0.5% |
| Scotts Miracle-Gro Co. (The) | | |
| 4.00%, due 4/1/31 | 25,455,000 | 18,936,102 |
| 4.375%, due 2/1/32 | 12,430,000 | 9,109,947 |
| 4.50%, due 10/15/29 | 26,000,000 | 20,540,000 |
| | | 48,586,049 |
| Insurance 1.0% |
| BroadStreet Partners, Inc. | | |
| 5.875%, due 4/15/29 (a) | 11,800,000 | 10,287,853 |
| Fairfax Financial Holdings Ltd. | | |
| 8.30%, due 4/15/26 | 5,435,000 | 5,631,890 |
| Fidelity & Guaranty Life Holdings, Inc. | | |
| 5.50%, due 5/1/25 (a) | 14,850,000 | 14,513,778 |
| MGIC Investment Corp. | | |
| 5.25%, due 8/15/28 | 25,957,000 | 23,859,033 |
| NMI Holdings, Inc. | | |
| 7.375%, due 6/1/25 (a) | 16,000,000 | 16,016,551 |
| USI, Inc. | | |
| 6.875%, due 5/1/25 (a) | 27,670,000 | 27,417,096 |
| | | 97,726,201 |
| Internet 1.5% |
| Cars.com, Inc. | | |
| 6.375%, due 11/1/28 (a) | 22,300,000 | 19,847,000 |
| | Principal
Amount | Value |
| |
| Internet (continued) |
| Gen Digital, Inc. (a) | | |
| 6.75%, due 9/30/27 | $ 10,000,000 | $ 9,733,909 |
| 7.125%, due 9/30/30 | 8,000,000 | 7,782,806 |
| Netflix, Inc. | | |
| 5.75%, due 3/1/24 | 10,461,000 | 10,440,078 |
| 5.875%, due 11/15/28 | 28,450,000 | 28,460,631 |
| Uber Technologies, Inc. (a) | | |
| 6.25%, due 1/15/28 | 4,125,000 | 3,970,312 |
| 7.50%, due 5/15/25 | 12,075,000 | 12,089,987 |
| 7.50%, due 9/15/27 | 23,710,000 | 23,769,559 |
| VeriSign, Inc. | | |
| 4.75%, due 7/15/27 | 17,744,000 | 16,912,865 |
| 5.25%, due 4/1/25 | 21,041,000 | 20,791,277 |
| | | 153,798,424 |
| Investment Companies 0.6% |
| Compass Group Diversified Holdings LLC (a) | | |
| 5.00%, due 1/15/32 | 8,370,000 | 6,581,670 |
| 5.25%, due 4/15/29 | 31,500,000 | 26,899,204 |
| Icahn Enterprises LP | | |
| 5.25%, due 5/15/27 | 13,130,000 | 11,242,563 |
| 6.25%, due 5/15/26 | 12,770,000 | 11,672,696 |
| | | 56,396,133 |
| Iron & Steel 1.5% |
| Allegheny Ludlum LLC | | |
| 6.95%, due 12/15/25 | 22,688,000 | 22,573,993 |
| Big River Steel LLC | | |
| 6.625%, due 1/31/29 (a) | 34,687,000 | 34,263,125 |
| Mineral Resources Ltd. (a) | | |
| 8.00%, due 11/1/27 | 5,000,000 | 4,831,450 |
| 8.125%, due 5/1/27 | 53,640,000 | 52,183,706 |
| 8.50%, due 5/1/30 | 9,629,000 | 9,218,906 |
| 9.25%, due 10/1/28 | 22,835,000 | 22,835,000 |
| | | 145,906,180 |
| Leisure Time 2.3% |
| Carnival Corp. (a) | | |
| 4.00%, due 8/1/28 | 28,000,000 | 24,354,954 |
| 5.75%, due 3/1/27 | 57,175,000 | 51,049,384 |
| 6.00%, due 5/1/29 | 33,500,000 | 28,300,683 |
| 7.00%, due 8/15/29 | 7,000,000 | 6,863,782 |
| 7.625%, due 3/1/26 | 9,110,000 | 8,858,497 |
| 9.875%, due 8/1/27 | 31,843,000 | 33,189,959 |
| Carnival Holdings Bermuda Ltd. | | |
| 10.375%, due 5/1/28 (a) | 20,500,000 | 21,857,390 |
| Royal Caribbean Cruises Ltd. (a) | | |
| 5.375%, due 7/15/27 | 8,895,000 | 8,197,415 |
The notes to the financial statements are an integral part of, and should be read in conjunction with, the financial statements.
15
Portfolio of Investments October 31, 2023†^ (continued)
| | Principal
Amount | Value |
| Corporate Bonds (continued) |
| Leisure Time (continued) |
Royal Caribbean Cruises Ltd. (a)
(continued) | | |
| 5.50%, due 4/1/28 | $ 20,000,000 | $ 18,237,032 |
| 7.25%, due 1/15/30 | 18,215,000 | 17,968,628 |
| 9.25%, due 1/15/29 | 5,000,000 | 5,219,195 |
| | | 224,096,919 |
| Lodging 1.6% |
| Boyd Gaming Corp. | | |
| 4.75%, due 12/1/27 | 38,570,000 | 35,098,511 |
| 4.75%, due 6/15/31 (a) | 47,500,000 | 39,420,188 |
| Hilton Domestic Operating Co., Inc. | | |
| 4.00%, due 5/1/31 (a) | 38,340,000 | 31,751,888 |
| 4.875%, due 1/15/30 | 35,110,000 | 31,519,150 |
| 5.375%, due 5/1/25 (a) | 5,000,000 | 4,915,260 |
| 5.75%, due 5/1/28 (a) | 12,500,000 | 11,976,065 |
| Station Casinos LLC | | |
| 4.50%, due 2/15/28 (a) | 5,000,000 | 4,318,130 |
| | | 158,999,192 |
| Machinery—Construction & Mining 0.3% |
| Terex Corp. | | |
| 5.00%, due 5/15/29 (a) | 9,000,000 | 7,878,120 |
| Vertiv Group Corp. | | |
| 4.125%, due 11/15/28 (a) | 27,920,000 | 24,402,214 |
| | | 32,280,334 |
| Machinery-Diversified 0.7% |
| Briggs & Stratton Corp. Escrow Claim Shares | | |
| 6.875%, due 12/15/20 (f)(g)(h) | 9,200,000 | — |
| Chart Industries, Inc. | | |
| 7.50%, due 1/1/30 (a) | 12,000,000 | 11,783,825 |
| Maxim Crane Works Holdings Capital LLC | | |
| 11.50%, due 9/1/28 (a) | 14,700,000 | 14,345,730 |
| TK Elevator Holdco GmbH | | |
| 7.625%, due 7/15/28 (a) | 12,126,000 | 10,936,447 |
| TK Elevator U.S. Newco, Inc. | | |
| 5.25%, due 7/15/27 (a) | 35,910,000 | 32,694,160 |
| | | 69,760,162 |
| Media 5.7% |
| Block Communications, Inc. | | |
| 4.875%, due 3/1/28 (a) | 16,000,000 | 13,137,760 |
| Cable One, Inc. | | |
| 4.00%, due 11/15/30 (a) | 37,800,000 | 28,161,000 |
| | Principal
Amount | Value |
| |
| Media (continued) |
| CCO Holdings LLC | | |
| 4.25%, due 2/1/31 (a) | $ 36,815,000 | $ 28,649,352 |
| 4.25%, due 1/15/34 (a) | 28,050,000 | 20,260,591 |
| 4.50%, due 8/15/30 (a) | 42,430,000 | 34,021,872 |
| 4.50%, due 5/1/32 | 47,500,000 | 36,361,098 |
| 4.50%, due 6/1/33 (a) | 14,500,000 | 10,816,500 |
| 4.75%, due 3/1/30 (a) | 31,835,000 | 26,261,420 |
| 5.00%, due 2/1/28 (a) | 24,000,000 | 21,550,494 |
| 5.125%, due 5/1/27 (a) | 41,225,000 | 37,955,721 |
| 5.375%, due 6/1/29 (a) | 13,495,000 | 11,811,897 |
| CSC Holdings LLC (a) | | |
| 5.50%, due 4/15/27 | 5,000,000 | 4,178,153 |
| 5.75%, due 1/15/30 | 23,900,000 | 12,503,753 |
| 6.50%, due 2/1/29 | 14,230,000 | 11,251,540 |
| 7.50%, due 4/1/28 | 8,900,000 | 5,704,259 |
| 11.25%, due 5/15/28 | 15,585,000 | 14,865,201 |
| Diamond Sports Group LLC | | |
| 6.625%, due 8/15/27 (a)(g)(i) | 7,000,000 | 70,000 |
| DIRECTV Financing LLC | | |
| 5.875%, due 8/15/27 (a) | 37,250,000 | 32,639,754 |
| DISH DBS Corp. | | |
| 7.75%, due 7/1/26 | 18,675,000 | 12,513,574 |
| LCPR Senior Secured Financing DAC (a) | | |
| 5.125%, due 7/15/29 | 19,150,000 | 14,914,509 |
| 6.75%, due 10/15/27 | 56,337,000 | 50,984,985 |
| News Corp. (a) | | |
| 3.875%, due 5/15/29 | 43,330,000 | 37,089,613 |
| 5.125%, due 2/15/32 | 11,110,000 | 9,594,041 |
| Scripps Escrow II, Inc. | | |
| 3.875%, due 1/15/29 (a) | 6,765,000 | 5,135,447 |
| Sirius XM Radio, Inc. (a) | | |
| 5.00%, due 8/1/27 | 7,425,000 | 6,807,983 |
| 5.50%, due 7/1/29 | 11,590,000 | 10,269,595 |
| Sterling Entertainment Enterprises LLC | | |
| 10.25%, due 1/15/25 (b)(f)(h) | 20,000,000 | 18,048,000 |
| Videotron Ltd. | | |
| 5.375%, due 6/15/24 (a) | 12,850,000 | 12,745,529 |
| Virgin Media Finance plc | | |
| 5.00%, due 7/15/30 (a) | 25,000,000 | 19,654,590 |
| Virgin Media Secured Finance plc | | |
| 5.50%, due 5/15/29 (a) | 5,545,000 | 4,910,083 |
| VZ Secured Financing BV | | |
| 5.00%, due 1/15/32 (a) | 14,320,000 | 10,864,942 |
| Ziggo BV | | |
| 4.875%, due 1/15/30 (a) | 10,500,000 | 8,383,184 |
| | | 572,116,440 |
The notes to the financial statements are an integral part of, and should be read in conjunction with, the financial statements.
| 16 | MainStay MacKay High Yield Corporate Bond Fund |
| | Principal
Amount | Value |
| Corporate Bonds (continued) |
| Metal Fabricate & Hardware 0.3% |
| Advanced Drainage Systems, Inc. (a) | | |
| 5.00%, due 9/30/27 | $ 18,315,000 | $ 17,078,738 |
| 6.375%, due 6/15/30 | 12,615,000 | 11,910,687 |
| | | 28,989,425 |
| Mining 1.4% |
| Century Aluminum Co. | | |
| 7.50%, due 4/1/28 (a) | 34,830,000 | 32,864,280 |
| Compass Minerals International, Inc. | | |
| 6.75%, due 12/1/27 (a) | 31,535,000 | 29,704,393 |
| Constellium SE | | |
| 3.75%, due 4/15/29 (a) | 10,000,000 | 8,231,914 |
| Eldorado Gold Corp. | | |
| 6.25%, due 9/1/29 (a) | 8,947,000 | 7,671,959 |
| First Quantum Minerals Ltd. (a) | | |
| 6.875%, due 10/15/27 | 16,950,000 | 14,436,751 |
| 7.50%, due 4/1/25 | 10,500,000 | 9,847,836 |
| 8.625%, due 6/1/31 | 4,000,000 | 3,376,406 |
| IAMGOLD Corp. | | |
| 5.75%, due 10/15/28 (a) | 39,275,000 | 30,938,096 |
| Novelis Corp. | | |
| 4.75%, due 1/30/30 (a) | 7,713,000 | 6,544,283 |
| | | 143,615,918 |
| Miscellaneous—Manufacturing 1.0% |
| Amsted Industries, Inc. | | |
| 5.625%, due 7/1/27 (a) | 24,395,000 | 22,447,936 |
| Calderys Financing LLC | | |
| 11.25%, due 6/1/28 (a) | 10,730,000 | 10,823,888 |
| EnPro Industries, Inc. | | |
| 5.75%, due 10/15/26 | 25,784,000 | 24,424,860 |
| Gates Global LLC | | |
| 6.25%, due 1/15/26 (a) | 6,750,000 | 6,610,950 |
| Hillenbrand, Inc. | | |
| 5.75%, due 6/15/25 | 7,000,000 | 6,859,534 |
| LSB Industries, Inc. | | |
| 6.25%, due 10/15/28 (a) | 16,905,000 | 14,996,625 |
| Trinity Industries, Inc. | | |
| 7.75%, due 7/15/28 (a) | 12,725,000 | 12,565,937 |
| | | 98,729,730 |
| Office Furnishings 0.1% |
| Interface, Inc. | | |
| 5.50%, due 12/1/28 (a) | 16,952,000 | 14,251,716 |
| | Principal
Amount | Value |
| |
| Oil & Gas 6.5% |
| Ascent Resources Utica Holdings LLC (a) | | |
| 7.00%, due 11/1/26 | $ 14,500,000 | $ 14,002,488 |
| 9.00%, due 11/1/27 | 11,295,000 | 14,259,937 |
| California Resources Corp. | | |
| 7.125%, due 2/1/26 (a) | 10,000,000 | 10,037,500 |
| Chevron USA, Inc. | | |
| 3.85%, due 1/15/28 | 5,560,000 | 5,263,341 |
| Civitas Resources, Inc. | | |
| 5.00%, due 10/15/26 (a) | 5,500,000 | 5,146,162 |
| Comstock Resources, Inc. | | |
| 6.75%, due 3/1/29 (a) | 12,120,000 | 11,029,470 |
| Diamond Foreign Asset Co. | | |
| 8.50%, due 10/1/30 (a) | 18,250,000 | 17,788,355 |
| Encino Acquisition Partners Holdings LLC | | |
| 8.50%, due 5/1/28 (a) | 41,705,000 | 40,662,375 |
| Gulfport Energy Corp. | | |
| 8.00%, due 5/17/26 | 1,362,721 | 1,360,377 |
| 8.00%, due 5/17/26 (a) | 30,637,302 | 30,584,606 |
| Gulfport Energy Operating Corp. Escrow Claim Shares (f)(g) | | |
| 6.00%, due 10/15/24 | 50,754,000 | — |
| 6.375%, due 5/15/25 | 24,354,000 | — |
| 6.375%, due 1/15/26 | 11,915,000 | — |
| 6.625%, due 5/1/23 | 17,072,000 | — |
| Hilcorp Energy I LP (a) | | |
| 5.75%, due 2/1/29 | 5,000,000 | 4,501,400 |
| 6.00%, due 4/15/30 | 8,000,000 | 7,102,241 |
| 6.25%, due 4/15/32 | 2,775,000 | 2,423,412 |
| Marathon Oil Corp. | | |
| 4.40%, due 7/15/27 | 6,825,000 | 6,395,484 |
| 6.80%, due 3/15/32 | 5,000,000 | 5,031,021 |
| Matador Resources Co. | | |
| 5.875%, due 9/15/26 | 24,545,000 | 23,651,412 |
| 6.875%, due 4/15/28 (a) | 6,100,000 | 5,977,866 |
| Moss Creek Resources Holdings, Inc. | | |
| 7.50%, due 1/15/26 (a) | 9,465,000 | 9,041,024 |
| Noble Finance II LLC | | |
| 8.00%, due 4/15/30 (a) | 7,500,000 | 7,495,418 |
| Occidental Petroleum Corp. | | |
| 5.55%, due 3/15/26 | 30,505,000 | 30,095,318 |
| 6.45%, due 9/15/36 | 6,850,000 | 6,653,268 |
| 6.95%, due 7/1/24 | 6,672,000 | 6,700,022 |
| 7.15%, due 5/15/28 | 4,000,000 | 4,080,000 |
| Parkland Corp. (a) | | |
| 4.50%, due 10/1/29 | 24,035,000 | 20,672,503 |
The notes to the financial statements are an integral part of, and should be read in conjunction with, the financial statements.
17
Portfolio of Investments October 31, 2023†^ (continued)
| | Principal
Amount | Value |
| Corporate Bonds (continued) |
| Oil & Gas (continued) |
| Parkland Corp. (a) (continued) | | |
| 4.625%, due 5/1/30 | $ 13,075,000 | $ 11,146,437 |
| 5.875%, due 7/15/27 | 14,025,000 | 13,428,297 |
| Permian Resources Operating LLC (a) | | |
| 5.375%, due 1/15/26 | 18,867,000 | 18,113,867 |
| 6.875%, due 4/1/27 | 23,400,000 | 22,958,676 |
| 7.75%, due 2/15/26 | 20,645,000 | 20,626,473 |
| Rockcliff Energy II LLC | | |
| 5.50%, due 10/15/29 (a) | 42,725,000 | 38,562,880 |
| Southwestern Energy Co. | | |
| 5.375%, due 3/15/30 | 13,830,000 | 12,685,529 |
| 5.70%, due 1/23/25 (j) | 3,504,000 | 3,461,825 |
| Sunoco LP | | |
| 6.00%, due 4/15/27 | 18,965,000 | 18,261,256 |
| Talos Production, Inc. | | |
| 12.00%, due 1/15/26 | 81,465,000 | 84,643,357 |
| Transocean Aquila Ltd. | | |
| 8.00%, due 9/30/28 (a) | 5,000,000 | 4,926,800 |
| Transocean Poseidon Ltd. | | |
| 6.875%, due 2/1/27 (a) | 29,283,750 | 28,698,075 |
| Transocean, Inc. | | |
| 8.75%, due 2/15/30 (a) | 38,356,250 | 38,243,099 |
| Viper Energy Partners LP | | |
| 5.375%, due 11/1/27 (a) | 7,000,000 | 6,634,250 |
| Vital Energy, Inc. | | |
| 7.75%, due 7/31/29 (a) | 17,830,000 | 16,144,284 |
| 10.125%, due 1/15/28 | 14,374,000 | 14,411,884 |
| | | 642,901,989 |
| Oil & Gas Services 1.0% |
| Bristow Group, Inc. | | |
| 6.875%, due 3/1/28 (a) | 31,500,000 | 29,176,875 |
| Nine Energy Service, Inc. | | |
| 13.00%, due 2/1/28 | 30,200,000 | 26,727,000 |
| Oceaneering International, Inc. | | |
| 6.00%, due 2/1/28 (a) | 10,600,000 | 9,725,500 |
| Weatherford International Ltd. (a) | | |
| 6.50%, due 9/15/28 | 18,013,000 | 18,105,804 |
| 8.625%, due 4/30/30 | 15,370,000 | 15,531,062 |
| | | 99,266,241 |
| Packaging & Containers 0.5% |
| ARD Finance SA | | |
| 6.50% (6.50% Cash or 7.25% PIK), due 6/30/27 (a)(c) | 11,208,936 | 6,525,613 |
| | Principal
Amount | Value |
| |
| Packaging & Containers (continued) |
| Cascades USA, Inc. (a) | | |
| 5.125%, due 1/15/26 | $ 11,306,000 | $ 10,730,812 |
| 5.375%, due 1/15/28 | 23,385,000 | 21,132,245 |
| Owens-Brockway Glass Container, Inc. | | |
| 7.25%, due 5/15/31 (a) | 6,000,000 | 5,490,000 |
| Sealed Air Corp. | | |
| 6.125%, due 2/1/28 (a) | 2,500,000 | 2,379,548 |
| | | 46,258,218 |
| Pharmaceuticals 3.0% |
| 1375209 BC Ltd. | | |
| 9.00%, due 1/30/28 (a) | 8,000,000 | 7,755,087 |
| 180 Medical, Inc. | | |
| 3.875%, due 10/15/29 (a) | 20,670,000 | 17,172,162 |
| Bausch Health Cos., Inc. (a) | | |
| 7.00%, due 1/15/28 | 7,000,000 | 2,870,313 |
| 7.25%, due 5/30/29 | 5,000,000 | 1,875,000 |
| 11.00%, due 9/30/28 | 20,687,000 | 12,619,070 |
| 14.00%, due 10/15/30 | 1,974,000 | 1,063,113 |
| BellRing Brands, Inc. | | |
| 7.00%, due 3/15/30 (a) | 20,880,000 | 20,279,700 |
| Grifols SA | | |
| 4.75%, due 10/15/28 (a) | 11,595,000 | 9,739,800 |
| Jazz Securities DAC | | |
| 4.375%, due 1/15/29 (a) | 49,390,000 | 42,952,928 |
| Organon & Co. (a) | | |
| 4.125%, due 4/30/28 | 25,000,000 | 21,594,003 |
| 5.125%, due 4/30/31 | 17,890,000 | 13,970,605 |
| Owens & Minor, Inc. (a) | | |
| 4.50%, due 3/31/29 | 24,155,000 | 19,380,540 |
| 6.625%, due 4/1/30 | 41,780,000 | 36,509,252 |
| Par Pharmaceutical, Inc. | | |
| 7.50%, due 4/1/27 (a)(g)(i) | 53,067,000 | 35,985,263 |
| Prestige Brands, Inc. (a) | | |
| 3.75%, due 4/1/31 | 39,485,000 | 31,360,961 |
| 5.125%, due 1/15/28 | 26,650,000 | 24,570,500 |
| | | 299,698,297 |
| Pipelines 4.8% |
| ANR Pipeline Co. | | |
| 7.375%, due 2/15/24 | 2,555,000 | 2,555,116 |
| Antero Midstream Partners LP (a) | | |
| 5.375%, due 6/15/29 | 3,500,000 | 3,178,168 |
| 5.75%, due 3/1/27 | 5,000,000 | 4,778,864 |
| 5.75%, due 1/15/28 | 8,000,000 | 7,499,931 |
| CNX Midstream Partners LP | | |
| 4.75%, due 4/15/30 (a) | 3,500,000 | 2,883,571 |
The notes to the financial statements are an integral part of, and should be read in conjunction with, the financial statements.
| 18 | MainStay MacKay High Yield Corporate Bond Fund |
| | Principal
Amount | Value |
| Corporate Bonds (continued) |
| Pipelines (continued) |
| Crestwood Midstream Partners LP | | |
| 8.00%, due 4/1/29 (a) | $ 6,500,000 | $ 6,643,715 |
| DT Midstream, Inc. | | |
| 4.375%, due 6/15/31 (a) | 7,255,000 | 6,024,985 |
| Energy Transfer LP | | |
| 4.40%, due 3/15/27 | 14,700,000 | 13,845,572 |
| 4.95%, due 5/15/28 | 16,000,000 | 15,129,301 |
| EQM Midstream Partners LP (a) | | |
| 4.75%, due 1/15/31 | 2,000,000 | 1,684,005 |
| 6.00%, due 7/1/25 | 4,497,000 | 4,397,765 |
| 6.50%, due 7/1/27 | 8,900,000 | 8,650,836 |
| 7.50%, due 6/1/27 | 5,000,000 | 4,951,899 |
| 7.50%, due 6/1/30 | 4,935,000 | 4,841,906 |
| FTAI Infra Escrow Holdings LLC | | |
| 10.50%, due 6/1/27 (a) | 31,295,000 | 30,417,532 |
| Genesis Energy LP | | |
| 6.25%, due 5/15/26 | 13,670,000 | 13,028,068 |
| 7.75%, due 2/1/28 | 26,315,000 | 24,778,583 |
| 8.00%, due 1/15/27 | 33,484,000 | 32,153,071 |
| 8.875%, due 4/15/30 | 1,340,000 | 1,295,386 |
| Harvest Midstream I LP | | |
| 7.50%, due 9/1/28 (a) | 26,675,000 | 25,275,974 |
| Hess Midstream Operations LP (a) | | |
| 4.25%, due 2/15/30 | 2,500,000 | 2,139,190 |
| 5.625%, due 2/15/26 | 1,000,000 | 968,439 |
| Holly Energy Partners LP (a) | | |
| 5.00%, due 2/1/28 | 9,870,000 | 9,136,511 |
| 6.375%, due 4/15/27 | 10,625,000 | 10,285,934 |
| ITT Holdings LLC | | |
| 6.50%, due 8/1/29 (a) | 22,620,000 | 18,915,975 |
| MPLX LP | | |
| 4.875%, due 12/1/24 | 7,500,000 | 7,398,760 |
| New Fortress Energy, Inc. | | |
| 6.50%, due 9/30/26 (a) | 12,930,000 | 11,581,360 |
| NuStar Logistics LP | | |
| 5.75%, due 10/1/25 | 3,000,000 | 2,903,360 |
| 6.00%, due 6/1/26 | 15,000,000 | 14,472,905 |
| Plains All American Pipeline LP | | |
| Series B | | |
| 9.736% (3 Month SOFR + 4.372%), due 11/15/71 (b)(d)(e) | 45,303,000 | 42,571,827 |
| Rockies Express Pipeline LLC | | |
| 4.80%, due 5/15/30 (a) | 10,270,000 | 8,633,500 |
| Summit Midstream Holdings LLC | | |
| 9.00%, due 10/15/26 (a)(j) | 24,525,000 | 23,544,000 |
| | Principal
Amount | Value |
| |
| Pipelines (continued) |
| Tallgrass Energy Partners LP (a) | | |
| 5.50%, due 1/15/28 | $ 5,000,000 | $ 4,380,252 |
| 6.00%, due 3/1/27 | 19,000,000 | 17,383,016 |
| 7.50%, due 10/1/25 | 8,500,000 | 8,373,783 |
| TransMontaigne Partners LP | | |
| 6.125%, due 2/15/26 | 26,447,000 | 22,546,067 |
| Venture Global LNG, Inc. (a) | | |
| 8.125%, due 6/1/28 | 26,310,000 | 25,542,302 |
| 9.50%, due 2/1/29 | 19,350,000 | 19,658,438 |
| Western Midstream Operating LP | | |
| 4.65%, due 7/1/26 | 5,000,000 | 4,780,517 |
| 4.75%, due 8/15/28 | 12,000,000 | 11,162,807 |
| 5.25%, due 2/1/50 (j) | 3,000,000 | 2,216,880 |
| | | 482,610,071 |
| Real Estate 0.3% |
| Howard Hughes Corp. (The) (a) | | |
| 4.125%, due 2/1/29 | 4,000,000 | 3,210,000 |
| 4.375%, due 2/1/31 | 4,500,000 | 3,425,381 |
| Newmark Group, Inc. | | |
| 6.125%, due 11/15/23 | 23,409,000 | 23,350,478 |
| | | 29,985,859 |
| Real Estate Investment Trusts 2.3% |
| CTR Partnership LP | | |
| 3.875%, due 6/30/28 (a) | 12,425,000 | 10,438,682 |
| GLP Capital LP | | |
| 5.25%, due 6/1/25 | 10,000,000 | 9,753,943 |
| 5.30%, due 1/15/29 | 14,080,000 | 12,860,866 |
| 5.375%, due 4/15/26 | 5,620,000 | 5,386,219 |
| MPT Operating Partnership LP | | |
| 4.625%, due 8/1/29 | 15,240,000 | 10,551,131 |
| 5.00%, due 10/15/27 | 37,735,000 | 29,133,175 |
| 5.25%, due 8/1/26 | 11,000,000 | 9,471,144 |
| RHP Hotel Properties LP | | |
| 4.50%, due 2/15/29 (a) | 8,305,000 | 7,069,133 |
| 4.75%, due 10/15/27 | 28,050,000 | 25,486,230 |
| 7.25%, due 7/15/28 (a) | 8,660,000 | 8,394,646 |
| VICI Properties LP (a) | | |
| 3.875%, due 2/15/29 | 13,475,000 | 11,439,346 |
| 4.625%, due 6/15/25 | 13,000,000 | 12,486,240 |
| 5.625%, due 5/1/24 | 52,060,000 | 51,703,066 |
| 5.75%, due 2/1/27 | 26,800,000 | 25,647,966 |
| | | 229,821,787 |
| Retail 5.3% |
| 1011778 B.C. Unlimited Liability Co. (a) | | |
| 3.875%, due 1/15/28 | 22,685,000 | 20,253,111 |
The notes to the financial statements are an integral part of, and should be read in conjunction with, the financial statements.
19
Portfolio of Investments October 31, 2023†^ (continued)
| | Principal
Amount | Value |
| Corporate Bonds (continued) |
| Retail (continued) |
| 1011778 B.C. Unlimited Liability Co. (a) (continued) | | |
| 4.00%, due 10/15/30 | $ 55,052,000 | $ 45,088,816 |
| Asbury Automotive Group, Inc. | | |
| 4.50%, due 3/1/28 | 23,137,000 | 20,500,770 |
| 4.625%, due 11/15/29 (a) | 13,005,000 | 11,000,821 |
| 4.75%, due 3/1/30 | 17,525,000 | 14,871,697 |
| 5.00%, due 2/15/32 (a) | 9,910,000 | 8,037,614 |
| CEC Entertainment LLC | | |
| 6.75%, due 5/1/26 (a) | 19,390,000 | 18,108,918 |
| Dave & Buster's, Inc. | | |
| 7.625%, due 11/1/25 (a) | 7,500,000 | 7,443,750 |
| Group 1 Automotive, Inc. | | |
| 4.00%, due 8/15/28 (a) | 16,000,000 | 13,771,958 |
| Ken Garff Automotive LLC | | |
| 4.875%, due 9/15/28 (a) | 26,535,000 | 22,440,770 |
| KFC Holding Co. | | |
| 4.75%, due 6/1/27 (a) | 18,287,000 | 17,282,129 |
| LCM Investments Holdings II LLC (a) | | |
| 4.875%, due 5/1/29 | 51,000,000 | 42,736,858 |
| 8.25%, due 8/1/31 | 11,300,000 | 10,750,558 |
| Murphy Oil USA, Inc. | | |
| 4.75%, due 9/15/29 | 7,500,000 | 6,640,266 |
| 5.625%, due 5/1/27 | 10,417,000 | 10,068,760 |
| NMG Holding Co., Inc. | | |
| 7.125%, due 4/1/26 (a) | 85,205,000 | 79,701,958 |
| Papa John's International, Inc. | | |
| 3.875%, due 9/15/29 (a) | 18,284,000 | 15,001,241 |
| Patrick Industries, Inc. (a) | | |
| 4.75%, due 5/1/29 | 5,000,000 | 4,057,424 |
| 7.50%, due 10/15/27 | 21,040,000 | 20,040,600 |
| Sonic Automotive, Inc. (a) | | |
| 4.625%, due 11/15/29 | 10,000,000 | 8,324,546 |
| 4.875%, due 11/15/31 | 10,795,000 | 8,596,349 |
| Yum! Brands, Inc. | | |
| 3.625%, due 3/15/31 | 40,870,000 | 33,187,351 |
| 4.625%, due 1/31/32 | 40,600,000 | 34,594,351 |
| 4.75%, due 1/15/30 (a) | 32,185,000 | 28,651,409 |
| 5.375%, due 4/1/32 | 30,000,000 | 26,967,281 |
| | | 528,119,306 |
| Software 3.8% |
| ACI Worldwide, Inc. | | |
| 5.75%, due 8/15/26 (a) | 13,784,000 | 13,194,915 |
| Camelot Finance SA | | |
| 4.50%, due 11/1/26 (a) | 19,590,000 | 18,108,786 |
| | Principal
Amount | Value |
| |
| Software (continued) |
| Central Parent LLC | | |
| 8.00%, due 6/15/29 (a) | $ 7,500,000 | $ 7,407,995 |
| Central Parent, Inc. | | |
| 7.25%, due 6/15/29 (a) | 12,750,000 | 12,248,771 |
| Clarivate Science Holdings Corp. (a) | | |
| 3.875%, due 7/1/28 | 31,609,000 | 27,139,579 |
| 4.875%, due 7/1/29 | 63,726,000 | 53,745,559 |
| Fair Isaac Corp. | | |
| 5.25%, due 5/15/26 (a) | 11,250,000 | 10,825,988 |
| MSCI, Inc. (a) | | |
| 3.25%, due 8/15/33 | 12,095,000 | 8,948,834 |
| 3.625%, due 9/1/30 | 26,600,000 | 22,010,979 |
| 3.875%, due 2/15/31 | 36,500,000 | 30,127,001 |
| 4.00%, due 11/15/29 | 31,330,000 | 26,970,080 |
| Open Text Corp. (a) | | |
| 3.875%, due 2/15/28 | 20,685,000 | 17,976,813 |
| 3.875%, due 12/1/29 | 13,000,000 | 10,631,150 |
| 6.90%, due 12/1/27 | 11,340,000 | 11,283,809 |
| Open Text Holdings, Inc. | | |
| 4.125%, due 2/15/30 (a) | 31,547,000 | 26,139,813 |
| PTC, Inc. (a) | | |
| 3.625%, due 2/15/25 | 9,000,000 | 8,675,708 |
| 4.00%, due 2/15/28 | 36,369,000 | 32,247,581 |
| SS&C Technologies, Inc. | | |
| 5.50%, due 9/30/27 (a) | 24,745,000 | 23,217,547 |
| Veritas US, Inc. | | |
| 7.50%, due 9/1/25 (a) | 16,665,000 | 13,642,346 |
| | | 374,543,254 |
| Telecommunications 2.5% |
| Connect Finco SARL | | |
| 6.75%, due 10/1/26 (a) | 56,200,000 | 52,408,533 |
| Frontier Communications Holdings LLC (a) | | |
| 5.00%, due 5/1/28 | 4,000,000 | 3,453,562 |
| 8.625%, due 3/15/31 | 12,140,000 | 11,414,077 |
| Hughes Satellite Systems Corp. | | |
| 6.625%, due 8/1/26 | 7,100,000 | 6,017,092 |
| Sprint Capital Corp. | | |
| 6.875%, due 11/15/28 | 104,520,000 | 107,193,203 |
| T-Mobile USA, Inc. | | |
| 2.875%, due 2/15/31 | 7,275,000 | 5,793,063 |
| 4.75%, due 2/1/28 | 32,555,000 | 30,971,671 |
| 5.375%, due 4/15/27 | 33,000,000 | 32,462,800 |
| | | 249,714,001 |
| Toys, Games & Hobbies 0.2% |
| Mattel, Inc. | | |
| 5.875%, due 12/15/27 (a) | 17,165,000 | 16,456,338 |
The notes to the financial statements are an integral part of, and should be read in conjunction with, the financial statements.
| 20 | MainStay MacKay High Yield Corporate Bond Fund |
| | Principal
Amount | Value |
| Corporate Bonds (continued) |
| Transportation 0.9% |
| Forward Air Corp. | | |
| 9.50%, due 10/15/31 (a) | $ 18,500,000 | $ 18,037,500 |
| RXO, Inc. | | |
| 7.50%, due 11/15/27 (a) | 4,000,000 | 3,998,920 |
| Seaspan Corp. | | |
| 5.50%, due 8/1/29 (a) | 24,865,000 | 19,075,433 |
| Watco Cos. LLC | | |
| 6.50%, due 6/15/27 (a) | 51,995,000 | 48,445,006 |
| | | 89,556,859 |
Total Corporate Bonds
(Cost $9,242,778,385) | | 8,456,290,294 |
| Loan Assignments 5.5% |
| Automobile 0.3% |
| Dealer Tire Financial LLC | |
| Term Loan B2 | |
| 9.824% (1 Month SOFR + 4.50%), due 12/14/27 (d) | 10,917,500 | 10,903,853 |
| Tenneco, Inc. | |
| First Lien Term Loan B 10.476% - 10.49% | |
| (3 Month SOFR + 5.00%), due 11/17/28 (d) | 21,550,000 | 17,883,138 |
| | | 28,786,991 |
| Beverage, Food & Tobacco 0.1% |
| United Natural Foods, Inc. | |
| Initial Term Loan | |
| 8.689% (1 Month SOFR + 3.25%), due 10/22/25 (d) | 10,714,378 | 10,666,389 |
| Capital Equipment 0.1% |
| DexKo Global, Inc. | |
| First Lien 2023 Incremental Term Loan | |
| 9.64% (3 Month SOFR + 4.25%), due 10/4/28 (d) | 8,000,000 | 7,707,504 |
| Cargo Transport 0.2% |
| Forward Air Corp.-Cov-Lite | |
| Senior Secured Term Loan B | |
| TBD, due 9/20/30 | 24,000,000 | 23,160,000 |
| | Principal
Amount | Value |
| |
| Chemicals, Plastics & Rubber 0.2% |
| Jazz Pharmaceuticals plc | |
| Initial Dollar Term Loan | |
| 8.939% (1 Month SOFR + 3.50%), due 5/5/28 (d) | $ 23,556,388 | $ 23,546,565 |
| Electronics 0.1% |
| Camelot U.S. Acquisition LLC (d) | |
| Initial Term Loan | |
| 8.439% (1 Month SOFR + 3.00%), due 10/30/26 | 4,055,174 | 4,047,931 |
| Amendment No. 2 Incremental Term Loan | |
| 8.439% (1 Month SOFR + 3.00%), due 10/30/26 | 4,122,187 | 4,114,092 |
| | | 8,162,023 |
| Energy (Electricity) 0.1% |
| Talen Energy Supply LLC (d) | |
| Initial Term Loan B | |
| 9.876% (3 Month SOFR + 4.50%), due 5/17/30 | 5,950,800 | 5,942,124 |
| Initial Term Loan C | |
| 9.876% (3 Month SOFR + 4.50%), due 5/17/30 | 4,834,286 | 4,827,237 |
| | | 10,769,361 |
| Finance 0.3% |
| Aretec Group, Inc. | |
| Term Loan B1 | |
| 9.924% (1 Month SOFR + 4.50%), due 8/9/30 (d) | 15,461,250 | 14,995,001 |
| RealTruck Group, Inc. | |
| Initial Term Loan | |
| 9.189% (1 Month SOFR + 3.75%), due 1/31/28 (d) | 19,120,146 | 18,173,106 |
| | | 33,168,107 |
| Healthcare, Education & Childcare 0.4% |
| Endo Luxembourg Finance Co. I SARL | |
| 2021 Term Loan | |
| 14.50% (1 Month LIBOR + 6.00%), due 3/27/28 (d) | 27,200,000 | 18,156,000 |
| LifePoint Health, Inc. | |
| 2023 Refinancing Term Loan | |
| 11.168% (3 Month SOFR + 5.50%), due 11/16/28 (d) | 17,000,000 | 16,864,000 |
The notes to the financial statements are an integral part of, and should be read in conjunction with, the financial statements.
21
Portfolio of Investments October 31, 2023†^ (continued)
| | Principal
Amount | Value |
| Loan Assignments (continued) |
| Healthcare, Education & Childcare (continued) |
| Organon & Co. | |
| Dollar Term Loan | |
| 8.45% (1 Month SOFR + 3.00%), due 6/2/28 (d) | $ 9,322,500 | $ 9,275,888 |
| | | 44,295,888 |
| High Tech Industries 0.2% |
| Open Text Corp. | |
| 2023 Replacement Term Loan | |
| 8.174% (1 Month SOFR + 2.75%), due 1/31/30 (d) | 19,917,380 | 19,906,704 |
| Insurance 0.2% |
| USI, Inc. | |
| 2022 Incremental Term Loan | |
| 9.14% (3 Month SOFR + 3.75%), due 11/22/29 (d) | 16,830,000 | 16,790,550 |
| Leisure, Amusement, Motion Pictures & Entertainment 0.1% |
| Carnival Corp. | |
| Initial Advance Term Loan | |
| 8.336% (1 Month SOFR + 3.00%), due 8/9/27 (d) | 9,975,000 | 9,775,500 |
| NASCAR Holdings LLC | |
| Initial Term Loan | |
| 7.939% (1 Month SOFR + 2.50%), due 10/19/26 (d) | 1,770,851 | 1,773,803 |
| | | 11,549,303 |
| Manufacturing 0.1% |
| Adient U.S. LLC | |
| Term Loan B1 | |
| 8.689% (1 Month SOFR + 3.25%), due 4/10/28 (d) | 6,443,411 | 6,435,356 |
| Media 0.4% |
| DIRECTV Financing LLC | |
| Closing Date Term Loan | |
| 10.439% (1 Month SOFR + 5.00%), due 8/2/27 (d) | 40,915,410 | 39,742,733 |
| Oil & Gas 0.7% |
| GIP III Stetson I LP | |
| Term Loan | |
| TBD, due 10/5/28 | 12,500,000 | 12,402,350 |
| | Principal
Amount | Value |
| |
| Oil & Gas (continued) |
| New Fortress Energy, Inc. | |
| Initial Term Loan | |
| 10.39% (3 Month SOFR + 5.00%), due 10/30/28 (d) | $ 24,750,000 | $ 22,770,000 |
| PetroQuest Energy LLC (b)(f) | |
| Term Loan | |
| 15.00% (12.07% PIK), due 11/8/23 (c) | 23,688,589 | 18,240,213 |
| 2020 Term Loan | |
| 15.00% (15.00% PIK) (1 Month LIBOR + 6.50%), due 9/19/26 (c)(d) | 2,448,984 | 2,448,984 |
| Term Loan | |
| 15.00% (1 Month LIBOR + 6.50%), due 1/1/28 (d) | 3,188,388 | 3,188,388 |
| TransMontaigne Operating Co. LP | |
| Tranche Term Loan B 8.939% - 8.941% | |
| (1 Month SOFR + 3.50%), due 11/17/28 (d) | 16,000,933 | 15,793,417 |
| | | 74,843,352 |
| Retail 0.9% |
| Great Outdoors Group LLC | |
| Term Loan B2 | |
| 9.402% (3 Month SOFR + 3.75%), due 3/6/28 (d) | 93,337,265 | 92,462,228 |
| Services: Business 0.3% |
| Dun & Bradstreet Corp. (The) | |
| Refinancing Term Loan | |
| 8.176% (1 Month SOFR + 2.75%), due 2/6/26 (d) | 10,971,001 | 10,955,324 |
| GIP II Blue Holding LP | |
| Initial Term Loan | |
| 9.939% (1 Month SOFR + 4.50%), due 9/29/28 (d) | 12,586,793 | 12,580,890 |
| Icon plc (d) | |
| Lux Term Loan | |
| 7.902% (3 Month SOFR + 2.25%), due 7/3/28 | 2,480,735 | 2,481,045 |
| U.S. Term Loan | |
| 7.902% (3 Month SOFR + 2.25%), due 7/3/28 | 618,077 | 618,154 |
| | | 26,635,413 |
The notes to the financial statements are an integral part of, and should be read in conjunction with, the financial statements.
| 22 | MainStay MacKay High Yield Corporate Bond Fund |
| | Principal
Amount | Value |
| Loan Assignments (continued) |
| Software 0.3% |
| Cloud Software Group, Inc. | |
| First Lien Term Loan A | |
| 9.99% (3 Month SOFR + 4.50%), due 9/29/28 (d) | $ 26,848,580 | $ 25,422,249 |
| Utilities 0.5% |
| PG&E Corp. | |
| Term Loan | |
| 8.439% (1 Month SOFR + 3.00%), due 6/23/25 (d) | 48,042,727 | 47,922,621 |
Total Loan Assignments
(Cost $557,136,592) | | 551,973,337 |
Total Long-Term Bonds
(Cost $9,906,664,119) | | 9,134,834,011 |
| |
| | Shares | |
| |
| Common Stocks 2.2% |
| Consumer Staples Distribution & Retail 0.0% ‡ |
| ASG warrant Corp. (b)(f)(k) | 12,502 | — |
| Distributors 0.0% ‡ |
| ATD New Holdings, Inc. (k) | 142,545 | 4,846,530 |
| Electric Utilities 0.0% ‡ |
| Keycon Power Holdings LLC (b)(f)(k) | 38,880 | 389 |
| Electrical Equipment 0.1% |
| Energy Technologies, Inc. (b)(f)(k) | 16,724 | 5,652,712 |
| Energy Equipment & Services 0.1% |
| Forum Energy Technologies, Inc. (k)(l) | 617,274 | 13,438,055 |
| Nine Energy Service, Inc. (k) | 148,500 | 522,720 |
| | | 13,960,775 |
| Independent Power and Renewable Electricity Producers 0.3% |
| GenOn Energy, Inc. (h) | 386,241 | 29,547,436 |
| Metals & Mining 0.1% |
| Franco-Nevada Corp. | 65,000 | 7,900,750 |
| | Shares | | Value |
| |
| Oil, Gas & Consumable Fuels 1.6% |
| Chord Energy Corp. | 85,742 | | $ 14,174,867 |
| Gulfport Energy Corp. (k) | 892,103 | | 110,272,852 |
| PetroQuest Energy, Inc. (b)(f)(k) | 284,709 | | — |
| Talos Energy, Inc. (k) | 2,074,193 | | 32,149,992 |
| | | | 156,597,711 |
Total Common Stocks
(Cost $236,743,383) | | | 218,506,303 |
| Preferred Stock 0.3% |
| Electrical Equipment 0.3% |
Energy Technologies Ltd. (b)(f)(k)
| 37,258 | | 28,874,950 |
Total Preferred Stock
(Cost $35,514,837) | | | 28,874,950 |
| Exchange-Traded Funds 0.4% |
| iShares Gold Trust (k) | 929,500 | | 34,939,905 |
| SPDR Gold Shares (k) | 55,336 | | 10,186,804 |
Total Exchange-Traded Funds
(Cost $33,598,418) | | | 45,126,709 |
| |
| | Number of
Warrants | | |
| |
| Warrants 0.0% ‡ |
| Hotels, Restaurants & Leisure 0.0% ‡ |
| CWT Travel Holdings, Inc. (f)(k) | | | |
| Expires 11/19/26 | 169,236 | | — |
| Expires 11/19/28 | 178,143 | | — |
| | | | — |
| Oil, Gas & Consumable Fuels 0.0% ‡ |
| California Resources Corp. | | | |
| Expires 10/27/24 (k) | 36,093 | | 643,899 |
Total Warrants
(Cost $32,627,513) | | | 643,899 |
Total Investments
(Cost $10,245,148,270) | 94.6% | | 9,427,985,872 |
| Other Assets, Less Liabilities | 5.4 | | 534,603,383 |
| Net Assets | 100.0% | | $ 9,962,589,255 |
| † | Percentages indicated are based on Fund net assets. |
| ^ | Industry classifications may be different than those used for compliance monitoring purposes. |
| ‡ | Less than one-tenth of a percent. |
The notes to the financial statements are an integral part of, and should be read in conjunction with, the financial statements.
23
Portfolio of Investments October 31, 2023†^ (continued)
| (a) | May be sold to institutional investors only under Rule 144A or securities offered pursuant to Section 4(a)(2) of the Securities Act of 1933, as amended. |
| (b) | Illiquid security—As of October 31, 2023, the total market value deemed illiquid under procedures approved by the Board of Trustees was $202,467,542, which represented 2.0% of the Fund’s net assets. (Unaudited) |
| (c) | PIK ("Payment-in-Kind")—issuer may pay interest or dividends with additional securities and/or in cash. |
| (d) | Floating rate—Rate shown was the rate in effect as of October 31, 2023. |
| (e) | Security is perpetual and, thus, does not have a predetermined maturity date. The date shown, if applicable, reflects the next call date. |
| (f) | Security in which significant unobservable inputs (Level 3) were used in determining fair value. |
| (g) | Issue in non-accrual status. |
| (h) | Restricted security. (See Note 5) |
| (i) | Issue in default. |
| (j) | Step coupon—Rate shown was the rate in effect as of October 31, 2023. |
| (k) | Non-income producing security. |
| (l) | As of October 31, 2023, the Fund’s ownership exceeds 5% of the outstanding shares of the company. |
| Abbreviation(s): |
| LIBOR—London Interbank Offered Rate |
| SOFR—Secured Overnight Financing Rate |
| SPDR—Standard & Poor’s Depositary Receipt |
| TBD—To Be Determined |
The following is a summary of the fair valuations according to the inputs used as of October 31, 2023, for valuing the Fund’s assets:
| Description | Quoted
Prices in
Active
Markets for
Identical
Assets
(Level 1) | | Significant
Other
Observable
Inputs
(Level 2) | | Significant
Unobservable
Inputs
(Level 3) | | Total |
| Asset Valuation Inputs | | | | | | | |
| Investments in Securities (a) | | | | | | | |
| Long-Term Bonds | | | | | | | |
| Convertible Bonds | $ — | | $ 126,570,380 | | $ — | | $ 126,570,380 |
| Corporate Bonds | — | | 8,438,242,294 | | 18,048,000 | | 8,456,290,294 |
| Loan Assignments | — | | 528,095,752 | | 23,877,585 | | 551,973,337 |
| Total Long-Term Bonds | — | | 9,092,908,426 | | 41,925,585 | | 9,134,834,011 |
| Common Stocks | 178,459,236 | | 34,393,966 | | 5,653,101 | | 218,506,303 |
| Preferred Stock | — | | — | | 28,874,950 | | 28,874,950 |
| Exchange-Traded Funds | 45,126,709 | | — | | — | | 45,126,709 |
| Warrants | 643,899 | | — | | — | | 643,899 |
| Total Investments in Securities | $ 224,229,844 | | $ 9,127,302,392 | | $ 76,453,636 | | $ 9,427,985,872 |
| (a) | For a complete listing of investments and their industries, see the Portfolio of Investments. |
The notes to the financial statements are an integral part of, and should be read in conjunction with, the financial statements.
| 24 | MainStay MacKay High Yield Corporate Bond Fund |
Statement of Assets and Liabilities as of October 31, 2023
| Assets |
Investment in securities, at value
(identified cost $10,245,148,270) | $ 9,427,985,872 |
| Cash | 487,973,172 |
| Due from custodian | 372,469 |
| Receivables: | |
| Interest | 151,292,869 |
| Investment securities sold | 43,497,983 |
| Fund shares sold | 14,595,546 |
| Other assets | 2,257,578 |
| Total assets | 10,127,975,489 |
| Liabilities |
| Payables: | |
| Investment securities purchased | 112,560,032 |
| Fund shares redeemed | 41,893,347 |
| Manager (See Note 3) | 4,591,561 |
| Transfer agent (See Note 3) | 1,754,117 |
| NYLIFE Distributors (See Note 3) | 732,717 |
| Shareholder communication | 511,698 |
| Professional fees | 148,651 |
| Custodian | 42,524 |
| Accrued expenses | 17,538 |
| Distributions payable | 3,134,049 |
| Total liabilities | 165,386,234 |
| Net assets | $ 9,962,589,255 |
| Composition of Net Assets |
| Shares of beneficial interest outstanding (par value of $.01 per share) unlimited number of shares authorized | $ 20,320,093 |
| Additional paid-in-capital | 11,270,010,175 |
| | 11,290,330,268 |
| Total distributable earnings (loss) | (1,327,741,013) |
| Net assets | $ 9,962,589,255 |
| Class A | |
| Net assets applicable to outstanding shares | $2,876,676,576 |
| Shares of beneficial interest outstanding | 586,159,003 |
| Net asset value per share outstanding | $ 4.91 |
| Maximum sales charge (4.50% of offering price) | 0.23 |
| Maximum offering price per share outstanding | $ 5.14 |
| Investor Class | |
| Net assets applicable to outstanding shares | $ 111,540,539 |
| Shares of beneficial interest outstanding | 22,560,860 |
| Net asset value per share outstanding | $ 4.94 |
| Maximum sales charge (4.00% of offering price) | 0.21 |
| Maximum offering price per share outstanding | $ 5.15 |
| Class B | |
| Net assets applicable to outstanding shares | $ 7,690,195 |
| Shares of beneficial interest outstanding | 1,574,815 |
| Net asset value and offering price per share outstanding | $ 4.88 |
| Class C | |
| Net assets applicable to outstanding shares | $ 98,728,929 |
| Shares of beneficial interest outstanding | 20,198,550 |
| Net asset value and offering price per share outstanding | $ 4.89 |
| Class I | |
| Net assets applicable to outstanding shares | $3,001,067,203 |
| Shares of beneficial interest outstanding | 611,323,098 |
| Net asset value and offering price per share outstanding | $ 4.91 |
| Class R1 | |
| Net assets applicable to outstanding shares | $ 47,657 |
| Shares of beneficial interest outstanding | 9,731 |
| Net asset value and offering price per share outstanding | $ 4.90 |
| Class R2 | |
| Net assets applicable to outstanding shares | $ 6,547,701 |
| Shares of beneficial interest outstanding | 1,333,496 |
| Net asset value and offering price per share outstanding | $ 4.91 |
| Class R3 | |
| Net assets applicable to outstanding shares | $ 3,913,206 |
| Shares of beneficial interest outstanding | 798,190 |
| Net asset value and offering price per share outstanding | $ 4.90 |
| Class R6 | |
| Net assets applicable to outstanding shares | $3,856,329,974 |
| Shares of beneficial interest outstanding | 788,041,971 |
| Net asset value and offering price per share outstanding | $ 4.89 |
| SIMPLE Class | |
| Net assets applicable to outstanding shares | $ 47,275 |
| Shares of beneficial interest outstanding | 9,559 |
| Net asset value and offering price per share outstanding | $ 4.95 |
The notes to the financial statements are an integral part of, and should be read in conjunction with, the financial statements.
25
Statement of Operations for the year ended October 31, 2023
| Investment Income (Loss) |
| Income | |
| Interest | $ 632,454,627 |
| Dividends (net of foreign tax withholding of $32,485) | 7,585,553 |
| Other | 21,897,383 |
| Total income | 661,937,563 |
| Expenses | |
| Manager (See Note 3) | 55,263,600 |
| Transfer agent (See Note 3) | 10,468,151 |
| Distribution/Service—Class A (See Note 3) | 7,564,987 |
| Distribution/Service—Investor Class (See Note 3) | 290,639 |
| Distribution/Service—Class B (See Note 3) | 101,353 |
| Distribution/Service—Class C (See Note 3) | 1,180,886 |
| Distribution/Service—Class R2 (See Note 3) | 16,718 |
| Distribution/Service—Class R3 (See Note 3) | 19,499 |
| Distribution/Service—SIMPLE Class (See Note 3) | 210 |
| Professional fees | 797,738 |
| Shareholder communication | 276,123 |
| Registration | 268,931 |
| Trustees | 262,675 |
| Custodian | 123,113 |
| Shareholder service (See Note 3) | 10,633 |
| Miscellaneous | 248,754 |
| Total expenses before waiver/reimbursement | 76,894,010 |
| Reimbursement from prior custodian(a) | (19,662) |
| Net expenses | 76,874,348 |
| Net investment income (loss) | 585,063,215 |
| Realized and Unrealized Gain (Loss) |
| Net realized gain (loss) on investments | (220,955,580) |
| Net change in unrealized appreciation (depreciation) on investments | 273,111,406 |
| Net realized and unrealized gain (loss) | 52,155,826 |
| Net increase (decrease) in net assets resulting from operations | $ 637,219,041 |
| (a) | Represents a refund for overbilling of custody fees. |
The notes to the financial statements are an integral part of, and should be read in conjunction with, the financial statements.
| 26 | MainStay MacKay High Yield Corporate Bond Fund |
Statements of Changes in Net Assets
for the years ended October 31, 2023 and October 31, 2022
| | 2023 | 2022 |
| Increase (Decrease) in Net Assets |
| Operations: | | |
| Net investment income (loss) | $ 585,063,215 | $ 529,759,959 |
| Net realized gain (loss) | (220,955,580) | (2,040,502) |
| Net change in unrealized appreciation (depreciation) | 273,111,406 | (1,544,808,534) |
| Net increase (decrease) in net assets resulting from operations | 637,219,041 | (1,017,089,077) |
| Distributions to shareholders: | | |
| Class A | (166,062,742) | (159,359,781) |
| Investor Class | (6,127,715) | (5,731,011) |
| Class B | (452,654) | (728,522) |
| Class C | (5,318,208) | (6,351,592) |
| Class I | (180,925,819) | (179,733,684) |
| Class R1 | (2,626) | (2,576) |
| Class R2 | (360,077) | (372,409) |
| Class R3 | (202,281) | (154,687) |
| Class R6 | (224,130,921) | (181,305,286) |
| SIMPLE Class | (2,223) | (1,390) |
| | (583,585,266) | (533,740,938) |
| Distributions to shareholders from return of capital: | | |
| Class A | — | (10,959,485) |
| Investor Class | — | (394,133) |
| Class B | — | (50,102) |
| Class C | — | (436,811) |
| Class I | — | (12,360,639) |
| Class R1 | — | (177) |
| Class R2 | — | (25,611) |
| Class R3 | — | (10,638) |
| Class R6 | — | (12,468,721) |
| SIMPLE Class | — | (96) |
| | — | (36,706,413) |
| Total distributions to shareholders | (583,585,266) | (570,447,351) |
| Capital share transactions: | | |
| Net proceeds from sales of shares | 2,378,286,543 | 3,247,300,040 |
| Net asset value of shares issued to shareholders in reinvestment of distributions | 550,045,714 | 531,741,895 |
| Cost of shares redeemed | (3,136,531,209) | (4,185,037,510) |
| Increase (decrease) in net assets derived from capital share transactions | (208,198,952) | (405,995,575) |
| Net increase (decrease) in net assets | (154,565,177) | (1,993,532,003) |
| Net Assets |
| Beginning of year | 10,117,154,432 | 12,110,686,435 |
| End of year | $ 9,962,589,255 | $10,117,154,432 |
The notes to the financial statements are an integral part of, and should be read in conjunction with, the financial statements.
27
Financial Highlights selected per share data and ratios
| | Year Ended October 31, |
| Class A | 2023 | | 2022 | | 2021 | | 2020 | | 2019 |
| Net asset value at beginning of year | $ 4.88 | | $ 5.63 | | $ 5.41 | | $ 5.61 | | $ 5.52 |
| Net investment income (loss) (a) | 0.28 | | 0.24 | | 0.25 | | 0.29 | | 0.29 |
| Net realized and unrealized gain (loss) | 0.03 | | (0.73) | | 0.25 | | (0.17) | | 0.12 |
| Total from investment operations | 0.31 | | (0.49) | | 0.50 | | 0.12 | | 0.41 |
| Less distributions: | | | | | | | | | |
| From net investment income | (0.28) | | (0.24) | | (0.25) | | (0.29) | | (0.29) |
| Return of capital | — | | (0.02) | | (0.03) | | (0.03) | | (0.03) |
| Total distributions | (0.28) | | (0.26) | | (0.28) | | (0.32) | | (0.32) |
| Net asset value at end of year | $ 4.91 | | $ 4.88 | | $ 5.63 | | $ 5.41 | | $ 5.61 |
| Total investment return (b) | 6.31% | | (8.88)% | | 9.37% | | 2.26% | | 7.58% |
| Ratios (to average net assets)/Supplemental Data: | | | | | | | | | |
| Net investment income (loss) | 5.52% | | 4.58% | | 4.38% | | 5.35% | | 5.21% |
| Net expenses (c) | 0.96% | | 0.95% | | 0.95% | | 0.97% | | 0.99% |
| Portfolio turnover rate | 20% | | 16% | | 40% | | 38% | | 30% |
| Net assets at end of year (in 000’s) | $ 2,876,677 | | $ 3,074,182 | | $ 3,901,512 | | $ 3,525,782 | | $ 3,405,587 |
| (a) | Per share data based on average shares outstanding during the year. |
| (b) | Total investment return is calculated exclusive of sales charges and assumes the reinvestment of dividends and distributions. For periods of less than one year, total return is not annualized. |
| (c) | In addition to the fees and expenses which the Fund bears directly, it also indirectly bears a pro-rata share of the fees and expenses of the underlying funds in which it invests. Such indirect expenses are not included in the above expense ratios. |
| | Year Ended October 31, |
| Investor Class | 2023 | | 2022 | | 2021 | | 2020 | | 2019 |
| Net asset value at beginning of year | $ 4.92 | | $ 5.67 | | $ 5.45 | | $ 5.65 | | $ 5.57 |
| Net investment income (loss) (a) | 0.27 | | 0.24 | | 0.24 | | 0.29 | | 0.29 |
| Net realized and unrealized gain (loss) | 0.02 | | (0.73) | | 0.26 | | (0.17) | | 0.11 |
| Total from investment operations | 0.29 | | (0.49) | | 0.50 | | 0.12 | | 0.40 |
| Less distributions: | | | | | | | | | |
| From net investment income | (0.27) | | (0.24) | | (0.25) | | (0.29) | | (0.29) |
| Return of capital | — | | (0.02) | | (0.03) | | (0.03) | | (0.03) |
| Total distributions | (0.27) | | (0.26) | | (0.28) | | (0.32) | | (0.32) |
| Net asset value at end of year | $ 4.94 | | $ 4.92 | | $ 5.67 | | $ 5.45 | | $ 5.65 |
| Total investment return (b) | 5.87% | | (8.90)% | | 9.25% | | 2.24% | | 7.33% |
| Ratios (to average net assets)/Supplemental Data: | | | | | | | | | |
| Net investment income (loss) | 5.35% | | 4.45% | | 4.26% | | 5.27% | | 5.15% |
| Net expenses (c) | 1.14% | | 1.09% | | 1.08% | | 1.06% | | 1.05% |
| Portfolio turnover rate | 20% | | 16% | | 40% | | 38% | | 30% |
| Net assets at end of year (in 000's) | $ 111,541 | | $ 116,961 | | $ 139,214 | | $ 149,726 | | $ 162,260 |
| (a) | Per share data based on average shares outstanding during the year. |
| (b) | Total investment return is calculated exclusive of sales charges and assumes the reinvestment of dividends and distributions. For periods of less than one year, total return is not annualized. |
| (c) | In addition to the fees and expenses which the Fund bears directly, it also indirectly bears a pro-rata share of the fees and expenses of the underlying funds in which it invests. Such indirect expenses are not included in the above expense ratios. |
The notes to the financial statements are an integral part of, and should be read in conjunction with, the financial statements.
| 28 | MainStay MacKay High Yield Corporate Bond Fund |
Financial Highlights selected per share data and ratios
| | Year Ended October 31, |
| Class B | 2023 | | 2022 | | 2021 | | 2020 | | 2019 |
| Net asset value at beginning of year | $ 4.86 | | $ 5.60 | | $ 5.38 | | $ 5.58 | | $ 5.50 |
| Net investment income (loss) (a) | 0.23 | | 0.19 | | 0.20 | | 0.25 | | 0.24 |
| Net realized and unrealized gain (loss) | 0.02 | | (0.72) | | 0.25 | | (0.18) | | 0.11 |
| Total from investment operations | 0.25 | | (0.53) | | 0.45 | | 0.07 | | 0.35 |
| Less distributions: | | | | | | | | | |
| From net investment income | (0.23) | | (0.20) | | (0.21) | | (0.24) | | (0.25) |
| Return of capital | — | | (0.01) | | (0.02) | | (0.03) | | (0.02) |
| Total distributions | (0.23) | | (0.21) | | (0.23) | | (0.27) | | (0.27) |
| Net asset value at end of year | $ 4.88 | | $ 4.86 | | $ 5.60 | | $ 5.38 | | $ 5.58 |
| Total investment return (b) | 5.12% | | (9.61)% | | 8.52% | | 1.39% | | 6.52% |
| Ratios (to average net assets)/Supplemental Data: | | | | | | | | | |
| Net investment income (loss) | 4.58% | | 3.64% | | 3.56% | | 4.55% | | 4.41% |
| Net expenses (c) | 1.89% | | 1.84% | | 1.83% | | 1.81% | | 1.80% |
| Portfolio turnover rate | 20% | | 16% | | 40% | | 38% | | 30% |
| Net assets at end of year (in 000’s) | $ 7,690 | | $ 13,032 | | $ 26,622 | | $ 45,661 | | $ 63,517 |
| (a) | Per share data based on average shares outstanding during the year. |
| (b) | Total investment return is calculated exclusive of sales charges and assumes the reinvestment of dividends and distributions. For periods of less than one year, total return is not annualized. |
| (c) | In addition to the fees and expenses which the Fund bears directly, it also indirectly bears a pro-rata share of the fees and expenses of the underlying funds in which it invests. Such indirect expenses are not included in the above expense ratios. |
| | Year Ended October 31, |
| Class C | 2023 | | 2022 | | 2021 | | 2020 | | 2019 |
| Net asset value at beginning of year | $ 4.86 | | $ 5.60 | | $ 5.39 | | $ 5.59 | | $ 5.50 |
| Net investment income (loss) (a) | 0.23 | | 0.19 | | 0.20 | | 0.25 | | 0.24 |
| Net realized and unrealized gain (loss) | 0.03 | | (0.72) | | 0.24 | | (0.18) | | 0.12 |
| Total from investment operations | 0.26 | | (0.53) | | 0.44 | | 0.07 | | 0.36 |
| Less distributions: | | | | | | | | | |
| From net investment income | (0.23) | | (0.20) | | (0.21) | | (0.24) | | (0.25) |
| Return of capital | — | | (0.01) | | (0.02) | | (0.03) | | (0.02) |
| Total distributions | (0.23) | | (0.21) | | (0.23) | | (0.27) | | (0.27) |
| Net asset value at end of year | $ 4.89 | | $ 4.86 | | $ 5.60 | | $ 5.39 | | $ 5.59 |
| Total investment return (b) | 5.34% | | (9.62)% | | 8.31% | | 1.39% | | 6.71% |
| Ratios (to average net assets)/Supplemental Data: | | | | | | | | | |
| Net investment income (loss) | 4.59% | | 3.66% | | 3.54% | | 4.54% | | 4.41% |
| Net expenses (c) | 1.89% | | 1.84% | | 1.83% | | 1.81% | | 1.80% |
| Portfolio turnover rate | 20% | | 16% | | 40% | | 38% | | 30% |
| Net assets at end of year (in 000’s) | $ 98,729 | | $ 133,295 | | $ 214,696 | | $ 297,431 | | $ 373,760 |
| (a) | Per share data based on average shares outstanding during the year. |
| (b) | Total investment return is calculated exclusive of sales charges and assumes the reinvestment of dividends and distributions. For periods of less than one year, total return is not annualized. |
| (c) | In addition to the fees and expenses which the Fund bears directly, it also indirectly bears a pro-rata share of the fees and expenses of the underlying funds in which it invests. Such indirect expenses are not included in the above expense ratios. |
The notes to the financial statements are an integral part of, and should be read in conjunction with, the financial statements.
29
Financial Highlights selected per share data and ratios
| | Year Ended October 31, |
| Class I | 2023 | | 2022 | | 2021 | | 2020 | | 2019 |
| Net asset value at beginning of year | $ 4.88 | | $ 5.63 | | $ 5.41 | | $ 5.61 | | $ 5.53 |
| Net investment income (loss) (a) | 0.29 | | 0.25 | | 0.26 | | 0.30 | | 0.30 |
| Net realized and unrealized gain (loss) | 0.03 | | (0.73) | | 0.26 | | (0.17) | | 0.11 |
| Total from investment operations | 0.32 | | (0.48) | | 0.52 | | 0.13 | | 0.41 |
| Less distributions: | | | | | | | | | |
| From net investment income | (0.29) | | (0.25) | | (0.27) | | (0.30) | | (0.30) |
| Return of capital | — | | (0.02) | | (0.03) | | (0.03) | | (0.03) |
| Total distributions | (0.29) | | (0.27) | | (0.30) | | (0.33) | | (0.33) |
| Net asset value at end of year | $ 4.91 | | $ 4.88 | | $ 5.63 | | $ 5.41 | | $ 5.61 |
| Total investment return (b) | 6.57% | | (8.65)% | | 9.65% | | 2.56% | | 7.68% |
| Ratios (to average net assets)/Supplemental Data: | | | | | | | | | |
| Net investment income (loss) | 5.78% | | 4.82% | | 4.62% | | 5.60% | | 5.45% |
| Net expenses (c) | 0.71% | | 0.70% | | 0.70% | | 0.72% | | 0.74% |
| Portfolio turnover rate | 20% | | 16% | | 40% | | 38% | | 30% |
| Net assets at end of year (in 000’s) | $ 3,001,067 | | $ 3,159,577 | | $ 4,116,697 | | $ 3,509,954 | | $ 3,451,487 |
| (a) | Per share data based on average shares outstanding during the year. |
| (b) | Total investment return is calculated exclusive of sales charges and assumes the reinvestment of dividends and distributions. Class I shares are not subject to sales charges. For periods of less than one year, total return is not annualized. |
| (c) | In addition to the fees and expenses which the Fund bears directly, it also indirectly bears a pro-rata share of the fees and expenses of the underlying funds in which it invests. Such indirect expenses are not included in the above expense ratios. |
| | Year Ended October 31, |
| Class R1 | 2023 | | 2022 | | 2021 | | 2020 | | 2019 |
| Net asset value at beginning of year | $ 4.87 | | $ 5.62 | | $ 5.40 | | $ 5.60 | | $ 5.52 |
| Net investment income (loss) (a) | 0.28 | | 0.25 | | 0.25 | | 0.30 | | 0.30 |
| Net realized and unrealized gain (loss) | 0.03 | | (0.73) | | 0.26 | | (0.17) | | 0.11 |
| Total from investment operations | 0.31 | | (0.48) | | 0.51 | | 0.13 | | 0.41 |
| Less distributions: | | | | | | | | | |
| From net investment income | (0.28) | | (0.25) | | (0.26) | | (0.30) | | (0.30) |
| Return of capital | — | | (0.02) | | (0.03) | | (0.03) | | (0.03) |
| Total distributions | (0.28) | | (0.27) | | (0.29) | | (0.33) | | (0.33) |
| Net asset value at end of year | $ 4.90 | | $ 4.87 | | $ 5.62 | | $ 5.40 | | $ 5.60 |
| Total investment return (b) | 6.48% | | (8.77)% | | 9.55% | | 2.45% | | 7.58% |
| Ratios (to average net assets)/Supplemental Data: | | | | | | | | | |
| Net investment income (loss) | 5.69% | | 4.74% | | 4.51% | | 5.52% | | 5.36% |
| Net expenses (c) | 0.81% | | 0.80% | | 0.80% | | 0.82% | | 0.84% |
| Portfolio turnover rate | 20% | | 16% | | 40% | | 38% | | 30% |
| Net assets at end of year (in 000’s) | $ 48 | | $ 52 | | $ 62 | | $ 51 | | $ 53 |
| (a) | Per share data based on average shares outstanding during the year. |
| (b) | Total investment return is calculated exclusive of sales charges and assumes the reinvestment of dividends and distributions. Class R1 shares are not subject to sales charges. For periods of less than one year, total return is not annualized. |
| (c) | In addition to the fees and expenses which the Fund bears directly, it also indirectly bears a pro-rata share of the fees and expenses of the underlying funds in which it invests. Such indirect expenses are not included in the above expense ratios. |
The notes to the financial statements are an integral part of, and should be read in conjunction with, the financial statements.
| 30 | MainStay MacKay High Yield Corporate Bond Fund |
Financial Highlights selected per share data and ratios
| | Year Ended October 31, |
| Class R2 | 2023 | | 2022 | | 2021 | | 2020 | | 2019 |
| Net asset value at beginning of year | $ 4.88 | | $ 5.63 | | $ 5.41 | | $ 5.61 | | $ 5.52 |
| Net investment income (loss) (a) | 0.27 | | 0.23 | | 0.24 | | 0.29 | | 0.28 |
| Net realized and unrealized gain (loss) | 0.03 | | (0.73) | | 0.26 | | (0.18) | | 0.12 |
| Total from investment operations | 0.30 | | (0.50) | | 0.50 | | 0.11 | | 0.40 |
| Less distributions: | | | | | | | | | |
| From net investment income | (0.27) | | (0.23) | | (0.25) | | (0.28) | | (0.29) |
| Return of capital | — | | (0.02) | | (0.03) | | (0.03) | | (0.02) |
| Total distributions | (0.27) | | (0.25) | | (0.28) | | (0.31) | | (0.31) |
| Net asset value at end of year | $ 4.91 | | $ 4.88 | | $ 5.63 | | $ 5.41 | | $ 5.61 |
| Total investment return (b) | 6.19% | | (8.98)% | | 9.28% | | 2.17% | | 7.49% |
| Ratios (to average net assets)/Supplemental Data: | | | | | | | | | |
| Net investment income (loss) | 5.42% | | 4.45% | | 4.28% | | 5.26% | | 5.10% |
| Net expenses (c) | 1.06% | | 1.05% | | 1.05% | | 1.07% | | 1.09% |
| Portfolio turnover rate | 20% | | 16% | | 40% | | 38% | | 30% |
| Net assets at end of year (in 000’s) | $ 6,548 | | $ 6,949 | | $ 10,640 | | $ 13,006 | | $ 13,866 |
| (a) | Per share data based on average shares outstanding during the year. |
| (b) | Total investment return is calculated exclusive of sales charges and assumes the reinvestment of dividends and distributions. Class R2 shares are not subject to sales charges. For periods of less than one year, total return is not annualized. |
| (c) | In addition to the fees and expenses which the Fund bears directly, it also indirectly bears a pro-rata share of the fees and expenses of the underlying funds in which it invests. Such indirect expenses are not included in the above expense ratios. |
| | Year Ended October 31, |
| Class R3 | 2023 | | 2022 | | 2021 | | 2020 | | 2019 |
| Net asset value at beginning of year | $ 4.88 | | $ 5.62 | | $ 5.40 | | $ 5.60 | | $ 5.52 |
| Net investment income (loss) (a) | 0.26 | | 0.22 | | 0.22 | | 0.27 | | 0.27 |
| Net realized and unrealized gain (loss) | 0.02 | | (0.72) | | 0.26 | | (0.17) | | 0.11 |
| Total from investment operations | 0.28 | | (0.50) | | 0.48 | | 0.10 | | 0.38 |
| Less distributions: | | | | | | | | | |
| From net investment income | (0.26) | | (0.22) | | (0.23) | | (0.27) | | (0.28) |
| Return of capital | — | | (0.02) | | (0.03) | | (0.03) | | (0.02) |
| Total distributions | (0.26) | | (0.24) | | (0.26) | | (0.30) | | (0.30) |
| Net asset value at end of year | $ 4.90 | | $ 4.88 | | $ 5.62 | | $ 5.40 | | $ 5.60 |
| Total investment return (b) | 5.72% | | (9.07)% | | 9.01% | | 1.90% | | 7.03% |
| Ratios (to average net assets)/Supplemental Data: | | | | | | | | | |
| Net investment income (loss) | 5.18% | | 4.25% | | 3.98% | | 4.96% | | 4.84% |
| Net expenses (c) | 1.31% | | 1.30% | | 1.30% | | 1.32% | | 1.34% |
| Portfolio turnover rate | 20% | | 16% | | 40% | | 38% | | 30% |
| Net assets at end of year (in 000’s) | $ 3,913 | | $ 3,482 | | $ 3,630 | | $ 1,924 | | $ 1,281 |
| (a) | Per share data based on average shares outstanding during the year. |
| (b) | Total investment return is calculated exclusive of sales charges and assumes the reinvestment of dividends and distributions. Class R3 shares are not subject to sales charges. For periods of less than one year, total return is not annualized. |
| (c) | In addition to the fees and expenses which the Fund bears directly, it also indirectly bears a pro-rata share of the fees and expenses of the underlying funds in which it invests. Such indirect expenses are not included in the above expense ratios. |
The notes to the financial statements are an integral part of, and should be read in conjunction with, the financial statements.
31
Financial Highlights selected per share data and ratios
| | Year Ended October 31, |
| Class R6 | 2023 | | 2022 | | 2021 | | 2020 | | 2019 |
| Net asset value at beginning of year | $ 4.87 | | $ 5.61 | | $ 5.40 | | $ 5.60 | | $ 5.52 |
| Net investment income (loss) (a) | 0.30 | | 0.26 | | 0.27 | | 0.31 | | 0.31 |
| Net realized and unrealized gain (loss) | 0.02 | | (0.72) | | 0.24 | | (0.17) | | 0.11 |
| Total from investment operations | 0.32 | | (0.46) | | 0.51 | | 0.14 | | 0.42 |
| Less distributions: | | | | | | | | | |
| From net investment income | (0.30) | | (0.26) | | (0.27) | | (0.31) | | (0.31) |
| Return of capital | — | | (0.02) | | (0.03) | | (0.03) | | (0.03) |
| Total distributions | (0.30) | | (0.28) | | (0.30) | | (0.34) | | (0.34) |
| Net asset value at end of year | $ 4.89 | | $ 4.87 | | $ 5.61 | | $ 5.40 | | $ 5.60 |
| Total investment return (b) | 6.54% | | (8.36)% | | 9.64% | | 2.70% | | 7.84% |
| Ratios (to average net assets)/Supplemental Data: | | | | | | | | | |
| Net investment income (loss) | 5.93% | | 4.98% | | 4.79% | | 5.65% | | 5.60% |
| Net expenses (c) | 0.56% | | 0.57% | | 0.57% | | 0.58% | | 0.58% |
| Portfolio turnover rate | 20% | | 16% | | 40% | | 38% | | 30% |
| Net assets at end of year (in 000’s) | $ 3,856,330 | | $ 3,609,591 | | $ 3,697,586 | | $ 4,420,424 | | $ 2,180,977 |
| (a) | Per share data based on average shares outstanding during the year. |
| (b) | Total investment return is calculated exclusive of sales charges and assumes the reinvestment of dividends and distributions. Class R6 shares are not subject to sales charges. For periods of less than one year, total return is not annualized. |
| (c) | In addition to the fees and expenses which the Fund bears directly, it also indirectly bears a pro-rata share of the fees and expenses of the underlying funds in which it invests. Such indirect expenses are not included in the above expense ratios. |
| | Year Ended October 31, | | August 31, 2020^ through
October 31, |
| SIMPLE Class | 2023 | | 2022 | | 2021 | | 2020 |
| Net asset value at beginning of period | $ 4.92 | | $ 5.67 | | $ 5.45 | | $ 5.54 |
| Net investment income (loss) | 0.27(a) | | 0.22(a) | | 0.23(a) | | 0.04 |
| Net realized and unrealized gain (loss) | 0.02 | | (0.73) | | 0.25 | | (0.08) |
| Total from investment operations | 0.29 | | (0.51) | | 0.48 | | (0.04) |
| Less distributions: | | | | | | | |
| From net investment income | (0.26) | | (0.22) | | (0.23) | | (0.05) |
| Return of capital | — | | (0.02) | | (0.03) | | (0.00)‡ |
| Total distributions | (0.26) | | (0.24) | | (0.26) | | (0.05) |
| Net asset value at end of period | $ 4.95 | | $ 4.92 | | $ 5.67 | | $ 5.45 |
| Total investment return (b) | 6.00% | | (9.14)% | | 8.98% | | (0.72)% |
| Ratios (to average net assets)/Supplemental Data: | | | | | | | |
| Net investment income (loss) | 5.30% | | 4.23% | | 4.00% | | 4.74%†† |
| Net expenses (c) | 1.21% | | 1.34% | | 1.33% | | 1.30%†† |
| Portfolio turnover rate | 20% | | 16% | | 40% | | 38% |
| Net assets at end of period (in 000’s) | $ 47 | | $ 32 | | $ 27 | | $ 25 |
| ^ | Inception date. |
| ‡ | Less than one cent per share. |
| †† | Annualized. |
| (a) | Per share data based on average shares outstanding during the period. |
| (b) | Total investment return is calculated exclusive of sales charges and assumes the reinvestment of dividends and distributions. SIMPLE Class shares are not subject to sales charges. For periods of less than one year, total return is not annualized. |
| (c) | In addition to the fees and expenses which the Fund bears directly, it also indirectly bears a pro-rata share of the fees and expenses of the underlying funds in which it invests. Such indirect expenses are not included in the above expense ratios. |
The notes to the financial statements are an integral part of, and should be read in conjunction with, the financial statements.
| 32 | MainStay MacKay High Yield Corporate Bond Fund |
Notes to Financial Statements
Note 1-Organization and Business
The MainStay Funds (the “Trust”) was organized on January 9, 1986, as a Massachusetts business trust. The Trust is registered under the Investment Company Act of 1940, as amended (the “1940 Act”), as an open-end management investment company, and is comprised of eleven funds (collectively referred to as the "Funds"). These financial statements and notes relate to the MainStay MacKay High Yield Corporate Bond Fund (the "Fund"), a “diversified” fund, as that term is defined in the 1940 Act, as interpreted or modified by regulatory authorities having jurisdiction, from time to time.
The following table lists the Fund's share classes that have been registered and commenced operations:
| Class | Commenced Operations |
| Class A | January 3, 1995 |
| Investor Class | February 28, 2008 |
| Class B | May 1, 1986 |
| Class C | September 1, 1998 |
| Class I | January 2, 2004 |
| Class R1* | June 29, 2012 |
| Class R2 | May 1, 2008 |
| Class R3 | February 29, 2016 |
| Class R6 | June 17, 2013 |
| SIMPLE Class | August 31, 2020 |
| * | As of October 31, 2023, Class R1 shares are closed to new investors and, upon the close of business on December 29, 2023, Class R1 shares are closed to additional investments by existing shareholders. Additionally, Class R1 shares will be liquidated on or about February 28, 2024 (the "Liquidation Date"). It is expected that the Fund will distribute to remaining shareholders invested in Class R1 shares, on or promptly after the Liquidation Date, a liquidating distribution in cash or cash equivalents equal to the net asset value of such shares. |
Class B shares of the MainStay Group of Funds are closed to all new purchases as well as additional investments by existing Class B shareholders. Existing Class B shareholders may continue to reinvest dividends and capital gains distributions, as well as exchange their Class B shares for Class B shares of other funds in the MainStay Group of Funds as permitted by the current exchange privileges. Class B shareholders continue to be subject to any applicable contingent deferred sales charge ("CDSC") at the time of redemption. All other features of the Class B shares, including but not limited to the fees and expenses applicable to Class B shares, remain unchanged. Unless redeemed, Class B shareholders will remain in Class B shares of their respective fund until the Class B shares are converted to Class A or Investor Class shares pursuant to the applicable conversion schedule.
Class A and Investor Class shares are offered at net asset value (“NAV”) per share plus an initial sales charge. No initial sales charge applies to investments of $1 million or more (and certain other qualified purchases) in Class A and Investor Class shares. However, a CDSC of 1.00% may be imposed on certain redemptions made within 18 months of the date of purchase on shares that were purchased without an initial sales charge.
Class C shares are offered at NAV without an initial sales charge, although a 1.00% CDSC may be imposed on certain redemptions of such shares made within one year of the date of purchase of Class C shares. When Class B shares were offered, they were offered at NAV without an initial sales charge, although a CDSC that declines depending on the number of years a shareholder held its Class B shares may be imposed on certain redemptions of such shares made within six years of the date of purchase of such shares. Class I, Class R1, Class R2, Class R3, Class R6 and SIMPLE Class shares are offered at NAV without a sales charge. Depending upon eligibility, Class B shares convert to either Class A or Investor Class shares at the end of the calendar quarter eight years after the date they were purchased. In addition, depending upon eligibility, Class C shares convert to either Class A or Investor Class shares at the end of the calendar quarter eight years after the date they were purchased. Additionally, Investor Class shares may convert automatically to Class A shares. SIMPLE Class shares convert to Class A shares, or Investor Class shares if you are not eligible to hold Class A shares, at the end of the calendar quarter, ten years after the date they were purchased. Share class conversions are based on the relevant NAVs of the two classes at the time of the conversion, and no sales load or other charge is imposed. Under certain circumstances and as may be permitted by the Trust’s multiple class plan pursuant to Rule 18f-3 under the 1940 Act, specified share classes of the Fund may be converted to one or more other share classes of the Fund as disclosed in the capital share trans-actions within these Notes. The classes of shares have the same voting (except for issues that relate solely to one class), dividend, liquidation and other rights, and the same terms and conditions, except that under distribution plans pursuant to Rule 12b-1 under the 1940 Act, Class B and Class C shares are subject to higher distribution and/or service fees than Class A, Investor Class, Class R2, Class R3 and SIMPLE Class shares. Class I, Class R1 and Class R6 shares are not subject to a distribution and/or service fee. Class R1, Class R2 and Class R3 shares are subject to a shareholder service fee, which is in addition to fees paid under the distribution plans for Class R2 and Class R3 shares.
At a meeting held on September 25-26, 2023, the Board of Trustees (the “Board”) of the Trust, after careful consideration of a number of factors and upon the recommendation of the Fund's investment adviser, New York Life Investment Management LLC (“New York Life Investments” or the "Manager"), approved a proposal to liquidate Class R1 shares of the Fund��on or about February 28, 2024, pursuant to the terms of a plan of liquidation.
The Fund's investment objective is to seek maximum current income through investment in a diversified portfolio of high-yield debt securities. Capital appreciation is a secondary objective.
Note 2–Significant Accounting Policies
The Fund is an investment company and accordingly follows the investment company accounting and reporting guidance of the Financial Accounting Standards Board (“FASB”) Accounting Standards Codification Topic 946 Financial Services—Investment Companies. The Fund
Notes to Financial Statements (continued)
prepares its financial statements in accordance with generally accepted accounting principles (“GAAP”) in the United States of America and follows the significant accounting policies described below.
(A) Securities Valuation. Investments are usually valued as of the close of regular trading on the New York Stock Exchange (the "Exchange") (usually 4:00 p.m. Eastern time) on each day the Fund is open for business ("valuation date").
Pursuant to Rule 2a-5 under the 1940 Act, the Board has designated New York Life Investments as its Valuation Designee (the "Valuation Designee"). The Valuation Designee is responsible for performing fair valuations relating to all investments in the Fund’s portfolio for which market quotations are not readily available; periodically assessing and managing material valuation risks; establishing and applying fair value methodologies; testing fair valuation methodologies; evaluating and overseeing pricing services; ensuring appropriate segregation of valuation and portfolio management functions; providing quarterly, annual and prompt reporting to the Board, as appropriate; identifying potential conflicts of interest; and maintaining appropriate records. The Valuation Designee has established a valuation committee ("Valuation Committee") to assist in carrying out the Valuation Designee’s responsibilities and establish prices of securities for which market quotations are not readily available. The Fund's and the Valuation Designee's policies and procedures ("Valuation Procedures") govern the Valuation Designee’s selection and application of methodologies for determining and calculating the fair value of Fund investments. The Valuation Designee may value the Fund's portfolio securities for which market quotations are not readily available and other Fund assets utilizing inputs from pricing services and other third-party sources. The Valuation Committee meets (in person, via electronic mail or via teleconference) on an ad-hoc basis to determine fair valuations and on a quarterly basis to review fair value events with respect to certain securities for which market quotations are not readily available, including valuation risks and back-testing results, and preview reports to the Board.
The Valuation Committee establishes prices of securities for which market quotations are not readily available based on such methodologies and measurements on a regular basis after considering information that is reasonably available and deemed relevant by the Valuation Committee. The Board shall oversee the Valuation Designee and review fair valuation materials on a prompt, quarterly and annual basis and approve proposed revisions to the Valuation Procedures.
Investments for which market quotations are not readily available are valued at fair value as determined in good faith pursuant to the Valuation Procedures. A market quotation is readily available only when that quotation is a quoted price (unadjusted) in active markets for identical investments that the Fund can access at the measurement date, provided that a quotation will not be readily available if it is not reliable. "Fair value" is defined as the price the Fund would reasonably expect to receive upon selling an asset or liability in an orderly transaction to an independent buyer in the principal or most advantageous market for the asset or liability. Fair value measurements are determined within a framework that
establishes a three-tier hierarchy that maximizes the use of observable market data and minimizes the use of unobservable inputs to establish a classification of fair value measurements for disclosure purposes. "Inputs" refer broadly to the assumptions that market participants would use in pricing the asset or liability, including assumptions about risk, such as the risk inherent in a particular valuation technique used to measure fair value using a pricing model and/or the risk inherent in the inputs for the valuation technique. Inputs may be observable or unobservable. Observable inputs reflect the assumptions market participants would use in pricing the asset or liability based on market data obtained from sources independent of the Fund. Unobservable inputs reflect the Fund’s own assumptions about the assumptions market participants would use in pricing the asset or liability based on the information available. The inputs or methodology used for valuing assets or liabilities may not be an indication of the risks associated with investing in those assets or liabilities. The three-tier hierarchy of inputs is summarized below.
| • | Level 1—quoted prices (unadjusted) in active markets for an identical asset or liability |
| • | Level 2—other significant observable inputs (including quoted prices for a similar asset or liability in active markets, interest rates and yield curves, prepayment speeds, credit risk, etc.) |
| • | Level 3—significant unobservable inputs (including the Fund's own assumptions about the assumptions that market participants would use in measuring fair value of an asset or liability) |
The level of an asset or liability within the fair value hierarchy is based on the lowest level of an input, both individually and in the aggregate, that is significant to the fair value measurement. The aggregate value by input level of the Fund’s assets and liabilities as of October 31, 2023, is included at the end of the Portfolio of Investments.
The Fund may use third-party vendor evaluations, whose prices may be derived from one or more of the following standard inputs, among others:
| • Benchmark yields | • Reported trades |
| • Broker/dealer quotes | • Issuer spreads |
| • Two-sided markets | • Benchmark securities |
| • Bids/offers | • Reference data (corporate actions or material event notices) |
| • Industry and economic events | • Comparable bonds |
| • Monthly payment information | |
An asset or liability for which a market quotation is not readily available is valued by methods deemed reasonable in good faith by the Valuation Committee, following the Valuation Procedures to represent fair value. Under these procedures, the Valuation Designee generally uses a market-based approach which may use related or comparable assets or liabilities, recent transactions, market multiples, book values and other relevant information. The Valuation Designee may also use an income-based valuation approach in which the anticipated future cash flows of the asset or liability are discounted to calculate fair value. Discounts may also be applied due to the nature and/or duration of any
| 34 | MainStay MacKay High Yield Corporate Bond Fund |
restrictions on the disposition of the asset or liability. Fair value represents a good faith approximation of the value of a security. Fair value determinations involve the consideration of a number of subjective factors, an analysis of applicable facts and circumstances and the exercise of judgment. As a result, it is possible that the fair value for a security determined in good faith in accordance with the Valuation Procedures may differ from valuations for the same security determined for other funds using their own valuation procedures. Although the Valuation Procedures are designed to value a security at the price the Fund may reasonably expect to receive upon the security's sale in an orderly transaction, there can be no assurance that any fair value determination thereunder would, in fact, approximate the amount that the Fund would actually realize upon the sale of the security or the price at which the security would trade if a reliable market price were readily available. During the year ended October 31, 2023, there were no material changes to the fair value methodologies.
Securities which may be valued in this manner include, but are not limited to: (i) a security for which trading has been halted or suspended or otherwise does not have a readily available market quotation on a given day; (ii) a debt security that has recently gone into default and for which there is not a current market quotation; (iii) a security of an issuer that has entered into a restructuring; (iv) a security that has been delisted from a national exchange; (v) a security subject to trading collars for which no or limited trading takes place; and (vi) a security whose principal market has been temporarily closed at a time when, under normal conditions, it would be open. Securities valued in this manner are generally categorized as Level 2 or 3 in the hierarchy. As of October 31, 2023, securities that were fair valued in such a manner are shown in the Portfolio of Investments.
Equity securities, rights and warrants, if applicable, are valued at the last quoted sales prices as of the close of regular trading on the relevant exchange on each valuation date. Securities that are not traded on the valuation date are valued at the mean of the last quoted bid and ask prices. Prices are normally taken from the principal market in which each security trades. These securities are generally categorized as Level 1 in the hierarchy.
Exchange-traded funds (“ETFs”) are valued at the last quoted sales prices as of the close of regular trading on the relevant exchange on each valuation date. Securities that are not traded on the valuation date are valued at the mean of the last quoted bid and ask prices. Prices are normally taken from the principal market in which each security trades. These securities are generally categorized as Level 1 in the hierarchy.
Debt securities (other than convertible and municipal bonds) are valued at the evaluated bid prices (evaluated mean prices in the case of convertible and municipal bonds) supplied by a pricing agent or broker selected by the Valuation Designee, in consultation with the Subadvisor. The evaluations are market-based measurements processed through a pricing application and represents the pricing agent’s good faith determination as to what a holder may receive in an orderly transaction under market conditions. The rules-based logic utilizes valuation techniques that reflect
participants’ assumptions and vary by asset class and per methodology, maximizing the use of relevant observable data including quoted prices for similar assets, benchmark yield curves and market corroborated inputs. The evaluated bid or mean prices are deemed by the Valuation Designee, in consultation with the Subadvisor, to be representative of market values at the regular close of trading of the Exchange on each valuation date. Debt securities purchased on a delayed delivery basis are marked to market daily until settlement at the forward settlement date. Debt securities, including corporate bonds, U.S. government and federal agency bonds, municipal bonds, foreign bonds, convertible bonds, asset-backed securities and mortgage-backed securities are generally categorized as Level 2 in the hierarchy.
Loan assignments, participations and commitments are valued at the average of bid quotations obtained from the engaged independent pricing service and are generally categorized as Level 2 in the hierarchy. Certain loan assignments, participations and commitments may be valued by utilizing significant unobservable inputs obtained from the pricing service and are generally categorized as Level 3 in the hierarchy. No securities held by the Fund as of October 31, 2023 were fair valued utilizing significant unobservable inputs obtained from the pricing service.
The information above is not intended to reflect an exhaustive list of the methodologies that may be used to value portfolio investments. The Valuation Procedures permit the use of a variety of valuation methodologies in connection with valuing portfolio investments. The methodology used for a specific type of investment may vary based on the market data available or other considerations. The methodologies summarized above may not represent the specific means by which portfolio investments are valued on any particular business day.
A portfolio investment may be classified as an illiquid investment under the Fund's written liquidity risk management program and related procedures (“Liquidity Program”). Illiquidity of an investment might prevent the sale of such investment at a time when the Manager or the Subadvisor might wish to sell, and these investments could have the effect of decreasing the overall level of the Fund's liquidity. Further, the lack of an established secondary market may make it more difficult to value illiquid investments, requiring the Fund to rely on judgments that may be somewhat subjective in measuring value, which could vary materially from the amount that the Fund could realize upon disposition. Difficulty in selling illiquid investments may result in a loss or may be costly to the Fund. An illiquid investment is any investment that the Manager or Subadvisor reasonably expects cannot be sold or disposed of in current market conditions in seven calendar days or less without the sale or disposition significantly changing the market value of the investment. The liquidity classification of each investment will be made using information obtained after reasonable inquiry and taking into account, among other things, relevant market, trading and investment-specific considerations in accordance with the Liquidity Program. Illiquid investments are often fair valued in accordance with the Fund's procedures described above. The liquidity of the Fund's investments was determined as of October 31, 2023, and can change at
Notes to Financial Statements (continued)
any time. Illiquid investments as of October 31, 2023, are shown in the Portfolio of Investments.
(B) Income Taxes. The Fund’s policy is to comply with the requirements of the Internal Revenue Code of 1986, as amended (the “Internal Revenue Code”), applicable to regulated investment companies and to distribute all of its taxable income to the shareholders of the Fund within the allowable time limits.
The Manager evaluates the Fund’s tax positions to determine if the tax positions taken meet the minimum recognition threshold in connection with accounting for uncertainties in income tax positions taken or expected to be taken for the purposes of measuring and recognizing tax liabilities in the financial statements. Recognition of tax benefits of an uncertain tax position is permitted only to the extent the position is “more likely than not” to be sustained assuming examination by taxing authorities. The Manager analyzed the Fund’s tax positions taken on federal, state and local income tax returns for all open tax years (for up to three tax years) and has concluded that no provisions for federal, state and local income tax are required in the Fund’s financial statements. The Fund’s federal, state and local income tax and federal excise tax returns for tax years for which the applicable statutes of limitations have not expired are subject to examination by the Internal Revenue Service and state and local departments of revenue.
(C) Dividends and Distributions to Shareholders. Dividends and distributions are recorded on the ex-dividend date. The Fund intends to declare and pay dividends from net investment income, if any, at least monthly and distributions from net realized capital and currency gains, if any, at least annually. Unless a shareholder elects otherwise, all dividends and distributions are reinvested at NAV in the same class of shares of the Fund. Dividends and distributions to shareholders are determined in accordance with federal income tax regulations and may differ from determinations using GAAP.
(D) Security Transactions and Investment Income. The Fund records security transactions on the trade date. Realized gains and losses on security transactions are determined using the identified cost method. Dividend income is recognized on the ex-dividend date, net of any foreign tax withheld at the source, and interest income is accrued as earned using the effective interest rate method. Distributions received from real estate investment trusts may be classified as dividends, capital gains and/or return of capital. Discounts and premiums on securities purchased for the Fund are accreted and amortized, respectively, on the effective interest rate method. Income from payment-in-kind securities is accreted daily based on the effective interest method.
Investment income and realized and unrealized gains and losses on investments of the Fund are allocated pro rata to the separate classes of shares based upon their relative net assets on the date the income is earned or realized and unrealized gains and losses are incurred.
The Fund may place a debt security on non-accrual status and reduce related interest income by ceasing current accruals and writing off all or a portion of any interest receivables when the collection of all or a portion of
such interest has become doubtful. A debt security is removed from non-accrual status when the issuer resumes interest payments or when collectability of interest is reasonably assured.
(E) Expenses. Expenses of the Trust are allocated to the individual Funds in proportion to the net assets of the respective Funds when the expenses are incurred, except where direct allocations of expenses can be made. Expenses (other than transfer agent expenses and fees incurred under the shareholder services plans and/or the distribution plans further discussed in Note 3(B)) are allocated to separate classes of shares pro rata based upon their relative net assets on the date the expenses are incurred. The expenses borne by the Fund, including those of related parties to the Fund, are shown in the Statement of Operations.
Additionally, the Fund may invest in ETFs and mutual funds, which are subject to management fees and other fees that may cause the costs of investing in ETFs and mutual funds to be greater than the costs of owning the underlying securities directly. These indirect expenses of ETFs and mutual funds are not included in the amounts shown as expenses in the Statement of Operations or in the expense ratios included in the Financial Highlights.
(F) Use of Estimates. In preparing financial statements in conformity with GAAP, the Manager makes estimates and assumptions that affect the reported amounts and disclosures in the financial statements. Actual results could differ from those estimates and assumptions.
(G) Loan Assignments, Participations and Commitments. The Fund may invest in loan assignments and participations ("loans"). Commitments are agreements to make money available to a borrower in a specified amount, at a specified rate and within a specified time. The Fund records an investment when the borrower withdraws money on a commitment or when a funded loan is purchased (trade date) and records interest as earned. These loans pay interest at rates that are periodically reset by reference to a base lending rate plus a spread. These base lending rates are generally the prime rate offered by a designated U.S. bank, the Secured Overnight Financing Rate ("SOFR") or an alternative reference rate.
The loans in which the Fund may invest are generally readily marketable, but may be subject to some restrictions on resale. For example, the Fund may be contractually obligated to receive approval from the agent bank and/or borrower prior to the sale of these investments. If the Fund purchases an assignment from a lender, the Fund will generally have direct contractual rights against the borrower in favor of the lender. If the Fund purchases a participation interest either from a lender or a participant, the Fund typically will have established a direct contractual relationship with the seller of the participation interest, but not with the borrower. Consequently, the Fund is subject to the credit risk of the lender or participant who sold the participation interest to the Fund, in addition to the usual credit risk of the borrower. In the event that the borrower, selling participant or intermediate participants become insolvent or enter into bankruptcy, the Fund may incur certain costs and delays in realizing payment, or may suffer a loss of principal and/or interest.
| 36 | MainStay MacKay High Yield Corporate Bond Fund |
Unfunded commitments represent the remaining obligation of the Fund to the borrower. At any point in time, up to the maturity date of the issue, the borrower may demand the unfunded portion. Unfunded amounts, if any, are marked to market and any unrealized gains or losses are recorded in the Statement of Assets and Liabilities. As of October 31, 2023, the Fund did not hold any unfunded commitments.
(H) Rights and Warrants. Rights are certificates that permit the holder to purchase a certain number of shares, or a fractional share, of a new stock from the issuer at a specific price. Warrants are instruments that entitle the holder to buy an equity security at a specific price for a specific period of time. These investments can provide a greater potential for profit or loss than an equivalent investment in the underlying security. Prices of these investments do not necessarily move in tandem with the prices of the underlying securities.
There is risk involved in the purchase of rights and warrants in that these investments are speculative investments. The Fund could also lose the entire value of its investment in warrants if such warrants are not exercised by the date of its expiration. The Fund is exposed to risk until the sale or exercise of each right or warrant is completed. Warrants as of October 31, 2023 are shown in the Portfolio of Investments.
(I) Debt Securities Risk. The ability of issuers of debt securities held by the Fund to meet their obligations may be affected by, among other things, economic or political developments in a specific country, industry or region. Debt securities are also subject to the risks associated with changes in interest rates. The Fund primarily invests in high-yield debt securities (commonly referred to as “junk bonds”), which are considered speculative because they present a greater risk of loss, including default, than higher rated debt securities. These securities pay investors a premium—a higher interest rate or yield than investment grade debt securities—because of the increased risk of loss. These securities can also be subject to greater price volatility. In times of unusual or adverse market, economic or political conditions, these securities may experience higher than normal default rates.
The loans in which the Fund invests are usually rated below investment grade, or if unrated, determined by the Subadvisor to be of comparable quality (commonly referred to as “junk bonds”) and are generally considered speculative because they present a greater risk of loss, including default, than higher quality debt securities. Moreover, such securities may, under certain circumstances, be particularly susceptible to liquidity and valuation risks.
Although certain loans are collateralized, there is no guarantee that the value of the collateral will be sufficient to repay the loan. In a recession or serious credit event, the value of these investments could decline significantly. As a result, the Fund’s NAVs could go down and you could lose money.
In addition, loans generally are subject to extended settlement periods that may be longer than seven days. As a result, the Fund may be adversely affected by selling other investments at an unfavorable time and/or under unfavorable conditions or engaging in borrowing
transactions, such as borrowing against its credit facility, to raise cash to meet redemption obligations or pursue other investment opportunities.
In certain circumstances, loans may not be deemed to be securities. As a result, the Fund may not have the protection of the anti-fraud provisions of the federal securities laws. In such cases, the Fund generally must rely on the contractual provisions in the loan agreement and common-law fraud protections under applicable state law.
(J) LIBOR Replacement Risk. The Fund may invest in certain debt securities, derivatives or other financial instruments that have relied or continue to rely on LIBOR, as a “benchmark” or “reference rate” for various interest rate calculations. As of January 1, 2022, the United Kingdom Financial Conduct Authority ("FCA"), which regulates LIBOR, ceased its active encouragement of banks to provide the quotations needed to sustain most LIBOR rates due to the absence of an active market for interbank unsecured lending and other reasons. In connection with supervisory guidance from U.S. regulators, certain U.S. regulated entities have generally ceased to enter into certain new LIBOR contracts after January 1, 2022. On March 15, 2022, the Adjustable Interest Rate (LIBOR) Act was signed into law. This law provides a statutory fallback mechanism on a nationwide basis to replace LIBOR with a benchmark rate that is selected by the Board of Governors of the Federal Reserve System and based on Secured Overnight Financing Rate ("SOFR") (which measures the cost of overnight borrowings through repurchase agreement transactions collateralized with U.S. Treasury securities) for tough legacy contracts. On February 27, 2023, the Federal Reserve System’s final rule in connection with this law became effective, establishing benchmark replacements based on SOFR and Term SOFR (a forward-looking measurement of market expectations of SOFR implied from certain derivatives markets) for applicable tough legacy contracts governed by U.S. law. In addition, the FCA has announced that it will require the publication of synthetic LIBOR for the one-month, three-month and six-month U.S. Dollar LIBOR settings after June 30, 2023 through at least September 30, 2024. Certain of the Fund's investments may involve individual tough legacy contracts which may be subject to the Adjustable Interest Rate (LIBOR) Act or synthetic LIBOR and no assurances can be given that these measures will have had the intended effects. Although the transition process away from LIBOR for many instruments has been completed, some LIBOR use is continuing and there are potential effects related to the transition away from LIBOR or continued use of LIBOR on the Fund.
The elimination of LIBOR or changes to other reference rates or any other changes or reforms to the determination or supervision of reference rates could have an adverse impact on the market for, or value of, any securities or payments linked to those reference rates, which may adversely affect the Fund's performance and/or net asset value. It could also lead to a reduction in the interest rates on, and the value of, some LIBOR-based investments and reduce the effectiveness of hedges mitigating risk in connection with LIBOR-based investments. Uncertainty and risk also remain regarding the willingness and ability of issuers and lenders to include enhanced provisions in new and existing contracts or
Notes to Financial Statements (continued)
instruments. Consequently, the transition away from LIBOR to other reference rates may lead to increased volatility and illiquidity in markets that are tied to LIBOR, fluctuations in values of LIBOR-related investments or investments in issuers that utilize LIBOR, increased difficulty in borrowing or refinancing and diminished effectiveness of hedging strategies, adversely affecting the Fund's performance. Furthermore, the risks associated with the expected discontinuation of LIBOR and transition may be exacerbated if the work necessary to effect an orderly transition to an alternative reference rate is not completed in a timely manner. The usefulness of LIBOR as a benchmark could deteriorate anytime during this transition period. Any such effects of the transition process, including unforeseen effects, could result in losses to the Fund.
(K) Indemnifications. Under the Trust’s organizational documents, its officers and trustees are indemnified against certain liabilities that may arise out of performance of their duties to the Trust. Additionally, in the normal course of business, the Fund enters into contracts with third-party service providers that contain a variety of representations and warranties and that may provide general indemnifications. The Fund's maximum exposure under these arrangements is unknown, as this would involve future claims that may be made against the Fund that have not yet occurred. The Manager believes that the risk of loss in connection with these potential indemnification obligations is remote. However, there can be no assurance that material liabilities related to such obligations will not arise in the future, which could adversely impact the Fund.
Note 3–Fees and Related Party Transactions
(A) Manager and Subadvisor. New York Life Investments, a registered investment adviser and an indirect, wholly-owned subsidiary of New York Life Insurance Company ("New York Life"), serves as the Fund's Manager, pursuant to an Amended and Restated Management Agreement ("Management Agreement"). The Manager provides offices, conducts clerical, recordkeeping and bookkeeping services and keeps most of the financial and accounting records required to be maintained by the Fund. Except for the portion of salaries and expenses that are the responsibility of the Fund, the Manager pays the salaries and expenses of all personnel affiliated with the Fund and certain operational expenses of the Fund. The Fund reimburses New York Life Investments in an amount equal to the portion of the compensation of the Chief Compliance Officer attributable to the Fund. MacKay Shields LLC ("MacKay Shields" or the "Subadvisor"), a registered investment adviser and an indirect, wholly-owned subsidiary of New York Life, serves as the Subadvisor to the Fund and is responsible for the day-to-day portfolio management of the Fund. Pursuant to the terms of an Amended and Restated Subadvisory Agreement ("Subadvisory Agreement") between New York Life Investments and MacKay Shields, New York Life Investments pays for the services of the Subadvisor.
Pursuant to the Management Agreement, the Fund pays the Manager a monthly fee for the services performed and the facilities furnished at an annual rate of the Fund’s average daily net assets as follows: 0.60% up to $500 million; 0.55% from $500 million up to $5 billion; 0.525% from
$5 billion up to $7 billion; 0.50% from $7 billion up to $10 billion; 0.49% from $10 billion to $15 billion; and 0.48% in excess of $15 billion, plus a fee for fund accounting services previously provided by New York Life Investments under a separate fund accounting agreement furnished at an annual rate of the Fund’s average daily net assets as follows: 0.05% up to $20 million; 0.0333% from $20 million to $100 million; and 0.01% in excess of $100 million. During the year ended October 31, 2023, the effective management fee rate was 0.54%, inclusive of a fee for fund accounting services of 0.01% of the Fund’s average daily net assets.
New York Life Investments has contractually agreed to waive fees and/or reimburse expenses so that Total Annual Fund Operating Expenses (excluding taxes, interest, litigation, extraordinary expenses, brokerage and other transaction expenses relating to the purchase or sale of portfolio investments and acquired (underlying) fund fees and expenses) of Class R6 do not exceed those of Class I. This agreement will remain in effect until February 28, 2024, and shall renew automatically for one-year terms unless New York Life Investments provides written notice of termination prior to the start of the next term or upon approval of the Board.
During the year ended October 31, 2023, New York Life Investments earned fees from the Fund in the amount of $55,263,600 and paid the Subadvisor in the amount of $27,108,365.
JPMorgan provides sub-administration and sub-accounting services to the Fund pursuant to an agreement with New York Life Investments. These services include calculating the daily NAVs of the Fund, maintaining the general ledger and sub-ledger accounts for the calculation of the Fund's NAVs, and assisting New York Life Investments in conducting various aspects of the Fund's administrative operations. For providing these services to the Fund, JPMorgan is compensated by New York Life Investments.
Pursuant to an agreement between the Trust and New York Life Investments, New York Life Investments is responsible for providing or procuring certain regulatory reporting services for the Fund. The Fund will reimburse New York Life Investments for the actual costs incurred by New York Life Investments in connection with providing or procuring these services for the Fund.
(B) Distribution and Service Fees. The Trust, on behalf of the Fund, has entered into a distribution agreement with NYLIFE Distributors LLC (the “Distributor”), an affiliate of New York Life Investments. The Fund has adopted distribution plans (the “Plans”) in accordance with the provisions of Rule 12b-1 under the 1940 Act.
Pursuant to the Class A, Investor Class and Class R2 Plans, the Distributor receives a monthly fee from the Class A, Investor Class and Class R2 shares at an annual rate of 0.25% of the average daily net assets of the Class A, Investor Class and Class R2 shares for distribution and/or service activities as designated by the Distributor. Pursuant to the Class B and Class C Plans, Class B and Class C shares pay the Distributor a monthly distribution fee at an annual rate of 0.75% of the average daily net assets of the Class B and Class C shares, along with a
| 38 | MainStay MacKay High Yield Corporate Bond Fund |
service fee at an annual rate of 0.25% of the average daily net assets of the Class B and Class C shares, for a total 12b-1 fee of 1.00%. Pursuant to the Class R3 and SIMPLE Class Plans, Class R3 and SIMPLE Class shares pay the Distributor a monthly distribution fee at an annual rate of 0.25% of the average daily net assets of the Class R3 and SIMPLE Class shares, along with a service fee at an annual rate of 0.25% of the average daily net assets of the Class R3 and SIMPLE Class shares, for a total 12b-1 fee of 0.50%. Class I, Class R1 and Class R6 shares are not subject to a distribution and/or service fee.
The Plans provide that the distribution and service fees are payable to the Distributor regardless of the amounts actually expended by the Distributor for distribution of the Fund's shares and service activities.
In accordance with the Shareholder Services Plans for the Class R1, Class R2 and Class R3 shares, the Manager has agreed to provide, through its affiliates or independent third parties, various shareholder and administrative support services to shareholders of the Class R1, Class R2 and Class R3 shares. For its services, the Manager, its affiliates or independent third-party service providers are entitled to a shareholder service fee accrued daily and paid monthly at an annual rate of 0.10% of the average daily net assets of the Class R1, Class R2 and Class R3 shares. This is in addition to any fees paid under the Class R2 and Class R3 Plans.
During the year ended October 31, 2023, shareholder service fees incurred by the Fund were as follows:
| |
| Class R1 | $ 46 |
| Class R2 | 6,687 |
| Class R3 | 3,900 |
(C) Sales Charges. The Fund was advised by the Distributor that the amount of initial sales charges retained on sales of Class A and Investor Class shares during the year ended October 31, 2023, were $314,285 and $17,446, respectively.
The Fund was also advised that the Distributor retained CDSCs on redemptions of Class A, Class B and Class C shares during the year ended October 31, 2023, of $47,946, $387 and $4,073, respectively.
(D) Transfer, Dividend Disbursing and Shareholder Servicing Agent. NYLIM Service Company LLC, an affiliate of New York Life Investments, is the Fund's transfer, dividend disbursing and shareholder servicing agent pursuant to an agreement between NYLIM Service Company LLC and the Trust. NYLIM Service Company LLC has entered into an agreement with SS&C Global Investor & Distribution Solutions, Inc. ("SS&C"), pursuant to which SS&C performs certain transfer agent services on behalf of NYLIM Service Company LLC. New York Life Investments has contractually agreed to limit the transfer agency expenses charged to the Fund’s share classes to a maximum of 0.35% of that share class’s average daily net assets on an annual basis after deducting any applicable Fund or class-level expense reimbursement or small account fees. This agreement will remain in effect until February
28, 2024, and shall renew automatically for one-year terms unless New York Life Investments provides written notice of termination prior to the start of the next term or upon approval of the Board. During the year ended October 31, 2023, transfer agent expenses incurred by the Fund and any reimbursements, pursuant to the aforementioned Transfer Agency expense limitation agreement, were as follows:
| Class | Expense | Waived |
| Class A | $4,648,550 | $— |
| Investor Class | 383,181 | — |
| Class B | 33,463 | — |
| Class C | 389,671 | — |
| Class I | 4,846,408 | — |
| Class R1 | 71 | — |
| Class R2 | 10,248 | — |
| Class R3 | 6,010 | — |
| Class R6 | 150,487 | — |
| SIMPLE Class | 62 | — |
(E) Small Account Fee. Shareholders with small accounts adversely impact the cost of providing transfer agency services. In an effort to reduce total transfer agency expenses, the Fund has implemented a small account fee on certain types of accounts. As described in the Fund's prospectus, certain shareholders with an account balance of less than $1,000 ($5,000 for Class A share accounts) are charged an annual per account fee of $20 (assessed semi-annually), the proceeds from which offset transfer agent fees as reflected in the Statement of Operations. This small account fee will not apply to certain types of accounts as described further in the Fund’s prospectus.
(F) Capital. As of October 31, 2023, New York Life and its affiliates beneficially held shares of the Fund with the values and percentages of net assets as follows:
| Class I | $10,387,715 | 0.3% |
| Class R1 | 41,160 | 86.4 |
| SIMPLE Class | 25,915 | 54.8 |
Note 4-Federal Income Tax
As of October 31, 2023, the cost and unrealized appreciation (depreciation) of the Fund’s investment portfolio, including applicable derivative contracts and other financial instruments, as determined on a federal income tax basis, were as follows:
| | Federal Tax
Cost | Gross
Unrealized
Appreciation | Gross
Unrealized
(Depreciation) | Net
Unrealized
Appreciation/
(Depreciation) |
| Investments in Securities | $10,221,181,273 | $157,661,804 | $(950,857,205) | $(793,195,401) |
Notes to Financial Statements (continued)
As of October 31, 2023, the components of accumulated gain (loss) on a tax basis were as follows:
Ordinary
Income | Accumulated
Capital
and Other
Gain (Loss) | Other
Temporary
Differences | Unrealized
Appreciation
(Depreciation) | Total
Accumulated
Gain (Loss) |
| $6,073,942 | $(537,451,087) | $(3,134,049) | $(793,229,819) | $(1,327,741,013) |
The difference between book-basis and tax-basis unrealized appreciation (depreciation) is primarily due to wash sales and cumulative bond amortization adjustments. The other temporary differences are primarily due to dividends payable.
As of October 31, 2023, for federal income tax purposes, capital loss carryforwards of $537,451,087, as shown in the table below, were available to the extent provided by the regulations to offset future realized gains of the Fund. Accordingly, no capital gains distributions are expected
to be paid to shareholders until net gains have been realized in excess of such amounts.
Capital Loss
Available Through | Short-Term
Capital Loss
Amounts (000’s) | Long-Term
Capital Loss
Amounts (000’s) |
| Unlimited | $40,757 | $496,694 |
During the years ended October 31, 2023 and October 31, 2022, the tax character of distributions paid as reflected in the Statements of Changes in Net Assets was as follows:
| | 2023 | 2022 |
| Distributions paid from: | | |
| Ordinary Income | $583,585,266 | $533,740,938 |
| Return of Capital | — | 36,706,413 |
| Total | $583,585,266 | $570,447,351 |
Note 5–Restricted Securities
Restricted securities are subject to legal or contractual restrictions on resale. Private placement securities are generally considered to be restricted except for those securities traded between qualified institutional investors under the provisions of Rule 144A of the Securities Act of 1933, as amended. Disposal of restricted securities may involve time consuming negotiations and expenses, and prompt sale at an acceptable price may be difficult to achieve.
As of October 31, 2023, restricted securities held by the Fund were as follows:
| Security | Date(s) of
Acquisition | Principal
Amount/
Shares | Cost | 10/31/23
Value | Percent of
Net Assets |
| Briggs & Stratton Corp. Escrow Claim Shares |
Corporate Bond
6.875%, due 12/15/20 | 2/26/21 | $ 9,200,000 | $ 9,323,706 | $ — | 0.0% |
| GenOn Energy, Inc. |
| Common Stock | 12/14/18 | 386,241 | 43,250,890 | 29,547,436 | 0.3 |
| Sterling Entertainment Enterprises LLC |
Corporate Bond
10.25%, due 1/15/25 | 12/28/17 | $ 20,000,000 | 19,932,246 | 18,048,000 | 0.2 |
| Total | | | $ 72,506,842 | $ 47,595,436 | 0.5% |
Note 6–Custodian
JPMorgan is the custodian of cash and securities held by the Fund. Custodial fees are charged to the Fund based on the Fund's net assets and/or the market value of securities held by the Fund and the number of certain transactions incurred by the Fund.
Note 7–Line of Credit
The Fund and certain other funds managed by New York Life Investments maintain a line of credit with a syndicate of banks in order to secure a source of funds for temporary purposes to meet unanticipated or excessive redemption requests.
Effective July 25, 2023, under the credit agreement (the “Credit Agreement”), the aggregate commitment amount is $600,000,000 with an additional uncommitted amount of $100,000,000. The commitment fee is an annual rate of 0.15% of the average commitment amount
payable quarterly, regardless of usage, to JPMorgan, who serves as the agent to the syndicate. The commitment fee is allocated among the Fund and certain other funds managed by New York Life Investments based upon their respective net assets and other factors. Interest on any revolving credit loan is charged based upon the Federal Funds Rate, Daily Simple Secured Overnight Financing Rate ("SOFR") + 0.10%, or the Overnight Bank Funding Rate, whichever is higher. The Credit Agreement expires on July 23, 2024, although the Fund, certain other funds managed by New York Life Investments and the syndicate of banks may renew the Credit Agreement for an additional year on the same or different terms or enter into a credit agreement with a different syndicate of banks. Prior to July 25, 2023, the aggregate commitment amount and the commitment fee were the same as those under the current Credit Agreement. During the year ended October 31, 2023, there were no borrowings made or outstanding with respect to the Fund under the Credit Agreement.
| 40 | MainStay MacKay High Yield Corporate Bond Fund |
Note 8–Interfund Lending Program
Pursuant to an exemptive order issued by the SEC, the Fund, along with certain other funds managed by New York Life Investments, may participate in an interfund lending program. The interfund lending program provides an alternative credit facility that permits the Fund and certain other funds managed by New York Life Investments to lend or borrow money for temporary purposes directly to or from one another, subject to the conditions of the exemptive order. During the year ended October 31, 2023, there were no interfund loans made or outstanding with respect to the Fund.
Note 9–Purchases and Sales of Securities (in 000’s)
During the year ended October 31, 2023, purchases and sales of securities, other than short-term securities, were $1,931,438 and $2,089,101, respectively.
Note 10–Capital Share Transactions
Transactions in capital shares for the years ended October 31, 2023 and October 31, 2022, were as follows:
| Class A | Shares | Amount |
| Year ended October 31, 2023: | | |
| Shares sold | 78,051,343 | $ 389,132,502 |
| Shares issued to shareholders in reinvestment of distributions | 28,889,335 | 144,137,090 |
| Shares redeemed | (154,751,687) | (772,065,976) |
| Net increase (decrease) in shares outstanding before conversion | (47,811,009) | (238,796,384) |
| Shares converted into Class A (See Note 1) | 5,245,041 | 26,189,256 |
| Shares converted from Class A (See Note 1) | (889,764) | (4,470,861) |
| Net increase (decrease) | (43,455,732) | $ (217,077,989) |
| Year ended October 31, 2022: | | |
| Shares sold | 96,269,574 | $ 504,848,483 |
| Shares issued to shareholders in reinvestment of distributions | 28,431,851 | 148,029,559 |
| Shares redeemed | (193,311,873) | (1,015,581,405) |
| Net increase (decrease) in shares outstanding before conversion | (68,610,448) | (362,703,363) |
| Shares converted into Class A (See Note 1) | 5,071,164 | 26,422,459 |
| Shares converted from Class A (See Note 1) | (233,056) | (1,222,885) |
| Net increase (decrease) | (63,772,340) | $ (337,503,789) |
| |
| Investor Class | Shares | Amount |
| Year ended October 31, 2023: | | |
| Shares sold | 1,017,985 | $ 5,121,893 |
| Shares issued to shareholders in reinvestment of distributions | 1,173,564 | 5,897,791 |
| Shares redeemed | (2,488,238) | (12,514,376) |
| Net increase (decrease) in shares outstanding before conversion | (296,689) | (1,494,692) |
| Shares converted into Investor Class (See Note 1) | 528,336 | 2,658,813 |
| Shares converted from Investor Class (See Note 1) | (1,457,838) | (7,322,253) |
| Net increase (decrease) | (1,226,191) | $ (6,158,132) |
| Year ended October 31, 2022: | | |
| Shares sold | 1,314,685 | $ 7,006,900 |
| Shares issued to shareholders in reinvestment of distributions | 1,121,506 | 5,871,610 |
| Shares redeemed | (2,565,213) | (13,569,137) |
| Net increase (decrease) in shares outstanding before conversion | (129,022) | (690,627) |
| Shares converted into Investor Class (See Note 1) | 647,159 | 3,427,758 |
| Shares converted from Investor Class (See Note 1) | (1,299,262) | (6,923,010) |
| Net increase (decrease) | (781,125) | $ (4,185,879) |
| |
| Class B | Shares | Amount |
| Year ended October 31, 2023: | | |
| Shares sold | 21,680 | $ 107,706 |
| Shares issued to shareholders in reinvestment of distributions | 73,983 | 367,385 |
| Shares redeemed | (465,849) | (2,310,090) |
| Net increase (decrease) in shares outstanding before conversion | (370,186) | (1,834,999) |
| Shares converted from Class B (See Note 1) | (736,809) | (3,657,717) |
| Net increase (decrease) | (1,106,995) | $ (5,492,716) |
| Year ended October 31, 2022: | | |
| Shares sold | 51,684 | $ 276,043 |
| Shares issued to shareholders in reinvestment of distributions | 128,906 | 673,604 |
| Shares redeemed | (1,235,556) | (6,393,498) |
| Net increase (decrease) in shares outstanding before conversion | (1,054,966) | (5,443,851) |
| Shares converted from Class B (See Note 1) | (1,019,213) | (5,298,623) |
| Net increase (decrease) | (2,074,179) | $ (10,742,474) |
| |
Notes to Financial Statements (continued)
| Class C | Shares | Amount |
| Year ended October 31, 2023: | | |
| Shares sold | 1,129,297 | $ 5,594,569 |
| Shares issued to shareholders in reinvestment of distributions | 1,028,914 | 5,113,581 |
| Shares redeemed | (7,525,687) | (37,352,570) |
| Net increase (decrease) in shares outstanding before conversion | (5,367,476) | (26,644,420) |
| Shares converted from Class C (See Note 1) | (1,842,802) | (9,158,313) |
| Net increase (decrease) | (7,210,278) | $ (35,802,733) |
| Year ended October 31, 2022: | | |
| Shares sold | 1,972,074 | $ 10,211,162 |
| Shares issued to shareholders in reinvestment of distributions | 1,235,498 | 6,431,044 |
| Shares redeemed | (12,067,962) | (63,194,114) |
| Net increase (decrease) in shares outstanding before conversion | (8,860,390) | (46,551,908) |
| Shares converted from Class C (See Note 1) | (2,062,605) | (10,660,509) |
| Net increase (decrease) | (10,922,995) | $ (57,212,417) |
| |
| Class I | Shares | Amount |
| Year ended October 31, 2023: | | |
| Shares sold | 188,810,621 | $ 943,198,625 |
| Shares issued to shareholders in reinvestment of distributions | 34,478,584 | 172,086,582 |
| Shares redeemed | (259,550,476) | (1,292,981,127) |
| Net increase (decrease) in shares outstanding before conversion | (36,261,271) | (177,695,920) |
| Shares converted into Class I (See Note 1) | 904,096 | 4,543,309 |
| Shares converted from Class I (See Note 1) | (274,234) | (1,380,102) |
| Net increase (decrease) | (35,631,409) | $ (174,532,713) |
| Year ended October 31, 2022: | | |
| Shares sold | 287,464,303 | $ 1,510,050,594 |
| Shares issued to shareholders in reinvestment of distributions | 34,206,122 | 178,206,439 |
| Shares redeemed | (406,328,774) | (2,107,290,774) |
| Net increase (decrease) in shares outstanding before conversion | (84,658,349) | (419,033,741) |
| Shares converted into Class I (See Note 1) | 252,101 | 1,317,383 |
| Shares converted from Class I (See Note 1) | (115,407) | (559,921) |
| Net increase (decrease) | (84,521,655) | $ (418,276,279) |
| |
| Class R1 | Shares | Amount |
| Year ended October 31, 2023: | | |
| Shares sold | 1,055 | $ 5,252 |
| Shares issued to shareholders in reinvestment of distributions | 518 | 2,582 |
| Shares redeemed | (2,614) | (12,959) |
| Net increase (decrease) | (1,041) | $ (5,125) |
| Year ended October 31, 2022: | | |
| Shares sold | 2,588 | $ 12,727 |
| Shares issued to shareholders in reinvestment of distributions | 531 | 2,753 |
| Shares redeemed | (3,382) | (17,585) |
| Net increase (decrease) | (263) | $ (2,105) |
| |
| Class R2 | Shares | Amount |
| Year ended October 31, 2023: | | |
| Shares sold | 276,469 | $ 1,378,905 |
| Shares issued to shareholders in reinvestment of distributions | 50,618 | 252,583 |
| Shares redeemed | (416,278) | (2,086,972) |
| Net increase (decrease) | (89,191) | $ (455,484) |
| Year ended October 31, 2022: | | |
| Shares sold | 313,412 | $ 1,646,320 |
| Shares issued to shareholders in reinvestment of distributions | 57,136 | 298,793 |
| Shares redeemed | (831,012) | (4,462,692) |
| Net increase (decrease) in shares outstanding before conversion | (460,464) | (2,517,579) |
| Shares converted from Class R2 (See Note 1) | (7,330) | (35,801) |
| Net increase (decrease) | (467,794) | $ (2,553,380) |
| |
| Class R3 | Shares | Amount |
| Year ended October 31, 2023: | | |
| Shares sold | 259,260 | $ 1,296,592 |
| Shares issued to shareholders in reinvestment of distributions | 37,303 | 185,998 |
| Shares redeemed | (212,168) | (1,061,437) |
| Net increase (decrease) | 84,395 | $ 421,153 |
| Year ended October 31, 2022: | | |
| Shares sold | 196,243 | $ 1,015,558 |
| Shares issued to shareholders in reinvestment of distributions | 29,907 | 155,148 |
| Shares redeemed | (139,286) | (714,740) |
| Net increase (decrease) in shares outstanding before conversion | 86,864 | 455,966 |
| Shares converted from Class R3 (See Note 1) | (19,036) | (93,846) |
| Net increase (decrease) | 67,828 | $ 362,120 |
| |
| 42 | MainStay MacKay High Yield Corporate Bond Fund |
| Class R6 | Shares | Amount |
| Year ended October 31, 2023: | | |
| Shares sold | 207,906,986 | $ 1,032,437,690 |
| Shares issued to shareholders in reinvestment of distributions | 44,598,388 | 221,999,899 |
| Shares redeemed | (204,221,976) | (1,016,145,702) |
| Net increase (decrease) in shares outstanding before conversion | 48,283,398 | 238,291,887 |
| Shares converted into Class R6 (See Note 1) | 9,706 | 49,014 |
| Shares converted from Class R6 (See Note 1) | (1,494,935) | (7,451,146) |
| Net increase (decrease) | 46,798,169 | $ 230,889,755 |
| Year ended October 31, 2022: | | |
| Shares sold | 234,416,558 | $ 1,212,223,525 |
| Shares issued to shareholders in reinvestment of distributions | 37,129,569 | 192,071,459 |
| Shares redeemed | (187,677,935) | (973,813,565) |
| Net increase (decrease) in shares outstanding before conversion | 83,868,192 | 430,481,419 |
| Shares converted into Class R6 (See Note 1) | 1,001 | 5,033 |
| Shares converted from Class R6 (See Note 1) | (1,230,526) | (6,378,038) |
| Net increase (decrease) | 82,638,667 | $ 424,108,414 |
| |
| SIMPLE Class | Shares | Amount |
| Year ended October 31, 2023: | | |
| Shares sold | 2,520 | $ 12,809 |
| Shares issued to shareholders in reinvestment of distributions | 442 | 2,223 |
| Net increase (decrease) | 2,962 | $ 15,032 |
| Year ended October 31, 2022: | | |
| Shares sold | 1,542 | $ 8,728 |
| Shares issued to shareholders in reinvestment of distributions | 285 | 1,486 |
| Net increase (decrease) | 1,827 | $ 10,214 |
Note 11–Other Matters
As of the date of this report, the Fund faces a heightened level of risk associated with current uncertainty, volatility and state of economies, financial markets, rising interest rates, and labor and health conditions around the world. Events such as war, acts of terrorism, recessions, rapid inflation, the imposition of international sanctions, earthquakes, hurricanes, epidemics and pandemics and other unforeseen natural or human disasters may have broad adverse social, political and economic effects on the global economy, which could negatively impact the value of the Fund's investments. Developments that disrupt global economies and financial markets may magnify factors that affect the Fund's performance.
Note 12–Subsequent Events
In connection with the preparation of the financial statements of the Fund as of and for the year ended October 31, 2023, events and transactions subsequent to October 31, 2023, through the date the financial statements were issued, have been evaluated by the Manager for possible adjustment and/or disclosure. No subsequent events requiring financial statement adjustment or disclosure have been identified.
Report of Independent Registered Public Accounting Firm
To the Shareholders of the Fund and Board of Trustees
The MainStay Funds:
Opinion on the Financial Statements
We have audited the accompanying statement of assets and liabilities of MainStay MacKay High Yield Corporate Bond Fund (the Fund), one of the funds constituting The MainStay Funds, including the portfolio of investments, as of October 31, 2023, the related statement of operations for the year then ended, the statements of changes in net assets for each of the years in the two-year period then ended, and the related notes (collectively, the financial statements) and the financial highlights for each of the years or periods in the five-year period then ended. In our opinion, the financial statements and financial highlights present fairly, in all material respects, the financial position of the Fund as of October 31, 2023, the results of its operations for the year then ended, the changes in its net assets for each of the years in the two-year period then ended, and the financial highlights for each of the years or periods in the five-year period then ended, in conformity with U.S. generally accepted accounting principles.
Basis for Opinion
These financial statements and financial highlights are the responsibility of the Fund's management. Our responsibility is to express an opinion on these financial statements and financial highlights based on our audits. We are a public accounting firm registered with the Public Company Accounting Oversight Board (United States) (PCAOB) and are required to be independent with respect to the Fund in accordance with the U.S. federal securities laws and the applicable rules and regulations of the Securities and Exchange Commission and the PCAOB.
We conducted our audits in accordance with the standards of the PCAOB. Those standards require that we plan and perform the audit to obtain reasonable assurance about whether the financial statements and financial highlights are free of material misstatement, whether due to error or fraud. Our audits included performing procedures to assess the risks of material misstatement of the financial statements and financial highlights, whether due to error or fraud, and performing procedures that respond to those risks. Such procedures included examining, on a test basis, evidence regarding the amounts and disclosures in the financial statements and financial highlights. Such procedures also included confirmation of securities owned as of October 31, 2023, by correspondence with custodians, agent banks and brokers; when replies were not received from agent banks and brokers, we performed other auditing procedures. Our audits also included evaluating the accounting principles used and significant estimates made by management, as well as evaluating the overall presentation of the financial statements and financial highlights. We believe that our audits a reasonable basis for our opinion.

We have served as the auditor of one or more New York Life Investment Management investment companies since 2003.
Philadelphia, Pennsylvania
December 22, 2023
| 44 | MainStay MacKay High Yield Corporate Bond Fund |
Federal Income Tax Information
(Unaudited)
The Fund is required under the Internal Revenue Code to advise shareholders in a written statement as to the federal tax status of dividends paid by the Fund during such fiscal years.
For the fiscal year ended October 31, 2023, the Fund designated approximately $7,515,198 under the Internal Revenue Code as qualified dividend income eligible for reduced tax rates.
The dividends paid by the Fund during the fiscal year ended October 31, 2023 should be multiplied by 1.28% to arrive at the amount eligible for the corporate dividend-received deduction.
In February 2024, shareholders will receive an IRS Form 1099-DIV or substitute Form 1099, which will show the federal tax status of the distributions received by shareholders in calendar year 2023. The amounts that will be reported on such 1099-DIV or substitute Form 1099 will be the amounts you are to use on your federal income tax return and will differ from the amounts which we must report for the Fund's fiscal year ended October 31, 2023.
Proxy Voting Policies and Procedures and Proxy Voting Record
The Fund is required to file with the SEC its proxy voting record for the 12-month period ending June 30 on Form N-PX. A description of the policies and procedures that are used to vote proxies relating to portfolio securities of the Fund is available free of charge upon request by calling 800-624-6782 or visiting the SEC’s website at www.sec.gov. The most recent Form N-PX or proxy voting record is available free of charge upon request by calling 800-624-6782; visiting newyorklifeinvestments.com; or visiting the SEC’s website at www.sec.gov.
Shareholder Reports and Quarterly Portfolio Disclosure
The Fund is required to file its complete schedule of portfolio holdings with the SEC 60 days after its first and third fiscal quarter on Form N-PORT. The Fund's holdings report is available free of charge upon request by calling New York Life Investments at 800-624-6782.
Board of Trustees and Officers (Unaudited)
The Trustees and officers of the Fund are listed below. The Board oversees the MainStay Group of Funds (which consists of MainStay Funds and MainStay Funds Trust), MainStay VP Funds Trust, MainStay MacKay DefinedTerm Municipal Opportunities Fund, MainStay CBRE Global Infrastructure Megatrends Term Fund, the Manager and the Subadvisors, and elects the officers of the Funds who are responsible for the day-to-day operations of the Fund. Information pertaining to the Trustees and officers is set forth below. Each Trustee serves until his or her successor is elected and qualified or until his or her resignation, death or
removal. Under the Board’s retirement policy, unless an exception is made, a Trustee must tender his or her resignation by the end of the calendar year during which he or she reaches the age of 75. Officers are elected annually by the Board. The business address of each Trustee and officer listed below is 51 Madison Avenue, New York, New York 10010. A majority of the Trustees are not “interested persons” (as defined by the 1940 Act and rules adopted by the SEC thereunder) of the Fund (“Independent Trustees”).
| | Name and
Year of Birth | Term of Office,
Position(s) Held and
Length of Service | Principal Occupation(s)
During Past Five Years | Number of
Portfolios in
Fund Complex
Overseen by
Trustee | Other Directorships
Held by Trustee |
| | | | | | |
| | Naïm Abou-Jaoudé*
1966 | MainStay Funds: Trustee
since 2023
MainStay Funds Trust:
Trustee since 2023 | Chief Executive Officer of New York Life Investment Management LLC (since 2023). Chief Executive Officer of Candriam (an affiliate of New York Life Investment Management LLC) (2007 to 2023). | 81 | MainStay VP Funds Trust:
Trustee since 2023 (31 portfolios);
MainStay MacKay DefinedTerm Municipal Opportunities Fund: Trustee
since 2023;
MainStay CBRE Global Infrastructure Megatrends Term Fund: Trustee
since 2023; and
New York Life Investment Management International (Chair) since 2015 |
| * | This Trustee is considered to be an “interested person” of the MainStay Group of Funds, MainStay VP Funds Trust, MainStay CBRE Global Infrastructure Megatrends Term Fund and MainStay MacKay DefinedTerm Municipal Opportunities Fund, within the meaning of the 1940 Act because of his affiliation with New York Life Investment Management LLC and Candriam, as described in detail above in the column entitled “Principal Occupation(s) During Past Five Years.” |
| | |
| 46 | MainStay MacKay High Yield Corporate Bond Fund |
| | Name and
Year of Birth | Term of Office,
Position(s) Held and
Length of Service | Principal Occupation(s)
During Past Five Years | Number of
Portfolios in
Fund Complex
Overseen by
Trustee | Other Directorships
Held by Trustee |
| | | | | | |
| | David H. Chow
1957 | MainStay Funds: Trustee since January 2016, Advisory Board Member (June 2015 to December 2015);MainStay Funds Trust:
Trustee since January 2016, Advisory Board Member (June 2015 to December 2015) | Founder and CEO, DanCourt Management, LLC (since 1999) | 81 | MainStay VP Funds Trust: Trustee since January 2016, Advisory Board Member (June 2015 to December 2015) (31 portfolios);
MainStay MacKay DefinedTerm Municipal Opportunities Fund: Trustee since January 2016, Advisory Board Member (June 2015 to December 2015);
MainStay CBRE Global Infrastructure Megatrends Term Fund: Trustee since 2021;
VanEck Vectors Group of Exchange-Traded Funds: Trustee since 2006 and Independent Chairman of the Board of Trustees from 2008 to 2022 (57 portfolios); and
Berea College of Kentucky: Trustee since 2009, Chair of the Investment Committee since 2018 |
| | Karen Hammond
1956 | MainStay Funds: Trustee since December 2021, Advisory Board Member (June 2021 to December 2021);MainStay Funds Trust:
Trustee since December 2021, Advisory Board Member (June 2021 to December 2021)
| Retired, Managing Director, Devonshire Investors (2007 to 2013); Senior Vice President, Fidelity Management & Research Co. (2005 to 2007); Senior Vice President and Corporate Treasurer, FMR Corp. (2003 to 2005); Chief Operating Officer, Fidelity Investments Japan (2001 to 2003) | 81 | MainStay VP Funds Trust: Trustee since December 2021, Advisory Board Member (June 2021 to December 2021) (31 portfolios);
MainStay MacKay DefinedTerm Municipal Opportunities Fund: Trustee since December 2021, Advisory Board Member (June 2021 to December 2021);
MainStay CBRE Global Infrastructure Megatrends Term Fund: Trustee since December 2021, Advisory Board Member (June 2021 to December 2021);
Two Harbors Investment Corp.: Director since 2018;
Rhode Island State Investment Commission: Member since 2017; and
Blue Cross Blue Shield of Rhode Island: Director since 2019 |
| | Susan B. Kerley
1951 | MainStay Funds: Chair since January 2017 and Trustee since 2007;MainStay Funds Trust:
Chair since January 2017 and Trustee since 1990*** | President, Strategic Management Advisors LLC (since 1990) | 81 | MainStay VP Funds Trust: Chair since January 2017 and Trustee since 2007 (31 portfolios)**;
MainStay MacKay DefinedTerm Municipal Opportunities Fund: Chair since January 2017 and Trustee since 2011;
MainStay CBRE Global Infrastructure Megatrends Term Fund: Trustee since June 2021; and
Legg Mason Partners Funds: Trustee since 1991 (45 portfolios) |
Board of Trustees and Officers (Unaudited) (continued)
| | Name and
Year of Birth | Term of Office,
Position(s) Held and
Length of Service | Principal Occupation(s)
During Past Five Years | Number of
Portfolios in
Fund Complex
Overseen by
Trustee | Other Directorships
Held by Trustee |
| | | | | | |
| | Alan R. Latshaw
1951 | MainStay Funds: Trusteesince 2006;MainStay Funds Trust:
Trustee since 2007*** | Retired; Partner, Ernst & Young LLP (2002 to 2003); Partner, Arthur Andersen LLP (1989 to 2002); Consultant to the MainStay Funds Audit and Compliance Committee (2004 to 2006) | 81 | MainStay VP Funds Trust: Trustee since 2007 (31 portfolios)**;
MainStay MacKay DefinedTerm Municipal Opportunities Fund: Trustee since 2011; and
MainStay CBRE Global Infrastructure Megatrends Term Fund: Trustee since June 2021 |
| | Jacques P. Perold
1958 | MainStay Funds: Trustee since January 2016, Advisory Board Member (June 2015to December 2015);MainStay Funds Trust:
Trustee since January 2016, Advisory Board Member (June 2015 to December 2015) | Founder and Chief Executive Officer, CapShift Advisors LLC (since 2018); President, Fidelity Management & Research Company (2009 to 2014); President and Chief Investment Officer, Geode Capital Management, LLC (2001 to 2009) | 81 | MainStay VP Funds Trust: Trustee since January 2016, Advisory Board Member (June 2015 to December 2015) (31 portfolios);
MainStay MacKay DefinedTerm Municipal Opportunities Fund: Trustee since January 2016, Advisory Board Member (June 2015 to December 2015);
MainStay CBRE Global Infrastructure Megatrends Term Fund: Trustee since June 2021;
Allstate Corporation: Director since 2015; and
MSCI Inc.: Director since 2017 |
| | Richard S. Trutanic
1952 | MainStay Funds: Trustee since 1994;MainStay Funds Trust:
Trustee since 2007*** | Chairman and Chief Executive Officer, Somerset & Company (financial advisory firm) (since 2004); Managing Director, The Carlyle Group (private investment firm) (2002 to 2004); Senior Managing Director, Partner and Board Member, Groupe Arnault S.A. (private investment firm) (1999 to 2002) | 81 | MainStay VP Funds Trust: Trustee since 2007 (31 portfolios)**;
MainStay MacKay DefinedTerm Municipal Opportunities Fund: Trustee since 2011; and
MainStay CBRE Global Infrastructure Megatrends Term Fund: Trustee since June 2021 |
| ** | Includes prior service as a Director of MainStay VP Series Fund, Inc., the predecessor to MainStay VP Funds Trust. |
| *** | Includes prior service as a Director/Trustee of certain predecessor entities to MainStay Funds Trust. |
| 48 | MainStay MacKay High Yield Corporate Bond Fund |
| | Name and
Year of Birth | Position(s) Held and
Length of Service | Principal Occupation(s)
During Past Five Years | |
| | | | | |
| | Kirk C. Lehneis
1974 | President, MainStay Funds, MainStay Funds Trust (since 2017) | Chief Operating Officer and Senior Managing Director (since 2016), New York Life Investment Management LLC and New York Life Investment Management Holdings LLC; Member of the Board of Managers (since 2017) and Senior Managing Director (since 2018), NYLIFE Distributors LLC; Chairman of the Board and Senior Managing Director, NYLIM Service Company LLC (since 2017); Trustee, President and Principal Executive Officer of IndexIQ Trust, IndexIQ ETF Trust and IndexIQ Active ETF Trust (since 2018); President, MainStay CBRE Global Infrastructure Megatrends Term Fund (since 2021), MainStay MacKay DefinedTerm Municipal Opportunities Fund and MainStay VP Funds Trust (since 2017)**; Senior Managing Director, Global Product Development (2015 to 2016); Managing Director, Product Development (2010 to 2015), New York Life Investment Management LLC | |
| | Jack R. Benintende
1964 | Treasurer and Principal Financial and Accounting Officer, MainStay Funds (since 2007), MainStay Funds Trust (since 2009) | Managing Director, New York Life Investment Management LLC (since 2007); Treasurer and Principal Financial and Accounting Officer, MainStay CBRE Global Infrastructure Megatrends Term Fund (since 2021), MainStay MacKay DefinedTerm Municipal Opportunities Fund (since 2011) and MainStay VP Funds Trust (since 2007)**; and Assistant Treasurer, New York Life Investment Management Holdings LLC (2008 to 2012) | |
| | J. Kevin Gao
1967 | Secretary and Chief Legal Officer, MainStay Funds and MainStay Funds Trust (since 2010) | Managing Director and Associate General Counsel, New York Life Investment Management LLC (since 2010); Secretary and Chief Legal Officer, MainStay CBRE Global Infrastructure Megatrends Term Fund (since 2021), MainStay MacKay DefinedTerm Municipal Opportunities Fund (since 2011) and MainStay VP Funds Trust (since 2010)** | |
| | Kevin M. Gleason
1967 | Vice President and Chief Compliance Officer, MainStay Funds and MainStay Funds Trust (since June 2022) | Vice President and Chief Compliance Officer, IndexIQ Trust, IndexIQ ETF Trust and Index IQ Active ETF Trust (since June 2022); Vice President and Chief Compliance Officer, MainStay CBRE Global Infrastructure Megatrends Term Fund, MainStay VP Funds Trust and MainStay MacKay DefinedTerm Municipal Opportunities Fund (since June 2022); Senior Vice President, Voya Investment Management and Chief Compliance Officer, Voya Family of Funds (2012 to 2022) | |
| | Scott T. Harrington
1959 | Vice President— Administration, MainStay Funds (since 2005), MainStay Funds Trust (since 2009) | Managing Director, New York Life Investment Management LLC (including predecessor advisory organizations) (since 2000); Member of the Board of Directors, New York Life Trust Company (since 2009); Vice President—Administration, MainStay CBRE Global Infrastructure Megatrends Term Fund (since 2021), MainStay MacKay DefinedTerm Municipal Opportunities Fund (since 2011) and MainStay VP Funds Trust (since 2005)** | |
| * | The officers listed above are considered to be “interested persons” of the MainStay Group of Funds, MainStay VP Funds Trust, MainStay CBRE Global Infrastructure Megatrends Term Fund and MainStay MacKay DefinedTerm Municipal Opportunities Fund within the meaning of the 1940 Act because of their affiliation with the MainStay Group of Funds, New York Life Insurance Company and/or its affiliates, including New York Life Investment Management LLC, New York Life Insurance Company, NYLIM Service Company LLC, NYLIFE Securities LLC and/or NYLIFE Distributors LLC, as described in detail in the column captioned “Principal Occupation(s) During Past Five Years.” Officers are elected annually by the Board. |
| ** | Includes prior service as an Officer of MainStay VP Series Fund, Inc., the predecessor to MainStay VP Funds Trust. |
Officers of the Trust (Who are not Trustees)*
This page intentionally left blank.
Equity
U.S. Equity
MainStay Epoch U.S. Equity Yield Fund
MainStay Fiera SMID Growth Fund
MainStay PineStone U.S. Equity Fund
MainStay S&P 500 Index Fund
MainStay Winslow Large Cap Growth Fund
MainStay WMC Enduring Capital Fund
MainStay WMC Growth Fund
MainStay WMC Small Companies Fund
MainStay WMC Value Fund
International Equity
MainStay Epoch International Choice Fund
MainStay PineStone International Equity Fund
MainStay WMC International Research Equity Fund
Emerging Markets Equity
MainStay Candriam Emerging Markets Equity Fund
Global Equity
MainStay Epoch Capital Growth Fund
MainStay Epoch Global Equity Yield Fund
MainStay PineStone Global Equity Fund
Fixed Income
Taxable Income
MainStay Candriam Emerging Markets Debt Fund
MainStay Floating Rate Fund
MainStay MacKay High Yield Corporate Bond Fund
MainStay MacKay Short Duration High Yield Fund
MainStay MacKay Strategic Bond Fund
MainStay MacKay Total Return Bond Fund
MainStay MacKay U.S. Infrastructure Bond Fund
MainStay Short Term Bond Fund
Tax-Exempt Income
MainStay MacKay California Tax Free Opportunities Fund1
MainStay MacKay High Yield Municipal Bond Fund
MainStay MacKay New York Tax Free Opportunities Fund2
MainStay MacKay Short Term Municipal Fund
MainStay MacKay Strategic Municipal Allocation Fund
MainStay MacKay Tax Free Bond Fund
Money Market
MainStay Money Market Fund
Mixed Asset
MainStay Balanced Fund
MainStay Income Builder Fund
MainStay MacKay Convertible Fund
Speciality
MainStay CBRE Global Infrastructure Fund
MainStay CBRE Real Estate Fund
MainStay Cushing MLP Premier Fund
Asset Allocation
MainStay Conservative Allocation Fund
MainStay Conservative ETF Allocation Fund
MainStay Defensive ETF Allocation Fund
MainStay Equity Allocation Fund
MainStay Equity ETF Allocation Fund
MainStay ESG Multi-Asset Allocation Fund
MainStay Growth Allocation Fund
MainStay Growth ETF Allocation Fund
MainStay Moderate Allocation Fund
MainStay Moderate ETF Allocation Fund
Manager
New York Life Investment Management LLC
New York, New York
Subadvisors
Candriam3
Strassen, Luxembourg
CBRE Investment Management Listed Real Assets LLC
Radnor, Pennsylvania
Cushing Asset Management, LP
Dallas, Texas
Epoch Investment Partners, Inc.
New York, New York
Fiera Capital Inc.
New York, New York
IndexIQ Advisors LLC3
New York, New York
MacKay Shields LLC3
New York, New York
NYL Investors LLC3
New York, New York
PineStone Asset Management Inc.
Montreal, Québec
Wellington Management Company LLP
Boston, Massachusetts
Winslow Capital Management, LLC
Minneapolis, Minnesota
Legal Counsel
Dechert LLP
Washington, District of Columbia
Independent Registered Public Accounting Firm
KPMG LLP
Philadelphia, Pennsylvania
Distributor
NYLIFE Distributors LLC3
Jersey City, New Jersey
Custodian
JPMorgan Chase Bank, N.A.
New York, New York
1.
This Fund is registered for sale in AZ, CA, NV, OR, TX, UT, WA and MI (Class A and Class I shares only), and CO, FL, GA, HI, ID, MA, MD, NH, NJ and NY (Class I shares only).
| 2. | This Fund is registered for sale in CA, CT, DE, FL, MA, NJ, NY and VT. |
| 3. | An affiliate of New York Life Investment Management LLC. |
Not part of the Annual Report
For more information
800-624-6782
newyorklifeinvestments.com
“New York Life Investments” is both a service mark, and the common trade name, of certain investment advisors affiliated with New York Life Insurance Company. The MainStay Funds® are managed by New York Life Investment Management LLC and distributed by NYLIFE Distributors LLC, 30 Hudson Street, Jersey City, NJ 07302, a wholly owned subsidiary of New York Life Insurance Company. NYLIFE Distributors LLC is a Member FINRA/SIPC.
©2023 NYLIFE Distributors LLC. All rights reserved.
| 5013763MS139-23 | MSHY11-12/23 |
(NYLIM) NL212
MainStay MacKay Strategic Bond Fund
Message from the President and Annual Report
October 31, 2023
Special Notice:
Beginning in July 2024, new regulations issued by the Securities and Exchange Commission (SEC) will take effect requiring open-end mutual fund companies and ETFs to (1) overhaul the content of their shareholder reports and (2) mail paper copies of the new tailored shareholder reports to shareholders who have not opted to receive these documents electronically.
If you have not yet elected to receive your shareholder reports electronically, please contact your financial intermediary or visit newyorklifeinvestments.com/accounts.
| Not FDIC/NCUA Insured | Not a Deposit | May Lose Value | No Bank Guarantee | Not Insured by Any Government Agency |
This page intentionally left blank
Message from the President
Volatile economic and geopolitical forces drove market behavior during the 12-month reporting period ended October 31, 2023. While equity markets generally gained ground, bond prices trended broadly lower.
Although the war in Ukraine, the outbreak of hostilities in the Middle East and several other notable events affected financial assets, inflation and interest rate trends stood at the forefront of market developments during most of the period. As the reporting period began, high levels of inflation already showed signs of easing in the face of aggressive rate hikes by the U.S. Federal Reserve (the “Fed”). From a peak of 9.1% in June 2022, the annualized U.S. inflation rate dropped to 7.1% in November 2022, and to 3.2% in October 2023. At the same time, the Fed increased the benchmark federal funds rate from 3.75%–4.00% at the beginning of the reporting period to 5.25%–5.50% as of October 31, 2023. As the pace of rate increases slowed during the period, investors hoped for an early shift to a looser monetary policy. However, comments from Fed members late in the period reinforced the central bank’s hawkish stance in response to surprisingly robust U.S. economic growth and rising wage pressures, thus increasing the likelihood that interest rates would stay higher for longer. International developed markets exhibited similar dynamics of elevated inflation and rising interest rates.
Despite the backdrop of high interest rates—along with political dysfunction in Washington D.C. and intensifying global geopolitical instability—equity markets managed to advance, supported by healthy consumer spending trends and persistent domestic economic growth. The S&P 500® Index, a widely regarded benchmark of large-cap U.S. market performance, gained ground, bolstered by the strong performance of energy stocks amid surging petroleum prices and mega-cap, growth-oriented, technology-related shares, which rose as investors flocked to companies creating the infrastructure for developments in artificial intelligence. Smaller-cap stocks and value-oriented shares produced milder returns. Among industry sectors, energy and
information technology posted the strongest gains. Real estate declined most sharply under pressure from rising mortgage rates and weak levels of office occupancy. Developed international markets outperformed U.S. markets, with Europe benefiting during the first half of the period from unexpected economic resilience in the face of rising energy prices and the ongoing war in Ukraine. Emerging markets posted positive results but lagged developed markets, largely due to slow economic growth in China despite the relaxation of pandemic-era lockdowns.
Bond prices were driven lower by rising yields and increasing expectations of high interest rates for an extended period of time. The U.S. yield curve steepened, with the 30-year Treasury yield exceeding 5% for the first time in more than a decade. The yield curve remained inverted, with the 10-year Treasury yield ending the period at 4.88%, compared with 5.07% for the 2-year Treasury yield. Corporate bonds outperformed long-term Treasury bonds, but still trended lower under pressure from rising yields and an uptick in default rates. Among corporates, lower-credit-quality instruments performed slightly better than their higher-credit-quality counterparts, while floating rate securities performed better still.
In the face of today’s uncertain market environment, New York Life Investments remains dedicated to providing the guidance, resources and investment solutions you need to pursue your financial goals.
Thank you for trusting us to help meet your investment needs.
Sincerely,
Kirk C. Lehneis
President
The opinions expressed are as of the date of this report and are subject to change. There is no guarantee that any forecast made will come to pass. This material does not constitute investment advice and is not intended as an endorsement of any specific investment. Past performance is no guarantee of future results.
Not part of the Annual Report
Investors should refer to the Fund’s Summary Prospectus and/or Prospectus and consider the Fund’s investment objectives, strategies, risks, charges and expenses carefully before investing. The Summary Prospectus and/or Prospectus contain this and other information about the Fund. You may obtain copies of the Fund’s Summary Prospectus, Prospectus and Statement of Additional Information, which includes information about The MainStay Funds' Trustees, free of charge, upon request, by calling toll-free 800-624-6782, by writing to NYLIFE Distributors LLC, Attn: MainStay Marketing Department, 30 Hudson Street, Jersey City, NJ 07302 or by sending an e-mail to MainStayShareholderServices@nylim.com. These documents are also available via the MainStay Funds’ website at newyorklifeinvestments.com. Please read the Fund’s Summary Prospectus and/or Prospectus carefully before investing.
Investment and Performance Comparison (Unaudited)
Performance data quoted represents past performance. Past performance is no guarantee of future results. Because of market volatility and other factors, current performance may be lower or higher than the figures shown. Investment return and principal value will fluctuate, and as a result, when shares are redeemed, they may be worth more or less than their original cost. The graph below depicts the historical performance of Class I shares of the Fund. Performance will vary from class to class based on differences in class-specific expenses and sales charges. For performance information current to the most recent month-end, please call 800-624-6782 or visit newyorklifeinvestments.com.
The performance table and graph do not reflect the deduction of taxes that a shareholder would pay on distributions or Fund share redemptions. Total returns reflect maximum applicable sales charges as indicated in the table below, if any, changes in share price, and reinvestment of dividend and capital gain distributions. The graph assumes the initial investment amount shown below and reflects the deduction of all sales charges that would have applied for the period of investment. Performance figures may reflect certain fee waivers and/or expense limitations, without which total returns may have been lower. For more information on share classes and current fee waivers and/or expense limitations (if any), please refer to the Notes to Financial Statements.
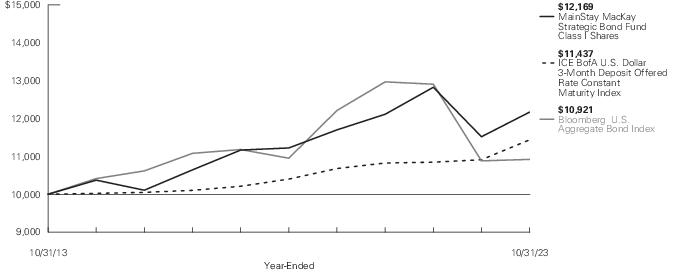
| Average Annual Total Returns for the Year-Ended October 31, 2023 |
| Class | Sales Charge | | Inception
Date | One
Year | Five
Years | Ten Years
or Since
Inception | Gross
Expense
Ratio1 |
| Class A Shares | Maximum 4.50% Initial Sales Charge | With sales charges | 2/28/1997 | 0.56% | 0.41% | 1.24% | 1.03% |
| | | Excluding sales charges | | 5.30 | 1.34 | 1.71 | 1.03 |
| Investor Class Shares2 | Maximum 4.00% Initial Sales Charge | With sales charges | 2/28/2008 | 0.83 | 0.28 | 1.17 | 1.17 |
| | | Excluding sales charges | | 5.03 | 1.21 | 1.64 | 1.17 |
| Class B Shares3 | Maximum 5.00% CDSC | With sales charges | 2/28/1997 | -0.68 | 0.10 | 0.89 | 1.92 |
| | if Redeemed Within the First Six Years of Purchase | Excluding sales charges | | 4.32 | 0.46 | 0.89 | 1.92 |
| Class C Shares | Maximum 1.00% CDSC | With sales charges | 9/1/1998 | 3.33 | 0.46 | 0.89 | 1.92 |
| | if Redeemed Within One Year of Purchase | Excluding sales charges | | 4.33 | 0.46 | 0.89 | 1.92 |
| Class I Shares | No Sales Charge | | 1/2/2004 | 5.64 | 1.63 | 1.98 | 0.78 |
| Class R2 Shares4 | No Sales Charge | | 2/28/2014 | 5.19 | 1.23 | 1.42 | 1.13 |
| Class R3 Shares4 | No Sales Charge | | 2/29/2016 | 4.92 | 0.97 | 2.41 | 1.38 |
| Class R6 Shares | No Sales Charge | | 2/28/2018 | 5.68 | 1.78 | 1.66 | 0.65 |
| 1. | The gross expense ratios presented reflect the Fund’s “Total Annual Fund Operating Expenses” from the most recent Prospectus, as supplemented, and may differ from other expense ratios disclosed in this report. |
| 2. | Prior to June 30, 2020, the maximum initial sales charge was 4.50%, which is reflected in the applicable average annual total return figures shown. |
| 3. | Class B shares are closed to all new purchases as well as additional investments by existing Class B shareholders and will be converted into Class A or Investor Class shares based on shareholder eligibility on or about February 28, 2024. |
| 4. | As of October 31, 2023, Class R2 and Class R3 shares are closed to new investors and, upon the close of business on December 29, 2023, Class R2 and Class R3 shares are closed to additional investments by existing shareholders. Additionally, Class R2 and Class R3 shares will be liquidated on or about February 28, 2024 (the "Liquidation Date"). It is expected that the Fund will distribute to remaining shareholders invested in Class R2 or Class R3 shares, on or promptly after the Liquidation Date, a liquidating distribution in cash or cash equivalents equal to the net asset value of such shares. |
The footnotes on the next page are an integral part of the table and graph and should be carefully read in conjunction with them.
| Benchmark Performance* | One
Year | Five
Years | Ten
Years |
| Bloomberg U.S. Aggregate Bond Index1 | 0.36% | -0.06% | 0.88% |
| ICE BofA U.S. Dollar 3-Month Deposit Offered Rate Constant Maturity Index2 | 4.81 | 1.92 | 1.35 |
| Morningstar Nontraditional Bond Category Average3 | 3.58 | 1.41 | 1.57 |
| * | Returns for indices reflect no deductions for fees, expenses or taxes, except for foreign withholding taxes where applicable. Results assume reinvestment of all dividends and capital gains. An investment cannot be made directly in an index. |
| 1. | The Bloomberg U.S. Aggregate Bond Index is the Fund's primary benchmark. The Bloomberg U.S. Aggregate Bond Index is a broad-based benchmark that measures performance of the investment-grade, U.S. dollar denominated, fixed-rate taxable bond market, including Treasuries, government-related and corporate securities, mortgage-backed securities (agency fixed-rate and hybrid adjustable-rate mortgage pass-throughs), asset-backed securities and commercial mortgage-backed securities. |
| 2. | The Fund has selected the ICE BofA U.S. Dollar 3-Month Deposit Offered Rate Constant Maturity Index as a secondary benchmark. The ICE BofA U.S. Dollar 3-Month Deposit Offered Rate Constant Maturity Index is unmanaged and tracks the performance of a synthetic asset paying a deposit offered rate to a stated maturity. The index is based on the assumed purchase at par of a synthetic instrument having exactly its stated maturity and with a coupon equal to that day’s fixing rate. That issue is assumed to be sold the following business day (priced at a yield equal to the current day fixing rate) and rolled into a new instrument. |
| 3. | The Fund has selected the Morningstar Nontraditional Bond Category Average as an additional benchmark. The Morningstar Nontraditional Bond Category Average contains funds that pursue strategies divergent in one or more ways from conventional practice in the broader bond-fund universe. Morningstar category averages are equal-weighted returns based on constituents of the category at the end of the period. |
The footnotes on the preceding page are an integral part of the table and graph and should be carefully read in conjunction with them.
| 6 | MainStay MacKay Strategic Bond Fund |
Cost in Dollars of a $1,000 Investment in MainStay MacKay Strategic Bond Fund (Unaudited)
The example below is intended to describe the fees and expenses borne by shareholders during the six-month period from May 1, 2023 to October 31, 2023, and the impact of those costs on your investment.
Example
As a shareholder of the Fund you incur two types of costs: (1) transaction costs, including exchange fees and sales charges (loads) on purchases (as applicable), and (2) ongoing costs, including management fees, distribution and/or service (12b-1) fees and other Fund expenses (as applicable). This example is intended to help you understand your ongoing costs (in dollars) of investing in the Fund and to compare these costs with the ongoing costs of investing in other mutual funds. The example is based on an investment of $1,000 made at the beginning of the six-month period and held for the entire period from May 1, 2023 to October 31, 2023.
This example illustrates your Fund’s ongoing costs in two ways:
Actual Expenses
The second and third data columns in the table below provide information about actual account values and actual expenses. You may use the information in these columns, together with the amount you invested, to estimate the expenses that you paid during the six months ended October 31, 2023. Simply divide your account value by $1,000 (for example, an
$8,600 account value divided by $1,000 = 8.6), then multiply the result by the number under the heading entitled “Expenses Paid During Period” to estimate the expenses you paid on your account during this period.
Hypothetical Example for Comparison Purposes
The fourth and fifth data columns in the table below provide information about hypothetical account values and hypothetical expenses based on the Fund’s actual expense ratio and an assumed rate of return of 5% per year before expenses, which is not the Fund’s actual return. The hypothetical account values and expenses may not be used to estimate the actual ending account balances or expenses you paid for the six-month period shown. You may use this information to compare the ongoing costs of investing in the Fund with the ongoing costs of investing in other mutual funds. To do so, compare this 5% hypothetical example with the 5% hypothetical examples that appear in the shareholder reports of the other mutual funds.
Please note that the expenses shown in the table are meant to highlight your ongoing costs only and do not reflect any transactional costs, such as exchange fees or sales charges (loads). Therefore, the fourth and fifth data columns of the table are useful in comparing ongoing costs only and will not help you determine the relative total costs of owning different funds. In addition, if these transactional costs were included, your costs would have been higher.
| Share Class | Beginning
Account
Value
5/1/23 | Ending Account
Value (Based
on Actual
Returns and
Expenses)
10/31/23 | Expenses
Paid
During
Period1 | Ending Account
Value (Based
on Hypothetical
5% Annualized
Return and
Actual Expenses)
10/31/23 | Expenses
Paid
During
Period1 | Net Expense
Ratio
During
Period2 |
| Class A Shares | $1,000.00 | $989.00 | $5.16 | $1,020.01 | $ 5.24 | 1.03% |
| Investor Class Shares | $1,000.00 | $986.90 | $6.21 | $1,018.95 | $ 6.31 | 1.24% |
| Class B Shares | $1,000.00 | $984.20 | $9.95 | $1,015.17 | $10.11 | 1.99% |
| Class C Shares | $1,000.00 | $983.00 | $9.95 | $1,015.17 | $10.11 | 1.99% |
| Class I Shares | $1,000.00 | $990.70 | $3.51 | $1,021.68 | $ 3.57 | 0.70% |
| Class R2 Shares | $1,000.00 | $987.30 | $5.66 | $1,019.51 | $ 5.75 | 1.13% |
| Class R3 Shares | $1,000.00 | $985.90 | $6.96 | $1,018.20 | $ 7.07 | 1.39% |
| Class R6 Shares | $1,000.00 | $989.80 | $3.26 | $1,021.93 | $ 3.31 | 0.65% |
| 1. | Expenses are equal to the Fund’s annualized expense ratio of each class multiplied by the average account value over the period, divided by 365 and multiplied by 184 (to reflect the six-month period). The table above represents the actual expenses incurred during the six-month period. In addition to the fees and expenses which the Fund bears directly, it also indirectly bears a pro rata share of the fees and expenses of the underlying funds in which it invests. Such indirect expenses are not included in the above-reported expense figures. |
| 2. | Expenses are equal to the Fund's annualized expense ratio to reflect the six-month period. |
Portfolio Composition as of October 31, 2023 (Unaudited)
‡ Less than one-tenth of a percent.
See Portfolio of Investments beginning on page 11 for specific holdings within these categories. The Fund's holdings are subject to change.
Top Ten Holdings and/or Issuers Held as of October 31, 2023 (excluding short-term investments) (Unaudited)
| 1. | FHLMC STACR REMIC Trust, 6.821%-11.571%, due 8/25/33–1/25/51 |
| 2. | GNMA, (zero coupon)-9.674%, due 8/20/49–10/16/63 |
| 3. | Connecticut Avenue Securities Trust, 6.971%-14.821%, due 1/25/40–7/25/42 |
| 4. | UMBS Pool, 30 Year, 5.50%-6.50%, due 7/1/53–11/1/53 |
| 5. | UMBS, 30 Year, 4.00%-6.00%, due 6/1/52–9/1/53 |
| 6. | U.S. Treasury Notes, 5.00%, due 10/31/25 |
| 7. | Flagship Credit Auto Trust, 1.59%-4.98%, due 3/16/26–3/15/28 |
| 8. | FHLMC, (zero coupon)-3.50%, due 1/15/33–8/15/56 |
| 9. | BX Trust, 3.605%-9.032%, due 2/15/28–12/9/41 |
| 10. | FNMA, (zero coupon)-9.535%, due 3/25/31–3/25/60 |
| 8 | MainStay MacKay Strategic Bond Fund |
Portfolio Management Discussion and Analysis (Unaudited)
Questions answered by portfolio managers Neil Moriarty III, Michael DePalma, Tom Musmanno, Matt Jacob, Lesya Paisley, CFA, and Shu-Yang Tan, CFA, of MacKay Shields LLC, the Fund’s Subadvisor.
How did MainStay MacKay Strategic Bond Fund perform relative to its benchmarks and peer group during the 12 months ended October 31, 2023?
For the 12 months ended October 31, 2023, Class I shares of MainStay MacKay Strategic Bond Fund returned 5.64%, outperforming the 0.36% return of the Fund’s primary benchmark, the Bloomberg U.S. Aggregate Bond Index, and the 4.81% return of the Fund’s secondary benchmark, the ICE BofA U.S. Dollar 3-Month Deposit Offered Rate Constant Maturity Index. Over the same period, Class I shares also outperformed the 3.58% return of the Morningstar Nontraditional Bond Category Average.1
Were there any changes to the Fund during the reporting period?
Effective May 9, 2023, Michael DePalma and Tom Musmanno were added as portfolio managers of the Fund, and Stephen R. Cianci was removed. Please see the supplement dated May 9, 2023, for more information.
What factors affected the Fund’s relative performance during the reporting period?
Relative to the Bloomberg U.S. Aggregate Bond Index, the Fund’s performance benefited from overweight exposure to securitized products, high-yield corporates and emerging-markets credit, as well as exposure to high-grade corporates. Performance varied across the ratings spectrum, term structure and asset type. Generally speaking, longer-duration2 assets underperformed shorter-duration assets, lower quality outperformed higher quality within the investment-grade segment of the market, and securitized assets outperformed unsecured credit. Conversely, the Fund’s underweight exposure to Treasury securities detracted from relative returns.
During the reporting period, were there any market events that materially impacted the Fund’s performance or liquidity?
Although volatility was prevalent throughout the reporting period, there was no single event that materially adversely impacted the Fund’s performance or liquidity during the reporting period.
During the reporting period, how was the Fund’s performance materially affected by investments in derivatives?
During the reporting period, the Fund used U.S. Treasury futures to hedge its duration. The Fund’s shorter duration profile versus
the Bloomberg U.S. Aggregate Bond Index was beneficial to relative returns in a rising rate market.
What was the Fund’s duration strategy during the reporting period?
The Fund does not track a fixed-income index and can demonstrate a low correlation to the Bloomberg U.S. Aggregate Bond Index. The average duration of the Fund will normally vary from 0 to 7 years. Duration positioning is based on what is most appropriate at a given point in the cycle. Throughout the reporting period, the Fund held a shorter duration than the Bloomberg U.S. Aggregate Index, a position that made a positive contribution to the Fund’s relative performance. (Contributions take weightings and total returns into account.) As of October 31, 2023, the overall duration of the Fund remained in the middle of its allowable range, with an effective duration of 3.59 years relative to 5.90 years for the Index.
During the reporting period, which sectors were the strongest positive contributors to the Fund’s relative performance and which sectors were particularly weak?
During the reporting period, the Fund’s relative performance benefited from exposure to securitized products, high-grade and high-yield corporates, and emerging-markets credit. Within the Fund’s investment-grade exposure, the banking, consumer cyclical and energy sectors were among the most significant positive contributors to performance. Conversely, the Fund’s underweight exposure to Treasury securities detracted from relative returns.
What were some of the Fund’s largest purchases and sales during the reporting period?
The Fund added exposure to Georgia Power, a fully regulated utility, because we saw attractive value on a risk-adjusted basis. Georgia Power benefits from stable and predictable cash flow generation and strong relationships with its regulators. We favor utilities exposure due to the defensive and predictable credit nature of these issuers and their ability to perform well, particularly in a recessionary scenario. The Fund also added a position in Charter Communications, based on attractive valuation. As one of the largest cable and telecommunications providers in the United States, we consider Charter a core high-yield holding, with solid fundamentals and relatively non-cyclical operations.
We sold the Fund’s position in Howmet Aerospace for relative value reasons as valuations became full. Although Howmet is a
| 1. | See "Investment and Performance Comparison" for other share class returns, which may be higher or lower than Class I share returns, and for more information on benchmark and peer group returns. |
| 2. | Duration is a measure of the price sensitivity of a fixed-income investment to changes in interest rates. Duration is expressed as a number of years and is considered a more accurate sensitivity gauge than average maturity. |
strong high-yield credit rated BB+3 on an improving trajectory, in our opinion, the valuation already fully reflected any potential future improvement. At the time of sale, Howmet traded in line with, or better than, many low-BBB-rated4 investment-grade corporates. We also sold the Fund’s QVC holdings following a periodic credit review of the issuer. We concluded that in light of worsening earnings trends, coupled with our cautious outlook on cyclical consumer spending, a stress event may materialize for the issuer in 2024, and likely in 2025.
How did the Fund’s sector weightings change during the reporting period?
During the reporting period, the Fund increased its exposure to residential mortgages securities. During the same period, the Fund reduced its exposure to agency mortgages, commercial mortgage-backed securities, high yield corporates and emerging-markets credit.
How was the Fund positioned at the end of the reporting period?
As of October 31, 2023, relative to the Bloomberg U.S. Aggregate Bond Index, the Fund held overweight exposure to high-yield corporate bonds and securitized assets. As of the same date, the Fund held underweight exposure to U.S. Treasury securities and agency mortgages.
| 3. | An obligation rated ‘BB’ by Standard & Poor’s (“S&P”) is deemed by S&P to be less vulnerable to nonpayment than other speculative issues. In the opinion of S&P, however, the obligor faces major ongoing uncertainties or exposure to adverse business, financial or economic conditions which could lead to the obligor’s inadequate capacity to meet its financial commitment on the obligation. When applied to Fund holdings, ratings are based solely on the creditworthiness of the bonds in the portfolio and are not meant to represent the security or safety of the Fund. Ratings from ‘AA’ to ‘CCC’ may be modified by the addition of a plus (+) or minus (–) sign to show relative standing within the major rating categories. |
| 4. | An obligation rated ‘BBB’ by S&P is deemed by S&P to exhibit adequate protection parameters. In the opinion of S&P, however, adverse economic conditions or changing circumstances are more likely to lead to a weakened capacity of the obligor to meet its financial commitment on the obligation. When applied to Fund holdings, ratings are based solely on the creditworthiness of the bonds in the portfolio and are not meant to represent the security or safety of the Fund. |
The opinions expressed are those of the portfolio managers as of the date of this report and are subject to change. There is no guarantee that any forecasts will come to pass. This material does not constitute investment advice and is not intended as an endorsement of any specific investment.
| 10 | MainStay MacKay Strategic Bond Fund |
Portfolio of Investments October 31, 2023†^
| | Principal
Amount | Value |
| Long-Term Bonds 95.7% |
| Asset-Backed Securities 15.5% |
| Automobile Asset-Backed Securities 10.5% |
| American Credit Acceptance Receivables Trust (a) | |
| Series 2021-2, Class D | | |
| 1.34%, due 7/13/27 | $ 1,715,000 | $ 1,654,020 |
| Series 2021-4, Class D | | |
| 1.82%, due 2/14/28 | 1,520,000 | 1,442,146 |
| Series 2022-1, Class D | | |
| 2.46%, due 3/13/28 | 3,050,000 | 2,893,570 |
| Series 2021-2, Class E | | |
| 2.54%, due 7/13/27 | 2,400,000 | 2,281,799 |
| Series 2020-2, Class C | | |
| 3.88%, due 4/13/26 | 239,500 | 239,299 |
| Avis Budget Rental Car Funding AESOP LLC (a) | |
| Series 2021-1A, Class A | | |
| 1.38%, due 8/20/27 | 1,135,000 | 1,001,379 |
| Series 2023-3A, Class A | | |
| 5.44%, due 2/22/28 | 1,415,000 | 1,377,959 |
| CPS Auto Receivables Trust (a) | |
| Series 2021-A, Class E | | |
| 2.53%, due 3/15/28 | 3,000,000 | 2,823,262 |
| Series 2021-C, Class E | | |
| 3.21%, due 9/15/28 | 2,820,000 | 2,611,111 |
| Series 2020-C, Class E | | |
| 4.22%, due 5/17/27 | 2,215,000 | 2,148,222 |
| Series 2019-C, Class E | | |
| 4.30%, due 7/15/25 | 728,648 | 725,180 |
| Drive Auto Receivables Trust | |
| Series 2021-2, Class D | | |
| 1.39%, due 3/15/29 | 1,890,000 | 1,770,101 |
| Series 2021-1, Class D | | |
| 1.45%, due 1/16/29 | 3,065,000 | 2,910,051 |
| DT Auto Owner Trust (a) | |
| Series 2021-4A, Class D | | |
| 1.99%, due 9/15/27 | 1,385,000 | 1,265,175 |
| Series 2021-3A, Class E | | |
| 2.65%, due 9/15/28 | 920,000 | 838,279 |
| Series 2020-3A, Class E | | |
| 3.62%, due 10/15/27 | 2,295,000 | 2,191,229 |
| Exeter Automobile Receivables Trust | |
| Series 2021-2A, Class D | | |
| 1.40%, due 4/15/27 | 1,605,000 | 1,492,965 |
| Series 2021-3A, Class D | | |
| 1.55%, due 6/15/27 | 2,710,000 | 2,483,640 |
| Series 2021-1A, Class E | | |
| 2.21%, due 2/15/28 (a) | 1,565,000 | 1,427,671 |
| Series 2021-3A, Class E | | |
| 3.04%, due 12/15/28 (a) | 3,790,000 | 3,395,704 |
| | Principal
Amount | Value |
| |
| Automobile Asset-Backed Securities (continued) |
| Flagship Credit Auto Trust (a) | |
| Series 2021-2, Class D | | |
| 1.59%, due 6/15/27 | $ 1,190,000 | $ 1,065,096 |
| Series 2021-3, Class D | | |
| 1.65%, due 9/15/27 | 1,537,000 | 1,362,476 |
| Series 2021-4, Class C | | |
| 1.96%, due 12/15/27 | 1,240,000 | 1,154,772 |
| Series 2021-4, Class D | | |
| 2.26%, due 12/15/27 | 3,507,000 | 3,139,553 |
| Series 2020-1, Class D | | |
| 2.48%, due 3/16/26 | 1,000,000 | 965,255 |
| Series 2020-1, Class E | | |
| 3.52%, due 6/15/27 | 2,590,000 | 2,385,729 |
| Series 2022-1, Class D | | |
| 3.64%, due 3/15/28 | 720,000 | 656,724 |
| Series 2019-2, Class E | | |
| 4.52%, due 12/15/26 | 1,315,000 | 1,270,224 |
| Series 2020-3, Class E | | |
| 4.98%, due 12/15/27 | 1,090,000 | 1,006,569 |
| Ford Credit Auto Owner Trust | |
| Series 2023-2, Class B | | |
| 5.92%, due 2/15/36 (a) | 1,618,000 | 1,569,928 |
| GLS Auto Receivables Issuer Trust (a) | |
| Series 2021-3A, Class D | | |
| 1.48%, due 7/15/27 | 2,635,000 | 2,409,631 |
| Series 2021-4A, Class D | | |
| 2.48%, due 10/15/27 | 1,650,000 | 1,520,316 |
| Series 2021-2A, Class E | | |
| 2.87%, due 5/15/28 | 2,340,000 | 2,136,295 |
| Series 2021-1A, Class E | | |
| 3.14%, due 1/18/28 | 1,080,000 | 1,016,548 |
| Series 2021-3A, Class E | | |
| 3.20%, due 10/16/28 | 2,485,000 | 2,259,121 |
| Series 2020-1A, Class D | | |
| 3.68%, due 11/16/26 | 1,070,000 | 1,041,336 |
| Hertz Vehicle Financing III LP (a) | |
| Series 2021-2A, Class C | | |
| 2.52%, due 12/27/27 | 3,285,000 | 2,847,565 |
| Series 2021-2A, Class D | | |
| 4.34%, due 12/27/27 | 2,450,000 | 2,122,338 |
| Hertz Vehicle Financing LLC | |
| Series 2021-1A, Class C | | |
| 2.05%, due 12/26/25 (a) | 870,000 | 827,711 |
| Santander Drive Auto Receivables Trust | |
| Series 2021-3, Class D | | |
| 1.33%, due 9/15/27 | 550,000 | 518,053 |
| Series 2021-4, Class D | | |
| 1.67%, due 10/15/27 | 2,385,000 | 2,212,434 |
The notes to the financial statements are an integral part of, and should be read in conjunction with, the financial statements.
11
Portfolio of Investments October 31, 2023†^ (continued)
| | Principal
Amount | Value |
| Asset-Backed Securities (continued) |
| Automobile Asset-Backed Securities (continued) |
| Santander Drive Auto Receivables Trust (continued) | |
| Series 2022-2, Class C | | |
| 3.76%, due 7/16/29 | $ 1,635,000 | $ 1,549,195 |
| | | 72,009,631 |
| Credit Card Asset-Backed Security 0.1% |
| Golden Credit Card Trust | |
| Series 2021-1A, Class C | | |
| 1.74%, due 8/15/28 (a) | 510,000 | 447,122 |
| Home Equity Asset-Backed Securities 0.1% |
| First NLC Trust | |
| Series 2007-1, Class A1 | | |
| 5.509% (1 Month SOFR + 0.184%), due 8/25/37 (a)(b) | 232,305 | 112,649 |
| GSAA Home Equity Trust | |
| Series 2007-8, Class A3 | | |
| 6.339% (1 Month SOFR + 1.014%), due 8/25/37 (b) | 29,657 | 28,620 |
| J.P. Morgan Mortgage Acquisition Trust | |
| Series 2007-HE1, Class AF1 | | |
| 4.285% (1 Month SOFR + 0.214%), due 3/25/47 (b) | 80,329 | 47,207 |
| Mastr Asset-Backed Securities Trust | |
| Series 2006-HE4, Class A1 | | |
| 5.539% (1 Month SOFR + 0.214%), due 11/25/36 (b) | 66,619 | 20,524 |
| Morgan Stanley ABS Capital I, Inc. Trust (b) | |
| Series 2007-HE4, Class A2A | | |
| 5.549% (1 Month SOFR + 0.224%), due 2/25/37 | 71,271 | 21,966 |
| Series 2007-HE7, Class M1 | | |
| 7.439% (1 Month SOFR + 2.114%), due 7/25/37 | 635,000 | 446,572 |
| | | 677,538 |
| Other Asset-Backed Securities 4.8% |
| American Airlines Pass-Through Trust | |
| Series 2019-1, Class B | | |
| 3.85%, due 2/15/28 | 716,624 | 623,139 |
| Series 2021-1, Class B | | |
| 3.95%, due 7/11/30 | 1,110,200 | 952,738 |
| Series 2016-1, Class A | | |
| 4.10%, due 1/15/28 | 850,237 | 755,102 |
| CF Hippolyta Issuer LLC (a) | |
| Series 2021-1A, Class A1 | | |
| 1.53%, due 3/15/61 | 527,771 | 462,062 |
| | Principal
Amount | Value |
| |
| Other Asset-Backed Securities (continued) |
| CF Hippolyta Issuer LLC (a) (continued) | |
| Series 2020-1, Class A1 | | |
| 1.69%, due 7/15/60 | $ 1,029,872 | $ 934,059 |
| Series 2021-1A, Class B1 | | |
| 1.98%, due 3/15/61 | 3,977,129 | 3,417,327 |
| Series 2020-1, Class A2 | | |
| 1.99%, due 7/15/60 | 1,530,495 | 1,275,386 |
| Series 2020-1, Class B1 | | |
| 2.28%, due 7/15/60 | 2,122,707 | 1,873,787 |
| Series 2020-1, Class B2 | | |
| 2.60%, due 7/15/60 | 2,401,537 | 1,882,478 |
| CVS Pass-Through Trust | |
| 5.789%, due 1/10/26 (a) | 17,364 | 17,102 |
| DB Master Finance LLC | |
| Series 2021-1A, Class A23 | | |
| 2.791%, due 11/20/51 (a) | 1,218,300 | 920,041 |
| DLLAA LLC | |
| Series 2023-1A, Class A3 | | |
| 5.64%, due 2/22/28 (a) | 975,000 | 965,436 |
| FirstKey Homes Trust | |
| Series 2020-SFR2, Class E | | |
| 2.668%, due 10/19/37 (a) | 1,650,000 | 1,506,813 |
| Hilton Grand Vacations Trust | |
| Series 2019-AA, Class B | | |
| 2.54%, due 7/25/33 (a) | 853,559 | 797,487 |
| Home Partners of America Trust | |
| Series 2021-2, Class B | | |
| 2.302%, due 12/17/26 (a) | 1,699,077 | 1,493,426 |
| Mosaic Solar Loan Trust | |
| Series 2021-2A, Class B | | |
| 2.09%, due 4/22/47 (a) | 1,582,485 | 1,137,581 |
| MVW LLC | |
| Series 2021-1WA, Class B | | |
| 1.44%, due 1/22/41 (a) | 978,231 | 882,601 |
| Navient Private Education Refi Loan Trust (a) | |
| Series 2021-BA, Class A | | |
| 0.94%, due 7/15/69 | 664,462 | 564,215 |
| Series 2020-GA, Class B | | |
| 2.50%, due 9/16/69 | 1,145,000 | 820,056 |
| Series 2020-HA, Class B | | |
| 2.78%, due 1/15/69 | 1,820,000 | 1,402,114 |
| New Economy Assets Phase 1 Sponsor LLC (a) | |
| Series 2021-1, Class A1 | | |
| 1.91%, due 10/20/61 | 1,260,000 | 1,077,479 |
| Series 2021-1, Class B1 | | |
| 2.41%, due 10/20/61 | 1,350,000 | 1,124,877 |
The notes to the financial statements are an integral part of, and should be read in conjunction with, the financial statements.
| 12 | MainStay MacKay Strategic Bond Fund |
| | Principal
Amount | Value |
| Asset-Backed Securities (continued) |
| Other Asset-Backed Securities (continued) |
| PFS Financing Corp. | |
| Series 2022-D, Class B | | |
| 4.90%, due 8/15/27 (a) | $ 2,360,000 | $ 2,277,396 |
| Progress Residential Trust | |
| Series 2021-SFR4, Class B | | |
| 1.808%, due 5/17/38 (a) | 1,340,000 | 1,184,923 |
| Sierra Timeshare Receivables Funding LLC | |
| Series 2023-2A, Class C | | |
| 7.30%, due 4/20/40 (a) | 780,397 | 780,829 |
| Taco Bell Funding LLC | |
| Series 2021-1A, Class A23 | | |
| 2.542%, due 8/25/51 (a) | 1,066,012 | 800,789 |
| Tricon American Homes | |
| Series 2020-SFR1, Class C | | |
| 2.249%, due 7/17/38 (a) | 1,500,000 | 1,347,117 |
| United Airlines Pass-Through Trust | |
| Series 2023-1, Class A | | |
| 5.80%, due 1/15/36 | 865,000 | 810,599 |
| Series 2020-1, Class A | | |
| 5.875%, due 10/15/27 | 986,650 | 971,396 |
| | | 33,058,355 |
Total Asset-Backed Securities
(Cost $112,712,846) | | 106,192,646 |
| Corporate Bonds 31.0% |
| Agriculture 0.2% |
| BAT Capital Corp. | | |
| 3.734%, due 9/25/40 | 1,095,000 | 694,396 |
| BAT International Finance plc | | |
| 4.448%, due 3/16/28 | 755,000 | 695,639 |
| | | 1,390,035 |
| Airlines 1.1% |
| American Airlines, Inc. (a) | | |
| 5.50%, due 4/20/26 | 916,667 | 891,411 |
| 5.75%, due 4/20/29 | 2,450,000 | 2,210,034 |
| Delta Air Lines, Inc. (a) | | |
| 4.50%, due 10/20/25 | 561,006 | 545,284 |
| 4.75%, due 10/20/28 | 2,665,000 | 2,505,051 |
| Mileage Plus Holdings LLC | | |
| 6.50%, due 6/20/27 (a) | 1,140,000 | 1,126,181 |
| | | 7,277,961 |
| Auto Manufacturers 2.0% |
| Ford Motor Credit Co. LLC | | |
| 2.30%, due 2/10/25 | 1,005,000 | 949,031 |
| | Principal
Amount | Value |
| |
| Auto Manufacturers (continued) |
| Ford Motor Credit Co. LLC (continued) | | |
| 4.125%, due 8/17/27 | $ 1,295,000 | $ 1,175,741 |
| 6.80%, due 5/12/28 (c) | 2,105,000 | 2,098,985 |
| 6.95%, due 3/6/26 | 1,195,000 | 1,197,063 |
| 7.20%, due 6/10/30 | 960,000 | 959,347 |
| General Motors Co. | | |
| 5.60%, due 10/15/32 | 625,000 | 570,710 |
| General Motors Financial Co., Inc. | | |
| 2.35%, due 1/8/31 | 1,178,000 | 877,134 |
| 2.70%, due 6/10/31 | 1,525,000 | 1,146,838 |
| 4.30%, due 4/6/29 | 1,090,000 | 968,523 |
| Nissan Motor Acceptance Co. LLC (a) | | |
| 1.85%, due 9/16/26 | 3,610,000 | 3,124,977 |
| 7.05%, due 9/15/28 | 975,000 | 962,942 |
| | | 14,031,291 |
| Banks 10.4% |
| Banco Santander SA | | |
| 4.175% (1 Year Treasury Constant Maturity Rate + 2.00%), due 3/24/28 (b) | 2,400,000 | 2,197,618 |
| 6.921%, due 8/8/33 | 1,000,000 | 928,779 |
| Bank of America Corp. | | |
| 2.087%, due 6/14/29 (d) | 1,275,000 | 1,052,698 |
| 3.384%, due 4/2/26 (d) | 1,700,000 | 1,628,858 |
| Series MM | | |
| 4.30%, due 1/28/25 (d)(e) | 1,516,000 | 1,362,162 |
| 8.57%, due 11/15/24 | 1,645,000 | 1,677,754 |
| Barclays plc (b)(e) | | |
| 4.375% (5 Year Treasury Constant Maturity Rate + 3.41%), due 3/15/28 | 2,380,000 | 1,626,656 |
| 8.00% (5 Year Treasury Constant Maturity Rate + 5.431%), due 3/15/29 | 1,315,000 | 1,163,117 |
| BNP Paribas SA (a) | | |
| 3.052%, due 1/13/31 (d) | 1,605,000 | 1,292,891 |
| 4.625% (5 Year Treasury Constant Maturity Rate + 3.196%), due 1/12/27 (b)(e) | 1,315,000 | 1,036,949 |
| 4.625% (5 Year Treasury Constant Maturity Rate + 3.34%), due 2/25/31 (b)(e) | 1,610,000 | 1,116,492 |
| 7.75% (5 Year Treasury Constant Maturity Rate + 4.899%), due 8/16/29 (b)(e) | 960,000 | 890,086 |
| BPCE SA (a) | | |
| 2.045%, due 10/19/27 (d) | 2,240,000 | 1,954,876 |
The notes to the financial statements are an integral part of, and should be read in conjunction with, the financial statements.
13
Portfolio of Investments October 31, 2023†^ (continued)
| | Principal
Amount | Value |
| Corporate Bonds (continued) |
| Banks (continued) |
| BPCE SA (a) (continued) | | |
| 5.125%, due 1/18/28 | $ 570,000 | $ 543,252 |
| 6.714%, due 10/19/29 (d) | 665,000 | 655,625 |
| Citigroup, Inc. | | |
| 2.52%, due 11/3/32 (d) | 2,115,000 | 1,573,439 |
| Series Y | | |
| 4.15% (5 Year Treasury Constant Maturity Rate + 3.00%), due 11/15/26 (b)(e) | 1,395,000 | 1,086,167 |
| Series M | | |
| 6.30%, due 5/15/24 (d)(e) | 3,260,000 | 3,161,268 |
| Credit Agricole SA | | |
| 4.75% (5 Year Treasury Constant Maturity Rate + 3.237%), due 3/23/29 (a)(b)(e) | 2,370,000 | 1,754,290 |
| Deutsche Bank AG | | |
| 3.035%, due 5/28/32 (d) | 460,000 | 342,657 |
| 4.875% (USISDA05 + 2.553%), due 12/1/32 (b) | 3,390,000 | 2,854,472 |
| Fifth Third Bank NA | | |
| 3.85%, due 3/15/26 | 1,400,000 | 1,289,831 |
| First Horizon Bank | | |
| 5.75%, due 5/1/30 | 1,673,000 | 1,415,954 |
| Goldman Sachs Group, Inc. (The) | | |
| 1.948%, due 10/21/27 (d) | 3,260,000 | 2,859,071 |
| Series V | | |
| 4.125% (5 Year Treasury Constant Maturity Rate + 2.949%), due 11/10/26 (b)(e) | 980,000 | 776,469 |
| Intesa Sanpaolo SpA | | |
| 4.198% (1 Year Treasury Constant Maturity Rate + 2.60%), due 6/1/32 (a)(b) | 3,430,000 | 2,438,021 |
| JPMorgan Chase & Co. | | |
| Series HH | | |
| 4.60%, due 2/1/25 (d)(e) | 389,000 | 362,417 |
| KeyBank NA | | |
| 4.15%, due 8/8/25 | 1,585,000 | 1,474,065 |
| Lloyds Banking Group plc | | |
| 4.582%, due 12/10/25 | 1,365,000 | 1,298,206 |
| 4.65%, due 3/24/26 | 1,985,000 | 1,879,895 |
| 4.976% (1 Year Treasury Constant Maturity Rate + 2.30%), due 8/11/33 (b) | 995,000 | 863,720 |
| Macquarie Group Ltd. | | |
| 2.871%, due 1/14/33 (a)(d) | 1,490,000 | 1,101,148 |
| | Principal
Amount | Value |
| |
| Banks (continued) |
| Morgan Stanley (d) | | |
| 2.484%, due 9/16/36 | $ 2,170,000 | $ 1,535,090 |
| 2.511%, due 10/20/32 | 3,225,000 | 2,412,184 |
| NatWest Group plc (b) | | |
| 3.073% (1 Year Treasury Constant Maturity Rate + 2.55%), due 5/22/28 | 2,145,000 | 1,897,357 |
| 4.60% (5 Year Treasury Constant Maturity Rate + 3.10%), due 6/28/31 (e) | 2,650,000 | 1,709,457 |
| 5.847% (1 Year Treasury Constant Maturity Rate + 1.35%), due 3/2/27 | 1,595,000 | 1,568,298 |
| Santander Holdings USA, Inc. | | |
| 6.499%, due 3/9/29 (d) | 1,315,000 | 1,271,834 |
| Societe Generale SA (a)(b)(e) | | |
| 4.75% (5 Year Treasury Constant Maturity Rate + 3.931%), due 5/26/26 | 1,240,000 | 994,184 |
| 5.375% (5 Year Treasury Constant Maturity Rate + 4.514%), due 11/18/30 | 1,920,000 | 1,377,036 |
| Synchrony Bank | | |
| 5.40%, due 8/22/25 | 1,805,000 | 1,723,767 |
| UBS Group AG (a) | | |
| 3.091%, due 5/14/32 (d) | 885,000 | 680,702 |
| 4.375% (5 Year Treasury Constant Maturity Rate + 3.313%), due 2/10/31 (b)(e) | 2,555,000 | 1,773,818 |
| 6.442%, due 8/11/28 (d) | 1,325,000 | 1,311,200 |
| Wells Fargo & Co. | | |
| 3.35%, due 3/2/33 (d) | 2,330,000 | 1,834,564 |
| 3.584%, due 5/22/28 (d) | 380,000 | 345,891 |
| 5.557%, due 7/25/34 (d) | 275,000 | 251,733 |
| Series S | | |
| 5.90% (3 Month LIBOR + 3.11%), due 6/15/24 (b)(e) | 3,295,000 | 3,239,991 |
| Westpac Banking Corp. | | |
| 3.02% (5 Year Treasury Constant Maturity Rate + 1.53%), due 11/18/36 (b) | 1,692,000 | 1,217,051 |
| | | 70,803,060 |
| Building Materials 0.4% |
| CEMEX Materials LLC | | |
| 7.70%, due 7/21/25 (a) | 2,490,000 | 2,512,111 |
The notes to the financial statements are an integral part of, and should be read in conjunction with, the financial statements.
| 14 | MainStay MacKay Strategic Bond Fund |
| | Principal
Amount | Value |
| Corporate Bonds (continued) |
| Chemicals 0.8% |
| Alpek SAB de CV | | |
| 3.25%, due 2/25/31 (a) | $ 1,255,000 | $ 958,035 |
| Braskem Netherlands Finance BV (a) | | |
| 4.50%, due 1/10/28 | 1,650,000 | 1,392,178 |
| 8.50%, due 1/12/31 | 940,000 | 880,028 |
| Sasol Financing USA LLC | | |
| 5.875%, due 3/27/24 | 2,075,000 | 2,055,018 |
| | | 5,285,259 |
| Commercial Services 0.3% |
| Ashtead Capital, Inc. | | |
| 4.25%, due 11/1/29 (a) | 1,640,000 | 1,429,536 |
| California Institute of Technology | | |
| 3.65%, due 9/1/2119 | 1,118,000 | 646,573 |
| | | 2,076,109 |
| Computers 0.4% |
| Dell International LLC | | |
| 8.10%, due 7/15/36 | 879,000 | 953,316 |
| NCR Voyix Corp. | | |
| 5.00%, due 10/1/28 (a) | 2,339,000 | 2,019,493 |
| | | 2,972,809 |
| Diversified Financial Services 3.3% |
| AerCap Ireland Capital DAC | | |
| 3.00%, due 10/29/28 | 1,650,000 | 1,389,704 |
| Air Lease Corp. | | |
| 2.30%, due 2/1/25 | 3,275,000 | 3,108,933 |
| 3.25%, due 3/1/25 | 4,000,000 | 3,830,531 |
| Aircastle Ltd. | | |
| 5.25% (5 Year Treasury Constant Maturity Rate + 4.41%), due 6/15/26 (a)(b)(e) | 1,770,000 | 1,387,941 |
| Ally Financial, Inc. | | |
| 5.75%, due 11/20/25 | 3,820,000 | 3,649,121 |
| 8.00%, due 11/1/31 | 1,890,000 | 1,844,721 |
| Avolon Holdings Funding Ltd. | | |
| 3.25%, due 2/15/27 (a) | 2,125,000 | 1,871,006 |
| Banco BTG Pactual SA | | |
| 2.75%, due 1/11/26 (a) | 1,585,000 | 1,458,210 |
| Capital One Financial Corp. | | |
| 6.312%, due 6/8/29 (d) | 1,860,000 | 1,780,900 |
| Nomura Holdings, Inc. | | |
| 5.099%, due 7/3/25 | 1,660,000 | 1,628,096 |
| OneMain Finance Corp. | | |
| 3.50%, due 1/15/27 | 1,100,000 | 929,500 |
| | | 22,878,663 |
| | Principal
Amount | Value |
| |
| Electric 2.7% |
| AEP Texas, Inc. | | |
| 4.70%, due 5/15/32 (c) | $ 1,175,000 | $ 1,042,915 |
| American Electric Power Co., Inc. | | |
| 5.625%, due 3/1/33 | 1,765,000 | 1,656,672 |
| Calpine Corp. | | |
| 5.125%, due 3/15/28 (a) | 1,185,000 | 1,060,494 |
| Dominion Energy, Inc. | | |
| Series C | | |
| 4.35% (5 Year Treasury Constant Maturity Rate + 3.195%), due 1/15/27 (b)(e) | 780,000 | 634,647 |
| Edison International | | |
| Series B | | |
| 5.00% (5 Year Treasury Constant Maturity Rate + 3.901%), due 12/15/26 (b)(e) | 2,690,000 | 2,393,997 |
| Ohio Power Co. | | |
| Series R | | |
| 2.90%, due 10/1/51 | 955,000 | 533,354 |
| Pacific Gas and Electric Co. | | |
| 3.50%, due 8/1/50 | 1,855,000 | 1,032,329 |
| Sempra | | |
| 4.125% (5 Year Treasury Constant Maturity Rate + 2.868%), due 4/1/52 (b) | 2,150,000 | 1,656,090 |
| Southern California Edison Co. | | |
| 5.30%, due 3/1/28 | 905,000 | 884,786 |
| Virginia Electric and Power Co. | | |
| 5.70%, due 8/15/53 | 1,580,000 | 1,398,403 |
| WEC Energy Group, Inc. | | |
| 7.739% (3 Month SOFR + 2.374%), due 5/15/67 (b) | 5,495,000 | 4,777,350 |
| Xcel Energy, Inc. | | |
| 5.45%, due 8/15/33 | 1,330,000 | 1,239,241 |
| | | 18,310,278 |
| Electronics 0.3% |
| Arrow Electronics, Inc. | | |
| 6.125%, due 3/1/26 | 1,760,000 | 1,746,978 |
| Environmental Control 0.1% |
| Covanta Holding Corp. | | |
| 4.875%, due 12/1/29 (a) | 950,000 | 741,000 |
| Food 0.6% |
| JBS USA LUX SA | | |
| 5.75%, due 4/1/33 | 2,140,000 | 1,890,088 |
The notes to the financial statements are an integral part of, and should be read in conjunction with, the financial statements.
15
Portfolio of Investments October 31, 2023†^ (continued)
| | Principal
Amount | Value |
| Corporate Bonds (continued) |
| Food (continued) |
| Minerva Luxembourg SA | | |
| 8.875%, due 9/13/33 (a)(c) | $ 1,085,000 | $ 1,064,873 |
| Smithfield Foods, Inc. | | |
| 3.00%, due 10/15/30 (a) | 1,520,000 | 1,149,937 |
| | | 4,104,898 |
| Gas 0.8% |
| Brooklyn Union Gas Co. (The) | | |
| 6.388%, due 9/15/33 (a) | 1,325,000 | 1,265,100 |
| National Fuel Gas Co. | | |
| 2.95%, due 3/1/31 | 1,695,000 | 1,288,477 |
| 5.50%, due 10/1/26 | 1,395,000 | 1,364,028 |
| Piedmont Natural Gas Co., Inc. | | |
| 5.05%, due 5/15/52 | 1,070,000 | 834,741 |
| Southern Co. Gas Capital Corp. | | |
| Series 21A | | |
| 3.15%, due 9/30/51 | 1,500,000 | 844,237 |
| | | 5,596,583 |
| Household Products & Wares 0.4% |
| Kronos Acquisition Holdings, Inc. | | |
| 5.00%, due 12/31/26 (a) | 2,770,000 | 2,505,608 |
| Insurance 0.8% |
| Lincoln National Corp. | | |
| 7.996% (3 Month LIBOR + 2.358%), due 5/17/66 (b) | 3,537,000 | 2,290,207 |
| NMI Holdings, Inc. | | |
| 7.375%, due 6/1/25 (a) | 685,000 | 685,709 |
| Protective Life Corp. | | |
| 8.45%, due 10/15/39 | 2,476,000 | 2,774,974 |
| | | 5,750,890 |
| Media 0.2% |
| CCO Holdings LLC | | |
| 4.75%, due 3/1/30 (a) | 825,000 | 680,561 |
| DISH DBS Corp. | | |
| 5.75%, due 12/1/28 (a) | 1,250,000 | 907,813 |
| | | 1,588,374 |
| Miscellaneous—Manufacturing 0.3% |
| Textron Financial Corp. | | |
| 7.361% (3 Month SOFR + 1.997%), due 2/15/42 (a)(b) | 2,905,000 | 2,265,988 |
| | Principal
Amount | Value |
| |
| Oil & Gas 0.1% |
| Gazprom PJSC Via Gaz Capital SA | | |
| 7.288%, due 8/16/37 (a)(f) | $ 850,000 | $ 658,750 |
| Packaging & Containers 0.3% |
| Berry Global, Inc. | | |
| 4.875%, due 7/15/26 (a) | 1,240,000 | 1,183,196 |
| Owens-Brockway Glass Container, Inc. | | |
| 6.625%, due 5/13/27 (a) | 840,000 | 798,000 |
| | | 1,981,196 |
| Pharmaceuticals 0.3% |
| Teva Pharmaceutical Finance Netherlands III BV | | |
| 3.15%, due 10/1/26 | 221,000 | 194,574 |
| 4.75%, due 5/9/27 | 2,345,000 | 2,129,116 |
| 7.875%, due 9/15/29 | 10,000 | 9,861 |
| | | 2,333,551 |
| Pipelines 3.4% |
| Cheniere Corpus Christi Holdings LLC | | |
| 2.742%, due 12/31/39 | 1,710,000 | 1,232,806 |
| CNX Midstream Partners LP | | |
| 4.75%, due 4/15/30 (a) | 2,570,000 | 2,117,365 |
| DCP Midstream Operating LP | | |
| 3.25%, due 2/15/32 | 3,090,000 | 2,429,855 |
| DT Midstream, Inc. | | |
| 4.30%, due 4/15/32 (a) | 1,715,000 | 1,444,682 |
| Enbridge, Inc. | | |
| 5.70%, due 3/8/33 | 1,250,000 | 1,168,792 |
| 5.969%, due 3/8/26 | 2,355,000 | 2,338,593 |
| Energy Transfer LP | | |
| Series H | | |
| 6.50% (5 Year Treasury Constant Maturity Rate + 5.694%), due 11/15/26 (b)(e) | 2,520,000 | 2,282,313 |
| EnLink Midstream LLC | | |
| 5.625%, due 1/15/28 (a) | 750,000 | 707,194 |
| Flex Intermediate Holdco LLC | | |
| 3.363%, due 6/30/31 (a) | 1,540,000 | 1,160,638 |
| Hess Midstream Operations LP | | |
| 5.625%, due 2/15/26 (a) | 367,000 | 355,417 |
| Kinder Morgan, Inc. | | |
| 7.75%, due 1/15/32 | 2,035,000 | 2,159,847 |
| MPLX LP | | |
| 4.00%, due 3/15/28 | 560,000 | 513,023 |
| Plains All American Pipeline LP | | |
| 3.80%, due 9/15/30 | 1,040,000 | 876,400 |
The notes to the financial statements are an integral part of, and should be read in conjunction with, the financial statements.
| 16 | MainStay MacKay Strategic Bond Fund |
| | Principal
Amount | Value |
| Corporate Bonds (continued) |
| Pipelines (continued) |
| Sabine Pass Liquefaction LLC | | |
| 5.75%, due 5/15/24 | $ 346,000 | $ 345,447 |
| Targa Resources Corp. | | |
| 4.20%, due 2/1/33 | 725,000 | 600,925 |
| Venture Global LNG, Inc. | | |
| 9.875%, due 2/1/32 (a) | 1,015,000 | 1,029,198 |
| Western Midstream Operating LP | | |
| 5.25%, due 2/1/50 (g) | 1,800,000 | 1,330,128 |
| Williams Cos., Inc. (The) | | |
| 3.50%, due 10/15/51 | 1,425,000 | 861,247 |
| | | 22,953,870 |
| Real Estate Investment Trusts 0.8% |
| GLP Capital LP | | |
| 3.35%, due 9/1/24 | 1,535,000 | 1,490,812 |
| Iron Mountain, Inc. | | |
| 4.875%, due 9/15/29 (a) | 1,686,000 | 1,468,609 |
| Starwood Property Trust, Inc. | | |
| 3.625%, due 7/15/26 (a) | 3,172,000 | 2,801,098 |
| | | 5,760,519 |
| Retail 0.3% |
| AutoNation, Inc. | | |
| 4.75%, due 6/1/30 | 1,116,000 | 977,477 |
| Nordstrom, Inc. | | |
| 4.25%, due 8/1/31 | 1,635,000 | 1,197,768 |
| | | 2,175,245 |
| Semiconductors 0.3% |
| Broadcom, Inc. (a) | | |
| 3.469%, due 4/15/34 | 2,040,000 | 1,554,357 |
| 3.75%, due 2/15/51 | 620,000 | 395,329 |
| | | 1,949,686 |
| Telecommunications 0.4% |
| Altice France SA | | |
| 5.125%, due 7/15/29 (a) | 2,405,000 | 1,646,611 |
| AT&T, Inc. | | |
| 3.50%, due 9/15/53 | 1,485,000 | 874,441 |
| | | 2,521,052 |
Total Corporate Bonds
(Cost $246,300,376) | | 212,171,764 |
| Foreign Government Bonds 1.6% |
| Brazil 0.1% |
| Brazil Government Bond | | |
| 3.75%, due 9/12/31 | 525,000 | 435,223 |
| | Principal
Amount | Value |
| |
| Chile 0.3% |
| Empresa Nacional del Petroleo | | |
| 3.45%, due 9/16/31 (a) | $ 2,540,000 | $ 1,970,418 |
| Colombia 0.3% |
| Colombia Government Bond | | |
| 3.25%, due 4/22/32 | 2,335,000 | 1,670,520 |
| 4.50%, due 1/28/26 (c) | 500,000 | 478,079 |
| | | 2,148,599 |
| Mexico 0.9% |
| Comision Federal de Electricidad (a) | | |
| 3.875%, due 7/26/33 | 2,385,000 | 1,728,771 |
| 4.677%, due 2/9/51 | 1,855,000 | 1,102,193 |
| Petroleos Mexicanos | | |
| 6.50%, due 3/13/27 | 2,535,000 | 2,236,125 |
| 6.75%, due 9/21/47 | 1,980,000 | 1,121,478 |
| | | 6,188,567 |
Total Foreign Government Bonds
(Cost $14,480,518) | | 10,742,807 |
| Loan Assignments 0.2% |
| Diversified/Conglomerate Service 0.2% |
| TruGreen LP (b) | |
| First Lien Second Refinancing Term Loan | |
| 9.424% (1 Month SOFR + 4.00%), due 11/2/27 | 760,212 | 711,558 |
| Second Lien Initial Term Loan | |
| 14.145% (3 Month SOFR + 8.50%), due 11/2/28 | 450,000 | 286,500 |
| | | 998,058 |
Total Loan Assignments
(Cost $1,199,105) | | 998,058 |
| Mortgage-Backed Securities 34.5% |
| Agency (Collateralized Mortgage Obligations) 7.7% |
| FHLMC | |
| REMIC, Series 4660 | | |
| (zero coupon), due 1/15/33 | 1,921,345 | 1,396,016 |
| REMIC, Series 5326, Class QO | | |
| (zero coupon), due 9/25/50 | 2,495,068 | 1,630,443 |
| REMIC, Series 5021, Class SA | | |
| (zero coupon) (SOFR 30A + 3.55%), due 10/25/50 (b)(h) | 3,217,642 | 32,363 |
The notes to the financial statements are an integral part of, and should be read in conjunction with, the financial statements.
17
Portfolio of Investments October 31, 2023†^ (continued)
| | Principal
Amount | Value |
| Mortgage-Backed Securities (continued) |
| Agency (Collateralized Mortgage Obligations) (continued) |
| FHLMC (continued) | |
| REMIC, Series 5200, Class SA | | |
| (zero coupon) (SOFR 30A + 3.50%), due 2/25/52 (b)(h) | $ 2,611,742 | $ 23,844 |
| REMIC, Series 5326 | | |
| (zero coupon), due 8/25/53 | 778,552 | 542,021 |
| REMIC, Series 5351, Class EO | | |
| (zero coupon), due 10/25/53 | 3,055,000 | 2,023,598 |
| REMIC, Series 4839, Class WO | | |
| (zero coupon), due 8/15/56 | 1,037,183 | 639,899 |
| REMIC, Series 4993, Class KS | | |
| 0.615% (SOFR 30A + 5.936%), due 7/25/50 (b)(h) | 4,724,683 | 456,812 |
| REMIC, Series 5031, Class IQ | | |
| 2.50%, due 10/25/50 (h) | 1,578,848 | 212,345 |
| REMIC, Series 5038, Class IB | | |
| 2.50%, due 10/25/50 (h) | 1,032,695 | 147,502 |
| REMIC, Series 5149, Class LI | | |
| 2.50%, due 10/25/51 (h) | 3,922,197 | 485,537 |
| REMIC, Series 5205, Class KI | | |
| 3.00%, due 12/25/48 (h) | 1,759,874 | 198,584 |
| REMIC, Series 5152, Class BI | | |
| 3.00%, due 7/25/50 (h) | 3,537,865 | 593,413 |
| REMIC, Series 5023, Class LI | | |
| 3.00%, due 10/25/50 (h) | 1,319,235 | 209,768 |
| REMIC, Series 5094, Class IP | | |
| 3.00%, due 4/25/51 (h) | 1,722,168 | 268,032 |
| REMIC, Series 5155, Class KI | | |
| 3.00%, due 10/25/51 (h) | 4,389,313 | 610,635 |
| REMIC, Series 5160 | | |
| 3.00%, due 10/25/51 (h) | 2,181,285 | 267,906 |
| REMIC, Series 5167, Class GI | | |
| 3.00%, due 11/25/51 (h) | 4,112,853 | 637,475 |
| REMIC, Series 5191 | | |
| 3.50%, due 9/25/50 (h) | 2,203,434 | 409,433 |
| REMIC, Series 5036 | | |
| 3.50%, due 11/25/50 (h) | 2,591,932 | 507,131 |
| REMIC, Series 5040 | | |
| 3.50%, due 11/25/50 (h) | 1,392,871 | 223,811 |
| FHLMC, Strips | |
| Series 311 | | |
| (zero coupon), due 8/15/43 | 708,164 | 495,759 |
| Series 311, Class S1 | | |
| 0.515% (SOFR 30A + 5.836%), due 8/15/43 (b)(h) | 2,173,019 | 169,097 |
| Series 389, Class C35 | | |
| 2.00%, due 6/15/52 (h) | 3,548,702 | 430,280 |
| | Principal
Amount | Value |
| |
| Agency (Collateralized Mortgage Obligations) (continued) |
| FNMA | |
| REMIC, Series 2022-3, Class YS | | |
| (zero coupon) (SOFR 30A + 2.55%), due 2/25/52 (b)(h) | $ 8,043,156 | $ 14,955 |
| REMIC, Series 2022-5, Class SN | | |
| (zero coupon) (SOFR 30A + 1.80%), due 2/25/52 (b)(h) | 1,500,149 | 624 |
| REMIC, Series 2023-41 | | |
| (zero coupon), due 9/25/53 | 1,225,336 | 856,288 |
| REMIC, Series 2023-45 | | |
| (zero coupon), due 10/25/53 | 1,522,585 | 1,055,413 |
| REMIC, Series 2022-10, Class SA | | |
| 0.429% (SOFR 30A + 5.75%), due 2/25/52 (b)(h) | 2,341,046 | 211,716 |
| REMIC, Series 2021-40, Class SI | | |
| 0.515% (SOFR 30A + 5.836%), due 9/25/47 (b)(h) | 2,825,592 | 201,892 |
| REMIC, Series 2016-57, Class SN | | |
| 0.615% (SOFR 30A + 5.936%), due 6/25/46 (b)(h) | 2,153,513 | 158,783 |
| REMIC, Series 2019-32, Class SB | | |
| 0.615% (SOFR 30A + 5.936%), due 6/25/49 (b)(h) | 1,673,477 | 123,043 |
| REMIC, Series 2020-23, Class PS | | |
| 0.615% (SOFR 30A + 5.936%), due 2/25/50 (b)(h) | 2,617,861 | 222,656 |
| REMIC, Series 2016-19, Class SD | | |
| 0.665% (SOFR 30A + 5.986%), due 4/25/46 (b)(h) | 4,776,929 | 267,020 |
| REMIC, Series 2021-10, Class LI | | |
| 2.50%, due 3/25/51 (h) | 1,558,438 | 220,124 |
| REMIC, Series 2021-12, Class JI | | |
| 2.50%, due 3/25/51 (h) | 1,900,389 | 300,352 |
| REMIC, Series 2021-95, Class KI | | |
| 2.50%, due 4/25/51 (h) | 5,488,108 | 758,698 |
| REMIC, Series 2021-54, Class HI | | |
| 2.50%, due 6/25/51 (h) | 738,588 | 96,001 |
| REMIC, Series 2021-85, Class BI | | |
| 3.00%, due 12/25/51 (h) | 3,908,911 | 642,362 |
| REMIC, Series 2021-8, Class ID | | |
| 3.50%, due 3/25/51 (h) | 2,468,498 | 490,285 |
| REMIC, Series 2020-10, Class DA | | |
| 3.50%, due 3/25/60 | 1,504,762 | 1,227,422 |
| REMIC, Series 2021-81, Class SA | | |
| 9.365% (SOFR 30A + 2.60%), due 12/25/51 (b)(h) | 13,879,561 | 31,852 |
The notes to the financial statements are an integral part of, and should be read in conjunction with, the financial statements.
| 18 | MainStay MacKay Strategic Bond Fund |
| | Principal
Amount | Value |
| Mortgage-Backed Securities (continued) |
| Agency (Collateralized Mortgage Obligations) (continued) |
| FNMA, Strips (h) | |
| REMIC, Series 426, Class C32 | | |
| 1.50%, due 2/25/52 | $ 6,855,198 | $ 639,363 |
| REMIC, Series 427, Class C77 | | |
| 2.50%, due 9/25/51 | 4,455,243 | 646,588 |
| GNMA | |
| Series 2020-1, Class YS | | |
| (zero coupon) (1 Month SOFR + 2.716%), due 1/20/50 (b)(h) | 3,634,578 | 12,369 |
| Series 2020-129, Class SB | | |
| (zero coupon) (1 Month SOFR + 3.086%), due 9/20/50 (b)(h) | 5,080,111 | 24,216 |
| Series 2021-97, Class SD | | |
| (zero coupon) (SOFR 30A + 2.60%), due 6/20/51 (b)(h) | 11,710,745 | 37,622 |
| Series 2021-158, Class SB | | |
| (zero coupon) (SOFR 30A + 3.70%), due 9/20/51 (b)(h) | 3,888,818 | 52,065 |
| Series 2021-205, Class DS | | |
| (zero coupon) (SOFR 30A + 3.20%), due 11/20/51 (b)(h) | 8,985,960 | 44,566 |
| Series 2021-213, Class ES | | |
| (zero coupon) (SOFR 30A + 1.70%), due 12/20/51 (b)(h) | 12,139,361 | 4,342 |
| Series 2022-19, Class SG | | |
| (zero coupon) (SOFR 30A + 2.45%), due 1/20/52 (b)(h) | 6,955,111 | 13,147 |
| Series 2022-24, Class SC | | |
| (zero coupon) (SOFR 30A + 2.37%), due 2/20/52 (b)(h) | 47,050,574 | 68,110 |
| Series 2022-121, Class SG | | |
| (zero coupon) (SOFR 30A + 3.97%), due 7/20/52 (b)(h) | 9,160,904 | 98,255 |
| Series 2023-56 | | |
| (zero coupon), due 7/20/52 | 2,023,273 | 1,794,830 |
| Series 2023-66, Class OQ | | |
| (zero coupon), due 7/20/52 | 1,938,459 | 1,418,939 |
| Series 2023-53 | | |
| (zero coupon), due 4/20/53 | 914,486 | 624,906 |
| Series 2023-80, Class SA | | |
| (zero coupon) (SOFR 30A + 5.25%), due 6/20/53 (b)(h) | 9,351,782 | 272,235 |
| Series 2023-101, Class EO | | |
| (zero coupon), due 7/20/53 | 1,334,638 | 1,055,572 |
| Series 2023-60, Class ES | | |
| 0.557% (SOFR 30A + 11.20%), due 4/20/53 (b) | 2,240,787 | 1,939,005 |
| | Principal
Amount | Value |
| |
| Agency (Collateralized Mortgage Obligations) (continued) |
| GNMA (continued) | |
| Series 2020-34, Class SC | | |
| 0.596% (1 Month SOFR + 5.936%), due 3/20/50 (b)(h) | $ 2,188,236 | $ 193,650 |
| Series 2020-146, Class SA | | |
| 0.846% (1 Month SOFR + 6.186%), due 10/20/50 (b)(h) | 2,678,346 | 264,732 |
| Series 2020-167, Class SN | | |
| 0.846% (1 Month SOFR + 6.186%), due 11/20/50 (b)(h) | 1,399,369 | 130,039 |
| Series 2021-179, Class SA | | |
| 0.846% (1 Month SOFR + 6.186%), due 11/20/50 (b)(h) | 4,135,421 | 392,176 |
| Series 2020-189, Class NS | | |
| 0.846% (1 Month SOFR + 6.186%), due 12/20/50 (b)(h) | 4,393,263 | 447,481 |
| Series 2020-189, Class SU | | |
| 0.846% (1 Month SOFR + 6.186%), due 12/20/50 (b)(h) | 871,055 | 84,241 |
| Series 2021-46, Class TS | | |
| 0.846% (1 Month SOFR + 6.186%), due 3/20/51 (b)(h) | 2,018,025 | 198,669 |
| Series 2021-57, Class SA | | |
| 0.846% (1 Month SOFR + 6.186%), due 3/20/51 (b)(h) | 3,187,643 | 310,500 |
| Series 2021-57, Class SD | | |
| 0.846% (1 Month SOFR + 6.186%), due 3/20/51 (b)(h) | 4,193,944 | 404,939 |
| Series 2021-96, Class NS | | |
| 0.846% (1 Month SOFR + 6.186%), due 6/20/51 (b)(h) | 6,018,955 | 578,828 |
| Series 2021-96, Class SN | | |
| 0.846% (1 Month SOFR + 6.186%), due 6/20/51 (b)(h) | 3,574,304 | 332,060 |
| Series 2021-122, Class HS | | |
| 0.846% (1 Month SOFR + 6.186%), due 7/20/51 (b)(h) | 3,337,805 | 350,802 |
| Series 2022-137, Class S | | |
| 0.846% (1 Month SOFR + 6.186%), due 7/20/51 (b)(h) | 3,586,209 | 343,604 |
| Series 2021-135, Class GS | | |
| 0.846% (1 Month SOFR + 6.186%), due 8/20/51 (b)(h) | 6,948,402 | 674,210 |
| Series 2021-96, Class JS | | |
| 0.896% (1 Month SOFR + 6.236%), due 6/20/51 (b)(h) | 3,424,011 | 282,025 |
| Series 2020-166, Class CA | | |
| 1.00%, due 11/20/50 | 2,553,902 | 1,752,826 |
The notes to the financial statements are an integral part of, and should be read in conjunction with, the financial statements.
19
Portfolio of Investments October 31, 2023†^ (continued)
| | Principal
Amount | Value |
| Mortgage-Backed Securities (continued) |
| Agency (Collateralized Mortgage Obligations) (continued) |
| GNMA (continued) | |
| Series 2023-86, Class SE | | |
| 1.329% (SOFR 30A + 6.65%), due 9/20/50 (b)(h) | $ 2,664,941 | $ 283,956 |
| Series 2023-66, Class MP | | |
| 1.657% (SOFR 30A + 12.30%), due 5/20/53 (b) | 2,163,327 | 1,853,416 |
| Series 2020-146, Class LI | | |
| 2.00%, due 10/20/50 (h) | 6,869,347 | 744,708 |
| Series 2021-41, Class FS | | |
| 2.00% (SOFR 30A + 0.20%), due 10/20/50 (b)(h) | 4,280,305 | 466,575 |
| Series 2020-166, Class IC | | |
| 2.00%, due 11/20/50 (h) | 1,393,037 | 139,089 |
| Series 2020-176, Class AI | | |
| 2.00%, due 11/20/50 (h) | 8,142,515 | 793,303 |
| Series 2020-185, Class BI | | |
| 2.00%, due 12/20/50 (h) | 2,120,276 | 231,274 |
| Series 2020-188 | | |
| 2.00%, due 12/20/50 (h) | 3,225,482 | 325,547 |
| Series 2021-30, Class HI | | |
| 2.00%, due 2/20/51 (h) | 6,262,721 | 637,875 |
| Series 2021-57, Class AI | | |
| 2.00%, due 2/20/51 (h) | 4,388,360 | 434,833 |
| Series 2021-49, Class YI | | |
| 2.00%, due 3/20/51 (h) | 643,189 | 68,086 |
| Series 2021-205, Class GA | | |
| 2.00%, due 11/20/51 | 566,044 | 437,673 |
| Series 2021-97, Class IN | | |
| 2.50%, due 8/20/49 (h) | 8,244,938 | 876,937 |
| Series 2019-159, Class P | | |
| 2.50%, due 9/20/49 | 1,085,704 | 881,698 |
| Series 2022-1, Class IA | | |
| 2.50%, due 6/20/50 (h) | 747,072 | 100,883 |
| Series 2020-122, Class IW | | |
| 2.50%, due 7/20/50 (h) | 2,620,610 | 337,546 |
| Series 2020-151, Class TI | | |
| 2.50%, due 10/20/50 (h) | 2,428,903 | 314,240 |
| Series 2021-56, Class FE | | |
| 2.50% (SOFR 30A + 0.20%), due 10/20/50 (b)(h) | 4,188,269 | 518,302 |
| Series 2020-173, Class EI | | |
| 2.50%, due 11/20/50 (h) | 2,744,192 | 370,544 |
| Series 2021-1, Class PI | | |
| 2.50%, due 12/20/50 (h) | 1,293,555 | 164,407 |
| Series 2021-137, Class HI | | |
| 2.50%, due 8/20/51 (h) | 2,997,849 | 409,960 |
| | Principal
Amount | Value |
| |
| Agency (Collateralized Mortgage Obligations) (continued) |
| GNMA (continued) | |
| Series 2021-149, Class CI | | |
| 2.50%, due 8/20/51 (h) | $ 3,783,886 | $ 488,112 |
| Series 2021-188 | | |
| 2.50%, due 10/20/51 (h) | 4,426,106 | 634,357 |
| Series 2022-83 | | |
| 2.50%, due 11/20/51 (h) | 3,368,243 | 440,325 |
| Series 2021-1, Class IT | | |
| 3.00%, due 1/20/51 (h) | 4,218,943 | 629,803 |
| Series 2021-74, Class HI | | |
| 3.00%, due 4/20/51 (h) | 519,108 | 76,850 |
| Series 2021-97, Class FA | | |
| 3.00% (SOFR 30A + 0.40%), due 6/20/51 (b) | 911,038 | 734,590 |
| Series 2021-98, Class IN | | |
| 3.00%, due 6/20/51 (h) | 1,642,857 | 291,350 |
| Series 2022-207 | | |
| 3.00%, due 8/20/51 (h) | 3,110,482 | 491,749 |
| Series 2021-158, Class NI | | |
| 3.00%, due 9/20/51 (h) | 4,540,855 | 689,576 |
| Series 2021-177, Class IM | | |
| 3.00%, due 10/20/51 (h) | 2,947,353 | 405,260 |
| Series 2023-19, Class CI | | |
| 3.00%, due 11/20/51 (h) | 3,760,617 | 580,380 |
| Series 2023-63, Class MA | | |
| 3.50%, due 5/20/50 | 1,547,901 | 1,318,669 |
| Series 2021-146, Class IN | | |
| 3.50%, due 8/20/51 (h) | 3,024,010 | 548,427 |
| Series 2019-136, Class YS | | |
| 9.674% (1 Month SOFR + 2.716%), due 11/20/49 (b)(h) | 638,918 | 2,005 |
| | | 52,700,407 |
| Commercial Mortgage Loans (Collateralized Mortgage Obligations) 9.1% |
| BAMLL Commercial Mortgage Securities Trust (a)(b) | |
| Series 2022-DKLX, Class E | | |
| 9.462% (1 Month SOFR + 4.127%), due 1/15/39 | 1,095,000 | 1,050,602 |
| Series 2022-DKLX, Class F | | |
| 10.292% (1 Month SOFR + 4.957%), due 1/15/39 | 1,650,000 | 1,573,607 |
| Bayview Commercial Asset Trust (a)(b) | |
| Series 2005-3A, Class A1 | | |
| 5.759% (1 Month SOFR + 0.594%), due 11/25/35 | 620,223 | 554,970 |
The notes to the financial statements are an integral part of, and should be read in conjunction with, the financial statements.
| 20 | MainStay MacKay Strategic Bond Fund |
| | Principal
Amount | Value |
| Mortgage-Backed Securities (continued) |
| Commercial Mortgage Loans (Collateralized Mortgage Obligations) (continued) |
| Bayview Commercial Asset Trust (a)(b) (continued) | |
| Series 2006-4A, Class A1 | | |
| 5.784% (1 Month SOFR + 0.459%), due 12/25/36 | $ 7,839 | $ 7,147 |
| Series 2007-2A, Class M1 | | |
| 5.809% (1 Month SOFR + 0.484%), due 7/25/37 | 1,010,574 | 860,284 |
| BBCMS Mortgage Trust (a)(b) | |
| Series 2018-TALL, Class B | | |
| 6.503% (1 Month SOFR + 1.168%), due 3/15/37 | 345,000 | 299,287 |
| Series 2018-TALL, Class C | | |
| 6.653% (1 Month SOFR + 1.318%), due 3/15/37 | 2,455,000 | 1,970,139 |
| Series 2018-TALL, Class D | | |
| 6.981% (1 Month SOFR + 1.646%), due 3/15/37 | 1,150,000 | 873,410 |
| BX Commercial Mortgage Trust (a)(i) | |
| Series 2020-VIV3, Class B | | |
| 3.544%, due 3/9/44 | 1,270,000 | 1,028,819 |
| Series 2020-VIVA, Class D | | |
| 3.549%, due 3/11/44 | 960,000 | 741,779 |
| BX Trust (a) | |
| Series 2019-OC11, Class B | | |
| 3.605%, due 12/9/41 | 205,000 | 170,127 |
| Series 2019-OC11, Class C | | |
| 3.856%, due 12/9/41 | 1,145,000 | 939,708 |
| Series 2019-OC11, Class D | | |
| 3.944%, due 12/9/41 (i) | 865,000 | 694,285 |
| Series 2019-OC11, Class E | | |
| 3.944%, due 12/9/41 (i) | 1,745,000 | 1,354,871 |
| Series 2023-LIFE, Class C | | |
| 5.884%, due 2/15/28 | 500,000 | 462,366 |
| Series 2018-GW, Class C | | |
| 6.852% (1 Month SOFR + 1.517%), due 5/15/35 (b) | 940,000 | 920,515 |
| Series 2021-LBA, Class DV | | |
| 7.049% (1 Month SOFR + 1.714%), due 2/15/36 (b) | 1,004,328 | 960,307 |
| Series 2021-RISE, Class D | | |
| 7.198% (1 Month SOFR + 1.864%), due 11/15/36 (b) | 2,375,117 | 2,312,622 |
| Series 2021-ARIA, Class E | | |
| 7.693% (1 Month SOFR + 2.359%), due 10/15/36 (b) | 3,015,000 | 2,818,576 |
| | Principal
Amount | Value |
| |
| Commercial Mortgage Loans (Collateralized Mortgage Obligations) (continued) |
| BX Trust (a) (continued) | |
| Series 2022-PSB, Class C | | |
| 9.032% (1 Month SOFR + 3.697%), due 8/15/39 (b) | $ 819,336 | $ 819,243 |
| BXHPP Trust (a)(b) | |
| Series 2021-FILM, Class B | | |
| 6.348% (1 Month SOFR + 1.014%), due 8/15/36 | 140,000 | 127,755 |
| Series 2021-FILM, Class C | | |
| 6.548% (1 Month SOFR + 1.214%), due 8/15/36 | 1,745,000 | 1,566,475 |
| Series 2021-FILM, Class D | | |
| 6.948% (1 Month SOFR + 1.614%), due 8/15/36 | 1,355,000 | 1,177,417 |
| BXSC Commercial Mortgage Trust | |
| Series 2022-WSS, Class D | | |
| 8.523% (1 Month SOFR + 3.188%), due 3/15/35 (a)(b) | 1,570,000 | 1,538,534 |
| Citigroup Commercial Mortgage Trust | |
| Series 2015-GC35, Class AS | | |
| 4.072%, due 11/10/48 (j) | 1,165,000 | 1,057,839 |
| Commercial Mortgage Trust | |
| Series 2012-CR4, Class AM | | |
| 3.251%, due 10/15/45 | 1,050,000 | 886,459 |
| CSMC WEST Trust | |
| Series 2020-WEST, Class A | | |
| 3.04%, due 2/15/35 (a) | 1,925,000 | 1,344,460 |
| DROP Mortgage Trust | |
| Series 2021-FILE, Class A | | |
| 6.598% (1 Month SOFR + 1.264%), due 10/15/43 (a)(b) | 1,700,000 | 1,579,498 |
| Extended Stay America Trust | |
| Series 2021-ESH, Class D | | |
| 7.698% (1 Month SOFR + 2.364%), due 7/15/38 (a)(b) | 3,585,719 | 3,522,958 |
| GNMA (h)(i) | |
| Series 2020-177 | | |
| 0.817%, due 6/16/62 | 5,514,330 | 315,990 |
| Series 2021-164 | | |
| 0.948%, due 10/16/63 | 6,035,223 | 410,542 |
| Series 2021-108 | | |
| 0.967%, due 6/16/61 | 8,803,271 | 590,795 |
| Series 2020-168, Class IA | | |
| 0.978%, due 12/16/62 | 4,683,972 | 322,001 |
| Series 2021-47 | | |
| 0.992%, due 3/16/61 | 10,569,211 | 722,191 |
The notes to the financial statements are an integral part of, and should be read in conjunction with, the financial statements.
21
Portfolio of Investments October 31, 2023†^ (continued)
| | Principal
Amount | Value |
| Mortgage-Backed Securities (continued) |
| Commercial Mortgage Loans (Collateralized Mortgage Obligations) (continued) |
| Hudson Yards Mortgage Trust | |
| Series 2019-30HY, Class A | | |
| 3.228%, due 7/10/39 (a) | $ 2,775,000 | $ 2,304,596 |
| Manhattan West Mortgage Trust | |
| Series 2020-1MW, Class A | | |
| 2.13%, due 9/10/39 (a) | 2,301,000 | 1,951,621 |
| Morgan Stanley Bank of America Merrill Lynch Trust | |
| Series 2017-C34, Class A4 | | |
| 3.536%, due 11/15/52 | 995,000 | 897,365 |
| Multifamily Connecticut Avenue Securities Trust (a)(b) | |
| Series 2019-01, Class M10 | | |
| 8.685% (SOFR 30A + 3.364%), due 10/25/49 | 3,227,884 | 3,108,176 |
| Series 2020-01, Class M10 | | |
| 9.185% (SOFR 30A + 3.864%), due 3/25/50 | 3,317,025 | 3,167,980 |
| Series 2019-01, Class B10 | | |
| 10.935% (SOFR 30A + 5.614%), due 10/25/49 | 1,680,000 | 1,570,851 |
| One Bryant Park Trust | |
| Series 2019-OBP, Class A | | |
| 2.516%, due 9/15/54 (a) | 3,425,000 | 2,682,020 |
| One Market Plaza Trust | |
| Series 2017-1MKT, Class A | | |
| 3.614%, due 2/10/32 (a) | 2,005,000 | 1,824,550 |
| ORL Trust (a)(b) | |
| Series 2023-GLKS, Class C | | |
| 8.985% (1 Month SOFR + 3.651%), due 10/15/28 | 565,000 | 562,758 |
| Series 2023-GLKS, Class D | | |
| 9.636% (1 Month SOFR + 4.301%), due 10/15/28 | 675,000 | 672,164 |
| SLG Office Trust (a) | |
| Series 2021-OVA, Class A | | |
| 2.585%, due 7/15/41 | 895,000 | 678,867 |
| Series 2021-OVA, Class F | | |
| 2.851%, due 7/15/41 | 1,510,000 | 981,444 |
| SMRT | |
| Series 2022-MINI, Class D | | |
| 7.285% (1 Month SOFR + 1.95%), due 1/15/39 (a)(b) | 2,760,000 | 2,611,326 |
| Wells Fargo Commercial Mortgage Trust | |
| Series 2018-AUS, Class A | | |
| 4.058%, due 8/17/36 (a)(i) | 1,985,000 | 1,751,980 |
| | Principal
Amount | Value |
| |
| Commercial Mortgage Loans (Collateralized Mortgage Obligations) (continued) |
| WFRBS Commercial Mortgage Trust | |
| Series 2014-C21, Class AS | | |
| 3.891%, due 8/15/47 | $ 2,175,000 | $ 2,060,601 |
| | | 62,401,877 |
| Whole Loan (Collateralized Mortgage Obligations) 17.7% |
| Alternative Loan Trust | |
| Series 2005-31, Class 1A1 | | |
| 5.999% (1 Month SOFR + 0.674%), due 8/25/35 (b) | 1,620,287 | 1,374,481 |
| American Home Mortgage Investment Trust | |
| Series 2005-4, Class 3A1 | | |
| 6.039% (1 Month SOFR + 0.714%), due 11/25/45 (b) | 1,172,882 | 790,336 |
| Bayview Commercial Asset Trust | |
| Series 2007-4A, Class A1 | | |
| 6.114% (1 Month SOFR + 0.789%), due 9/25/37 (a)(b) | 848,597 | 759,532 |
| CIM Trust | |
| Series 2021-J2, Class AS | | |
| 0.21%, due 4/25/51 (a)(h)(j) | 47,016,806 | 499,996 |
| Connecticut Avenue Securities Trust (a)(b) | |
| Series 2021-R03, Class 1M2 | | |
| 6.971% (SOFR 30A + 1.65%), due 12/25/41 | 2,025,924 | 1,991,524 |
| Series 2022-R01, Class 1M2 | | |
| 7.221% (SOFR 30A + 1.90%), due 12/25/41 | 675,000 | 664,884 |
| Series 2020-R02, Class 2M2 | | |
| 7.435% (SOFR 30A + 2.114%), due 1/25/40 | 1,116,072 | 1,117,463 |
| Series 2021-R03, Class 1B1 | | |
| 8.071% (SOFR 30A + 2.75%), due 12/25/41 | 2,385,000 | 2,358,693 |
| Series 2021-R01, Class 1B1 | | |
| 8.421% (SOFR 30A + 3.10%), due 10/25/41 | 4,480,000 | 4,466,051 |
| Series 2022-R01, Class 1B1 | | |
| 8.471% (SOFR 30A + 3.15%), due 12/25/41 | 1,875,000 | 1,869,152 |
| Series 2022-R02, Class 2B1 | | |
| 9.821% (SOFR 30A + 4.50%), due 1/25/42 | 3,725,000 | 3,798,842 |
| Series 2021-R03, Class 1B2 | | |
| 10.821% (SOFR 30A + 5.50%), due 12/25/41 | 1,425,000 | 1,395,900 |
The notes to the financial statements are an integral part of, and should be read in conjunction with, the financial statements.
| 22 | MainStay MacKay Strategic Bond Fund |
| | Principal
Amount | Value |
| Mortgage-Backed Securities (continued) |
| Whole Loan (Collateralized Mortgage Obligations) (continued) |
| Connecticut Avenue Securities Trust (a)(b) (continued) | |
| Series 2022-R08, Class 1B1 | | |
| 10.921% (SOFR 30A + 5.60%), due 7/25/42 | $ 600,000 | $ 643,335 |
| Series 2021-R01, Class 1B2 | | |
| 11.321% (SOFR 30A + 6.00%), due 10/25/41 | 3,210,000 | 3,189,937 |
| Series 2022-R01, Class 1B2 | | |
| 11.321% (SOFR 30A + 6.00%), due 12/25/41 | 1,285,000 | 1,278,119 |
| Series 2020-SBT1, Class 1B1 | | |
| 12.185% (SOFR 30A + 6.864%), due 2/25/40 | 2,300,000 | 2,353,170 |
| Series 2022-R04, Class 1B2 | | |
| 14.821% (SOFR 30A + 9.50%), due 3/25/42 | 975,000 | 1,055,382 |
| FHLMC STACR REMIC Trust (a)(b) | |
| Series 2021-DNA6, Class M2 | | |
| 6.821% (SOFR 30A + 1.50%), due 10/25/41 | 1,041,000 | 1,025,192 |
| Series 2021-HQA2, Class M2 | | |
| 7.371% (SOFR 30A + 2.05%), due 12/25/33 | 3,665,000 | 3,614,455 |
| Series 2021-HQA3, Class M2 | | |
| 7.421% (SOFR 30A + 2.10%), due 9/25/41 | 2,615,000 | 2,539,819 |
| Series 2021-HQA4, Class M2 | | |
| 7.671% (SOFR 30A + 2.35%), due 12/25/41 | 2,275,000 | 2,203,906 |
| Series 2020-HQA1, Class B1 | | |
| 7.785% (SOFR 30A + 2.464%), due 1/25/50 | 1,815,000 | 1,791,728 |
| Series 2022-DNA1, Class M2 | | |
| 7.821% (SOFR 30A + 2.50%), due 1/25/42 | 1,435,000 | 1,402,712 |
| Series 2020-DNA2, Class B1 | | |
| 7.935% (SOFR 30A + 2.614%), due 2/25/50 | 3,015,000 | 3,030,035 |
| Series 2021-DNA1, Class B1 | | |
| 7.971% (SOFR 30A + 2.65%), due 1/25/51 | 2,760,000 | 2,694,481 |
| Series 2021-HQA1, Class B1 | | |
| 8.321% (SOFR 30A + 3.00%), due 8/25/33 | 4,061,290 | 4,002,929 |
| Series 2020-DNA6, Class B1 | | |
| 8.321% (SOFR 30A + 3.00%), due 12/25/50 | 1,805,000 | 1,811,749 |
| | Principal
Amount | Value |
| |
| Whole Loan (Collateralized Mortgage Obligations) (continued) |
| FHLMC STACR REMIC Trust (a)(b) (continued) | |
| Series 2021-DNA5, Class B1 | | |
| 8.371% (SOFR 30A + 3.05%), due 1/25/34 | $ 3,395,000 | $ 3,395,000 |
| Series 2021-HQA2, Class B1 | | |
| 8.471% (SOFR 30A + 3.15%), due 12/25/33 | 2,955,000 | 2,918,062 |
| Series 2021-HQA3, Class B1 | | |
| 8.671% (SOFR 30A + 3.35%), due 9/25/41 | 2,870,000 | 2,848,475 |
| Series 2021-DNA6, Class B1 | | |
| 8.721% (SOFR 30A + 3.40%), due 10/25/41 | 4,020,000 | 4,040,100 |
| Series 2022-DNA1, Class B1 | | |
| 8.721% (SOFR 30A + 3.40%), due 1/25/42 | 4,470,295 | 4,425,592 |
| Series 2021-DNA3, Class B1 | | |
| 8.821% (SOFR 30A + 3.50%), due 10/25/33 | 2,860,000 | 2,918,975 |
| Series 2021-DNA7, Class B1 | | |
| 8.971% (SOFR 30A + 3.65%), due 11/25/41 | 3,905,000 | 3,954,307 |
| Series 2021-HQA4, Class B1 | | |
| 9.071% (SOFR 30A + 3.75%), due 12/25/41 | 3,435,000 | 3,415,741 |
| Series 2022-DNA2, Class M2 | | |
| 9.071% (SOFR 30A + 3.75%), due 2/25/42 | 2,745,000 | 2,782,744 |
| Series 2022-DNA3, Class M2 | | |
| 9.671% (SOFR 30A + 4.35%), due 4/25/42 | 675,000 | 699,995 |
| Series 2020-HQA1, Class B2 | | |
| 10.535% (SOFR 30A + 5.214%), due 1/25/50 | 2,035,000 | 2,018,744 |
| Series 2022-HQA3, Class M2 | | |
| 10.671% (SOFR 30A + 5.35%), due 8/25/42 | 1,590,000 | 1,679,381 |
| Series 2020-DNA1, Class B2 | | |
| 10.685% (SOFR 30A + 5.364%), due 1/25/50 | 750,000 | 757,500 |
| Series 2022-DNA6, Class M2 | | |
| 11.071% (SOFR 30A + 5.75%), due 9/25/42 | 2,115,000 | 2,296,721 |
| Series 2021-DNA3, Class B2 | | |
| 11.571% (SOFR 30A + 6.25%), due 10/25/33 | 1,895,000 | 1,982,567 |
The notes to the financial statements are an integral part of, and should be read in conjunction with, the financial statements.
23
Portfolio of Investments October 31, 2023†^ (continued)
| | Principal
Amount | Value |
| Mortgage-Backed Securities (continued) |
| Whole Loan (Collateralized Mortgage Obligations) (continued) |
| FHLMC STACR Trust | |
| Series 2018-HQA2, Class B2 | | |
| 16.435% (SOFR 30A + 11.114%), due 10/25/48 (a)(b) | $ 2,380,000 | $ 2,878,951 |
| FHLMC Structured Agency Credit Risk Debt Notes (a)(b) | |
| Series 2021-DNA2, Class B1 | | |
| 8.721% (SOFR 30A + 3.40%), due 8/25/33 | 1,565,000 | 1,594,744 |
| Series 2022-HQA2, Class M2 | | |
| 11.321% (SOFR 30A + 6.00%), due 7/25/42 | 2,755,000 | 2,979,529 |
| FNMA (b) | |
| Series 2021-R02, Class 2M2 | | |
| 7.321% (SOFR 30A + 2.00%), due 11/25/41 (a) | 505,000 | 495,582 |
| Series 2021-R02, Class 2B1 | | |
| 8.621% (SOFR 30A + 3.30%), due 11/25/41 (a) | 1,450,000 | 1,439,125 |
| Series 2018-C06, Class 2B1 | | |
| 9.535% (SOFR 30A + 4.214%), due 3/25/31 | 2,015,000 | 2,185,950 |
| Galton Funding Mortgage Trust | |
| Series 2018-2, Class A51 | | |
| 4.50%, due 10/25/58 (a)(j) | 348,522 | 312,504 |
| GreenPoint Mortgage Funding Trust | |
| Series 2007-AR3, Class A1 | | |
| 5.879% (1 Month SOFR + 0.554%), due 6/25/37 (b) | 350,463 | 296,849 |
| HarborView Mortgage Loan Trust | |
| Series 2007-3, Class 2A1A | | |
| 5.848% (1 Month SOFR + 0.514%), due 5/19/47 (b) | 1,278,324 | 1,157,511 |
| MASTR Alternative Loan Trust | |
| Series 2005-6, Class 1A2 | | |
| 5.50%, due 12/25/35 | 1,176,256 | 748,151 |
| Series 2005-5, Class 3A1 | | |
| 5.75%, due 8/25/35 | 1,444,441 | 712,134 |
| New Residential Mortgage Loan Trust (a) | |
| Series 2019-5A, Class B7 | | |
| 4.325%, due 8/25/59 (i) | 2,310,857 | 1,262,947 |
| Series 2019-4A, Class B6 | | |
| 4.621%, due 12/25/58 (j) | 2,355,945 | 1,290,205 |
| Series 2019-2A, Class B6 | | |
| 4.832%, due 12/25/57 (j) | 1,071,429 | 632,023 |
| OBX Trust | |
| Series 2022-NQM1, Class A1 | | |
| 2.305%, due 11/25/61 (a)(j) | 901,694 | 733,406 |
| | Principal
Amount | Value |
| |
| Whole Loan (Collateralized Mortgage Obligations) (continued) |
| Onslow Bay Mortgage Loan Trust | |
| Series 2021-NQM4, Class A1 | | |
| 1.957%, due 10/25/61 (a)(j) | $ 4,161,185 | $ 3,211,518 |
| Sequoia Mortgage Trust (a) | |
| Series 2021-4, Class A1 | | |
| 0.167%, due 6/25/51 (h)(i) | 34,526,137 | 276,599 |
| Series 2018-7, Class B3 | | |
| 4.25%, due 9/25/48 (j) | 1,336,226 | 1,053,570 |
| STACR Trust | |
| Series 2018-HRP2, Class B1 | | |
| 9.635% (SOFR 30A + 4.314%), due 2/25/47 (a)(b) | 2,995,000 | 3,203,601 |
| WaMu Mortgage Pass-Through Certificates Trust | |
| Series 2006-AR9, Class 2A | | |
| 5.848% (12 Month Monthly Treasury Average Index + 1.048%), due 8/25/46 (b) | 526,424 | 411,323 |
| | | 120,733,929 |
Total Mortgage-Backed Securities
(Cost $246,608,618) | | 235,836,213 |
| Municipal Bond 0.2% |
| California 0.2% |
Regents of the University of California Medical Center, Pooled
Revenue Bonds | | |
| Series N | | |
| 3.006%, due 5/15/50 | 2,760,000 | 1,642,107 |
Total Municipal Bond
(Cost $2,760,000) | | 1,642,107 |
| U.S. Government & Federal Agencies 12.7% |
| Federal Home Loan Mortgage Corporation (Mortgage Pass-Through Securities) 4.2% |
| UMBS Pool, 20 Year | | |
| 5.00%, due 7/1/43 | 2,805,768 | 2,629,638 |
| UMBS Pool, 30 Year | | |
| 5.50%, due 7/1/53 | 2,663,954 | 2,527,618 |
| 6.00%, due 9/1/53 | 4,087,466 | 3,981,497 |
| 6.50%, due 7/1/53 | 1,306,048 | 1,298,473 |
| 6.50%, due 10/1/53 | 7,697,868 | 7,657,685 |
| 6.50%, due 11/1/53 | 10,360,000 | 10,302,699 |
| | | 28,397,610 |
The notes to the financial statements are an integral part of, and should be read in conjunction with, the financial statements.
| 24 | MainStay MacKay Strategic Bond Fund |
| | Principal
Amount | Value |
| U.S. Government & Federal Agencies (continued) |
| Federal National Mortgage Association (Mortgage Pass-Through Securities) 3.6% |
| UMBS, 30 Year | | |
| 4.00%, due 6/1/52 | $ 4,172,225 | $ 3,608,436 |
| 4.00%, due 7/1/52 | 3,122,002 | 2,696,046 |
| 5.00%, due 11/1/52 | 8,645,956 | 7,977,224 |
| 5.00%, due 3/1/53 | 114,426 | 105,538 |
| 5.00%, due 3/1/53 | 663,445 | 611,887 |
| 5.50%, due 6/1/53 | 430,630 | 408,591 |
| 5.50%, due 8/1/53 | 1,253,203 | 1,190,399 |
| 6.00%, due 3/1/53 | 300,346 | 293,447 |
| 6.00%, due 8/1/53 | 1,320,960 | 1,286,557 |
| 6.00%, due 9/1/53 | 554,319 | 539,850 |
| 6.00%, due 9/1/53 | 6,084,319 | 5,925,014 |
| | | 24,642,989 |
| United States Treasury Bonds 0.4% |
| U.S. Treasury Bonds | | |
| 4.375%, due 8/15/43 (c) | 2,955,000 | 2,635,491 |
| United States Treasury Inflation - Indexed Notes 1.5% |
| U.S. Treasury Inflation Linked Notes | | |
| 1.375%, due 7/15/33 (k) | 11,226,267 | 10,155,057 |
| United States Treasury Notes 3.0% |
| U.S. Treasury Notes | | |
| 5.00%, due 10/31/25 | 20,875,000 | 20,849,722 |
Total U.S. Government & Federal Agencies
(Cost $89,348,928) | | 86,680,869 |
Total Long-Term Bonds
(Cost $713,410,391) | | 654,264,464 |
| |
| | Shares | |
| |
| Common Stocks 0.0% ‡ |
| Commercial Services & Supplies 0.0% ‡ |
| Quad/Graphics, Inc. (l) | 14 | 69 |
| Tobacco 0.0% ‡ |
| Turning Point Brands, Inc. | 6,802 | 136,380 |
Total Common Stocks
(Cost $0) | | 136,449 |
| | Shares | | Value |
| Short-Term Investments 4.1% |
| Affiliated Investment Company 0.9% |
| MainStay U.S. Government Liquidity Fund, 5.275% (m) | 6,230,614 | | $ 6,230,614 |
| Unaffiliated Investment Company 0.3% |
| Invesco Government & Agency Portfolio, 5.357% (m)(n) | 2,116,256 | | 2,116,256 |
| |
| | Principal
Amount | | |
| |
| U.S. Treasury Debt 2.9% |
| U.S. Treasury Bills (o) | | | |
| 5.347%, due 12/12/23 | $ 13,100,000 | | 13,021,076 |
| 5.401%, due 1/25/24 | 6,800,000 | | 6,714,799 |
| | | | 19,735,875 |
Total Short-Term Investments
(Cost $28,082,353) | | | 28,082,745 |
Total Investments
(Cost $741,492,744) | 99.8% | | 682,483,658 |
| Other Assets, Less Liabilities | 0.2 | | 1,253,749 |
| Net Assets | 100.0% | | $ 683,737,407 |
| † | Percentages indicated are based on Fund net assets. |
| ^ | Industry classifications may be different than those used for compliance monitoring purposes. |
| ‡ | Less than one-tenth of a percent. |
| (a) | May be sold to institutional investors only under Rule 144A or securities offered pursuant to Section 4(a)(2) of the Securities Act of 1933, as amended. |
| (b) | Floating rate—Rate shown was the rate in effect as of October 31, 2023. |
| (c) | All or a portion of this security was held on loan. As of October 31, 2023, the aggregate market value of securities on loan was $4,673,039; the total market value of collateral held by the Fund was $4,842,954. The market value of the collateral held included non-cash collateral in the form of U.S. Treasury securities with a value of $2,726,698. The Fund received cash collateral with a value of $2,116,256. (See Note 2(K)) |
| (d) | Fixed to floating rate—Rate shown was the rate in effect as of October 31, 2023. |
| (e) | Security is perpetual and, thus, does not have a predetermined maturity date. The date shown, if applicable, reflects the next call date. |
| (f) | Illiquid security—As of October 31, 2023, the total market value deemed illiquid under procedures approved by the Board of Trustees was $658,750, which represented 0.1% of the Fund’s net assets. (Unaudited) |
| (g) | Step coupon—Rate shown was the rate in effect as of October 31, 2023. |
The notes to the financial statements are an integral part of, and should be read in conjunction with, the financial statements.
25
Portfolio of Investments October 31, 2023†^ (continued)
| (h) | Collateralized Mortgage Obligation Interest Only Strip—Pays a fixed or variable rate of interest based on mortgage loans or mortgage pass-through securities. The principal amount of the underlying pool represents the notional amount on which the current interest was calculated. The value of these stripped securities may be particularly sensitive to changes in prevailing interest rates and are typically more sensitive to changes in prepayment rates than traditional mortgage-backed securities. |
| (i) | Collateral strip rate—A bond whose interest was based on the weighted net interest rate of the collateral. The coupon rate adjusts periodically based on a predetermined schedule. Rate shown was the rate in effect as of October 31, 2023. |
| (j) | Coupon rate may change based on changes of the underlying collateral or prepayments of principal. Rate shown was the rate in effect as of October 31, 2023. |
| (k) | Treasury Inflation Protected Security—Pays a fixed rate of interest on a principal amount that is continuously adjusted for inflation based on the Consumer Price Index-Urban Consumers. |
| (l) | Non-income producing security. |
| (m) | Current yield as of October 31, 2023. |
| (n) | Represents a security purchased with cash collateral received for securities on loan. |
| (o) | Interest rate shown represents yield to maturity. |
Investments in Affiliates (in 000's)
Investments in issuers considered to be affiliate(s) of the Fund during the year ended October 31, 2023 for purposes of Section 2(a)(3) of the Investment Company Act of 1940, as amended, were as follows:
| Affiliated Investment Companies | Value,
Beginning
of Year | Purchases
at Cost | Proceeds
from
Sales | Net
Realized
Gain/(Loss)
on Sales | Change in
Unrealized
Appreciation/
(Depreciation) | Value,
End of
Year | Dividend
Income | Other
Distributions | Shares
End of
Year |
| MainStay U.S. Government Liquidity Fund | $ 10,062 | $ 247,829 | $ (251,660) | $ — | $ — | $ 6,231 | $ 298 | $ — | 6,231 |
Futures Contracts
As of October 31, 2023, the Fund held the following futures contracts1:
| Type | Number of
Contracts | Expiration
Date | Value at
Trade Date | Current
Notional
Amount | Unrealized
Appreciation
(Depreciation)2 |
| Long Contracts | | | | | |
| U.S. Treasury 10 Year Ultra Bonds | 737 | December 2023 | $ 83,769,976 | $ 80,206,328 | $ (3,563,648) |
| U.S. Treasury Long Bonds | 47 | December 2023 | 5,642,316 | 5,143,563 | (498,753) |
| U.S. Treasury Ultra Bonds | 65 | December 2023 | 7,932,379 | 7,316,562 | (615,817) |
| Total Long Contracts | | | | | (4,678,218) |
| Short Contracts | | | | | |
| U.S. Treasury 2 Year Notes | (687) | December 2023 | (139,631,225) | (139,063,829) | 567,396 |
| U.S. Treasury 5 Year Notes | (664) | December 2023 | (70,132,888) | (69,372,438) | 760,450 |
The notes to the financial statements are an integral part of, and should be read in conjunction with, the financial statements.
| 26 | MainStay MacKay Strategic Bond Fund |
| Type | Number of
Contracts | Expiration
Date | Value at
Trade Date | Current
Notional
Amount | Unrealized
Appreciation
(Depreciation)2 |
| U.S. Treasury 10 Year Notes | (112) | December 2023 | $ (12,143,350) | $ (11,891,250) | $ 252,100 |
| Total Short Contracts | | | | | 1,579,946 |
| Net Unrealized Depreciation | | | | | $ (3,098,272) |
| 1. | As of October 31, 2023, cash in the amount of $1,970,955 was on deposit with a broker or futures commission merchant for futures transactions. |
| 2. | Represents the difference between the value of the contracts at the time they were opened and the value as of October 31, 2023. |
| Abbreviation(s): |
| FHLMC—Federal Home Loan Mortgage Corp. |
| FNMA—Federal National Mortgage Association |
| GNMA—Government National Mortgage Association |
| LIBOR—London Interbank Offered Rate |
| REMIC—Real Estate Mortgage Investment Conduit |
| SOFR—Secured Overnight Financing Rate |
| STACR—Structured Agency Credit Risk |
| UMBS—Uniform Mortgage Backed Securities |
| USISDA—U.S. International Swaps and Derivatives Association |
The notes to the financial statements are an integral part of, and should be read in conjunction with, the financial statements.
27
Portfolio of Investments October 31, 2023†^ (continued)
The following is a summary of the fair valuations according to the inputs used as of October 31, 2023, for valuing the Fund’s assets and liabilities:
| Description | Quoted
Prices in
Active
Markets for
Identical
Assets
(Level 1) | | Significant
Other
Observable
Inputs
(Level 2) | | Significant
Unobservable
Inputs
(Level 3) | | Total |
| Asset Valuation Inputs | | | | | | | |
| Investments in Securities (a) | | | | | | | |
| Long-Term Bonds | | | | | | | |
| Asset-Backed Securities | $ — | | $ 106,192,646 | | $ — | | $ 106,192,646 |
| Corporate Bonds | — | | 212,171,764 | | — | | 212,171,764 |
| Foreign Government Bonds | — | | 10,742,807 | | — | | 10,742,807 |
| Loan Assignments | — | | 998,058 | | — | | 998,058 |
| Mortgage-Backed Securities | — | | 235,836,213 | | — | | 235,836,213 |
| Municipal Bond | — | | 1,642,107 | | — | | 1,642,107 |
| U.S. Government & Federal Agencies | — | | 86,680,869 | | — | | 86,680,869 |
| Total Long-Term Bonds | — | | 654,264,464 | | — | | 654,264,464 |
| Common Stocks | 136,449 | | — | | — | | 136,449 |
| Short-Term Investments | | | | | | | |
| Affiliated Investment Company | 6,230,614 | | — | | — | | 6,230,614 |
| Unaffiliated Investment Company | 2,116,256 | | ��— | | — | | 2,116,256 |
| U.S. Treasury Debt | — | | 19,735,875 | | — | | 19,735,875 |
| Total Short-Term Investments | 8,346,870 | | 19,735,875 | | — | | 28,082,745 |
| Total Investments in Securities | 8,483,319 | | 674,000,339 | | — | | 682,483,658 |
| Other Financial Instruments | | | | | | | |
| Futures Contracts (b) | 1,579,946 | | — | | — | | 1,579,946 |
| Total Investments in Securities and Other Financial Instruments | $ 10,063,265 | | $ 674,000,339 | | $ — | | $ 684,063,604 |
| Liability Valuation Inputs | | | | | | | |
| Other Financial Instruments | | | | | | | |
| Futures Contracts (b) | $ (4,678,218) | | $ — | | $ — | | $ (4,678,218) |
| (a) | For a complete listing of investments and their industries, see the Portfolio of Investments. |
| (b) | The value listed for these securities reflects unrealized appreciation (depreciation) as shown on the Portfolio of Investments. |
The notes to the financial statements are an integral part of, and should be read in conjunction with, the financial statements.
| 28 | MainStay MacKay Strategic Bond Fund |
Statement of Assets and Liabilities as of October 31, 2023
| Assets |
Investment in unaffiliated securities, at value
(identified cost $735,262,130) including securities on loan of $4,673,039 | $ 676,253,044 |
Investment in affiliated investment companies, at value
(identified cost $6,230,614) | 6,230,614 |
| Cash | 54,790 |
Cash denominated in foreign currencies
(identified cost $932) | 917 |
| Cash collateral on deposit at broker for futures contracts | 1,970,955 |
| Receivables: | |
| Dividends and interest | 4,377,893 |
| Fund shares sold | 1,736,778 |
| Investment securities sold | 426,313 |
| Variation margin on futures contracts | 378,617 |
| Securities lending | 1,321 |
| Other assets | 47,538 |
| Total assets | 691,478,780 |
| Liabilities |
| Cash collateral received for securities on loan | 2,116,256 |
| Payables: | |
| Investment securities purchased | 3,634,761 |
| Fund shares redeemed | 1,102,050 |
| Manager (See Note 3) | 305,675 |
| Transfer agent (See Note 3) | 175,571 |
| NYLIFE Distributors (See Note 3) | 52,657 |
| Custodian | 21,630 |
| Professional fees | 18,881 |
| Shareholder communication | 7,395 |
| Accrued expenses | 931 |
| Distributions payable | 305,566 |
| Total liabilities | 7,741,373 |
| Net assets | $ 683,737,407 |
| Composition of Net Assets |
| Shares of beneficial interest outstanding (par value of $.01 per share) unlimited number of shares authorized | $ 854,184 |
| Additional paid-in-capital | 941,252,826 |
| | 942,107,010 |
| Total distributable earnings (loss) | (258,369,603) |
| Net assets | $ 683,737,407 |
| Class A | |
| Net assets applicable to outstanding shares | $182,026,837 |
| Shares of beneficial interest outstanding | 22,760,144 |
| Net asset value per share outstanding | $ 8.00 |
| Maximum sales charge (4.50% of offering price) | 0.38 |
| Maximum offering price per share outstanding | $ 8.38 |
| Investor Class | |
| Net assets applicable to outstanding shares | $ 12,923,364 |
| Shares of beneficial interest outstanding | 1,600,579 |
| Net asset value per share outstanding | $ 8.07 |
| Maximum sales charge (4.00% of offering price) | 0.34 |
| Maximum offering price per share outstanding | $ 8.41 |
| Class B | |
| Net assets applicable to outstanding shares | $ 537,062 |
| Shares of beneficial interest outstanding | 67,496 |
| Net asset value and offering price per share outstanding | $ 7.96 |
| Class C | |
| Net assets applicable to outstanding shares | $ 12,333,752 |
| Shares of beneficial interest outstanding | 1,551,356 |
| Net asset value and offering price per share outstanding | $ 7.95 |
| Class I | |
| Net assets applicable to outstanding shares | $470,565,955 |
| Shares of beneficial interest outstanding | 58,771,959 |
| Net asset value and offering price per share outstanding | $ 8.01 |
| Class R2 | |
| Net assets applicable to outstanding shares | $ 1,055,651 |
| Shares of beneficial interest outstanding | 131,942 |
| Net asset value and offering price per share outstanding | $ 8.00 |
| Class R3 | |
| Net assets applicable to outstanding shares | $ 369,498 |
| Shares of beneficial interest outstanding | 46,174 |
| Net asset value and offering price per share outstanding | $ 8.00 |
| Class R6 | |
| Net assets applicable to outstanding shares | $ 3,925,288 |
| Shares of beneficial interest outstanding | 488,728 |
| Net asset value and offering price per share outstanding | $ 8.03 |
The notes to the financial statements are an integral part of, and should be read in conjunction with, the financial statements.
29
Statement of Operations for the year ended October 31, 2023
| Investment Income (Loss) |
| Income | |
| Interest | $ 36,609,158 |
| Dividends-affiliated | 298,432 |
| Securities lending, net | 52,782 |
| Dividends-unaffiliated | 1,735 |
| Total income | 36,962,107 |
| Expenses | |
| Manager (See Note 3) | 4,073,232 |
| Transfer agent (See Note 3) | 1,029,413 |
| Distribution/Service—Class A (See Note 3) | 452,921 |
| Distribution/Service—Investor Class (See Note 3) | 34,632 |
| Distribution/Service—Class B (See Note 3) | 9,254 |
| Distribution/Service—Class C (See Note 3) | 164,194 |
| Distribution/Service—Class R2 (See Note 3) | 2,646 |
| Distribution/Service—Class R3 (See Note 3) | 2,466 |
| Registration | 135,709 |
| Professional fees | 128,389 |
| Custodian | 65,386 |
| Trustees | 18,012 |
| Shareholder communication | 14,785 |
| Shareholder service (See Note 3) | 1,551 |
| Miscellaneous | 22,800 |
| Total expenses before waiver/reimbursement | 6,155,390 |
| Expense waiver/reimbursement from Manager (See Note 3) | (411,848) |
| Reimbursement from prior custodian(a) | (1,338) |
| Net expenses | 5,742,204 |
| Net investment income (loss) | 31,219,903 |
| Realized and Unrealized Gain (Loss) |
| Net realized gain (loss) on: | |
| Unaffiliated investment transactions | (28,120,679) |
| Futures transactions | 2,542,758 |
| Swap transactions | 492,299 |
| Foreign currency transactions | (10) |
| Net realized gain (loss) | (25,085,632) |
| Net change in unrealized appreciation (depreciation) on: | |
| Unaffiliated investments | 34,350,920 |
| Futures contracts | (3,984,032) |
| Swap contracts | (564,729) |
| Translation of other assets and liabilities in foreign currencies | 43 |
| Net change in unrealized appreciation (depreciation) | 29,802,202 |
| Net realized and unrealized gain (loss) | 4,716,570 |
| Net increase (decrease) in net assets resulting from operations | $ 35,936,473 |
| (a) | Represents a refund for overbilling of custody fees. |
The notes to the financial statements are an integral part of, and should be read in conjunction with, the financial statements.
| 30 | MainStay MacKay Strategic Bond Fund |
Statements of Changes in Net Assets
for the years ended October 31, 2023 and October 31, 2022
| | 2023 | 2022 |
| Increase (Decrease) in Net Assets |
| Operations: | | |
| Net investment income (loss) | $ 31,219,903 | $ 20,275,770 |
| Net realized gain (loss) | (25,085,632) | 13,644,876 |
| Net change in unrealized appreciation (depreciation) | 29,802,202 | (111,167,582) |
| Net increase (decrease) in net assets resulting from operations | 35,936,473 | (77,246,936) |
| Distributions to shareholders: | | |
| Class A | (7,998,314) | (4,730,207) |
| Investor Class | (573,435) | (353,497) |
| Class B | (30,984) | (31,662) |
| Class C | (558,210) | (480,971) |
| Class I | (22,468,698) | (12,885,438) |
| Class R2 | (45,621) | (24,679) |
| Class R3 | (19,860) | (12,448) |
| Class R6 | (99,707) | (39,398) |
| Total distributions to shareholders | (31,794,829) | (18,558,300) |
| Capital share transactions: | | |
| Net proceeds from sales of shares | 242,538,209 | 301,260,901 |
| Net asset value of shares issued to shareholders in reinvestment of distributions | 27,732,279 | 16,426,709 |
| Cost of shares redeemed | (241,754,978) | (281,548,790) |
| Increase (decrease) in net assets derived from capital share transactions | 28,515,510 | 36,138,820 |
| Net increase (decrease) in net assets | 32,657,154 | (59,666,416) |
| Net Assets |
| Beginning of year | 651,080,253 | 710,746,669 |
| End of year | $ 683,737,407 | $ 651,080,253 |
The notes to the financial statements are an integral part of, and should be read in conjunction with, the financial statements.
31
Financial Highlights selected per share data and ratios
| | Year Ended October 31, |
| Class A | 2023 | | 2022 | | 2021 | | 2020 | | 2019 |
| Net asset value at beginning of year | $ 7.94 | | $ 9.10 | | $ 8.80 | | $ 8.74 | | $ 8.65 |
| Net investment income (loss) (a) | 0.35 | | 0.24 | | 0.22 | | 0.22 | | 0.23 |
| Net realized and unrealized gain (loss) | 0.07 | | (1.19) | | 0.27 | | 0.06 | | 0.11 |
| Total from investment operations | 0.42 | | (0.95) | | 0.49 | | 0.28 | | 0.34 |
| Less distributions: | | | | | | | | | |
| From net investment income | (0.36) | | (0.21) | | (0.18) | | (0.21) | | (0.25) |
| Return of capital | — | | — | | (0.01) | | (0.01) | | — |
| Total distributions | (0.36) | | (0.21) | | (0.19) | | (0.22) | | (0.25) |
| Net asset value at end of year | $ 8.00 | | $ 7.94 | | $ 9.10 | | $ 8.80 | | $ 8.74 |
| Total investment return (b) | 5.30% | | (10.51)% | | 5.61% | | 3.27% | | 3.99% |
| Ratios (to average net assets)/Supplemental Data: | | | | | | | | | |
| Net investment income (loss) | 4.32% | | 2.75% | | 2.43% | | 2.60% | | 2.66% |
| Net expenses (c) | 1.04% | | 1.04% | | 1.07%(d) | | 1.18%(d) | | 1.27%(d) |
| Portfolio turnover rate | 92% | | 86% | | 53% | | 56%(e) | | 50%(e) |
| Net assets at end of year (in 000’s) | $ 182,027 | | $ 178,508 | | $ 192,190 | | $ 175,682 | | $ 197,686 |
| (a) | Per share data based on average shares outstanding during the year. |
| (b) | Total investment return is calculated exclusive of sales charges and assumes the reinvestment of dividends and distributions. For periods of less than one year, total return is not annualized. |
| (c) | In addition to the fees and expenses which the Fund bears directly, it also indirectly bears a pro-rata share of the fees and expenses of the underlying funds in which it invests. Such indirect expenses are not included in the above expense ratios. |
| (d) | The expense ratios presented below show the impact of short sales expense: |
| Year Ended | | Net Expenses
(excluding short
sale expenses) | | Short Sales
Expenses |
| October 31, 2021 | | 1.04% | | 0.03% |
| October 31, 2020 | | 1.07% | | 0.11% |
| October 31, 2019 | | 1.07% | | 0.20% |
| (e) | The portfolio turnover rate not including mortgage dollar rolls was 53% and 44% for the years ended October 31, 2020 and 2019, respectively. |
The notes to the financial statements are an integral part of, and should be read in conjunction with, the financial statements.
| 32 | MainStay MacKay Strategic Bond Fund |
Financial Highlights selected per share data and ratios
| | Year Ended October 31, |
| Investor Class | 2023 | | 2022 | | 2021 | | 2020 | | 2019 |
| Net asset value at beginning of year | $ 8.01 | | $ 9.18 | | $ 8.88 | | $ 8.81 | | $ 8.72 |
| Net investment income (loss) (a) | 0.34 | | 0.22 | | 0.21 | | 0.22 | | 0.23 |
| Net realized and unrealized gain (loss) | 0.06 | | (1.19) | | 0.27 | | 0.06 | | 0.11 |
| Total from investment operations | 0.40 | | (0.97) | | 0.48 | | 0.28 | | 0.34 |
| Less distributions: | | | | | | | | | |
| From net investment income | (0.34) | | (0.20) | | (0.17) | | (0.20) | | (0.25) |
| Return of capital | — | | — | | (0.01) | | (0.01) | | — |
| Total distributions | (0.34) | | (0.20) | | (0.18) | | (0.21) | | (0.25) |
| Net asset value at end of year | $ 8.07 | | $ 8.01 | | $ 9.18 | | $ 8.88 | | $ 8.81 |
| Total investment return (b) | 5.03% | | (10.65)% | | 5.41% | | 3.29% | | 3.93% |
| Ratios (to average net assets)/Supplemental Data: | | | | | | | | | |
| Net investment income (loss) | 4.11% | | 2.59% | | 2.30% | | 2.54% | | 2.63% |
| Net expenses (c) | 1.25% | | 1.18% | | 1.20%(d) | | 1.24%(d) | | 1.29%(d) |
| Expenses (before waiver/reimbursement) (c) | 1.26% | | 1.18% | | 1.20% | | 1.24% | | 1.29% |
| Portfolio turnover rate | 92% | | 86% | | 53% | | 56%(e) | | 50%(e) |
| Net assets at end of year (in 000's) | $ 12,923 | | $ 13,795 | | $ 16,874 | | $ 18,139 | | $ 19,748 |
| (a) | Per share data based on average shares outstanding during the year. |
| (b) | Total investment return is calculated exclusive of sales charges and assumes the reinvestment of dividends and distributions. For periods of less than one year, total return is not annualized. |
| (c) | In addition to the fees and expenses which the Fund bears directly, it also indirectly bears a pro-rata share of the fees and expenses of the underlying funds in which it invests. Such indirect expenses are not included in the above expense ratios. |
| (d) | The expense ratios presented below show the impact of short sales expense: |
| Year Ended | | Net Expenses
(excluding short
sale expenses) | | Short Sales
Expenses |
| October 31, 2021 | | 1.17% | | 0.03% |
| October 31, 2020 | | 1.13% | | 0.11% |
| October 31, 2019 | | 1.09% | | 0.20% |
| (e) | The portfolio turnover rate not including mortgage dollar rolls was 53% and 44% for the years ended October 31, 2020 and 2019, respectively. |
The notes to the financial statements are an integral part of, and should be read in conjunction with, the financial statements.
33
Financial Highlights selected per share data and ratios
| | Year Ended October 31, |
| Class B | 2023 | | 2022 | | 2021 | | 2020 | | 2019 |
| Net asset value at beginning of year | $ 7.90 | | $ 9.06 | | $ 8.76 | | $ 8.70 | | $ 8.61 |
| Net investment income (loss) (a) | 0.27 | | 0.15 | | 0.14 | | 0.15 | | 0.16 |
| Net realized and unrealized gain (loss) | 0.07 | | (1.17) | | 0.27 | | 0.06 | | 0.11 |
| Total from investment operations | 0.34 | | (1.02) | | 0.41 | | 0.21 | | 0.27 |
| Less distributions: | | | | | | | | | |
| From net investment income | (0.28) | | (0.14) | | (0.10) | | (0.15) | | (0.18) |
| Return of capital | — | | — | | (0.01) | | (0.00)‡ | | — |
| Total distributions | (0.28) | | (0.14) | | (0.11) | | (0.15) | | (0.18) |
| Net asset value at end of year | $ 7.96 | | $ 7.90 | | $ 9.06 | | $ 8.76 | | $ 8.70 |
| Total investment return (b) | 4.32% | | (11.27)% | | 4.57% | | 2.44% | | 3.20% |
| Ratios (to average net assets)/Supplemental Data: | | | | | | | | | |
| Net investment income (loss) | 3.32% | | 1.74% | | 1.55% | | 1.77% | | 1.90% |
| Net expenses (c) | 2.00% | | 1.93% | | 1.95%(d) | | 2.00%(d) | | 2.04%(d) |
| Expenses (before waiver/reimbursement) (c) | 2.01% | | 1.93% | | 1.95% | | 2.00% | | 2.04% |
| Portfolio turnover rate | 92% | | 86% | | 53% | | 56%(e) | | 50%(e) |
| Net assets at end of year (in 000’s) | $ 537 | | $ 1,327 | | $ 3,191 | | $ 4,872 | | $ 7,970 |
| ‡ | Less than one cent per share. |
| (a) | Per share data based on average shares outstanding during the year. |
| (b) | Total investment return is calculated exclusive of sales charges and assumes the reinvestment of dividends and distributions. For periods of less than one year, total return is not annualized. |
| (c) | In addition to the fees and expenses which the Fund bears directly, it also indirectly bears a pro-rata share of the fees and expenses of the underlying funds in which it invests. Such indirect expenses are not included in the above expense ratios. |
| (d) | The expense ratios presented below show the impact of short sales expense: |
| Year Ended | | Net Expenses
(excluding short
sale expenses) | | Short Sales
Expenses |
| October 31, 2021 | | 1.92% | | 0.03% |
| October 31, 2020 | | 1.89% | | 0.11% |
| October 31, 2019 | | 1.84% | | 0.20% |
| (e) | The portfolio turnover rate not including mortgage dollar rolls was 53% and 44% for the years ended October 31, 2020 and 2019, respectively. |
The notes to the financial statements are an integral part of, and should be read in conjunction with, the financial statements.
| 34 | MainStay MacKay Strategic Bond Fund |
Financial Highlights selected per share data and ratios
| | Year Ended October 31, |
| Class C | 2023 | | 2022 | | 2021 | | 2020 | | 2019 |
| Net asset value at beginning of year | $ 7.89 | | $ 9.05 | | $ 8.75 | | $ 8.69 | | $ 8.60 |
| Net investment income (loss) (a) | 0.27 | | 0.15 | | 0.14 | | 0.15 | | 0.16 |
| Net realized and unrealized gain (loss) | 0.07 | | (1.17) | | 0.27 | | 0.06 | | 0.11 |
| Total from investment operations | 0.34 | | (1.02) | | 0.41 | | 0.21 | | 0.27 |
| Less distributions: | | | | | | | | | |
| From net investment income | (0.28) | | (0.14) | | (0.10) | | (0.15) | | (0.18) |
| Return of capital | — | | — | | (0.01) | | (0.00)‡ | | — |
| Total distributions | (0.28) | | (0.14) | | (0.11) | | (0.15) | | (0.18) |
| Net asset value at end of year | $ 7.95 | | $ 7.89 | | $ 9.05 | | $ 8.75 | | $ 8.69 |
| Total investment return (b) | 4.33% | | (11.38)% | | 4.69% | | 2.45% | | 3.21% |
| Ratios (to average net assets)/Supplemental Data: | | | | | | | | | |
| Net investment income (loss) | 3.34% | | 1.75% | | 1.55% | | 1.78% | | 1.90% |
| Net expenses (c) | 2.00% | | 1.93% | | 1.95%(d) | | 2.00%(d) | | 2.04%(d) |
| Expenses (before waiver/reimbursement) (c) | 2.01% | | 1.93% | | 1.95% | | 2.00% | | 2.04% |
| Portfolio turnover rate | 92% | | 86% | | 53% | | 56%(e) | | 50%(e) |
| Net assets at end of year (in 000’s) | $ 12,334 | | $ 20,804 | | $ 46,537 | | $ 65,158 | | $ 91,598 |
| ‡ | Less than one cent per share. |
| (a) | Per share data based on average shares outstanding during the year. |
| (b) | Total investment return is calculated exclusive of sales charges and assumes the reinvestment of dividends and distributions. For periods of less than one year, total return is not annualized. |
| (c) | In addition to the fees and expenses which the Fund bears directly, it also indirectly bears a pro-rata share of the fees and expenses of the underlying funds in which it invests. Such indirect expenses are not included in the above expense ratios. |
| (d) | The expense ratios presented below show the impact of short sales expense: |
| Year Ended | | Net Expenses
(excluding short
sale expenses) | | Short Sales
Expenses |
| October 31, 2021 | | 1.92% | | 0.03% |
| October 31, 2020 | | 1.89% | | 0.11% |
| October 31, 2019 | | 1.84% | | 0.20% |
| (e) | The portfolio turnover rate not including mortgage dollar rolls was 53% and 44% for the years ended October 31, 2020 and 2019, respectively. |
The notes to the financial statements are an integral part of, and should be read in conjunction with, the financial statements.
35
Financial Highlights selected per share data and ratios
| | Year Ended October 31, |
| Class I | 2023 | | 2022 | | 2021 | | 2020 | | 2019 |
| Net asset value at beginning of year | $ 7.95 | | $ 9.11 | | $ 8.81 | | $ 8.75 | | $ 8.66 |
| Net investment income (loss) (a) | 0.38 | | 0.27 | | 0.25 | | 0.24 | | 0.25 |
| Net realized and unrealized gain (loss) | 0.07 | | (1.19) | | 0.27 | | 0.06 | | 0.11 |
| Total from investment operations | 0.45 | | (0.92) | | 0.52 | | 0.30 | | 0.36 |
| Less distributions: | | | | | | | | | |
| From net investment income | (0.39) | | (0.24) | | (0.21) | | (0.23) | | (0.27) |
| Return of capital | — | | — | | (0.01) | | (0.01) | | — |
| Total distributions | (0.39) | | (0.24) | | (0.22) | | (0.24) | | (0.27) |
| Net asset value at end of year | $ 8.01 | | $ 7.95 | | $ 9.11 | | $ 8.81 | | $ 8.75 |
| Total investment return (b) | 5.64% | | (10.19)% | | 5.88% | | 3.53% | | 4.24% |
| Ratios (to average net assets)/Supplemental Data: | | | | | | | | | |
| Net investment income (loss) | 4.66% | | 3.09% | | 2.70% | | 2.83% | | 2.91% |
| Net expenses (c) | 0.70% | | 0.70% | | 0.79%(d) | | 0.94%(d) | | 1.02%(d) |
| Expenses (before waiver/reimbursement) (c) | 0.79% | | 0.79% | | 0.82% | | 0.94% | | 1.02% |
| Portfolio turnover rate | 92% | | 86% | | 53% | | 56%(e) | | 50%(e) |
| Net assets at end of year (in 000’s) | $ 470,566 | | $ 433,814 | | $ 448,881 | | $ 404,964 | | $ 604,981 |
| (a) | Per share data based on average shares outstanding during the year. |
| (b) | Total investment return is calculated exclusive of sales charges and assumes the reinvestment of dividends and distributions. Class I shares are not subject to sales charges. For periods of less than one year, total return is not annualized. |
| (c) | In addition to the fees and expenses which the Fund bears directly, it also indirectly bears a pro-rata share of the fees and expenses of the underlying funds in which it invests. Such indirect expenses are not included in the above expense ratios. |
| (d) | The expense ratios presented below show the impact of short sales expense: |
| Year Ended | | Net Expenses
(excluding short
sale expenses) | | Short Sales
Expenses |
| October 31, 2021 | | 0.76% | | 0.03% |
| October 31, 2020 | | 0.83% | | 0.11% |
| October 31, 2019 | | 0.82% | | 0.20% |
| (e) | The portfolio turnover rate not including mortgage dollar rolls was 53% and 44% for the years ended October 31, 2020 and 2019, respectively. |
The notes to the financial statements are an integral part of, and should be read in conjunction with, the financial statements.
| 36 | MainStay MacKay Strategic Bond Fund |
Financial Highlights selected per share data and ratios
| | Year Ended October 31, |
| Class R2 | 2023 | | 2022 | | 2021 | | 2020 | | 2019 |
| Net asset value at beginning of year | $ 7.94 | | $ 9.11 | | $ 8.81 | | $ 8.74 | | $ 8.65 |
| Net investment income (loss) (a) | 0.35 | | 0.23 | | 0.21 | | 0.21 | | 0.22 |
| Net realized and unrealized gain (loss) | 0.06 | | (1.19) | | 0.27 | | 0.07 | | 0.11 |
| Total from investment operations | 0.41 | | (0.96) | | 0.48 | | 0.28 | | 0.33 |
| Less distributions: | | | | | | | | | |
| From net investment income | (0.35) | | (0.21) | | (0.17) | | (0.20) | | (0.24) |
| Return of capital | — | | — | | (0.01) | | (0.01) | | — |
| Total distributions | (0.35) | | (0.21) | | (0.18) | | (0.21) | | (0.24) |
| Net asset value at end of year | $ 8.00 | | $ 7.94 | | $ 9.11 | | $ 8.81 | | $ 8.74 |
| Total investment return (b) | 5.19% | | (10.69)% | | 5.49% | | 3.27% | | 3.89% |
| Ratios (to average net assets)/Supplemental Data: | | | | | | | | | |
| Net investment income (loss) | 4.23% | | 2.64% | | 2.33% | | 2.49% | | 2.54% |
| Net expenses (c) | 1.14% | | 1.14% | | 1.17%(d) | | 1.29%(d) | | 1.37%(d) |
| Portfolio turnover rate | 92% | | 86% | | 53% | | 56%(e) | | 50%(e) |
| Net assets at end of year (in 000’s) | $ 1,056 | | $ 983 | | $ 1,047 | | $ 934 | | $ 7,232 |
| (a) | Per share data based on average shares outstanding during the year. |
| (b) | Total investment return is calculated exclusive of sales charges and assumes the reinvestment of dividends and distributions. Class R2 shares are not subject to sales charges. For periods of less than one year, total return is not annualized. |
| (c) | In addition to the fees and expenses which the Fund bears directly, it also indirectly bears a pro-rata share of the fees and expenses of the underlying funds in which it invests. Such indirect expenses are not included in the above expense ratios. |
| (d) | The expense ratios presented below show the impact of short sales expense: |
| Year Ended | | Net Expenses
(excluding short
sale expenses) | | Short Sales
Expenses |
| October 31, 2021 | | 1.14% | | 0.03% |
| October 31, 2020 | | 1.18% | | 0.11% |
| October 31, 2019 | | 1.17% | | 0.20% |
| (e) | The portfolio turnover rate not including mortgage dollar rolls was 53% and 44% for the years ended October 31, 2020 and 2019, respectively. |
The notes to the financial statements are an integral part of, and should be read in conjunction with, the financial statements.
37
Financial Highlights selected per share data and ratios
| | Year Ended October 31, |
| Class R3 | 2023 | | 2022 | | 2021 | | 2020 | | 2019 |
| Net asset value at beginning of year | $ 7.94 | | $ 9.10 | | $ 8.80 | | $ 8.74 | | $ 8.65 |
| Net investment income (loss) (a) | 0.33 | | 0.20 | | 0.19 | | 0.20 | | 0.20 |
| Net realized and unrealized gain (loss) | 0.06 | | (1.18) | | 0.27 | | 0.05 | | 0.11 |
| Total from investment operations | 0.39 | | (0.98) | | 0.46 | | 0.25 | | 0.31 |
| Less distributions: | | | | | | | | | |
| From net investment income | (0.33) | | (0.18) | | (0.15) | | (0.18) | | (0.22) |
| Return of capital | — | | — | | (0.01) | | (0.01) | | — |
| Total distributions | (0.33) | | (0.18) | | (0.16) | | (0.19) | | (0.22) |
| Net asset value at end of year | $ 8.00 | | $ 7.94 | | $ 9.10 | | $ 8.80 | | $ 8.74 |
| Total investment return (b) | 4.92% | | (10.83)% | | 5.21% | | 2.90% | | 3.63% |
| Ratios (to average net assets)/Supplemental Data: | | | | | | | | | |
| Net investment income (loss) | 3.96% | | 2.38% | | 2.05% | | 2.27% | | 2.29% |
| Net expenses (c) | 1.39% | | 1.39% | | 1.42%(d) | | 1.52%(d) | | 1.62%(d) |
| Portfolio turnover rate | 92% | | 86% | | 53% | | 56%(e) | | 50%(e) |
| Net assets at end of year (in 000’s) | $ 369 | | $ 501 | | $ 619 | | $ 276 | | $ 218 |
| (a) | Per share data based on average shares outstanding during the year. |
| (b) | Total investment return is calculated exclusive of sales charges and assumes the reinvestment of dividends and distributions. Class R3 shares are not subject to sales charges. For periods of less than one year, total return is not annualized. |
| (c) | In addition to the fees and expenses which the Fund bears directly, it also indirectly bears a pro-rata share of the fees and expenses of the underlying funds in which it invests. Such indirect expenses are not included in the above expense ratios. |
| (d) | The expense ratios presented below show the impact of short sales expense: |
| Year Ended | | Net Expenses
(excluding short
sale expenses) | | Short Sales
Expenses |
| October 31, 2021 | | 1.39% | | 0.03% |
| October 31, 2020 | | 1.41% | | 0.11% |
| October 31, 2019 | | 1.42% | | 0.20% |
| (e) | The portfolio turnover rate not including mortgage dollar rolls was 53% and 44% for the years ended October 31, 2020 and 2019, respectively. |
The notes to the financial statements are an integral part of, and should be read in conjunction with, the financial statements.
| 38 | MainStay MacKay Strategic Bond Fund |
Financial Highlights selected per share data and ratios
| | Year Ended October 31, |
| Class R6 | 2023 | | 2022 | | 2021 | | 2020 | | 2019 |
| Net asset value at beginning of year | $ 7.97 | | $ 9.14 | | $ 8.84 | | $ 8.75 | | $ 8.66 |
| Net investment income (loss) (a) | 0.39 | | 0.27 | | 0.26 | | 0.25 | | 0.27 |
| Net realized and unrealized gain (loss) | 0.06 | | (1.19) | | 0.26 | | 0.09 | | 0.11 |
| Total from investment operations | 0.45 | | (0.92) | | 0.52 | | 0.34 | | 0.38 |
| Less distributions: | | | | | | | | | |
| From net investment income | (0.39) | | (0.25) | | (0.21) | | (0.24) | | (0.29) |
| Return of capital | — | | — | | (0.01) | | (0.01) | | — |
| Total distributions | (0.39) | | (0.25) | | (0.22) | | (0.25) | | (0.29) |
| Net asset value at end of year | $ 8.03 | | $ 7.97 | | $ 9.14 | | $ 8.84 | | $ 8.75 |
| Total investment return (b) | 5.68% | | (10.23)% | | 5.97% | | 4.04% | | 4.43% |
| Ratios (to average net assets)/Supplemental Data: | | | | | | | | | |
| Net investment income (loss) | 4.76% | | 3.14% | | 2.83% | | 2.88% | | 3.13% |
| Net expenses (c) | 0.65% | | 0.66% | | 0.69%(d) | | 0.82%(d) | | 0.84%(d) |
| Portfolio turnover rate | 92% | | 86% | | 53% | | 56%(e) | | 50%(e) |
| Net assets at end of year (in 000’s) | $ 3,925 | | $ 1,349 | | $ 1,407 | | $ 465 | | $ 22,632 |
| (a) | Per share data based on average shares outstanding during the year. |
| (b) | Total investment return is calculated exclusive of sales charges and assumes the reinvestment of dividends and distributions. Class R6 shares are not subject to sales charges. For periods of less than one year, total return is not annualized. |
| (c) | In addition to the fees and expenses which the Fund bears directly, it also indirectly bears a pro-rata share of the fees and expenses of the underlying funds in which it invests. Such indirect expenses are not included in the above expense ratios. |
| (d) | The expense ratios presented below show the impact of short sales expense: |
| Year Ended | | Net Expenses
(excluding short
sale expenses) | | Short Sales
Expenses |
| October 31, 2021 | | 0.67% | | 0.02% |
| October 31, 2020 | | 0.66% | | 0.16% |
| October 31, 2019 | | 0.64% | | 0.20% |
| (e) | The portfolio turnover rate not including mortgage dollar rolls was 53% and 44% for the years ended October 31, 2020 and 2019, respectively. |
The notes to the financial statements are an integral part of, and should be read in conjunction with, the financial statements.
39
Notes to Financial Statements
Note 1-Organization and Business
The MainStay Funds (the “Trust”) was organized on January 9, 1986, as a Massachusetts business trust. The Trust is registered under the Investment Company Act of 1940, as amended (the “1940 Act”), as an open-end management investment company, and is comprised of eleven funds (collectively referred to as the "Funds"). These financial statements and notes relate to the MainStay MacKay Strategic Bond Fund (the "Fund"), a “diversified” fund, as that term is defined in the 1940 Act, as interpreted or modified by regulatory authorities having jurisdiction, from time to time.
The following table lists the Fund's share classes that have been registered and commenced operations:
| Class | Commenced Operations |
| Class A | February 28, 1997 |
| Investor Class | February 28, 2008 |
| Class B^ | February 28, 1997 |
| Class C | September 1, 1998 |
| Class I | January 2, 2004 |
| Class R2* | February 28, 2014 |
| Class R3* | February 29, 2016 |
| Class R6 | February 28, 2018 |
| ^ | Class B shares are closed to all new purchases as well as additional investments by existing Class B shareholders and will be converted into Class A or Investor Class shares based on shareholder eligibility on or about February 28, 2024. |
| * | As of October 31, 2023, Class R2 and Class R3 shares are closed to new investors and, upon the close of business on December 29, 2023, Class R2 and Class R3 shares are closed to additional investments by existing shareholders. Additionally, Class R2 and Class R3 shares will be liquidated on or about February 28, 2024 (the "Liquidation Date"). It is expected that the Fund will distribute to remaining shareholders invested in Class R2 or Class R3 shares, on or promptly after the Liquidation Date, a liquidating distribution in cash or cash equivalents equal to the net asset value of such shares. |
Class B shares of the MainStay Group of Funds are closed to all new purchases as well as additional investments by existing Class B shareholders. Existing Class B shareholders may continue to reinvest dividends and capital gains distributions, as well as exchange their Class B shares for Class B shares of other funds in the MainStay Group of Funds as permitted by the current exchange privileges. Class B shareholders continue to be subject to any applicable contingent deferred sales charge ("CDSC") at the time of redemption. All other features of the Class B shares, including but not limited to the fees and expenses applicable to Class B shares, remain unchanged. Unless redeemed, Class B shareholders will remain in Class B shares of their respective fund until the Class B shares are converted to Class A or Investor Class shares pursuant to the applicable conversion schedule.
Class A and Investor Class shares are offered at net asset value (“NAV”) per share plus an initial sales charge. No initial sales charge applies to investments of $1 million or more (and certain other qualified purchases) in Class A and Investor Class shares. However, a CDSC of 1.00% may be imposed on certain redemptions made within 18 months of the date of
purchase on shares that were purchased without an initial sales charge. Class C shares are offered at NAV without an initial sales charge, although a 1.00% CDSC may be imposed on certain redemptions of such shares made within one year of the date of purchase of Class C shares. When Class B shares were offered, they were offered at NAV without an initial sales charge, although a CDSC that declines depending on the number of years a shareholder held its Class B shares may be imposed on certain redemptions of such shares made within six years of the date of purchase of such shares. Class I, Class R2, Class R3 and Class R6 shares are offered at NAV without a sales charge. Depending upon eligibility, Class B shares convert to either Class A or Investor Class shares at the end of the calendar quarter eight years after the date they were purchased. In addition, depending upon eligibility, Class C shares convert to either Class A or Investor Class shares at the end of the calendar quarter eight years after the date they were purchased. Additionally, Investor Class shares may convert automatically to Class A shares. Under certain circumstances and as may be permitted by the Trust’s multiple class plan pursuant to Rule 18f-3 under the 1940 Act, specified share classes of the Fund may be converted to one or more other share classes of the Fund as disclosed in the capital share transactions within these Notes. The classes of shares have the same voting (except for issues that relate solely to one class), dividend, liquidation and other rights, and the same terms and conditions, except that under distribution plans pursuant to Rule 12b-1 under the 1940 Act, Class B and Class C shares are subject to higher distribution and/or service fees than Class A, Investor Class and Class R2 shares. Class I and Class R6 shares are not subject to a distribution and/or service fee. Class R2 and Class R3 shares are subject to a shareholder service fee. This is in addition to any fees paid under a distribution plan, where applicable.
At a meeting held on September 25-26, 2023, the Board of Trustees (the “Board”) of the Trust, after careful consideration of a number of factors and upon the recommendation of the Fund's investment adviser, New York Life Investment Management LLC (“New York Life Investments” or the "Manager"), approved a proposal to liquidate Class R2 and Class R3 shares of the Fund on or about February 28, 2024, pursuant to the terms of a plan of liquidation.
In addition, the Board approved a proposal to accelerate the conversion of the Fund’s Class B shares into Class A shares, or Investor Class shares, based on shareholder eligibility. Class B shareholders of the Fund will receive Class A shares of the Fund if they hold at least $15,000 of Class B shares of the Fund on or around February 28, 2024; otherwise, Class B shareholders of the Fund will receive Investor Class shares of the Fund.
The Fund's investment objective is to seek total return by investing primarily in domestic and foreign debt securities.
| 40 | MainStay MacKay Strategic Bond Fund |
Note 2–Significant Accounting Policies
The Fund is an investment company and accordingly follows the investment company accounting and reporting guidance of the Financial Accounting Standards Board (“FASB”) Accounting Standards Codification Topic 946 Financial Services—Investment Companies. The Fund prepares its financial statements in accordance with generally accepted accounting principles (“GAAP”) in the United States of America and follows the significant accounting policies described below.
(A) Securities Valuation. Investments are usually valued as of the close of regular trading on the New York Stock Exchange (the "Exchange") (usually 4:00 p.m. Eastern time) on each day the Fund is open for business ("valuation date").
Pursuant to Rule 2a-5 under the 1940 Act, the Board has designated New York Life Investments as its Valuation Designee (the "Valuation Designee"). The Valuation Designee is responsible for performing fair valuations relating to all investments in the Fund’s portfolio for which market quotations are not readily available; periodically assessing and managing material valuation risks; establishing and applying fair value methodologies; testing fair valuation methodologies; evaluating and overseeing pricing services; ensuring appropriate segregation of valuation and portfolio management functions; providing quarterly, annual and prompt reporting to the Board, as appropriate; identifying potential conflicts of interest; and maintaining appropriate records. The Valuation Designee has established a valuation committee ("Valuation Committee") to assist in carrying out the Valuation Designee’s responsibilities and establish prices of securities for which market quotations are not readily available. The Fund's and the Valuation Designee's policies and procedures ("Valuation Procedures") govern the Valuation Designee’s selection and application of methodologies for determining and calculating the fair value of Fund investments. The Valuation Designee may value the Fund's portfolio securities for which market quotations are not readily available and other Fund assets utilizing inputs from pricing services and other third-party sources. The Valuation Committee meets (in person, via electronic mail or via teleconference) on an ad-hoc basis to determine fair valuations and on a quarterly basis to review fair value events with respect to certain securities for which market quotations are not readily available, including valuation risks and back-testing results, and preview reports to the Board.
The Valuation Committee establishes prices of securities for which market quotations are not readily available based on such methodologies and measurements on a regular basis after considering information that is reasonably available and deemed relevant by the Valuation Committee. The Board shall oversee the Valuation Designee and review fair valuation materials on a prompt, quarterly and annual basis and approve proposed revisions to the Valuation Procedures.
Investments for which market quotations are not readily available are valued at fair value as determined in good faith pursuant to the Valuation Procedures. A market quotation is readily available only when that quotation is a quoted price (unadjusted) in active markets for identical
investments that the Fund can access at the measurement date, provided that a quotation will not be readily available if it is not reliable. "Fair value" is defined as the price the Fund would reasonably expect to receive upon selling an asset or liability in an orderly transaction to an independent buyer in the principal or most advantageous market for the asset or liability. Fair value measurements are determined within a framework that establishes a three-tier hierarchy that maximizes the use of observable market data and minimizes the use of unobservable inputs to establish a classification of fair value measurements for disclosure purposes. "Inputs" refer broadly to the assumptions that market participants would use in pricing the asset or liability, including assumptions about risk, such as the risk inherent in a particular valuation technique used to measure fair value using a pricing model and/or the risk inherent in the inputs for the valuation technique. Inputs may be observable or unobservable. Observable inputs reflect the assumptions market participants would use in pricing the asset or liability based on market data obtained from sources independent of the Fund. Unobservable inputs reflect the Fund’s own assumptions about the assumptions market participants would use in pricing the asset or liability based on the information available. The inputs or methodology used for valuing assets or liabilities may not be an indication of the risks associated with investing in those assets or liabilities. The three-tier hierarchy of inputs is summarized below.
| • | Level 1—quoted prices (unadjusted) in active markets for an identical asset or liability |
| • | Level 2—other significant observable inputs (including quoted prices for a similar asset or liability in active markets, interest rates and yield curves, prepayment speeds, credit risk, etc.) |
| • | Level 3—significant unobservable inputs (including the Fund's own assumptions about the assumptions that market participants would use in measuring fair value of an asset or liability) |
The level of an asset or liability within the fair value hierarchy is based on the lowest level of an input, both individually and in the aggregate, that is significant to the fair value measurement. The aggregate value by input level of the Fund’s assets and liabilities as of October 31, 2023, is included at the end of the Portfolio of Investments.
The Fund may use third-party vendor evaluations, whose prices may be derived from one or more of the following standard inputs, among others:
| • Benchmark yields | • Reported trades |
| • Broker/dealer quotes | • Issuer spreads |
| • Two-sided markets | • Benchmark securities |
| • Bids/offers | • Reference data (corporate actions or material event notices) |
| • Industry and economic events | • Comparable bonds |
| • Monthly payment information | |
An asset or liability for which a market quotation is not readily available is valued by methods deemed reasonable in good faith by the Valuation Committee, following the Valuation Procedures to represent fair value. Under these procedures, the Valuation Designee generally uses a
Notes to Financial Statements (continued)
market-based approach which may use related or comparable assets or liabilities, recent transactions, market multiples, book values and other relevant information. The Valuation Designee may also use an income-based valuation approach in which the anticipated future cash flows of the asset or liability are discounted to calculate fair value. Discounts may also be applied due to the nature and/or duration of any restrictions on the disposition of the asset or liability. Fair value represents a good faith approximation of the value of a security. Fair value determinations involve the consideration of a number of subjective factors, an analysis of applicable facts and circumstances and the exercise of judgment. As a result, it is possible that the fair value for a security determined in good faith in accordance with the Valuation Procedures may differ from valuations for the same security determined for other funds using their own valuation procedures. Although the Valuation Procedures are designed to value a security at the price the Fund may reasonably expect to receive upon the security's sale in an orderly transaction, there can be no assurance that any fair value determination thereunder would, in fact, approximate the amount that the Fund would actually realize upon the sale of the security or the price at which the security would trade if a reliable market price were readily available. During the year ended October 31, 2023, there were no material changes to the fair value methodologies.
Securities which may be valued in this manner include, but are not limited to: (i) a security for which trading has been halted or suspended or otherwise does not have a readily available market quotation on a given day; (ii) a debt security that has recently gone into default and for which there is not a current market quotation; (iii) a security of an issuer that has entered into a restructuring; (iv) a security that has been delisted from a national exchange; (v) a security subject to trading collars for which no or limited trading takes place; and (vi) a security whose principal market has been temporarily closed at a time when, under normal conditions, it would be open. Securities valued in this manner are generally categorized as Level 2 or 3 in the hierarchy. No securities held by the Fund as of October 31, 2023, were fair valued in such a manner.
Equity securities, rights and warrants, if applicable, are valued at the last quoted sales prices as of the close of regular trading on the relevant exchange on each valuation date. Securities that are not traded on the valuation date are valued at the mean of the last quoted bid and ask prices. Prices are normally taken from the principal market in which each security trades. These securities are generally categorized as Level 1 in the hierarchy.
Investments in mutual funds, including money market funds, are valued at their respective NAVs at the close of business each day on the valuation date. These securities are generally categorized as Level 1 in the hierarchy.
Futures contracts are valued at the last posted settlement price on the market where such futures are primarily traded. These securities are generally categorized as Level 1 in the hierarchy.
Debt securities (other than convertible and municipal bonds) are valued at the evaluated bid prices (evaluated mean prices in the case of convertible
and municipal bonds) supplied by a pricing agent or broker selected by the Valuation Designee, in consultation with the Subadvisor. The evaluations are market-based measurements processed through a pricing application and represents the pricing agent’s good faith determination as to what a holder may receive in an orderly transaction under market conditions. The rules-based logic utilizes valuation techniques that reflect participants’ assumptions and vary by asset class and per methodology, maximizing the use of relevant observable data including quoted prices for similar assets, benchmark yield curves and market corroborated inputs. The evaluated bid or mean prices are deemed by the Valuation Designee, in consultation with the Subadvisor, to be representative of market values at the regular close of trading of the Exchange on each valuation date. Debt securities purchased on a delayed delivery basis are marked to market daily until settlement at the forward settlement date. Debt securities, including corporate bonds, U.S. government and federal agency bonds, municipal bonds, foreign bonds, convertible bonds, asset-backed securities and mortgage-backed securities are generally categorized as Level 2 in the hierarchy.
Loan assignments, participations and commitments are valued at the average of bid quotations obtained from the engaged independent pricing service and are generally categorized as Level 2 in the hierarchy. Certain loan assignments, participations and commitments may be valued by utilizing significant unobservable inputs obtained from the pricing service and are generally categorized as Level 3 in the hierarchy. No securities held by the Fund as of October 31, 2023 were fair valued utilizing significant unobservable inputs obtained from the pricing service.
Temporary cash investments acquired in excess of 60 days to maturity at the time of purchase are valued using the latest bid prices or using valuations based on a matrix system (which considers such factors as security prices, yields, maturities and ratings), both as furnished by independent pricing services. Temporary cash investments that mature in 60 days or less at the time of purchase ("Short-Term Investments") are valued using the amortized cost method of valuation, unless the use of such method would be inappropriate. The amortized cost method involves valuing a security at its cost on the date of purchase and thereafter assuming a constant amortization to maturity of the difference between such cost and the value on maturity date. Amortized cost approximates the current fair value of a security. Securities valued using the amortized cost method are not valued using quoted prices in an active market and are generally categorized as Level 2 in the hierarchy.
The information above is not intended to reflect an exhaustive list of the methodologies that may be used to value portfolio investments. The Valuation Procedures permit the use of a variety of valuation methodologies in connection with valuing portfolio investments. The methodology used for a specific type of investment may vary based on the market data available or other considerations. The methodologies summarized above may not represent the specific means by which portfolio investments are valued on any particular business day.
A portfolio investment may be classified as an illiquid investment under the Fund's written liquidity risk management program and related
| 42 | MainStay MacKay Strategic Bond Fund |
procedures (“Liquidity Program”). Illiquidity of an investment might prevent the sale of such investment at a time when the Manager or the Subadvisor might wish to sell, and these investments could have the effect of decreasing the overall level of the Fund's liquidity. Further, the lack of an established secondary market may make it more difficult to value illiquid investments, requiring the Fund to rely on judgments that may be somewhat subjective in measuring value, which could vary materially from the amount that the Fund could realize upon disposition. Difficulty in selling illiquid investments may result in a loss or may be costly to the Fund. An illiquid investment is any investment that the Manager or Subadvisor reasonably expects cannot be sold or disposed of in current market conditions in seven calendar days or less without the sale or disposition significantly changing the market value of the investment. The liquidity classification of each investment will be made using information obtained after reasonable inquiry and taking into account, among other things, relevant market, trading and investment-specific considerations in accordance with the Liquidity Program. Illiquid investments are often fair valued in accordance with the Fund's procedures described above. The liquidity of the Fund's investments was determined as of October 31, 2023, and can change at any time. Illiquid investments as of October 31, 2023, are shown in the Portfolio of Investments.
(B) Income Taxes. The Fund's policy is to comply with the requirements of the Internal Revenue Code of 1986, as amended (the “Internal Revenue Code”), applicable to regulated investment companies and to distribute all of its taxable income to the shareholders of the Fund within the allowable time limits.
The Manager evaluates the Fund’s tax positions to determine if the tax positions taken meet the minimum recognition threshold in connection with accounting for uncertainties in income tax positions taken or expected to be taken for the purposes of measuring and recognizing tax liabilities in the financial statements. Recognition of tax benefits of an uncertain tax position is permitted only to the extent the position is “more likely than not” to be sustained assuming examination by taxing authorities. The Manager analyzed the Fund's tax positions taken on federal, state and local income tax returns for all open tax years (for up to three tax years) and has concluded that no provisions for federal, state and local income tax are required in the Fund's financial statements. The Fund's federal, state and local income tax and federal excise tax returns for tax years for which the applicable statutes of limitations have not expired are subject to examination by the Internal Revenue Service and state and local departments of revenue.
(C) Dividends and Distributions to Shareholders. Dividends and distributions are recorded on the ex-dividend date. The Fund intends to declare and pay dividends from net investment income, if any, at least monthly and distributions from net realized capital and currency gains, if any, at least annually. Unless a shareholder elects otherwise, all dividends and distributions are reinvested at NAV in the same class of shares of the Fund. Dividends and distributions to shareholders are determined in
accordance with federal income tax regulations and may differ from determinations using GAAP.
(D) Security Transactions and Investment Income. The Fund records security transactions on the trade date. Realized gains and losses on security transactions are determined using the identified cost method. Dividend income is recognized on the ex-dividend date, net of any foreign tax withheld at the source, and interest income is accrued as earned using the effective interest rate method and includes any realized gains and losses from repayments of principal on mortgage-backed securities. Distributions received from real estate investment trusts may be classified as dividends, capital gains and/or return of capital. Discounts and premiums on securities purchased for the Fund are accreted and amortized, respectively, on the effective interest rate method.
Investment income and realized and unrealized gains and losses on investments of the Fund are allocated pro rata to the separate classes of shares based upon their relative net assets on the date the income is earned or realized and unrealized gains and losses are incurred.
The Fund may place a debt security on non-accrual status and reduce related interest income by ceasing current accruals and writing off all or a portion of any interest receivables when the collection of all or a portion of such interest has become doubtful. A debt security is removed from non-accrual status when the issuer resumes interest payments or when collectability of interest is reasonably assured.
(E) Expenses. Expenses of the Trust are allocated to the individual Funds in proportion to the net assets of the respective Funds when the expenses are incurred, except where direct allocations of expenses can be made. Expenses (other than transfer agent expenses and fees incurred under the shareholder services plans and/or the distribution plans further discussed in Note 3(B)) are allocated to separate classes of shares pro rata based upon their relative net assets on the date the expenses are incurred. The expenses borne by the Fund, including those of related parties to the Fund, are shown in the Statement of Operations.
Additionally, the Fund may invest in mutual funds, which are subject to management fees and other fees that may cause the costs of investing in mutual funds to be greater than the costs of owning the underlying securities directly. These indirect expenses of mutual funds are not included in the amounts shown as expenses in the Statement of Operations or in the expense ratios included in the Financial Highlights.
(F) Use of Estimates. In preparing financial statements in conformity with GAAP, the Manager makes estimates and assumptions that affect the reported amounts and disclosures in the financial statements. Actual results could differ from those estimates and assumptions.
(G) Futures Contracts. A futures contract is an agreement to purchase or sell a specified quantity of an underlying instrument at a specified future date and price, or to make or receive a cash payment based on the value of a financial instrument (e.g., foreign currency, interest rate, security or securities index). The Fund is subject to risks such as market price risk, leverage risk, liquidity risk, counterparty risk,
Notes to Financial Statements (continued)
operational risk, legal risk and/or interest rate risk in the normal course of investing in these contracts. Upon entering into a futures contract, the Fund is required to pledge to the broker or futures commission merchant an amount of cash and/or U.S. government securities equal to a certain percentage of the collateral amount, known as the “initial margin.” During the period the futures contract is open, changes in the value of the contract are recognized as unrealized appreciation or depreciation by marking to market such contract on a daily basis to reflect the market value of the contract at the end of each day’s trading. The Fund agrees to receive from or pay to the broker or futures commission merchant an amount of cash equal to the daily fluctuation in the value of the contract. Such receipts or payments are known as “variation margin.” When the futures contract is closed, the Fund records a realized gain or loss equal to the difference between the proceeds from (or cost of) the closing transaction and the Fund's basis in the contract.
The use of futures contracts involves, to varying degrees, elements of market risk in excess of the amount recognized in the Statement of Assets and Liabilities. The contract or notional amounts and variation margin reflect the extent of the Fund's involvement in open futures positions. There are several risks associated with the use of futures contracts as hedging techniques. There can be no assurance that a liquid market will exist at the time when the Fund seeks to close out a futures contract. If no liquid market exists, the Fund would remain obligated to meet margin requirements until the position is closed. Futures contracts may involve a small initial investment relative to the risk assumed, which could result in losses greater than if the Fund did not invest in futures contracts. Futures contracts may be more volatile than direct investments in the instrument underlying the futures and may not correlate to the underlying instrument, causing a given hedge not to achieve its objectives. The Fund's activities in futures contracts have minimal counterparty risk as they are conducted through regulated exchanges that guarantee the futures against default by the counterparty. In the event of a bankruptcy or insolvency of a futures commission merchant that holds margin on behalf of the Fund, the Fund may not be entitled to the return of the entire margin owed to the Fund, potentially resulting in a loss. The Fund may invest in futures contracts to seek enhanced returns or to reduce the risk of loss by hedging certain of its holdings. The Fund's investment in futures contracts and other derivatives may increase the volatility of the Fund's NAVs and may result in a loss to the Fund. Open futures contracts as of October 31, 2023, are shown in the Portfolio of Investments.
(H) Loan Assignments, Participations and Commitments. The Fund may invest in loan assignments and participations ("loans"). Commitments are agreements to make money available to a borrower in a specified amount, at a specified rate and within a specified time. The Fund records an investment when the borrower withdraws money on a commitment or when a funded loan is purchased (trade date) and records interest as earned. These loans pay interest at rates that are periodically reset by reference to a base lending rate plus a spread. These base lending rates are generally the prime rate offered by a designated U.S.
bank, the Secured Overnight Financing Rate ("SOFR") or an alternative reference rate.
The loans in which the Fund may invest are generally readily marketable, but may be subject to some restrictions on resale. For example, the Fund may be contractually obligated to receive approval from the agent bank and/or borrower prior to the sale of these investments. If the Fund purchases an assignment from a lender, the Fund will generally have direct contractual rights against the borrower in favor of the lender. If the Fund purchases a participation interest either from a lender or a participant, the Fund typically will have established a direct contractual relationship with the seller of the participation interest, but not with the borrower. Consequently, the Fund is subject to the credit risk of the lender or participant who sold the participation interest to the Fund, in addition to the usual credit risk of the borrower. In the event that the borrower, selling participant or intermediate participants become insolvent or enter into bankruptcy, the Fund may incur certain costs and delays in realizing payment, or may suffer a loss of principal and/or interest.
Unfunded commitments represent the remaining obligation of the Fund to the borrower. At any point in time, up to the maturity date of the issue, the borrower may demand the unfunded portion. Unfunded amounts, if any, are marked to market and any unrealized gains or losses are recorded in the Statement of Assets and Liabilities. As of October 31, 2023, the Fund did not hold any unfunded commitments.
(I) Swap Contracts. The Fund may enter into credit default, interest rate, equity, index and currency exchange rate swap contracts (“swaps”). In a typical swap transaction, two parties agree to exchange the future returns (or differentials in rates of future returns) earned or realized at periodic intervals on a particular investment or instrument based on a notional principal amount. Generally, the Fund will enter into a swap on a net basis, which means that the two payment streams under the swap are netted, with the Fund receiving or paying (as the case may be) only the net amount of the two payment streams. Therefore, the Fund's current obligation under a swap generally will be equal to the net amount to be paid or received under the swap, based on the relative value of notional positions attributable to each counterparty to the swap. The payments may be adjusted for transaction costs, interest payments, the amount of interest paid on the investment or instrument or other factors. Collateral, in the form of cash or securities, may be required to be held in segregated accounts with the custodian bank or broker in accordance with the terms of the swap. Swap agreements are privately negotiated in the over the counter (“OTC”) market and may be executed in a multilateral or other trade facilities platform, such as a registered commodities exchange (“centrally cleared swaps”).
Certain standardized swaps, including certain credit default and interest rate swaps, are subject to mandatory clearing and exchange-trading, and more types of standardized swaps are expected to be subject to mandatory clearing and exchange-trading in the future. The counterparty risk for exchange-traded and cleared derivatives is expected to be generally lower than for uncleared derivatives, but cleared contracts are not risk-free. In a cleared derivative transaction, the Fund typically enters
| 44 | MainStay MacKay Strategic Bond Fund |
into the transaction with a financial institution counterparty, and performance of the transaction is effectively guaranteed by a central clearinghouse, thereby reducing or eliminating the Fund's exposure to the credit risk of its original counterparty. The Fund will be required to post specified levels of margin with the clearinghouse or at the instruction of the clearinghouse; the margin required by a clearinghouse may be greater than the margin the Fund would be required to post in an uncleared transaction. As of October 31, 2023, the Fund did not hold any swap positions.
Swaps are marked to market daily based upon quotations from pricing agents, brokers, or market makers and the change in value, if any, is recorded as unrealized appreciation or depreciation. Any payments made or received upon entering into a swap would be amortized or accreted over the life of the swap and recorded as a realized gain or loss. Early termination of a swap is recorded as a realized gain or loss. Daily changes in valuation of centrally cleared swaps, if any, are recorded as a receivable or payable for the change in value as appropriate on the Statement of Assets and Liabilities.
The Fund bears the risk of loss of the amount expected to be received under a swap in the event of the default or bankruptcy of the swap counterparty. The Fund may be able to eliminate its exposure under a swap either by assignment or other disposition, or by entering into an offsetting swap with the same party or a similar credit-worthy party. Swaps are not actively traded on financial markets. Entering into swaps involves elements of credit, market, leverage, liquidity, operational, counterparty and legal/documentation risk in excess of the amounts recognized on the Statement of Assets and Liabilities. Such risks involve the possibilities that there will be no liquid market for these swaps, that the counterparty to the swaps may default on its obligation to perform or disagree as to the meaning of the contractual terms in the swaps and that there may be unfavorable changes in interest rates, the price of the index or the security underlying these transactions, among other risks.
(J) Foreign Currency Transactions. The Fund's books and records are maintained in U.S. dollars. Prices of securities denominated in foreign currency amounts are translated into U.S. dollars at the mean between the buying and selling rates last quoted by any major U.S. bank at the following dates:
(i) market value of investment securities, other assets and liabilities— at the valuation date; and
(ii) purchases and sales of investment securities, income and expenses—at the date of such transactions.
The assets and liabilities that are denominated in foreign currency amounts are presented at the exchange rates and market values at the close of the period. The realized and unrealized changes in net assets arising from fluctuations in exchange rates and market prices of securities are not separately presented.
Net realized gain (loss) on foreign currency transactions represents net currency gains or losses realized as a result of differences between the
amounts of securities sale proceeds or purchase cost, dividends, interest and withholding taxes as recorded on the Fund's books, and the U.S. dollar equivalent amount actually received or paid. Net currency gains or losses from valuing such foreign currency denominated assets and liabilities, other than investments at valuation date exchange rates, are reflected in unrealized foreign exchange gains or losses.
(K) Securities Lending. In order to realize additional income, the Fund may engage in securities lending, subject to the limitations set forth in the 1940 Act and relevant guidance by the staff of the Securities and Exchange Commission (“SEC”). If the Fund engages in securities lending, the Fund will lend through its custodian, JPMorgan Chase Bank, N.A., ("JPMorgan"), acting as securities lending agent on behalf of the Fund. Under the current arrangement, JPMorgan will manage the Fund's collateral in accordance with the securities lending agency agreement between the Fund and JPMorgan, and indemnify the Fund against counterparty risk. The loans will be collateralized by cash (which may be invested in a money market fund) and/or non-cash collateral (which may include U.S. Treasury securities and/or U.S. government agency securities issued or guaranteed by the United States government or its agencies or instrumentalities) at least equal at all times to the market value of the securities loaned. Non-cash collateral held at year end is segregated and cannot be transferred by the Fund. The Fund bears the risk of delay in recovery of, or loss of rights in, the securities loaned. The Fund may also record a realized gain or loss on securities deemed sold due to a borrower’s inability to return securities on loan. The Fund bears the risk of any loss on investment of cash collateral. The Fund will receive compensation for lending its securities in the form of fees or it will retain a portion of interest earned on the investment of any cash collateral. The Fund will also continue to receive interest and dividends on the securities loaned and any gain or loss in the market price of the securities loaned that may occur during the term of the loan will be for the account of the Fund. Income earned from securities lending activities, if any, is reflected in the Statement of Operations. Securities on loan as of October 31, 2023, are shown in the Portfolio of Investments.
(L) Dollar Rolls. The Fund may enter into dollar roll transactions in which it sells mortgage-backed securities ("MBS") from its portfolio to a counterparty from whom it simultaneously agrees to buy a similar security on a delayed delivery basis. The Fund generally transfers MBS where the MBS are "to be announced," therefore, the Fund accounts for these transactions as purchases and sales.
When accounted for as purchase and sales, the securities sold in connection with the dollar rolls are removed from the portfolio and a realized gain or loss is recognized. The securities the Fund has agreed to acquire are included at market value in the Portfolio of Investments and liabilities for such purchase commitments are included as payables for investments purchased. During the roll period, the Fund foregoes principal and interest paid on the securities. The Fund is compensated by the difference between the current sales price and the forward price for the future as well as by the earnings on the cash proceeds of the initial sale. Dollar rolls may be renewed without physical delivery of the
Notes to Financial Statements (continued)
securities subject to the contract. Dollar roll transactions involve certain risks, including the risk that the securities returned to the Fund at the end of the roll period, while substantially similar, could be inferior to what was initially sold to the counterparty. During the year ended October 31, 2023, the Fund did not invest in Dollar Rolls.
(M) Debt and Foreign Securities Risk. The ability of issuers of debt securities held by the Fund to meet their obligations may be affected by, among other things, economic or political developments in a specific country, industry or region. Debt securities are also subject to the risks associated with changes in interest rates. The Fund primarily invests in high yield debt securities (commonly referred to as “junk bonds”), which are considered speculative because they present a greater risk of loss, including default, than higher rated debt securities. These securities pay investors a premium—a higher interest rate or yield than investment grade debt securities—because of the increased risk of loss. These securities can also be subject to greater price volatility. In times of unusual or adverse market, economic or political conditions, these securities may experience higher than normal default rates.
Investments in the Fund are not guaranteed, even though some of the Fund’s underlying investments are guaranteed by the U.S. government or its agencies or instrumentalities. The principal risk of mortgage-related and asset-backed securities is that the underlying debt may be prepaid ahead of schedule, if interest rates fall, thereby reducing the value of the Fund’s investment. If interest rates rise, less of the debt may be prepaid and the Fund may lose money because the Fund may be unable to invest in higher yielding assets. The Fund is subject to interest-rate risk and can lose principal value when interest rates rise. Bonds are also subject to credit risk, in which the bond issuer may fail to pay interest and principal in a timely manner.
The Fund may invest in loans which are usually rated below investment grade and are generally considered speculative because they present a greater risk of loss, including default, than higher rated debt securities. These investments pay investors a higher interest rate than investment grade debt securities because of the increased risk of loss. Although certain loans are collateralized, there is no guarantee that the value of the collateral will be sufficient to repay the loan. In a recession or serious credit event, the value of these investments could decline significantly. As a result of these and other events, the Fund’s NAVs could go down and you could lose money.
In addition, loans generally are subject to the extended settlement periods that may be longer than seven days. As a result, the Fund may be adversely affected by selling other investments at an unfavorable time and/or under unfavorable conditions or engaging in borrowing transactions, such as borrowing against its credit facility, to raise cash to meet redemption obligations or pursue other investment opportunities.
In certain circumstances, loans may not be deemed to be securities. As a result, the Fund may not have the protection of anti-fraud provisions of the federal securities laws. In such cases, the Fund generally must rely on
the contractual provisions in the loan agreement and common-law fraud protections under applicable state law.
The ability of issuers of debt securities held by the Fund to meet their obligations may be affected by, among other things, economic or political developments in a specific country, industry or region. Debt securities are also subject to the risks associated with changes in interest rates. The Fund may invest in foreign securities, which carry certain risks that are in addition to the usual risks inherent in domestic securities. Foreign regulatory regimes and securities markets can have less stringent investor protections and disclosure standards and less liquid trading markets than U.S. regulatory regimes and securities markets, and can experience political, social and economic developments that may affect the value of investments in foreign securities. These risks include those resulting from currency fluctuations, future adverse political or economic developments and possible imposition of currency exchange blockages or other foreign governmental laws or restrictions. Economic sanctions and other similar governmental actions or developments could, among other things, effectively restrict or eliminate the Fund’s ability to purchase or sell certain foreign securities or groups of foreign securities, and thus may make the Fund’s investments in such securities less liquid or more difficult to value. These risks are likely to be greater in emerging markets than in developed markets. The ability of issuers of debt securities held by the Fund to meet their obligations may be affected by, among other things, economic or political developments in a specific country, industry or region.
(N) Counterparty Credit Risk. In order to better define its contractual rights and to secure rights that will help the Fund mitigate its counterparty risk, the Fund may enter into an International Swaps and Derivatives Association, Inc. Master Agreement (“ISDA Master Agreement”) or similar agreement with its counterparties. An ISDA Master Agreement is a bilateral agreement between the Fund and a counterparty that governs certain OTC derivatives and typically contains collateral posting terms and netting provisions. Under an ISDA Master Agreement, the Fund may, under certain circumstances, offset with the counterparty certain derivative financial instruments’ payables and/ or receivables with collateral held and/or posted and create one single net payment. The provisions of the ISDA Master Agreement typically permit a single net payment in the event of default including the bankruptcy or insolvency of the counterparty. Bankruptcy or insolvency laws of a particular jurisdiction may restrict or prohibit the right of offset in bankruptcy, insolvency or other events. In addition, certain ISDA Master Agreements may contain provisions for early termination of OTC derivative transactions in the event the net assets of the Fund decline below specific levels or if the Fund fails to meet the terms of its ISDA Master Agreements. The result would cause the Fund to accelerate payment of any net liability owed to the counterparty.
For financial reporting purposes, the Fund does not offset derivative assets and derivative liabilities that are subject to netting arrangements, if any, in the Statement of Assets and Liabilities.
| 46 | MainStay MacKay Strategic Bond Fund |
(O) LIBOR Replacement Risk. The Fund may invest in certain debt securities, derivatives or other financial instruments that have relied or continue to rely on LIBOR, as a “benchmark” or “reference rate” for various interest rate calculations. As of January 1, 2022, the United Kingdom Financial Conduct Authority ("FCA"), which regulates LIBOR, ceased its active encouragement of banks to provide the quotations needed to sustain most LIBOR rates due to the absence of an active market for interbank unsecured lending and other reasons. In connection with supervisory guidance from U.S. regulators, certain U.S. regulated entities have generally ceased to enter into certain new LIBOR contracts after January 1, 2022. On March 15, 2022, the Adjustable Interest Rate (LIBOR) Act was signed into law. This law provides a statutory fallback mechanism on a nationwide basis to replace LIBOR with a benchmark rate that is selected by the Board of Governors of the Federal Reserve System and based on Secured Overnight Financing Rate ("SOFR") (which measures the cost of overnight borrowings through repurchase agreement transactions collateralized with U.S. Treasury securities) for tough legacy contracts. On February 27, 2023, the Federal Reserve System’s final rule in connection with this law became effective, establishing benchmark replacements based on SOFR and Term SOFR (a forward-looking measurement of market expectations of SOFR implied from certain derivatives markets) for applicable tough legacy contracts governed by U.S. law. In addition, the FCA has announced that it will require the publication of synthetic LIBOR for the one-month, three-month and six-month U.S. Dollar LIBOR settings after June 30, 2023 through at least September 30, 2024. Certain of the Fund's investments may involve individual tough legacy contracts which may be subject to the Adjustable Interest Rate (LIBOR) Act or synthetic LIBOR and no assurances can be given that these measures will have had the intended effects. Although the transition process away from LIBOR for many instruments has been completed, some LIBOR use is continuing and there are potential effects related to the transition away from LIBOR or continued use of LIBOR on the Fund.
The elimination of LIBOR or changes to other reference rates or any other changes or reforms to the determination or supervision of reference rates could have an adverse impact on the market for, or value of, any securities or payments linked to those reference rates, which may adversely affect the Fund's performance and/or net asset value. It could also lead to a reduction in the interest rates on, and the value of, some LIBOR-based investments and reduce the effectiveness of hedges mitigating risk in connection with LIBOR-based investments. Uncertainty and risk also remain regarding the willingness and ability of issuers and
lenders to include enhanced provisions in new and existing contracts or instruments. Consequently, the transition away from LIBOR to other reference rates may lead to increased volatility and illiquidity in markets that are tied to LIBOR, fluctuations in values of LIBOR-related investments or investments in issuers that utilize LIBOR, increased difficulty in borrowing or refinancing and diminished effectiveness of hedging strategies, adversely affecting the Fund's performance. Furthermore, the risks associated with the expected discontinuation of LIBOR and transition may be exacerbated if the work necessary to effect an orderly transition to an alternative reference rate is not completed in a timely manner. The usefulness of LIBOR as a benchmark could deteriorate anytime during this transition period. Any such effects of the transition process, including unforeseen effects, could result in losses to the Fund.
(P) Indemnifications. Under the Trust’s organizational documents, its officers and trustees are indemnified against certain liabilities that may arise out of performance of their duties to the Trust. Additionally, in the normal course of business, the Fund enters into contracts with third-party service providers that contain a variety of representations and warranties and that may provide general indemnifications. The Fund's maximum exposure under these arrangements is unknown, as this would involve future claims that may be made against the Fund that have not yet occurred. The Manager believes that the risk of loss in connection with these potential indemnification obligations is remote. However, there can be no assurance that material liabilities related to such obligations will not arise in the future, which could adversely impact the Fund.
(Q) Quantitative Disclosure of Derivative Holdings. The following tables show additional disclosures related to the Fund's derivative and hedging activities, including how such activities are accounted for and their effect on the Fund's financial positions, performance and cash flows.
The Fund entered into futures contracts to help manage the duration and yield curve positioning of the portfolio while minimizing the exposure to wider bid/ask spreads in traditional bonds. The Fund entered into interest rate and credit default swap contracts in order to obtain a desired return at a lower cost to the Fund, rather than directly investing in an instrument yielding that desired return or to hedge against credit and interest rate risk. The Fund also entered into foreign currency forward contracts to gain exposure to a particular currency or to hedge against the risk of loss due to changing currency exchange rates. These derivatives are not accounted for as hedging instruments.
Notes to Financial Statements (continued)
Fair value of derivative instruments as of October 31, 2023:
| Asset Derivatives | Interest
Rate
Contracts
Risk | Total |
| Futures Contracts - Net Assets—Net unrealized appreciation on futures contracts (a) | $1,579,946 | $1,579,946 |
| Total Fair Value | $1,579,946 | $1,579,946 |
| (a) | Includes cumulative appreciation (depreciation) of futures contracts as reported in the Portfolio of Investments. Only current day’s variation margin is reported within the Statement of Assets and Liabilities. |
| Liability Derivatives | Interest
Rate
Contracts
Risk | Total |
| Futures Contracts - Net Assets—Net unrealized depreciation on futures contracts (a) | $(4,678,218) | $(4,678,218) |
| Total Fair Value | $(4,678,218) | $(4,678,218) |
| (a) | Includes cumulative appreciation (depreciation) of futures contracts as reported in the Portfolio of Investments. Only current day’s variation margin is reported within the Statement of Assets and Liabilities. |
The effect of derivative instruments on the Statement of Operations for the year ended October 31, 2023:
| Net Realized Gain (Loss) from: | Interest
Rate
Contracts
Risk | Total |
| Futures Transactions | $2,542,758 | $2,542,758 |
| Swap Transactions | 492,299 | 492,299 |
| Total Net Realized Gain (Loss) | $3,035,057 | $3,035,057 |
| Net Change in Unrealized Appreciation (Depreciation) | Interest
Rate
Contracts
Risk | Total |
| Futures Contracts | $(3,984,032) | $(3,984,032) |
| Swap Contracts | (564,729) | (564,729) |
| Total Net Change in Unrealized Appreciation (Depreciation) | $(4,548,761) | $(4,548,761) |
| Average Notional Amount | Total |
| Futures Contracts Long | $ 82,407,953 |
| Futures Contracts Short | $(189,622,758) |
| Swap Contracts Long (a) | $ 81,000,000 |
| (a) | Positions were open for four months during the reporting period. |
Note 3–Fees and Related Party Transactions
(A) Manager and Subadvisor. New York Life Investments, a registered investment adviser and an indirect, wholly-owned subsidiary of New York Life Insurance Company ("New York Life"), serves as the Fund's Manager, pursuant to an Amended and Restated Management Agreement ("Management Agreement"). The Manager provides offices, conducts clerical, recordkeeping and bookkeeping services and keeps most of the financial and accounting records required to be maintained by the Fund. Except for the portion of salaries and expenses that are the responsibility
of the Fund, the Manager pays the salaries and expenses of all personnel affiliated with the Fund and certain operational expenses of the Fund. The Fund reimburses New York Life Investments in an amount equal to the portion of the compensation of the Chief Compliance Officer attributable to the Fund. MacKay Shields LLC ("MacKay Shields" or the "Subadvisor"), a registered investment adviser and an indirect, wholly-owned subsidiary of New York Life, serves as the Subadvisor to the Fund and is responsible for the day-to-day portfolio management of the Fund. Pursuant to the terms of an Amended and Restated Subadvisory Agreement ("Subadvisory Agreement") between New York Life Investments and MacKay Shields, New York Life Investments pays for the services of the Subadvisor.
Effective February 28, 2023, pursuant to the Management Agreement, the Fund pays the Manager a monthly fee for the services performed and the facilities furnished at an annual rate of the Fund’s average daily net
| 48 | MainStay MacKay Strategic Bond Fund |
assets as follows: 0.60% up to $500 million; 0.55% from $500 million to $1 billion; 0.50% from $1 billion to $5 billion; and 0.475% in excess of $5 billion.
Prior to February 28, 2023, the Fund paid the Manager a monthly fee for the services performed and the facilities furnished at an annual rate of the Fund’s average daily net assets as follows: 0.60% up to $500 million; 0.55% from $500 million to $1 billion; 0.50% from $1 billion to $5 billion; and 0.475% in excess of $5 billion, plus a fee for fund accounting services previously provided by New York Life Investments under a separate fund accounting agreement furnished at an annual rate of the Fund’s average daily net assets as follows: 0.05% up to $20 million; 0.0333% from $20 million to $100 million; and 0.01% in excess of $100 million. During the year ended October 31, 2023, the effective management fee rate was 0.59%, inclusive of a fee for fund accounting services of less than one-tenth percent of the Fund’s average daily net assets.
New York Life Investments has contractually agreed to waive fees and/or reimburse expenses so that Total Annual Fund Operating Expenses (excluding taxes, interest expenses (including interest on securities sold short), litigation, extraordinary expenses, brokerage and other transaction expenses relating to the purchase or sale of portfolio investments and acquired (underlying) fund fees and expenses) for Class I shares do not exceed 0.70% of its average daily net assets, and, for Class R6, do not exceed those of Class I. This agreement will remain in effect until February 28, 2024, and shall renew automatically for one-year terms unless New York Life Investments provides written notice of termination prior to the start of the next term or upon approval of the Board.
During the year ended October 31, 2023, New York Life Investments earned fees from the Fund in the amount of $4,073,232 and waived and/or reimbursed in the amount of $411,848 and paid the Subadvisor in the amount of $1,815,285.
JPMorgan provides sub-administration and sub-accounting services to the Fund pursuant to an agreement with New York Life Investments. These services include calculating the daily NAVs of the Fund, maintaining the general ledger and sub-ledger accounts for the calculation of the Fund's NAVs, and assisting New York Life Investments in conducting various aspects of the Fund's administrative operations. For providing these services to the Fund, JPMorgan is compensated by New York Life Investments.
Pursuant to an agreement between the Trust and New York Life Investments, New York Life Investments is responsible for providing or procuring certain regulatory reporting services for the Fund. The Fund will reimburse New York Life Investments for the actual costs incurred by New York Life Investments in connection with providing or procuring these services for the Fund.
(B) Distribution and Service Fees. The Trust, on behalf of the Fund, has entered into a distribution agreement with NYLIFE Distributors LLC (the “Distributor”), an affiliate of New York Life
Investments. The Fund has adopted distribution plans (the “Plans”) in accordance with the provisions of Rule 12b-1 under the 1940 Act.
Pursuant to the Class A, Investor Class and Class R2 Plans, the Distributor receives a monthly fee from the Class A, Investor Class and Class R2 shares at an annual rate of 0.25% of the average daily net assets of the Class A, Investor Class and Class R2 shares for distribution and/or service activities as designated by the Distributor. Pursuant to the Class B and Class C Plans, Class B and Class C shares pay the Distributor a monthly distribution fee at an annual rate of 0.75% of the average daily net assets of the Class B and Class C shares, along with a service fee at an annual rate of 0.25% of the average daily net assets of the Class B and Class C shares, for a total 12b-1 fee of 1.00%. Pursuant to the Class R3 Plan, Class R3 shares pay the Distributor a monthly distribution fee at an annual rate of 0.25% of the average daily net assets of the Class R3 shares, along with a service fee at an annual rate of 0.25% of the average daily net assets of the Class R3 shares, for a total 12b-1 fee of 0.50%. Class I and Class R6 shares are not subject to a distribution and/or service fee.
The Plans provide that the distribution and service fees are payable to the Distributor regardless of the amounts actually expended by the Distributor for distribution of the Fund's shares and service activities.
In accordance with the Shareholder Services Plans for the Class R2 and Class R3 shares, the Manager has agreed to provide, through its affiliates or independent third parties, various shareholder and administrative support services to shareholders of the Class R2 and Class R3 shares. For its services, the Manager, its affiliates or independent third-party service providers are entitled to a shareholder service fee accrued daily and paid monthly at an annual rate of 0.10% of the average daily net assets of the Class R2 and Class R3 shares. This is in addition to any fees paid under the Class R2 and Class R3 Plans.
During the year ended October 31, 2023, shareholder service fees incurred by the Fund were as follows:
| |
| Class R2 | $1,058 |
| Class R3 | 493 |
(C) Sales Charges. The Fund was advised by the Distributor that the amount of initial sales charges retained on sales of Class A and Investor Class shares during the year ended October 31, 2023, were $13,178 and $725, respectively.
The Fund was also advised that the Distributor retained CDSCs on redemptions of Class A, Class B and Class C shares during the year ended October 31, 2023, of $9,174, $15 and $417, respectively.
(D) Transfer, Dividend Disbursing and Shareholder Servicing Agent. NYLIM Service Company LLC, an affiliate of New York Life Investments, is the Fund's transfer, dividend disbursing and shareholder servicing agent pursuant to an agreement between NYLIM Service Company LLC and the Trust. NYLIM Service Company LLC has entered into an agreement with SS&C Global Investor & Distribution Solutions, Inc.
Notes to Financial Statements (continued)
("SS&C"), pursuant to which SS&C performs certain transfer agent services on behalf of NYLIM Service Company LLC. New York Life Investments has contractually agreed to limit the transfer agency expenses charged to the Fund’s share classes to a maximum of 0.35% of that share class’s average daily net assets on an annual basis after deducting any applicable Fund or class-level expense reimbursement or small account fees. This agreement will remain in effect until February 28, 2024, and shall renew automatically for one-year terms unless New York Life Investments provides written notice of termination prior to the start of the next term or upon approval of the Board. During the year ended October 31, 2023, transfer agent expenses incurred by the Fund and any reimbursements, pursuant to the aforementioned Transfer Agency expense limitation agreement, were as follows:
| Class | Expense | Waived |
| Class A | $252,964 | $ — |
| Investor Class | 49,829 | (1,564) |
| Class B | 3,353 | (124) |
| Class C | 59,288 | (2,028) |
| Class I | 661,732 | — |
| Class R2 | 1,479 | — |
| Class R3 | 687 | — |
| Class R6 | 81 | — |
(E) Small Account Fee. Shareholders with small accounts adversely impact the cost of providing transfer agency services. In an effort to reduce total transfer agency expenses, the Fund has implemented a small account fee on certain types of accounts. As described in the Fund's prospectus, certain shareholders with an account balance of less than $1,000 ($5,000 for Class A share accounts) are charged an annual per account fee of $20 (assessed semi-annually), the proceeds from which offset transfer agent fees as reflected in the Statement of Operations. This small account fee will not apply to certain types of accounts as described further in the Fund’s prospectus.
(F) Capital. As of October 31, 2023, New York Life and its affiliates beneficially held shares of the Fund with the values and percentages of net assets as follows:
| Class I | $967,605 | 0.2% |
| Class R3 | 29,909 | 8.1 |
| Class R6 | 27,344 | 0.7 |
Note 4-Federal Income Tax
As of October 31, 2023, the cost and unrealized appreciation (depreciation) of the Fund’s investment portfolio, including applicable derivative contracts and other financial instruments, as determined on a federal income tax basis, were as follows:
| | Federal Tax
Cost | Gross
Unrealized
Appreciation | Gross
Unrealized
(Depreciation) | Net
Unrealized
Appreciation/
(Depreciation) |
| Investments in Securities | $742,152,053 | $4,040,892 | $(63,709,287) | $(59,668,395) |
As of October 31, 2023, the components of accumulated gain (loss) on a tax basis were as follows:
Ordinary
Income | Accumulated
Capital
and Other
Gain (Loss) | Other
Temporary
Differences | Unrealized
Appreciation
(Depreciation) | Total
Accumulated
Gain (Loss) |
| $845,933 | $(199,241,977) | $(305,566) | $(59,667,993) | $(258,369,603) |
The difference between book-basis and tax-basis unrealized appreciation (depreciation) is primarily due to mark to market of futures contracts and cumulative bond amortization adjustment.
As of October 31, 2023, for federal income tax purposes, capital loss carryforwards of $199,241,555, as shown in the table below, were available to the extent provided by the regulations to offset future realized gains of the Fund. Accordingly, no capital gains distributions are expected to be paid to shareholders until net gains have been realized in excess of such amounts.
Capital Loss
Available Through | Short-Term
Capital Loss
Amounts (000’s) | Long-Term
Capital Loss
Amounts (000’s) |
| Unlimited | $26,022 | $173,220 |
During the years ended October 31, 2023 and October 31, 2022, the tax character of distributions paid as reflected in the Statements of Changes in Net Assets was as follows:
| | 2023 | 2022 |
| Distributions paid from: | | |
| Ordinary Income | $31,794,829 | $18,558,300 |
Note 5–Custodian
JPMorgan is the custodian of cash and securities held by the Fund. Custodial fees are charged to the Fund based on the Fund's net assets and/or the market value of securities held by the Fund and the number of certain transactions incurred by the Fund.
| 50 | MainStay MacKay Strategic Bond Fund |
Note 6–Line of Credit
The Fund and certain other funds managed by New York Life Investments maintain a line of credit with a syndicate of banks in order to secure a source of funds for temporary purposes to meet unanticipated or excessive redemption requests.
Effective July 25, 2023, under the credit agreement (the “Credit Agreement”), the aggregate commitment amount is $600,000,000 with an additional uncommitted amount of $100,000,000. The commitment fee is an annual rate of 0.15% of the average commitment amount payable quarterly, regardless of usage, to JPMorgan, who serves as the agent to the syndicate. The commitment fee is allocated among the Fund and certain other funds managed by New York Life Investments based upon their respective net assets and other factors. Interest on any revolving credit loan is charged based upon the Federal Funds Rate, Daily Simple Secured Overnight Financing Rate ("SOFR") + 0.10%, or the Overnight Bank Funding Rate, whichever is higher. The Credit Agreement expires on July 23, 2024, although the Fund, certain other funds managed by New York Life Investments and the syndicate of banks may renew the Credit Agreement for an additional year on the same or different terms or enter into a credit agreement with a different syndicate of banks. Prior to July 25, 2023, the aggregate commitment amount and the commitment fee were the same as those under the current Credit Agreement. During the year ended October 31, 2023, there were no borrowings made or outstanding with respect to the Fund under the Credit Agreement.
Note 7–Interfund Lending Program
Pursuant to an exemptive order issued by the SEC, the Fund, along with certain other funds managed by New York Life Investments, may participate in an interfund lending program. The interfund lending program provides an alternative credit facility that permits the Fund and certain other funds managed by New York Life Investments to lend or borrow money for temporary purposes directly to or from one another, subject to the conditions of the exemptive order. During the year ended October 31, 2023, there were no interfund loans made or outstanding with respect to the Fund.
Note 8–Purchases and Sales of Securities (in 000’s)
During the year ended October 31, 2023, purchases and sales of U.S. government securities were $283,357 and $280,393, respectively. Purchases and sales of securities, other than U.S. government securities and short-term securities, were $351,389 and $339,115, respectively.
Note 9–Capital Share Transactions
Transactions in capital shares for the years ended October 31, 2023 and October 31, 2022, were as follows:
| Class A | Shares | Amount |
| Year ended October 31, 2023: | | |
| Shares sold | 4,144,382 | $ 33,821,811 |
| Shares issued to shareholders in reinvestment of distributions | 900,510 | 7,387,865 |
| Shares redeemed | (4,890,143) | (40,075,857) |
| Net increase (decrease) in shares outstanding before conversion | 154,749 | 1,133,819 |
| Shares converted into Class A (See Note 1) | 145,028 | 1,189,857 |
| Shares converted from Class A (See Note 1) | (25,889) | (213,426) |
| Net increase (decrease) | 273,888 | $ 2,110,250 |
| Year ended October 31, 2022: | | |
| Shares sold | 5,239,194 | $ 44,969,613 |
| Shares issued to shareholders in reinvestment of distributions | 516,644 | 4,347,022 |
| Shares redeemed | (4,555,605) | (38,840,159) |
| Net increase (decrease) in shares outstanding before conversion | 1,200,233 | 10,476,476 |
| Shares converted into Class A (See Note 1) | 194,631 | 1,666,342 |
| Shares converted from Class A (See Note 1) | (22,766) | (195,017) |
| Net increase (decrease) | 1,372,098 | $ 11,947,801 |
| |
| Investor Class | Shares | Amount |
| Year ended October 31, 2023: | | |
| Shares sold | 41,924 | $ 347,440 |
| Shares issued to shareholders in reinvestment of distributions | 68,195 | 564,774 |
| Shares redeemed | (225,662) | (1,871,230) |
| Net increase (decrease) in shares outstanding before conversion | (115,543) | (959,016) |
| Shares converted into Investor Class (See Note 1) | 65,242 | 541,003 |
| Shares converted from Investor Class (See Note 1) | (71,152) | (589,109) |
| Net increase (decrease) | (121,453) | $ (1,007,122) |
| Year ended October 31, 2022: | | |
| Shares sold | 72,504 | $ 632,849 |
| Shares issued to shareholders in reinvestment of distributions | 40,927 | 347,822 |
| Shares redeemed | (217,500) | (1,884,049) |
| Net increase (decrease) in shares outstanding before conversion | (104,069) | (903,378) |
| Shares converted into Investor Class (See Note 1) | 88,587 | 767,005 |
| Shares converted from Investor Class (See Note 1) | (100,049) | (872,203) |
| Net increase (decrease) | (115,531) | $ (1,008,576) |
| |
Notes to Financial Statements (continued)
| Class B | Shares | Amount |
| Year ended October 31, 2023: | | |
| Shares sold | 905 | $ 7,420 |
| Shares issued to shareholders in reinvestment of distributions | 3,214 | 26,255 |
| Shares redeemed | (60,188) | (490,718) |
| Net increase (decrease) in shares outstanding before conversion | (56,069) | (457,043) |
| Shares converted from Class B (See Note 1) | (44,394) | (362,382) |
| Net increase (decrease) | (100,463) | $ (819,425) |
| Year ended October 31, 2022: | | |
| Shares sold | 11,822 | $ 106,766 |
| Shares issued to shareholders in reinvestment of distributions | 3,034 | 25,484 |
| Shares redeemed | (145,596) | (1,238,760) |
| Net increase (decrease) in shares outstanding before conversion | (130,740) | (1,106,510) |
| Shares converted from Class B (See Note 1) | (53,740) | (458,368) |
| Net increase (decrease) | (184,480) | $ (1,564,878) |
| |
| Class C | Shares | Amount |
| Year ended October 31, 2023: | | |
| Shares sold | 238,636 | $ 1,942,371 |
| Shares issued to shareholders in reinvestment of distributions | 64,957 | 529,902 |
| Shares redeemed | (1,293,692) | (10,548,035) |
| Net increase (decrease) in shares outstanding before conversion | (990,099) | (8,075,762) |
| Shares converted from Class C (See Note 1) | (94,324) | (770,651) |
| Net increase (decrease) | (1,084,423) | $ (8,846,413) |
| Year ended October 31, 2022: | | |
| Shares sold | 192,791 | $ 1,643,823 |
| Shares issued to shareholders in reinvestment of distributions | 55,328 | 463,896 |
| Shares redeemed | (2,628,674) | (22,246,426) |
| Net increase (decrease) in shares outstanding before conversion | (2,380,555) | (20,138,707) |
| Shares converted from Class C (See Note 1) | (126,672) | (1,073,171) |
| Net increase (decrease) | (2,507,227) | $ (21,211,878) |
| |
| Class I | Shares | Amount |
| Year ended October 31, 2023: | | |
| Shares sold | 24,753,093 | $ 203,140,277 |
| Shares issued to shareholders in reinvestment of distributions | 2,321,193 | 19,064,568 |
| Shares redeemed | (22,915,910) | (187,890,601) |
| Net increase (decrease) in shares outstanding before conversion | 4,158,376 | 34,314,244 |
| Shares converted into Class I (See Note 1) | 31,439 | 260,010 |
| Shares converted from Class I (See Note 1) | (6,780) | (55,302) |
| Net increase (decrease) | 4,183,035 | $ 34,518,952 |
| Year ended October 31, 2022: | | |
| Shares sold | 29,577,873 | $ 253,024,297 |
| Shares issued to shareholders in reinvestment of distributions | 1,323,433 | 11,171,084 |
| Shares redeemed | (25,595,708) | (216,538,337) |
| Net increase (decrease) in shares outstanding before conversion | 5,305,598 | 47,657,044 |
| Shares converted into Class I (See Note 1) | 23,007 | 197,262 |
| Shares converted from Class I (See Note 1) | (4,001) | (31,850) |
| Net increase (decrease) | 5,324,604 | $ 47,822,456 |
| |
| Class R2 | Shares | Amount |
| Year ended October 31, 2023: | | |
| Shares sold | 14,150 | $ 116,117 |
| Shares issued to shareholders in reinvestment of distributions | 5,559 | 45,621 |
| Shares redeemed | (11,519) | (94,722) |
| Net increase (decrease) | 8,190 | $ 67,016 |
| Year ended October 31, 2022: | | |
| Shares sold | 13,401 | $ 116,403 |
| Shares issued to shareholders in reinvestment of distributions | 2,933 | 24,679 |
| Shares redeemed | (7,531) | (65,679) |
| Net increase (decrease) | 8,803 | $ 75,403 |
| |
| Class R3 | Shares | Amount |
| Year ended October 31, 2023: | | |
| Shares sold | 12,072 | $ 99,196 |
| Shares issued to shareholders in reinvestment of distributions | 1,671 | 13,710 |
| Shares redeemed | (30,618) | (252,824) |
| Net increase (decrease) | (16,875) | $ (139,918) |
| Year ended October 31, 2022: | | |
| Shares sold | 7,736 | $ 66,560 |
| Shares issued to shareholders in reinvestment of distributions | 874 | 7,363 |
| Shares redeemed | (13,572) | (114,643) |
| Net increase (decrease) | (4,962) | $ (40,720) |
| |
| 52 | MainStay MacKay Strategic Bond Fund |
| Class R6 | Shares | Amount |
| Year ended October 31, 2023: | | |
| Shares sold | 371,977 | $ 3,063,577 |
| Shares issued to shareholders in reinvestment of distributions | 12,123 | 99,584 |
| Shares redeemed | (64,521) | (530,991) |
| Net increase (decrease) | 319,579 | $ 2,632,170 |
| Year ended October 31, 2022: | | |
| Shares sold | 82,311 | $ 700,590 |
| Shares issued to shareholders in reinvestment of distributions | 4,657 | 39,359 |
| Shares redeemed | (71,763) | (620,737) |
| Net increase (decrease) | 15,205 | $ 119,212 |
Note 10–Other Matters
As of the date of this report, the Fund faces a heightened level of risk associated with current uncertainty, volatility and state of economies, financial markets, rising interest rates, and labor and health conditions around the world. Events such as war, acts of terrorism, recessions, rapid inflation, the imposition of international sanctions, earthquakes, hurricanes, epidemics and pandemics and other unforeseen natural or human disasters may have broad adverse social, political and economic effects on the global economy, which could negatively impact the value of the Fund's investments. Developments that disrupt global economies and financial markets may magnify factors that affect the Fund's performance.
Note 11–Subsequent Events
In connection with the preparation of the financial statements of the Fund as of and for the year ended October 31, 2023, events and transactions subsequent to October 31, 2023, through the date the financial statements were issued, have been evaluated by the Manager for possible adjustment and/or disclosure. No subsequent events requiring financial statement adjustment or disclosure have been identified.
Report of Independent Registered Public Accounting Firm
To the Shareholders of the Fund and Board of Trustees
The MainStay Funds:
Opinion on the Financial Statements
We have audited the accompanying statement of assets and liabilities of MainStay MacKay Strategic Bond Fund (the Fund), one of the funds constituting The MainStay Funds, including the portfolio of investments, as of October 31, 2023, the related statement of operations for the year then ended, the statements of changes in net assets for each of the years in the two-year period then ended, and the related notes (collectively, the financial statements) and the financial highlights for each of the years in the five-year period then ended. In our opinion, the financial statements and financial highlights present fairly, in all material respects, the financial position of the Fund as of October 31, 2023, the results of its operations for the year then ended, the changes in its net assets for each of the years in the two-year period then ended, and the financial highlights for each of the years in the five-year period then ended, in conformity with U.S. generally accepted accounting principles.
Basis for Opinion
These financial statements and financial highlights are the responsibility of the Fund's management. Our responsibility is to express an opinion on these financial statements and financial highlights based on our audits. We are a public accounting firm registered with the Public Company Accounting Oversight Board (United States) (PCAOB) and are required to be independent with respect to the Fund in accordance with the U.S. federal securities laws and the applicable rules and regulations of the Securities and Exchange Commission and the PCAOB.
We conducted our audits in accordance with the standards of the PCAOB. Those standards require that we plan and perform the audit to obtain reasonable assurance about whether the financial statements and financial highlights are free of material misstatement, whether due to error or fraud. Our audits included performing procedures to assess the risks of material misstatement of the financial statements and financial highlights, whether due to error or fraud, and performing procedures that respond to those risks. Such procedures included examining, on a test basis, evidence regarding the amounts and disclosures in the financial statements and financial highlights. Such procedures also included confirmation of securities owned as of October 31, 2023, by correspondence with custodians, the transfer agent, agent banks and brokers; when replies were not received from agent banks and brokers, we performed other auditing procedures. Our audits also included evaluating the accounting principles used and significant estimates made by management, as well as evaluating the overall presentation of the financial statements and financial highlights. We believe that our audits provide a reasonable basis for our opinion.

We have served as the auditor of one or more New York Life Investment Management investment companies since 2003.
Philadelphia, Pennsylvania
December 22, 2023
| 54 | MainStay MacKay Strategic Bond Fund |
Federal Income Tax Information
(Unaudited)
The Fund is required under the Internal Revenue Code to advise shareholders in a written statement as to the federal tax status of dividends paid by the Fund during such fiscal years.
For the fiscal year ended October 31, 2023, the Fund designated approximately $1,752 under the Internal Revenue Code as qualified dividend income eligible for reduced tax rates.
The dividends paid by the Fund during the fiscal year ended October 31, 2023 should be multiplied by 0.01% to arrive at the amount eligible for the corporate dividend-received deduction.
In February 2024, shareholders will receive an IRS Form 1099-DIV or substitute Form 1099, which will show the federal tax status of the distributions received by shareholders in calendar year 2023. The amounts that will be reported on such 1099-DIV or substitute Form 1099 will be the amounts you are to use on your federal income tax return and will differ from the amounts which we must report for the Fund's fiscal year ended October 31, 2023.
Proxy Voting Policies and Procedures and Proxy Voting Record
The Fund is required to file with the SEC its proxy voting record for the 12-month period ending June 30 on Form N-PX. A description of the policies and procedures that are used to vote proxies relating to portfolio securities of the Fund is available free of charge upon request by calling 800-624-6782 or visiting the SEC’s website at www.sec.gov. The most recent Form N-PX or proxy voting record is available free of charge upon request by calling 800-624-6782; visiting newyorklifeinvestments.com; or visiting the SEC’s website at www.sec.gov.
Shareholder Reports and Quarterly Portfolio Disclosure
The Fund is required to file its complete schedule of portfolio holdings with the SEC 60 days after its first and third fiscal quarter on Form N-PORT. The Fund's holdings report is available free of charge upon request by calling New York Life Investments at 800-624-6782.
Board of Trustees and Officers (Unaudited)
The Trustees and officers of the Fund are listed below. The Board oversees the MainStay Group of Funds (which consists of MainStay Funds and MainStay Funds Trust), MainStay VP Funds Trust, MainStay MacKay DefinedTerm Municipal Opportunities Fund, MainStay CBRE Global Infrastructure Megatrends Term Fund, the Manager and the Subadvisors, and elects the officers of the Funds who are responsible for the day-to-day operations of the Fund. Information pertaining to the Trustees and officers is set forth below. Each Trustee serves until his or her successor is elected and qualified or until his or her resignation, death or
removal. Under the Board’s retirement policy, unless an exception is made, a Trustee must tender his or her resignation by the end of the calendar year during which he or she reaches the age of 75. Officers are elected annually by the Board. The business address of each Trustee and officer listed below is 51 Madison Avenue, New York, New York 10010. A majority of the Trustees are not “interested persons” (as defined by the 1940 Act and rules adopted by the SEC thereunder) of the Fund (“Independent Trustees”).
| | Name and
Year of Birth | Term of Office,
Position(s) Held and
Length of Service | Principal Occupation(s)
During Past Five Years | Number of
Portfolios in
Fund Complex
Overseen by
Trustee | Other Directorships
Held by Trustee |
| | | | | | |
| | Naïm Abou-Jaoudé*
1966 | MainStay Funds: Trustee
since 2023
MainStay Funds Trust:
Trustee since 2023 | Chief Executive Officer of New York Life Investment Management LLC (since 2023). Chief Executive Officer of Candriam (an affiliate of New York Life Investment Management LLC) (2007 to 2023). | 81 | MainStay VP Funds Trust:
Trustee since 2023 (31 portfolios);
MainStay MacKay DefinedTerm Municipal Opportunities Fund: Trustee
since 2023;
MainStay CBRE Global Infrastructure Megatrends Term Fund: Trustee
since 2023; and
New York Life Investment Management International (Chair) since 2015 |
| * | This Trustee is considered to be an “interested person” of the MainStay Group of Funds, MainStay VP Funds Trust, MainStay CBRE Global Infrastructure Megatrends Term Fund and MainStay MacKay DefinedTerm Municipal Opportunities Fund, within the meaning of the 1940 Act because of his affiliation with New York Life Investment Management LLC and Candriam, as described in detail above in the column entitled “Principal Occupation(s) During Past Five Years.” |
| | |
| 56 | MainStay MacKay Strategic Bond Fund |
| | Name and
Year of Birth | Term of Office,
Position(s) Held and
Length of Service | Principal Occupation(s)
During Past Five Years | Number of
Portfolios in
Fund Complex
Overseen by
Trustee | Other Directorships
Held by Trustee |
| | | | | | |
| | David H. Chow
1957 | MainStay Funds: Trustee since January 2016, Advisory Board Member (June 2015 to December 2015);MainStay Funds Trust:
Trustee since January 2016, Advisory Board Member (June 2015 to December 2015) | Founder and CEO, DanCourt Management, LLC (since 1999) | 81 | MainStay VP Funds Trust: Trustee since January 2016, Advisory Board Member (June 2015 to December 2015) (31 portfolios);
MainStay MacKay DefinedTerm Municipal Opportunities Fund: Trustee since January 2016, Advisory Board Member (June 2015 to December 2015);
MainStay CBRE Global Infrastructure Megatrends Term Fund: Trustee since 2021;
VanEck Vectors Group of Exchange-Traded Funds: Trustee since 2006 and Independent Chairman of the Board of Trustees from 2008 to 2022 (57 portfolios); and
Berea College of Kentucky: Trustee since 2009, Chair of the Investment Committee since 2018 |
| | Karen Hammond
1956 | MainStay Funds: Trustee since December 2021, Advisory Board Member (June 2021 to December 2021);MainStay Funds Trust:
Trustee since December 2021, Advisory Board Member (June 2021 to December 2021)
| Retired, Managing Director, Devonshire Investors (2007 to 2013); Senior Vice President, Fidelity Management & Research Co. (2005 to 2007); Senior Vice President and Corporate Treasurer, FMR Corp. (2003 to 2005); Chief Operating Officer, Fidelity Investments Japan (2001 to 2003) | 81 | MainStay VP Funds Trust: Trustee since December 2021, Advisory Board Member (June 2021 to December 2021) (31 portfolios);
MainStay MacKay DefinedTerm Municipal Opportunities Fund: Trustee since December 2021, Advisory Board Member (June 2021 to December 2021);
MainStay CBRE Global Infrastructure Megatrends Term Fund: Trustee since December 2021, Advisory Board Member (June 2021 to December 2021);
Two Harbors Investment Corp.: Director since 2018;
Rhode Island State Investment Commission: Member since 2017; and
Blue Cross Blue Shield of Rhode Island: Director since 2019 |
| | Susan B. Kerley
1951 | MainStay Funds: Chair since January 2017 and Trustee since 2007;MainStay Funds Trust:
Chair since January 2017 and Trustee since 1990*** | President, Strategic Management Advisors LLC (since 1990) | 81 | MainStay VP Funds Trust: Chair since January 2017 and Trustee since 2007 (31 portfolios)**;
MainStay MacKay DefinedTerm Municipal Opportunities Fund: Chair since January 2017 and Trustee since 2011;
MainStay CBRE Global Infrastructure Megatrends Term Fund: Trustee since June 2021; and
Legg Mason Partners Funds: Trustee since 1991 (45 portfolios) |
Board of Trustees and Officers (Unaudited) (continued)
| | Name and
Year of Birth | Term of Office,
Position(s) Held and
Length of Service | Principal Occupation(s)
During Past Five Years | Number of
Portfolios in
Fund Complex
Overseen by
Trustee | Other Directorships
Held by Trustee |
| | | | | | |
| | Alan R. Latshaw
1951 | MainStay Funds: Trusteesince 2006;MainStay Funds Trust:
Trustee since 2007*** | Retired; Partner, Ernst & Young LLP (2002 to 2003); Partner, Arthur Andersen LLP (1989 to 2002); Consultant to the MainStay Funds Audit and Compliance Committee (2004 to 2006) | 81 | MainStay VP Funds Trust: Trustee since 2007 (31 portfolios)**;
MainStay MacKay DefinedTerm Municipal Opportunities Fund: Trustee since 2011; and
MainStay CBRE Global Infrastructure Megatrends Term Fund: Trustee since June 2021 |
| | Jacques P. Perold
1958 | MainStay Funds: Trustee since January 2016, Advisory Board Member (June 2015to December 2015);MainStay Funds Trust:
Trustee since January 2016, Advisory Board Member (June 2015 to December 2015) | Founder and Chief Executive Officer, CapShift Advisors LLC (since 2018); President, Fidelity Management & Research Company (2009 to 2014); President and Chief Investment Officer, Geode Capital Management, LLC (2001 to 2009) | 81 | MainStay VP Funds Trust: Trustee since January 2016, Advisory Board Member (June 2015 to December 2015) (31 portfolios);
MainStay MacKay DefinedTerm Municipal Opportunities Fund: Trustee since January 2016, Advisory Board Member (June 2015 to December 2015);
MainStay CBRE Global Infrastructure Megatrends Term Fund: Trustee since June 2021;
Allstate Corporation: Director since 2015; and
MSCI Inc.: Director since 2017 |
| | Richard S. Trutanic
1952 | MainStay Funds: Trustee since 1994;MainStay Funds Trust:
Trustee since 2007*** | Chairman and Chief Executive Officer, Somerset & Company (financial advisory firm) (since 2004); Managing Director, The Carlyle Group (private investment firm) (2002 to 2004); Senior Managing Director, Partner and Board Member, Groupe Arnault S.A. (private investment firm) (1999 to 2002) | 81 | MainStay VP Funds Trust: Trustee since 2007 (31 portfolios)**;
MainStay MacKay DefinedTerm Municipal Opportunities Fund: Trustee since 2011; and
MainStay CBRE Global Infrastructure Megatrends Term Fund: Trustee since June 2021 |
| ** | Includes prior service as a Director of MainStay VP Series Fund, Inc., the predecessor to MainStay VP Funds Trust. |
| *** | Includes prior service as a Director/Trustee of certain predecessor entities to MainStay Funds Trust. |
| 58 | MainStay MacKay Strategic Bond Fund |
| | Name and
Year of Birth | Position(s) Held and
Length of Service | Principal Occupation(s)
During Past Five Years | |
| | | | | |
| | Kirk C. Lehneis
1974 | President, MainStay Funds, MainStay Funds Trust (since 2017) | Chief Operating Officer and Senior Managing Director (since 2016), New York Life Investment Management LLC and New York Life Investment Management Holdings LLC; Member of the Board of Managers (since 2017) and Senior Managing Director (since 2018), NYLIFE Distributors LLC; Chairman of the Board and Senior Managing Director, NYLIM Service Company LLC (since 2017); Trustee, President and Principal Executive Officer of IndexIQ Trust, IndexIQ ETF Trust and IndexIQ Active ETF Trust (since 2018); President, MainStay CBRE Global Infrastructure Megatrends Term Fund (since 2021), MainStay MacKay DefinedTerm Municipal Opportunities Fund and MainStay VP Funds Trust (since 2017)**; Senior Managing Director, Global Product Development (2015 to 2016); Managing Director, Product Development (2010 to 2015), New York Life Investment Management LLC | |
| | Jack R. Benintende
1964 | Treasurer and Principal Financial and Accounting Officer, MainStay Funds (since 2007), MainStay Funds Trust (since 2009) | Managing Director, New York Life Investment Management LLC (since 2007); Treasurer and Principal Financial and Accounting Officer, MainStay CBRE Global Infrastructure Megatrends Term Fund (since 2021), MainStay MacKay DefinedTerm Municipal Opportunities Fund (since 2011) and MainStay VP Funds Trust (since 2007)**; and Assistant Treasurer, New York Life Investment Management Holdings LLC (2008 to 2012) | |
| | J. Kevin Gao
1967 | Secretary and Chief Legal Officer, MainStay Funds and MainStay Funds Trust (since 2010) | Managing Director and Associate General Counsel, New York Life Investment Management LLC (since 2010); Secretary and Chief Legal Officer, MainStay CBRE Global Infrastructure Megatrends Term Fund (since 2021), MainStay MacKay DefinedTerm Municipal Opportunities Fund (since 2011) and MainStay VP Funds Trust (since 2010)** | |
| | Kevin M. Gleason
1967 | Vice President and Chief Compliance Officer, MainStay Funds and MainStay Funds Trust (since June 2022) | Vice President and Chief Compliance Officer, IndexIQ Trust, IndexIQ ETF Trust and Index IQ Active ETF Trust (since June 2022); Vice President and Chief Compliance Officer, MainStay CBRE Global Infrastructure Megatrends Term Fund, MainStay VP Funds Trust and MainStay MacKay DefinedTerm Municipal Opportunities Fund (since June 2022); Senior Vice President, Voya Investment Management and Chief Compliance Officer, Voya Family of Funds (2012 to 2022) | |
| | Scott T. Harrington
1959 | Vice President— Administration, MainStay Funds (since 2005), MainStay Funds Trust (since 2009) | Managing Director, New York Life Investment Management LLC (including predecessor advisory organizations) (since 2000); Member of the Board of Directors, New York Life Trust Company (since 2009); Vice President—Administration, MainStay CBRE Global Infrastructure Megatrends Term Fund (since 2021), MainStay MacKay DefinedTerm Municipal Opportunities Fund (since 2011) and MainStay VP Funds Trust (since 2005)** | |
| * | The officers listed above are considered to be “interested persons” of the MainStay Group of Funds, MainStay VP Funds Trust, MainStay CBRE Global Infrastructure Megatrends Term Fund and MainStay MacKay DefinedTerm Municipal Opportunities Fund within the meaning of the 1940 Act because of their affiliation with the MainStay Group of Funds, New York Life Insurance Company and/or its affiliates, including New York Life Investment Management LLC, New York Life Insurance Company, NYLIM Service Company LLC, NYLIFE Securities LLC and/or NYLIFE Distributors LLC, as described in detail in the column captioned “Principal Occupation(s) During Past Five Years.” Officers are elected annually by the Board. |
| ** | Includes prior service as an Officer of MainStay VP Series Fund, Inc., the predecessor to MainStay VP Funds Trust. |
Officers of the Trust (Who are not Trustees)*
This page intentionally left blank.
This page intentionally left blank.
This page intentionally left blank.
Equity
U.S. Equity
MainStay Epoch U.S. Equity Yield Fund
MainStay Fiera SMID Growth Fund
MainStay PineStone U.S. Equity Fund
MainStay S&P 500 Index Fund
MainStay Winslow Large Cap Growth Fund
MainStay WMC Enduring Capital Fund
MainStay WMC Growth Fund
MainStay WMC Small Companies Fund
MainStay WMC Value Fund
International Equity
MainStay Epoch International Choice Fund
MainStay PineStone International Equity Fund
MainStay WMC International Research Equity Fund
Emerging Markets Equity
MainStay Candriam Emerging Markets Equity Fund
Global Equity
MainStay Epoch Capital Growth Fund
MainStay Epoch Global Equity Yield Fund
MainStay PineStone Global Equity Fund
Fixed Income
Taxable Income
MainStay Candriam Emerging Markets Debt Fund
MainStay Floating Rate Fund
MainStay MacKay High Yield Corporate Bond Fund
MainStay MacKay Short Duration High Yield Fund
MainStay MacKay Strategic Bond Fund
MainStay MacKay Total Return Bond Fund
MainStay MacKay U.S. Infrastructure Bond Fund
MainStay Short Term Bond Fund
Tax-Exempt Income
MainStay MacKay California Tax Free Opportunities Fund1
MainStay MacKay High Yield Municipal Bond Fund
MainStay MacKay New York Tax Free Opportunities Fund2
MainStay MacKay Short Term Municipal Fund
MainStay MacKay Strategic Municipal Allocation Fund
MainStay MacKay Tax Free Bond Fund
Money Market
MainStay Money Market Fund
Mixed Asset
MainStay Balanced Fund
MainStay Income Builder Fund
MainStay MacKay Convertible Fund
Speciality
MainStay CBRE Global Infrastructure Fund
MainStay CBRE Real Estate Fund
MainStay Cushing MLP Premier Fund
Asset Allocation
MainStay Conservative Allocation Fund
MainStay Conservative ETF Allocation Fund
MainStay Defensive ETF Allocation Fund
MainStay Equity Allocation Fund
MainStay Equity ETF Allocation Fund
MainStay ESG Multi-Asset Allocation Fund
MainStay Growth Allocation Fund
MainStay Growth ETF Allocation Fund
MainStay Moderate Allocation Fund
MainStay Moderate ETF Allocation Fund
Manager
New York Life Investment Management LLC
New York, New York
Subadvisors
Candriam3
Strassen, Luxembourg
CBRE Investment Management Listed Real Assets LLC
Radnor, Pennsylvania
Cushing Asset Management, LP
Dallas, Texas
Epoch Investment Partners, Inc.
New York, New York
Fiera Capital Inc.
New York, New York
IndexIQ Advisors LLC3
New York, New York
MacKay Shields LLC3
New York, New York
NYL Investors LLC3
New York, New York
PineStone Asset Management Inc.
Montreal, Québec
Wellington Management Company LLP
Boston, Massachusetts
Winslow Capital Management, LLC
Minneapolis, Minnesota
Legal Counsel
Dechert LLP
Washington, District of Columbia
Independent Registered Public Accounting Firm
KPMG LLP
Philadelphia, Pennsylvania
Distributor
NYLIFE Distributors LLC3
Jersey City, New Jersey
Custodian
JPMorgan Chase Bank, N.A.
New York, New York
1.
This Fund is registered for sale in AZ, CA, NV, OR, TX, UT, WA and MI (Class A and Class I shares only), and CO, FL, GA, HI, ID, MA, MD, NH, NJ and NY (Class I shares only).
| 2. | This Fund is registered for sale in CA, CT, DE, FL, MA, NJ, NY and VT. |
| 3. | An affiliate of New York Life Investment Management LLC. |
Not part of the Annual Report
For more information
800-624-6782
newyorklifeinvestments.com
“New York Life Investments” is both a service mark, and the common trade name, of certain investment advisors affiliated with New York Life Insurance Company. The MainStay Funds® are managed by New York Life Investment Management LLC and distributed by NYLIFE Distributors LLC, 30 Hudson Street, Jersey City, NJ 07302, a wholly owned subsidiary of New York Life Insurance Company. NYLIFE Distributors LLC is a Member FINRA/SIPC.
©2023 NYLIFE Distributors LLC. All rights reserved.
| 5013948MS139-23 | MSSB11-12/23 |
(NYLIM) NL052
MainStay MacKay Tax Free Bond Fund
Message from the President and Annual Report
October 31, 2023
Special Notice:
Beginning in July 2024, new regulations issued by the Securities and Exchange Commission (SEC) will take effect requiring open-end mutual fund companies and ETFs to (1) overhaul the content of their shareholder reports and (2) mail paper copies of the new tailored shareholder reports to shareholders who have not opted to receive these documents electronically.
If you have not yet elected to receive your shareholder reports electronically, please contact your financial intermediary or visit newyorklifeinvestments.com/accounts.
| Not FDIC/NCUA Insured | Not a Deposit | May Lose Value | No Bank Guarantee | Not Insured by Any Government Agency |
This page intentionally left blank
Message from the President
Volatile economic and geopolitical forces drove market behavior during the 12-month reporting period ended October 31, 2023. While equity markets generally gained ground, bond prices trended broadly lower.
Although the war in Ukraine, the outbreak of hostilities in the Middle East and several other notable events affected financial assets, inflation and interest rate trends stood at the forefront of market developments during most of the period. As the reporting period began, high levels of inflation already showed signs of easing in the face of aggressive rate hikes by the U.S. Federal Reserve (the “Fed”). From a peak of 9.1% in June 2022, the annualized U.S. inflation rate dropped to 7.1% in November 2022, and to 3.2% in October 2023. At the same time, the Fed increased the benchmark federal funds rate from 3.75%–4.00% at the beginning of the reporting period to 5.25%–5.50% as of October 31, 2023. As the pace of rate increases slowed during the period, investors hoped for an early shift to a looser monetary policy. However, comments from Fed members late in the period reinforced the central bank’s hawkish stance in response to surprisingly robust U.S. economic growth and rising wage pressures, thus increasing the likelihood that interest rates would stay higher for longer. International developed markets exhibited similar dynamics of elevated inflation and rising interest rates.
Despite the backdrop of high interest rates—along with political dysfunction in Washington D.C. and intensifying global geopolitical instability—equity markets managed to advance, supported by healthy consumer spending trends and persistent domestic economic growth. The S&P 500® Index, a widely regarded benchmark of large-cap U.S. market performance, gained ground, bolstered by the strong performance of energy stocks amid surging petroleum prices and mega-cap, growth-oriented, technology-related shares, which rose as investors flocked to companies creating the infrastructure for developments in artificial intelligence. Smaller-cap stocks and value-oriented shares produced milder returns. Among industry sectors, energy and
information technology posted the strongest gains. Real estate declined most sharply under pressure from rising mortgage rates and weak levels of office occupancy. Developed international markets outperformed U.S. markets, with Europe benefiting during the first half of the period from unexpected economic resilience in the face of rising energy prices and the ongoing war in Ukraine. Emerging markets posted positive results but lagged developed markets, largely due to slow economic growth in China despite the relaxation of pandemic-era lockdowns.
Bond prices were driven lower by rising yields and increasing expectations of high interest rates for an extended period of time. The U.S. yield curve steepened, with the 30-year Treasury yield exceeding 5% for the first time in more than a decade. The yield curve remained inverted, with the 10-year Treasury yield ending the period at 4.88%, compared with 5.07% for the 2-year Treasury yield. Corporate bonds outperformed long-term Treasury bonds, but still trended lower under pressure from rising yields and an uptick in default rates. Among corporates, lower-credit-quality instruments performed slightly better than their higher-credit-quality counterparts, while floating rate securities performed better still.
In the face of today’s uncertain market environment, New York Life Investments remains dedicated to providing the guidance, resources and investment solutions you need to pursue your financial goals.
Thank you for trusting us to help meet your investment needs.
Sincerely,
Kirk C. Lehneis
President
The opinions expressed are as of the date of this report and are subject to change. There is no guarantee that any forecast made will come to pass. This material does not constitute investment advice and is not intended as an endorsement of any specific investment. Past performance is no guarantee of future results.
Not part of the Annual Report
Investors should refer to the Fund’s Summary Prospectus and/or Prospectus and consider the Fund’s investment objectives, strategies, risks, charges and expenses carefully before investing. The Summary Prospectus and/or Prospectus contain this and other information about the Fund. You may obtain copies of the Fund’s Summary Prospectus, Prospectus and Statement of Additional Information, which includes information about The MainStay Funds' Trustees, free of charge, upon request, by calling toll-free 800-624-6782, by writing to NYLIFE Distributors LLC, Attn: MainStay Marketing Department, 30 Hudson Street, Jersey City, NJ 07302 or by sending an e-mail to MainStayShareholderServices@nylim.com. These documents are also available via the MainStay Funds’ website at newyorklifeinvestments.com. Please read the Fund’s Summary Prospectus and/or Prospectus carefully before investing.
Investment and Performance Comparison (Unaudited)
Performance data quoted represents past performance. Past performance is no guarantee of future results. Because of market volatility and other factors, current performance may be lower or higher than the figures shown. Investment return and principal value will fluctuate, and as a result, when shares are redeemed, they may be worth more or less than their original cost. The graph below depicts the historical performance of Class I shares of the Fund. Performance will vary from class to class based on differences in class-specific expenses and sales charges. For performance information current to the most recent month-end, please call 800-624-6782 or visit newyorklifeinvestments.com.
The performance table and graph do not reflect the deduction of taxes that a shareholder would pay on distributions or Fund share redemptions. Total returns reflect maximum applicable sales charges as indicated in the table below, if any, changes in share price, and reinvestment of dividend and capital gain distributions. The graph assumes the initial investment amount shown below and reflects the deduction of all sales charges that would have applied for the period of investment. Performance figures may reflect certain fee waivers and/or expense limitations, without which total returns may have been lower. For more information on share classes and current fee waivers and/or expense limitations (if any), please refer to the Notes to Financial Statements.

| Average Annual Total Returns for the Year-Ended October 31, 2023 |
| Class | Sales Charge | | Inception
Date | One
Year | Five
Years | Ten Years
or Since
Inception | Gross
Expense
Ratio1 |
| Class A Shares2 | Maximum 3.00% Initial Sales Charge | With sales charges | 1/3/1995 | -0.46% | -0.30% | 2.05% | 0.75% |
| | | Excluding sales charges | | 2.62 | 0.62 | 2.52 | 0.75 |
| Investor Class Shares3, 4 | Maximum 2.50% Initial Sales Charge | With sales charges | 2/28/2008 | 0.00 | -0.31 | 2.02 | 0.77 |
| | | Excluding sales charges | | 2.57 | 0.61 | 2.49 | 0.77 |
| Class B Shares5 | Maximum 5.00% CDSC | With sales charges | 5/1/1986 | -2.63 | 0.00 | 2.25 | 1.02 |
| | if Redeemed Within the First Six Years of Purchase | Excluding sales charges | | 2.32 | 0.36 | 2.25 | 1.02 |
| Class C Shares | Maximum 1.00% CDSC | With sales charges | 9/1/1998 | 1.45 | 0.38 | 2.25 | 1.02 |
| | if Redeemed Within One Year of Purchase | Excluding sales charges | | 2.44 | 0.38 | 2.25 | 1.02 |
| Class C2 Shares | Maximum 1.00% CDSC | With sales charges | 8/31/2020 | 1.18 | N/A | -3.27 | 1.17 |
| | if Redeemed Within One Year of Purchase | Excluding sales charges | | 2.17 | N/A | -3.27 | 1.17 |
| Class I Shares | No Sales Charge | | 12/21/2009 | 2.99 | 0.90 | 2.77 | 0.50 |
| Class R6 Shares | No Sales Charge | | 11/1/2019 | 2.93 | N/A | -0.97 | 0.44 |
| 1. | The gross expense ratios presented reflect the Fund’s “Total Annual Fund Operating Expenses” from the most recent Prospectus, as supplemented, and may differ from other expense ratios disclosed in this report. |
| 2. | Prior to August 10, 2022, the maximum initial sales charge was 4.50%, which is reflected in the applicable average annual total return figures shown. |
| 3. | Prior to June 30, 2020, the maximum initial sales charge was 4.50%, which is reflected in the applicable average annual total return figures shown. |
| 4. | Prior to August 10, 2022, the maximum initial sales charge was 4.00%, which is reflected in the applicable average annual total return figures shown. |
| 5. | Class B shares are closed to all new purchases as well as additional investments by existing Class B shareholders. |
The footnotes on the next page are an integral part of the table and graph and should be carefully read in conjunction with them.
| Benchmark Performance* | One
Year | Five
Years | Ten
Years |
| Bloomberg Municipal Bond Index1 | 2.64% | 1.00% | 2.12% |
| Morningstar Muni National Long Category Average2 | 2.12 | 0.38 | 1.95 |
| * | Returns for indices reflect no deductions for fees, expenses or taxes, except for foreign withholding taxes where applicable. Results assume reinvestment of all dividends and capital gains. An investment cannot be made directly in an index. |
| 1. | The Bloomberg Municipal Bond Index is the Fund's primary broad-based securities market index for comparison purposes. The Bloomberg Municipal Bond Index is considered representative of the broad market for investment-grade, tax-exempt bonds with a maturity of at least one year. Bonds subject to the alternative minimum tax or with floating or zero coupons are excluded. |
| 2. | The Morningstar Muni National Long Category Average is representative of funds that invest in bonds issued by various state and local governments to fund public projects. The income from these bonds is generally free from federal taxes. These funds have durations of more than 7 years. Results are based on average total returns of similar funds with all dividends and capital gain distributions reinvested. |
The footnotes on the preceding page are an integral part of the table and graph and should be carefully read in conjunction with them.
| 6 | MainStay MacKay Tax Free Bond Fund |
Cost in Dollars of a $1,000 Investment in MainStay MacKay Tax Free Bond Fund (Unaudited)
The example below is intended to describe the fees and expenses borne by shareholders during the six-month period from May 1, 2023 to October 31, 2023, and the impact of those costs on your investment.
Example
As a shareholder of the Fund you incur two types of costs: (1) transaction costs, including exchange fees and sales charges (loads) on purchases (as applicable), and (2) ongoing costs, including management fees, distribution and/or service (12b-1) fees and other Fund expenses (as applicable). This example is intended to help you understand your ongoing costs (in dollars) of investing in the Fund and to compare these costs with the ongoing costs of investing in other mutual funds. The example is based on an investment of $1,000 made at the beginning of the six-month period and held for the entire period from May 1, 2023 to October 31, 2023.
This example illustrates your Fund’s ongoing costs in two ways:
Actual Expenses
The second and third data columns in the table below provide information about actual account values and actual expenses. You may use the information in these columns, together with the amount you invested, to estimate the expenses that you paid during the six months ended October 31, 2023. Simply divide your account value by $1,000 (for example, an
$8,600 account value divided by $1,000 = 8.6), then multiply the result by the number under the heading entitled “Expenses Paid During Period” to estimate the expenses you paid on your account during this period.
Hypothetical Example for Comparison Purposes
The fourth and fifth data columns in the table below provide information about hypothetical account values and hypothetical expenses based on the Fund’s actual expense ratio and an assumed rate of return of 5% per year before expenses, which is not the Fund’s actual return. The hypothetical account values and expenses may not be used to estimate the actual ending account balances or expenses you paid for the six-month period shown. You may use this information to compare the ongoing costs of investing in the Fund with the ongoing costs of investing in other mutual funds. To do so, compare this 5% hypothetical example with the 5% hypothetical examples that appear in the shareholder reports of the other mutual funds.
Please note that the expenses shown in the table are meant to highlight your ongoing costs only and do not reflect any transactional costs, such as exchange fees or sales charges (loads). Therefore, the fourth and fifth data columns of the table are useful in comparing ongoing costs only and will not help you determine the relative total costs of owning different funds. In addition, if these transactional costs were included, your costs would have been higher.
| Share Class | Beginning
Account
Value
5/1/23 | Ending Account
Value (Based
on Actual
Returns and
Expenses)
10/31/23 | Expenses
Paid
During
Period1 | Ending Account
Value (Based
on Hypothetical
5% Annualized
Return and
Actual Expenses)
10/31/23 | Expenses
Paid
During
Period1 | Net Expense
Ratio
During
Period2 |
| Class A Shares | $1,000.00 | $948.90 | $3.64 | $1,021.47 | $3.77 | 0.74% |
| Investor Class Shares | $1,000.00 | $949.00 | $3.78 | $1,021.32 | $3.92 | 0.77% |
| Class B Shares | $1,000.00 | $947.50 | $5.06 | $1,020.01 | $5.24 | 1.03% |
| Class C Shares | $1,000.00 | $948.60 | $5.01 | $1,020.06 | $5.19 | 1.02% |
| Class C2 Shares | $1,000.00 | $946.80 | $5.74 | $1,019.31 | $5.96 | 1.17% |
| Class I Shares | $1,000.00 | $951.20 | $2.41 | $1,022.73 | $2.50 | 0.49% |
| Class R6 Shares | $1,000.00 | $950.40 | $2.11 | $1,023.04 | $2.19 | 0.43% |
| 1. | Expenses are equal to the Fund’s annualized expense ratio of each class multiplied by the average account value over the period, divided by 365 and multiplied by 184 (to reflect the six-month period). The table above represents the actual expenses incurred during the six-month period. In addition to the fees and expenses which the Fund bears directly, it also indirectly bears a pro rata share of the fees and expenses of the underlying funds in which it invests. Such indirect expenses are not included in the above-reported expense figures. |
| 2. | Expenses are equal to the Fund's annualized expense ratio to reflect the six-month period. |
Portfolio Composition as of October 31, 2023 (Unaudited)
| New York | 14.8% |
| California | 12.3 |
| Texas | 11.1 |
| Illinois | 7.4 |
| Florida | 4.6 |
| Pennsylvania | 3.8 |
| Georgia | 3.4 |
| New Jersey | 3.2 |
| Alabama | 2.8 |
| Utah | 2.7 |
| District of Columbia | 2.6 |
| Washington | 2.6 |
| Colorado | 2.4 |
| Massachusetts | 2.4 |
| Nevada | 1.7 |
| Ohio | 1.7 |
| Connecticut | 1.6 |
| Michigan | 1.6 |
| Nebraska | 1.4 |
| South Carolina | 1.2 |
| Tennessee | 1.1 |
| U.S. Virgin Islands | 1.0 |
| Minnesota | 0.9 |
| Indiana | 0.9 |
| Oklahoma | 0.8 |
| Arizona | 0.7 |
| Kentucky | 0.7 |
| Virginia | 0.7 |
| Missouri | 0.7 |
| Oregon | 0.7% |
| Wisconsin | 0.7 |
| Hawaii | 0.6 |
| North Carolina | 0.5 |
| Montana | 0.3 |
| Iowa | 0.3 |
| Louisiana | 0.3 |
| Maryland | 0.3 |
| West Virginia | 0.3 |
| Puerto Rico | 0.2 |
| Alaska | 0.2 |
| New Mexico | 0.2 |
| Arkansas | 0.2 |
| Vermont | 0.2 |
| Guam | 0.1 |
| Kansas | 0.1 |
| South Dakota | 0.1 |
| New Hampshire | 0.1 |
| Wyoming | 0.1 |
| Mississippi | 0.0‡ |
| Rhode Island | 0.0‡ |
| Delaware | 0.0‡ |
| Maine | 0.0‡ |
| Idaho | 0.0‡ |
| Short–Term Investment | 2.2 |
| Other Assets, Less Liabilities | –0.5 |
| | 100.0% |
| ‡ | Less than one–tenth of a percent. |
See Portfolio of Investments beginning on page 11 for specific holdings within these categories. The Fund's holdings are subject to change.
Top Ten Holdings and/or Issuers Held as of October 31, 2023 (excluding short-term investments) (Unaudited)
| 1. | New York City Transitional Finance Authority, 3.00%-5.50%, due 5/1/33–7/15/49 |
| 2. | State of California, 3.00%-5.00%, due 11/1/28–4/1/52 |
| 3. | Triborough Bridge & Tunnel Authority, 3.00%-5.50%, due 1/1/32–5/15/63 |
| 4. | New York State Dormitory Authority, 3.00%-5.75%, due 7/1/27–7/1/50 |
| 5. | City of Chicago, 4.00%-6.00%, due 1/1/28–11/1/62 |
| 6. | Port Authority of New York & New Jersey, 4.00%-5.50%, due 9/1/27–8/1/52 |
| 7. | Metropolitan Transportation Authority, 4.00%-5.25%, due 11/15/26–11/15/49 |
| 8. | Black Belt Energy Gas District, 4.00%-5.408%, due 6/1/49–12/1/53 |
| 9. | San Francisco City & County Airport Commission, 5.00%, due 5/1/33–5/1/50 |
| 10. | State of Connecticut, 3.00%-5.25%, due 9/15/28–7/1/42 |
| 8 | MainStay MacKay Tax Free Bond Fund |
Portfolio Management Discussion and Analysis (Unaudited)
Questions answered by portfolio managers John Loffredo, CFA, Robert DiMella, CFA, Michael Petty, David Dowden, Scott Sprauer, Frances Lewis and Michael Denlinger, CFA, of MacKay Shields LLC, the Fund’s Subadvisor.
How did MainStay MacKay Tax Free Bond Fund perform relative to its benchmark and peer group during the 12 months ended October 31, 2023?
For the 12 months ended October 31, 2023, Class I shares of MainStay MacKay Tax Free Bond Fund returned 2.99%, outperforming the 2.64% return of the Fund’s benchmark, the Bloomberg Municipal Bond Index (the "Index"). Over the same period, Class I shares also outperformed the 2.12% return of the Morningstar Muni National Long Category Average.1
What factors affected the Fund’s relative performance during the reporting period?
The Fund outperformed the Index partly due to overweight exposure to maturities of 15 years and longer. In addition, underweight exposure to 4+% coupons aided on a relative basis. From a credit-quality standpoint, overweight exposure to AA-rated2 bonds contributed positively to relative performance. (Contributions take weightings and total returns into account.) From a geographic perspective, overweight exposure to bonds from the states of New York, Illinois and Florida also contributed positively. Conversely, the Fund’s underweight positions in A-rated and BBB-rated credits,3 as well as underweight exposure to 0–1% coupon bonds detracted from relative performance. Also, the Fund engaged in significant tax-loss harvesting. This created losses that can be carried forward to offset future gains in the Fund. This activity also resulted in creating a higher book yield for the Fund.
During the reporting period, how was the Fund’s performance materially affected by investments in derivatives?
The Fund will employ U.S. Treasury futures hedges at times, typically as a paired strategy with longer maturity bonds, to
dampen duration4 and interest-rate sensitivity. During the reporting period, the Fund’s allocation to hedges was minimal.
What was the Fund’s duration strategy during the reporting period?
We do not make interest rate forecasts or duration bets. Rather, we aim to adopt a duration-neutral posture in the Fund relative to the Index. As of October 31, 2023, the modified duration to worst5 for the Fund was 6.82 years relative to 6.90 years for the Index.
During the reporting period, which sectors were the strongest positive contributors to the Fund’s relative performance and which sectors were particularly weak?
During the reporting period, the Fund held overweight exposure to the special tax and IDR/PCR (industry development revenue/pollution control revenue) sectors, which made positive contributions to returns relative to the Index. Conversely, security selection in the hospital and housing sectors detracted from relative performance.
What were some of the Fund’s significant purchases and sales during the reporting period?
As the Fund remains focused on diversification and liquidity, no individual purchase or sale was considered significant, although sector overweights or security structure, in their entirety, did have an impact.
How did the Fund’s sector weighting change during the reporting period?
During the reporting period, there were no material changes to the weightings in the Fund. There was an increase in the Fund’s exposure to the state and local general obligation and electric sectors. The Fund added exposure to traditional municipal bonds,
| 1. | See "Investment and Performance Comparison" for other share class returns, which may be higher or lower than Class I share returns, and for more information on benchmark and peer group returns. |
| 2. | An obligation rated ‘AA’ by Standard & Poor’s (“S&P”) is deemed by S&P to differ from the highest-rated obligations only to a small degree. In the opinion of S&P, the obligor's capacity to meet its financial commitment on the obligation is very strong. When applied to Fund holdings, ratings are based solely on the creditworthiness of the bonds in the portfolio and are not meant to represent the security or safety of the Fund. |
| 3. | An obligation rated ‘A’ by S&P is deemed by S&P to be somewhat more susceptible to the adverse effects of changes in circumstances and economic conditions than obligations in higher-rated categories. In the opinion of S&P, however, the obligor's capacity to meet its financial commitment on the obligation is still strong. An obligation rated ‘BBB’ by S&P is deemed by S&P to exhibit adequate protection parameters. In the opinion of S&P, however, adverse economic conditions or changing circumstances are more likely to lead to a weakened capacity of the obligor to meet its financial commitment on the obligation. When applied to Fund holdings, ratings are based solely on the creditworthiness of the bonds in the portfolio and are not meant to represent the security or safety of the Fund. |
| 4. | Duration is a measure of the price sensitivity of a fixed-income investment to changes in interest rates. Duration is expressed as a number of years and is considered a more accurate sensitivity gauge than average maturity. |
| 5. | Modified duration is inversely related to the approximate percentage change in price for a given change in yield. Duration to worst is the duration of a bond computed using the bond’s nearest call date or maturity. This measure ignores future cash flow fluctuations due to embedded optionality. |
including bonds backed by the taxing power of general obligation issuers or secured by the revenues of essential service providers, due to their generally strong, resilient profiles. In addition, there was an increase in exposure to higher-credit-quality AAA-rated6 bonds. The Fund increased exposure to high quality credits as they are in relatively strong financial condition and were available at much higher yields. Conversely, there was a decrease in the Fund’s exposure to the leasing and special tax sectors. Across states, there was a decrease in exposure to Florida and New York bonds.
How was the Fund positioned at the end of the reporting period?
As of October 31, 2023, the Fund maintained overweight exposure to the long end of the yield curve,7 where municipal yields were more attractive. In addition, the Fund held overweight exposure to the electric, special tax and local general obligation sectors. Across states, the Fund held overweight exposure to Illinois and Florida holdings. Furthermore, from a credit perspective, the Fund held overweight exposure to AA-rated bonds. As of the same date, the Fund held underweight exposure to the education and hospital sectors. In addition, the Fund held underweight exposure to A-rated credits, as well as holdings from the state of New York.
| 6. | An obligation rated ‘AAA’ has the highest rating assigned by S&P, and in the opinion of S&P, the obligor’s capacity to meet its financial commitment on the obligation is extremely strong. When applied to Fund holdings, ratings are based solely on the creditworthiness of the bonds in the portfolio and are not meant to represent the security or safety of the Fund. |
| 7. | The yield curve is a line that plots the yields of various securities of similar quality—typically U.S. Treasury issues—across a range of maturities. The U.S. Treasury yield curve serves as a benchmark for other debt and is used in economic forecasting. |
The opinions expressed are those of the portfolio managers as of the date of this report and are subject to change. There is no guarantee that any forecasts will come to pass. This material does not constitute investment advice and is not intended as an endorsement of any specific investment.
| 10 | MainStay MacKay Tax Free Bond Fund |
Portfolio of Investments October 31, 2023†^
| | Principal
Amount | Value |
| Municipal Bonds 98.3% |
| Long-Term Municipal Bonds 96.2% |
| Alabama 2.7% |
| Black Belt Energy Gas District, Gas Project, Revenue Bonds | | |
| Series D-1 | | |
| 4.00%, due 7/1/52 (a) | $ 3,000,000 | $ 2,894,146 |
| Series B-1 | | |
| 4.00%, due 4/1/53 (a) | 19,350,000 | 18,548,769 |
| Series B | | |
| 4.74%, due 4/1/53 | 36,990,000 | 36,308,189 |
| Series B-2 | | |
| 5.25%, due 12/1/53 (a) | 12,500,000 | 12,601,275 |
| Series D-3 | | |
| 5.408%, due 6/1/49 | 9,250,000 | 9,232,607 |
| Black Belt Energy Gas District, Gas Project No.6, Revenue Bonds | | |
| Series B | | |
| 4.00%, due 10/1/52 (a) | 31,755,000 | 30,595,193 |
| Black Belt Energy Gas District, Gas Project No.7, Revenue Bonds | | |
| Series C-2 | | |
| 4.44%, due 10/1/52 | 6,710,000 | 6,538,811 |
| County of Jefferson, Sewer, Revenue Bonds, Sub. Lien | | |
| Series D | | |
| 6.00%, due 10/1/42 | 4,910,000 | 5,051,918 |
| Energy Southeast, A Cooperative District, Revenue Bonds | | |
| Series B-1 | | |
| 5.75%, due 4/1/54 (a) | 16,850,000 | 17,440,441 |
| Series B-2 | | |
| 5.758%, due 4/1/54 | 20,000,000 | 19,974,600 |
| Lower Alabama Gas District (The), Revenue Bonds | | |
| Series A | | |
| 5.00%, due 9/1/46 | 20,795,000 | 19,370,534 |
| Southeast Energy Authority, A Cooperative District, Project No. 2, Revenue Bonds | | |
| Series B | | |
| 4.00%, due 12/1/51 (a) | 14,815,000 | 13,517,974 |
| Southeast Energy Authority, A Cooperative District, Project No. 4, Revenue Bonds | | |
| Series B-1 | | |
| 5.00%, due 5/1/53 (a) | 12,230,000 | 12,116,447 |
| | Principal
Amount | Value |
| |
| Alabama (continued) |
| Town of Pike Road, Limited General Obligation | | |
| 5.00%, due 3/1/52 | $ 7,750,000 | $ 7,824,674 |
| | | 212,015,578 |
| Alaska 0.2% |
| Alaska Housing Finance Corp., General Mortgage, Revenue Bonds | | |
| Series C-II, Insured: GNMA / FNMA / FHLMC | | |
| 5.75%, due 12/1/52 | 6,350,000 | 6,523,750 |
| Alaska Industrial Development & Export Authority, Greater Fairbanks Community Hospital Foundation Obligated Group, Revenue Bonds | | |
| 5.00%, due 4/1/32 | 3,050,000 | 3,054,595 |
| Municipality of Anchorage, Unlimited General Obligation | | |
| Series B | | |
| 5.00%, due 9/1/26 | 5,340,000 | 5,448,844 |
| | | 15,027,189 |
| Arizona 0.7% |
| Arizona Board of Regents, Arizona State University, Revenue Bonds | | |
| Series A | | |
| 5.50%, due 7/1/48 | 8,500,000 | 9,002,402 |
| City of Phoenix Civic Improvement Corp., Airport, Revenue Bonds, Junior Lien | | |
| Series D | | |
| 5.00%, due 7/1/37 | 5,000,000 | 5,023,894 |
| City of Phoenix Civic Improvement Corp., Water System, Revenue Bonds, Junior Lien | | |
| Series A | | |
| 5.00%, due 7/1/44 | 10,180,000 | 10,418,156 |
| Coconino County Unified School District No. 1, Flagstaff, Unlimited General Obligation | | |
| Series B | | |
| 1.75%, due 7/1/35 | 2,375,000 | 1,602,317 |
| Series B | | |
| 1.75%, due 7/1/36 | 2,760,000 | 1,788,484 |
The notes to the financial statements are an integral part of, and should be read in conjunction with, the financial statements.
11
Portfolio of Investments October 31, 2023†^ (continued)
| | Principal
Amount | Value |
| Long-Term Municipal Bonds (continued) |
| Arizona (continued) |
| Maricopa County Industrial Development Authority, Banner Health, Revenue Bonds | | |
| Series D | | |
| 4.00%, due 1/1/48 | $ 6,000,000 | $ 4,958,977 |
| Salt River Project Agricultural Improvement & Power District, Revenue Bonds | | |
| Series A | | |
| 5.00%, due 12/1/45 | 5,000,000 | 5,074,669 |
| Series A | | |
| 5.00%, due 1/1/50 | 14,250,000 | 14,530,444 |
| | | 52,399,343 |
| Arkansas 0.2% |
| Little Rock School District, Limited General Obligation | | |
| Series A, Insured: BAM State Aid Withholding | | |
| 3.00%, due 2/1/46 | 15,230,000 | 10,404,216 |
| Series A, Insured: BAM State Aid Withholding | | |
| 3.00%, due 2/1/50 | 6,180,000 | 4,048,731 |
| State of Arkansas, Unlimited General Obligation | | |
| 3.00%, due 10/1/24 | 2,000,000 | 1,977,380 |
| | | 16,430,327 |
| California 12.3% |
| Alameda Corridor Transportation Authority, Revenue Bonds | | |
| Series A, Insured: NATL-RE | | |
| (zero coupon), due 10/1/36 | 23,000,000 | 12,301,019 |
| Series C, Insured: AGM | | |
| 5.00%, due 10/1/52 | 4,750,000 | 4,750,316 |
| Allan Hancock Joint Community College District, Unlimited General Obligation | | |
| Series C | | |
| (zero coupon), due 8/1/44 | 8,500,000 | 5,278,456 |
| Anaheim City School District, Election of 2010, Unlimited General Obligation | | |
| Insured: AGM | | |
| 5.00%, due 8/1/51 | 4,670,000 | 4,730,861 |
| | Principal
Amount | Value |
| |
| California (continued) |
| Antelope Valley Community College District, Election of 2016, Unlimited General Obligation | | |
| Series B | | |
| 3.00%, due 8/1/50 | $ 3,750,000 | $ 2,501,202 |
| Cabrillo Unified School District, Election of 2018, Unlimited General Obligation | | |
| Series B, Insured: AGM-CR | | |
| 5.00%, due 8/1/50 | 4,105,000 | 4,135,602 |
| California Community Choice Financing Authority, Clean Energy Project, Revenue Bonds | | |
| Series A-1 | | |
| 4.00%, due 5/1/53 (a) | 4,555,000 | 4,334,469 |
| Series E-1 | | |
| 5.00%, due 2/1/54 (a) | 4,160,000 | 4,146,740 |
| Series E-2 | | |
| 5.228%, due 2/1/54 | 27,500,000 | 27,298,516 |
| Series C | | |
| 5.25%, due 1/1/54 (a) | 22,825,000 | 22,345,184 |
| Series A-2 | | |
| 5.508%, due 12/1/53 | 14,250,000 | 14,383,205 |
| California Health Facilities Financing Authority, CommonSpirit Health, Revenue Bonds | | |
| Series A, Insured: BAM | | |
| 3.00%, due 4/1/44 | 2,075,000 | 1,428,697 |
| Series A | | |
| 4.00%, due 4/1/49 | 5,000,000 | 3,963,353 |
| California Infrastructure & Economic Development Bank, Brightline West Passenger Rail Project, Revenue Bonds | | |
| Series A | | |
| 3.65%, due 1/1/50 (a)(b)(c) | 8,600,000 | 8,552,116 |
| California Infrastructure & Economic Development Bank, Clean Water and Drinking Water, Revenue Bonds | | |
| 4.00%, due 10/1/40 | 5,100,000 | 4,728,867 |
| 4.00%, due 10/1/42 | 1,500,000 | 1,374,224 |
| 4.00%, due 10/1/45 | 7,400,000 | 6,675,924 |
| California Municipal Finance Authority, Community Health System, Revenue Bonds | | |
| Series A, Insured: AGM-CR | | |
| 4.00%, due 2/1/41 | 2,500,000 | 2,200,828 |
The notes to the financial statements are an integral part of, and should be read in conjunction with, the financial statements.
| 12 | MainStay MacKay Tax Free Bond Fund |
| | Principal
Amount | Value |
| Long-Term Municipal Bonds (continued) |
| California (continued) |
| California Municipal Finance Authority, CHF-Davis I LLC, West Village Student Housing Project, Revenue Bonds | | |
| 5.00%, due 5/15/32 | $ 1,570,000 | $ 1,612,824 |
| Insured: BAM | | |
| 5.00%, due 5/15/36 | 3,400,000 | 3,481,483 |
| Insured: BAM | | |
| 5.00%, due 5/15/39 | 8,215,000 | 8,281,183 |
| California Public Finance Authority, Hoag Memorial Hospital Presbyterian, Revenue Bonds | | |
| Series A | | |
| 4.00%, due 7/15/51 | 15,000,000 | 13,058,909 |
| California State University, Systemwide, Revenue Bonds | | |
| Series C | | |
| 3.00%, due 11/1/40 | 6,000,000 | 4,575,510 |
| Series A | | |
| 5.00%, due 11/1/42 | 9,725,000 | 9,826,649 |
| Carlsbad Unified School District, Election of 2018, Unlimited General Obligation | | |
| Series B | | |
| 3.00%, due 8/1/46 | 2,725,000 | 1,877,669 |
| Center Joint Unified School District, Election of 2008, Unlimited General Obligation | | |
| Series B, Insured: BAM | | |
| 3.00%, due 8/1/51 | 4,750,000 | 3,140,934 |
| Chabot-Las Positas Community College District, Unlimited General Obligation | | |
| Series C | | |
| 5.25%, due 8/1/48 | 5,000,000 | 5,248,282 |
| City of Escondido, Unlimited General Obligation | | |
| 5.00%, due 9/1/36 | 4,000,000 | 4,069,396 |
| City of Long Beach, Harbor, Revenue Bonds | | |
| Series A | | |
| 5.00%, due 5/15/44 | 6,070,000 | 6,250,954 |
| City of Los Angeles, Department of Airports, Revenue Bonds (c) | | |
| Series D | | |
| 3.00%, due 5/15/39 | 170,000 | 155,248 |
| | Principal
Amount | Value |
| |
| California (continued) |
City of Los Angeles, Department of Airports, Revenue Bonds (c)
(continued) | | |
| Series D | | |
| 4.00%, due 5/15/40 | $ 2,200,000 | $ 1,902,207 |
| Series A | | |
| 5.00%, due 5/15/44 | 3,535,000 | 3,411,745 |
| City of Los Angeles, Department of Airports, Revenue Bonds, Senior Lien | | |
| Series C | | |
| 4.00%, due 5/15/50 (c) | 11,000,000 | 8,942,228 |
| Series A | | |
| 4.75%, due 5/15/40 (c) | 6,000,000 | 5,726,471 |
| Series A | | |
| 5.00%, due 5/15/33 (c) | 3,330,000 | 3,323,518 |
| Series G | | |
| 5.00%, due 5/15/47 (c) | 3,250,000 | 3,138,193 |
| Series I | | |
| 5.00%, due 5/15/48 | 5,800,000 | 5,915,238 |
| Series G | | |
| 5.50%, due 5/15/36 (c) | 15,175,000 | 16,111,900 |
| Series G | | |
| 5.50%, due 5/15/39 (c) | 3,250,000 | 3,374,361 |
| Series G | | |
| 5.50%, due 5/15/40 (c) | 6,700,000 | 6,944,856 |
| Series H | | |
| 5.50%, due 5/15/47 (c) | 8,150,000 | 8,289,320 |
| City of Los Angeles, Wastewater System, Revenue Bonds | | |
| Series A | | |
| 5.00%, due 6/1/43 | 3,000,000 | 2,999,951 |
| Coalinga-Huron Joint Unified School District, Election of 2016, Unlimited General Obligation | | |
| Series B, Insured: BAM | | |
| 5.00%, due 8/1/48 | 4,985,000 | 5,010,965 |
| El Camino Community College District Foundation (The), Election of 2002, Unlimited General Obligation | | |
| Series C | | |
| (zero coupon), due 8/1/38 | 11,750,000 | 5,749,975 |
| Fontana Public Facilities Financing Authority, City of Fontana, Revenue Bonds | | |
| Series A, Insured: BAM | | |
| 5.00%, due 9/1/32 | 1,320,000 | 1,329,263 |
The notes to the financial statements are an integral part of, and should be read in conjunction with, the financial statements.
13
Portfolio of Investments October 31, 2023†^ (continued)
| | Principal
Amount | Value |
| Long-Term Municipal Bonds (continued) |
| California (continued) |
| Fresno Unified School District, Unlimited General Obligation | | |
| Series B | | |
| 3.00%, due 8/1/43 | $ 7,500,000 | $ 5,388,982 |
| Irvine Facilities Financing Authority, Community Facilities District No. 2013-3, Special Tax | | |
| Series A, Insured: BAM | | |
| 5.00%, due 9/1/48 | 8,500,000 | 8,684,937 |
| Irvine Facilities Financing Authority, Gateway Preserve Land Acquisition Project, Revenue Bonds | | |
| Series A | | |
| 5.25%, due 5/1/43 | 3,800,000 | 3,853,854 |
| Jurupa Unified School District, Election 2014, Unlimited General Obligation | | |
| Series C | | |
| 5.25%, due 8/1/43 | 4,450,000 | 4,592,116 |
| Live Oak Elementary School District, Certificate of Participation | | |
| Insured: AGM | | |
| 5.00%, due 8/1/39 | 2,455,000 | 2,493,813 |
| Long Beach Unified School District, Unlimited General Obligation | | |
| Series D-1 | | |
| (zero coupon), due 8/1/30 | 4,450,000 | 3,291,773 |
| Los Angeles Unified School District, Unlimited General Obligation | | |
| Series C | | |
| 4.00%, due 7/1/33 | 2,750,000 | 2,760,463 |
| Series C | | |
| 4.00%, due 7/1/38 | 5,750,000 | 5,416,487 |
| Series A | | |
| 5.00%, due 7/1/32 | 7,080,000 | 7,674,275 |
| Series A | | |
| 5.00%, due 7/1/33 | 7,620,000 | 8,233,997 |
| Los Angeles Unified School District, Election of 2008, Unlimited General Obligation | | |
| Series B-1, Insured: AGM-CR | | |
| 5.25%, due 7/1/42 | 41,155,000 | 42,510,942 |
| | Principal
Amount | Value |
| |
| California (continued) |
| Metropolitan Water District of Southern California, Waterworks, Revenue Bonds | | |
| Series C | | |
| 4.23%, due 7/1/47 | $ 12,850,000 | $ 12,823,745 |
| Modesto Irrigation District, Domestic Water Project, Revenue Bonds | | |
| Series F, Insured: NATL-RE | | |
| 4.38%, due 9/1/27 | 5,805,000 | 5,731,511 |
| Moreno Valley Unified School District, Election 2014, Unlimited General Obligation | | |
| Series C, Insured: BAM | | |
| 3.00%, due 8/1/46 | 4,750,000 | 3,273,000 |
| Murrieta Valley Unified School District, Election of 2014, Unlimited General Obligation | | |
| 5.25%, due 9/1/51 | 9,700,000 | 9,922,329 |
| Napa Valley Community College District, Unlimited General Obligation | | |
| 4.00%, due 8/1/29 | 5,250,000 | 5,268,081 |
| 4.00%, due 8/1/32 | 5,250,000 | 5,233,660 |
| North Lake Tahoe Public Financing Authority, Health & Human Services Center, Revenue Bonds | | |
| 4.50%, due 12/1/52 | 4,350,000 | 4,126,556 |
| Oak Grove School District, Unlimited General Obligation | | |
| Series A-2, Insured: BAM | | |
| 5.00%, due 8/1/52 | 4,330,000 | 4,416,965 |
| Oakland Unified School District, Alameda County, Unlimited General Obligation | | |
| Insured: AGM | | |
| 5.00%, due 8/1/27 | 1,160,000 | 1,181,525 |
| Insured: AGM | | |
| 5.00%, due 8/1/28 | 1,755,000 | 1,784,307 |
| Insured: AGM | | |
| 5.00%, due 8/1/29 | 2,285,000 | 2,318,371 |
| Ocean View School District of Orange County, Unlimited General Obligation | | |
| Series C, Insured: AGM | | |
| 3.00%, due 8/1/47 | 4,250,000 | 2,845,090 |
The notes to the financial statements are an integral part of, and should be read in conjunction with, the financial statements.
| 14 | MainStay MacKay Tax Free Bond Fund |
| | Principal
Amount | Value |
| Long-Term Municipal Bonds (continued) |
| California (continued) |
| Ontario Montclair School District, Election of 2016, Unlimited General Obligation | | |
| Series A | | |
| 5.00%, due 8/1/46 | $ 3,250,000 | $ 3,291,534 |
| Orange County Sanitation District, Revenue Bonds | | |
| Series A | | |
| 5.00%, due 2/1/30 | 8,500,000 | 8,585,560 |
| Palomar Community College District, Election of 2006, Unlimited General Obligation | | |
| Series D | | |
| 5.25%, due 8/1/45 | 10,000,000 | 10,220,895 |
| Panama-Buena Vista Union School District, Election of 2022, Unlimited General Obligation | | |
| 0.05%, due 8/1/24 | 4,170,000 | 4,028,382 |
| Peninsula Corridor Joint Powers Board, Green Bond, Revenue Bonds | | |
| Series A | | |
| 5.00%, due 6/1/47 | 3,000,000 | 3,063,250 |
| Richmond Joint Powers Financing Authority, Civic Center Project, Revenue Bonds | | |
| Series A, Insured: AGM | | |
| 5.00%, due 11/1/36 | 2,750,000 | 2,858,079 |
| Riverside County Transportation Commission, Sales Tax, Revenue Bonds | | |
| Series B | | |
| 4.00%, due 6/1/36 | 15,950,000 | 15,517,032 |
| Sacramento Area Flood Control Agency, Consolidated Capital Assessment District No. 2, Special Assessment | | |
| Series A | | |
| 5.00%, due 10/1/36 | 3,195,000 | 3,262,755 |
| Sacramento City Unified School District, Election of 2020, Unlimited General Obligation | | |
| Series A, Insured: BAM | | |
| 5.50%, due 8/1/47 | 8,840,000 | 9,207,797 |
| Series A, Insured: BAM | | |
| 5.50%, due 8/1/52 | 14,920,000 | 15,508,988 |
| | Principal
Amount | Value |
| |
| California (continued) |
| Sacramento Municipal Utility District, Revenue Bonds | | |
| Series H | | |
| 4.00%, due 8/15/45 | $ 5,200,000 | $ 4,627,188 |
| San Bernardino City Unified School District, Election of 2012, Unlimited General Obligation | | |
| Series F, Insured: AGM | | |
| 3.00%, due 8/1/44 | 5,650,000 | 3,897,009 |
| San Diego County Regional Airport Authority, Revenue Bonds | | |
| Series B | | |
| 5.00%, due 7/1/33 (c) | 4,990,000 | 5,124,836 |
| San Diego Public Facilities Financing Authority, Water Utility, Revenue Bonds | | |
| Series A | | |
| 5.25%, due 8/1/48 | 5,250,000 | 5,523,689 |
| San Diego Unified School District, Election of 2012, Unlimited General Obligation | | |
| Series R-2 | | |
| (zero coupon), due 7/1/41 | 11,000,000 | 9,021,702 |
| Series M-2 | | |
| 3.00%, due 7/1/50 | 10,000,000 | 6,674,914 |
| Series B-4 | | |
| 5.00%, due 7/1/40 | 4,570,000 | 4,864,021 |
| Series I | | |
| 5.00%, due 7/1/41 | 3,750,000 | 3,826,521 |
| San Francisco City & County Airport Commission, San Francisco International Airport, Revenue Bonds, Second Series (c) | | |
| Series C | | |
| 5.00%, due 5/1/33 (d) | 35,000,000 | 35,887,320 |
| Series A | | |
| 5.00%, due 5/1/34 | 7,350,000 | 7,509,762 |
| Series E | | |
| 5.00%, due 5/1/50 | 46,725,000 | 44,649,644 |
| San Francisco City & County Airport Commission, San Francisco International Airport, Revenue Bonds (c) | | |
| Series A | | |
| 5.00%, due 5/1/44 | 10,740,000 | 10,353,116 |
| Series A | | |
| 5.00%, due 5/1/49 | 5,330,000 | 5,115,391 |
The notes to the financial statements are an integral part of, and should be read in conjunction with, the financial statements.
15
Portfolio of Investments October 31, 2023†^ (continued)
| | Principal
Amount | Value |
| Long-Term Municipal Bonds (continued) |
| California (continued) |
| San Joaquin Hills Transportation Corridor Agency, Revenue Bonds, Junior Lien | | |
| Series B | | |
| 5.25%, due 1/15/49 | $ 3,220,000 | $ 3,226,075 |
| San Jose Evergreen Community College District, Election of 2016, Unlimited General Obligation | | |
| Series B | | |
| 3.00%, due 9/1/41 | 1,065,000 | 796,917 |
| San Leandro Unified School District, Election of 2020, Unlimited General Obligation | | |
| Series B | | |
| 5.25%, due 8/1/48 | 10,900,000 | 11,345,643 |
| San Marcos Schools Financing Authority, San Marcos Unified School District, Revenue Bonds | | |
| Insured: AGM | | |
| 5.00%, due 8/15/34 | 1,000,000 | 1,033,181 |
| San Mateo Union High School District, Capital Appreciation, Election of 2010, Unlimited General Obligation | | |
| Series A | | |
| (zero coupon), due 9/1/41 | 6,750,000 | 6,073,990 |
| Santa Ana Unified School District, Capital Appreciation, Election 2008, Unlimited General Obligation | | |
| Series B, Insured: AGC | | |
| (zero coupon), due 8/1/33 | 14,955,000 | 9,198,107 |
| Silicon Valley Clean Water, Revenue Bonds | | |
| Series A | | |
| 0.25%, due 3/1/24 | 7,300,000 | 7,143,416 |
| Southern California Public Power Authority, Southern Transmissional System Renewal Project, Revenue Bonds | | |
| Series A-1 | | |
| 5.25%, due 7/1/53 | 41,725,000 | 43,747,995 |
| State of California, Various Purpose, Unlimited General Obligation | | |
| 3.00%, due 10/1/36 | 5,810,000 | 4,867,810 |
| 3.00%, due 10/1/37 | 8,565,000 | 7,025,998 |
| 3.00%, due 4/1/52 | 5,590,000 | 3,913,556 |
| | Principal
Amount | Value |
| |
| California (continued) |
State of California, Various Purpose, Unlimited General Obligation
(continued) | | |
| 4.00%, due 3/1/36 | $ 30,200,000 | $ 29,757,742 |
| 4.00%, due 10/1/36 | 3,150,000 | 3,030,300 |
| 4.00%, due 10/1/37 | 10,800,000 | 10,329,503 |
| 4.00%, due 10/1/39 | 5,775,000 | 5,458,631 |
| 5.00%, due 11/1/28 | 3,845,000 | 3,849,641 |
| 5.00%, due 11/1/28 | 3,655,000 | 3,658,256 |
| Series B | | |
| 5.00%, due 11/1/32 | 30,350,000 | 33,297,753 |
| 5.00%, due 9/1/41 | 6,150,000 | 6,413,742 |
| 5.00%, due 10/1/41 | 16,065,000 | 16,712,813 |
| 5.00%, due 9/1/42 | 10,000,000 | 10,432,688 |
| 5.00%, due 4/1/47 | 10,500,000 | 10,814,782 |
| Stockton Unified School District, Unlimited General Obligation | | |
| Series A, Insured: AGM | | |
| 5.00%, due 8/1/42 | 4,400,000 | 4,414,886 |
| Sunnyvale School District, Election of 2013, Unlimited General Obligation | | |
| Series C | | |
| 3.00%, due 9/1/44 | 6,750,000 | 4,856,489 |
| Tahoe-Truckee Unified School District, Election 2014, Unlimited General Obligation | | |
| Series B | | |
| 5.00%, due 8/1/41 | 1,950,000 | 1,976,120 |
| Temecula Valley Unified School District, Election 2012, Unlimited General Obligation | | |
| Series D | | |
| 3.00%, due 8/1/47 | 5,000,000 | 3,526,353 |
| Twin Rivers Unified School District, Election 2006, Unlimited General Obligation | | |
| Series 2008, Insured: AGM | | |
| (zero coupon), due 8/1/32 | 4,370,000 | 2,943,146 |
| University of California, Revenue Bonds | | |
| Series AO | | |
| 3.25%, due 5/15/29 | 6,750,000 | 6,436,725 |
| Series AR | | |
| 5.00%, due 5/15/41 | 12,260,000 | 12,340,215 |
| Series BN | | |
| 5.50%, due 5/15/40 | 10,000,000 | 11,034,962 |
The notes to the financial statements are an integral part of, and should be read in conjunction with, the financial statements.
| 16 | MainStay MacKay Tax Free Bond Fund |
| | Principal
Amount | Value |
| Long-Term Municipal Bonds (continued) |
| California (continued) |
| Val Verde Unified School District, Election of 2012, Unlimited General Obligation | | |
| Series F, Insured: AGM | | |
| 3.00%, due 8/1/47 | $ 8,910,000 | $ 5,876,576 |
| Vista Unified School District, Election of 2018, Unlimited General Obligation | | |
| Series B, Insured: BAM | | |
| 5.25%, due 8/1/48 | 6,000,000 | 6,184,451 |
| Yosemite Community College District, Unlimited General Obligation | | |
| Series D | | |
| (zero coupon), due 8/1/42 | 17,500,000 | 12,100,669 |
| | | 959,144,106 |
| Colorado 2.4% |
| Arapahoe County School District No. 5, Cherry Creek, Unlimited General Obligation | | |
| Series B, Insured: State Aid Withholding | | |
| 2.30%, due 12/15/28 | 5,790,000 | 5,062,598 |
| City & County of Denver, Airport System, Revenue Bonds (c) | | |
| Series A | | |
| 5.00%, due 12/1/25 | 4,370,000 | 4,410,364 |
| Series A | | |
| 5.00%, due 12/1/34 | 6,000,000 | 6,115,847 |
| Series A | | |
| 5.00%, due 12/1/36 | 12,115,000 | 11,883,979 |
| Series A | | |
| 5.00%, due 12/1/37 | 11,000,000 | 10,774,205 |
| Series A | | |
| 5.00%, due 12/1/43 | 10,940,000 | 10,534,160 |
| Series A | | |
| 5.00%, due 12/1/48 | 3,790,000 | 3,553,223 |
| Series A | | |
| 5.50%, due 11/15/27 | 6,000,000 | 6,001,106 |
| Series A | | |
| 5.50%, due 11/15/35 | 5,250,000 | 5,580,260 |
| Series A | | |
| 5.50%, due 11/15/40 | 17,760,000 | 18,460,337 |
| Series D | | |
| 5.75%, due 11/15/38 | 3,000,000 | 3,214,185 |
| | Principal
Amount | Value |
| |
| Colorado (continued) |
City & County of Denver, Airport System, Revenue Bonds (c)
(continued) | | |
| Series D | | |
| 5.75%, due 11/15/45 | $ 7,100,000 | $ 7,448,641 |
| City & County of Denver, Convention Center Expansion Project, Certificate of Participation | | |
| Series A | | |
| 5.375%, due 6/1/43 | 4,250,000 | 4,313,630 |
| City of Colorado Springs, Utilities System, Revenue Bonds | | |
| Series A-2 | | |
| 5.00%, due 11/15/44 | 2,750,000 | 2,762,742 |
| Series B | | |
| 5.25%, due 11/15/52 | 11,150,000 | 11,464,820 |
| Colorado Health Facilities Authority, AdventHealth, Revenue Bonds | | |
| Series A | | |
| 3.00%, due 11/15/51 | 4,500,000 | 2,906,743 |
| Series A | | |
| 4.00%, due 11/15/48 | 28,000,000 | 23,151,512 |
| Denver City & County School District No. 1, Unlimited General Obligation | | |
| Insured: State Aid Withholding | | |
| 4.00%, due 12/1/31 | 6,000,000 | 5,926,192 |
| Denver Convention Center Hotel Authority, Revenue Bonds, Senior Lien | | |
| 5.00%, due 12/1/36 | 1,000,000 | 949,074 |
| Regional Transportation District Sales Tax, Fastracks Project, Revenue Bonds | | |
| Series A | | |
| 5.00%, due 11/1/31 | 6,500,000 | 7,048,603 |
| State of Colorado, Certificate of Participation | | |
| 6.00%, due 12/15/40 | 5,025,000 | 5,606,095 |
| 6.00%, due 12/15/41 | 4,560,000 | 5,071,421 |
| Vista Ridge Metropolitan District, Unlimited General Obligation | | |
| Series A, Insured: BAM | | |
| 5.00%, due 12/1/31 | 1,250,000 | 1,281,459 |
The notes to the financial statements are an integral part of, and should be read in conjunction with, the financial statements.
17
Portfolio of Investments October 31, 2023†^ (continued)
| | Principal
Amount | Value |
| Long-Term Municipal Bonds (continued) |
| Colorado (continued) |
| Weld County School District No. RE-4, Unlimited General Obligation | | |
| Insured: State Aid Withholding | | |
| 5.25%, due 12/1/41 | $ 8,250,000 | $ 8,399,574 |
| Insured: State Aid Withholding | | |
| 5.25%, due 12/1/47 | 14,150,000 | 14,636,462 |
| | | 186,557,232 |
| Connecticut 1.6% |
| City of Bridgeport, Unlimited General Obligation | | |
| Series D, Insured: AGM | | |
| 5.00%, due 8/15/35 | 2,590,000 | 2,613,062 |
| Series D, Insured: AGM | | |
| 5.00%, due 8/15/36 | 2,590,000 | 2,604,666 |
| City of Hartford, Unlimited General Obligation | | |
| Series C, Insured: AGM State Guaranteed | | |
| 5.00%, due 7/15/32 | 6,370,000 | 6,446,920 |
| Series C, Insured: AGM State Guaranteed | | |
| 5.00%, due 7/15/34 | 2,250,000 | 2,276,203 |
| State of Connecticut, Unlimited General Obligation | | |
| Series A | | |
| 3.00%, due 1/15/37 | 6,420,000 | 5,145,772 |
| Series F | | |
| 5.00%, due 9/15/28 | 6,610,000 | 6,994,579 |
| Series A | | |
| 5.00%, due 3/15/29 | 5,300,000 | 5,359,908 |
| State of Connecticut, Transportation Infrastructure, Special Tax, Revenue Bonds | | |
| Series A | | |
| 5.00%, due 9/1/33 | 10,950,000 | 11,187,082 |
| Series A | | |
| 5.25%, due 7/1/40 | 20,420,000 | 21,806,326 |
| Series A | | |
| 5.25%, due 7/1/41 | 21,480,000 | 22,822,500 |
| Series A | | |
| 5.25%, due 7/1/42 | 25,220,000 | 26,637,112 |
| | Principal
Amount | Value |
| |
| Connecticut (continued) |
| State of Connecticut Clean Water Fund, State Revolving Fund, Revenue Bonds | | |
| Series A | | |
| 5.00%, due 5/1/33 | $ 2,250,000 | $ 2,335,756 |
| Town of North Branford, Unlimited General Obligation | | |
| 5.00%, due 8/2/24 | 9,500,000 | 9,563,675 |
| | | 125,793,561 |
| Delaware 0.0% ‡ |
| Delaware State Health Facilities Authority, Christiana Care Health System, Revenue Bonds | | |
| Series A | | |
| 5.00%, due 10/1/36 | 3,185,000 | 3,282,305 |
| District of Columbia 2.6% |
| District of Columbia, Water & Sewer Authority, Revenue Bonds, Sub. Lien | | |
| Series C | | |
| 4.00%, due 10/1/32 | 6,975,000 | 6,787,808 |
| District of Columbia, Unlimited General Obligation | | |
| Series D | | |
| 5.00%, due 6/1/32 | 3,500,000 | 3,510,407 |
| Series A | | |
| 5.00%, due 10/15/44 | 11,255,000 | 11,448,791 |
| Series A | | |
| 5.25%, due 1/1/48 | 13,850,000 | 14,368,871 |
| District of Columbia, Revenue Bonds | | |
| Series A | | |
| 5.00%, due 7/1/36 | 7,675,000 | 8,230,985 |
| Series A | | |
| 5.50%, due 7/1/47 | 28,705,000 | 30,367,878 |
| Metropolitan Washington Airports Authority, Dulles Toll Road, Metrorail & Capital Improvement Project, Revenue Bonds, Senior Lien | | |
| Series A, Insured: AGM | | |
| 4.00%, due 10/1/52 | 20,435,000 | 16,959,456 |
| Series B | | |
| 6.50%, due 10/1/44 | 6,040,000 | 6,373,628 |
| Series B | | |
| 6.50%, due 10/1/44 | 2,600,000 | 2,743,615 |
The notes to the financial statements are an integral part of, and should be read in conjunction with, the financial statements.
| 18 | MainStay MacKay Tax Free Bond Fund |
| | Principal
Amount | Value |
| Long-Term Municipal Bonds (continued) |
| District of Columbia (continued) |
| Metropolitan Washington Airports Authority, Dulles Toll Road, Metrorail & Capital Improvement Project, Revenue Bonds, Second Lien | | |
| Series C, Insured: AGC | | |
| 6.50%, due 10/1/41 | $ 6,730,000 | $ 7,222,857 |
| Metropolitan Washington Airports Authority, Revenue Bonds (c) | | |
| Series A | | |
| 5.00%, due 10/1/28 | 2,700,000 | 2,696,221 |
| Series A | | |
| 5.00%, due 10/1/29 | 25,250,000 | 25,206,542 |
| Series A | | |
| 5.00%, due 10/1/35 | 3,955,000 | 3,963,668 |
| Series A | | |
| 5.00%, due 10/1/36 | 3,750,000 | 3,757,515 |
| Series A | | |
| 5.00%, due 10/1/43 | 6,000,000 | 5,814,312 |
| Series A | | |
| 5.25%, due 10/1/48 | 5,000,000 | 4,965,413 |
| Washington Metropolitan Area Transit Authority, Green bond, Revenue Bonds | | |
| Series A, Insured: BAM | | |
| 3.00%, due 7/15/36 | 5,175,000 | 4,252,595 |
| Series A | | |
| 4.00%, due 7/15/39 | 5,600,000 | 5,081,910 |
| Series A | | |
| 5.50%, due 7/15/51 | 13,275,000 | 13,937,594 |
| Washington Metropolitan Area Transit Authority, Green bond, Revenue Bonds, Second Lien | | |
| Series A | | |
| 5.00%, due 7/15/44 | 4,500,000 | 4,593,353 |
| Series A | | |
| 5.00%, due 7/15/48 | 6,105,000 | 6,174,778 |
| Series A | | |
| 5.25%, due 7/15/53 | 16,225,000 | 16,618,567 |
| | | 205,076,764 |
| Florida 4.6% |
| City of Cape Coral, Water & Sewer, Revenue Bonds | | |
| Insured: BAM | | |
| 4.00%, due 10/1/42 | 7,000,000 | 6,088,345 |
| | Principal
Amount | Value |
| |
| Florida (continued) |
| City of Fort Lauderdale, Parks and Recreation Project, Unlimited General Obligation | | |
| Series A | | |
| 5.00%, due 7/1/48 | $ 4,255,000 | $ 4,337,997 |
| City of Gainesville, Utilities System, Revenue Bonds | | |
| Series A | | |
| 5.00%, due 10/1/44 | 14,645,000 | 14,742,870 |
| City of Miami, Beach Parking, Revenue Bonds | | |
| Insured: BAM | | |
| 5.00%, due 9/1/40 | 510,000 | 510,023 |
| City of South Miami, Miami Health Facilities Authority, Inc., Revenue Bonds | | |
| 5.00%, due 8/15/42 | 17,115,000 | 16,577,118 |
| City of Tampa, Revenue Bonds | | |
| Series C, Insured: BAM | | |
| 3.00%, due 10/1/36 | 4,440,000 | 3,641,141 |
| City of Tampa, BayCare, Revenue Bonds | | |
| Series A | | |
| 5.00%, due 11/15/46 | 6,000,000 | 5,737,061 |
| County of Brevard, Solid Waste Management System, Revenue Bonds | | |
| 5.50%, due 9/1/53 | 8,720,000 | 8,965,040 |
| County of Broward, Tourist Development Tax, Revenue Bonds | | |
| 4.00%, due 9/1/40 | 5,000,000 | 4,319,407 |
| County of Broward, Airport System, Revenue Bonds | | |
| 5.00%, due 10/1/42 (c) | 5,045,000 | 4,893,229 |
| County of Lee, Airport, Revenue Bonds (c) | | |
| Series A | | |
| 5.00%, due 10/1/24 | 3,785,000 | 3,801,614 |
| Series A | | |
| 5.00%, due 10/1/24 | 815,000 | 818,577 |
| Series A | | |
| 5.00%, due 10/1/29 | 11,000,000 | 11,246,191 |
| Series A | | |
| 5.00%, due 10/1/30 | 8,030,000 | 8,189,583 |
| Series B | | |
| 5.00%, due 10/1/37 | 3,750,000 | 3,676,534 |
| Series B | | |
| 5.00%, due 10/1/46 | 4,750,000 | 4,512,847 |
The notes to the financial statements are an integral part of, and should be read in conjunction with, the financial statements.
19
Portfolio of Investments October 31, 2023†^ (continued)
| | Principal
Amount | Value |
| Long-Term Municipal Bonds (continued) |
| Florida (continued) |
| County of Miami-Dade, Water & Sewer System, Revenue Bonds | | |
| Insured: BAM | | |
| 3.00%, due 10/1/36 | $ 2,100,000 | $ 1,672,572 |
| Series B | | |
| 4.00%, due 10/1/38 | 5,000,000 | 4,565,636 |
| Series B, Insured: BAM | | |
| 4.00%, due 10/1/49 | 39,630,000 | 32,702,724 |
| Series B | | |
| 5.00%, due 10/1/33 | 4,250,000 | 4,299,719 |
| County of Miami-Dade, Transit System, Revenue Bonds | | |
| 3.00%, due 7/1/37 | 4,000,000 | 3,143,155 |
| County of Miami-Dade, Aviation, Revenue Bonds | | |
| Series A | | |
| 5.00%, due 10/1/38 (c) | 4,650,000 | 4,545,648 |
| County of Pasco, State of Florida Cigarette Tax Revenue, Revenue Bonds | | |
| Series A, Insured: AGM | | |
| 5.75%, due 9/1/54 | 17,500,000 | 18,293,289 |
| County of Sarasota, Utility System, Revenue Bonds | | |
| 5.25%, due 10/1/52 | 12,795,000 | 13,237,631 |
| Florida Municipal Power Agency, All-Requirements Power Supply Project, Revenue Bonds | | |
| Series A | | |
| 5.00%, due 10/1/26 | 3,500,000 | 3,601,184 |
| Greater Orlando Aviation Authority, Revenue Bonds | | |
| Series A | | |
| 5.00%, due 10/1/33 (c) | 1,205,000 | 1,222,824 |
| Hillsborough County Aviation Authority, Tampa International Airport, Revenue Bonds | | |
| Series A | | |
| 5.00%, due 10/1/47 (c) | 7,000,000 | 6,701,966 |
| Miami-Dade County Health Facilities Authority, Nicklaus Children's Hospital Project, Revenue Bonds | | |
| Series A, Insured: AGM-CR | | |
| 4.00%, due 8/1/46 | 5,000,000 | 4,123,516 |
| | Principal
Amount | Value |
| |
| Florida (continued) |
| North Broward Hospital District, Revenue Bonds | | |
| Series B | | |
| 5.00%, due 1/1/42 | $ 6,500,000 | $ 6,144,775 |
| Orange County Health Facilities Authority, Orlando Health, Revenue Bonds | | |
| Series A | | |
| 4.00%, due 10/1/49 | 3,530,000 | 2,875,310 |
| 4.00%, due 10/1/52 | 7,000,000 | 5,636,053 |
| Series A | | |
| 5.00%, due 10/1/39 | 2,875,000 | 2,788,365 |
| School Board of Miami-Dade County (The), Unlimited General Obligation | | |
| Series A, Insured: BAM | | |
| 5.00%, due 3/15/35 | 6,060,000 | 6,541,498 |
| Series A, Insured: BAM | | |
| 5.00%, due 3/15/47 | 8,240,000 | 8,374,317 |
| Series A, Insured: BAM | | |
| 5.00%, due 3/15/52 | 5,755,000 | 5,781,123 |
| School District of Broward County, Certificate of Participation | | |
| Series A, Insured: AGM | | |
| 5.00%, due 7/1/27 | 3,750,000 | 3,814,326 |
| South Broward Hospital District, Revenue Bonds | | |
| Series A | | |
| 3.00%, due 5/1/51 | 8,000,000 | 5,025,525 |
| Series A, Insured: BAM | | |
| 3.00%, due 5/1/51 | 21,200,000 | 13,929,362 |
| 4.00%, due 5/1/48 | 4,750,000 | 3,813,033 |
| South Florida Water Management District, Certificate of Participation | | |
| 5.00%, due 10/1/34 | 12,955,000 | 13,217,818 |
| State of Florida, Department of Transportation Turnpike System, Revenue Bonds | | |
| Series B | | |
| 3.00%, due 7/1/49 | 3,750,000 | 2,557,459 |
| Series C | | |
| 3.00%, due 7/1/51 | 8,150,000 | 5,509,072 |
| Series A | | |
| 3.50%, due 7/1/29 | 7,250,000 | 6,918,745 |
| Series A | | |
| 4.00%, due 7/1/32 | 4,250,000 | 4,219,338 |
The notes to the financial statements are an integral part of, and should be read in conjunction with, the financial statements.
| 20 | MainStay MacKay Tax Free Bond Fund |
| | Principal
Amount | Value |
| Long-Term Municipal Bonds (continued) |
| Florida (continued) |
| State of Florida, Capital Outlay, Unlimited General Obligation | | |
| Series C | | |
| 3.15%, due 6/1/29 | $ 4,750,000 | $ 4,442,350 |
| Series C | | |
| 4.00%, due 6/1/32 | 3,400,000 | 3,408,641 |
| Tampa Bay Water, Revenue Bonds | | |
| Series A | | |
| 5.00%, due 10/1/26 | 5,780,000 | 5,896,590 |
| Village Community Development District No. 8, Special Assessment | | |
| Insured: AGM | | |
| 3.50%, due 5/1/40 | 4,945,000 | 4,055,949 |
| Volusia County Educational Facility Authority, Embry-Riddle Aeronautical University, Revenue Bonds | | |
| Series A | | |
| 5.00%, due 10/15/49 | 3,650,000 | 3,527,077 |
| West Palm Beach Community Redevelopment Agency, City center community redevelopment, Tax Allocation | | |
| Insured: AGM-CR | | |
| 5.00%, due 3/1/34 | 8,450,000 | 8,981,196 |
| Insured: AGM-CR | | |
| 5.00%, due 3/1/35 | 9,020,000 | 9,556,003 |
| Wildwood Utility Dependent District, Revenue Bonds | | |
| Insured: AGM | | |
| 5.25%, due 10/1/43 | 10,250,000 | 10,531,459 |
| Insured: AGM | | |
| 5.50%, due 10/1/53 | 14,000,000 | 14,338,762 |
| | | 362,051,587 |
| Georgia 2.6% |
| Augusta Development Authority, WellStar Health System Project, Revenue Bonds | | |
| Series A, Insured: AGM | | |
| 5.125%, due 4/1/53 | 5,400,000 | 5,343,548 |
| Brookhaven Development Authority, Children's Healthcare of Atlanta, Revenue Bonds | | |
| Series A | | |
| 4.00%, due 7/1/44 | 10,935,000 | 9,445,752 |
| | Principal
Amount | Value |
| |
| Georgia (continued) |
| Brookhaven Development Authority, Children's Healthcare of Atlanta, Revenue Bonds (continued) | | |
| Series A | | |
| 4.00%, due 7/1/49 | $ 15,325,000 | $ 12,920,604 |
| City of Atlanta, Airport Passenger Facility Charge, Revenue Bonds, Sub. Lien | | |
| Series D | | |
| 4.00%, due 7/1/35 (c) | 13,820,000 | 12,917,959 |
| City of Atlanta, Water & Wastewater, Revenue Bonds | | |
| Series C | | |
| 4.00%, due 11/1/37 | 4,750,000 | 4,363,603 |
| 5.00%, due 11/1/29 | 4,250,000 | 4,311,457 |
| City of Atlanta, Department of Aviation, Revenue Bonds (c) | | |
| Series C | | |
| 5.00%, due 1/1/27 | 2,750,000 | 2,753,640 |
| Series C | | |
| 5.00%, due 1/1/28 | 2,250,000 | 2,252,978 |
| Series C | | |
| 5.00%, due 1/1/29 | 2,000,000 | 2,002,647 |
| City of Atlanta, Public Improvement, Unlimited General Obligation | | |
| Series A-1 | | |
| 5.00%, due 12/1/42 | 11,750,000 | 12,172,499 |
| City of Dalton (The), Georgia Combined Utilities, Revenue Bonds | | |
| 5.00%, due 3/1/30 | 2,055,000 | 2,079,548 |
| Dalton Whitfield County Joint Development Authority, Hamilton Health Care System, Revenue Bonds | | |
| 4.00%, due 8/15/48 | 4,375,000 | 3,622,891 |
| Development Authority of Appling County, Oglethorpe Power Corp. Project, Revenue Bonds | | |
| Series A | | |
| 1.50%, due 1/1/38 (a) | 2,500,000 | 2,366,667 |
| Development Authority of Burke County (The), Oglethorpe Power Corp. Project, Revenue Bonds | | |
| Series A | | |
| 1.50%, due 1/1/40 (a) | 6,315,000 | 5,978,200 |
The notes to the financial statements are an integral part of, and should be read in conjunction with, the financial statements.
21
Portfolio of Investments October 31, 2023†^ (continued)
| | Principal
Amount | Value |
| Long-Term Municipal Bonds (continued) |
| Georgia (continued) |
| Development Authority of Monroe County (The), Oglethorpe Power Corp. Scherer Project, Revenue Bonds | | |
| Series A | | |
| 1.50%, due 1/1/39 (a) | $ 3,250,000 | $ 3,076,667 |
| Gainesville & Hall County Hospital Authority, Northeast Georgia Health System, Revenue Bonds | | |
| Series A | | |
| 2.50%, due 2/15/51 | 8,500,000 | 4,658,146 |
| Georgia Ports Authority, Revenue Bonds | | |
| 4.00%, due 7/1/47 | 3,000,000 | 2,545,472 |
| 5.25%, due 7/1/39 | 2,500,000 | 2,642,795 |
| 5.25%, due 7/1/43 | 4,695,000 | 4,896,398 |
| 5.25%, due 7/1/52 | 4,750,000 | 4,879,612 |
| Griffin-Spalding County Hospital Authority, WellStar Health System, Revenue Bonds | | |
| 4.00%, due 4/1/42 | 3,500,000 | 3,017,126 |
| Main Street Natural Gas, Inc., Revenue Bonds | | |
| Series C | | |
| 4.00%, due 3/1/50 (a) | 2,500,000 | 2,429,224 |
| Series C | | |
| 4.00%, due 5/1/52 (a) | 6,960,000 | 6,529,042 |
| Series A | | |
| 4.00%, due 7/1/52 (a) | 21,645,000 | 20,832,464 |
| Series A | | |
| 4.00%, due 9/1/52 (a) | 21,190,000 | 19,711,175 |
| Series A | | |
| 5.00%, due 5/15/34 | 2,750,000 | 2,713,417 |
| Series A | | |
| 5.00%, due 5/15/37 | 2,265,000 | 2,187,939 |
| Municipal Electric Authority of Georgia, Project One Subordinated Bonds, Revenue Bonds | | |
| Series A, Insured: AGM-CR | | |
| 4.00%, due 1/1/41 | 2,545,000 | 2,250,256 |
| Series A | | |
| 4.00%, due 1/1/49 | 4,850,000 | 3,920,410 |
| Series A | | |
| 5.00%, due 1/1/45 | 2,185,000 | 2,130,346 |
| Series A, Insured: BAM | | |
| 5.00%, due 1/1/45 | 3,050,000 | 3,016,158 |
| | Principal
Amount | Value |
| |
| Georgia (continued) |
| Municipal Electric Authority of Georgia, Plant Vogtle Units 3&4 Project, Revenue Bonds | | |
| Series B | | |
| 4.00%, due 1/1/49 | $ 5,500,000 | $ 4,293,489 |
| Series A | | |
| 5.00%, due 1/1/39 | 10,000,000 | 9,752,894 |
| Municipal Electric Authority of Georgia, Power, Revenue Bonds | | |
| Series HH | | |
| 5.00%, due 1/1/36 | 3,515,000 | 3,551,862 |
| Series GG | | |
| 5.00%, due 1/1/43 | 3,000,000 | 2,933,924 |
| Series HH | | |
| 5.00%, due 1/1/44 | 2,700,000 | 2,642,747 |
| Municipal Electric Authority of Georgia, Plant Vogtle Units 3 & 4 Project, Revenue Bonds | | |
| Series A | | |
| 5.25%, due 7/1/64 | 6,500,000 | 6,265,742 |
| | | 203,409,298 |
| Guam 0.1% |
| Guam Government Waterworks Authority, Water and Wastewater System, Revenue Bonds | | |
| 5.00%, due 1/1/46 | 6,000,000 | 5,501,979 |
| Series A | | |
| 5.00%, due 1/1/50 | 1,660,000 | 1,491,581 |
| Guam Power Authority, Revenue Bonds | | |
| Series A, Insured: AGM | | |
| 5.00%, due 10/1/44 | 655,000 | 631,111 |
| | | 7,624,671 |
| Hawaii 0.6% |
| City & County of Honolulu, Wastewater System, Revenue Bonds, Senior Lien | | |
| Series B | | |
| 4.00%, due 7/1/29 | 8,450,000 | 8,419,981 |
| City & County of Honolulu, Unlimited General Obligation | | |
| Series C | | |
| 4.00%, due 10/1/31 | 5,500,000 | 5,454,204 |
| Series B | | |
| 5.00%, due 10/1/25 | 3,725,000 | 3,805,495 |
| Series D | | |
| 5.00%, due 3/1/26 | 2,500,000 | 2,568,024 |
The notes to the financial statements are an integral part of, and should be read in conjunction with, the financial statements.
| 22 | MainStay MacKay Tax Free Bond Fund |
| | Principal
Amount | Value |
| Long-Term Municipal Bonds (continued) |
| Hawaii (continued) |
| State of Hawaii, Unlimited General Obligation | | |
| Series FH | | |
| 4.00%, due 10/1/30 | $ 12,250,000 | $ 12,165,667 |
| Series FB | | |
| 4.00%, due 4/1/31 | 6,300,000 | 6,247,913 |
| Series FK | | |
| 4.00%, due 5/1/32 | 4,300,000 | 4,234,870 |
| State of Hawaii Department of Budget & Finance, Hawaiian Electric Co., Inc., Revenue Bonds | | |
| Insured: AGM-CR | | |
| 3.50%, due 10/1/49 (c) | 5,675,000 | 3,983,363 |
| | | 46,879,517 |
| Idaho 0.0% ‡ |
| Boise State University, Revenue Bonds | | |
| Series A | | |
| 5.25%, due 4/1/53 | 3,600,000 | 3,636,744 |
| Illinois 7.4% |
| Chicago Board of Education, Capital Appreciation, School Reform, Unlimited General Obligation | | |
| Series A, Insured: NATL-RE | | |
| (zero coupon), due 12/1/26 | 17,245,000 | 14,821,867 |
| Chicago Board of Education, Unlimited General Obligation | | |
| Series A, Insured: AGM | | |
| 5.00%, due 12/1/27 | 7,000,000 | 7,087,276 |
| Chicago Board of Education, Dedicated Capital Improvement, Revenue Bonds | | |
| 5.75%, due 4/1/48 | 17,500,000 | 17,599,071 |
| 6.00%, due 4/1/46 | 16,560,000 | 16,659,637 |
| Chicago Midway International Airport, Revenue Bonds, Second Lien | | |
| Series B | | |
| 5.00%, due 1/1/26 | 2,880,000 | 2,887,733 |
| Chicago O'Hare International Airport, General, Revenue Bonds, Senior Lien | | |
| Series A, Insured: AGM | | |
| 4.00%, due 1/1/36 | 8,100,000 | 7,732,224 |
| | Principal
Amount | Value |
| |
| Illinois (continued) |
| Chicago O'Hare International Airport, General, Revenue Bonds, Senior Lien (continued) | | |
| Series A | | |
| 4.00%, due 1/1/36 | $ 12,500,000 | $ 11,932,444 |
| Series A, Insured: BAM | | |
| 4.00%, due 1/1/43 (c) | 7,250,000 | 6,106,784 |
| Series D, Insured: AGM | | |
| 5.00%, due 1/1/38 | 4,750,000 | 4,868,722 |
| Series D | | |
| 5.00%, due 1/1/52 (c) | 3,250,000 | 3,001,221 |
| Series F | | |
| 5.25%, due 1/1/29 | 3,060,000 | 3,166,627 |
| Series A, Insured: AGM | | |
| 5.50%, due 1/1/53 (c) | 23,525,000 | 23,645,500 |
| Chicago O'Hare International Airport, General, Revenue Bonds | | |
| Series A | | |
| 5.00%, due 1/1/31 (c) | 8,500,000 | 8,428,106 |
| Series B | | |
| 5.00%, due 1/1/33 | 3,600,000 | 3,575,826 |
| Chicago O'Hare International Airport, Passenger Facility Charge, Revenue Bonds | | |
| Series A | | |
| 5.00%, due 1/1/30 | 2,665,000 | 2,656,982 |
| Chicago Park District, Limited Tax, Limited General Obligation | | |
| Series C | | |
| 4.00%, due 1/1/35 | 4,000,000 | 3,695,004 |
| Series B | | |
| 5.00%, due 1/1/25 | 2,140,000 | 2,142,535 |
| Series A | | |
| 5.00%, due 1/1/28 | 1,000,000 | 1,006,919 |
| Series A | | |
| 5.00%, due 1/1/31 | 1,000,000 | 1,005,806 |
| Series A | | |
| 5.00%, due 1/1/35 | 2,000,000 | 2,008,389 |
| Chicago Transit Authority Sales Tax Receipts Fund, Revenue Bonds, Second Lien | | |
| 5.00%, due 12/1/46 | 4,530,000 | 4,359,662 |
| City of Chicago, Waterworks, Revenue Bonds, Second Lien | | |
| 4.00%, due 11/1/37 | 265,000 | 232,910 |
| 5.00%, due 11/1/29 | 1,700,000 | 1,708,766 |
| Series 2, Insured: AGM | | |
| 5.00%, due 11/1/32 | 4,000,000 | 4,084,160 |
The notes to the financial statements are an integral part of, and should be read in conjunction with, the financial statements.
23
Portfolio of Investments October 31, 2023†^ (continued)
| | Principal
Amount | Value |
| Long-Term Municipal Bonds (continued) |
| Illinois (continued) |
City of Chicago, Waterworks, Revenue Bonds, Second Lien
(continued) | | |
| Series 2, Insured: AGM | | |
| 5.00%, due 11/1/33 | $ 8,550,000 | $ 8,739,073 |
| Series 2, Insured: AGM | | |
| 5.00%, due 11/1/38 | 2,750,000 | 2,719,091 |
| Insured: AGM | | |
| 5.25%, due 11/1/33 | 4,000,000 | 4,145,516 |
| Insured: AGM | | |
| 5.25%, due 11/1/34 | 1,860,000 | 1,924,545 |
| Insured: AGM | | |
| 5.25%, due 11/1/35 | 2,275,000 | 2,344,885 |
| Series A, Insured: AGM | | |
| 5.25%, due 11/1/48 | 5,000,000 | 5,048,406 |
| Series A, Insured: AGM | | |
| 5.50%, due 11/1/62 | 7,000,000 | 7,266,659 |
| City of Chicago, Unlimited General Obligation | | |
| Series B | | |
| 4.00%, due 1/1/38 | 4,750,000 | 4,058,364 |
| Series A | | |
| 5.00%, due 1/1/32 | 1,400,000 | 1,423,560 |
| Series A | | |
| 5.00%, due 1/1/33 | 1,425,000 | 1,448,728 |
| Series A | | |
| 5.50%, due 1/1/40 | 4,650,000 | 4,689,646 |
| Series A | | |
| 5.50%, due 1/1/49 | 8,550,000 | 8,355,703 |
| Series A | | |
| 6.00%, due 1/1/38 | 39,050,000 | 40,007,690 |
| Series A, Insured: BAM | | |
| 6.00%, due 1/1/38 | 5,000,000 | 5,163,942 |
| City of Chicago, Wastewater Transmission Project, Revenue Bonds, Second Lien | | |
| 5.00%, due 1/1/28 | 1,000,000 | 1,000,679 |
| Series B, Insured: AGM-CR | | |
| 5.00%, due 1/1/30 | 6,435,000 | 6,475,474 |
| Insured: BAM | | |
| 5.00%, due 1/1/44 | 11,240,000 | 10,770,815 |
| Series A, Insured: AGM | | |
| 5.25%, due 1/1/42 | 3,750,000 | 3,788,887 |
| City of Chicago, Motor Fuel Tax, Revenue Bonds | | |
| Insured: AGM | | |
| 5.00%, due 1/1/33 | 3,770,000 | 3,775,614 |
| | Principal
Amount | Value |
| |
| Illinois (continued) |
| City of Chicago Heights, Unlimited General Obligation | | |
| Series B, Insured: BAM | | |
| 5.25%, due 12/1/34 | $ 1,865,000 | $ 1,956,821 |
| Cook County High School District No. 209, Proviso Township, Limited General Obligation | | |
| Series B, Insured: AGM | | |
| 4.00%, due 12/1/38 | 3,000,000 | 2,651,495 |
| County of Cook, Unlimited General Obligation | | |
| Series A | | |
| 5.00%, due 11/15/24 | 3,750,000 | 3,784,443 |
| Illinois Finance Authority, Northwestern Memorial Healthcare, Revenue Bonds | | |
| Series A | | |
| 4.00%, due 7/15/47 | 16,660,000 | 13,835,730 |
| Illinois Municipal Electric Agency, Revenue Bonds | | |
| Series A | | |
| 4.00%, due 2/1/34 | 5,650,000 | 5,224,647 |
| Illinois Sports Facilities Authority (The), Revenue Bonds | | |
| Insured: AGM | | |
| 5.25%, due 6/15/31 | 4,000,000 | 4,017,509 |
| Illinois State Toll Highway Authority, Revenue Bonds, Senior Lien | | |
| Series B | | |
| 5.00%, due 1/1/34 | 3,250,000 | 3,249,619 |
| Series B | | |
| 5.00%, due 1/1/41 | 6,000,000 | 6,020,026 |
| Illinois State Toll Highway Authority, Revenue Bonds | | |
| Series A | | |
| 5.00%, due 1/1/37 | 5,000,000 | 5,000,133 |
| Lake County Community High School District No. 115, Lake Forest, Unlimited General Obligation | | |
| 4.25%, due 11/1/41 | 7,260,000 | 6,735,006 |
| 4.50%, due 11/1/42 | 7,585,000 | 7,210,357 |
| Metropolitan Pier & Exposition Authority, McCormick Place Expansion Project, Capital Appreciation, Revenue Bonds | | |
| Series A, Insured: NATL-RE | | |
| (zero coupon), due 6/15/35 | 20,150,000 | 11,415,733 |
The notes to the financial statements are an integral part of, and should be read in conjunction with, the financial statements.
| 24 | MainStay MacKay Tax Free Bond Fund |
| | Principal
Amount | Value |
| Long-Term Municipal Bonds (continued) |
| Illinois (continued) |
Metropolitan Pier & Exposition Authority, McCormick Place Expansion Project, Capital Appreciation, Revenue Bonds
(continued) | | |
| Series A, Insured: NATL-RE | | |
| (zero coupon), due 6/15/36 | $ 30,550,000 | $ 16,230,063 |
| Series B-1, Insured: AGM | | |
| (zero coupon), due 6/15/43 | 13,720,000 | 4,730,161 |
| Rock Island County Public Building Commission, County of Rock Island, Revenue Bonds | | |
| Insured: AGM | | |
| 5.00%, due 12/1/36 | 2,145,000 | 2,193,375 |
| Sales Tax Securitization Corp., Revenue Bonds | | |
| Series A | | |
| 4.00%, due 1/1/48 | 10,000,000 | 8,084,490 |
| Series A, Insured: BAM | | |
| 4.00%, due 1/1/48 | 9,500,000 | 7,765,611 |
| Series C | | |
| 5.00%, due 1/1/25 | 4,000,000 | 4,044,765 |
| Series A | | |
| 5.00%, due 1/1/28 | 3,685,000 | 3,815,269 |
| Series C | | |
| 5.25%, due 1/1/34 | 7,500,000 | 7,749,797 |
| Series C, Insured: BAM | | |
| 5.25%, due 1/1/48 | 32,200,000 | 32,298,635 |
| Sangamon County School District No. 186, Springfield, Unlimited General Obligation | | |
| Insured: AGM | | |
| 5.50%, due 6/1/58 | 9,475,000 | 9,628,699 |
| Southern Illinois University, Housing & Auxiliary Facilities System, Revenue Bonds | | |
| Series B, Insured: BAM | | |
| 5.00%, due 4/1/26 | 1,175,000 | 1,186,458 |
| Series B, Insured: BAM | | |
| 5.00%, due 4/1/29 | 1,620,000 | 1,630,933 |
| Series B, Insured: BAM | | |
| 5.00%, due 4/1/30 | 1,000,000 | 1,005,932 |
| State of Illinois, Unlimited General Obligation | | |
| Insured: BAM | | |
| 4.00%, due 6/1/41 | 6,450,000 | 5,561,256 |
| | Principal
Amount | Value |
| |
| Illinois (continued) |
| State of Illinois, Unlimited General Obligation (continued) | | |
| Series D | | |
| 5.00%, due 11/1/26 | $ 7,375,000 | $ 7,514,747 |
| 5.00%, due 2/1/27 | 3,980,000 | 4,062,368 |
| Series D | | |
| 5.00%, due 11/1/27 | 10,000,000 | 10,249,154 |
| 5.00%, due 1/1/28 | 5,155,000 | 5,221,428 |
| Series D | | |
| 5.00%, due 11/1/28 | 6,280,000 | 6,422,293 |
| 5.00%, due 5/1/29 | 2,660,000 | 2,641,895 |
| Series A | | |
| 5.00%, due 12/1/34 | 4,500,000 | 4,531,839 |
| 5.25%, due 2/1/32 | 8,550,000 | 8,490,464 |
| Series A | | |
| 5.50%, due 3/1/47 | 4,750,000 | 4,778,180 |
| 5.75%, due 5/1/45 | 4,250,000 | 4,337,014 |
| Series A | | |
| 6.00%, due 5/1/27 | 8,190,000 | 8,624,882 |
| State of Illinois, Sales Tax, Revenue Bonds, Junior Lien | | |
| Series C | | |
| 5.00%, due 6/15/30 | 3,000,000 | 3,093,561 |
| State of Illinois, Build America Bonds, Unlimited General Obligation | | |
| Series 4, Insured: AGM-CR | | |
| 6.875%, due 7/1/25 | 6,335,000 | 6,405,913 |
| United City of Yorkville, Special Tax | | |
| Insured: AGM | | |
| 5.00%, due 3/1/32 | 3,017,000 | 3,054,458 |
| Village of Bellwood, Unlimited General Obligation | | |
| Insured: AGM | | |
| 5.00%, due 12/1/29 | 1,500,000 | 1,530,172 |
| Village of Rosemont, Corporate Purpose, Unlimited General Obligation | | |
| Series A, Insured: AGM | | |
| 5.00%, due 12/1/40 | 6,790,000 | 6,866,827 |
| Village of Schaumburg, Unlimited General Obligation | | |
| Series A, Insured: BAM | | |
| 4.00%, due 12/1/41 | 32,050,000 | 28,656,142 |
The notes to the financial statements are an integral part of, and should be read in conjunction with, the financial statements.
25
Portfolio of Investments October 31, 2023†^ (continued)
| | Principal
Amount | Value |
| Long-Term Municipal Bonds (continued) |
| Illinois (continued) |
| Will County School District No. 114, Manhattan, Unlimited General Obligation | | |
| Insured: BAM | | |
| 5.50%, due 1/1/49 | $ 6,210,000 | $ 6,415,621 |
| | | 577,485,369 |
| Indiana 0.9% |
| Greater Clark Building Corp., Revenue Bonds | | |
| Insured: State Intercept | | |
| 6.00%, due 7/15/38 | 5,700,000 | 6,297,556 |
| Indiana Finance Authority, Indiana University Health, Revenue Bonds | | |
| Series L | | |
| 0.70%, due 12/1/46 (a) | 5,000,000 | 4,528,777 |
| Series A | | |
| 5.00%, due 10/1/41 | 7,750,000 | 7,927,895 |
| Series A | | |
| 5.00%, due 10/1/42 | 12,220,000 | 12,408,124 |
| Series A | | |
| 5.00%, due 10/1/46 | 4,000,000 | 3,950,716 |
| Indiana Finance Authority, CWA Authority, Inc., Revenue Bonds, First Lien | | |
| Series B | | |
| 5.25%, due 10/1/47 | 13,695,000 | 13,881,026 |
| Indiana Housing & Community Development Authority, Revenue Bonds | | |
| Series A-1, Insured: GNMA / FNMA / FHLMC | | |
| 5.75%, due 7/1/53 | 2,745,000 | 2,816,684 |
| Indiana Municipal Power Agency, Revenue Bonds | | |
| Series A | | |
| 5.00%, due 1/1/42 | 15,425,000 | 15,372,637 |
| Indianapolis Local Public Improvement Bond Bank, Revenue Bonds | | |
| Series C | | |
| 5.00%, due 1/1/52 | 6,350,000 | 6,379,182 |
| | | 73,562,597 |
| | Principal
Amount | Value |
| |
| Iowa 0.3% |
| Ames Community School District, Unlimited General Obligation | | |
| 1.875%, due 6/1/36 | $ 4,000,000 | $ 2,779,372 |
| 1.875%, due 6/1/37 | 4,000,000 | 2,643,909 |
| City of Des Moines, Unlimited General Obligation | | |
| Series F | | |
| 2.00%, due 6/1/37 | 4,450,000 | 3,066,722 |
| PEFA, Inc., Revenue Bonds | | |
| 5.00%, due 9/1/49 (a) | 8,175,000 | 8,121,417 |
| Waukee Community School District, Unlimited General Obligation | | |
| Series B | | |
| 2.00%, due 6/1/37 | 4,265,000 | 2,843,582 |
| | | 19,455,002 |
| Kansas 0.1% |
| City of Hutchinson, Hutchinson Regional Medical Center, Inc., Revenue Bonds | | |
| 5.00%, due 12/1/26 | 565,000 | 545,973 |
| 5.00%, due 12/1/28 | 410,000 | 387,773 |
| 5.00%, due 12/1/30 | 500,000 | 464,088 |
| City of Topeka, Combined Utility, Revenue Bonds | | |
| Series A | | |
| 4.00%, due 8/1/48 | 6,000,000 | 4,874,376 |
| University of Kansas Hospital Authority, KU Health System, Revenue Bonds | | |
| 5.00%, due 9/1/33 | 2,500,000 | 2,516,092 |
| 5.00%, due 9/1/35 | 2,550,000 | 2,558,356 |
| | | 11,346,658 |
| Kentucky 0.7% |
| Kentucky Public Energy Authority, Gas Supply, Revenue Bonds | | |
| Series C | | |
| 4.00%, due 2/1/50 (a) | 8,640,000 | 8,200,112 |
| Series A-1 | | |
| 4.00%, due 8/1/52 (a) | 9,125,000 | 8,434,649 |
| Series A-2 | | |
| 4.758%, due 8/1/52 | 18,960,000 | 18,172,586 |
| Series C-2 | | |
| 4.938%, due 12/1/49 | 5,750,000 | 5,750,815 |
The notes to the financial statements are an integral part of, and should be read in conjunction with, the financial statements.
| 26 | MainStay MacKay Tax Free Bond Fund |
| | Principal
Amount | Value |
| Long-Term Municipal Bonds (continued) |
| Kentucky (continued) |
| Louisville & Jefferson County Visitors and Convention Commission, Revenue Bonds | | |
| Insured: AGM-CR | | |
| 4.00%, due 6/1/29 | $ 3,320,000 | $ 3,251,483 |
| Louisville/Jefferson County Metropolitan Government, UofL Health Project, Revenue Bonds | | |
| Series A, Insured: AGM | | |
| 5.00%, due 5/15/47 | 8,250,000 | 7,913,916 |
| | | 51,723,561 |
| Louisiana 0.3% |
| City of Shreveport, Unlimited General Obligation | | |
| Insured: BAM | | |
| 5.00%, due 8/1/30 | 4,355,000 | 4,425,415 |
| Ernest N Morial New Orleans Exhibition Hall Authority, Special Tax | | |
| 5.50%, due 7/15/53 | 15,135,000 | 15,451,497 |
| | | 19,876,912 |
| Maine 0.0% ‡ |
| Maine Municipal Bond Bank, Revenue Bonds | | |
| Series B | | |
| 3.50%, due 11/1/29 | 3,700,000 | 3,542,626 |
| Maryland 0.3% |
| County of Baltimore, Unlimited General Obligation | | |
| 3.50%, due 8/1/29 | 8,200,000 | 7,849,395 |
| County of Frederick, Public Facilities Project, Unlimited General Obligation | | |
| Series A | | |
| 1.75%, due 10/1/36 | 5,630,000 | 3,868,815 |
| State of Maryland, Department of Transportation, Revenue Bonds | | |
| Series A | | |
| 3.00%, due 10/1/33 | 1,550,000 | 1,358,286 |
| State of Maryland, State and Local Facilities Loan, Unlimited General Obligation | | |
| Series A | | |
| 5.00%, due 6/1/33 | 4,250,000 | 4,667,280 |
| | Principal
Amount | Value |
| |
| Maryland (continued) |
| State of Maryland, Unlimited General Obligation | | |
| Series A | | |
| 5.00%, due 3/15/36 | $ 4,010,000 | $ 4,370,196 |
| | | 22,113,972 |
| Massachusetts 2.4% |
| City of Boston, Unlimited General Obligation | | |
| Series A | | |
| 5.00%, due 11/1/38 | 5,750,000 | 6,171,955 |
| City of Cambridge, Limited General Obligation | | |
| 5.00%, due 2/15/26 | 2,000,000 | 2,063,462 |
| City of Worcester, Limited General Obligation | | |
| Insured: AGM | | |
| 3.00%, due 2/1/37 | 2,750,000 | 2,227,118 |
| Commonwealth of Massachusetts, Consolidated Loan, Limited General Obligation | | |
| Series B | | |
| 3.00%, due 4/1/47 | 6,725,000 | 4,571,218 |
| Series B | | |
| 3.00%, due 2/1/48 | 31,045,000 | 20,886,887 |
| Series B | | |
| 3.00%, due 4/1/48 | 5,000,000 | 3,359,963 |
| Series C | | |
| 3.00%, due 3/1/49 | 13,250,000 | 8,816,318 |
| Series B | | |
| 3.00%, due 4/1/49 | 7,465,000 | 4,964,315 |
| Series D | | |
| 5.00%, due 7/1/25 | 9,500,000 | 9,699,889 |
| Series A | | |
| 5.00%, due 4/1/37 | 2,950,000 | 3,008,330 |
| Series D | | |
| 5.00%, due 7/1/45 | 20,280,000 | 20,581,991 |
| Series E | | |
| 5.00%, due 11/1/50 | 4,050,000 | 4,087,029 |
| Series A | | |
| 5.00%, due 5/1/53 | 17,010,000 | 17,174,698 |
| Commonwealth of Massachusetts Transportation Fund, Rail Enhancement Program, Revenue Bonds | | |
| Series A | | |
| 5.00%, due 6/1/50 | 14,200,000 | 14,320,334 |
The notes to the financial statements are an integral part of, and should be read in conjunction with, the financial statements.
27
Portfolio of Investments October 31, 2023†^ (continued)
| | Principal
Amount | Value |
| Long-Term Municipal Bonds (continued) |
| Massachusetts (continued) |
| Massachusetts Bay Transportation Authority, Sales Tax, Revenue Bonds | | |
| Series A | | |
| (zero coupon), due 7/1/31 | $ 11,500,000 | $ 7,890,925 |
| Massachusetts Development Finance Agency, Partners Healthcare System Issue, Revenue Bonds | | |
| Series O-2 | | |
| 5.00%, due 7/1/27 | 4,700,000 | 4,788,405 |
| Massachusetts Development Finance Agency, Harvard University Issue, Revenue Bonds | | |
| Series B | | |
| 5.00%, due 11/15/32 | 11,735,000 | 13,097,728 |
| Massachusetts Development Finance Agency, Dana-Farber Cancer Institute, Revenue Bonds | | |
| Series N | | |
| 5.00%, due 12/1/41 | 15,500,000 | 15,367,012 |
| Massachusetts Development Finance Agency, Trustees of Boston University, Revenue Bonds | | |
| Series P | | |
| 5.45%, due 5/15/59 | 5,305,000 | 5,519,998 |
| Massachusetts School Building Authority, Revenue Bonds, Senior Lien | | |
| Series B | | |
| 5.00%, due 11/15/33 | 8,500,000 | 8,732,643 |
| Town of Middleton, Limited General Obligation | | |
| 2.00%, due 12/15/39 | 2,675,000 | 1,687,973 |
| Town of Natick, Qualified Municipal Purpose Loan, Limited General Obligation | | |
| 4.00%, due 7/15/36 | 3,280,000 | 3,274,173 |
| Town of Stoneham, Limited General Obligation | | |
| 2.25%, due 1/15/39 | 4,430,000 | 2,982,388 |
| | | 185,274,752 |
| | Principal
Amount | Value |
| |
| Michigan 1.6% |
| Downriver Utility Wastewater Authority, Revenue Bonds | | |
| Insured: AGM | | |
| 5.00%, due 4/1/31 | $ 1,600,000 | $ 1,661,634 |
| Flat Rock Community School District, Unlimited General Obligation | | |
| Insured: Q-SBLF | | |
| 5.25%, due 5/1/52 | 2,365,000 | 2,367,610 |
| Great Lakes Water Authority, Water Supply System, Revenue Bonds, Senior Lien | | |
| Series C | | |
| 5.25%, due 7/1/34 | 15,350,000 | 15,616,720 |
| Holly Area School District, Unlimited General Obligation | | |
| Series I, Insured: Q-SBLF | | |
| 5.25%, due 5/1/48 | 3,415,000 | 3,429,348 |
| Lapeer Community Schools, Unlimited General Obligation | | |
| Insured: AGM | | |
| 5.25%, due 5/1/46 | 9,000,000 | 9,019,079 |
| Lincoln Consolidated School District, Unlimited General Obligation | | |
| Series A, Insured: AGM Q-SBLF | | |
| 5.00%, due 5/1/30 | 1,455,000 | 1,481,166 |
| Series A, Insured: AGM Q-SBLF | | |
| 5.00%, due 5/1/40 | 1,300,000 | 1,293,437 |
| Michigan Finance Authority, McLaren Health Care Corp., Revenue Bonds | | |
| Series A | | |
| 4.00%, due 2/15/44 | 8,500,000 | 7,179,844 |
| Michigan Finance Authority, BHSH System Obligated Group, Revenue Bonds | | |
| Series A | | |
| 5.00%, due 4/15/28 | 6,600,000 | 6,845,610 |
| Michigan Finance Authority, Great Lakes Water Authority Sewage Disposal System, Revenue Bonds, Second Lien | | |
| Series C-7, Insured: NATL-RE | | |
| 5.00%, due 7/1/32 | 2,000,000 | 2,010,458 |
The notes to the financial statements are an integral part of, and should be read in conjunction with, the financial statements.
| 28 | MainStay MacKay Tax Free Bond Fund |
| | Principal
Amount | Value |
| Long-Term Municipal Bonds (continued) |
| Michigan (continued) |
| Michigan Finance Authority, Great Lakes Water Authority Sewage Disposal System, Revenue Bonds, Senior Lien | | |
| Series C-3, Insured: AGM | | |
| 5.00%, due 7/1/33 | $ 2,500,000 | $ 2,513,398 |
| Michigan Finance Authority, Great Lakes Water Authority Water Supply System, Revenue Bonds | | |
| Series D-1, Insured: AGM | | |
| 5.00%, due 7/1/35 | 1,750,000 | 1,757,667 |
| Series D-6, Insured: NATL-RE | | |
| 5.00%, due 7/1/36 | 6,350,000 | 6,362,546 |
| Michigan Finance Authority, Beaumont Health Obligated Group, Revenue Bonds | | |
| Series A | | |
| 5.00%, due 11/1/44 | 4,860,000 | 4,617,548 |
| Michigan Finance Authority, Bronson Health Care Group, Revenue Bonds | | |
| Series A | | |
| 5.00%, due 5/15/54 | 11,870,000 | 11,331,420 |
| Michigan State Housing Development Authority, Revenue Bonds | | |
| Series A | | |
| 3.75%, due 4/1/27 | 8,500,000 | 8,193,444 |
| Southgate Community School District, Unlimited General Obligation | | |
| Series II, Insured: Q-SBLF | | |
| 5.25%, due 5/1/49 | 9,440,000 | 9,588,561 |
| State of Michigan, Trunk Line, Revenue Bonds | | |
| Series A | | |
| 4.00%, due 11/15/44 | 31,625,000 | 27,669,759 |
| | | 122,939,249 |
| Minnesota 0.9% |
| City of Rochester, Mayo Clinic, Revenue Bonds | | |
| 4.00%, due 11/15/39 | 16,425,000 | 14,782,204 |
| | Principal
Amount | Value |
| |
| Minnesota (continued) |
| Elk River Independent School District No. 728, Unlimited General Obligation | | |
| Series A, Insured: SD CRED PROG | | |
| 2.25%, due 2/1/36 | $ 5,250,000 | $ 3,900,852 |
| Series A, Insured: SD CRED PROG | | |
| 2.50%, due 2/1/38 | 9,000,000 | 6,497,705 |
| Metropolitan Council, Minneapolis-St.Paul Metropolitan Area, Unlimited General Obligation | | |
| Series A | | |
| 3.00%, due 3/1/29 | 5,500,000 | 5,170,421 |
| Minneapolis-St Paul Metropolitan Airports Commission, Revenue Bonds | | |
| Series B | | |
| 5.00%, due 1/1/28 (c) | 5,000,000 | 5,073,361 |
| Minnesota Housing Finance Agency, Residential Housing Finance, Revenue Bonds | | |
| Series E, Insured: GNMA / FNMA / FHLMC | | |
| 4.25%, due 1/1/49 | 30,000 | 29,378 |
| Moorhead Independent School District No. 152, Unlimited General Obligation | | |
| Series A, Insured: SD CRED PROG | | |
| 2.50%, due 2/1/38 | 8,000,000 | 5,811,776 |
| State of Minnesota, Unlimited General Obligation | | |
| Series B | | |
| 1.625%, due 8/1/37 | 4,000,000 | 2,563,277 |
| Series B | | |
| 5.00%, due 8/1/26 | 11,000,000 | 11,377,629 |
| White Bear Lake Independent School District No. 624, Unlimited General Obligation | | |
| Series A, Insured: SD CRED PROG | | |
| 2.50%, due 2/1/39 | 8,300,000 | 5,873,195 |
| Series A, Insured: SD CRED PROG | | |
| 2.50%, due 2/1/40 | 8,105,000 | 5,620,664 |
| Series A, Insured: SD CRED PROG | | |
| 3.00%, due 2/1/43 | 4,060,000 | 2,933,603 |
| | | 69,634,065 |
The notes to the financial statements are an integral part of, and should be read in conjunction with, the financial statements.
29
Portfolio of Investments October 31, 2023†^ (continued)
| | Principal
Amount | Value |
| Long-Term Municipal Bonds (continued) |
| Mississippi 0.0% ‡ |
| Mississippi Home Corp., Single Family Mortgage Housing, Revenue Bonds | | |
| Series A, Insured: GNMA / FNMA / FHLMC | | |
| 4.00%, due 12/1/44 | $ 950,000 | $ 929,016 |
| Missouri 0.7% |
| Health & Educational Facilities Authority of the State of Missouri, Mercy Health, Revenue Bonds | | |
| 3.00%, due 6/1/53 | 4,500,000 | 2,810,806 |
| 4.00%, due 6/1/53 | 9,750,000 | 7,724,663 |
| 5.50%, due 12/1/48 | 11,300,000 | 11,561,354 |
| Health & Educational Facilities Authority of the State of Missouri, St Luke's Health System, Revenue Bonds | | |
| Series A | | |
| 4.00%, due 11/15/48 | 8,500,000 | 6,946,306 |
| Health & Educational Facilities Authority of the State of Missouri, CoxHealth, Revenue Bonds | | |
| Series A | | |
| 4.00%, due 11/15/49 | 6,750,000 | 5,493,665 |
| Health & Educational Facilities Authority of the State of Missouri, BJC Healthcare, Revenue Bonds | | |
| Series D | | |
| 4.00%, due 1/1/58 (a) | 13,000,000 | 10,724,665 |
| Missouri Housing Development Commission, First Place Homeownership Loan Program, Revenue Bonds | | |
| Series A, Insured: GNMA / FNMA / FHLMC | | |
| 4.25%, due 5/1/47 | 210,000 | 205,791 |
| Missouri Joint Municipal Electric Utility Commission, Prairie State Project, Revenue Bonds | | |
| Series A | | |
| 5.00%, due 12/1/31 | 3,000,000 | 3,033,098 |
| | Principal
Amount | Value |
| |
| Missouri (continued) |
| St. Charles County School District No. R-IV, Wentzville, Unlimited General Obligation | | |
| Insured: State Aid Direct Deposit | | |
| 1.875%, due 3/1/40 | $ 11,145,000 | $ 6,626,658 |
| | | 55,127,006 |
| Montana 0.3% |
| Montana Board of Housing, Single Family Mortgage, Revenue Bonds | | |
| Series B | | |
| 3.40%, due 12/1/33 | 685,000 | 615,688 |
| Series B | | |
| 3.60%, due 6/1/37 | 890,000 | 758,872 |
| Montana Facility Finance Authority, Benefis Health System Obligated Group, Revenue Bonds | | |
| 5.00%, due 2/15/31 | 1,500,000 | 1,504,647 |
| 5.00%, due 2/15/33 | 1,320,000 | 1,323,111 |
| 5.00%, due 2/15/34 | 1,200,000 | 1,203,262 |
| Montana State Board of Regents, University of Montana/Missoula, Revenue Bonds | | |
| Insured: AGM | | |
| 5.25%, due 11/15/52 | 7,370,000 | 7,497,182 |
| Silver Bow County School District No. 1, School Building, Unlimited General Obligation | | |
| 4.00%, due 7/1/32 | 1,945,000 | 1,864,830 |
| 4.00%, due 7/1/33 | 2,020,000 | 1,928,028 |
| Yellowstone County K-12, School District No. 26 Lockwood, Unlimited General Obligation | | |
| 5.00%, due 7/1/29 | 2,010,000 | 2,108,307 |
| 5.00%, due 7/1/30 | 2,000,000 | 2,092,135 |
| 5.00%, due 7/1/31 | 2,265,000 | 2,363,774 |
| 5.00%, due 7/1/32 | 2,550,000 | 2,654,897 |
| | | 25,914,733 |
| Nebraska 1.4% |
| Central Plains Energy, Nebraska Gas Project No. 4, Revenue Bonds | | |
| Series A | | |
| 5.00%, due 3/1/50 (a) | 42,065,000 | 42,194,165 |
| County of Sarpy, Highway Allocation Fund, Limited General Obligation | | |
| 1.875%, due 6/1/39 | 2,890,000 | 1,757,093 |
The notes to the financial statements are an integral part of, and should be read in conjunction with, the financial statements.
| 30 | MainStay MacKay Tax Free Bond Fund |
| | Principal
Amount | Value |
| Long-Term Municipal Bonds (continued) |
| Nebraska (continued) |
| Metropolitan Utilities District of Omaha, Revenue Bonds | | |
| 3.30%, due 12/1/29 | $ 2,845,000 | $ 2,634,067 |
| 3.40%, due 12/1/30 | 7,000,000 | 6,423,767 |
| Nebraska Investment Finance Authority, Single Family Housing, Revenue Bonds | | |
| Series C | | |
| 4.00%, due 9/1/48 | 100,000 | 97,768 |
| Omaha Public Power District, Revenue Bonds | | |
| Series C | | |
| 5.00%, due 2/1/43 | 4,500,000 | 4,511,659 |
| Series A | | |
| 5.25%, due 2/1/52 | 21,430,000 | 22,165,988 |
| Omaha Public Power District, Electric System, Revenue Bonds | | |
| Series A | | |
| 5.00%, due 2/1/47 | 19,000,000 | 19,361,612 |
| Omaha School District, Unlimited General Obligation | | |
| 1.75%, due 12/15/36 | 7,635,000 | 5,104,385 |
| 1.75%, due 12/15/37 | 6,755,000 | 4,310,282 |
| | | 108,560,786 |
| Nevada 1.7% |
| City of Reno, Capital Improvement, Revenue Bonds | | |
| Series A-1, Insured: AGM | | |
| 4.00%, due 6/1/46 | 1,600,000 | 1,281,270 |
| Clark County School District, Limited General Obligation | | |
| Series B, Insured: BAM | | |
| 3.00%, due 6/15/36 | 5,500,000 | 4,425,646 |
| County of Clark, Regional Transportation Commission of Southern Nevada Motor Fuel Tax, Revenue Bonds | | |
| Insured: AGM | | |
| 4.00%, due 7/1/40 | 16,500,000 | 14,682,924 |
| County of Clark, Limited General Obligation | | |
| 4.00%, due 7/1/44 | 4,900,000 | 4,220,259 |
| | Principal
Amount | Value |
| |
| Nevada (continued) |
| County of Clark, Stadium Improvements, Limited General Obligation | | |
| Series A | | |
| 5.00%, due 6/1/43 | $ 12,500,000 | $ 12,624,768 |
| Las Vegas Convention & Visitors Authority, Convention Center Expansion, Revenue Bonds | | |
| Series B | | |
| 4.00%, due 7/1/49 | 28,845,000 | 23,799,346 |
| Series B | | |
| 5.00%, due 7/1/34 | 2,500,000 | 2,668,674 |
| Series B | | |
| 5.00%, due 7/1/43 | 25,635,000 | 25,754,300 |
| Series A | | |
| 5.00%, due 7/1/49 | 8,150,000 | 8,068,707 |
| Series B | | |
| 5.25%, due 7/1/49 | 8,000,000 | 8,092,111 |
| Las Vegas Valley Water District, Limited General Obligation | | |
| 5.00%, due 6/1/33 | 7,600,000 | 7,675,675 |
| Las Vegas Valley Water District, Water Improvement, Limited General Obligation | | |
| Series A | | |
| 5.00%, due 6/1/41 | 6,500,000 | 6,546,632 |
| Series A | | |
| 5.00%, due 6/1/46 | 14,265,000 | 14,312,344 |
| | | 134,152,656 |
| New Hampshire 0.1% |
| New Hampshire Health and Education Facilities Authority Act, University System of New Hampshire, Revenue Bonds | | |
| 5.00%, due 7/1/40 | 7,250,000 | 7,268,814 |
| New Jersey 3.2% |
| City of Atlantic City, Unlimited General Obligation | | |
| Series B, Insured: AGM State Aid Withholding | | |
| 5.00%, due 3/1/32 | 2,650,000 | 2,705,583 |
| New Jersey Building Authority, Revenue Bonds | | |
| Series A, Insured: BAM | | |
| 5.00%, due 6/15/28 | 1,805,000 | 1,849,322 |
The notes to the financial statements are an integral part of, and should be read in conjunction with, the financial statements.
31
Portfolio of Investments October 31, 2023†^ (continued)
| | Principal
Amount | Value |
| Long-Term Municipal Bonds (continued) |
| New Jersey (continued) |
| New Jersey Economic Development Authority, New Jersey-American Water Co., Inc., Revenue Bonds (a)(c) | | |
| Series D | | |
| 1.10%, due 11/1/29 | $ 6,500,000 | $ 5,329,824 |
| Series A | | |
| 2.20%, due 10/1/39 | 12,000,000 | 9,771,042 |
| New Jersey Economic Development Authority, The Goethals Bridge Replacement Project, Revenue Bonds (c) | | |
| 5.00%, due 1/1/28 | 1,000,000 | 1,000,431 |
| 5.50%, due 1/1/26 | 1,000,000 | 1,001,074 |
| New Jersey Economic Development Authority, State of New Jersey Motor Vehicle Surcharge, Revenue Bonds | | |
| Series A, Insured: BAM | | |
| 5.00%, due 7/1/28 | 2,000,000 | 2,050,410 |
| New Jersey Health Care Facilities Financing Authority, RWJ Barnabas Health, Revenue Bonds | | |
| Series A | | |
| 4.00%, due 7/1/36 | 6,500,000 | 6,089,842 |
| New Jersey Health Care Facilities Financing Authority, Hackensack Meridian Health, Inc., Revenue Bonds | | |
| Series A | | |
| 5.00%, due 7/1/38 | 8,400,000 | 8,492,109 |
| New Jersey Transportation Trust Fund Authority, Transportation System, Revenue Bonds | | |
| Series C, Insured: NATL-RE | | |
| (zero coupon), due 12/15/27 | 7,960,000 | 6,680,749 |
| Series C, Insured: NATL-RE | | |
| (zero coupon), due 12/15/30 | 17,075,000 | 12,385,618 |
| Series C, Insured: AGM | | |
| (zero coupon), due 12/15/34 | 25,900,000 | 15,574,652 |
| Series A | | |
| (zero coupon), due 12/15/37 | 25,000,000 | 11,960,840 |
| Series A | | |
| 5.00%, due 12/15/26 | 3,500,000 | 3,596,775 |
| | Principal
Amount | Value |
| |
| New Jersey (continued) |
| New Jersey Transportation Trust Fund Authority, Transportation Program, Revenue Bonds | | |
| Series AA | | |
| 5.00%, due 6/15/46 | $ 6,115,000 | $ 6,029,035 |
| Series AA | | |
| 5.25%, due 6/15/43 | 8,655,000 | 8,737,012 |
| New Jersey Transportation Trust Fund Authority, Build America Bonds, Revenue Bonds | | |
| Series C | | |
| 5.754%, due 12/15/28 | 2,500,000 | 2,499,059 |
| New Jersey Turnpike Authority, Revenue Bonds | | |
| Series D-1 | | |
| 4.50%, due 1/1/24 | 22,000,000 | 21,996,388 |
| Series E | | |
| 5.00%, due 1/1/25 | 2,720,000 | 2,755,704 |
| Series B | | |
| 5.25%, due 1/1/52 | 40,755,000 | 41,584,156 |
| State of New Jersey, COVID-19 General Obligation Emergency Bonds, Unlimited General Obligation | | |
| Series A | | |
| 5.00%, due 6/1/24 | 10,165,000 | 10,228,891 |
| State of New Jersey, Various Purpose, Unlimited General Obligation | | |
| 5.00%, due 6/1/38 | 3,685,000 | 3,776,498 |
| 5.00%, due 6/1/40 | 5,585,000 | 5,697,389 |
| 5.00%, due 6/1/41 | 11,100,000 | 11,302,956 |
| Tobacco Settlement Financing Corp., Revenue Bonds | | |
| Series A | | |
| 5.00%, due 6/1/30 | 1,815,000 | 1,872,637 |
| Series A | | |
| 5.00%, due 6/1/33 | 5,400,000 | 5,553,196 |
| Series A | | |
| 5.00%, due 6/1/34 | 2,000,000 | 2,054,922 |
| Series A | | |
| 5.00%, due 6/1/36 | 4,950,000 | 5,041,403 |
| Series A | | |
| 5.25%, due 6/1/46 | 4,000,000 | 3,932,304 |
| Township of Bridgewater, Unlimited General Obligation | | |
| 4.50%, due 7/31/24 | 10,000,000 | 10,025,585 |
The notes to the financial statements are an integral part of, and should be read in conjunction with, the financial statements.
| 32 | MainStay MacKay Tax Free Bond Fund |
| | Principal
Amount | Value |
| Long-Term Municipal Bonds (continued) |
| New Jersey (continued) |
| Township of East Hanover, Unlimited General Obligation | | |
| Series A | | |
| 4.75%, due 8/8/24 | $ 10,685,000 | $ 10,743,698 |
| Township of Edison, Unlimited General Obligation | | |
| 2.00%, due 3/15/36 | 4,545,000 | 3,189,827 |
| | | 245,508,931 |
| New Mexico 0.2% |
| New Mexico Hospital Equipment Loan Council, Presbyterian Healthcare Services, Revenue Bonds | | |
| Series A | | |
| 4.00%, due 8/1/37 | 3,650,000 | 3,189,582 |
| Series A | | |
| 5.00%, due 8/1/44 | 6,835,000 | 6,676,515 |
| State of New Mexico, Severance Tax Permanent Fund, Revenue Bonds | | |
| Series A | | |
| 5.00%, due 7/1/24 | 9,400,000 | 9,473,122 |
| | | 19,339,219 |
| New York 14.5% |
| Battery Park City Authority, Revenue Bonds, Senior Lien | | |
| Series A | | |
| 5.00%, due 11/1/53 | 12,500,000 | 12,665,514 |
| City of New York, Unlimited General Obligation | | |
| Series A, Insured: BAM | | |
| 3.00%, due 8/1/36 | 12,320,000 | 10,147,750 |
| Series A-1 | | |
| 4.00%, due 8/1/37 | 2,000,000 | 1,858,693 |
| Series E-1 | | |
| 4.00%, due 4/1/42 | 17,770,000 | 15,621,916 |
| Series D-1 | | |
| 4.00%, due 3/1/50 | 7,000,000 | 5,859,559 |
| Series A-1 | | |
| 5.00%, due 9/1/37 | 4,250,000 | 4,451,335 |
| Series C | | |
| 5.00%, due 8/1/42 | 2,160,000 | 2,189,154 |
| Series F-1 | | |
| 5.00%, due 3/1/43 | 4,315,000 | 4,364,307 |
| Series B-1 | | |
| 5.25%, due 10/1/33 | 6,260,000 | 6,526,915 |
| | Principal
Amount | Value |
| |
| New York (continued) |
| Hudson Yards Infrastructure Corp., Second Indenture, Revenue Bonds | | |
| Series A | | |
| 4.00%, due 2/15/37 | $ 2,175,000 | $ 2,027,093 |
| Series A | | |
| 5.00%, due 2/15/39 | 4,700,000 | 4,728,282 |
| Long Island Power Authority, Electric System, Revenue Bonds | | |
| 5.00%, due 9/1/37 | 2,000,000 | 2,051,816 |
| Series A, Insured: BAM | | |
| 5.00%, due 9/1/39 | 8,500,000 | 8,508,673 |
| Series A | | |
| 5.00%, due 9/1/44 | 5,875,000 | 5,811,789 |
| Metropolitan Transportation Authority, Revenue Bonds | | |
| Series B | | |
| 4.00%, due 11/15/36 | 3,500,000 | 3,200,510 |
| Series D-2B, Insured: AGM | | |
| 4.108%, due 11/1/32 | 24,100,000 | 24,094,418 |
| Series D-1 | | |
| 5.00%, due 11/15/26 | 2,285,000 | 2,303,290 |
| Series C-1 | | |
| 5.00%, due 11/15/35 | 4,250,000 | 4,256,106 |
| Series A-1 | | |
| 5.00%, due 11/15/37 | 1,300,000 | 1,290,723 |
| Series C | | |
| 5.00%, due 11/15/38 | 6,300,000 | 6,311,699 |
| Series A-1 | | |
| 5.00%, due 11/15/40 | 4,140,000 | 4,079,066 |
| Series C | | |
| 5.00%, due 11/15/42 | 8,525,000 | 8,540,831 |
| Series E | | |
| 5.00%, due 11/15/43 | 2,250,000 | 2,200,276 |
| Series C-1 | | |
| 5.25%, due 11/15/29 | 2,230,000 | 2,245,214 |
| Series B | | |
| 5.25%, due 11/15/35 | 2,370,000 | 2,372,300 |
| Series D-1 | | |
| 5.25%, due 11/15/44 | 6,355,000 | 6,306,889 |
| Metropolitan Transportation Authority, Metropolitan Transportation Authority Dedicated Tax Fund, Revenue Bonds | | |
| Series A | | |
| 4.00%, due 11/15/40 | 4,120,000 | 3,628,018 |
The notes to the financial statements are an integral part of, and should be read in conjunction with, the financial statements.
33
Portfolio of Investments October 31, 2023†^ (continued)
| | Principal
Amount | Value |
| Long-Term Municipal Bonds (continued) |
| New York (continued) |
| Metropolitan Transportation Authority, Metropolitan Transportation Authority Dedicated Tax Fund, Revenue Bonds (continued) | | |
| Series A | | |
| 5.00%, due 11/15/42 | $ 13,250,000 | $ 13,262,472 |
| Series A | | |
| 5.00%, due 11/15/45 | 6,725,000 | 6,748,042 |
| Metropolitan Transportation Authority, Dedicated Tax Fund, Revenue Bonds | | |
| Series B-1 | | |
| 5.00%, due 11/15/36 | 4,675,000 | 4,730,072 |
| Series A | | |
| 5.00%, due 11/15/44 | 4,250,000 | 4,276,349 |
| Series A | | |
| 5.00%, due 11/15/49 | 5,250,000 | 5,205,043 |
| Metropolitan Transportation Authority, Green Bond, Revenue Bonds | | |
| Series A-1 | | |
| 5.00%, due 11/15/41 | 2,815,000 | 2,767,637 |
| Series C, Insured: BAM | | |
| 5.00%, due 11/15/42 | 7,700,000 | 7,697,438 |
| Series D | | |
| 5.00%, due 11/15/44 | 10,450,000 | 10,189,731 |
| New York City Housing Development Corp., Revenue Bonds | | |
| Series A-1 | | |
| 4.15%, due 11/1/38 | 15,130,000 | 13,802,035 |
| New York City Municipal Water Finance Authority, Water & Sewer System Second General Resolution, Revenue Bonds | | |
| Series BB-1, Insured: BAM | | |
| 3.00%, due 6/15/44 | 18,700,000 | 13,209,452 |
| Series DD-1 | | |
| 3.00%, due 6/15/50 | 4,515,000 | 2,978,480 |
| Series FF-2 | | |
| 4.00%, due 6/15/41 | 6,975,000 | 6,209,935 |
| Series AA-2 | | |
| 4.00%, due 6/15/43 | 6,200,000 | 5,409,451 |
| Series AA-2 | | |
| 5.00%, due 6/15/28 | 1,000,000 | 1,033,465 |
| Series AA-2 | | |
| 5.00%, due 6/15/29 | 1,100,000 | 1,149,193 |
| | Principal
Amount | Value |
| |
| New York (continued) |
New York City Municipal Water Finance Authority, Water & Sewer System Second General Resolution, Revenue Bonds
(continued) | | |
| Series AA-2 | | |
| 5.00%, due 6/15/32 | $ 1,000,000 | $ 1,081,384 |
| Series AA | | |
| 5.00%, due 6/15/37 | 3,750,000 | 3,820,798 |
| Series AA | | |
| 5.00%, due 6/15/38 | 3,750,000 | 3,807,047 |
| Series FF | | |
| 5.00%, due 6/15/38 | 4,565,000 | 4,659,410 |
| Series EE | | |
| 5.00%, due 6/15/40 | 6,905,000 | 7,003,841 |
| Series BB-1 | | |
| 5.00%, due 6/15/44 | 3,250,000 | 3,306,229 |
| Series GG-1 | | |
| 5.00%, due 6/15/48 | 4,350,000 | 4,374,105 |
| Series AA-1 | | |
| 5.00%, due 6/15/50 | 5,570,000 | 5,594,740 |
| Series CC-1 | | |
| 5.00%, due 6/15/51 | 5,385,000 | 5,409,082 |
| Series DD-2 | | |
| 5.25%, due 6/15/47 | 6,915,000 | 7,154,112 |
| Series AA-1 | | |
| 5.25%, due 6/15/52 | 11,190,000 | 11,500,011 |
| New York City Transitional Finance Authority, Building Aid, Revenue Bonds | | |
| Series S-1A, Insured: State Aid Withholding | | |
| 3.00%, due 7/15/39 | 5,000,000 | 3,827,186 |
| Series S-1B, Insured: State Aid Withholding | | |
| 3.00%, due 7/15/49 | 10,000,000 | 6,688,808 |
| Series S-1A, Insured: State Aid Withholding | | |
| 4.00%, due 7/15/36 | 5,750,000 | 5,439,094 |
| Series S-1, Insured: State Aid Withholding | | |
| 5.00%, due 7/15/36 | 8,450,000 | 8,390,863 |
| New York City Transitional Finance Authority, Future Tax Secured, Revenue Bonds | | |
| Series B-1 | | |
| 3.00%, due 11/1/47 | 8,410,000 | 5,682,108 |
The notes to the financial statements are an integral part of, and should be read in conjunction with, the financial statements.
| 34 | MainStay MacKay Tax Free Bond Fund |
| | Principal
Amount | Value |
| Long-Term Municipal Bonds (continued) |
| New York (continued) |
| New York City Transitional Finance Authority, Future Tax Secured, Revenue Bonds (continued) | | |
| Series A-1 | | |
| 4.00%, due 11/1/35 | $ 8,750,000 | $ 8,415,836 |
| Series C-1 | | |
| 4.00%, due 11/1/36 | 3,520,000 | 3,318,167 |
| Series C-1 | | |
| 4.00%, due 11/1/42 | 8,540,000 | 7,545,918 |
| Series E-1 | | |
| 4.00%, due 2/1/46 | 16,085,000 | 13,794,712 |
| Series A-1 | | |
| 5.00%, due 5/1/33 | 8,475,000 | 8,648,570 |
| Series B-1 | | |
| 5.00%, due 11/1/36 | 17,000,000 | 17,586,284 |
| Series A-1 | | |
| 5.00%, due 8/1/40 | 4,400,000 | 4,437,925 |
| Series C-3 | | |
| 5.00%, due 5/1/41 | 5,400,000 | 5,433,006 |
| Series F-1 | | |
| 5.00%, due 2/1/42 | 5,000,000 | 5,100,371 |
| Series E-1 | | |
| 5.00%, due 2/1/43 | 2,545,000 | 2,525,515 |
| Series A-1 | | |
| 5.25%, due 8/1/42 | 6,350,000 | 6,601,137 |
| Series C | | |
| 5.50%, due 5/1/42 | 10,000,000 | 10,696,190 |
| Series C | | |
| 5.50%, due 5/1/43 | 5,000,000 | 5,331,754 |
| Series C | | |
| 5.50%, due 5/1/44 | 22,000,000 | 23,373,095 |
| Series D-1 | | |
| 5.50%, due 11/1/45 | 21,025,000 | 22,159,713 |
| New York Liberty Development Corp., Bank of America Tower at One Bryant Park Project, Revenue Bonds | | |
| 2.45%, due 9/15/69 | 11,125,000 | 9,537,303 |
| New York Liberty Development Corp., 1 World Trade Center, Revenue Bonds | | |
| Insured: BAM | | |
| 2.75%, due 2/15/44 | 18,000,000 | 12,059,545 |
| Insured: AGM-CR | | |
| 3.00%, due 2/15/42 | 10,000,000 | 7,152,600 |
| Insured: BAM | | |
| 4.00%, due 2/15/43 | 3,250,000 | 2,757,568 |
| | Principal
Amount | Value |
| |
| New York (continued) |
| New York Liberty Development Corp., 1 World Trade Center, Revenue Bonds (continued) | | |
| Insured: AGM-CR | | |
| 4.00%, due 2/15/43 | $ 9,500,000 | $ 8,060,583 |
| New York Liberty Development Corp., 4 World Trade Center LLC, Revenue Bonds | | |
| Series A | | |
| 2.875%, due 11/15/46 | 14,060,000 | 9,069,047 |
| New York Power Authority, Revenue Bonds | | |
| Series A | | |
| 4.00%, due 11/15/50 | 5,000,000 | 4,142,890 |
| New York State Dormitory Authority, State Personal Income Tax, Revenue Bonds | | |
| Series A | | |
| 3.00%, due 3/15/39 | 11,585,000 | 8,940,709 |
| Series A | | |
| 3.00%, due 3/15/42 | 6,315,000 | 4,598,292 |
| Series A | | |
| 4.00%, due 3/15/36 | 6,750,000 | 6,408,567 |
| Series D | | |
| 4.00%, due 2/15/37 | 5,250,000 | 4,911,344 |
| Series A | | |
| 4.00%, due 3/15/37 | 4,000,000 | 3,735,522 |
| Series A | | |
| 4.00%, due 3/15/37 | 3,200,000 | 2,988,418 |
| Series A | | |
| 4.00%, due 3/15/39 | 17,200,000 | 15,487,836 |
| Series A | | |
| 4.00%, due 3/15/40 | 16,840,000 | 15,077,618 |
| Series A | | |
| 4.00%, due 3/15/41 | 3,180,000 | 2,835,075 |
| Series E | | |
| 4.00%, due 3/15/45 | 2,550,000 | 2,208,608 |
| Series E | | |
| 5.00%, due 2/15/35 | 2,905,000 | 3,067,926 |
| Series A | | |
| 5.00%, due 3/15/39 | 5,000,000 | 5,075,517 |
| Series A | | |
| 5.00%, due 3/15/46 | 4,750,000 | 4,788,060 |
| New York State Dormitory Authority, NYU Langone Hospitals Obligated Group, Revenue Bonds | | |
| Series A | | |
| 3.00%, due 7/1/48 | 9,000,000 | 5,970,691 |
The notes to the financial statements are an integral part of, and should be read in conjunction with, the financial statements.
35
Portfolio of Investments October 31, 2023†^ (continued)
| | Principal
Amount | Value |
| Long-Term Municipal Bonds (continued) |
| New York (continued) |
New York State Dormitory Authority, NYU Langone Hospitals Obligated Group, Revenue Bonds
(continued) | | |
| Series A | | |
| 4.00%, due 7/1/50 | $ 15,000,000 | $ 12,068,641 |
| New York State Dormitory Authority, School Districts Financing Program, Revenue Bonds | | |
| Series A, Insured: AGM | | |
| 5.00%, due 10/1/34 | 5,000 | 5,298 |
| Series A, Insured: BAM | | |
| 5.00%, due 10/1/36 | 3,750,000 | 3,903,515 |
| New York State Dormitory Authority, St John's University, Revenue Bonds | | |
| 5.00%, due 7/1/39 | 7,450,000 | 7,615,021 |
| 5.00%, due 7/1/40 | 7,835,000 | 7,941,579 |
| New York State Dormitory Authority, Sales Tax, Revenue Bonds | | |
| Series A | | |
| 5.00%, due 3/15/42 | 4,750,000 | 4,790,043 |
| New York State Dormitory Authority, Northwell Health, Revenue Bonds | | |
| Series B-3 | | |
| 5.00%, due 5/1/48 (a) | 5,000,000 | 5,058,207 |
| New York State Dormitory Authority, New York University, Revenue Bonds | | |
| Series A, Insured: NATL-RE | | |
| 5.75%, due 7/1/27 | 2,625,000 | 2,709,372 |
| New York State Environmental Facilities Corp., Clean Water & Drinking Water, Revenue Bonds | | |
| Series B | | |
| 3.00%, due 6/15/38 | 8,100,000 | 6,411,959 |
| New York State Thruway Authority, Revenue Bonds | | |
| Series B | | |
| 4.00%, due 1/1/38 | 4,250,000 | 3,787,340 |
| Series N | | |
| 5.00%, due 1/1/36 | 5,000,000 | 5,271,066 |
| New York State Thruway Authority, Revenue Bonds, Junior Lien | | |
| Series A | | |
| 5.00%, due 1/1/46 | 5,440,000 | 5,310,227 |
| | Principal
Amount | Value |
| |
| New York (continued) |
| New York State Thruway Authority, State Personal Income Tax, Revenue Bonds | | |
| Series A-1 | | |
| 4.00%, due 3/15/43 | $ 7,500,000 | $ 6,580,935 |
| New York State Thruway Authority, General Revenue Junior Indebtedness Obligation, Revenue Bonds, Junior Lien | | |
| Series B, Insured: BAM | | |
| 4.00%, due 1/1/45 | 4,650,000 | 3,941,314 |
| New York State Urban Development Corp., Sales Tax, Revenue Bonds | | |
| Series A | | |
| 3.00%, due 3/15/40 | 6,750,000 | 5,107,110 |
| Series A | | |
| 4.00%, due 3/15/37 | 14,250,000 | 13,493,123 |
| Series A | | |
| 4.00%, due 3/15/38 | 5,550,000 | 5,145,423 |
| Series A | | |
| 5.00%, due 3/15/36 | 5,360,000 | 5,592,534 |
| New York State Urban Development Corp., Personal Income Tax, Revenue Bonds | | |
| Series A | | |
| 5.00%, due 3/15/42 | 15,250,000 | 15,497,683 |
| Series C | | |
| 5.00%, due 3/15/50 | 4,750,000 | 4,726,042 |
| New York Transportation Development Corp., LaGuardia Airport Terminal B Redevelopment Project, Revenue Bonds (c) | | |
| Series A, Insured: AGM | | |
| 4.00%, due 7/1/35 | 10,730,000 | 9,984,000 |
| Series A, Insured: AGM | | |
| 4.00%, due 7/1/37 | 11,770,000 | 10,577,311 |
| New York Transportation Development Corp., Terminal 4 John F. Kennedy International Airport Project, Revenue Bonds (c) | | |
| Insured: AGM-CR | | |
| 5.00%, due 12/1/27 | 4,250,000 | 4,363,328 |
| Insured: AGM-CR | | |
| 5.00%, due 12/1/28 | 4,250,000 | 4,358,779 |
| Insured: AGM-CR | | |
| 5.00%, due 12/1/29 | 7,900,000 | 8,101,168 |
| 5.00%, due 12/1/30 | 1,700,000 | 1,722,092 |
The notes to the financial statements are an integral part of, and should be read in conjunction with, the financial statements.
| 36 | MainStay MacKay Tax Free Bond Fund |
| | Principal
Amount | Value |
| Long-Term Municipal Bonds (continued) |
| New York (continued) |
| Onondaga County Trust for Cultural Resources, Syracuse University Project, Revenue Bonds | | |
| 5.00%, due 12/1/43 | $ 10,210,000 | $ 10,351,387 |
| 5.00%, due 12/1/45 | 8,140,000 | 8,220,912 |
| Oswego City School District, Unlimited General Obligation | | |
| Insured: State Aid Withholding | | |
| 4.75%, due 7/19/24 | 7,500,000 | 7,526,134 |
| Port Authority of New York & New Jersey, Revenue Bonds (c) | | |
| Series 207 | | |
| 4.00%, due 3/15/30 | 16,000,000 | 15,361,818 |
| 4.00%, due 3/15/35 | 9,560,000 | 8,866,985 |
| Series 223 | | |
| 4.00%, due 7/15/46 | 4,175,000 | 3,370,686 |
| Series 185 | | |
| 5.00%, due 9/1/27 | 6,200,000 | 6,201,329 |
| Series 178 | | |
| 5.00%, due 12/1/28 | 6,850,000 | 6,857,256 |
| Series 242 | | |
| 5.00%, due 12/1/30 | 17,705,000 | 18,213,516 |
| Series 185 | | |
| 5.00%, due 9/1/31 | 6,750,000 | 6,722,203 |
| Series 242 | | |
| 5.00%, due 12/1/31 | 18,000,000 | 18,544,406 |
| Series 185 | | |
| 5.00%, due 9/1/32 | 6,000,000 | 5,971,574 |
| Series 218 | | |
| 5.00%, due 11/1/44 | 2,750,000 | 2,680,219 |
| Series 231 | | |
| 5.50%, due 8/1/40 | 9,205,000 | 9,544,888 |
| Series 231 | | |
| 5.50%, due 8/1/47 | 18,000,000 | 18,340,778 |
| Series 231 | | |
| 5.50%, due 8/1/52 | 3,415,000 | 3,464,549 |
| Series 234 | | |
| 5.50%, due 8/1/52 | 4,665,000 | 4,732,686 |
| Rensselaer City School District, Certificate of Participation | | |
| Insured: AGM State Aid Withholding | | |
| 5.00%, due 6/1/30 | 1,880,000 | 1,915,899 |
| Insured: AGM State Aid Withholding | | |
| 5.00%, due 6/1/32 | 2,000,000 | 2,036,721 |
| | Principal
Amount | Value |
| |
| New York (continued) |
| State of New York, Mortgage Agency, Revenue Bonds | | |
| Series 227 | | |
| 2.30%, due 10/1/40 | $ 6,250,000 | $ 4,033,069 |
| State of New York, Unlimited General Obligation | | |
| Series A | | |
| 3.00%, due 3/15/34 | 2,250,000 | 1,952,813 |
| Suffolk County Water Authority, Revenue Bonds | | |
| Series B | | |
| 3.00%, due 6/1/45 | 3,875,000 | 2,716,927 |
| Suffolk County Water Authority, Waterworks, Revenue Bonds | | |
| Series A | | |
| 3.75%, due 6/1/36 | 15,470,000 | 14,297,714 |
| Town of Hempstead, Limited General Obligation | | |
| 2.125%, due 6/15/38 | 6,720,000 | 4,595,490 |
| Triborough Bridge & Tunnel Authority, MTA Bridges & Tunnels, Revenue Bonds, Senior Lien | | |
| Series C-3 | | |
| 3.00%, due 5/15/51 | 18,415,000 | 11,904,312 |
| Series C-3, Insured: AGM-CR | | |
| 3.00%, due 5/15/51 | 14,520,000 | 9,435,508 |
| Series D-2 | | |
| 4.50%, due 5/15/47 | 10,000,000 | 9,411,571 |
| Series C | | |
| 5.25%, due 11/15/40 | 5,000,000 | 5,253,444 |
| Series D-2 | | |
| 5.25%, due 5/15/47 | 22,750,000 | 23,281,406 |
| Series D-2 | | |
| 5.50%, due 5/15/52 | 28,550,000 | 29,831,738 |
| Triborough Bridge & Tunnel Authority, MTA Bridges & Tunnels, Revenue Bonds | | |
| Series B-4A | | |
| 3.938%, due 1/1/32 | 2,440,000 | 2,432,821 |
| Series C | | |
| 4.00%, due 11/15/41 | 10,250,000 | 9,043,002 |
| Series A | | |
| 4.00%, due 5/15/52 | 5,500,000 | 4,568,282 |
| Series B | | |
| 5.00%, due 11/15/37 | 2,850,000 | 2,905,026 |
| Series C-2 | | |
| 5.00%, due 11/15/42 | 4,750,000 | 4,782,232 |
The notes to the financial statements are an integral part of, and should be read in conjunction with, the financial statements.
37
Portfolio of Investments October 31, 2023†^ (continued)
| | Principal
Amount | Value |
| Long-Term Municipal Bonds (continued) |
| New York (continued) |
| Triborough Bridge & Tunnel Authority, MTA Bridges & Tunnels, Revenue Bonds (continued) | | |
| Series A | | |
| 5.00%, due 11/15/43 | $ 4,000,000 | $ 4,004,404 |
| Series A | | |
| 5.00%, due 5/15/53 | 5,250,000 | 5,261,178 |
| Series A | | |
| 5.25%, due 5/15/52 | 3,750,000 | 3,839,497 |
| Series A | | |
| 5.50%, due 5/15/63 | 4,340,000 | 4,512,448 |
| TSASC, Inc., Tobacco Settlement Bonds, Revenue Bonds | | |
| Series A | | |
| 5.00%, due 6/1/33 | 5,890,000 | 5,993,968 |
| Series A | | |
| 5.00%, due 6/1/35 | 2,365,000 | 2,396,833 |
| Utility Debt Securitization Authority, Revenue Bonds | | |
| Series E-1 | | |
| 5.00%, due 12/15/39 | 9,500,000 | 10,035,424 |
| | | 1,127,367,824 |
| North Carolina 0.5% |
| City of Fayetteville, Public Works Commission, Revenue Bonds | | |
| 2.00%, due 3/1/35 | 3,330,000 | 2,475,597 |
| 2.00%, due 3/1/37 | 3,465,000 | 2,387,955 |
| 2.00%, due 3/1/38 | 3,535,000 | 2,319,926 |
| 2.125%, due 3/1/39 | 3,605,000 | 2,350,733 |
| 2.125%, due 3/1/40 | 3,680,000 | 2,340,657 |
| County of Brunswick, School, Unlimited General Obligation | | |
| 2.85%, due 8/1/29 | 2,475,000 | 2,257,962 |
| 2.95%, due 8/1/30 | 2,500,000 | 2,260,145 |
| County of Durham, Unlimited General Obligation | | |
| 3.00%, due 10/1/29 | 3,750,000 | 3,470,770 |
| County of Union, Unlimited General Obligation | | |
| Series C | | |
| 2.50%, due 9/1/36 | 4,000,000 | 3,061,226 |
| North Carolina Housing Finance Agency, Revenue Bonds | | |
| Series 49, Insured: GNMA / FNMA / FHLMC | | |
| 6.00%, due 7/1/53 | 8,470,000 | 8,778,132 |
| | Principal
Amount | Value |
| |
| North Carolina (continued) |
| North Carolina Turnpike Authority, Triangle Expressway System, Revenue Bonds, Senior Lien | | |
| Insured: AGM | | |
| 5.00%, due 1/1/27 | $ 3,250,000 | $ 3,335,747 |
| | | 35,038,850 |
| Ohio 1.0% |
| American Municipal Power, Inc., Prairie State Energy Campus Project, Revenue Bonds | | |
| Series A, Insured: BAM | | |
| 4.00%, due 2/15/34 | 10,000,000 | 9,566,590 |
| Series A, Insured: BAM | | |
| 5.00%, due 2/15/33 | 3,450,000 | 3,606,322 |
| Buckeye Tobacco Settlement Financing Authority, Revenue Bonds, Senior Lien | | |
| Series A-2 | | |
| 3.00%, due 6/1/48 | 9,915,000 | 6,535,359 |
| Series A-2, Class 1 | | |
| 5.00%, due 6/1/36 | 4,250,000 | 4,347,986 |
| Clermont County Port Authority, West Clermont Local School District Project, Revenue Bonds | | |
| Insured: BAM | | |
| 5.00%, due 12/1/32 | 2,200,000 | 2,236,335 |
| Insured: BAM | | |
| 5.00%, due 12/1/33 | 1,335,000 | 1,357,315 |
| Cleveland-Cuyahoga County Port Authority, Annual Appropriation Bonds, Revenue Bonds | | |
| 6.00%, due 11/15/25 | 1,260,000 | 1,262,003 |
| County of Franklin, Ohio Hospital, Revenue Bonds | | |
| Series A | | |
| 4.00%, due 5/15/47 | 3,950,000 | 3,229,482 |
| 5.00%, due 5/15/40 | 5,750,000 | 5,631,046 |
| Ohio Higher Educational Facility Commission, Ashtabula County Medical Center Obligated Group, Revenue Bonds | | |
| 5.00%, due 1/1/30 | 210,000 | 210,913 |
| 5.00%, due 1/1/34 | 360,000 | 363,141 |
| 5.25%, due 1/1/36 | 495,000 | 503,246 |
| 5.25%, due 1/1/52 | 2,500,000 | 2,255,992 |
The notes to the financial statements are an integral part of, and should be read in conjunction with, the financial statements.
| 38 | MainStay MacKay Tax Free Bond Fund |
| | Principal
Amount | Value |
| Long-Term Municipal Bonds (continued) |
| Ohio (continued) |
| Ohio Housing Finance Agency, Residential Mortgage, Revenue Bonds | | |
| Series A, Insured: GNMA / FNMA / FHLMC | | |
| 4.50%, due 9/1/48 | $ 2,380,000 | $ 2,351,291 |
| Pickerington Local School District, Unlimited General Obligation | | |
| 5.00%, due 12/1/53 | 5,000,000 | 5,006,513 |
| Worthington City School District, Unlimited General Obligation | | |
| 5.50%, due 12/1/54 | 25,055,000 | 26,086,569 |
| | | 74,550,103 |
| Oklahoma 0.8% |
| Edmond Public Works Authority, Revenue Bonds | | |
| 5.00%, due 7/1/42 | 9,405,000 | 9,434,244 |
| Lincoln County Educational Facilities Authority, Stroud Public Schools Project, Revenue Bonds | | |
| 5.00%, due 9/1/28 | 2,450,000 | 2,492,649 |
| 5.00%, due 9/1/29 | 2,120,000 | 2,153,517 |
| Oklahoma Turnpike Authority, Revenue Bonds | | |
| 5.50%, due 1/1/53 | 41,000,000 | 43,082,361 |
| Weatherford Industrial Trust, Custer County Independent School District No. 26 Weatherford, Revenue Bonds | | |
| 5.00%, due 3/1/31 | 1,820,000 | 1,885,025 |
| 5.00%, due 3/1/33 | 2,000,000 | 2,067,854 |
| | | 61,115,650 |
| Oregon 0.7% |
| Multnomah County School District No. 1, Portland Bidding Group 1, Unlimited General Obligation | | |
| Insured: School Bond Guaranty | | |
| 5.00%, due 6/15/25 | 17,500,000 | 17,833,702 |
| Multnomah County School District No. 40, Unlimited General Obligation | | |
| Series B, Insured: School Bond Guaranty | | |
| 5.50%, due 6/15/53 | 8,875,000 | 9,333,685 |
| | Principal
Amount | Value |
| |
| Oregon (continued) |
| Oregon State Lottery, Revenue Bonds | | |
| Series C, Insured: Moral Obligation | | |
| 5.00%, due 4/1/24 | $ 4,500,000 | $ 4,520,444 |
| Port of Portland, Airport, Revenue Bonds (c) | | |
| Series A-27 | | |
| 5.00%, due 7/1/37 | 5,550,000 | 5,541,967 |
| Series 29-A | | |
| 5.00%, due 7/1/45 | 3,300,000 | 3,170,784 |
| Series 29 | | |
| 5.50%, due 7/1/48 | 5,750,000 | 5,848,705 |
| State of Oregon, Unlimited General Obligation | | |
| Series A | | |
| 5.00%, due 5/1/42 | 2,795,000 | 2,831,420 |
| Washington Clackamas & Yamhill Counties School District No. 88J, Sherwood, Unlimited General Obligation | | |
| Series B, Insured: School Bond Guaranty | | |
| 5.00%, due 6/15/30 | 4,000,000 | 4,148,732 |
| | | 53,229,439 |
| Pennsylvania 3.8% |
| Allegheny County Airport Authority, Revenue Bonds | | |
| Series A | | |
| 4.00%, due 1/1/38 (c) | 4,665,000 | 4,109,369 |
| Bethel Park School District, Limited General Obligation (d) | | |
| Insured: State Aid Withholding | | |
| 5.00%, due 8/1/46 | 2,500,000 | 2,465,969 |
| Insured: State Aid Withholding | | |
| 5.50%, due 8/1/48 | 2,500,000 | 2,571,686 |
| City of Philadelphia, Water & Wastewater, Revenue Bonds | | |
| Series C | | |
| 5.50%, due 6/1/47 | 14,055,000 | 14,454,913 |
| Series B, Insured: AGM | | |
| 5.50%, due 9/1/53 | 8,865,000 | 9,101,697 |
| Commonwealth Financing Authority, Revenue Bonds | | |
| Series C, Insured: AGM | | |
| 5.197%, due 6/1/26 | 6,140,000 | 6,040,030 |
The notes to the financial statements are an integral part of, and should be read in conjunction with, the financial statements.
39
Portfolio of Investments October 31, 2023†^ (continued)
| | Principal
Amount | Value |
| Long-Term Municipal Bonds (continued) |
| Pennsylvania (continued) |
| Commonwealth of Pennsylvania, Unlimited General Obligation | | |
| Series 2 | | |
| 4.00%, due 10/15/28 | $ 6,000,000 | $ 5,949,330 |
| Series 1 | | |
| 4.00%, due 4/1/31 | 9,500,000 | 9,365,847 |
| Series 1 | | |
| 4.00%, due 4/1/32 | 20,600,000 | 20,197,350 |
| Delaware Valley Regional Finance Authority, Revenue Bonds | | |
| Series E | | |
| 4.517%, due 9/1/48 | 17,500,000 | 17,238,293 |
| Pennsylvania Economic Development Financing Authority, UPMC Obligated Group, Revenue Bonds | | |
| Series A-2 | | |
| 4.00%, due 5/15/48 | 6,090,000 | 4,889,272 |
| Pennsylvania Economic Development Financing Authority, Waste Management, Inc. Project, Revenue Bonds | | |
| Series A | | |
| 4.49%, due 6/1/41 (c) | 13,500,000 | 13,394,763 |
| Pennsylvania Economic Development Financing Authority, Penndot Major Bridges Project, Revenue Bonds | | |
| Insured: AGM | | |
| 5.75%, due 12/31/62 (c) | 24,960,000 | 26,057,783 |
| Pennsylvania Higher Educational Facilities Authority, University of Pennsylvania Health System, Revenue Bonds | | |
| Series A | | |
| 4.00%, due 8/15/42 | 4,000,000 | 3,442,870 |
| 4.00%, due 8/15/49 | 19,640,000 | 16,058,774 |
| Series A | | |
| 5.00%, due 8/15/42 | 5,370,000 | 5,245,051 |
| 5.00%, due 8/15/49 | 4,450,000 | 4,382,825 |
| Pennsylvania Housing Finance Agency, Revenue Bonds | | |
| Series A-141 | | |
| 5.75%, due 10/1/53 | 6,510,000 | 6,682,663 |
| | Principal
Amount | Value |
| |
| Pennsylvania (continued) |
| Pennsylvania Turnpike Commission, Revenue Bonds | | |
| Series B | | |
| 5.00%, due 12/1/30 | $ 6,355,000 | $ 6,384,964 |
| Series B | | |
| 5.25%, due 12/1/39 | 4,000,000 | 4,004,293 |
| Series B | | |
| 5.25%, due 12/1/44 | 4,085,000 | 4,218,178 |
| Philadelphia Authority for Industrial Development, St. Joseph's University Project, Revenue Bonds | | |
| 5.25%, due 11/1/52 | 3,250,000 | 3,137,735 |
| Pittsburgh Water & Sewer Authority, Revenue Bonds | | |
| Series B, Insured: AGM | | |
| 4.00%, due 9/1/34 | 2,400,000 | 2,251,133 |
| School District of Philadelphia (The), Revenue Notes | | |
| Series A | | |
| 5.00%, due 6/28/24 | 82,500,000 | 82,917,945 |
| State Public School Building Authority, Philadelphia Community College, Revenue Bonds | | |
| Series A, Insured: BAM | | |
| 5.00%, due 6/15/28 | 4,505,000 | 4,554,929 |
| State Public School Building Authority, School District of Philadelphia (The), Revenue Bonds | | |
| Series A, Insured: AGM State Aid Withholding | | |
| 5.00%, due 6/1/31 | 20,000,000 | 20,335,414 |
| | | 299,453,076 |
| Puerto Rico 0.2% |
| Puerto Rico Commonwealth Aqueduct & Sewer Authority, Revenue Bonds, Senior Lien | | |
| Series A, Insured: AGC-ICC | | |
| 6.125%, due 7/1/24 | 150,000 | 151,115 |
| Puerto Rico Electric Power Authority, Revenue Bonds | | |
| Series UU, Insured: AGC | | |
| 4.25%, due 7/1/27 | 2,345,000 | 2,276,054 |
| Series NN, Insured: NATL-RE | | |
| 4.75%, due 7/1/33 | 1,140,000 | 1,101,340 |
| Series PP, Insured: NATL-RE | | |
| 5.00%, due 7/1/24 | 2,415,000 | 2,415,331 |
The notes to the financial statements are an integral part of, and should be read in conjunction with, the financial statements.
| 40 | MainStay MacKay Tax Free Bond Fund |
| | Principal
Amount | Value |
| Long-Term Municipal Bonds (continued) |
| Puerto Rico (continued) |
| Puerto Rico Electric Power Authority, Revenue Bonds (continued) | | |
| Series UU, Insured: AGM | | |
| 5.00%, due 7/1/24 | $ 3,915,000 | $ 3,910,072 |
| Series TT, Insured: AGM-CR | | |
| 5.00%, due 7/1/27 | 500,000 | 496,667 |
| Series SS, Insured: AGM | | |
| 5.00%, due 7/1/30 | 550,000 | 543,285 |
| Series VV, Insured: NATL-RE | | |
| 5.25%, due 7/1/26 | 1,575,000 | 1,556,666 |
| Series VV, Insured: NATL-RE | | |
| 5.25%, due 7/1/29 | 1,470,000 | 1,456,145 |
| Series VV, Insured: NATL-RE | | |
| 5.25%, due 7/1/32 | 1,225,000 | 1,208,662 |
| Series VV, Insured: NATL-RE | | |
| 5.25%, due 7/1/34 | 550,000 | 543,774 |
| Puerto Rico Municipal Finance Agency, Revenue Bonds | | |
| Series A, Insured: AGM | | |
| 5.00%, due 8/1/27 | 195,000 | 196,281 |
| Series A, Insured: AGM | | |
| 5.00%, due 8/1/30 | 1,440,000 | 1,449,457 |
| Puerto Rico Sales Tax Financing Corp., Revenue Bonds | | |
| Insured: BHAC-CR | | |
| (zero coupon), due 8/1/54 | 98,098 | 17,732 |
| | | 17,322,581 |
| Rhode Island 0.0% ‡ |
| Providence Public Building Authority, Various Capital Projects, Revenue Bonds | | |
| Series A, Insured: AGM | | |
| 5.875%, due 6/15/26 | 990,000 | 991,575 |
| South Carolina 1.2% |
| Beaufort County School District, Unlimited General Obligation | | |
| Series B, Insured: SCSDE | | |
| 3.50%, due 3/1/30 | 5,330,000 | 5,045,967 |
| Berkeley County School District, Unlimited General Obligation | | |
| Series C, Insured: SCSDE | | |
| 2.50%, due 3/1/24 | 4,110,000 | 4,067,677 |
| | Principal
Amount | Value |
| |
| South Carolina (continued) |
| South Carolina Jobs-Economic Development Authority, AnMed Health, Revenue Bonds | | |
| 4.25%, due 2/1/48 | $ 13,580,000 | $ 11,625,148 |
| 5.25%, due 2/1/53 | 6,500,000 | 6,430,035 |
| South Carolina Public Service Authority, Santee Cooper Project, Revenue Bonds | | |
| Series B, Insured: AGM-CR | | |
| 4.00%, due 12/1/29 | 4,167,000 | 4,074,371 |
| Series A, Insured: BAM | | |
| 4.00%, due 12/1/40 | 5,450,000 | 4,776,098 |
| Series B, Insured: BAM | | |
| 4.00%, due 12/1/55 | 3,000 | 2,363 |
| Series A, Insured: AGM-CR | | |
| 5.00%, due 12/1/31 | 2,250,000 | 2,349,660 |
| Series A, Insured: AGM-CR | | |
| 5.00%, due 12/1/32 | 8,500,000 | 8,628,884 |
| Series A, Insured: AGM-CR | | |
| 5.00%, due 12/1/36 | 12,750,000 | 13,169,532 |
| Series E, Insured: AGM | | |
| 5.00%, due 12/1/52 | 14,550,000 | 13,990,385 |
| Series E, Insured: AGM | | |
| 5.50%, due 12/1/42 | 9,125,000 | 9,472,919 |
| South Carolina Transportation Infrastructure Bank, Revenue Bonds | | |
| Series A | | |
| 5.00%, due 10/1/36 | 12,950,000 | 13,250,210 |
| | | 96,883,249 |
| South Dakota 0.1% |
| South Dakota Conservancy District, State Revolving Fund Program, Revenue Bonds | | |
| 5.00%, due 8/1/37 | 1,750,000 | 1,804,580 |
| 5.00%, due 8/1/38 | 2,250,000 | 2,314,034 |
| South Dakota Housing Development Authority, Revenue Bonds | | |
| Series A, Insured: GNMA / FNMA / FHLMC | | |
| 6.00%, due 5/1/54 | 5,230,000 | 5,410,177 |
| | | 9,528,791 |
| Tennessee 1.1% |
| County of Knox, Unlimited General Obligation | | |
| Series B | | |
| 3.00%, due 6/1/34 | 3,665,000 | 3,163,370 |
The notes to the financial statements are an integral part of, and should be read in conjunction with, the financial statements.
41
Portfolio of Investments October 31, 2023†^ (continued)
| | Principal
Amount | Value |
| Long-Term Municipal Bonds (continued) |
| Tennessee (continued) |
| County of Rutherford, Unlimited General Obligation | | |
| 1.625%, due 4/1/34 | $ 5,375,000 | $ 3,971,498 |
| 1.875%, due 4/1/39 | 4,120,000 | 2,630,647 |
| Metropolitan Government of Nashville & Davidson County, Water & Sewer, Revenue Bonds | | |
| Series A | | |
| 3.00%, due 7/1/40 | 4,000,000 | 2,993,720 |
| Metropolitan Nashville Airport Authority (The), Revenue Bonds (c) | | |
| Series B | | |
| 5.00%, due 7/1/44 | 10,225,000 | 9,792,334 |
| Series B | | |
| 5.50%, due 7/1/40 | 2,000,000 | 2,057,700 |
| Series B | | |
| 5.50%, due 7/1/41 | 3,000,000 | 3,075,141 |
| Series B | | |
| 5.50%, due 7/1/52 | 7,000,000 | 7,018,856 |
| State of Tennessee, Unlimited General Obligation | | |
| Series A | | |
| 5.00%, due 5/1/36 | 19,000,000 | 20,603,129 |
| Series A | | |
| 5.00%, due 5/1/40 | 14,500,000 | 15,142,994 |
| Series A | | |
| 5.00%, due 5/1/42 | 10,000,000 | 10,349,764 |
| Series A | | |
| 5.00%, due 5/1/43 | 3,630,000 | 3,748,586 |
| Tennessee Energy Acquisition Corp., Revenue Bonds | | |
| 4.00%, due 11/1/49 (a) | 1,250,000 | 1,223,057 |
| | | 85,770,796 |
| Texas 11.0% |
| Aldine Independent School District, Unlimited General Obligation | | |
| Insured: PSF-GTD | | |
| 4.00%, due 2/15/31 | 11,000,000 | 10,823,721 |
| Arlington Higher Education Finance Corp., Harmony Public Schools, Revenue Bonds | | |
| Series A, Insured: PSF-GTD | | |
| 5.00%, due 2/15/35 | 3,450,000 | 3,466,295 |
| | Principal
Amount | Value |
| |
| Texas (continued) |
| Bastrop Independent School District, Unlimited General Obligation | | |
| Insured: PSF-GTD | | |
| 5.00%, due 2/15/48 | $ 6,785,000 | $ 6,863,265 |
| Bexar County Hospital District, Certificates of Obligation, Limited General Obligation | | |
| 4.00%, due 2/15/37 | 3,450,000 | 3,228,654 |
| Central Texas Regional Mobility Authority, Revenue Bonds, Sub. Lien | | |
| Series F | | |
| 5.00%, due 1/1/25 | 5,130,000 | 5,150,235 |
| Central Texas Turnpike System, Revenue Bonds | | |
| Series C | | |
| 5.00%, due 8/15/28 | 2,070,000 | 2,070,068 |
| Series C | | |
| 5.00%, due 8/15/42 | 2,135,000 | 2,019,745 |
| City of Austin, Water & Wastewater System, Revenue Bonds | | |
| Series A | | |
| 3.35%, due 5/15/29 | 4,250,000 | 3,899,447 |
| City of Austin, Electric Utility, Revenue Bonds | | |
| Series A | | |
| 5.00%, due 11/15/45 | 4,025,000 | 3,989,460 |
| City of Austin, Airport System, Revenue Bonds | | |
| Series B | | |
| 5.00%, due 11/15/48 (c) | 4,250,000 | 4,006,910 |
| City of Celina, Limited General Obligation | | |
| 1.75%, due 9/1/36 | 3,395,000 | 2,216,131 |
| 1.875%, due 9/1/37 | 3,455,000 | 2,203,172 |
| 1.875%, due 9/1/39 | 3,585,000 | 2,131,579 |
| City of Dallas, Hotel Occupancy Tax, Revenue Bonds | | |
| 4.00%, due 8/15/36 | 1,150,000 | 994,611 |
| City of El Paso, Limited General Obligation | | |
| Insured: BAM | | |
| 4.00%, due 8/15/42 | 16,040,000 | 13,635,110 |
| City of El Paso, Water & Sewer, Revenue Bonds | | |
| 5.00%, due 3/1/52 | 20,000,000 | 19,783,900 |
| 5.25%, due 3/1/49 | 18,010,000 | 18,305,551 |
The notes to the financial statements are an integral part of, and should be read in conjunction with, the financial statements.
| 42 | MainStay MacKay Tax Free Bond Fund |
| | Principal
Amount | Value |
| Long-Term Municipal Bonds (continued) |
| Texas (continued) |
| City of Fort Worth, General purpose, Limited General Obligation | | |
| 2.00%, due 3/1/38 | $ 5,000,000 | $ 3,233,702 |
| 2.00%, due 3/1/41 | 5,470,000 | 3,230,300 |
| City of Frisco, Limited General Obligation | | |
| 2.00%, due 2/15/38 | 4,740,000 | 3,103,183 |
| City of Georgetown, Utility System, Revenue Bonds | | |
| Insured: AGM | | |
| 5.25%, due 8/15/52 | 4,700,000 | 4,751,377 |
| City of Houston, Public Improvement, Limited General Obligation | | |
| Series A | | |
| 5.00%, due 3/1/28 | 3,445,000 | 3,566,303 |
| City of Houston, Hotel Occupancy Tax & Special Tax, Revenue Bonds | | |
| 5.00%, due 9/1/31 | 2,200,000 | 2,211,681 |
| 5.00%, due 9/1/34 | 1,550,000 | 1,556,092 |
| City of Houston, Combined Utility System, Revenue Bonds, First Lien | | |
| Series A | | |
| 5.00%, due 11/15/36 | 9,500,000 | 9,575,280 |
| City of Houston, Airport System, Revenue Bonds, Sub. Lien | | |
| Series A, Insured: AGM | | |
| 5.25%, due 7/1/48 (c) | 6,980,000 | 6,884,497 |
| City of Lubbock, Electric Light & Power System, Revenue Bonds | | |
| Insured: AGM-CR | | |
| 4.00%, due 4/15/46 | 8,150,000 | 6,799,749 |
| Insured: AGM-CR | | |
| 4.00%, due 4/15/51 | 6,290,000 | 5,098,266 |
| City of San Antonio, Electric & Gas Systems, Revenue Bonds | | |
| 4.00%, due 2/1/28 | 2,750,000 | 2,704,361 |
| 4.00%, due 2/1/47 | 7,735,000 | 6,466,101 |
| Series B | | |
| 5.00%, due 2/1/34 | 6,900,000 | 7,439,325 |
| Series A | | |
| 5.50%, due 2/1/50 | 37,280,000 | 39,128,603 |
| Cleburne Independent School District, Unlimited General Obligation | | |
| Insured: PSF-GTD | | |
| 5.00%, due 2/15/35 | 6,000,000 | 6,085,780 |
| | Principal
Amount | Value |
| |
| Texas (continued) |
| Collin County Community College District, Limited General Obligation | | |
| 3.50%, due 8/15/37 | $ 4,250,000 | $ 3,539,969 |
| Comal Independent School District, School Building, Unlimited General Obligation | | |
| Insured: PSF-GTD | | |
| 3.00%, due 2/1/39 | 7,670,000 | 5,879,448 |
| Insured: PSF-GTD | | |
| 3.00%, due 2/1/40 | 12,500,000 | 9,380,646 |
| Conroe Independent School District, Unlimited General Obligation | | |
| Insured: PSF-GTD | | |
| 2.50%, due 2/15/37 | 4,000,000 | 2,979,044 |
| County of Collin, Limited General Obligation | | |
| 2.25%, due 2/15/41 | 4,740,000 | 3,005,102 |
| County of Harris, Unlimited General Obligation | | |
| Series A | | |
| 5.00%, due 10/1/31 | 4,000,000 | 4,056,217 |
| Crowley Independent School District, Unlimited General Obligation | | |
| Insured: PSF-GTD | | |
| 5.25%, due 2/1/53 | 4,795,000 | 4,960,614 |
| Cypress-Fairbanks Independent School District, Unlimited General Obligation | | |
| Series A, Insured: PSF-GTD | | |
| 3.30%, due 2/15/30 | 3,500,000 | 3,247,736 |
| Dallas Fort Worth International Airport, Revenue Bonds | | |
| Series A | | |
| 4.00%, due 11/1/34 | 18,000,000 | 17,414,392 |
| Dallas Independent School District, Unlimited General Obligation | | |
| Series A, Insured: PSF-GTD | | |
| 5.00%, due 2/15/27 | 3,485,000 | 3,530,159 |
| Denton Independent School District, Unlimited General Obligation | | |
| Insured: PSF-GTD | | |
| 1.80%, due 8/15/37 | 6,000,000 | 3,835,633 |
| El Paso Independent School District, Unlimited General Obligation | | |
| Insured: PSF-GTD | | |
| 4.00%, due 8/15/45 | 4,750,000 | 4,052,392 |
The notes to the financial statements are an integral part of, and should be read in conjunction with, the financial statements.
43
Portfolio of Investments October 31, 2023†^ (continued)
| | Principal
Amount | Value |
| Long-Term Municipal Bonds (continued) |
| Texas (continued) |
| Frisco Independent School District, Unlimited General Obligation | | |
| Insured: PSF-GTD | | |
| 4.00%, due 8/15/44 | $ 4,250,000 | $ 3,670,546 |
| Harris County Cultural Education Facilities Finance Corp., Texas Children's Hospital, Revenue Bonds | | |
| Series A | | |
| 3.00%, due 10/1/51 | 3,400,000 | 2,149,288 |
| Highland Park Independent School District, Unlimited General Obligation | | |
| Insured: PSF-GTD | | |
| 5.00%, due 2/15/27 | 6,000,000 | 6,083,023 |
| Irving Independent School District, Unlimited General Obligation | | |
| Insured: PSF-GTD | | |
| 5.00%, due 2/15/40 | 4,500,000 | 4,653,600 |
| Klein Independent School District, Schoolhouse, Unlimited General Obligation | | |
| Series A, Insured: PSF-GTD | | |
| 5.00%, due 8/1/27 | 3,500,000 | 3,566,737 |
| Lamar Consolidated Independent School District, Unlimited General Obligation | | |
| Insured: AGM | | |
| 5.50%, due 2/15/58 | 78,550,000 | 82,376,241 |
| Leander Independent School District, Unlimited General Obligation | | |
| Series A, Insured: PSF-GTD | | |
| 5.00%, due 8/15/38 | 8,910,000 | 8,974,837 |
| Series A, Insured: PSF-GTD | | |
| 5.00%, due 8/15/39 | 6,325,000 | 6,363,478 |
| Love Field Airport Modernization Corp., Revenue Bonds | | |
| Insured: AGM | | |
| 4.00%, due 11/1/40 (c) | 5,750,000 | 4,923,308 |
| Lower Colorado River Authority, LCRA Transmission Services Corp., Revenue Bonds | | |
| Insured: AGM | | |
| 5.50%, due 5/15/48 | 8,100,000 | 8,322,268 |
| Insured: AGM | | |
| 5.50%, due 5/15/53 | 26,875,000 | 27,469,247 |
| | Principal
Amount | Value |
| |
| Texas (continued) |
| Lubbock-Cooper Independent School District, Unlimited General Obligation | | |
| Insured: PSF-GTD | | |
| 5.00%, due 2/15/46 | $ 5,000,000 | $ 5,094,019 |
| Marshall Independent School District, Unlimited General Obligation | | |
| Insured: PSF-GTD | | |
| 4.00%, due 2/15/48 | 3,620,000 | 3,001,398 |
| Matagorda County Navigation District No. 1, Central Power and Light Company Project, Revenue Bonds | | |
| Series A | | |
| 2.60%, due 11/1/29 | 13,500,000 | 11,525,796 |
| New Caney Independent School District, Unlimited General Obligation | | |
| Insured: PSF-GTD | | |
| 5.00%, due 2/15/48 | 6,000,000 | 6,087,728 |
| North Texas Municipal Water District, Sabine Creek Regional Wastewater System, Revenue Bonds | | |
| Insured: AGM | | |
| 4.375%, due 6/1/52 | 7,200,000 | 6,112,566 |
| North Texas Tollway Authority, Revenue Bonds, First Tier | | |
| Series A | | |
| 4.00%, due 1/1/43 | 7,250,000 | 6,084,550 |
| Series A | | |
| 4.125%, due 1/1/39 | 2,250,000 | 2,026,634 |
| Series A | | |
| 4.125%, due 1/1/40 | 4,750,000 | 4,234,947 |
| Series A | | |
| 5.00%, due 1/1/27 | 7,270,000 | 7,281,429 |
| Series A | | |
| 5.25%, due 1/1/38 | 6,700,000 | 7,037,292 |
| North Texas Tollway Authority, Revenue Bonds | | |
| Series A | | |
| 5.00%, due 1/1/33 | 4,500,000 | 4,513,059 |
| Series A | | |
| 5.00%, due 1/1/34 | 1,400,000 | 1,403,200 |
| Series A | | |
| 5.00%, due 1/1/35 | 2,450,000 | 2,454,212 |
The notes to the financial statements are an integral part of, and should be read in conjunction with, the financial statements.
| 44 | MainStay MacKay Tax Free Bond Fund |
| | Principal
Amount | Value |
| Long-Term Municipal Bonds (continued) |
| Texas (continued) |
| North Texas Tollway Authority, Revenue Bonds (continued) | | |
| Series A, Insured: BAM | | |
| 5.00%, due 1/1/38 | $ 8,175,000 | $ 8,097,946 |
| North Texas Tollway Authority, Revenue Bonds, Second Tier | | |
| Series B | | |
| 5.00%, due 1/1/39 | 4,500,000 | 4,528,494 |
| Northwest Independent School District, Unlimited General Obligation | | |
| Series B, Insured: PSF-GTD | | |
| 5.00%, due 2/15/25 | 4,500,000 | 4,568,094 |
| Pearland Independent School District, Unlimited General Obligation | | |
| Insured: PSF-GTD | | |
| 5.25%, due 2/15/32 | 5,000,000 | 5,127,969 |
| Port Authority of Houston of Harris County Texas, Revenue Bonds, First Lien | | |
| 5.00%, due 10/1/53 | 15,000,000 | 14,926,858 |
| Royse City Independent School District, Unlimited General Obligation | | |
| Insured: PSF-GTD | | |
| 5.00%, due 2/15/53 | 19,570,000 | 19,679,852 |
| San Antonio Independent School District, Unlimited General Obligation | | |
| Insured: PSF-GTD | | |
| 5.00%, due 8/15/52 | 8,715,000 | 8,839,990 |
| San Antonio Water System, Revenue Bonds, Junior Lien | | |
| Series B | | |
| 5.25%, due 5/15/52 | 42,750,000 | 43,860,136 |
| San Marcos Consolidated Independent School District, Unlimited General Obligation | | |
| Insured: PSF-GTD | | |
| 5.25%, due 8/15/47 | 9,000,000 | 9,386,736 |
| Spring Independent School District, Unlimited General Obligation | | |
| 5.00%, due 8/15/47 | 5,000,000 | 5,024,115 |
| | Principal
Amount | Value |
| |
| Texas (continued) |
| State of Texas, Water Financial Assistance, Unlimited General Obligation | | |
| Series A | | |
| 3.00%, due 8/1/27 | $ 2,075,000 | $ 1,948,046 |
| Series D | | |
| 3.40%, due 5/15/31 | 2,000,000 | 1,824,598 |
| Series B | | |
| 5.00%, due 8/1/39 | 10,490,000 | 10,545,384 |
| State of Texas, College Student Loan, Unlimited General Obligation (c) | | |
| Series B | | |
| 4.00%, due 8/1/26 | 10,595,000 | 10,350,764 |
| Series B | | |
| 4.00%, due 8/1/27 | 6,000,000 | 5,805,853 |
| Series B | | |
| 4.00%, due 8/1/28 | 3,105,000 | 2,976,302 |
| 5.00%, due 8/1/27 | 7,750,000 | 7,846,715 |
| 5.50%, due 8/1/32 | 3,500,000 | 3,612,049 |
| State of Texas, Transportation Commission, Highway Improvement, Unlimited General Obligation | | |
| 5.00%, due 4/1/33 | 5,500,000 | 5,611,906 |
| Series A | | |
| 5.00%, due 4/1/37 | 4,525,000 | 4,590,041 |
| 5.00%, due 4/1/43 | 7,390,000 | 7,444,014 |
| State of Texas, Mobility Fund, Unlimited General Obligation | | |
| Series B | | |
| 5.00%, due 10/1/36 | 23,250,000 | 23,457,532 |
| Tarrant County Cultural Education Facilities Finance Corp., Buckner Retirement Services, Revenue Bonds | | |
| Series B | | |
| 5.00%, due 11/15/46 | 2,745,000 | 2,364,423 |
| Texas Department of Housing & Community Affairs, Revenue Bonds | | |
| Series A, Insured: GNMA / FNMA | | |
| 3.95%, due 1/1/50 | 2,285,000 | 1,861,535 |
| Series B, Insured: GNMA | | |
| 6.00%, due 3/1/53 | 11,665,000 | 12,221,994 |
The notes to the financial statements are an integral part of, and should be read in conjunction with, the financial statements.
45
Portfolio of Investments October 31, 2023†^ (continued)
| | Principal
Amount | Value |
| Long-Term Municipal Bonds (continued) |
| Texas (continued) |
| Texas Department of Housing & Community Affairs, Residential Mortgage, Revenue Bonds | | |
| Series A, Insured: GNMA / FNMA | | |
| 4.75%, due 1/1/49 | $ 15,000 | $ 14,900 |
| Texas Municipal Gas Acquisition & Supply Corp. II, Revenue Bonds | | |
| Series C | | |
| 4.433%, due 9/15/27 | 30,410,000 | 29,746,052 |
| Texas Municipal Gas Acquisition & Supply Corp. III, Gas Supply, Revenue Bonds | | |
| 5.00%, due 12/15/25 | 1,525,000 | 1,521,143 |
| 5.00%, due 12/15/26 | 4,925,000 | 4,907,399 |
| 5.00%, due 12/15/27 | 5,180,000 | 5,145,787 |
| 5.00%, due 12/15/28 | 3,000,000 | 2,962,291 |
| 5.00%, due 12/15/32 | 10,075,000 | 9,779,271 |
| Texas Private Activity Bond Surface Transportation Corp., LBJ Infrastructure Group LLC, Revenue Bonds, Senior Lien | | |
| Series A | | |
| 4.00%, due 6/30/35 | 2,300,000 | 2,142,075 |
| Texas Private Activity Bond Surface Transportation Corp., North Tarrant Express Managed Lanes Project, Revenue Bonds, Senior Lien | | |
| 5.50%, due 12/31/58 (c) | 13,200,000 | 13,279,174 |
| Texas State Technical College, Revenue Bonds | | |
| Series A, Insured: AGM | | |
| 5.50%, due 8/1/42 | 3,750,000 | 3,913,262 |
| Texas Transportation Commission, State Highway, Revenue Bonds, First Tier | | |
| 5.00%, due 10/1/25 | 9,000,000 | 9,196,153 |
| Texas Water Development Board, State Water Implementation Fund, Revenue Bonds | | |
| 4.65%, due 10/15/40 | 3,505,000 | 3,472,137 |
| 5.00%, due 8/1/42 | 3,375,000 | 3,452,553 |
| 5.00%, due 10/15/47 | 4,385,000 | 4,440,053 |
| Series A | | |
| 5.25%, due 10/15/51 | 22,000,000 | 22,656,128 |
| | Principal
Amount | Value |
| |
| Texas (continued) |
| Upper Brushy Creek Water Control and Improvement District, Unlimited General Obligation | | |
| 3.00%, due 8/15/47 | $ 2,885,000 | $ 1,928,940 |
| Waxahachie Independent School District, Unlimited General Obligation | | |
| Insured: PSF-GTD | | |
| 5.00%, due 2/15/48 | 3,035,000 | 3,079,376 |
| | | 856,051,249 |
| U.S. Virgin Islands 1.0% |
| Matching Fund Special Purpose Securitization Corp., Revenue Bonds | | |
| Series A | | |
| 5.00%, due 10/1/28 | 5,000,000 | 4,977,347 |
| Series A | | |
| 5.00%, due 10/1/30 | 11,805,000 | 11,685,171 |
| Series A | | |
| 5.00%, due 10/1/32 | 11,805,000 | 11,607,854 |
| Series A | | |
| 5.00%, due 10/1/39 | 35,670,000 | 33,829,275 |
| Virgin Islands Public Finance Authority, Revenue Bonds | | |
| 5.00%, due 9/1/30 (b) | 4,700,000 | 4,643,711 |
| Series C, Insured: AGM-CR | | |
| 5.00%, due 10/1/39 | 7,575,000 | 7,199,478 |
| | | 73,942,836 |
| Utah 2.7% |
| City of Salt Lake City, Airport, Revenue Bonds (c) | | |
| Series A | | |
| 4.00%, due 7/1/41 | 5,750,000 | 4,900,846 |
| Series A | | |
| 5.00%, due 7/1/31 | 6,155,000 | 6,318,013 |
| Series A | | |
| 5.00%, due 7/1/32 | 3,750,000 | 3,841,065 |
| Series A | | |
| 5.00%, due 7/1/35 | 4,500,000 | 4,549,920 |
| Series A | | |
| 5.00%, due 7/1/36 | 4,250,000 | 4,260,021 |
| Series A | | |
| 5.00%, due 7/1/43 | 7,250,000 | 7,027,060 |
| Series A | | |
| 5.00%, due 7/1/46 | 8,250,000 | 7,840,202 |
| Series A | | |
| 5.00%, due 7/1/47 | 29,570,000 | 27,974,453 |
The notes to the financial statements are an integral part of, and should be read in conjunction with, the financial statements.
| 46 | MainStay MacKay Tax Free Bond Fund |
| | Principal
Amount | Value |
| Long-Term Municipal Bonds (continued) |
| Utah (continued) |
| City of Salt Lake City, Airport, Revenue Bonds (c) (continued) | | |
| Series A | | |
| 5.50%, due 7/1/53 | $ 8,500,000 | $ 8,549,044 |
| Intermountain Power Agency, Revenue Bonds | | |
| Series A | | |
| 4.00%, due 7/1/36 | 9,500,000 | 9,258,226 |
| Series A | | |
| 5.00%, due 7/1/33 | 5,950,000 | 6,408,105 |
| Series A | | |
| 5.00%, due 7/1/42 | 4,045,000 | 4,163,890 |
| Series A | | |
| 5.00%, due 7/1/45 | 15,550,000 | 15,779,140 |
| Series A | | |
| 5.25%, due 7/1/43 | 7,435,000 | 7,807,940 |
| Series A | | |
| 5.25%, due 7/1/44 | 8,155,000 | 8,513,461 |
| Series A | | |
| 5.25%, due 7/1/45 | 17,910,000 | 18,645,703 |
| Jordan School District, School Building, Unlimited General Obligation | | |
| Insured: School Bond Guaranty | | |
| 2.25%, due 6/15/36 | 1,225,000 | 875,201 |
| State of Utah, Unlimited General Obligation | | |
| 3.00%, due 7/1/33 | 5,450,000 | 4,961,582 |
| University of Utah (The), Revenue Bonds | | |
| Series B | | |
| 5.25%, due 8/1/53 | 7,830,000 | 8,063,372 |
| Utah Board of Higher Education, Revenue Bonds | | |
| Series A, Insured: NATL-RE | | |
| 5.50%, due 4/1/29 | 8,000,000 | 8,425,520 |
| Utah Charter School Finance Authority, Spectrum Academy Project, Revenue Bonds | | |
| Insured: BAM UT CSCE | | |
| 4.00%, due 4/15/45 | 1,750,000 | 1,426,351 |
| Utah Housing Corp., Mortgage-Backed, Revenue Bonds | | |
| Series H-G2, Insured: GNMA | | |
| 4.50%, due 10/21/48 | 517,713 | 495,572 |
| | Principal
Amount | Value |
| |
| Utah (continued) |
| Utah Housing Corp., Mortgage-Backed, Revenue Bonds (continued) | | |
| Series J-G2, Insured: GNMA | | |
| 4.50%, due 12/21/48 | $ 494,926 | $ 472,219 |
| Series A, Insured: GNMA | | |
| 4.50%, due 1/21/49 | 1,167,297 | 1,118,800 |
| Series B-G2, Insured: GNMA | | |
| 4.50%, due 2/21/49 | 1,147,246 | 1,068,708 |
| Series G-2, Insured: GNMA | | |
| 5.00%, due 7/21/52 | 13,892,065 | 12,643,347 |
| Series H-G2, Insured: GNMA | | |
| 5.00%, due 8/21/52 | 20,481,788 | 19,074,855 |
| Series C-G2, Insured: GNMA | | |
| 5.50%, due 4/21/53 | 4,970,305 | 4,759,333 |
| Utah Infrastructure Agency, Telecommunication, Revenue Bonds | | |
| 5.00%, due 10/15/38 | 1,990,000 | 2,016,585 |
| | | 211,238,534 |
| Vermont 0.2% |
| University of Vermont and State Agricultural College, Revenue Bonds | | |
| 5.00%, due 10/1/40 | 14,000,000 | 14,036,287 |
| Virginia 0.7% |
| Arlington County Industrial Development Authority, Virginia Hospital Center, Revenue Bonds | | |
| 4.00%, due 7/1/45 | 4,750,000 | 3,963,072 |
| Series A | | |
| 5.00%, due 7/1/53 (a) | 10,000,000 | 10,349,399 |
| City of Alexandria, Unlimited General Obligation | | |
| Series A, Insured: State Aid Withholding | | |
| 2.00%, due 12/15/39 | 1,550,000 | 971,544 |
| City of Harrisonburg, Unlimited General Obligation | | |
| Series A, Insured: State Aid Withholding | | |
| 1.875%, due 7/15/37 | 3,200,000 | 2,095,593 |
The notes to the financial statements are an integral part of, and should be read in conjunction with, the financial statements.
47
Portfolio of Investments October 31, 2023†^ (continued)
| | Principal
Amount | Value |
| Long-Term Municipal Bonds (continued) |
| Virginia (continued) |
| County of Fairfax, Unlimited General Obligation | | |
| Series B, Insured: State Aid Withholding | | |
| 3.00%, due 10/1/26 | $ 7,750,000 | $ 7,403,907 |
| Hampton Roads Transportation Accountability Commission, Revenue Bonds, Senior Lien | | |
| Series A | | |
| 5.00%, due 7/1/45 | 4,750,000 | 4,836,624 |
| Roanoke Economic Development Authority, Carilion Clinic Obligated Group, Revenue Bonds | | |
| Series A | | |
| 3.00%, due 7/1/45 | 9,000,000 | 6,156,342 |
| Virginia College Building Authority, 21st Century College & Equipment Programs, Revenue Bonds | | |
| Series D, Insured: State Intercept | | |
| 3.00%, due 2/1/26 | 6,000,000 | 5,822,271 |
| Series D, Insured: State Intercept | | |
| 3.15%, due 2/1/28 | 5,800,000 | 5,520,703 |
| Virginia Public Building Authority, Revenue Bonds | | |
| Series A | | |
| 3.30%, due 8/1/28 | 6,750,000 | 6,383,488 |
| | | 53,502,943 |
| Washington 2.6% |
| City of Seattle, Municipal Light & Power, Revenue Bonds | | |
| 4.00%, due 9/1/31 | 5,285,000 | 5,289,736 |
| County of King, Sewer, Limited General Obligation | | |
| 5.00%, due 1/1/37 | 4,125,000 | 4,295,195 |
| Douglas County Public Utility District No. 1, Wells Hydroelectric Project, Revenue Bonds | | |
| Series B | | |
| 5.00%, due 9/1/47 | 10,030,000 | 10,088,928 |
| Energy Northwest, Bonneville Power Administration, Revenue Bonds | | |
| Series C | | |
| 5.00%, due 7/1/28 | 11,400,000 | 11,478,975 |
| Series A | | |
| 5.00%, due 7/1/35 | 4,250,000 | 4,501,133 |
| | Principal
Amount | Value |
| |
| Washington (continued) |
Energy Northwest, Bonneville Power Administration, Revenue Bonds
(continued) | | |
| Series A | | |
| 5.00%, due 7/1/36 | $ 5,000,000 | $ 5,221,277 |
| Series A | | |
| 5.00%, due 7/1/36 | 6,100,000 | 6,492,840 |
| North Thurston Public Schools, Unlimited General Obligation | | |
| Insured: School Bond Guaranty | | |
| 3.50%, due 12/1/29 | 4,360,000 | 4,120,045 |
| Port of Seattle, Revenue Bonds (c) | | |
| 5.00%, due 4/1/27 | 6,835,000 | 6,962,755 |
| 5.00%, due 7/1/28 | 8,500,000 | 8,501,600 |
| 5.00%, due 7/1/29 | 6,585,000 | 6,586,062 |
| Series C | | |
| 5.00%, due 4/1/30 | 2,000,000 | 2,002,480 |
| Series C | | |
| 5.00%, due 8/1/30 | 5,000,000 | 5,126,502 |
| Series C | | |
| 5.00%, due 4/1/32 | 3,000,000 | 2,996,395 |
| Series C | | |
| 5.00%, due 4/1/34 | 4,400,000 | 4,380,869 |
| Port of Seattle, Intermediate Lien, Revenue Bonds | | |
| Series C | | |
| 5.00%, due 8/1/38 (c) | 8,965,000 | 8,949,200 |
| Snohomish County Public Utility District No. 1, Generation System, Revenue Bonds | | |
| 5.00%, due 12/1/45 | 6,200,000 | 6,225,083 |
| Southwest Suburban Sewer District, Revenue Bonds | | |
| Series A | | |
| 3.00%, due 5/1/29 | 2,050,000 | 1,882,840 |
| State of Washington, Various Purpose, Unlimited General Obligation | | |
| Series R-2023A | | |
| 5.00%, due 8/1/25 | 22,500,000 | 22,958,645 |
| Series C | | |
| 5.00%, due 2/1/29 | 5,900,000 | 6,281,129 |
| Series D | | |
| 5.00%, due 2/1/30 | 8,145,000 | 8,160,199 |
| Series R-2015D | �� | |
| 5.00%, due 7/1/32 | 5,000,000 | 5,054,724 |
| Series A | | |
| 5.00%, due 8/1/35 | 4,700,000 | 5,064,835 |
The notes to the financial statements are an integral part of, and should be read in conjunction with, the financial statements.
| 48 | MainStay MacKay Tax Free Bond Fund |
| | Principal
Amount | Value |
| Long-Term Municipal Bonds (continued) |
| Washington (continued) |
| State of Washington, Various Purpose, Unlimited General Obligation (continued) | | |
| Series A | | |
| 5.00%, due 8/1/38 | $ 10,565,000 | $ 11,124,066 |
| Series C | | |
| 5.00%, due 2/1/41 | 4,250,000 | 4,367,513 |
| Series A | | |
| 5.00%, due 8/1/41 | 11,700,000 | 12,159,453 |
| State of Washington, Motor Vehicle Fuel Tax, Unlimited General Obligation | | |
| Series R-2022B | | |
| 5.00%, due 2/1/29 | 4,750,000 | 5,056,841 |
| Series E | | |
| 5.00%, due 2/1/33 | 10,970,000 | 10,991,560 |
| Series B | | |
| 5.00%, due 6/1/37 | 5,540,000 | 5,889,856 |
| Washington State Housing Finance Commission, Single Family Program, Revenue Bonds | | |
| Series 1N | | |
| 4.00%, due 6/1/49 | 170,000 | 166,387 |
| | | 202,377,123 |
| West Virginia 0.3% |
| West Virginia Hospital Finance Authority, United Health System, Revenue Bonds | | |
| Series A | | |
| 5.00%, due 6/1/52 | 13,280,000 | 12,612,674 |
| West Virginia Hospital Finance Authority, Vandalia Health, Inc., Revenue Bonds | | |
| Series B, Insured: AGM | | |
| 5.50%, due 9/1/48 | 8,600,000 | 8,657,722 |
| | | 21,270,396 |
| Wisconsin 0.6% |
| County of Milwaukee, Unlimited General Obligation | | |
| Series A | | |
| 3.00%, due 12/1/25 | 2,515,000 | 2,423,947 |
| Howard-Suamico School District, Unlimited General Obligation | | |
| 2.00%, due 3/1/36 | 4,825,000 | 3,518,171 |
| 2.00%, due 3/1/39 | 5,200,000 | 3,404,779 |
| | Principal
Amount | Value |
| |
| Wisconsin (continued) |
Howard-Suamico School District, Unlimited General Obligation
(continued) | | |
| 2.00%, due 3/1/40 | $ 3,245,000 | $ 2,072,828 |
| 2.00%, due 3/1/41 | 4,540,000 | 2,829,531 |
| Sun Prairie Area School District, Unlimited General Obligation | | |
| 2.00%, due 3/1/41 | 9,755,000 | 5,856,478 |
| Waunakee Community School District, Unlimited General Obligation | | |
| 3.25%, due 4/1/28 | 13,000,000 | 12,172,894 |
| Wisconsin Health & Educational Facilities Authority, Children's Hospital of Wisconsin, Revenue Bonds | | |
| 4.00%, due 8/15/42 | 6,350,000 | 5,417,718 |
| 4.00%, due 8/15/47 | 3,750,000 | 3,103,344 |
| Wisconsin Health & Educational Facilities Authority, Aspirus, Inc. Obligated Group, Revenue Bonds | | |
| 4.00%, due 8/15/48 | 4,015,000 | 3,201,778 |
| | | 44,001,468 |
| Wyoming 0.1% |
| Wyoming Community Development Authority, Revenue Bonds | | |
| Series 1 | | |
| 5.75%, due 6/1/53 | 5,200,000 | 5,337,108 |
Total Long-Term Municipal Bonds
(Cost $7,816,423,341) | | 7,496,094,024 |
| Short-Term Municipal Notes 2.1% |
| Alabama 0.1% |
| Walker County Economic & Industrial Development Authority, Alabama Power Co., Revenue Bonds, First Series | | |
| Series 1 | | |
| 4.25%, due 8/1/63 (c)(e) | 10,000,000 | 10,000,000 |
| Florida 0.0% ‡ |
| City of Orlando, Tourist Development Tax, Revenue Bonds, Third Lien | | |
| Series C, Insured: AGC | | |
| 5.50%, due 11/1/38 (e) | 1,145,000 | 1,145,000 |
The notes to the financial statements are an integral part of, and should be read in conjunction with, the financial statements.
49
Portfolio of Investments October 31, 2023†^ (continued)
| | Principal
Amount | Value |
| Short-Term Municipal Notes (continued) |
| Georgia 0.8% |
| Bartow County Development Authority, Georgia Power Company Plant Bowen Project, Revenue Bonds | | |
| Series 1 | | |
| 4.25%, due 11/1/62 (c)(e) | $ 24,000,000 | $ 24,000,000 |
| Development Authority of Burke County (The), Georgia Power Co. Vogtle Project, Revenue Bonds | | |
| Series 1 | | |
| 4.30%, due 11/1/48 (e) | 38,935,000 | 38,935,000 |
| | | 62,935,000 |
| New York 0.3% |
| Long Island Power Authority, Electric System, Revenue Bonds | | |
| Series D | | |
| 3.98%, due 5/1/33 (e) | 25,500,000 | 25,500,000 |
| Ohio 0.7% |
| Ohio State University (The), Revenue Bonds | | |
| Series A-1 | | |
| 3.95%, due 6/1/43 (e) | 50,000,000 | 50,000,000 |
| Texas 0.1% |
| Dallas Fort Worth International Airport, Revenue Bonds (e) | | |
| Series C | | |
| 0.632%, due 11/1/23 | 1,705,000 | 1,705,000 |
| Series E | | |
| 5.25%, due 11/1/33 (c) | 3,220,000 | 3,220,000 |
| | | 4,925,000 |
| Wisconsin 0.1% |
| Nuveen AMT-Free Quality Municipal Income Fund | | |
| Series D | | |
| 4.54%, due 3/1/29 (e) | 10,600,000 | 10,600,000 |
Total Short-Term Municipal Notes
(Cost $165,105,000) | | 165,105,000 |
Total Municipal Bonds
(Cost $7,981,528,341) | | 7,661,199,024 |
| |
| | Shares | | Value |
| Short-Term Investment 2.2% |
| Unaffiliated Investment Company 2.2% |
| BlackRock Liquidity Funds MuniCash, 3.821% (f) | 169,770,554 | | $ 169,770,484 |
Total Short-Term Investment
(Cost $169,770,484) | | | 169,770,484 |
Total Investments
(Cost $8,151,298,825) | 100.5% | | 7,830,969,508 |
| Other Assets, Less Liabilities | (0.5) | | (38,100,761) |
| Net Assets | 100.0% | | $ 7,792,868,747 |
| † | Percentages indicated are based on Fund net assets. |
| ^ | Industry classifications may be different than those used for compliance monitoring purposes. |
| ‡ | Less than one-tenth of a percent. |
| (a) | Coupon rate may change based on changes of the underlying collateral or prepayments of principal. Rate shown was the rate in effect as of October 31, 2023. |
| (b) | May be sold to institutional investors only under Rule 144A or securities offered pursuant to Section 4(a)(2) of the Securities Act of 1933, as amended. |
| (c) | Interest on these securities was subject to alternative minimum tax. |
| (d) | Delayed delivery security. |
| (e) | Variable-rate demand notes (VRDNs)—Provide the right to sell the security at face value on either that day or within the rate-reset period. VRDNs will normally trade as if the maturity is the earlier put date, even though stated maturity is longer. The interest rate is reset on the put date at a stipulated daily, weekly, monthly, quarterly, or other specified time interval to reflect current market conditions. These securities do not indicate a reference rate and spread in their description. The maturity date shown is the final maturity. |
| (f) | Current yield as of October 31, 2023. |
| Abbreviation(s): |
| AGC—Assured Guaranty Corp. |
| AGM—Assured Guaranty Municipal Corp. |
| BAM—Build America Mutual Assurance Co. |
| BHAC—Berkshire Hathaway Assurance Corp. |
| CHF—Collegiate Housing Foundation |
| CR—Custodial Receipts |
| FHLMC—Federal Home Loan Mortgage Corp. |
| FNMA—Federal National Mortgage Association |
| GNMA—Government National Mortgage Association |
| ICC—Insured Custody Certificates |
| MTA—Metropolitan Transportation Authority |
The notes to the financial statements are an integral part of, and should be read in conjunction with, the financial statements.
| 50 | MainStay MacKay Tax Free Bond Fund |
| NATL-RE—National Public Finance Guarantee Corp. |
| PSF-GTD—Permanent School Fund Guaranteed |
| Q-SBLF—Qualified School Board Loan Fund |
| SCSDE—South Carolina State Department of Education |
| SD CRED PROG—School District Credit Enhancement Program |
| UT CSCE—Utah Charter School Credit Enhancement Program |
The notes to the financial statements are an integral part of, and should be read in conjunction with, the financial statements.
51
Portfolio of Investments October 31, 2023†^ (continued)
The following is a summary of the fair valuations according to the inputs used as of October 31, 2023, for valuing the Fund’s assets:
| Description | Quoted
Prices in
Active
Markets for
Identical
Assets
(Level 1) | | Significant
Other
Observable
Inputs
(Level 2) | | Significant
Unobservable
Inputs
(Level 3) | | Total |
| Asset Valuation Inputs | | | | | | | |
| Investments in Securities (a) | | | | | | | |
| Municipal Bonds | | | | | | | |
| Long-Term Municipal Bonds | $ — | | $ 7,496,094,024 | | $ — | | $ 7,496,094,024 |
| Short-Term Municipal Notes | — | | 165,105,000 | | — | | 165,105,000 |
| Total Municipal Bonds | — | | 7,661,199,024 | | — | | 7,661,199,024 |
| Short-Term Investment | | | | | | | |
| Unaffiliated Investment Company | 169,770,484 | | — | | — | | 169,770,484 |
| Total Investments in Securities | $ 169,770,484 | | $ 7,661,199,024 | | $ — | | $ 7,830,969,508 |
| (a) | For a complete listing of investments and their industries, see the Portfolio of Investments. |
The notes to the financial statements are an integral part of, and should be read in conjunction with, the financial statements.
| 52 | MainStay MacKay Tax Free Bond Fund |
Statement of Assets and Liabilities as of October 31, 2023
| Assets |
Investment in securities, at value
(identified cost $8,151,298,825) | $ 7,830,969,508 |
| Receivables: | |
| Investment securities sold | 120,356,122 |
| Interest | 98,105,992 |
| Fund shares sold | 43,284,069 |
| Other assets | 136,964 |
| Total assets | 8,092,852,655 |
| Liabilities |
| Due to custodian | 28,910 |
| Payables: | |
| Investment securities purchased | 237,331,517 |
| Fund shares redeemed | 50,685,558 |
| Manager (See Note 3) | 2,738,409 |
| Transfer agent (See Note 3) | 742,668 |
| NYLIFE Distributors (See Note 3) | 310,772 |
| Professional fees | 94,247 |
| Custodian | 60,284 |
| Shareholder communication | 57,207 |
| Trustees | 1,747 |
| Accrued expenses | 14,305 |
| Distributions payable | 7,918,284 |
| Total liabilities | 299,983,908 |
| Net assets | $ 7,792,868,747 |
| Composition of Net Assets |
| Shares of beneficial interest outstanding (par value of $.01 per share) unlimited number of shares authorized | $ 8,879,633 |
| Additional paid-in-capital | 9,089,894,141 |
| | 9,098,773,774 |
| Total distributable earnings (loss) | (1,305,905,027) |
| Net assets | $ 7,792,868,747 |
| Class A | |
| Net assets applicable to outstanding shares | $1,200,332,891 |
| Shares of beneficial interest outstanding | 136,807,516 |
| Net asset value per share outstanding | $ 8.77 |
| Maximum sales charge (3.00% of offering price) | 0.27 |
| Maximum offering price per share outstanding | $ 9.04 |
| Investor Class | |
| Net assets applicable to outstanding shares | $ 6,247,619 |
| Shares of beneficial interest outstanding | 708,833 |
| Net asset value per share outstanding | $ 8.81 |
| Maximum sales charge (2.50% of offering price) | 0.23 |
| Maximum offering price per share outstanding | $ 9.04 |
| Class B | |
| Net assets applicable to outstanding shares | $ 1,919,502 |
| Shares of beneficial interest outstanding | 218,836 |
| Net asset value and offering price per share outstanding | $ 8.77 |
| Class C | |
| Net assets applicable to outstanding shares | $ 103,571,203 |
| Shares of beneficial interest outstanding | 11,801,715 |
| Net asset value and offering price per share outstanding | $ 8.78 |
| Class C2 | |
| Net assets applicable to outstanding shares | $ 5,349,644 |
| Shares of beneficial interest outstanding | 609,995 |
| Net asset value and offering price per share outstanding | $ 8.77 |
| Class I | |
| Net assets applicable to outstanding shares | $5,868,538,956 |
| Shares of beneficial interest outstanding | 668,688,394 |
| Net asset value and offering price per share outstanding | $ 8.78 |
| Class R6 | |
| Net assets applicable to outstanding shares | $ 606,908,932 |
| Shares of beneficial interest outstanding | 69,127,973 |
| Net asset value and offering price per share outstanding | $ 8.78 |
The notes to the financial statements are an integral part of, and should be read in conjunction with, the financial statements.
53
Statement of Operations for the year ended October 31, 2023
| Investment Income (Loss) |
| Income | |
| Interest | $ 297,873,326 |
| Expenses | |
| Manager (See Note 3) | 31,862,362 |
| Transfer agent (See Note 3) | 4,362,308 |
| Distribution/Service—Class A (See Note 3) | 3,346,713 |
| Distribution/Service—Investor Class (See Note 3) | 17,054 |
| Distribution/Service—Class B (See Note 3) | 13,909 |
| Distribution/Service—Class C (See Note 3) | 609,859 |
| Distribution/Service—Class C2 (See Note 3) | 34,112 |
| Professional fees | 535,795 |
| Registration | 362,624 |
| Trustees | 200,754 |
| Custodian | 194,434 |
| Shareholder communication | 61,332 |
| Miscellaneous | 185,120 |
| Total expenses before waiver/reimbursement | 41,786,376 |
| Reimbursement from prior custodian(a) | (14,394) |
| Net expenses | 41,771,982 |
| Net investment income (loss) | 256,101,344 |
| Realized and Unrealized Gain (Loss) |
| Net realized gain (loss) on: | |
| Unaffiliated investment transactions | (220,785,463) |
| In-kind Transactions | 3,292,526 |
| Futures transactions | 13,344,679 |
| Net realized gain (loss) | (204,148,258) |
| Net change in unrealized appreciation (depreciation) on: | |
| Unaffiliated investments | 117,408,010 |
| Futures contracts | (31,453,455) |
| Net change in unrealized appreciation (depreciation) | 85,954,555 |
| Net realized and unrealized gain (loss) | (118,193,703) |
| Net increase (decrease) in net assets resulting from operations | $ 137,907,641 |
| (a) | Represents a refund for overbilling of custody fees. |
The notes to the financial statements are an integral part of, and should be read in conjunction with, the financial statements.
| 54 | MainStay MacKay Tax Free Bond Fund |
Statements of Changes in Net Assets
for the years ended October 31, 2023 and October 31, 2022
| | 2023 | 2022 |
| Increase (Decrease) in Net Assets |
| Operations: | | |
| Net investment income (loss) | $ 256,101,344 | $ 179,472,941 |
| Net realized gain (loss) | (204,148,258) | (568,250,184) |
| Net change in unrealized appreciation (depreciation) | 85,954,555 | (795,183,757) |
| Net increase (decrease) in net assets resulting from operations | 137,907,641 | (1,183,961,000) |
| Distributions to shareholders: | | |
| Class A | (46,644,991) | (63,381,043) |
| Investor Class | (234,139) | (229,133) |
| Class B | (88,640) | (153,810) |
| Class C | (3,895,641) | (4,398,849) |
| Class C2 | (160,027) | (90,208) |
| Class I | (216,236,340) | (168,558,373) |
| Class R6 | (18,378,828) | (15,713,711) |
| Total distributions to shareholders | (285,638,606) | (252,525,127) |
| Capital share transactions: | | |
| Net proceeds from sales of shares | 5,473,281,465 | 6,084,451,250 |
| Net asset value of shares issued to shareholders in reinvestment of distributions | 203,066,915 | 183,548,070 |
| Cost of shares redeemed | (3,880,913,107) | (6,715,327,651) |
| Redemptions in-kind | (373,829,325) | (930,537,398) |
| Increase (decrease) in net assets derived from capital share transactions | 1,421,605,948 | (1,377,865,729) |
| Net increase (decrease) in net assets | 1,273,874,983 | (2,814,351,856) |
| Net Assets |
| Beginning of year | 6,518,993,764 | 9,333,345,620 |
| End of year | $ 7,792,868,747 | $ 6,518,993,764 |
The notes to the financial statements are an integral part of, and should be read in conjunction with, the financial statements.
55
Financial Highlights selected per share data and ratios
| | Year Ended October 31, |
| Class A | 2023 | | 2022 | | 2021 | | 2020 | | 2019 |
| Net asset value at beginning of year | $ 8.85 | | $ 10.60 | | $ 10.43 | | $ 10.33 | | $ 9.80 |
| Net investment income (loss) | 0.29(a) | | 0.20(a) | | 0.17(a) | | 0.26 | | 0.30 |
| Net realized and unrealized gain (loss) | (0.05) | | (1.66) | | 0.23 | | 0.11 | | 0.53 |
| Total from investment operations | 0.24 | | (1.46) | | 0.40 | | 0.37 | | 0.83 |
| Less distributions: | | | | | | | | | |
| From net investment income | (0.32) | | (0.26) | | (0.23) | | (0.27) | | (0.30) |
| From net realized gain on investments | — | | (0.03) | | — | | — | | — |
| Total distributions | (0.32) | | (0.29) | | (0.23) | | (0.27) | | (0.30) |
| Net asset value at end of year | $ 8.77 | | $ 8.85 | | $ 10.60 | | $ 10.43 | | $ 10.33 |
| Total investment return (b) | 2.62% | | (13.96)% | | 3.84% | | 3.66% | | 8.55% |
| Ratios (to average net assets)/Supplemental Data: | | | | | | | | | |
| Net investment income (loss) | 3.10% | | 2.03% | | 1.63% | | 2.04% | | 2.93% |
| Net expenses (c) | 0.74% | | 0.75% | | 0.73% | | 0.75% | | 0.78% |
| Portfolio turnover rate (d) | 75%(e) | | 127%(e) | | 39% | | 72% | | 38% |
| Net assets at end of year (in 000’s) | $ 1,200,333 | | $ 1,552,537 | | $ 3,134,090 | | $ 2,674,765 | | $ 1,728,643 |
| (a) | Per share data based on average shares outstanding during the year. |
| (b) | Total investment return is calculated exclusive of sales charges and assumes the reinvestment of dividends and distributions. For periods of less than one year, total return is not annualized. |
| (c) | In addition to the fees and expenses which the Fund bears directly, it also indirectly bears a pro-rata share of the fees and expenses of the underlying funds in which it invests. Such indirect expenses are not included in the above expense ratios. |
| (d) | The portfolio turnover rate includes variable rate demand notes. |
| (e) | The portfolio turnover rate excludes in-kind transactions. |
| | Year Ended October 31, |
| Investor Class | 2023 | | 2022 | | 2021 | | 2020 | | 2019 |
| Net asset value at beginning of year | $ 8.89 | | $ 10.65 | | $ 10.48 | | $ 10.38 | | $ 9.84 |
| Net investment income (loss) | 0.28(a) | | 0.20(a) | | 0.17(a) | | 0.20 | | 0.30 |
| Net realized and unrealized gain (loss) | (0.04) | | (1.67) | | 0.23 | | 0.17 | | 0.54 |
| Total from investment operations | 0.24 | | (1.47) | | 0.40 | | 0.37 | | 0.84 |
| Less distributions: | | | | | | | | | |
| From net investment income | (0.32) | | (0.26) | | (0.23) | | (0.27) | | (0.30) |
| From net realized gain on investments | — | | (0.03) | | — | | — | | — |
| Total distributions | (0.32) | | (0.29) | | (0.23) | | (0.27) | | (0.30) |
| Net asset value at end of year | $ 8.81 | | $ 8.89 | | $ 10.65 | | $ 10.48 | | $ 10.38 |
| Total investment return (b) | 2.57% | | (14.01)% | | 3.80% | | 3.64% | | 8.63% |
| Ratios (to average net assets)/Supplemental Data: | | | | | | | | | |
| Net investment income (loss) | 3.05% | | 2.07% | | 1.61% | | 2.04% | | 2.95% |
| Net expenses (c) | 0.78% | | 0.77% | | 0.76% | | 0.76% | | 0.77% |
| Portfolio turnover rate (d) | 75%(e) | | 127%(e) | | 39% | | 72% | | 38% |
| Net assets at end of year (in 000's) | $ 6,248 | | $ 6,622 | | $ 9,027 | | $ 9,334 | | $ 9,815 |
| (a) | Per share data based on average shares outstanding during the year. |
| (b) | Total investment return is calculated exclusive of sales charges and assumes the reinvestment of dividends and distributions. For periods of less than one year, total return is not annualized. |
| (c) | In addition to the fees and expenses which the Fund bears directly, it also indirectly bears a pro-rata share of the fees and expenses of the underlying funds in which it invests. Such indirect expenses are not included in the above expense ratios. |
| (d) | The portfolio turnover rate includes variable rate demand notes. |
| (e) | The portfolio turnover rate excludes in-kind transactions. |
The notes to the financial statements are an integral part of, and should be read in conjunction with, the financial statements.
| 56 | MainStay MacKay Tax Free Bond Fund |
Financial Highlights selected per share data and ratios
| | Year Ended October 31, |
| Class B | 2023 | | 2022 | | 2021 | | 2020 | | 2019 |
| Net asset value at beginning of year | $ 8.85 | | $ 10.60 | | $ 10.43 | | $ 10.33 | | $ 9.80 |
| Net investment income (loss) | 0.26(a) | | 0.18(a) | | 0.15(a) | | 0.12 | | 0.27 |
| Net realized and unrealized gain (loss) | (0.04) | | (1.66) | | 0.22 | | 0.23 | | 0.53 |
| Total from investment operations | 0.22 | | (1.48) | | 0.37 | | 0.35 | | 0.80 |
| Less distributions: | | | | | | | | | |
| From net investment income | (0.30) | | (0.24) | | (0.20) | | (0.25) | | (0.27) |
| From net realized gain on investments | — | | (0.03) | | — | | — | | — |
| Total distributions | (0.30) | | (0.27) | | (0.20) | | (0.25) | | (0.27) |
| Net asset value at end of year | $ 8.77 | | $ 8.85 | | $ 10.60 | | $ 10.43 | | $ 10.33 |
| Total investment return (b) | 2.32% | | (14.19)% | | 3.56% | | 3.38% | | 8.28% |
| Ratios (to average net assets)/Supplemental Data: | | | | | | | | | |
| Net investment income (loss) | 2.80% | | 1.80% | | 1.38% | | 1.80% | | 2.71% |
| Net expenses (c) | 1.03% | | 1.02% | | 1.01% | | 1.01% | | 1.02% |
| Portfolio turnover rate (d) | 75%(e) | | 127%(e) | | 39% | | 72% | | 38% |
| Net assets at end of year (in 000’s) | $ 1,920 | | $ 3,959 | | $ 7,006 | | $ 9,286 | | $ 12,354 |
| (a) | Per share data based on average shares outstanding during the year. |
| (b) | Total investment return is calculated exclusive of sales charges and assumes the reinvestment of dividends and distributions. For periods of less than one year, total return is not annualized. |
| (c) | In addition to the fees and expenses which the Fund bears directly, it also indirectly bears a pro-rata share of the fees and expenses of the underlying funds in which it invests. Such indirect expenses are not included in the above expense ratios. |
| (d) | The portfolio turnover rate includes variable rate demand notes. |
| (e) | The portfolio turnover rate excludes in-kind transactions. |
| | Year Ended October 31, |
| Class C | 2023 | | 2022 | | 2021 | | 2020 | | 2019 |
| Net asset value at beginning of year | $ 8.85 | | $ 10.60 | | $ 10.44 | | $ 10.34 | | $ 9.80 |
| Net investment income (loss) | 0.26(a) | | 0.18(a) | | 0.15(a) | | 0.18 | | 0.27 |
| Net realized and unrealized gain (loss) | (0.03) | | (1.66) | | 0.21 | | 0.17 | | 0.54 |
| Total from investment operations | 0.23 | | (1.48) | | 0.36 | | 0.35 | | 0.81 |
| Less distributions: | | | | | | | | | |
| From net investment income | (0.30) | | (0.24) | | (0.20) | | (0.25) | | (0.27) |
| From net realized gain on investments | — | | (0.03) | | — | | — | | — |
| Total distributions | (0.30) | | (0.27) | | (0.20) | | (0.25) | | (0.27) |
| Net asset value at end of year | $ 8.78 | | $ 8.85 | | $ 10.60 | | $ 10.44 | | $ 10.34 |
| Total investment return (b) | 2.44% | | (14.19)% | | 3.46% | | 3.38% | | 8.39% |
| Ratios (to average net assets)/Supplemental Data: | | | | | | | | | |
| Net investment income (loss) | 2.81% | | 1.81% | | 1.37% | | 1.79% | | 2.69% |
| Net expenses (c) | 1.03% | | 1.02% | | 1.01% | | 1.01% | | 1.02% |
| Portfolio turnover rate (d) | 75%(e) | | 127%(e) | | 39% | | 72% | | 38% |
| Net assets at end of year (in 000’s) | $ 103,571 | | $ 125,521 | | $ 194,545 | | $ 220,146 | | $ 225,762 |
| (a) | Per share data based on average shares outstanding during the year. |
| (b) | Total investment return is calculated exclusive of sales charges and assumes the reinvestment of dividends and distributions. For periods of less than one year, total return is not annualized. |
| (c) | In addition to the fees and expenses which the Fund bears directly, it also indirectly bears a pro-rata share of the fees and expenses of the underlying funds in which it invests. Such indirect expenses are not included in the above expense ratios. |
| (d) | The portfolio turnover rate includes variable rate demand notes. |
| (e) | The portfolio turnover rate excludes in-kind transactions. |
The notes to the financial statements are an integral part of, and should be read in conjunction with, the financial statements.
57
Financial Highlights selected per share data and ratios
| | Year Ended October 31, | | August 31, 2020^ through
October 31, |
| Class C2 | 2023 | | 2022 | | 2021 | | 2020 |
| Net asset value at beginning of period | $ 8.85 | | $ 10.60 | | $ 10.43 | | $ 10.52 |
| Net investment income (loss) | 0.25(a) | | 0.17(a) | | 0.12(a) | | 0.03 |
| Net realized and unrealized gain (loss) | (0.05) | | (1.67) | | 0.23 | | (0.09) |
| Total from investment operations | 0.20 | | (1.50) | | 0.35 | | (0.06) |
| Less distributions: | | | | | | | |
| From net investment income | (0.28) | | (0.22) | | (0.18) | | (0.03) |
| From net realized gain on investments | — | | (0.03) | | — | | — |
| Total distributions | (0.28) | | (0.25) | | (0.18) | | (0.03) |
| Net asset value at end of period | $ 8.77 | | $ 8.85 | | $ 10.60 | | $ 10.43 |
| Total investment return (b) | 2.17% | | (14.32)% | | 3.39% | | (0.54)% |
| Ratios (to average net assets)/Supplemental Data: | | | | | | | |
| Net investment income (loss) | 2.67% | | 1.75% | | 1.12% | | 1.02%†† |
| Net expenses (c) | 1.18% | | 1.17% | | 1.15% | | 1.15%†† |
| Portfolio turnover rate (d) | 75%(e) | | 127%(e) | | 39% | | 72% |
| Net assets at end of period (in 000’s) | $ 5,350 | | $ 3,920 | | $ 2,990 | | $ 251 |
| ^ | Inception date. |
| †† | Annualized. |
| (a) | Per share data based on average shares outstanding during the period. |
| (b) | Total investment return is calculated exclusive of sales charges and assumes the reinvestment of dividends and distributions. For periods of less than one year, total return is not annualized. |
| (c) | In addition to the fees and expenses which the Fund bears directly, it also indirectly bears a pro-rata share of the fees and expenses of the underlying funds in which it invests. Such indirect expenses are not included in the above expense ratios. |
| (d) | The portfolio turnover rate includes variable rate demand notes. |
| (e) | The portfolio turnover rate excludes in-kind transactions. |
| | Year Ended October 31, |
| Class I | 2023 | | 2022 | | 2021 | | 2020 | | 2019 |
| Net asset value at beginning of year | $ 8.85 | | $ 10.60 | | $ 10.44 | | $ 10.34 | | $ 9.80 |
| Net investment income (loss) | 0.31(a) | | 0.23(a) | | 0.20(a) | | 0.29 | | 0.32 |
| Net realized and unrealized gain (loss) | (0.03) | | (1.66) | | 0.22 | | 0.11 | | 0.54 |
| Total from investment operations | 0.28 | | (1.43) | | 0.42 | | 0.40 | | 0.86 |
| Less distributions: | | | | | | | | | |
| From net investment income | (0.35) | | (0.29) | | (0.26) | | (0.30) | | (0.32) |
| From net realized gain on investments | — | | (0.03) | | — | | — | | — |
| Total distributions | (0.35) | | (0.32) | | (0.26) | | (0.30) | | (0.32) |
| Net asset value at end of year | $ 8.78 | | $ 8.85 | | $ 10.60 | | $ 10.44 | | $ 10.34 |
| Total investment return (b) | 2.99% | | (13.75)% | | 4.00% | | 3.91% | | 8.93% |
| Ratios (to average net assets)/Supplemental Data: | | | | | | | | | |
| Net investment income (loss) | 3.35% | | 2.33% | | 1.87% | | 2.28% | | 3.14% |
| Net expenses (c) | 0.49% | | 0.50% | | 0.48% | | 0.50% | | 0.52% |
| Portfolio turnover rate (d) | 75%(e) | | 127%(e) | | 39% | | 72% | | 38% |
| Net assets at end of year (in 000’s) | $ 5,868,539 | | $ 4,357,422 | | $ 5,709,408 | | $ 4,430,985 | | $ 2,866,903 |
| (a) | Per share data based on average shares outstanding during the year. |
| (b) | Total investment return is calculated exclusive of sales charges and assumes the reinvestment of dividends and distributions. Class I shares are not subject to sales charges. For periods of less than one year, total return is not annualized. |
| (c) | In addition to the fees and expenses which the Fund bears directly, it also indirectly bears a pro-rata share of the fees and expenses of the underlying funds in which it invests. Such indirect expenses are not included in the above expense ratios. |
| (d) | The portfolio turnover rate includes variable rate demand notes. |
| (e) | The portfolio turnover rate excludes in-kind transactions. |
The notes to the financial statements are an integral part of, and should be read in conjunction with, the financial statements.
| 58 | MainStay MacKay Tax Free Bond Fund |
Financial Highlights selected per share data and ratios
| | Year Ended October 31, | | November 1, 2019^ through
October 31, |
| Class R6 | 2023 | | 2022 | | 2021 | | 2020 |
| Net asset value at beginning of period | $ 8.86 | | $ 10.61 | | $ 10.44 | | $ 10.34 |
| Net investment income (loss) | 0.32(a) | | 0.24(a) | | 0.21(a) | | 0.27 |
| Net realized and unrealized gain (loss) | (0.05) | | (1.66) | | 0.22 | | 0.13 |
| Total from investment operations | 0.27 | | (1.42) | | 0.43 | | 0.40 |
| Less distributions: | | | | | | | |
| From net investment income | (0.35) | | (0.30) | | (0.26) | | (0.30) |
| From net realized gain on investments | — | | (0.03) | | — | | — |
| Total distributions | (0.35) | | (0.33) | | (0.26) | | (0.30) |
| Net asset value at end of period | $ 8.78 | | $ 8.86 | | $ 10.61 | | $ 10.44 |
| Total investment return (b) | 2.93% | | (13.68)% | | 4.15% | | 3.95% |
| Ratios (to average net assets)/Supplemental Data: | | | | | | | |
| Net investment income (loss) | 3.40% | | 2.51% | | 1.92% | | 2.27% |
| Net expenses (c) | 0.43% | | 0.44% | | 0.43% | | 0.44% |
| Portfolio turnover rate (d) | 75%(e) | | 127%(e) | | 39% | | 72% |
| Net assets at end of period (in 000’s) | $ 606,909 | | $ 469,013 | | $ 276,280 | | $ 197,746 |
| ^ | Inception date. |
| (a) | Per share data based on average shares outstanding during the period. |
| (b) | Total investment return is calculated exclusive of sales charges and assumes the reinvestment of dividends and distributions. Class R6 shares are not subject to sales charges. For periods of less than one year, total return is not annualized. |
| (c) | In addition to the fees and expenses which the Fund bears directly, it also indirectly bears a pro-rata share of the fees and expenses of the underlying funds in which it invests. Such indirect expenses are not included in the above expense ratios. |
| (d) | The portfolio turnover rate includes variable rate demand notes. |
| (e) | The portfolio turnover rate excludes in-kind transactions. |
The notes to the financial statements are an integral part of, and should be read in conjunction with, the financial statements.
59
Notes to Financial Statements
Note 1-Organization and Business
The MainStay Funds (the “Trust”) was organized on January 9, 1986, as a Massachusetts business trust. The Trust is registered under the Investment Company Act of 1940, as amended (the “1940 Act”), as an open-end management investment company, and is comprised of eleven funds (collectively referred to as the "Funds"). These financial statements and notes relate to the MainStay MacKay Tax Free Bond Fund (the "Fund"), a “diversified” fund, as that term is defined in the 1940 Act, as interpreted or modified by regulatory authorities having jurisdiction, from time to time.
The following table lists the Fund's share classes that have been registered and commenced operations:
| Class | Commenced Operations |
| Class A | January 3, 1995 |
| Investor Class | February 28, 2008 |
| Class B | May 1, 1986 |
| Class C | September 1, 1998 |
| Class C2 | August 31, 2020 |
| Class I | December 21, 2009 |
| Class R6 | November 1, 2019 |
Class B shares of the MainStay Group of Funds are closed to all new purchases as well as additional investments by existing Class B shareholders. Existing Class B shareholders may continue to reinvest dividends and capital gains distributions, as well as exchange their Class B shares for Class B shares of other funds in the MainStay Group of Funds as permitted by the current exchange privileges. Class B shareholders continue to be subject to any applicable contingent deferred sales charge ("CDSC") at the time of redemption. All other features of the Class B shares, including but not limited to the fees and expenses applicable to Class B shares, remain unchanged. Unless redeemed, Class B shareholders will remain in Class B shares of their respective fund until the Class B shares are converted to Class A or Investor Class shares pursuant to the applicable conversion schedule.
Class A and Investor Class shares are offered at net asset value (“NAV”) per share plus an initial sales charge. No initial sales charge applies to investments of $250,000 or more (and certain other qualified purchases) in Class A and Investor Class shares. However, a CDSC of 1.00% may be imposed on certain redemptions made within 18 months of the date of purchase on shares that were purchased without an initial sales charge. Class C and Class C2 shares are offered at NAV without an initial sales charge, although a 1.00% CDSC may be imposed on certain redemptions of such shares made within one year of the date of purchase of Class C and Class C2 shares. When Class B shares were offered, they were offered at NAV without an initial sales charge, although a CDSC that declines depending on the number of years a shareholder held its Class B shares may be imposed on certain redemptions of such shares made within six years of the date of purchase of such shares. Class I and Class R6 shares are offered at NAV without a sales charge. Depending upon eligibility, Class B shares convert to either Class A or Investor Class
shares at the end of the calendar quarter eight years after the date they were purchased. In addition, depending upon eligibility, Class C and Class C2 shares convert to either Class A or Investor Class shares at the end of the calendar quarter eight years after the date they were purchased. Additionally, Investor Class shares may convert automatically to Class A shares. Under certain circumstances and as may be permitted by the Trust’s multiple class plan pursuant to Rule 18f-3 under the 1940 Act, specified share classes of the Fund may be converted to one or more other share classes of the Fund as disclosed in the capital share transactions within these Notes. The classes of shares have the same voting (except for issues that relate solely to one class), dividend, liquidation and other rights, and the same terms and conditions, except that under distribution plans pursuant to Rule 12b-1 under the 1940 Act, Class B, Class C and Class C2 shares are subject to higher distribution and/or service fees than Class A and Investor Class shares. Class I and Class R6 shares are not subject to a distribution and/or service fee.
The Fund's investment objective is to seek current income exempt from regular federal income tax.
Note 2–Significant Accounting Policies
The Fund is an investment company and accordingly follows the investment company accounting and reporting guidance of the Financial Accounting Standards Board (“FASB”) Accounting Standards Codification Topic 946 Financial Services—Investment Companies. The Fund prepares its financial statements in accordance with generally accepted accounting principles (“GAAP”) in the United States of America and follows the significant accounting policies described below.
(A) Securities Valuation. Investments are usually valued as of the close of regular trading on the New York Stock Exchange (the "Exchange") (usually 4:00 p.m. Eastern time) on each day the Fund is open for business ("valuation date").
Pursuant to Rule 2a-5 under the 1940 Act, the Board of Trustees of the Trust (the "Board") has designated New York Life Investment Management LLC (“New York Life Investments” or the "Manager") as its Valuation Designee (the "Valuation Designee"). The Valuation Designee is responsible for performing fair valuations relating to all investments in the Fund’s portfolio for which market quotations are not readily available; periodically assessing and managing material valuation risks; establishing and applying fair value methodologies; testing fair valuation methodologies; evaluating and overseeing pricing services; ensuring appropriate segregation of valuation and portfolio management functions; providing quarterly, annual and prompt reporting to the Board, as appropriate; identifying potential conflicts of interest; and maintaining appropriate records. The Valuation Designee has established a valuation committee ("Valuation Committee") to assist in carrying out the Valuation Designee’s responsibilities and establish prices of securities for which market quotations are not readily available. The Fund's and the Valuation Designee's policies and procedures ("Valuation Procedures") govern the Valuation Designee’s selection and application of methodologies for determining and calculating the fair value of Fund investments. The
| 60 | MainStay MacKay Tax Free Bond Fund |
Valuation Designee may value the Fund's portfolio securities for which market quotations are not readily available and other Fund assets utilizing inputs from pricing services and other third-party sources. The Valuation Committee meets (in person, via electronic mail or via teleconference) on an ad-hoc basis to determine fair valuations and on a quarterly basis to review fair value events with respect to certain securities for which market quotations are not readily available, including valuation risks and back-testing results, and preview reports to the Board.
The Valuation Committee establishes prices of securities for which market quotations are not readily available based on such methodologies and measurements on a regular basis after considering information that is reasonably available and deemed relevant by the Valuation Committee. The Board shall oversee the Valuation Designee and review fair valuation materials on a prompt, quarterly and annual basis and approve proposed revisions to the Valuation Procedures.
Investments for which market quotations are not readily available are valued at fair value as determined in good faith pursuant to the Valuation Procedures. A market quotation is readily available only when that quotation is a quoted price (unadjusted) in active markets for identical investments that the Fund can access at the measurement date, provided that a quotation will not be readily available if it is not reliable. "Fair value" is defined as the price the Fund would reasonably expect to receive upon selling an asset or liability in an orderly transaction to an independent buyer in the principal or most advantageous market for the asset or liability. Fair value measurements are determined within a framework that establishes a three-tier hierarchy that maximizes the use of observable market data and minimizes the use of unobservable inputs to establish a classification of fair value measurements for disclosure purposes. "Inputs" refer broadly to the assumptions that market participants would use in pricing the asset or liability, including assumptions about risk, such as the risk inherent in a particular valuation technique used to measure fair value using a pricing model and/or the risk inherent in the inputs for the valuation technique. Inputs may be observable or unobservable. Observable inputs reflect the assumptions market participants would use in pricing the asset or liability based on market data obtained from sources independent of the Fund. Unobservable inputs reflect the Fund’s own assumptions about the assumptions market participants would use in pricing the asset or liability based on the information available. The inputs or methodology used for valuing assets or liabilities may not be an indication of the risks associated with investing in those assets or liabilities. The three-tier hierarchy of inputs is summarized below.
| • | Level 1—quoted prices (unadjusted) in active markets for an identical asset or liability |
| • | Level 2—other significant observable inputs (including quoted prices for a similar asset or liability in active markets, interest rates and yield curves, prepayment speeds, credit risk, etc.) |
| • | Level 3—significant unobservable inputs (including the Fund's own assumptions about the assumptions that market participants would use in measuring fair value of an asset or liability) |
The level of an asset or liability within the fair value hierarchy is based on the lowest level of an input, both individually and in the aggregate, that is significant to the fair value measurement. The aggregate value by input level of the Fund’s assets and liabilities as of October 31, 2023, is included at the end of the Portfolio of Investments.
The Fund may use third-party vendor evaluations, whose prices may be derived from one or more of the following standard inputs, among others:
| • Benchmark yields | • Reported trades |
| • Broker/dealer quotes | • Issuer spreads |
| • Two-sided markets | • Benchmark securities |
| • Bids/offers | • Reference data (corporate actions or material event notices) |
| • Industry and economic events | • Comparable bonds |
| • Monthly payment information | |
An asset or liability for which a market quotation is not readily available is valued by methods deemed reasonable in good faith by the Valuation Committee, following the Valuation Procedures to represent fair value. Under these procedures, the Valuation Designee generally uses a market-based approach which may use related or comparable assets or liabilities, recent transactions, market multiples, book values and other relevant information. The Valuation Designee may also use an income-based valuation approach in which the anticipated future cash flows of the asset or liability are discounted to calculate fair value. Discounts may also be applied due to the nature and/or duration of any restrictions on the disposition of the asset or liability. Fair value represents a good faith approximation of the value of a security. Fair value determinations involve the consideration of a number of subjective factors, an analysis of applicable facts and circumstances and the exercise of judgment. As a result, it is possible that the fair value for a security determined in good faith in accordance with the Valuation Procedures may differ from valuations for the same security determined for other funds using their own valuation procedures. Although the Valuation Procedures are designed to value a security at the price the Fund may reasonably expect to receive upon the security's sale in an orderly transaction, there can be no assurance that any fair value determination thereunder would, in fact, approximate the amount that the Fund would actually realize upon the sale of the security or the price at which the security would trade if a reliable market price were readily available. During the year ended October 31, 2023, there were no material changes to the fair value methodologies.
Securities which may be valued in this manner include, but are not limited to: (i) a security for which trading has been halted or suspended or otherwise does not have a readily available market quotation on a given day; (ii) a debt security that has recently gone into default and for which there is not a current market quotation; (iii) a security of an issuer that has entered into a restructuring; (iv) a security that has been delisted from a national exchange; (v) a security subject to trading collars for which no or limited trading takes place; and (vi) a security whose principal market has been temporarily closed at a time when, under normal
Notes to Financial Statements (continued)
conditions, it would be open. Securities valued in this manner are generally categorized as Level 2 or 3 in the hierarchy. No securities held by the Fund as of October 31, 2023, were fair valued in such a manner.
Investments in mutual funds, including money market funds, are valued at their respective NAVs at the close of business each day on the valuation date. These securities are generally categorized as Level 1 in the hierarchy.
Municipal debt securities are valued at the evaluated mean prices supplied by a pricing agent or broker selected by the Valuation Designee, in consultation with the Subadvisor. The evaluations are market-based measurements processed through a pricing application and represents the pricing agent's good faith determination as to what a holder may receive in an orderly transaction under market conditions. The rules-based logic utilizes valuation techniques that reflect participants' assumptions and vary by asset class and per methodology, maximizing the use of relevant observable data including quoted prices for similar assets, benchmark yield curves and market corroborated inputs. The evaluated bid or mean prices are deemed by the Valuation Designee, in consultation with the Subadvisor, to be representative of market values, at the regular close of trading of the Exchange on each valuation date. Municipal debt securities purchased on a delayed delivery basis are marked to market daily until settlement at the forward settlement date. Municipal debt securities are generally categorized as Level 2 in the hierarchy.
Temporary cash investments acquired in excess of 60 days to maturity at the time of purchase are valued using the latest bid prices or using valuations based on a matrix system (which considers such factors as security prices, yields, maturities and ratings), both as furnished by independent pricing services. Temporary cash investments that mature in 60 days or less at the time of purchase ("Short-Term Investments") are valued using the amortized cost method of valuation, unless the use of such method would be inappropriate. The amortized cost method involves valuing a security at its cost on the date of purchase and thereafter assuming a constant amortization to maturity of the difference between such cost and the value on maturity date. Amortized cost approximates the current fair value of a security. Securities valued using the amortized cost method are not valued using quoted prices in an active market and are generally categorized as Level 2 in the hierarchy.
The information above is not intended to reflect an exhaustive list of the methodologies that may be used to value portfolio investments. The Valuation Procedures permit the use of a variety of valuation methodologies in connection with valuing portfolio investments. The methodology used for a specific type of investment may vary based on the market data available or other considerations. The methodologies summarized above may not represent the specific means by which portfolio investments are valued on any particular business day.
(B) Income Taxes. The Fund's policy is to comply with the requirements of the Internal Revenue Code of 1986, as amended (the “Internal Revenue Code”), applicable to regulated investment companies
and to distribute all of its taxable income to the shareholders of the Fund within the allowable time limits.
The Manager evaluates the Fund’s tax positions to determine if the tax positions taken meet the minimum recognition threshold in connection with accounting for uncertainties in income tax positions taken or expected to be taken for the purposes of measuring and recognizing tax liabilities in the financial statements. Recognition of tax benefits of an uncertain tax position is permitted only to the extent the position is “more likely than not” to be sustained assuming examination by taxing authorities. The Manager analyzed the Fund's tax positions taken on federal, state and local income tax returns for all open tax years (for up to three tax years) and has concluded that no provisions for federal, state and local income tax are required in the Fund's financial statements. The Fund's federal, state and local income tax and federal excise tax returns for tax years for which the applicable statutes of limitations have not expired are subject to examination by the Internal Revenue Service and state and local departments of revenue.
(C) Dividends and Distributions to Shareholders. Dividends and distributions are recorded on the ex-dividend date. The Fund intends to declare dividends from net investment income, if any, daily and intends to pay them at least monthly and declares and pays distributions from net realized capital gains, if any, at least annually. Unless a shareholder elects otherwise, all dividends and distributions are reinvested at NAV in the same class of shares of the Fund. Dividends and distributions to shareholders are determined in accordance with federal income tax regulations and may differ from determinations using GAAP.
(D) Security Transactions and Investment Income. The Fund records security transactions on the trade date. Realized gains and losses on security transactions are determined using the identified cost method. Discounts and premiums on securities purchased, other than temporary cash investments that mature in 60 days or less at the time of purchase, for the Fund are accreted and amortized, respectively, on the effective interest rate method.
Investment income and realized and unrealized gains and losses on investments of the Fund are allocated pro rata to the separate classes of shares based upon their relative net assets on the date the income is earned or realized and unrealized gains and losses are incurred.
The Fund may place a debt security on non-accrual status and reduce related interest income by ceasing current accruals and writing off all or a portion of any interest receivables when the collection of all or a portion of such interest has become doubtful. A debt security is removed from non-accrual status when the issuer resumes interest payments or when collectability of interest is reasonably assured.
(E) Expenses. Expenses of the Trust are allocated to the individual Funds in proportion to the net assets of the respective Funds when the expenses are incurred, except where direct allocations of expenses can be made. Expenses (other than transfer agent expenses and fees incurred under the shareholder services plans and/or the distribution plans further discussed in Note 3(B)) are allocated to separate classes of shares pro
| 62 | MainStay MacKay Tax Free Bond Fund |
rata based upon their relative net assets on the date the expenses are incurred. The expenses borne by the Fund, including those of related parties to the Fund, are shown in the Statement of Operations.
Additionally, the Fund may invest in mutual funds, which are subject to management fees and other fees that may cause the costs of investing in mutual funds to be greater than the costs of owning the underlying securities directly. These indirect expenses of mutual funds are not included in the amounts shown as expenses in the Statement of Operations or in the expense ratios included in the Financial Highlights.
(F) Use of Estimates. In preparing financial statements in conformity with GAAP, the Manager makes estimates and assumptions that affect the reported amounts and disclosures in the financial statements. Actual results could differ from those estimates and assumptions.
(G) Futures Contracts. A futures contract is an agreement to purchase or sell a specified quantity of an underlying instrument at a specified future date and price, or to make or receive a cash payment based on the value of a financial instrument (e.g., foreign currency, interest rate, security or securities index). The Fund is subject to risks such as market price risk, leverage risk, liquidity risk, counterparty risk, operational risk, legal risk and/or interest rate risk in the normal course of investing in these contracts. Upon entering into a futures contract, the Fund is required to pledge to the broker or futures commission merchant an amount of cash and/or U.S. government securities equal to a certain percentage of the collateral amount, known as the “initial margin.” During the period the futures contract is open, changes in the value of the contract are recognized as unrealized appreciation or depreciation by marking to market such contract on a daily basis to reflect the market value of the contract at the end of each day’s trading. The Fund agrees to receive from or pay to the broker or futures commission merchant an amount of cash equal to the daily fluctuation in the value of the contract. Such receipts or payments are known as “variation margin.” When the futures contract is closed, the Fund records a realized gain or loss equal to the difference between the proceeds from (or cost of) the closing transaction and the Fund's basis in the contract.
The use of futures contracts involves, to varying degrees, elements of market risk in excess of the amount recognized in the Statement of Assets and Liabilities. The contract or notional amounts and variation margin reflect the extent of the Fund's involvement in open futures positions. There are several risks associated with the use of futures contracts as hedging techniques. There can be no assurance that a liquid market will exist at the time when the Fund seeks to close out a futures contract. If no liquid market exists, the Fund would remain obligated to meet margin requirements until the position is closed. Futures contracts may involve a small initial investment relative to the risk assumed, which could result in losses greater than if the Fund did not invest in futures contracts. Futures contracts may be more volatile than direct investments in the instrument underlying the futures and may not correlate to the underlying instrument, causing a given hedge not to achieve its objectives. The Fund's activities in futures contracts have minimal counterparty risk as they are conducted through regulated exchanges that
guarantee the futures against default by the counterparty. In the event of a bankruptcy or insolvency of a futures commission merchant that holds margin on behalf of the Fund, the Fund may not be entitled to the return of the entire margin owed to the Fund, potentially resulting in a loss. The Fund may invest in futures contracts to seek enhanced returns or to reduce the risk of loss by hedging certain of its holdings. The Fund's investment in futures contracts and other derivatives may increase the volatility of the Fund's NAVs and may result in a loss to the Fund. As of October 31, 2023, the Fund did not hold any open futures contracts.
(H) Delayed Delivery Transactions. The Fund may purchase or sell securities on a delayed delivery basis. These transactions involve a commitment by the Fund to purchase or sell securities for a predetermined price or yield, with payment and delivery taking place beyond the customary settlement period. When delayed delivery purchases are outstanding, the Fund will designate liquid assets in an amount sufficient to meet the purchase price. When purchasing a security on a delayed delivery basis, the Fund assumes the rights and risks of ownership of the security, including the risk of price and yield fluctuations, and takes such fluctuations into account when determining its NAV. The Fund may dispose of or renegotiate a delayed delivery transaction after it is entered into, and may sell delayed delivery securities before they are delivered, which may result in a realized gain or loss. When the Fund has sold a security it owns on a delayed delivery basis, the Fund does not participate in future gains and losses with respect to the security. Delayed delivery transactions as of October 31, 2023, are shown in the Portfolio of Investments.
(I) Municipal Bond Risk. The Fund may invest more heavily in municipal bonds from certain cities, states, territories or regions than others, which may increase the Fund’s exposure to losses resulting from economic, political, regulatory occurrences, or declines in tax revenue impacting these particular cities, states, territories or regions. In addition, many state and municipal governments that issue securities are under significant economic and financial stress and may not be able to satisfy their obligations, and these events may be made worse due to economic challenges posed by COVID-19. The Fund may invest a substantial amount of its assets in municipal bonds whose interest is paid solely from revenues of similar projects, such as tobacco settlement bonds. If the Fund concentrates its investments in this manner, it assumes the legal and economic risks relating to such projects and this may have a significant impact on the Fund’s investment performance.
Certain of the issuers in which the Fund may invest have recently experienced, or may experience, significant financial difficulties and repeated credit rating downgrades. On May 3, 2017, the Commonwealth of Puerto Rico (the "Commonwealth") began proceedings pursuant to the Puerto Rico Oversight, Management, and Economic Stability Act (“PROMESA”) to seek bankruptcy-type protections from approximately $74 billion in debt and approximately $48 billion in unfunded pension obligations. In addition, the current economic environment and the resulting pressure on Puerto Rico’s budget have further contributed to its financial challenges. Following the outbreak of COVID-19, the federal
Notes to Financial Statements (continued)
government passed certain relief packages, including the Coronavirus Aid, Relief, and Economic Security Act and the American Rescue Plan, which included an aggregate of more than $7 billion in disaster relief funds for the U.S. territories, including Puerto Rico. However, there can be no assurances that the federal funds allocated to the Commonwealth will be sufficient to address the long-term economic challenges that arose from COVID-19.
As of October 31, 2023 PREPA has remained in Title III Bankruptcy for over 6 years. A significant number of net revenue bond creditors, the Oversight Board, and the Commonwealth have been unable to reach a consensual resolution on PREPA’s debt restructuring following the termination of the previous 2019 PREPA Restructuring Support Agreement by the Commonwealth of Puerto Rico in March of 2022. On December 16, 2022, the Oversight Board filed a proposed plan of adjustment to restructure more than $10 billion of debt and other claims against PREPA. The plan of adjustment, amended in March, proposed to cut PREPA’s unsustainable debt to approximately $5.68 billion.
Bankruptcy litigation has ensued between the Oversight Board and a group of net revenue bond creditors over the security provisions of PREPA’s $8.3 billion of net revenue bonds resulting in a ruling in March that PREPA’s net revenue bonds are unsecured.
In June of 2023, a claims estimation hearing resulted in a ruling that PREPA’s now asserted unsecured net revenue bond claim was valued at approximately 2.383 billion, which is only 28.3% of the full pre-petition claim asserted by net revenue bond holders. Due to the lower claims estimation ruling, at the end of August 2023 the Oversight Board filed a new proposed plan of adjustment to reflect the March lien ruling and June estimation hearing with lower recovery amounts afforded to net revenue bond holders. In conjunction with the new proposed plan of adjustment, a subset of the original litigating PREPA creditors entered into Planned Support Agreements (”PSAs”) supporting the new proposed plan of adjustment.
However, following the new proposed plan of adjustment, a significant amount of creditors not previously involved in the PREPA bankruptcy have objected to the revised plan of adjustment, including the MainStay MacKay Municipal Bond Funds.
Objecting creditors are appealing several rulings, including the March net revenue bond lien ruling, the June net revenue bond claims estimation ruling, and the November disclosure statement approval ruling that provides for a plan with disparate recoveries for the same creditors. Objecting creditors believe the PREPA bankruptcy plan of adjustment is un-confirmable and these rulings will be overturned on appeal, but there is no certainty that objecting creditors will be successful in appealing these rulings, or if overturned, these creditors will receive the relief sought. The proposed PREPA August plan of adjustment provides 3.5% of cash recovery for objecting creditors to the plan as opposed to 12.5% of cash recovery for consenting creditors who have not previously settled. Bankruptcy plan confirmation hearings are currently scheduled to begin in March of 2024.
The Fund’s vulnerability to potential losses associated with such developments may be reduced through investing in municipal securities that feature credit enhancements (such as bond insurance). The bond insurance provider pays both principal and interest when due to the bond holder. The magnitude of Puerto Rico’s debt restructuring or other adverse economic developments could pose significant strains on the ability of municipal securities insurers to meet all future claims. As of October 31, 2023, the Fund's total Puerto Rico investments is 1.3% of total investments, with 100.0% of that amount insured.
(J) Indemnifications. Under the Trust’s organizational documents, its officers and trustees are indemnified against certain liabilities that may arise out of performance of their duties to the Trust. Additionally, in the normal course of business, the Fund enters into contracts with third-party service providers that contain a variety of representations and warranties and that may provide general indemnifications. The Fund's maximum exposure under these arrangements is unknown, as this would involve future claims that may be made against the Fund that have not yet occurred. The Manager believes that the risk of loss in connection with these potential indemnification obligations is remote. However, there can be no assurance that material liabilities related to such obligations will not arise in the future, which could adversely impact the Fund.
(K) Quantitative Disclosure of Derivative Holdings. The following tables show additional disclosures related to the Fund's derivative and hedging activities, including how such activities are accounted for and their effect on the Fund's financial positions, performance and cash flows.
The Fund entered into futures contracts to help manage the duration and yield curve positioning of the portfolio. These derivatives are not accounted for as hedging instruments.
The effect of derivative instruments on the Statement of Operations for the year ended October 31, 2023:
| Net Realized Gain (Loss) from: | Interest
Rate
Contracts
Risk | Total |
| Futures Transactions | $13,344,679 | $13,344,679 |
| Total Net Realized Gain (Loss) | $13,344,679 | $13,344,679 |
| Net Change in Unrealized Appreciation (Depreciation) | Interest
Rate
Contracts
Risk | Total |
| Futures Contracts | $(31,453,455) | $(31,453,455) |
| Total Net Change in Unrealized Appreciation (Depreciation) | $(31,453,455) | $(31,453,455) |
| 64 | MainStay MacKay Tax Free Bond Fund |
| Average Notional Amount | Total |
| Futures Contracts Short (a) | $(378,273,438) |
| (a) | Positions were open six months during the reporting period. |
Note 3–Fees and Related Party Transactions
(A) Manager and Subadvisor. New York Life Investments, a registered investment adviser and an indirect, wholly-owned subsidiary of New York Life Insurance Company ("New York Life"), serves as the Fund's Manager, pursuant to an Amended and Restated Management Agreement ("Management Agreement"). The Manager provides offices, conducts clerical, recordkeeping and bookkeeping services and keeps most of the financial and accounting records required to be maintained by the Fund. Except for the portion of salaries and expenses that are the responsibility of the Fund, the Manager pays the salaries and expenses of all personnel affiliated with the Fund and certain operational expenses of the Fund. The Fund reimburses New York Life Investments in an amount equal to the portion of the compensation of the Chief Compliance Officer attributable to the Fund. MacKay Shields LLC ("MacKay Shields" or the "Subadvisor"), a registered investment adviser and an indirect, wholly-owned subsidiary of New York Life, serves as the Subadvisor to the Fund and is responsible for the day-to-day portfolio management of the Fund. Pursuant to the terms of an Amended and Restated Subadvisory Agreement ("Subadvisory Agreement") between New York Life Investments and MacKay Shields, New York Life Investments pays for the services of the Subadvisor.
Pursuant to the Management Agreement, the Fund pays the Manager a monthly fee for the services performed and the facilities furnished at an annual rate of the Fund’s average daily net assets as follows: 0.45% up to $500 million; 0.425% from $500 million to $1 billion; 0.40% from $1 billion to $5 billion; 0.39% from $5 billion to $7 billion; 0.38% from $7 billion to $9 billion; and 0.37% in excess of $9 billion, plus a fee for fund accounting services previously provided by New York Life Investments under a separate fund accounting agreement furnished at an annual rate of the Fund’s average daily net assets as follows: 0.05% up to $20 million; 0.0333% from $20 million to $100 million; and 0.01% in excess of $100 million. During the year ended October 31, 2023, the effective management fee rate was 0.41%, inclusive of a fee for fund accounting services of 0.01% of the Fund's average daily net assets.
In addition, New York Life Investments waived fees and/or reimbursed expenses so that Total Annual Fund Operating Expenses (excluding taxes, interest, litigation, extraordinary expenses, brokerage and other transaction expenses relating to the purchase or sale of portfolio investments, and acquired (underlying) fund fees and expenses) for Class R6 shares did not exceed those of Class I.
During the year ended October 31, 2023, New York Life Investments earned fees from the Fund in the amount of $31,862,362 and paid the Subadvisor in the amount of $15,530,172. There were no waived fees and/or reimbursed expenses.
JPMorgan Chase Bank, N.A. ("JPMorgan") provides sub-administration and sub-accounting services to the Fund pursuant to an agreement with New York Life Investments. These services include calculating the daily NAVs of the Fund, maintaining the general ledger and sub-ledger accounts for the calculation of the Fund's NAVs, and assisting New York Life Investments in conducting various aspects of the Fund's administrative operations. For providing these services to the Fund, JPMorgan is compensated by New York Life Investments.
Pursuant to an agreement between the Trust and New York Life Investments, New York Life Investments is responsible for providing or procuring certain regulatory reporting services for the Fund. The Fund will reimburse New York Life Investments for the actual costs incurred by New York Life Investments in connection with providing or procuring these services for the Fund.
(B) Distribution and Service Fees. The Trust, on behalf of the Fund, has entered into a distribution agreement with NYLIFE Distributors LLC (the “Distributor”), an affiliate of New York Life Investments. The Fund has adopted distribution plans (the “Plans”) in accordance with the provisions of Rule 12b-1 under the 1940 Act.
Pursuant to the Class A and Investor Class Plans, the Distributor receives a monthly fee from the Class A and Investor Class shares at an annual rate of 0.25% of the average daily net assets of the Class A and Investor Class shares for distribution and/or service activities as designated by the Distributor. Pursuant to the Class B and Class C Plans, Class B and Class C shares pay the Distributor a monthly distribution fee at an annual rate of 0.25% of the average daily net assets of the Class B and Class C shares along with a service fee at an annual rate of 0.25% of the average daily net assets of the Class B and Class C shares, for a total 12b-1 fee of 0.50%. Pursuant to the Class C2 Plan, Class C2 shares pay the Distributor a monthly distribution fee at an annual rate of 0.40% of the average daily net assets of the Class C2 shares, along with a service fee at an annual rate of 0.25% of the average daily net assets of the Class C2 shares, for a total 12b-1 fee of 0.65%. Class I and Class R6 shares are not subject to a distribution and/or service fee.
The Plans provide that the distribution and service fees are payable to the Distributor regardless of the amounts actually expended by the Distributor for distribution of the Fund's shares and service activities.
(C) Sales Charges. The Fund was advised by the Distributor that the amount of initial sales charges retained on sales of Class A and Investor Class shares during the year ended October 31, 2023, were $19,141 and $324, respectively.
The Fund was also advised that the Distributor retained CDSCs on redemptions of Class A and Class C shares during the year ended October 31, 2023, of $128,945 and $11,953, respectively.
(D) Transfer, Dividend Disbursing and Shareholder Servicing Agent. NYLIM Service Company LLC, an affiliate of New York Life Investments, is the Fund's transfer, dividend disbursing and shareholder servicing agent pursuant to an agreement between NYLIM Service
Notes to Financial Statements (continued)
Company LLC and the Trust. NYLIM Service Company LLC has entered into an agreement with SS&C Global Investor & Distribution Solutions, Inc. ("SS&C"), pursuant to which SS&C performs certain transfer agent services on behalf of NYLIM Service Company LLC. New York Life Investments has contractually agreed to limit the transfer agency expenses charged to the Fund’s share classes to a maximum of 0.35% of that share class’s average daily net assets on an annual basis after deducting any applicable Fund or class-level expense reimbursement or small account fees. This agreement will remain in effect until February 28, 2024, and shall renew automatically for one-year terms unless New York Life Investments provides written notice of termination prior to the start of the next term or upon approval of the Board. During the year ended October 31, 2023, transfer agent expenses incurred by the Fund and any reimbursements, pursuant to the aforementioned Transfer Agency expense limitation agreement, were as follows:
| Class | Expense | Waived |
| Class A | $ 783,589 | $— |
| Investor Class | 6,496 | — |
| Class B | 2,651 | — |
| Class C | 116,193 | — |
| Class C2 | 4,998 | — |
| Class I | 3,428,918 | — |
| Class R6 | 19,463 | — |
(E) Small Account Fee. Shareholders with small accounts adversely impact the cost of providing transfer agency services. In an effort to reduce total transfer agency expenses, the Fund has implemented a small account fee on certain types of accounts. As described in the Fund's prospectus, certain shareholders with an account balance of less than $1,000 ($5,000 for Class A share accounts) are charged an annual per account fee of $20 (assessed semi-annually), the proceeds from which offset transfer agent fees as reflected in the Statement of Operations. This small account fee will not apply to certain types of accounts as described further in the Fund’s prospectus.
(F) Capital. As of October 31, 2023, New York Life and its affiliates beneficially held shares of the Fund with the values and percentages of net assets as follows:
| Class C2 | $22,439 | 0.4% |
| Class R6 | 23,963 | 0.0‡ |
| ‡ | Less than one-tenth of a percent. |
Note 4-Federal Income Tax
As of October 31, 2023, the cost and unrealized appreciation (depreciation) of the Fund’s investment portfolio, including applicable derivative contracts and other financial instruments, as determined on a federal income tax basis, were as follows:
| | Federal Tax
Cost | Gross
Unrealized
Appreciation | Gross
Unrealized
(Depreciation) | Net
Unrealized
Appreciation/
(Depreciation) |
| Investments in Securities | $8,187,698,346 | $4,783,984 | $(361,512,822) | $(356,728,838) |
As of October 31, 2023, the components of accumulated gain (loss) on a tax basis were as follows:
Ordinary
Income | Undistributed
Tax Exempt
Income | Accumulated
Capital
and Other
Gain (Loss) | Other
Temporary
Differences | Unrealized
Appreciation
(Depreciation) | Total
Accumulated
Gain (Loss) |
| $— | $7,177,506 | $(948,435,411) | $(7,918,284) | $(356,728,838) | $(1,305,905,027) |
The difference between book-basis and tax-basis unrealized appreciation (depreciation) is primarily due to cumulative bond amortization and wash sales adjustments.
The following table discloses the current year reclassifications between total distributable earnings (loss) and additional paid-in capital arising from permanent differences; net assets as of October 31, 2023 were not affected.
| | Total
Distributable
Earnings (Loss) | Additional
Paid-In
Capital |
| | $(788,844) | $788,844 |
The reclassifications for the Fund are primarily due to redemption in-kind adjustments.
As of October 31, 2023, for federal income tax purposes, capital loss carryforwards of $948,435,411, as shown in the table below, were available to the extent provided by the regulations to offset future realized gains of the Fund. Accordingly, no capital gains distributions are expected to be paid to shareholders until net gains have been realized in excess of such amounts.
Capital Loss
Available Through | Short-Term
Capital Loss
Amounts (000’s) | Long-Term
Capital Loss
Amounts (000’s) |
| Unlimited | $565,664 | $382,771 |
| 66 | MainStay MacKay Tax Free Bond Fund |
During the years ended October 31, 2023 and October 31, 2022, the tax character of distributions paid as reflected in the Statements of Changes in Net Assets was as follows:
| | 2023 | 2022 |
| Distributions paid from: | | |
| Ordinary Income | $ 6,696,558 | $ 3,636,127 |
| Long-Term Capital Gains | — | 26,911,851 |
| Exempt Interest Dividends | 278,942,048 | 221,977,149 |
| Total | $285,638,606 | $252,525,127 |
Note 5–Custodian
JPMorgan is the custodian of cash and securities held by the Fund. Custodial fees are charged to the Fund based on the Fund's net assets and/or the market value of securities held by the Fund and the number of certain transactions incurred by the Fund.
Note 6–Line of Credit
The Fund and certain other funds managed by New York Life Investments maintain a line of credit with a syndicate of banks in order to secure a source of funds for temporary purposes to meet unanticipated or excessive redemption requests.
Effective July 25, 2023, under the credit agreement (the “Credit Agreement”), the aggregate commitment amount is $600,000,000 with an additional uncommitted amount of $100,000,000. The commitment fee is an annual rate of 0.15% of the average commitment amount payable quarterly, regardless of usage, to JPMorgan, who serves as the agent to the syndicate. The commitment fee is allocated among the Fund and certain other funds managed by New York Life Investments based upon their respective net assets and other factors. Interest on any revolving credit loan is charged based upon the Federal Funds Rate, Daily Simple Secured Overnight Financing Rate ("SOFR") + 0.10%, or the Overnight Bank Funding Rate, whichever is higher. The Credit Agreement expires on July 23, 2024, although the Fund, certain other funds managed by New York Life Investments and the syndicate of banks may renew the Credit Agreement for an additional year on the same or different terms or enter into a credit agreement with a different syndicate of banks. Prior to July 25, 2023, the aggregate commitment amount and the commitment fee were the same as those under the current Credit Agreement. During the year ended October 31, 2023, there were no borrowings made or outstanding with respect to the Fund under the Credit Agreement.
Note 7–Interfund Lending Program
Pursuant to an exemptive order issued by the SEC, the Fund, along with certain other funds managed by New York Life Investments, may participate in an interfund lending program. The interfund lending program provides an alternative credit facility that permits the Fund and certain other funds managed by New York Life Investments to lend or borrow money for temporary purposes directly to or from one another,
subject to the conditions of the exemptive order. During the year ended October 31, 2023, there were no interfund loans made or outstanding with respect to the Fund.
Note 8–Purchases and Sales of Securities (in 000’s)
During the year ended October 31, 2023, purchases and sales of securities, other than short-term securities and in-kind transactions, were $7,386,268 and $5,670,612, respectively.
Note 9–Capital Share Transactions
Transactions in capital shares for the years ended October 31, 2023 and October 31, 2022, were as follows:
| Class A | Shares | Amount |
| Year ended October 31, 2023: | | |
| Shares sold | 47,760,222 | $ 442,488,108 |
| Shares issued to shareholders in reinvestment of distributions | 4,007,599 | 37,098,862 |
| Shares redeemed | (50,435,605) | (465,236,589) |
| Shares redeemed in connection with in-kind transactions | (39,952,689) | (373,829,325) |
| Net increase (decrease) in shares outstanding before conversion | (38,620,473) | (359,478,944) |
| Shares converted into Class A (See Note 1) | 321,509 | 3,003,490 |
| Shares converted from Class A (See Note 1) | (311,175) | (2,883,763) |
| Net increase (decrease) | (38,610,139) | $ (359,359,217) |
| Year ended October 31, 2022: | | |
| Shares sold | 130,380,923 | $ 1,314,002,747 |
| Shares issued to shareholders in reinvestment of distributions | 5,421,368 | 53,611,172 |
| Shares redeemed | (167,369,579) | (1,665,629,660) |
| Shares redeemed in connection with in-kind transactions | (88,883,335) | (930,537,398) |
| Net increase (decrease) in shares outstanding before conversion | (120,450,623) | (1,228,553,139) |
| Shares converted into Class A (See Note 1) | 452,466 | 4,319,856 |
| Shares converted from Class A (See Note 1) | (241,624) | (2,235,525) |
| Net increase (decrease) | (120,239,781) | $(1,226,468,808) |
| |
Notes to Financial Statements (continued)
| Investor Class | Shares | Amount |
| Year ended October 31, 2023: | | |
| Shares sold | 21,923 | $ 205,436 |
| Shares issued to shareholders in reinvestment of distributions | 23,957 | 222,827 |
| Shares redeemed | (85,065) | (791,986) |
| Net increase (decrease) in shares outstanding before conversion | (39,185) | (363,723) |
| Shares converted into Investor Class (See Note 1) | 34,707 | 322,690 |
| Shares converted from Investor Class (See Note 1) | (31,523) | (294,482) |
| Net increase (decrease) | (36,001) | $ (335,515) |
| Year ended October 31, 2022: | | |
| Shares sold | 47,829 | $ 477,956 |
| Shares issued to shareholders in reinvestment of distributions | 22,092 | 217,249 |
| Shares redeemed | (131,140) | (1,340,625) |
| Net increase (decrease) in shares outstanding before conversion | (61,219) | (645,420) |
| Shares converted into Investor Class (See Note 1) | 15,813 | 157,272 |
| Shares converted from Investor Class (See Note 1) | (57,552) | (572,273) |
| Net increase (decrease) | (102,958) | $ (1,060,421) |
| |
| Class B | Shares | Amount |
| Year ended October 31, 2023: | | |
| Shares sold | 10,162 | $ 92,414 |
| Shares issued to shareholders in reinvestment of distributions | 9,094 | 84,378 |
| Shares redeemed | (225,573) | (2,110,439) |
| Net increase (decrease) in shares outstanding before conversion | (206,317) | (1,933,647) |
| Shares converted from Class B (See Note 1) | (22,298) | (206,802) |
| Net increase (decrease) | (228,615) | $ (2,140,449) |
| Year ended October 31, 2022: | | |
| Shares sold | 4,936 | $ 47,640 |
| Shares issued to shareholders in reinvestment of distributions | 14,760 | 145,103 |
| Shares redeemed | (209,782) | (2,027,969) |
| Net increase (decrease) in shares outstanding before conversion | (190,086) | (1,835,226) |
| Shares converted from Class B (See Note 1) | (23,583) | (229,631) |
| Net increase (decrease) | (213,669) | $ (2,064,857) |
| |
| Class C | Shares | Amount |
| Year ended October 31, 2023: | | |
| Shares sold | 2,263,361 | $ 21,043,323 |
| Shares issued to shareholders in reinvestment of distributions | 335,827 | 3,111,757 |
| Shares redeemed | (4,817,895) | (44,653,513) |
| Net increase (decrease) in shares outstanding before conversion | (2,218,707) | (20,498,433) |
| Shares converted from Class C (See Note 1) | (158,785) | (1,474,192) |
| Net increase (decrease) | (2,377,492) | $ (21,972,625) |
| Year ended October 31, 2022: | | |
| Shares sold | 2,218,065 | $ 21,391,995 |
| Shares issued to shareholders in reinvestment of distributions | 352,474 | 3,461,431 |
| Shares redeemed | (6,602,650) | (64,058,583) |
| Net increase (decrease) in shares outstanding before conversion | (4,032,111) | (39,205,157) |
| Shares converted from Class C (See Note 1) | (136,858) | (1,334,457) |
| Net increase (decrease) | (4,168,969) | $ (40,539,614) |
| |
| Class C2 | Shares | Amount |
| Year ended October 31, 2023: | | |
| Shares sold | 382,509 | $ 3,563,900 |
| Shares issued to shareholders in reinvestment of distributions | 17,308 | 160,027 |
| Shares redeemed | (232,963) | (2,161,230) |
| Net increase (decrease) | 166,854 | $ 1,562,697 |
| Year ended October 31, 2022: | | |
| Shares sold | 226,213 | $ 2,213,594 |
| Shares issued to shareholders in reinvestment of distributions | 9,314 | 90,208 |
| Shares redeemed | (74,555) | (706,592) |
| Net increase (decrease) | 160,972 | $ 1,597,210 |
| |
| 68 | MainStay MacKay Tax Free Bond Fund |
| Class I | Shares | Amount |
| Year ended October 31, 2023: | | |
| Shares sold | 463,833,414 | $ 4,298,291,795 |
| Shares issued to shareholders in reinvestment of distributions | 17,389,207 | 160,931,629 |
| Shares redeemed | (304,933,040) | (2,803,075,906) |
| Net increase (decrease) in shares outstanding before conversion | 176,289,581 | 1,656,147,518 |
| Shares converted into Class I (See Note 1) | 328,304 | 3,044,015 |
| Shares converted from Class I (See Note 1) | (136,968) | (1,281,488) |
| Net increase (decrease) | 176,480,917 | $ 1,657,910,045 |
| Year ended October 31, 2022: | | |
| Shares sold | 355,933,328 | $ 3,455,802,105 |
| Shares issued to shareholders in reinvestment of distributions | 12,832,922 | 125,526,725 |
| Shares redeemed | (385,037,502) | (3,678,587,460) |
| Net increase (decrease) in shares outstanding before conversion | (16,271,252) | (97,258,630) |
| Shares converted into Class I (See Note 1) | 277,634 | 2,599,530 |
| Shares converted from Class I (See Note 1) | (30,259,512) | (303,254,838) |
| Net increase (decrease) | (46,253,130) | $ (397,913,938) |
| |
| Class R6 | Shares | Amount |
| Year ended October 31, 2023: | | |
| Shares sold | 77,829,474 | $ 707,596,489 |
| Shares issued to shareholders in reinvestment of distributions | 157,438 | 1,457,435 |
| Shares redeemed | (61,792,901) | (562,883,444) |
| Net increase (decrease) in shares outstanding before conversion | 16,194,011 | 146,170,480 |
| Shares converted into Class R6 (See Note 1) | 116,991 | 1,096,842 |
| Shares converted from Class R6 (See Note 1) | (140,796) | (1,326,310) |
| Net increase (decrease) | 16,170,206 | $ 145,941,012 |
| Year ended October 31, 2022: | | |
| Shares sold | 133,667,628 | $ 1,290,515,213 |
| Shares issued to shareholders in reinvestment of distributions | 52,050 | 496,182 |
| Shares redeemed | (136,777,292) | (1,302,976,762) |
| Net increase (decrease) in shares outstanding before conversion | (3,057,614) | (11,965,367) |
| Shares converted into Class R6 (See Note 1) | 30,237,243 | 303,054,035 |
| Shares converted from Class R6 (See Note 1) | (263,796) | (2,503,969) |
| Net increase (decrease) | 26,915,833 | $ 288,584,699 |
Note 10–Other Matters
As of the date of this report, the Fund faces a heightened level of risk associated with current uncertainty, volatility and state of economies, financial markets, rising interest rates, and labor and health conditions around the world. Events such as war, acts of terrorism, recessions, rapid inflation, the imposition of international sanctions, earthquakes, hurricanes, epidemics and pandemics and other unforeseen natural or human disasters may have broad adverse social, political and economic effects on the global economy, which could negatively impact the value of the Fund's investments. Developments that disrupt global economies and financial markets may magnify factors that affect the Fund's performance.
Note 11–Subsequent Events
In connection with the preparation of the financial statements of the Fund as of and for the year ended October 31, 2023, events and transactions subsequent to October 31, 2023, through the date the financial statements were issued have been evaluated by the Manager for possible adjustment and/or disclosure. No subsequent events requiring financial statement adjustment or disclosure have been identified, other than the following:
At a meeting held on December 6-7, 2023, the Board approved an additional breakpoint in the management fee of 0.01% at $11 billion. Effective February 28, 2024, the Fund will pay the Manager a monthly fee for the services performed and the facilities furnished at an annual rate of the Fund’s average daily net assets as follows: 0.45% up to $500 million; 0.425% from $500 million to $1 billion; 0.40% from $1 billion to $5 billion; 0.39% from $5 billion to $7 billion; 0.38% from $7 billion to $9 billion; 0.37% from $9 billion to $11 billion; and 0.36% in excess of $11 billion.
Report of Independent Registered Public Accounting Firm
To the Shareholders of the Fund and Board of Trustees
The MainStay Funds:
Opinion on the Financial Statements
We have audited the accompanying statement of assets and liabilities of MainStay MacKay Tax Free Bond Fund (the Fund), one of the funds constituting The MainStay Funds, including the portfolio of investments, as of October 31, 2023, the related statement of operations for the year then ended, the statements of changes in net assets for each of the years in the two-year period then ended, and the related notes (collectively, the financial statements) and the financial highlights for each of the years or periods in the five-year period then ended. In our opinion, the financial statements and financial highlights present fairly, in all material respects, the financial position of the Fund as of October 31, 2023, the results of its operations for the year then ended, the changes in its net assets for each of the years in the two-year period then ended, and the financial highlights for each of the years or periods in the five-year period then ended, in conformity with U.S. generally accepted accounting principles.
Basis for Opinion
These financial statements and financial highlights are the responsibility of the Fund's management. Our responsibility is to express an opinion on these financial statements and financial highlights based on our audits. We are a public accounting firm registered with the Public Company Accounting Oversight Board (United States) (PCAOB) and are required to be independent with respect to the Fund in accordance with the U.S. federal securities laws and the applicable rules and regulations of the Securities and Exchange Commission and the PCAOB.
We conducted our audits in accordance with the standards of the PCAOB. Those standards require that we plan and perform the audit to obtain reasonable assurance about whether the financial statements and financial highlights are free of material misstatement, whether due to error or fraud. Our audits included performing procedures to assess the risks of material misstatement of the financial statements and financial highlights, whether due to error or fraud, and performing procedures that respond to those risks. Such procedures included examining, on a test basis, evidence regarding the amounts and disclosures in the financial statements and financial highlights. Such procedures also included confirmation of securities owned as of October 31, 2023, by correspondence with the custodians and brokers; when replies were not received from brokers, we performed other auditing procedures. Our audits also included evaluating the accounting principles used and significant estimates made by management, as well as evaluating the overall presentation of the financial statements and financial highlights. We believe that our audits provide a reasonable basis for our opinion.

We have served as the auditor of one or more New York Life Investment Management investment companies since 2003.
Philadelphia, Pennsylvania
December 22, 2023
| 70 | MainStay MacKay Tax Free Bond Fund |
Federal Income Tax Information
(Unaudited)
The Fund is required under the Internal Revenue Code to advise shareholders in a written statement as to the federal tax status of dividends paid by the Fund during such fiscal years.
For Federal individual income tax purposes, the Fund designated 97.7% of the ordinary income dividends paid during its fiscal year ended October 31, 2023 as attributable to interest income from Tax Exempt Municipal Bonds. Such dividends are currently exempt from Federal income taxes under Section 103(a) of the Internal Revenue Code.
In February 2024, shareholders will receive an IRS Form 1099-DIV or substitute Form 1099, which will show the federal tax status of the distributions received by shareholders in calendar year 2023. The amounts that will be reported on such 1099-DIV or substitute Form 1099 will be the amounts you are to use on your federal income tax return and will differ from the amounts which we must report for the Fund's fiscal year ended October 31, 2023.
Proxy Voting Policies and Procedures and Proxy Voting Record
The Fund is required to file with the SEC its proxy voting record for the 12-month period ending June 30 on Form N-PX. A description of the policies and procedures that are used to vote proxies relating to portfolio securities of the Fund is available free of charge upon request by calling 800-624-6782 or visiting the SEC’s website at www.sec.gov. The most recent Form N-PX or proxy voting record is available free of charge upon request by calling 800-624-6782; visiting newyorklifeinvestments.com; or visiting the SEC’s website at www.sec.gov.
Shareholder Reports and Quarterly Portfolio Disclosure
The Fund is required to file its complete schedule of portfolio holdings with the SEC 60 days after its first and third fiscal quarter on Form N-PORT. The Fund's holdings report is available free of charge upon request by calling New York Life Investments at 800-624-6782.
Board of Trustees and Officers (Unaudited)
The Trustees and officers of the Fund are listed below. The Board oversees the MainStay Group of Funds (which consists of MainStay Funds and MainStay Funds Trust), MainStay VP Funds Trust, MainStay MacKay DefinedTerm Municipal Opportunities Fund, MainStay CBRE Global Infrastructure Megatrends Term Fund, the Manager and the Subadvisors, and elects the officers of the Funds who are responsible for the day-to-day operations of the Fund. Information pertaining to the Trustees and officers is set forth below. Each Trustee serves until his or her successor is elected and qualified or until his or her resignation, death or
removal. Under the Board’s retirement policy, unless an exception is made, a Trustee must tender his or her resignation by the end of the calendar year during which he or she reaches the age of 75. Officers are elected annually by the Board. The business address of each Trustee and officer listed below is 51 Madison Avenue, New York, New York 10010. A majority of the Trustees are not “interested persons” (as defined by the 1940 Act and rules adopted by the SEC thereunder) of the Fund (“Independent Trustees”).
| | Name and
Year of Birth | Term of Office,
Position(s) Held and
Length of Service | Principal Occupation(s)
During Past Five Years | Number of
Portfolios in
Fund Complex
Overseen by
Trustee | Other Directorships
Held by Trustee |
| | | | | | |
| | Naïm Abou-Jaoudé*
1966 | MainStay Funds: Trustee
since 2023
MainStay Funds Trust:
Trustee since 2023 | Chief Executive Officer of New York Life Investment Management LLC (since 2023). Chief Executive Officer of Candriam (an affiliate of New York Life Investment Management LLC) (2007 to 2023). | 81 | MainStay VP Funds Trust:
Trustee since 2023 (31 portfolios);
MainStay MacKay DefinedTerm Municipal Opportunities Fund: Trustee
since 2023;
MainStay CBRE Global Infrastructure Megatrends Term Fund: Trustee
since 2023; and
New York Life Investment Management International (Chair) since 2015 |
| * | This Trustee is considered to be an “interested person” of the MainStay Group of Funds, MainStay VP Funds Trust, MainStay CBRE Global Infrastructure Megatrends Term Fund and MainStay MacKay DefinedTerm Municipal Opportunities Fund, within the meaning of the 1940 Act because of his affiliation with New York Life Investment Management LLC and Candriam, as described in detail above in the column entitled “Principal Occupation(s) During Past Five Years.” |
| | |
| 72 | MainStay MacKay Tax Free Bond Fund |
| | Name and
Year of Birth | Term of Office,
Position(s) Held and
Length of Service | Principal Occupation(s)
During Past Five Years | Number of
Portfolios in
Fund Complex
Overseen by
Trustee | Other Directorships
Held by Trustee |
| | | | | | |
| | David H. Chow
1957 | MainStay Funds: Trustee since January 2016, Advisory Board Member (June 2015 to December 2015);MainStay Funds Trust:
Trustee since January 2016, Advisory Board Member (June 2015 to December 2015) | Founder and CEO, DanCourt Management, LLC (since 1999) | 81 | MainStay VP Funds Trust: Trustee since January 2016, Advisory Board Member (June 2015 to December 2015) (31 portfolios);
MainStay MacKay DefinedTerm Municipal Opportunities Fund: Trustee since January 2016, Advisory Board Member (June 2015 to December 2015);
MainStay CBRE Global Infrastructure Megatrends Term Fund: Trustee since 2021;
VanEck Vectors Group of Exchange-Traded Funds: Trustee since 2006 and Independent Chairman of the Board of Trustees from 2008 to 2022 (57 portfolios); and
Berea College of Kentucky: Trustee since 2009, Chair of the Investment Committee since 2018 |
| | Karen Hammond
1956 | MainStay Funds: Trustee since December 2021, Advisory Board Member (June 2021 to December 2021);MainStay Funds Trust:
Trustee since December 2021, Advisory Board Member (June 2021 to December 2021)
| Retired, Managing Director, Devonshire Investors (2007 to 2013); Senior Vice President, Fidelity Management & Research Co. (2005 to 2007); Senior Vice President and Corporate Treasurer, FMR Corp. (2003 to 2005); Chief Operating Officer, Fidelity Investments Japan (2001 to 2003) | 81 | MainStay VP Funds Trust: Trustee since December 2021, Advisory Board Member (June 2021 to December 2021) (31 portfolios);
MainStay MacKay DefinedTerm Municipal Opportunities Fund: Trustee since December 2021, Advisory Board Member (June 2021 to December 2021);
MainStay CBRE Global Infrastructure Megatrends Term Fund: Trustee since December 2021, Advisory Board Member (June 2021 to December 2021);
Two Harbors Investment Corp.: Director since 2018;
Rhode Island State Investment Commission: Member since 2017; and
Blue Cross Blue Shield of Rhode Island: Director since 2019 |
| | Susan B. Kerley
1951 | MainStay Funds: Chair since January 2017 and Trustee since 2007;MainStay Funds Trust:
Chair since January 2017 and Trustee since 1990*** | President, Strategic Management Advisors LLC (since 1990) | 81 | MainStay VP Funds Trust: Chair since January 2017 and Trustee since 2007 (31 portfolios)**;
MainStay MacKay DefinedTerm Municipal Opportunities Fund: Chair since January 2017 and Trustee since 2011;
MainStay CBRE Global Infrastructure Megatrends Term Fund: Trustee since June 2021; and
Legg Mason Partners Funds: Trustee since 1991 (45 portfolios) |
Board of Trustees and Officers (Unaudited) (continued)
| | Name and
Year of Birth | Term of Office,
Position(s) Held and
Length of Service | Principal Occupation(s)
During Past Five Years | Number of
Portfolios in
Fund Complex
Overseen by
Trustee | Other Directorships
Held by Trustee |
| | | | | | |
| | Alan R. Latshaw
1951 | MainStay Funds: Trusteesince 2006;MainStay Funds Trust:
Trustee since 2007*** | Retired; Partner, Ernst & Young LLP (2002 to 2003); Partner, Arthur Andersen LLP (1989 to 2002); Consultant to the MainStay Funds Audit and Compliance Committee (2004 to 2006) | 81 | MainStay VP Funds Trust: Trustee since 2007 (31 portfolios)**;
MainStay MacKay DefinedTerm Municipal Opportunities Fund: Trustee since 2011; and
MainStay CBRE Global Infrastructure Megatrends Term Fund: Trustee since June 2021 |
| | Jacques P. Perold
1958 | MainStay Funds: Trustee since January 2016, Advisory Board Member (June 2015to December 2015);MainStay Funds Trust:
Trustee since January 2016, Advisory Board Member (June 2015 to December 2015) | Founder and Chief Executive Officer, CapShift Advisors LLC (since 2018); President, Fidelity Management & Research Company (2009 to 2014); President and Chief Investment Officer, Geode Capital Management, LLC (2001 to 2009) | 81 | MainStay VP Funds Trust: Trustee since January 2016, Advisory Board Member (June 2015 to December 2015) (31 portfolios);
MainStay MacKay DefinedTerm Municipal Opportunities Fund: Trustee since January 2016, Advisory Board Member (June 2015 to December 2015);
MainStay CBRE Global Infrastructure Megatrends Term Fund: Trustee since June 2021;
Allstate Corporation: Director since 2015; and
MSCI Inc.: Director since 2017 |
| | Richard S. Trutanic
1952 | MainStay Funds: Trustee since 1994;MainStay Funds Trust:
Trustee since 2007*** | Chairman and Chief Executive Officer, Somerset & Company (financial advisory firm) (since 2004); Managing Director, The Carlyle Group (private investment firm) (2002 to 2004); Senior Managing Director, Partner and Board Member, Groupe Arnault S.A. (private investment firm) (1999 to 2002) | 81 | MainStay VP Funds Trust: Trustee since 2007 (31 portfolios)**;
MainStay MacKay DefinedTerm Municipal Opportunities Fund: Trustee since 2011; and
MainStay CBRE Global Infrastructure Megatrends Term Fund: Trustee since June 2021 |
| ** | Includes prior service as a Director of MainStay VP Series Fund, Inc., the predecessor to MainStay VP Funds Trust. |
| *** | Includes prior service as a Director/Trustee of certain predecessor entities to MainStay Funds Trust. |
| 74 | MainStay MacKay Tax Free Bond Fund |
| | Name and
Year of Birth | Position(s) Held and
Length of Service | Principal Occupation(s)
During Past Five Years | |
| | | | | |
| | Kirk C. Lehneis
1974 | President, MainStay Funds, MainStay Funds Trust (since 2017) | Chief Operating Officer and Senior Managing Director (since 2016), New York Life Investment Management LLC and New York Life Investment Management Holdings LLC; Member of the Board of Managers (since 2017) and Senior Managing Director (since 2018), NYLIFE Distributors LLC; Chairman of the Board and Senior Managing Director, NYLIM Service Company LLC (since 2017); Trustee, President and Principal Executive Officer of IndexIQ Trust, IndexIQ ETF Trust and IndexIQ Active ETF Trust (since 2018); President, MainStay CBRE Global Infrastructure Megatrends Term Fund (since 2021), MainStay MacKay DefinedTerm Municipal Opportunities Fund and MainStay VP Funds Trust (since 2017)**; Senior Managing Director, Global Product Development (2015 to 2016); Managing Director, Product Development (2010 to 2015), New York Life Investment Management LLC | |
| | Jack R. Benintende
1964 | Treasurer and Principal Financial and Accounting Officer, MainStay Funds (since 2007), MainStay Funds Trust (since 2009) | Managing Director, New York Life Investment Management LLC (since 2007); Treasurer and Principal Financial and Accounting Officer, MainStay CBRE Global Infrastructure Megatrends Term Fund (since 2021), MainStay MacKay DefinedTerm Municipal Opportunities Fund (since 2011) and MainStay VP Funds Trust (since 2007)**; and Assistant Treasurer, New York Life Investment Management Holdings LLC (2008 to 2012) | |
| | J. Kevin Gao
1967 | Secretary and Chief Legal Officer, MainStay Funds and MainStay Funds Trust (since 2010) | Managing Director and Associate General Counsel, New York Life Investment Management LLC (since 2010); Secretary and Chief Legal Officer, MainStay CBRE Global Infrastructure Megatrends Term Fund (since 2021), MainStay MacKay DefinedTerm Municipal Opportunities Fund (since 2011) and MainStay VP Funds Trust (since 2010)** | |
| | Kevin M. Gleason
1967 | Vice President and Chief Compliance Officer, MainStay Funds and MainStay Funds Trust (since June 2022) | Vice President and Chief Compliance Officer, IndexIQ Trust, IndexIQ ETF Trust and Index IQ Active ETF Trust (since June 2022); Vice President and Chief Compliance Officer, MainStay CBRE Global Infrastructure Megatrends Term Fund, MainStay VP Funds Trust and MainStay MacKay DefinedTerm Municipal Opportunities Fund (since June 2022); Senior Vice President, Voya Investment Management and Chief Compliance Officer, Voya Family of Funds (2012 to 2022) | |
| | Scott T. Harrington
1959 | Vice President— Administration, MainStay Funds (since 2005), MainStay Funds Trust (since 2009) | Managing Director, New York Life Investment Management LLC (including predecessor advisory organizations) (since 2000); Member of the Board of Directors, New York Life Trust Company (since 2009); Vice President—Administration, MainStay CBRE Global Infrastructure Megatrends Term Fund (since 2021), MainStay MacKay DefinedTerm Municipal Opportunities Fund (since 2011) and MainStay VP Funds Trust (since 2005)** | |
| * | The officers listed above are considered to be “interested persons” of the MainStay Group of Funds, MainStay VP Funds Trust, MainStay CBRE Global Infrastructure Megatrends Term Fund and MainStay MacKay DefinedTerm Municipal Opportunities Fund within the meaning of the 1940 Act because of their affiliation with the MainStay Group of Funds, New York Life Insurance Company and/or its affiliates, including New York Life Investment Management LLC, New York Life Insurance Company, NYLIM Service Company LLC, NYLIFE Securities LLC and/or NYLIFE Distributors LLC, as described in detail in the column captioned “Principal Occupation(s) During Past Five Years.” Officers are elected annually by the Board. |
| ** | Includes prior service as an Officer of MainStay VP Series Fund, Inc., the predecessor to MainStay VP Funds Trust. |
Officers of the Trust (Who are not Trustees)*
This page intentionally left blank.
This page intentionally left blank.
This page intentionally left blank.
Equity
U.S. Equity
MainStay Epoch U.S. Equity Yield Fund
MainStay Fiera SMID Growth Fund
MainStay PineStone U.S. Equity Fund
MainStay S&P 500 Index Fund
MainStay Winslow Large Cap Growth Fund
MainStay WMC Enduring Capital Fund
MainStay WMC Growth Fund
MainStay WMC Small Companies Fund
MainStay WMC Value Fund
International Equity
MainStay Epoch International Choice Fund
MainStay PineStone International Equity Fund
MainStay WMC International Research Equity Fund
Emerging Markets Equity
MainStay Candriam Emerging Markets Equity Fund
Global Equity
MainStay Epoch Capital Growth Fund
MainStay Epoch Global Equity Yield Fund
MainStay PineStone Global Equity Fund
Fixed Income
Taxable Income
MainStay Candriam Emerging Markets Debt Fund
MainStay Floating Rate Fund
MainStay MacKay High Yield Corporate Bond Fund
MainStay MacKay Short Duration High Yield Fund
MainStay MacKay Strategic Bond Fund
MainStay MacKay Total Return Bond Fund
MainStay MacKay U.S. Infrastructure Bond Fund
MainStay Short Term Bond Fund
Tax-Exempt Income
MainStay MacKay California Tax Free Opportunities Fund1
MainStay MacKay High Yield Municipal Bond Fund
MainStay MacKay New York Tax Free Opportunities Fund2
MainStay MacKay Short Term Municipal Fund
MainStay MacKay Strategic Municipal Allocation Fund
MainStay MacKay Tax Free Bond Fund
Money Market
MainStay Money Market Fund
Mixed Asset
MainStay Balanced Fund
MainStay Income Builder Fund
MainStay MacKay Convertible Fund
Speciality
MainStay CBRE Global Infrastructure Fund
MainStay CBRE Real Estate Fund
MainStay Cushing MLP Premier Fund
Asset Allocation
MainStay Conservative Allocation Fund
MainStay Conservative ETF Allocation Fund
MainStay Defensive ETF Allocation Fund
MainStay Equity Allocation Fund
MainStay Equity ETF Allocation Fund
MainStay ESG Multi-Asset Allocation Fund
MainStay Growth Allocation Fund
MainStay Growth ETF Allocation Fund
MainStay Moderate Allocation Fund
MainStay Moderate ETF Allocation Fund
Manager
New York Life Investment Management LLC
New York, New York
Subadvisors
Candriam3
Strassen, Luxembourg
CBRE Investment Management Listed Real Assets LLC
Radnor, Pennsylvania
Cushing Asset Management, LP
Dallas, Texas
Epoch Investment Partners, Inc.
New York, New York
Fiera Capital Inc.
New York, New York
IndexIQ Advisors LLC3
New York, New York
MacKay Shields LLC3
New York, New York
NYL Investors LLC3
New York, New York
PineStone Asset Management Inc.
Montreal, Québec
Wellington Management Company LLP
Boston, Massachusetts
Winslow Capital Management, LLC
Minneapolis, Minnesota
Legal Counsel
Dechert LLP
Washington, District of Columbia
Independent Registered Public Accounting Firm
KPMG LLP
Philadelphia, Pennsylvania
Distributor
NYLIFE Distributors LLC3
Jersey City, New Jersey
Custodian
JPMorgan Chase Bank, N.A.
New York, New York
1.
This Fund is registered for sale in AZ, CA, NV, OR, TX, UT, WA and MI (Class A and Class I shares only), and CO, FL, GA, HI, ID, MA, MD, NH, NJ and NY (Class I shares only).
| 2. | This Fund is registered for sale in CA, CT, DE, FL, MA, NJ, NY and VT. |
| 3. | An affiliate of New York Life Investment Management LLC. |
Not part of the Annual Report
For more information
800-624-6782
newyorklifeinvestments.com
“New York Life Investments” is both a service mark, and the common trade name, of certain investment advisors affiliated with New York Life Insurance Company. The MainStay Funds® are managed by New York Life Investment Management LLC and distributed by NYLIFE Distributors LLC, 30 Hudson Street, Jersey City, NJ 07302, a wholly owned subsidiary of New York Life Insurance Company. NYLIFE Distributors LLC is a Member FINRA/SIPC.
©2023 NYLIFE Distributors LLC. All rights reserved.
| 5013754MS139-23 | MST11-12/23 |
(NYLIM) NL215
MainStay MacKay U.S. Infrastructure Bond Fund
Message from the President and Annual Report
October 31, 2023
Special Notice:
Beginning in July 2024, new regulations issued by the Securities and Exchange Commission (SEC) will take effect requiring open-end mutual fund companies and ETFs to (1) overhaul the content of their shareholder reports and (2) mail paper copies of the new tailored shareholder reports to shareholders who have not opted to receive these documents electronically.
If you have not yet elected to receive your shareholder reports electronically, please contact your financial intermediary or visit newyorklifeinvestments.com/accounts.
| Not FDIC/NCUA Insured | Not a Deposit | May Lose Value | No Bank Guarantee | Not Insured by Any Government Agency |
This page intentionally left blank
Message from the President
Volatile economic and geopolitical forces drove market behavior during the 12-month reporting period ended October 31, 2023. While equity markets generally gained ground, bond prices trended broadly lower.
Although the war in Ukraine, the outbreak of hostilities in the Middle East and several other notable events affected financial assets, inflation and interest rate trends stood at the forefront of market developments during most of the period. As the reporting period began, high levels of inflation already showed signs of easing in the face of aggressive rate hikes by the U.S. Federal Reserve (the “Fed”). From a peak of 9.1% in June 2022, the annualized U.S. inflation rate dropped to 7.1% in November 2022, and to 3.2% in October 2023. At the same time, the Fed increased the benchmark federal funds rate from 3.75%–4.00% at the beginning of the reporting period to 5.25%–5.50% as of October 31, 2023. As the pace of rate increases slowed during the period, investors hoped for an early shift to a looser monetary policy. However, comments from Fed members late in the period reinforced the central bank’s hawkish stance in response to surprisingly robust U.S. economic growth and rising wage pressures, thus increasing the likelihood that interest rates would stay higher for longer. International developed markets exhibited similar dynamics of elevated inflation and rising interest rates.
Despite the backdrop of high interest rates—along with political dysfunction in Washington D.C. and intensifying global geopolitical instability—equity markets managed to advance, supported by healthy consumer spending trends and persistent domestic economic growth. The S&P 500® Index, a widely regarded benchmark of large-cap U.S. market performance, gained ground, bolstered by the strong performance of energy stocks amid surging petroleum prices and mega-cap, growth-oriented, technology-related shares, which rose as investors flocked to companies creating the infrastructure for developments in artificial intelligence. Smaller-cap stocks and value-oriented shares produced milder returns. Among industry sectors, energy and
information technology posted the strongest gains. Real estate declined most sharply under pressure from rising mortgage rates and weak levels of office occupancy. Developed international markets outperformed U.S. markets, with Europe benefiting during the first half of the period from unexpected economic resilience in the face of rising energy prices and the ongoing war in Ukraine. Emerging markets posted positive results but lagged developed markets, largely due to slow economic growth in China despite the relaxation of pandemic-era lockdowns.
Bond prices were driven lower by rising yields and increasing expectations of high interest rates for an extended period of time. The U.S. yield curve steepened, with the 30-year Treasury yield exceeding 5% for the first time in more than a decade. The yield curve remained inverted, with the 10-year Treasury yield ending the period at 4.88%, compared with 5.07% for the 2-year Treasury yield. Corporate bonds outperformed long-term Treasury bonds, but still trended lower under pressure from rising yields and an uptick in default rates. Among corporates, lower-credit-quality instruments performed slightly better than their higher-credit-quality counterparts, while floating rate securities performed better still.
In the face of today’s uncertain market environment, New York Life Investments remains dedicated to providing the guidance, resources and investment solutions you need to pursue your financial goals.
Thank you for trusting us to help meet your investment needs.
Sincerely,
Kirk C. Lehneis
President
The opinions expressed are as of the date of this report and are subject to change. There is no guarantee that any forecast made will come to pass. This material does not constitute investment advice and is not intended as an endorsement of any specific investment. Past performance is no guarantee of future results.
Not part of the Annual Report
Investors should refer to the Fund’s Summary Prospectus and/or Prospectus and consider the Fund’s investment objectives, strategies, risks, charges and expenses carefully before investing. The Summary Prospectus and/or Prospectus contain this and other information about the Fund. You may obtain copies of the Fund’s Summary Prospectus, Prospectus and Statement of Additional Information, which includes information about The MainStay Funds' Trustees, free of charge, upon request, by calling toll-free 800-624-6782, by writing to NYLIFE Distributors LLC, Attn: MainStay Marketing Department, 30 Hudson Street, Jersey City, NJ 07302 or by sending an e-mail to MainStayShareholderServices@nylim.com. These documents are also available via the MainStay Funds’ website at newyorklifeinvestments.com. Please read the Fund’s Summary Prospectus and/or Prospectus carefully before investing.
Investment and Performance Comparison (Unaudited)
Performance data quoted represents past performance. Past performance is no guarantee of future results. Because of market volatility and other factors, current performance may be lower or higher than the figures shown. Investment return and principal value will fluctuate, and as a result, when shares are redeemed, they may be worth more or less than their original cost. The graph below depicts the historical performance of Class I shares of the Fund. Performance will vary from class to class based on differences in class-specific expenses and sales charges. For performance information current to the most recent month-end, please call 800-624-6782 or visit newyorklifeinvestments.com.
The performance table and graph do not reflect the deduction of taxes that a shareholder would pay on distributions or Fund share redemptions. Total returns reflect maximum applicable sales charges as indicated in the table below, if any, changes in share price, and reinvestment of dividend and capital gain distributions. The graph assumes the initial investment amount shown below and reflects the deduction of all sales charges that would have applied for the period of investment. Performance figures may reflect certain fee waivers and/or expense limitations, without which total returns may have been lower. For more information on share classes and current fee waivers and/or expense limitations (if any), please refer to the Notes to Financial Statements.
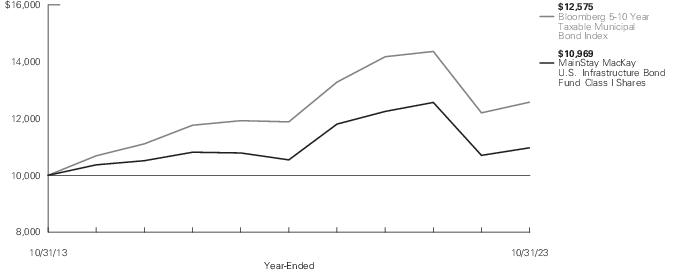
| Average Annual Total Returns for the Year-Ended October 31, 2023 |
| Class | Sales Charge | | Inception
Date1 | One
Year | Five
Years | Ten Years
or Since
Inception | Gross
Expense
Ratio2 |
| Class A Shares3 | Maximum 3.00% Initial Sales Charge | With sales charges | 1/3/1995 | -0.81% | -0.35% | 0.22% | 0.98% |
| | | Excluding sales charges | | 2.26 | 0.57 | 0.68 | 0.98 |
| Investor Class Shares4 | Maximum 2.50% Initial Sales Charge | With sales charges | 2/28/2008 | -0.74 | -0.68 | -0.08 | 1.25 |
| | | Excluding sales charges | | 1.80 | 0.24 | 0.38 | 1.25 |
| Class B Shares5 | Maximum 5.00% CDSC | With sales charges | 5/1/1986 | -3.72 | -0.86 | -0.36 | 2.00 |
| | if Redeemed Within the First Six Years of Purchase | Excluding sales charges | | 1.19 | -0.50 | -0.36 | 2.00 |
| Class C Shares | Maximum 1.00% CDSC | With sales charges | 9/1/1998 | 0.21 | -0.47 | -0.35 | 2.00 |
| | if Redeemed Within One Year of Purchase | Excluding sales charges | | 1.19 | -0.47 | -0.35 | 2.00 |
| Class I Shares | No Sales Charge | | 1/2/2004 | 2.48 | 0.79 | 0.93 | 0.73 |
| Class R6 Shares | No Sales Charge | | 11/1/2019 | 2.55 | N/A | -1.72 | 0.57 |
| 1. | Effective February 28, 2019 and June 21, 2019, the Fund modified its principal investment strategies. The past performance in the bar chart and table prior to those dates reflects the Fund’s prior principal investment strategies. |
| 2. | The gross expense ratios presented reflect the Fund’s “Total Annual Fund Operating Expenses” from the most recent Prospectus, as supplemented, and may differ from other expense ratios disclosed in this report. |
| 3. | Prior to August 10, 2022, the maximum initial sales charge was 4.50%, which is reflected in the applicable average annual total return figures shown. |
| 4. | Prior to August 10, 2022, the maximum initial sales charge was 4.00%, which is reflected in the applicable average annual total return figures shown. |
| 5. | Class B shares are closed to all new purchases as well as additional investments by existing Class B shareholders and will be converted into Class A or Investor Class shares based on shareholder eligibility on or about February 28, 2024. |
The footnotes on the next page are an integral part of the table and graph and should be carefully read in conjunction with them.
| Benchmark Performance* | One
Year | Five
Years | Ten
Years |
| Bloomberg 5-10 Year Taxable Municipal Bond Index1 | 3.08% | 1.14% | 2.32% |
| Morningstar Intermediate Core Bond Category Average2 | 0.55 | -0.16 | 0.76 |
| * | Returns for indices reflect no deductions for fees, expenses or taxes, except for foreign withholding taxes where applicable. Results assume reinvestment of all dividends and capital gains. An investment cannot be made directly in an index. |
| 1. | The Fund has selected the Bloomberg 5-10 Year Taxable Municipal Bond Index as its primary benchmark. The Bloomberg 5-10 Year Taxable Municipal Bond Index is the 5-10 year component of the Bloomberg Taxable Municipal Bond Index. |
| 2. | The Morningstar Intermediate Core Bond Category Average is representative of funds that invest primarily in investment-grade U.S. fixed-income issues including government, corporate, and securitized debt, and hold less than 5% in below-investment-grade exposures. Their durations (a measure of interest-rate sensitivity) typically range between 75% and 125% of the three-year average of the effective duration of the Morningstar Core Bond Index. Results are based on average total returns of similar funds with all dividends and capital gain distributions reinvested. |
The footnotes on the preceding page are an integral part of the table and graph and should be carefully read in conjunction with them.
| 6 | MainStay MacKay U.S. Infrastructure Bond Fund |
Cost in Dollars of a $1,000 Investment in MainStay MacKay U.S. Infrastructure Bond Fund (Unaudited)
The example below is intended to describe the fees and expenses borne by shareholders during the six-month period from May 1, 2023 to October 31, 2023, and the impact of those costs on your investment.
Example
As a shareholder of the Fund you incur two types of costs: (1) transaction costs, including exchange fees and sales charges (loads) on purchases (as applicable), and (2) ongoing costs, including management fees, distribution and/or service (12b-1) fees and other Fund expenses (as applicable). This example is intended to help you understand your ongoing costs (in dollars) of investing in the Fund and to compare these costs with the ongoing costs of investing in other mutual funds. The example is based on an investment of $1,000 made at the beginning of the six-month period and held for the entire period from May 1, 2023 to October 31, 2023.
This example illustrates your Fund’s ongoing costs in two ways:
Actual Expenses
The second and third data columns in the table below provide information about actual account values and actual expenses. You may use the information in these columns, together with the amount you invested, to estimate the expenses that you paid during the six months ended October 31, 2023. Simply divide your account value by $1,000 (for example, an
$8,600 account value divided by $1,000 = 8.6), then multiply the result by the number under the heading entitled “Expenses Paid During Period” to estimate the expenses you paid on your account during this period.
Hypothetical Example for Comparison Purposes
The fourth and fifth data columns in the table below provide information about hypothetical account values and hypothetical expenses based on the Fund’s actual expense ratio and an assumed rate of return of 5% per year before expenses, which is not the Fund’s actual return. The hypothetical account values and expenses may not be used to estimate the actual ending account balances or expenses you paid for the six-month period shown. You may use this information to compare the ongoing costs of investing in the Fund with the ongoing costs of investing in other mutual funds. To do so, compare this 5% hypothetical example with the 5% hypothetical examples that appear in the shareholder reports of the other mutual funds.
Please note that the expenses shown in the table are meant to highlight your ongoing costs only and do not reflect any transactional costs, such as exchange fees or sales charges (loads). Therefore, the fourth and fifth data columns of the table are useful in comparing ongoing costs only and will not help you determine the relative total costs of owning different funds. In addition, if these transactional costs were included, your costs would have been higher.
| Share Class | Beginning
Account
Value
5/1/23 | Ending Account
Value (Based
on Actual
Returns and
Expenses)
10/31/23 | Expenses
Paid
During
Period1 | Ending Account
Value (Based
on Hypothetical
5% Annualized
Return and
Actual Expenses)
10/31/23 | Expenses
Paid
During
Period1 | Net Expense
Ratio
During
Period2 |
| Class A Shares | $1,000.00 | $953.60 | $4.19 | $1,020.92 | $4.33 | 0.85% |
| Investor Class Shares | $1,000.00 | $952.50 | $5.56 | $1,019.51 | $5.75 | 1.13% |
| Class B Shares | $1,000.00 | $948.70 | $9.28 | $1,015.68 | $9.60 | 1.89% |
| Class C Shares | $1,000.00 | $949.90 | $9.29 | $1,015.68 | $9.60 | 1.89% |
| Class I Shares | $1,000.00 | $955.30 | $2.96 | $1,022.18 | $3.06 | 0.60% |
| Class R6 Shares | $1,000.00 | $955.70 | $2.61 | $1,022.53 | $2.70 | 0.53% |
| 1. | Expenses are equal to the Fund’s annualized expense ratio of each class multiplied by the average account value over the period, divided by 365 and multiplied by 184 (to reflect the six-month period). The table above represents the actual expenses incurred during the six-month period. In addition to the fees and expenses which the Fund bears directly, it also indirectly bears a pro rata share of the fees and expenses of the underlying funds in which it invests. Such indirect expenses are not included in the above-reported expense figures. |
| 2. | Expenses are equal to the Fund's annualized expense ratio to reflect the six-month period. |
Portfolio Composition as of October 31, 2023 (Unaudited)
‡ Less than one-tenth of percent
See Portfolio of Investments beginning on page 11 for specific holdings within these categories. The Fund's holdings are subject to change.
Top Ten Holdings and/or Issuers Held as of October 31, 2023 (excluding short-term investments) (Unaudited)
| 1. | State of Illinois, 2.159%-7.35%, due 6/15/29–4/1/38 |
| 2. | Commonwealth of Massachusetts, 1.52%-5.50%, due 7/15/29–10/1/31 |
| 3. | State of Texas, 2.526%-4.98%, due 10/1/31–10/1/36 |
| 4. | City of New York, 1.623%-5.625%, due 8/1/28–4/1/34 |
| 5. | New York City Transitional Finance Authority, 1.55%-5.65%, due 5/1/28–11/1/35 |
| 6. | City of Oakland, 5.50%-5.85%, due 7/15/31–7/15/35 |
| 7. | Alabama Federal Aid Highway Finance Authority, 1.727%-2.256%, due 9/1/28–9/1/33 |
| 8. | Oregon State Lottery, 1.641%-4.303%, due 4/1/28–4/1/31 |
| 9. | State of Connecticut, 2.677%-5.459%, due 5/15/30–11/1/30 |
| 10. | State of Hawaii, 1.395%-2.642%, due 10/1/28–10/1/36 |
| 8 | MainStay MacKay U.S. Infrastructure Bond Fund |
Portfolio Management Discussion and Analysis (Unaudited)
Questions answered by portfolio managers John Loffredo, CFA, Robert DiMella, CFA, Michael Petty, David Dowden, Scott Sprauer, Frances Lewis, Robert Burke, CFA, John Lawlor, Sanjit Gill, CFA, and Michael Denlinger, CFA, of MacKay Shields LLC, the Fund’s Subadvisor.
How did MainStay MacKay U.S. Infrastructure Bond Fund perform relative to its benchmarks and peer group during the 12 months ended October 31, 2023?
For the 12 months ended October 31, 2023, Class I shares of MainStay MacKay U.S. Infrastructure Bond Fund returned 2.48%, underperforming the 3.08% return of the Fund’s benchmark, the Bloomberg 5–10 Year Taxable Municipal Bond Index (the “Index”). Over the same period, Class I shares outperformed the 0.55% return of the Morningstar Intermediate Core Bond Category Average.1
What factors affected the Fund’s relative performance during the reporting period?
During the reporting period, the Fund underperformed the Index due to underweight exposure to AA-rated bonds and overweight exposure to AAA-rated bonds.2 In addition, underweight exposure to holdings from Texas and Oregon, as well as an underweight exposure to bonds maturing between 5–9 years, detracted from relative returns. Conversely, the Fund’s security selection among 4% coupon bonds made a positive contribution to relative performance. (Contributions take weightings and total returns into account.) From a credit perspective, underweight exposure to A-rated3 bonds aided relative performance. In addition, underweight allocations to the states of Illinois and New Jersey added on a relative basis, as did out-of-Index bonds maturing beyond 10 years. Also, the Fund engaged in significant tax-loss harvesting. This created losses that can be carried forward to offset future gains in the Fund. This activity also resulted in creating a higher book yield for the Fund.
What was the Fund’s duration4 strategy during the reporting period?
We do not make interest rate forecasts or duration bets. Rather, we aim to adopt a duration-neutral posture in the Fund relative to
the Index. As of October 31, 2023, the modified duration to worst5 for the Fund was 5.84 years compared to 6.09 years for the Index.
During the reporting period, which sectors were the strongest positive contributors to the Fund’s relative performance and which sectors were particularly weak?
During the reporting period, the Fund’s overweight exposure to the transportation and state general obligation sectors made positive contributions to returns relative to the Index. Conversely, the Fund’s underweight exposure to and security selection in the education and leasing sectors weakened relative returns.
What were some of the Fund’s largest purchases and sales during the reporting period?
As the Fund remains focused on diversification and liquidity, no individual purchase or sale was considered significant, although sector overweights or security structure, in their entirety, did have an impact.
How did the Fund’s sector weighting change during the reporting period?
During the reporting period, there were no material changes to the weightings in the Fund. There was an increase to the Fund’s electric and state general obligation weightings. We added to traditional municipal bonds, such as bonds backed by the taxing power of general obligation issuers or secured by the revenues of essential service providers, due to their generally strong, resilient profiles. In addition, we increased exposure to higher-quality AAA-rated credits. During the reporting period, the Fund increased exposure to high-quality credits since they are in relatively strong financial condition and were available at much higher yields. Conversely, the Fund decreased exposure to the transportation and hospital sectors, and to A-rated bonds. From a state
| 1. | See "Investment and Performance Comparison" for other share class returns, which may be higher or lower than Class I share returns, and for more information on benchmark and peer group returns. |
| 2. | An obligation rated ‘AA’ by Standard & Poor’s (“S&P”), is deemed by S&P to differ from the highest-rated obligations only to a small degree. In the opinion of S&P, the obligor's capacity to meet its financial commitment on the obligation is very strong. An obligation rated ‘AAA’ has the highest rating assigned by S&P, and in the opinion of S&P, the obligor’s capacity to meet its financial commitment on the obligation is extremely strong. When applied to Fund holdings, ratings are based solely on the creditworthiness of the bonds in the portfolio and are not meant to represent the security or safety of the Fund. |
| 3. | An obligation rated ‘A’ by S&P is deemed by S&P to be somewhat more susceptible to the adverse effects of changes in circumstances and economic conditions than obligations in higher-rated categories. In the opinion of S&P, however, the obligor's capacity to meet its financial commitment on the obligation is still strong. When applied to Fund holdings, ratings are based solely on the creditworthiness of the bonds in the portfolio and are not meant to represent the security or safety of the Fund. |
| 4. | Duration is a measure of the price sensitivity of a fixed-income investment to changes in interest rates. Duration is expressed as a number of years and is considered a more accurate sensitivity gauge than average maturity. |
| 5. | Modified duration is inversely related to the approximate percentage change in price for a given change in yield. Duration to worst is the duration of a bond computed using the bond’s nearest call date or maturity. This measure ignores future cash flow fluctuations due to embedded optionality. |
perspective, the Fund decreased exposure to holdings from Illinois.
How was the Fund positioned at the end of the reporting period?
As of October 31, 2023, the Fund held overweight exposure to bonds maturing beyond 10 years, where municipal yields are more attractive. In addition, the Fund held overweight exposure to the electric and water & sewer sectors. Furthermore, the Fund held overweight exposure to AAA-rated bonds. As of the same date, the Fund held underweight exposure to the state general obligation and leasing sectors. In addition, the Fund held underweight exposure to A-rated credits, as well as the states of New York and Texas.
The opinions expressed are those of the portfolio managers as of the date of this report and are subject to change. There is no guarantee that any forecasts will come to pass. This material does not constitute investment advice and is not intended as an endorsement of any specific investment.
| 10 | MainStay MacKay U.S. Infrastructure Bond Fund |
Portfolio of Investments October 31, 2023†^
| | Principal
Amount | Value |
| Long-Term Bonds 95.4% |
| Corporate Bonds 3.5% |
| Commercial Services 2.4% |
| Chapman University | | |
| Series 2021 | | |
| 2.067%, due 4/1/31 | $ 2,680,000 | $ 2,010,353 |
| Emory University | | |
| Series 2020 | | |
| 2.143%, due 9/1/30 | 10,240,000 | 8,226,712 |
| Johns Hopkins University | | |
| Series A | | |
| 4.705%, due 7/1/32 | 12,391,000 | 11,734,605 |
| | | 21,971,670 |
| Healthcare-Services 1.1% |
| Advocate Health & Hospitals Corp. | | |
| 3.829%, due 8/15/28 | 6,590,000 | 6,100,889 |
| OhioHealth Corp. | | |
| 2.297%, due 11/15/31 | 5,000,000 | 3,864,467 |
| | | 9,965,356 |
Total Corporate Bonds
(Cost $33,500,901) | | 31,937,026 |
| Municipal Bonds 91.9% |
| Alabama 2.0% |
Alabama Federal Aid Highway Finance Authority
Revenue Bonds | | |
| Series B | | |
| 1.727%, due 9/1/28 | 8,000,000 | 6,852,294 |
| Series B | | |
| 1.856%, due 9/1/29 | 2,160,000 | 1,800,906 |
| Series B | | |
| 2.156%, due 9/1/32 | 4,000,000 | 3,083,916 |
| Series B | | |
| 2.256%, due 9/1/33 | 5,725,000 | 4,328,262 |
City of Birmingham
Unlimited General Obligation | | |
| 2.128%, due 3/1/31 | 1,135,000 | 913,156 |
City of Huntsville, Water System
Revenue Bonds | | |
| Series B | | |
| 1.187%, due 11/1/27 | 1,000,000 | 855,771 |
| | | 17,834,305 |
| | Principal
Amount | Value |
| |
| Arizona 0.8% |
Arizona Board of Regents, Arizona State University
Revenue Bonds | | |
| Series C | | |
| 4.531%, due 7/1/29 | $ 1,525,000 | $ 1,446,505 |
Arizona Industrial Development Authority, Voyager Foundation Inc., Project
Revenue Bonds | | |
| Series 2020 | | |
| 3.65%, due 10/1/29 | 1,115,000 | 945,232 |
| Series 2020 | | |
| 3.90%, due 10/1/34 | 1,900,000 | 1,374,670 |
City of Phoenix
Unlimited General Obligation | | |
| Series A | | |
| 5.269%, due 7/1/34 | 3,980,000 | 3,870,383 |
| | | 7,636,790 |
| Arkansas 1.2% |
City of Springdale, Sales & Use Tax
Revenue Bonds | | |
| Series A, Insured: BAM | | |
| 5.025%, due 8/1/28 | 1,200,000 | 1,181,080 |
| Series A, Insured: BAM | | |
| 5.053%, due 8/1/29 | 3,345,000 | 3,275,113 |
| Series A, Insured: BAM | | |
| 5.103%, due 8/1/30 | 1,500,000 | 1,459,782 |
| Series A, Insured: BAM | | |
| 5.11%, due 8/1/31 | 2,100,000 | 2,025,966 |
| Series A, Insured: BAM | | |
| 5.16%, due 8/1/32 | 2,000,000 | 1,921,346 |
| Series A, Insured: BAM | | |
| 5.21%, due 8/1/33 | 1,150,000 | 1,101,049 |
| | | 10,964,336 |
| California 18.0% |
Alameda Corridor Transportation Authority
Revenue Bonds, Sub. Lien | | |
| Series B, Insured: BAM AMBAC | | |
| (zero coupon), due 10/1/32 | 5,000,000 | 2,925,250 |
Anaheim Public Financing Authority, Convention Center Expansion
Revenue Bonds | | |
| Series A, Insured: AGM | | |
| 2.971%, due 7/1/33 | 2,800,000 | 2,186,061 |
The notes to the financial statements are an integral part of, and should be read in conjunction with, the financial statements.
11
Portfolio of Investments October 31, 2023†^ (continued)
| | Principal
Amount | Value |
| Municipal Bonds (continued) |
| California (continued) |
California Community Choice Financing Authority, Clean Energy Project (a)
Revenue Bonds | | |
| Series A-1 | | |
| 4.00%, due 5/1/53 | $ 5,405,000 | $ 5,143,316 |
| Series C | | |
| 5.25%, due 1/1/54 | 5,725,000 | 5,604,652 |
California Health Facilities Financing Authority
Revenue Bonds, Senior Lien | | |
| 1.829%, due 6/1/29 | 2,500,000 | 2,073,058 |
California State University, Systemwide
Revenue Bonds | | |
| Series B | | |
| 1.674%, due 11/1/29 | 2,710,000 | 2,197,099 |
| Series B | | |
| 1.994%, due 11/1/32 | 1,000,000 | 741,991 |
| Series B | | |
| 4.90%, due 11/1/34 | 2,750,000 | 2,545,574 |
| Series B | | |
| 5.00%, due 11/1/35 | 4,750,000 | 4,392,192 |
Central Basin Municipal Water District
Revenue Bonds | | |
| Series B, Insured: BAM | | |
| 3.56%, due 8/1/33 | 1,345,000 | 1,098,711 |
City of Los Angeles, Department of Airports
Revenue Bonds | | |
| Series C | | |
| 1.613%, due 5/15/30 | 1,000,000 | 785,848 |
City of Los Angeles
Unlimited General Obligation | | |
| Series A | | |
| 2.15%, due 9/1/32 | 2,500,000 | 1,912,704 |
City of Los Angeles, Department of Airports Customer Facility Charge
Revenue Bonds | | |
| Series A, Insured: AGM | | |
| 3.258%, due 5/15/30 | 2,620,000 | 2,292,363 |
| Series A, Insured: AGM | | |
| 3.408%, due 5/15/32 | 2,410,000 | 2,035,390 |
City of Oakland
Unlimited General Obligation | | |
| Series A-2 | | |
| 5.50%, due 7/15/31 | 3,000,000 | 2,980,509 |
| Series A-2 | | |
| 5.60%, due 7/15/32 | 2,580,000 | 2,568,430 |
| | Principal
Amount | Value |
| |
| California (continued) |
City of Oakland
Unlimited General Obligation
(continued) | | |
| Series A-2 | | |
| 5.65%, due 7/15/33 | $ 2,000,000 | $ 1,990,359 |
| Series A-2 | | |
| 5.75%, due 7/15/34 | 4,205,000 | 4,196,125 |
| Series A-2 | | |
| 5.85%, due 7/15/35 | 4,430,000 | 4,433,836 |
Contra Costa Community College District
Unlimited General Obligation | | |
| 1.75%, due 8/1/28 | 1,500,000 | 1,284,622 |
| Series B | | |
| 6.504%, due 8/1/34 | 2,270,000 | 2,391,536 |
Contra Costa Transportation Authority, Sales Tax
Revenue Bonds | | |
| Series B | | |
| 2.25%, due 3/1/34 | 1,580,000 | 1,167,889 |
County of Alameda
Unlimited General Obligation | | |
| Series B | | |
| 3.599%, due 8/1/29 | 9,185,000 | 8,453,371 |
| Series B | | |
| 3.749%, due 8/1/32 | 2,000,000 | 1,760,058 |
Cupertino Union School District
Unlimited General Obligation | | |
| 2.65%, due 8/1/31 | 1,000,000 | 820,049 |
East Side Union High School District
Unlimited General Obligation | | |
| Series B, Insured: BAM | | |
| 2.027%, due 8/1/30 | 1,195,000 | 967,098 |
Foothill-De Anza Community College District, Election of 2006
Unlimited General Obligation | | |
| Series E | | |
| 2.896%, due 8/1/31 | 1,025,000 | 859,140 |
Glendale Community College District
Unlimited General Obligation | | |
| 2.268%, due 8/1/30 | 1,500,000 | 1,234,113 |
| 2.568%, due 8/1/33 | 2,145,000 | 1,655,108 |
| 2.668%, due 8/1/34 | 2,545,000 | 1,929,665 |
Glendale Unified School District
Unlimited General Obligation | | |
| Series B | | |
| 1.83%, due 9/1/32 | 1,280,000 | 943,593 |
The notes to the financial statements are an integral part of, and should be read in conjunction with, the financial statements.
| 12 | MainStay MacKay U.S. Infrastructure Bond Fund |
| | Principal
Amount | Value |
| Municipal Bonds (continued) |
| California (continued) |
Long Beach Community College District
Unlimited General Obligation | | |
| Series H | | |
| 2.387%, due 8/1/29 | $ 1,695,000 | $ 1,444,707 |
Los Angeles Community College District, Election of 2008
Unlimited General Obligation | | |
| Series B | | |
| 7.53%, due 8/1/29 | 6,000,000 | 6,523,312 |
Los Angeles Unified School District
Unlimited General Obligation | | |
| Series RY | | |
| 6.758%, due 7/1/34 | 2,360,000 | 2,497,727 |
Marin Community College District
Unlimited General Obligation | | |
| Series B | | |
| 1.89%, due 8/1/32 | 2,400,000 | 1,770,479 |
Marin Community College District, Election of 2016
Unlimited General Obligation | | |
| Series A-1 | | |
| 3.272%, due 8/1/27 | 1,425,000 | 1,324,558 |
Oakland Unified School District, Alameda County
Unlimited General Obligation | | |
| Insured: BAM | | |
| 2.774%, due 8/1/34 | 1,000,000 | 749,867 |
| Insured: BAM | | |
| 2.874%, due 8/1/35 | 7,405,000 | 5,447,677 |
Oxnard Financing Authority
Revenue Bonds | | |
| Series B | | |
| 6.819%, due 6/1/30 | 4,910,000 | 5,097,625 |
Port of Oakland
Revenue Bonds, Senior Lien | | |
| Series R | | |
| 1.949%, due 5/1/28 | 4,000,000 | 3,464,213 |
| Series R | | |
| 2.099%, due 5/1/30 | 2,360,000 | 1,919,485 |
| Series R | | |
| 2.349%, due 5/1/33 | 1,205,000 | 905,775 |
Redondo Beach Unified School District
Unlimited General Obligation | | |
| Series B | | |
| 2.211%, due 8/1/36 | 2,100,000 | 1,416,396 |
| | Principal
Amount | Value |
| |
| California (continued) |
San Diego Community College District
Unlimited General Obligation | | |
| 2.113%, due 8/1/31 | $ 3,470,000 | $ 2,738,937 |
San Diego County Regional Transportation Commission
Revenue Bonds | | |
| Series A | | |
| 2.499%, due 4/1/30 | 1,570,000 | 1,321,019 |
San Francisco City & County Public Utilities Commission, Wastewater
Revenue Bonds | | |
| Series B | | |
| 5.60%, due 10/1/30 | 6,620,000 | 6,634,199 |
San Francisco City & County Redevelopment Agency Successor Agency
Tax Allocation, Third Lien | | |
| Series A, Insured: AGM | | |
| 2.543%, due 8/1/30 | 2,000,000 | 1,618,560 |
| Series A, Insured: AGM | | |
| 2.643%, due 8/1/31 | 1,780,000 | 1,406,609 |
San Joaquin Hills Transportation Corridor Agency
Revenue Bonds, Senior Lien | | |
| Series B, Insured: AGM | | |
| 2.571%, due 1/15/30 | 1,250,000 | 1,049,352 |
San Jose Evergreen Community College District
Unlimited General Obligation | | |
| Series B | | |
| 6.649%, due 7/1/43 | 5,000,000 | 4,930,352 |
San Jose Unified School District
Unlimited General Obligation | | |
| 1.847%, due 8/1/33 | 1,685,000 | 1,215,248 |
Santa Monica-Malibu Unified School District
Unlimited General Obligation | | |
| 1.51%, due 7/1/30 | 2,510,000 | 1,971,785 |
Silicon Valley Clean Water
Revenue Bonds | | |
| Series A | | |
| 1.962%, due 8/1/31 | 2,950,000 | 2,276,858 |
Southern California Public Power Authority, National Gas Project
Revenue Bonds | | |
| Series A, Insured: AGM | | |
| 5.93%, due 7/1/32 | 1,800,000 | 1,814,428 |
The notes to the financial statements are an integral part of, and should be read in conjunction with, the financial statements.
13
Portfolio of Investments October 31, 2023†^ (continued)
| | Principal
Amount | Value |
| Municipal Bonds (continued) |
| California (continued) |
Southern California Public Power Authority, National Gas Project
Revenue Bonds (continued) | | |
| Series A, Insured: AGM | | |
| 6.03%, due 7/1/32 | $ 7,030,000 | $ 7,116,875 |
State of California, Various Purpose
Unlimited General Obligation | | |
| 3.00%, due 11/1/30 | 3,225,000 | 2,741,495 |
| 5.20%, due 3/1/43 | 1,000,000 | 876,959 |
| 5.875%, due 10/1/41 | 4,000,000 | 3,836,844 |
| 7.50%, due 4/1/34 | 4,000,000 | 4,483,713 |
State of California Department of Water Resources, Central Valley Project
Revenue Bonds | | |
| Series BC | | |
| 1.16%, due 12/1/27 | 2,180,000 | 1,862,280 |
| Series BE | | |
| 2.132%, due 12/1/33 | 7,500,000 | 5,510,140 |
Vacaville Unified School District
Unlimited General Obligation | | |
| 1.639%, due 8/1/29 | 2,000,000 | 1,621,234 |
| | | 163,158,418 |
| Colorado 1.6% |
City & County of Denver, Airport System
Revenue Bonds | | |
| Series C | | |
| 2.237%, due 11/15/30 | 6,645,000 | 5,388,847 |
| Series C | | |
| 2.617%, due 11/15/33 | 3,000,000 | 2,300,346 |
City & County of Denver, Pledged Excise Tax
Revenue Bonds | | |
| Series B | | |
| 3.696%, due 8/1/28 | 4,670,000 | 4,303,186 |
Colorado Housing and Finance Authority
Revenue Bonds | | |
| Series K-1, Insured: GNMA | | |
| 5.75%, due 11/1/53 | 3,000,000 | 2,798,129 |
| | | 14,790,508 |
| Connecticut 1.8% |
State of Connecticut
Unlimited General Obligation | | |
| Series A | | |
| 2.677%, due 7/1/30 | 3,805,000 | 3,217,103 |
| | Principal
Amount | Value |
| |
| Connecticut (continued) |
State of Connecticut
Unlimited General Obligation
(continued) | | |
| Series A | | |
| 4.06%, due 6/15/30 | $ 4,600,000 | $ 4,243,566 |
| Series A | | |
| 4.657%, due 5/15/30 | 7,000,000 | 6,694,004 |
State of Connecticut, Transportation Infrastructure, Special Tax
Revenue Bonds | | |
| Series B | | |
| 5.459%, due 11/1/30 | 1,860,000 | 1,831,552 |
| | | 15,986,225 |
| District of Columbia 0.2% |
District of Columbia
Revenue Bonds | | |
| Series B | | |
| 3.759%, due 7/1/29 | 1,870,000 | 1,723,344 |
| Florida 3.1% |
Bay Laurel Center Community Development District, Water & Sewer
Revenue Bonds | | |
| Series B, Insured: AGM | | |
| 5.60%, due 9/1/42 | 1,000,000 | 949,088 |
City of Miami, Beach Parking
Unlimited General Obligation | | |
| Series B | | |
| 4.661%, due 5/1/31 | 1,310,000 | 1,239,725 |
| Series B | | |
| 4.674%, due 5/1/29 | 1,900,000 | 1,844,948 |
| Series B | | |
| 5.261%, due 5/1/38 | 2,010,000 | 1,879,438 |
County of Broward, Airport System
Revenue Bonds | | |
| Series C | | |
| 2.504%, due 10/1/28 | 2,360,000 | 2,070,148 |
County of Miami-Dade, Seaport Department
Revenue Bonds | | |
| Series A-3, Insured: AGM | | |
| 2.012%, due 10/1/31 | 6,940,000 | 5,256,057 |
| Series A-3, Insured: AGM | | |
| 2.162%, due 10/1/32 | 4,000,000 | 2,964,479 |
The notes to the financial statements are an integral part of, and should be read in conjunction with, the financial statements.
| 14 | MainStay MacKay U.S. Infrastructure Bond Fund |
| | Principal
Amount | Value |
| Municipal Bonds (continued) |
| Florida (continued) |
County of Miami-Dade, Aviation
Revenue Bonds | | |
| Series B | | |
| 2.287%, due 10/1/29 | $ 1,000,000 | $ 833,586 |
| Series B | | |
| 3.406%, due 10/1/32 | 1,500,000 | 1,243,017 |
Florida Development Finance Corp., UF Health Jacksonville Project
Revenue Bonds | | |
| Series B, Insured: AGM | | |
| 3.223%, due 2/1/32 | 8,500,000 | 6,737,198 |
Tampa-Hillsborough County Expressway Authority
Revenue Bonds | | |
| Series B, Insured: BAM | | |
| 2.142%, due 7/1/31 | 4,375,000 | 3,405,166 |
| | | 28,422,850 |
| Georgia 1.1% |
City of Atlanta, Water & Wastewater
Revenue Bonds | | |
| 1.637%, due 11/1/29 | 1,000,000 | 812,465 |
| 2.257%, due 11/1/35 | 5,560,000 | 4,114,491 |
Municipal Electric Authority of Georgia, Project One Subordinated Bonds
Revenue Bonds | | |
| Series B | | |
| 2.257%, due 1/1/29 | 1,425,000 | 1,201,311 |
Oglethorpe Power Corp.
Revenue Bonds | | |
| Insured: NATL-RE | | |
| 5.534%, due 1/1/35 (b) | 2,300,000 | 2,178,222 |
State of Georgia
Unlimited General Obligation | | |
| Series H | | |
| 5.114%, due 11/1/29 | 1,500,000 | 1,491,770 |
| | | 9,798,259 |
| Guam 0.9% |
Guam Government Waterworks Authority, Water and Wastewater System
Revenue Bonds | | |
| Series B | | |
| 2.75%, due 7/1/30 | 6,500,000 | 5,426,180 |
| Series B | | |
| 3.25%, due 7/1/34 | 2,000,000 | 1,565,992 |
| | Principal
Amount | Value |
| |
| Guam (continued) |
Port Authority of Guam
Revenue Bonds | | |
| Series C | | |
| 4.532%, due 7/1/27 | $ 500,000 | $ 470,352 |
| Series C | | |
| 4.582%, due 7/1/28 | 1,000,000 | 923,794 |
| | | 8,386,318 |
| Hawaii 2.2% |
City & County of Honolulu, Wastewater System
Revenue Bonds | | |
| Series A | | |
| 1.623%, due 7/1/31 | 3,080,000 | 2,333,171 |
City & County of Honolulu
Unlimited General Obligation | | |
| Series D | | |
| 3.068%, due 10/1/30 | 1,980,000 | 1,721,443 |
State of Hawaii
Unlimited General Obligation | | |
| Series FZ | | |
| 1.395%, due 8/1/30 | 7,520,000 | 5,841,447 |
| Series GD | | |
| 1.71%, due 10/1/28 | 1,000,000 | 849,941 |
| Series GC | | |
| 1.868%, due 10/1/31 | 6,000,000 | 4,619,338 |
| Series FZ | | |
| 2.065%, due 8/1/35 | 1,100,000 | 761,755 |
| Series GE | | |
| 2.642%, due 10/1/36 | 4,725,000 | 3,398,041 |
| | | 19,525,136 |
| Illinois 6.0% |
Chicago Board of Education
Unlimited General Obligation | | |
| Series C, Insured: BAM | | |
| 6.319%, due 11/1/29 | 2,000,000 | 1,991,863 |
Chicago Transit Authority Sales Tax Receipts Fund
Revenue Bonds | | |
| Series B, Insured: BAM | | |
| 3.102%, due 12/1/30 | 2,100,000 | 1,805,815 |
City of Chicago
Unlimited General Obligation | | |
| Series B, Insured: AGM-CR | | |
| 7.375%, due 1/1/33 | 1,200,000 | 1,269,087 |
The notes to the financial statements are an integral part of, and should be read in conjunction with, the financial statements.
15
Portfolio of Investments October 31, 2023†^ (continued)
| | Principal
Amount | Value |
| Municipal Bonds (continued) |
| Illinois (continued) |
County of Cook
Unlimited General Obligation | | |
| Series C | | |
| 5.79%, due 11/15/29 | $ 1,290,000 | $ 1,290,988 |
Illinois Finance Authority, Ann & Robert H Lurie Children's Hospital
Revenue Bonds | | |
| 3.548%, due 8/15/29 | 2,525,000 | 2,267,887 |
| 3.598%, due 8/15/30 | 1,000,000 | 881,028 |
Illinois Municipal Electric Agency
Revenue Bonds | | |
| Series C | | |
| 6.832%, due 2/1/35 | 5,000,000 | 5,143,156 |
Sales Tax Securitization Corp.
Revenue Bonds, Second Lien | | |
| Series B, Insured: BAM | | |
| 2.857%, due 1/1/31 | 6,000,000 | 5,031,225 |
Sales Tax Securitization Corp.
Revenue Bonds | | |
| Series C | | |
| 3.23%, due 1/1/28 | 2,160,000 | 1,990,885 |
State of Illinois, Sales Tax
Revenue Bonds, Junior Lien | | |
| Series B | | |
| 2.159%, due 6/15/29 | 2,500,000 | 2,038,217 |
| Series B | | |
| 2.509%, due 6/15/32 | 1,000,000 | 746,303 |
State of Illinois, Sales Tax
Revenue Bonds | | |
| 3.45%, due 6/15/29 | 3,170,000 | 2,775,339 |
State of Illinois
Unlimited General Obligation | | |
| Series B | | |
| 5.52%, due 4/1/38 | 11,950,000 | 10,835,257 |
| Series 3 | | |
| 6.725%, due 4/1/35 | 10,153,846 | 10,061,178 |
State of Illinois, Build America Bonds
Unlimited General Obligation | | |
| Series 5 | | |
| 7.35%, due 7/1/35 | 5,931,429 | 6,040,261 |
| | | 54,168,489 |
| | Principal
Amount | Value |
| |
| Indiana 0.7% |
Indianapolis Local Public Improvement Bond Bank
Revenue Bonds | | |
| Series G-3 | | |
| 5.04%, due 1/1/29 | $ 1,115,000 | $ 1,083,878 |
| Series A-2 | | |
| 5.854%, due 1/15/30 | 5,325,000 | 5,329,701 |
| | | 6,413,579 |
| Iowa 0.5% |
Iowa Finance Authority, State Revolving Fund
Revenue Bonds | | |
| Series B | | |
| 4.40%, due 8/1/29 | 3,250,000 | 3,132,975 |
| Series B | | |
| 4.45%, due 8/1/30 | 1,500,000 | 1,433,777 |
| | | 4,566,752 |
| Kansas 1.1% |
County of Johnson
Unlimited General Obligation | | |
| Series D | | |
| 1.70%, due 9/1/32 | 5,025,000 | 3,697,777 |
| Series D | | |
| 2.00%, due 9/1/29 | 4,515,000 | 3,788,600 |
State of Kansas Department of Transportation
Revenue Bonds | | |
| Series A | | |
| 4.596%, due 9/1/35 | 2,500,000 | 2,297,934 |
| | | 9,784,311 |
| Louisiana 1.2% |
Louisiana Local Government Environmental Facilities & Community Development Authority, Utilities Restoration Corp. Project
Revenue Bonds | | |
| 5.197%, due 9/1/39 | 3,917,220 | 3,739,520 |
| 5.198%, due 12/1/39 | 4,830,000 | 4,520,183 |
State of Louisiana
Unlimited General Obligation | | |
| Series C-1 | | |
| 1.804%, due 6/1/31 | 3,710,000 | 2,880,530 |
| | | 11,140,233 |
The notes to the financial statements are an integral part of, and should be read in conjunction with, the financial statements.
| 16 | MainStay MacKay U.S. Infrastructure Bond Fund |
| | Principal
Amount | Value |
| Municipal Bonds (continued) |
| Maryland 1.0% |
County of Baltimore
Unlimited General Obligation | | |
| 3.569%, due 8/1/32 | $ 3,015,000 | $ 2,691,608 |
County of Howard
Unlimited General Obligation | | |
| Series E | | |
| 1.55%, due 8/15/31 | 3,000,000 | 2,287,923 |
Maryland Stadium Authority, Baltimore City Public School Construction Financing Fund
Revenue Bonds | | |
| Series C, Insured: State Intercept | | |
| 2.207%, due 5/1/31 | 1,510,000 | 1,203,362 |
Maryland State Transportation Authority
Revenue Bonds | | |
| Series B | | |
| 5.604%, due 7/1/30 | 3,000,000 | 2,973,927 |
| | | 9,156,820 |
| Massachusetts 5.4% |
Commonwealth of Massachusetts
Limited General Obligation | | |
| Series E | | |
| 1.52%, due 11/1/30 | 2,000,000 | 1,552,647 |
| Series D | | |
| 4.50%, due 8/1/31 | 1,320,000 | 1,231,205 |
| Series E | | |
| 5.50%, due 10/1/29 | 9,000,000 | 9,078,819 |
| Series E | | |
| 5.50%, due 10/1/31 | 5,050,000 | 5,052,284 |
Commonwealth of Massachusetts, COVID-19 Recovery Assessment
Revenue Bonds | | |
| Series A | | |
| 3.769%, due 7/15/29 | 7,250,000 | 6,734,431 |
| Series A | | |
| 3.881%, due 1/15/31 | 7,900,000 | 7,177,781 |
Massachusetts Bay Transportation Authority, Sales Tax
Revenue Bonds | | |
| Series B | | |
| 2.235%, due 7/1/31 | 7,795,000 | 6,130,219 |
Massachusetts Port Authority
Revenue Bonds | | |
| Series C | | |
| 1.679%, due 7/1/31 | 1,625,000 | 1,239,173 |
| | Principal
Amount | Value |
| |
| Massachusetts (continued) |
Massachusetts School Building Authority
Revenue Bonds, Senior Lien | | |
| Series B | | |
| 1.753%, due 8/15/30 | $ 3,725,000 | $ 3,016,790 |
Massachusetts Water Resources Authority
Revenue Bonds | | |
| Series C | | |
| 1.94%, due 8/1/30 | 1,500,000 | 1,209,426 |
| Series C | | |
| 2.09%, due 8/1/31 | 1,055,000 | 830,643 |
| Series E | | |
| 2.323%, due 8/1/29 | 2,015,000 | 1,721,047 |
University of Massachusetts, Building Authority
Revenue Bonds, Senior Lien | | |
| Series 4 | | |
| 2.008%, due 11/1/31 | 2,730,000 | 2,104,873 |
| Series 2 | | |
| 3.646%, due 11/1/34 | 2,495,000 | 2,077,819 |
| | | 49,157,157 |
| Michigan 1.3% |
Great Lakes Water Authority, Sewage Disposal System
Revenue Bonds, Senior Lien | | |
| Series A | | |
| 2.365%, due 7/1/32 | 1,000,000 | 784,256 |
Michigan Finance Authority, Local Government Loan Program
Revenue Bonds | | |
| Series E, Insured: State Aid Direct Deposit | | |
| 8.369%, due 11/1/35 | 715,000 | 816,468 |
Michigan State Building Authority
Revenue Bonds | | |
| Series II | | |
| 1.812%, due 10/15/31 | 2,000,000 | 1,525,001 |
University of Michigan
Revenue Bonds | | |
| Series B | | |
| 1.672%, due 4/1/30 | 5,120,000 | 4,121,617 |
| Series D | | |
| 5.183%, due 4/1/35 | 5,000,000 | 4,798,729 |
| | | 12,046,071 |
The notes to the financial statements are an integral part of, and should be read in conjunction with, the financial statements.
17
Portfolio of Investments October 31, 2023†^ (continued)
| | Principal
Amount | Value |
| Municipal Bonds (continued) |
| Minnesota 0.9% |
University of Minnesota
Revenue Bonds | | |
| Series B | | |
| 5.018%, due 8/1/35 | $ 7,685,000 | $ 7,272,786 |
Western Minnesota Municipal Power Agency
Revenue Bonds | | |
| Series A | | |
| 2.595%, due 1/1/29 | 1,000,000 | 884,170 |
| | | 8,156,956 |
| Mississippi 1.6% |
State of Mississippi
Unlimited General Obligation | | |
| Series B | | |
| 1.699%, due 6/1/29 | 2,935,000 | 2,440,768 |
| Series B | | |
| 1.849%, due 6/1/30 | 2,135,000 | 1,735,780 |
| Series E | | |
| 1.987%, due 10/1/30 | 7,835,000 | 6,355,654 |
| Series D | | |
| 2.187%, due 10/1/32 | 4,000,000 | 3,077,152 |
| Series D | | |
| 3.729%, due 10/1/32 | 1,000,000 | 877,704 |
| | | 14,487,058 |
| Missouri 1.2% |
Health & Educational Facilities Authority of the State of Missouri, Washington University (The)
Revenue Bonds | | |
| Series A | | |
| 3.471%, due 1/15/36 | 5,000,000 | 4,004,431 |
| Series A | | |
| 3.535%, due 2/15/33 | 1,300,000 | 1,102,196 |
Missouri Highway & Transportation Commission, Federal Reimbursement State Road
Revenue Bonds | | |
| Series B | | |
| 5.445%, due 5/1/33 | 6,120,000 | 6,009,818 |
| | | 11,116,445 |
| Nebraska 0.3% |
City of Lincoln, Electric System
Revenue Bonds | | |
| Series B | | |
| 1.499%, due 9/1/30 | 3,000,000 | 2,325,120 |
| | Principal
Amount | Value |
| |
| New Jersey 1.5% |
New Jersey Turnpike Authority
Revenue Bonds | | |
| Series B | | |
| 1.483%, due 1/1/28 | $ 2,000,000 | $ 1,726,779 |
| Series B | | |
| 1.713%, due 1/1/29 | 3,235,000 | 2,725,914 |
| Series B | | |
| 2.213%, due 1/1/34 | 1,220,000 | 902,499 |
State of New Jersey
Unlimited General Obligation | | |
| Series A | | |
| 2.30%, due 6/1/27 | 1,000,000 | 904,987 |
| Series A | | |
| 2.75%, due 6/1/31 | 3,900,000 | 3,243,925 |
| Series A, Insured: BAM | | |
| 2.90%, due 6/1/33 | 5,180,000 | 4,184,525 |
| | | 13,688,629 |
| New Mexico 0.1% |
City of Albuquerque, Gross Receipts Tax
Revenue Bonds | | |
| Series C | | |
| 2.205%, due 7/1/32 | 1,420,000 | 1,094,013 |
| New York 10.0% |
Brookhaven Local Development Corp., Long Island Community Hospital Health Care Services Foundation
Revenue Bonds | | |
| Series B, Insured: AGM-CR | | |
| 6.00%, due 10/1/30 | 1,855,000 | 1,842,116 |
City of New York
Unlimited General Obligation | | |
| Series D | | |
| 1.623%, due 8/1/28 | 6,500,000 | 5,471,133 |
| Series D | | |
| 1.723%, due 8/1/29 | 1,300,000 | 1,059,114 |
| Series D-2 | | |
| 1.75%, due 3/1/30 | 2,450,000 | 1,954,287 |
| Series D-3 | | |
| 1.97%, due 3/1/31 | 1,000,000 | 779,486 |
| Series A-3 | | |
| 2.80%, due 8/1/30 | 2,820,000 | 2,376,422 |
| Series E-2 | | |
| 4.90%, due 4/1/34 | 2,000,000 | 1,850,651 |
| Series B-2 | | |
| 5.514%, due 10/1/30 | 3,880,000 | 3,838,574 |
The notes to the financial statements are an integral part of, and should be read in conjunction with, the financial statements.
| 18 | MainStay MacKay U.S. Infrastructure Bond Fund |
| | Principal
Amount | Value |
| Municipal Bonds (continued) |
| New York (continued) |
City of New York
Unlimited General Obligation
(continued) | | |
| Series B-2 | | |
| 5.625%, due 10/1/31 | $ 2,110,000 | $ 2,087,657 |
Metropolitan Transportation Authority
Revenue Bonds | | |
| Series B-1 | | |
| 6.548%, due 11/15/31 | 6,245,000 | 6,285,449 |
New York City Transitional Finance Authority, Future Tax Secured
Revenue Bonds | | |
| Series C-2 | | |
| 1.55%, due 5/1/28 | 1,000,000 | 845,621 |
| Series B-3 | | |
| 3.00%, due 11/1/33 | 1,000,000 | 782,766 |
| Series C-3 | | |
| 3.35%, due 11/1/30 | 4,000,000 | 3,461,452 |
| Series A-2 | | |
| 4.60%, due 5/1/30 | 6,000,000 | 5,659,322 |
| Series D-3 | | |
| 5.65%, due 11/1/35 | 6,000,000 | 5,820,118 |
New York Power Authority
Revenue Bonds | | |
| Series A, Insured: AGM | | |
| 5.749%, due 11/15/33 | 6,530,000 | 6,592,214 |
New York State Dormitory Authority, State University of New York Dormitory Facilities
Revenue Bonds | | |
| Series A | | |
| 2.462%, due 7/1/32 | 4,750,000 | 3,686,715 |
New York State Dormitory Authority, State Personal Income Tax
Revenue Bonds | | |
| Series H | | |
| 5.289%, due 3/15/33 | 6,935,000 | 6,716,690 |
New York State Urban Development Corp., Sales Tax
Revenue Bonds | | |
| Series B | | |
| 1.75%, due 3/15/28 | 3,580,000 | 3,083,649 |
New York State Urban Development Corp., Personal Income Tax
Revenue Bonds | | |
| Series B | | |
| 1.777%, due 3/15/28 | 3,500,000 | 3,006,032 |
| | Principal
Amount | Value |
| |
| New York (continued) |
New York State Urban Development Corp., Personal Income Tax
Revenue Bonds (continued) | | |
| Series D | | |
| 3.32%, due 3/15/29 | $ 4,990,000 | $ 4,488,346 |
New York Transportation Development Corp., LaGuardia Airport Terminal B Redevelopment Project
Revenue Bonds | | |
| Series B, Insured: AGM-CR | | |
| 3.473%, due 7/1/28 | 4,860,000 | 4,460,089 |
Port Authority of New York & New Jersey
Revenue Bonds | | |
| Series 159 | | |
| 6.04%, due 12/1/29 | 5,000,000 | 5,124,495 |
State of New York
Unlimited General Obligation | | |
| Series B | | |
| 2.10%, due 3/15/33 | 2,490,000 | 1,854,016 |
| Series B | | |
| 2.95%, due 2/15/34 | 2,500,000 | 1,976,667 |
State of New York, Build America Bonds
Unlimited General Obligation | | |
| Series C | | |
| 5.54%, due 3/1/30 | 5,000,000 | 5,015,926 |
| | | 90,119,007 |
| North Carolina 0.9% |
City of Charlotte
Unlimited General Obligation | | |
| Series A | | |
| 4.75%, due 6/1/29 | 3,630,000 | 3,545,514 |
North Carolina Turnpike Authority, Monroe Connector System
Revenue Bonds | | |
| Series A | | |
| 5.318%, due 1/1/31 | 3,000,000 | 2,959,120 |
University of North Carolina at Chapel Hill
Revenue Bonds | | |
| 3.847%, due 12/1/34 | 1,530,000 | 1,326,363 |
| | | 7,830,997 |
| Ohio 3.0% |
American Municipal Power, Inc., Combined Hydroelectric
Revenue Bonds | | |
| Series B | | |
| 6.424%, due 2/15/32 | 1,455,000 | 1,498,394 |
The notes to the financial statements are an integral part of, and should be read in conjunction with, the financial statements.
19
Portfolio of Investments October 31, 2023†^ (continued)
| | Principal
Amount | Value |
| Municipal Bonds (continued) |
| Ohio (continued) |
County of Lucas
Revenue Notes | | |
| 6.25%, due 10/11/24 | $ 8,330,000 | $ 8,344,149 |
Franklin County Convention Facilities Authority
Revenue Bonds | | |
| Series B | | |
| 2.022%, due 12/1/30 | 4,795,000 | 3,762,661 |
JobsOhio Beverage System
Revenue Bonds, Senior Lien | | |
| 4.433%, due 1/1/33 | 7,000,000 | 6,671,528 |
Ohio Higher Educational Facility Commission, Ashtabula County Medical Center Obligated Group
Revenue Bonds | | |
| 5.25%, due 1/1/42 | 2,000,000 | 1,896,130 |
Ohio State University (The), General Receipts
Revenue Bonds | | |
| Series B | | |
| 3.673%, due 6/1/33 | 1,000,000 | 908,224 |
State of Ohio, Build America Bonds
Unlimited General Obligation | | |
| Series B | | |
| 5.462%, due 9/1/30 | 2,000,000 | 2,013,319 |
Summit County Development Finance Authority, Franciscan University of Steubenville Project
Revenue Bonds | | |
| Series A | | |
| 6.00%, due 11/1/48 (b) | 1,750,000 | 1,621,746 |
| | | 26,716,151 |
| Oklahoma 0.1% |
Oklahoma Municipal Power Authority, Power Supply System
Revenue Bonds | | |
| Series B, Insured: AGM | | |
| 2.251%, due 1/1/32 | 1,300,000 | 1,002,717 |
| Oregon 3.3% |
City of Portland, Affordable Housing Project
Unlimited General Obligation | | |
| Series A | | |
| 4.37%, due 6/15/28 | 1,855,000 | 1,803,868 |
| | Principal
Amount | Value |
| |
| Oregon (continued) |
City of Portland, Affordable Housing Project
Unlimited General Obligation
(continued) | | |
| Series A | | |
| 4.43%, due 6/15/29 | $ 2,270,000 | $ 2,194,327 |
Metro
Unlimited General Obligation | | |
| 3.10%, due 6/1/31 | 1,000,000 | 853,210 |
Oregon State Lottery
Revenue Bonds | | |
| Series B | | |
| 1.641%, due 4/1/28 | 9,500,000 | 8,186,902 |
| Series B | | |
| 1.875%, due 4/1/29 | 3,900,000 | 3,286,415 |
| Series B | | |
| 3.821%, due 4/1/31 | 3,000,000 | 2,705,437 |
| Series B, Insured: Moral Obligation | | |
| 4.303%, due 4/1/31 | 2,000,000 | 1,850,248 |
Port of Morrow, Bonneville Power Administration
Revenue Bonds | | |
| Series 1 | | |
| 2.987%, due 9/1/36 | 5,810,000 | 4,449,518 |
State of Oregon, Department of Transportation
Revenue Bonds, Senior Lien | | |
| Series B | | |
| 1.53%, due 11/15/30 | 2,500,000 | 1,950,536 |
State of Oregon
Unlimited General Obligation | | |
| Series C | | |
| 1.975%, due 5/1/31 | 1,000,000 | 788,153 |
Tri-County Metropolitan Transportation, District of Oregon
Revenue Bonds, Senior Lien | | |
| Series B | | |
| 2.583%, due 9/1/36 | 2,100,000 | 1,516,677 |
| | | 29,585,291 |
| Pennsylvania 1.6% |
Authority Improvement Municipalities, Carlow University
Revenue Bonds | | |
| Series B | | |
| 5.00%, due 11/1/53 | 750,000 | 483,219 |
The notes to the financial statements are an integral part of, and should be read in conjunction with, the financial statements.
| 20 | MainStay MacKay U.S. Infrastructure Bond Fund |
| | Principal
Amount | Value |
| Municipal Bonds (continued) |
| Pennsylvania (continued) |
City of Philadelphia
Unlimited General Obligation | | |
| Series B, Insured: AGM | | |
| 1.618%, due 7/15/29 | $ 2,505,000 | $ 2,026,215 |
| Series B, Insured: AGM | | |
| 1.738%, due 7/15/30 | 2,250,000 | 1,761,282 |
City of Philadelphia, Water & Wastewater
Revenue Bonds | | |
| Series B | | |
| 2.034%, due 11/1/31 | 1,000,000 | 804,254 |
City of Pittsburgh
Unlimited General Obligation | | |
| Series B | | |
| 1.619%, due 9/1/29 | 1,570,000 | 1,284,214 |
Commonwealth of Pennsylvania
Unlimited General Obligation | | |
| Series 1 | | |
| 2.05%, due 8/1/31 | 4,020,000 | 3,133,312 |
County of Allegheny
Unlimited General Obligation | | |
| Series C-79 | | |
| 1.786%, due 11/1/30 | 1,000,000 | 787,628 |
Erie City Water Authority
Revenue Bonds | | |
| Series D, Insured: AGM | | |
| 1.961%, due 12/1/30 | 2,945,000 | 2,333,227 |
University of Pittsburgh-of the Commonwealth System of Higher Education
Revenue Bonds | | |
| Series B | | |
| 3.596%, due 9/15/30 | 2,000,000 | 1,783,833 |
| | | 14,397,184 |
| Rhode Island 1.4% |
State of Rhode Island
Unlimited General Obligation | | |
| Series B | | |
| 4.79%, due 8/1/31 | 4,000,000 | 3,789,272 |
| Series B | | |
| 4.90%, due 8/1/32 | 6,000,000 | 5,673,728 |
| Series B | | |
| 5.00%, due 8/1/29 | 3,145,000 | 3,077,226 |
| | | 12,540,226 |
| | Principal
Amount | Value |
| |
| South Carolina 0.4% |
South Carolina Public Service Authority, Santee Cooper Project
Revenue Bonds | | |
| Series F, Insured: AGM-CR | | |
| 5.74%, due 1/1/30 | $ 3,690,000 | $ 3,685,492 |
| Tennessee 0.8% |
City of Memphis
Unlimited General Obligation | | |
| Series F | | |
| 6.042%, due 7/1/34 | 2,000,000 | 2,036,703 |
Metropolitan Government Nashville & Davidson County Sports Authority, Stadium Project
Revenue Bonds | | |
| Series D | | |
| 4.98%, due 7/1/29 | 1,315,000 | 1,283,086 |
| Series D | | |
| 5.03%, due 7/1/30 | 1,000,000 | 969,409 |
| Series D | | |
| 5.068%, due 7/1/31 | 1,600,000 | 1,539,712 |
| Series D | | |
| 5.168%, due 7/1/33 | 1,550,000 | 1,479,045 |
| | | 7,307,955 |
| Texas 9.3% |
Central Texas Regional Mobility Authority
Revenue Bonds, Senior Lien | | |
| Series C | | |
| 2.635%, due 1/1/32 | 1,500,000 | 1,185,585 |
City of Corpus Christi, Utility System
Revenue Bonds, Junior Lien | | |
| Series B | | |
| 2.166%, due 7/15/32 | 2,500,000 | 1,902,548 |
City of Dallas, Waterworks & Sewer System
Revenue Bonds | | |
| Series B | | |
| 3.648%, due 10/1/30 | 2,000,000 | 1,810,520 |
City of Frisco
Limited General Obligation | | |
| Series B | | |
| 5.25%, due 2/15/33 | 2,120,000 | 2,090,125 |
City of Houston, Combined Utility System
Revenue Bonds, First Lien | | |
| Series D | | |
| 1.972%, due 11/15/34 | 1,000,000 | 694,592 |
The notes to the financial statements are an integral part of, and should be read in conjunction with, the financial statements.
21
Portfolio of Investments October 31, 2023†^ (continued)
| | Principal
Amount | Value |
| Municipal Bonds (continued) |
| Texas (continued) |
City of Houston, Combined Utility System
Revenue Bonds, First Lien
(continued) | | |
| Series D | | |
| 2.022%, due 11/15/35 | $ 2,000,000 | $ 1,350,985 |
| Series B | | |
| 3.828%, due 5/15/28 | 2,575,000 | 2,464,504 |
City of Houston, Airport System
Revenue Bonds, Sub. Lien | | |
| Series C | | |
| 2.485%, due 7/1/32 | 1,470,000 | 1,149,234 |
City of Midland
Limited General Obligation | | |
| Series A | | |
| 3.601%, due 3/1/31 | 1,420,000 | 1,274,076 |
City of San Antonio, Electric & Gas Systems
Limited General Obligation | | |
| 1.763%, due 2/1/31 | 4,500,000 | 3,521,220 |
County of Bexar, Combined Venue Tax
Revenue Bonds | | |
| Insured: AGM | | |
| 2.434%, due 8/15/33 | 1,000,000 | 748,884 |
County of Williamson
Limited General Obligation | | |
| 1.486%, due 2/15/31 | 1,500,000 | 1,152,668 |
Dallas Area Rapid Transit
Revenue Bonds, Senior Lien | | |
| Series D | | |
| 1.828%, due 12/1/29 | 3,600,000 | 2,972,209 |
Dallas Area Rapid Transit
Revenue Bonds | | |
| Series C | | |
| 1.946%, due 12/1/31 | 1,730,000 | 1,342,497 |
Dallas Fort Worth International Airport
Revenue Bonds | | |
| Series C | | |
| 2.246%, due 11/1/31 | 2,585,000 | 2,039,495 |
| Series A | | |
| 2.454%, due 11/1/29 | 1,000,000 | 853,007 |
| Series A | | |
| 4.892%, due 11/1/34 | 1,750,000 | 1,636,329 |
| Series A | | |
| 4.942%, due 11/1/35 | 4,670,000 | 4,344,261 |
| | Principal
Amount | Value |
| |
| Texas (continued) |
Dallas Independent School District
Unlimited General Obligation | | |
| Series A, Insured: PSF-GTD | | |
| 2.533%, due 2/15/32 | $ 7,500,000 | $ 6,027,143 |
Metropolitan Transit Authority of Harris County
Revenue Bonds | | |
| Series A | | |
| 2.499%, due 11/1/34 | 4,000,000 | 2,938,793 |
North Texas Tollway Authority
Revenue Bonds, First Tier | | |
| Series B | | |
| 1.827%, due 1/1/29 | 3,300,000 | 2,777,440 |
Northwest Independent School District
Unlimited General Obligation | | |
| Series A, Insured: PSF-GTD | | |
| 1.776%, due 2/15/31 | 3,665,000 | 2,881,643 |
State of Texas, Public Finance Authority
Unlimited General Obligation | | |
| 2.526%, due 10/1/31 | 4,000,000 | 3,280,449 |
| 2.746%, due 10/1/33 | 1,000,000 | 795,284 |
| 4.68%, due 10/1/32 | 7,470,000 | 7,050,859 |
| 4.70%, due 10/1/33 | 1,000,000 | 937,609 |
| 4.90%, due 10/1/35 | 5,100,000 | 4,779,756 |
| 4.98%, due 10/1/36 | 4,250,000 | 3,975,832 |
State of Texas, Water Financial Assistance, Economically Distressed Areas Program
Unlimited General Obligation | | |
| Series D | | |
| 4.616%, due 8/1/34 | 1,000,000 | 914,956 |
State of Texas, Transportation Commission, Highway Improvement
Unlimited General Obligation | | |
| Series A | | |
| 4.631%, due 4/1/33 | 3,000,000 | 2,846,614 |
Texas Natural Gas Securitization Finance Corp.
Revenue Bonds | | |
| Series A-1 | | |
| 5.102%, due 4/1/35 | 9,000,000 | 8,717,928 |
Texas Public Finance Authority, Texas Facilities Commission
Revenue Bonds | | |
| 1.62%, due 2/1/31 | 3,655,000 | 2,819,744 |
The notes to the financial statements are an integral part of, and should be read in conjunction with, the financial statements.
| 22 | MainStay MacKay U.S. Infrastructure Bond Fund |
| | Principal
Amount | Value |
| Municipal Bonds (continued) |
| Texas (continued) |
Texas Tech University System
Revenue Bonds | | |
| 1.653%, due 2/15/29 | $ 1,250,000 | $ 1,043,181 |
| | | 84,319,970 |
| U.S. Virgin Islands 0.6% |
Matching Fund Special Purpose Securitization Corp.
Revenue Bonds | | |
| Series B | | |
| 6.00%, due 10/1/25 | 5,875,000 | 5,809,363 |
| Utah 0.9% |
County of Salt Lake, Convention Hotel
Revenue Bonds | | |
| 5.25%, due 10/1/34 (b) | 3,610,000 | 3,101,141 |
Intermountain Power Agency
Revenue Bonds | | |
| Series B | | |
| 4.978%, due 7/1/31 | 1,020,000 | 979,599 |
| Series B | | |
| 5.228%, due 7/1/35 | 2,520,000 | 2,391,793 |
Utah Board of Higher Education
Revenue Bonds | | |
| Series B | | |
| 1.656%, due 8/1/31 | 1,000,000 | 760,264 |
Utah Transit Authority
Revenue Bonds | | |
| 2.038%, due 12/15/31 | 1,050,000 | 811,222 |
| | | 8,044,019 |
| Virginia 0.6% |
Farmville Industrial Development Authority, Longwood University Student Housing Project
Revenue Bonds | | |
| Series B | | |
| 5.00%, due 1/1/34 | 2,000,000 | 1,743,325 |
Virginia College Building Authority, 21st Century College & Equipment Programs
Revenue Bonds | | |
| Series B | | |
| 1.865%, due 2/1/31 | 3,000,000 | 2,364,086 |
| | Principal
Amount | Value |
| |
| Virginia (continued) |
Virginia Commonwealth Transportation Board, Build America Bonds
Revenue Bonds | | |
| Series A-2, Insured: State Appropriations | | |
| 5.35%, due 5/15/35 | $ 1,255,000 | $ 1,219,266 |
| | | 5,326,677 |
| Washington 2.2% |
County of King, Sewer
Revenue Bonds | | |
| Series B | | |
| 1.30%, due 1/1/28 | 2,140,000 | 1,838,966 |
| Series A | | |
| 2.091%, due 7/1/34 | 1,880,000 | 1,361,872 |
Energy Northwest, Bonneville Power Administration
Revenue Bonds | | |
| Series B | | |
| 2.166%, due 7/1/32 | 2,740,000 | 2,114,955 |
Port of Seattle, Intermediate Lien
Revenue Bonds | | |
| Series C | | |
| 3.913%, due 8/1/30 | 2,200,000 | 1,997,855 |
Spokane Public Facilities District, Sales & Lodging tax
Revenue Bonds | | |
| Series B | | |
| 1.996%, due 12/1/30 | 1,950,000 | 1,551,845 |
State of Washington, Motor Vehicle Fuel Tax
Unlimited General Obligation | | |
| Series F | | |
| 5.09%, due 8/1/33 | 11,750,000 | 11,333,096 |
| | | 20,198,589 |
| West Virginia 0.3% |
County of Ohio, Special District Excise Tax
Revenue Bonds | | |
| Series A | | |
| 4.00%, due 3/1/40 | 3,500,000 | 2,336,093 |
| Wisconsin 0.8% |
State of Wisconsin
Unlimited General Obligation | | |
| Series 3 | | |
| 1.122%, due 5/1/28 | 4,100,000 | 3,446,168 |
The notes to the financial statements are an integral part of, and should be read in conjunction with, the financial statements.
23
Portfolio of Investments October 31, 2023†^ (continued)
| | Principal
Amount | Value |
| Municipal Bonds (continued) |
| Wisconsin (continued) |
State of Wisconsin
Unlimited General Obligation
(continued) | | |
| Series 2 | | |
| 2.614%, due 5/1/32 | $ 4,250,000 | $ 3,407,614 |
Wisconsin Department of Transportation
Revenue Bonds | | |
| Series 1 | | |
| 1.789%, due 7/1/33 | 1,000,000 | 719,602 |
| | | 7,573,384 |
Total Municipal Bonds
(Cost $863,898,234) | | 832,321,237 |
| U.S. Government & Federal Agencies 0.0% ‡ |
| Federal Home Loan Mortgage Corporation (Mortgage Pass-Through Securities) 0.0% ‡ |
| FHLMC Gold Pools, 30 Year | | |
| 4.00%, due 10/1/48 | 112,624 | 99,368 |
| 6.50%, due 4/1/37 | 22,186 | 22,815 |
| | | 122,183 |
| Government National Mortgage Association (Mortgage Pass-Through Security) 0.0% ‡ |
| GNMA I, 30 Year | | |
| 6.50%, due 4/15/31 | 67,762 | 67,695 |
Total U.S. Government & Federal Agencies
(Cost $204,171) | | 189,878 |
Total Long-Term Bonds
(Cost $897,603,306) | | 864,448,141 |
| |
| | Shares | |
| |
| Short-Term Investments 1.6% |
| Affiliated Investment Company 0.1% |
| MainStay U.S. Government Liquidity Fund, 5.275% (c) | 825,933 | 825,933 |
| |
| | Principal
Amount | | Value |
| |
| Short-Term Municipal Notes 1.5% |
| Mizuho Floater (b)(d) | | | |
| 5.73%, due 12/1/52 | $ 4,750,000 | | $ 4,750,000 |
| 5.73%, due 12/1/62 | 8,750,000 | | 8,750,000 |
Total Short-Term Municipal Notes
(Cost $13,500,000) | | | 13,500,000 |
Total Short-Term Investments
(Cost $14,325,933) | | | 14,325,933 |
Total Investments
(Cost $911,929,239) | 97.0% | | 878,774,074 |
| Other Assets, Less Liabilities | 3.0 | | 27,590,875 |
| Net Assets | 100.0% | | $ 906,364,949 |
| † | Percentages indicated are based on Fund net assets. |
| ^ | Industry classifications may be different than those used for compliance monitoring purposes. |
| ‡ | Less than one-tenth of a percent. |
| (a) | Coupon rate may change based on changes of the underlying collateral or prepayments of principal. Rate shown was the rate in effect as of October 31, 2023. |
| (b) | May be sold to institutional investors only under Rule 144A or securities offered pursuant to Section 4(a)(2) of the Securities Act of 1933, as amended. |
| (c) | Current yield as of October 31, 2023. |
| (d) | Variable-rate demand notes (VRDNs)—Provide the right to sell the security at face value on either that day or within the rate-reset period. VRDNs will normally trade as if the maturity is the earlier put date, even though stated maturity is longer. The interest rate is reset on the put date at a stipulated daily, weekly, monthly, quarterly, or other specified time interval to reflect current market conditions. These securities do not indicate a reference rate and spread in their description. The maturity date shown is the final maturity. |
The notes to the financial statements are an integral part of, and should be read in conjunction with, the financial statements.
| 24 | MainStay MacKay U.S. Infrastructure Bond Fund |
Investments in Affiliates (in 000's)
Investments in issuers considered to be affiliate(s) of the Fund during the year ended October 31, 2023 for purposes of Section 2(a)(3) of the Investment Company Act of 1940, as amended, were as follows:
| Affiliated Investment Companies | Value,
Beginning
of Year | Purchases
at Cost | Proceeds
from
Sales | Net
Realized
Gain/(Loss)
on Sales | Change in
Unrealized
Appreciation/
(Depreciation) | Value,
End of
Year | Dividend
Income | Other
Distributions | Shares
End of
Year |
| MainStay U.S. Government Liquidity Fund | $ 40,537 | $ 741,248 | $ (780,959) | $ — | $ — | $ 826 | $ 1,099 | $ — | 826 |
| Abbreviation(s): |
| AGM—Assured Guaranty Municipal Corp. |
| AMBAC—Ambac Assurance Corp. |
| BAM—Build America Mutual Assurance Co. |
| CR—Custodial Receipts |
| FHLMC—Federal Home Loan Mortgage Corp. |
| GNMA—Government National Mortgage Association |
| NATL-RE—National Public Finance Guarantee Corp. |
| PSF-GTD—Permanent School Fund Guaranteed |
The following is a summary of the fair valuations according to the inputs used as of October 31, 2023, for valuing the Fund’s assets:
| Description | Quoted
Prices in
Active
Markets for
Identical
Assets
(Level 1) | | Significant
Other
Observable
Inputs
(Level 2) | | Significant
Unobservable
Inputs
(Level 3) | | Total |
| Asset Valuation Inputs | | | | | | | |
| Investments in Securities (a) | | | | | | | |
| Long-Term Bonds | | | | | | | |
| Corporate Bonds | $ — | | $ 31,937,026 | | $ — | | $ 31,937,026 |
| Municipal Bonds | — | | 832,321,237 | | — | | 832,321,237 |
| U.S. Government & Federal Agencies | — | | 189,878 | | — | | 189,878 |
| Total Long-Term Bonds | — | | 864,448,141 | | — | | 864,448,141 |
| Short-Term Investments | | | | | | | |
| Affiliated Investment Company | 825,933 | | — | | — | | 825,933 |
| Short-Term Municipal Notes | — | | 13,500,000 | | — | | 13,500,000 |
| Total Short-Term Investments | 825,933 | | 13,500,000 | | — | | 14,325,933 |
| Total Investments in Securities | $ 825,933 | | $ 877,948,141 | | $ — | | $ 878,774,074 |
| (a) | For a complete listing of investments and their industries, see the Portfolio of Investments. |
The notes to the financial statements are an integral part of, and should be read in conjunction with, the financial statements.
25
Statement of Assets and Liabilities as of October 31, 2023
| Assets |
Investment in unaffiliated securities, at value
(identified cost $911,103,306) | $ 877,948,141 |
Investment in affiliated investment companies, at value
(identified cost $825,933) | 825,933 |
| Receivables: | |
| Investment securities sold | 24,775,607 |
| Dividends and interest | 9,416,335 |
| Fund shares sold | 4,362,359 |
| Other assets | 87,433 |
| Total assets | 917,415,808 |
| Liabilities |
| Payables: | |
| Investment securities purchased | 5,659,908 |
| Fund shares redeemed | 4,101,754 |
| Manager (See Note 3) | 266,335 |
| Transfer agent (See Note 3) | 197,578 |
| NYLIFE Distributors (See Note 3) | 24,210 |
| Custodian | 23,464 |
| Professional fees | 13,116 |
| Shareholder communication | 5,350 |
| Accrued expenses | 770 |
| Distributions payable | 758,374 |
| Total liabilities | 11,050,859 |
| Net assets | $ 906,364,949 |
| Composition of Net Assets |
| Shares of beneficial interest outstanding (par value of $.01 per share) unlimited number of shares authorized | $ 1,268,771 |
| Additional paid-in-capital | 1,030,238,024 |
| | 1,031,506,795 |
| Total distributable earnings (loss) | (125,141,846) |
| Net assets | $ 906,364,949 |
| Class A | |
| Net assets applicable to outstanding shares | $ 78,067,730 |
| Shares of beneficial interest outstanding | 11,040,143 |
| Net asset value per share outstanding | $ 7.07 |
| Maximum sales charge (3.00% of offering price) | 0.22 |
| Maximum offering price per share outstanding | $ 7.29 |
| Investor Class | |
| Net assets applicable to outstanding shares | $ 13,065,575 |
| Shares of beneficial interest outstanding | 1,839,223 |
| Net asset value per share outstanding | $ 7.10 |
| Maximum sales charge (2.50% of offering price) | 0.18 |
| Maximum offering price per share outstanding | $ 7.28 |
| Class B | |
| Net assets applicable to outstanding shares | $ 293,812 |
| Shares of beneficial interest outstanding | 41,541 |
| Net asset value and offering price per share outstanding | $ 7.07 |
| Class C | |
| Net assets applicable to outstanding shares | $ 4,733,547 |
| Shares of beneficial interest outstanding | 669,821 |
| Net asset value and offering price per share outstanding | $ 7.07 |
| Class I | |
| Net assets applicable to outstanding shares | $683,014,266 |
| Shares of beneficial interest outstanding | 95,513,190 |
| Net asset value and offering price per share outstanding | $ 7.15 |
| Class R6 | |
| Net assets applicable to outstanding shares | $127,190,019 |
| Shares of beneficial interest outstanding | 17,773,135 |
| Net asset value and offering price per share outstanding | $ 7.16 |
The notes to the financial statements are an integral part of, and should be read in conjunction with, the financial statements.
| 26 | MainStay MacKay U.S. Infrastructure Bond Fund |
Statement of Operations for the year ended October 31, 2023
| Investment Income (Loss) |
| Income | |
| Interest | $ 32,495,276 |
| Dividends-affiliated | 1,099,146 |
| Total income | 33,594,422 |
| Expenses | |
| Manager (See Note 3) | 3,416,982 |
| Transfer agent (See Note 3) | 1,129,656 |
| Distribution/Service—Class A (See Note 3) | 196,618 |
| Distribution/Service—Investor Class (See Note 3) | 34,940 |
| Distribution/Service—Class B (See Note 3) | 4,854 |
| Distribution/Service—Class C (See Note 3) | 57,298 |
| Registration | 131,055 |
| Professional fees | 115,349 |
| Custodian | 81,558 |
| Shareholder communication | 35,294 |
| Trustees | 17,157 |
| Miscellaneous | 25,240 |
| Total expenses before waiver/reimbursement | 5,246,001 |
| Expense waiver/reimbursement from Manager (See Note 3) | (807,420) |
| Reimbursement from prior custodian(a) | (1,101) |
| Net expenses | 4,437,480 |
| Net investment income (loss) | 29,156,942 |
| Realized and Unrealized Gain (Loss) |
| Net realized gain (loss) on: | |
| Unaffiliated investment transactions | (28,130,346) |
| Futures transactions | 1,339,322 |
| Net realized gain (loss) | (26,791,024) |
| Net change in unrealized appreciation (depreciation) on: | |
| Unaffiliated investments | (940,190) |
| Futures contracts | (1,701,802) |
| Net change in unrealized appreciation (depreciation) | (2,641,992) |
| Net realized and unrealized gain (loss) | (29,433,016) |
| Net increase (decrease) in net assets resulting from operations | $ (276,074) |
| (a) | Represents a refund for overbilling of custody fees. |
The notes to the financial statements are an integral part of, and should be read in conjunction with, the financial statements.
27
Statements of Changes in Net Assets
for the years ended October 31, 2023 and October 31, 2022
| | 2023 | 2022 |
| Increase (Decrease) in Net Assets |
| Operations: | | |
| Net investment income (loss) | $ 29,156,942 | $ 13,838,405 |
| Net realized gain (loss) | (26,791,024) | (64,129,820) |
| Net change in unrealized appreciation (depreciation) | (2,641,992) | (41,992,401) |
| Net increase (decrease) in net assets resulting from operations | (276,074) | (92,283,816) |
| Distributions to shareholders: | | |
| Class A | (3,190,609) | (2,991,990) |
| Investor Class | (522,064) | (464,952) |
| Class B | (14,468) | (21,454) |
| Class C | (171,500) | (166,814) |
| Class I | (20,530,573) | (10,840,872) |
| Class R6 | (4,837,944) | (4,569,870) |
| Total distributions to shareholders | (29,267,158) | (19,055,952) |
| Capital share transactions: | | |
| Net proceeds from sales of shares | 673,028,663 | 323,563,093 |
| Net asset value of shares issued to shareholders in reinvestment of distributions | 22,229,651 | 13,320,339 |
| Cost of shares redeemed | (264,606,267) | (336,252,102) |
| Increase (decrease) in net assets derived from capital share transactions | 430,652,047 | 631,330 |
| Net increase (decrease) in net assets | 401,108,815 | (110,708,438) |
| Net Assets |
| Beginning of year | 505,256,134 | 615,964,572 |
| End of year | $ 906,364,949 | $ 505,256,134 |
The notes to the financial statements are an integral part of, and should be read in conjunction with, the financial statements.
| 28 | MainStay MacKay U.S. Infrastructure Bond Fund |
Financial Highlights selected per share data and ratios
| | Year Ended October 31, |
| Class A | 2023 | | 2022 | | 2021 | | 2020 | | 2019 |
| Net asset value at beginning of year | $ 7.20 | | $ 8.74 | | $ 8.77 | | $ 8.64 | | $ 7.93 |
| Net investment income (loss) (a) | 0.30 | | 0.18 | | 0.13 | | 0.16 | | 0.21 |
| Net realized and unrealized gain (loss) | (0.13) | | (1.47) | | 0.07 | | 0.14 | | 0.71 |
| Total from investment operations | 0.17 | | (1.29) | | 0.20 | | 0.30 | | 0.92 |
| Less distributions: | | | | | | | | | |
| From net investment income | (0.30) | | (0.18) | | (0.13) | | (0.17) | | (0.21) |
| From net realized gain on investments | — | | (0.07) | | (0.10) | | — | | — |
| Return of capital | — | | — | | — | | — | | (0.00)‡ |
| Total distributions | (0.30) | | (0.25) | | (0.23) | | (0.17) | | (0.21) |
| Net asset value at end of year | $ 7.07 | | $ 7.20 | | $ 8.74 | | $ 8.77 | | $ 8.64 |
| Total investment return (b) | 2.26% | | (14.98)% | | 2.36% | | 3.45% | | 11.76% |
| Ratios (to average net assets)/Supplemental Data: | | | | | | | | | |
| Net investment income (loss) | 4.04% | | 2.20% | | 1.49% | | 1.84% | | 2.52% |
| Net expenses (c) | 0.85% | | 0.85% | | 0.85% | | 0.85% | | 0.89% |
| Expenses (before waiver/reimbursement) (c) | 0.99% | | 0.98% | | 0.96% | | 0.98% | | 1.02% |
| Portfolio turnover rate (d) | 130% | | 170% | | 51% | | 89% | | 124% |
| Net assets at end of year (in 000’s) | $ 78,068 | | $ 75,780 | | $ 111,626 | | $ 103,475 | | $ 84,513 |
| ‡ | Less than one cent per share. |
| (a) | Per share data based on average shares outstanding during the year. |
| (b) | Total investment return is calculated exclusive of sales charges and assumes the reinvestment of dividends and distributions. For periods of less than one year, total return is not annualized. |
| (c) | In addition to the fees and expenses which the Fund bears directly, it also indirectly bears a pro-rata share of the fees and expenses of the underlying funds in which it invests. Such indirect expenses are not included in the above expense ratios. |
| (d) | The portfolio turnover rate includes variable rate demand notes. |
| | Year Ended October 31, |
| Investor Class | 2023 | | 2022 | | 2021 | | 2020 | | 2019 |
| Net asset value at beginning of year | $ 7.24 | | $ 8.78 | | $ 8.81 | | $ 8.68 | | $ 7.97 |
| Net investment income (loss) (a) | 0.28 | | 0.16 | | 0.10 | | 0.14 | | 0.19 |
| Net realized and unrealized gain (loss) | (0.14) | | (1.47) | | 0.07 | | 0.13 | | 0.71 |
| Total from investment operations | 0.14 | | (1.31) | | 0.17 | | 0.27 | | 0.90 |
| Less distributions: | | | | | | | | | |
| From net investment income | (0.28) | | (0.16) | | (0.10) | | (0.14) | | (0.19) |
| From net realized gain on investments | — | | (0.07) | | (0.10) | | — | | — |
| Return of capital | — | | — | | — | | — | | (0.00)‡ |
| Total distributions | (0.28) | | (0.23) | | (0.20) | | (0.14) | | (0.19) |
| Net asset value at end of year | $ 7.10 | | $ 7.24 | | $ 8.78 | | $ 8.81 | | $ 8.68 |
| Total investment return (b) | 1.80% | | (15.14)% | | 2.02% | | 3.14% | | 11.36% |
| Ratios (to average net assets)/Supplemental Data: | | | | | | | | | |
| Net investment income (loss) | 3.72% | | 1.95% | | 1.16% | | 1.57% | | 2.21% |
| Net expenses (c) | 1.15% | | 1.12% | | 1.17% | | 1.15% | | 1.21% |
| Expenses (before waiver/reimbursement) (c) | 1.37% | | 1.25% | | 1.33% | | 1.28% | | 1.35% |
| Portfolio turnover rate (d) | 130% | | 170% | | 51% | | 89% | | 124% |
| Net assets at end of year (in 000's) | $ 13,066 | | $ 13,974 | | $ 17,994 | | $ 19,459 | | $ 20,520 |
| ‡ | Less than one cent per share. |
| (a) | Per share data based on average shares outstanding during the year. |
| (b) | Total investment return is calculated exclusive of sales charges and assumes the reinvestment of dividends and distributions. For periods of less than one year, total return is not annualized. |
| (c) | In addition to the fees and expenses which the Fund bears directly, it also indirectly bears a pro-rata share of the fees and expenses of the underlying funds in which it invests. Such indirect expenses are not included in the above expense ratios. |
| (d) | The portfolio turnover rate includes variable rate demand notes. |
The notes to the financial statements are an integral part of, and should be read in conjunction with, the financial statements.
29
Financial Highlights selected per share data and ratios
| | Year Ended October 31, |
| Class B | 2023 | | 2022 | | 2021 | | 2020 | | 2019 |
| Net asset value at beginning of year | $ 7.20 | | $ 8.74 | | $ 8.77 | | $ 8.64 | | $ 7.94 |
| Net investment income (loss) (a) | 0.22 | | 0.09 | | 0.04 | | 0.07 | | 0.12 |
| Net realized and unrealized gain (loss) | (0.13) | | (1.46) | | 0.07 | | 0.14 | | 0.70 |
| Total from investment operations | 0.09 | | (1.37) | | 0.11 | | 0.21 | | 0.82 |
| Less distributions: | | | | | | | | | |
| From net investment income | (0.22) | | (0.10) | | (0.04) | | (0.08) | | (0.12) |
| From net realized gain on investments | — | | (0.07) | | (0.10) | | — | | — |
| Return of capital | — | | — | | — | | — | | (0.00)‡ |
| Total distributions | (0.22) | | (0.17) | | (0.14) | | (0.08) | | (0.12) |
| Net asset value at end of year | $ 7.07 | | $ 7.20 | | $ 8.74 | | $ 8.77 | | $ 8.64 |
| Total investment return (b) | 1.19% | | (15.84)% | | 1.28% | | 2.39% | | 10.46% |
| Ratios (to average net assets)/Supplemental Data: | | | | | | | | | |
| Net investment income (loss) | 2.96% | | 1.11% | | 0.42% | | 0.85% | | 1.46% |
| Net expenses (c) | 1.91% | | 1.87% | | 1.92% | | 1.90% | | 1.96% |
| Expenses (before waiver/reimbursement) (c) | 2.13% | | 2.00% | | 2.08% | | 2.03% | | 2.10% |
| Portfolio turnover rate (d) | 130% | | 170% | | 51% | | 89% | | 124% |
| Net assets at end of year (in 000’s) | $ 294 | | $ 623 | | $ 1,343 | | $ 1,902 | | $ 2,621 |
| ‡ | Less than one cent per share. |
| (a) | Per share data based on average shares outstanding during the year. |
| (b) | Total investment return is calculated exclusive of sales charges and assumes the reinvestment of dividends and distributions. For periods of less than one year, total return is not annualized. |
| (c) | In addition to the fees and expenses which the Fund bears directly, it also indirectly bears a pro-rata share of the fees and expenses of the underlying funds in which it invests. Such indirect expenses are not included in the above expense ratios. |
| (d) | The portfolio turnover rate includes variable rate demand notes. |
| | Year Ended October 31, |
| Class C | 2023 | | 2022 | | 2021 | | 2020 | | 2019 |
| Net asset value at beginning of year | $ 7.20 | | $ 8.74 | | $ 8.77 | | $ 8.64 | | $ 7.93 |
| Net investment income (loss) (a) | 0.22 | | 0.11 | | 0.04 | | 0.08 | | 0.12 |
| Net realized and unrealized gain (loss) | (0.13) | | (1.48) | | 0.07 | | 0.13 | | 0.71 |
| Total from investment operations | 0.09 | | (1.37) | | 0.11 | | 0.21 | | 0.83 |
| Less distributions: | | | | | | | | | |
| From net investment income | (0.22) | | (0.10) | | (0.04) | | (0.08) | | (0.12) |
| From net realized gain on investments | — | | (0.07) | | (0.10) | | — | | — |
| Return of capital | — | | — | | — | | — | | (0.00)‡ |
| Total distributions | (0.22) | | (0.17) | | (0.14) | | (0.08) | | (0.12) |
| Net asset value at end of year | $ 7.07 | | $ 7.20 | | $ 8.74 | | $ 8.77 | | $ 8.64 |
| Total investment return (b) | 1.19% | | (15.84)% | | 1.27% | | 2.38% | | 10.59% |
| Ratios (to average net assets)/Supplemental Data: | | | | | | | | | |
| Net investment income (loss) | 2.98% | | 1.38% | | 0.42% | | 0.88% | | 1.47% |
| Net expenses (c) | 1.91% | | 1.87% | | 1.92% | | 1.90% | | 1.96% |
| Expenses (before waiver/reimbursement) (c) | 2.13% | | 2.00% | | 2.08% | | 2.02% | | 2.10% |
| Portfolio turnover rate (d) | 130% | | 170% | | 51% | | 89% | | 124% |
| Net assets at end of year (in 000’s) | $ 4,734 | | $ 7,037 | | $ 6,481 | | $ 8,708 | | $ 14,152 |
| ‡ | Less than one cent per share. |
| (a) | Per share data based on average shares outstanding during the year. |
| (b) | Total investment return is calculated exclusive of sales charges and assumes the reinvestment of dividends and distributions. For periods of less than one year, total return is not annualized. |
| (c) | In addition to the fees and expenses which the Fund bears directly, it also indirectly bears a pro-rata share of the fees and expenses of the underlying funds in which it invests. Such indirect expenses are not included in the above expense ratios. |
| (d) | The portfolio turnover rate includes variable rate demand notes. |
The notes to the financial statements are an integral part of, and should be read in conjunction with, the financial statements.
| 30 | MainStay MacKay U.S. Infrastructure Bond Fund |
Financial Highlights selected per share data and ratios
| | Year Ended October 31, |
| Class I | 2023 | | 2022 | | 2021 | | 2020 | | 2019 |
| Net asset value at beginning of year | $ 7.28 | | $ 8.84 | | $ 8.87 | | $ 8.73 | | $ 8.02 |
| Net investment income (loss) (a) | 0.32 | | 0.20 | | 0.15 | | 0.17 | | 0.24 |
| Net realized and unrealized gain (loss) | (0.13) | | (1.49) | | 0.07 | | 0.16 | | 0.71 |
| Total from investment operations | 0.19 | | (1.29) | | 0.22 | | 0.33 | | 0.95 |
| Less distributions: | | | | | | | | | |
| From net investment income | (0.32) | | (0.20) | | (0.15) | | (0.19) | | (0.24) |
| From net realized gain on investments | — | | (0.07) | | (0.10) | | — | | — |
| Return of capital | — | | — | | — | | — | | (0.00)‡ |
| Total distributions | (0.32) | | (0.27) | | (0.25) | | (0.19) | | (0.24) |
| Net asset value at end of year | $ 7.15 | | $ 7.28 | | $ 8.84 | | $ 8.87 | | $ 8.73 |
| Total investment return (b) | 2.48% | | (14.83)% | | 2.58% | | 3.78% | | 11.95% |
| Ratios (to average net assets)/Supplemental Data: | | | | | | | | | |
| Net investment income (loss) | 4.24% | | 2.47% | | 1.71% | | 1.97% | | 2.64% |
| Net expenses (c) | 0.60% | | 0.60% | | 0.60% | | 0.60% | | 0.60% |
| Expenses (before waiver/reimbursement) (c) | 0.74% | | 0.73% | | 0.71% | | 0.72% | | 0.74% |
| Portfolio turnover rate (d) | 130% | | 170% | | 51% | | 89% | | 124% |
| Net assets at end of year (in 000’s) | $ 683,014 | | $ 297,386 | | $ 329,021 | | $ 292,000 | | $ 177,305 |
| ‡ | Less than one cent per share. |
| (a) | Per share data based on average shares outstanding during the year. |
| (b) | Total investment return is calculated exclusive of sales charges and assumes the reinvestment of dividends and distributions. Class I shares are not subject to sales charges. For periods of less than one year, total return is not annualized. |
| (c) | In addition to the fees and expenses which the Fund bears directly, it also indirectly bears a pro-rata share of the fees and expenses of the underlying funds in which it invests. Such indirect expenses are not included in the above expense ratios. |
| (d) | The portfolio turnover rate includes variable rate demand notes. |
The notes to the financial statements are an integral part of, and should be read in conjunction with, the financial statements.
31
Financial Highlights selected per share data and ratios
| | Year Ended October 31, | | November 1, 2019^ through
October 31, |
| Class R6 | 2023 | | 2022 | | 2021 | | 2020 |
| Net asset value at beginning of period | $ 7.29 | | $ 8.84 | | $ 8.87 | | $ 8.72 |
| Net investment income (loss) (a) | 0.32 | | 0.20 | | 0.16 | | 0.19 |
| Net realized and unrealized gain (loss) | (0.13) | | (1.47) | | 0.07 | | 0.15 |
| Total from investment operations | 0.19 | | (1.27) | | 0.23 | | 0.34 |
| Less distributions: | | | | | | | |
| From net investment income | (0.32) | | (0.21) | | (0.16) | | (0.19) |
| From net realized gain on investments | — | | (0.07) | | (0.10) | | — |
| Total distributions | (0.32) | | (0.28) | | (0.26) | | (0.19) |
| Net asset value at end of period | $ 7.16 | | $ 7.29 | | $ 8.84 | | $ 8.87 |
| Total investment return (b) | 2.55% | | (14.66)% | | 2.65% | | 3.85% |
| Ratios (to average net assets)/Supplemental Data: | | | | | | | |
| Net investment income (loss) | 4.30% | | 2.50% | | 1.77% | | 2.16% |
| Net expenses (c) | 0.53% | | 0.53% | | 0.53% | | 0.53% |
| Expenses (before waiver/reimbursement) (c) | 0.56% | | 0.57% | | 0.56% | | 0.58% |
| Portfolio turnover rate (d) | 130% | | 170% | | 51% | | 89% |
| Net assets at end of period (in 000’s) | $ 127,190 | | $ 110,457 | | $ 149,500 | | $ 83,204 |
| ^ | Inception date. |
| (a) | Per share data based on average shares outstanding during the period. |
| (b) | Total investment return is calculated exclusive of sales charges and assumes the reinvestment of dividends and distributions. Class R6 shares are not subject to sales charges. For periods of less than one year, total return is not annualized. |
| (c) | In addition to the fees and expenses which the Fund bears directly, it also indirectly bears a pro-rata share of the fees and expenses of the underlying funds in which it invests. Such indirect expenses are not included in the above expense ratios. |
| (d) | The portfolio turnover rate includes variable rate demand notes. |
The notes to the financial statements are an integral part of, and should be read in conjunction with, the financial statements.
| 32 | MainStay MacKay U.S. Infrastructure Bond Fund |
Notes to Financial Statements
Note 1-Organization and Business
The MainStay Funds (the “Trust”) was organized on January 9, 1986, as a Massachusetts business trust. The Trust is registered under the Investment Company Act of 1940, as amended (the “1940 Act”), as an open-end management investment company, and is comprised of eleven funds (collectively referred to as the "Funds"). These financial statements and notes relate to the MainStay MacKay U.S. Infrastructure Bond Fund (the "Fund"), a “diversified” fund, as that term is defined in the 1940 Act, as interpreted or modified by regulatory authorities having jurisdiction, from time to time.
The following table lists the Fund's share classes that have been registered and commenced operations:
| Class | Commenced Operations |
| Class A | January 3, 1995 |
| Investor Class | February 28, 2008 |
| Class B^ | May 1, 1986 |
| Class C | September 1, 1998 |
| Class I | January 2, 2004 |
| Class R6 | November 1, 2019 |
| ^ | Class B shares are closed to all new purchases as well as additional investments by existing Class B shareholders and will be converted into Class A or Investor Class shares based on shareholder eligibility on or about February 28, 2024. |
Class B shares of the MainStay Group of Funds are closed to all new purchases as well as additional investments by existing Class B shareholders. Existing Class B shareholders may continue to reinvest dividends and capital gains distributions, as well as exchange their Class B shares for Class B shares of other funds in the MainStay Group of Funds as permitted by the current exchange privileges. Class B shareholders continue to be subject to any applicable contingent deferred sales charge ("CDSC") at the time of redemption. All other features of the Class B shares, including but not limited to the fees and expenses applicable to Class B shares, remain unchanged. Unless redeemed, Class B shareholders will remain in Class B shares of their respective fund until the Class B shares are converted to Class A or Investor Class shares pursuant to the applicable conversion schedule.
Class A and Investor Class shares are offered at net asset value (“NAV”) per share plus an initial sales charge. No initial sales charge applies to investments of $250,000 or more (and certain other qualified purchases) in Class A and Investor Class shares. A CDSC of 1.00% may be imposed on certain redemptions of Class A and Investor Class shares made within 18 months of the date of purchase on shares that were purchased without an initial sales charge. Class C shares are offered at NAV without an initial sales charge, although a 1.00% CDSC may be imposed on certain redemptions of such shares made within one year of the date of purchase of Class C shares. Investments in Class C shares are subject to a purchase maximum of $250,000. When Class B shares were offered, they were offered at NAV without an initial sales charge, although a CDSC that declines depending on the number of years a shareholder held its Class B shares may be imposed on certain redemptions of such shares
made within six years of the date of purchase of such shares. Class I and Class R6 shares are offered at NAV without a sales charge. Depending upon eligibility, Class B shares convert to either Class A or Investor Class shares at the end of the calendar quarter eight years after the date they were purchased. In addition, depending upon eligibility, Class C shares convert to either Class A or Investor Class shares at the end of the calendar quarter eight years after the date they were purchased. Additionally, Investor Class shares may convert automatically to Class A shares. Under certain circumstances and as may be permitted by the Trust’s multiple class plan pursuant to Rule 18f-3 under the 1940 Act, specified share classes of the Fund may be converted to one or more other share classes of the Fund as disclosed in the capital share transactions within these Notes. The classes of shares have the same voting (except for issues that relate solely to one class), dividend, liquidation and other rights, and the same terms and conditions, except that under distribution plans pursuant to Rule 12b-1 under the 1940 Act, Class B and Class C shares are subject to higher distribution and/or service fees than Class A and Investor Class shares. Class I and Class R6 shares are not subject to a distribution and/or service fee.
At a meeting held on September 25-26, 2023, the Board of Trustees (the “Board”) of the Trust, after careful consideration of a number of factors and upon the recommendation of the Fund’s investment adviser, New York Life Investment Management LLC (“New York Life Investments” or the "Manager"), approved a proposal to accelerate the conversion of the Fund’s Class B shares into Class A shares, or Investor Class shares, based on shareholder eligibility. Class B shareholders of the Fund will receive Class A shares of the Fund if they hold at least $15,000 of Class B shares of the Fund on or around February 28, 2024; otherwise, Class B shareholders of the Fund will receive Investor Class shares of the relevant Fund.
The Fund's investment objective is to seek current income.
Note 2–Significant Accounting Policies
The Fund is an investment company and accordingly follows the investment company accounting and reporting guidance of the Financial Accounting Standards Board (“FASB”) Accounting Standards Codification Topic 946 Financial Services—Investment Companies. The Fund prepares its financial statements in accordance with generally accepted accounting principles (“GAAP”) in the United States of America and follows the significant accounting policies described below.
(A) Securities Valuation. Investments are usually valued as of the close of regular trading on the New York Stock Exchange (the "Exchange") (usually 4:00 p.m. Eastern time) on each day the Fund is open for business ("valuation date").
Pursuant to Rule 2a-5 under the 1940 Act, the Board has designated New York Life Investments as its Valuation Designee (the "Valuation Designee"). The Valuation Designee is responsible for performing fair valuations relating to all investments in the Fund’s portfolio for which market quotations are not readily available; periodically assessing and
Notes to Financial Statements (continued)
managing material valuation risks; establishing and applying fair value methodologies; testing fair valuation methodologies; evaluating and overseeing pricing services; ensuring appropriate segregation of valuation and portfolio management functions; providing quarterly, annual and prompt reporting to the Board, as appropriate; identifying potential conflicts of interest; and maintaining appropriate records. The Valuation Designee has established a valuation committee ("Valuation Committee") to assist in carrying out the Valuation Designee’s responsibilities and establish prices of securities for which market quotations are not readily available. The Fund's and the Valuation Designee's policies and procedures ("Valuation Procedures") govern the Valuation Designee’s selection and application of methodologies for determining and calculating the fair value of Fund investments. The Valuation Designee may value the Fund's portfolio securities for which market quotations are not readily available and other Fund assets utilizing inputs from pricing services and other third-party sources. The Valuation Committee meets (in person, via electronic mail or via teleconference) on an ad-hoc basis to determine fair valuations and on a quarterly basis to review fair value events with respect to certain securities for which market quotations are not readily available, including valuation risks and back-testing results, and preview reports to the Board.
The Valuation Committee establishes prices of securities for which market quotations are not readily available based on such methodologies and measurements on a regular basis after considering information that is reasonably available and deemed relevant by the Valuation Committee. The Board shall oversee the Valuation Designee and review fair valuation materials on a prompt, quarterly and annual basis and approve proposed revisions to the Valuation Procedures.
Investments for which market quotations are not readily available are valued at fair value as determined in good faith pursuant to the Valuation Procedures. A market quotation is readily available only when that quotation is a quoted price (unadjusted) in active markets for identical investments that the Fund can access at the measurement date, provided that a quotation will not be readily available if it is not reliable. "Fair value" is defined as the price the Fund would reasonably expect to receive upon selling an asset or liability in an orderly transaction to an independent buyer in the principal or most advantageous market for the asset or liability. Fair value measurements are determined within a framework that establishes a three-tier hierarchy that maximizes the use of observable market data and minimizes the use of unobservable inputs to establish a classification of fair value measurements for disclosure purposes. "Inputs" refer broadly to the assumptions that market participants would use in pricing the asset or liability, including assumptions about risk, such as the risk inherent in a particular valuation technique used to measure fair value using a pricing model and/or the risk inherent in the inputs for the valuation technique. Inputs may be observable or unobservable. Observable inputs reflect the assumptions market participants would use in pricing the asset or liability based on market data obtained from sources independent of the Fund. Unobservable inputs reflect the Fund’s own assumptions about the assumptions market participants would use in pricing the asset or liability based on the information available. The
inputs or methodology used for valuing assets or liabilities may not be an indication of the risks associated with investing in those assets or liabilities. The three-tier hierarchy of inputs is summarized below.
| • | Level 1—quoted prices (unadjusted) in active markets for an identical asset or liability |
| • | Level 2—other significant observable inputs (including quoted prices for a similar asset or liability in active markets, interest rates and yield curves, prepayment speeds, credit risk, etc.) |
| • | Level 3—significant unobservable inputs (including the Fund's own assumptions about the assumptions that market participants would use in measuring fair value of an asset or liability) |
The level of an asset or liability within the fair value hierarchy is based on the lowest level of an input, both individually and in the aggregate, that is significant to the fair value measurement. The aggregate value by input level of the Fund’s assets and liabilities as of October 31, 2023, is included at the end of the Portfolio of Investments.
The Fund may use third-party vendor evaluations, whose prices may be derived from one or more of the following standard inputs, among others:
| • Benchmark yields | • Reported trades |
| • Broker/dealer quotes | • Issuer spreads |
| • Two-sided markets | • Benchmark securities |
| • Bids/offers | • Reference data (corporate actions or material event notices) |
| • Industry and economic events | • Comparable bonds |
| • Monthly payment information | |
An asset or liability for which a market quotation is not readily available is valued by methods deemed reasonable in good faith by the Valuation Committee, following the Valuation Procedures to represent fair value. Under these procedures, the Valuation Designee generally uses a market-based approach which may use related or comparable assets or liabilities, recent transactions, market multiples, book values and other relevant information. The Valuation Designee may also use an income-based valuation approach in which the anticipated future cash flows of the asset or liability are discounted to calculate fair value. Discounts may also be applied due to the nature and/or duration of any restrictions on the disposition of the asset or liability. Fair value represents a good faith approximation of the value of a security. Fair value determinations involve the consideration of a number of subjective factors, an analysis of applicable facts and circumstances and the exercise of judgment. As a result, it is possible that the fair value for a security determined in good faith in accordance with the Valuation Procedures may differ from valuations for the same security determined for other funds using their own valuation procedures. Although the Valuation Procedures are designed to value a security at the price the Fund may reasonably expect to receive upon the security's sale in an orderly transaction, there can be no assurance that any fair value determination thereunder would, in fact, approximate the amount that the Fund would actually realize upon the sale of the security or the price
| 34 | MainStay MacKay U.S. Infrastructure Bond Fund |
at which the security would trade if a reliable market price were readily available. During the year ended October 31, 2023, there were no material changes to the fair value methodologies.
Securities which may be valued in this manner include, but are not limited to: (i) a security for which trading has been halted or suspended or otherwise does not have a readily available market quotation on a given day; (ii) a debt security that has recently gone into default and for which there is not a current market quotation; (iii) a security of an issuer that has entered into a restructuring; (iv) a security that has been delisted from a national exchange; (v) a security subject to trading collars for which no or limited trading takes place; and (vi) a security whose principal market has been temporarily closed at a time when, under normal conditions, it would be open. Securities valued in this manner are generally categorized as Level 2 or 3 in the hierarchy. No securities held by the Fund as of October 31, 2023, were fair valued in such a manner.
Investments in mutual funds, including money market funds, are valued at their respective NAVs at the close of business each day on the valuation date. These securities are generally categorized as Level 1 in the hierarchy.
Debt securities (other than convertible and municipal bonds) are valued at the evaluated bid prices (evaluated mean prices in the case of convertible and municipal bonds) supplied by a pricing agent or broker selected by the Valuation Designee, in consultation with the Subadvisor. The evaluations are market-based measurements processed through a pricing application and represents the pricing agent’s good faith determination as to what a holder may receive in an orderly transaction under market conditions. The rules-based logic utilizes valuation techniques that reflect participants’ assumptions and vary by asset class and per methodology, maximizing the use of relevant observable data including quoted prices for similar assets, benchmark yield curves and market corroborated inputs. The evaluated bid or mean prices are deemed by the Valuation Designee, in consultation with the Subadvisor, to be representative of market values at the regular close of trading of the Exchange on each valuation date. Debt securities purchased on a delayed delivery basis are marked to market daily until settlement at the forward settlement date. Debt securities, including corporate bonds, U.S. government and federal agency bonds, municipal bonds, foreign bonds, convertible bonds, asset-backed securities and mortgage-backed securities are generally categorized as Level 2 in the hierarchy.
Temporary cash investments acquired in excess of 60 days to maturity at the time of purchase are valued using the latest bid prices or using valuations based on a matrix system (which considers such factors as security prices, yields, maturities and ratings), both as furnished by independent pricing services. Temporary cash investments that mature in 60 days or less at the time of purchase ("Short-Term Investments") are valued using the amortized cost method of valuation, unless the use of such method would be inappropriate. The amortized cost method involves valuing a security at its cost on the date of purchase and thereafter assuming a constant amortization to maturity of the difference between such cost and the value on maturity date. Amortized cost approximates
the current fair value of a security. Securities valued using the amortized cost method are not valued using quoted prices in an active market and are generally categorized as Level 2 in the hierarchy.
The information above is not intended to reflect an exhaustive list of the methodologies that may be used to value portfolio investments. The Valuation Procedures permit the use of a variety of valuation methodologies in connection with valuing portfolio investments. The methodology used for a specific type of investment may vary based on the market data available or other considerations. The methodologies summarized above may not represent the specific means by which portfolio investments are valued on any particular business day.
(B) Income Taxes. The Fund's policy is to comply with the requirements of the Internal Revenue Code of 1986, as amended (the “Internal Revenue Code”), applicable to regulated investment companies and to distribute all of its taxable income to the shareholders of the Fund within the allowable time limits.
The Manager evaluates the Fund’s tax positions to determine if the tax positions taken meet the minimum recognition threshold in connection with accounting for uncertainties in income tax positions taken or expected to be taken for the purposes of measuring and recognizing tax liabilities in the financial statements. Recognition of tax benefits of an uncertain tax position is permitted only to the extent the position is “more likely than not” to be sustained assuming examination by taxing authorities. The Manager analyzed the Fund's tax positions taken on federal, state and local income tax returns for all open tax years (for up to three tax years) and has concluded that no provisions for federal, state and local income tax are required in the Fund's financial statements. The Fund's federal, state and local income tax and federal excise tax returns for tax years for which the applicable statutes of limitations have not expired are subject to examination by the Internal Revenue Service and state and local departments of revenue.
(C) Dividends and Distributions to Shareholders. Dividends and distributions are recorded on the ex-dividend date. The Fund intends to declare dividends from net investment income, if any, daily and intends to pay them at least monthly and pays distributions from net realized capital and currency gains, if any, at least annually. Unless a shareholder elects otherwise, all dividends and distributions are reinvested at NAV in the same class of shares of the Fund. Dividends and distributions to shareholders are determined in accordance with federal income tax regulations and may differ from determinations using GAAP.
(D) Security Transactions and Investment Income. The Fund records security transactions on the trade date. Realized gains and losses on security transactions are determined using the identified cost method. Interest income is accrued as earned using the effective interest rate method and includes any realized gains and losses from repayments of principal on mortgage-backed securities. Distributions received from real estate investment trusts may be classified as dividends, capital gains and/or return of capital. Discounts and premiums on securities purchased, other than temporary cash investments that mature in 60
Notes to Financial Statements (continued)
days or less at the time of purchase, for the Fund are accreted and amortized, respectively, on the effective interest rate method.
Investment income and realized and unrealized gains and losses on investments of the Fund are allocated pro rata to the separate classes of shares based upon their relative net assets on the date the income is earned or realized and unrealized gains and losses are incurred.
The Fund may place a debt security on non-accrual status and reduce related interest income by ceasing current accruals and writing off all or a portion of any interest receivables when the collection of all or a portion of such interest has become doubtful. A debt security is removed from non-accrual status when the issuer resumes interest payments or when collectability of interest is reasonably assured.
(E) Expenses. Expenses of the Trust are allocated to the individual Funds in proportion to the net assets of the respective Funds when the expenses are incurred, except where direct allocations of expenses can be made. Expenses (other than transfer agent expenses and fees incurred under the shareholder services plans and/or the distribution plans further discussed in Note 3(B)) are allocated to separate classes of shares pro rata based upon their relative net assets on the date the expenses are incurred. The expenses borne by the Fund, including those of related parties to the Fund, are shown in the Statement of Operations.
Additionally, the Fund may invest in mutual funds, which are subject to management fees and other fees that may cause the costs of investing in mutual funds to be greater than the costs of owning the underlying securities directly. These indirect expenses of mutual funds are not included in the amounts shown as expenses in the Statement of Operations or in the expense ratios included in the Financial Highlights.
(F) Use of Estimates. In preparing financial statements in conformity with GAAP, the Manager makes estimates and assumptions that affect the reported amounts and disclosures in the financial statements. Actual results could differ from those estimates and assumptions.
(G) Futures Contracts. A futures contract is an agreement to purchase or sell a specified quantity of an underlying instrument at a specified future date and price, or to make or receive a cash payment based on the value of a financial instrument (e.g., foreign currency, interest rate, security or securities index). The Fund is subject to risks such as market price risk, leverage risk, liquidity risk, counterparty risk, operational risk, legal risk and/or interest rate risk in the normal course of investing in these contracts. Upon entering into a futures contract, the Fund is required to pledge to the broker or futures commission merchant an amount of cash and/or U.S. government securities equal to a certain percentage of the collateral amount, known as the “initial margin.” During the period the futures contract is open, changes in the value of the contract are recognized as unrealized appreciation or depreciation by marking to market such contract on a daily basis to reflect the market value of the contract at the end of each day’s trading. The Fund agrees to receive from or pay to the broker or futures commission merchant an amount of cash equal to the daily fluctuation in the value of the contract. Such receipts or payments are known as “variation margin.” When the
futures contract is closed, the Fund records a realized gain or loss equal to the difference between the proceeds from (or cost of) the closing transaction and the Fund's basis in the contract.
The use of futures contracts involves, to varying degrees, elements of market risk in excess of the amount recognized in the Statement of Assets and Liabilities. The contract or notional amounts and variation margin reflect the extent of the Fund's involvement in open futures positions. There are several risks associated with the use of futures contracts as hedging techniques. There can be no assurance that a liquid market will exist at the time when the Fund seeks to close out a futures contract. If no liquid market exists, the Fund would remain obligated to meet margin requirements until the position is closed. Futures contracts may involve a small initial investment relative to the risk assumed, which could result in losses greater than if the Fund did not invest in futures contracts. Futures contracts may be more volatile than direct investments in the instrument underlying the futures and may not correlate to the underlying instrument, causing a given hedge not to achieve its objectives. The Fund's activities in futures contracts have minimal counterparty risk as they are conducted through regulated exchanges that guarantee the futures against default by the counterparty. In the event of a bankruptcy or insolvency of a futures commission merchant that holds margin on behalf of the Fund, the Fund may not be entitled to the return of the entire margin owed to the Fund, potentially resulting in a loss. The Fund may invest in futures contracts to seek enhanced returns or to reduce the risk of loss by hedging certain of its holdings. The Fund's investment in futures contracts and other derivatives may increase the volatility of the Fund's NAVs and may result in a loss to the Fund. As of October 31, 2023, the Fund did not hold any open futures contracts.
(H) Securities Lending. In order to realize additional income, the Fund may engage in securities lending, subject to the limitations set forth in the 1940 Act and relevant guidance by the staff of the Securities and Exchange Commission (“SEC”). If the Fund engages in securities lending, the Fund will lend through its custodian, JPMorgan Chase Bank, N.A., ("JPMorgan"), acting as securities lending agent on behalf of the Fund. Under the current arrangement, JPMorgan will manage the Fund's collateral in accordance with the securities lending agency agreement between the Fund and JPMorgan, and indemnify the Fund against counterparty risk. The loans will be collateralized by cash (which may be invested in a money market fund) and/or non-cash collateral (which may include U.S. Treasury securities and/or U.S. government agency securities issued or guaranteed by the United States government or its agencies or instrumentalities) at least equal at all times to the market value of the securities loaned. Non-cash collateral held at year end is segregated and cannot be transferred by the Fund. The Fund bears the risk of delay in recovery of, or loss of rights in, the securities loaned. The Fund may also record a realized gain or loss on securities deemed sold due to a borrower’s inability to return securities on loan. The Fund bears the risk of any loss on investment of cash collateral. The Fund will receive compensation for lending its securities in the form of fees or it will retain a portion of interest earned on the investment of any cash collateral. The Fund will also continue to receive interest and dividends on the securities
| 36 | MainStay MacKay U.S. Infrastructure Bond Fund |
loaned and any gain or loss in the market price of the securities loaned that may occur during the term of the loan will be for the account of the Fund. Income earned from securities lending activities, if any, is reflected in the Statement of Operations. As of October 31, 2023, the Fund did not have any portfolio securities on loan.
(I) Government, Infrastructure Investment and Municipal Bond Risk. Investments in the Fund are not guaranteed, even though some of the Fund’s underlying investments are guaranteed by the U.S. government or its agencies or instrumentalities. The principal risk of mortgage-related and asset-backed securities is that the underlying debt may be prepaid ahead of schedule, if interest rates fall, thereby reducing the value of the Fund’s investment. If interest rates rise, less of the debt may be prepaid and the Fund may lose money because the Fund may be unable to invest in higher yielding assets. The Fund is subject to interest-rate risk and can lose principal value when interest rates rise. Bonds are also subject to credit risk, in which the bond issuer may fail to pay interest and principal in a timely manner.
The Fund’s investments in infrastructure-related securities will expose the Fund to potential adverse economic, regulatory, political, legal and other changes affecting such investments. Issuers of securities in infrastructure-related businesses are subject to a variety of factors that may adversely affect their business or operations, including high interest costs in connection with capital construction programs, high leverage, costs associated with environmental or other regulations and the effects of economic slowdowns. Rising interest rates could lead to higher financing costs and reduced earnings for infrastructure companies.
Municipal bond risks include the inability of the issuer to repay the obligation, the relative lack of information about certain issuers, and the possibility of future tax and legislative changes, which could affect the market for and value of municipal securities.
Municipalities continue to experience political, economic and financial difficulties in the current economic environment. The ability of a municipal issuer to make payments and the value of municipal bonds can be affected by uncertainties in the municipal securities market. Such uncertainties could cause increased volatility in the municipal securities market and could negatively impact the Fund’s net asset value, and/or the distributions paid by the Fund.
(J) Indemnifications. Under the Trust’s organizational documents, its officers and trustees are indemnified against certain liabilities that may arise out of performance of their duties to the Trust. Additionally, in the normal course of business, the Fund enters into contracts with third-party service providers that contain a variety of representations and warranties and that may provide general indemnifications. The Fund's maximum exposure under these arrangements is unknown, as this would involve future claims that may be made against the Fund that have not yet occurred. The Manager believes that the risk of loss in connection with these potential indemnification obligations is remote. However, there can be no assurance that material liabilities related to such obligations will not arise in the future, which could adversely impact the Fund.
(K) Quantitative Disclosure of Derivative Holdings. The following tables show additional disclosures related to the Fund's derivative and hedging activities, including how such activities are accounted for and their effect on the Fund's financial positions, performance and cash flows.
The Fund entered into futures contracts to help manage the duration and yield curve positioning of the portfolio. These derivatives are not accounted for as hedging instruments.
The effect of derivative instruments on the Statement of Operations for the year ended October 31, 2023:
| Net Realized Gain (Loss) from: | Interest
Rate
Contracts
Risk | Total |
| Futures Transactions | $1,339,322 | $1,339,322 |
| Total Net Realized Gain (Loss) | $1,339,322 | $1,339,322 |
| Net Change in Unrealized Appreciation (Depreciation) | Interest
Rate
Contracts
Risk | Total |
| Futures Contracts | $(1,701,802) | $(1,701,802) |
| Total Net Change in Unrealized Appreciation (Depreciation) | $(1,701,802) | $(1,701,802) |
| Average Notional Amount | Total |
| Futures Contracts Long (a) | $ 6,217,453 |
| Futures Contracts Short (b) | $(13,768,333) |
| (a) | Position was open one month during the reporting period. |
| (b) | Positions were open seven months during the reporting period. |
Note 3–Fees and Related Party Transactions
(A) Manager and Subadvisor. New York Life Investments, a registered investment adviser and an indirect, wholly-owned subsidiary of New York Life Insurance Company ("New York Life"), serves as the Fund's Manager, pursuant to an Amended and Restated Management Agreement ("Management Agreement"). The Manager provides offices, conducts clerical, recordkeeping and bookkeeping services and keeps most of the financial and accounting records required to be maintained by the Fund. Except for the portion of salaries and expenses that are the responsibility of the Fund, the Manager pays the salaries and expenses of all personnel affiliated with the Fund and certain operational expenses of the Fund. The Fund reimburses New York Life Investments in an amount equal to the portion of the compensation of the Chief Compliance Officer attributable to the Fund. MacKay Shields LLC ("MacKay Shields" or the "Subadvisor"), a registered investment adviser and an indirect, wholly-owned subsidiary of New York Life, serves as the Subadvisor to the Fund and is responsible for the day-to-day portfolio management of the Fund. Pursuant to the terms of an Amended and Restated Subadvisory Agreement
Notes to Financial Statements (continued)
("Subadvisory Agreement") between New York Life Investments and MacKay Shields, New York Life Investments pays for the services of the Subadvisor.
Pursuant to the Management Agreement, the Fund pays the Manager a monthly fee for the services performed and the facilities furnished at an annual rate of the Fund’s average daily net assets as follows: 0.50% up to $500 million; 0.475% from $500 million to $1 billion; and 0.45% in excess of $1 billion. During the year ended October 31, 2023, the effective management fee rate was 0.49% of the Fund’s average daily net assets, exclusive of any applicable waivers/reimbursements.
New York Life Investments has contractually agreed to waive fees and/or reimburse expenses so that Total Annual Fund Operating Expenses (excluding taxes, interest, litigation, extraordinary expenses, brokerage and other transaction expenses relating to the purchase or sale of portfolio investments and acquired (underlying) fund fees and expenses) do not exceed the following percentages of daily net assets: Class A, 0.85% and Class R6, 0.53%. New York Life Investments will apply an equivalent waiver or reimbursement, in an equal number of basis points of basis points of the Class A shares waiver/ reimbursement to Investor Class, Class B, Class C and Class I shares. This agreement will remain in effect until February 28, 2024, and shall renew automatically for one-year terms unless New York Life Investments provides written notice of termination prior to the start of the next term or upon approval of the Board.
During the year ended October 31, 2023, New York Life Investments earned fees from the Fund in the amount of $3,416,982 and waived fees and/or reimbursed expenses, including the waiver/reimbursement of certain class specific expenses in the amount of $807,420 and paid the Subadvisor fees in the amount of $1,304,781.
JPMorgan Chase Bank, N.A. ("JPMorgan") provides sub-administration and sub-accounting services to the Fund pursuant to an agreement with New York Life Investments. These services include calculating the daily NAVs of the Fund, maintaining the general ledger and sub-ledger accounts for the calculation of the Fund's NAVs, and assisting New York Life Investments in conducting various aspects of the Fund's administrative operations. For providing these services to the Fund, JPMorgan is compensated by New York Life Investments.
Pursuant to an agreement between the Trust and New York Life Investments, New York Life Investments is responsible for providing or procuring certain regulatory reporting services for the Fund. The Fund will reimburse New York Life Investments for the actual costs incurred by New York Life Investments in connection with providing or procuring these services for the Fund.
(B) Distribution and Service Fees. The Trust, on behalf of the Fund, has entered into a distribution agreement with NYLIFE Distributors LLC (the “Distributor”), an affiliate of New York Life Investments. The Fund has adopted distribution plans (the “Plans”) in accordance with the provisions of Rule 12b-1 under the 1940 Act.
Pursuant to the Class A and Investor Class Plans, the Distributor receives a monthly fee from the Class A and Investor Class shares at an annual rate of 0.25% of the average daily net assets of the Class A and Investor Class shares for distribution and/or service activities as designated by the Distributor. Pursuant to the Class B and Class C Plans, Class B and Class C shares pay the Distributor a monthly distribution fee at an annual rate of 0.75% of the average daily net assets of the Class B and Class C shares along with a service fee at an annual rate of 0.25% of the average daily net assets of the Class B and Class C shares, for a total 12b-1 fee of 1.00%. Class I and Class R6 shares are not subject to a distribution and/or service fee.
The Plans provide that the distribution and service fees are payable to the Distributor regardless of the amounts actually expended by the Distributor for distribution of the Fund's shares and service activities.
(C) Sales Charges. The Fund was advised by the Distributor that the amount of initial sales charges retained on sales of Class A and Investor Class shares during the year ended October 31, 2023, were $3,477 and $387, respectively.
The Fund was also advised that the Distributor retained CDSCs on redemptions of Class A, Investor Class, Class B and Class C shares during the year ended October 31, 2023, of $3,319, $4, $1 and $617, respectively.
(D) Transfer, Dividend Disbursing and Shareholder Servicing Agent. NYLIM Service Company LLC, an affiliate of New York Life Investments, is the Fund's transfer, dividend disbursing and shareholder servicing agent pursuant to an agreement between NYLIM Service Company LLC and the Trust. NYLIM Service Company LLC has entered into an agreement with SS&C Global Investor & Distribution Solutions, Inc. ("SS&C"), pursuant to which SS&C performs certain transfer agent services on behalf of NYLIM Service Company LLC. New York Life Investments has contractually agreed to limit the transfer agency expenses charged to the Fund’s share classes to a maximum of 0.35% of that share class’s average daily net assets on an annual basis after deducting any applicable Fund or class-level expense reimbursement or small account fees. This agreement will remain in effect until February 28, 2024, and shall renew automatically for one-year terms unless New York Life Investments provides written notice of termination prior to the start of the next term or upon approval of the Board. During the year ended October 31, 2023, transfer agent expenses incurred by the Fund and any reimbursements, pursuant to the aforementioned Transfer Agency expense limitation agreement, were as follows:
| Class | Expense | Waived |
| Class A | $142,986 | $ — |
| Investor Class | 79,102 | (11,856) |
| Class B | 2,749 | (376) |
| Class C | 32,366 | (4,589) |
| Class I | 867,967 | — |
| Class R6 | 4,486 | — |
| 38 | MainStay MacKay U.S. Infrastructure Bond Fund |
(E) Small Account Fee. Shareholders with small accounts adversely impact the cost of providing transfer agency services. In an effort to reduce total transfer agency expenses, the Fund has implemented a small account fee on certain types of accounts. As described in the Fund's prospectus, certain shareholders with an account balance of less than $1,000 ($5,000 for Class A share accounts) are charged an annual per account fee of $20 (assessed semi-annually), the proceeds from which offset transfer agent fees as reflected in the Statement of Operations. This small account fee will not apply to certain types of accounts as described further in the Fund’s prospectus.
(F) Capital. As of October 31, 2023, New York Life and its affiliates beneficially held shares of the Fund with the values and percentages of net assets as follows:
| ‡ | Less than one-tenth of a percent. |
Note 4-Federal Income Tax
As of October 31, 2023, the cost and unrealized appreciation (depreciation) of the Fund’s investment portfolio, including applicable derivative contracts and other financial instruments, as determined on a federal income tax basis, were as follows:
| | Federal Tax
Cost | Gross
Unrealized
Appreciation | Gross
Unrealized
(Depreciation) | Net
Unrealized
Appreciation/
(Depreciation) |
| Investments in Securities | $913,563,254 | $278,563 | $(35,067,743) | $(34,789,180) |
As of October 31, 2023, the components of accumulated gain (loss) on a tax basis were as follows:
Ordinary
Income | Accumulated
Capital
and Other
Gain (Loss) | Other
Temporary
Differences | Unrealized
Appreciation
(Depreciation) | Total
Accumulated
Gain (Loss) |
| $831,960 | $(90,426,252) | $(758,374) | $(34,789,180) | $(125,141,846) |
The difference between book-basis and tax-basis unrealized appreciation (depreciation) is primarily due to wash sales adjustments.
As of October 31, 2023, for federal income tax purposes, capital loss carryforwards of $90,426,252, as shown in the table below, were available to the extent provided by the regulations to offset future realized gains of the Fund. Accordingly, no capital gains distributions are expected to be paid to shareholders until net gains have been realized in excess of such amounts.
Capital Loss
Available Through | Short-Term
Capital Loss
Amounts (000’s) | Long-Term
Capital Loss
Amounts (000’s) |
| Unlimited | $53,934 | $36,492 |
During the years ended October 31, 2023 and October 31, 2022, the tax character of distributions paid as reflected in the Statements of Changes in Net Assets was as follows:
| | 2023 | 2022 |
| Distributions paid from: | | |
| Ordinary Income | $29,267,158 | $16,251,597 |
| Long-Term Capital Gains | — | 2,804,355 |
| Total | $29,267,158 | $19,055,952 |
Note 5–Custodian
JPMorgan is the custodian of cash and securities held by the Fund. Custodial fees are charged to the Fund based on the Fund's net assets and/or the market value of securities held by the Fund and the number of certain transactions incurred by the Fund.
Note 6–Line of Credit
The Fund and certain other funds managed by New York Life Investments maintain a line of credit with a syndicate of banks in order to secure a source of funds for temporary purposes to meet unanticipated or excessive redemption requests.
Effective July 25, 2023, under the credit agreement (the “Credit Agreement”), the aggregate commitment amount is $600,000,000 with an additional uncommitted amount of $100,000,000. The commitment fee is an annual rate of 0.15% of the average commitment amount payable quarterly, regardless of usage, to JPMorgan, who serves as the agent to the syndicate. The commitment fee is allocated among the Fund and certain other funds managed by New York Life Investments based upon their respective net assets and other factors. Interest on any revolving credit loan is charged based upon the Federal Funds Rate, Daily Simple SOFR + 0.10%, or the Overnight Bank Funding Rate, whichever is higher. The Credit Agreement expires on July 23, 2024, although the Fund, certain other funds managed by New York Life Investments and the syndicate of banks may renew the Credit Agreement for an additional year on the same or different terms or enter into a credit agreement with a different syndicate of banks. Prior to July 25, 2023, the aggregate commitment amount and the commitment fee were the same as those under the current Credit Agreement. During the year ended October 31, 2023, there were no borrowings made or outstanding with respect to the Fund under the Credit Agreement.
Note 7–Interfund Lending Program
Pursuant to an exemptive order issued by the SEC, the Fund, along with certain other funds managed by New York Life Investments, may participate in an interfund lending program. The interfund lending program provides an alternative credit facility that permits the Fund and certain other funds managed by New York Life Investments to lend or borrow money for temporary purposes directly to or from one another, subject to the conditions of the exemptive order. During the year ended
Notes to Financial Statements (continued)
October 31, 2023, there were no interfund loans made or outstanding with respect to the Fund.
Note 8–Purchases and Sales of Securities (in 000’s)
During the year ended October 31, 2023, purchases and sales of securities, other than short-term securities, were $1,279,932 and $861,364, respectively.
Note 9–Capital Share Transactions
Transactions in capital shares for the years ended October 31, 2023 and October 31, 2022, were as follows:
| Class A | Shares | Amount |
| Year ended October 31, 2023: | | |
| Shares sold | 3,242,640 | $ 24,038,951 |
| Shares issued to shareholders in reinvestment of distributions | 392,218 | 2,894,696 |
| Shares redeemed | (3,218,969) | (23,728,902) |
| Net increase (decrease) in shares outstanding before conversion | 415,889 | 3,204,745 |
| Shares converted into Class A (See Note 1) | 108,943 | 809,230 |
| Shares converted from Class A (See Note 1) | (6,067) | (46,047) |
| Net increase (decrease) | 518,765 | $ 3,967,928 |
| Year ended October 31, 2022: | | |
| Shares sold | 1,339,045 | $ 10,623,586 |
| Shares issued to shareholders in reinvestment of distributions | 338,782 | 2,751,730 |
| Shares redeemed | (4,065,381) | (32,494,364) |
| Net increase (decrease) in shares outstanding before conversion | (2,387,554) | (19,119,048) |
| Shares converted into Class A (See Note 1) | 136,281 | 1,091,052 |
| Net increase (decrease) | (2,251,273) | $ (18,027,996) |
| |
| Investor Class | Shares | Amount |
| Year ended October 31, 2023: | | |
| Shares sold | 58,734 | $ 439,185 |
| Shares issued to shareholders in reinvestment of distributions | 68,232 | 506,179 |
| Shares redeemed | (190,031) | (1,411,925) |
| Net increase (decrease) in shares outstanding before conversion | (63,065) | (466,561) |
| Shares converted into Investor Class (See Note 1) | 31,293 | 231,512 |
| Shares converted from Investor Class (See Note 1) | (60,321) | (451,493) |
| Net increase (decrease) | (92,093) | $ (686,542) |
| Year ended October 31, 2022: | | |
| Shares sold | 49,196 | $ 406,321 |
| Shares issued to shareholders in reinvestment of distributions | 55,770 | 453,075 |
| Shares redeemed | (211,433) | (1,711,769) |
| Net increase (decrease) in shares outstanding before conversion | (106,467) | (852,373) |
| Shares converted into Investor Class (See Note 1) | 24,384 | 197,255 |
| Shares converted from Investor Class (See Note 1) | (36,410) | (294,644) |
| Net increase (decrease) | (118,493) | $ (949,762) |
| |
| Class B | Shares | Amount |
| Year ended October 31, 2023: | | |
| Shares sold | 48 | $ 459 |
| Shares issued to shareholders in reinvestment of distributions | 1,862 | 13,788 |
| Shares redeemed | (7,935) | (58,774) |
| Net increase (decrease) in shares outstanding before conversion | (6,025) | (44,527) |
| Shares converted from Class B (See Note 1) | (38,870) | (286,065) |
| Net increase (decrease) | (44,895) | $ (330,592) |
| Year ended October 31, 2022: | | |
| Shares sold | 908 | $ 7,260 |
| Shares issued to shareholders in reinvestment of distributions | 2,398 | 19,643 |
| Shares redeemed | (31,334) | (256,127) |
| Net increase (decrease) in shares outstanding before conversion | (28,028) | (229,224) |
| Shares converted from Class B (See Note 1) | (39,207) | (316,544) |
| Net increase (decrease) | (67,235) | $ (545,768) |
| |
| 40 | MainStay MacKay U.S. Infrastructure Bond Fund |
| Class C | Shares | Amount |
| Year ended October 31, 2023: | | |
| Shares sold | 259,903 | $ 1,923,254 |
| Shares issued to shareholders in reinvestment of distributions | 22,463 | 165,942 |
| Shares redeemed | (568,869) | (4,205,610) |
| Net increase (decrease) in shares outstanding before conversion | (286,503) | (2,116,414) |
| Shares converted from Class C (See Note 1) | (21,091) | (155,454) |
| Net increase (decrease) | (307,594) | $ (2,271,868) |
| Year ended October 31, 2022: | | |
| Shares sold | 1,674,506 | $ 13,419,612 |
| Shares issued to shareholders in reinvestment of distributions | 19,536 | 155,146 |
| Shares redeemed | (1,432,935) | (11,189,460) |
| Net increase (decrease) in shares outstanding before conversion | 261,107 | 2,385,298 |
| Shares converted from Class C (See Note 1) | (25,380) | (202,703) |
| Net increase (decrease) | 235,727 | $ 2,182,595 |
| |
| Class I | Shares | Amount |
| Year ended October 31, 2023: | | |
| Shares sold | 78,116,291 | $ 585,268,003 |
| Shares issued to shareholders in reinvestment of distributions | 2,482,267 | 18,466,059 |
| Shares redeemed | (25,920,656) | (193,052,091) |
| Net increase (decrease) in shares outstanding before conversion | 54,677,902 | 410,681,971 |
| Shares converted into Class I (See Note 1) | 5,996 | 46,047 |
| Net increase (decrease) | 54,683,898 | $ 410,728,018 |
| Year ended October 31, 2022: | | |
| Shares sold | 30,421,882 | $ 247,802,802 |
| Shares issued to shareholders in reinvestment of distributions | 1,184,397 | 9,631,745 |
| Shares redeemed | (27,984,055) | (225,779,233) |
| Net increase (decrease) in shares outstanding before conversion | 3,622,224 | 31,655,314 |
| Shares converted into Class I (See Note 1) | 1,613 | 12,578 |
| Shares converted from Class I (See Note 1) | (27,235) | (204,537) |
| Net increase (decrease) | 3,596,602 | $ 31,463,355 |
| |
| Class R6 | Shares | Amount |
| Year ended October 31, 2023: | | |
| Shares sold | 8,280,249 | $ 61,358,811 |
| Shares issued to shareholders in reinvestment of distributions | 24,490 | 182,987 |
| Shares redeemed | (5,666,639) | (42,148,965) |
| Net increase (decrease) in shares outstanding before conversion | 2,638,100 | 19,392,833 |
| Shares converted from Class R6 (See Note 1) | (19,584) | (147,730) |
| Net increase (decrease) | 2,618,516 | $ 19,245,103 |
| Year ended October 31, 2022: | | |
| Shares sold | 6,403,249 | $ 51,303,512 |
| Shares issued to shareholders in reinvestment of distributions | 36,712 | 309,000 |
| Shares redeemed | (8,157,515) | (64,821,149) |
| Net increase (decrease) in shares outstanding before conversion | (1,717,554) | (13,208,637) |
| Shares converted from Class R6 (See Note 1) | (33,326) | (282,457) |
| Net increase (decrease) | (1,750,880) | $ (13,491,094) |
Note 10–Other Matters
As of the date of this report, the Fund faces a heightened level of risk associated with current uncertainty, volatility and state of economies, financial markets, rising interest rates, and labor and health conditions around the world. Events such as war, acts of terrorism, recessions, rapid inflation, the imposition of international sanctions, earthquakes, hurricanes, epidemics and pandemics and other unforeseen natural or human disasters may have broad adverse social, political and economic effects on the global economy, which could negatively impact the value of the Fund's investments. Developments that disrupt global economies and financial markets may magnify factors that affect the Fund's performance.
Note 11–Subsequent Events
In connection with the preparation of the financial statements of the Fund as of and for the year ended October 31, 2023, events and transactions subsequent to October 31, 2023, through the date the financial statements were issued, have been evaluated by the Manager for possible adjustment and/or disclosure. No subsequent events requiring financial statement adjustment or disclosure have been identified.
Report of Independent Registered Public Accounting Firm
To the Shareholders of the Fund and Board of Trustees
The MainStay Funds:
Opinion on the Financial Statements
We have audited the accompanying statement of assets and liabilities of MainStay MacKay U.S. Infrastructure Bond Fund (the Fund), one of the funds constituting The MainStay Funds, including the portfolio of investments, as of October 31, 2023, the related statement of operations for the year then ended, the statements of changes in net assets for each of the years in the two-year period then ended, and the related notes (collectively, the financial statements) and the financial highlights for each of the years or periods in the five-year period then ended. In our opinion, the financial statements and financial highlights present fairly, in all material respects, the financial position of the Fund as of October 31, 2023, the results of its operations for the year then ended, the changes in its net assets for each of the years in the two-year period then ended, and the financial highlights for each of the years or periods in the five-year period then ended, in conformity with U.S. generally accepted accounting principles.
Basis for Opinion
These financial statements and financial highlights are the responsibility of the Fund's management. Our responsibility is to express an opinion on these financial statements and financial highlights based on our audits. We are a public accounting firm registered with the Public Company Accounting Oversight Board (United States) (PCAOB) and are required to be independent with respect to the Fund in accordance with the U.S. federal securities laws and the applicable rules and regulations of the Securities and Exchange Commission and the PCAOB.
We conducted our audits in accordance with the standards of the PCAOB. Those standards require that we plan and perform the audit to obtain reasonable assurance about whether the financial statements and financial highlights are free of material misstatement, whether due to error or fraud. Our audits included performing procedures to assess the risks of material misstatement of the financial statements and financial highlights, whether due to error or fraud, and performing procedures that respond to those risks. Such procedures included examining, on a test basis, evidence regarding the amounts and disclosures in the financial statements and financial highlights. Such procedures also included confirmation of securities owned as of October 31, 2023, by correspondence with the custodian, the transfer agent and brokers; when replies were not received from brokers, we performed other auditing procedures. Our audits also included evaluating the accounting principles used and significant estimates made by management, as well as evaluating the overall presentation of the financial statements and financial highlights. We believe that our audits provide a reasonable basis for our opinion.

We have served as the auditor of one or more New York Life Investment Management investment companies since 2003.
Philadelphia, Pennsylvania
December 22, 2023
| 42 | MainStay MacKay U.S. Infrastructure Bond Fund |
Federal Income Tax Information
(Unaudited)
The Fund is required under the Internal Revenue Code to advise shareholders in a written statement as to the federal tax status of dividends paid by the Fund during such fiscal years.
In February 2024, shareholders will receive an IRS Form 1099-DIV or substitute Form 1099, which will show the federal tax status of the distributions received by shareholders in calendar year 2023. The amounts that will be reported on such 1099-DIV or substitute Form 1099 will be the amounts you are to use on your federal income tax return and will differ from the amounts which we must report for the Fund's fiscal year ended October 31, 2023.
Proxy Voting Policies and Procedures and Proxy Voting Record
The Fund is required to file with the SEC its proxy voting record for the 12-month period ending June 30 on Form N-PX. A description of the policies and procedures that are used to vote proxies relating to portfolio securities of the Fund is available free of charge upon request by calling 800-624-6782 or visiting the SEC’s website at www.sec.gov. The most recent Form N-PX or proxy voting record is available free of charge upon request by calling 800-624-6782; visiting newyorklifeinvestments.com; or visiting the SEC’s website at www.sec.gov.
Shareholder Reports and Quarterly Portfolio Disclosure
The Fund is required to file its complete schedule of portfolio holdings with the SEC 60 days after its first and third fiscal quarter on Form N-PORT. The Fund's holdings report is available free of charge upon request by calling New York Life Investments at 800-624-6782.
Board of Trustees and Officers (Unaudited)
The Trustees and officers of the Fund are listed below. The Board oversees the MainStay Group of Funds (which consists of MainStay Funds and MainStay Funds Trust), MainStay VP Funds Trust, MainStay MacKay DefinedTerm Municipal Opportunities Fund, MainStay CBRE Global Infrastructure Megatrends Term Fund, the Manager and the Subadvisors, and elects the officers of the Funds who are responsible for the day-to-day operations of the Fund. Information pertaining to the Trustees and officers is set forth below. Each Trustee serves until his or her successor is elected and qualified or until his or her resignation, death or
removal. Under the Board’s retirement policy, unless an exception is made, a Trustee must tender his or her resignation by the end of the calendar year during which he or she reaches the age of 75. Officers are elected annually by the Board. The business address of each Trustee and officer listed below is 51 Madison Avenue, New York, New York 10010. A majority of the Trustees are not “interested persons” (as defined by the 1940 Act and rules adopted by the SEC thereunder) of the Fund (“Independent Trustees”).
| | Name and
Year of Birth | Term of Office,
Position(s) Held and
Length of Service | Principal Occupation(s)
During Past Five Years | Number of
Portfolios in
Fund Complex
Overseen by
Trustee | Other Directorships
Held by Trustee |
| | | | | | |
| | Naïm Abou-Jaoudé*
1966 | MainStay Funds: Trustee
since 2023
MainStay Funds Trust:
Trustee since 2023 | Chief Executive Officer of New York Life Investment Management LLC (since 2023). Chief Executive Officer of Candriam (an affiliate of New York Life Investment Management LLC) (2007 to 2023). | 81 | MainStay VP Funds Trust:
Trustee since 2023 (31 portfolios);
MainStay MacKay DefinedTerm Municipal Opportunities Fund: Trustee
since 2023;
MainStay CBRE Global Infrastructure Megatrends Term Fund: Trustee
since 2023; and
New York Life Investment Management International (Chair) since 2015 |
| * | This Trustee is considered to be an “interested person” of the MainStay Group of Funds, MainStay VP Funds Trust, MainStay CBRE Global Infrastructure Megatrends Term Fund and MainStay MacKay DefinedTerm Municipal Opportunities Fund, within the meaning of the 1940 Act because of his affiliation with New York Life Investment Management LLC and Candriam, as described in detail above in the column entitled “Principal Occupation(s) During Past Five Years.” |
| | |
| 44 | MainStay MacKay U.S. Infrastructure Bond Fund |
| | Name and
Year of Birth | Term of Office,
Position(s) Held and
Length of Service | Principal Occupation(s)
During Past Five Years | Number of
Portfolios in
Fund Complex
Overseen by
Trustee | Other Directorships
Held by Trustee |
| | | | | | |
| | David H. Chow
1957 | MainStay Funds: Trustee since January 2016, Advisory Board Member (June 2015 to December 2015);MainStay Funds Trust:
Trustee since January 2016, Advisory Board Member (June 2015 to December 2015) | Founder and CEO, DanCourt Management, LLC (since 1999) | 81 | MainStay VP Funds Trust: Trustee since January 2016, Advisory Board Member (June 2015 to December 2015) (31 portfolios);
MainStay MacKay DefinedTerm Municipal Opportunities Fund: Trustee since January 2016, Advisory Board Member (June 2015 to December 2015);
MainStay CBRE Global Infrastructure Megatrends Term Fund: Trustee since 2021;
VanEck Vectors Group of Exchange-Traded Funds: Trustee since 2006 and Independent Chairman of the Board of Trustees from 2008 to 2022 (57 portfolios); and
Berea College of Kentucky: Trustee since 2009, Chair of the Investment Committee since 2018 |
| | Karen Hammond
1956 | MainStay Funds: Trustee since December 2021, Advisory Board Member (June 2021 to December 2021);MainStay Funds Trust:
Trustee since December 2021, Advisory Board Member (June 2021 to December 2021)
| Retired, Managing Director, Devonshire Investors (2007 to 2013); Senior Vice President, Fidelity Management & Research Co. (2005 to 2007); Senior Vice President and Corporate Treasurer, FMR Corp. (2003 to 2005); Chief Operating Officer, Fidelity Investments Japan (2001 to 2003) | 81 | MainStay VP Funds Trust: Trustee since December 2021, Advisory Board Member (June 2021 to December 2021) (31 portfolios);
MainStay MacKay DefinedTerm Municipal Opportunities Fund: Trustee since December 2021, Advisory Board Member (June 2021 to December 2021);
MainStay CBRE Global Infrastructure Megatrends Term Fund: Trustee since December 2021, Advisory Board Member (June 2021 to December 2021);
Two Harbors Investment Corp.: Director since 2018;
Rhode Island State Investment Commission: Member since 2017; and
Blue Cross Blue Shield of Rhode Island: Director since 2019 |
| | Susan B. Kerley
1951 | MainStay Funds: Chair since January 2017 and Trustee since 2007;MainStay Funds Trust:
Chair since January 2017 and Trustee since 1990*** | President, Strategic Management Advisors LLC (since 1990) | 81 | MainStay VP Funds Trust: Chair since January 2017 and Trustee since 2007 (31 portfolios)**;
MainStay MacKay DefinedTerm Municipal Opportunities Fund: Chair since January 2017 and Trustee since 2011;
MainStay CBRE Global Infrastructure Megatrends Term Fund: Trustee since June 2021; and
Legg Mason Partners Funds: Trustee since 1991 (45 portfolios) |
Board of Trustees and Officers (Unaudited) (continued)
| | Name and
Year of Birth | Term of Office,
Position(s) Held and
Length of Service | Principal Occupation(s)
During Past Five Years | Number of
Portfolios in
Fund Complex
Overseen by
Trustee | Other Directorships
Held by Trustee |
| | | | | | |
| | Alan R. Latshaw
1951 | MainStay Funds: Trusteesince 2006;MainStay Funds Trust:
Trustee since 2007*** | Retired; Partner, Ernst & Young LLP (2002 to 2003); Partner, Arthur Andersen LLP (1989 to 2002); Consultant to the MainStay Funds Audit and Compliance Committee (2004 to 2006) | 81 | MainStay VP Funds Trust: Trustee since 2007 (31 portfolios)**;
MainStay MacKay DefinedTerm Municipal Opportunities Fund: Trustee since 2011; and
MainStay CBRE Global Infrastructure Megatrends Term Fund: Trustee since June 2021 |
| | Jacques P. Perold
1958 | MainStay Funds: Trustee since January 2016, Advisory Board Member (June 2015to December 2015);MainStay Funds Trust:
Trustee since January 2016, Advisory Board Member (June 2015 to December 2015) | Founder and Chief Executive Officer, CapShift Advisors LLC (since 2018); President, Fidelity Management & Research Company (2009 to 2014); President and Chief Investment Officer, Geode Capital Management, LLC (2001 to 2009) | 81 | MainStay VP Funds Trust: Trustee since January 2016, Advisory Board Member (June 2015 to December 2015) (31 portfolios);
MainStay MacKay DefinedTerm Municipal Opportunities Fund: Trustee since January 2016, Advisory Board Member (June 2015 to December 2015);
MainStay CBRE Global Infrastructure Megatrends Term Fund: Trustee since June 2021;
Allstate Corporation: Director since 2015; and
MSCI Inc.: Director since 2017 |
| | Richard S. Trutanic
1952 | MainStay Funds: Trustee since 1994;MainStay Funds Trust:
Trustee since 2007*** | Chairman and Chief Executive Officer, Somerset & Company (financial advisory firm) (since 2004); Managing Director, The Carlyle Group (private investment firm) (2002 to 2004); Senior Managing Director, Partner and Board Member, Groupe Arnault S.A. (private investment firm) (1999 to 2002) | 81 | MainStay VP Funds Trust: Trustee since 2007 (31 portfolios)**;
MainStay MacKay DefinedTerm Municipal Opportunities Fund: Trustee since 2011; and
MainStay CBRE Global Infrastructure Megatrends Term Fund: Trustee since June 2021 |
| ** | Includes prior service as a Director of MainStay VP Series Fund, Inc., the predecessor to MainStay VP Funds Trust. |
| *** | Includes prior service as a Director/Trustee of certain predecessor entities to MainStay Funds Trust. |
| 46 | MainStay MacKay U.S. Infrastructure Bond Fund |
| | Name and
Year of Birth | Position(s) Held and
Length of Service | Principal Occupation(s)
During Past Five Years | |
| | | | | |
| | Kirk C. Lehneis
1974 | President, MainStay Funds, MainStay Funds Trust (since 2017) | Chief Operating Officer and Senior Managing Director (since 2016), New York Life Investment Management LLC and New York Life Investment Management Holdings LLC; Member of the Board of Managers (since 2017) and Senior Managing Director (since 2018), NYLIFE Distributors LLC; Chairman of the Board and Senior Managing Director, NYLIM Service Company LLC (since 2017); Trustee, President and Principal Executive Officer of IndexIQ Trust, IndexIQ ETF Trust and IndexIQ Active ETF Trust (since 2018); President, MainStay CBRE Global Infrastructure Megatrends Term Fund (since 2021), MainStay MacKay DefinedTerm Municipal Opportunities Fund and MainStay VP Funds Trust (since 2017)**; Senior Managing Director, Global Product Development (2015 to 2016); Managing Director, Product Development (2010 to 2015), New York Life Investment Management LLC | |
| | Jack R. Benintende
1964 | Treasurer and Principal Financial and Accounting Officer, MainStay Funds (since 2007), MainStay Funds Trust (since 2009) | Managing Director, New York Life Investment Management LLC (since 2007); Treasurer and Principal Financial and Accounting Officer, MainStay CBRE Global Infrastructure Megatrends Term Fund (since 2021), MainStay MacKay DefinedTerm Municipal Opportunities Fund (since 2011) and MainStay VP Funds Trust (since 2007)**; and Assistant Treasurer, New York Life Investment Management Holdings LLC (2008 to 2012) | |
| | J. Kevin Gao
1967 | Secretary and Chief Legal Officer, MainStay Funds and MainStay Funds Trust (since 2010) | Managing Director and Associate General Counsel, New York Life Investment Management LLC (since 2010); Secretary and Chief Legal Officer, MainStay CBRE Global Infrastructure Megatrends Term Fund (since 2021), MainStay MacKay DefinedTerm Municipal Opportunities Fund (since 2011) and MainStay VP Funds Trust (since 2010)** | |
| | Kevin M. Gleason
1967 | Vice President and Chief Compliance Officer, MainStay Funds and MainStay Funds Trust (since June 2022) | Vice President and Chief Compliance Officer, IndexIQ Trust, IndexIQ ETF Trust and Index IQ Active ETF Trust (since June 2022); Vice President and Chief Compliance Officer, MainStay CBRE Global Infrastructure Megatrends Term Fund, MainStay VP Funds Trust and MainStay MacKay DefinedTerm Municipal Opportunities Fund (since June 2022); Senior Vice President, Voya Investment Management and Chief Compliance Officer, Voya Family of Funds (2012 to 2022) | |
| | Scott T. Harrington
1959 | Vice President— Administration, MainStay Funds (since 2005), MainStay Funds Trust (since 2009) | Managing Director, New York Life Investment Management LLC (including predecessor advisory organizations) (since 2000); Member of the Board of Directors, New York Life Trust Company (since 2009); Vice President—Administration, MainStay CBRE Global Infrastructure Megatrends Term Fund (since 2021), MainStay MacKay DefinedTerm Municipal Opportunities Fund (since 2011) and MainStay VP Funds Trust (since 2005)** | |
| * | The officers listed above are considered to be “interested persons” of the MainStay Group of Funds, MainStay VP Funds Trust, MainStay CBRE Global Infrastructure Megatrends Term Fund and MainStay MacKay DefinedTerm Municipal Opportunities Fund within the meaning of the 1940 Act because of their affiliation with the MainStay Group of Funds, New York Life Insurance Company and/or its affiliates, including New York Life Investment Management LLC, New York Life Insurance Company, NYLIM Service Company LLC, NYLIFE Securities LLC and/or NYLIFE Distributors LLC, as described in detail in the column captioned “Principal Occupation(s) During Past Five Years.” Officers are elected annually by the Board. |
| ** | Includes prior service as an Officer of MainStay VP Series Fund, Inc., the predecessor to MainStay VP Funds Trust. |
Officers of the Trust (Who are not Trustees)*
This page intentionally left blank.
This page intentionally left blank.
This page intentionally left blank.
Equity
U.S. Equity
MainStay Epoch U.S. Equity Yield Fund
MainStay Fiera SMID Growth Fund
MainStay PineStone U.S. Equity Fund
MainStay S&P 500 Index Fund
MainStay Winslow Large Cap Growth Fund
MainStay WMC Enduring Capital Fund
MainStay WMC Growth Fund
MainStay WMC Small Companies Fund
MainStay WMC Value Fund
International Equity
MainStay Epoch International Choice Fund
MainStay PineStone International Equity Fund
MainStay WMC International Research Equity Fund
Emerging Markets Equity
MainStay Candriam Emerging Markets Equity Fund
Global Equity
MainStay Epoch Capital Growth Fund
MainStay Epoch Global Equity Yield Fund
MainStay PineStone Global Equity Fund
Fixed Income
Taxable Income
MainStay Candriam Emerging Markets Debt Fund
MainStay Floating Rate Fund
MainStay MacKay High Yield Corporate Bond Fund
MainStay MacKay Short Duration High Yield Fund
MainStay MacKay Strategic Bond Fund
MainStay MacKay Total Return Bond Fund
MainStay MacKay U.S. Infrastructure Bond Fund
MainStay Short Term Bond Fund
Tax-Exempt Income
MainStay MacKay California Tax Free Opportunities Fund1
MainStay MacKay High Yield Municipal Bond Fund
MainStay MacKay New York Tax Free Opportunities Fund2
MainStay MacKay Short Term Municipal Fund
MainStay MacKay Strategic Municipal Allocation Fund
MainStay MacKay Tax Free Bond Fund
Money Market
MainStay Money Market Fund
Mixed Asset
MainStay Balanced Fund
MainStay Income Builder Fund
MainStay MacKay Convertible Fund
Speciality
MainStay CBRE Global Infrastructure Fund
MainStay CBRE Real Estate Fund
MainStay Cushing MLP Premier Fund
Asset Allocation
MainStay Conservative Allocation Fund
MainStay Conservative ETF Allocation Fund
MainStay Defensive ETF Allocation Fund
MainStay Equity Allocation Fund
MainStay Equity ETF Allocation Fund
MainStay ESG Multi-Asset Allocation Fund
MainStay Growth Allocation Fund
MainStay Growth ETF Allocation Fund
MainStay Moderate Allocation Fund
MainStay Moderate ETF Allocation Fund
Manager
New York Life Investment Management LLC
New York, New York
Subadvisors
Candriam3
Strassen, Luxembourg
CBRE Investment Management Listed Real Assets LLC
Radnor, Pennsylvania
Cushing Asset Management, LP
Dallas, Texas
Epoch Investment Partners, Inc.
New York, New York
Fiera Capital Inc.
New York, New York
IndexIQ Advisors LLC3
New York, New York
MacKay Shields LLC3
New York, New York
NYL Investors LLC3
New York, New York
PineStone Asset Management Inc.
Montreal, Québec
Wellington Management Company LLP
Boston, Massachusetts
Winslow Capital Management, LLC
Minneapolis, Minnesota
Legal Counsel
Dechert LLP
Washington, District of Columbia
Independent Registered Public Accounting Firm
KPMG LLP
Philadelphia, Pennsylvania
Distributor
NYLIFE Distributors LLC3
Jersey City, New Jersey
Custodian
JPMorgan Chase Bank, N.A.
New York, New York
1.
This Fund is registered for sale in AZ, CA, NV, OR, TX, UT, WA and MI (Class A and Class I shares only), and CO, FL, GA, HI, ID, MA, MD, NH, NJ and NY (Class I shares only).
| 2. | This Fund is registered for sale in CA, CT, DE, FL, MA, NJ, NY and VT. |
| 3. | An affiliate of New York Life Investment Management LLC. |
Not part of the Annual Report
For more information
800-624-6782
newyorklifeinvestments.com
“New York Life Investments” is both a service mark, and the common trade name, of certain investment advisors affiliated with New York Life Insurance Company. The MainStay Funds® are managed by New York Life Investment Management LLC and distributed by NYLIFE Distributors LLC, 30 Hudson Street, Jersey City, NJ 07302, a wholly owned subsidiary of New York Life Insurance Company. NYLIFE Distributors LLC is a Member FINRA/SIPC.
©2023 NYLIFE Distributors LLC. All rights reserved.
| 5013941MS139-23 | MSINF11-12/23 |
(NYLIM) NL211
MainStay Money Market Fund
Message from the President and Annual Report
October 31, 2023
Special Notice:
Beginning in July 2024, new regulations issued by the Securities and Exchange Commission (SEC) will take effect requiring open-end mutual fund companies and ETFs to (1) overhaul the content of their shareholder reports and (2) mail paper copies of the new tailored shareholder reports to shareholders who have not opted to receive these documents electronically.
If you have not yet elected to receive your shareholder reports electronically, please contact your financial intermediary or visit newyorklifeinvestments.com/accounts.
| Not FDIC/NCUA Insured | Not a Deposit | May Lose Value | No Bank Guarantee | Not Insured by Any Government Agency |
This page intentionally left blank
Message from the President
Volatile economic and geopolitical forces drove market behavior during the 12-month reporting period ended October 31, 2023. While equity markets generally gained ground, bond prices trended broadly lower.
Although the war in Ukraine, the outbreak of hostilities in the Middle East and several other notable events affected financial assets, inflation and interest rate trends stood at the forefront of market developments during most of the period. As the reporting period began, high levels of inflation already showed signs of easing in the face of aggressive rate hikes by the U.S. Federal Reserve (the “Fed”). From a peak of 9.1% in June 2022, the annualized U.S. inflation rate dropped to 7.1% in November 2022, and to 3.2% in October 2023. At the same time, the Fed increased the benchmark federal funds rate from 3.75%–4.00% at the beginning of the reporting period to 5.25%–5.50% as of October 31, 2023. As the pace of rate increases slowed during the period, investors hoped for an early shift to a looser monetary policy. However, comments from Fed members late in the period reinforced the central bank’s hawkish stance in response to surprisingly robust U.S. economic growth and rising wage pressures, thus increasing the likelihood that interest rates would stay higher for longer. International developed markets exhibited similar dynamics of elevated inflation and rising interest rates.
Despite the backdrop of high interest rates—along with political dysfunction in Washington D.C. and intensifying global geopolitical instability—equity markets managed to advance, supported by healthy consumer spending trends and persistent domestic economic growth. The S&P 500® Index, a widely regarded benchmark of large-cap U.S. market performance, gained ground, bolstered by the strong performance of energy stocks amid surging petroleum prices and mega-cap, growth-oriented, technology-related shares, which rose as investors flocked to companies creating the infrastructure for developments in artificial intelligence. Smaller-cap stocks and value-oriented shares produced milder returns. Among industry sectors, energy and
information technology posted the strongest gains. Real estate declined most sharply under pressure from rising mortgage rates and weak levels of office occupancy. Developed international markets outperformed U.S. markets, with Europe benefiting during the first half of the period from unexpected economic resilience in the face of rising energy prices and the ongoing war in Ukraine. Emerging markets posted positive results but lagged developed markets, largely due to slow economic growth in China despite the relaxation of pandemic-era lockdowns.
Bond prices were driven lower by rising yields and increasing expectations of high interest rates for an extended period of time. The U.S. yield curve steepened, with the 30-year Treasury yield exceeding 5% for the first time in more than a decade. The yield curve remained inverted, with the 10-year Treasury yield ending the period at 4.88%, compared with 5.07% for the 2-year Treasury yield. Corporate bonds outperformed long-term Treasury bonds, but still trended lower under pressure from rising yields and an uptick in default rates. Among corporates, lower-credit-quality instruments performed slightly better than their higher-credit-quality counterparts, while floating rate securities performed better still.
In the face of today’s uncertain market environment, New York Life Investments remains dedicated to providing the guidance, resources and investment solutions you need to pursue your financial goals.
Thank you for trusting us to help meet your investment needs.
Sincerely,
Kirk C. Lehneis
President
The opinions expressed are as of the date of this report and are subject to change. There is no guarantee that any forecast made will come to pass. This material does not constitute investment advice and is not intended as an endorsement of any specific investment. Past performance is no guarantee of future results.
Not part of the Annual Report
An investment in the Fund is not insured or guaranteed by the Federal Deposit Insurance Corporation or any other government agency. Although the Fund seeks to preserve the value of your investment at $1.00 per share, it is possible to lose money by investing in the Fund. The Fund’s sponsor has no legal obligation to provide financial support to the Fund, and you should not expect that the sponsor will provide financial support at any time. The Fund may impose a fee upon the sale of your shares or may temporarily suspend your ability to sell shares if the Fund’s liquidity falls below required minimums because of market conditions or other factors.
Investors should refer to the Fund’s Summary Prospectus and/or Prospectus and consider the Fund’s investment objectives, strategies, risks, charges and expenses carefully before investing. The Summary Prospectus and/or Prospectus contain this and other information about the Fund. You may obtain copies of the Fund’s Summary Prospectus, Prospectus and Statement of Additional Information, which includes information about The MainStay Funds' Trustees, free of charge, upon request, by calling toll-free 800-624-6782, by writing to NYLIFE Distributors LLC, Attn: MainStay Marketing Department, 30 Hudson Street, Jersey City, NJ 07302 or by sending an e-mail to MainStayShareholderServices@nylim.com. These documents are also available via the MainStay Funds’ website at newyorklifeinvestments.com. Please read the Fund’s Summary Prospectus and/or Prospectus carefully before investing.
Investment and Performance Comparison (Unaudited)
Performance data quoted represents past performance. Past performance is no guarantee of future results. Because of market volatility and other factors, current performance may be lower or higher than the figures shown. Investment return and principal value will fluctuate, and as a result, when shares are redeemed, they may be worth more or less than their original cost. The graph below depicts the historical performance of Class A2 shares of the Fund. Performance will vary from class to class based on differences in class-specific expenses. For performance information current to the most recent month-end, please call 800-624-6782 or visit newyorklifeinvestments.com.
The performance table and graph do not reflect the deduction of taxes that a shareholder would pay on distributions or Fund share redemptions. Total returns reflect changes in share price, and reinvestment of dividend and capital gain distributions. The graph assumes the initial investment amount shown below. Performance figures may reflect certain fee waivers and/or expense limitations, without which total returns may have been lower. For more information on share classes and current fee waivers and/or expense limitations (if any), please refer to the Notes to Financial Statements.
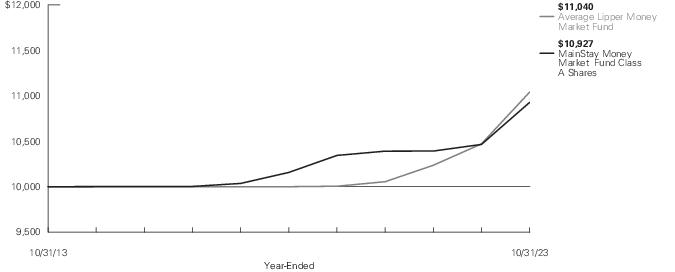
| Average Annual Total Returns for the Year-Ended October 31, 2023 |
| Class | Sales Charge | | Inception
Date | One
Year | Five
Years | Ten Years
or Since
Inception | Gross
Expense
Ratio1 |
| Class A Shares2 | No Sales Charge | | 1/3/1995 | 4.42% | 1.47% | 0.89% | 0.52% |
| Investor Class Shares2 | No Sales Charge | | 2/28/2008 | 4.13 | 1.32 | 0.78 | 0.84 |
| Class B Shares2, 3 | No Sales Charge | | 5/1/1986 | 4.13 | 1.32 | 0.78 | 0.84 |
| Class C Shares2 | No Sales Charge | | 9/1/1998 | 4.13 | 1.32 | 0.78 | 0.84 |
| SIMPLE Class Shares2 | No Sales Charge | | 8/31/2020 | 4.33 | N/A | 1.53 | 0.65 |
| 1. | The gross expense ratios presented reflect the Fund’s “Total Annual Fund Operating Expenses” from the most recent Prospectus, as supplemented, and may differ from other expense ratios disclosed in this report. |
| 2. | As of October 31, 2023, MainStay Money Market Fund had an effective 7-day yield of 5.06% for Class A, 4.77% for Investor Class, 4.77% for Class B, 4.77% for Class C and 5.13% for SIMPLE Class shares. The 7-day current yield was 4.94% for Class A, 4.66% for Investor Class, 4.66% for Class B, 4.66% for Class C and 5.00% for SIMPLE Class shares. These yields reflect certain expense limitations. Had these expense limitations not been in effect, the effective 7-day yield would have been 5.06%, 4.95%, 4.95%, 4.95% and 5.13%, for Class A, Investor Class, Class B, Class C and SIMPLE Class shares, respectively, and the 7-day current yield would have been 4.94%, 4.83%, 4.83%, 4.83% and 5.00%, for Class A, Investor Class, Class B, Class C and SIMPLE Class shares, respectively. The current yield reflects the Fund’s earnings better than the Fund’s total return. |
| 3. | Class B shares are closed to all new purchases as well as additional investments by existing Class B shareholders. |
The footnotes on the next page are an integral part of the table and graph and should be carefully read in conjunction with them.
| Benchmark Performance* | One
Year | Five
Years | Ten
Years |
| Average Lipper Money Market Fund1 | 4.55% | 1.56% | 0.99% |
| * | Returns for indices reflect no deductions for fees, expenses or taxes, except for foreign withholding taxes where applicable. Results assume reinvestment of all dividends and capital gains. An investment cannot be made directly in an index. |
| 1. | The Average Lipper Money Market Fund is an equally weighted performance average adjusted for capital gains distributions and income dividends of all of the money market funds in the Lipper Universe. Lipper Inc., a wholly-owned subsidiary of Reuters Group PLC, is an independent monitor of mutual fund performance. Lipper averages are not class specific. Lipper returns are unaudited. Results are based on average total returns of similar funds with all dividend and capital gain distributions reinvested. |
The footnotes on the preceding page are an integral part of the table and graph and should be carefully read in conjunction with them.
| 6 | MainStay Money Market Fund |
Cost in Dollars of a $1,000 Investment in MainStay Money Market Fund (Unaudited)
The example below is intended to describe the fees and expenses borne by shareholders during the six-month period from May 1, 2023 to October 31, 2023, and the impact of those costs on your investment.
Example
As a shareholder of the Fund you incur two types of costs: (1) transaction costs, including exchange fees and sales charges (loads) on purchases (as applicable), and (2) ongoing costs, including management fees, distribution and/or service (12b-1) fees and other Fund expenses (as applicable). This example is intended to help you understand your ongoing costs (in dollars) of investing in the Fund and to compare these costs with the ongoing costs of investing in other mutual funds. The example is based on an investment of $1,000 made at the beginning of the six-month period and held for the entire period from May 1, 2023 to October 31, 2023.
This example illustrates your Fund’s ongoing costs in two ways:
Actual Expenses
The second and third data columns in the table below provide information about actual account values and actual expenses. You may use the information in these columns, together with the amount you invested, to estimate the expenses that you paid during the six months ended October 31, 2023. Simply divide your account value by $1,000 (for example, an
$8,600 account value divided by $1,000 = 8.6), then multiply the result by the number under the heading entitled “Expenses Paid During Period” to estimate the expenses you paid on your account during this period.
Hypothetical Example for Comparison Purposes
The fourth and fifth data columns in the table below provide information about hypothetical account values and hypothetical expenses based on the Fund’s actual expense ratio and an assumed rate of return of 5% per year before expenses, which is not the Fund’s actual return. The hypothetical account values and expenses may not be used to estimate the actual ending account balances or expenses you paid for the six-month period shown. You may use this information to compare the ongoing costs of investing in the Fund with the ongoing costs of investing in other mutual funds. To do so, compare this 5% hypothetical example with the 5% hypothetical examples that appear in the shareholder reports of the other mutual funds.
Please note that the expenses shown in the table are meant to highlight your ongoing costs only and do not reflect any transactional costs, such as exchange fees or sales charges (loads). Therefore, the fourth and fifth data columns of the table are useful in comparing ongoing costs only and will not help you determine the relative total costs of owning different funds. In addition, if these transactional costs were included, your costs would have been higher.
| Share Class | Beginning
Account
Value
5/1/23 | Ending Account
Value (Based
on Actual
Returns and
Expenses)
10/31/23 | Expenses
Paid
During
Period1 | Ending Account
Value (Based
on Hypothetical
5% Annualized
Return and
Actual Expenses)
10/31/23 | Expenses
Paid
During
Period1 | Net Expense
Ratio
During
Period2 |
| Class A Shares | $1,000.00 | $1,024.20 | $2.70 | $1,022.53 | $2.70 | 0.53% |
| Investor Class Shares | $1,000.00 | $1,022.80 | $4.08 | $1,021.17 | $4.08 | 0.80% |
| Class B Shares | $1,000.00 | $1,022.80 | $4.08 | $1,021.17 | $4.08 | 0.80% |
| Class C Shares | $1,000.00 | $1,022.80 | $4.08 | $1,021.17 | $4.08 | 0.80% |
| SIMPLE Class Shares | $1,000.00 | $1,024.40 | $2.70 | $1,022.53 | $2.70 | 0.53% |
| 1. | Expenses are equal to the Fund’s annualized expense ratio of each class multiplied by the average account value over the period, divided by 365 and multiplied by 184 (to reflect the six-month period). The table above represents the actual expenses incurred during the six-month period. In addition to the fees and expenses which the Fund bears directly, it also indirectly bears a pro rata share of the fees and expenses of the underlying funds in which it invests. Such indirect expenses are not included in the above-reported expense figures. |
| 2. | Expenses are equal to the Fund's annualized expense ratio to reflect the six-month period. |
Portfolio Composition as of October 31, 2023 (Unaudited)
See Portfolio of Investments beginning on page 10 for specific holdings within these categories. The Fund's holdings are subject to change.
| 8 | MainStay Money Market Fund |
Portfolio Management Discussion and Analysis (Unaudited)
Questions answered by NYL Investors LLC, the Fund’s Subadvisor.
How did MainStay Money Market Fund perform relative to its benchmark and peer group during the 12 months ended October 31, 2023?
For the 12 months ended October 31, 2023, Class A shares of MainStay Money Market Fund provided a 7-day effective yield of 5.06% and a 7-day current yield of 4.94%. For the 12 months ended October 31, 2023, Class A shares returned 4.42%, underperforming the 4.55% return of the Average Lipper Money Market Fund.1
What factors affected the Fund’s relative performance during the reporting period?
During the reporting period, the U.S. Federal Reserve (the “Fed”) continued to tighten monetary policy, increasing the federal funds target rate from 3% to 5.25%. This continued to drive demand among investors, as money market yields were higher than longer-term interest rates. Industry wide, portfolio manager duration2 positioning remained short and focused on staying within the upcoming Fed meetings to benefit from the continued tightening cycle. A large increase in bill issuance was easily absorbed by the cash inflows into money market funds, keeping T-Bills and agency discount notes in line with the effective federal funds rate.3 Commercial paper interest rates remained higher than the effective federal funds rate, providing a yield pickup that was unavailable in T-Bills or agency discount notes.
What was the Fund’s duration strategy during the reporting period?
During the reporting period, the Fund generally maintained a duration shorter than that of the Bloomberg 1 Month T-Bill Index (the “Index”).4 Our strategy throughout the reporting period was to keep the duration of the Fund as short as possible to stay in front of each Fed monetary policy meeting. Our expectation was that the Fed would be tightening monetary policy by raising interest rates at each meeting. The shorter duration profile of the Fund allowed us to reinvest maturing securities at higher interest rates after each subsequent meeting. While it appears that the Fed may be done raising rates in this hiking cycle, still-elevated inflation combined with stronger-than-expected economic data should prevent the Fed from cutting rates anytime soon. Because of this, we remain hesitant to demonstrably extend the Fund’s duration until we have more clarity on the future of monetary policy. As of
October 31, 2023, the Fund’s duration was 0.04 years compared to a duration of 0.09 years for the Index.
During the reporting period, which sectors were the strongest positive contributors to the Fund’s relative performance and which sectors were particularly weak?
During the reporting period, the Fund maintained overweight exposure compared to the Index in the Tier 15 commercial paper subcomponent, which was accretive to relative performance. Within the industrial subsector of the Fund’s commercial paper holdings, the best performers included Cummins and Toyota Motor. Within the utility subsector, Canadian National Railway was the most accretive to performance. The Fund also maintained an overweight position in tri-party repurchase positions. This allocation was accretive to relative performance.
During the same period, the Fund maintained underweight exposure to the Treasury sector, which detracted from relative performance.
What were some of the Fund’s largest purchases and sales during the reporting period?
The top issuers purchased during the reporting period included Toronto-Dominion Bank, Cummins, Toyota Motor, Bank of America and Canadian National Railway. Sales during the reporting period were limited to U.S. Treasury bills.
How did the Fund’s sector weightings change during the reporting period?
The Fund’s allocation to the Treasury sector increased from 11.8% to 29.9% during the reporting period, while the allocation to tri-party repo increased from 6.5% to 11.2%. Conversely, the Fund’s allocation to Tier 1 commercial paper decreased from 81.7% to 59% during the same period. The allocation changes were made to take advantage of the increased yield being offered on both Treasury bills and tri-party repurchase positions. In addition to the sector weighting changes, the Fund’s duration changed from 0.02 years to 0.04 years during the reporting period.
| 1. | See "Investment and Performance Comparison" for other share class returns, which may be higher or lower than Class A share returns, and for more information on benchmark and peer group returns. |
| 2. | Duration is a measure of the price sensitivity of a fixed-income investment to changes in interest rates. Duration is expressed as a number of years and is considered a more accurate sensitivity gauge than average maturity. |
| 3. | The effective federal funds rate (EFFR) is calculated as the effective median interest rate of overnight federal funds transactions during the previous business day. It is published daily by the Federal Reserve Bank of New York. |
| 4. | The Bloomberg 1 Month T-Bill Index represents a hypothetical one-month T-bill curve. |
| 5. | Tier 1 commercial paper may carry A-1 or above ratings from Standard & Poor’s, P-1 from Moody’s and/or F1 or above from Fitch. |
The opinions expressed are those of the portfolio manager as of the date of this report and are subject to change. There is no guarantee that any forecasts will come to pass. This material does not constitute investment advice and is not intended as an endorsement of any specific investment.
Portfolio of Investments October 31, 2023†^
| | Principal
Amount | Value |
| Short-Term Investments 103.7% |
| Commercial Paper 62.7% |
| Alabama Power Co. | | |
| 5.382%, due 11/2/23 | $ 20,000,000 | $ 19,997,011 |
| American Transmission Co. LLC | | |
| 5.371%, due 11/8/23 | 20,000,000 | 19,979,195 |
| Analog Devices, Inc. | | |
| 5.423%, due 11/9/23 | 20,000,000 | 19,976,000 |
| CDP Financial, Inc. | | |
| 5.405%, due 11/6/23 | 20,000,000 | 19,985,056 |
| Cummins, Inc. | | |
| 5.474%, due 11/13/23 | 20,000,000 | 19,963,733 |
| Emerson Electric Co. | | |
| 5.405%, due 11/2/23 | 20,000,000 | 19,997,011 |
| Estee Lauder Cos., Inc. (The) | | |
| 5.438%, due 12/4/23 | 20,000,000 | 19,901,000 |
| Henkel Corp. | | |
| 5.401%, due 11/27/23 | 20,000,000 | 19,922,289 |
| Hydro-Quebec | | |
| 5.37%, due 11/6/23 | 20,000,000 | 19,985,139 |
| John Deere Financial, Inc. | | |
| 5.433%, due 12/4/23 | 20,000,000 | 19,901,000 |
| Microsoft Corp. | | |
| 5.364%, due 11/3/23 | 20,000,000 | 19,994,078 |
| National Rural Utilities Cooperative Finance Corp. | | |
| 5.464%, due 11/9/23 | 20,000,000 | 19,975,778 |
| Natixis SA | | |
| 5.465%, due 11/22/23 | 20,000,000 | 19,936,533 |
| PACCAR Financial Corp. | | |
| 5.403%, due 11/29/23 | 20,000,000 | 19,916,467 |
| Protective Life Short Term Funding LLC | | |
| 5.423%, due 11/14/23 | 20,000,000 | 19,961,000 |
| Southern California Gas Co. | | |
| 5.351%, due 11/8/23 | 20,000,000 | 19,979,233 |
| TotalEnergies Capital SA | | |
| 5.347%, due 11/16/23 | 20,000,000 | 19,955,583 |
Total Commercial Paper
(Cost $339,326,106) | | 339,326,106 |
| | Principal
Amount | Value |
| |
| Repurchase Agreements 11.2% |
Bofa Securities, Inc.
5.29%, dated 10/31/23
due 11/1/23
Proceeds at Maturity $30,000,046
(Collateralized by United States Treasury security with a rate of 2.75% and with maturity date of 07/31/27, with a Principal Amount of $32,717,700 and a Market Value of $30,600,047) | $ 30,000,000 | $ 30,000,000 |
RBC Capital Markets LLC
5.29%, dated 10/31/23
due 11/1/23
Proceeds at Maturity $15,479,354
(Collateralized by United States Treasury securities with rates between 0.00% and 5.419% and maturity dates between 07/31/24 and 05/15/32, with a Principal Amount of $16,547,031 and a Market Value of $15,788,942) | 15,477,000 | 15,477,000 |
TD Securities, Inc.
5.30%, dated 10/31/23
due 11/1/23
Proceeds at Maturity $15,000,022
(Collateralized by United States Treasury securities with rates between 0.75% and 4.125% and maturity dates between 06/30/24 and 10/31/27, with a Principal Amount of $15,898,500 and a Market Value of $15,300,022) | 15,000,000 | 15,000,000 |
Total Repurchase Agreements
(Cost $60,477,000) | | 60,477,000 |
| U.S. Treasury Debt 29.8% |
| U.S. Treasury Bills (a) | | |
| 5.307%, due 11/28/23 | 45,000,000 | 44,821,640 |
| 5.31%, due 11/14/23 | 11,000,000 | 10,978,990 |
The notes to the financial statements are an integral part of, and should be read in conjunction with, the financial statements.
| 10 | MainStay Money Market Fund |
| | Principal
Amount | | Value |
| Short-Term Investments (continued) |
| U.S. Treasury Debt (continued) |
| U.S. Treasury Bills (a) (continued) | | | |
| 5.317%, due 11/21/23 | $ 28,000,000 | | $ 27,917,635 |
| 5.335%, due 11/7/23 | 78,000,000 | | 77,930,937 |
Total U.S. Treasury Debt
(Cost $161,649,202) | | | 161,649,202 |
Total Short-Term Investments
(Cost $561,452,308) | 103.7% | | 561,452,308 |
| Other Assets, Less Liabilities | (3.7) | | (19,899,834) |
| Net Assets | 100.0% | | $ 541,552,474 |
| † | Percentages indicated are based on Fund net assets. |
| ^ | Industry classifications may be different than those used for compliance monitoring purposes. |
| (a) | Interest rate shown represents yield to maturity. |
The following is a summary of the fair valuations according to the inputs used as of October 31, 2023, for valuing the Fund’s assets:
| Description | Quoted
Prices in
Active
Markets for
Identical
Assets
(Level 1) | | Significant
Other
Observable
Inputs
(Level 2) | | Significant
Unobservable
Inputs
(Level 3) | | Total |
| Asset Valuation Inputs | | | | | | | |
| Investments in Securities (a) | | | | | | | |
| Short-Term Investments | | | | | | | |
| Commercial Paper | $ — | | $ 339,326,106 | | $ — | | $ 339,326,106 |
| Repurchase Agreements | — | | 60,477,000 | | — | | 60,477,000 |
| U.S. Treasury Debt | — | | 161,649,202 | | — | | 161,649,202 |
| Total Investments in Securities | $ — | | $ 561,452,308 | | $ — | | $ 561,452,308 |
| (a) | For a complete listing of investments and their industries, see the Portfolio of Investments. |
The notes to the financial statements are an integral part of, and should be read in conjunction with, the financial statements.
11
Statement of Assets and Liabilities as of October 31, 2023
| Assets |
Investment in securities, at value
(amortized cost $500,975,308) | $500,975,308 |
Repurchase agreements, at value
(amortized cost $60,477,000) | 60,477,000 |
| Cash | 1,510 |
| Receivables: | |
| Fund shares sold | 328,653 |
| Interest | 8,870 |
| Other assets | 51,232 |
| Total assets | 561,842,573 |
| Liabilities |
| Payables: | |
| Investment securities purchased | 19,922,289 |
| Manager (See Note 3) | 184,042 |
| Transfer agent (See Note 3) | 102,718 |
| Fund shares redeemed | 35,172 |
| Professional fees | 13,856 |
| Custodian | 3,988 |
| Shareholder communication | 453 |
| Accrued expenses | 228 |
| Dividends payable | 27,353 |
| Total liabilities | 20,290,099 |
| Net assets | $541,552,474 |
| Composition of Net Assets |
| Shares of beneficial interest outstanding (par value of $.01 per share) unlimited number of shares authorized | $ 5,415,654 |
| Additional paid-in-capital | 536,109,303 |
| | 541,524,957 |
| Total distributable earnings (loss) | 27,517 |
| Net assets | $541,552,474 |
| Class A | |
| Net assets applicable to outstanding shares | $487,114,201 |
| Shares of beneficial interest outstanding | 487,114,210 |
| Net asset value and offering price per share outstanding | $ 1.00 |
| Investor Class | |
| Net assets applicable to outstanding shares | $ 17,024,680 |
| Shares of beneficial interest outstanding | 17,034,338 |
| Net asset value and offering price per share outstanding | $ 1.00 |
| Class B | |
| Net assets applicable to outstanding shares | $ 22,152,105 |
| Shares of beneficial interest outstanding | 22,155,435 |
| Net asset value and offering price per share outstanding | $ 1.00 |
| Class C | |
| Net assets applicable to outstanding shares | $ 15,086,614 |
| Shares of beneficial interest outstanding | 15,086,524 |
| Net asset value and offering price per share outstanding | $ 1.00 |
| SIMPLE Class | |
| Net assets applicable to outstanding shares | $ 174,874 |
| Shares of beneficial interest outstanding | 174,873 |
| Net asset value and offering price per share outstanding | $ 1.00 |
The notes to the financial statements are an integral part of, and should be read in conjunction with, the financial statements.
| 12 | MainStay Money Market Fund |
Statement of Operations for the year ended October 31, 2023
| Investment Income (Loss) |
| Income | |
| Interest | $24,409,371 |
| Expenses | |
| Manager (See Note 3) | 2,001,310 |
| Transfer agent (See Note 3) | 552,677 |
| Registration | 123,807 |
| Professional fees | 98,924 |
| Custodian | 24,610 |
| Trustees | 12,567 |
| Shareholder communication | 4,719 |
| Miscellaneous | 5,549 |
| Total expenses before waiver/reimbursement | 2,824,163 |
| Expense waiver/reimbursement from Manager (See Note 3) | (41,368) |
| Reimbursement from prior custodian(a) | (934) |
| Net expenses | 2,781,861 |
| Net investment income (loss) | 21,627,510 |
| Realized Gain (Loss) |
| Net realized gain (loss) on investments | 3,598 |
| Net increase (decrease) in net assets resulting from operations | $21,631,108 |
| (a) | Represents a refund for overbilling of custody fees. |
The notes to the financial statements are an integral part of, and should be read in conjunction with, the financial statements.
13
Statements of Changes in Net Assets
for the years ended October 31, 2023 and October 31, 2022
| | 2023 | 2022 |
| Increase (Decrease) in Net Assets |
| Operations: | | |
| Net investment income (loss) | $ 21,627,510 | $ 3,266,263 |
| Net realized gain (loss) | 3,598 | (8,910) |
| Net increase (decrease) in net assets resulting from operations | 21,631,108 | 3,257,353 |
| Distributions to shareholders: | | |
| Class A | (19,296,985) | (2,920,592) |
| Investor Class | (738,241) | (109,797) |
| Class B | (920,152) | (132,408) |
| Class C | (664,134) | (103,073) |
| SIMPLE Class | (7,996) | (394) |
| Total distributions to shareholders | (21,627,508) | (3,266,264) |
| Capital share transactions: | | |
| Net proceeds from sales of shares | 467,513,223 | 533,186,206 |
| Net asset value of shares issued to shareholders in reinvestment of distributions | 21,108,528 | 3,179,577 |
| Cost of shares redeemed | (436,011,790) | (467,932,037) |
| Increase (decrease) in net assets derived from capital share transactions | 52,609,961 | 68,433,746 |
| Net increase (decrease) in net assets | 52,613,561 | 68,424,835 |
| Net Assets |
| Beginning of year | 488,938,913 | 420,514,078 |
| End of year | $ 541,552,474 | $ 488,938,913 |
The notes to the financial statements are an integral part of, and should be read in conjunction with, the financial statements.
| 14 | MainStay Money Market Fund |
Financial Highlights selected per share data and ratios
| | Year Ended October 31, |
| Class A | 2023 | | 2022 | | 2021 | | 2020 | | 2019 |
| Net asset value at beginning of year | $ 1.00 | | $ 1.00 | | $ 1.00 | | $ 1.00 | | $ 1.00 |
| Net investment income (loss) (a) | 0.04 | | 0.01 | | 0.00‡ | | 0.00‡ | | 0.02 |
| Net realized and unrealized gain (loss) | 0.00‡ | | 0.00‡ | | 0.00‡ | | 0.00‡ | | 0.00‡ |
| Total from investment operations | 0.04 | | 0.01 | | 0.00‡ | | 0.00‡ | | 0.02 |
| Less distributions: | | | | | | | | | |
| From net investment income | (0.04) | | (0.01) | | (0.00)‡ | | (0.00)‡ | | (0.02) |
| Net asset value at end of year | $ 1.00 | | $ 1.00 | | $ 1.00 | | $ 1.00 | | $ 1.00 |
| Total investment return (b) | 4.42% | | 0.70% | | 0.01% | | 0.45% | | 1.84% |
| Ratios (to average net assets)/Supplemental Data: | | | | | | | | | |
| Net investment income (loss) | 4.35% | | 0.75% | | 0.01% | | 0.37% | | 1.82% |
| Net expenses | 0.52% | | 0.37% | | 0.12% | | 0.39% | | 0.56% |
| Expenses (before waiver/reimbursement) | 0.52% | | 0.52% | | 0.54% | | 0.55% | | 0.56% |
| Net assets at end of year (in 000’s) | $ 487,114 | | $ 427,378 | | $ 354,743 | | $ 415,041 | | $ 290,421 |
| ‡ | Less than one cent per share. |
| (a) | Per share data based on average shares outstanding during the year. |
| (b) | Total investment return is calculated exclusive of sales charges and assumes the reinvestment of distributions. For periods of less than one year, total return is not annualized. |
| | Year Ended October 31, |
| Investor Class | 2023 | | 2022 | | 2021 | | 2020 | | 2019 |
| Net asset value at beginning of year | $ 1.00 | | $ 1.00 | | $ 1.00 | | $ 1.00 | | $ 1.00 |
| Net investment income (loss) (a) | 0.04 | | 0.01 | | 0.00‡ | | 0.00‡ | | 0.02 |
| Net realized and unrealized gain (loss) | 0.00‡ | | 0.00‡ | | 0.00‡ | | 0.00‡ | | 0.00‡ |
| Total from investment operations | 0.04 | | 0.01 | | 0.00‡ | | 0.00‡ | | 0.02 |
| Less distributions: | | | | | | | | | |
| From net investment income | (0.04) | | (0.01) | | (0.00)‡ | | (0.00)‡ | | (0.02) |
| Net asset value at end of year | $ 1.00 | | $ 1.00 | | $ 1.00 | | $ 1.00 | | $ 1.00 |
| Total investment return (b) | 4.13% | | 0.56% | | 0.01% | | 0.35% | | 1.59% |
| Ratios (to average net assets)/Supplemental Data: | | | | | | | | | |
| Net investment income (loss) | 4.04% | | 0.53% | | 0.01% | | 0.33% | | 1.58% |
| Net expenses | 0.80% | | 0.49% | | 0.12% | | 0.51% | | 0.80% |
| Expenses (before waiver/reimbursement) | 0.87% | | 0.84% | | 0.96% | | 0.91% | | 0.88% |
| Net assets at end of year (in 000's) | $ 17,025 | | $ 19,327 | | $ 22,096 | | $ 28,427 | | $ 28,133 |
| ‡ | Less than one cent per share. |
| (a) | Per share data based on average shares outstanding during the year. |
| (b) | Total investment return is calculated exclusive of sales charges and assumes the reinvestment of distributions. For periods of less than one year, total return is not annualized. |
The notes to the financial statements are an integral part of, and should be read in conjunction with, the financial statements.
15
Financial Highlights selected per share data and ratios
| | Year Ended October 31, |
| Class B | 2023 | | 2022 | | 2021 | | 2020 | | 2019 |
| Net asset value at beginning of year | $ 1.00 | | $ 1.00 | | $ 1.00 | | $ 1.00 | | $ 1.00 |
| Net investment income (loss) (a) | 0.04 | | 0.01 | | 0.00‡ | | 0.00‡ | | 0.02 |
| Net realized and unrealized gain (loss) | 0.00‡ | | 0.00‡ | | 0.00‡ | | 0.00‡ | | 0.00‡ |
| Total from investment operations | 0.04 | | 0.01 | | 0.00‡ | | 0.00‡ | | 0.02 |
| Less distributions: | | | | | | | | | |
| From net investment income | (0.04) | | (0.01) | | (0.00)‡ | | (0.00)‡ | | (0.02) |
| Net asset value at end of year | $ 1.00 | | $ 1.00 | | $ 1.00 | | $ 1.00 | | $ 1.00 |
| Total investment return (b) | 4.13% | | 0.56% | | 0.01% | | 0.35% | | 1.59% |
| Ratios (to average net assets)/Supplemental Data: | | | | | | | | | |
| Net investment income (loss) | 4.05% | | 0.54% | | 0.01% | | 0.35% | | 1.59% |
| Net expenses | 0.80% | | 0.49% | | 0.12% | | 0.52% | | 0.80% |
| Expenses (before waiver/reimbursement) | 0.87% | | 0.84% | | 0.97% | | 0.90% | | 0.88% |
| Net assets at end of year (in 000’s) | $ 22,152 | | $ 23,696 | | $ 25,709 | | $ 30,215 | | $ 32,981 |
| ‡ | Less than one cent per share. |
| (a) | Per share data based on average shares outstanding during the year. |
| (b) | Total investment return is calculated exclusive of sales charges and assumes the reinvestment of distributions. For periods of less than one year, total return is not annualized. |
| | Year Ended October 31, |
| Class C | 2023 | | 2022 | | 2021 | | 2020 | | 2019 |
| Net asset value at beginning of year | $ 1.00 | | $ 1.00 | | $ 1.00 | | $ 1.00 | | $ 1.00 |
| Net investment income (loss) (a) | 0.04 | | 0.01 | | 0.00‡ | | 0.00‡ | | 0.02 |
| Net realized and unrealized gain (loss) | 0.00‡ | | 0.00‡ | | 0.00‡ | | 0.00‡ | | 0.00‡ |
| Total from investment operations | 0.04 | | 0.01 | | 0.00‡ | | 0.00‡ | | 0.02 |
| Less distributions: | | | | | | | | | |
| From net investment income | (0.04) | | (0.01) | | (0.00)‡ | | (0.00)‡ | | (0.02) |
| Net asset value at end of year | $ 1.00 | | $ 1.00 | | $ 1.00 | | $ 1.00 | | $ 1.00 |
| Total investment return (b) | 4.13% | | 0.56% | | 0.01% | | 0.35% | | 1.60% |
| Ratios (to average net assets)/Supplemental Data: | | | | | | | | | |
| Net investment income (loss) | 4.02% | | 0.55% | | 0.01% | | 0.27% | | 1.59% |
| Net expenses | 0.80% | | 0.52% | | 0.12% | | 0.50% | | 0.80% |
| Expenses (before waiver/reimbursement) | 0.87% | | 0.84% | | 0.96% | | 0.90% | | 0.88% |
| Net assets at end of year (in 000’s) | $ 15,087 | | $ 18,464 | | $ 17,941 | | $ 28,171 | | $ 20,308 |
| ‡ | Less than one cent per share. |
| (a) | Per share data based on average shares outstanding during the year. |
| (b) | Total investment return is calculated exclusive of sales charges and assumes the reinvestment of distributions. For periods of less than one year, total return is not annualized. |
The notes to the financial statements are an integral part of, and should be read in conjunction with, the financial statements.
| 16 | MainStay Money Market Fund |
Financial Highlights selected per share data and ratios
| | Year Ended October 31, | | August 31, 2020^ through
October 31, |
| SIMPLE Class | 2023 | | 2022 | | 2021 | | 2020 |
| Net asset value at beginning of period | $ 1.00 | | $ 1.00 | | $ 1.00 | | $ 1.00 |
| Net investment income (loss) (a) | 0.04 | | 0.01 | | 0.00‡ | | (0.00)‡ |
| Net realized and unrealized gain (loss) | 0.00‡ | | 0.00‡ | | 0.00‡ | | 0.00‡ |
| Total from investment operations | 0.04 | | 0.01 | | 0.00‡ | | 0.00‡ |
| Less distributions: | | | | | | | |
| From net investment income | (0.04) | | (0.01) | | (0.00)‡ | | (0.00)‡ |
| Net asset value at end of period | $ 1.00 | | $ 1.00 | | $ 1.00 | | $ 1.00 |
| Total investment return (b) | 4.33% | | 0.56% | | 0.01% | | 0.00%‡‡ |
| Ratios (to average net assets)/Supplemental Data: | | | | | | | |
| Net investment income (loss) | 4.32% | | 0.58% | | 0.01% | | (0.02)%†† |
| Net expenses | 0.59% | | 0.51% | | 0.12% | | 0.19%†† |
| Expenses (before waiver/reimbursement) | 0.59% | | 0.84% | | 0.97% | | 0.95%†† |
| Net assets at end of period (in 000’s) | $ 175 | | $ 74 | | $ 25 | | $ 25 |
| ^ | Inception date. |
| ‡ | Less than one cent per share. |
| ‡‡ | Less than one-tenth percent. |
| †† | Annualized. |
| (a) | Per share data based on average shares outstanding during the period. |
| (b) | Total investment return is calculated exclusive of sales charges and assumes the reinvestment of dividends and distributions. SIMPLE Class shares are not subject to sales charges. For periods of less than one year, total return is not annualized. |
The notes to the financial statements are an integral part of, and should be read in conjunction with, the financial statements.
17
Notes to Financial Statements
Note 1-Organization and Business
The MainStay Funds (the “Trust”) was organized on January 9, 1986, as a Massachusetts business trust. The Trust is registered under the Investment Company Act of 1940, as amended (the “1940 Act”), as an open-end management investment company, and is comprised of eleven funds (collectively referred to as the "Funds"). These financial statements and notes relate to the MainStay Money Market Fund (the "Fund"), a “diversified” fund, as that term is defined in the 1940 Act, as interpreted or modified by regulatory authorities having jurisdiction, from time to time.
The following table lists the Fund's share classes that have been registered and commenced operations:
| Class | Commenced Operations |
| Class A | January 3, 1995 |
| Investor Class | February 28, 2008 |
| Class B | May 1, 1986 |
| Class C | September 1, 1998 |
| SIMPLE Class | August 31, 2020 |
Class A, Class C, Investor Class and SIMPLE Class shares are offered at net asset value (“NAV”) without an initial sales charge. Class B shares of the MainStay Group of Funds are closed to all new purchases as well as additional investments by existing Class B shareholders. Existing Class B shareholders may continue to reinvest dividends and capital gains distributions, as well as exchange their Class B shares for Class B shares of other funds in the MainStay Group of Funds as permitted by the current exchange privileges. All other features of the Class B shares, including but not limited to the fees and expenses applicable to Class B shares, remain unchanged. Unless redeemed, Class B shareholders will remain in Class B shares of their respective fund until the Class B shares are converted to Class A or Investor Class shares pursuant to the applicable conversion schedule. Depending upon eligibility, Class B shares convert to either Class A or Investor Class shares at the end of the calendar quarter eight years after the date they were purchased. Additionally, Investor Class shares may convert automatically to Class A shares. SIMPLE Class shares convert to Class A shares, or Investor Class shares if you are not eligible to hold Class A shares, at the end of the calendar quarter, ten years after the date they were purchased. Share class conversions are based on the relevant NAVs of the two classes at the time of the conversion, and no sales load or other charge is imposed. Under certain circumstances and as may be permitted by the Trust’s multiple class plan pursuant to Rule 18f-3 under the 1940 Act, specified share classes of the Fund may be converted to one or more other share classes of the Fund as disclosed in the capital share transactions within these Notes. The classes of shares have the same voting (except for issues that relate solely to one class), dividend, liquidation and other rights, and the same terms and conditions.
The Fund's investment objective is to seek a high level of current income while preserving capital and maintaining liquidity.
Note 2–Significant Accounting Policies
The Fund is an investment company and accordingly follows the investment company accounting and reporting guidance of the Financial Accounting Standards Board (“FASB”) Accounting Standards Codification Topic 946 Financial Services—Investment Companies. The Fund prepares its financial statements in accordance with generally accepted accounting principles (“GAAP”) in the United States of America and follows the significant accounting policies described below.
(A) Valuation of Shares. You could lose money by investing in the Fund. Although the Fund seeks to preserve the value of your investment at $1.00 per share by using the amortized cost method of valuation, it cannot guarantee it will do so. The Fund may impose a fee upon the sale of your shares or may temporarily suspend your ability to sell shares if the Fund's liquidity falls below required minimums because of market conditions or other factors. An investment in the Fund is not insured or guaranteed by the Federal Deposit Insurance Corporation or any other government agency. The Fund's sponsor has no legal obligation to provide financial support to the Fund, and you should not expect that the sponsor will provide financial support to the Fund at any time.
(B) Securities Valuation. Securities are valued using the amortized cost method of valuation, unless the use of such method would be inappropriate per the requirements of Rule 2a-7 under the 1940 Act. The amortized cost method involves valuing a security at its cost on the date of purchase and thereafter assuming a constant amortization to maturity of the difference between such cost and the value on maturity date. Amortized cost approximates the current fair value of a security.
Pursuant to Rule 2a-5 under the 1940 Act, the Board of Trustees of the Trust (the "Board") has designated New York Life Investment Management LLC (“New York Life Investments” or the "Manager") as its Valuation Designee (the "Valuation Designee"). The Valuation Designee is responsible for performing fair valuations relating to all investments in the Fund’s portfolio for which market quotations are not readily available; periodically assessing and managing material valuation risks; establishing and applying fair value methodologies; testing fair valuation methodologies; evaluating and overseeing pricing services; ensuring appropriate segregation of valuation and portfolio management functions; providing quarterly, annual and prompt reporting to the Board, as appropriate; identifying potential conflicts of interest; and maintaining appropriate records. The Valuation Designee has established a valuation committee ("Valuation Committee") to assist in carrying out the Valuation Designee’s responsibilities and establish prices of securities for which market quotations are not readily available. The Fund's and the Valuation Designee's policies and procedures ("Valuation Procedures") govern the Valuation Designee’s selection and application of methodologies for determining and calculating the fair value of Fund investments. The Valuation Designee may value the Fund's portfolio securities for which market quotations are not readily available and other Fund assets utilizing inputs from pricing services and other third-party sources. The Valuation Committee meets (in person, via electronic mail or via teleconference) on an ad-hoc basis to determine fair valuations and on a quarterly basis to
| 18 | MainStay Money Market Fund |
review fair value events with respect to certain securities for which market quotations are not readily available, including valuation risks and back-testing results, and preview reports to the Board.
The Valuation Committee establishes prices of securities for which market quotations are not readily available based on such methodologies and measurements on a regular basis after considering information that is reasonably available and deemed relevant by the Valuation Committee. The Board shall oversee the Valuation Designee and review fair valuation materials on a prompt, quarterly and annual basis and approve proposed revisions to the Valuation Procedures.
Investments for which market quotations are not readily available are valued at fair value as determined in good faith pursuant to the Valuation Procedures. A market quotation is readily available only when that quotation is a quoted price (unadjusted) in active markets for identical investments that the Fund can access at the measurement date, provided that a quotation will not be readily available if it is not reliable. "Fair value" is defined as the price the Fund would reasonably expect to receive upon selling an asset or liability in an orderly transaction to an independent buyer in the principal or most advantageous market for the asset or liability. Fair value measurements are determined within a framework that establishes a three-tier hierarchy that maximizes the use of observable market data and minimizes the use of unobservable inputs to establish a classification of fair value measurements for disclosure purposes. "Inputs" refer broadly to the assumptions that market participants would use in pricing the asset or liability, including assumptions about risk, such as the risk inherent in a particular valuation technique used to measure fair value using a pricing model and/or the risk inherent in the inputs for the valuation technique. Inputs may be observable or unobservable. Observable inputs reflect the assumptions market participants would use in pricing the asset or liability based on market data obtained from sources independent of the Fund. Unobservable inputs reflect the Fund’s own assumptions about the assumptions market participants would use in pricing the asset or liability based on the information available. The inputs or methodology used for valuing assets or liabilities may not be an indication of the risks associated with investing in those assets or liabilities. The three-tier hierarchy of inputs is summarized below.
| • | Level 1—quoted prices (unadjusted) in active markets for an identical asset or liability |
| • | Level 2—other significant observable inputs (including quoted prices for a similar asset or liability in active markets, interest rates and yield curves, prepayment speeds, credit risk, etc.) |
| • | Level 3—significant unobservable inputs (including the Fund's own assumptions about the assumptions that market participants would use in measuring fair value of an asset or liability) |
Securities valued at amortized cost are not obtained from a quoted price in an active market and are generally categorized as Level 2 in the hierarchy. The level of an asset or liability within the fair value hierarchy is based on the lowest level of an input, both individually and in the aggregate, that is significant to the fair value measurement. As of October
31, 2023, the aggregate value by input level of the Fund’s assets and liabilities is included at the end of the Portfolio of Investments.
The Fund may use third-party vendor evaluations, whose prices may be derived from one or more of the following standard inputs, among others:
| • Benchmark yields | • Reported trades |
| • Broker/dealer quotes | • Issuer spreads |
| • Two-sided markets | • Benchmark securities |
| • Bids/offers | • Reference data (corporate actions or material event notices) |
| • Industry and economic events | • Comparable bonds |
| • Monthly payment information | |
An asset or liability for which a market quotation is not readily available is valued by methods deemed reasonable in good faith by the Valuation Committee, following the Valuation Procedures to represent fair value. Under these procedures, the Valuation Designee generally uses a market-based approach which may use related or comparable assets or liabilities, recent transactions, market multiples, book values and other relevant information. The Valuation Designee may also use an income-based valuation approach in which the anticipated future cash flows of the asset or liability are discounted to calculate fair value. Discounts may also be applied due to the nature and/or duration of any restrictions on the disposition of the asset or liability. Fair value represents a good faith approximation of the value of a security. Fair value determinations involve the consideration of a number of subjective factors, an analysis of applicable facts and circumstances and the exercise of judgment. As a result, it is possible that the fair value for a security determined in good faith in accordance with the Valuation Procedures may differ from valuations for the same security determined for other funds using their own valuation procedures. Although the Valuation Procedures are designed to value a security at the price the Fund may reasonably expect to receive upon the security's sale in an orderly transaction, there can be no assurance that any fair value determination thereunder would, in fact, approximate the amount that the Fund would actually realize upon the sale of the security or the price at which the security would trade if a reliable market price were readily available. During the year ended October 31, 2023, there were no material changes to the fair value methodologies.
Securities which may be valued in this manner include, but are not limited to: (i) a security for which trading has been halted or suspended or otherwise does not have a readily available market quotation on a given day; (ii) a debt security that has recently gone into default and for which there is not a current market quotation; (iii) a security of an issuer that has entered into a restructuring; (iv) a security that has been delisted from a national exchange; (v) a security subject to trading collars for which no or limited trading takes place; and (vi) a security whose principal market has been temporarily closed at a time when, under normal conditions, it would be open. Securities valued in this manner are generally categorized as Level 2 or 3 in the hierarchy. No securities held by the Fund as of October 31, 2023, were fair valued in such a manner.
Notes to Financial Statements (continued)
The information above is not intended to reflect an exhaustive list of the methodologies that may be used to value portfolio investments. The Valuation Procedures permit the use of a variety of valuation methodologies in connection with valuing portfolio investments. The methodology used for a specific type of investment may vary based on the market data available or other considerations. The methodologies summarized above may not represent the specific means by which portfolio investments are valued on any particular business day.
(C) Income Taxes. The Fund's policy is to comply with the requirements of the Internal Revenue Code of 1986, as amended (the “Internal Revenue Code”), applicable to regulated investment companies and to distribute all of its taxable income to the shareholders of the Fund within the allowable time limits.
The Manager evaluates the Fund’s tax positions to determine if the tax positions taken meet the minimum recognition threshold in connection with accounting for uncertainties in income tax positions taken or expected to be taken for the purposes of measuring and recognizing tax liabilities in the financial statements. Recognition of tax benefits of an uncertain tax position is permitted only to the extent the position is “more likely than not” to be sustained assuming examination by taxing authorities. The Manager analyzed the Fund's tax positions taken on federal, state and local income tax returns for all open tax years (for up to three tax years) and has concluded that no provisions for federal, state and local income tax are required in the Fund's financial statements. The Fund's federal, state and local income tax and federal excise tax returns for tax years for which the applicable statutes of limitations have not expired are subject to examination by the Internal Revenue Service and state and local departments of revenue.
(D) Dividends and Distributions to Shareholders. Dividends and distributions are recorded on the ex-dividend date. The Fund intends to declare dividends from net investment income, if any, daily and intends to pay them at least monthly and declares and pays distributions from net realized capital and currency gains, if any, at least annually. Unless a shareholder elects otherwise, all dividends and distributions are reinvested at NAV in the same class of shares of the Fund. Dividends and distributions to shareholders are determined in accordance with federal income tax regulations and may differ from determinations using GAAP.
(E) Security Transactions and Investment Income. The Fund records security transactions on the trade date. Realized gains and losses on security transactions are determined using the identified cost method. Interest income is accrued daily and discounts and premiums on securities purchased for the Fund are accreted and amortized, respectively, on the straight-line method. The straight-line method approximates the effective interest rate for short-term investments.
Investment income and realized and unrealized gains and losses on investments of the Fund are allocated pro rata to the separate classes of shares based upon their relative net assets on the date the income is earned or realized and unrealized gains and losses are incurred.
The Fund may place a debt security on non-accrual status and reduce related interest income by ceasing current accruals and writing off all or a portion of any interest receivables when the collection of all or a portion of such interest has become doubtful. A debt security is removed from non-accrual status when the issuer resumes interest payments or when collectability of interest is reasonably assured.
(F) Expenses. Expenses of the Trust are allocated to the individual Funds in proportion to the net assets of the respective Funds when the expenses are incurred, except where direct allocations of expenses can be made. Expenses (other than transfer agent expenses and fees incurred under the shareholder services plans and/or the distribution plans further discussed in Note 3(B)) are allocated to separate classes of shares pro rata based upon their relative net assets on the date the expenses are incurred. The expenses borne by the Fund, including those of related parties to the Fund, are shown in the Statement of Operations.
(G) Use of Estimates. In preparing financial statements in conformity with GAAP, the Manager makes estimates and assumptions that affect the reported amounts and disclosures in the financial statements. Actual results could differ from those estimates and assumptions.
(H) Repurchase Agreements. The Fund may enter into repurchase agreements (i.e., buy a security from another party with the agreement that it will be sold back in the future) to earn income. The Fund may enter into repurchase agreements only with counterparties, usually financial institutions, that are deemed by the Manager or the Subadvisor to be creditworthy, pursuant to guidelines established by the Board. During the term of any repurchase agreement, the Manager or the Subadvisor will continue to monitor the creditworthiness of the counterparty. Under the 1940 Act, repurchase agreements are considered to be collateralized loans by the Fund to the counterparty secured by the securities transferred to the Fund.
Repurchase agreements are subject to counterparty risk, meaning the Fund could lose money by the counterparty’s failure to perform under the terms of the agreement. The Fund mitigates this risk by ensuring the repurchase agreement is collateralized by cash, U.S. government securities, fixed income securities and/or other securities. The collateral is held by the Fund's custodian and valued daily on a mark to market basis to determine if the value, including accrued interest, exceeds the repurchase price. In the event of the counterparty’s default on the obligation to repurchase, the Fund has the right to liquidate the collateral and apply the proceeds in satisfaction of the obligation. Under certain circumstances, such as in the event of default or bankruptcy by the counterparty, realization and/or retention of the collateral may be limited or subject to delay, to legal proceedings and possible realized loss to the Fund. Repurchase agreements as of October 31, 2023, are shown in the Portfolio of Investments.
(I) Debt Securities Risk. The Fund’s investments may include securities such as variable rate notes, floaters and mortgage-related and asset-backed securities. If expectations about changes in interest rates or
| 20 | MainStay Money Market Fund |
assessments of an issuer’s credit worthiness or market conditions are incorrect, investments in these types of securities could lose money for the Fund.
The Fund may also invest in U.S. dollar-denominated securities of foreign issuers, which carry certain risks in addition to the usual risks inherent in domestic instruments. Foreign regulatory regimes and securities markets can have less stringent investor protections and disclosure standards and less liquid trading markets than U.S. regulatory regimes and securities markets, and can experience political, social and economic developments that may affect the value of investments in foreign securities. These risks include those resulting from future adverse political or economic developments and possible imposition of foreign governmental laws or restrictions. Economic sanctions and other similar governmental actions or developments could, among other things, effectively restrict or eliminate the Fund’s ability to purchase or sell certain foreign securities or groups of foreign securities, and thus may make the Fund’s investments in such securities less liquid or more difficult to value. The ability of issuers of debt securities held by the Fund to meet their obligations may be affected by, among other things, economic or political developments in a specific country, industry or region.
(J) LIBOR Replacement Risk. The Fund may invest in certain debt securities, derivatives or other financial instruments that have relied or continue to rely on the London Interbank Offered Rate ("LIBOR"), as a “benchmark” or “reference rate” for various interest rate calculations. As of January 1, 2022, the United Kingdom Financial Conduct Authority ("FCA"), which regulates LIBOR, ceased its active encouragement of banks to provide the quotations needed to sustain most LIBOR rates due to the absence of an active market for interbank unsecured lending and other reasons. In connection with supervisory guidance from U.S. regulators, certain U.S. regulated entities have generally ceased to enter into certain new LIBOR contracts after January 1, 2022. On March 15, 2022, the Adjustable Interest Rate (LIBOR) Act was signed into law. This law provides a statutory fallback mechanism on a nationwide basis to replace LIBOR with a benchmark rate that is selected by the Board of Governors of the Federal Reserve System and based on Secured Overnight Financing Rate ("SOFR") (which measures the cost of overnight borrowings through repurchase agreement transactions collateralized with U.S. Treasury securities) for tough legacy contracts. On February 27, 2023, the Federal Reserve System’s final rule in connection with this law became effective, establishing benchmark replacements based on SOFR and Term SOFR (a forward-looking measurement of market expectations of SOFR implied from certain derivatives markets) for applicable tough legacy contracts governed by U.S. law. In addition, the FCA has announced that it will require the publication of synthetic LIBOR for the one-month, three-month and six-month U.S. Dollar LIBOR settings after June 30, 2023 through at least September 30, 2024. Certain of the Fund's investments may involve individual tough legacy contracts which may be subject to the Adjustable Interest Rate (LIBOR) Act or synthetic LIBOR and no assurances can be given that these measures will have had the intended effects. Although the transition process away from LIBOR for many instruments has been completed, some LIBOR use is
continuing and there are potential effects related to the transition away from LIBOR or continued use of LIBOR on the Fund.
The elimination of LIBOR or changes to other reference rates or any other changes or reforms to the determination or supervision of reference rates could have an adverse impact on the market for, or value of, any securities or payments linked to those reference rates, which may adversely affect the Fund's performance and/or net asset value. It could also lead to a reduction in the interest rates on, and the value of, some LIBOR-based investments and reduce the effectiveness of hedges mitigating risk in connection with LIBOR-based investments. Uncertainty and risk also remain regarding the willingness and ability of issuers and lenders to include enhanced provisions in new and existing contracts or instruments. Consequently, the transition away from LIBOR to other reference rates may lead to increased volatility and illiquidity in markets that are tied to LIBOR, fluctuations in values of LIBOR-related investments or investments in issuers that utilize LIBOR, increased difficulty in borrowing or refinancing and diminished effectiveness of hedging strategies, adversely affecting the Fund's performance. Furthermore, the risks associated with the expected discontinuation of LIBOR and transition may be exacerbated if the work necessary to effect an orderly transition to an alternative reference rate is not completed in a timely manner. The usefulness of LIBOR as a benchmark could deteriorate anytime during this transition period. Any such effects of the transition process, including unforeseen effects, could result in losses to the Fund.
(K) Indemnifications. Under the Trust’s organizational documents, its officers and trustees are indemnified against certain liabilities that may arise out of performance of their duties to the Trust. Additionally, in the normal course of business, the Fund enters into contracts with third-party service providers that contain a variety of representations and warranties and that may provide general indemnifications. The Fund's maximum exposure under these arrangements is unknown, as this would involve future claims that may be made against the Fund that have not yet occurred. The Manager believes that the risk of loss in connection with these potential indemnification obligations is remote. However, there can be no assurance that material liabilities related to such obligations will not arise in the future, which could adversely impact the Fund.
Note 3–Fees and Related Party Transactions
(A) Manager and Subadvisor. New York Life Investments, a registered investment adviser and an indirect, wholly-owned subsidiary of New York Life Insurance Company ("New York Life"), serves as the Fund's Manager pursuant to an Amended and Restated Management Agreement ("Management Agreement"). The Manager provides offices, conducts clerical, recordkeeping and bookkeeping services and keeps most of the financial and accounting records required to be maintained by the Fund. Except for the portion of salaries and expenses that are the responsibility of the Fund, the Manager pays the salaries and expenses of all personnel affiliated with the Fund and certain operational expenses of the Fund. The Fund reimburses New York Life Investments in an amount equal to the portion of the compensation of the Chief Compliance Officer attributable
Notes to Financial Statements (continued)
to the Fund. NYL Investors LLC ("NYL Investors" or ''Subadvisor''), a registered investment adviser and a direct, wholly-owned subsidiary of New York Life, serves as the Subadvisor to the Fund and is responsible for the day-to-day portfolio management of the Fund. Pursuant to the terms of a Subadvisory Agreement ("Subadvisory Agreement") between New York Life Investments and NYL Investors, New York Life Investments pays for the services of the Subadvisor.
Pursuant to the Management Agreement, the Fund pays the Manager a monthly fee for the services performed and the facilities furnished at an annual rate of the Fund’s average daily net assets as follows: 0.40% up to $500 million; 0.35% from $500 million to $1 billion; and 0.30% in excess of $1 billion. During the year ended October 31, 2023, the effective management fee rate was 0.40% of the Fund’s average daily net assets, exclusive of any applicable waivers/reimbursements.
New York Life Investments has contractually agreed to waive fees and/or reimburse expenses so that Total Annual Fund Operating Expenses (excluding taxes, interest, litigation, extraordinary expenses, brokerage and other transaction expenses relating to the purchase or sale of portfolio investments and acquired (underlying) fund fees and expenses) do not exceed the following percentages of average daily net assets: Class A, 0.70%; Investor Class, 0.80%; Class B, 0.80%; Class C, 0.80% and SIMPLE Class, 0.80%. This agreement will remain in effect until February 28, 2024, and shall renew automatically for one-year terms unless New York Life Investments provides written notice of termination prior to the start of the next term or upon approval of the Board.
New York Life Investments may voluntarily waive fees or reimburse expenses of the Fund to the extent it deems appropriate to enhance the yield of the Fund’s during periods when expenses have a significant impact on the yield of the Fund, as applicable, because of low interest rates. This expense limitation policy is voluntary and in addition to any contractual arrangements that may be in place with respect to the Fund and described in the Fund’s prospectus.
During the year ended October 31, 2023, New York Life Investments earned fees from the Fund in the amount of $2,001,310 and paid the Subadvisor in the amount of $975,846. Additionally, New York Life Investments reimbursed expenses in the amount of $41,368, without which the Fund's total returns would have been lower.
JPMorgan Chase Bank, N.A. ("JPMorgan") provides sub-administration and sub-accounting services to the Fund pursuant to an agreement with New York Life Investments. These services include calculating the daily NAVs of the Fund, maintaining the general ledger and sub-ledger accounts for the calculation of the Fund's NAVs, and assisting New York Life Investments in conducting various aspects of the Fund's administrative operations. For providing these services to the Fund, JPMorgan is compensated by New York Life Investments.
Pursuant to an agreement between the Trust and New York Life Investments, New York Life Investments is responsible for providing or procuring certain regulatory reporting services for the Fund. The Fund will
reimburse New York Life Investments for the actual costs incurred by New York Life Investments in connection with providing or procuring these services for the Fund.
(B) Sales Charges. Although the Fund does not assess a CDSC upon redemption of Class B or Class C shares of the Fund, the applicable CDSC will be assessed when shares are redeemed from the Fund if the shareholder previously exchanged his or her investment into the Fund from another fund within the MainStay Group of Funds. The Fund was advised that the Distributor received from shareholders the proceeds from CDSCs of Class A, Investor Class, Class B and Class C during the year ended October 31, 2023, of $114,852, $41, $14,201 and $12,113, respectively.
(C) Transfer, Dividend Disbursing and Shareholder Servicing Agent. NYLIM Service Company LLC, an affiliate of New York Life Investments, is the Fund's transfer, dividend disbursing and shareholder servicing agent pursuant to an agreement between NYLIM Service Company LLC and the Trust. NYLIM Service Company LLC has entered into an agreement with SS&C Global Investor & Distribution Solutions, Inc. ("SS&C"), pursuant to which SS&C performs certain transfer agent services on behalf of NYLIM Service Company LLC. New York Life Investments has contractually agreed to limit the transfer agency expenses charged to the Fund’s share classes to a maximum of 0.35% of that share class’s average daily net assets on an annual basis after deducting any applicable Fund or class-level expense reimbursement or small account fees. This agreement will remain in effect until February 28, 2024, and shall renew automatically for one-year terms unless New York Life Investments provides written notice of termination prior to the start of the next term or upon approval of the Board. During the year ended October 31, 2023, transfer agent expenses incurred by the Fund and any reimbursements, pursuant to the aforementioned Transfer Agency expense limitation agreement, were as follows:
| Class | Expense | Waived |
| Class A | $311,578 | $— |
| Investor Class | 76,568 | — |
| Class B | 95,085 | — |
| Class C | 69,185 | — |
| SIMPLE Class | 261 | — |
(D) Small Account Fee. Shareholders with small accounts adversely impact the cost of providing transfer agency services. In an effort to reduce total transfer agency expenses, the Fund has implemented a small account fee on certain types of accounts. As described in the Fund's prospectus, certain shareholders with an account balance of less than $1,000 ($5,000 for Class A share accounts) are charged an annual per account fee of $20 (assessed semi-annually), the proceeds from which offset transfer agent fees as reflected in the Statement of Operations. This small account fee will not apply to certain types of accounts as described further in the Fund’s prospectus.
| 22 | MainStay Money Market Fund |
(E) Capital. As of October 31, 2023, New York Life and its affiliates beneficially held shares of the Fund with the values and percentages of net assets as follows:
Note 4-Federal Income Tax
The amortized cost also represents the aggregate cost for federal income tax purposes.
As of October 31, 2023, the components of accumulated gain (loss) on a tax basis were as follows:
Ordinary
Income | Accumulated
Capital
and Other
Gain (Loss) | Other
Temporary
Differences | Unrealized
Appreciation
(Depreciation) | Total
Accumulated
Gain (Loss) |
| $60,318 | $(5,448) | $(27,353) | $— | $27,517 |
As of October 31, 2023, for federal income tax purposes, capital loss carryforwards of $5,448, as shown in the table below, were available to the extent provided by the regulations to offset future realized gains of the Fund. Accordingly, no capital gains distributions are expected to be paid to shareholders until net gains have been realized in excess of such amounts.
Capital Loss
Available Through | Short-Term
Capital Loss
Amounts (000’s) | Long-Term
Capital Loss
Amounts (000’s) |
| Unlimited | $5 | $— |
The Fund utilized $3,598 of capital loss carryforwards during the year ended October 31, 2023.
During the years ended October 31, 2023 and October 31, 2022, the tax character of distributions paid as reflected in the Statements of Changes in Net Assets was as follows:
| | 2023 | 2022 |
| Distributions paid from: | | |
| Ordinary Income | $21,627,508 | $3,266,264 |
Note 5–Custodian
JPMorgan is the custodian of cash and securities held by the Fund. Custodial fees are charged to the Fund based on the Fund's net assets and/or the market value of securities held by the Fund and the number of certain transactions incurred by the Fund.
Note 6–Interfund Lending Program
Pursuant to an exemptive order issued by the SEC, the Fund, along with certain other funds managed by New York Life Investments, may participate in an interfund lending program. The interfund lending program provides an alternative credit facility that permits the Fund and certain other funds managed by New York Life Investments to lend or borrow money for temporary purposes directly to or from one another,
subject to the conditions of the exemptive order. During the year ended October 31, 2023, there were no interfund loans made or outstanding with respect to the Fund.
Note 7–Capital Share Transactions
Transactions in capital shares for the years ended October 31, 2023 and October 31, 2022, were as follows:
| Class A (at $1 per share) | Shares |
| Year ended October 31, 2023: | |
| Shares sold | 448,938,701 |
| Shares issued to shareholders in reinvestment of distributions | 18,818,104 |
| Shares redeemed | (414,117,186) |
| Net increase (decrease) in shares outstanding before conversion | 53,639,619 |
| Shares converted into Class A (See Note 1) | 6,170,381 |
| Shares converted from Class A (See Note 1) | (77,698) |
| Net increase (decrease) | 59,732,302 |
| Year ended October 31, 2022: | |
| Shares sold | 501,242,230 |
| Shares issued to shareholders in reinvestment of distributions | 2,840,624 |
| Shares redeemed | (437,742,190) |
| Net increase (decrease) in shares outstanding before conversion | 66,340,664 |
| Shares converted into Class A (See Note 1) | 6,333,245 |
| Shares converted from Class A (See Note 1) | (31,127) |
| Net increase (decrease) | 72,642,782 |
| |
| Investor Class (at $1 per share) | Shares |
| Year ended October 31, 2023: | |
| Shares sold | 11,047,443 |
| Shares issued to shareholders in reinvestment of distributions | 717,723 |
| Shares redeemed | (8,087,178) |
| Net increase (decrease) in shares outstanding before conversion | 3,677,988 |
| Shares converted into Investor Class (See Note 1) | 82,400 |
| Shares converted from Investor Class (See Note 1) | (6,062,419) |
| Net increase (decrease) | (2,302,031) |
| Year ended October 31, 2022: | |
| Shares sold | 15,993,287 |
| Shares issued to shareholders in reinvestment of distributions | 106,552 |
| Shares redeemed | (12,623,425) |
| Net increase (decrease) in shares outstanding before conversion | 3,476,414 |
| Shares converted into Investor Class (See Note 1) | 54,453 |
| Shares converted from Investor Class (See Note 1) | (6,299,663) |
| Net increase (decrease) | (2,768,796) |
| |
Notes to Financial Statements (continued)
| Class B (at $1 per share) | Shares |
| Year ended October 31, 2023: | |
| Shares sold | 817,072 |
| Shares issued to shareholders in reinvestment of distributions | 909,328 |
| Shares redeemed | (3,183,969) |
| Net increase (decrease) in shares outstanding before conversion | (1,457,569) |
| Shares converted into Class B (See Note 1) | 20,761 |
| Shares converted from Class B (See Note 1) | (107,393) |
| Net increase (decrease) | (1,544,201) |
| Year ended October 31, 2022: | |
| Shares sold | 1,717,725 |
| Shares issued to shareholders in reinvestment of distributions | 130,661 |
| Shares redeemed | (3,810,689) |
| Net increase (decrease) in shares outstanding before conversion | (1,962,303) |
| Shares converted from Class B (See Note 1) | (50,239) |
| Net increase (decrease) | (2,012,542) |
| |
| Class C (at $1 per share) | Shares |
| Year ended October 31, 2023: | |
| Shares sold | 6,312,161 |
| Shares issued to shareholders in reinvestment of distributions | 655,669 |
| Shares redeemed | (10,319,185) |
| Net increase (decrease) in shares outstanding before conversion | (3,351,355) |
| Shares converted from Class C (See Note 1) | (26,031) |
| Net increase (decrease) | (3,377,386) |
| Year ended October 31, 2022: | |
| Shares sold | 14,098,553 |
| Shares issued to shareholders in reinvestment of distributions | 101,346 |
| Shares redeemed | (13,669,897) |
| Net increase (decrease) in shares outstanding before conversion | 530,002 |
| Shares converted from Class C (See Note 1) | (6,668) |
| Net increase (decrease) | 523,334 |
| |
| SIMPLE Class (at $1 per share) | Shares |
| Year ended October 31, 2023: | |
| Shares sold | 397,607 |
| Shares issued to shareholders in reinvestment of distributions | 7,704 |
| Shares redeemed | (304,265) |
| Net increase (decrease) | 101,046 |
| Year ended October 31, 2022: | |
| Shares sold | 134,386 |
| Shares issued to shareholders in reinvestment of distributions | 393 |
| Shares redeemed | (85,956) |
| Net increase (decrease) | 48,823 |
Note 8–Other Matters
As of the date of this report, the Fund faces a heightened level of risk associated with current uncertainty, volatility and state of economies, financial markets, rising interest rates, and labor and health conditions
around the world. Events such as war, acts of terrorism, recessions, rapid inflation, the imposition of international sanctions, earthquakes, hurricanes, epidemics and pandemics and other unforeseen natural or human disasters may have broad adverse social, political and economic effects on the global economy, which could negatively impact the value of the Fund's investments. Developments that disrupt global economies and financial markets may magnify factors that affect the Fund's performance.
On July 12, 2023, the SEC adopted certain amendments to the regulatory requirements for money market funds, including the Fund. In particular, the SEC, among other things, amended Rule 2a-7 under the 1940 Act to remove the ability of a money market fund to impose a redemption gate (except as part of a liquidation), while preserving the discretion to impose liquidity fees for non-government money market funds, such as the Fund (without regard to weekly liquid asset levels). Prior to these amendments, the Fund was permitted to impose a liquidity fee and/or redemption gate if the Fund invested less than 30% of its total assets in weekly liquid assets. The Fund is no longer permitted to temporarily impose a redemption gate, except as part of its liquidation, and the Fund may subject redemptions to a liquidity fee of up to 2% without regard to the Fund’s level of weekly liquid assets if the Fund’s Board of Trustees believes such fee to be in the best interest of the Fund.
Note 9–Subsequent Events
In connection with the preparation of the financial statements of the Fund as of and for the year ended October 31, 2023, events and transactions subsequent to October 31, 2023, through the date the financial statements were issued, have been evaluated by the Manager for possible adjustment and/or disclosure. No subsequent events requiring financial statement adjustment or disclosure have been identified.
| 24 | MainStay Money Market Fund |
Report of Independent Registered Public Accounting Firm
To the Shareholders of the Fund and Board of Trustees
The MainStay Funds:
Opinion on the Financial Statements
We have audited the accompanying statement of assets and liabilities of MainStay Money Market Fund (the Fund), one of the funds constituting The MainStay Funds, including the portfolio of investments, as of October 31, 2023, the related statement of operations for the year then ended, the statements of changes in net assets for each of the years in the two-year period then ended, and the related notes (collectively, the financial statements) and the financial highlights for each of the years or periods in the five-year period then ended. In our opinion, the financial statements and financial highlights present fairly, in all material respects, the financial position of the Fund as of October 31, 2023, the results of its operations for the year then ended, the changes in its net assets for each of the years in the two-year period then ended, and the financial highlights for each of the years or periods in the five-year period then ended, in conformity with U.S. generally accepted accounting principles.
Basis for Opinion
These financial statements and financial highlights are the responsibility of the Fund's management. Our responsibility is to express an opinion on these financial statements and financial highlights based on our audits. We are a public accounting firm registered with the Public Company Accounting Oversight Board (United States) (PCAOB) and are required to be independent with respect to the Fund in accordance with the U.S. federal securities laws and the applicable rules and regulations of the Securities and Exchange Commission and the PCAOB.
We conducted our audits in accordance with the standards of the PCAOB. Those standards require that we plan and perform the audit to obtain reasonable assurance about whether the financial statements and financial highlights are free of material misstatement, whether due to error or fraud. Our audits included performing procedures to assess the risks of material misstatement of the financial statements and financial highlights, whether due to error or fraud, and performing procedures that respond to those risks. Such procedures included examining, on a test basis, evidence regarding the amounts and disclosures in the financial statements and financial highlights. Such procedures also included confirmation of securities owned as of October 31, 2023, by correspondence with the custodian and brokers; when replies were not received from brokers, we performed other auditing procedures. Our audits also included evaluating the accounting principles used and significant estimates made by management, as well as evaluating the overall presentation of the financial statements and financial highlights. We believe that our audits provide a reasonable basis for our opinion.

We have served as the auditor of one or more New York Life Investment Management investment companies since 2003.
Philadelphia, Pennsylvania
December 22, 2023
Federal Income Tax Information
(Unaudited)
In February 2024, shareholders will receive an IRS Form 1099-DIV or substitute Form 1099, which will show the federal tax status of the distributions received by shareholders in calendar year 2023. The amounts that will be reported on such 1099-DIV or substitute Form 1099 will be the amounts you are to use on your federal income tax return and will differ from the amounts which we must report for the Fund's fiscal year ended October 31, 2023.
Proxy Voting Policies and Procedures and Proxy Voting Record
The Fund is required to file with the SEC its proxy voting record for the 12-month period ending June 30 on Form N-PX. A description of the policies and procedures that are used to vote proxies relating to portfolio securities of the Fund is available free of charge upon request by calling 800-624-6782 or visiting the SEC’s website at www.sec.gov. The most recent Form N-PX or proxy voting record is available free of charge upon request by calling 800-624-6782; visiting newyorklifeinvestments.com; or visiting the SEC’s website at www.sec.gov.
Shareholder Reports and Quarterly Portfolio Disclosure
The Fund is required to file a Form N-MFP every month disclosing its portfolio holdings. The Fund's Form N-MFP is available free of charge upon request by calling New York Life Investments at 800-624-6782.
Board of Trustees and Officers (Unaudited)
The Trustees and officers of the Fund are listed below. The Board oversees the MainStay Group of Funds (which consists of MainStay Funds and MainStay Funds Trust), MainStay VP Funds Trust, MainStay MacKay DefinedTerm Municipal Opportunities Fund, MainStay CBRE Global Infrastructure Megatrends Term Fund, the Manager and the Subadvisors, and elects the officers of the Funds who are responsible for the day-to-day operations of the Fund. Information pertaining to the Trustees and officers is set forth below. Each Trustee serves until his or her successor is elected and qualified or until his or her resignation, death or
removal. Under the Board’s retirement policy, unless an exception is made, a Trustee must tender his or her resignation by the end of the calendar year during which he or she reaches the age of 75. Officers are elected annually by the Board. The business address of each Trustee and officer listed below is 51 Madison Avenue, New York, New York 10010. A majority of the Trustees are not “interested persons” (as defined by the 1940 Act and rules adopted by the SEC thereunder) of the Fund (“Independent Trustees”).
| | Name and
Year of Birth | Term of Office,
Position(s) Held and
Length of Service | Principal Occupation(s)
During Past Five Years | Number of
Portfolios in
Fund Complex
Overseen by
Trustee | Other Directorships
Held by Trustee |
| | | | | | |
| | Naïm Abou-Jaoudé*
1966 | MainStay Funds: Trustee
since 2023
MainStay Funds Trust:
Trustee since 2023 | Chief Executive Officer of New York Life Investment Management LLC (since 2023). Chief Executive Officer of Candriam (an affiliate of New York Life Investment Management LLC) (2007 to 2023). | 81 | MainStay VP Funds Trust:
Trustee since 2023 (31 portfolios);
MainStay MacKay DefinedTerm Municipal Opportunities Fund: Trustee
since 2023;
MainStay CBRE Global Infrastructure Megatrends Term Fund: Trustee
since 2023; and
New York Life Investment Management International (Chair) since 2015 |
| * | This Trustee is considered to be an “interested person” of the MainStay Group of Funds, MainStay VP Funds Trust, MainStay CBRE Global Infrastructure Megatrends Term Fund and MainStay MacKay DefinedTerm Municipal Opportunities Fund, within the meaning of the 1940 Act because of his affiliation with New York Life Investment Management LLC and Candriam, as described in detail above in the column entitled “Principal Occupation(s) During Past Five Years.” |
| | |
Board of Trustees and Officers (Unaudited) (continued)
| | Name and
Year of Birth | Term of Office,
Position(s) Held and
Length of Service | Principal Occupation(s)
During Past Five Years | Number of
Portfolios in
Fund Complex
Overseen by
Trustee | Other Directorships
Held by Trustee |
| | | | | | |
| | David H. Chow
1957 | MainStay Funds: Trustee since January 2016, Advisory Board Member (June 2015 to December 2015);MainStay Funds Trust:
Trustee since January 2016, Advisory Board Member (June 2015 to December 2015) | Founder and CEO, DanCourt Management, LLC (since 1999) | 81 | MainStay VP Funds Trust: Trustee since January 2016, Advisory Board Member (June 2015 to December 2015) (31 portfolios);
MainStay MacKay DefinedTerm Municipal Opportunities Fund: Trustee since January 2016, Advisory Board Member (June 2015 to December 2015);
MainStay CBRE Global Infrastructure Megatrends Term Fund: Trustee since 2021;
VanEck Vectors Group of Exchange-Traded Funds: Trustee since 2006 and Independent Chairman of the Board of Trustees from 2008 to 2022 (57 portfolios); and
Berea College of Kentucky: Trustee since 2009, Chair of the Investment Committee since 2018 |
| | Karen Hammond
1956 | MainStay Funds: Trustee since December 2021, Advisory Board Member (June 2021 to December 2021);MainStay Funds Trust:
Trustee since December 2021, Advisory Board Member (June 2021 to December 2021)
| Retired, Managing Director, Devonshire Investors (2007 to 2013); Senior Vice President, Fidelity Management & Research Co. (2005 to 2007); Senior Vice President and Corporate Treasurer, FMR Corp. (2003 to 2005); Chief Operating Officer, Fidelity Investments Japan (2001 to 2003) | 81 | MainStay VP Funds Trust: Trustee since December 2021, Advisory Board Member (June 2021 to December 2021) (31 portfolios);
MainStay MacKay DefinedTerm Municipal Opportunities Fund: Trustee since December 2021, Advisory Board Member (June 2021 to December 2021);
MainStay CBRE Global Infrastructure Megatrends Term Fund: Trustee since December 2021, Advisory Board Member (June 2021 to December 2021);
Two Harbors Investment Corp.: Director since 2018;
Rhode Island State Investment Commission: Member since 2017; and
Blue Cross Blue Shield of Rhode Island: Director since 2019 |
| | Susan B. Kerley
1951 | MainStay Funds: Chair since January 2017 and Trustee since 2007;MainStay Funds Trust:
Chair since January 2017 and Trustee since 1990*** | President, Strategic Management Advisors LLC (since 1990) | 81 | MainStay VP Funds Trust: Chair since January 2017 and Trustee since 2007 (31 portfolios)**;
MainStay MacKay DefinedTerm Municipal Opportunities Fund: Chair since January 2017 and Trustee since 2011;
MainStay CBRE Global Infrastructure Megatrends Term Fund: Trustee since June 2021; and
Legg Mason Partners Funds: Trustee since 1991 (45 portfolios) |
| 28 | MainStay Money Market Fund |
| | Name and
Year of Birth | Term of Office,
Position(s) Held and
Length of Service | Principal Occupation(s)
During Past Five Years | Number of
Portfolios in
Fund Complex
Overseen by
Trustee | Other Directorships
Held by Trustee |
| | | | | | |
| | Alan R. Latshaw
1951 | MainStay Funds: Trusteesince 2006;MainStay Funds Trust:
Trustee since 2007*** | Retired; Partner, Ernst & Young LLP (2002 to 2003); Partner, Arthur Andersen LLP (1989 to 2002); Consultant to the MainStay Funds Audit and Compliance Committee (2004 to 2006) | 81 | MainStay VP Funds Trust: Trustee since 2007 (31 portfolios)**;
MainStay MacKay DefinedTerm Municipal Opportunities Fund: Trustee since 2011; and
MainStay CBRE Global Infrastructure Megatrends Term Fund: Trustee since June 2021 |
| | Jacques P. Perold
1958 | MainStay Funds: Trustee since January 2016, Advisory Board Member (June 2015to December 2015);MainStay Funds Trust:
Trustee since January 2016, Advisory Board Member (June 2015 to December 2015) | Founder and Chief Executive Officer, CapShift Advisors LLC (since 2018); President, Fidelity Management & Research Company (2009 to 2014); President and Chief Investment Officer, Geode Capital Management, LLC (2001 to 2009) | 81 | MainStay VP Funds Trust: Trustee since January 2016, Advisory Board Member (June 2015 to December 2015) (31 portfolios);
MainStay MacKay DefinedTerm Municipal Opportunities Fund: Trustee since January 2016, Advisory Board Member (June 2015 to December 2015);
MainStay CBRE Global Infrastructure Megatrends Term Fund: Trustee since June 2021;
Allstate Corporation: Director since 2015; and
MSCI Inc.: Director since 2017 |
| | Richard S. Trutanic
1952 | MainStay Funds: Trustee since 1994;MainStay Funds Trust:
Trustee since 2007*** | Chairman and Chief Executive Officer, Somerset & Company (financial advisory firm) (since 2004); Managing Director, The Carlyle Group (private investment firm) (2002 to 2004); Senior Managing Director, Partner and Board Member, Groupe Arnault S.A. (private investment firm) (1999 to 2002) | 81 | MainStay VP Funds Trust: Trustee since 2007 (31 portfolios)**;
MainStay MacKay DefinedTerm Municipal Opportunities Fund: Trustee since 2011; and
MainStay CBRE Global Infrastructure Megatrends Term Fund: Trustee since June 2021 |
| ** | Includes prior service as a Director of MainStay VP Series Fund, Inc., the predecessor to MainStay VP Funds Trust. |
| *** | Includes prior service as a Director/Trustee of certain predecessor entities to MainStay Funds Trust. |
Board of Trustees and Officers (Unaudited) (continued)
| | Name and
Year of Birth | Position(s) Held and
Length of Service | Principal Occupation(s)
During Past Five Years | |
| | | | | |
| | Kirk C. Lehneis
1974 | President, MainStay Funds, MainStay Funds Trust (since 2017) | Chief Operating Officer and Senior Managing Director (since 2016), New York Life Investment Management LLC and New York Life Investment Management Holdings LLC; Member of the Board of Managers (since 2017) and Senior Managing Director (since 2018), NYLIFE Distributors LLC; Chairman of the Board and Senior Managing Director, NYLIM Service Company LLC (since 2017); Trustee, President and Principal Executive Officer of IndexIQ Trust, IndexIQ ETF Trust and IndexIQ Active ETF Trust (since 2018); President, MainStay CBRE Global Infrastructure Megatrends Term Fund (since 2021), MainStay MacKay DefinedTerm Municipal Opportunities Fund and MainStay VP Funds Trust (since 2017)**; Senior Managing Director, Global Product Development (2015 to 2016); Managing Director, Product Development (2010 to 2015), New York Life Investment Management LLC | |
| | Jack R. Benintende
1964 | Treasurer and Principal Financial and Accounting Officer, MainStay Funds (since 2007), MainStay Funds Trust (since 2009) | Managing Director, New York Life Investment Management LLC (since 2007); Treasurer and Principal Financial and Accounting Officer, MainStay CBRE Global Infrastructure Megatrends Term Fund (since 2021), MainStay MacKay DefinedTerm Municipal Opportunities Fund (since 2011) and MainStay VP Funds Trust (since 2007)**; and Assistant Treasurer, New York Life Investment Management Holdings LLC (2008 to 2012) | |
| | J. Kevin Gao
1967 | Secretary and Chief Legal Officer, MainStay Funds and MainStay Funds Trust (since 2010) | Managing Director and Associate General Counsel, New York Life Investment Management LLC (since 2010); Secretary and Chief Legal Officer, MainStay CBRE Global Infrastructure Megatrends Term Fund (since 2021), MainStay MacKay DefinedTerm Municipal Opportunities Fund (since 2011) and MainStay VP Funds Trust (since 2010)** | |
| | Kevin M. Gleason
1967 | Vice President and Chief Compliance Officer, MainStay Funds and MainStay Funds Trust (since June 2022) | Vice President and Chief Compliance Officer, IndexIQ Trust, IndexIQ ETF Trust and Index IQ Active ETF Trust (since June 2022); Vice President and Chief Compliance Officer, MainStay CBRE Global Infrastructure Megatrends Term Fund, MainStay VP Funds Trust and MainStay MacKay DefinedTerm Municipal Opportunities Fund (since June 2022); Senior Vice President, Voya Investment Management and Chief Compliance Officer, Voya Family of Funds (2012 to 2022) | |
| | Scott T. Harrington
1959 | Vice President— Administration, MainStay Funds (since 2005), MainStay Funds Trust (since 2009) | Managing Director, New York Life Investment Management LLC (including predecessor advisory organizations) (since 2000); Member of the Board of Directors, New York Life Trust Company (since 2009); Vice President—Administration, MainStay CBRE Global Infrastructure Megatrends Term Fund (since 2021), MainStay MacKay DefinedTerm Municipal Opportunities Fund (since 2011) and MainStay VP Funds Trust (since 2005)** | |
| * | The officers listed above are considered to be “interested persons” of the MainStay Group of Funds, MainStay VP Funds Trust, MainStay CBRE Global Infrastructure Megatrends Term Fund and MainStay MacKay DefinedTerm Municipal Opportunities Fund within the meaning of the 1940 Act because of their affiliation with the MainStay Group of Funds, New York Life Insurance Company and/or its affiliates, including New York Life Investment Management LLC, New York Life Insurance Company, NYLIM Service Company LLC, NYLIFE Securities LLC and/or NYLIFE Distributors LLC, as described in detail in the column captioned “Principal Occupation(s) During Past Five Years.” Officers are elected annually by the Board. |
| ** | Includes prior service as an Officer of MainStay VP Series Fund, Inc., the predecessor to MainStay VP Funds Trust. |
Officers of the Trust (Who are not Trustees)*
| 30 | MainStay Money Market Fund |
Equity
U.S. Equity
MainStay Epoch U.S. Equity Yield Fund
MainStay Fiera SMID Growth Fund
MainStay PineStone U.S. Equity Fund
MainStay S&P 500 Index Fund
MainStay Winslow Large Cap Growth Fund
MainStay WMC Enduring Capital Fund
MainStay WMC Growth Fund
MainStay WMC Small Companies Fund
MainStay WMC Value Fund
International Equity
MainStay Epoch International Choice Fund
MainStay PineStone International Equity Fund
MainStay WMC International Research Equity Fund
Emerging Markets Equity
MainStay Candriam Emerging Markets Equity Fund
Global Equity
MainStay Epoch Capital Growth Fund
MainStay Epoch Global Equity Yield Fund
MainStay PineStone Global Equity Fund
Fixed Income
Taxable Income
MainStay Candriam Emerging Markets Debt Fund
MainStay Floating Rate Fund
MainStay MacKay High Yield Corporate Bond Fund
MainStay MacKay Short Duration High Yield Fund
MainStay MacKay Strategic Bond Fund
MainStay MacKay Total Return Bond Fund
MainStay MacKay U.S. Infrastructure Bond Fund
MainStay Short Term Bond Fund
Tax-Exempt Income
MainStay MacKay California Tax Free Opportunities Fund1
MainStay MacKay High Yield Municipal Bond Fund
MainStay MacKay New York Tax Free Opportunities Fund2
MainStay MacKay Short Term Municipal Fund
MainStay MacKay Strategic Municipal Allocation Fund
MainStay MacKay Tax Free Bond Fund
Money Market
MainStay Money Market Fund
Mixed Asset
MainStay Balanced Fund
MainStay Income Builder Fund
MainStay MacKay Convertible Fund
Speciality
MainStay CBRE Global Infrastructure Fund
MainStay CBRE Real Estate Fund
MainStay Cushing MLP Premier Fund
Asset Allocation
MainStay Conservative Allocation Fund
MainStay Conservative ETF Allocation Fund
MainStay Defensive ETF Allocation Fund
MainStay Equity Allocation Fund
MainStay Equity ETF Allocation Fund
MainStay ESG Multi-Asset Allocation Fund
MainStay Growth Allocation Fund
MainStay Growth ETF Allocation Fund
MainStay Moderate Allocation Fund
MainStay Moderate ETF Allocation Fund
Manager
New York Life Investment Management LLC
New York, New York
Subadvisors
Candriam3
Strassen, Luxembourg
CBRE Investment Management Listed Real Assets LLC
Radnor, Pennsylvania
Cushing Asset Management, LP
Dallas, Texas
Epoch Investment Partners, Inc.
New York, New York
Fiera Capital Inc.
New York, New York
IndexIQ Advisors LLC3
New York, New York
MacKay Shields LLC3
New York, New York
NYL Investors LLC3
New York, New York
PineStone Asset Management Inc.
Montreal, Québec
Wellington Management Company LLP
Boston, Massachusetts
Winslow Capital Management, LLC
Minneapolis, Minnesota
Legal Counsel
Dechert LLP
Washington, District of Columbia
Independent Registered Public Accounting Firm
KPMG LLP
Philadelphia, Pennsylvania
Distributor
NYLIFE Distributors LLC3
Jersey City, New Jersey
Custodian
JPMorgan Chase Bank, N.A.
New York, New York
1.
This Fund is registered for sale in AZ, CA, NV, OR, TX, UT, WA and MI (Class A and Class I shares only), and CO, FL, GA, HI, ID, MA, MD, NH, NJ and NY (Class I shares only).
| 2. | This Fund is registered for sale in CA, CT, DE, FL, MA, NJ, NY and VT. |
| 3. | An affiliate of New York Life Investment Management LLC. |
Not part of the Annual Report
For more information
800-624-6782
newyorklifeinvestments.com
“New York Life Investments” is both a service mark, and the common trade name, of certain investment advisors affiliated with New York Life Insurance Company. The MainStay Funds® are managed by New York Life Investment Management LLC and distributed by NYLIFE Distributors LLC, 30 Hudson Street, Jersey City, NJ 07302, a wholly owned subsidiary of New York Life Insurance Company. NYLIFE Distributors LLC is a Member FINRA/SIPC.
©2023 NYLIFE Distributors LLC. All rights reserved.
| 5013932MS139-23 | MSMM11-12/23 |
(NYLIM) NL214
MainStay Winslow Large Cap Growth Fund
Message from the President and Annual Report
October 31, 2023
Special Notice:
Beginning in July 2024, new regulations issued by the Securities and Exchange Commission (SEC) will take effect requiring open-end mutual fund companies and ETFs to (1) overhaul the content of their shareholder reports and (2) mail paper copies of the new tailored shareholder reports to shareholders who have not opted to receive these documents electronically.
If you have not yet elected to receive your shareholder reports electronically, please contact your financial intermediary or visit newyorklifeinvestments.com/accounts.
| Not FDIC/NCUA Insured | Not a Deposit | May Lose Value | No Bank Guarantee | Not Insured by Any Government Agency |
This page intentionally left blank
Message from the President
Volatile economic and geopolitical forces drove market behavior during the 12-month reporting period ended October 31, 2023. While equity markets generally gained ground, bond prices trended broadly lower.
Although the war in Ukraine, the outbreak of hostilities in the Middle East and several other notable events affected financial assets, inflation and interest rate trends stood at the forefront of market developments during most of the period. As the reporting period began, high levels of inflation already showed signs of easing in the face of aggressive rate hikes by the U.S. Federal Reserve (the “Fed”). From a peak of 9.1% in June 2022, the annualized U.S. inflation rate dropped to 7.1% in November 2022, and to 3.2% in October 2023. At the same time, the Fed increased the benchmark federal funds rate from 3.75%–4.00% at the beginning of the reporting period to 5.25%–5.50% as of October 31, 2023. As the pace of rate increases slowed during the period, investors hoped for an early shift to a looser monetary policy. However, comments from Fed members late in the period reinforced the central bank’s hawkish stance in response to surprisingly robust U.S. economic growth and rising wage pressures, thus increasing the likelihood that interest rates would stay higher for longer. International developed markets exhibited similar dynamics of elevated inflation and rising interest rates.
Despite the backdrop of high interest rates—along with political dysfunction in Washington D.C. and intensifying global geopolitical instability—equity markets managed to advance, supported by healthy consumer spending trends and persistent domestic economic growth. The S&P 500® Index, a widely regarded benchmark of large-cap U.S. market performance, gained ground, bolstered by the strong performance of energy stocks amid surging petroleum prices and mega-cap, growth-oriented, technology-related shares, which rose as investors flocked to companies creating the infrastructure for developments in artificial intelligence. Smaller-cap stocks and value-oriented shares produced milder returns. Among industry sectors, energy and
information technology posted the strongest gains. Real estate declined most sharply under pressure from rising mortgage rates and weak levels of office occupancy. Developed international markets outperformed U.S. markets, with Europe benefiting during the first half of the period from unexpected economic resilience in the face of rising energy prices and the ongoing war in Ukraine. Emerging markets posted positive results but lagged developed markets, largely due to slow economic growth in China despite the relaxation of pandemic-era lockdowns.
Bond prices were driven lower by rising yields and increasing expectations of high interest rates for an extended period of time. The U.S. yield curve steepened, with the 30-year Treasury yield exceeding 5% for the first time in more than a decade. The yield curve remained inverted, with the 10-year Treasury yield ending the period at 4.88%, compared with 5.07% for the 2-year Treasury yield. Corporate bonds outperformed long-term Treasury bonds, but still trended lower under pressure from rising yields and an uptick in default rates. Among corporates, lower-credit-quality instruments performed slightly better than their higher-credit-quality counterparts, while floating rate securities performed better still.
In the face of today’s uncertain market environment, New York Life Investments remains dedicated to providing the guidance, resources and investment solutions you need to pursue your financial goals.
Thank you for trusting us to help meet your investment needs.
Sincerely,
Kirk C. Lehneis
President
The opinions expressed are as of the date of this report and are subject to change. There is no guarantee that any forecast made will come to pass. This material does not constitute investment advice and is not intended as an endorsement of any specific investment. Past performance is no guarantee of future results.
Not part of the Annual Report
Investors should refer to the Fund’s Summary Prospectus and/or Prospectus and consider the Fund’s investment objectives, strategies, risks, charges and expenses carefully before investing. The Summary Prospectus and/or Prospectus contain this and other information about the Fund. You may obtain copies of the Fund’s Summary Prospectus, Prospectus and Statement of Additional Information, which includes information about The MainStay Funds' Trustees, free of charge, upon request, by calling toll-free 800-624-6782, by writing to NYLIFE Distributors LLC, Attn: MainStay Marketing Department, 30 Hudson Street, Jersey City, NJ 07302 or by sending an e-mail to MainStayShareholderServices@nylim.com. These documents are also available via the MainStay Funds’ website at newyorklifeinvestments.com. Please read the Fund’s Summary Prospectus and/or Prospectus carefully before investing.
Investment and Performance Comparison (Unaudited)
Performance data quoted represents past performance. Past performance is no guarantee of future results. Because of market volatility and other factors, current performance may be lower or higher than the figures shown. Investment return and principal value will fluctuate, and as a result, when shares are redeemed, they may be worth more or less than their original cost. The graph below depicts the historical performance of Class I shares of the Fund. Performance will vary from class to class based on differences in class-specific expenses and sales charges. For performance information current to the most recent month-end, please call 800-624-6782 or visit newyorklifeinvestments.com.
The performance table and graph do not reflect the deduction of taxes that a shareholder would pay on distributions or Fund share redemptions. Total returns reflect maximum applicable sales charges as indicated in the table below, if any, changes in share price, and reinvestment of dividend and capital gain distributions. The graph assumes the initial investment amount shown below and reflects the deduction of all sales charges that would have applied for the period of investment. Performance figures may reflect certain fee waivers and/or expense limitations, without which total returns may have been lower. For more information on share classes and current fee waivers and/or expense limitations (if any), please refer to the Notes to Financial Statements.

| Average Annual Total Returns for the Year-Ended October 31, 2023 |
| Class | Sales Charge | | Inception
Date | One
Year | Five
Years | Ten Years
or Since
Inception | Gross
Expense
Ratio1 |
| Class A Shares | Maximum 5.50% Initial Sales Charge | With sales charges | 7/1/1995 | 12.99% | 10.69% | 11.27% | 0.96% |
| | | Excluding sales charges | | 19.57 | 11.95 | 11.90 | 0.96 |
| Investor Class Shares2 | Maximum 5.00% Initial Sales Charge | With sales charges | 2/28/2008 | 13.30 | 10.54 | 11.15 | 1.11 |
| | | Excluding sales charges | | 19.26 | 11.80 | 11.78 | 1.11 |
| Class B Shares3 | Maximum 5.00% CDSC | With sales charges | 4/1/2005 | 13.61 | 10.78 | 10.96 | 1.86 |
| | if Redeemed Within the First Six Years of Purchase | Excluding sales charges | | 18.40 | 10.94 | 10.96 | 1.86 |
| Class C Shares | Maximum 1.00% CDSC | With sales charges | 4/1/2005 | 17.29 | 10.92 | 10.93 | 1.86 |
| | if Redeemed Within One Year of Purchase | Excluding sales charges | | 18.24 | 10.92 | 10.93 | 1.86 |
| Class I Shares | No Sales Charge | | 4/1/2005 | 19.89 | 12.22 | 12.18 | 0.71 |
| Class R1 Shares | No Sales Charge | | 4/1/2005 | 19.73 | 12.11 | 12.07 | 0.81 |
| Class R2 Shares | No Sales Charge | | 4/1/2005 | 19.29 | 11.81 | 11.79 | 1.06 |
| Class R3 Shares | No Sales Charge | | 4/28/2006 | 19.11 | 11.54 | 11.50 | 1.31 |
| Class R6 Shares | No Sales Charge | | 6/17/2013 | 19.95 | 12.32 | 12.29 | 0.64 |
| SIMPLE Class Shares | No Sales Charge | | 8/31/2020 | 19.28 | N/A | 1.59 | 1.33 |
| 1. | The gross expense ratios presented reflect the Fund’s “Total Annual Fund Operating Expenses” from the most recent Prospectus, as supplemented, and may differ from other expense ratios disclosed in this report. |
| 2. | Prior to June 30, 2020, the maximum initial sales charge was 5.50%, which is reflected in the applicable average annual total return figures shown. |
| 3. | Class B shares are closed to all new purchases as well as additional investments by existing Class B shareholders. |
The footnotes on the next page are an integral part of the table and graph and should be carefully read in conjunction with them.
| Benchmark Performance* | One
Year | Five
Years | Ten
Years |
| Russell 1000® Growth Index1 | 18.95% | 14.22% | 13.82% |
| S&P 500® Index2 | 10.14 | 11.01 | 11.18 |
| Morningstar Large Growth Category Average3 | 14.19 | 10.68 | 10.98 |
| * | Returns for indices reflect no deductions for fees, expenses or taxes, except for foreign withholding taxes where applicable. Results assume reinvestment of all dividends and capital gains. An investment cannot be made directly in an index. |
| 1. | The Russell 1000® Growth Index is the Fund's primary benchmark. The Russell 1000® Growth Index is a broad-based benchmark that measures the performance of the large-cap growth segment of the U.S. equity universe. It includes those Russell 1000® Index companies with higher price-to-book ratios and higher forecasted growth values. |
| 2. | The S&P 500® Index is the Fund's secondary benchmark. “S&P 500® " is a trademark of The McGraw-Hill Companies, Inc. The S&P 500® Index is widely regarded as the standard index for measuring large-cap U.S. stock market performance. |
| 3. | The Morningstar Large Growth Category Average is representative of funds that invest primarily in big U.S. companies that are projected to grow faster than other large-cap stocks. Stocks in the top 70% of the capitalization of the U.S. equity market are defined as large cap. Growth is defined based on fast growth and high valuations. Most of these funds focus on companies in rapidly expanding industries. Results are based on average total returns of similar funds with all dividends and capital gain distributions reinvested. |
The footnotes on the preceding page are an integral part of the table and graph and should be carefully read in conjunction with them.
| 6 | MainStay Winslow Large Cap Growth Fund |
Cost in Dollars of a $1,000 Investment in MainStay Winslow Large Cap Growth Fund (Unaudited)
The example below is intended to describe the fees and expenses borne by shareholders during the six-month period from May 1, 2023 to October 31, 2023, and the impact of those costs on your investment.
Example
As a shareholder of the Fund you incur two types of costs: (1) transaction costs, including exchange fees and sales charges (loads) on purchases (as applicable), and (2) ongoing costs, including management fees, distribution and/or service (12b-1) fees and other Fund expenses (as applicable). This example is intended to help you understand your ongoing costs (in dollars) of investing in the Fund and to compare these costs with the ongoing costs of investing in other mutual funds. The example is based on an investment of $1,000 made at the beginning of the six-month period and held for the entire period from May 1, 2023 to October 31, 2023.
This example illustrates your Fund’s ongoing costs in two ways:
Actual Expenses
The second and third data columns in the table below provide information about actual account values and actual expenses. You may use the information in these columns, together with the amount you invested, to estimate the expenses that you paid during the six months ended October 31, 2023. Simply divide your account value by $1,000 (for example, an
$8,600 account value divided by $1,000 = 8.6), then multiply the result by the number under the heading entitled “Expenses Paid During Period” to estimate the expenses you paid on your account during this period.
Hypothetical Example for Comparison Purposes
The fourth and fifth data columns in the table below provide information about hypothetical account values and hypothetical expenses based on the Fund’s actual expense ratio and an assumed rate of return of 5% per year before expenses, which is not the Fund’s actual return. The hypothetical account values and expenses may not be used to estimate the actual ending account balances or expenses you paid for the six-month period shown. You may use this information to compare the ongoing costs of investing in the Fund with the ongoing costs of investing in other mutual funds. To do so, compare this 5% hypothetical example with the 5% hypothetical examples that appear in the shareholder reports of the other mutual funds.
Please note that the expenses shown in the table are meant to highlight your ongoing costs only and do not reflect any transactional costs, such as exchange fees or sales charges (loads). Therefore, the fourth and fifth data columns of the table are useful in comparing ongoing costs only and will not help you determine the relative total costs of owning different funds. In addition, if these transactional costs were included, your costs would have been higher.
| Share Class | Beginning
Account
Value
5/1/23 | Ending Account
Value (Based
on Actual
Returns and
Expenses)
10/31/23 | Expenses
Paid
During
Period1 | Ending Account
Value (Based
on Hypothetical
5% Annualized
Return and
Actual Expenses)
10/31/23 | Expenses
Paid
During
Period1 | Net Expense
Ratio
During
Period2 |
| Class A Shares | $1,000.00 | $1,063.40 | $5.04 | $1,020.32 | $4.94 | 0.97% |
| Investor Class Shares | $1,000.00 | $1,063.20 | $6.03 | $1,019.36 | $5.90 | 1.16% |
| Class B Shares | $1,000.00 | $1,058.70 | $9.96 | $1,015.53 | $9.75 | 1.92% |
| Class C Shares | $1,000.00 | $1,056.80 | $9.90 | $1,015.58 | $9.70 | 1.91% |
| Class I Shares | $1,000.00 | $1,064.90 | $3.75 | $1,021.58 | $3.67 | 0.72% |
| Class R1 Shares | $1,000.00 | $1,063.90 | $4.27 | $1,021.07 | $4.18 | 0.82% |
| Class R2 Shares | $1,000.00 | $1,063.10 | $5.56 | $1,019.81 | $5.45 | 1.07% |
| Class R3 Shares | $1,000.00 | $1,061.50 | $6.86 | $1,018.55 | $6.72 | 1.32% |
| Class R6 Shares | $1,000.00 | $1,065.00 | $3.28 | $1,022.03 | $3.21 | 0.63% |
| SIMPLE Class Shares | $1,000.00 | $1,062.40 | $6.13 | $1,019.26 | $6.01 | 1.18% |
| 1. | Expenses are equal to the Fund’s annualized expense ratio of each class multiplied by the average account value over the period, divided by 365 and multiplied by 184 (to reflect the six-month period). The table above represents the actual expenses incurred during the six-month period. In addition to the fees and expenses which the Fund bears directly, it also indirectly bears a pro rata share of the fees and expenses of the underlying funds in which it invests. Such indirect expenses are not included in the above-reported expense figures. |
| 2. | Expenses are equal to the Fund's annualized expense ratio to reflect the six-month period. |
Industry Composition as of October 31, 2023 (Unaudited)
| Software | 23.9% |
| Semiconductors & Semiconductor Equipment | 13.6 |
| Interactive Media & Services | 10.5 |
| Technology Hardware, Storage & Peripherals | 6.3 |
| Health Care Equipment & Supplies | 5.9 |
| Broadline Retail | 5.6 |
| Hotels, Restaurants & Leisure | 5.4 |
| Financial Services | 4.3 |
| Ground Transportation | 2.7 |
| IT Services | 2.3 |
| Capital Markets | 2.1 |
| Pharmaceuticals | 2.0 |
| Biotechnology | 2.0 |
| Entertainment | 1.9% |
| Chemicals | 1.8 |
| Textiles, Apparel & Luxury Goods | 1.7 |
| Specialty Retail | 1.7 |
| Health Care Providers & Services | 1.4 |
| Machinery | 1.4 |
| Automobiles | 1.4 |
| Consumer Staples Distribution & Retail | 1.2 |
| Short–Term Investments | 0.4 |
| Other Assets, Less Liabilities | 0.5 |
| | 100.0% |
See Portfolio of Investments beginning on page 11 for specific holdings within these categories. The Fund's holdings are subject to change.
Top Ten Holdings and/or Issuers Held as of October 31, 2023 (excluding short-term investments) (Unaudited)
| 1. | Microsoft Corp. |
| 2. | Apple, Inc. |
| 3. | Amazon.com, Inc. |
| 4. | Alphabet, Inc. |
| 5. | Meta Platforms, Inc., Class A |
| 6. | NVIDIA Corp. |
| 7. | ServiceNow, Inc. |
| 8. | Uber Technologies, Inc. |
| 9. | Workday, Inc., Class A |
| 10. | Chipotle Mexican Grill, Inc. |
| 8 | MainStay Winslow Large Cap Growth Fund |
Portfolio Management Discussion and Analysis (Unaudited)
Questions answered by portfolio managers Justin H. Kelly, CFA, Patrick M. Burton, CFA, Peter A. Dlugosch and Steve M. Hamill, CFA, of Winslow Capital Management, LLC, the Fund’s Subadvisor.
How did MainStay Winslow Large Cap Growth Fund perform relative to its benchmarks and peer group during the 12 months ended October 31, 2023?
For the 12 months ended October 31, 2023, Class I shares of MainStay Winslow Large Cap Growth Fund returned 19.89%, outperforming the 18.95% return of the Fund’s primary benchmark, the Russell 1000® Growth Index. Over the same period, Class I shares also outperformed the 10.14% return of the S&P 500® Index, which is the Fund��s secondary benchmark, and the 14.19% return of the Morningstar Large Growth Category Average.1
Were there any changes to the Fund during the reporting period?
Effective February 2023, Steve M. Hamill, CFA, was added as a portfolio manager of the Fund.
What factors affected the Fund’s relative performance during the reporting period?
The Fund outperformed the Russell 1000® Growth Index, largely due to favorable stock selection in the health care, consumer discretionary and financials sectors, partly offset by relatively weak stock selection in the information technology and real estate sectors. From an allocation perspective, relative returns were negatively affected by the Fund’s overweight exposure to the lagging health care sector, and underweight exposure to the strong performing communication services sector.
During the reporting period, were there any market events that materially impacted the Fund’s performance or liquidity?
Throughout the reporting period, equity and bond markets vacillated on expectations of the magnitude of the economic slowdown required to lower inflation. Marginally better inflation data, weakening coincident U.S. economic indicators, and recent signals that the U.S. Federal Reserve is nearing the end of its tightening cycle all combined to drive equity markets higher.
Large cap growth equities, which were one of the worst performers during the previous reporting period, regained their leadership during the current reporting period, materially outperforming other asset classes.
During the reporting period, which sectors were the strongest positive contributors to the Fund’s relative performance and which sectors made the weakest contributions?
Relative to the Russell 1000® Growth Index, the consumer discretionary and health care sectors made the strongest positive contributions to the Fund’s performance. (Contributions take
weightings and total returns into account.) Outperformance in both sectors was driven by strong stock selection. The information technology and communication services sectors detracted most. Relative weakness in information technology resulted from stock selection, while relative weakness in communication services resulted from underweight allocation to this strong-performing sector.
During the reporting period, which individual stocks made the strongest positive contributions to the Fund’s absolute performance and which stocks detracted the most?
The stocks that made the strongest positive contributions to the Fund’s absolute performance during the reporting period included semiconductor company NVIDIA and multinational software, services and solutions provider Microsoft. NVIDIA benefited from rising demand for graphic processing units (GPUs) needed for both datacenter and AI acceleration, as well as for gaming applications. GPUs are used for compute intensive workloads involved in machine learning and artificial intelligence applications. Advanced GPUs lower computational latency, thereby delivering faster processing of large language models. We believe NVIDIA has a sustainable competitive advantage in the design and production of such GPUs due to the company’s proprietary software, customer ecosystem and strong manufacturing relationship with major chip foundries. Microsoft, a core Fund holding in software, continued to deliver double-digit growth, driven by ongoing migration to the company’s Office 365 software subscription service and adoption of the Microsoft’s cloud computing platform, Azure.
The most significant detractors from the Fund’s absolute performance during the reporting period were electric vehicle, and energy generation and storage company Tesla, and health care and data services company UnitedHealth Group. Tesla detracted from performance amid concerns regarding demand, and the price cuts that the company would likely need to make to stimulate demand as production increases. We believe that, as the leading global manufacturer of electric vehicles, Tesla is best positioned to benefit from the acceleration in electric vehicle adoption over the coming years. We also see the company as well positioned to benefit from provisions in the Inflation Reduction Act relating to domestic battery pack and cell production, as well as tax credits for U.S. consumers who purchase electric vehicles. Fundamentals remained strong at UnitedHealth Group; however, the managed care subsector was negatively impacted by a shift in investor sentiment away from health care in favor of AI-centric information technology and communication services shares. We continue to appreciate UnitedHealth’s position as both the largest health insurer and the largest provider of healthcare services in the United States, with a business model that yields high
| 1. | See "Investment and Performance Comparison" for other share class returns, which may be higher or lower than Class I share returns, and for more information on benchmark and peer group returns. |
single-digit revenue growth and double-digit earnings-per-share growth–with little macroeconomic sensitivity. Both holdings remained in the fund as of the end of the reporting period.
What were some of the Fund’s largest purchases and sales during the reporting period?
During the reporting period, the Fund’s largest purchases included software company Microsoft and e-commerce leader Amazon.com. As mentioned above, Microsoft is a core holding in software, with sustainable, double-digit growth driven by continued Azure adoption and Office 365 migration. We also believe that generative AI will be a major driver for future growth, as the company is able to offer full-stack solutions to its enterprise customers. Microsoft’s Azure cloud business has stabilized at 25–27% growth, well above previous expectations, with growth appearing poised to reaccelerate sometime in the first half of 2024. In the long-run, we expect the company to continue benefiting from vendor consolidation with its best-in-class product portfolio. Amazon doubled the size of its fulfillment network during the pandemic, which reduced profitability in the company’s North American retail operations to approximately breakeven in 2022. As Amazon grows into the new capacity and implements cost saving initiatives, we believe North American retail profitability can revert to earlier levels.
The Fund’s largest sales during the reporting period included business and financial management solutions provider Intuit, and energy services and technology company Schlumberger. A market leader in tax preparation and small business accounting software, Intuit offers mission-critical solutions. Moreover, we believe the consumer tax business is recession resilient, given that consumers need to file taxes in the majority of cases. However, the company lost share in its tax business to H&R Block, and Intuit’s higher-priced Turbo Tax Live product fell short of expectations. We exited the Fund’s position after lowering our estimates. Schlumberger shares declined as the price of crude oil retreated, mainly due to concerns that a recession could curtail demand despite long-term supply constraints.
How did the Fund’s sector weightings change during the reporting period?
During the reporting period, several material changes occurred to the Fund’s positioning at the sector level. The largest decrease in exposure was in the health care sector, followed by consumer staples and financials. Conversely, the largest sector increases were in information technology, followed by communication services.
How was the Fund positioned at the end of the reporting period?
The portfolio structure changed materially during the reporting period, reflecting shifting absolute and relative growth, and valuation rates. Our flexible "No Preferred Habitat" investment style allows our team to diversify the Fund’s assets across three different, yet complementary, types of growth companies: dynamic growth, consistent growth and cyclical growth. During the reporting period, as dynamic growth valuations looked increasingly attractive, we increased the Fund’s allocation. As of October 31, 2023, dynamic growth represented the Fund’s largest area of investment. At the same time, we decreased the Fund’s consistent growth allocation due to slowing growth and high relative valuations. As of the end of the reporting period, consistent growth represented the second-largest area of allocation. The Fund’s cyclical growth allocation increased modestly during the reporting period, but remained an underweight position relative to the Russell 1000® Growth Index, reflecting our preference for secular growth stocks in a slowing growth environment.
At the sector level, information technology represented the Fund’s largest allocation on both an absolute and relative basis. We believe that generative AI is likely to expand the scope of business processes that can be automated, and the Fund holds overweight exposure to software and semiconductor companies in line to profit from these trends. The Fund also holds overweight exposure to other information technology stocks, as well as stocks in the communication services sector, that we believe are positioned to benefit from a recovering advertising cycle environment and renewed focus on cost efficiency. Conversely, the consumer staples sector represents the Fund’s most significantly underweight position relative to the Russell 1000® Growth Index. We have long viewed the sector as unattractively valued, and it now faces tough post-pandemic earnings comparisons and weak sentiment as the market processes the impact of new, more effective diabetes and weight-loss drugs.
The opinions expressed are those of the portfolio managers as of the date of this report and are subject to change. There is no guarantee that any forecasts will come to pass. This material does not constitute investment advice and is not intended as an endorsement of any specific investment.
| 10 | MainStay Winslow Large Cap Growth Fund |
Portfolio of Investments October 31, 2023†^
| | Shares | Value |
| Common Stocks 99.1% |
| Automobiles 1.4% |
| Tesla, Inc. (a) | 806,200 | $ 161,917,208 |
| Biotechnology 2.0% |
| Vertex Pharmaceuticals, Inc. (a) | 644,200 | 233,271,262 |
| Broadline Retail 5.6% |
| Amazon.com, Inc. (a) | 5,014,500 | 667,379,805 |
| Capital Markets 2.1% |
| Moody's Corp. | 413,150 | 127,250,200 |
| MSCI, Inc. | 266,300 | 125,573,765 |
| | | 252,823,965 |
| Chemicals 1.8% |
| Linde plc | 569,030 | 217,460,505 |
| Consumer Staples Distribution & Retail 1.2% |
| Costco Wholesale Corp. | 253,200 | 139,877,808 |
| Entertainment 1.9% |
| Netflix, Inc. (a) | 547,500 | 225,400,275 |
| Financial Services 4.3% |
| Mastercard, Inc., Class A | 797,500 | 300,139,125 |
| Visa, Inc., Class A (b) | 910,600 | 214,082,060 |
| | | 514,221,185 |
| Ground Transportation 2.7% |
| Uber Technologies, Inc. (a) | 7,543,600 | 326,487,008 |
| Health Care Equipment & Supplies 5.9% |
| Boston Scientific Corp. (a) | 3,056,700 | 156,472,473 |
| DexCom, Inc. (a) | 1,377,800 | 122,389,974 |
| IDEXX Laboratories, Inc. (a) | 467,200 | 186,632,384 |
| Intuitive Surgical, Inc. (a) | 933,390 | 244,753,526 |
| | | 710,248,357 |
| Health Care Providers & Services 1.4% |
| UnitedHealth Group, Inc. | 322,800 | 172,878,768 |
| Hotels, Restaurants & Leisure 5.4% |
| Chipotle Mexican Grill, Inc. (a) | 155,870 | 302,730,714 |
| Hilton Worldwide Holdings, Inc. | 867,700 | 131,482,581 |
| | Shares | Value |
| |
| Hotels, Restaurants & Leisure (continued) |
| McDonald's Corp. | 790,160 | $ 207,156,247 |
| | | 641,369,542 |
| Interactive Media & Services 10.5% |
| Alphabet, Inc. (a) | | |
| Class A | 2,798,620 | 347,252,769 |
| Class C | 2,464,320 | 308,779,296 |
| |
| Meta Platforms, Inc., Class A (a) | 1,992,200 | 600,190,094 |
| | | 1,256,222,159 |
| IT Services 2.3% |
| Gartner, Inc. (a) | 450,340 | 149,530,894 |
| Snowflake, Inc., Class A (a) | 823,400 | 119,500,042 |
| | | 269,030,936 |
| Machinery 1.4% |
| Parker-Hannifin Corp. | 466,100 | 171,948,951 |
| Pharmaceuticals 2.0% |
| Eli Lilly & Co. | 427,000 | 236,528,110 |
| Semiconductors & Semiconductor Equipment 13.6% |
| Analog Devices, Inc. | 611,940 | 96,276,520 |
| ASML Holding NV (Registered) | 466,570 | 279,386,782 |
| Broadcom, Inc. | 348,900 | 293,553,993 |
| Lam Research Corp. (b) | 475,690 | 279,810,372 |
| Monolithic Power Systems, Inc. | 272,400 | 120,329,976 |
| NVIDIA Corp. | 1,354,950 | 552,548,610 |
| | | 1,621,906,253 |
| Software 23.9% |
| Atlassian Corp., Class A (a) | 868,250 | 156,840,680 |
| Microsoft Corp. | 4,262,330 | 1,441,136,396 |
| Salesforce, Inc. (a) | 1,355,500 | 272,225,065 |
| ServiceNow, Inc. (a) | 787,210 | 458,038,139 |
| Synopsys, Inc. (a) | 448,600 | 210,590,784 |
| Workday, Inc., Class A (a) | 1,481,100 | 313,563,681 |
| | | 2,852,394,745 |
| Specialty Retail 1.7% |
| O'Reilly Automotive, Inc. (a) | 215,120 | 200,156,253 |
| Technology Hardware, Storage & Peripherals 6.3% |
| Apple, Inc. | 4,396,780 | 750,838,120 |
The notes to the financial statements are an integral part of, and should be read in conjunction with, the financial statements.
11
Portfolio of Investments October 31, 2023†^ (continued)
| | Shares | | Value |
| Common Stocks (continued) |
| Textiles, Apparel & Luxury Goods 1.7% |
| Lululemon Athletica, Inc. (a) | 513,600 | | $ 202,091,328 |
Total Common Stocks
(Cost $8,478,612,203) | | | 11,824,452,543 |
| Short-Term Investments 0.4% |
| Affiliated Investment Company 0.3% |
| MainStay U.S. Government Liquidity Fund, 5.275% (c) | 38,040,328 | | 38,040,328 |
| Unaffiliated Investment Company 0.1% |
| Invesco Government & Agency Portfolio, 5.357% (c)(d) | 8,416,095 | | 8,416,095 |
Total Short-Term Investments
(Cost $46,456,423) | | | 46,456,423 |
Total Investments
(Cost $8,525,068,626) | 99.5% | | 11,870,908,966 |
| Other Assets, Less Liabilities | 0.5 | | 57,874,405 |
| Net Assets | 100.0% | | $ 11,928,783,371 |
| † | Percentages indicated are based on Fund net assets. |
| ^ | Industry classifications may be different than those used for compliance monitoring purposes. |
| (a) | Non-income producing security. |
| (b) | All or a portion of this security was held on loan. As of October 31, 2023, the aggregate market value of securities on loan was $8,250,658. The Fund received cash collateral with a value of $8,416,095. (See Note 2(H)) |
| (c) | Current yield as of October 31, 2023. |
| (d) | Represents a security purchased with cash collateral received for securities on loan. |
Investments in Affiliates (in 000's)
Investments in issuers considered to be affiliate(s) of the Fund during the year ended October 31, 2023 for purposes of Section 2(a)(3) of the Investment Company Act of 1940, as amended, were as follows:
| Affiliated Investment Companies | Value,
Beginning
of Year | Purchases
at Cost | Proceeds
from
Sales | Net
Realized
Gain/(Loss)
on Sales | Change in
Unrealized
Appreciation/
(Depreciation) | Value,
End of
Year | Dividend
Income | Other
Distributions | Shares
End of
Year |
| MainStay U.S. Government Liquidity Fund | $ 209,899 | $ 2,119,285 | $ (2,291,144) | $ — | $ — | $ 38,040 | $ 2,978 | $ — | 38,040 |
The notes to the financial statements are an integral part of, and should be read in conjunction with, the financial statements.
| 12 | MainStay Winslow Large Cap Growth Fund |
The following is a summary of the fair valuations according to the inputs used as of October 31, 2023, for valuing the Fund’s assets:
| Description | Quoted
Prices in
Active
Markets for
Identical
Assets
(Level 1) | | Significant
Other
Observable
Inputs
(Level 2) | | Significant
Unobservable
Inputs
(Level 3) | | Total |
| Asset Valuation Inputs | | | | | | | |
| Investments in Securities (a) | | | | | | | |
| Common Stocks | $ 11,824,452,543 | | $ — | | $ — | | $ 11,824,452,543 |
| Short-Term Investments | | | | | | | |
| Affiliated Investment Company | 38,040,328 | | — | | — | | 38,040,328 |
| Unaffiliated Investment Company | 8,416,095 | | — | | — | | 8,416,095 |
| Total Short-Term Investments | 46,456,423 | | — | | — | | 46,456,423 |
| Total Investments in Securities | $ 11,870,908,966 | | $ — | | $ — | | $ 11,870,908,966 |
| (a) | For a complete listing of investments and their industries, see the Portfolio of Investments. |
The notes to the financial statements are an integral part of, and should be read in conjunction with, the financial statements.
13
Statement of Assets and Liabilities as of October 31, 2023
| Assets |
Investment in unaffiliated securities, at value
(identified cost $8,487,028,298) including securities on loan of $8,250,658 | $11,832,868,638 |
Investment in affiliated investment companies, at value
(identified cost $38,040,328) | 38,040,328 |
| Receivables: | |
| Investment securities sold | 195,420,034 |
| Fund shares sold | 12,124,809 |
| Dividends | 1,500,290 |
| Securities lending | 126 |
| Other assets | 170,761 |
| Total assets | 12,080,124,986 |
| Liabilities |
| Cash collateral received for securities on loan | 8,416,095 |
| Payables: | |
| Investment securities purchased | 125,728,254 |
| Fund shares redeemed | 8,794,292 |
| Manager (See Note 3) | 6,352,085 |
| Transfer agent (See Note 3) | 1,369,522 |
| NYLIFE Distributors (See Note 3) | 426,635 |
| Professional fees | 146,382 |
| Shareholder communication | 69,042 |
| Custodian | 37,385 |
| Trustees | 838 |
| Accrued expenses | 1,085 |
| Total liabilities | 151,341,615 |
| Net assets | $11,928,783,371 |
| Composition of Net Assets |
| Shares of beneficial interest outstanding (par value of $.01 per share) unlimited number of shares authorized | $ 12,404,203 |
| Additional paid-in-capital | 7,461,681,027 |
| | 7,474,085,230 |
| Total distributable earnings (loss) | 4,454,698,141 |
| Net assets | $11,928,783,371 |
| Class A | |
| Net assets applicable to outstanding shares | $1,153,265,396 |
| Shares of beneficial interest outstanding | 137,502,914 |
| Net asset value per share outstanding | $ 8.39 |
| Maximum sales charge (5.50% of offering price) | 0.49 |
| Maximum offering price per share outstanding | $ 8.88 |
| Investor Class | |
| Net assets applicable to outstanding shares | $ 61,360,460 |
| Shares of beneficial interest outstanding | 7,605,969 |
| Net asset value per share outstanding | $ 8.07 |
| Maximum sales charge (5.00% of offering price) | 0.42 |
| Maximum offering price per share outstanding | $ 8.49 |
| Class B | |
| Net assets applicable to outstanding shares | $ 6,235,347 |
| Shares of beneficial interest outstanding | 1,235,622 |
| Net asset value and offering price per share outstanding | $ 5.05 |
| Class C | |
| Net assets applicable to outstanding shares | $ 38,923,323 |
| Shares of beneficial interest outstanding | 7,746,106 |
| Net asset value and offering price per share outstanding | $ 5.02 |
| Class I | |
| Net assets applicable to outstanding shares | $6,217,494,308 |
| Shares of beneficial interest outstanding | 631,337,660 |
| Net asset value and offering price per share outstanding | $ 9.85 |
| Class R1 | |
| Net assets applicable to outstanding shares | $ 850,154,840 |
| Shares of beneficial interest outstanding | 91,190,710 |
| Net asset value and offering price per share outstanding | $ 9.32 |
| Class R2 | |
| Net assets applicable to outstanding shares | $ 111,520,078 |
| Shares of beneficial interest outstanding | 13,511,106 |
| Net asset value and offering price per share outstanding | $ 8.25 |
| Class R3 | |
| Net assets applicable to outstanding shares | $ 34,337,499 |
| Shares of beneficial interest outstanding | 4,733,244 |
| Net asset value and offering price per share outstanding | $ 7.25 |
| Class R6 | |
| Net assets applicable to outstanding shares | $3,455,133,732 |
| Shares of beneficial interest outstanding | 345,512,158 |
| Net asset value and offering price per share outstanding | $ 10.00 |
The notes to the financial statements are an integral part of, and should be read in conjunction with, the financial statements.
| 14 | MainStay Winslow Large Cap Growth Fund |
| SIMPLE Class | |
| Net assets applicable to outstanding shares | $358,388 |
| Shares of beneficial interest outstanding | 44,815 |
| Net asset value and offering price per share outstanding | $ 8.00 |
The notes to the financial statements are an integral part of, and should be read in conjunction with, the financial statements.
15
Statement of Operations for the year ended October 31, 2023
| Investment Income (Loss) |
| Income | |
| Dividends-unaffiliated (net of foreign tax withholding of $477,803) | $ 67,057,581 |
| Dividends-affiliated | 2,978,487 |
| Securities lending, net | 1,425 |
| Total income | 70,037,493 |
| Expenses | |
| Manager (See Note 3) | 74,084,253 |
| Transfer agent (See Note 3) | 8,291,610 |
| Distribution/Service—Class A (See Note 3) | 2,841,738 |
| Distribution/Service—Investor Class (See Note 3) | 163,658 |
| Distribution/Service—Class B (See Note 3) | 80,095 |
| Distribution/Service—Class C (See Note 3) | 435,721 |
| Distribution/Service—Class R2 (See Note 3) | 275,960 |
| Distribution/Service—Class R3 (See Note 3) | 186,976 |
| Distribution/Service—SIMPLE Class (See Note 3) | 1,511 |
| Shareholder service (See Note 3) | 958,081 |
| Professional fees | 773,703 |
| Registration | 484,402 |
| Trustees | 310,753 |
| Shareholder communication | 102,089 |
| Custodian | 99,089 |
| Miscellaneous | 261,978 |
| Total expenses before waiver/reimbursement | 89,351,617 |
| Expense waiver/reimbursement from Manager (See Note 3) | (245,068) |
| Reimbursement from prior custodian(a) | (22,061) |
| Net expenses | 89,084,488 |
| Net investment income (loss) | (19,046,995) |
| Realized and Unrealized Gain (Loss) |
| Net realized gain (loss) on: | |
| Unaffiliated investment transactions | 1,300,343,605 |
| Foreign currency transactions | (2,655) |
| Net realized gain (loss) | 1,300,340,950 |
| Net change in unrealized appreciation (depreciation) on unaffiliated investments | 841,465,661 |
| Net realized and unrealized gain (loss) | 2,141,806,611 |
| Net increase (decrease) in net assets resulting from operations | $2,122,759,616 |
| (a) | Represents a refund for overbilling of custody fees. |
The notes to the financial statements are an integral part of, and should be read in conjunction with, the financial statements.
| 16 | MainStay Winslow Large Cap Growth Fund |
Statements of Changes in Net Assets
for the years ended October 31, 2023 and October 31, 2022
| | 2023 | 2022 |
| Increase (Decrease) in Net Assets |
| Operations: | | |
| Net investment income (loss) | $ (19,046,995) | $ (18,381,730) |
| Net realized gain (loss) | 1,300,340,950 | 1,364,007,827 |
| Net change in unrealized appreciation (depreciation) | 841,465,661 | (6,575,829,012) |
| Net increase (decrease) in net assets resulting from operations | 2,122,759,616 | (5,230,202,915) |
| Distributions to shareholders: | | |
| Class A | (137,076,160) | (364,397,755) |
| Investor Class | (8,619,202) | (22,722,175) |
| Class B | (1,794,965) | (5,810,514) |
| Class C | (8,883,388) | (25,393,609) |
| Class I | (674,639,763) | (1,557,071,002) |
| Class R1 | (86,323,034) | (230,113,135) |
| Class R2 | (13,562,024) | (37,915,929) |
| Class R3 | (5,552,262) | (14,198,963) |
| Class R6 | (369,612,028) | (894,224,087) |
| SIMPLE Class | (30,895) | (16,490) |
| Total distributions to shareholders | (1,306,093,721) | (3,151,863,659) |
| Capital share transactions: | | |
| Net proceeds from sales of shares | 1,751,093,329 | 3,411,138,066 |
| Net asset value of shares issued to shareholders in reinvestment of distributions | 1,210,855,286 | 2,914,756,292 |
| Cost of shares redeemed | (3,204,378,874) | (3,229,423,183) |
| Increase (decrease) in net assets derived from capital share transactions | (242,430,259) | 3,096,471,175 |
| Net increase (decrease) in net assets | 574,235,636 | (5,285,595,399) |
| Net Assets |
| Beginning of year | 11,354,547,735 | 16,640,143,134 |
| End of year | $11,928,783,371 | $11,354,547,735 |
The notes to the financial statements are an integral part of, and should be read in conjunction with, the financial statements.
17
Financial Highlights selected per share data and ratios
| | Year Ended October 31, |
| Class A | 2023 | | 2022 | | 2021 | | 2020 | | 2019 |
| Net asset value at beginning of year | $ 8.03 | | $ 14.92 | | $ 11.08 | | $ 9.59 | | $ 9.95 |
| Net investment income (loss) (a) | (0.03) | | (0.04) | | (0.07) | | (0.03) | | (0.02) |
| Net realized and unrealized gain (loss) | 1.44 | | (3.74) | | 4.55 | | 2.58 | | 1.48 |
| Total from investment operations | 1.41 | | (3.78) | | 4.48 | | 2.55 | | 1.46 |
| Less distributions: | | | | | | | | | |
| From net realized gain on investments | (1.05) | | (3.11) | | (0.64) | | (1.06) | | (1.82) |
| Net asset value at end of year | $ 8.39 | | $ 8.03 | | $ 14.92 | | $ 11.08 | | $ 9.59 |
| Total investment return (b) | 19.57% | | (31.71)% | | 42.16% | | 29.44% | | 17.05% |
| Ratios (to average net assets)/Supplemental Data: | | | | | | | | | |
| Net investment income (loss) | (0.39)% | | (0.37)% | | (0.53)% | | (0.31)% | | (0.20)% |
| Net expenses (c) | 0.98% | | 0.96% | | 0.93% | | 0.97% | | 0.99% |
| Expenses (before waiver/reimbursement) (c) | 0.98%(d) | | 0.96%(d) | | 0.94% | | 0.97% | | 0.99% |
| Portfolio turnover rate | 81% | | 77% | | 66% | | 44% | | 54% |
| Net assets at end of year (in 000’s) | $ 1,153,265 | | $ 1,065,870 | | $ 1,745,833 | | $ 1,341,381 | | $ 1,008,608 |
| (a) | Per share data based on average shares outstanding during the year. |
| (b) | Total investment return is calculated exclusive of sales charges and assumes the reinvestment of dividends and distributions. For periods of less than one year, total return is not annualized. |
| (c) | In addition to the fees and expenses which the Fund bears directly, it also indirectly bears a pro-rata share of the fees and expenses of the underlying funds in which it invests. Such indirect expenses are not included in the above expense ratios. |
| (d) | Expense waiver/reimbursement less than 0.01%. |
| | Year Ended October 31, |
| Investor Class | 2023 | | 2022 | | 2021 | | 2020 | | 2019 |
| Net asset value at beginning of year | $ 7.78 | | $ 14.56 | | $ 10.84 | | $ 9.42 | | $ 9.81 |
| Net investment income (loss) (a) | (0.05) | | (0.05) | | (0.08) | | (0.04) | | (0.03) |
| Net realized and unrealized gain (loss) | 1.39 | | (3.62) | | 4.44 | | 2.52 | | 1.46 |
| Total from investment operations | 1.34 | | (3.67) | | 4.36 | | 2.48 | | 1.43 |
| Less distributions: | | | | | | | | | |
| From net realized gain on investments | (1.05) | | (3.11) | | (0.64) | | (1.06) | | (1.82) |
| Net asset value at end of year | $ 8.07 | | $ 7.78 | | $ 14.56 | | $ 10.84 | | $ 9.42 |
| Total investment return (b) | 19.26% | | (31.75)% | | 41.98% | | 29.19% | | 16.96% |
| Ratios (to average net assets)/Supplemental Data: | | | | | | | | | |
| Net investment income (loss) | (0.59)% | | (0.52)% | | (0.67)% | | (0.43)% | | (0.31)% |
| Net expenses (c) | 1.19% | | 1.11% | | 1.08% | | 1.10% | | 1.09% |
| Expenses (before waiver/reimbursement) (c) | 1.19%(d) | | 1.11%(d) | | 1.09% | | 1.10% | | 1.10% |
| Portfolio turnover rate | 81% | | 77% | | 66% | | 44% | | 54% |
| Net assets at end of year (in 000's) | $ 61,360 | | $ 64,065 | | $ 106,354 | | $ 110,831 | | $ 109,236 |
| (a) | Per share data based on average shares outstanding during the year. |
| (b) | Total investment return is calculated exclusive of sales charges and assumes the reinvestment of dividends and distributions. For periods of less than one year, total return is not annualized. |
| (c) | In addition to the fees and expenses which the Fund bears directly, it also indirectly bears a pro-rata share of the fees and expenses of the underlying funds in which it invests. Such indirect expenses are not included in the above expense ratios. |
| (d) | Expense waiver/reimbursement less than 0.01%. |
The notes to the financial statements are an integral part of, and should be read in conjunction with, the financial statements.
| 18 | MainStay Winslow Large Cap Growth Fund |
Financial Highlights selected per share data and ratios
| | Year Ended October 31, |
| Class B | 2023 | | 2022 | | 2021 | | 2020 | | 2019 |
| Net asset value at beginning of year | $ 5.28 | | $ 10.96 | | $ 8.37 | | $ 7.55 | | $ 8.26 |
| Net investment income (loss) (a) | (0.06) | | (0.08) | | (0.13) | | (0.09) | | (0.08) |
| Net realized and unrealized gain (loss) | 0.88 | | (2.49) | | 3.36 | | 1.97 | | 1.19 |
| Total from investment operations | 0.82 | | (2.57) | | 3.23 | | 1.88 | | 1.11 |
| Less distributions: | | | | | | | | | |
| From net realized gain on investments | (1.05) | | (3.11) | | (0.64) | | (1.06) | | (1.82) |
| Net asset value at end of year | $ 5.05 | | $ 5.28 | | $ 10.96 | | $ 8.37 | | $ 7.55 |
| Total investment return (b) | 18.40% | | (32.29)% | | 40.80% | | 28.37% | | 15.96% |
| Ratios (to average net assets)/Supplemental Data: | | | | | | | | | |
| Net investment income (loss) | (1.32)% | | (1.27)% | | (1.42)% | | (1.17)% | | (1.05)% |
| Net expenses (c) | 1.94% | | 1.86% | | 1.83% | | 1.85% | | 1.84% |
| Expenses (before waiver/reimbursement) (c) | 1.94%(d) | | 1.86%(d) | | 1.84% | | 1.85% | | 1.85% |
| Portfolio turnover rate | 81% | | 77% | | 66% | | 44% | | 54% |
| Net assets at end of year (in 000’s) | $ 6,235 | | $ 9,408 | | $ 20,533 | | $ 20,172 | | $ 21,015 |
| (a) | Per share data based on average shares outstanding during the year. |
| (b) | Total investment return is calculated exclusive of sales charges and assumes the reinvestment of dividends and distributions. For periods of less than one year, total return is not annualized. |
| (c) | In addition to the fees and expenses which the Fund bears directly, it also indirectly bears a pro-rata share of the fees and expenses of the underlying funds in which it invests. Such indirect expenses are not included in the above expense ratios. |
| (d) | Expense waiver/reimbursement less than 0.01%. |
| | Year Ended October 31, |
| Class C | 2023 | | 2022 | | 2021 | | 2020 | | 2019 |
| Net asset value at beginning of year | $ 5.26 | | $ 10.93 | | $ 8.35 | | $ 7.53 | | $ 8.25 |
| Net investment income (loss) (a) | (0.07) | | (0.08) | | (0.13) | | (0.09) | | (0.07) |
| Net realized and unrealized gain (loss) | 0.88 | | (2.48) | | 3.35 | | 1.97 | | 1.17 |
| Total from investment operations | 0.81 | | (2.56) | | 3.22 | | 1.88 | | 1.10 |
| Less distributions: | | | | | | | | | |
| From net realized gain on investments | (1.05) | | (3.11) | | (0.64) | | (1.06) | | (1.82) |
| Net asset value at end of year | $ 5.02 | | $ 5.26 | | $ 10.93 | | $ 8.35 | | $ 7.53 |
| Total investment return (b) | 18.24% | | (32.29)% | | 40.77% | | 28.46% | | 15.97% |
| Ratios (to average net assets)/Supplemental Data: | | | | | | | | | |
| Net investment income (loss) | (1.34)% | | (1.27)% | | (1.42)% | | (1.17)% | | (1.04)% |
| Net expenses (c) | 1.94% | | 1.86% | | 1.83% | | 1.85% | | 1.84% |
| Expenses (before waiver/reimbursement) (c) | 1.94%(d) | | 1.86%(d) | | 1.84% | | 1.85% | | 1.85% |
| Portfolio turnover rate | 81% | | 77% | | 66% | | 44% | | 54% |
| Net assets at end of year (in 000’s) | $ 38,923 | | $ 46,833 | | $ 90,377 | | $ 95,761 | | $ 131,945 |
| (a) | Per share data based on average shares outstanding during the year. |
| (b) | Total investment return is calculated exclusive of sales charges and assumes the reinvestment of dividends and distributions. For periods of less than one year, total return is not annualized. |
| (c) | In addition to the fees and expenses which the Fund bears directly, it also indirectly bears a pro-rata share of the fees and expenses of the underlying funds in which it invests. Such indirect expenses are not included in the above expense ratios. |
| (d) | Expense waiver/reimbursement less than 0.01%. |
The notes to the financial statements are an integral part of, and should be read in conjunction with, the financial statements.
19
Financial Highlights selected per share data and ratios
| | Year Ended October 31, |
| Class I | 2023 | | 2022 | | 2021 | | 2020 | | 2019 |
| Net asset value at beginning of year | $ 9.24 | | $ 16.66 | | $ 12.28 | | $ 10.49 | | $ 10.69 |
| Net investment income (loss) (a) | (0.01) | | (0.01) | | (0.04) | | (0.01) | | 0.00‡ |
| Net realized and unrealized gain (loss) | 1.68 | | (4.30) | | 5.06 | | 2.86 | | 1.62 |
| Total from investment operations | 1.67 | | (4.31) | | 5.02 | | 2.85 | | 1.62 |
| Less distributions: | | | | | | | | | |
| From net investment income | (0.01) | | — | | — | | — | | — |
| From net realized gain on investments | (1.05) | | (3.11) | | (0.64) | | (1.06) | | (1.82) |
| Total distributions | (1.06) | | (3.11) | | (0.64) | | (1.06) | | (1.82) |
| Net asset value at end of year | $ 9.85 | | $ 9.24 | | $ 16.66 | | $ 12.28 | | $ 10.49 |
| Total investment return (b) | 19.89% | | (31.55)% | | 42.46% | | 29.80% | | 17.29% |
| Ratios (to average net assets)/Supplemental Data: | | | | | | | | | |
| Net investment income (loss) | (0.14)% | | (0.11)% | | (0.28)% | | (0.06)% | | 0.05% |
| Net expenses (c) | 0.73% | | 0.71% | | 0.68% | | 0.72% | | 0.74% |
| Expenses (before waiver/reimbursement) (c) | 0.73%(d) | | 0.71%(d) | | 0.69% | | 0.72% | | 0.74% |
| Portfolio turnover rate | 81% | | 77% | | 66% | | 44% | | 54% |
| Net assets at end of year (in 000’s) | $ 6,217,494 | | $ 6,016,574 | | $ 8,434,291 | | $ 6,824,224 | | $ 6,080,320 |
| ‡ | Less than one cent per share. |
| (a) | Per share data based on average shares outstanding during the year. |
| (b) | Total investment return is calculated exclusive of sales charges and assumes the reinvestment of dividends and distributions. Class I shares are not subject to sales charges. For periods of less than one year, total return is not annualized. |
| (c) | In addition to the fees and expenses which the Fund bears directly, it also indirectly bears a pro-rata share of the fees and expenses of the underlying funds in which it invests. Such indirect expenses are not included in the above expense ratios. |
| (d) | Expense waiver/reimbursement less than 0.01%. |
| | Year Ended October 31, |
| Class R1 | 2023 | | 2022 | | 2021 | | 2020 | | 2019 |
| Net asset value at beginning of year | $ 8.80 | | $ 16.03 | | $ 11.85 | | $ 10.17 | | $ 10.43 |
| Net investment income (loss) (a) | (0.02) | | (0.02) | | (0.05) | | (0.02) | | (0.00)‡ |
| Net realized and unrealized gain (loss) | 1.59 | | (4.10) | | 4.87 | | 2.76 | | 1.56 |
| Total from investment operations | 1.57 | | (4.12) | | 4.82 | | 2.74 | | 1.56 |
| Less distributions: | | | | | | | | | |
| From net investment income | (0.00)‡ | | — | | — | | — | | — |
| From net realized gain on investments | (1.05) | | (3.11) | | (0.64) | | (1.06) | | (1.82) |
| Total distributions | (1.05) | | (3.11) | | (0.64) | | (1.06) | | (1.82) |
| Net asset value at end of year | $ 9.32 | | $ 8.80 | | $ 16.03 | | $ 11.85 | | $ 10.17 |
| Total investment return (b) | 19.73% | | (31.62)% | | 42.30% | | 29.64% | | 17.25% |
| Ratios (to average net assets)/Supplemental Data: | | | | | | | | | |
| Net investment income (loss) | (0.25)% | | (0.22)% | | (0.38)% | | (0.15)% | | (0.04)% |
| Net expenses (c) | 0.83% | | 0.81% | | 0.78% | | 0.82% | | 0.84% |
| Expenses (before waiver/reimbursement) (c) | 0.83%(d) | | 0.81%(d) | | 0.79% | | 0.82% | | 0.84% |
| Portfolio turnover rate | 81% | | 77% | | 66% | | 44% | | 54% |
| Net assets at end of year (in 000’s) | $ 850,155 | | $ 721,142 | | $ 1,207,903 | | $ 914,359 | | $ 919,236 |
| ‡ | Less than one cent per share. |
| (a) | Per share data based on average shares outstanding during the year. |
| (b) | Total investment return is calculated exclusive of sales charges and assumes the reinvestment of dividends and distributions. Class R1 shares are not subject to sales charges. For periods of less than one year, total return is not annualized. |
| (c) | In addition to the fees and expenses which the Fund bears directly, it also indirectly bears a pro-rata share of the fees and expenses of the underlying funds in which it invests. Such indirect expenses are not included in the above expense ratios. |
| (d) | Expense waiver/reimbursement less than 0.01%. |
The notes to the financial statements are an integral part of, and should be read in conjunction with, the financial statements.
| 20 | MainStay Winslow Large Cap Growth Fund |
Financial Highlights selected per share data and ratios
| | Year Ended October 31, |
| Class R2 | 2023 | | 2022 | | 2021 | | 2020 | | 2019 |
| Net asset value at beginning of year | $ 7.93 | | $ 14.78 | | $ 10.99 | | $ 9.53 | | $ 9.90 |
| Net investment income (loss) (a) | (0.04) | | (0.04) | | (0.08) | | (0.04) | | (0.03) |
| Net realized and unrealized gain (loss) | 1.41 | | (3.70) | | 4.51 | | 2.56 | | 1.48 |
| Total from investment operations | 1.37 | | (3.74) | | 4.43 | | 2.52 | | 1.45 |
| Less distributions: | | | | | | | | | |
| From net realized gain on investments | (1.05) | | (3.11) | | (0.64) | | (1.06) | | (1.82) |
| Net asset value at end of year | $ 8.25 | | $ 7.93 | | $ 14.78 | | $ 10.99 | | $ 9.53 |
| Total investment return (b) | 19.29% | | (31.74)% | | 42.04% | | 29.29% | | 16.89% |
| Ratios (to average net assets)/Supplemental Data: | | | | | | | | | |
| Net investment income (loss) | (0.49)% | | (0.47)% | | (0.63)% | | (0.40)% | | (0.29)% |
| Net expenses (c) | 1.08% | | 1.06% | | 1.03% | | 1.07% | | 1.09% |
| Expenses (before waiver/reimbursement) (c) | 1.08%(d) | | 1.06%(d) | | 1.04% | | 1.07% | | 1.09% |
| Portfolio turnover rate | 81% | | 77% | | 66% | | 44% | | 54% |
| Net assets at end of year (in 000’s) | $ 111,520 | | $ 106,414 | | $ 188,790 | | $ 159,297 | | $ 163,288 |
| (a) | Per share data based on average shares outstanding during the year. |
| (b) | Total investment return is calculated exclusive of sales charges and assumes the reinvestment of dividends and distributions. Class R2 shares are not subject to sales charges. For periods of less than one year, total return is not annualized. |
| (c) | In addition to the fees and expenses which the Fund bears directly, it also indirectly bears a pro-rata share of the fees and expenses of the underlying funds in which it invests. Such indirect expenses are not included in the above expense ratios. |
| (d) | Expense waiver/reimbursement less than 0.01%. |
| | Year Ended October 31, |
| Class R3 | 2023 | | 2022 | | 2021 | | 2020 | | 2019 |
| Net asset value at beginning of year | $ 7.10 | | $ 13.60 | | $ 10.19 | | $ 8.93 | | $ 9.41 |
| Net investment income (loss) (a) | (0.05) | | (0.06) | | (0.10) | | (0.06) | | (0.05) |
| Net realized and unrealized gain (loss) | 1.25 | | (3.33) | | 4.15 | | 2.38 | | 1.39 |
| Total from investment operations | 1.20 | | (3.39) | | 4.05 | | 2.32 | | 1.34 |
| Less distributions: | | | | | | | | | |
| From net realized gain on investments | (1.05) | | (3.11) | | (0.64) | | (1.06) | | (1.82) |
| Net asset value at end of year | $ 7.25 | | $ 7.10 | | $ 13.60 | | $ 10.19 | | $ 8.93 |
| Total investment return (b) | 19.11% | | (31.98)% | | 41.60% | | 28.99% | | 16.69% |
| Ratios (to average net assets)/Supplemental Data: | | | | | | | | | |
| Net investment income (loss) | (0.73)% | | (0.72)% | | (0.88)% | | (0.65)% | | (0.55)% |
| Net expenses (c) | 1.33% | | 1.31% | | 1.28% | | 1.32% | | 1.34% |
| Expenses (before waiver/reimbursement) (c) | 1.33%(d) | | 1.31%(d) | | 1.29% | | 1.32% | | 1.34% |
| Portfolio turnover rate | 81% | | 77% | | 66% | | 44% | | 54% |
| Net assets at end of year (in 000’s) | $ 34,337 | | $ 38,027 | | $ 63,195 | | $ 56,657 | | $ 57,283 |
| (a) | Per share data based on average shares outstanding during the year. |
| (b) | Total investment return is calculated exclusive of sales charges and assumes the reinvestment of dividends and distributions. Class R3 shares are not subject to sales charges. For periods of less than one year, total return is not annualized. |
| (c) | In addition to the fees and expenses which the Fund bears directly, it also indirectly bears a pro-rata share of the fees and expenses of the underlying funds in which it invests. Such indirect expenses are not included in the above expense ratios. |
| (d) | Expense waiver/reimbursement less than 0.01%. |
The notes to the financial statements are an integral part of, and should be read in conjunction with, the financial statements.
21
Financial Highlights selected per share data and ratios
| | Year Ended October 31, |
| Class R6 | 2023 | | 2022 | | 2021 | | 2020 | | 2019 |
| Net asset value at beginning of year | $ 9.37 | | $ 16.84 | | $ 12.39 | | $ 10.58 | | $ 10.76 |
| Net investment income (loss) (a) | (0.01) | | (0.00)‡ | | (0.03) | | 0.00‡ | | 0.01 |
| Net realized and unrealized gain (loss) | 1.71 | | (4.36) | | 5.12 | | 2.88 | | 1.63 |
| Total from investment operations | 1.70 | | (4.36) | | 5.09 | | 2.88 | | 1.64 |
| Less distributions: | | | | | | | | | |
| From net investment income | (0.02) | | — | | — | | (0.01) | | — |
| From net realized gain on investments | (1.05) | | (3.11) | | (0.64) | | (1.06) | | (1.82) |
| Total distributions | (1.07) | | (3.11) | | (0.64) | | (1.07) | | (1.82) |
| Net asset value at end of year | $ 10.00 | | $ 9.37 | | $ 16.84 | | $ 12.39 | | $ 10.58 |
| Total investment return (b) | 19.95% | | (31.50)% | | 42.65% | | 29.83% | | 17.49% |
| Ratios (to average net assets)/Supplemental Data: | | | | | | | | | |
| Net investment income (loss) | (0.05)% | | (0.04)% | | (0.22)% | | 0.02% | | 0.13% |
| Net expenses (c) | 0.64% | | 0.63% | | 0.62% | | 0.64% | | 0.64% |
| Expenses (before waiver/reimbursement) (c) | 0.64%(d) | | 0.64% | | 0.63% | | 0.64% | | 0.64% |
| Portfolio turnover rate | 81% | | 77% | | 66% | | 44% | | 54% |
| Net assets at end of year (in 000’s) | $ 3,455,134 | | $ 3,285,993 | | $ 4,782,798 | | $ 3,981,812 | | $ 3,148,459 |
| ‡ | Less than one cent per share. |
| (a) | Per share data based on average shares outstanding during the year. |
| (b) | Total investment return is calculated exclusive of sales charges and assumes the reinvestment of dividends and distributions. Class R6 shares are not subject to sales charges. For periods of less than one year, total return is not annualized. |
| (c) | In addition to the fees and expenses which the Fund bears directly, it also indirectly bears a pro-rata share of the fees and expenses of the underlying funds in which it invests. Such indirect expenses are not included in the above expense ratios. |
| (d) | Expense waiver/reimbursement less than 0.01%. |
| | Year Ended October 31, | | August 31, 2020^ through
October 31, |
| SIMPLE Class | 2023 | | 2022 | | 2021 | | 2020 |
| Net asset value at beginning of period | $ 7.72 | | $ 14.52 | | $ 10.84 | | $ 11.84* |
| Net investment income (loss) (a) | (0.05) | | (0.07) | | (0.12) | | (0.02) |
| Net realized and unrealized gain (loss) | 1.38 | | (3.62) | | 4.44 | | (0.98) |
| Total from investment operations | 1.33 | | (3.69) | | 4.32 | | (1.00) |
| Less distributions: | | | | | | | |
| From net realized gain on investments | (1.05) | | (3.11) | | (0.64) | | — |
| Net asset value at end of period | $ 8.00 | | $ 7.72 | | $ 14.52 | | $ 10.84 |
| Total investment return (b) | 19.28% | | (32.02)% | | 41.59% | | (8.45)% |
| Ratios (to average net assets)/Supplemental Data: | | | | | | | |
| Net investment income (loss) | (0.68)% | | (0.77)% | | (0.96)% | | (1.00)%†† |
| Net expenses (c) | 1.24% | | 1.37% | | 1.33% | | 1.32%†† |
| Expenses (before waiver/reimbursement) (c) | 1.24%(d) | | 1.38% | | 1.34% | | 1.33%†† |
| Portfolio turnover rate | 81% | | 77% | | 66% | | 44% |
| Net assets at end of period (in 000’s) | $ 358 | | $ 220 | | $ 71 | | $ 23 |
| ^ | Inception date. |
| * | Based on the net asset value of Investor Class as of August 31, 2020. |
| †† | Annualized. |
| (a) | Per share data based on average shares outstanding during the period. |
| (b) | Total investment return is calculated exclusive of sales charges and assumes the reinvestment of dividends and distributions. SIMPLE Class shares are not subject to sales charges. For periods of less than one year, total return is not annualized. |
| (c) | In addition to the fees and expenses which the Fund bears directly, it also indirectly bears a pro-rata share of the fees and expenses of the underlying funds in which it invests. Such indirect expenses are not included in the above expense ratios. |
| (d) | Expense waiver/reimbursement less than 0.01%. |
The notes to the financial statements are an integral part of, and should be read in conjunction with, the financial statements.
| 22 | MainStay Winslow Large Cap Growth Fund |
Notes to Financial Statements
Note 1-Organization and Business
The MainStay Funds (the “Trust”) was organized on January 9, 1986, as a Massachusetts business trust. The Trust is registered under the Investment Company Act of 1940, as amended (the “1940 Act”), as an open-end management investment company, and is comprised of eleven funds (collectively referred to as the "Funds"). These financial statements and notes relate to the MainStay Winslow Large Cap Growth Fund (the "Fund"), a “diversified” fund, as that term is defined in the 1940 Act, as interpreted or modified by regulatory authorities having jurisdiction, from time to time.
The following table lists the Fund's share classes that have been registered and commenced operations:
| Class | Commenced Operations |
| Class A | July 1, 1995 |
| Investor Class | February 28, 2008 |
| Class B | April 1, 2005 |
| Class C | April 1, 2005 |
| Class I | April 1, 2005 |
| Class R1 | April 1, 2005 |
| Class R2 | April 1, 2005 |
| Class R3 | April 28, 2006 |
| Class R6 | June 17, 2013 |
| SIMPLE Class | August 31, 2020 |
Class B shares of the MainStay Group of Funds are closed to all new purchases as well as additional investments by existing Class B shareholders. Existing Class B shareholders may continue to reinvest dividends and capital gains distributions, as well as exchange their Class B shares for Class B shares of other funds in the MainStay Group of Funds as permitted by the current exchange privileges. Class B shareholders continue to be subject to any applicable contingent deferred sales charge ("CDSC") at the time of redemption. All other features of the Class B shares, including but not limited to the fees and expenses applicable to Class B shares, remain unchanged. Unless redeemed, Class B shareholders will remain in Class B shares of their respective fund until the Class B shares are converted to Class A or Investor Class shares pursuant to the applicable conversion schedule.
Class A and Investor Class shares are offered at net asset value (“NAV”) per share plus an initial sales charge. No initial sales charge applies to investments of $1 million or more (and certain other qualified purchases) in Class A and Investor Class shares. However, a CDSC of 1.00% may be imposed on certain redemptions made within 18 months of the date of purchase on shares that were purchased without an initial sales charge. Class C shares are offered at NAV without an initial sales charge, although a 1.00% CDSC may be imposed on certain redemptions of such shares made within one year of the date of purchase of Class C shares. When Class B shares were offered, they were offered at NAV without an initial sales charge, although a CDSC that declines depending on the number of years a shareholder held its Class B shares may be imposed on certain redemptions of such shares made within six years of the date
of purchase of such shares. Class I, Class R1, Class R2, Class R3, Class R6 and SIMPLE Class shares are offered at NAV without a sales charge. Depending upon eligibility, Class B shares convert to either Class A or Investor Class shares at the end of the calendar quarter eight years after the date they were purchased. In addition, depending upon eligibility, Class C shares convert to either Class A or Investor Class shares at the end of the calendar quarter eight years after the date they were purchased. Additionally, Investor Class shares may convert automatically to Class A shares. SIMPLE Class shares convert to Class A shares, or Investor Class shares if you are not eligible to hold Class A shares, at the end of the calendar quarter, ten years after the date they were purchased. Share class conversions are based on the relevant NAVs of the two classes at the time of the conversion, and no sales load or other charge is imposed. Under certain circumstances and as may be permitted by the Trust’s multiple class plan pursuant to Rule 18f-3 under the 1940 Act, specified share classes of the Fund may be converted to one or more other share classes of the Fund as disclosed in the capital share trans-actions within these Notes. The classes of shares have the same voting (except for issues that relate solely to one class), dividend, liquidation and other rights, and the same terms and conditions, except that under distribution plans pursuant to Rule 12b-1 under the 1940 Act, Class B and Class C shares are subject to higher distribution and/or service fees than Class A, Investor Class, Class R2, Class R3 and SIMPLE Class shares. Class I, Class R1 and Class R6 shares are not subject to a distribution and/or service fee. Class R1, Class R2 and Class R3 shares are subject to a shareholder service fee, which is in addition to fees paid under the distribution plans for Class R2 and Class R3 shares.
The Fund's investment objective is to seek long-term growth of capital.
Note 2–Significant Accounting Policies
The Fund is an investment company and accordingly follows the investment company accounting and reporting guidance of the Financial Accounting Standards Board (“FASB”) Accounting Standards Codification Topic 946 Financial Services—Investment Companies. The Fund prepares its financial statements in accordance with generally accepted accounting principles (“GAAP”) in the United States of America and follows the significant accounting policies described below.
(A) Securities Valuation. Investments are usually valued as of the close of regular trading on the New York Stock Exchange (the "Exchange") (usually 4:00 p.m. Eastern time) on each day the Fund is open for business ("valuation date").
Pursuant to Rule 2a-5 under the 1940 Act, the Board of Trustees of the Trust (the "Board") has designated New York Life Investment Management LLC (“New York Life Investments” or the "Manager") as its Valuation Designee (the "Valuation Designee"). The Valuation Designee is responsible for performing fair valuations relating to all investments in the Fund’s portfolio for which market quotations are not readily available; periodically assessing and managing material valuation risks; establishing and applying fair value methodologies; testing fair valuation methodologies; evaluating and overseeing pricing services; ensuring
Notes to Financial Statements (continued)
appropriate segregation of valuation and portfolio management functions; providing quarterly, annual and prompt reporting to the Board, as appropriate; identifying potential conflicts of interest; and maintaining appropriate records. The Valuation Designee has established a valuation committee ("Valuation Committee") to assist in carrying out the Valuation Designee’s responsibilities and establish prices of securities for which market quotations are not readily available. The Fund's and the Valuation Designee's policies and procedures ("Valuation Procedures") govern the Valuation Designee’s selection and application of methodologies for determining and calculating the fair value of Fund investments. The Valuation Designee may value the Fund's portfolio securities for which market quotations are not readily available and other Fund assets utilizing inputs from pricing services and other third-party sources. The Valuation Committee meets (in person, via electronic mail or via teleconference) on an ad-hoc basis to determine fair valuations and on a quarterly basis to review fair value events with respect to certain securities for which market quotations are not readily available, including valuation risks and back-testing results, and preview reports to the Board.
The Valuation Committee establishes prices of securities for which market quotations are not readily available based on such methodologies and measurements on a regular basis after considering information that is reasonably available and deemed relevant by the Valuation Committee. The Board shall oversee the Valuation Designee and review fair valuation materials on a prompt, quarterly and annual basis and approve proposed revisions to the Valuation Procedures.
Investments for which market quotations are not readily available are valued at fair value as determined in good faith pursuant to the Valuation Procedures. A market quotation is readily available only when that quotation is a quoted price (unadjusted) in active markets for identical investments that the Fund can access at the measurement date, provided that a quotation will not be readily available if it is not reliable. "Fair value" is defined as the price the Fund would reasonably expect to receive upon selling an asset or liability in an orderly transaction to an independent buyer in the principal or most advantageous market for the asset or liability. Fair value measurements are determined within a framework that establishes a three-tier hierarchy that maximizes the use of observable market data and minimizes the use of unobservable inputs to establish a classification of fair value measurements for disclosure purposes. "Inputs" refer broadly to the assumptions that market participants would use in pricing the asset or liability, including assumptions about risk, such as the risk inherent in a particular valuation technique used to measure fair value using a pricing model and/or the risk inherent in the inputs for the valuation technique. Inputs may be observable or unobservable. Observable inputs reflect the assumptions market participants would use in pricing the asset or liability based on market data obtained from sources independent of the Fund. Unobservable inputs reflect the Fund’s own assumptions about the assumptions market participants would use in pricing the asset or liability based on the information available. The inputs or methodology used for valuing assets or liabilities may not be an indication of the risks associated with investing in those assets or liabilities. The three-tier hierarchy of inputs is summarized below.
| • | Level 1—quoted prices (unadjusted) in active markets for an identical asset or liability |
| • | Level 2—other significant observable inputs (including quoted prices for a similar asset or liability in active markets, interest rates and yield curves, prepayment speeds, credit risk, etc.) |
| • | Level 3—significant unobservable inputs (including the Fund's own assumptions about the assumptions that market participants would use in measuring fair value of an asset or liability) |
The level of an asset or liability within the fair value hierarchy is based on the lowest level of an input, both individually and in the aggregate, that is significant to the fair value measurement. The aggregate value by input level of the Fund’s assets and liabilities as of October 31, 2023, is included at the end of the Portfolio of Investments.
The Fund may use third-party vendor evaluations, whose prices may be derived from one or more of the following standard inputs, among others:
| • Broker/dealer quotes | • Benchmark securities |
| • Two-sided markets | • Reference data (corporate actions or material event notices) |
| • Bids/offers | • Monthly payment information |
| • Industry and economic events | • Reported trades |
An asset or liability for which a market quotation is not readily available is valued by methods deemed reasonable in good faith by the Valuation Committee, following the Valuation Procedures to represent fair value. Under these procedures, the Valuation Designee generally uses a market-based approach which may use related or comparable assets or liabilities, recent transactions, market multiples, book values and other relevant information. The Valuation Designee may also use an income-based valuation approach in which the anticipated future cash flows of the asset or liability are discounted to calculate fair value. Discounts may also be applied due to the nature and/or duration of any restrictions on the disposition of the asset or liability. Fair value represents a good faith approximation of the value of a security. Fair value determinations involve the consideration of a number of subjective factors, an analysis of applicable facts and circumstances and the exercise of judgment. As a result, it is possible that the fair value for a security determined in good faith in accordance with the Valuation Procedures may differ from valuations for the same security determined for other funds using their own valuation procedures. Although the Valuation Procedures are designed to value a security at the price the Fund may reasonably expect to receive upon the security's sale in an orderly transaction, there can be no assurance that any fair value determination thereunder would, in fact, approximate the amount that the Fund would actually realize upon the sale of the security or the price at which the security would trade if a reliable market price were readily available. During the year ended October 31, 2023, there were no material changes to the fair value methodologies.
Securities which may be valued in this manner include, but are not limited to: (i) a security for which trading has been halted or suspended or
| 24 | MainStay Winslow Large Cap Growth Fund |
otherwise does not have a readily available market quotation on a given day; (ii) a debt security that has recently gone into default and for which there is not a current market quotation; (iii) a security of an issuer that has entered into a restructuring; (iv) a security that has been delisted from a national exchange; (v) a security subject to trading collars for which no or limited trading takes place; and (vi) a security whose principal market has been temporarily closed at a time when, under normal conditions, it would be open. Securities valued in this manner are generally categorized as Level 2 or 3 in the hierarchy. No securities held by the Fund as of October 31, 2023, were fair valued in such a manner.
Certain securities held by the Fund may principally trade in foreign markets. Events may occur between the time the foreign markets close and the time at which the Fund's NAVs are calculated. These events may include, but are not limited to, situations relating to a single issuer in a market sector, significant fluctuations in U.S. or foreign markets, natural disasters, armed conflicts, governmental actions or other developments not tied directly to the securities markets. Should the Valuation Designee conclude that such events may have affected the accuracy of the last price of such securities reported on the local foreign market, the Valuation Designee may, pursuant to the Valuation Procedures, adjust the value of the local price to reflect the estimated impact on the price of such securities as a result of such events. In this instance, securities are generally categorized as Level 3 in the hierarchy. Additionally, certain foreign equity securities are also fair valued whenever the movement of a particular index exceeds certain thresholds. In such cases, the securities are fair valued by applying factors provided by a third-party vendor in accordance with the Valuation Procedures and are generally categorized as Level 2 in the hierarchy. No foreign equity securities held by the Fund as of October 31, 2023 were fair valued in such a manner.
Equity securities, rights and warrants, if applicable, are valued at the last quoted sales prices as of the close of regular trading on the relevant exchange on each valuation date. Securities that are not traded on the valuation date are valued at the mean of the last quoted bid and ask prices. Prices are normally taken from the principal market in which each security trades. These securities are generally categorized as Level 1 in the hierarchy.
Investments in mutual funds, including money market funds, are valued at their respective NAVs at the close of business each day on the valuation date. These securities are generally categorized as Level 1 in the hierarchy.
Temporary cash investments acquired in excess of 60 days to maturity at the time of purchase are valued using the latest bid prices or using valuations based on a matrix system (which considers such factors as security prices, yields, maturities and ratings), both as furnished by independent pricing services. Temporary cash investments that mature in 60 days or less at the time of purchase ("Short-Term Investments") are valued using the amortized cost method of valuation, unless the use of such method would be inappropriate. The amortized cost method involves valuing a security at its cost on the date of purchase and thereafter assuming a constant amortization to maturity of the difference between
such cost and the value on maturity date. Amortized cost approximates the current fair value of a security. Securities valued using the amortized cost method are not valued using quoted prices in an active market and are generally categorized as Level 2 in the hierarchy.
The information above is not intended to reflect an exhaustive list of the methodologies that may be used to value portfolio investments. The Valuation Procedures permit the use of a variety of valuation methodologies in connection with valuing portfolio investments. The methodology used for a specific type of investment may vary based on the market data available or other considerations. The methodologies summarized above may not represent the specific means by which portfolio investments are valued on any particular business day.
(B) Income Taxes. The Fund's policy is to comply with the requirements of the Internal Revenue Code of 1986, as amended (the “Internal Revenue Code”), applicable to regulated investment companies and to distribute all of its taxable income to the shareholders of the Fund within the allowable time limits.
The Manager evaluates the Fund’s tax positions to determine if the tax positions taken meet the minimum recognition threshold in connection with accounting for uncertainties in income tax positions taken or expected to be taken for the purposes of measuring and recognizing tax liabilities in the financial statements. Recognition of tax benefits of an uncertain tax position is permitted only to the extent the position is “more likely than not” to be sustained assuming examination by taxing authorities. The Manager analyzed the Fund's tax positions taken on federal, state and local income tax returns for all open tax years (for up to three tax years) and has concluded that no provisions for federal, state and local income tax are required in the Fund's financial statements. The Fund's federal, state and local income tax and federal excise tax returns for tax years for which the applicable statutes of limitations have not expired are subject to examination by the Internal Revenue Service and state and local departments of revenue.
(C) Dividends and Distributions to Shareholders. Dividends and distributions are recorded on the ex-dividend date. The Fund intends to declare and pay dividends from net investment income and distributions from net realized capital and currency gains, if any, at least annually. Unless a shareholder elects otherwise, all dividends and distributions are reinvested at NAV in the same class of shares of the Fund. Dividends and distributions to shareholders are determined in accordance with federal income tax regulations and may differ from determinations using GAAP.
(D) Security Transactions and Investment Income. The Fund records security transactions on the trade date. Realized gains and losses on security transactions are determined using the identified cost method. Dividend income is recognized on the ex-dividend date, net of any foreign tax withheld at the source, and interest income is accrued as earned using the effective interest rate method. Distributions received from real estate investment trusts may be classified as dividends, capital gains and/or return of capital.
Notes to Financial Statements (continued)
Investment income and realized and unrealized gains and losses on investments of the Fund are allocated pro rata to the separate classes of shares based upon their relative net assets on the date the income is earned or realized and unrealized gains and losses are incurred.
(E) Expenses. Expenses of the Trust are allocated to the individual Funds in proportion to the net assets of the respective Funds when the expenses are incurred, except where direct allocations of expenses can be made. Expenses (other than transfer agent expenses and fees incurred under the shareholder services plans and/or the distribution plans further discussed in Note 3(B)) are allocated to separate classes of shares pro rata based upon their relative net assets on the date the expenses are incurred. The expenses borne by the Fund, including those of related parties to the Fund, are shown in the Statement of Operations.
Additionally, the Fund may invest in mutual funds, which are subject to management fees and other fees that may cause the costs of investing in mutual funds to be greater than the costs of owning the underlying securities directly. These indirect expenses of mutual funds are not included in the amounts shown as expenses in the Statement of Operations or in the expense ratios included in the Financial Highlights.
(F) Use of Estimates. In preparing financial statements in conformity with GAAP, the Manager makes estimates and assumptions that affect the reported amounts and disclosures in the financial statements. Actual results could differ from those estimates and assumptions.
(G) Foreign Currency Transactions. The Fund's books and records are maintained in U.S. dollars. Prices of securities denominated in foreign currency amounts are translated into U.S. dollars at the mean between the buying and selling rates last quoted by any major U.S. bank at the following dates:
(i) market value of investment securities, other assets and liabilities— at the valuation date; and
(ii) purchases and sales of investment securities, income and expenses—at the date of such transactions.
The assets and liabilities that are denominated in foreign currency amounts are presented at the exchange rates and market values at the close of the period. The realized and unrealized changes in net assets arising from fluctuations in exchange rates and market prices of securities are not separately presented.
Net realized gain (loss) on foreign currency transactions represents net currency gains or losses realized as a result of differences between the amounts of securities sale proceeds or purchase cost, dividends, interest and withholding taxes as recorded on the Fund's books, and the U.S. dollar equivalent amount actually received or paid. Net currency gains or losses from valuing such foreign currency denominated assets and liabilities, other than investments at valuation date exchange rates, are reflected in unrealized foreign exchange gains or losses.
(H) Securities Lending. In order to realize additional income, the Fund may engage in securities lending, subject to the limitations set forth in the 1940 Act and relevant guidance by the staff of the Securities and Exchange Commission (“SEC”). If the Fund engages in securities lending, the Fund will lend through its custodian, JPMorgan Chase Bank, N.A., ("JPMorgan"), acting as securities lending agent on behalf of the Fund. Under the current arrangement, JPMorgan will manage the Fund's collateral in accordance with the securities lending agency agreement between the Fund and JPMorgan, and indemnify the Fund against counterparty risk. The loans will be collateralized by cash (which may be invested in a money market fund) and/or non-cash collateral (which may include U.S. Treasury securities and/or U.S. government agency securities issued or guaranteed by the United States government or its agencies or instrumentalities) at least equal at all times to the market value of the securities loaned. Non-cash collateral held at year end is segregated and cannot be transferred by the Fund. The Fund bears the risk of delay in recovery of, or loss of rights in, the securities loaned. The Fund may also record a realized gain or loss on securities deemed sold due to a borrower’s inability to return securities on loan. The Fund bears the risk of any loss on investment of cash collateral. The Fund will receive compensation for lending its securities in the form of fees or it will retain a portion of interest earned on the investment of any cash collateral. The Fund will also continue to receive interest and dividends on the securities loaned and any gain or loss in the market price of the securities loaned that may occur during the term of the loan will be for the account of the Fund. Income earned from securities lending activities, if any, is reflected in the Statement of Operations. Securities on loan as of October 31, 2023, are shown in the Portfolio of Investments.
(I) Indemnifications. Under the Trust’s organizational documents, its officers and trustees are indemnified against certain liabilities that may arise out of performance of their duties to the Trust. Additionally, in the normal course of business, the Fund enters into contracts with third-party service providers that contain a variety of representations and warranties and that may provide general indemnifications. The Fund's maximum exposure under these arrangements is unknown, as this would involve future claims that may be made against the Fund that have not yet occurred. The Manager believes that the risk of loss in connection with these potential indemnification obligations is remote. However, there can be no assurance that material liabilities related to such obligations will not arise in the future, which could adversely impact the Fund.
Note 3–Fees and Related Party Transactions
(A) Manager and Subadvisor. New York Life Investments, a registered investment adviser and an indirect, wholly-owned subsidiary of New York Life Insurance Company ("New York Life"), serves as the Fund’s Manager, pursuant to an Amended and Restated Management Agreement (“Management Agreement”). The Manager provides offices, conducts clerical, recordkeeping and bookkeeping services and keeps most of the financial and accounting records required to be maintained by the Fund. Except for the portion of salaries and expenses that are the responsibility of the Fund, the Manager pays the salaries and expenses of all personnel
| 26 | MainStay Winslow Large Cap Growth Fund |
affiliated with the Fund and certain operational expenses of the Fund. The Fund reimburses New York Life Investments in an amount equal to the portion of the compensation of the Chief Compliance Officer attributable to the Fund. Winslow Capital Management, LLC. (“Winslow” or the “Subadvisor”), a registered investment adviser, serves as the Subadvisor to the Fund and is responsible for the day-to-day portfolio management of the Fund. Pursuant to the terms of a Subadvisory Agreement ("Subadvisory Agreement") between New York Life Investments and Winslow, New York Life Investments pays for the services of the Subadvisor.
Pursuant to the Management Agreement, the Fund pays the Manager a monthly fee for the services performed and the facilities furnished at an annual rate of the Fund’s average daily net assets as follows: 0.75% up to $500 million; 0.725% from $500 million to $750 million; 0.71% from $750 million to $1 billion; 0.70% from $1 billion to $2 billion; 0.66% from $2 billion to $3 billion; 0.61% from $3 billion to $7 billion; 0.585% from $7 billion to $9 billion; and 0.575% on assets over $9 billion. During the year ended October 31, 2023, the effective management fee rate was 0.62% of the Fund’s average daily net assets, exclusive of any applicable waivers/reimbursements.
New York Life Investments has contractually agreed to waive a portion of its management fee so that the management fee does not exceed 0.55% of the Fund’s average daily net assets from $11 billion to $13 billion; and 0.525% of the Fund’s average daily net assets over $13 billion. This agreement will remain in effect until February 28, 2024, and shall renew automatically for one-year terms unless New York Life Investments provides written notice of termination prior to the start of the next term or upon approval of the Board.
New York Life Investments has also contractually agreed to waive fees and/or reimburse expenses so that Total Annual Fund Operating Expenses (excluding taxes, interest, litigation, extraordinary expenses, brokerage and other transaction expenses relating to the purchase and sale of portfolio investments, and acquired (underlying) fund fees and expenses) of Class I shares do not exceed 0.88% of the Fund’s average daily net assets. New York Life Investments has also contractually agreed to waive fees and/or reimburse expenses so that Total Annual Fund Operating Expenses (excluding taxes, interest, litigation, extraordinary expenses, brokerage and other transaction expenses relating to the purchase or sale of portfolio investments, and acquired (underlying) fund fees and expenses) of Class R6 do not exceed those of Class I. These agreements will remain in effect until February 28, 2024, and shall renew automatically for one-year terms unless New York Life Investments provides written notice of termination prior to the start of the next term or upon approval of the Board.
Additionally, New York Life Investments has agreed to further voluntarily waive fees and/or reimburse expenses of the appropriate class of the Fund so that Total Annual Fund Operating Expenses (excluding taxes, interest, litigation, extraordinary expenses, brokerage and other transaction expenses relating to the purchase and sale of portfolio investments, and acquired (underlying) fund fees and expenses) of
Class R1 shares do not exceed 0.95%. These voluntary waivers or reimbursements may be discontinued at any time without notice.
During the year ended October 31, 2023, New York Life Investments earned fees from the Fund in the amount of $74,084,253 and waived fees and/or reimbursed expenses in the amount of $245,068 and paid the Subadvisor fees in the amount of $28,878,294.
JPMorgan provides sub-administration and sub-accounting services to the Fund pursuant to an agreement with New York Life Investments. These services include calculating the daily NAVs of the Fund, maintaining the general ledger and sub-ledger accounts for the calculation of the Fund's NAVs, and assisting New York Life Investments in conducting various aspects of the Fund's administrative operations. For providing these services to the Fund, JPMorgan is compensated by New York Life Investments.
Pursuant to an agreement between the Trust and New York Life Investments, New York Life Investments is responsible for providing or procuring certain regulatory reporting services for the Fund. The Fund will reimburse New York Life Investments for the actual costs incurred by New York Life Investments in connection with providing or procuring these services for the Fund.
(B) Distribution and Service Fees. The Trust, on behalf of the Fund, has entered into a distribution agreement with NYLIFE Distributors LLC (the “Distributor”), an affiliate of New York Life Investments. The Fund has adopted distribution plans (the “Plans”) in accordance with the provisions of Rule 12b-1 under the 1940 Act.
Pursuant to the Class A, Investor Class and Class R2 Plans, the Distributor receives a monthly fee from the Class A, Investor Class and Class R2 shares at an annual rate of 0.25% of the average daily net assets of the Class A, Investor Class and Class R2 shares for distribution and/or service activities as designated by the Distributor. Pursuant to the Class B and Class C Plans, Class B and Class C shares pay the Distributor a monthly distribution fee at an annual rate of 0.75% of the average daily net assets of the Class B and Class C shares, along with a service fee at an annual rate of 0.25% of the average daily net assets of the Class B and Class C shares, for a total 12b-1 fee of 1.00%. Pursuant to the Class R3 and SIMPLE Class Plans, Class R3 and SIMPLE Class shares pay the Distributor a monthly distribution fee at an annual rate of 0.25% of the average daily net assets of the Class R3 and SIMPLE Class shares, along with a service fee at an annual rate of 0.25% of the average daily net assets of the Class R3 and SIMPLE Class shares, for a total 12b-1 fee of 0.50%. Class I, Class R1 and Class R6 shares are not subject to a distribution and/or service fee.
The Plans provide that the distribution and service fees are payable to the Distributor regardless of the amounts actually expended by the Distributor for distribution of the Fund's shares and service activities.
In accordance with the Shareholder Services Plans for the Class R1, Class R2 and Class R3 shares, the Manager has agreed to provide, through its affiliates or independent third parties, various shareholder and
Notes to Financial Statements (continued)
administrative support services to shareholders of the Class R1, Class R2 and Class R3 shares. For its services, the Manager, its affiliates or independent third-party service providers are entitled to a shareholder service fee accrued daily and paid monthly at an annual rate of 0.10% of the average daily net assets of the Class R1, Class R2 and Class R3 shares. This is in addition to any fees paid under the Class R2 and Class R3 Plans.
During the year ended October 31, 2023, shareholder service fees incurred by the Fund were as follows:
| |
| Class R1 | $810,302 |
| Class R2 | 110,384 |
| Class R3 | 37,395 |
(C) Sales Charges. The Fund was advised by the Distributor that the amount of initial sales charges retained on sales of Class A and Investor Class shares during the year ended October 31, 2023, were $125,551 and $19,482, respectively.
The Fund was also advised that the Distributor retained CDSCs on redemptions of Class A, Class B and Class C shares during the year ended October 31, 2023, of $8,131, $111 and $1,985, respectively.
(D) Transfer, Dividend Disbursing and Shareholder Servicing Agent. NYLIM Service Company LLC, an affiliate of New York Life Investments, is the Fund's transfer, dividend disbursing and shareholder servicing agent pursuant to an agreement between NYLIM Service Company LLC and the Trust. NYLIM Service Company LLC has entered into an agreement with SS&C Global Investor & Distribution Solutions, Inc. ("SS&C"), pursuant to which SS&C performs certain transfer agent services on behalf of NYLIM Service Company LLC. New York Life Investments has contractually agreed to limit the transfer agency expenses charged to the Fund’s share classes to a maximum of 0.35% of that share class’s average daily net assets on an annual basis after deducting any applicable Fund or class-level expense reimbursement or small account fees. This agreement will remain in effect until February 28, 2024, and shall renew automatically for one-year terms unless New York Life Investments provides written notice of termination prior to the start of the next term or upon approval of the Board. During the year ended October 31, 2023, transfer agent expenses incurred by the Fund
and any reimbursements, pursuant to the aforementioned Transfer Agency expense limitation agreement, were as follows:
| Class | Expense | Waived |
| Class A | $1,053,807 | $— |
| Investor Class | 197,284 | — |
| Class B | 24,326 | — |
| Class C | 131,468 | — |
| Class I | 5,859,551 | — |
| Class R1 | 749,951 | — |
| Class R2 | 102,406 | — |
| Class R3 | 34,851 | — |
| Class R6 | 137,647 | — |
| SIMPLE Class | 319 | — |
(E) Small Account Fee. Shareholders with small accounts adversely impact the cost of providing transfer agency services. In an effort to reduce total transfer agency expenses, the Fund has implemented a small account fee on certain types of accounts. As described in the Fund's prospectus, certain shareholders with an account balance of less than $1,000 ($5,000 for Class A share accounts) are charged an annual per account fee of $20 (assessed semi-annually), the proceeds from which offset transfer agent fees as reflected in the Statement of Operations. This small account fee will not apply to certain types of accounts as described further in the Fund’s prospectus.
(F) Capital. As of October 31, 2023, New York Life and its affiliates beneficially held shares of the Fund with the values and percentages of net assets as follows:
Note 4-Federal Income Tax
As of October 31, 2023, the cost and unrealized appreciation (depreciation) of the Fund’s investment portfolio, including applicable derivative contracts and other financial instruments, as determined on a federal income tax basis, were as follows:
| | Federal Tax
Cost | Gross
Unrealized
Appreciation | Gross
Unrealized
(Depreciation) | Net
Unrealized
Appreciation/
(Depreciation) |
| Investments in Securities | $8,574,572,721 | $3,385,257,017 | $(88,920,772) | $3,296,336,245 |
As of October 31, 2023, the components of accumulated gain (loss) on a tax basis were as follows:
Ordinary
Income | Accumulated
Capital
and Other
Gain (Loss) | Other
Temporary
Differences | Unrealized
Appreciation
(Depreciation) | Total
Accumulated
Gain (Loss) |
| $172,974,004 | $985,387,892 | $— | $3,296,336,245 | $4,454,698,141 |
| 28 | MainStay Winslow Large Cap Growth Fund |
The difference between book-basis and tax-basis unrealized appreciation (depreciation) is primarily due to wash sale adjustments.
The following table discloses the current year reclassifications between total distributable earnings (loss) and additional paid-in capital arising from permanent differences; net assets as of October 31, 2023 were not affected.
| | Total
Distributable
Earnings (Loss) | Additional
Paid-In
Capital |
| | $(108,617,957) | $108,617,957 |
The reclassifications for the Fund are primarily due to equalization.
During the years ended October 31, 2023 and October 31, 2022, the tax character of distributions paid as reflected in the Statements of Changes in Net Assets was as follows:
| | 2023 | 2022 |
| Distributions paid from: | | |
| Ordinary Income | $ 13,433,752 | $ 549,987,364 |
| Long-Term Capital Gains | 1,292,659,969 | 2,601,876,295 |
| Total | $1,306,093,721 | $3,151,863,659 |
Note 5–Custodian
JPMorgan is the custodian of cash and securities held by the Fund. Custodial fees are charged to the Fund based on the Fund's net assets and/or the market value of securities held by the Fund and the number of certain transactions incurred by the Fund.
Note 6–Line of Credit
The Fund and certain other funds managed by New York Life Investments maintain a line of credit with a syndicate of banks in order to secure a source of funds for temporary purposes to meet unanticipated or excessive redemption requests.
Effective July 25, 2023, under the credit agreement (the “Credit Agreement”), the aggregate commitment amount is $600,000,000 with an additional uncommitted amount of $100,000,000. The commitment fee is an annual rate of 0.15% of the average commitment amount payable quarterly, regardless of usage, to JPMorgan, who serves as the agent to the syndicate. The commitment fee is allocated among the Fund and certain other funds managed by New York Life Investments based upon their respective net assets and other factors. Interest on any revolving credit loan is charged based upon the Federal Funds Rate, Daily Simple Secured Overnight Financing Rate ("SOFR") + 0.10%, or the Overnight Bank Funding Rate, whichever is higher. The Credit Agreement expires on July 23, 2024, although the Fund, certain other funds managed by New York Life Investments and the syndicate of banks may renew the Credit Agreement for an additional year on the same or different terms or enter into a credit agreement with a different syndicate of banks. Prior to July 25, 2023, the aggregate commitment amount and the commitment fee were the same as those under the current Credit
Agreement. During the year ended October 31, 2023, there were no borrowings made or outstanding with respect to the Fund under the Credit Agreement.
Note 7–Interfund Lending Program
Pursuant to an exemptive order issued by the SEC, the Fund, along with certain other funds managed by New York Life Investments, may participate in an interfund lending program. The interfund lending program provides an alternative credit facility that permits the Fund and certain other funds managed by New York Life Investments to lend or borrow money for temporary purposes directly to or from one another, subject to the conditions of the exemptive order. During the year ended October 31, 2023, there were no interfund loans made or outstanding with respect to the Fund.
Note 8–Purchases and Sales of Securities (in 000’s)
During the year ended October 31, 2023, purchases and sales of securities, other than short-term securities, were $9,662,992 and $11,192,716, respectively.
Note 9–Capital Share Transactions
Transactions in capital shares for the years ended October 31, 2023 and October 31, 2022, were as follows:
| Class A | Shares | Amount |
| Year ended October 31, 2023: | | |
| Shares sold | 15,983,106 | $ 129,616,235 |
| Shares issued to shareholders in reinvestment of distributions | 17,289,578 | 125,347,772 |
| Shares redeemed | (29,604,181) | (235,655,363) |
| Net increase (decrease) in shares outstanding before conversion | 3,668,503 | 19,308,644 |
| Shares converted into Class A (See Note 1) | 1,268,493 | 10,288,730 |
| Shares converted from Class A (See Note 1) | (174,362) | (1,381,429) |
| Net increase (decrease) | 4,762,634 | $ 28,215,945 |
| Year ended October 31, 2022: | | |
| Shares sold | 16,625,935 | $ 171,252,843 |
| Shares issued to shareholders in reinvestment of distributions | 28,541,804 | 330,514,092 |
| Shares redeemed | (30,234,090) | (288,975,973) |
| Net increase (decrease) in shares outstanding before conversion | 14,933,649 | 212,790,962 |
| Shares converted into Class A (See Note 1) | 906,871 | 9,104,942 |
| Shares converted from Class A (See Note 1) | (118,111) | (1,203,240) |
| Net increase (decrease) | 15,722,409 | $ 220,692,664 |
| |
Notes to Financial Statements (continued)
| Investor Class | Shares | Amount |
| Year ended October 31, 2023: | | |
| Shares sold | 594,759 | $ 4,639,901 |
| Shares issued to shareholders in reinvestment of distributions | 1,231,575 | 8,608,707 |
| Shares redeemed | (2,052,819) | (15,881,811) |
| Net increase (decrease) in shares outstanding before conversion | (226,485) | (2,633,203) |
| Shares converted into Investor Class (See Note 1) | 193,762 | 1,546,555 |
| Shares converted from Investor Class (See Note 1) | (599,739) | (4,736,436) |
| Net increase (decrease) | (632,462) | $ (5,823,084) |
| Year ended October 31, 2022: | | |
| Shares sold | 766,345 | $ 7,074,265 |
| Shares issued to shareholders in reinvestment of distributions | 2,020,849 | 22,694,134 |
| Shares redeemed | (1,515,150) | (12,951,150) |
| Net increase (decrease) in shares outstanding before conversion | 1,272,044 | 16,817,249 |
| Shares converted into Investor Class (See Note 1) | 122,735 | 1,084,686 |
| Shares converted from Investor Class (See Note 1) | (458,718) | (4,837,943) |
| Net increase (decrease) | 936,061 | $ 13,063,992 |
| |
| Class B | Shares | Amount |
| Year ended October 31, 2023: | | |
| Shares sold | 13,930 | $ 64,994 |
| Shares issued to shareholders in reinvestment of distributions | 401,754 | 1,767,718 |
| Shares redeemed | (298,158) | (1,460,234) |
| Net increase (decrease) in shares outstanding before conversion | 117,526 | 372,478 |
| Shares converted from Class B (See Note 1) | (665,391) | (3,230,081) |
| Net increase (decrease) | (547,865) | $ (2,857,603) |
| Year ended October 31, 2022: | | |
| Shares sold | 32,973 | $ 228,304 |
| Shares issued to shareholders in reinvestment of distributions | 739,284 | 5,677,697 |
| Shares redeemed | (322,522) | (2,010,001) |
| Net increase (decrease) in shares outstanding before conversion | 449,735 | 3,896,000 |
| Shares converted from Class B (See Note 1) | (539,254) | (3,347,320) |
| Net increase (decrease) | (89,519) | $ 548,680 |
| |
| Class C | Shares | Amount |
| Year ended October 31, 2023: | | |
| Shares sold | 907,854 | $ 4,372,020 |
| Shares issued to shareholders in reinvestment of distributions | 1,816,650 | 7,956,928 |
| Shares redeemed | (3,484,405) | (16,834,402) |
| Net increase (decrease) in shares outstanding before conversion | (759,901) | (4,505,454) |
| Shares converted from Class C (See Note 1) | (399,925) | (1,981,428) |
| Net increase (decrease) | (1,159,826) | $ (6,486,882) |
| Year ended October 31, 2022: | | |
| Shares sold | 1,531,291 | $ 10,262,438 |
| Shares issued to shareholders in reinvestment of distributions | 2,934,389 | 22,448,071 |
| Shares redeemed | (3,524,833) | (22,771,338) |
| Net increase (decrease) in shares outstanding before conversion | 940,847 | 9,939,171 |
| Shares converted from Class C (See Note 1) | (300,459) | (1,784,533) |
| Net increase (decrease) | 640,388 | $ 8,154,638 |
| |
| Class I | Shares | Amount |
| Year ended October 31, 2023: | | |
| Shares sold | 87,063,257 | $ 813,021,273 |
| Shares issued to shareholders in reinvestment of distributions | 72,242,661 | 614,062,619 |
| Shares redeemed | (178,838,638) | (1,685,015,501) |
| Net increase (decrease) in shares outstanding before conversion | (19,532,720) | (257,931,609) |
| Shares converted into Class I (See Note 1) | 157,330 | 1,466,305 |
| Shares converted from Class I (See Note 1) | (201,120) | (1,891,775) |
| Net increase (decrease) | (19,576,510) | $ (258,357,079) |
| Year ended October 31, 2022: | | |
| Shares sold | 206,773,027 | $ 2,304,009,295 |
| Shares issued to shareholders in reinvestment of distributions | 104,600,432 | 1,391,185,741 |
| Shares redeemed | (166,738,192) | (1,848,655,608) |
| Net increase (decrease) in shares outstanding before conversion | 144,635,267 | 1,846,539,428 |
| Shares converted into Class I (See Note 1) | 101,332 | 1,181,298 |
| Shares converted from Class I (See Note 1) | (21,339) | (189,065) |
| Net increase (decrease) | 144,715,260 | $ 1,847,531,661 |
| |
| 30 | MainStay Winslow Large Cap Growth Fund |
| Class R1 | Shares | Amount |
| Year ended October 31, 2023: | | |
| Shares sold | 18,440,679 | $ 167,960,802 |
| Shares issued to shareholders in reinvestment of distributions | 10,722,851 | 86,318,947 |
| Shares redeemed | (19,868,278) | (178,889,345) |
| Net increase (decrease) in shares outstanding before conversion | 9,295,252 | 75,390,404 |
| Shares converted into Class R1 (See Note 1) | 7,150 | 60,468 |
| Shares converted from Class R1 (See Note 1) | (23,920) | (240,876) |
| Net increase (decrease) | 9,278,482 | $ 75,209,996 |
| Year ended October 31, 2022: | | |
| Shares sold | 12,545,711 | $ 128,752,543 |
| Shares issued to shareholders in reinvestment of distributions | 18,146,768 | 230,101,018 |
| Shares redeemed | (24,117,145) | (264,354,356) |
| Net increase (decrease) in shares outstanding before conversion | 6,575,334 | 94,499,205 |
| Shares converted from Class R1 (See Note 1) | (856) | (8,825) |
| Net increase (decrease) | 6,574,478 | $ 94,490,380 |
| |
| Class R2 | Shares | Amount |
| Year ended October 31, 2023: | | |
| Shares sold | 2,296,843 | $ 17,881,375 |
| Shares issued to shareholders in reinvestment of distributions | 1,391,973 | 9,938,687 |
| Shares redeemed | (3,601,858) | (28,456,267) |
| Net increase (decrease) in shares outstanding before conversion | 86,958 | (636,205) |
| Shares converted from Class R2 (See Note 1) | (2,389) | (17,227) |
| Net increase (decrease) | 84,569 | $ (653,432) |
| Year ended October 31, 2022: | | |
| Shares sold | 2,804,293 | $ 27,795,594 |
| Shares issued to shareholders in reinvestment of distributions | 2,370,271 | 27,115,902 |
| Shares redeemed | (4,522,072) | (46,339,701) |
| Net increase (decrease) | 652,492 | $ 8,571,795 |
| |
| Class R3 | Shares | Amount |
| Year ended October 31, 2023: | | |
| Shares sold | 922,756 | $ 6,449,354 |
| Shares issued to shareholders in reinvestment of distributions | 870,215 | 5,473,601 |
| Shares redeemed | (2,412,610) | (16,649,602) |
| Net increase (decrease) | (619,639) | $ (4,726,647) |
| Year ended October 31, 2022: | | |
| Shares sold | 904,543 | $ 7,708,409 |
| Shares issued to shareholders in reinvestment of distributions | 1,354,080 | 13,919,943 |
| Shares redeemed | (1,551,868) | (13,129,182) |
| Net increase (decrease) | 706,755 | $ 8,499,170 |
| |
| Class R6 | Shares | Amount |
| Year ended October 31, 2023: | | |
| Shares sold | 63,800,380 | $ 606,984,764 |
| Shares issued to shareholders in reinvestment of distributions | 40,759,793 | 351,349,412 |
| Shares redeemed | (109,697,203) | (1,025,523,675) |
| Net increase (decrease) in shares outstanding before conversion | (5,137,030) | (67,189,499) |
| Shares converted into Class R6 (See Note 1) | 11,946 | 117,194 |
| Net increase (decrease) | (5,125,084) | $ (67,072,305) |
| Year ended October 31, 2022: | | |
| Shares sold | 68,050,104 | $ 753,843,263 |
| Shares issued to shareholders in reinvestment of distributions | 64,620,416 | 871,083,204 |
| Shares redeemed | (66,095,061) | (730,228,554) |
| Net increase (decrease) | 66,575,459 | $ 894,697,913 |
| |
| SIMPLE Class | Shares | Amount |
| Year ended October 31, 2023: | | |
| Shares sold | 13,600 | $ 102,611 |
| Shares issued to shareholders in reinvestment of distributions | 4,458 | 30,895 |
| Shares redeemed | (1,770) | (12,674) |
| Net increase (decrease) | 16,288 | $ 120,832 |
| Year ended October 31, 2022: | | |
| Shares sold | 22,996 | $ 211,112 |
| Shares issued to shareholders in reinvestment of distributions | 1,475 | 16,490 |
| Shares redeemed | (826) | (7,320) |
| Net increase (decrease) | 23,645 | $ 220,282 |
Note 10–Other Matters
As of the date of this report, the Fund faces a heightened level of risk associated with current uncertainty, volatility and state of economies, financial markets, rising interest rates, and labor and health conditions around the world. Events such as war, acts of terrorism, recessions, rapid inflation, the imposition of international sanctions, earthquakes, hurricanes, epidemics and pandemics and other unforeseen natural or
Notes to Financial Statements (continued)
human disasters may have broad adverse social, political and economic effects on the global economy, which could negatively impact the value of the Fund's investments. Developments that disrupt global economies and financial markets may magnify factors that affect the Fund's performance.
Note 11–Subsequent Events
In connection with the preparation of the financial statements of the Fund as of and for the year ended October 31, 2023, events and transactions subsequent to October 31, 2023, through the date the financial statements were issued, have been evaluated by the Manager for possible adjustment and/or disclosure. No subsequent events requiring financial statement adjustment or disclosure have been identified.
| 32 | MainStay Winslow Large Cap Growth Fund |
Report of Independent Registered Public Accounting Firm
To the Shareholders of the Fund and Board of Trustees
The MainStay Funds:
Opinion on the Financial Statements
We have audited the accompanying statement of assets and liabilities of MainStay Winslow Large Cap Growth Fund (the Fund), one of the funds constituting The MainStay Funds, including the portfolio of investments, as of October 31, 2023, the related statement of operations for the year then ended, the statements of changes in net assets for each of the years in the two-year period then ended, and the related notes (collectively, the financial statements) and the financial highlights for each of the years or periods in the five-year period then ended. In our opinion, the financial statements and financial highlights present fairly, in all material respects, the financial position of the Fund as of October 31, 2023, the results of its operations for the year then ended, the changes in its net assets for each of the years in the two-year period then ended, and the financial highlights for each of the years or periods in the five-year period then ended, in conformity with U.S. generally accepted accounting principles.
Basis for Opinion
These financial statements and financial highlights are the responsibility of the Fund's management. Our responsibility is to express an opinion on these financial statements and financial highlights based on our audits. We are a public accounting firm registered with the Public Company Accounting Oversight Board (United States) (PCAOB) and are required to be independent with respect to the Fund in accordance with the U.S. federal securities laws and the applicable rules and regulations of the Securities and Exchange Commission and the PCAOB.
We conducted our audits in accordance with the standards of the PCAOB. Those standards require that we plan and perform the audit to obtain reasonable assurance about whether the financial statements and financial highlights are free of material misstatement, whether due to error or fraud. Our audits included performing procedures to assess the risks of material misstatement of the financial statements and financial highlights, whether due to error or fraud, and performing procedures that respond to those risks. Such procedures included examining, on a test basis, evidence regarding the amounts and disclosures in the financial statements and financial highlights. Such procedures also included confirmation of securities owned as of October 31, 2023, by correspondence with the custodians, the transfer agent and brokers; when replies were not received from brokers, we performed other auditing procedures. Our audits also included evaluating the accounting principles used and significant estimates made by management, as well as evaluating the overall presentation of the financial statements and financial highlights. We believe that our audits provide a reasonable basis for our opinion.

We have served as the auditor of one or more New York Life Investment Management investment companies since 2003.
Philadelphia, Pennsylvania
December 22, 2023
Federal Income Tax Information
(Unaudited)
The Fund is required under the Internal Revenue Code to advise shareholders in a written statement as to the federal tax status of dividends paid by the Fund during such fiscal years. Accordingly, the Fund paid $1,289,885,332 as long term capital gain distributions.
For the fiscal year ended October 31, 2023, the Fund designated approximately $13,433,752 under the Internal Revenue Code as qualified dividend income eligible for reduced tax rates.
The dividends paid by the Fund during the fiscal year ended October 31, 2023 should be multiplied by 100.00% to arrive at the amount eligible for the corporate dividend-received deduction.
In February 2024, shareholders will receive an IRS Form 1099-DIV or substitute Form 1099, which will show the federal tax status of the distributions received by shareholders in calendar year 2023. The amounts that will be reported on such 1099-DIV or substitute Form 1099 will be the amounts you are to use on your federal income tax return and will differ from the amounts which we must report for the Fund's fiscal year ended October 31, 2023.
Proxy Voting Policies and Procedures and Proxy Voting Record
The Fund is required to file with the SEC its proxy voting record for the 12-month period ending June 30 on Form N-PX. A description of the policies and procedures that are used to vote proxies relating to portfolio securities of the Fund is available free of charge upon request by calling 800-624-6782 or visiting the SEC’s website at www.sec.gov. The most recent Form N-PX or proxy voting record is available free of charge upon request by calling 800-624-6782; visiting newyorklifeinvestments.com; or visiting the SEC’s website at www.sec.gov.
Shareholder Reports and Quarterly Portfolio Disclosure
The Fund is required to file its complete schedule of portfolio holdings with the SEC 60 days after its first and third fiscal quarter on Form N-PORT. The Fund's holdings report is available free of charge upon request by calling New York Life Investments at 800-624-6782.
| 34 | MainStay Winslow Large Cap Growth Fund |
Board of Trustees and Officers (Unaudited)
The Trustees and officers of the Fund are listed below. The Board oversees the MainStay Group of Funds (which consists of MainStay Funds and MainStay Funds Trust), MainStay VP Funds Trust, MainStay MacKay DefinedTerm Municipal Opportunities Fund, MainStay CBRE Global Infrastructure Megatrends Term Fund, the Manager and the Subadvisors, and elects the officers of the Funds who are responsible for the day-to-day operations of the Fund. Information pertaining to the Trustees and officers is set forth below. Each Trustee serves until his or her successor is elected and qualified or until his or her resignation, death or
removal. Under the Board’s retirement policy, unless an exception is made, a Trustee must tender his or her resignation by the end of the calendar year during which he or she reaches the age of 75. Officers are elected annually by the Board. The business address of each Trustee and officer listed below is 51 Madison Avenue, New York, New York 10010. A majority of the Trustees are not “interested persons” (as defined by the 1940 Act and rules adopted by the SEC thereunder) of the Fund (“Independent Trustees”).
| | Name and
Year of Birth | Term of Office,
Position(s) Held and
Length of Service | Principal Occupation(s)
During Past Five Years | Number of
Portfolios in
Fund Complex
Overseen by
Trustee | Other Directorships
Held by Trustee |
| | | | | | |
| | Naïm Abou-Jaoudé*
1966 | MainStay Funds: Trustee
since 2023
MainStay Funds Trust:
Trustee since 2023 | Chief Executive Officer of New York Life Investment Management LLC (since 2023). Chief Executive Officer of Candriam (an affiliate of New York Life Investment Management LLC) (2007 to 2023). | 81 | MainStay VP Funds Trust:
Trustee since 2023 (31 portfolios);
MainStay MacKay DefinedTerm Municipal Opportunities Fund: Trustee
since 2023;
MainStay CBRE Global Infrastructure Megatrends Term Fund: Trustee
since 2023; and
New York Life Investment Management International (Chair) since 2015 |
| * | This Trustee is considered to be an “interested person” of the MainStay Group of Funds, MainStay VP Funds Trust, MainStay CBRE Global Infrastructure Megatrends Term Fund and MainStay MacKay DefinedTerm Municipal Opportunities Fund, within the meaning of the 1940 Act because of his affiliation with New York Life Investment Management LLC and Candriam, as described in detail above in the column entitled “Principal Occupation(s) During Past Five Years.” |
| | |
Board of Trustees and Officers (Unaudited) (continued)
| | Name and
Year of Birth | Term of Office,
Position(s) Held and
Length of Service | Principal Occupation(s)
During Past Five Years | Number of
Portfolios in
Fund Complex
Overseen by
Trustee | Other Directorships
Held by Trustee |
| | | | | | |
| | David H. Chow
1957 | MainStay Funds: Trustee since January 2016, Advisory Board Member (June 2015 to December 2015);MainStay Funds Trust:
Trustee since January 2016, Advisory Board Member (June 2015 to December 2015) | Founder and CEO, DanCourt Management, LLC (since 1999) | 81 | MainStay VP Funds Trust: Trustee since January 2016, Advisory Board Member (June 2015 to December 2015) (31 portfolios);
MainStay MacKay DefinedTerm Municipal Opportunities Fund: Trustee since January 2016, Advisory Board Member (June 2015 to December 2015);
MainStay CBRE Global Infrastructure Megatrends Term Fund: Trustee since 2021;
VanEck Vectors Group of Exchange-Traded Funds: Trustee since 2006 and Independent Chairman of the Board of Trustees from 2008 to 2022 (57 portfolios); and
Berea College of Kentucky: Trustee since 2009, Chair of the Investment Committee since 2018 |
| | Karen Hammond
1956 | MainStay Funds: Trustee since December 2021, Advisory Board Member (June 2021 to December 2021);MainStay Funds Trust:
Trustee since December 2021, Advisory Board Member (June 2021 to December 2021)
| Retired, Managing Director, Devonshire Investors (2007 to 2013); Senior Vice President, Fidelity Management & Research Co. (2005 to 2007); Senior Vice President and Corporate Treasurer, FMR Corp. (2003 to 2005); Chief Operating Officer, Fidelity Investments Japan (2001 to 2003) | 81 | MainStay VP Funds Trust: Trustee since December 2021, Advisory Board Member (June 2021 to December 2021) (31 portfolios);
MainStay MacKay DefinedTerm Municipal Opportunities Fund: Trustee since December 2021, Advisory Board Member (June 2021 to December 2021);
MainStay CBRE Global Infrastructure Megatrends Term Fund: Trustee since December 2021, Advisory Board Member (June 2021 to December 2021);
Two Harbors Investment Corp.: Director since 2018;
Rhode Island State Investment Commission: Member since 2017; and
Blue Cross Blue Shield of Rhode Island: Director since 2019 |
| | Susan B. Kerley
1951 | MainStay Funds: Chair since January 2017 and Trustee since 2007;MainStay Funds Trust:
Chair since January 2017 and Trustee since 1990*** | President, Strategic Management Advisors LLC (since 1990) | 81 | MainStay VP Funds Trust: Chair since January 2017 and Trustee since 2007 (31 portfolios)**;
MainStay MacKay DefinedTerm Municipal Opportunities Fund: Chair since January 2017 and Trustee since 2011;
MainStay CBRE Global Infrastructure Megatrends Term Fund: Trustee since June 2021; and
Legg Mason Partners Funds: Trustee since 1991 (45 portfolios) |
| 36 | MainStay Winslow Large Cap Growth Fund |
| | Name and
Year of Birth | Term of Office,
Position(s) Held and
Length of Service | Principal Occupation(s)
During Past Five Years | Number of
Portfolios in
Fund Complex
Overseen by
Trustee | Other Directorships
Held by Trustee |
| | | | | | |
| | Alan R. Latshaw
1951 | MainStay Funds: Trusteesince 2006;MainStay Funds Trust:
Trustee since 2007*** | Retired; Partner, Ernst & Young LLP (2002 to 2003); Partner, Arthur Andersen LLP (1989 to 2002); Consultant to the MainStay Funds Audit and Compliance Committee (2004 to 2006) | 81 | MainStay VP Funds Trust: Trustee since 2007 (31 portfolios)**;
MainStay MacKay DefinedTerm Municipal Opportunities Fund: Trustee since 2011; and
MainStay CBRE Global Infrastructure Megatrends Term Fund: Trustee since June 2021 |
| | Jacques P. Perold
1958 | MainStay Funds: Trustee since January 2016, Advisory Board Member (June 2015to December 2015);MainStay Funds Trust:
Trustee since January 2016, Advisory Board Member (June 2015 to December 2015) | Founder and Chief Executive Officer, CapShift Advisors LLC (since 2018); President, Fidelity Management & Research Company (2009 to 2014); President and Chief Investment Officer, Geode Capital Management, LLC (2001 to 2009) | 81 | MainStay VP Funds Trust: Trustee since January 2016, Advisory Board Member (June 2015 to December 2015) (31 portfolios);
MainStay MacKay DefinedTerm Municipal Opportunities Fund: Trustee since January 2016, Advisory Board Member (June 2015 to December 2015);
MainStay CBRE Global Infrastructure Megatrends Term Fund: Trustee since June 2021;
Allstate Corporation: Director since 2015; and
MSCI Inc.: Director since 2017 |
| | Richard S. Trutanic
1952 | MainStay Funds: Trustee since 1994;MainStay Funds Trust:
Trustee since 2007*** | Chairman and Chief Executive Officer, Somerset & Company (financial advisory firm) (since 2004); Managing Director, The Carlyle Group (private investment firm) (2002 to 2004); Senior Managing Director, Partner and Board Member, Groupe Arnault S.A. (private investment firm) (1999 to 2002) | 81 | MainStay VP Funds Trust: Trustee since 2007 (31 portfolios)**;
MainStay MacKay DefinedTerm Municipal Opportunities Fund: Trustee since 2011; and
MainStay CBRE Global Infrastructure Megatrends Term Fund: Trustee since June 2021 |
| ** | Includes prior service as a Director of MainStay VP Series Fund, Inc., the predecessor to MainStay VP Funds Trust. |
| *** | Includes prior service as a Director/Trustee of certain predecessor entities to MainStay Funds Trust. |
Board of Trustees and Officers (Unaudited) (continued)
| | Name and
Year of Birth | Position(s) Held and
Length of Service | Principal Occupation(s)
During Past Five Years | |
| | | | | |
| | Kirk C. Lehneis
1974 | President, MainStay Funds, MainStay Funds Trust (since 2017) | Chief Operating Officer and Senior Managing Director (since 2016), New York Life Investment Management LLC and New York Life Investment Management Holdings LLC; Member of the Board of Managers (since 2017) and Senior Managing Director (since 2018), NYLIFE Distributors LLC; Chairman of the Board and Senior Managing Director, NYLIM Service Company LLC (since 2017); Trustee, President and Principal Executive Officer of IndexIQ Trust, IndexIQ ETF Trust and IndexIQ Active ETF Trust (since 2018); President, MainStay CBRE Global Infrastructure Megatrends Term Fund (since 2021), MainStay MacKay DefinedTerm Municipal Opportunities Fund and MainStay VP Funds Trust (since 2017)**; Senior Managing Director, Global Product Development (2015 to 2016); Managing Director, Product Development (2010 to 2015), New York Life Investment Management LLC | |
| | Jack R. Benintende
1964 | Treasurer and Principal Financial and Accounting Officer, MainStay Funds (since 2007), MainStay Funds Trust (since 2009) | Managing Director, New York Life Investment Management LLC (since 2007); Treasurer and Principal Financial and Accounting Officer, MainStay CBRE Global Infrastructure Megatrends Term Fund (since 2021), MainStay MacKay DefinedTerm Municipal Opportunities Fund (since 2011) and MainStay VP Funds Trust (since 2007)**; and Assistant Treasurer, New York Life Investment Management Holdings LLC (2008 to 2012) | |
| | J. Kevin Gao
1967 | Secretary and Chief Legal Officer, MainStay Funds and MainStay Funds Trust (since 2010) | Managing Director and Associate General Counsel, New York Life Investment Management LLC (since 2010); Secretary and Chief Legal Officer, MainStay CBRE Global Infrastructure Megatrends Term Fund (since 2021), MainStay MacKay DefinedTerm Municipal Opportunities Fund (since 2011) and MainStay VP Funds Trust (since 2010)** | |
| | Kevin M. Gleason
1967 | Vice President and Chief Compliance Officer, MainStay Funds and MainStay Funds Trust (since June 2022) | Vice President and Chief Compliance Officer, IndexIQ Trust, IndexIQ ETF Trust and Index IQ Active ETF Trust (since June 2022); Vice President and Chief Compliance Officer, MainStay CBRE Global Infrastructure Megatrends Term Fund, MainStay VP Funds Trust and MainStay MacKay DefinedTerm Municipal Opportunities Fund (since June 2022); Senior Vice President, Voya Investment Management and Chief Compliance Officer, Voya Family of Funds (2012 to 2022) | |
| | Scott T. Harrington
1959 | Vice President— Administration, MainStay Funds (since 2005), MainStay Funds Trust (since 2009) | Managing Director, New York Life Investment Management LLC (including predecessor advisory organizations) (since 2000); Member of the Board of Directors, New York Life Trust Company (since 2009); Vice President—Administration, MainStay CBRE Global Infrastructure Megatrends Term Fund (since 2021), MainStay MacKay DefinedTerm Municipal Opportunities Fund (since 2011) and MainStay VP Funds Trust (since 2005)** | |
| * | The officers listed above are considered to be “interested persons” of the MainStay Group of Funds, MainStay VP Funds Trust, MainStay CBRE Global Infrastructure Megatrends Term Fund and MainStay MacKay DefinedTerm Municipal Opportunities Fund within the meaning of the 1940 Act because of their affiliation with the MainStay Group of Funds, New York Life Insurance Company and/or its affiliates, including New York Life Investment Management LLC, New York Life Insurance Company, NYLIM Service Company LLC, NYLIFE Securities LLC and/or NYLIFE Distributors LLC, as described in detail in the column captioned “Principal Occupation(s) During Past Five Years.” Officers are elected annually by the Board. |
| ** | Includes prior service as an Officer of MainStay VP Series Fund, Inc., the predecessor to MainStay VP Funds Trust. |
Officers of the Trust (Who are not Trustees)*
| 38 | MainStay Winslow Large Cap Growth Fund |
Equity
U.S. Equity
MainStay Epoch U.S. Equity Yield Fund
MainStay Fiera SMID Growth Fund
MainStay PineStone U.S. Equity Fund
MainStay S&P 500 Index Fund
MainStay Winslow Large Cap Growth Fund
MainStay WMC Enduring Capital Fund
MainStay WMC Growth Fund
MainStay WMC Small Companies Fund
MainStay WMC Value Fund
International Equity
MainStay Epoch International Choice Fund
MainStay PineStone International Equity Fund
MainStay WMC International Research Equity Fund
Emerging Markets Equity
MainStay Candriam Emerging Markets Equity Fund
Global Equity
MainStay Epoch Capital Growth Fund
MainStay Epoch Global Equity Yield Fund
MainStay PineStone Global Equity Fund
Fixed Income
Taxable Income
MainStay Candriam Emerging Markets Debt Fund
MainStay Floating Rate Fund
MainStay MacKay High Yield Corporate Bond Fund
MainStay MacKay Short Duration High Yield Fund
MainStay MacKay Strategic Bond Fund
MainStay MacKay Total Return Bond Fund
MainStay MacKay U.S. Infrastructure Bond Fund
MainStay Short Term Bond Fund
Tax-Exempt Income
MainStay MacKay California Tax Free Opportunities Fund1
MainStay MacKay High Yield Municipal Bond Fund
MainStay MacKay New York Tax Free Opportunities Fund2
MainStay MacKay Short Term Municipal Fund
MainStay MacKay Strategic Municipal Allocation Fund
MainStay MacKay Tax Free Bond Fund
Money Market
MainStay Money Market Fund
Mixed Asset
MainStay Balanced Fund
MainStay Income Builder Fund
MainStay MacKay Convertible Fund
Speciality
MainStay CBRE Global Infrastructure Fund
MainStay CBRE Real Estate Fund
MainStay Cushing MLP Premier Fund
Asset Allocation
MainStay Conservative Allocation Fund
MainStay Conservative ETF Allocation Fund
MainStay Defensive ETF Allocation Fund
MainStay Equity Allocation Fund
MainStay Equity ETF Allocation Fund
MainStay ESG Multi-Asset Allocation Fund
MainStay Growth Allocation Fund
MainStay Growth ETF Allocation Fund
MainStay Moderate Allocation Fund
MainStay Moderate ETF Allocation Fund
Manager
New York Life Investment Management LLC
New York, New York
Subadvisors
Candriam3
Strassen, Luxembourg
CBRE Investment Management Listed Real Assets LLC
Radnor, Pennsylvania
Cushing Asset Management, LP
Dallas, Texas
Epoch Investment Partners, Inc.
New York, New York
Fiera Capital Inc.
New York, New York
IndexIQ Advisors LLC3
New York, New York
MacKay Shields LLC3
New York, New York
NYL Investors LLC3
New York, New York
PineStone Asset Management Inc.
Montreal, Québec
Wellington Management Company LLP
Boston, Massachusetts
Winslow Capital Management, LLC
Minneapolis, Minnesota
Legal Counsel
Dechert LLP
Washington, District of Columbia
Independent Registered Public Accounting Firm
KPMG LLP
Philadelphia, Pennsylvania
Distributor
NYLIFE Distributors LLC3
Jersey City, New Jersey
Custodian
JPMorgan Chase Bank, N.A.
New York, New York
1.
This Fund is registered for sale in AZ, CA, NV, OR, TX, UT, WA and MI (Class A and Class I shares only), and CO, FL, GA, HI, ID, MA, MD, NH, NJ and NY (Class I shares only).
| 2. | This Fund is registered for sale in CA, CT, DE, FL, MA, NJ, NY and VT. |
| 3. | An affiliate of New York Life Investment Management LLC. |
Not part of the Annual Report
For more information
800-624-6782
newyorklifeinvestments.com
“New York Life Investments” is both a service mark, and the common trade name, of certain investment advisors affiliated with New York Life Insurance Company. The MainStay Funds® are managed by New York Life Investment Management LLC and distributed by NYLIFE Distributors LLC, 30 Hudson Street, Jersey City, NJ 07302, a wholly owned subsidiary of New York Life Insurance Company. NYLIFE Distributors LLC is a Member FINRA/SIPC.
©2023 NYLIFE Distributors LLC. All rights reserved.
| 5013907MS139-23 | MSLG11-12/23 |
(NYLIM) NL221
MainStay WMC Enduring Capital Fund
Message from the President and Annual Report
October 31, 2023
Special Notice:
Beginning in July 2024, new regulations issued by the Securities and Exchange Commission (SEC) will take effect requiring open-end mutual fund companies and ETFs to (1) overhaul the content of their shareholder reports and (2) mail paper copies of the new tailored shareholder reports to shareholders who have not opted to receive these documents electronically.
If you have not yet elected to receive your shareholder reports electronically, please contact your financial intermediary or visit newyorklifeinvestments.com/accounts.
| Not FDIC/NCUA Insured | Not a Deposit | May Lose Value | No Bank Guarantee | Not Insured by Any Government Agency |
This page intentionally left blank
Message from the President
Volatile economic and geopolitical forces drove market behavior during the 12-month reporting period ended October 31, 2023. While equity markets generally gained ground, bond prices trended broadly lower.
Although the war in Ukraine, the outbreak of hostilities in the Middle East and several other notable events affected financial assets, inflation and interest rate trends stood at the forefront of market developments during most of the period. As the reporting period began, high levels of inflation already showed signs of easing in the face of aggressive rate hikes by the U.S. Federal Reserve (the “Fed”). From a peak of 9.1% in June 2022, the annualized U.S. inflation rate dropped to 7.1% in November 2022, and to 3.2% in October 2023. At the same time, the Fed increased the benchmark federal funds rate from 3.75%–4.00% at the beginning of the reporting period to 5.25%–5.50% as of October 31, 2023. As the pace of rate increases slowed during the period, investors hoped for an early shift to a looser monetary policy. However, comments from Fed members late in the period reinforced the central bank’s hawkish stance in response to surprisingly robust U.S. economic growth and rising wage pressures, thus increasing the likelihood that interest rates would stay higher for longer. International developed markets exhibited similar dynamics of elevated inflation and rising interest rates.
Despite the backdrop of high interest rates—along with political dysfunction in Washington D.C. and intensifying global geopolitical instability—equity markets managed to advance, supported by healthy consumer spending trends and persistent domestic economic growth. The S&P 500® Index, a widely regarded benchmark of large-cap U.S. market performance, gained ground, bolstered by the strong performance of energy stocks amid surging petroleum prices and mega-cap, growth-oriented, technology-related shares, which rose as investors flocked to companies creating the infrastructure for developments in artificial intelligence. Smaller-cap stocks and value-oriented shares produced milder returns. Among industry sectors, energy and
information technology posted the strongest gains. Real estate declined most sharply under pressure from rising mortgage rates and weak levels of office occupancy. Developed international markets outperformed U.S. markets, with Europe benefiting during the first half of the period from unexpected economic resilience in the face of rising energy prices and the ongoing war in Ukraine. Emerging markets posted positive results but lagged developed markets, largely due to slow economic growth in China despite the relaxation of pandemic-era lockdowns.
Bond prices were driven lower by rising yields and increasing expectations of high interest rates for an extended period of time. The U.S. yield curve steepened, with the 30-year Treasury yield exceeding 5% for the first time in more than a decade. The yield curve remained inverted, with the 10-year Treasury yield ending the period at 4.88%, compared with 5.07% for the 2-year Treasury yield. Corporate bonds outperformed long-term Treasury bonds, but still trended lower under pressure from rising yields and an uptick in default rates. Among corporates, lower-credit-quality instruments performed slightly better than their higher-credit-quality counterparts, while floating rate securities performed better still.
In the face of today’s uncertain market environment, New York Life Investments remains dedicated to providing the guidance, resources and investment solutions you need to pursue your financial goals.
Thank you for trusting us to help meet your investment needs.
Sincerely,
Kirk C. Lehneis
President
The opinions expressed are as of the date of this report and are subject to change. There is no guarantee that any forecast made will come to pass. This material does not constitute investment advice and is not intended as an endorsement of any specific investment. Past performance is no guarantee of future results.
Not part of the Annual Report
Investors should refer to the Fund’s Summary Prospectus and/or Prospectus and consider the Fund’s investment objectives, strategies, risks, charges and expenses carefully before investing. The Summary Prospectus and/or Prospectus contain this and other information about the Fund. You may obtain copies of the Fund’s Summary Prospectus, Prospectus and Statement of Additional Information, which includes information about The MainStay Funds' Trustees, free of charge, upon request, by calling toll-free 800-624-6782, by writing to NYLIFE Distributors LLC, Attn: MainStay Marketing Department, 30 Hudson Street, Jersey City, NJ 07302 or by sending an e-mail to MainStayShareholderServices@nylim.com. These documents are also available via the MainStay Funds’ website at newyorklifeinvestments.com. Please read the Fund’s Summary Prospectus and/or Prospectus carefully before investing.
Investment and Performance Comparison (Unaudited)
Performance data quoted represents past performance. Past performance is no guarantee of future results. Because of market volatility and other factors, current performance may be lower or higher than the figures shown. Investment return and principal value will fluctuate, and as a result, when shares are redeemed, they may be worth more or less than their original cost. The graph below depicts the historical performance of Class I shares of the Fund. Performance will vary from class to class based on differences in class-specific expenses and sales charges. For performance information current to the most recent month-end, please call 800-624-6782 or visit newyorklifeinvestments.com.
The performance table and graph do not reflect the deduction of taxes that a shareholder would pay on distributions or Fund share redemptions. Total returns reflect maximum applicable sales charges as indicated in the table below, if any, changes in share price, and reinvestment of dividend and capital gain distributions. The graph assumes the initial investment amount shown below and reflects the deduction of all sales charges that would have applied for the period of investment. Performance figures may reflect certain fee waivers and/or expense limitations, without which total returns may have been lower. For more information on share classes and current fee waivers and/or expense limitations (if any), please refer to the Notes to Financial Statements.
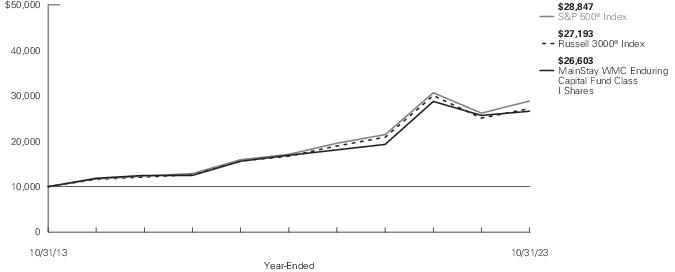
| Average Annual Total Returns for the Year-Ended October 31, 2023 |
| Class | Sales Charge | | Inception
Date1 | One
Year | Five
Years | Ten Years
or Since
Inception | Gross
Expense
Ratio2 |
| Class A Shares | Maximum 5.50% Initial Sales Charge | With sales charges | 6/1/1998 | -2.33% | 7.98% | 9.38% | 0.94% |
| | | Excluding sales charges | | 3.36 | 9.21 | 10.00 | 0.94 |
| Investor Class Shares3 | Maximum 5.00% Initial Sales Charge | With sales charges | 2/28/2008 | -2.02 | 7.71 | 9.11 | 1.11 |
| | | Excluding sales charges | | 3.13 | 8.94 | 9.73 | 1.11 |
| Class B Shares4 | Maximum 5.00% CDSC | With sales charges | 6/1/1998 | -2.57 | 7.83 | 8.91 | 1.86 |
| | if Redeemed Within the First Six Years of Purchase | Excluding sales charges | | 2.34 | 8.12 | 8.91 | 1.86 |
| Class C Shares | Maximum 1.00% CDSC | With sales charges | 9/1/1998 | 1.40 | 8.13 | 8.91 | 1.86 |
| | if Redeemed Within One Year of Purchase | Excluding sales charges | | 2.39 | 8.13 | 8.91 | 1.86 |
| Class I Shares | No Sales Charge | | 12/28/2004 | 3.60 | 9.49 | 10.28 | 0.69 |
| Class R3 Shares5 | No Sales Charge | | 2/29/2016 | 2.99 | 8.82 | 10.83 | 1.30 |
| Class R6 Shares | No Sales Charge | | 4/26/2021 | 3.69 | N/A | 1.53 | 0.63 |
| 1. | Effective March 5, 2021, the Fund replaced its subadvisor and modified its principal investment strategies. The past performance in the graph and table prior to March 5, 2021 reflects the Fund's prior subadvisor and principal investment strategies. |
| 2. | The gross expense ratios presented reflect the Fund’s “Total Annual Fund Operating Expenses” from the most recent Prospectus, as supplemented, and may differ from other expense ratios disclosed in this report. |
| 3. | Prior to June 30, 2020, the maximum initial sales charge was 5.50%, which is reflected in the applicable average annual total return figures shown. |
| 4. | Class B shares are closed to all new purchases as well as additional investments by existing Class B shareholders. |
| 5. | As of October 31, 2023, Class R3 shares are closed to new investors and, upon the close of business on December 29, 2023, Class R3 shares are closed to additional investments by existing shareholders. Additionally, Class R3 shares will be liquidated on or about February 28, 2024 (the "Liquidation Date"). It is expected that the Fund will distribute to remaining shareholders invested in Class R3 shares, on or promptly after the Liquidation Date, a liquidating distribution in cash or cash equivalents equal to the net asset value of such shares. |
The footnotes on the next page are an integral part of the table and graph and should be carefully read in conjunction with them.
| Benchmark Performance* | One
Year | Five
Years | Ten
Years |
| S&P 500® Index1 | 10.14% | 11.01% | 11.18% |
| Russell 3000® Index2 | 8.38 | 10.23 | 10.52 |
| Morningstar Large Blend Category Average3 | 7.62 | 9.67 | 9.69 |
| * | Returns for indices reflect no deductions for fees, expenses or taxes, except for foreign withholding taxes where applicable. Results assume reinvestment of all dividends and capital gains. An investment cannot be made directly in an index. |
| 1. | The S&P 500® Index is the Fund's primary benchmark. S&P 500® is a trademark of The McGraw-Hill Companies, Inc. The S&P 500® Index is widely regarded as the standard index for measuring large-cap U.S. stock market performance. |
| 2. | The Russell 3000® Index is the Fund's secondary benchmark. The Russell 3000® Index measures the performance of the largest 3,000 U.S. companies representing approximately 98% of the investable U.S. equity market. |
| 3. | The Morningstar Large Blend Category Average is representative of funds that represent the overall U.S. stock market in size, growth rates and price. Stocks in the top 70% of the capitalization of the U.S. equity market are defined as large cap. The blend style is assigned to funds where neither growth nor value characteristics predominate. These funds tend to invest across the spectrum of U.S. industries, and owing to their broad exposure, the funds' returns are often similar to those of the S&P 500® Index. Results are based on average total returns of similar funds with all dividends and capital gain distributions reinvested. |
The footnotes on the preceding page are an integral part of the table and graph and should be carefully read in conjunction with them.
| 6 | MainStay WMC Enduring Capital Fund |
Cost in Dollars of a $1,000 Investment in MainStay WMC Enduring Capital Fund (Unaudited)
The example below is intended to describe the fees and expenses borne by shareholders during the six-month period from May 1, 2023 to October 31, 2023, and the impact of those costs on your investment.
Example
As a shareholder of the Fund you incur two types of costs: (1) transaction costs, including exchange fees and sales charges (loads) on purchases (as applicable), and (2) ongoing costs, including management fees, distribution and/or service (12b-1) fees and other Fund expenses (as applicable). This example is intended to help you understand your ongoing costs (in dollars) of investing in the Fund and to compare these costs with the ongoing costs of investing in other mutual funds. The example is based on an investment of $1,000 made at the beginning of the six-month period and held for the entire period from May 1, 2023 to October 31, 2023.
This example illustrates your Fund’s ongoing costs in two ways:
Actual Expenses
The second and third data columns in the table below provide information about actual account values and actual expenses. You may use the information in these columns, together with the amount you invested, to estimate the expenses that you paid during the six months ended October 31, 2023. Simply divide your account value by $1,000 (for example, an
$8,600 account value divided by $1,000 = 8.6), then multiply the result by the number under the heading entitled “Expenses Paid During Period” to estimate the expenses you paid on your account during this period.
Hypothetical Example for Comparison Purposes
The fourth and fifth data columns in the table below provide information about hypothetical account values and hypothetical expenses based on the Fund’s actual expense ratio and an assumed rate of return of 5% per year before expenses, which is not the Fund’s actual return. The hypothetical account values and expenses may not be used to estimate the actual ending account balances or expenses you paid for the six-month period shown. You may use this information to compare the ongoing costs of investing in the Fund with the ongoing costs of investing in other mutual funds. To do so, compare this 5% hypothetical example with the 5% hypothetical examples that appear in the shareholder reports of the other mutual funds.
Please note that the expenses shown in the table are meant to highlight your ongoing costs only and do not reflect any transactional costs, such as exchange fees or sales charges (loads). Therefore, the fourth and fifth data columns of the table are useful in comparing ongoing costs only and will not help you determine the relative total costs of owning different funds. In addition, if these transactional costs were included, your costs would have been higher.
| Share Class | Beginning
Account
Value
5/1/23 | Ending Account
Value (Based
on Actual
Returns and
Expenses)
10/31/23 | Expenses
Paid
During
Period1 | Ending Account
Value (Based
on Hypothetical
5% Annualized
Return and
Actual Expenses)
10/31/23 | Expenses
Paid
During
Period1 | Net Expense
Ratio
During
Period2 |
| Class A Shares | $1,000.00 | $989.10 | $4.81 | $1,020.37 | $4.89 | 0.96% |
| Investor Class Shares | $1,000.00 | $987.70 | $5.91 | $1,019.26 | $6.01 | 1.18% |
| Class B Shares | $1,000.00 | $984.10 | $9.65 | $1,015.48 | $9.80 | 1.93% |
| Class C Shares | $1,000.00 | $984.40 | $9.65 | $1,015.48 | $9.80 | 1.93% |
| Class I Shares | $1,000.00 | $990.10 | $3.56 | $1,021.63 | $3.62 | 0.71% |
| Class R3 Shares | $1,000.00 | $987.30 | $6.56 | $1,018.60 | $6.67 | 1.31% |
| Class R6 Shares | $1,000.00 | $990.80 | $3.06 | $1,022.13 | $3.11 | 0.61% |
| 1. | Expenses are equal to the Fund’s annualized expense ratio of each class multiplied by the average account value over the period, divided by 365 and multiplied by 184 (to reflect the six-month period). The table above represents the actual expenses incurred during the six-month period. In addition to the fees and expenses which the Fund bears directly, it also indirectly bears a pro rata share of the fees and expenses of the underlying funds in which it invests. Such indirect expenses are not included in the above-reported expense figures. |
| 2. | Expenses are equal to the Fund's annualized expense ratio to reflect the six-month period. |
Industry Composition as of October 31, 2023 (Unaudited)
| Machinery | 11.8% |
| Insurance | 10.6 |
| Commercial Services & Supplies | 10.6 |
| Chemicals | 7.5 |
| Software | 6.8 |
| Ground Transportation | 6.5 |
| Capital Markets | 4.9 |
| Household Durables | 4.7 |
| Financial Services | 4.6 |
| Air Freight & Logistics | 4.0 |
| Trading Companies & Distributors | 3.9 |
| Consumer Staples Distribution & Retail | 3.7 |
| Specialized REITs | 3.6% |
| Health Care Providers & Services | 2.6 |
| Banks | 2.5 |
| Consumer Finance | 2.3 |
| Containers & Packaging | 2.3 |
| Life Sciences Tools & Services | 2.2 |
| Electric Utilities | 2.0 |
| Media | 2.0 |
| Short–Term Investments | 1.4 |
| Other Assets, Less Liabilities | –0.5 |
| | 100.0% |
See Portfolio of Investments beginning on page 11 for specific holdings within these categories. The Fund's holdings are subject to change.
Top Ten Holdings and/or Issuers Held as of October 31, 2023 (excluding short-term investments) (Unaudited)
| 1. | Constellation Software, Inc. |
| 2. | Markel Group, Inc. |
| 3. | Progressive Corp. (The) |
| 4. | PACCAR, Inc. |
| 5. | NVR, Inc. |
| 6. | Berkshire Hathaway, Inc., Class B |
| 7. | Copart, Inc. |
| 8. | Linde plc |
| 9. | Expeditors International of Washington, Inc. |
| 10. | Watsco, Inc. |
| 8 | MainStay WMC Enduring Capital Fund |
Portfolio Management Discussion and Analysis (Unaudited)
Questions answered by portfolio manager Mark A. Whitaker, CFA, of Wellington Management Company LLP, the Fund’s Subadvisor.
How did MainStay WMC Enduring Capital Fund perform relative to its benchmarks and peer group during the 12 months ended October 31, 2023?
For the 12 months ended October 31, 2023, Class I shares of MainStay WMC Enduring Capital Fund returned 3.60%, underperforming the 10.14% return of the Fund’s primary benchmark, the S&P 500® Index, and the 8.38% return of the Fund’s secondary benchmark, the Russell 3000® Index. Over the same period, Class I shares also underperformed the 7.62% return of the Morningstar Large Blend Category Average.1
What factors affected the Fund’s relative performance during the reporting period?
The Fund underperformed its primary benchmark, the S&P 500® Index, amid volatile market conditions exacerbated by rising interest rates, increased inflation and geopolitical conflict. In addition, the market grappled with concerns regarding U.S. banking system liquidity, which broadly affected the financials sector.
From an attribution perspective, sector allocation, a result of our bottom-up stock selection process, primarily drove relative underperformance, largely due to the Fund’s underweight positioning in information technology, financials and communication services, and overweight exposure to financials. The positive impact of the Fund’s lack of exposure to energy and underweight exposure to health care and consumer staples partially offset negative allocation effects. Security selection made a modestly positive contribution to relative results. (Contributions take weightings and total returns into account.) Strong selection in industrials and materials more than compensated for weak selection in financials and communication services.
During the reporting period, which sectors were the strongest positive contributors to the Fund’s relative performance, and which sectors were particularly weak?
During the reporting period, the industrials, health care and consumer staples provided the strongest positive contributions to the Fund’s performance relative to the S&P 500® Index. Over the same period, the financials, information technology and communication services sectors detracted most from the Fund’s relative performance.
During the reporting period, which individual stocks made the strongest positive contributions to the Fund’s absolute performance and which stocks detracted the most?
The individual stocks that made the strongest contributions to the Fund’s absolute performance included Canadian diversified software company Constellation Software and global online vehicle auction company Copart. Shares of Constellation Software rose as the company executed on multiple acquisitions throughout the reporting period, including the acquisition of Black Knight’s Empower loan origination system business, in connection with a pending merger between Black Knight and Intercontinental Exchange. Copart shares advanced as the company continued to extend its competitive advantage over competitor IAAI.
The holdings that detracted most significantly from absolute performance included commercial bank First Republic Bank and financial services provider Charles Schwab. Shares of First Republic Bank plunged on concerns that a wave of banking failures could undermine the regional lender. We eliminated the Fund’s position during the reporting period. Similarly, shares of Charles Schwab fell sharply as investors feared that firms like Schwab, which have large bond holdings with long maturities, might be forced to sell these assets at a loss to cover a rush of deposit withdrawals. The Fund continued to hold shares in Charles Schwab at the end of the reporting period, but reduced the size of its position.
What were some of the Fund’s largest purchases and sales during the reporting period?
During the reporting period, the Fund initiated a new position in Credit Acceptance, an auto finance company. The company is known for its industry-leading profitability, its consistent winning of “best places to work” awards and, importantly, its willingness to behave differently than peers, often taking a very opportunistic approach to capital allocation. In terms of notable sales, the Fund trimmed its position in Old Dominion Freight Line, a U.S.-based less-than-truckload shipping company, due to valuation.
How did the Fund’s sector and/or country weightings change during the reporting period?
During the reporting period, we increased the Fund’s active weights primarily in the consumer discretionary, materials and energy sectors, while decreasing exposure most significantly in communication services, real estate and financials.
| 1. | See "Investment and Performance Comparison" for other share class returns, which may be higher or lower than Class I share returns, and for more information on benchmark and peer group returns. |
How was the Fund positioned at the end of the reporting period?
As of October 31, 2023, the Fund held its largest overweight exposures relative to the S&P 500® Index in the industrials, financials and materials sectors. As of the same date, the Fund’s most significantly underweight exposures were to information technology, health care and communication services.
The opinions expressed are those of the portfolio manager as of the date of this report and are subject to change. There is no guarantee that any forecasts will come to pass. This material does not constitute investment advice and is not intended as an endorsement of any specific investment.
| 10 | MainStay WMC Enduring Capital Fund |
Portfolio of Investments October 31, 2023†^
| | Shares | Value |
| Common Stocks 99.1% |
| Air Freight & Logistics 4.0% |
| Expeditors International of Washington, Inc. | 172,133 | $ 18,805,530 |
| Banks 2.5% |
| M&T Bank Corp. | 102,990 | 11,612,123 |
| Capital Markets 4.9% |
| Brookfield Asset Management Ltd., Class A (a) | 165,325 | 4,739,868 |
| Brookfield Corp. | 254,798 | 7,427,362 |
| Charles Schwab Corp. (The) | 205,784 | 10,708,999 |
| | | 22,876,229 |
| Chemicals 7.5% |
| Linde plc | 54,813 | 20,947,336 |
| Sherwin-Williams Co. (The) | 59,167 | 14,094,171 |
| | | 35,041,507 |
| Commercial Services & Supplies 10.6% |
| Cintas Corp. | 29,193 | 14,804,354 |
| Copart, Inc. (b) | 486,455 | 21,170,522 |
| Waste Connections, Inc. | 104,421 | 13,522,519 |
| | | 49,497,395 |
| Consumer Finance 2.3% |
| Credit Acceptance Corp. (a)(b) | 27,368 | 11,013,704 |
| Consumer Staples Distribution & Retail 3.7% |
| Costco Wholesale Corp. | 31,172 | 17,220,660 |
| Containers & Packaging 2.3% |
| Ball Corp. | 221,532 | 10,666,766 |
| Electric Utilities 2.0% |
| NextEra Energy, Inc. | 164,402 | 9,584,637 |
| Financial Services 4.6% |
| Berkshire Hathaway, Inc., Class B (b) | 62,652 | 21,385,007 |
| Ground Transportation 6.5% |
| Canadian National Railway Co. | 126,339 | 13,367,746 |
| Old Dominion Freight Line, Inc. | 45,757 | 17,234,831 |
| | | 30,602,577 |
| Health Care Providers & Services 2.6% |
| UnitedHealth Group, Inc. | 22,876 | 12,251,471 |
| | Shares | Value |
| |
| Household Durables 4.7% |
| NVR, Inc. (b) | 4,068 | $ 22,018,538 |
| Insurance 10.6% |
| Brookfield Reinsurance Ltd. | 3,730 | 108,953 |
| Markel Group, Inc. (b) | 17,633 | 25,929,679 |
| Progressive Corp. (The) | 151,164 | 23,897,517 |
| | | 49,936,149 |
| Life Sciences Tools & Services 2.2% |
| Danaher Corp. | 54,460 | 10,457,409 |
| Machinery 11.8% |
| Deere & Co. | 27,675 | 10,111,338 |
| Fortive Corp. | 168,606 | 11,006,600 |
| IDEX Corp. | 63,067 | 12,071,654 |
| PACCAR, Inc. | 269,921 | 22,276,580 |
| | | 55,466,172 |
| Media 2.0% |
| Cable One, Inc. | 17,186 | 9,450,066 |
| Software 6.8% |
| Constellation Software, Inc. | 15,501 | 31,074,768 |
| Lumine Group, Inc. (b) | 61,645 | 775,258 |
| | | 31,850,026 |
| Specialized REITs 3.6% |
| American Tower Corp. | 50,390 | 8,978,994 |
| Public Storage | 33,839 | 8,077,708 |
| | | 17,056,702 |
| Trading Companies & Distributors 3.9% |
| Watsco, Inc. | 52,159 | 18,197,754 |
Total Common Stocks
(Cost $404,934,106) | | 464,990,422 |
| |
| | Number of
Warrants | |
| |
| Warrants 0.0% ‡ |
| Software 0.0% ‡ |
| Constellation Software, Inc. | | |
| Expires 3/31/40 (b)(c)(d) | 16,496 | — |
Total Warrants
(Cost $0) | | — |
| |
The notes to the financial statements are an integral part of, and should be read in conjunction with, the financial statements.
11
Portfolio of Investments October 31, 2023†^ (continued)
| | Shares | | Value |
| |
| Short-Term Investments 1.4% |
| Affiliated Investment Company 1.1% |
| MainStay U.S. Government Liquidity Fund, 5.275% (e) | 5,151,776 | | $ 5,151,776 |
| Unaffiliated Investment Companies 0.3% |
| Fidelity Government Portfolio, 5.338% (e)(f) | 1,000,000 | | 1,000,000 |
| Invesco Government & Agency Portfolio, 5.357% (e)(f) | 447,829 | | 447,829 |
| | | | 1,447,829 |
Total Short-Term Investments
(Cost $6,599,605) | | | 6,599,605 |
Total Investments
(Cost $411,533,711) | 100.5% | | 471,590,027 |
| Other Assets, Less Liabilities | (0.5) | | (2,282,945) |
| Net Assets | 100.0% | | $ 469,307,082 |
| † | Percentages indicated are based on Fund net assets. |
| ^ | Industry classifications may be different than those used for compliance monitoring purposes. |
| ‡ | Less than one-tenth of a percent. |
| (a) | All or a portion of this security was held on loan. As of October 31, 2023, the aggregate market value of securities on loan was $1,418,057. The Fund received cash collateral with a value of $1,447,829. (See Note 2(I)) |
| (b) | Non-income producing security. |
| (c) | Illiquid security—As of October 31, 2023, the total market value deemed illiquid under procedures approved by the Board of Trustees was $0, which represented less than one-tenth of a percent of the Fund’s net assets. (Unaudited) |
| (d) | Security in which significant unobservable inputs (Level 3) were used in determining fair value. |
| (e) | Current yield as of October 31, 2023. |
| (f) | Represents a security purchased with cash collateral received for securities on loan. |
Investments in Affiliates (in 000's)
Investments in issuers considered to be affiliate(s) of the Fund during the year ended October 31, 2023 for purposes of Section 2(a)(3) of the Investment Company Act of 1940, as amended, were as follows:
| Affiliated Investment Companies | Value,
Beginning
of Year | Purchases
at Cost | Proceeds
from
Sales | Net
Realized
Gain/(Loss)
on Sales | Change in
Unrealized
Appreciation/
(Depreciation) | Value,
End of
Year | Dividend
Income | Other
Distributions | Shares
End of
Year |
| MainStay U.S. Government Liquidity Fund | $ 148 | $ 144,808 | $ (139,804) | $ — | $ — | $ 5,152 | $ 207 | $ — | 5,152 |
The notes to the financial statements are an integral part of, and should be read in conjunction with, the financial statements.
| 12 | MainStay WMC Enduring Capital Fund |
| Abbreviation(s): |
| REIT—Real Estate Investment Trust |
The following is a summary of the fair valuations according to the inputs used as of October 31, 2023, for valuing the Fund’s assets:
| Description | Quoted
Prices in
Active
Markets for
Identical
Assets
(Level 1) | | Significant
Other
Observable
Inputs
(Level 2) | | Significant
Unobservable
Inputs
(Level 3) | | Total |
| Asset Valuation Inputs | | | | | | | |
| Investments in Securities (a) | | | | | | | |
| Common Stocks | $ 464,990,422 | | $ — | | $ — | | $ 464,990,422 |
| Warrants | — | | — | | — | | — |
| Short-Term Investments | | | | | | | |
| Affiliated Investment Company | 5,151,776 | | — | | — | | 5,151,776 |
| Unaffiliated Investment Companies | 1,447,829 | | — | | — | | 1,447,829 |
| Total Short-Term Investments | 6,599,605 | | — | | — | | 6,599,605 |
| Total Investments in Securities | $ 471,590,027 | | $ — | | $ — | | $ 471,590,027 |
| (a) | For a complete listing of investments and their industries, see the Portfolio of Investments. |
The notes to the financial statements are an integral part of, and should be read in conjunction with, the financial statements.
13
Statement of Assets and Liabilities as of October 31, 2023
| Assets |
Investment in unaffiliated securities, at value
(identified cost $406,381,935) including securities on loan of $1,418,057 | $466,438,251 |
Investment in affiliated investment companies, at value
(identified cost $5,151,776) | 5,151,776 |
| Cash | 49,567 |
| Receivables: | |
| Fund shares sold | 84,766 |
| Dividends | 57,876 |
| Securities lending | 1,608 |
| Other assets | 52,923 |
| Total assets | 471,836,767 |
| Liabilities |
| Cash collateral received for securities on loan | 1,447,829 |
| Foreign currency due to custodian, at value | 372 |
| Payables: | |
| Fund shares redeemed | 295,959 |
| Investment securities purchased | 235,048 |
| Manager (See Note 3) | 227,279 |
| Shareholder communication | 114,225 |
| Transfer agent (See Note 3) | 66,038 |
| NYLIFE Distributors (See Note 3) | 64,218 |
| Custodian | 56,585 |
| Professional fees | 20,743 |
| Trustees | 439 |
| Accrued expenses | 950 |
| Total liabilities | 2,529,685 |
| Net assets | $469,307,082 |
| Composition of Net Assets |
| Shares of beneficial interest outstanding (par value of $.01 per share) unlimited number of shares authorized | $ 157,494 |
| Additional paid-in-capital | 414,071,041 |
| | 414,228,535 |
| Total distributable earnings (loss) | 55,078,547 |
| Net assets | $469,307,082 |
| Class A | |
| Net assets applicable to outstanding shares | $197,726,087 |
| Shares of beneficial interest outstanding | 6,621,727 |
| Net asset value per share outstanding | $ 29.86 |
| Maximum sales charge (5.50% of offering price) | 1.74 |
| Maximum offering price per share outstanding | $ 31.60 |
| Investor Class | |
| Net assets applicable to outstanding shares | $ 21,764,050 |
| Shares of beneficial interest outstanding | 730,270 |
| Net asset value per share outstanding | $ 29.80 |
| Maximum sales charge (5.00% of offering price) | 1.57 |
| Maximum offering price per share outstanding | $ 31.37 |
| Class B | |
| Net assets applicable to outstanding shares | $ 1,527,200 |
| Shares of beneficial interest outstanding | 58,826 |
| Net asset value and offering price per share outstanding | $ 25.96 |
| Class C | |
| Net assets applicable to outstanding shares | $ 16,624,348 |
| Shares of beneficial interest outstanding | 640,960 |
| Net asset value and offering price per share outstanding | $ 25.94 |
| Class I | |
| Net assets applicable to outstanding shares | $ 75,684,057 |
| Shares of beneficial interest outstanding | 2,514,965 |
| Net asset value and offering price per share outstanding | $ 30.09 |
| Class R3 | |
| Net assets applicable to outstanding shares | $ 847,758 |
| Shares of beneficial interest outstanding | 28,725 |
| Net asset value and offering price per share outstanding | $ 29.51 |
| Class R6 | |
| Net assets applicable to outstanding shares | $155,133,582 |
| Shares of beneficial interest outstanding | 5,153,911 |
| Net asset value and offering price per share outstanding | $ 30.10 |
The notes to the financial statements are an integral part of, and should be read in conjunction with, the financial statements.
| 14 | MainStay WMC Enduring Capital Fund |
Statement of Operations for the year ended October 31, 2023
| Investment Income (Loss) |
| Income | |
| Dividends-unaffiliated (net of foreign tax withholding of $131,385) | $ 7,334,128 |
| Dividends-affiliated | 206,607 |
| Securities lending, net | 12,946 |
| Total income | 7,553,681 |
| Expenses | |
| Manager (See Note 3) | 3,152,197 |
| Distribution/Service—Class A (See Note 3) | 514,527 |
| Distribution/Service—Investor Class (See Note 3) | 58,258 |
| Distribution/Service—Class B (See Note 3) | 22,341 |
| Distribution/Service—Class C (See Note 3) | 205,994 |
| Distribution/Service—Class R3 (See Note 3) | 3,786 |
| Transfer agent (See Note 3) | 405,566 |
| Registration | 112,948 |
| Professional fees | 107,559 |
| Custodian | 72,476 |
| Shareholder communication | 23,237 |
| Trustees | 14,660 |
| Shareholder service (See Note 3) | 757 |
| Miscellaneous | 12,648 |
| Total expenses before waiver/reimbursement | 4,706,954 |
| Reimbursement from prior custodian(a) | (2,079) |
| Net expenses | 4,704,875 |
| Net investment income (loss) | 2,848,806 |
| Realized and Unrealized Gain (Loss) |
| Net realized gain (loss) on: | |
| Unaffiliated investment transactions | (6,909,949) |
| Foreign currency transactions | 18,141 |
| Net realized gain (loss) | (6,891,808) |
| Net change in unrealized appreciation (depreciation) on: | |
| Unaffiliated investments | 28,352,457 |
| Translation of other assets and liabilities in foreign currencies | 5 |
| Net change in unrealized appreciation (depreciation) | 28,352,462 |
| Net realized and unrealized gain (loss) | 21,460,654 |
| Net increase (decrease) in net assets resulting from operations | $24,309,460 |
| (a) | Represents a refund for overbilling of custody fees. |
The notes to the financial statements are an integral part of, and should be read in conjunction with, the financial statements.
15
Statements of Changes in Net Assets
for the years ended October 31, 2023 and October 31, 2022
| | 2023 | 2022 |
| Increase (Decrease) in Net Assets |
| Operations: | | |
| Net investment income (loss) | $ 2,848,806 | $ 1,692,280 |
| Net realized gain (loss) | (6,891,808) | 19,226,663 |
| Net change in unrealized appreciation (depreciation) | 28,352,462 | (87,315,486) |
| Net increase (decrease) in net assets resulting from operations | 24,309,460 | (66,396,543) |
| Distributions to shareholders: | | |
| Class A | (7,743,520) | (19,185,374) |
| Investor Class | (859,939) | (2,404,448) |
| Class B | (113,221) | (453,565) |
| Class C | (929,434) | (3,325,977) |
| Class I | (3,690,395) | (10,230,592) |
| Class R3 | (21,276) | (40,016) |
| Class R6 | (8,289,276) | (22,407,486) |
| Total distributions to shareholders | (21,647,061) | (58,047,458) |
| Capital share transactions: | | |
| Net proceeds from sales of shares | 125,928,585 | 86,455,226 |
| Net asset value of shares issued to shareholders in reinvestment of distributions | 21,396,272 | 57,355,353 |
| Cost of shares redeemed | (197,554,301) | (201,267,040) |
| Increase (decrease) in net assets derived from capital share transactions | (50,229,444) | (57,456,461) |
| Net increase (decrease) in net assets | (47,567,045) | (181,900,462) |
| Net Assets |
| Beginning of year | 516,874,127 | 698,774,589 |
| End of year | $ 469,307,082 | $ 516,874,127 |
The notes to the financial statements are an integral part of, and should be read in conjunction with, the financial statements.
| 16 | MainStay WMC Enduring Capital Fund |
Financial Highlights selected per share data and ratios
| | Year Ended October 31, |
| Class A | 2023 | | 2022 | | 2021 | | 2020 | | 2019 |
| Net asset value at beginning of year | $ 30.01 | | $ 36.76 | | $ 24.95 | | $ 24.92 | | $ 26.31 |
| Net investment income (loss) (a) | 0.11 | | 0.06 | | 0.06 | | 0.16 | | 0.26 |
| Net realized and unrealized gain (loss) | 0.92 | | (3.74) | | 11.99 | | 1.36 | | 1.28 |
| Total from investment operations | 1.03 | | (3.68) | | 12.05 | | 1.52 | | 1.54 |
| Less distributions: | | | | | | | | | |
| From net investment income | (0.08) | | (0.04) | | (0.24) | | (0.27) | | (0.22) |
| From net realized gain on investments | (1.10) | | (3.03) | | — | | (1.22) | | (2.71) |
| Total distributions | (1.18) | | (3.07) | | (0.24) | | (1.49) | | (2.93) |
| Net asset value at end of year | $ 29.86 | | $ 30.01 | | $ 36.76 | | $ 24.95 | | $ 24.92 |
| Total investment return (b) | 3.36% | | (10.96)% | | 48.53% | | 6.42% | | 6.80% |
| Ratios (to average net assets)/Supplemental Data: | | | | | | | | | |
| Net investment income (loss) | 0.35% | | 0.18% | | 0.19% | | 0.64% | | 1.08% |
| Net expenses (c) | 0.94% | | 0.94% | | 0.91% | | 0.99% | | 0.97% |
| Portfolio turnover rate | 17% | | 2% | | 24% | | 166% | | 164% |
| Net assets at end of year (in 000’s) | $ 197,726 | | $ 196,218 | | $ 228,700 | | $ 62,611 | | $ 63,814 |
| (a) | Per share data based on average shares outstanding during the year. |
| (b) | Total investment return is calculated exclusive of sales charges and assumes the reinvestment of dividends and distributions. For periods of less than one year, total return is not annualized. |
| (c) | In addition to the fees and expenses which the Fund bears directly, it also indirectly bears a pro-rata share of the fees and expenses of the underlying funds in which it invests. Such indirect expenses are not included in the above expense ratios. |
| | Year Ended October 31, |
| Investor Class | 2023 | | 2022 | | 2021 | | 2020 | | 2019 |
| Net asset value at beginning of year | $ 29.97 | | $ 36.73 | | $ 24.92 | | $ 24.90 | | $ 26.29 |
| Net investment income (loss) (a) | 0.04 | | 0.01 | | (0.01) | | 0.08 | | 0.20 |
| Net realized and unrealized gain (loss) | 0.91 | | (3.74) | | 11.98 | | 1.37 | | 1.27 |
| Total from investment operations | 0.95 | | (3.73) | | 11.97 | | 1.45 | | 1.47 |
| Less distributions: | | | | | | | | | |
| From net investment income | (0.02) | | — | | (0.16) | | (0.21) | | (0.15) |
| From net realized gain on investments | (1.10) | | (3.03) | | — | | (1.22) | | (2.71) |
| Total distributions | (1.12) | | (3.03) | | (0.16) | | (1.43) | | (2.86) |
| Net asset value at end of year | $ 29.80 | | $ 29.97 | | $ 36.73 | | $ 24.92 | | $ 24.90 |
| Total investment return (b) | 3.13% | | (11.13)% | | 48.22% | | 6.05% | | 6.51% |
| Ratios (to average net assets)/Supplemental Data: | | | | | | | | | |
| Net investment income (loss) | 0.13% | | 0.03% | | (0.02)% | | 0.35% | | 0.82% |
| Net expenses (c) | 1.17% | | 1.11% | | 1.19% | | 1.30% | | 1.23% |
| Expenses (before waiver/reimbursement) (c) | 1.17% | | 1.11% | | 1.19% | | 1.31% | | 1.27% |
| Portfolio turnover rate | 17% | | 2% | | 24% | | 166% | | 164% |
| Net assets at end of year (in 000's) | $ 21,764 | | $ 22,977 | | $ 29,293 | | $ 15,544 | | $ 17,203 |
| (a) | Per share data based on average shares outstanding during the year. |
| (b) | Total investment return is calculated exclusive of sales charges and assumes the reinvestment of dividends and distributions. For periods of less than one year, total return is not annualized. |
| (c) | In addition to the fees and expenses which the Fund bears directly, it also indirectly bears a pro-rata share of the fees and expenses of the underlying funds in which it invests. Such indirect expenses are not included in the above expense ratios. |
The notes to the financial statements are an integral part of, and should be read in conjunction with, the financial statements.
17
Financial Highlights selected per share data and ratios
| | Year Ended October 31, |
| Class B | 2023 | | 2022 | | 2021 | | 2020 | | 2019 |
| Net asset value at beginning of year | $ 26.41 | | $ 32.96 | | $ 22.40 | | $ 22.50 | | $ 24.04 |
| Net investment income (loss) (a) | (0.15) | | (0.21) | | (0.22) | | (0.08) | | 0.02 |
| Net realized and unrealized gain (loss) | 0.80 | | (3.31) | | 10.78 | | 1.22 | | 1.15 |
| Total from investment operations | 0.65 | | (3.52) | | 10.56 | | 1.14 | | 1.17 |
| Less distributions: | | | | | | | | | |
| From net investment income | — | | — | | — | | (0.02) | | — |
| From net realized gain on investments | (1.10) | | (3.03) | | — | | (1.22) | | (2.71) |
| Total distributions | (1.10) | | (3.03) | | — | | (1.24) | | (2.71) |
| Net asset value at end of year | $ 25.96 | | $ 26.41 | | $ 32.96 | | $ 22.40 | | $ 22.50 |
| Total investment return (b) | 2.34% | | (11.79)% | | 47.14%(c) | | 5.28% | | 5.71% |
| Ratios (to average net assets)/Supplemental Data: | | | | | | | | | |
| Net investment income (loss) | (0.57)% | | (0.72)% | | (0.77)% | | (0.39)% | | 0.10% |
| Net expenses (d) | 1.92% | | 1.86% | | 1.95% | | 2.05% | | 1.98% |
| Expenses (before waiver/reimbursement) (d) | 1.92% | | 1.86% | | 1.95% | | 2.06% | | 2.02% |
| Portfolio turnover rate | 17% | | 2% | | 24% | | 166% | | 164% |
| Net assets at end of year (in 000’s) | $ 1,527 | | $ 2,824 | | $ 5,007 | | $ 3,666 | | $ 4,718 |
| (a) | Per share data based on average shares outstanding during the year. |
| (b) | Total investment return is calculated exclusive of sales charges and assumes the reinvestment of dividends and distributions. For periods of less than one year, total return is not annualized. |
| (c) | Total investment return may reflect adjustments to conform to generally accepted accounting principles. |
| (d) | In addition to the fees and expenses which the Fund bears directly, it also indirectly bears a pro-rata share of the fees and expenses of the underlying funds in which it invests. Such indirect expenses are not included in the above expense ratios. |
| | Year Ended October 31, |
| Class C | 2023 | | 2022 | | 2021 | | 2020 | | 2019 |
| Net asset value at beginning of year | $ 26.39 | | $ 32.93 | | $ 22.38 | | $ 22.48 | | $ 24.02 |
| Net investment income (loss) (a) | (0.16) | | (0.21) | | (0.24) | | (0.08) | | 0.02 |
| Net realized and unrealized gain (loss) | 0.81 | | (3.30) | | 10.79 | | 1.22 | | 1.15 |
| Total from investment operations | 0.65 | | (3.51) | | 10.55 | | 1.14 | | 1.17 |
| Less distributions: | | | | | | | | | |
| From net investment income | — | | — | | — | | (0.02) | | — |
| From net realized gain on investments | (1.10) | | (3.03) | | — | | (1.22) | | (2.71) |
| Total distributions | (1.10) | | (3.03) | | — | | (1.24) | | (2.71) |
| Net asset value at end of year | $ 25.94 | | $ 26.39 | | $ 32.93 | | $ 22.38 | | $ 22.48 |
| Total investment return (b) | 2.39% | | (11.80)% | | 47.14%(c) | | 5.29% | | 5.72% |
| Ratios (to average net assets)/Supplemental Data: | | | | | | | | | |
| Net investment income (loss) | (0.60)% | | (0.72)% | | (0.80)% | | (0.38)% | | 0.10% |
| Net expenses (d) | 1.92% | | 1.86% | | 1.89% | | 2.05% | | 1.98% |
| Expenses (before waiver/reimbursement) (d) | 1.92% | | 1.86% | | 1.89% | | 2.06% | | 2.02% |
| Portfolio turnover rate | 17% | | 2% | | 24% | | 166% | | 164% |
| Net assets at end of year (in 000’s) | $ 16,624 | | $ 23,500 | | $ 37,234 | | $ 6,641 | | $ 10,946 |
| (a) | Per share data based on average shares outstanding during the year. |
| (b) | Total investment return is calculated exclusive of sales charges and assumes the reinvestment of dividends and distributions. For periods of less than one year, total return is not annualized. |
| (c) | Total investment return may reflect adjustments to conform to generally accepted accounting principles. |
| (d) | In addition to the fees and expenses which the Fund bears directly, it also indirectly bears a pro-rata share of the fees and expenses of the underlying funds in which it invests. Such indirect expenses are not included in the above expense ratios. |
The notes to the financial statements are an integral part of, and should be read in conjunction with, the financial statements.
| 18 | MainStay WMC Enduring Capital Fund |
Financial Highlights selected per share data and ratios
| | Year Ended October 31, |
| Class I | 2023 | | 2022 | | 2021 | | 2020 | | 2019 |
| Net asset value at beginning of year | $ 30.24 | | $ 36.99 | | $ 25.09 | | $ 25.05 | | $ 26.44 |
| Net investment income (loss) (a) | 0.19 | | 0.15 | | 0.16 | | 0.23 | | 0.32 |
| Net realized and unrealized gain (loss) | 0.92 | | (3.77) | | 12.03 | | 1.37 | | 1.28 |
| Total from investment operations | 1.11 | | (3.62) | | 12.19 | | 1.60 | | 1.60 |
| Less distributions: | | | | | | | | | |
| From net investment income | (0.16) | | (0.10) | | (0.29) | | (0.34) | | (0.28) |
| From net realized gain on investments | (1.10) | | (3.03) | | — | | (1.22) | | (2.71) |
| Total distributions | (1.26) | | (3.13) | | (0.29) | | (1.56) | | (2.99) |
| Net asset value at end of year | $ 30.09 | | $ 30.24 | | $ 36.99 | | $ 25.09 | | $ 25.05 |
| Total investment return (b) | 3.60% | | (10.72)% | | 48.97% | | 6.66% | | 7.06% |
| Ratios (to average net assets)/Supplemental Data: | | | | | | | | | |
| Net investment income (loss) | 0.62% | | 0.45% | | 0.48% | | 0.96% | | 1.34% |
| Net expenses (c) | 0.69% | | 0.69% | | 0.66% | | 0.74% | | 0.72% |
| Portfolio turnover rate | 17% | | 2% | | 24% | | 166% | | 164% |
| Net assets at end of year (in 000’s) | $ 75,684 | | $ 73,935 | | $ 135,219 | | $ 37,491 | | $ 97,903 |
| (a) | Per share data based on average shares outstanding during the year. |
| (b) | Total investment return is calculated exclusive of sales charges and assumes the reinvestment of dividends and distributions. Class I shares are not subject to sales charges. For periods of less than one year, total return is not annualized. |
| (c) | In addition to the fees and expenses which the Fund bears directly, it also indirectly bears a pro-rata share of the fees and expenses of the underlying funds in which it invests. Such indirect expenses are not included in the above expense ratios. |
| | Year Ended October 31, |
| Class R3 | 2023 | | 2022 | | 2021 | | 2020 | | 2019 |
| Net asset value at beginning of year | $ 29.71 | | $ 36.51 | | $ 24.78 | | $ 24.77 | | $ 26.17 |
| Net investment income (loss) (a) | (0.01) | | (0.05) | | (0.04) | | 0.07 | | 0.17 |
| Net realized and unrealized gain (loss) | 0.92 | | (3.72) | | 11.91 | | 1.36 | | 1.28 |
| Total from investment operations | 0.91 | | (3.77) | | 11.87 | | 1.43 | | 1.45 |
| Less distributions: | | | | | | | | | |
| From net investment income | (0.01) | | — | | (0.14) | | (0.20) | | (0.14) |
| From net realized gain on investments | (1.10) | | (3.03) | | — | | (1.22) | | (2.71) |
| Total distributions | (1.11) | | (3.03) | | (0.14) | | (1.42) | | (2.85) |
| Net asset value at end of year | $ 29.51 | | $ 29.71 | | $ 36.51 | | $ 24.78 | | $ 24.77 |
| Total investment return (b) | 2.99% | | (11.29)% | | 48.07% | | 6.02% | | 6.42% |
| Ratios (to average net assets)/Supplemental Data: | | | | | | | | | |
| Net investment income (loss) | (0.03)% | | (0.17)% | | (0.13)% | | 0.30% | | 0.70% |
| Net expenses (c) | 1.29% | | 1.30% | | 1.28% | | 1.34% | | 1.32% |
| Portfolio turnover rate | 17% | | 2% | | 24% | | 166% | | 164% |
| Net assets at end of year (in 000’s) | $ 848 | | $ 561 | | $ 479 | | $ 207 | | $ 227 |
| (a) | Per share data based on average shares outstanding during the year. |
| (b) | Total investment return is calculated exclusive of sales charges and assumes the reinvestment of dividends and distributions. Class R3 shares are not subject to sales charges. For periods of less than one year, total return is not annualized. |
| (c) | In addition to the fees and expenses which the Fund bears directly, it also indirectly bears a pro-rata share of the fees and expenses of the underlying funds in which it invests. Such indirect expenses are not included in the above expense ratios. |
The notes to the financial statements are an integral part of, and should be read in conjunction with, the financial statements.
19
Financial Highlights selected per share data and ratios
| | Year Ended October 31, | | April 26, 2021^ through
October 31, |
| Class R6 | 2023 | | 2022 | | 2021 |
| Net asset value at beginning of period | $ 30.24 | | $ 37.00 | | $ 33.07 |
| Net investment income (loss) (a) | 0.22 | | 0.16 | | 0.14 |
| Net realized and unrealized gain (loss) | 0.92 | | (3.77) | | 3.79 |
| Total from investment operations | 1.14 | | (3.61) | | 3.93 |
| Less distributions: | | | | | |
| From net investment income | (0.18) | | (0.12) | | — |
| From net realized gain on investments | (1.10) | | (3.03) | | — |
| Total distributions | (1.28) | | (3.15) | | — |
| Net asset value at end of period | $ 30.10 | | $ 30.24 | | $ 37.00 |
| Total investment return (b) | 3.69% | | (10.69)% | | 11.88% |
| Ratios (to average net assets)/Supplemental Data: | | | | | |
| Net investment income (loss) | 0.71% | | 0.50% | | 0.44%†† |
| Net expenses (c) | 0.61% | | 0.63% | | 0.60%†† |
| Portfolio turnover rate | 17% | | 2% | | 24% |
| Net assets at end of period (in 000’s) | $ 155,134 | | $ 196,860 | | $ 262,843 |
| ^ | Inception date. |
| †† | Annualized. |
| (a) | Per share data based on average shares outstanding during the period. |
| (b) | Total investment return is calculated exclusive of sales charges and assumes the reinvestment of dividends and distributions. Class R6 shares are not subject to sales charges. For periods of less than one year, total return is not annualized. |
| (c) | In addition to the fees and expenses which the Fund bears directly, it also indirectly bears a pro-rata share of the fees and expenses of the underlying funds in which it invests. Such indirect expenses are not included in the above expense ratios. |
The notes to the financial statements are an integral part of, and should be read in conjunction with, the financial statements.
| 20 | MainStay WMC Enduring Capital Fund |
Notes to Financial Statements
Note 1-Organization and Business
The MainStay Funds (the “Trust”) was organized on January 9, 1986, as a Massachusetts business trust. The Trust is registered under the Investment Company Act of 1940, as amended (the “1940 Act”), as an open-end management investment company, and is comprised of eleven funds (collectively referred to as the "Funds"). These financial statements and notes relate to the MainStay WMC Enduring Capital Fund (the "Fund"), a “diversified” fund, as that term is defined in the 1940 Act, as interpreted or modified by regulatory authorities having jurisdiction, from time to time.
The following table lists the Fund's share classes that have been registered and commenced operations:
| Class | Commenced Operations |
| Class A | June 1, 1998 |
| Investor Class | February 28, 2008 |
| Class B | June 1, 1998 |
| Class C | September 1, 1998 |
| Class I | December 28, 2004 |
| Class R3* | February 29, 2016 |
| Class R6 | April 26, 2021 |
| * | As of October 31, 2023, Class R3 shares are closed to new investors and, upon the close of business on December 29, 2023, Class R3 shares are closed to additional investments by existing shareholders. Additionally, Class R3 shares will be liquidated on or about February 28, 2024 (the "Liquidation Date"). It is expected that the Fund will distribute to remaining shareholders invested in Class R3 shares, on or promptly after the Liquidation Date, a liquidating distribution in cash or cash equivalents equal to the net asset value of such shares. |
Class B shares of the MainStay Group of Funds are closed to all new purchases as well as additional investments by existing Class B shareholders. Existing Class B shareholders may continue to reinvest dividends and capital gains distributions, as well as exchange their Class B shares for Class B shares of other funds in the MainStay Group of Funds as permitted by the current exchange privileges. Class B shareholders continue to be subject to any applicable contingent deferred sales charge ("CDSC") at the time of redemption. All other features of the Class B shares, including but not limited to the fees and expenses applicable to Class B shares, remain unchanged. Unless redeemed, Class B shareholders will remain in Class B shares of their respective fund until the Class B shares are converted to Class A or Investor Class shares pursuant to the applicable conversion schedule.
Class A and Investor Class shares are offered at net asset value (“NAV”) per share plus an initial sales charge. No initial sales charge applies to investments of $1 million or more (and certain other qualified purchases) in Class A and Investor Class shares. However, a CDSC of 1.00% may be imposed on certain redemptions made within 18 months of the date of purchase on shares that were purchased without an initial sales charge. Class C shares are offered at NAV without an initial sales charge, although a 1.00% CDSC may be imposed on certain redemptions of such shares made within one year of the date of purchase of Class C shares. When Class B shares were offered, they were offered at NAV without an
initial sales charge, although a CDSC that declines depending on the number of years a shareholder held its Class B shares may be imposed on certain redemptions of such shares made within six years of the date of purchase of such shares. Class I, Class R3 and Class R6 shares are offered at NAV without a sales charge. Depending upon eligibility, Class B shares convert to either Class A or Investor Class shares at the end of the calendar quarter eight years after the date they were purchased. In addition, depending upon eligibility, Class C shares convert to either Class A or Investor Class shares at the end of the calendar quarter eight years after the date they were purchased. Additionally, Investor Class shares may convert automatically to Class A shares. Under certain circumstances and as may be permitted by the Trust’s multiple class plan pursuant to Rule 18f-3 under the 1940 Act, specified share classes of the Fund may be converted to one or more other share classes of the Fund as disclosed in the capital share transactions within these Notes. The classes of shares have the same voting (except for issues that relate solely to one class), dividend, liquidation and other rights, and the same terms and conditions, except that under distribution plans pursuant to Rule 12b-1 under the 1940 Act, Class B and Class C shares are subject to higher distribution and/or service fees than Class A, Investor Class, Class R3 shares. Class I and Class R6 shares are not subject to a distribution and/or service fee. Class R3 shares are subject to a shareholder service fee, which is in addition to fees paid under the distribution plans for Class R3 shares.
At a meeting held on September 25-26, 2023, the Board of Trustees (the “Board”) of the Trust, after careful consideration of a number of factors and upon the recommendation of the Fund's investment adviser, New York Life Investment Management LLC (“New York Life Investments” or the "Manager"), approved a proposal to liquidate Class R3 shares of the Fund on or about February 28, 2024, pursuant to the terms of a plan of liquidation.
The Fund's investment objective is to seek long-term growth of capital.
Note 2–Significant Accounting Policies
The Fund is an investment company and accordingly follows the investment company accounting and reporting guidance of the Financial Accounting Standards Board (“FASB”) Accounting Standards Codification Topic 946 Financial Services—Investment Companies. The Fund prepares its financial statements in accordance with generally accepted accounting principles (“GAAP”) in the United States of America and follows the significant accounting policies described below.
(A) Securities Valuation. Investments are usually valued as of the close of regular trading on the New York Stock Exchange (the "Exchange") (usually 4:00 p.m. Eastern time) on each day the Fund is open for business ("valuation date").
Pursuant to Rule 2a-5 under the 1940 Act, the Board has designated New York Life Investments as its Valuation Designee (the "Valuation Designee"). The Valuation Designee is responsible for performing fair valuations relating to all investments in the Fund’s portfolio for which
Notes to Financial Statements (continued)
market quotations are not readily available; periodically assessing and managing material valuation risks; establishing and applying fair value methodologies; testing fair valuation methodologies; evaluating and overseeing pricing services; ensuring appropriate segregation of valuation and portfolio management functions; providing quarterly, annual and prompt reporting to the Board, as appropriate; identifying potential conflicts of interest; and maintaining appropriate records. The Valuation Designee has established a valuation committee ("Valuation Committee") to assist in carrying out the Valuation Designee’s responsibilities and establish prices of securities for which market quotations are not readily available. The Fund's and the Valuation Designee's policies and procedures ("Valuation Procedures") govern the Valuation Designee’s selection and application of methodologies for determining and calculating the fair value of Fund investments. The Valuation Designee may value the Fund's portfolio securities for which market quotations are not readily available and other Fund assets utilizing inputs from pricing services and other third-party sources. The Valuation Committee meets (in person, via electronic mail or via teleconference) on an ad-hoc basis to determine fair valuations and on a quarterly basis to review fair value events with respect to certain securities for which market quotations are not readily available, including valuation risks and back-testing results, and preview reports to the Board.
The Valuation Committee establishes prices of securities for which market quotations are not readily available based on such methodologies and measurements on a regular basis after considering information that is reasonably available and deemed relevant by the Valuation Committee. The Board shall oversee the Valuation Designee and review fair valuation materials on a prompt, quarterly and annual basis and approve proposed revisions to the Valuation Procedures.
Investments for which market quotations are not readily available are valued at fair value as determined in good faith pursuant to the Valuation Procedures. A market quotation is readily available only when that quotation is a quoted price (unadjusted) in active markets for identical investments that the Fund can access at the measurement date, provided that a quotation will not be readily available if it is not reliable. "Fair value" is defined as the price the Fund would reasonably expect to receive upon selling an asset or liability in an orderly transaction to an independent buyer in the principal or most advantageous market for the asset or liability. Fair value measurements are determined within a framework that establishes a three-tier hierarchy that maximizes the use of observable market data and minimizes the use of unobservable inputs to establish a classification of fair value measurements for disclosure purposes. "Inputs" refer broadly to the assumptions that market participants would use in pricing the asset or liability, including assumptions about risk, such as the risk inherent in a particular valuation technique used to measure fair value using a pricing model and/or the risk inherent in the inputs for the valuation technique. Inputs may be observable or unobservable. Observable inputs reflect the assumptions market participants would use in pricing the asset or liability based on market data obtained from sources independent of the Fund. Unobservable inputs reflect the Fund’s own assumptions about the assumptions market participants would use
in pricing the asset or liability based on the information available. The inputs or methodology used for valuing assets or liabilities may not be an indication of the risks associated with investing in those assets or liabilities. The three-tier hierarchy of inputs is summarized below.
| • | Level 1—quoted prices (unadjusted) in active markets for an identical asset or liability |
| • | Level 2—other significant observable inputs (including quoted prices for a similar asset or liability in active markets, interest rates and yield curves, prepayment speeds, credit risk, etc.) |
| • | Level 3—significant unobservable inputs (including the Fund's own assumptions about the assumptions that market participants would use in measuring fair value of an asset or liability) |
The level of an asset or liability within the fair value hierarchy is based on the lowest level of an input, both individually and in the aggregate, that is significant to the fair value measurement. The aggregate value by input level of the Fund’s assets and liabilities as of October 31, 2023, is included at the end of the Portfolio of Investments.
The Fund may use third-party vendor evaluations, whose prices may be derived from one or more of the following standard inputs, among others:
| • Broker/dealer quotes | • Benchmark securities |
| • Two-sided markets | • Reference data (corporate actions or material event notices) |
| • Bids/offers | • Monthly payment information |
| • Industry and economic events | • Reported trades |
An asset or liability for which a market quotation is not readily available is valued by methods deemed reasonable in good faith by the Valuation Committee, following the Valuation Procedures to represent fair value. Under these procedures, the Valuation Designee generally uses a market-based approach which may use related or comparable assets or liabilities, recent transactions, market multiples, book values and other relevant information. The Valuation Designee may also use an income-based valuation approach in which the anticipated future cash flows of the asset or liability are discounted to calculate fair value. Discounts may also be applied due to the nature and/or duration of any restrictions on the disposition of the asset or liability. Fair value represents a good faith approximation of the value of a security. Fair value determinations involve the consideration of a number of subjective factors, an analysis of applicable facts and circumstances and the exercise of judgment. As a result, it is possible that the fair value for a security determined in good faith in accordance with the Valuation Procedures may differ from valuations for the same security determined for other funds using their own valuation procedures. Although the Valuation Procedures are designed to value a security at the price the Fund may reasonably expect to receive upon the security's sale in an orderly transaction, there can be no assurance that any fair value determination thereunder would, in fact, approximate the amount that the Fund would actually realize upon the sale of the security or the price at which the security would trade if a reliable market price were readily
| 22 | MainStay WMC Enduring Capital Fund |
available. During the year ended October 31, 2023, there were no material changes to the fair value methodologies.
Securities which may be valued in this manner include, but are not limited to: (i) a security for which trading has been halted or suspended or otherwise does not have a readily available market quotation on a given day; (ii) a debt security that has recently gone into default and for which there is not a current market quotation; (iii) a security of an issuer that has entered into a restructuring; (iv) a security that has been delisted from a national exchange; (v) a security subject to trading collars for which no or limited trading takes place; and (vi) a security whose principal market has been temporarily closed at a time when, under normal conditions, it would be open. Securities valued in this manner are generally categorized as Level 2 or 3 in the hierarchy. As of October 31, 2023, securities that were fair valued in such a manner are shown in the Portfolio of Investments.
Certain securities held by the Fund may principally trade in foreign markets. Events may occur between the time the foreign markets close and the time at which the Fund's NAVs are calculated. These events may include, but are not limited to, situations relating to a single issuer in a market sector, significant fluctuations in U.S. or foreign markets, natural disasters, armed conflicts, governmental actions or other developments not tied directly to the securities markets. Should the Valuation Designee conclude that such events may have affected the accuracy of the last price of such securities reported on the local foreign market, the Valuation Designee may, pursuant to the Valuation Procedures, adjust the value of the local price to reflect the estimated impact on the price of such securities as a result of such events. In this instance, securities are generally categorized as Level 3 in the hierarchy. Additionally, certain foreign equity securities are also fair valued whenever the movement of a particular index exceeds certain thresholds. In such cases, the securities are fair valued by applying factors provided by a third-party vendor in accordance with the Valuation Procedures and are generally categorized as Level 2 in the hierarchy. No foreign equity securities held by the Fund as of October 31, 2023 were fair valued in such a manner.
If the principal market of certain foreign equity securities is closed in observance of a local foreign holiday, these securities are valued using the last closing price of regular trading on the relevant exchange and fair valued by applying factors provided by a third-party vendor in accordance with the Valuation Procedures. These securities are generally categorized as Level 2 in the hierarchy. No securities held by the Fund as of October 31, 2023, were fair valued in such a manner.
Equity securities, rights and warrants, if applicable, are valued at the last quoted sales prices as of the close of regular trading on the relevant exchange on each valuation date. Securities that are not traded on the valuation date are valued at the mean of the last quoted bid and ask prices. Prices are normally taken from the principal market in which each security trades. These securities are generally categorized as Level 1 in the hierarchy.
Investments in mutual funds, including money market funds, are valued at their respective NAVs at the close of business each day on the valuation date. These securities are generally categorized as Level 1 in the hierarchy.
Temporary cash investments acquired in excess of 60 days to maturity at the time of purchase are valued using the latest bid prices or using valuations based on a matrix system (which considers such factors as security prices, yields, maturities and ratings), both as furnished by independent pricing services. Temporary cash investments that mature in 60 days or less at the time of purchase ("Short-Term Investments") are valued using the amortized cost method of valuation, unless the use of such method would be inappropriate. The amortized cost method involves valuing a security at its cost on the date of purchase and thereafter assuming a constant amortization to maturity of the difference between such cost and the value on maturity date. Amortized cost approximates the current fair value of a security. Securities valued using the amortized cost method are not valued using quoted prices in an active market and are generally categorized as Level 2 in the hierarchy.
The information above is not intended to reflect an exhaustive list of the methodologies that may be used to value portfolio investments. The Valuation Procedures permit the use of a variety of valuation methodologies in connection with valuing portfolio investments. The methodology used for a specific type of investment may vary based on the market data available or other considerations. The methodologies summarized above may not represent the specific means by which portfolio investments are valued on any particular business day.
(B) Income Taxes. The Fund's policy is to comply with the requirements of the Internal Revenue Code of 1986, as amended (the “Internal Revenue Code”), applicable to regulated investment companies and to distribute all of its taxable income to the shareholders of the Fund within the allowable time limits.
The Manager evaluates the Fund’s tax positions to determine if the tax positions taken meet the minimum recognition threshold in connection with accounting for uncertainties in income tax positions taken or expected to be taken for the purposes of measuring and recognizing tax liabilities in the financial statements. Recognition of tax benefits of an uncertain tax position is permitted only to the extent the position is “more likely than not” to be sustained assuming examination by taxing authorities. The Manager analyzed the Fund's tax positions taken on federal, state and local income tax returns for all open tax years (for up to three tax years) and has concluded that no provisions for federal, state and local income tax are required in the Fund's financial statements. The Fund's federal, state and local income tax and federal excise tax returns for tax years for which the applicable statutes of limitations have not expired are subject to examination by the Internal Revenue Service and state and local departments of revenue.
(C) Foreign Taxes. The Fund may be subject to foreign taxes on income and other transaction-based taxes imposed by certain countries in which it invests. A portion of the taxes on gains on investments or
Notes to Financial Statements (continued)
currency purchases/repatriation may be reclaimable. The Fund will accrue such taxes and reclaims as applicable, based upon its current interpretation of tax rules and regulations that exist in the markets in which it invests.
The Fund may be subject to taxation on realized capital gains, repatriation proceeds and other transaction-based taxes imposed by certain countries in which it invests. The Fund will accrue such taxes as applicable based upon its current interpretation of tax rules and regulations that exist in the market in which it invests. Capital gains taxes relating to positions still held are reflected as a liability in the Statement of Assets and Liabilities, as well as an adjustment to the Fund's net unrealized appreciation (depreciation). Taxes related to capital gains realized, if any, are reflected as part of net realized gain (loss) in the Statement of Operations. Changes in tax liabilities related to capital gains taxes on unrealized investment gains, if any, are reflected as part of the change in net unrealized appreciation (depreciation) on investments in the Statement of Operations. Transaction-based charges are generally assessed as a percentage of the transaction amount.
(D) Dividends and Distributions to Shareholders. Dividends and distributions are recorded on the ex-dividend date. The Fund intends to declare and pay dividends from net investment income and distributions from net realized capital and currency gains, if any, at least annually. Unless a shareholder elects otherwise, all dividends and distributions are reinvested at NAV in the same class of shares of the Fund. Dividends and distributions to shareholders are determined in accordance with federal income tax regulations and may differ from determinations using GAAP.
(E) Security Transactions and Investment Income. The Fund records security transactions on the trade date. Realized gains and losses on security transactions are determined using the identified cost method. Dividend income is recognized on the ex-dividend date, net of any foreign tax withheld at the source, and interest income is accrued as earned using the effective interest rate method. Distributions received from real estate investment trusts may be classified as dividends, capital gains and/or return of capital.
Investment income and realized and unrealized gains and losses on investments of the Fund are allocated pro rata to the separate classes of shares based upon their relative net assets on the date the income is earned or realized and unrealized gains and losses are incurred.
(F) Expenses. Expenses of the Trust are allocated to the individual Funds in proportion to the net assets of the respective Funds when the expenses are incurred, except where direct allocations of expenses can be made. Expenses (other than transfer agent expenses and fees incurred under the shareholder services plans and/or the distribution plans further discussed in Note 3(B)) are allocated to separate classes of shares pro rata based upon their relative net assets on the date the expenses are incurred. The expenses borne by the Fund, including those of related parties to the Fund, are shown in the Statement of Operations.
Additionally, the Fund may invest in mutual funds, which are subject to management fees and other fees that may cause the costs of investing in
mutual funds to be greater than the costs of owning the underlying securities directly. These indirect expenses of mutual funds are not included in the amounts shown as expenses in the Statement of Operations or in the expense ratios included in the Financial Highlights.
(G) Use of Estimates. In preparing financial statements in conformity with GAAP, the Manager makes estimates and assumptions that affect the reported amounts and disclosures in the financial statements. Actual results could differ from those estimates and assumptions.
(H) Foreign Currency Transactions. The Fund's books and records are maintained in U.S. dollars. Prices of securities denominated in foreign currency amounts are translated into U.S. dollars at the mean between the buying and selling rates last quoted by any major U.S. bank at the following dates:
(i) market value of investment securities, other assets and liabilities— at the valuation date; and
(ii) purchases and sales of investment securities, income and expenses—at the date of such transactions.
The assets and liabilities that are denominated in foreign currency amounts are presented at the exchange rates and market values at the close of the period. The realized and unrealized changes in net assets arising from fluctuations in exchange rates and market prices of securities are not separately presented.
Net realized gain (loss) on foreign currency transactions represents net currency gains or losses realized as a result of differences between the amounts of securities sale proceeds or purchase cost, dividends, interest and withholding taxes as recorded on the Fund's books, and the U.S. dollar equivalent amount actually received or paid. Net currency gains or losses from valuing such foreign currency denominated assets and liabilities, other than investments at valuation date exchange rates, are reflected in unrealized foreign exchange gains or losses.
(I) Securities Lending. In order to realize additional income, the Fund may engage in securities lending, subject to the limitations set forth in the 1940 Act and relevant guidance by the staff of the Securities and Exchange Commission (“SEC”). If the Fund engages in securities lending, the Fund will lend through its custodian, JPMorgan Chase Bank, N.A., ("JPMorgan"), acting as securities lending agent on behalf of the Fund. Under the current arrangement, JPMorgan will manage the Fund's collateral in accordance with the securities lending agency agreement between the Fund and JPMorgan, and indemnify the Fund against counterparty risk. The loans will be collateralized by cash (which may be invested in a money market fund) and/or non-cash collateral (which may include U.S. Treasury securities and/or U.S. government agency securities issued or guaranteed by the United States government or its agencies or instrumentalities) at least equal at all times to the market value of the securities loaned. Non-cash collateral held at year end is segregated and cannot be transferred by the Fund. The Fund bears the risk of delay in recovery of, or loss of rights in, the securities loaned. The Fund may also record a realized gain or loss on securities deemed sold due to a
| 24 | MainStay WMC Enduring Capital Fund |
borrower’s inability to return securities on loan. The Fund bears the risk of any loss on investment of cash collateral. The Fund will receive compensation for lending its securities in the form of fees or it will retain a portion of interest earned on the investment of any cash collateral. The Fund will also continue to receive interest and dividends on the securities loaned and any gain or loss in the market price of the securities loaned that may occur during the term of the loan will be for the account of the Fund. Income earned from securities lending activities, if any, is reflected in the Statement of Operations. Securities on loan as of October 31, 2023, are shown in the Portfolio of Investments.
(J) Rights and Warrants. Rights are certificates that permit the holder to purchase a certain number of shares, or a fractional share, of a new stock from the issuer at a specific price. Warrants are instruments that entitle the holder to buy an equity security at a specific price for a specific period of time. These investments can provide a greater potential for profit or loss than an equivalent investment in the underlying security. Prices of these investments do not necessarily move in tandem with the prices of the underlying securities.
There is risk involved in the purchase of rights and warrants in that these investments are speculative investments. The Fund could also lose the entire value of its investment in warrants if such warrants are not exercised by the date of its expiration. The Fund is exposed to risk until the sale or exercise of each right or warrant is completed. Rights and Warrants as of October 31, 2023 are shown in the Portfolio of Investments.
(K) Indemnifications. Under the Trust’s organizational documents, its officers and trustees are indemnified against certain liabilities that may arise out of performance of their duties to the Trust. Additionally, in the normal course of business, the Fund enters into contracts with third-party service providers that contain a variety of representations and warranties and that may provide general indemnifications. The Fund's maximum exposure under these arrangements is unknown, as this would involve future claims that may be made against the Fund that have not yet occurred. The Manager believes that the risk of loss in connection with these potential indemnification obligations is remote. However, there can be no assurance that material liabilities related to such obligations will not arise in the future, which could adversely impact the Fund.
Note 3–Fees and Related Party Transactions
(A) Manager and Subadvisor. New York Life Investments, a registered investment adviser and an indirect, wholly-owned subsidiary of New York Life Insurance Company ("New York Life"), serves as the Fund's Manager, pursuant to an Amended and Restated Management Agreement ("Management Agreement"). The Manager provides offices, conducts clerical, recordkeeping and bookkeeping services and keeps most of the financial and accounting records required to be maintained by the Fund. Except for the portion of salaries and expenses that are the responsibility of the Fund, the Manager pays the salaries and expenses of all personnel affiliated with the Fund and certain operational expenses of the Fund. The Fund reimburses New York Life Investments in an amount equal to the
portion of the compensation of the Chief Compliance Officer attributable to the Fund. Wellington Management Company LLP ("Wellington" or the "Subadvisor"), a registered investment adviser, serves as the Subadvisor to the Fund and is responsible for the day-to-day portfolio management of the Fund. Pursuant to the terms of a Subadvisory Agreement ("Subadvisory Agreement") between New York Life Investments and Wellington, New York Life Investments pays for the services of the Subadvisor.
Pursuant to the Management Agreement, the Fund pays the Manager a monthly fee for the services performed and the facilities furnished at an annual rate of the Fund’s average daily net assets as follows: 0.55% up to $500 million; 0.525% from $500 million to $1 billion; and 0.50% on assets in excess of $1 billion. During the year ended October 31, 2023, the effective management fee rate was 0.55%.
New York Life Investments has contractually agreed to waive fees and/or reimburse expenses so that Class R6 fees and expenses do not exceed those of Class I. This agreement will remain in effect until February 28, 2024, and shall renew automatically for one-year terms unless New York Life Investments provides written notice of termination prior to the start of the next term or upon approval of the Board.
New York Life Investments has agreed to voluntarily waive fees and/or reimburse expenses of the appropriate class of the Fund so that Total Annual Fund Operating Expenses (excluding taxes, interest, litigation, extraordinary expenses, brokerage and other transaction expenses relating to the purchase and sale of portfolio investments, and acquired (underlying) fund fees and expenses) of a class do not exceed the following percentages of average daily net assets: Investor Class, 1.85%; Class B, 2.60%; and Class C, 2.60%. These voluntary waivers or reimbursements may be discontinued at any time without notice.
During the year ended October 31, 2023, New York Life Investments earned fees from the Fund in the amount of $3,152,197 and paid the Subadvisor fees in the amount of $1,371,361.
JPMorgan provides sub-administration and sub-accounting services to the Fund pursuant to an agreement with New York Life Investments. These services include calculating the daily NAVs of the Fund, maintaining the general ledger and sub-ledger accounts for the calculation of the Fund's NAVs, and assisting New York Life Investments in conducting various aspects of the Fund's administrative operations. For providing these services to the Fund, JPMorgan is compensated by New York Life Investments.
Pursuant to an agreement between the Trust and New York Life Investments, New York Life Investments is responsible for providing or procuring certain regulatory reporting services for the Fund. The Fund will reimburse New York Life Investments for the actual costs incurred by New York Life Investments in connection with providing or procuring these services for the Fund.
Notes to Financial Statements (continued)
(B) Distribution and Service Fees. The Trust, on behalf of the Fund, has entered into a distribution agreement with NYLIFE Distributors LLC (the “Distributor”), an affiliate of New York Life Investments. The Fund has adopted distribution plans (the “Plans”) in accordance with the provisions of Rule 12b-1 under the 1940 Act.
Pursuant to the Class A and Investor Class Plans, the Distributor receives a monthly fee from the Class A and Investor Class shares at an annual rate of 0.25% of the average daily net assets of the Class A and Investor Class shares for distribution and/or service activities as designated by the Distributor. Pursuant to the Class B and Class C Plans, Class B and Class C shares pay the Distributor a monthly distribution fee at an annual rate of 0.75% of the average daily net assets of the Class B and Class C shares, along with a service fee at an annual rate of 0.25% of the average daily net assets of the Class B and Class C shares, for a total 12b-1 fee of 1.00%. Pursuant to the Class R3 Plan, Class R3 shares pay the Distributor a monthly distribution fee at an annual rate of 0.25% of the average daily net assets of the Class R3 shares, along with a service fee at an annual rate of 0.25% of the average daily net assets of the Class R3 shares, for a total 12b-1 fee of 0.50%. Class I and Class R6 shares are not subject to a distribution and/or service fee.
The Plans provide that the distribution and service fees are payable to the Distributor regardless of the amounts actually expended by the Distributor for distribution of the Fund's shares and service activities.
In accordance with the Shareholder Services Plans for the Class R3 shares, the Manager has agreed to provide, through its affiliates or independent third parties, various shareholder and administrative support services to shareholders of the Class R3 shares. For its services, the Manager, its affiliates or independent third-party service providers are entitled to a shareholder service fee accrued daily and paid monthly at an annual rate of 0.10% of the average daily net assets of the Class R3 shares. This is in addition to any fees paid under the Class R3 Plan.
During the year ended October 31, 2023, shareholder service fees incurred by the Fund were as follows:
(C) Sales Charges. The Fund was advised by the Distributor that the amount of initial sales charges retained on sales of Class A and Investor Class shares during the year ended October 31, 2023, were $35,168 and $3,918, respectively.
The Fund was also advised that the Distributor retained CDSCs on redemptions of Class A, Class B and Class C shares during the year ended October 31, 2023, of $7,946, $3 and $239, respectively.
(D) Transfer, Dividend Disbursing and Shareholder Servicing Agent. NYLIM Service Company LLC, an affiliate of New York Life Investments, is the Fund's transfer, dividend disbursing and shareholder servicing agent pursuant to an agreement between NYLIM Service Company LLC and the Trust. NYLIM Service Company LLC has entered into an agreement with SS&C Global Investor & Distribution Solutions, Inc.
("SS&C"), pursuant to which SS&C performs certain transfer agent services on behalf of NYLIM Service Company LLC. New York Life Investments has contractually agreed to limit the transfer agency expenses charged to the Fund’s share classes to a maximum of 0.35% of that share class’s average daily net assets on an annual basis after deducting any applicable Fund or class-level expense reimbursement or small account fees. This agreement will remain in effect until February 28, 2024, and shall renew automatically for one-year terms unless New York Life Investments provides written notice of termination prior to the start of the next term or upon approval of the Board. During the year ended October 31, 2023, transfer agent expenses incurred by the Fund and any reimbursements, pursuant to the aforementioned Transfer Agency expense limitation agreement, were as follows:
| Class | Expense | Waived |
| Class A | $175,360 | $— |
| Investor Class | 73,030 | — |
| Class B | 7,007 | — |
| Class C | 64,586 | — |
| Class I | 75,538 | — |
| Class R3 | 650 | — |
| Class R6 | 9,395 | — |
(E) Small Account Fee. Shareholders with small accounts adversely impact the cost of providing transfer agency services. In an effort to reduce total transfer agency expenses, the Fund has implemented a small account fee on certain types of accounts. As described in the Fund's prospectus, certain shareholders with an account balance of less than $1,000 ($5,000 for Class A share accounts) are charged an annual per account fee of $20 (assessed semi-annually), the proceeds from which offset transfer agent fees as reflected in the Statement of Operations. This small account fee will not apply to certain types of accounts as described further in the Fund’s prospectus.
(F) Capital. As of October 31, 2023, New York Life and its affiliates beneficially held shares of the Fund with the values and percentages of net assets as follows:
| Class R3 | $55,044 | 6.5% |
| Class R6 | 39,288 | 0.0‡ |
| ‡ | Less than one-tenth of a percent. |
| 26 | MainStay WMC Enduring Capital Fund |
Note 4-Federal Income Tax
As of October 31, 2023, the cost and unrealized appreciation (depreciation) of the Fund’s investment portfolio, including applicable derivative contracts and other financial instruments, as determined on a federal income tax basis, were as follows:
| | Federal Tax
Cost | Gross
Unrealized
Appreciation | Gross
Unrealized
(Depreciation) | Net
Unrealized
Appreciation/
(Depreciation) |
| Investments in Securities | $411,844,749 | $98,058,826 | $(38,313,548) | $59,745,278 |
As of October 31, 2023, the components of accumulated gain (loss) on a tax basis were as follows:
Ordinary
Income | Accumulated
Capital
and Other
Gain (Loss) | Other
Temporary
Differences | Unrealized
Appreciation
(Depreciation) | Total
Accumulated
Gain (Loss) |
| $2,572,169 | $(7,238,905) | $— | $59,745,283 | $55,078,547 |
The difference between book-basis and tax-basis unrealized appreciation (depreciation) is primarily due to wash sale adjustments.
The following table discloses the current year reclassifications between total distributable earnings (loss) and additional paid-in capital arising from permanent differences; net assets as of October 31, 2023 were not affected.
| | Total
Distributable
Earnings (Loss) | Additional
Paid-In
Capital |
| | $(40,917) | $40,917 |
The reclassifications for the Fund are primarily due to equalization.
As of October 31, 2023, for federal income tax purposes, capital loss carryforwards of $7,238,905, as shown in the table below, were available to the extent provided by the regulations to offset future realized gains of the Fund. Accordingly, no capital gains distributions are expected to be paid to shareholders until net gains have been realized in excess of such amounts.
Capital Loss
Available Through | Short-Term
Capital Loss
Amounts (000’s) | Long-Term
Capital Loss
Amounts (000’s) |
| Unlimited | $1,196 | $6,043 |
During the years ended October 31, 2023 and October 31, 2022, the tax character of distributions paid as reflected in the Statements of Changes in Net Assets was as follows:
| | 2023 | 2022 |
| Distributions paid from: | | |
| Ordinary Income | $13,213,407 | $24,964,525 |
| Long-Term Capital Gains | 8,433,654 | 33,082,933 |
| Total | $21,647,061 | $58,047,458 |
Note 5–Custodian
JPMorgan is the custodian of cash and securities held by the Fund. Custodial fees are charged to the Fund based on the Fund's net assets and/or the market value of securities held by the Fund and the number of certain transactions incurred by the Fund.
Note 6–Line of Credit
The Fund and certain other funds managed by New York Life Investments maintain a line of credit with a syndicate of banks in order to secure a source of funds for temporary purposes to meet unanticipated or excessive redemption requests.
Effective July 25, 2023, under the credit agreement (the “Credit Agreement”), the aggregate commitment amount is $600,000,000 with an additional uncommitted amount of $100,000,000. The commitment fee is an annual rate of 0.15% of the average commitment amount payable quarterly, regardless of usage, to JPMorgan, who serves as the agent to the syndicate. The commitment fee is allocated among the Fund and certain other funds managed by New York Life Investments based upon their respective net assets and other factors. Interest on any revolving credit loan is charged based upon the Federal Funds Rate, Daily Simple Secured Overnight Financing Rate ("SOFR") + 0.10%, or the Overnight Bank Funding Rate, whichever is higher. The Credit Agreement expires on July 23, 2024, although the Fund, certain other funds managed by New York Life Investments and the syndicate of banks may renew the Credit Agreement for an additional year on the same or different terms or enter into a credit agreement with a different syndicate of banks. Prior to July 25, 2023, the aggregate commitment amount and the commitment fee were the same as those under the current Credit Agreement. During the year ended October 31, 2023, there were no borrowings made or outstanding with respect to the Fund under the Credit Agreement.
Note 7–Interfund Lending Program
Pursuant to an exemptive order issued by the SEC, the Fund, along with certain other funds managed by New York Life Investments, may participate in an interfund lending program. The interfund lending program provides an alternative credit facility that permits the Fund and certain other funds managed by New York Life Investments to lend or borrow money for temporary purposes directly to or from one another, subject to the conditions of the exemptive order. During the year ended October 31, 2023, there were no interfund loans made or outstanding with respect to the Fund.
Note 8–Purchases and Sales of Securities (in 000’s)
During the year ended October 31, 2023, purchases and sales of securities, other than short-term securities, were $94,990 and $167,029, respectively.
Notes to Financial Statements (continued)
Note 9–Capital Share Transactions
Transactions in capital shares for the years ended October 31, 2023 and October 31, 2022, were as follows:
| Class A | Shares | Amount |
| Year ended October 31, 2023: | | |
| Shares sold | 777,331 | $ 23,810,633 |
| Shares issued to shareholders in reinvestment of distributions | 247,479 | 7,533,253 |
| Shares redeemed | (1,019,479) | (31,269,191) |
| Net increase (decrease) in shares outstanding before conversion | 5,331 | 74,695 |
| Shares converted into Class A (See Note 1) | 78,147 | 2,366,476 |
| Shares converted from Class A (See Note 1) | (151) | (4,661) |
| Net increase (decrease) | 83,327 | $ 2,436,510 |
| Year ended October 31, 2022: | | |
| Shares sold | 964,328 | $ 31,211,920 |
| Shares issued to shareholders in reinvestment of distributions | 549,149 | 18,594,184 |
| Shares redeemed | (1,313,198) | (41,861,145) |
| Net increase (decrease) in shares outstanding before conversion | 200,279 | 7,944,959 |
| Shares converted into Class A (See Note 1) | 118,908 | 3,952,416 |
| Shares converted from Class A (See Note 1) | (2,122) | (64,560) |
| Net increase (decrease) | 317,065 | $ 11,832,815 |
| |
| Investor Class | Shares | Amount |
| Year ended October 31, 2023: | | |
| Shares sold | 29,849 | $ 915,511 |
| Shares issued to shareholders in reinvestment of distributions | 28,225 | 859,163 |
| Shares redeemed | (67,503) | (2,064,768) |
| Net increase (decrease) in shares outstanding before conversion | (9,429) | (290,094) |
| Shares converted into Investor Class (See Note 1) | 18,857 | 587,855 |
| Shares converted from Investor Class (See Note 1) | (45,909) | (1,390,486) |
| Net increase (decrease) | (36,481) | $ (1,092,725) |
| Year ended October 31, 2022: | | |
| Shares sold | 35,401 | $ 1,145,205 |
| Shares issued to shareholders in reinvestment of distributions | 70,920 | 2,401,347 |
| Shares redeemed | (70,871) | (2,264,176) |
| Net increase (decrease) in shares outstanding before conversion | 35,450 | 1,282,376 |
| Shares converted into Investor Class (See Note 1) | 21,377 | 677,516 |
| Shares converted from Investor Class (See Note 1) | (87,635) | (2,969,099) |
| Net increase (decrease) | (30,808) | $ (1,009,207) |
| |
| Class B | Shares | Amount |
| Year ended October 31, 2023: | | |
| Shares sold | 73 | $ 2,000 |
| Shares issued to shareholders in reinvestment of distributions | 4,112 | 109,752 |
| Shares redeemed | (16,415) | (431,503) |
| Net increase (decrease) in shares outstanding before conversion | (12,230) | (319,751) |
| Shares converted from Class B (See Note 1) | (35,872) | (966,410) |
| Net increase (decrease) | (48,102) | $ (1,286,161) |
| Year ended October 31, 2022: | | |
| Shares sold | 1,841 | $ 53,478 |
| Shares issued to shareholders in reinvestment of distributions | 14,748 | 443,192 |
| Shares redeemed | (23,125) | (653,846) |
| Net increase (decrease) in shares outstanding before conversion | (6,536) | (157,176) |
| Shares converted from Class B (See Note 1) | (38,436) | (1,074,180) |
| Net increase (decrease) | (44,972) | $ (1,231,356) |
| |
| Class C | Shares | Amount |
| Year ended October 31, 2023: | | |
| Shares sold | 32,846 | $ 872,256 |
| Shares issued to shareholders in reinvestment of distributions | 34,072 | 908,718 |
| Shares redeemed | (294,528) | (7,872,021) |
| Net increase (decrease) in shares outstanding before conversion | (227,610) | (6,091,047) |
| Shares converted from Class C (See Note 1) | (22,080) | (583,195) |
| Net increase (decrease) | (249,690) | $ (6,674,242) |
| Year ended October 31, 2022: | | |
| Shares sold | 24,436 | $ 690,062 |
| Shares issued to shareholders in reinvestment of distributions | 108,949 | 3,270,638 |
| Shares redeemed | (352,310) | (10,083,915) |
| Net increase (decrease) in shares outstanding before conversion | (218,925) | (6,123,215) |
| Shares converted from Class C (See Note 1) | (21,155) | (586,653) |
| Net increase (decrease) | (240,080) | $ (6,709,868) |
| |
| 28 | MainStay WMC Enduring Capital Fund |
| Class I | Shares | Amount |
| Year ended October 31, 2023: | | |
| Shares sold | 1,177,378 | $ 35,968,422 |
| Shares issued to shareholders in reinvestment of distributions | 120,167 | 3,678,308 |
| Shares redeemed | (1,227,165) | (37,749,795) |
| Net increase (decrease) in shares outstanding before conversion | 70,380 | 1,896,935 |
| Shares converted into Class I (See Note 1) | 150 | 4,661 |
| Shares converted from Class I (See Note 1) | (466) | (14,240) |
| Net increase (decrease) | 70,064 | $ 1,887,356 |
| Year ended October 31, 2022: | | |
| Shares sold | 981,052 | $ 32,552,040 |
| Shares issued to shareholders in reinvestment of distributions | 299,886 | 10,205,117 |
| Shares redeemed | (2,493,569) | (85,095,425) |
| Net increase (decrease) in shares outstanding before conversion | (1,212,631) | (42,338,268) |
| Shares converted into Class I (See Note 1) | 2,107 | 64,560 |
| Net increase (decrease) | (1,210,524) | $ (42,273,708) |
| |
| Class R3 | Shares | Amount |
| Year ended October 31, 2023: | | |
| Shares sold | 10,803 | $ 327,040 |
| Shares issued to shareholders in reinvestment of distributions | 590 | 17,802 |
| Shares redeemed | (1,533) | (48,413) |
| Net increase (decrease) | 9,860 | $ 296,429 |
| Year ended October 31, 2022: | | |
| Shares sold | 8,459 | $ 246,328 |
| Shares issued to shareholders in reinvestment of distributions | 993 | 33,389 |
| Shares redeemed | (3,717) | (113,830) |
| Net increase (decrease) | 5,735 | $ 165,887 |
| |
| Class R6 | Shares | Amount |
| Year ended October 31, 2023: | | |
| Shares sold | 2,095,234 | $ 64,032,723 |
| Shares issued to shareholders in reinvestment of distributions | 270,980 | 8,289,276 |
| Shares redeemed | (3,722,309) | (118,118,610) |
| Net increase (decrease) | (1,356,095) | $ (45,796,611) |
| Year ended October 31, 2022: | | |
| Shares sold | 628,462 | $ 20,556,193 |
| Shares issued to shareholders in reinvestment of distributions | 658,656 | 22,407,486 |
| Shares redeemed | (1,881,346) | (61,194,703) |
| Net increase (decrease) | (594,228) | $ (18,231,024) |
Note 10–Other Matters
As of the date of this report, the Fund faces a heightened level of risk associated with current uncertainty, volatility and state of economies, financial markets, rising interest rates, and labor and health conditions around the world. Events such as war, acts of terrorism, recessions, rapid inflation, the imposition of international sanctions, earthquakes, hurricanes, epidemics and pandemics and other unforeseen natural or human disasters may have broad adverse social, political and economic effects on the global economy, which could negatively impact the value of the Fund's investments. Developments that disrupt global economies and financial markets may magnify factors that affect the Fund's performance.
Note 11–Subsequent Events
In connection with the preparation of the financial statements of the Fund as of and for the year ended October 31, 2023, events and transactions subsequent to October 31, 2023, through the date the financial statements were issued, have been evaluated by the Manager for possible adjustment and/or disclosure. No subsequent events requiring financial statement adjustment or disclosure have been identified.
Report of Independent Registered Public Accounting Firm
To the Shareholders of the Fund and Board of Trustees
The MainStay Funds:
Opinion on the Financial Statements
We have audited the accompanying statement of assets and liabilities of MainStay WMC Enduring Capital Fund (the Fund), one of the funds constituting The MainStay Funds, including the portfolio of investments, as of October 31, 2023, the related statement of operations for the year then ended, the statements of changes in net assets for each of the years in the two-year period then ended, and the related notes (collectively, the financial statements) and the financial highlights for each of the years or periods in the five-year period then ended. In our opinion, the financial statements and financial highlights present fairly, in all material respects, the financial position of the Fund as of October 31, 2023, the results of its operations for the year then ended, the changes in its net assets for each of the years in the two-year period then ended, and the financial highlights for each of the years or periods in the five-year period then ended, in conformity with U.S. generally accepted accounting principles.
Basis for Opinion
These financial statements and financial highlights are the responsibility of the Fund's management. Our responsibility is to express an opinion on these financial statements and financial highlights based on our audits. We are a public accounting firm registered with the Public Company Accounting Oversight Board (United States) (PCAOB) and are required to be independent with respect to the Fund in accordance with the U.S. federal securities laws and the applicable rules and regulations of the Securities and Exchange Commission and the PCAOB.
We conducted our audits in accordance with the standards of the PCAOB. Those standards require that we plan and perform the audit to obtain reasonable assurance about whether the financial statements and financial highlights are free of material misstatement, whether due to error or fraud. Our audits included performing procedures to assess the risks of material misstatement of the financial statements and financial highlights, whether due to error or fraud, and performing procedures that respond to those risks. Such procedures included examining, on a test basis, evidence regarding the amounts and disclosures in the financial statements and financial highlights. Such procedures also included confirmation of securities owned as of October 31, 2023, by correspondence with the custodians, the transfer agent and brokers; when replies were not received from brokers, we performed other auditing procedures. Our audits also included evaluating the accounting principles used and significant estimates made by management, as well as evaluating the overall presentation of the financial statements and financial highlights. We believe that our audits provide a reasonable basis for our opinion.

We have served as the auditor of one or more New York Life Investment Management investment companies since 2003.
Philadelphia, Pennsylvania
December 22, 2023
| 30 | MainStay WMC Enduring Capital Fund |
Federal Income Tax Information
(Unaudited)
The Fund is required under the Internal Revenue Code to advise shareholders in a written statement as to the federal tax status of dividends paid by the Fund during such fiscal years. Accordingly, the Fund paid $8,433,654 as long term capital gain distributions.
For the fiscal year ended October 31, 2023, the Fund designated approximately $6,314,488 under the Internal Revenue Code as qualified dividend income eligible for reduced tax rates.
The dividends paid by the Fund during the fiscal year ended October 31, 2023 should be multiplied by 39.56% to arrive at the amount eligible for the corporate dividend-received deduction.
In February 2024, shareholders will receive an IRS Form 1099-DIV or substitute Form 1099, which will show the federal tax status of the distributions received by shareholders in calendar year 2023. The amounts that will be reported on such 1099-DIV or substitute Form 1099 will be the amounts you are to use on your federal income tax return and will differ from the amounts which we must report for the Fund's fiscal year ended October 31, 2023.
Proxy Voting Policies and Procedures and Proxy Voting Record
The Fund is required to file with the SEC its proxy voting record for the 12-month period ending June 30 on Form N-PX. A description of the policies and procedures that are used to vote proxies relating to portfolio securities of the Fund is available free of charge upon request by calling 800-624-6782 or visiting the SEC’s website at www.sec.gov. The most recent Form N-PX or proxy voting record is available free of charge upon request by calling 800-624-6782; visiting newyorklifeinvestments.com; or visiting the SEC’s website at www.sec.gov.
Shareholder Reports and Quarterly Portfolio Disclosure
The Fund is required to file its complete schedule of portfolio holdings with the SEC 60 days after its first and third fiscal quarter on Form N-PORT. The Fund's holdings report is available free of charge upon request by calling New York Life Investments at 800-624-6782.
Board of Trustees and Officers (Unaudited)
The Trustees and officers of the Fund are listed below. The Board oversees the MainStay Group of Funds (which consists of MainStay Funds and MainStay Funds Trust), MainStay VP Funds Trust, MainStay MacKay DefinedTerm Municipal Opportunities Fund, MainStay CBRE Global Infrastructure Megatrends Term Fund, the Manager and the Subadvisors, and elects the officers of the Funds who are responsible for the day-to-day operations of the Fund. Information pertaining to the Trustees and officers is set forth below. Each Trustee serves until his or her successor is elected and qualified or until his or her resignation, death or
removal. Under the Board’s retirement policy, unless an exception is made, a Trustee must tender his or her resignation by the end of the calendar year during which he or she reaches the age of 75. Officers are elected annually by the Board. The business address of each Trustee and officer listed below is 51 Madison Avenue, New York, New York 10010. A majority of the Trustees are not “interested persons” (as defined by the 1940 Act and rules adopted by the SEC thereunder) of the Fund (“Independent Trustees”).
| | Name and
Year of Birth | Term of Office,
Position(s) Held and
Length of Service | Principal Occupation(s)
During Past Five Years | Number of
Portfolios in
Fund Complex
Overseen by
Trustee | Other Directorships
Held by Trustee |
| | | | | | |
| | Naïm Abou-Jaoudé*
1966 | MainStay Funds: Trustee
since 2023
MainStay Funds Trust:
Trustee since 2023 | Chief Executive Officer of New York Life Investment Management LLC (since 2023). Chief Executive Officer of Candriam (an affiliate of New York Life Investment Management LLC) (2007 to 2023). | 81 | MainStay VP Funds Trust:
Trustee since 2023 (31 portfolios);
MainStay MacKay DefinedTerm Municipal Opportunities Fund: Trustee
since 2023;
MainStay CBRE Global Infrastructure Megatrends Term Fund: Trustee
since 2023; and
New York Life Investment Management International (Chair) since 2015 |
| * | This Trustee is considered to be an “interested person” of the MainStay Group of Funds, MainStay VP Funds Trust, MainStay CBRE Global Infrastructure Megatrends Term Fund and MainStay MacKay DefinedTerm Municipal Opportunities Fund, within the meaning of the 1940 Act because of his affiliation with New York Life Investment Management LLC and Candriam, as described in detail above in the column entitled “Principal Occupation(s) During Past Five Years.” |
| | |
| 32 | MainStay WMC Enduring Capital Fund |
| | Name and
Year of Birth | Term of Office,
Position(s) Held and
Length of Service | Principal Occupation(s)
During Past Five Years | Number of
Portfolios in
Fund Complex
Overseen by
Trustee | Other Directorships
Held by Trustee |
| | | | | | |
| | David H. Chow
1957 | MainStay Funds: Trustee since January 2016, Advisory Board Member (June 2015 to December 2015);MainStay Funds Trust:
Trustee since January 2016, Advisory Board Member (June 2015 to December 2015) | Founder and CEO, DanCourt Management, LLC (since 1999) | 81 | MainStay VP Funds Trust: Trustee since January 2016, Advisory Board Member (June 2015 to December 2015) (31 portfolios);
MainStay MacKay DefinedTerm Municipal Opportunities Fund: Trustee since January 2016, Advisory Board Member (June 2015 to December 2015);
MainStay CBRE Global Infrastructure Megatrends Term Fund: Trustee since 2021;
VanEck Vectors Group of Exchange-Traded Funds: Trustee since 2006 and Independent Chairman of the Board of Trustees from 2008 to 2022 (57 portfolios); and
Berea College of Kentucky: Trustee since 2009, Chair of the Investment Committee since 2018 |
| | Karen Hammond
1956 | MainStay Funds: Trustee since December 2021, Advisory Board Member (June 2021 to December 2021);MainStay Funds Trust:
Trustee since December 2021, Advisory Board Member (June 2021 to December 2021)
| Retired, Managing Director, Devonshire Investors (2007 to 2013); Senior Vice President, Fidelity Management & Research Co. (2005 to 2007); Senior Vice President and Corporate Treasurer, FMR Corp. (2003 to 2005); Chief Operating Officer, Fidelity Investments Japan (2001 to 2003) | 81 | MainStay VP Funds Trust: Trustee since December 2021, Advisory Board Member (June 2021 to December 2021) (31 portfolios);
MainStay MacKay DefinedTerm Municipal Opportunities Fund: Trustee since December 2021, Advisory Board Member (June 2021 to December 2021);
MainStay CBRE Global Infrastructure Megatrends Term Fund: Trustee since December 2021, Advisory Board Member (June 2021 to December 2021);
Two Harbors Investment Corp.: Director since 2018;
Rhode Island State Investment Commission: Member since 2017; and
Blue Cross Blue Shield of Rhode Island: Director since 2019 |
| | Susan B. Kerley
1951 | MainStay Funds: Chair since January 2017 and Trustee since 2007;MainStay Funds Trust:
Chair since January 2017 and Trustee since 1990*** | President, Strategic Management Advisors LLC (since 1990) | 81 | MainStay VP Funds Trust: Chair since January 2017 and Trustee since 2007 (31 portfolios)**;
MainStay MacKay DefinedTerm Municipal Opportunities Fund: Chair since January 2017 and Trustee since 2011;
MainStay CBRE Global Infrastructure Megatrends Term Fund: Trustee since June 2021; and
Legg Mason Partners Funds: Trustee since 1991 (45 portfolios) |
Board of Trustees and Officers (Unaudited) (continued)
| | Name and
Year of Birth | Term of Office,
Position(s) Held and
Length of Service | Principal Occupation(s)
During Past Five Years | Number of
Portfolios in
Fund Complex
Overseen by
Trustee | Other Directorships
Held by Trustee |
| | | | | | |
| | Alan R. Latshaw
1951 | MainStay Funds: Trusteesince 2006;MainStay Funds Trust:
Trustee since 2007*** | Retired; Partner, Ernst & Young LLP (2002 to 2003); Partner, Arthur Andersen LLP (1989 to 2002); Consultant to the MainStay Funds Audit and Compliance Committee (2004 to 2006) | 81 | MainStay VP Funds Trust: Trustee since 2007 (31 portfolios)**;
MainStay MacKay DefinedTerm Municipal Opportunities Fund: Trustee since 2011; and
MainStay CBRE Global Infrastructure Megatrends Term Fund: Trustee since June 2021 |
| | Jacques P. Perold
1958 | MainStay Funds: Trustee since January 2016, Advisory Board Member (June 2015to December 2015);MainStay Funds Trust:
Trustee since January 2016, Advisory Board Member (June 2015 to December 2015) | Founder and Chief Executive Officer, CapShift Advisors LLC (since 2018); President, Fidelity Management & Research Company (2009 to 2014); President and Chief Investment Officer, Geode Capital Management, LLC (2001 to 2009) | 81 | MainStay VP Funds Trust: Trustee since January 2016, Advisory Board Member (June 2015 to December 2015) (31 portfolios);
MainStay MacKay DefinedTerm Municipal Opportunities Fund: Trustee since January 2016, Advisory Board Member (June 2015 to December 2015);
MainStay CBRE Global Infrastructure Megatrends Term Fund: Trustee since June 2021;
Allstate Corporation: Director since 2015; and
MSCI Inc.: Director since 2017 |
| | Richard S. Trutanic
1952 | MainStay Funds: Trustee since 1994;MainStay Funds Trust:
Trustee since 2007*** | Chairman and Chief Executive Officer, Somerset & Company (financial advisory firm) (since 2004); Managing Director, The Carlyle Group (private investment firm) (2002 to 2004); Senior Managing Director, Partner and Board Member, Groupe Arnault S.A. (private investment firm) (1999 to 2002) | 81 | MainStay VP Funds Trust: Trustee since 2007 (31 portfolios)**;
MainStay MacKay DefinedTerm Municipal Opportunities Fund: Trustee since 2011; and
MainStay CBRE Global Infrastructure Megatrends Term Fund: Trustee since June 2021 |
| ** | Includes prior service as a Director of MainStay VP Series Fund, Inc., the predecessor to MainStay VP Funds Trust. |
| *** | Includes prior service as a Director/Trustee of certain predecessor entities to MainStay Funds Trust. |
| 34 | MainStay WMC Enduring Capital Fund |
| | Name and
Year of Birth | Position(s) Held and
Length of Service | Principal Occupation(s)
During Past Five Years | |
| | | | | |
| | Kirk C. Lehneis
1974 | President, MainStay Funds, MainStay Funds Trust (since 2017) | Chief Operating Officer and Senior Managing Director (since 2016), New York Life Investment Management LLC and New York Life Investment Management Holdings LLC; Member of the Board of Managers (since 2017) and Senior Managing Director (since 2018), NYLIFE Distributors LLC; Chairman of the Board and Senior Managing Director, NYLIM Service Company LLC (since 2017); Trustee, President and Principal Executive Officer of IndexIQ Trust, IndexIQ ETF Trust and IndexIQ Active ETF Trust (since 2018); President, MainStay CBRE Global Infrastructure Megatrends Term Fund (since 2021), MainStay MacKay DefinedTerm Municipal Opportunities Fund and MainStay VP Funds Trust (since 2017)**; Senior Managing Director, Global Product Development (2015 to 2016); Managing Director, Product Development (2010 to 2015), New York Life Investment Management LLC | |
| | Jack R. Benintende
1964 | Treasurer and Principal Financial and Accounting Officer, MainStay Funds (since 2007), MainStay Funds Trust (since 2009) | Managing Director, New York Life Investment Management LLC (since 2007); Treasurer and Principal Financial and Accounting Officer, MainStay CBRE Global Infrastructure Megatrends Term Fund (since 2021), MainStay MacKay DefinedTerm Municipal Opportunities Fund (since 2011) and MainStay VP Funds Trust (since 2007)**; and Assistant Treasurer, New York Life Investment Management Holdings LLC (2008 to 2012) | |
| | J. Kevin Gao
1967 | Secretary and Chief Legal Officer, MainStay Funds and MainStay Funds Trust (since 2010) | Managing Director and Associate General Counsel, New York Life Investment Management LLC (since 2010); Secretary and Chief Legal Officer, MainStay CBRE Global Infrastructure Megatrends Term Fund (since 2021), MainStay MacKay DefinedTerm Municipal Opportunities Fund (since 2011) and MainStay VP Funds Trust (since 2010)** | |
| | Kevin M. Gleason
1967 | Vice President and Chief Compliance Officer, MainStay Funds and MainStay Funds Trust (since June 2022) | Vice President and Chief Compliance Officer, IndexIQ Trust, IndexIQ ETF Trust and Index IQ Active ETF Trust (since June 2022); Vice President and Chief Compliance Officer, MainStay CBRE Global Infrastructure Megatrends Term Fund, MainStay VP Funds Trust and MainStay MacKay DefinedTerm Municipal Opportunities Fund (since June 2022); Senior Vice President, Voya Investment Management and Chief Compliance Officer, Voya Family of Funds (2012 to 2022) | |
| | Scott T. Harrington
1959 | Vice President— Administration, MainStay Funds (since 2005), MainStay Funds Trust (since 2009) | Managing Director, New York Life Investment Management LLC (including predecessor advisory organizations) (since 2000); Member of the Board of Directors, New York Life Trust Company (since 2009); Vice President—Administration, MainStay CBRE Global Infrastructure Megatrends Term Fund (since 2021), MainStay MacKay DefinedTerm Municipal Opportunities Fund (since 2011) and MainStay VP Funds Trust (since 2005)** | |
| * | The officers listed above are considered to be “interested persons” of the MainStay Group of Funds, MainStay VP Funds Trust, MainStay CBRE Global Infrastructure Megatrends Term Fund and MainStay MacKay DefinedTerm Municipal Opportunities Fund within the meaning of the 1940 Act because of their affiliation with the MainStay Group of Funds, New York Life Insurance Company and/or its affiliates, including New York Life Investment Management LLC, New York Life Insurance Company, NYLIM Service Company LLC, NYLIFE Securities LLC and/or NYLIFE Distributors LLC, as described in detail in the column captioned “Principal Occupation(s) During Past Five Years.” Officers are elected annually by the Board. |
| ** | Includes prior service as an Officer of MainStay VP Series Fund, Inc., the predecessor to MainStay VP Funds Trust. |
Officers of the Trust (Who are not Trustees)*
This page intentionally left blank.
This page intentionally left blank.
This page intentionally left blank.
Equity
U.S. Equity
MainStay Epoch U.S. Equity Yield Fund
MainStay Fiera SMID Growth Fund
MainStay PineStone U.S. Equity Fund
MainStay S&P 500 Index Fund
MainStay Winslow Large Cap Growth Fund
MainStay WMC Enduring Capital Fund
MainStay WMC Growth Fund
MainStay WMC Small Companies Fund
MainStay WMC Value Fund
International Equity
MainStay Epoch International Choice Fund
MainStay PineStone International Equity Fund
MainStay WMC International Research Equity Fund
Emerging Markets Equity
MainStay Candriam Emerging Markets Equity Fund
Global Equity
MainStay Epoch Capital Growth Fund
MainStay Epoch Global Equity Yield Fund
MainStay PineStone Global Equity Fund
Fixed Income
Taxable Income
MainStay Candriam Emerging Markets Debt Fund
MainStay Floating Rate Fund
MainStay MacKay High Yield Corporate Bond Fund
MainStay MacKay Short Duration High Yield Fund
MainStay MacKay Strategic Bond Fund
MainStay MacKay Total Return Bond Fund
MainStay MacKay U.S. Infrastructure Bond Fund
MainStay Short Term Bond Fund
Tax-Exempt Income
MainStay MacKay California Tax Free Opportunities Fund1
MainStay MacKay High Yield Municipal Bond Fund
MainStay MacKay New York Tax Free Opportunities Fund2
MainStay MacKay Short Term Municipal Fund
MainStay MacKay Strategic Municipal Allocation Fund
MainStay MacKay Tax Free Bond Fund
Money Market
MainStay Money Market Fund
Mixed Asset
MainStay Balanced Fund
MainStay Income Builder Fund
MainStay MacKay Convertible Fund
Speciality
MainStay CBRE Global Infrastructure Fund
MainStay CBRE Real Estate Fund
MainStay Cushing MLP Premier Fund
Asset Allocation
MainStay Conservative Allocation Fund
MainStay Conservative ETF Allocation Fund
MainStay Defensive ETF Allocation Fund
MainStay Equity Allocation Fund
MainStay Equity ETF Allocation Fund
MainStay ESG Multi-Asset Allocation Fund
MainStay Growth Allocation Fund
MainStay Growth ETF Allocation Fund
MainStay Moderate Allocation Fund
MainStay Moderate ETF Allocation Fund
Manager
New York Life Investment Management LLC
New York, New York
Subadvisors
Candriam3
Strassen, Luxembourg
CBRE Investment Management Listed Real Assets LLC
Radnor, Pennsylvania
Cushing Asset Management, LP
Dallas, Texas
Epoch Investment Partners, Inc.
New York, New York
Fiera Capital Inc.
New York, New York
IndexIQ Advisors LLC3
New York, New York
MacKay Shields LLC3
New York, New York
NYL Investors LLC3
New York, New York
PineStone Asset Management Inc.
Montreal, Québec
Wellington Management Company LLP
Boston, Massachusetts
Winslow Capital Management, LLC
Minneapolis, Minnesota
Legal Counsel
Dechert LLP
Washington, District of Columbia
Independent Registered Public Accounting Firm
KPMG LLP
Philadelphia, Pennsylvania
Distributor
NYLIFE Distributors LLC3
Jersey City, New Jersey
Custodian
JPMorgan Chase Bank, N.A.
New York, New York
1.
This Fund is registered for sale in AZ, CA, NV, OR, TX, UT, WA and MI (Class A and Class I shares only), and CO, FL, GA, HI, ID, MA, MD, NH, NJ and NY (Class I shares only).
| 2. | This Fund is registered for sale in CA, CT, DE, FL, MA, NJ, NY and VT. |
| 3. | An affiliate of New York Life Investment Management LLC. |
Not part of the Annual Report
For more information
800-624-6782
newyorklifeinvestments.com
“New York Life Investments” is both a service mark, and the common trade name, of certain investment advisors affiliated with New York Life Insurance Company. The MainStay Funds® are managed by New York Life Investment Management LLC and distributed by NYLIFE Distributors LLC, 30 Hudson Street, Jersey City, NJ 07302, a wholly owned subsidiary of New York Life Insurance Company. NYLIFE Distributors LLC is a Member FINRA/SIPC.
©2023 NYLIFE Distributors LLC. All rights reserved.
| 5013911 MS139-23 | MSWEC11-12/23 |
(NYLIM) NL528
MainStay WMC Value Fund
Message from the President and Annual Report
October 31, 2023
Special Notice:
Beginning in July 2024, new regulations issued by the Securities and Exchange Commission (SEC) will take effect requiring open-end mutual fund companies and ETFs to (1) overhaul the content of their shareholder reports and (2) mail paper copies of the new tailored shareholder reports to shareholders who have not opted to receive these documents electronically.
If you have not yet elected to receive your shareholder reports electronically, please contact your financial intermediary or visit newyorklifeinvestments.com/accounts.
| Not FDIC/NCUA Insured | Not a Deposit | May Lose Value | No Bank Guarantee | Not Insured by Any Government Agency |
This page intentionally left blank
Message from the President
Volatile economic and geopolitical forces drove market behavior during the 12-month reporting period ended October 31, 2023. While equity markets generally gained ground, bond prices trended broadly lower.
Although the war in Ukraine, the outbreak of hostilities in the Middle East and several other notable events affected financial assets, inflation and interest rate trends stood at the forefront of market developments during most of the period. As the reporting period began, high levels of inflation already showed signs of easing in the face of aggressive rate hikes by the U.S. Federal Reserve (the “Fed”). From a peak of 9.1% in June 2022, the annualized U.S. inflation rate dropped to 7.1% in November 2022, and to 3.2% in October 2023. At the same time, the Fed increased the benchmark federal funds rate from 3.75%–4.00% at the beginning of the reporting period to 5.25%–5.50% as of October 31, 2023. As the pace of rate increases slowed during the period, investors hoped for an early shift to a looser monetary policy. However, comments from Fed members late in the period reinforced the central bank’s hawkish stance in response to surprisingly robust U.S. economic growth and rising wage pressures, thus increasing the likelihood that interest rates would stay higher for longer. International developed markets exhibited similar dynamics of elevated inflation and rising interest rates.
Despite the backdrop of high interest rates—along with political dysfunction in Washington D.C. and intensifying global geopolitical instability—equity markets managed to advance, supported by healthy consumer spending trends and persistent domestic economic growth. The S&P 500® Index, a widely regarded benchmark of large-cap U.S. market performance, gained ground, bolstered by the strong performance of energy stocks amid surging petroleum prices and mega-cap, growth-oriented, technology-related shares, which rose as investors flocked to companies creating the infrastructure for developments in artificial intelligence. Smaller-cap stocks and value-oriented shares produced milder returns. Among industry sectors, energy and
information technology posted the strongest gains. Real estate declined most sharply under pressure from rising mortgage rates and weak levels of office occupancy. Developed international markets outperformed U.S. markets, with Europe benefiting during the first half of the period from unexpected economic resilience in the face of rising energy prices and the ongoing war in Ukraine. Emerging markets posted positive results but lagged developed markets, largely due to slow economic growth in China despite the relaxation of pandemic-era lockdowns.
Bond prices were driven lower by rising yields and increasing expectations of high interest rates for an extended period of time. The U.S. yield curve steepened, with the 30-year Treasury yield exceeding 5% for the first time in more than a decade. The yield curve remained inverted, with the 10-year Treasury yield ending the period at 4.88%, compared with 5.07% for the 2-year Treasury yield. Corporate bonds outperformed long-term Treasury bonds, but still trended lower under pressure from rising yields and an uptick in default rates. Among corporates, lower-credit-quality instruments performed slightly better than their higher-credit-quality counterparts, while floating rate securities performed better still.
In the face of today’s uncertain market environment, New York Life Investments remains dedicated to providing the guidance, resources and investment solutions you need to pursue your financial goals.
Thank you for trusting us to help meet your investment needs.
Sincerely,
Kirk C. Lehneis
President
The opinions expressed are as of the date of this report and are subject to change. There is no guarantee that any forecast made will come to pass. This material does not constitute investment advice and is not intended as an endorsement of any specific investment. Past performance is no guarantee of future results.
Not part of the Annual Report
Investors should refer to the Fund’s Summary Prospectus and/or Prospectus and consider the Fund’s investment objectives, strategies, risks, charges and expenses carefully before investing. The Summary Prospectus and/or Prospectus contain this and other information about the Fund. You may obtain copies of the Fund’s Summary Prospectus, Prospectus and Statement of Additional Information, which includes information about The MainStay Funds' Trustees, free of charge, upon request, by calling toll-free 800-624-6782, by writing to NYLIFE Distributors LLC, Attn: MainStay Marketing Department, 30 Hudson Street, Jersey City, NJ 07302 or by sending an e-mail to MainStayShareholderServices@nylim.com. These documents are also available via the MainStay Funds’ website at newyorklifeinvestments.com. Please read the Fund’s Summary Prospectus and/or Prospectus carefully before investing.
Investment and Performance Comparison (Unaudited)
Performance data quoted represents past performance. Past performance is no guarantee of future results. Because of market volatility and other factors, current performance may be lower or higher than the figures shown. Investment return and principal value will fluctuate, and as a result, when shares are redeemed, they may be worth more or less than their original cost. The graph below depicts the historical performance of Class I shares of the Fund. Performance will vary from class to class based on differences in class-specific expenses and sales charges. For performance information current to the most recent month-end, please call 800-624-6782 or visit newyorklifeinvestments.com.
The performance table and graph do not reflect the deduction of taxes that a shareholder would pay on distributions or Fund share redemptions. Total returns reflect maximum applicable sales charges as indicated in the table below, if any, changes in share price, and reinvestment of dividend and capital gain distributions. The graph assumes the initial investment amount shown below and reflects the deduction of all sales charges that would have applied for the period of investment. Performance figures may reflect certain fee waivers and/or expense limitations, without which total returns may have been lower. For more information on share classes and current fee waivers and/or expense limitations (if any), please refer to the Notes to Financial Statements.

| Average Annual Total Returns for the Year-Ended October 31, 2023 |
| Class | Sales Charge | | Inception
Date1 | One
Year | Five
Years | Ten Years
or Since
Inception | Gross
Expense
Ratio2 |
| Class A Shares | Maximum 5.50% Initial Sales Charge | With sales charges | 6/9/1999 | -7.55% | 8.55% | 8.33% | 1.02% |
| | | Excluding sales charges | | -2.17 | 9.79 | 8.95 | 1.02 |
| Investor Class Shares3 | Maximum 5.00% Initial Sales Charge | With sales charges | 2/28/2008 | -7.31 | 8.26 | 8.09 | 1.26 |
| | | Excluding sales charges | | -2.43 | 9.50 | 8.70 | 1.26 |
| Class B Shares4 | Maximum 5.00% CDSC | With sales charges | 6/9/1999 | -7.69 | 8.53 | 7.89 | 2.01 |
| | if Redeemed Within the First Six Years of Purchase | Excluding sales charges | | -3.18 | 8.67 | 7.89 | 2.01 |
| Class C Shares | Maximum 1.00% CDSC | With sales charges | 6/9/1999 | -4.08 | 8.67 | 7.89 | 2.01 |
| | if Redeemed Within One Year of Purchase | Excluding sales charges | | -3.18 | 8.67 | 7.89 | 2.01 |
| Class I Shares | No Sales Charge | | 1/21/1971 | -1.88 | 10.10 | 9.24 | 0.77 |
| Class R1 Shares5 | No Sales Charge | | 1/2/2004 | -2.02 | 9.96 | 9.11 | 0.87 |
| Class R2 Shares5 | No Sales Charge | | 1/2/2004 | -2.28 | 9.68 | 8.83 | 1.12 |
| Class R3 Shares5 | No Sales Charge | | 4/28/2006 | -2.53 | 9.40 | 8.56 | 1.37 |
| Class R6 Shares | No Sales Charge | | 4/26/2021 | -1.88 | N/A | 0.86 | 0.70 |
| 1. | Effective April 26, 2021, the Fund replaced its subadvisor, changed its investment objective and modified its principal investment strategies. Therefore, the performance information shown in this report prior to April 26, 2021 reflects that of the Fund’s prior subadvisor, investment objective and principal investment strategies. |
| 2. | The gross expense ratios presented reflect the Fund’s “Total Annual Fund Operating Expenses” from the most recent Prospectus, as supplemented, and may differ from other expense ratios disclosed in this report. |
| 3. | Prior to June 30, 2020, the maximum initial sales charge was 5.50%, which is reflected in the applicable average annual total return figures shown. |
| 4. | Class B shares are closed to all new purchases as well as additional investments by existing Class B shareholders. |
| 5. | As of October 31, 2023, Class R1, Class R2 and Class R3 shares are closed to new investors and, upon the close of business on December 29, 2023, Class R1, Class R2 and Class R3 shares are closed to additional investments by existing shareholders. Additionally, Class R1, Class R2 and Class R3 shares will be liquidated on or about February 28, 2024 (the "Liquidation Date"). It is expected that the Fund will distribute to remaining shareholders invested in Class R1, Class R2 or Class R3 shares, on or promptly after the Liquidation Date, a liquidating distribution in cash or cash equivalents equal to the net asset value of such shares. |
The footnotes on the next page are an integral part of the table and graph and should be carefully read in conjunction with them.
| Benchmark Performance* | One
Year | Five
Years | Ten
Years |
| Russell 1000® Value Index1 | 0.13% | 6.60% | 7.60% |
| Morningstar Large Value Category Average2 | 0.68 | 7.10 | 7.62 |
| * | Returns for indices reflect no deductions for fees, expenses or taxes, except for foreign withholding taxes where applicable. Results assume reinvestment of all dividends and capital gains. An investment cannot be made directly in an index. |
| 1. | The Fund has selected the Russell 1000® Value Index as its primary benchmark as a replacement for the Russell 3000® Index because it believes that the Russell 1000® Value Index is more reflective of its principal investment strategies. The Russell 1000® Value Index measures the performance of the large-cap value segment of the U.S. equity universe. It includes those Russell 1000® Index companies with lower price-to-book ratios and lower expected growth values. |
| 2. | The Morningstar Large Value Category Average is representative of funds that invest primarily in big U.S. companies that are less expensive or growing more slowly than other large-cap stocks. Results are based on average total returns of similar funds with all dividends and capital gain distributions reinvested. |
The footnotes on the preceding page are an integral part of the table and graph and should be carefully read in conjunction with them.
Cost in Dollars of a $1,000 Investment in MainStay WMC Value Fund (Unaudited)
The example below is intended to describe the fees and expenses borne by shareholders during the six-month period from May 1, 2023 to October 31, 2023, and the impact of those costs on your investment.
Example
As a shareholder of the Fund you incur two types of costs: (1) transaction costs, including exchange fees and sales charges (loads) on purchases (as applicable), and (2) ongoing costs, including management fees, distribution and/or service (12b-1) fees and other Fund expenses (as applicable). This example is intended to help you understand your ongoing costs (in dollars) of investing in the Fund and to compare these costs with the ongoing costs of investing in other mutual funds. The example is based on an investment of $1,000 made at the beginning of the six-month period and held for the entire period from May 1, 2023 to October 31, 2023.
This example illustrates your Fund’s ongoing costs in two ways:
Actual Expenses
The second and third data columns in the table below provide information about actual account values and actual expenses. You may use the information in these columns, together with the amount you invested, to estimate the expenses that you paid during the six months ended October 31, 2023. Simply divide your account value by $1,000 (for example, an
$8,600 account value divided by $1,000 = 8.6), then multiply the result by the number under the heading entitled “Expenses Paid During Period” to estimate the expenses you paid on your account during this period.
Hypothetical Example for Comparison Purposes
The fourth and fifth data columns in the table below provide information about hypothetical account values and hypothetical expenses based on the Fund’s actual expense ratio and an assumed rate of return of 5% per year before expenses, which is not the Fund’s actual return. The hypothetical account values and expenses may not be used to estimate the actual ending account balances or expenses you paid for the six-month period shown. You may use this information to compare the ongoing costs of investing in the Fund with the ongoing costs of investing in other mutual funds. To do so, compare this 5% hypothetical example with the 5% hypothetical examples that appear in the shareholder reports of the other mutual funds.
Please note that the expenses shown in the table are meant to highlight your ongoing costs only and do not reflect any transactional costs, such as exchange fees or sales charges (loads). Therefore, the fourth and fifth data columns of the table are useful in comparing ongoing costs only and will not help you determine the relative total costs of owning different funds. In addition, if these transactional costs were included, your costs would have been higher.
| Share Class | Beginning
Account
Value
5/1/23 | Ending Account
Value (Based
on Actual
Returns and
Expenses)
10/31/23 | Expenses
Paid
During
Period1 | Ending Account
Value (Based
on Hypothetical
5% Annualized
Return and
Actual Expenses)
10/31/23 | Expenses
Paid
During
Period1 | Net Expense
Ratio
During
Period2 |
| Class A Shares | $1,000.00 | $968.70 | $ 5.16 | $1,019.96 | $ 5.30 | 1.04% |
| Investor Class Shares | $1,000.00 | $967.60 | $ 6.45 | $1,018.65 | $ 6.61 | 1.30% |
| Class B Shares | $1,000.00 | $963.70 | $10.15 | $1,014.87 | $10.41 | 2.05% |
| Class C Shares | $1,000.00 | $963.70 | $10.15 | $1,014.87 | $10.41 | 2.05% |
| Class I Shares | $1,000.00 | $970.30 | $ 3.48 | $1,021.68 | $ 3.57 | 0.70% |
| Class R1 Shares | $1,000.00 | $969.60 | $ 4.42 | $1,020.72 | $ 4.53 | 0.89% |
| Class R2 Shares | $1,000.00 | $968.00 | $ 5.65 | $1,019.46 | $ 5.80 | 1.14% |
| Class R3 Shares | $1,000.00 | $966.90 | $ 6.89 | $1,018.20 | $ 7.07 | 1.39% |
| Class R6 Shares | $1,000.00 | $970.20 | $ 3.48 | $1,021.68 | $ 3.57 | 0.70% |
| 1. | Expenses are equal to the Fund’s annualized expense ratio of each class multiplied by the average account value over the period, divided by 365 and multiplied by 184 (to reflect the six-month period). The table above represents the actual expenses incurred during the six-month period. In addition to the fees and expenses which the Fund bears directly, it also indirectly bears a pro rata share of the fees and expenses of the underlying funds in which it invests. Such indirect expenses are not included in the above-reported expense figures. |
| 2. | Expenses are equal to the Fund's annualized expense ratio to reflect the six-month period. |
Industry Composition as of October 31, 2023 (Unaudited)
| Oil, Gas & Consumable Fuels | 9.3% |
| Banks | 8.4 |
| Capital Markets | 7.5 |
| Pharmaceuticals | 7.4 |
| Health Care Providers & Services | 6.2 |
| Insurance | 5.5 |
| Communications Equipment | 4.4 |
| Semiconductors & Semiconductor Equipment | 3.9 |
| Health Care Equipment & Supplies | 3.2 |
| Aerospace & Defense | 3.2 |
| Beverages | 2.5 |
| Building Products | 2.4 |
| Health Care REITs | 1.7 |
| Biotechnology | 1.6 |
| Electrical Equipment | 1.6 |
| Specialized REITs | 1.5 |
| Multi–Utilities | 1.5 |
| Food Products | 1.5 |
| Automobile Components | 1.5 |
| Entertainment | 1.5 |
| Diversified Consumer Services | 1.5 |
| Gas Utilities | 1.4 |
| Electronic Equipment, Instruments & Components | 1.4% |
| Electric Utilities | 1.4 |
| Personal Care Products | 1.3 |
| Distributors | 1.3 |
| Air Freight & Logistics | 1.3 |
| Interactive Media & Services | 1.3 |
| Media | 1.3 |
| Real Estate Management & Development | 1.3 |
| Hotel & Resort REITs | 1.2 |
| IT Services | 1.2 |
| Ground Transportation | 1.2 |
| Financial Services | 1.1 |
| Chemicals | 1.1 |
| Machinery | 1.0 |
| Household Durables | 1.0 |
| Containers & Packaging | 0.8 |
| Specialty Retail | 0.6 |
| Short–Term Investment | 1.0 |
| Other Assets, Less Liabilities | –0.0‡ |
| | 100.0% |
| ‡ | Less than one–tenth of a percent. |
See Portfolio of Investments beginning on page 10 for specific holdings within these categories. The Fund's holdings are subject to change.
Top Ten Holdings and/or Issuers Held as of October 31, 2023 (excluding short-term investments) (Unaudited)
| 1. | JPMorgan Chase & Co. |
| 2. | Cisco Systems, Inc. |
| 3. | Pfizer, Inc. |
| 4. | Merck & Co., Inc. |
| 5. | ConocoPhillips |
| 6. | Elevance Health, Inc. |
| 7. | UnitedHealth Group, Inc. |
| 8. | Centene Corp. |
| 9. | Phillips 66 |
| 10. | Chubb Ltd. |
Portfolio Management Discussion and Analysis (Unaudited)
Questions answered by portfolio manager Adam H. Illfelder, CFA, of Wellington Management Company LLP, the Fund’s Subadvisor.
How did MainStay WMC Value Fund perform relative to its benchmarks and peer group during the 12 months ended October 31, 2023?
For the 12 months ended October 31, 2023, Class I shares of MainStay WMC Value Fund returned −1.88%, underperforming the 0.13% return of the Fund’s benchmark, the Russell 1000® Value Index (the “Index”). Over the same period, Class I shares also underperformed the 0.68% return of the Morningstar Large Growth Category Average.1
What factors affected the Fund’s relative performance during the reporting period?
The Fund underperformed the Index over the reporting period primarily due to security selection. Weak selection in industrials, communication services and information technology outweighed relatively strong selection in health care and real estate. Sector allocation, as a result of our bottom-up stock selection process, also detracted from relative returns, primarily due to the Fund’s underweight exposure to communication services and materials, as well as overweight exposure to real estate. The negative effects of these allocations were partially offset by the positive impact of the Fund’s overweight exposure to information technology and underweight exposure to consumer staples.
During the reporting period, which sectors were the strongest positive contributors to the Fund’s relative performance and which sectors were particularly weak?
During the reporting period, the health care, real estate and energy sectors provided the strongest positive contributions to relative performance. (Contributions take weightings and total returns into account.) Over the same period, industrials, communication services and materials detracted most notably from the Fund’s relative performance.
During the reporting period, which individual stocks made the strongest positive contributions to the Fund’s absolute performance and which stocks detracted the most?
The two top contributors to the Fund’s absolute performance included Google’s parent company, Alphabet, and pharmaceutical company Eli Lilly. Alphabet shares rose as recent quarterly results exceeded consensus expectations due to revenue growth in the company’s Search and Google Cloud divisions, along with a return to growth in YouTube. Additional factors contributing to positive market sentiment included stabilizing advertising demand, potential upside driven by artificial intelligence (“AI”) advances, and effective cost management. We trimmed the Fund’s position in Alphabet. Shares of Eli Lilly gained ground on better-than-expected revenues. The company raised full-year guidance twice in 2023, driven by positive results for Alzheimer's drug Donanemab, weight loss drug Retatrutide and diabetes drug Mounjaro. We sold the Fund’s position in Eli Lilly.
The holdings that detracted most significantly from absolute performance included pharmaceutical company Pfizer and power generation company AES. Pfizer shares declined as the company faced questions regarding the sustainability of revenue from its COVID-19 portfolio as the pandemic eased. The Fund continues to hold Pfizer. AES shares declined as quarterly earnings fell below consensus expectations. Concerns over rising interest rates further weighed on the share price. We exited the Fund’s position in AES.
What were some of the Fund’s largest purchases and sales during the reporting period?
During the reporting period, the Fund’s largest purchases included shares of multinational insurance company American International Group (AIG) and pharmaceutical firm Gilead Sciences. We believe AIG’s transformation over the past 5 years toward a pure-play property & casualty insurer has improved the quality of the underlying business. Improved pricing and risk controls are likely to drive higher earnings per share and return on equity, and the stock trades at an attractive valuation. We believe the recent patent life extensions for Gilead’s key HIV drugs through the early 2030s (versus the previous mid-2020s expiration dates) are positive developments for the business. Gilead’s HIV franchise drives the majority of the company’s revenue, supporting dividend sustainability. In addition, developments in the company’s oncology and cell therapy franchises could drive further growth.
During the same period, the Fund eliminated its positions in pharmaceutical company Eli Lilly and home improvement retailer Home Depot, as shares of both moved to premium levels. We redeployed the proceeds elsewhere.
How did the Fund’s sector weightings change during the reporting period?
The Fund’s largest increases in sector exposure relative to the Index were in the financials, communication services and health care sectors, while the most significant decreases were in industrials, consumer staples and information technology.
How was the Fund positioned at the end of the reporting period?
As of October 31, 2023, the Fund held its largest overweight exposures relative to the Index in the health care, information technology and financials sectors. As of the same date, the Fund’s most significantly underweight exposures were in consumer staples, materials and industrials.
| 1. | See "Investment and Performance Comparison" for other share class returns, which may be higher or lower than Class I share returns, and for more information on benchmark and peer group returns. |
The opinions expressed are those of the portfolio manager as of the date of this report and are subject to change. There is no guarantee that any forecasts will come to pass. This material does not constitute investment advice and is not intended as an endorsement of any specific investment.
Portfolio of Investments October 31, 2023†^
| | Shares | Value |
| Common Stocks 99.0% |
| Aerospace & Defense 3.2% |
| General Dynamics Corp. | 65,039 | $ 15,694,561 |
| L3Harris Technologies, Inc. | 70,603 | 12,666,884 |
| | | 28,361,445 |
| Air Freight & Logistics 1.3% |
| United Parcel Service, Inc., Class B | 85,033 | 12,010,911 |
| Automobile Components 1.5% |
| Gentex Corp. | 464,998 | 13,336,143 |
| Banks 8.4% |
| JPMorgan Chase & Co. | 228,577 | 31,785,918 |
| M&T Bank Corp. | 139,400 | 15,717,350 |
| New York Community Bancorp, Inc. | 1,314,838 | 12,464,664 |
| PNC Financial Services Group, Inc. (The) | 137,468 | 15,735,962 |
| | | 75,703,894 |
| Beverages 2.5% |
| Keurig Dr Pepper, Inc. | 408,627 | 12,393,657 |
| Pernod Ricard SA, Sponsored ADR (a) | 280,123 | 9,950,249 |
| | | 22,343,906 |
| Biotechnology 1.6% |
| Gilead Sciences, Inc. | 188,136 | 14,776,201 |
| Building Products 2.4% |
| Fortune Brands Innovations, Inc. | 152,398 | 8,503,808 |
| Johnson Controls International plc | 262,602 | 12,872,750 |
| | | 21,376,558 |
| Capital Markets 7.5% |
| Ares Management Corp. | 119,466 | 11,778,153 |
| Blackstone, Inc. | 85,039 | 7,853,351 |
| Intercontinental Exchange, Inc. | 118,493 | 12,730,888 |
| LPL Financial Holdings, Inc. | 40,229 | 9,032,215 |
| Morgan Stanley | 172,229 | 12,197,258 |
| Raymond James Financial, Inc. | 143,604 | 13,705,566 |
| | | 67,297,431 |
| Chemicals 1.1% |
| Axalta Coating Systems Ltd. (b) | 378,001 | 9,914,966 |
| Communications Equipment 4.4% |
| Cisco Systems, Inc. | 505,088 | 26,330,237 |
| F5, Inc. (b) | 87,393 | 13,247,905 |
| | | 39,578,142 |
| | Shares | Value |
| |
| Containers & Packaging 0.8% |
| Sealed Air Corp. | 238,882 | $ 7,355,177 |
| Distributors 1.3% |
| LKQ Corp. | 275,158 | 12,084,939 |
| Diversified Consumer Services 1.5% |
| H&R Block, Inc. | 318,312 | 13,066,708 |
| Electric Utilities 1.4% |
| Exelon Corp. | 312,961 | 12,186,701 |
| Electrical Equipment 1.6% |
| Emerson Electric Co. | 160,343 | 14,265,717 |
| Electronic Equipment, Instruments & Components 1.4% |
| Corning, Inc. | 462,762 | 12,383,511 |
| Entertainment 1.5% |
| Electronic Arts, Inc. | 106,407 | 13,172,123 |
| Financial Services 1.1% |
| Global Payments, Inc. | 97,411 | 10,346,996 |
| Food Products 1.5% |
| Archer-Daniels-Midland Co. | 187,256 | 13,401,912 |
| Gas Utilities 1.4% |
| Atmos Energy Corp. | 115,764 | 12,463,152 |
| Ground Transportation 1.2% |
| Knight-Swift Transportation Holdings, Inc. | 212,400 | 10,384,236 |
| Health Care Equipment & Supplies 3.2% |
| Becton Dickinson & Co. | 59,866 | 15,132,928 |
| Boston Scientific Corp. (b) | 262,200 | 13,422,018 |
| | | 28,554,946 |
| Health Care Providers & Services 6.2% |
| Centene Corp. (b) | 253,704 | 17,500,502 |
| Elevance Health, Inc. | 42,905 | 19,311,111 |
| UnitedHealth Group, Inc. | 35,264 | 18,885,988 |
| | | 55,697,601 |
| Health Care REITs 1.7% |
| Welltower, Inc. | 178,408 | 14,916,693 |
The notes to the financial statements are an integral part of, and should be read in conjunction with, the financial statements.
| 10 | MainStay WMC Value Fund |
| | Shares | Value |
| Common Stocks (continued) |
| Hotel & Resort REITs 1.2% |
| Host Hotels & Resorts, Inc. | 710,898 | $ 11,004,701 |
| Household Durables 1.0% |
| Lennar Corp., Class A | 84,623 | 9,027,582 |
| Insurance 5.5% |
| American International Group, Inc. | 263,514 | 16,156,044 |
| Chubb Ltd. | 78,773 | 16,906,261 |
| MetLife, Inc. | 267,486 | 16,051,835 |
| | | 49,114,140 |
| Interactive Media & Services 1.3% |
| Alphabet, Inc., Class C (b) | 93,973 | 11,774,817 |
| IT Services 1.2% |
| Amdocs Ltd. | 131,219 | 10,518,515 |
| Machinery 1.0% |
| Middleby Corp. (The) (b) | 82,548 | 9,317,193 |
| Media 1.3% |
| Omnicom Group, Inc. | 152,081 | 11,392,388 |
| Multi-Utilities 1.5% |
| Sempra | 193,555 | 13,554,657 |
| Oil, Gas & Consumable Fuels 9.3% |
| ConocoPhillips | 186,794 | 22,191,127 |
| Coterra Energy, Inc. | 521,965 | 14,354,038 |
| Diamondback Energy, Inc. | 92,140 | 14,771,885 |
| EOG Resources, Inc. | 115,540 | 14,586,925 |
| Phillips 66 | 151,348 | 17,264,266 |
| | | 83,168,241 |
| Personal Care Products 1.3% |
| Unilever plc, Sponsored ADR | 255,606 | 12,102,944 |
| Pharmaceuticals 7.4% |
| AstraZeneca plc, Sponsored ADR | 181,344 | 11,466,381 |
| Merck & Co., Inc. | 224,616 | 23,068,063 |
| Pfizer, Inc. | 756,491 | 23,118,365 |
| Roche Holding AG | 32,902 | 8,458,344 |
| | | 66,111,153 |
| | Shares | | Value |
| |
| Real Estate Management & Development 1.3% |
| CBRE Group, Inc., Class A (b) | 162,774 | | $ 11,286,749 |
| Semiconductors & Semiconductor Equipment 3.9% |
| Analog Devices, Inc. | 73,465 | | 11,558,249 |
| NXP Semiconductors NV | 62,896 | | 10,845,157 |
| QUALCOMM, Inc. | 116,794 | | 12,729,378 |
| | | | 35,132,784 |
| Specialized REITs 1.5% |
| Gaming and Leisure Properties, Inc. | 302,778 | | 13,743,093 |
| Specialty Retail 0.6% |
| GCI Liberty, Inc. (b)(c)(d) | 15,319 | | — |
| Victoria's Secret & Co. (b) | 299,467 | | 5,354,470 |
| | | | 5,354,470 |
Total Common Stocks
(Cost $871,899,743) | | | 887,583,436 |
| Short-Term Investment 1.0% |
| Affiliated Investment Company 1.0% |
| MainStay U.S. Government Liquidity Fund, 5.275% (e) | 9,392,880 | | 9,392,880 |
Total Short-Term Investment
(Cost $9,392,880) | | | 9,392,880 |
Total Investments
(Cost $881,292,623) | 100.0% | | 896,976,316 |
| Other Assets, Less Liabilities | (0.0)‡ | | (390,162) |
| Net Assets | 100.0% | | $ 896,586,154 |
| † | Percentages indicated are based on Fund net assets. |
| ^ | Industry classifications may be different than those used for compliance monitoring purposes. |
| ‡ | Less than one-tenth of a percent. |
| (a) | All or a portion of this security was held on loan. As of October 31, 2023, the aggregate market value of securities on loan was $4,649,699. The market value of the collateral held included non-cash collateral in the form of U.S. Treasury securities with a value of $4,730,691. (See Note 2(H)) |
| (b) | Non-income producing security. |
| (c) | Illiquid security—As of October 31, 2023, the total market value deemed illiquid under procedures approved by the Board of Trustees was $0, which represented less than one-tenth of a percent of the Fund’s net assets. (Unaudited) |
| (d) | Security in which significant unobservable inputs (Level 3) were used in determining fair value. |
| (e) | Current yield as of October 31, 2023. |
The notes to the financial statements are an integral part of, and should be read in conjunction with, the financial statements.
11
Portfolio of Investments October 31, 2023†^ (continued)
Investments in Affiliates (in 000's)
Investments in issuers considered to be affiliate(s) of the Fund during the year ended October 31, 2023 for purposes of Section 2(a)(3) of the Investment Company Act of 1940, as amended, were as follows:
| Affiliated Investment Companies | Value,
Beginning
of Year | Purchases
at Cost | Proceeds
from
Sales | Net
Realized
Gain/(Loss)
on Sales | Change in
Unrealized
Appreciation/
(Depreciation) | Value,
End of
Year | Dividend
Income | Other
Distributions | Shares
End of
Year |
| MainStay U.S. Government Liquidity Fund | $ 41,010 | $ 151,284 | $ (182,901) | $ — | $ — | $ 9,393 | $ 658 | $ — | 9,393 |
| Abbreviation(s): |
| ADR—American Depositary Receipt |
| REIT—Real Estate Investment Trust |
The following is a summary of the fair valuations according to the inputs used as of October 31, 2023, for valuing the Fund’s assets:
| Description | Quoted
Prices in
Active
Markets for
Identical
Assets
(Level 1) | | Significant
Other
Observable
Inputs
(Level 2) | | Significant
Unobservable
Inputs
(Level 3) | | Total |
| Asset Valuation Inputs | | | | | | | |
| Investments in Securities (a) | | | | | | | |
| Common Stocks | $ 887,583,436 | | $ — | | $ — | | $ 887,583,436 |
| Short-Term Investment | | | | | | | |
| Affiliated Investment Company | 9,392,880 | | — | | — | | 9,392,880 |
| Total Investments in Securities | $ 896,976,316 | | $ — | | $ — | | $ 896,976,316 |
| (a) | For a complete listing of investments and their industries, see the Portfolio of Investments. |
The notes to the financial statements are an integral part of, and should be read in conjunction with, the financial statements.
| 12 | MainStay WMC Value Fund |
Statement of Assets and Liabilities as of October 31, 2023
| Assets |
Investment in unaffiliated securities, at value
(identified cost $871,899,743) including securities on loan of $4,649,699 | $887,583,436 |
Investment in affiliated investment companies, at value
(identified cost $9,392,880) | 9,392,880 |
| Cash | 61,714 |
| Receivables: | |
| Dividends | 683,711 |
| Fund shares sold | 140,918 |
| Securities lending | 1,653 |
| Other assets | 69,993 |
| Total assets | 897,934,305 |
| Liabilities |
| Payables: | |
| Manager (See Note 3) | 501,253 |
| Fund shares redeemed | 493,717 |
| Transfer agent (See Note 3) | 145,255 |
| NYLIFE Distributors (See Note 3) | 134,138 |
| Shareholder communication | 44,989 |
| Professional fees | 21,720 |
| Custodian | 6,049 |
| Trustees | 60 |
| Accrued expenses | 970 |
| Total liabilities | 1,348,151 |
| Net assets | $896,586,154 |
| Composition of Net Assets |
| Shares of beneficial interest outstanding (par value of $.01 per share) unlimited number of shares authorized | $ 338,617 |
| Additional paid-in-capital | 844,119,964 |
| | 844,458,581 |
| Total distributable earnings (loss) | 52,127,573 |
| Net assets | $896,586,154 |
| Class A | |
| Net assets applicable to outstanding shares | $485,176,900 |
| Shares of beneficial interest outstanding | 18,677,764 |
| Net asset value per share outstanding | $ 25.98 |
| Maximum sales charge (5.50% of offering price) | 1.51 |
| Maximum offering price per share outstanding | $ 27.49 |
| Investor Class | |
| Net assets applicable to outstanding shares | $ 50,023,902 |
| Shares of beneficial interest outstanding | 1,927,138 |
| Net asset value per share outstanding | $ 25.96 |
| Maximum sales charge (5.00% of offering price) | 1.37 |
| Maximum offering price per share outstanding | $ 27.33 |
| Class B | |
| Net assets applicable to outstanding shares | $ 4,502,535 |
| Shares of beneficial interest outstanding | 245,998 |
| Net asset value and offering price per share outstanding | $ 18.30 |
| Class C | |
| Net assets applicable to outstanding shares | $ 14,603,180 |
| Shares of beneficial interest outstanding | 797,343 |
| Net asset value and offering price per share outstanding | $ 18.31 |
| Class I | |
| Net assets applicable to outstanding shares | $141,185,174 |
| Shares of beneficial interest outstanding | 5,030,799 |
| Net asset value and offering price per share outstanding | $ 28.06 |
| Class R1 | |
| Net assets applicable to outstanding shares | $ 161,464 |
| Shares of beneficial interest outstanding | 6,094 |
| Net asset value and offering price per share outstanding | $ 26.50 |
| Class R2 | |
| Net assets applicable to outstanding shares | $ 1,006,449 |
| Shares of beneficial interest outstanding | 38,223 |
| Net asset value and offering price per share outstanding | $ 26.33 |
| Class R3 | |
| Net assets applicable to outstanding shares | $ 1,465,141 |
| Shares of beneficial interest outstanding | 56,389 |
| Net asset value and offering price per share outstanding | $ 25.98 |
| Class R6 | |
| Net assets applicable to outstanding shares | $198,461,409 |
| Shares of beneficial interest outstanding | 7,081,928 |
| Net asset value and offering price per share outstanding | $ 28.02 |
The notes to the financial statements are an integral part of, and should be read in conjunction with, the financial statements.
13
Statement of Operations for the year ended October 31, 2023
| Investment Income (Loss) |
| Income | |
| Dividends-unaffiliated (net of foreign tax withholding of $96,280) | $ 24,173,023 |
| Dividends-affiliated | 657,762 |
| Securities lending, net | 12,106 |
| Total income | 24,842,891 |
| Expenses | |
| Manager (See Note 3) | 6,667,683 |
| Distribution/Service—Class A (See Note 3) | 1,304,948 |
| Distribution/Service—Investor Class (See Note 3) | 136,759 |
| Distribution/Service—Class B (See Note���3) | 63,710 |
| Distribution/Service—Class C (See Note 3) | 151,119 |
| Distribution/Service—Class R2 (See Note 3) | 2,612 |
| Distribution/Service—Class R3 (See Note 3) | 7,415 |
| Transfer agent (See Note 3) | 849,206 |
| Registration | 187,885 |
| Professional fees | 144,554 |
| Trustees | 26,044 |
| Shareholder communication | 16,990 |
| Custodian | 16,749 |
| Shareholder service (See Note 3) | 2,699 |
| Miscellaneous | 30,968 |
| Total expenses before waiver/reimbursement | 9,609,341 |
| Expense waiver/reimbursement from Manager (See Note 3) | (157,654) |
| Reimbursement from prior custodian(a) | (2,055) |
| Net expenses | 9,449,632 |
| Net investment income (loss) | 15,393,259 |
| Realized and Unrealized Gain (Loss) |
| Net realized gain (loss) on: | |
| Unaffiliated investment transactions | 27,324,222 |
| Foreign currency transactions | 757 |
| Net realized gain (loss) | 27,324,979 |
| Net change in unrealized appreciation (depreciation) on: | |
| Unaffiliated investments | (58,743,452) |
| Translation of other assets and liabilities in foreign currencies | 7,357 |
| Net change in unrealized appreciation (depreciation) | (58,736,095) |
| Net realized and unrealized gain (loss) | (31,411,116) |
| Net increase (decrease) in net assets resulting from operations | $(16,017,857) |
| (a) | Represents a refund for overbilling of custody fees. |
The notes to the financial statements are an integral part of, and should be read in conjunction with, the financial statements.
| 14 | MainStay WMC Value Fund |
Statements of Changes in Net Assets
for the years ended October 31, 2023 and October 31, 2022
| | 2023 | 2022 |
| Increase (Decrease) in Net Assets |
| Operations: | | |
| Net investment income (loss) | $ 15,393,259 | $ 13,384,235 |
| Net realized gain (loss) | 27,324,979 | 43,070,782 |
| Net change in unrealized appreciation (depreciation) | (58,736,095) | (83,059,547) |
| Net increase (decrease) in net assets resulting from operations | (16,017,857) | (26,604,530) |
| Distributions to shareholders: | | |
| Class A | (29,416,342) | (254,684,263) |
| Investor Class | (3,013,210) | (30,552,543) |
| Class B | (545,950) | (7,017,069) |
| Class C | (977,214) | (6,589,112) |
| Class I | (8,145,019) | (44,509,475) |
| Class R1 | (9,920) | (21,242) |
| Class R2 | (56,602) | (492,154) |
| Class R3 | (81,173) | (528,702) |
| Class R6 | (14,701,579) | (161,084,996) |
| Total distributions to shareholders | (56,947,009) | (505,479,556) |
| Capital share transactions: | | |
| Net proceeds from sales of shares | 126,738,662 | 167,876,878 |
| Net asset value of shares issued to shareholders in reinvestment of distributions | 55,819,279 | 492,255,863 |
| Cost of shares redeemed | (226,681,810) | (213,638,603) |
| Increase (decrease) in net assets derived from capital share transactions | (44,123,869) | 446,494,138 |
| Net increase (decrease) in net assets | (117,088,735) | (85,589,948) |
| Net Assets |
| Beginning of year | 1,013,674,889 | 1,099,264,837 |
| End of year | $ 896,586,154 | $1,013,674,889 |
The notes to the financial statements are an integral part of, and should be read in conjunction with, the financial statements.
15
Financial Highlights selected per share data and ratios
| | Year Ended October 31, |
| Class A | 2023 | | 2022 | | 2021 | | 2020 | | 2019 |
| Net asset value at beginning of year | $ 28.11 | | $ 55.21 | | $ 39.49 | | $ 42.24 | | $ 41.20 |
| Net investment income (loss) (a) | 0.39 | | 0.36 | | 0.30 | | 0.21 | | 0.26 |
| Net realized and unrealized gain (loss) | (0.94) | | (1.68) | | 17.09 | | 0.55 | | 4.88 |
| Total from investment operations | (0.55) | | (1.32) | | 17.39 | | 0.76 | | 5.14 |
| Less distributions: | | | | | | | | | |
| From net investment income | (0.42) | | (0.38) | | (0.25) | | (0.31) | | (0.28) |
| From net realized gain on investments | (1.16) | | (25.40) | | (1.42) | | (3.20) | | (3.82) |
| Total distributions | (1.58) | | (25.78) | | (1.67) | | (3.51) | | (4.10) |
| Net asset value at end of year | $ 25.98 | | $ 28.11 | | $ 55.21 | | $ 39.49 | | $ 42.24 |
| Total investment return (b) | (2.17)% | | (2.68)% | | 45.14% | | 1.66% | | 13.54% |
| Ratios (to average net assets)/Supplemental Data: | | | | | | | | | |
| Net investment income (loss) | 1.42% | | 1.21% | | 0.60% | | 0.55% | | 0.67% |
| Net expenses (c) | 1.03%(d) | | 1.02%(d) | | 1.06% | | 1.10%(e) | | 1.11% |
| Portfolio turnover rate | 29% | | 37% | | 23% | | 16% | | 20% |
| Net assets at end of year (in 000’s) | $ 485,177 | | $ 522,937 | | $ 547,299 | | $ 389,530 | | $ 427,040 |
| (a) | Per share data based on average shares outstanding during the year. |
| (b) | Total investment return is calculated exclusive of sales charges and assumes the reinvestment of dividends and distributions. For periods of less than one year, total return is not annualized. |
| (c) | In addition to the fees and expenses which the Fund bears directly, it also indirectly bears a pro-rata share of the fees and expenses of the underlying funds in which it invests. Such indirect expenses are not included in the above expense ratios. |
| (d) | Expense waiver/reimbursement less than 0.01%. |
| (e) | Net of interest expense which is less than one-tenth of a percent. |
| | Year Ended October 31, |
| Investor Class | 2023 | | 2022 | | 2021 | | 2020 | | 2019 |
| Net asset value at beginning of year | $ 28.09 | | $ 55.08 | | $ 39.40 | | $ 42.17 | | $ 41.15 |
| Net investment income (loss) (a) | 0.31 | | 0.29 | | 0.14 | | 0.10 | | 0.18 |
| Net realized and unrealized gain (loss) | (0.93) | | (1.69) | | 17.09 | | 0.53 | | 4.86 |
| Total from investment operations | (0.62) | | (1.40) | | 17.23 | | 0.63 | | 5.04 |
| Less distributions: | | | | | | | | | |
| From net investment income | (0.35) | | (0.19) | | (0.13) | | (0.20) | | (0.20) |
| From net realized gain on investments | (1.16) | | (25.40) | | (1.42) | | (3.20) | | (3.82) |
| Total distributions | (1.51) | | (25.59) | | (1.55) | | (3.40) | | (4.02) |
| Net asset value at end of year | $ 25.96 | | $ 28.09 | | $ 55.08 | | $ 39.40 | | $ 42.17 |
| Total investment return (b) | (2.43)% | | (2.91)% | | 44.73% | | 1.35% | | 13.27% |
| Ratios (to average net assets)/Supplemental Data: | | | | | | | | | |
| Net investment income (loss) | 1.16% | | 0.97% | | 0.28% | | 0.25% | | 0.46% |
| Net expenses (c) | 1.30% | | 1.26% | | 1.36% | | 1.40%(d) | | 1.33% |
| Expenses (before waiver/reimbursement) (c) | 1.30%(e) | | 1.26%(e) | | 1.36% | | 1.41% | | 1.38% |
| Portfolio turnover rate | 29% | | 37% | | 23% | | 16% | | 20% |
| Net assets at end of year (in 000's) | $ 50,024 | | $ 56,061 | | $ 66,193 | | $ 69,423 | | $ 80,733 |
| (a) | Per share data based on average shares outstanding during the year. |
| (b) | Total investment return is calculated exclusive of sales charges and assumes the reinvestment of dividends and distributions. For periods of less than one year, total return is not annualized. |
| (c) | In addition to the fees and expenses which the Fund bears directly, it also indirectly bears a pro-rata share of the fees and expenses of the underlying funds in which it invests. Such indirect expenses are not included in the above expense ratios. |
| (d) | Net of interest expense which is less than one-tenth of a percent. |
| (e) | Expense waiver/reimbursement less than 0.01%. |
The notes to the financial statements are an integral part of, and should be read in conjunction with, the financial statements.
| 16 | MainStay WMC Value Fund |
Financial Highlights selected per share data and ratios
| | Year Ended October 31, |
| Class B | 2023 | | 2022 | | 2021 | | 2020 | | 2019 |
| Net asset value at beginning of year | $ 20.29 | | $ 47.03 | | $ 33.97 | | $ 36.88 | | $ 36.53 |
| Net investment income (loss) (a) | 0.08 | | 0.05 | | (0.20) | | (0.16) | | (0.09) |
| Net realized and unrealized gain (loss) | (0.66) | | (1.39) | | 14.68 | | 0.45 | | 4.26 |
| Total from investment operations | (0.58) | | (1.34) | | 14.48 | | 0.29 | | 4.17 |
| Less distributions: | | | | | | | | | |
| From net investment income | (0.25) | | — | | — | | — | | — |
| From net realized gain on investments | (1.16) | | (25.40) | | (1.42) | | (3.20) | | (3.82) |
| Total distributions | (1.41) | | (25.40) | | (1.42) | | (3.20) | | (3.82) |
| Net asset value at end of year | $ 18.30 | | $ 20.29 | | $ 47.03 | | $ 33.97 | | $ 36.88 |
| Total investment return (b) | (3.18)% | | (3.66)% | | 43.67% | | 0.57% | | 12.45% |
| Ratios (to average net assets)/Supplemental Data: | | | | | | | | | |
| Net investment income (loss) | 0.43% | | 0.23% | | (0.47)% | | (0.48)% | | (0.27)% |
| Net expenses (c) | 2.05% | | 2.01% | | 2.11% | | 2.15%(d) | | 2.08% |
| Expenses (before waiver/reimbursement) (c) | 2.05%(e) | | 2.01%(e) | | 2.11% | | 2.16% | | 2.13% |
| Portfolio turnover rate | 29% | | 37% | | 23% | | 16% | | 20% |
| Net assets at end of year (in 000’s) | $ 4,503 | | $ 8,045 | | $ 13,100 | | $ 14,212 | | $ 21,088 |
| (a) | Per share data based on average shares outstanding during the year. |
| (b) | Total investment return is calculated exclusive of sales charges and assumes the reinvestment of dividends and distributions. For periods of less than one year, total return is not annualized. |
| (c) | In addition to the fees and expenses which the Fund bears directly, it also indirectly bears a pro-rata share of the fees and expenses of the underlying funds in which it invests. Such indirect expenses are not included in the above expense ratios. |
| (d) | Net of interest expense which is less than one-tenth of a percent. |
| (e) | Expense waiver/reimbursement less than 0.01%. |
| | Year Ended October 31, |
| Class C | 2023 | | 2022 | | 2021 | | 2020 | | 2019 |
| Net asset value at beginning of year | $ 20.30 | | $ 47.04 | | $ 33.98 | | $ 36.88 | | $ 36.53 |
| Net investment income (loss) (a) | 0.08 | | 0.05 | | (0.21) | | (0.16) | | (0.07) |
| Net realized and unrealized gain (loss) | (0.66) | | (1.39) | | 14.69 | | 0.46 | | 4.24 |
| Total from investment operations | (0.58) | | (1.34) | | 14.48 | | 0.30 | | 4.17 |
| Less distributions: | | | | | | | | | |
| From net investment income | (0.25) | | — | | — | | — | | — |
| From net realized gain on investments | (1.16) | | (25.40) | | (1.42) | | (3.20) | | (3.82) |
| Total distributions | (1.41) | | (25.40) | | (1.42) | | (3.20) | | (3.82) |
| Net asset value at end of year | $ 18.31 | | $ 20.30 | | $ 47.04 | | $ 33.98 | | $ 36.88 |
| Total investment return (b) | (3.18)% | | (3.66)% | | 43.65% | | 0.60% | | 12.45% |
| Ratios (to average net assets)/Supplemental Data: | | | | | | | | | |
| Net investment income (loss) | 0.41% | | 0.22% | | (0.50)% | | (0.48)% | | (0.22)% |
| Net expenses (c) | 2.05% | | 2.00% | | 2.11% | | 2.15%(d) | | 2.07% |
| Expenses (before waiver/reimbursement) (c) | 2.05%(e) | | 2.01% | | 2.11% | | 2.16% | | 2.12% |
| Portfolio turnover rate | 29% | | 37% | | 23% | | 16% | | 20% |
| Net assets at end of year (in 000’s) | $ 14,603 | | $ 14,564 | | $ 11,119 | | $ 14,315 | | $ 22,933 |
| (a) | Per share data based on average shares outstanding during the year. |
| (b) | Total investment return is calculated exclusive of sales charges and assumes the reinvestment of dividends and distributions. For periods of less than one year, total return is not annualized. |
| (c) | In addition to the fees and expenses which the Fund bears directly, it also indirectly bears a pro-rata share of the fees and expenses of the underlying funds in which it invests. Such indirect expenses are not included in the above expense ratios. |
| (d) | Net of interest expense which is less than one-tenth of a percent. |
| (e) | Expense waiver/reimbursement less than 0.01%. |
The notes to the financial statements are an integral part of, and should be read in conjunction with, the financial statements.
17
Financial Highlights selected per share data and ratios
| | Year Ended October 31, |
| Class I | 2023 | | 2022 | | 2021 | | 2020 | | 2019 |
| Net asset value at beginning of year | $ 30.24 | | $ 57.43 | | $ 40.99 | | $ 43.71 | | $ 42.51 |
| Net investment income (loss) (a) | 0.51 | | 0.48 | | 0.30 | | 0.32 | | 0.38 |
| Net realized and unrealized gain (loss) | (1.02) | | (1.76) | | 17.91 | | 0.57 | | 5.02 |
| Total from investment operations | (0.51) | | (1.28) | | 18.21 | | 0.89 | | 5.40 |
| Less distributions: | | | | | | | | | |
| From net investment income | (0.51) | | (0.51) | | (0.35) | | (0.41) | | (0.38) |
| From net realized gain on investments | (1.16) | | (25.40) | | (1.42) | | (3.20) | | (3.82) |
| Total distributions | (1.67) | | (25.91) | | (1.77) | | (3.61) | | (4.20) |
| Net asset value at end of year | $ 28.06 | | $ 30.24 | | $ 57.43 | | $ 40.99 | | $ 43.71 |
| Total investment return (b) | (1.88)% | | (2.37)% | | 45.57% | | 1.92% | | 13.80% |
| Ratios (to average net assets)/Supplemental Data: | | | | | | | | | |
| Net investment income (loss) | 1.76% | | 1.51% | | 0.61% | | 0.81% | | 0.93% |
| Net expenses (c) | 0.70% | | 0.70% | | 0.82% | | 0.85%(d) | | 0.86% |
| Expenses (before waiver/reimbursement) (c) | 0.79% | | 0.77% | | 0.83% | | 0.85% | | 0.86% |
| Portfolio turnover rate | 29% | | 37% | | 23% | | 16% | | 20% |
| Net assets at end of year (in 000’s) | $ 141,185 | | $ 137,117 | | $ 102,714 | | $ 417,329 | | $ 488,730 |
| (a) | Per share data based on average shares outstanding during the year. |
| (b) | Total investment return is calculated exclusive of sales charges and assumes the reinvestment of dividends and distributions. Class I shares are not subject to sales charges. For periods of less than one year, total return is not annualized. |
| (c) | In addition to the fees and expenses which the Fund bears directly, it also indirectly bears a pro-rata share of the fees and expenses of the underlying funds in which it invests. Such indirect expenses are not included in the above expense ratios. |
| (d) | Net of interest expense which is less than one-tenth of a percent. |
| | Year Ended October 31, |
| Class R1 | 2023 | | 2022 | | 2021 | | 2020 | | 2019 |
| Net asset value at beginning of year | $ 28.67 | | $ 55.81 | | $ 39.90 | | $ 42.64 | | $ 41.53 |
| Net investment income (loss) (a) | 0.43 | | 0.37 | | 0.38 | | 0.27 | | 0.33 |
| Net realized and unrealized gain (loss) | (0.95) | | (1.67) | | 17.27 | | 0.56 | | 4.91 |
| Total from investment operations | (0.52) | | (1.30) | | 17.65 | | 0.83 | | 5.24 |
| Less distributions: | | | | | | | | | |
| From net investment income | (0.49) | | (0.44) | | (0.32) | | (0.37) | | (0.31) |
| From net realized gain on investments | (1.16) | | (25.40) | | (1.42) | | (3.20) | | (3.82) |
| Total distributions | (1.65) | | (25.84) | | (1.74) | | (3.57) | | (4.13) |
| Net asset value at end of year | $ 26.50 | | $ 28.67 | | $ 55.81 | | $ 39.90 | | $ 42.64 |
| Total investment return (b) | (2.02)% | | (2.54)% | | 45.37% | | 1.82% | | 13.71% |
| Ratios (to average net assets)/Supplemental Data: | | | | | | | | | |
| Net investment income (loss) | 1.57% | | 1.24% | | 0.75% | | 0.69% | | 0.83% |
| Net expenses (c) | 0.89%(d) | | 0.87%(d) | | 0.91% | | 0.95%(e) | | 0.96% |
| Portfolio turnover rate | 29% | | 37% | | 23% | | 16% | | 20% |
| Net assets at end of year (in 000’s) | $ 161 | | $ 172 | | $ 57 | | $ 38 | | $ 35 |
| (a) | Per share data based on average shares outstanding during the year. |
| (b) | Total investment return is calculated exclusive of sales charges and assumes the reinvestment of dividends and distributions. Class R1 shares are not subject to sales charges. For periods of less than one year, total return is not annualized. |
| (c) | In addition to the fees and expenses which the Fund bears directly, it also indirectly bears a pro-rata share of the fees and expenses of the underlying funds in which it invests. Such indirect expenses are not included in the above expense ratios. |
| (d) | Expense waiver/reimbursement less than 0.01%. |
| (e) | Net of interest expense which is less than one-tenth of a percent. |
The notes to the financial statements are an integral part of, and should be read in conjunction with, the financial statements.
| 18 | MainStay WMC Value Fund |
Financial Highlights selected per share data and ratios
| | Year Ended October 31, |
| Class R2 | 2023 | | 2022 | | 2021 | | 2020 | | 2019 |
| Net asset value at beginning of year | $ 28.47 | | $ 55.57 | | $ 39.74 | | $ 42.48 | | $ 41.38 |
| Net investment income (loss) (a) | 0.36 | | 0.33 | | 0.25 | | 0.18 | | 0.23 |
| Net realized and unrealized gain (loss) | (0.95) | | (1.70) | | 17.21 | | 0.55 | | 4.89 |
| Total from investment operations | (0.59) | | (1.37) | | 17.46 | | 0.73 | | 5.12 |
| Less distributions: | | | | | | | | | |
| From net investment income | (0.39) | | (0.33) | | (0.21) | | (0.27) | | (0.20) |
| From net realized gain on investments | (1.16) | | (25.40) | | (1.42) | | (3.20) | | (3.82) |
| Total distributions | (1.55) | | (25.73) | | (1.63) | | (3.47) | | (4.02) |
| Net asset value at end of year | $ 26.33 | | $ 28.47 | | $ 55.57 | | $ 39.74 | | $ 42.48 |
| Total investment return (b) | (2.28)% | | (2.79)% | | 45.01% | | 1.57% | | 13.42% |
| Ratios (to average net assets)/Supplemental Data: | | | | | | | | | |
| Net investment income (loss) | 1.32% | | 1.10% | | 0.50% | | 0.45% | | 0.59% |
| Net expenses (c) | 1.13%(d) | | 1.12%(d) | | 1.16% | | 1.20%(e) | | 1.21% |
| Portfolio turnover rate | 29% | | 37% | | 23% | | 16% | | 20% |
| Net assets at end of year (in 000’s) | $ 1,006 | | $ 1,034 | | $ 1,066 | | $ 716 | | $ 780 |
| (a) | Per share data based on average shares outstanding during the year. |
| (b) | Total investment return is calculated exclusive of sales charges and assumes the reinvestment of dividends and distributions. Class R2 shares are not subject to sales charges. For periods of less than one year, total return is not annualized. |
| (c) | In addition to the fees and expenses which the Fund bears directly, it also indirectly bears a pro-rata share of the fees and expenses of the underlying funds in which it invests. Such indirect expenses are not included in the above expense ratios. |
| (d) | Expense waiver/reimbursement less than 0.01%. |
| (e) | Net of interest expense which is less than one-tenth of a percent. |
| | Year Ended October 31, |
| Class R3 | 2023 | | 2022 | | 2021 | | 2020 | | 2019 |
| Net asset value at beginning of year | $ 28.14 | | $ 55.17 | | $ 39.48 | | $ 42.24 | | $ 41.15 |
| Net investment income (loss) (a) | 0.29 | | 0.25 | | 0.12 | | 0.07 | | 0.13 |
| Net realized and unrealized gain (loss) | (0.94) | | (1.69) | | 17.12 | | 0.54 | | 4.87 |
| Total from investment operations | (0.65) | | (1.44) | | 17.24 | | 0.61 | | 5.00 |
| Less distributions: | | | | | | | | | |
| From net investment income | (0.35) | | (0.19) | | (0.13) | | (0.17) | | (0.09) |
| From net realized gain on investments | (1.16) | | (25.40) | | (1.42) | | (3.20) | | (3.82) |
| Total distributions | (1.51) | | (25.59) | | (1.55) | | (3.37) | | (3.91) |
| Net asset value at end of year | $ 25.98 | | $ 28.14 | | $ 55.17 | | $ 39.48 | | $ 42.24 |
| Total investment return (b) | (2.53)% | | (3.03)% | | 44.66% | | 1.29% | | 13.14% |
| Ratios (to average net assets)/Supplemental Data: | | | | | | | | | |
| Net investment income (loss) | 1.08% | | 0.85% | | 0.25% | | 0.19% | | 0.32% |
| Net expenses (c) | 1.38%(d) | | 1.37%(d) | | 1.42% | | 1.45%(e) | | 1.46% |
| Portfolio turnover rate | 29% | | 37% | | 23% | | 16% | | 20% |
| Net assets at end of year (in 000’s) | $ 1,465 | | $ 1,471 | | $ 1,137 | | $ 2,442 | | $ 2,314 |
| (a) | Per share data based on average shares outstanding during the year. |
| (b) | Total investment return is calculated exclusive of sales charges and assumes the reinvestment of dividends and distributions. Class R3 shares are not subject to sales charges. For periods of less than one year, total return is not annualized. |
| (c) | In addition to the fees and expenses which the Fund bears directly, it also indirectly bears a pro-rata share of the fees and expenses of the underlying funds in which it invests. Such indirect expenses are not included in the above expense ratios. |
| (d) | Expense waiver/reimbursement less than 0.01%. |
| (e) | Net of interest expense which is less than one-tenth of a percent. |
The notes to the financial statements are an integral part of, and should be read in conjunction with, the financial statements.
19
Financial Highlights selected per share data and ratios
| | Year Ended October 31, | | April 26, 2021^ through
October 31, |
| Class R6 | 2023 | | 2022 | | 2021 |
| Net asset value at beginning of period | $ 30.20 | | $ 57.42 | | $ 53.83* |
| Net investment income (loss) (a) | 0.52 | | 0.49 | | 0.65 |
| Net realized and unrealized gain (loss) | (1.03) | | (1.77) | | 2.94 |
| Total from investment operations | (0.51) | | (1.28) | | 3.59 |
| Less distributions: | | | | | |
| From net investment income | (0.51) | | (0.54) | | — |
| From net realized gain on investments | (1.16) | | (25.40) | | — |
| Total distributions | (1.67) | | (25.94) | | — |
| Net asset value at end of period | $ 28.02 | | $ 30.20 | | $ 57.42 |
| Total investment return (b) | (1.88)% | | (2.37)% | | 6.67% |
| Ratios (to average net assets)/Supplemental Data: | | | | | |
| Net investment income (loss) | 1.77% | | 1.52% | | 1.25%†† |
| Net expenses (c) | 0.70% | | 0.70% | | 0.72%†† |
| Expenses (before waiver/reimbursement) (c) | 0.71% | | 0.71% | | 0.72%†† |
| Portfolio turnover rate | 29% | | 37% | | 23% |
| Net assets at end of period (in 000’s) | $ 198,461 | | $ 272,274 | | $ 356,580 |
| * | Based on the net asset value of Class I as of April 26, 2021. |
| ^ | Inception date. |
| †† | Annualized. |
| (a) | Per share data based on average shares outstanding during the period. |
| (b) | Total investment return is calculated exclusive of sales charges and assumes the reinvestment of dividends and distributions. Class R6 shares are not subject to sales charges. For periods of less than one year, total return is not annualized. |
| (c) | In addition to the fees and expenses which the Fund bears directly, it also indirectly bears a pro-rata share of the fees and expenses of the underlying funds in which it invests. Such indirect expenses are not included in the above expense ratios. |
The notes to the financial statements are an integral part of, and should be read in conjunction with, the financial statements.
| 20 | MainStay WMC Value Fund |
Notes to Financial Statements
Note 1-Organization and Business
The MainStay Funds (the “Trust”) was organized on January 9, 1986, as a Massachusetts business trust. The Trust is registered under the Investment Company Act of 1940, as amended (the “1940 Act”), as an open-end management investment company, and is comprised of eleven funds (collectively referred to as the "Funds"). These financial statements and notes relate to the MainStay WMC Value Fund (the "Fund"), a “diversified” fund, as that term is defined in the 1940 Act, as interpreted or modified by regulatory authorities having jurisdiction, from time to time.
The following table lists the Fund's share classes that have been registered and commenced operations:
| Class | Commenced Operations |
| Class A | June 9, 1999 |
| Investor Class | February 28, 2008 |
| Class B | June 9, 1999 |
| Class C | June 9, 1999 |
| Class I | January 21, 1971 |
| Class R1* | January 2, 2004 |
| Class R2* | January 2, 2004 |
| Class R3* | April 28, 2006 |
| Class R6 | April 26, 2021 |
| * | As of October 31, 2023, Class R1, Class R2 and Class R3 shares are closed to new investors and, upon the close of business on December 29, 2023, Class R1, Class R2 and Class R3 shares are closed to additional investments by existing shareholders. Additionally, Class R1, Class R2 and Class R3 shares will be liquidated on or about February 28, 2024 (the "Liquidation Date"). It is expected that the Fund will distribute to remaining shareholders invested in Class R1, Class R2 or Class R3 shares, on or promptly after the Liquidation Date, a liquidating distribution in cash or cash equivalents equal to the net asset value of such shares. |
Class B shares of the MainStay Group of Funds are closed to all new purchases as well as additional investments by existing Class B shareholders. Existing Class B shareholders may continue to reinvest dividends and capital gains distributions, as well as exchange their Class B shares for Class B shares of other funds in the MainStay Group of Funds as permitted by the current exchange privileges. Class B shareholders continue to be subject to any applicable contingent deferred sales charge ("CDSC") at the time of redemption. All other features of the Class B shares, including but not limited to the fees and expenses applicable to Class B shares, remain unchanged. Unless redeemed, Class B shareholders will remain in Class B shares of their respective fund until the Class B shares are converted to Class A or Investor Class shares pursuant to the applicable conversion schedule.
Class A and Investor Class shares are offered at net asset value (“NAV”) per share plus an initial sales charge. No initial sales charge applies to investments of $1 million or more (and certain other qualified purchases) in Class A and Investor Class shares. A CDSC of 1.00% may be imposed on certain redemptions of Class A and Investor Class shares made within 18 months of the date of purchase on shares that were purchased without an initial sales charge. Class C shares are offered at NAV without an initial sales charge, although a 1.00% CDSC may be imposed on
certain redemptions of such shares made within one year of the date of purchase of Class C shares. Class I and Class R6 shares are offered at NAV without a sales charge. Depending upon eligibility, Class C shares convert to either Class A or Investor Class shares at the end of the calendar quarter eight years after the date they were purchased. Additionally, Investor Class shares may convert automatically to Class A shares. Under certain circumstances and as may be permitted by the Trust’s multiple class plan pursuant to Rule 18f-3 under the 1940 Act, specified share classes of the Fund may be converted to one or more other share classes of the Fund as disclosed in the capital share transactions within these Notes. The classes of shares have the same voting (except for issues that relate solely to one class), dividend, liquidation and other rights, and the same terms and conditions, except that under distribution plans pursuant to Rule 12b-1 under the 1940 Act, Class C shares are subject to higher distribution and/or service fees than Class A and Investor Class shares. Class I, Class R1 and Class R6 shares are not subject to a distribution and/or service fee. Class R1, Class R2 and Class R3 shares are subject to a shareholder service fee, which is in addition to fees paid under the distribution plans for Class R2 and Class R3 shares.
At a meeting held on September 25-26, 2023, the Board of Trustees (the “Board”) of the Trust, after careful consideration of a number of factors and upon the recommendation of the Fund’s investment adviser, New York Life Investment Management LLC (“New York Life Investments” or the "Manager"), approved a proposal to liquidate Class R1, Class R2 and Class R3 shares of the Fund on or about February 28, 2024, pursuant to the terms of a plan of liquidation.
The Fund's investment objective is to seek long-term appreciation of capital.
Note 2–Significant Accounting Policies
The Fund is an investment company and accordingly follows the investment company accounting and reporting guidance of the Financial Accounting Standards Board (“FASB”) Accounting Standards Codification Topic 946 Financial Services—Investment Companies. The Fund prepares its financial statements in accordance with generally accepted accounting principles (“GAAP”) in the United States of America and follows the significant accounting policies described below.
(A) Securities Valuation. Investments are usually valued as of the close of regular trading on the New York Stock Exchange (the "Exchange") (usually 4:00 p.m. Eastern time) on each day the Fund is open for business ("valuation date").
Pursuant to Rule 2a-5 under the 1940 Act, the Board has designated New York Life Investments as its Valuation Designee (the "Valuation Designee"). The Valuation Designee is responsible for performing fair valuations relating to all investments in the Fund’s portfolio for which market quotations are not readily available; periodically assessing and managing material valuation risks; establishing and applying fair value methodologies; testing fair valuation methodologies; evaluating and
Notes to Financial Statements (continued)
overseeing pricing services; ensuring appropriate segregation of valuation and portfolio management functions; providing quarterly, annual and prompt reporting to the Board, as appropriate; identifying potential conflicts of interest; and maintaining appropriate records. The Valuation Designee has established a valuation committee ("Valuation Committee") to assist in carrying out the Valuation Designee’s responsibilities and establish prices of securities for which market quotations are not readily available. The Fund's and the Valuation Designee's policies and procedures ("Valuation Procedures") govern the Valuation Designee’s selection and application of methodologies for determining and calculating the fair value of Fund investments. The Valuation Designee may value the Fund's portfolio securities for which market quotations are not readily available and other Fund assets utilizing inputs from pricing services and other third-party sources. The Valuation Committee meets (in person, via electronic mail or via teleconference) on an ad-hoc basis to determine fair valuations and on a quarterly basis to review fair value events with respect to certain securities for which market quotations are not readily available, including valuation risks and back-testing results, and preview reports to the Board.
The Valuation Committee establishes prices of securities for which market quotations are not readily available based on such methodologies and measurements on a regular basis after considering information that is reasonably available and deemed relevant by the Valuation Committee. The Board shall oversee the Valuation Designee and review fair valuation materials on a prompt, quarterly and annual basis and approve proposed revisions to the Valuation Procedures.
Investments for which market quotations are not readily available are valued at fair value as determined in good faith pursuant to the Valuation Procedures. A market quotation is readily available only when that quotation is a quoted price (unadjusted) in active markets for identical investments that the Fund can access at the measurement date, provided that a quotation will not be readily available if it is not reliable. "Fair value" is defined as the price the Fund would reasonably expect to receive upon selling an asset or liability in an orderly transaction to an independent buyer in the principal or most advantageous market for the asset or liability. Fair value measurements are determined within a framework that establishes a three-tier hierarchy that maximizes the use of observable market data and minimizes the use of unobservable inputs to establish a classification of fair value measurements for disclosure purposes. "Inputs" refer broadly to the assumptions that market participants would use in pricing the asset or liability, including assumptions about risk, such as the risk inherent in a particular valuation technique used to measure fair value using a pricing model and/or the risk inherent in the inputs for the valuation technique. Inputs may be observable or unobservable. Observable inputs reflect the assumptions market participants would use in pricing the asset or liability based on market data obtained from sources independent of the Fund. Unobservable inputs reflect the Fund’s own assumptions about the assumptions market participants would use in pricing the asset or liability based on the information available. The inputs or methodology used for valuing assets or liabilities may not be an
indication of the risks associated with investing in those assets or liabilities. The three-tier hierarchy of inputs is summarized below.
| • | Level 1—quoted prices (unadjusted) in active markets for an identical asset or liability |
| • | Level 2—other significant observable inputs (including quoted prices for a similar asset or liability in active markets, interest rates and yield curves, prepayment speeds, credit risk, etc.) |
| • | Level 3—significant unobservable inputs (including the Fund's own assumptions about the assumptions that market participants would use in measuring fair value of an asset or liability) |
The level of an asset or liability within the fair value hierarchy is based on the lowest level of an input, both individually and in the aggregate, that is significant to the fair value measurement. The aggregate value by input level of the Fund’s assets and liabilities as of October 31, 2023, is included at the end of the Portfolio of Investments.
The Fund may use third-party vendor evaluations, whose prices may be derived from one or more of the following standard inputs, among others:
| • Broker/dealer quotes | • Benchmark securities |
| • Two-sided markets | • Reference data (corporate actions or material event notices) |
| • Bids/offers | • Monthly payment information |
| • Industry and economic events | • Reported trades |
An asset or liability for which a market quotation is not readily available is valued by methods deemed reasonable in good faith by the Valuation Committee, following the Valuation Procedures to represent fair value. Under these procedures, the Valuation Designee generally uses a market-based approach which may use related or comparable assets or liabilities, recent transactions, market multiples, book values and other relevant information. The Valuation Designee may also use an income-based valuation approach in which the anticipated future cash flows of the asset or liability are discounted to calculate fair value. Discounts may also be applied due to the nature and/or duration of any restrictions on the disposition of the asset or liability. Fair value represents a good faith approximation of the value of a security. Fair value determinations involve the consideration of a number of subjective factors, an analysis of applicable facts and circumstances and the exercise of judgment. As a result, it is possible that the fair value for a security determined in good faith in accordance with the Valuation Procedures may differ from valuations for the same security determined for other funds using their own valuation procedures. Although the Valuation Procedures are designed to value a security at the price the Fund may reasonably expect to receive upon the security's sale in an orderly transaction, there can be no assurance that any fair value determination thereunder would, in fact, approximate the amount that the Fund would actually realize upon the sale of the security or the price at which the security would trade if a reliable market price were readily available. During the year ended October 31, 2023, there were no material changes to the fair value methodologies.
| 22 | MainStay WMC Value Fund |
Securities which may be valued in this manner include, but are not limited to: (i) a security for which trading has been halted or suspended or otherwise does not have a readily available market quotation on a given day; (ii) a debt security that has recently gone into default and for which there is not a current market quotation; (iii) a security of an issuer that has entered into a restructuring; (iv) a security that has been delisted from a national exchange; (v) a security subject to trading collars for which no or limited trading takes place; and (vi) a security whose principal market has been temporarily closed at a time when, under normal conditions, it would be open. Securities valued in this manner are generally categorized as Level 2 or 3 in the hierarchy. As of October 31, 2023, securities that were fair valued in such a manner are shown in the Portfolio of Investments.
Equity securities, rights and warrants, if applicable, are valued at the last quoted sales prices as of the close of regular trading on the relevant exchange on each valuation date. Securities that are not traded on the valuation date are valued at the mean of the last quoted bid and ask prices. Prices are normally taken from the principal market in which each security trades. These securities are generally categorized as Level 1 in the hierarchy.
Investments in mutual funds, including money market funds, are valued at their respective NAVs at the close of business each day on the valuation date. These securities are generally categorized as Level 1 in the hierarchy.
Temporary cash investments acquired in excess of 60 days to maturity at the time of purchase are valued using the latest bid prices or using valuations based on a matrix system (which considers such factors as security prices, yields, maturities and ratings), both as furnished by independent pricing services. Temporary cash investments that mature in 60 days or less at the time of purchase ("Short-Term Investments") are valued using the amortized cost method of valuation, unless the use of such method would be inappropriate. The amortized cost method involves valuing a security at its cost on the date of purchase and thereafter assuming a constant amortization to maturity of the difference between such cost and the value on maturity date. Amortized cost approximates the current fair value of a security. Securities valued using the amortized cost method are not valued using quoted prices in an active market and are generally categorized as Level 2 in the hierarchy.
The information above is not intended to reflect an exhaustive list of the methodologies that may be used to value portfolio investments. The Valuation Procedures permit the use of a variety of valuation methodologies in connection with valuing portfolio investments. The methodology used for a specific type of investment may vary based on the market data available or other considerations. The methodologies summarized above may not represent the specific means by which portfolio investments are valued on any particular business day.
(B) Income Taxes. The Fund's policy is to comply with the requirements of the Internal Revenue Code of 1986, as amended (the “Internal Revenue Code”), applicable to regulated investment companies
and to distribute all of its taxable income to the shareholders of the Fund within the allowable time limits.
The Manager evaluates the Fund’s tax positions to determine if the tax positions taken meet the minimum recognition threshold in connection with accounting for uncertainties in income tax positions taken or expected to be taken for the purposes of measuring and recognizing tax liabilities in the financial statements. Recognition of tax benefits of an uncertain tax position is permitted only to the extent the position is “more likely than not” to be sustained assuming examination by taxing authorities. The Manager analyzed the Fund's tax positions taken on federal, state and local income tax returns for all open tax years (for up to three tax years) and has concluded that no provisions for federal, state and local income tax are required in the Fund's financial statements. The Fund's federal, state and local income tax and federal excise tax returns for tax years for which the applicable statutes of limitations have not expired are subject to examination by the Internal Revenue Service and state and local departments of revenue.
(C) Dividends and Distributions to Shareholders. Dividends and distributions are recorded on the ex-dividend date. The Fund intends to declare and pay dividends from net investment income and distributions from net realized capital and currency gains, if any, at least annually. Unless a shareholder elects otherwise, all dividends and distributions are reinvested at NAV in the same class of shares of the Fund. Dividends and distributions to shareholders are determined in accordance with federal income tax regulations and may differ from determinations using GAAP.
(D) Security Transactions and Investment Income. The Fund records security transactions on the trade date. Realized gains and losses on security transactions are determined using the identified cost method. Dividend income is recognized on the ex-dividend date, net of any foreign tax withheld at the source, and interest income is accrued as earned using the effective interest rate method. Distributions received from real estate investment trusts may be classified as dividends, capital gains and/or return of capital.
Investment income and realized and unrealized gains and losses on investments of the Fund are allocated pro rata to the separate classes of shares based upon their relative net assets on the date the income is earned or realized and unrealized gains and losses are incurred.
(E) Expenses. Expenses of the Trust are allocated to the individual Funds in proportion to the net assets of the respective Funds when the expenses are incurred, except where direct allocations of expenses can be made. Expenses (other than transfer agent expenses and fees incurred under the shareholder services plans and/or the distribution plans further discussed in Note 3(B)) are allocated to separate classes of shares pro rata based upon their relative net assets on the date the expenses are incurred. The expenses borne by the Fund, including those of related parties to the Fund, are shown in the Statement of Operations.
Additionally, the Fund may invest in mutual funds, which are subject to management fees and other fees that may cause the costs of investing in mutual funds to be greater than the costs of owning the underlying
Notes to Financial Statements (continued)
securities directly. These indirect expenses of mutual funds are not included in the amounts shown as expenses in the Statement of Operations or in the expense ratios included in the Financial Highlights.
(F) Use of Estimates. In preparing financial statements in conformity with GAAP, the Manager makes estimates and assumptions that affect the reported amounts and disclosures in the financial statements. Actual results could differ from those estimates and assumptions.
(G) Foreign Currency Transactions. The Fund's books and records are maintained in U.S. dollars. Prices of securities denominated in foreign currency amounts are translated into U.S. dollars at the mean between the buying and selling rates last quoted by any major U.S. bank at the following dates:
(i) market value of investment securities, other assets and liabilities— at the valuation date; and
(ii) purchases and sales of investment securities, income and expenses—at the date of such transactions.
The assets and liabilities that are denominated in foreign currency amounts are presented at the exchange rates and market values at the close of the period. The realized and unrealized changes in net assets arising from fluctuations in exchange rates and market prices of securities are not separately presented.
Net realized gain (loss) on foreign currency transactions represents net currency gains or losses realized as a result of differences between the amounts of securities sale proceeds or purchase cost, dividends, interest and withholding taxes as recorded on the Fund's books, and the U.S. dollar equivalent amount actually received or paid. Net currency gains or losses from valuing such foreign currency denominated assets and liabilities, other than investments at valuation date exchange rates, are reflected in unrealized foreign exchange gains or losses.
(H) Securities Lending. In order to realize additional income, the Fund may engage in securities lending, subject to the limitations set forth in the 1940 Act and relevant guidance by the staff of the Securities and Exchange Commission (“SEC”). If the Fund engages in securities lending, the Fund will lend through its custodian, JPMorgan Chase Bank, N.A., ("JPMorgan"), acting as securities lending agent on behalf of the Fund. Under the current arrangement, JPMorgan will manage the Fund's collateral in accordance with the securities lending agency agreement between the Fund and JPMorgan, and indemnify the Fund against counterparty risk. The loans will be collateralized by cash (which may be invested in a money market fund) and/or non-cash collateral (which may include U.S. Treasury securities and/or U.S. government agency securities issued or guaranteed by the United States government or its agencies or instrumentalities) at least equal at all times to the market value of the securities loaned. Non-cash collateral held at year end is segregated and cannot be transferred by the Fund. The Fund bears the risk of delay in recovery of, or loss of rights in, the securities loaned. The Fund may also record a realized gain or loss on securities deemed sold due to a borrower’s inability to return securities on loan. The Fund bears the risk of
any loss on investment of cash collateral. The Fund will receive compensation for lending its securities in the form of fees or it will retain a portion of interest earned on the investment of any cash collateral. The Fund will also continue to receive interest and dividends on the securities loaned and any gain or loss in the market price of the securities loaned that may occur during the term of the loan will be for the account of the Fund. Income earned from securities lending activities, if any, is reflected in the Statement of Operations. Securities on loan as of October 31, 2023, are shown in the Portfolio of Investments.
(I) Foreign Securities Risk. The Fund may invest in foreign securities, which carry certain risks that are in addition to the usual risks inherent in domestic securities. Foreign regulatory regimes and securities markets can have less stringent investor protections and disclosure standards and less liquid trading markets than U.S. regulatory regimes and securities markets, and can experience political, social and economic developments that may affect the value of investments in foreign securities. These risks include those resulting from currency fluctuations, future adverse political or economic developments and possible imposition of currency exchange blockages or other foreign governmental laws or restrictions. Economic sanctions and other similar governmental actions or developments could, among other things, effectively restrict or eliminate the Fund's ability to purchase or sell certain foreign securities or groups of foreign securities, and thus may make the Fund's investments in such securities less liquid or more difficult to value. These risks are likely to be greater in emerging markets than in developed markets. The ability of issuers of debt securities held by the Fund to meet their obligations may be affected by, among other things, economic or political developments in a specific country, industry or region.
(J) Indemnifications. Under the Trust’s organizational documents, its officers and trustees are indemnified against certain liabilities that may arise out of performance of their duties to the Trust. Additionally, in the normal course of business, the Fund enters into contracts with third-party service providers that contain a variety of representations and warranties and that may provide general indemnifications. The Fund's maximum exposure under these arrangements is unknown, as this would involve future claims that may be made against the Fund that have not yet occurred. The Manager believes that the risk of loss in connection with these potential indemnification obligations is remote. However, there can be no assurance that material liabilities related to such obligations will not arise in the future, which could adversely impact the Fund.
Note 3–Fees and Related Party Transactions
(A) Manager and Subadvisor. New York Life Investments, a registered investment adviser and an indirect, wholly-owned subsidiary of New York Life Insurance Company ("New York Life"), serves as the Fund's Manager, pursuant to an Amended and Restated Management Agreement ("Management Agreement"). The Manager provides offices, conducts clerical, recordkeeping and bookkeeping services and keeps most of the financial and accounting records required to be maintained by the Fund. Except for the portion of salaries and expenses that are the responsibility
| 24 | MainStay WMC Value Fund |
of the Fund, the Manager pays the salaries and expenses of all personnel affiliated with the Fund and certain operational expenses of the Fund. The Fund reimburses New York Life Investments in an amount equal to the portion of the compensation of the Chief Compliance Officer attributable to the Fund. Wellington Management Company LLP ("Wellington" or the "Subadvisor"), a registered investment adviser, serves as the Subadvisor to the Fund and is responsible for the day-to-day portfolio management of the Fund. Pursuant to the terms of a Subadvisory Agreement ("Subadvisory Agreement") between New York Life Investments and Wellington, New York Life Investments pays for the services of the Subadvisor.
Under the Management Agreement, the Fund pays the Manager a monthly fee for the services performed and the facilities furnished at an annual rate of the Fund’s average daily net assets as follows: 0.66% on assets up to $1 billion; 0.64% on assets from $1 billion to $3 billion; and 0.62% on assets over $3 billion. During the year ended October 31, 2023, the effective management fee rate was 0.66% of the Fund’s average daily net assets, exclusive of any applicable waivers/reimbursements.
New York Life Investments has contractually agreed to waive fees and/or reimburse expenses so that Total Annual Fund Operating Expenses (excluding taxes, interest, litigation, extraordinary expenses, brokerage and other transaction expenses relating to the purchase or sale of portfolio investments, and acquired (underlying) fund fees and expenses) for Class I shares do not exceed 0.70% of its average daily net assets. In addition, New York Life Investments will waive fees and/or reimburse expenses so that Total Annual Fund Operating Expenses (excluding taxes, interest, litigation, extraordinary expenses, brokerage and other transaction expenses relating to the purchase or sale of portfolio investments, and acquired (underlying) fund fees and expenses) for Class R6 do not exceed those of Class I. This agreement will remain in effect until February 28, 2024, and shall renew automatically for one-year terms unless New York Life Investments provides written notice of termination prior to the start of the next term or upon approval of the Board.
During the year ended October 31, 2023, New York Life Investments earned fees from the Fund in the amount of $6,667,683 and waived fees and/or reimbursed expenses in the amount of $157,654 and paid the Subadvisor fees in the amount of $2,708,549.
JPMorgan provides sub-administration and sub-accounting services to the Fund pursuant to an agreement with New York Life Investments. These services include calculating the daily NAVs of the Fund, maintaining the general ledger and sub-ledger accounts for the calculation of the Fund's NAVs, and assisting New York Life Investments in conducting various aspects of the Fund's administrative operations. For providing these services to the Fund, JPMorgan is compensated by New York Life Investments.
Pursuant to an agreement between the Trust and New York Life Investments, New York Life Investments is responsible for providing or procuring certain regulatory reporting services for the Fund. The Fund will
reimburse New York Life Investments for the actual costs incurred by New York Life Investments in connection with providing or procuring these services for the Fund.
(B) Distribution and Service Fees. The Trust, on behalf of the Fund, has entered into a distribution agreement with NYLIFE Distributors LLC (the “Distributor”), an affiliate of New York Life Investments. The Fund has adopted distribution plans (the “Plans”) in accordance with the provisions of Rule 12b-1 under the 1940 Act.
Pursuant to the Class A, Investor Class and Class R2 Plans, the Distributor receives a monthly fee from the Class A, Investor Class and Class R2 shares at an annual rate of 0.25% of the average daily net assets of the Class A, Investor Class and Class R2 shares for distribution and/or service activities as designated by the Distributor. Pursuant to the Class B and Class C Plans, Class B and Class C shares pay the Distributor a monthly distribution fee at an annual rate of 0.75% of the average daily net assets of the Class B and Class C shares, along with a service fee at an annual rate of 0.25% of the average daily net assets of the Class B and Class C shares, for a total 12b-1 fee of 1.00%. Pursuant to the Class R3 Plan, Class R3 shares pay the Distributor a monthly distribution fee at an annual rate of 0.25% of the average daily net assets of the Class R3 shares, along with a service fee at an annual rate of 0.25% of the average daily net assets of the Class R3 shares, for a total 12b-1 fee of 0.50%. Class I, Class R1 and Class R6 shares are not subject to a distribution and/or service fee.
The Plans provide that the distribution and service fees are payable to the Distributor regardless of the amounts actually expended by the Distributor for distribution of the Fund's shares and service activities.
In accordance with the Shareholder Services Plans for the Class R1, Class R2 and Class R3 shares, the Manager has agreed to provide, through its affiliates or independent third parties, various shareholder and administrative support services to shareholders of the Class R1, Class R2 and Class R3 shares. For its services, the Manager, its affiliates or independent third-party service providers are entitled to a shareholder service fee accrued daily and paid monthly at an annual rate of 0.10% of the average daily net assets of the Class R1, Class R2 and Class R3 shares. This is in addition to any fees paid under the Class R2 and Class R3 Plans.
During the year ended October 31, 2023, shareholder service fees incurred by the Fund were as follows:
| |
| Class R1 | $ 171 |
| Class R2 | 1,045 |
| Class R3 | 1,483 |
(C) Sales Charges. The Fund was advised by the Distributor that the amount of initial sales charges retained on sales of Class A and Investor Class shares during the year ended October 31, 2023, were $64,474 and $5,486, respectively.
Notes to Financial Statements (continued)
The Fund was also advised that the Distributor retained CDSCs on redemptions of Class A, Class B and Class C shares during the year ended October 31, 2023, of $3,923, $19 and $2,463, respectively.
(D) Transfer, Dividend Disbursing and Shareholder Servicing Agent. NYLIM Service Company LLC, an affiliate of New York Life Investments, is the Fund's transfer, dividend disbursing and shareholder servicing agent pursuant to an agreement between NYLIM Service Company LLC and the Trust. NYLIM Service Company LLC has entered into an agreement with SS&C Global Investor & Distribution Solutions, Inc. ("SS&C"), pursuant to which SS&C performs certain transfer agent services on behalf of NYLIM Service Company LLC. New York Life Investments has contractually agreed to limit the transfer agency expenses charged to the Fund’s share classes to a maximum of 0.35% of that share class’s average daily net assets on an annual basis after deducting any applicable Fund or class-level expense reimbursement or small account fees. This agreement will remain in effect until February 28, 2024, and shall renew automatically for one-year terms unless New York Life Investments provides written notice of termination prior to the start of the next term or upon approval of the Board. During the year ended October 31, 2023, transfer agent expenses incurred by the Fund and any reimbursements, pursuant to the aforementioned Transfer Agency expense limitation agreement, were as follows:
| Class | Expense | Waived |
| Class A | $438,907 | $ — |
| Investor Class | 192,141 | (2,102) |
| Class B | 22,458 | (294) |
| Class C | 53,058 | (575) |
| Class I | 130,162 | — |
| Class R1 | 144 | — |
| Class R2 | 880 | — |
| Class R3 | 1,242 | — |
| Class R6 | 10,214 | — |
(E) Small Account Fee. Shareholders with small accounts adversely impact the cost of providing transfer agency services. In an effort to reduce total transfer agency expenses, the Fund has implemented a small account fee on certain types of accounts. As described in the Fund's prospectus, certain shareholders with an account balance of less than $1,000 ($5,000 for Class A share accounts) are charged an annual per account fee of $20 (assessed semi-annually), the proceeds from which offset transfer agent fees as reflected in the Statement of Operations. This small account fee will not apply to certain types of accounts as described further in the Fund’s prospectus.
(F) Capital. As of October 31, 2023, New York Life and its affiliates beneficially held shares of the Fund with the values and percentages of net assets as follows:
| ‡ | Less than one-tenth of a percent. |
Note 4-Federal Income Tax
As of October 31, 2023, the cost and unrealized appreciation (depreciation) of the Fund’s investment portfolio, including applicable derivative contracts and other financial instruments, as determined on a federal income tax basis, were as follows:
| | Federal Tax
Cost | Gross
Unrealized
Appreciation | Gross
Unrealized
(Depreciation) | Net
Unrealized
Appreciation/
(Depreciation) |
| Investments in Securities | $886,014,895 | $85,396,022 | $(74,434,601) | $10,961,421 |
As of October 31, 2023, the components of accumulated gain (loss) on a tax basis were as follows:
Ordinary
Income | Accumulated
Capital
and Other
Gain (Loss) | Other
Temporary
Differences | Unrealized
Appreciation
(Depreciation) | Total
Accumulated
Gain (Loss) |
| $12,231,909 | $28,931,082 | $— | $10,964,582 | $52,127,573 |
The difference between book-basis and tax-basis unrealized appreciation (depreciation) is primarily due to wash sale adjustments.
The following table discloses the current year reclassifications between total distributable earnings (loss) and additional paid-in capital arising from permanent differences; net assets as of October 31, 2023 were not affected.
| | Total
Distributable
Earnings (Loss) | Additional
Paid-In
Capital |
| | $38,700 | $(38,700) |
The reclassifications for the Fund are primarily due to equalization.
During the years ended October 31, 2023 and October 31, 2022, the tax character of distributions paid as reflected in the Statements of Changes in Net Assets was as follows:
| | 2023 | 2022 |
| Distributions paid from: | | |
| Ordinary Income | $17,709,162 | $ 44,602,455 |
| Long-Term Capital Gains | 39,237,847 | 460,877,101 |
| Total | $56,947,009 | $505,479,556 |
Note 5–Custodian
JPMorgan is the custodian of cash and securities held by the Fund. Custodial fees are charged to the Fund based on the Fund's net assets and/or the market value of securities held by the Fund and the number of certain transactions incurred by the Fund.
| 26 | MainStay WMC Value Fund |
Note 6–Line of Credit
The Fund and certain other funds managed by New York Life Investments maintain a line of credit with a syndicate of banks in order to secure a source of funds for temporary purposes to meet unanticipated or excessive redemption requests.
Effective July 25, 2023, under the credit agreement (the “Credit Agreement”), the aggregate commitment amount is $600,000,000 with an additional uncommitted amount of $100,000,000. The commitment fee is an annual rate of 0.15% of the average commitment amount payable quarterly, regardless of usage, to JPMorgan, who serves as the agent to the syndicate. The commitment fee is allocated among the Fund and certain other funds managed by New York Life Investments based upon their respective net assets and other factors. Interest on any revolving credit loan is charged based upon the Federal Funds Rate, Daily Simple Secured Overnight Financing Rate ("SOFR") + 0.10%, or the Overnight Bank Funding Rate, whichever is higher. The Credit Agreement expires on July 23, 2024, although the Fund, certain other funds managed by New York Life Investments and the syndicate of banks may renew the Credit Agreement for an additional year on the same or different terms or enter into a credit agreement with a different syndicate of banks. Prior to July 25, 2023, the aggregate commitment amount and the commitment fee were the same as those under the current Credit Agreement. During the year ended October 31, 2023, there were no borrowings made or outstanding with respect to the Fund under the Credit Agreement.
Note 7–Interfund Lending Program
Pursuant to an exemptive order issued by the SEC, the Fund, along with certain other funds managed by New York Life Investments, may participate in an interfund lending program. The interfund lending program provides an alternative credit facility that permits the Fund and certain other funds managed by New York Life Investments to lend or borrow money for temporary purposes directly to or from one another, subject to the conditions of the exemptive order. During the year ended October 31, 2023, there were no interfund loans made or outstanding with respect to the Fund.
Note 8–Purchases and Sales of Securities (in 000’s)
During the year ended October 31, 2023, purchases and sales of securities, other than short-term securities, were $289,206 and $349,595, respectively.
The Fund may purchase securities from or sell securities to other portfolios managed by the Subadvisor. These interportfolio transactions are primarily used for cash management purposes and are made
pursuant to Rule 17a-7 under the 1940 Act. The Rule 17a-7 transactions during the year ended October 31, 2023, were as follows:
Sales
(000's) | Realized
Gain / (Loss)
(000's) |
| $1,455 | $194 |
Note 9–Capital Share Transactions
Transactions in capital shares for the years ended October 31, 2023 and October 31, 2022, were as follows:
| Class A | Shares | Amount |
| Year ended October 31, 2023: | | |
| Shares sold | 1,590,537 | $ 43,127,887 |
| Shares issued to shareholders in reinvestment of distributions | 1,052,417 | 28,541,623 |
| Shares redeemed | (2,737,252) | (74,286,857) |
| Net increase (decrease) in shares outstanding before conversion | (94,298) | (2,617,347) |
| Shares converted into Class A (See Note 1) | 179,908 | 4,832,388 |
| Shares converted from Class A (See Note 1) | (11,768) | (323,015) |
| Net increase (decrease) | 73,842 | $ 1,892,026 |
| Year ended October 31, 2022: | | |
| Shares sold | 2,574,874 | $ 75,162,709 |
| Shares issued to shareholders in reinvestment of distributions | 8,653,260 | 244,714,188 |
| Shares redeemed | (2,898,457) | (85,207,197) |
| Net increase (decrease) in shares outstanding before conversion | 8,329,677 | 234,669,700 |
| Shares converted into Class A (See Note 1) | 365,434 | 10,680,993 |
| Shares converted from Class A (See Note 1) | (3,901) | (117,088) |
| Net increase (decrease) | 8,691,210 | $245,233,605 |
| |
Notes to Financial Statements (continued)
| Investor Class | Shares | Amount |
| Year ended October 31, 2023: | | |
| Shares sold | 51,736 | $ 1,400,586 |
| Shares issued to shareholders in reinvestment of distributions | 110,738 | 3,007,651 |
| Shares redeemed | (174,718) | (4,739,165) |
| Net increase (decrease) in shares outstanding before conversion | (12,244) | (330,928) |
| Shares converted into Investor Class (See Note 1) | 31,998 | 887,420 |
| Shares converted from Investor Class (See Note 1) | (88,401) | (2,373,861) |
| Net increase (decrease) | (68,647) | $ (1,817,369) |
| Year ended October 31, 2022: | | |
| Shares sold | 99,246 | $ 2,910,829 |
| Shares issued to shareholders in reinvestment of distributions | 1,076,017 | 30,472,806 |
| Shares redeemed | (160,132) | (4,790,100) |
| Net increase (decrease) in shares outstanding before conversion | 1,015,131 | 28,593,535 |
| Shares converted into Investor Class (See Note 1) | 38,738 | 1,108,283 |
| Shares converted from Investor Class (See Note 1) | (259,839) | (7,693,164) |
| Net increase (decrease) | 794,030 | $ 22,008,654 |
| |
| Class B | Shares | Amount |
| Year ended October 31, 2023: | | |
| Shares sold | 1,127 | $ 22,150 |
| Shares issued to shareholders in reinvestment of distributions | 28,265 | 544,951 |
| Shares redeemed | (39,346) | (753,882) |
| Net increase (decrease) in shares outstanding before conversion | (9,954) | (186,781) |
| Shares converted from Class B (See Note 1) | (140,526) | (2,699,233) |
| Net increase (decrease) | (150,480) | $ (2,886,014) |
| Year ended October 31, 2022: | | |
| Shares sold | 13,232 | $ 270,904 |
| Shares issued to shareholders in reinvestment of distributions | 340,527 | 7,014,860 |
| Shares redeemed | (71,258) | (1,533,977) |
| Net increase (decrease) in shares outstanding before conversion | 282,501 | 5,751,787 |
| Shares converted from Class B (See Note 1) | (164,591) | (3,396,152) |
| Net increase (decrease) | 117,910 | $ 2,355,635 |
| |
| Class C | Shares | Amount |
| Year ended October 31, 2023: | | |
| Shares sold | 296,509 | $ 5,705,628 |
| Shares issued to shareholders in reinvestment of distributions | 50,505 | 974,235 |
| Shares redeemed | (234,517) | (4,556,446) |
| Net increase (decrease) in shares outstanding before conversion | 112,497 | 2,123,417 |
| Shares converted from Class C (See Note 1) | (32,491) | (625,729) |
| Net increase (decrease) | 80,006 | $ 1,497,688 |
| Year ended October 31, 2022: | | |
| Shares sold | 430,915 | $ 9,751,926 |
| Shares issued to shareholders in reinvestment of distributions | 317,250 | 6,538,534 |
| Shares redeemed | (233,253) | (4,957,547) |
| Net increase (decrease) in shares outstanding before conversion | 514,912 | 11,332,913 |
| Shares converted from Class C (See Note 1) | (33,962) | (698,007) |
| Net increase (decrease) | 480,950 | $ 10,634,906 |
| |
| Class I | Shares | Amount |
| Year ended October 31, 2023: | | |
| Shares sold | 2,437,113 | $ 71,634,987 |
| Shares issued to shareholders in reinvestment of distributions | 270,746 | 7,908,495 |
| Shares redeemed | (2,222,127) | (64,985,391) |
| Net increase (decrease) in shares outstanding before conversion | 485,732 | 14,558,091 |
| Shares converted into Class I (See Note 1) | 11,171 | 330,560 |
| Shares converted from Class I (See Note 1) | (970) | (28,530) |
| Net increase (decrease) | 495,933 | $ 14,860,121 |
| Year ended October 31, 2022: | | |
| Shares sold | 2,456,778 | $ 75,283,479 |
| Shares issued to shareholders in reinvestment of distributions | 1,366,048 | 41,432,227 |
| Shares redeemed | (1,080,081) | (35,831,216) |
| Net increase (decrease) in shares outstanding before conversion | 2,742,745 | 80,884,490 |
| Shares converted into Class I (See Note 1) | 3,574 | 115,135 |
| Net increase (decrease) | 2,746,319 | $ 80,999,625 |
| |
| 28 | MainStay WMC Value Fund |
| Class R1 | Shares | Amount |
| Year ended October 31, 2023: | | |
| Shares sold | 197 | $ 5,380 |
| Shares issued to shareholders in reinvestment of distributions | 359 | 9,920 |
| Shares redeemed | (473) | (13,122) |
| Net increase (decrease) | 83 | $ 2,178 |
| Year ended October 31, 2022: | | |
| Shares sold | 4,530 | $ 124,674 |
| Shares issued to shareholders in reinvestment of distributions | 738 | 21,242 |
| Shares redeemed | (272) | (13,072) |
| Net increase (decrease) | 4,996 | $ 132,844 |
| |
| Class R2 | Shares | Amount |
| Year ended October 31, 2023: | | |
| Shares sold | 1,806 | $ 49,580 |
| Shares issued to shareholders in reinvestment of distributions | 1,923 | 52,887 |
| Shares redeemed | (1,834) | (50,187) |
| Net increase (decrease) | 1,895 | $ 52,280 |
| Year ended October 31, 2022: | | |
| Shares sold | 3,099 | $ 92,709 |
| Shares issued to shareholders in reinvestment of distributions | 15,637 | 448,308 |
| Shares redeemed | (1,597) | (49,958) |
| Net increase (decrease) | 17,139 | $ 491,059 |
| |
| Class R3 | Shares | Amount |
| Year ended October 31, 2023: | | |
| Shares sold | 18,812 | $ 507,413 |
| Shares issued to shareholders in reinvestment of distributions | 2,864 | 77,938 |
| Shares redeemed | (17,565) | (458,612) |
| Net increase (decrease) | 4,111 | $ 126,739 |
| Year ended October 31, 2022: | | |
| Shares sold | 14,878 | $ 418,071 |
| Shares issued to shareholders in reinvestment of distributions | 18,616 | 528,702 |
| Shares redeemed | (1,823) | (50,952) |
| Net increase (decrease) | 31,671 | $ 895,821 |
| |
| Class R6 | Shares | Amount |
| Year ended October 31, 2023: | | |
| Shares sold | 148,724 | $ 4,285,051 |
| Shares issued to shareholders in reinvestment of distributions | 503,997 | 14,701,579 |
| Shares redeemed | (2,587,712) | (76,838,148) |
| Net increase (decrease) | (1,934,991) | $ (57,851,518) |
| Year ended October 31, 2022: | | |
| Shares sold | 125,655 | $ 3,861,577 |
| Shares issued to shareholders in reinvestment of distributions | 5,318,092 | 161,084,996 |
| Shares redeemed | (2,637,087) | (81,204,584) |
| Net increase (decrease) | 2,806,660 | $ 83,741,989 |
Note 10–Other Matters
As of the date of this report, the Fund faces a heightened level of risk associated with current uncertainty, volatility and state of economies, financial markets, rising interest rates, and labor and health conditions around the world. Events such as war, acts of terrorism, recessions, rapid inflation, the imposition of international sanctions, earthquakes, hurricanes, epidemics and pandemics and other unforeseen natural or human disasters may have broad adverse social, political and economic effects on the global economy, which could negatively impact the value of the Fund's investments. Developments that disrupt global economies and financial markets may magnify factors that affect the Fund's performance.
Note 11–Subsequent Events
In connection with the preparation of the financial statements of the Fund as of and for the year ended October 31, 2023, events and transactions subsequent to October 31, 2023, through the date the financial statements were issued, have been evaluated by the Manager for possible adjustment and/or disclosure. No subsequent events requiring financial statement adjustment or disclosure have been identified.
Report of Independent Registered Public Accounting Firm
To the Shareholders of the Fund and Board of Trustees
The MainStay Funds:
Opinion on the Financial Statements
We have audited the accompanying statement of assets and liabilities of MainStay WMC Value Fund (the Fund), one of the funds constituting The MainStay Funds, including the portfolio of investments, as of October 31, 2023, the related statement of operations for the year then ended, the statements of changes in net assets for each of the years in the two-year period then ended, and the related notes (collectively, the financial statements) and the financial highlights for each of the years or periods in the five-year period then ended. In our opinion, the financial statements and financial highlights present fairly, in all material respects, the financial position of the Fund as of October 31, 2023, the results of its operations for the year then ended, the changes in its net assets for each of the years in the two-year period then ended, and the financial highlights for each of the years or periods in the five-year period then ended, in conformity with U.S. generally accepted accounting principles.
Basis for Opinion
These financial statements and financial highlights are the responsibility of the Fund's management. Our responsibility is to express an opinion on these financial statements and financial highlights based on our audits. We are a public accounting firm registered with the Public Company Accounting Oversight Board (United States) (PCAOB) and are required to be independent with respect to the Fund in accordance with the U.S. federal securities laws and the applicable rules and regulations of the Securities and Exchange Commission and the PCAOB.
We conducted our audits in accordance with the standards of the PCAOB. Those standards require that we plan and perform the audit to obtain reasonable assurance about whether the financial statements and financial highlights are free of material misstatement, whether due to error or fraud. Our audits included performing procedures to assess the risks of material misstatement of the financial statements and financial highlights, whether due to error or fraud, and performing procedures that respond to those risks. Such procedures included examining, on a test basis, evidence regarding the amounts and disclosures in the financial statements and financial highlights. Such procedures also included confirmation of securities owned as of October 31, 2023, by correspondence with the custodian and the transfer agent. Our audits also included evaluating the accounting principles used and significant estimates made by management, as well as evaluating the overall presentation of the financial statements and financial highlights. We believe that our audits provide a reasonable basis for our opinion.

We have served as the auditor of one or more New York Life Investment Management investment companies since 2003.
Philadelphia, Pennsylvania
December 22, 2023
| 30 | MainStay WMC Value Fund |
Federal Income Tax Information
(Unaudited)
The Fund is required under the Internal Revenue Code to advise shareholders in a written statement as to the federal tax status of dividends paid by the Fund during such fiscal years. Accordingly, the Fund paid $39,164,964 as long term capital gain distributions.
For the fiscal year ended October 31, 2023, the Fund designated approximately $17,709,162 under the Internal Revenue Code as qualified dividend income eligible for reduced tax rates.
The dividends paid by the Fund during the fiscal year ended October 31, 2023 should be multiplied by 100.00% to arrive at the amount eligible for the corporate dividend-received deduction.
In February 2024, shareholders will receive an IRS Form 1099-DIV or substitute Form 1099, which will show the federal tax status of the distributions received by shareholders in calendar year 2023. The amounts that will be reported on such 1099-DIV or substitute Form 1099 will be the amounts you are to use on your federal income tax return and will differ from the amounts which we must report for the Fund's fiscal year ended October 31, 2023.
Proxy Voting Policies and Procedures and Proxy Voting Record
The Fund is required to file with the SEC its proxy voting record for the 12-month period ending June 30 on Form N-PX. A description of the policies and procedures that are used to vote proxies relating to portfolio securities of the Fund is available free of charge upon request by calling 800-624-6782 or visiting the SEC’s website at www.sec.gov. The most recent Form N-PX or proxy voting record is available free of charge upon request by calling 800-624-6782; visiting newyorklifeinvestments.com; or visiting the SEC’s website at www.sec.gov.
Shareholder Reports and Quarterly Portfolio Disclosure
The Fund is required to file its complete schedule of portfolio holdings with the SEC 60 days after its first and third fiscal quarter on Form N-PORT. The Fund's holdings report is available free of charge upon request by calling New York Life Investments at 800-624-6782.
Board of Trustees and Officers (Unaudited)
The Trustees and officers of the Fund are listed below. The Board oversees the MainStay Group of Funds (which consists of MainStay Funds and MainStay Funds Trust), MainStay VP Funds Trust, MainStay MacKay DefinedTerm Municipal Opportunities Fund, MainStay CBRE Global Infrastructure Megatrends Term Fund, the Manager and the Subadvisors, and elects the officers of the Funds who are responsible for the day-to-day operations of the Fund. Information pertaining to the Trustees and officers is set forth below. Each Trustee serves until his or her successor is elected and qualified or until his or her resignation, death or
removal. Under the Board’s retirement policy, unless an exception is made, a Trustee must tender his or her resignation by the end of the calendar year during which he or she reaches the age of 75. Officers are elected annually by the Board. The business address of each Trustee and officer listed below is 51 Madison Avenue, New York, New York 10010. A majority of the Trustees are not “interested persons” (as defined by the 1940 Act and rules adopted by the SEC thereunder) of the Fund (“Independent Trustees”).
| | Name and
Year of Birth | Term of Office,
Position(s) Held and
Length of Service | Principal Occupation(s)
During Past Five Years | Number of
Portfolios in
Fund Complex
Overseen by
Trustee | Other Directorships
Held by Trustee |
| | | | | | |
| | Naïm Abou-Jaoudé*
1966 | MainStay Funds: Trustee
since 2023
MainStay Funds Trust:
Trustee since 2023 | Chief Executive Officer of New York Life Investment Management LLC (since 2023). Chief Executive Officer of Candriam (an affiliate of New York Life Investment Management LLC) (2007 to 2023). | 81 | MainStay VP Funds Trust:
Trustee since 2023 (31 portfolios);
MainStay MacKay DefinedTerm Municipal Opportunities Fund: Trustee
since 2023;
MainStay CBRE Global Infrastructure Megatrends Term Fund: Trustee
since 2023; and
New York Life Investment Management International (Chair) since 2015 |
| * | This Trustee is considered to be an “interested person” of the MainStay Group of Funds, MainStay VP Funds Trust, MainStay CBRE Global Infrastructure Megatrends Term Fund and MainStay MacKay DefinedTerm Municipal Opportunities Fund, within the meaning of the 1940 Act because of his affiliation with New York Life Investment Management LLC and Candriam, as described in detail above in the column entitled “Principal Occupation(s) During Past Five Years.” |
| | |
| 32 | MainStay WMC Value Fund |
| | Name and
Year of Birth | Term of Office,
Position(s) Held and
Length of Service | Principal Occupation(s)
During Past Five Years | Number of
Portfolios in
Fund Complex
Overseen by
Trustee | Other Directorships
Held by Trustee |
| | | | | | |
| | David H. Chow
1957 | MainStay Funds: Trustee since January 2016, Advisory Board Member (June 2015 to December 2015);MainStay Funds Trust:
Trustee since January 2016, Advisory Board Member (June 2015 to December 2015) | Founder and CEO, DanCourt Management, LLC (since 1999) | 81 | MainStay VP Funds Trust: Trustee since January 2016, Advisory Board Member (June 2015 to December 2015) (31 portfolios);
MainStay MacKay DefinedTerm Municipal Opportunities Fund: Trustee since January 2016, Advisory Board Member (June 2015 to December 2015);
MainStay CBRE Global Infrastructure Megatrends Term Fund: Trustee since 2021;
VanEck Vectors Group of Exchange-Traded Funds: Trustee since 2006 and Independent Chairman of the Board of Trustees from 2008 to 2022 (57 portfolios); and
Berea College of Kentucky: Trustee since 2009, Chair of the Investment Committee since 2018 |
| | Karen Hammond
1956 | MainStay Funds: Trustee since December 2021, Advisory Board Member (June 2021 to December 2021);MainStay Funds Trust:
Trustee since December 2021, Advisory Board Member (June 2021 to December 2021)
| Retired, Managing Director, Devonshire Investors (2007 to 2013); Senior Vice President, Fidelity Management & Research Co. (2005 to 2007); Senior Vice President and Corporate Treasurer, FMR Corp. (2003 to 2005); Chief Operating Officer, Fidelity Investments Japan (2001 to 2003) | 81 | MainStay VP Funds Trust: Trustee since December 2021, Advisory Board Member (June 2021 to December 2021) (31 portfolios);
MainStay MacKay DefinedTerm Municipal Opportunities Fund: Trustee since December 2021, Advisory Board Member (June 2021 to December 2021);
MainStay CBRE Global Infrastructure Megatrends Term Fund: Trustee since December 2021, Advisory Board Member (June 2021 to December 2021);
Two Harbors Investment Corp.: Director since 2018;
Rhode Island State Investment Commission: Member since 2017; and
Blue Cross Blue Shield of Rhode Island: Director since 2019 |
| | Susan B. Kerley
1951 | MainStay Funds: Chair since January 2017 and Trustee since 2007;MainStay Funds Trust:
Chair since January 2017 and Trustee since 1990*** | President, Strategic Management Advisors LLC (since 1990) | 81 | MainStay VP Funds Trust: Chair since January 2017 and Trustee since 2007 (31 portfolios)**;
MainStay MacKay DefinedTerm Municipal Opportunities Fund: Chair since January 2017 and Trustee since 2011;
MainStay CBRE Global Infrastructure Megatrends Term Fund: Trustee since June 2021; and
Legg Mason Partners Funds: Trustee since 1991 (45 portfolios) |
Board of Trustees and Officers (Unaudited) (continued)
| | Name and
Year of Birth | Term of Office,
Position(s) Held and
Length of Service | Principal Occupation(s)
During Past Five Years | Number of
Portfolios in
Fund Complex
Overseen by
Trustee | Other Directorships
Held by Trustee |
| | | | | | |
| | Alan R. Latshaw
1951 | MainStay Funds: Trusteesince 2006;MainStay Funds Trust:
Trustee since 2007*** | Retired; Partner, Ernst & Young LLP (2002 to 2003); Partner, Arthur Andersen LLP (1989 to 2002); Consultant to the MainStay Funds Audit and Compliance Committee (2004 to 2006) | 81 | MainStay VP Funds Trust: Trustee since 2007 (31 portfolios)**;
MainStay MacKay DefinedTerm Municipal Opportunities Fund: Trustee since 2011; and
MainStay CBRE Global Infrastructure Megatrends Term Fund: Trustee since June 2021 |
| | Jacques P. Perold
1958 | MainStay Funds: Trustee since January 2016, Advisory Board Member (June 2015to December 2015);MainStay Funds Trust:
Trustee since January 2016, Advisory Board Member (June 2015 to December 2015) | Founder and Chief Executive Officer, CapShift Advisors LLC (since 2018); President, Fidelity Management & Research Company (2009 to 2014); President and Chief Investment Officer, Geode Capital Management, LLC (2001 to 2009) | 81 | MainStay VP Funds Trust: Trustee since January 2016, Advisory Board Member (June 2015 to December 2015) (31 portfolios);
MainStay MacKay DefinedTerm Municipal Opportunities Fund: Trustee since January 2016, Advisory Board Member (June 2015 to December 2015);
MainStay CBRE Global Infrastructure Megatrends Term Fund: Trustee since June 2021;
Allstate Corporation: Director since 2015; and
MSCI Inc.: Director since 2017 |
| | Richard S. Trutanic
1952 | MainStay Funds: Trustee since 1994;MainStay Funds Trust:
Trustee since 2007*** | Chairman and Chief Executive Officer, Somerset & Company (financial advisory firm) (since 2004); Managing Director, The Carlyle Group (private investment firm) (2002 to 2004); Senior Managing Director, Partner and Board Member, Groupe Arnault S.A. (private investment firm) (1999 to 2002) | 81 | MainStay VP Funds Trust: Trustee since 2007 (31 portfolios)**;
MainStay MacKay DefinedTerm Municipal Opportunities Fund: Trustee since 2011; and
MainStay CBRE Global Infrastructure Megatrends Term Fund: Trustee since June 2021 |
| ** | Includes prior service as a Director of MainStay VP Series Fund, Inc., the predecessor to MainStay VP Funds Trust. |
| *** | Includes prior service as a Director/Trustee of certain predecessor entities to MainStay Funds Trust. |
| 34 | MainStay WMC Value Fund |
| | Name and
Year of Birth | Position(s) Held and
Length of Service | Principal Occupation(s)
During Past Five Years | |
| | | | | |
| | Kirk C. Lehneis
1974 | President, MainStay Funds, MainStay Funds Trust (since 2017) | Chief Operating Officer and Senior Managing Director (since 2016), New York Life Investment Management LLC and New York Life Investment Management Holdings LLC; Member of the Board of Managers (since 2017) and Senior Managing Director (since 2018), NYLIFE Distributors LLC; Chairman of the Board and Senior Managing Director, NYLIM Service Company LLC (since 2017); Trustee, President and Principal Executive Officer of IndexIQ Trust, IndexIQ ETF Trust and IndexIQ Active ETF Trust (since 2018); President, MainStay CBRE Global Infrastructure Megatrends Term Fund (since 2021), MainStay MacKay DefinedTerm Municipal Opportunities Fund and MainStay VP Funds Trust (since 2017)**; Senior Managing Director, Global Product Development (2015 to 2016); Managing Director, Product Development (2010 to 2015), New York Life Investment Management LLC | |
| | Jack R. Benintende
1964 | Treasurer and Principal Financial and Accounting Officer, MainStay Funds (since 2007), MainStay Funds Trust (since 2009) | Managing Director, New York Life Investment Management LLC (since 2007); Treasurer and Principal Financial and Accounting Officer, MainStay CBRE Global Infrastructure Megatrends Term Fund (since 2021), MainStay MacKay DefinedTerm Municipal Opportunities Fund (since 2011) and MainStay VP Funds Trust (since 2007)**; and Assistant Treasurer, New York Life Investment Management Holdings LLC (2008 to 2012) | |
| | J. Kevin Gao
1967 | Secretary and Chief Legal Officer, MainStay Funds and MainStay Funds Trust (since 2010) | Managing Director and Associate General Counsel, New York Life Investment Management LLC (since 2010); Secretary and Chief Legal Officer, MainStay CBRE Global Infrastructure Megatrends Term Fund (since 2021), MainStay MacKay DefinedTerm Municipal Opportunities Fund (since 2011) and MainStay VP Funds Trust (since 2010)** | |
| | Kevin M. Gleason
1967 | Vice President and Chief Compliance Officer, MainStay Funds and MainStay Funds Trust (since June 2022) | Vice President and Chief Compliance Officer, IndexIQ Trust, IndexIQ ETF Trust and Index IQ Active ETF Trust (since June 2022); Vice President and Chief Compliance Officer, MainStay CBRE Global Infrastructure Megatrends Term Fund, MainStay VP Funds Trust and MainStay MacKay DefinedTerm Municipal Opportunities Fund (since June 2022); Senior Vice President, Voya Investment Management and Chief Compliance Officer, Voya Family of Funds (2012 to 2022) | |
| | Scott T. Harrington
1959 | Vice President— Administration, MainStay Funds (since 2005), MainStay Funds Trust (since 2009) | Managing Director, New York Life Investment Management LLC (including predecessor advisory organizations) (since 2000); Member of the Board of Directors, New York Life Trust Company (since 2009); Vice President—Administration, MainStay CBRE Global Infrastructure Megatrends Term Fund (since 2021), MainStay MacKay DefinedTerm Municipal Opportunities Fund (since 2011) and MainStay VP Funds Trust (since 2005)** | |
| * | The officers listed above are considered to be “interested persons” of the MainStay Group of Funds, MainStay VP Funds Trust, MainStay CBRE Global Infrastructure Megatrends Term Fund and MainStay MacKay DefinedTerm Municipal Opportunities Fund within the meaning of the 1940 Act because of their affiliation with the MainStay Group of Funds, New York Life Insurance Company and/or its affiliates, including New York Life Investment Management LLC, New York Life Insurance Company, NYLIM Service Company LLC, NYLIFE Securities LLC and/or NYLIFE Distributors LLC, as described in detail in the column captioned “Principal Occupation(s) During Past Five Years.” Officers are elected annually by the Board. |
| ** | Includes prior service as an Officer of MainStay VP Series Fund, Inc., the predecessor to MainStay VP Funds Trust. |
Officers of the Trust (Who are not Trustees)*
This page intentionally left blank.
This page intentionally left blank.
This page intentionally left blank.
Equity
U.S. Equity
MainStay Epoch U.S. Equity Yield Fund
MainStay Fiera SMID Growth Fund
MainStay PineStone U.S. Equity Fund
MainStay S&P 500 Index Fund
MainStay Winslow Large Cap Growth Fund
MainStay WMC Enduring Capital Fund
MainStay WMC Growth Fund
MainStay WMC Small Companies Fund
MainStay WMC Value Fund
International Equity
MainStay Epoch International Choice Fund
MainStay PineStone International Equity Fund
MainStay WMC International Research Equity Fund
Emerging Markets Equity
MainStay Candriam Emerging Markets Equity Fund
Global Equity
MainStay Epoch Capital Growth Fund
MainStay Epoch Global Equity Yield Fund
MainStay PineStone Global Equity Fund
Fixed Income
Taxable Income
MainStay Candriam Emerging Markets Debt Fund
MainStay Floating Rate Fund
MainStay MacKay High Yield Corporate Bond Fund
MainStay MacKay Short Duration High Yield Fund
MainStay MacKay Strategic Bond Fund
MainStay MacKay Total Return Bond Fund
MainStay MacKay U.S. Infrastructure Bond Fund
MainStay Short Term Bond Fund
Tax-Exempt Income
MainStay MacKay California Tax Free Opportunities Fund1
MainStay MacKay High Yield Municipal Bond Fund
MainStay MacKay New York Tax Free Opportunities Fund2
MainStay MacKay Short Term Municipal Fund
MainStay MacKay Strategic Municipal Allocation Fund
MainStay MacKay Tax Free Bond Fund
Money Market
MainStay Money Market Fund
Mixed Asset
MainStay Balanced Fund
MainStay Income Builder Fund
MainStay MacKay Convertible Fund
Speciality
MainStay CBRE Global Infrastructure Fund
MainStay CBRE Real Estate Fund
MainStay Cushing MLP Premier Fund
Asset Allocation
MainStay Conservative Allocation Fund
MainStay Conservative ETF Allocation Fund
MainStay Defensive ETF Allocation Fund
MainStay Equity Allocation Fund
MainStay Equity ETF Allocation Fund
MainStay ESG Multi-Asset Allocation Fund
MainStay Growth Allocation Fund
MainStay Growth ETF Allocation Fund
MainStay Moderate Allocation Fund
MainStay Moderate ETF Allocation Fund
Manager
New York Life Investment Management LLC
New York, New York
Subadvisors
Candriam3
Strassen, Luxembourg
CBRE Investment Management Listed Real Assets LLC
Radnor, Pennsylvania
Cushing Asset Management, LP
Dallas, Texas
Epoch Investment Partners, Inc.
New York, New York
Fiera Capital Inc.
New York, New York
IndexIQ Advisors LLC3
New York, New York
MacKay Shields LLC3
New York, New York
NYL Investors LLC3
New York, New York
PineStone Asset Management Inc.
Montreal, Québec
Wellington Management Company LLP
Boston, Massachusetts
Winslow Capital Management, LLC
Minneapolis, Minnesota
Legal Counsel
Dechert LLP
Washington, District of Columbia
Independent Registered Public Accounting Firm
KPMG LLP
Philadelphia, Pennsylvania
Distributor
NYLIFE Distributors LLC3
Jersey City, New Jersey
Custodian
JPMorgan Chase Bank, N.A.
New York, New York
1.
This Fund is registered for sale in AZ, CA, NV, OR, TX, UT, WA and MI (Class A and Class I shares only), and CO, FL, GA, HI, ID, MA, MD, NH, NJ and NY (Class I shares only).
| 2. | This Fund is registered for sale in CA, CT, DE, FL, MA, NJ, NY and VT. |
| 3. | An affiliate of New York Life Investment Management LLC. |
Not part of the Annual Report
For more information
800-624-6782
newyorklifeinvestments.com
“New York Life Investments” is both a service mark, and the common trade name, of certain investment advisors affiliated with New York Life Insurance Company. The MainStay Funds® are managed by New York Life Investment Management LLC and distributed by NYLIFE Distributors LLC, 30 Hudson Street, Jersey City, NJ 07302, a wholly owned subsidiary of New York Life Insurance Company. NYLIFE Distributors LLC is a Member FINRA/SIPC.
©2023 NYLIFE Distributors LLC. All rights reserved.
| 5013939MS139-23 | MSWV11-12/23 |
(NYLIM) NL532
As of the end of the period covered by this report, the Registrant has adopted a code of ethics (the “Code”) that applies to the Registrant’s principal executive officer (“PEO”) and principal financial officer (“PFO”). During the period covered by this report, no amendments were made to the provisions of the Code. The Registrant did not grant any waivers, including implicit waivers, from any provisions of the Code to the PEO or PFO during the period covered by this report. A copy of the Code is filed herewith.
| Item 3. | Audit Committee Financial Expert. |
The Board of Trustees has determined that the Registrant has three “audit committee financial experts” serving on its Audit Committee. The Audit Committee financial experts are Alan R. Latshaw, Karen Hammond and Susan B. Kerley. Mr. Latshaw, Ms. Hammond and Ms. Kerley are “independent” as defined by Item 3 of Form N-CSR.
| Item 4. | Principal Accountant Fees and Services. |
(a) Audit Fees
The aggregate fees billed for the fiscal year ended October 31, 2023 for professional services rendered by KPMG LLP (“KPMG”) for the audit of the Registrant’s annual financial statements or services that are normally provided by KPMG in connection with statutory and regulatory filings or engagements for that fiscal year were $815,850.
The aggregate fees billed for the fiscal year ended October 31, 2022 for professional services rendered by KPMG for the audit of the Registrant’s annual financial statements or services that are normally provided by KPMG in connection with statutory and regulatory filings or engagements for that fiscal year were
$874,450.
(b) Audit-Related Fees
The aggregate fees billed for assurance and related services by KPMG that are reasonably related to the performance of the audit of the Registrant’s financial statements and are not reported under paragraph (a) of this Item were: (i) $0 for the fiscal year ended October 31, 2023, and (ii) $0 for the fiscal year ended October 31, 2022.
The aggregate fees billed for professional services rendered by KPMG for tax compliance, tax advice, and tax planning were: (i) $0 during the fiscal year ended October 31, 2023, and (ii) $0 during the fiscal year ended October 31, 2022. These services primarily included preparation of federal, state and local income tax returns and excise tax returns, as well as services relating to excise tax distribution requirements.
(d) All Other Fees
The aggregate fees billed for products and services provided by KPMG, other than the services reported in paragraphs (a) through (c) of this Item were: (i) $0 during the fiscal year ended October 31, 2023, and (ii) $0 during the fiscal year ended October 31, 2022.
(e) Pre-Approval Policies and Procedures
| | (1) | The Registrant’s Audit Committee has adopted pre-approval policies and procedures (the “Procedures”) to govern the Committee’s pre-approval of (i) all audit services and permissible non-audit services to be provided to the Registrant by its independent accountant, and (ii) all permissible non-audit services to be provided by such independent accountant to the Registrant’s investment adviser and to any entity controlling, controlled by or under common control with the investment adviser that provides ongoing services to the Registrant (collectively, the “Service Affiliates”) if the services directly relate to the Registrant’s operations and financial reporting. In accordance with the Procedures, the Audit Committee is responsible for the engagement of the independent accountant to certify the Registrant’s financial statements for each fiscal year. With respect to the pre-approval of non-audit services provided to the Registrant and its Service Affiliates, the Procedures provide that the Audit Committee may annually pre-approve a list of the types of services that may be provided to the Registrant or its Service Affiliates, or the Audit Committee may pre-approve such services on a project-by-project basis as they arise. Unless a type of service has received general pre-approval, it will require specific pre-approval by the Audit Committee if it is to be provided by the independent accountant. The Procedures also permit the Audit Committee to delegate authority to one or more of its members to pre-approve any proposed non-audit services that have not been previously pre-approved by the Audit Committee, subject to the ratification by the full Audit Committee no later than its next scheduled meeting. To date, the Audit Committee has not delegated such authority. |
| | (2) | With respect to the services described in paragraphs (b) through (d) of this Item 4, no amount was approved by the Audit Committee pursuant to paragraph (c)(7)(i)(C) of Rule 2-01 of Regulation S-X. |
(f) There were no hours expended on KPMG’s engagement to audit the Registrant’s financial statements for the most recent fiscal year was attributable to work performed by persons other than KPMG’s full-time, permanent employees.
(g) All non-audit fees billed by KPMG for services rendered to the Registrant for the fiscal years ended October 31, 2023 and October 31, 2022 are disclosed in 4(b)-(d) above.
The aggregate non-audit fees billed by KPMG for services rendered to the Registrant’s investment adviser (not including any sub-adviser whose role is primarily portfolio management and is subcontracted with or overseen by another investment adviser), and any entity controlling, controlled by, or under common control with the adviser that provides ongoing services to the Registrant were approximately: (i) $252,428 for the fiscal year ended October 31, 2023, and (ii) $193,405 for the fiscal year ended October 31, 2022.
(h) The Registrant’s Audit Committee has determined that the non-audit services rendered by KPMG for the fiscal year ended October 31, 2023 to the Registrant’s investment adviser and any entity controlling, controlled by, or under common control with the Registrant’s investment adviser that provides ongoing services to the Registrant that were not required to be pre-approved by the Audit Committee because they
did not relate directly to the operations and financial reporting of the registrant were compatible with maintaining the respective independence of KPMG during the relevant time period.
| Item 5. | Audit Committee of Listed Registrants. |
Not applicable.
The Schedule of Investments is included as part of Item 1 of this report.
| Item 7. | Disclosure of Proxy Voting Policies and Procedures for Closed-End Management Investment Companies. |
Not applicable.
| Item 8. | Portfolio Managers of Closed-End Management Investment Companies. |
Not applicable.
| Item 9. | Purchases of Equity Securities by Closed-End Management Investment Company and Affiliated Purchasers. |
Not applicable.
| Item 10. | Submission of Matters to a Vote of Security Holders. |
Since the Registrant’s last response to this Item, there have been no material changes to the procedures by which shareholders may recommend nominees to the Registrant’s Board of Trustees.
Item 11. Controls and Procedures.
(a) Based on an evaluation of the Registrant’s Disclosure Controls and Procedures (as defined in Rule 30a-3(c) under the Investment Company Act of 1940) (the “Disclosure Controls”), as of a date within 90 days prior to the filing date (the “Filing Date”) of this Form N-CSR (the “Report”), the Registrant’s principal executive officer and principal financial officer have concluded that the Disclosure Controls are reasonably designed to ensure that information required to be disclosed by the Registrant in the Report is recorded, processed, summarized and reported by the Filing Date, including ensuring that information required to be disclosed in the Report is accumulated and communicated to the Registrant’s management, including the Registrant’s principal executive officer and principal financial officer, as appropriate to allow timely decisions regarding required disclosure.
(b) There were no changes in the Registrant’s internal control over financial reporting (as defined in Rule 30a-3(d)) under the Investment Company Act of 1940 that occurred during the period covered by this report that has materially affected, or is reasonably likely to materially affect, the Registrant’s internal control over financial reporting.
Item 12. Disclosure of Securities Lending Activities for Closed End Management Investment Companies.
Not applicable.
Item 13. Exhibits.
SIGNATURES
Pursuant to the requirements of the Securities Exchange Act of 1934 and the Investment Company Act of 1940, the Registrant has duly caused this Report to be signed on its behalf by the undersigned, thereunto duly authorized.
| | |
| THE MAINSTAY FUNDS |
| |
| By: | | /s/ Kirk C. Lehneis |
| | Kirk C. Lehneis |
| | President and Principal Executive Officer |
|
| Date: January 5, 2024 |
Pursuant to the requirements of the Securities Exchange Act of 1934 and the Investment Company Act of 1940, this Report has been signed below by the following persons on behalf of the Registrant and in the capacities and on the dates indicated.
| | |
| By: | | /s/ Kirk C. Lehneis |
| | Kirk C. Lehneis |
| | President and Principal Executive Officer |
|
| Date: January 5, 2024 |
| | |
| By: | | /s/ Jack R. Benintende |
| | Jack R. Benintende |
| | Treasurer and Principal Financial and Accounting Officer |
|
| Date: January 5, 2024 |