UNITED STATES
SECURITIES AND EXCHANGE COMMISSION
Washington, D.C. 20549
Form N-CSR
CERTIFIED SHAREHOLDER REPORT OF REGISTERED MANAGEMENT
INVESTMENT COMPANIES
Investment Company Act File Number 811-04550
THE MAINSTAY FUNDS
(Exact name of Registrant as specified in charter)
51 Madison Avenue, New York, NY 10010
(Address of principal executive offices) (Zip code)
J. Kevin Gao, Esq.
30 Hudson Street
Jersey City, New Jersey 07302
(Name and address of agent for service)
Registrant’s telephone number, including area code: (212) 576-7000
Date of fiscal year end: October 31
Date of reporting period: October 31, 2022
FORM N-CSR
| Item 1. | Reports to Stockholders. |
MainStay Candriam Emerging Markets Debt Fund
Message from the President and Annual Report
October 31, 2022
Sign up for e-delivery of your shareholder reports. For full details on e-delivery, including who can participate and what you can receive via e-delivery,
please log in to newyorklifeinvestments.com/accounts.
| Not FDIC/NCUA Insured | Not a Deposit | May Lose Value | No Bank Guarantee | Not Insured by Any Government Agency |
This page intentionally left blank
Message from the President
A series of economic and geopolitical challenges undermined equity and fixed-income markets during the 12-month reporting period ended October 31, 2022. Stocks and bonds alike trended lower in the face of sharply rising interest rates, increasing inflationary pressures, slowing economic growth and Russia’s invasion of Ukraine.
The reporting period began on a mixed note, with concerns about the spreading Omicron variant of the COVID-19 virus and increasingly hawkish statements from the U.S. Federal Reserve (the “Fed”) regarding mounting inflation, countered by bullish sentiment stemming from U.S. economic growth and strong corporate earnings. In January 2022, markets turned decisively negative as comments from the Fed raised the likelihood of rate hikes as early as March, and Russia issued increasingly aggressive threats toward Ukraine. The onset of Russia’s invasion in February exacerbated global inflationary pressures while increasing investor uncertainty. Domestic supply shortages, international trade imbalances and rising inflation caused GDP (gross domestic product) to contract in the first and second quarters of the year, although employment and consumer spending proved resilient. Prices for petroleum surged to multi-year highs, while many key agricultural chemicals and industrial metals climbed as well. Accelerating inflationary forces prompted the Fed to implement its most aggressive interest rate increases since the 1980s with a series of five sharp rate hikes, raising the federal funds rate from a range of 0.00% to 0.25% in March to 3.00% to 3.25% in September, with additional rate hikes expected before the end of the year. International central banks generally followed suit, raising rates by varying degrees in efforts to curb local inflation, although most increases remained significantly more modest than those in the United States. Relatively high U.S. interest rates and risk-averse international sentiment pushed U.S. dollar values higher compared to most other currencies, with the ensuing negative impact on global prices for food, fuel and other key, U.S.-dollar-denominated products.
The effects of these interrelated challenges were felt throughout U.S. and international financial markets. The S&P 500® Index, a widely regarded benchmark of U.S. market performance, declined by more than 14% during the reporting period. Although the energy sector generated strong gains, bolstered by elevated oil and gas prices, most other industry areas recorded losses. The more cyclical and growth-oriented sectors of consumer discretionary, real estate and information technology delivered the
weakest returns, while the traditionally defensive and value-oriented consumer staples, utilities and health care sectors outperformed. International stocks lagged compared to their U.S. counterparts, with some emerging markets, such as China, suffering particularly steep losses. A few markets, however, including Brazil, Mexico and the United Arab Emirates, ended the reporting period with little change. Fixed-income markets saw bond prices broadly decline as yields rose along with interest rates. Short-term yields rose faster than long-term yields, producing a yield curve inversion from July through the end of the reporting period, with long-term rates remaining below short-term rates. While floating-rate instruments, which feature variable interest rates that allow investors to benefit from a rising rate environment, provided a degree of insulation from inflation-driven trends, they were not immune to the market’s widespread declines.
While the Fed acknowledges the costs of rising rates in terms of weaker GDP growth and unsettled financial markets over the short term, its primary focus continues to be the longer-term economic impact of inflation. With the latest figures as of the date of this report showing that inflation remains above 8%, versus a target rate of just 2%, the Fed clearly has a distance yet to go, making further rate increases and market volatility more likely in the coming months. The question remains as to whether the Fed and other central banks will manage a so-called “soft landing,” curbing inflation while avoiding a persistent economic slowdown. If they prove successful, we expect that favorable inflation trends and increasingly attractive valuations in both equity and bond markets should eventually translate into sustainable improvements in the investment environment.
Whatever actions the Fed takes and however financial markets react, as a MainStay investor, you can depend on us to continue providing the insight, expertise and service that have long defined New York Life Investments. Thank you for trusting us to help you meet your investment needs.
Sincerely,
Kirk C. Lehneis
President
The opinions expressed are as of the date of this report and are subject to change. There is no guarantee that any forecast made will come to pass. This material does not constitute investment advice and is not intended as an endorsement of any specific investment. Past performance is no guarantee of future results.
Not part of the Annual Report
Investors should refer to the Fund’s Summary Prospectus and/or Prospectus and consider the Fund’s investment objectives, strategies, risks, charges and expenses carefully before investing. The Summary Prospectus and/or Prospectus contain this and other information about the Fund. You may obtain copies of the Fund’s Summary Prospectus, Prospectus and Statement of Additional Information, which includes information about The MainStay Funds' Trustees, free of charge, upon request, by calling toll-free 800-624-6782, by writing to NYLIFE Distributors LLC, Attn: MainStay Marketing Department, 30 Hudson Street, Jersey City, NJ 07302 or by sending an e-mail to MainStayShareholderServices@nylim.com. These documents are also available via the MainStay Funds’ website at newyorklifeinvestments.com. Please read the Fund’s Summary Prospectus and/or Prospectus carefully before investing.
Investment and Performance Comparison (Unaudited)
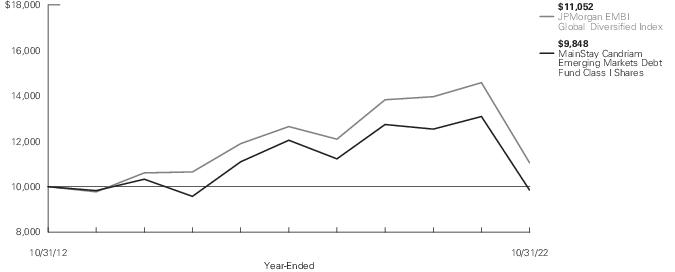
Performance data quoted represents past performance. Past performance is no guarantee of future results. Because of market volatility and other factors, current performance may be lower or higher than the figures shown. Investment return and principal value will fluctuate, and as a result, when shares are redeemed, they may be worth more or less than their original cost. The graph below depicts the historical performance of Class I shares of the Fund. Performance will vary from class to class based on differences in class-specific expenses and sales charges. For performance information current to the most recent month-end, please call 800-624-6782 or visit newyorklifeinvestments.com.
The performance table and graph do not reflect the deduction of taxes that a shareholder would pay on distributions or Fund share redemptions. Total returns reflect maximum applicable sales charges as indicated in the table below, if any, changes in share price, and reinvestment of dividend and capital gain distributions. The graph assumes the initial investment amount shown below and reflects the deduction of all sales charges that would have applied for the period of investment. Performance figures may reflect certain fee waivers and/or expense limitations, without which total returns may have been lower. For more information on share classes and current fee waivers and/or expense limitations (if any), please refer to the Notes to Financial Statements.
| Average Annual Total Returns for the Year-Ended October 31, 2022 |
| Class | Sales Charge | | Inception
Date1 | One
Year | Five
Years | Ten
Years | Gross
Expense
Ratio2 |
| Class A Shares | Maximum 4.5% Initial Sales Charge | With sales charges | 6/1/1998 | -28.31% | -5.09% | -0.88% | 1.32% |
| | | Excluding sales charges | | -24.93 | -4.21 | -0.42 | 1.32 |
| Investor Class Shares3 | Maximum 4% Initial Sales Charge | With sales charges | 2/28/2008 | -28.26 | -5.39 | -1.13 | 1.70 |
| | | Excluding sales charges | | -25.27 | -4.51 | -0.67 | 1.70 |
| Class B Shares4 | Maximum 5% CDSC | With sales charges | 6/1/1998 | -29.38 | -5.57 | -1.42 | 2.45 |
| | if Redeemed Within the First Six Years of Purchase | Excluding sales charges | | -25.85 | -5.25 | -1.42 | 2.45 |
| Class C Shares | Maximum 1% CDSC | With sales charges | 9/1/1998 | -26.61 | -5.25 | -1.41 | 2.45 |
| | if Redeemed Within One Year of Purchase | Excluding sales charges | | -25.90 | -5.25 | -1.41 | 2.45 |
| Class I Shares | No Sales Charge | | 8/31/2007 | -24.75 | -3.95 | -0.15 | 1.06 |
| 1. | Prior to February 28, 2017, the Fund's primary investment strategies were changed. Effective June 21, 2019, the Fund replaced its prior subadvisor and modified its investment objective and principal investment strategies. The performance in the graph and table prior to those dates reflects its prior subadvisor's, investment objective and principal investment strategies. |
| 2. | The gross expense ratios presented reflect the Fund’s “Total Annual Fund Operating Expenses” from the most recent Prospectus, as supplemented, and may differ from other expense ratios disclosed in this report. |
| 3. | Prior to June 30, 2020, the maximum initial sales charge was 4.5%, which is reflected in the applicable average annual total return figures shown. |
| 4. | Class B shares are closed to all new purchases as well as additional investments by existing Class B shareholders. |
The footnotes on the next page are an integral part of the table and graph and should be carefully read in conjunction with them.
| Benchmark Performance* | One
Year | Five
Years | Ten
Years |
| JPMorgan EMBI Global Diversified Index1 | -24.19% | -2.66% | 1.01% |
| Morningstar Emerging Markets Bond Category Average2 | -21.77 | -2.75 | -0.59 |
| * | Returns for indices reflect no deductions for fees, expenses or taxes, except for foreign withholding taxes where applicable. Results assume reinvestment of all dividends and capital gains. An investment cannot be made directly in an index. |
| 1. | The JPMorgan EMBI Global Diversified Index is the Fund’s primary broad-based securities market index for comparison purposes. The JPMorgan EMBI Global Diversified Index is a market-capitalization weighted, total return index tracking the traded market for U.S. dollar-denominated Brady Bonds, Eurobonds, traded loans and local market debt instruments issued by sovereign and quasi-sovereign entities. |
| 2. | The Morningstar Emerging Markets Bond Category Average is representative of funds that invest more than 65% of their assets in foreign bonds from developing countries. The largest portion of the emerging-markets bond market comes from Latin America, followed by Eastern Europe. Africa, the Middle East, and Asia make up the rest. Results are based on average total returns of similar funds with all dividends and capital gain distributions reinvested. |
The footnotes on the preceding page are an integral part of the table and graph and should be carefully read in conjunction with them.
| 6 | MainStay Candriam Emerging Markets Debt Fund |
Cost in Dollars of a $1,000 Investment in MainStay Candriam Emerging Markets Debt Fund (Unaudited)
The example below is intended to describe the fees and expenses borne by shareholders during the six-month period from May 1, 2022 to October 31, 2022, and the impact of those costs on your investment.
Example
As a shareholder of the Fund you incur two types of costs: (1) transaction costs, including exchange fees and sales charges (loads) on purchases (as applicable), and (2) ongoing costs, including management fees, distribution and/or service (12b-1) fees and other Fund expenses (as applicable). This example is intended to help you understand your ongoing costs (in dollars) of investing in the Fund and to compare these costs with the ongoing costs of investing in other mutual funds. The example is based on an investment of $1,000 made at the beginning of the six-month period and held for the entire period from May 1, 2022 to October 31, 2022.
This example illustrates your Fund’s ongoing costs in two ways:
Actual Expenses
The second and third data columns in the table below provide information about actual account values and actual expenses. You may use the information in these columns, together with the amount you invested, to estimate the expenses that you paid during the six months ended October 31, 2022. Simply divide your account value by $1,000 (for example, an
$8,600 account value divided by $1,000 = 8.6), then multiply the result by the number under the heading entitled “Expenses Paid During Period” to estimate the expenses you paid on your account during this period.
Hypothetical Example for Comparison Purposes
The fourth and fifth data columns in the table below provide information about hypothetical account values and hypothetical expenses based on the Fund’s actual expense ratio and an assumed rate of return of 5% per year before expenses, which is not the Fund’s actual return. The hypothetical account values and expenses may not be used to estimate the actual ending account balances or expenses you paid for the six-month period shown. You may use this information to compare the ongoing costs of investing in the Fund with the ongoing costs of investing in other mutual funds. To do so, compare this 5% hypothetical example with the 5% hypothetical examples that appear in the shareholder reports of the other mutual funds.
Please note that the expenses shown in the table are meant to highlight your ongoing costs only and do not reflect any transactional costs, such as exchange fees or sales charges (loads). Therefore, the fourth and fifth data columns of the table are useful in comparing ongoing costs only and will not help you determine the relative total costs of owning different funds. In addition, if these transactional costs were included, your costs would have been higher.
| Share Class | Beginning
Account
Value
5/1/22 | Ending Account
Value (Based
on Actual
Returns and
Expenses)
10/31/22 | Expenses
Paid
During
Period1 | Ending Account
Value (Based
on Hypothetical
5% Annualized
Return and
Actual Expenses)
10/31/22 | Expenses
Paid
During
Period1 | Net Expense
Ratio
During
Period2 |
| Class A Shares | $1,000.00 | $878.80 | $ 5.45 | $1,019.41 | $ 5.85 | 1.15% |
| Investor Class Shares | $1,000.00 | $877.00 | $ 7.43 | $1,017.29 | $ 7.98 | 1.57% |
| Class B Shares | $1,000.00 | $873.20 | $11.00 | $1,013.46 | $11.82 | 2.33% |
| Class C Shares | $1,000.00 | $873.40 | $11.00 | $1,013.46 | $11.82 | 2.33% |
| Class I Shares | $1,000.00 | $880.30 | $ 4.03 | $1,020.92 | $ 4.33 | 0.85% |
| 1. | Expenses are equal to the Fund’s annualized expense ratio of each class multiplied by the average account value over the period, divided by 365 and multiplied by 184 (to reflect the six-month period). The table above represents the actual expenses incurred during the six-month period. In addition to the fees and expenses which the Fund bears directly, it also indirectly bears a pro rata share of the fees and expenses of the underlying funds in which it invests. Such indirect expenses are not included in the above-reported expense figures. |
| 2. | Expenses are equal to the Fund's annualized expense ratio to reflect the six-month period. |
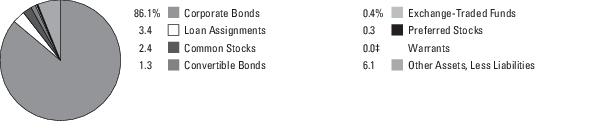
Country Composition as of October 31, 2022 (Unaudited)
| Mexico | 8.6% |
| United States | 7.1 |
| United Arab Emirates | 6.3 |
| Saudi Arabia | 5.4 |
| Chile | 4.8 |
| Indonesia | 4.7 |
| Romania | 4.5 |
| Colombia | 4.4 |
| Brazil | 3.3 |
| Oman | 3.2 |
| South Africa | 3.0 |
| Qatar | 2.9 |
| Dominican Republic | 2.9 |
| Hungary | 2.5 |
| Croatia | 2.4 |
| Egypt | 2.2 |
| Azerbaijan | 2.0 |
| Angola | 1.8 |
| Bahrain | 1.7 |
| Philippines | 1.7 |
| Nigeria | 1.6 |
| Uruguay | 1.5 |
| Ecuador | 1.4 |
| Argentina | 1.4 |
| Ukraine | 1.3 |
| Paraguay | 1.3% |
| Panama | 1.3 |
| El Salvador | 1.0 |
| Republic of the Congo | 1.0 |
| Gabon | 0.9 |
| Peru | 0.9 |
| Tunisia | 0.8 |
| Iraq | 0.8 |
| Ghana | 0.7 |
| Georgia | 0.7 |
| Venezuela | 0.7 |
| Poland | 0.6 |
| Mozambique | 0.6 |
| India | 0.6 |
| Cote D'Ivoire | 0.6 |
| Zambia | 0.4 |
| Bahamas | 0.4 |
| Sri Lanka | 0.3 |
| Senegal | 0.3 |
| Republic Of Serbia | 0.2 |
| Lebanon | 0.2 |
| Pakistan | 0.1 |
| Other Assets, Less Liabilities | 3.0 |
| | 100.0% |
See Portfolio of Investments beginning on page 12 for specific holdings within these categories. The Fund's holdings are subject to change.
Top Ten Holdings and/or Issuers Held as of October 31, 2022 (excluding short-term investments) (Unaudited)
| 1. | Mexico Government Bond, 2.659%-4.75%, due 1/21/26–4/19/71 |
| 2. | Chile Government Bond, 2.55%-4.34%, due 1/27/32–1/22/61 |
| 3. | Abu Dhabi Government Bond, 1.875%-3.875%, due 4/16/25–4/16/50 |
| 4. | Romanian Government Bond, 3.00%-6.00%, due 2/27/27–5/25/34 |
| 5. | Oman Government Bond, 4.875%-7.00%, due 2/1/25–1/25/51 |
| 6. | Colombia Government Bond, 3.125%-6.125%, due 2/26/24–5/15/49 |
| 7. | South Africa Government Bond, 4.30%-7.30%, due 9/16/25–4/20/52 |
| 8. | Qatar Government Bond, 3.40%-4.40%, due 4/16/25–4/16/50 |
| 9. | Dominican Republic Government Bond, 4.875%-5.95%, due 1/27/25–1/30/60 |
| 10. | Hungary Government Bond, 2.125%-3.125%, due 9/22/31–9/21/51 |
| 8 | MainStay Candriam Emerging Markets Debt Fund |
Portfolio Management Discussion and Analysis (Unaudited)
Questions answered by portfolio managers Diliana Deltcheva, CFA, and Christopher Mey, CFA, of Candriam, the Fund’s Subadvisor.
How did MainStay Candriam Emerging Markets Debt Fund perform relative to its benchmark and peer group during the 12 months ended October 31, 2022?
For the 12 months ended October 31, 2022, Class I shares of MainStay Candriam Emerging Markets Debt Fund returned −24.75%, underperforming the −24.19% return of the Fund’s benchmark, the JPMorgan EMBI Global Diversified Index (the "Index"). Over the same period, Class I shares also underperformed the −21.77% return of the Morningstar Emerging Markets Bond Category Average.1
Were there any changes to the Fund during the reporting period?
Effective January 11, 2022, Magda Branet no longer served as a portfolio manager for the Fund. For more information see the prospectus supplement dated January 11, 2022.
What factors affected the Fund’s relative performance during the reporting period?
In the fourth quarter of 2021, emerging-market hard-currency debt optically declined only marginally, as flat Treasury returns, muted spread2 returns and asset class risks progressively rose during the quarter. In November, the discovery of a more contagious Omicron variant of the COVID-19 virus in South Africa accelerated a slight correction in the asset class. The U.S. Federal Reserve (the “Fed”) shifted to an explicitly hawkish stance during the quarter, and market expectations of a rate hike increased significantly. The main detractor from the Fund’s performance relative to the Index during the final two months of 2021 was overweight exposure to idiosyncratic high-yield credits, including Ghana, El Salvador, Ukraine and Venezuela. Underweight positions in rich U.S. Treasury-sensitive emerging-markets investment-grade credits, including Malaysia, Philippines and Qatar—which were supported by the Omicron-driven U.S. Treasury rally towards year end—also detracted from relative performance. The top contributions to the Fund’s relative performance came from underweight positions in distressed and/or nearing default debt of Belarus, Ethiopia and Sri Lanka, as well as overweight positions in Bahamas and Ecuador, which benefited from stabilization of debt sustainability risks. (Contributions take weightings and total returns into account.)
In the first quarter of 2022, emerging-market hard-currency debt posted one of its worst quarters on record as geopolitical risks rose sharply with the Russian invasion of Ukraine on February 24, 2022, adding to already-weak emerging-markets sentiment regarding developed-market monetary policy tightening and
Chinese regulatory activism. Both spread and U.S. Treasury returns rose on higher emerging-markets spreads: spread returns were up 31 basis points (“bps”) and 10-year U.S. Treasury yields were up 83 bps, amid more volatile core rates and emerging-markets risk premiums. (A basis point is one one-hundredth of a percentage point.) The Fund strongly outperformed the Index thanks to underweight positions in Belarus, Kazakhstan and Russia. An outright short 10-year U.S. Treasury futures position also bolstered relative performance, as 10-year U.S. Treasuries sold-off by 83 bps during the quarter. Overweight exposure to energy exporters, including Azerbaijan, Iraq, Nigeria and Venezuela also made positive contributions to relative performance, as oil rallied further following the implementation of Russian sanctions.
Emerging-market hard-currency debt delivered poor returns again in the second quarter of 2022.Tightening global liquidity related to the start of the developed-market central bank hiking cycle, together with surging inflation related to higher commodities prices, China’s “Zero-COVID” policies (which restricted goods supply) and the ongoing war in Ukraine (which pressured energy and agricultural prices) led to a material risky asset market correction. The Fund’s slight underperformance over the quarter (78 bps) was due to underweight exposure to defensive Chinese sovereign and quasi-sovereign debt, which outperformed the Index. Overweight positions in higher beta3 credits, including Egypt, Ghana and Bahrain—which suffered in an environment of tighter global liquidity conditions, high and rising volatility of core rates, and general uncertainties over the global growth outlook—also detracted from returns. However, these negative positions were partially balanced by the positive impact of underweight exposures in Sri Lanka and Kenya. Sri Lanka declared default in May and approached the International Monetary Fund (the “IMF”) for a funding program while Kenya held elections in August and faced rising funding concerns. Overweight exposure in Iraq (an oil exporter with no repayment issues), also contributed to relative performance.
In the third quarter of 2022, elevated U.S. nominal and real rates volatility drove corrections across credit and equity in developed and emerging markets. These corrections were in line with typical asset performance trends at the mature stage of monetary policy normalization and economic contraction. The Fund underperformed the Index by 85 bps over the quarter, due to underweight positions in China and Turkey, as well as overweight positions in Venezuela and Petroleos de Venezuela (PDVSA), the Venezuelan state-owned oil and natural gas company. Security selection in Argentina (with Province of Buenos Aires
| 1. | See page 5 for other share class returns, which may be higher or lower than Class I share returns. See page 6 for more information on benchmark and peer group returns. |
| 2. | The terms “spread” and “yield spread” may refer to the difference in yield between a security or type of security and comparable U.S. Treasury issues. The terms may also refer to the difference in yield between two specific securities or types of securities at a given time. |
| 3. | Beta is a measure of volatility in relation to the market as a whole. A beta higher than 1 indicates that a security or portfolio will tend to exhibit higher volatility than the market. A beta lower than 1 indicates that a security or portfolio will tend to exhibit lower volatility than the market. |
outperforming the sovereign) and underweight exposure in Pakistan contributed positively to relative performance, as did the Fund’s higher average cash position and its underweight exposure to U.S. Treasury duration.4
During the reporting period, how was the Fund’s performance materially affected by investments in derivatives?
The Fund held a short 10-year U.S. Treasury futures position from the beginning of 2022 that posted positive performance over the reporting period. The Fund also initiated a short position in the 5-year, versus a long position in the 30-year segment on rising stagflation risks, which was also rewarded.
What was the Fund’s duration strategy during the reporting period?
In the first quarter of 2022, the Fund's absolute duration (−4 bps to 6.57 years) and relative duration (−37 bps to − 0.91 years) declined marginally; we took some profits on the Fund’s 10-year U.S. Treasury position and installed a short 5-year versus 30-year U.S. Treasury yield curve5 position on the basis of rising stagflation risks. Through the second quarter, the Fund’s absolute duration (-42 bps to 6.15 years) and relative duration (-25 bps to -0.66 years) continued to decline as we persisted in our partial profit-taking on the Fund’s short U.S. Treasury position, when 10-year U.S. Treasuries approached 3.5% in mid-June. The Fund’s duration did not change materially through the end of the reporting period, with absolute duration standing at 5.84 years and relative duration standing at -0.73 years.
How was the Fund affected by shifting currency values during the reporting period?
The Fund was not affected by shifting currency values during the reporting period.
During the reporting period, which countries and/or sectors were the strongest positive contributors to the Fund’s relative performance and which countries and/or sectors were particularly weak?
During the last two months of 2021, the main detractors from the Fund’s performance relative to the Index were overweight positions in idiosyncratic high-yield credits, including Ghana, El Salvador, Ukraine and Venezuela. The Fund’s underweight positions in rich U.S. Treasury-sensitive emerging-market investment-grade credits, including Malaysia, Philippines and Qatar, which were supported by the Omicron-driven Treasury rally towards year end, also detracted from relative returns. The
strongest contributors to relative performance were underweight positions in distressed and/or nearing default Belarus, Ethiopia and Sri Lanka, as well as overweight positions in Bahamas and Ecuador, which benefited from stabilization of debt sustainability risks.
During the first ten months of 2022, the main positive contributors included the Fund’s underweight positions in Russia, Belarus and Kazakhstan. The Fund’s underweight exposure to U.S. Treasuries (short positions, both outright and relative) also enhanced relative returns. The main detractors from relative performance were the Fund’s overweight position in Ukraine and underweight positions in certain investment-grade countries when, despite tight spreads, China and Indonesia continued outperforming asset class peers.
What were some of the Fund’s largest purchases and sales during the reporting period?
In the first quarter of 2022, the Fund reduced risk overall across a number of high-yield credits (Argentina, El Salvador, Nigeria, Pakistan and Zambia) that may have been impacted by a rise in asset class uncertainty. When emerging-market spreads widened to 526 bps in the first week of March, we added high-yield risk back into the Fund through energy exporters and Egypt. We added exposure to energy exporters, including Angola, Bahrain, Ecuador and Oman, on the view that oil prices in the $90-$110 range would strengthen their balance sheets and lead to risk premium compression. In Egypt, we covered the Fund’s underweight position and moved to an overweight stance when the country rounded up sizeable Gulf Cooperation Council financing ($12 billion to date) and moved closer to an IMF funding program, after allowing a currency devaluation in excess of 15%. We moved to complete underweight positions in Pakistan and Turkey on the rise of political uncertainty in the former, and given the adverse impact of higher agricultural and energy prices in both countries.
During the second quarter, we continued to reduce the Fund’s risk on the margin and selectively participated in primary market deals. The early-quarter recovery lasted until April 5, 2022, with emerging-market spreads widening by an impressive 155 bps between the low on April 5, 2022, (387 bps) and June 30, 2022. The reductions included vulnerable and higher-beta high-yield credits, including Angola, Bahrain, Colombia, Ecuador, Ghana, Nigeria, Pakistan and Tunisia. In May, we also reduced the Fund’s exposure to longer-dated investment-grade credits in Indonesia, Peru, Romania and UAE that had outperformed their respective 10-year counterparts. Additionally, we exited the Fund’s 30-year, long U.S. Treasury futures position, retaining only the 5-year short U.S. Treasury futures position, as the long end of the U.S. Treasury curve flattened to prior cycle lows.
| 4. | Duration is a measure of the price sensitivity of a fixed-income investment to changes in interest rates. Duration is expressed as a number of years and is considered a more accurate sensitivity gauge than average maturity. |
| 5. | The yield curve is a line that plots the yields of various securities of similar quality—typically U.S. Treasury issues—across a range of maturities. The U.S. Treasury yield curve serves as a benchmark for other debt and is used in economic forecasting. |
| 10 | MainStay Candriam Emerging Markets Debt Fund |
In the third quarter of 2022, we continued reducing risk on the margin and selectively participated in primary market deals. Volatility during the third quarter rose materially, with emerging-market spreads rising to 592 bps by mid-July, before recovering 120 bps by mid-August and widening to 559 bps by the end of September 2022, in line with nominal and real U.S. Treasury yields. The reductions spanned BB-rated6 (Azerbaijan, Brazil, Dominican Republic and Serbia) to higher-beta high-yield credits (Bahamas, Ghana, Egypt, Iraq, Nigeria, Oman and Pakistan). We added to the Fund’s Ukraine exposure as Eurobonds traded down to 20 bps after the two-year debt service extension agreed in August. We also increased exposure to Colombia in anticipation of some political risk premium repricing after the presidential election cycle was resolved in mid-June.
How did the Fund’s country and/or sector weightings change during the reporting period?
Early in the reporting period, the buildup of Russian troops around the Russian-Ukraine border intensified. Following failed negotiations between Russia and Ukraine in January 2022 we decided to reduce the Fund’s exposure to Russian short-dated corporates in anticipation of an acceleration of the conflict. We reduced the Fund’s Russian corporate exposure from neutral (approximately 3.1%) to an underweight position of 2.5%, retaining a 0.5% position in Russian fertilizer producer PhosAgro. Once the full Russian invasion of Ukraine started on February 24, 2022, we divested the residual PhosAgro position.
In January 2022, mass protests erupted in Kazakhstan in response to a sudden and sharp increase in gas prices when the government removed a price cap. Eventually the protests turned violent as President Tokayev declared a state of emergency and ordered the use of force, resulting in 160+ civilian deaths. Given the sharp rise of political uncertainty, we fully divested the Fund of any Kazakh sovereign holdings (1% of the Fund), resulting in a full underweight position in Kazakhstan, compared to the Index weighting of 2.5%.
After taking profits in the tactical additions to high-yield-rated energy exporters that the Fund traded between March and April 2022, in May 2022 we covered the Fund’s underweight positions in cheap investment-grade-rated credits, bringing the Fund’s overall investment-grade exposure closer to Index. The additions included Abu Dhabi (1.5%), Chile (1.5%), Hungary (0.5%) and Mexico (1.5%).
In August 2022, we added to the Fund’s Colombia position (+2%), as we expected a decline in political risk premiums following the presidential elections of May 29, 2022, and a run-off on June 19, 2022, were cleared. Colombia screened as the most attractive BB-rated credit globally. We funded the addition to the Fund’s Colombia exposure with reductions in Brazil and the Dominican Republic, and with similarly rated Latin American credits trading well inside Colombia.
How was the Fund positioned at the end of the reporting period?
As of October 31, 2022, the Fund maintains a negative stance on U.S. Treasury-sensitive investment-grade-rated proxies concentrated in Asia (Malaysia, Philippines), the Gulf Cooperation Council (Qatar), and Latin America (Panama, Peru, Uruguay) on the view that investment-grade-rated issuers offer only limited spread cushion versus extended core rate rises. At the same time, we acknowledge that during the current contractionary stage of the business cycle, investment grade is likely to outperform high yield. In response, the Fund retains exposure to select investment-grade-rated credits with attractive valuations, including Chile, Hungary, Mexico, Poland and Romania.
Outside of the oil exporter and investment-grade space, the Fund continues to hold overweight exposure to attractively valued and fundamentally supported emerging market credits across BB-rated and high-yield credits in Africa (Ivory Coast) and Europe (Ukraine). The Fund also continues to hold specific idiosyncratic credits with near-term performance catalysts and distressed valuations, including Argentina, Bahamas, Egypt and Tunisia. We prefer to retain the Fund’s underweight positions in distressed Sri Lanka (where restructuring may deliver recovery values in the low-to-mid-30s) and Pakistan (where floods increased risks for debt renegotiation). The Fund does not hold any Turkish exposure; this reflects our assessment that the government’s policies of foreign exchange (FX) deposit guarantees, targeted at preventing a bank run and deeper currency devaluation are unsustainable, given the country’s deeply negative net FX reserves position, and its excessive sensitivity to higher energy and wheat prices. The Fund does not have any exposure to Belarus, Kazakhstan, Russia, Uzbekistan or Tajikistan on the basis of elevated governance, default and sanctions risks that are not sufficiently compensated by valuations.
| 6. | An obligation rated ‘BB’ by Standard & Poor’s (“S&P”) is deemed by S&P to be less vulnerable to nonpayment than other speculative issues. In the opinion of S&P, however, the obligor faces major ongoing uncertainties or exposure to adverse business, financial or economic conditions which could lead to the obligor’s inadequate capacity to meet its financial commitment on the obligation. When applied to Fund holdings, ratings are based solely on the creditworthiness of the bonds in the portfolio and are not meant to represent the security or safety of the Fund. |
The opinions expressed are those of the portfolio managers as of the date of this report and are subject to change. There is no guarantee that any forecasts will come to pass. This material does not constitute investment advice and is not intended as an endorsement of any specific investment.
Portfolio of Investments October 31, 2022†
| | Principal
Amount | Value |
| Long-Term Bonds 89.9% |
| Corporate Bonds 9.1% |
| Brazil 2.4% |
| Arcos Dorados BV | | |
| Series Reg S | | |
| 6.125%, due 5/27/29 | $ 500,000 | $ 460,000 |
| Braskem Netherlands Finance BV | | |
| Series Reg S | | |
| 4.50%, due 1/31/30 | 800,000 | 649,136 |
| Rumo Luxembourg SARL | | |
| Series Reg S | | |
| 4.20%, due 1/18/32 | 500,000 | 378,750 |
| | | 1,487,886 |
| Georgia 0.7% |
| Georgian Railway JSC | | |
| Series Reg S | | |
| 4.00%, due 6/17/28 | 600,000 | 451,548 |
| Mexico 2.2% |
| Alpek SAB de CV | | |
| Series Reg S | | |
| 3.25%, due 2/25/31 (a) | 750,000 | 573,560 |
| Cemex SAB de CV | | |
| Series Reg S | | |
| 3.875%, due 7/11/31 (a) | 500,000 | 380,582 |
| Orbia Advance Corp. SAB de CV | | |
| Series Reg S | | |
| 5.875%, due 9/17/44 | 500,000 | 384,895 |
| | | 1,339,037 |
| Saudi Arabia 2.6% |
| Gaci First Investment Co. | | |
| Series Reg S | | |
| 5.25%, due 10/13/32 | 1,300,000 | 1,269,125 |
| SA Global Sukuk Ltd. | | |
| Series Reg S | | |
| 1.602%, due 6/17/26 | 400,000 | 349,916 |
| | | 1,619,041 |
| United Arab Emirates 1.1% |
| Galaxy Pipeline Assets Bidco Ltd. | | |
| Series Reg S | | |
| 2.625%, due 3/31/36 | 650,000 | 493,660 |
| MDGH GMTN RSC Ltd. | | |
| Series Reg S | | |
| 5.50%, due 4/28/33 | 200,000 | 198,656 |
| | | 692,316 |
| | Principal
Amount | Value |
| |
| Venezuela 0.1% |
| Petroleos de Venezuela SA | | |
| 5.375%, due 4/12/27 (b)(c)(d) | $ 3,000,000 | $ 60,000 |
Total Corporate Bonds
(Cost $7,386,501) | | 5,649,828 |
| Foreign Government Bonds 80.8% |
| Angola 1.8% |
| Angola Government Bond | | |
| Series Reg S | | |
| 8.00%, due 11/26/29 | 400,000 | 324,680 |
| Series Reg S | | |
| 8.75%, due 4/14/32 | 500,000 | 402,750 |
| Series Reg S | | |
| 9.375%, due 5/8/48 | 500,000 | 379,400 |
| | | 1,106,830 |
| Argentina 1.4% |
| Buenos Aires Government Bond | | |
| Series Reg S | | |
| 5.25%, due 9/1/37 (e) | 2,887,805 | 869,652 |
| Azerbaijan 2.0% |
| Southern Gas Corridor CJSC | | |
| Series Reg S | | |
| 6.875%, due 3/24/26 | 700,000 | 687,764 |
| State Oil Co. of the Azerbaijan Republic | | |
| Series Reg S | | |
| 6.95%, due 3/18/30 | 550,000 | 534,094 |
| | | 1,221,858 |
| Bahamas 0.4% |
| Bahamas Government Bond | | |
| Series Reg S | | |
| 6.00%, due 11/21/28 | 400,000 | 252,545 |
| Bahrain 1.7% |
| Bahrain Government Bond | | |
| Series Reg S | | |
| 5.625%, due 5/18/34 | 500,000 | 391,290 |
| Series Reg S | | |
| 6.25%, due 1/25/51 | 300,000 | 210,991 |
| Series Reg S | | |
| 6.75%, due 9/20/29 | 500,000 | 469,170 |
| | | 1,071,451 |
The notes to the financial statements are an integral part of, and should be read in conjunction with, the financial statements.
| 12 | MainStay Candriam Emerging Markets Debt Fund |
| | Principal
Amount | Value |
| Foreign Government Bonds (continued) |
| Brazil 0.9% |
| Brazil Government Bond | | |
| 8.75%, due 2/4/25 | $ 500,000 | $ 533,153 |
| Chile 4.8% |
| Chile Government Bond | | |
| 2.55%, due 1/27/32 (a) | 1,200,000 | 940,047 |
| 2.55%, due 7/27/33 | 1,000,000 | 743,578 |
| 3.10%, due 1/22/61 (a) | 300,000 | 167,723 |
| 3.50%, due 1/31/34 | 400,000 | 322,622 |
| 3.50%, due 4/15/53 (a) | 550,000 | 355,939 |
| 4.34%, due 3/7/42 | 561,000 | 431,414 |
| | | 2,961,323 |
| Colombia 4.4% |
| Colombia Government Bond | | |
| 3.125%, due 4/15/31 | 300,000 | 204,864 |
| 3.25%, due 4/22/32 | 300,000 | 199,096 |
| 4.00%, due 2/26/24 | 800,000 | 766,260 |
| 5.00%, due 6/15/45 | 300,000 | 181,680 |
| 5.20%, due 5/15/49 | 300,000 | 181,888 |
| 6.125%, due 1/18/41 | 500,000 | 355,494 |
| Ecopetrol SA | | |
| 4.625%, due 11/2/31 | 1,200,000 | 826,995 |
| | | 2,716,277 |
| Cote D'Ivoire 0.6% |
| Ivory Coast Government Bond | | |
| Series Reg S | | |
| 5.75%, due 12/31/32 (e) | 125,389 | 110,601 |
| Series Reg S | | |
| 6.125%, due 6/15/33 (a) | 300,000 | 234,000 |
| | | 344,601 |
| Croatia 2.4% |
| Croatia Government Bond | | |
| Series Reg S | | |
| 5.50%, due 4/4/23 | 1,000,000 | 1,000,084 |
| Series Reg S | | |
| 6.00%, due 1/26/24 | 500,000 | 503,301 |
| | | 1,503,385 |
| Dominican Republic 2.9% |
| Dominican Republic Government Bond | | |
| Series Reg S | | |
| 4.875%, due 9/23/32 | 300,000 | 231,152 |
| Series Reg S | | |
| 5.50%, due 1/27/25 | 500,000 | 488,695 |
| | Principal
Amount | Value |
| |
| Dominican Republic (continued) |
Dominican Republic Government Bond
(continued) | | |
| Series Reg S | | |
| 5.50%, due 2/22/29 | $ 300,000 | $ 261,940 |
| Series Reg S | | |
| 5.875%, due 1/30/60 | 500,000 | 328,379 |
| Series Reg S | | |
| 5.95%, due 1/25/27 | 500,000 | 466,998 |
| | | 1,777,164 |
| Ecuador 1.4% |
| Ecuador Government Bond | | |
| Series Reg S | | |
| (zero coupon), due 7/31/30 | 208,496 | 64,807 |
| Series Reg S | | |
| 1.50%, due 7/31/40 (e) | 1,200,000 | 396,207 |
| Series Reg S | | |
| 2.50%, due 7/31/35 (e) | 1,200,000 | 438,595 |
| | | 899,609 |
| Egypt 2.2% |
| Egypt Government Bond | | |
| Series Reg S | | |
| 5.875%, due 2/16/31 | 500,000 | 307,500 |
| Series Reg S | | |
| 6.875%, due 4/30/40 | 300,000 | 172,320 |
| Series Reg S | | |
| 7.30%, due 9/30/33 | 500,000 | 311,876 |
| Series Reg S | | |
| 7.50%, due 2/16/61 | 600,000 | 333,900 |
| Series Reg S | | |
| 8.70%, due 3/1/49 | 400,000 | 238,000 |
| | | 1,363,596 |
| El Salvador 1.0% |
| El Salvador Government Bond | | |
| Series Reg S | | |
| 7.625%, due 2/1/41 | 900,000 | 308,638 |
| Series Reg S | | |
| 8.25%, due 4/10/32 | 500,000 | 198,709 |
| Series Reg S | | |
| 9.50%, due 7/15/52 | 263,000 | 98,636 |
| | | 605,983 |
| Gabon 0.9% |
| Gabon Government Bond | | |
| Series Reg S | | |
| 6.95%, due 6/16/25 | 350,000 | 315,301 |
The notes to the financial statements are an integral part of, and should be read in conjunction with, the financial statements.
13
Portfolio of Investments October 31, 2022† (continued)
| | Principal
Amount | Value |
| Foreign Government Bonds (continued) |
| Gabon (continued) |
| Gabon Government Bond (continued) | | |
| Series Reg S | | |
| 7.00%, due 11/24/31 | $ 350,000 | $ 243,442 |
| | | 558,743 |
| Ghana 0.7% |
| Ghana Government Bond | | |
| Series Reg S | | |
| 7.75%, due 4/7/29 (a) | 800,000 | 230,360 |
| Series Reg S | | |
| 7.875%, due 2/11/35 | 500,000 | 140,040 |
| Series Reg S | | |
| 8.627%, due 6/16/49 | 300,000 | 82,080 |
| | | 452,480 |
| Hungary 2.5% |
| Hungary Government Bond | | |
| Series Reg S | | |
| 2.125%, due 9/22/31 | 1,600,000 | 1,143,974 |
| Series Reg S | | |
| 3.125%, due 9/21/51 | 800,000 | 437,565 |
| | | 1,581,539 |
| India 0.6% |
| Export-Import Bank of India | | |
| Series Reg S | | |
| 2.25%, due 1/13/31 | 500,000 | 366,375 |
| Indonesia 4.7% |
| Indonesia Government Bond | | |
| 3.55%, due 3/31/32 (a) | 700,000 | 597,272 |
| 5.45%, due 9/20/52 | 500,000 | 450,000 |
| Pertamina Persero PT | | |
| Series Reg S | | |
| 4.15%, due 2/25/60 | 500,000 | 308,749 |
| 5.625%, due 5/20/43 (a)(f) | 500,000 | 412,500 |
| Series Reg S | | |
| 6.00%, due 5/3/42 | 400,000 | 340,818 |
| Perusahaan Penerbit SBSN Indonesia III | | |
| Series Reg S | | |
| 3.55%, due 6/9/51 | 700,000 | 472,573 |
| Series Reg S | | |
| 4.70%, due 6/6/32 (a) | 350,000 | 327,016 |
| | | 2,908,928 |
| | Principal
Amount | Value |
| |
| Iraq 0.8% |
| Iraq Government Bond | | |
| Series Reg S | | |
| 5.80%, due 1/15/28 | $ 206,250 | $ 175,216 |
| Series Reg S | | |
| 6.752%, due 3/9/23 | 300,000 | 294,750 |
| | | 469,966 |
| Lebanon 0.2% |
| Lebanon Government Bond (b)(c)(d) | | |
| Series Reg S | | |
| 6.65%, due 4/22/24 | 1,200,000 | 70,874 |
| Series Reg S | | |
| 6.85%, due 3/23/27 | 1,000,000 | 59,000 |
| | | 129,874 |
| Mexico 6.4% |
| Comision Federal de Electricidad | | |
| Series Reg S | | |
| 3.875%, due 7/26/33 | 500,000 | 356,250 |
| Series Reg S | | |
| 4.677%, due 2/9/51 | 700,000 | 426,773 |
| Mexico Government Bond | | |
| 2.659%, due 5/24/31 | 500,000 | 387,071 |
| 3.50%, due 2/12/34 | 500,000 | 381,477 |
| 3.75%, due 4/19/71 | 1,000,000 | 578,304 |
| 3.771%, due 5/24/61 | 800,000 | 464,309 |
| 4.125%, due 1/21/26 | 1,000,000 | 962,534 |
| 4.75%, due 4/27/32 (a) | 500,000 | 452,306 |
| | | 4,009,024 |
| Mozambique 0.6% |
| Mozambique Government Bond | | |
| Series Reg S | | |
| 5.00%, due 9/15/31 (e) | 550,000 | 370,563 |
| Nigeria 1.6% |
| Nigeria Government Bond | | |
| Series Reg S | | |
| 7.625%, due 11/21/25 | 500,000 | 429,502 |
| Series Reg S | | |
| 7.625%, due 11/28/47 | 300,000 | 169,800 |
| Series Reg S | | |
| 7.875%, due 2/16/32 | 600,000 | 385,500 |
| Series Reg S | | |
| 8.375%, due 3/24/29 | 27,000 | 19,507 |
| | | 1,004,309 |
The notes to the financial statements are an integral part of, and should be read in conjunction with, the financial statements.
| 14 | MainStay Candriam Emerging Markets Debt Fund |
| | Principal
Amount | Value |
| Foreign Government Bonds (continued) |
| Oman 3.2% |
| Oman Government Bond | | |
| Series Reg S | | |
| 4.875%, due 2/1/25 | $ 1,000,000 | $ 971,490 |
| Series Reg S | | |
| 5.625%, due 1/17/28 | 500,000 | 476,305 |
| Series Reg S | | |
| 7.00%, due 1/25/51 | 600,000 | 511,169 |
| | | 1,958,964 |
| Pakistan 0.1% |
| Pakistan Government Bond | | |
| Series Reg S | | |
| 7.375%, due 4/8/31 | 300,000 | 93,000 |
| Panama 1.3% |
| Aeropuerto Internacional de Tocumen SA | | |
| Series Reg S | | |
| 5.125%, due 8/11/61 | 727,000 | 491,731 |
| Panama Government Bond | | |
| 3.87%, due 7/23/60 | 500,000 | 289,283 |
| | | 781,014 |
| Paraguay 1.3% |
| Paraguay Government Bond | | |
| Series Reg S | | |
| 2.739%, due 1/29/33 | 495,000 | 368,424 |
| Series Reg S | | |
| 5.40%, due 3/30/50 | 600,000 | 460,031 |
| | | 828,455 |
| Peru 0.9% |
| Peruvian Government Bond | | |
| 2.783%, due 1/23/31 (a) | 700,000 | 552,048 |
| Philippines 1.7% |
| Philippine Government Bond | | |
| 3.229%, due 3/29/27 | 300,000 | 276,346 |
| 4.20%, due 3/29/47 | 500,000 | 388,364 |
| 5.609%, due 4/13/33 (a) | 381,000 | 381,061 |
| | | 1,045,771 |
| Poland 0.6% |
| Poland Government Bond | | |
| 3.25%, due 4/6/26 | 200,000 | 187,488 |
| 4.00%, due 1/22/24 | 200,000 | 196,866 |
| | | 384,354 |
| | Principal
Amount | Value |
| |
| Qatar 2.9% |
| Qatar Government Bond | | |
| Series Reg S | | |
| 3.40%, due 4/16/25 | $ 1,000,000 | $ 964,178 |
| Series Reg S | | |
| 4.40%, due 4/16/50 | 1,000,000 | 840,000 |
| | | 1,804,178 |
| Republic Of Serbia 0.2% |
| Serbia Government Bond | | |
| Series Reg S | | |
| 2.125%, due 12/1/30 | 200,000 | 138,238 |
| Republic of the Congo 1.0% |
| Congo Government Bond | | |
| Series Reg S | | |
| 6.00%, due 6/30/29 (e) | 712,500 | 600,637 |
| Romania 4.5% |
| Romanian Government Bond | | |
| Series Reg S | | |
| 3.00%, due 2/27/27 | 900,000 | 771,206 |
| Series Reg S | | |
| 3.00%, due 2/14/31 | 300,000 | 221,592 |
| Series Reg S | | |
| 5.25%, due 11/25/27 | 1,200,000 | 1,100,679 |
| Series Reg S | | |
| 6.00%, due 5/25/34 | 800,000 | 674,112 |
| | | 2,767,589 |
| Saudi Arabia 2.8% |
| Saudi Arabian Oil Co. | | |
| Series Reg S | | |
| 2.25%, due 11/24/30 | 800,000 | 630,907 |
| Series Reg S | | |
| 3.25%, due 11/24/50 | 300,000 | 188,095 |
| Saudi Government Bond | | |
| Series Reg S | | |
| 5.50%, due 10/25/32 | 900,000 | 911,250 |
| | | 1,730,252 |
| Senegal 0.3% |
| Senegal Government Bond | | |
| Series Reg S | | |
| 6.75%, due 3/13/48 | 250,000 | 158,625 |
| South Africa 3.0% |
| South Africa Government Bond | | |
| 4.30%, due 10/12/28 | 500,000 | 426,430 |
The notes to the financial statements are an integral part of, and should be read in conjunction with, the financial statements.
15
Portfolio of Investments October 31, 2022† (continued)
| | Principal
Amount | Value |
| Foreign Government Bonds (continued) |
| South Africa (continued) |
| South Africa Government Bond (continued) | | |
| 5.75%, due 9/30/49 | $ 200,000 | $ 132,660 |
| 5.875%, due 9/16/25 | 400,000 | 395,562 |
| 5.875%, due 4/20/32 | 400,000 | 341,728 |
| 6.25%, due 3/8/41 | 300,000 | 228,000 |
| 7.30%, due 4/20/52 | 450,000 | 352,125 |
| | | 1,876,505 |
| Sri Lanka 0.3% |
| Sri Lanka Government Bond | | |
| Series Reg S | | |
| 6.825%, due 7/18/26 (b)(d) | 850,000 | 191,300 |
| Tunisia 0.8% |
| Tunisian Republic | | |
| Series Reg S | | |
| 5.625%, due 2/17/24 | EUR 200,000 | 145,253 |
| Series Reg S | | |
| 5.75%, due 1/30/25 | $ 600,000 | 375,754 |
| | | 521,007 |
| Ukraine 1.3% |
| NPC Ukrenergo | | |
| Series Reg S | | |
| 6.875%, due 11/9/28 (b)(c)(d) | 1,150,000 | 165,647 |
| State Agency of Roads of Ukraine | | |
| Series Reg S | | |
| 6.25%, due 6/24/30 (b)(c)(d) | 2,227,000 | 311,833 |
| Ukraine Government Bond (b)(c)(d) | | |
| Series Reg S | | |
| 7.253%, due 3/15/35 | 1,300,000 | 198,838 |
| Series Reg S | | |
| 7.375%, due 9/25/34 | 1,000,000 | 155,000 |
| | | 831,318 |
| United Arab Emirates 5.2% |
| Abu Dhabi Government Bond | | |
| Series Reg S | | |
| 1.875%, due 9/15/31 | 600,000 | 472,904 |
| Series Reg S | | |
| 2.50%, due 4/16/25 | 1,000,000 | 951,250 |
| Series Reg S | | |
| 3.125%, due 4/16/30 | 600,000 | 537,684 |
| Series Reg S | | |
| 3.125%, due 9/30/49 | 600,000 | 403,524 |
| Series Reg S | | |
| 3.875%, due 4/16/50 | 600,000 | 464,184 |
| | Principal
Amount | Value |
| |
| United Arab Emirates (continued) |
| Finance Department Government of Sharjah | | |
| Series Reg S | | |
| 4.00%, due 7/28/50 | $ 400,000 | $ 230,680 |
| United Arab Emirates Government Bond | | |
| Series Reg S | | |
| 3.90%, due 9/9/50 | 250,000 | 162,743 |
| | | 3,222,969 |
| Uruguay 1.5% |
| Uruguay Government Bond | | |
| 4.975%, due 4/20/55 | 400,000 | 346,586 |
| 5.75%, due 10/28/34 | 600,000 | 610,830 |
| | | 957,416 |
| Venezuela 0.6% |
| Petroleos de Venezuela SA (b)(c)(d) | | |
| Series Reg S | | |
| 6.00%, due 5/16/24 | 2,500,000 | 56,250 |
| Series Reg S | | |
| 6.00%, due 11/15/26 (g) | 2,500,000 | 47,500 |
| Venezuela Government Bond | | |
| Series Reg S | | |
| 9.25%, due 5/7/28 (b)(c)(d) | 4,095,000 | 276,412 |
| | | 380,162 |
| Zambia 0.4% |
| Zambia Government Bond | | |
| Series Reg S | | |
| 8.97%, due 7/30/27 (b)(d) | 700,000 | 275,590 |
Total Foreign Government Bonds
(Cost $71,228,249) | | 50,178,620 |
Total Long-Term Bonds
(Cost $78,614,750) | | 55,828,448 |
| |
The notes to the financial statements are an integral part of, and should be read in conjunction with, the financial statements.
| 16 | MainStay Candriam Emerging Markets Debt Fund |
| | Shares | | Value |
| Short-Term Investment 7.1% |
| Unaffiliated Investment Company 7.1% |
| United States 7.1% |
| Invesco Government & Agency Portfolio, 3.163% (h)(i) | 4,430,155 | | $ 4,430,155 |
Total Short-Term Investment
(Cost $4,430,155) | | | 4,430,155 |
Total Investments
(Cost $83,044,905) | 97.0% | | 60,258,603 |
| Other Assets, Less Liabilities | 3.0 | | 1,885,773 |
| Net Assets | 100.0% | | $ 62,144,376 |
| † | Percentages indicated are based on Fund net assets. |
| (a) | All or a portion of this security was held on loan. As of October 31, 2022, the aggregate market value of securities on loan was $4,598,470; the total market value of collateral held by the Fund was $4,824,475. The market value of the collateral held included non-cash collateral in the form of U.S. Treasury securities with a value of $394,320. The Fund received cash collateral with a value of $4,430,155. (See Note 2(J)) |
| (b) | Issue in default. |
| (c) | Illiquid security—As of October 31, 2022, the total market value deemed illiquid under procedures approved by the Board of Trustees was $1,401,354, which represented 2.3% of the Fund’s net assets.(Unaudited) |
| (d) | Issue in non-accrual status. |
| (e) | Step coupon—Rate shown was the rate in effect as of October 31, 2022. |
| (f) | May be sold to institutional investors only under Rule 144A or securities offered pursuant to Section 4(a)(2) of the Securities Act of 1933, as amended. |
| (g) | Coupon rate may change based on changes of the underlying collateral or prepayments of principal. Rate shown was the rate in effect as of October 31, 2022. |
| (h) | Current yield as of October 31, 2022. |
| (i) | Represents a security purchased with cash collateral received for securities on loan. |
Futures Contracts
As of October 31, 2022, the Fund held the following futures contracts1:
| Type | Number of
Contracts | Expiration
Date | Value at
Trade Date | Current
Notional
Amount | Unrealized
Appreciation
(Depreciation)2 |
| Long Contracts | | | | | |
| U.S. Treasury Ultra Bonds | 10 | December 2022 | $ 1,275,339 | $ 1,276,563 | $ 1,224 |
| 1. | As of October 31, 2022, cash in the amount of $1,932,182 was on deposit with a broker or futures commission merchant for futures transactions. |
| 2. | Represents the difference between the value of the contracts at the time they were opened and the value as of October 31, 2022. |
The notes to the financial statements are an integral part of, and should be read in conjunction with, the financial statements.
17
Portfolio of Investments October 31, 2022† (continued)
The following is a summary of the fair valuations according to the inputs used as of October 31, 2022, for valuing the Fund’s assets:
| Description | Quoted
Prices in
Active
Markets for
Identical
Assets
(Level 1) | | Significant
Other
Observable
Inputs
(Level 2) | | Significant
Unobservable
Inputs
(Level 3) | | Total |
| Asset Valuation Inputs | | | | | | | |
| Investments in Securities (a) | | | | | | | |
| Long-Term Bonds | | | | | | | |
| Corporate Bonds | $ — | | $ 5,649,828 | | $ — | | $ 5,649,828 |
| Foreign Government Bonds | — | | 50,178,620 | | — | | 50,178,620 |
| Total Long-Term Bonds | — | | 55,828,448 | | — | | 55,828,448 |
| Short-Term Investment | | | | | | | |
| Unaffiliated Investment Company | 4,430,155 | | — | | — | | 4,430,155 |
| Total Investments in Securities | 4,430,155 | | 55,828,448 | | — | | 60,258,603 |
| Other Financial Instruments | | | | | | | |
| Futures Contracts (b) | 1,224 | | — | | — | | 1,224 |
| Total Investments in Securities and Other Financial Instruments | $ 4,431,379 | | $ 55,828,448 | | $ — | | $ 60,259,827 |
| (a) | For a complete listing of investments and their industries, see the Portfolio of Investments. |
| (b) | The value listed for these securities reflects unrealized appreciation (depreciation) as shown on the Portfolio of Investments. |
The notes to the financial statements are an integral part of, and should be read in conjunction with, the financial statements.
| 18 | MainStay Candriam Emerging Markets Debt Fund |
Statement of Assets and Liabilities as of October 31, 2022
| Assets |
Investment in securities, at value
(identified cost $83,044,905) including securities on loan of $4,598,470 | $ 60,258,603 |
| Cash | 3,453,785 |
Cash denominated in foreign currencies
(identified cost $40,683) | 40,779 |
| Cash collateral on deposit at broker for futures contracts | 1,932,182 |
| Due from custodian | 807,076 |
| Receivables: | |
| Interest | 763,851 |
| Investment securities sold | 266,445 |
| Variation margin on futures contracts | 71,500 |
| Fund shares sold | 6,513 |
| Securities lending | 3,532 |
| Other assets | 62,129 |
| Total assets | 67,666,395 |
| Liabilities |
| Cash collateral received for securities on loan | 4,430,155 |
| Payables: | |
| Investment securities purchased | 807,076 |
| Fund shares redeemed | 151,333 |
| Transfer agent (See Note 3) | 30,472 |
| Shareholder communication | 22,105 |
| Manager (See Note 3) | 20,753 |
| NYLIFE Distributors (See Note 3) | 13,803 |
| Custodian | 11,624 |
| Professional fees | 11,183 |
| Trustees | 47 |
| Accrued expenses | 9,849 |
| Distributions payable | 13,619 |
| Total liabilities | 5,522,019 |
| Net assets | $ 62,144,376 |
| Composition of Net Assets |
| Shares of beneficial interest outstanding (par value of $.01 per share) unlimited number of shares authorized | $ 90,231 |
| Additional paid-in-capital | 113,441,531 |
| | 113,531,762 |
| Total distributable earnings (loss) | (51,387,386) |
| Net assets | $ 62,144,376 |
| Class A | |
| Net assets applicable to outstanding shares | $48,053,369 |
| Shares of beneficial interest outstanding | 6,984,655 |
| Net asset value per share outstanding | $ 6.88 |
| Maximum sales charge (4.50% of offering price) | 0.32 |
| Maximum offering price per share outstanding | $ 7.20 |
| Investor Class | |
| Net assets applicable to outstanding shares | $ 8,669,750 |
| Shares of beneficial interest outstanding | 1,245,686 |
| Net asset value per share outstanding | $ 6.96 |
| Maximum sales charge (4.00% of offering price) | 0.29 |
| Maximum offering price per share outstanding | $ 7.25 |
| Class B | |
| Net assets applicable to outstanding shares | $ 426,208 |
| Shares of beneficial interest outstanding | 63,383 |
| Net asset value and offering price per share outstanding | $ 6.72 |
| Class C | |
| Net assets applicable to outstanding shares | $ 1,358,322 |
| Shares of beneficial interest outstanding | 201,655 |
| Net asset value and offering price per share outstanding | $ 6.74 |
| Class I | |
| Net assets applicable to outstanding shares | $ 3,636,727 |
| Shares of beneficial interest outstanding | 527,734 |
| Net asset value and offering price per share outstanding | $ 6.89 |
The notes to the financial statements are an integral part of, and should be read in conjunction with, the financial statements.
19
Statement of Operations for the year ended October 31, 2022
| Investment Income (Loss) |
| Income | |
| Interest | $ 4,635,467 |
| Securities lending, net | 21,100 |
| Total income | 4,656,567 |
| Expenses | |
| Manager (See Note 3) | 573,341 |
| Distribution/Service—Class A (See Note 3) | 160,576 |
| Distribution/Service—Investor Class (See Note 3) | 26,582 |
| Distribution/Service—Class B (See Note 3) | 7,990 |
| Distribution/Service—Class C (See Note 3) | 22,716 |
| Transfer agent (See Note 3) | 172,527 |
| Professional fees | 83,134 |
| Registration | 75,730 |
| Custodian | 47,445 |
| Shareholder communication | 7,305 |
| Trustees | 1,508 |
| Miscellaneous | 8,755 |
| Total expenses before waiver/reimbursement | 1,187,609 |
| Expense waiver/reimbursement from Manager (See Note 3) | (178,325) |
| Net expenses | 1,009,284 |
| Net investment income (loss) | 3,647,283 |
| Realized and Unrealized Gain (Loss) |
| Net realized gain (loss) on: | |
| Unaffiliated investment transactions | (14,035,936) |
| Futures transactions | 831,068 |
| Foreign currency transactions | (368,963) |
| Foreign currency forward transactions | 418,843 |
| Net realized gain (loss) | (13,154,988) |
| Net change in unrealized appreciation (depreciation) on: | |
| Unaffiliated investments | (13,431,533) |
| Futures contracts | (324,760) |
| Foreign currency forward contracts | (134,512) |
| Translation of other assets and liabilities in foreign currencies | (4,565) |
| Net change in unrealized appreciation (depreciation) | (13,895,370) |
| Net realized and unrealized gain (loss) | (27,050,358) |
| Net increase (decrease) in net assets resulting from operations | $(23,403,075) |
The notes to the financial statements are an integral part of, and should be read in conjunction with, the financial statements.
| 20 | MainStay Candriam Emerging Markets Debt Fund |
Statements of Changes in Net Assets
for the years ended October 31, 2022 and October 31, 2021
| | 2022 | 2021 |
| Increase (Decrease) in Net Assets |
| Operations: | | |
| Net investment income (loss) | $ 3,647,283 | $ 3,880,608 |
| Net realized gain (loss) | (13,154,988) | 262,191 |
| Net change in unrealized appreciation (depreciation) | (13,895,370) | 336,603 |
| Net increase (decrease) in net assets resulting from operations | (23,403,075) | 4,479,402 |
| Distributions to shareholders: | | |
| Class A | (3,612,534) | (4,028,577) |
| Investor Class | (549,300) | (598,582) |
| Class B | (37,561) | (56,287) |
| Class C | (107,128) | (199,315) |
| Class I | (237,169) | (337,673) |
| | (4,543,692) | (5,220,434) |
| Distributions to shareholders from return of capital: | | |
| Class A | (277,063) | — |
| Investor Class | (42,129) | — |
| Class B | (2,881) | — |
| Class C | (8,216) | — |
| Class I | (18,190) | — |
| | (348,479) | — |
| Total distributions to shareholders | (4,892,171) | (5,220,434) |
| Capital share transactions: | | |
| Net proceeds from sales of shares | 12,957,410 | 10,338,246 |
| Net asset value of shares issued to shareholders in reinvestment of distributions | 4,663,688 | 4,945,465 |
| Cost of shares redeemed | (31,448,175) | (21,792,166) |
| Increase (decrease) in net assets derived from capital share transactions | (13,827,077) | (6,508,455) |
| Net increase (decrease) in net assets | (42,122,323) | (7,249,487) |
| Net Assets |
| Beginning of year | 104,266,699 | 111,516,186 |
| End of year | $ 62,144,376 | $104,266,699 |
The notes to the financial statements are an integral part of, and should be read in conjunction with, the financial statements.
21
Financial Highlights selected per share data and ratios
| | Year Ended October 31, |
| Class A | 2022 | | 2021 | | 2020 | | 2019 | | 2018 |
| Net asset value at beginning of year | $ 9.73 | | $ 9.81 | | $ 10.46 | | $ 9.71 | | $ 10.88 |
| Net investment income (loss) (a) | 0.38 | | 0.36 | | 0.47 | | 0.49 | | 0.45 |
| Net realized and unrealized gain (loss) | (2.73) | | 0.04 | | (0.67) | | 0.76 | | (1.19) |
| Total from investment operations | (2.35) | | 0.40 | | (0.20) | | 1.25 | | (0.74) |
| Less distributions: | | | | | | | | | |
| From net investment income | (0.46) | | (0.48) | | (0.45) | | (0.50) | | (0.43) |
| Return of capital | (0.04) | | — | | — | | — | | — |
| Total distributions | (0.50) | | (0.48) | | (0.45) | | (0.50) | | (0.43) |
| Net asset value at end of year | $ 6.88 | | $ 9.73 | | $ 9.81 | | $ 10.46 | | $ 9.71 |
| Total investment return (b) | (24.93)% | | 4.00% | | (1.80)% | | 13.05% | | (6.95)% |
| Ratios (to average net assets)/Supplemental Data: | | | | | | | | | |
| Net investment income (loss) | 4.53% | | 3.58% | | 4.70% | | 4.78% | | 4.36% |
| Net expenses (c) | 1.15% | | 1.16% | | 1.17% | | 1.23% | | 1.26% |
| Expenses (before waiver/reimbursement) (c) | 1.36% | | 1.31% | | 1.33% | | 1.26% | | 1.26% |
| Portfolio turnover rate | 116% | | 112% | | 102% | | 102% | | 44% |
| Net assets at end of year (in 000’s) | $ 48,053 | | $ 81,092 | | $ 82,874 | | $ 93,472 | | $ 86,452 |
| (a) | Per share data based on average shares outstanding during the year. |
| (b) | Total investment return is calculated exclusive of sales charges and assumes the reinvestment of dividends and distributions. For periods of less than one year, total return is not annualized. |
| (c) | In addition to the fees and expenses which the Fund bears directly, it also indirectly bears a pro-rata share of the fees and expenses of the underlying funds in which it invests. Such indirect expenses are not included in the above expense ratios. |
| | Year Ended October 31, |
| Investor Class | 2022 | | 2021 | | 2020 | | 2019 | | 2018 |
| Net asset value at beginning of year | $ 9.84 | | $ 9.91 | | $ 10.57 | | $ 9.80 | | $ 10.98 |
| Net investment income (loss) (a) | 0.35 | | 0.33 | | 0.44 | | 0.47 | | 0.43 |
| Net realized and unrealized gain (loss) | (2.77) | | 0.04 | | (0.68) | | 0.77 | | (1.20) |
| Total from investment operations | (2.42) | | 0.37 | | (0.24) | | 1.24 | | (0.77) |
| Less distributions: | | | | | | | | | |
| From net investment income | (0.43) | | (0.44) | | (0.42) | | (0.47) | | (0.41) |
| Return of capital | (0.03) | | — | | — | | — | | — |
| Total distributions | (0.46) | | (0.44) | | (0.42) | | (0.47) | | (0.41) |
| Net asset value at end of year | $ 6.96 | | $ 9.84 | | $ 9.91 | | $ 10.57 | | $ 9.80 |
| Total investment return (b) | (25.27)% | | 3.70% | | (2.20)% | | 12.82% | | (7.18)% |
| Ratios (to average net assets)/Supplemental Data: | | | | | | | | | |
| Net investment income (loss) | 4.14% | | 3.21% | | 4.38% | | 4.50% | | 4.15% |
| Net expenses (c) | 1.56% | | 1.53% | | 1.49% | | 1.52% | | 1.47% |
| Expenses (before waiver/reimbursement) (c) | 1.78% | | 1.70% | | 1.66% | | 1.56% | | 1.49% |
| Portfolio turnover rate | 116% | | 112% | | 102% | | 102% | | 44% |
| Net assets at end of year (in 000's) | $ 8,670 | | $ 12,806 | | $ 13,801 | | $ 16,024 | | $ 15,911 |
| (a) | Per share data based on average shares outstanding during the year. |
| (b) | Total investment return is calculated exclusive of sales charges and assumes the reinvestment of dividends and distributions. For periods of less than one year, total return is not annualized. |
| (c) | In addition to the fees and expenses which the Fund bears directly, it also indirectly bears a pro-rata share of the fees and expenses of the underlying funds in which it invests. Such indirect expenses are not included in the above expense ratios. |
The notes to the financial statements are an integral part of, and should be read in conjunction with, the financial statements.
| 22 | MainStay Candriam Emerging Markets Debt Fund |
Financial Highlights selected per share data and ratios
| | Year Ended October 31, |
| Class B | 2022 | | 2021 | | 2020 | | 2019 | | 2018 |
| Net asset value at beginning of year | $ 9.52 | | $ 9.61 | | $ 10.26 | | $ 9.52 | | $ 10.69 |
| Net investment income (loss) (a) | 0.27 | | 0.24 | | 0.36 | | 0.38 | | 0.34 |
| Net realized and unrealized gain (loss) | (2.67) | | 0.04 | | (0.66) | | 0.75 | | (1.18) |
| Total from investment operations | (2.40) | | 0.28 | | (0.30) | | 1.13 | | (0.84) |
| Less distributions: | | | | | | | | | |
| From net investment income | (0.37) | | (0.37) | | (0.35) | | (0.39) | | (0.33) |
| Return of capital | (0.03) | | — | | — | | — | | — |
| Total distributions | (0.40) | | (0.37) | | (0.35) | | (0.39) | | (0.33) |
| Net asset value at end of year | $ 6.72 | | $ 9.52 | | $ 9.61 | | $ 10.26 | | $ 9.52 |
| Total investment return (b) | (25.85)% | | 2.87% | | (2.91)% | | 12.04% | | (7.98)% |
| Ratios (to average net assets)/Supplemental Data: | | | | | | | | | |
| Net investment income (loss) | 3.31% | | 2.49% | | 3.66% | | 3.76% | | 3.37% |
| Net expenses (c) | 2.31% | | 2.28% | | 2.24% | | 2.27% | | 2.22% |
| Expenses (before waiver/reimbursement) (c) | 2.52% | | 2.45% | | 2.40% | | 2.31% | | 2.24% |
| Portfolio turnover rate | 116% | | 112% | | 102% | | 102% | | 44% |
| Net assets at end of year (in 000’s) | $ 426 | | $ 1,129 | | $ 1,789 | | $ 2,663 | | $ 3,660 |
| (a) | Per share data based on average shares outstanding during the year. |
| (b) | Total investment return is calculated exclusive of sales charges and assumes the reinvestment of dividends and distributions. For periods of less than one year, total return is not annualized. |
| (c) | In addition to the fees and expenses which the Fund bears directly, it also indirectly bears a pro-rata share of the fees and expenses of the underlying funds in which it invests. Such indirect expenses are not included in the above expense ratios. |
| | Year Ended October 31, |
| Class C | 2022 | | 2021 | | 2020 | | 2019 | | 2018 |
| Net asset value at beginning of year | $ 9.54 | | $ 9.63 | | $ 10.27 | | $ 9.54 | | $ 10.70 |
| Net investment income (loss) (a) | 0.27 | | 0.25 | | 0.36 | | 0.38 | | 0.35 |
| Net realized and unrealized gain (loss) | (2.67) | | 0.03 | | (0.66) | | 0.74 | | (1.18) |
| Total from investment operations | (2.40) | | 0.28 | | (0.30) | | 1.12 | | (0.83) |
| Less distributions: | | | | | | | | | |
| From net investment income | (0.37) | | (0.37) | | (0.34) | | (0.39) | | (0.33) |
| Return of capital | (0.03) | | — | | — | | — | | — |
| Total distributions | (0.40) | | (0.37) | | (0.34) | | (0.39) | | (0.33) |
| Net asset value at end of year | $ 6.74 | | $ 9.54 | | $ 9.63 | | $ 10.27 | | $ 9.54 |
| Total investment return (b) | (25.90)% | | 2.87% | | (2.81)% | | 11.91% | | (7.88)% |
| Ratios (to average net assets)/Supplemental Data: | | | | | | | | | |
| Net investment income (loss) | 3.31% | | 2.52% | | 3.68% | | 3.78% | | 3.39% |
| Net expenses (c) | 2.31% | | 2.28% | | 2.24% | | 2.27% | | 2.22% |
| Expenses (before waiver/reimbursement) (c) | 2.52% | | 2.45% | | 2.40% | | 2.31% | | 2.24% |
| Portfolio turnover rate | 116% | | 112% | | 102% | | 102% | | 44% |
| Net assets at end of year (in 000’s) | $ 1,358 | | $ 3,511 | | $ 6,365 | | $ 11,150 | | $ 19,246 |
| (a) | Per share data based on average shares outstanding during the year. |
| (b) | Total investment return is calculated exclusive of sales charges and assumes the reinvestment of dividends and distributions. For periods of less than one year, total return is not annualized. |
| (c) | In addition to the fees and expenses which the Fund bears directly, it also indirectly bears a pro-rata share of the fees and expenses of the underlying funds in which it invests. Such indirect expenses are not included in the above expense ratios. |
The notes to the financial statements are an integral part of, and should be read in conjunction with, the financial statements.
23
Financial Highlights selected per share data and ratios
| | Year Ended October 31, |
| Class I | 2022 | | 2021 | | 2020 | | 2019 | | 2018 |
| Net asset value at beginning of year | $ 9.75 | | $ 9.82 | | $ 10.48 | | $ 9.72 | | $ 10.90 |
| Net investment income (loss) (a) | 0.40 | | 0.39 | | 0.51 | | 0.52 | | 0.48 |
| Net realized and unrealized gain (loss) | (2.74) | | 0.05 | | (0.69) | | 0.76 | | (1.20) |
| Total from investment operations | (2.34) | | 0.44 | | (0.18) | | 1.28 | | (0.72) |
| Less distributions: | | | | | | | | | |
| From net investment income | (0.48) | | (0.51) | | (0.48) | | (0.52) | | (0.46) |
| Return of capital | (0.04) | | — | | — | | — | | — |
| Total distributions | (0.52) | | (0.51) | | (0.48) | | (0.52) | | (0.46) |
| Net asset value at end of year | $ 6.89 | | $ 9.75 | | $ 9.82 | | $ 10.48 | | $ 9.72 |
| Total investment return (b) | (24.75)% | | 4.42% | | (1.59)% | | 13.46% | | (6.80)% |
| Ratios (to average net assets)/Supplemental Data: | | | | | | | | | |
| Net investment income (loss) | 4.89% | | 3.86% | | 5.09% | | 4.99% | | 4.60% |
| Net expenses (c) | 0.85% | | 0.85% | | 0.85% | | 0.94% | | 1.01% |
| Expenses (before waiver/reimbursement) (c) | 1.12% | | 1.06% | | 1.07% | | 1.01% | | 1.01% |
| Portfolio turnover rate | 116% | | 112% | | 102% | | 102% | | 44% |
| Net assets at end of year (in 000’s) | $ 3,637 | | $ 5,729 | | $ 6,687 | | $ 17,100 | | $ 10,428 |
| (a) | Per share data based on average shares outstanding during the year. |
| (b) | Total investment return is calculated exclusive of sales charges and assumes the reinvestment of dividends and distributions. Class I shares are not subject to sales charges. For periods of less than one year, total return is not annualized. |
| (c) | In addition to the fees and expenses which the Fund bears directly, it also indirectly bears a pro-rata share of the fees and expenses of the underlying funds in which it invests. Such indirect expenses are not included in the above expense ratios. |
The notes to the financial statements are an integral part of, and should be read in conjunction with, the financial statements.
| 24 | MainStay Candriam Emerging Markets Debt Fund |
Notes to Financial Statements
Note 1-Organization and Business
The MainStay Funds (the “Trust”) was organized on January 9, 1986, as a Massachusetts business trust. The Trust is registered under the Investment Company Act of 1940, as amended (the “1940 Act”), as an open-end management investment company, and is comprised of twelve funds (collectively referred to as the "Funds"). These financial statements and notes relate to the MainStay Candriam Emerging Markets Debt Fund (the "Fund"), a “diversified” fund, as that term is defined in the 1940 Act, as interpreted or modified by regulatory authorities having jurisdiction, from time to time.
The following table lists the Fund's share classes that have been registered and commenced operations:
| Class | Commenced Operations |
| Class A | June 1, 1998 |
| Investor Class | February 28, 2008 |
| Class B | June 1, 1998 |
| Class C | September 1, 1998 |
| Class I | August 31, 2007 |
| Class R6 | N/A* |
| SIMPLE Class | N/A* |
| * | Class R6 shares were registered for sale effective as of February 28, 2017 and SIMPLE Class shares were registered for sale effective as of August 31, 2020 but have not yet commenced operations. |
Class B shares of the MainStay Group of Funds are closed to all new purchases as well as additional investments by existing Class B shareholders. Existing Class B shareholders may continue to reinvest dividends and capital gains distributions, as well as exchange their Class B shares for Class B shares of other funds in the MainStay Group of Funds as permitted by the current exchange privileges. Class B shareholders continue to be subject to any applicable contingent deferred sales charge ("CDSC") at the time of redemption. All other features of the Class B shares, including but not limited to the fees and expenses applicable to Class B shares, remain unchanged. Unless redeemed, Class B shareholders will remain in Class B shares of their respective fund until the Class B shares are converted to Class A or Investor Class shares pursuant to the applicable conversion schedule.
Class A and Investor Class shares are offered at net asset value (“NAV”) per share plus an initial sales charge. No initial sales charge applies to investments of $1 million or more (and certain other qualified purchases) in Class A and Investor Class shares. However, a CDSC of 1.00% may be imposed on certain redemptions made within 18 months of the date of purchase on shares that were purchased without an initial sales charge. Class C shares are offered at NAV without an initial sales charge, although a 1.00% CDSC may be imposed on certain redemptions of such shares made within one year of the date of purchase of Class C shares. When Class B shares were offered, they were offered at NAV without an initial sales charge, although a CDSC that declines depending on the number of years a shareholder held its Class B shares may be imposed on certain redemptions of such shares made within six years of the date
of purchase of such shares. Class I shares are offered at NAV without a sales charge. Class R6 and SIMPLE Class shares are expected to be offered at NAV without a sales charge if such shares are offered in the future. Depending upon eligibility, Class B shares convert to either Class A or Investor Class shares at the end of the calendar quarter eight years after the date they were purchased. In addition, depending upon eligibility, Class C shares convert to either Class A or Investor Class shares at the end of the calendar quarter eight years after the date they were purchased. Additionally, Investor Class shares may convert automatically to Class A shares. Under certain circumstances and as may be permitted by the Trust’s multiple class plan pursuant to Rule 18f-3 under the 1940 Act, specified share classes of the Fund may be converted to one or more other share classes of the Fund as disclosed in the capital share transactions within these Notes. The classes of shares have the same voting (except for issues that relate solely to one class), dividend, liquidation and other rights, and the same terms and conditions, except that under distribution plans pursuant to Rule 12b-1 under the 1940 Act, Class B and Class C shares are subject to higher distribution and/or service fees than Class A, Investor Class and SIMPLE Class shares. Class I and Class R6 shares are not subject to a distribution and/or service fee.
The Fund's investment objective is to seek total return.
Note 2–Significant Accounting Policies
The Fund is an investment company and accordingly follows the investment company accounting and reporting guidance of the Financial Accounting Standards Board (“FASB”) Accounting Standards Codification Topic 946 Financial Services—Investment Companies. The Fund prepares its financial statements in accordance with generally accepted accounting principles (“GAAP”) in the United States of America and follows the significant accounting policies described below.
(A) Securities Valuation. Investments are usually valued as of the close of regular trading on the New York Stock Exchange (the "Exchange") (usually 4:00 p.m. Eastern time) on each day the Fund is open for business ("valuation date").
Effective September 8, 2022, and pursuant to Rule 2a-5 under the 1940 Act, the Board of Trustees of the Trust (the "Board") designated New York Life Investment Management LLC (“New York Life Investments” or the "Manager") as its Valuation Designee (the "Valuation Designee"). The Valuation Designee is responsible for performing fair valuations relating to all investments in the Fund’s portfolio for which market quotations are not readily available; periodically assessing and managing material valuation risks; establishing and applying fair value methodologies; testing fair valuation methodologies; evaluating and overseeing pricing services; segregation of valuation and portfolio management functions; providing quarterly, annual and prompt reporting to the Board, as appropriate; identifying potential conflicts of interest; and maintaining appropriate records. The Valuation Designee has established a valuation committee ("Valuation Committee") to assist in carrying out the Valuation Designee’s responsibilities and establish prices of securities for which market
Notes to Financial Statements (continued)
quotations are not readily available. The Fund’s and the Valuation Designee's policies and procedures ("Valuation Procedures") govern the Valuation Designee’s selection and application of methodologies for determining and calculating the fair value of Fund investments. The Valuation Designee may value Fund portfolio securities for which market quotations are not readily available and other Fund assets utilizing inputs from pricing services and other third-party sources (together, “Pricing Sources”). The Valuation Committee meets (in person, via electronic mail or via teleconference) on an ad-hoc basis to determine fair valuations and on a quarterly basis to review fair value events (excluding fair valuations from pricing services), including valuation risks and back-testing results, and preview reports to the Board.
The Valuation Committee establishes prices of securities for which market quotations are not readily available based on such methodologies and measurements on a regular basis after considering information that is reasonably available and deemed relevant by the Valuation Committee. The Board shall oversee the Valuation Designee and review fair valuation materials on a prompt, quarterly and annual basis and approve proposed revisions to the Valuation Procedures.
Investments for which market quotations are not readily available are valued at fair value as determined in good faith pursuant to the Valuation Procedures. A market quotation is readily available only when that quotation is a quoted price (unadjusted) in active markets for identical investments that the Fund can access at the measurement date, provided that a quotation will not be readily available if it is not reliable. Fair value measurements are determined within a framework that establishes a three-tier hierarchy that maximizes the use of observable market data and minimizes the use of unobservable inputs to establish a classification of fair value measurements for disclosure purposes. "Inputs" refer broadly to the assumptions that market participants would use in pricing the asset or liability, including assumptions about risk, such as the risk inherent in a particular valuation technique used to measure fair value using a pricing model and/or the risk inherent in the inputs for the valuation technique. Inputs may be observable or unobservable. Observable inputs reflect the assumptions market participants would use in pricing the asset or liability based on market data obtained from sources independent of the Fund. Unobservable inputs reflect the Fund’s own assumptions about the assumptions market participants would use in pricing the asset or liability based on the information available. The inputs or methodology used for valuing assets or liabilities may not be an indication of the risks associated with investing in those assets or liabilities. The three-tier hierarchy of inputs is summarized below.
| • | Level 1—quoted prices (unadjusted) in active markets for an identical asset or liability |
| • | Level 2—other significant observable inputs (including quoted prices for a similar asset or liability in active markets, interest rates and yield curves, prepayment speeds, credit risk, etc.) |
| • | Level 3—significant unobservable inputs (including the Fund's own assumptions about the assumptions that market participants would use in measuring fair value of an asset or liability) |
The level of an asset or liability within the fair value hierarchy is based on the lowest level of an input, both individually and in the aggregate, that is significant to the fair value measurement. The aggregate value by input level of the Fund’s assets and liabilities as of October 31, 2022, is included at the end of the Portfolio of Investments.
The Fund may use third-party vendor evaluations, whose prices may be derived from one or more of the following standard inputs, among others:
| • Benchmark yields | • Reported trades |
| • Broker/dealer quotes | • Issuer spreads |
| • Two-sided markets | • Benchmark securities |
| • Bids/offers | • Reference data (corporate actions or material event notices) |
| • Industry and economic events | • Comparable bonds |
| • Monthly payment information | |
An asset or liability for which a market quotation is not readily available is valued by methods deemed reasonable in good faith by the Valuation Committee, following the Valuation Procedures to represent fair value. Under these procedures, the Valuation Designee generally uses a market-based approach which may use related or comparable assets or liabilities, recent transactions, market multiples, book values and other relevant information. The Valuation Designee may also use an income-based valuation approach in which the anticipated future cash flows of the asset or liability are discounted to calculate fair value. Discounts may also be applied due to the nature and/or duration of any restrictions on the disposition of the asset or liability. Fair value represents a good faith approximation of the value of a security. Fair value determinations involve the consideration of a number of subjective factors, an analysis of applicable facts and circumstances and the exercise of judgment. As a result, it is possible that the fair value for a security determined in good faith in accordance with the Valuation Procedures may differ from valuations for the same security determined for other funds using their own valuation procedures. Although the Valuation Procedures are designed to value a security at the price the Fund may reasonably expect to receive upon the security's sale in an orderly transaction, there can be no assurance that any fair value determination thereunder would, in fact, approximate the amount that the Fund would actually realize upon the sale of the security or the price at which the security would trade if a reliable market price were readily available. During the year ended October 31, 2022, there were no material changes to the fair value methodologies.
Securities which may be valued in this manner include, but are not limited to: (i) a security for which trading has been halted or suspended or otherwise does not have a readily available market quotation on a given day; (ii) a debt security that has recently gone into default and for which there is not a current market quotation; (iii) a security of an issuer that has entered into a restructuring; (iv) a security that has been delisted from a national exchange; (v) a security subject to trading collars for which no or limited trading takes place; and (vi) a security whose principal market has been temporarily closed at a time when, under normal
| 26 | MainStay Candriam Emerging Markets Debt Fund |
conditions, it would be open. Securities valued in this manner are generally categorized as Level 2 or 3 in the hierarchy.
Investments in mutual funds, including money market funds, are valued at their respective NAVs at the close of business each day on the valuation date. These securities are generally categorized as Level 1 in the hierarchy.
Futures contracts are valued at the last posted settlement price on the market where such futures are primarily traded. These securities are generally categorized as Level 1 in the hierarchy.
Debt securities (other than convertible and municipal bonds) are valued at the evaluated bid prices (evaluated mean prices in the case of convertible and municipal bonds) supplied by a pricing agent or broker selected by the Valuation Designee, in consultation with the Subadvisor. The evaluations are market-based measurements processed through a pricing application and represents the pricing agent’s good faith determination as to what a holder may receive in an orderly transaction under market conditions. The rules-based logic utilizes valuation techniques that reflect participants’ assumptions and vary by asset class and per methodology, maximizing the use of relevant observable data including quoted prices for similar assets, benchmark yield curves and market corroborated inputs. The evaluated bid or mean prices are deemed by the Valuation Designee, in consultation with the Subadvisor, to be representative of market values at the regular close of trading of the Exchange on each valuation date. Debt securities purchased on a delayed delivery basis are marked to market daily until settlement at the forward settlement date. Debt securities, including corporate bonds, U.S. government and federal agency bonds, municipal bonds, foreign bonds, convertible bonds, asset-backed securities and mortgage-backed securities are generally categorized as Level 2 in the hierarchy.
Temporary cash investments acquired in excess of 60 days to maturity at the time of purchase are valued using the latest bid prices or using valuations based on a matrix system (which considers such factors as security prices, yields, maturities and ratings), both as furnished by independent pricing services. Temporary cash investments that mature in 60 days or less at the time of purchase ("Short-Term Investments") are valued using the amortized cost method of valuation, unless the use of such method would be inappropriate. The amortized cost method involves valuing a security at its cost on the date of purchase and thereafter assuming a constant amortization to maturity of the difference between such cost and the value on maturity date. Amortized cost approximates the current fair value of a security. Securities valued using the amortized cost method are not valued using quoted prices in an active market and are generally categorized as Level 2 in the hierarchy.
The information above is not intended to reflect an exhaustive list of the methodologies that may be used to value portfolio investments. The Valuation Procedures permit the use of a variety of valuation methodologies in connection with valuing portfolio investments. The methodology used for a specific type of investment may vary based on the market data available or other considerations. The methodologies
summarized above may not represent the specific means by which portfolio investments are valued on any particular business day.
A portfolio investment may be classified as an illiquid investment under the Fund's written liquidity risk management program and related procedures (“Liquidity Program”). Illiquidity of an investment might prevent the sale of such investment at a time when the Manager or the Subadvisor might wish to sell, and these investments could have the effect of decreasing the overall level of the Fund's liquidity. Further, the lack of an established secondary market may make it more difficult to value illiquid investments, requiring the Fund to rely on judgments that may be somewhat subjective in measuring value, which could vary materially from the amount that the Fund could realize upon disposition. Difficulty in selling illiquid investments may result in a loss or may be costly to the Fund. An illiquid investment is any investment that the Manager or Subadvisor reasonably expects cannot be sold or disposed of in current market conditions in seven calendar days or less without the sale or disposition significantly changing the market value of the investment. The liquidity classification of each investment will be made using information obtained after reasonable inquiry and taking into account, among other things, relevant market, trading and investment-specific considerations in accordance with the Liquidity Program. Illiquid investments are often fair valued in accordance with the Fund's procedures described above. The liquidity of the Fund's investments was determined as of October 31, 2022, and can change at any time. Illiquid investments as of October 31, 2022, are shown in the Portfolio of Investments.
(B) Income Taxes. The Fund's policy is to comply with the requirements of the Internal Revenue Code of 1986, as amended (the “Internal Revenue Code”), applicable to regulated investment companies and to distribute all of its taxable income to the shareholders of the Fund within the allowable time limits.
The Manager evaluates the Fund’s tax positions to determine if the tax positions taken meet the minimum recognition threshold in connection with accounting for uncertainties in income tax positions taken or expected to be taken for the purposes of measuring and recognizing tax liabilities in the financial statements. Recognition of tax benefits of an uncertain tax position is permitted only to the extent the position is “more likely than not” to be sustained assuming examination by taxing authorities. The Manager analyzed the Fund's tax positions taken on federal, state and local income tax returns for all open tax years (for up to three tax years) and has concluded that no provisions for federal, state and local income tax are required in the Fund's financial statements. The Fund's federal, state and local income tax and federal excise tax returns for tax years for which the applicable statutes of limitations have not expired are subject to examination by the Internal Revenue Service and state and local departments of revenue.
(C) Dividends and Distributions to Shareholders. Dividends and distributions are recorded on the ex-dividend date. The Fund intends to declare and pay dividends from net investment income, if any, at least monthly and distributions from net realized capital and currency gains, if
Notes to Financial Statements (continued)
any, at least annually. Unless a shareholder elects otherwise, all dividends and distributions are reinvested at NAV in the same class of shares of the Fund. Dividends and distributions to shareholders are determined in accordance with federal income tax regulations and may differ from determinations using GAAP.
(D) Security Transactions and Investment Income. The Fund records security transactions on the trade date. Realized gains and losses on security transactions are determined using the identified cost method. Interest income is accrued as earned using the effective interest rate method. Distributions received from real estate investment trusts may be classified as dividends, capital gains and/or return of capital. Discounts and premiums on securities purchased for the Fund are accreted and amortized, respectively, on the effective interest rate method. Income from payment-in-kind securities, to the extent the Fund held any such securities during the year ended October 31, 2022, is accreted daily based on the effective interest method.
Investment income and realized and unrealized gains and losses on investments of the Fund are allocated pro rata to the separate classes of shares based upon their relative net assets on the date the income is earned or realized and unrealized gains and losses are incurred.
The Fund may place a debt security on non-accrual status and reduce related interest income by ceasing current accruals and writing off all or a portion of any interest receivables when the collection of all or a portion of such interest has become doubtful. A debt security is removed from non-accrual status when the issuer resumes interest payments or when collectability of interest is reasonably assured.
(E) Expenses. Expenses of the Trust are allocated to the individual Funds in proportion to the net assets of the respective Funds when the expenses are incurred, except where direct allocations of expenses can be made. Expenses (other than transfer agent expenses and fees incurred under the shareholder services plans and/or the distribution plans further discussed in Note 3(B)) are allocated to separate classes of shares pro rata based upon their relative net assets on the date the expenses are incurred. The expenses borne by the Fund, including those of related parties to the Fund, are shown in the Statement of Operations.
Additionally, the Fund may invest in mutual funds, which are subject to management fees and other fees that may cause the costs of investing in mutual funds to be greater than the costs of owning the underlying securities directly. These indirect expenses of mutual funds are not included in the amounts shown as expenses in the Statement of Operations or in the expense ratios included in the Financial Highlights.
(F) Use of Estimates. In preparing financial statements in conformity with GAAP, the Manager makes estimates and assumptions that affect the reported amounts and disclosures in the financial statements. Actual results could differ from those estimates and assumptions.
(G) Futures Contracts. A futures contract is an agreement to purchase or sell a specified quantity of an underlying instrument at a specified future date and price, or to make or receive a cash payment
based on the value of a financial instrument (e.g., foreign currency, interest rate, security or securities index). The Fund is subject to risks such as market price risk, leverage risk, liquidity risk, counterparty risk, operational risk, legal risk and/or interest rate risk in the normal course of investing in these contracts. Upon entering into a futures contract, the Fund is required to pledge to the broker or futures commission merchant an amount of cash and/or U.S. government securities equal to a certain percentage of the collateral amount, known as the “initial margin.” During the period the futures contract is open, changes in the value of the contract are recognized as unrealized appreciation or depreciation by marking to market such contract on a daily basis to reflect the market value of the contract at the end of each day’s trading. The Fund agrees to receive from or pay to the broker or futures commission merchant an amount of cash equal to the daily fluctuation in the value of the contract. Such receipts or payments are known as “variation margin.” When the futures contract is closed, the Fund records a realized gain or loss equal to the difference between the proceeds from (or cost of) the closing transaction and the Fund's basis in the contract.
The use of futures contracts involves, to varying degrees, elements of market risk in excess of the amount recognized in the Statement of Assets and Liabilities. The contract or notional amounts and variation margin reflect the extent of the Fund's involvement in open futures positions. There are several risks associated with the use of futures contracts as hedging techniques. There can be no assurance that a liquid market will exist at the time when the Fund seeks to close out a futures contract. If no liquid market exists, the Fund would remain obligated to meet margin requirements until the position is closed. Futures contracts may involve a small initial investment relative to the risk assumed, which could result in losses greater than if the Fund did not invest in futures contracts. Futures contracts may be more volatile than direct investments in the instrument underlying the futures and may not correlate to the underlying instrument, causing a given hedge not to achieve its objectives. The Fund's activities in futures contracts have minimal counterparty risk as they are conducted through regulated exchanges that guarantee the futures against default by the counterparty. In the event of a bankruptcy or insolvency of a futures commission merchant that holds margin on behalf of the Fund, the Fund may not be entitled to the return of the entire margin owed to the Fund, potentially resulting in a loss. The Fund may invest in futures contracts to seek enhanced returns or to reduce the risk of loss by hedging certain of its holdings. The Fund's investment in futures contracts and other derivatives may increase the volatility of the Fund's NAVs and may result in a loss to the Fund. Open futures contracts as of October 31, 2022, are shown in the Portfolio of Investments.
(H) Foreign Currency Forward Contracts. The Fund may enter into foreign currency forward contracts, which are agreements to buy or sell foreign currencies on a specified future date at a specified rate. The Fund is subject to foreign currency exchange rate risk in the normal course of investing in these transactions. During the period the forward contract is open, changes in the value of the contract are recognized as unrealized appreciation or depreciation by marking to market such contract on a
| 28 | MainStay Candriam Emerging Markets Debt Fund |
daily basis to reflect the market value of the contract at the end of each day’s trading. Cash movement occurs on the settlement date. When the forward contract is closed, the Fund records a realized gain or loss equal to the difference between the proceeds from (or cost of) the closing transaction and the Fund's basis in the contract. The Fund may purchase and sell foreign currency forward contracts for purposes of seeking to enhance portfolio returns and manage portfolio risk more efficiently. Foreign currency forward contracts may also be used to gain exposure to a particular currency or to hedge against the risk of loss due to changing currency exchange rates. Foreign currency forward contracts to purchase or sell a foreign currency may also be used in anticipation of future purchases or sales of securities denominated in foreign currency, even if the specific investments have not yet been selected.
The use of foreign currency forward contracts involves, to varying degrees, elements of risk in excess of the amount recognized in the Statement of Assets and Liabilities, including counterparty risk, market risk, leverage risk, operational risk, legal risk and liquidity risk. Counterparty risk is heightened for these instruments because foreign currency forward contracts are not exchange-traded and therefore no clearinghouse or exchange stands ready to meet the obligations under such contracts. Thus, the Fund faces the risk that its counterparties under such contracts may not perform their obligations. Market risk is the risk that the value of a foreign currency forward contract will depreciate due to unfavorable changes in exchange rates. Liquidity risk arises because the secondary market for foreign currency forward contracts may have less liquidity relative to markets for other securities and financial instruments. Liquidity risk also can arise when forward currency contracts create margin or settlement payment obligations for the Fund. Leverage risk is the risk that a foreign currency forward contract can magnify the Fund's gains and losses. Operational risk refers to risk related to potential operational issues (including documentation issues, settlement issues, systems failures, inadequate controls and human error), and legal risk refers to insufficient documentation, insufficient capacity or authority of the counterparty, or legality or enforceability of a foreign currency forward contract. Risks also arise from the possible movements in the foreign exchange rates underlying these instruments. While the Fund may enter into forward contracts to reduce currency exchange risks, changes in currency exchange rates may result in poorer overall performance for the Fund than if it had not engaged in such transactions. Exchange rate movements can be large, depending on the currency, and can last for extended periods of time, affecting the value of the Fund's assets. Moreover, there may be an imperfect correlation between the Fund's holdings of securities denominated in a particular currency and forward contracts entered into by the Fund. Such imperfect correlation may prevent the Fund from achieving the intended hedge or expose the Fund to the risk of currency exchange loss. The unrealized appreciation (depreciation) on forward contracts also reflects the Fund's exposure at the valuation date to credit loss in the event of a counterparty’s failure to perform its obligations. As of October 31, 2022, the Fund did not hold any foreign currency forward contracts.
(I) Foreign Currency Transactions. The Fund's books and records are maintained in U.S. dollars. Prices of securities denominated in foreign currency amounts are translated into U.S. dollars at the mean between the buying and selling rates last quoted by any major U.S. bank at the following dates:
(i) market value of investment securities, other assets and liabilities— at the valuation date; and
(ii) purchases and sales of investment securities, income and expenses—at the date of such transactions.
The assets and liabilities that are denominated in foreign currency amounts are presented at the exchange rates and market values at the close of the period. The realized and unrealized changes in net assets arising from fluctuations in exchange rates and market prices of securities are not separately presented.
Net realized gain (loss) on foreign currency transactions represents net currency gains or losses realized as a result of differences between the amounts of securities sale proceeds or purchase cost, dividends, interest and withholding taxes as recorded on the Fund's books, and the U.S. dollar equivalent amount actually received or paid. Net currency gains or losses from valuing such foreign currency denominated assets and liabilities, other than investments at valuation date exchange rates, are reflected in unrealized foreign exchange gains or losses.
(J) Securities Lending. In order to realize additional income, the Fund may engage in securities lending, subject to the limitations set forth in the 1940 Act and relevant guidance by the staff of the Securities and Exchange Commission (“SEC”). If the Fund engages in securities lending, the Fund will lend through its custodian, JPMorgan Chase Bank, N.A., ("JPMorgan"), acting as securities lending agent on behalf of the Fund. Under the current arrangement, JPMorgan will manage the Fund's collateral in accordance with the securities lending agency agreement between the Fund and JPMorgan, and indemnify the Fund against counterparty risk. The loans will be collateralized by cash (which may be invested in a money market fund) and/or non-cash collateral (which may include U.S. Treasury securities and/or U.S. government agency securities issued or guaranteed by the United States government or its agencies or instrumentalities) at least equal at all times to the market value of the securities loaned. Non-cash collateral held at year end is segregated and cannot be transferred by the Fund. The Fund bears the risk of delay in recovery of, or loss of rights in, the securities loaned. The Fund may also record a realized gain or loss on securities deemed sold due to a borrower’s inability to return securities on loan. The Fund bears the risk of any loss on investment of cash collateral. The Fund will receive compensation for lending its securities in the form of fees or it will retain a portion of interest earned on the investment of any cash collateral. The Fund will also continue to receive interest and dividends on the securities loaned and any gain or loss in the market price of the securities loaned that may occur during the term of the loan will be for the account of the Fund. Income earned from securities lending activities, if any, is reflected
Notes to Financial Statements (continued)
in the Statement of Operations. Securities on loan as of October 31, 2022, are shown in the Portfolio of Investments.
(K) High Yield and General Debt Securities Risk. The ability of issuers of debt securities held by the Fund to meet their obligations may be affected by, among other things, economic or political developments in a specific country, industry or region. Debt securities are also subject to the risks associated with changes in interest rates. The Fund’s principal investments include high yield debt securities (commonly referred to as “junk bonds”), which are considered speculative because they present a greater risk of loss, including default, than higher quality debt securities. These securities pay investors a premium—a higher interest rate or yield than investment grade debt securities—because of the increased risk of loss. These securities can also be subject to greater price volatility. In times of unusual or adverse market economic or political conditions, these securities may experience higher than normal default rates.
(L) Foreign Securities Risk and Emerging Markets Risk. The ability of issuers of debt securities held by the Fund to meet their obligations may be affected by, among other things, economic or political developments in a specific country, industry or region. Debt securities are also subject to the risks associated with changes in interest rates. The Fund may invest in foreign securities, which carry certain risks that are in addition to the usual risks inherent in domestic securities. These risks include those resulting from currency fluctuations, future adverse political or economic developments and possible imposition of currency exchange blockages or other foreign governmental laws or restrictions. The ability of issuers of debt securities held by the Fund to meet their obligations may be affected by, among other things, economic or political developments in a specific country, industry or region.
The risks related to investing in foreign securities are generally greater with respect to securities of companies that conduct their business activities in emerging markets or whose securities are traded principally in emerging markets. The risks of investing in emerging markets include the risks of illiquidity, increased price volatility, smaller market capitalizations, less government regulation, less extensive and less frequent accounting, financial and other reporting requirements, loss resulting from problems in share registration and custody, substantial economic and political disruptions and the nationalization of foreign deposits or assets.
(M) Counterparty Credit Risk. In order to better define its contractual rights and to secure rights that will help the Fund mitigate its counterparty risk, the Fund may enter into an International Swaps and Derivatives Association, Inc. Master Agreement (“ISDA Master Agreement”) or similar agreement with its counterparties. An ISDA Master Agreement is a bilateral agreement between the Fund and a counterparty that governs certain OTC derivatives and typically contains collateral posting terms and netting provisions. Under an ISDA Master Agreement, the Fund may, under certain circumstances, offset with the counterparty certain derivative financial instruments’ payables and/ or receivables with collateral held and/or posted and create one single net payment. The provisions of the ISDA Master Agreement typically permit a single net
payment in the event of default including the bankruptcy or insolvency of the counterparty. Bankruptcy or insolvency laws of a particular jurisdiction may restrict or prohibit the right of offset in bankruptcy, insolvency or other events. In addition, certain ISDA Master Agreements may contain provisions for early termination of OTC derivative transactions in the event the net assets of the Fund decline below specific levels or if the Fund fails to meet the terms of its ISDA Master Agreements. The result would cause the Fund to accelerate payment of any net liability owed to the counterparty.
For financial reporting purposes, the Fund does not offset derivative assets and derivative liabilities that are subject to netting arrangements, if any, in the Statement of Assets and Liabilities.
(N) Indemnifications. Under the Trust’s organizational documents, its officers and trustees are indemnified against certain liabilities that may arise out of performance of their duties to the Trust. Additionally, in the normal course of business, the Fund enters into contracts with third-party service providers that contain a variety of representations and warranties and that may provide general indemnifications. The Fund's maximum exposure under these arrangements is unknown, as this would involve future claims that may be made against the Fund that have not yet occurred. The Manager believes that the risk of loss in connection with these potential indemnification obligations is remote. However, there can be no assurance that material liabilities related to such obligations will not arise in the future, which could adversely impact the Fund.
(O) Quantitative Disclosure of Derivative Holdings. The following tables show additional disclosures related to the Fund's derivative and hedging activities, including how such activities are accounted for and their effect on the Fund's financial positions, performance and cash flows.
The Fund entered into futures contracts to hedge against anticipated changes in interest rates that might otherwise have an adverse effect upon the value of the Fund’s securities as well as help manage the duration and yield curve positioning of the portfolio.
The Fund also entered into foreign currency forward contracts to gain exposure to a particular currency or to hedge against the risk of loss due to changing currency exchange rates.
Fair value of derivative instruments as of October 31, 2022:
| Asset Derivatives | Interest
Rate
Contracts
Risk | Total |
| Futures Contracts - Net Assets—Net unrealized appreciation on futures contracts (a) | $1,224 | $1,224 |
| Total Fair Value | $1,224 | $1,224 |
| (a) | Includes cumulative appreciation (depreciation) of futures contracts as reported in the Portfolio of Investments. Only current day’s variation margin is reported within the Statement of Assets and Liabilities. |
| 30 | MainStay Candriam Emerging Markets Debt Fund |
The effect of derivative instruments on the Statement of Operations for the year ended October 31, 2022:
| Net Realized Gain (Loss) from: | Foreign
Exchange
Contracts
Risk | Interest
Rate
Contracts
Risk | Total |
| Futures Contracts | $ — | $831,068 | $ 831,068 |
| Forward Contracts | 418,843 | — | 418,843 |
| Total Net Realized Gain (Loss) | $418,843 | $831,068 | $1,249,911 |
| Net Change in Unrealized Appreciation (Depreciation) | Foreign
Exchange
Contracts
Risk | Interest
Rate
Contracts
Risk | Total |
| Futures Contracts | $ — | $(324,760) | $(324,760) |
| Forward Contracts | (134,512) | — | (134,512) |
| Total Net Change in Unrealized Appreciation (Depreciation) | $(134,512) | $(324,760) | $(459,272) |
| Average Notional Amount | Total |
| Futures Contracts Long (a) | $ 4,100,700 |
| Futures Contracts Short (b) | $(12,612,979) |
| Forward Contracts Long (c) | $ 1,787,099 |
| Forward Contracts Short (d) | $ (2,528,929) |
| (a) | Positions were open five months during the reporting period. |
| (b) | Positions were open seven months during the reporting period. |
| (c) | Positions were open three months during the reporting period. |
| (d) | Positions were open ten months during the reporting period. |
Note 3–Fees and Related Party Transactions
(A) Manager and Subadvisor. New York Life Investments, a registered investment adviser and an indirect, wholly-owned subsidiary of New York Life Insurance Company ("New York Life"), serves as the Fund's Manager, pursuant to an Amended and Restated Management Agreement (“Management Agreement”). The Manager provides offices, conducts clerical, recordkeeping and bookkeeping services and keeps most of the financial and accounting records required to be maintained by the Fund. Except for the portion of salaries and expenses that are the responsibility of the Fund, the Manager pays the salaries and expenses of all personnel affiliated with the Fund and certain operational expenses of the Fund. During a portion of the year ended October 31, 2022, the Fund reimbursed New York Life Investments in an amount equal to the portion of the compensation of the Chief Compliance Officer attributable to the Fund. Candriam (the "Subadvisor"), a registered investment adviser and an indirect, wholly-owned subsidiary of New York Life, serves as the Subadvisor to the Fund and is responsible for the day-to-day portfolio management of the Fund. Pursuant to the terms of a Subadvisory Agreement (“Subadvisory Agreement”) between New York Life Investments and Candriam, New York Life Investments pays for the services of the Subadvisor.
Pursuant to the Management Agreement, the Fund pays the Manager a monthly fee for the services performed and the facilities furnished at an annual rate of the Fund’s average daily net assets as follows: 0.70% to $500 million and 0.65% in excess of $500 million. During the year ended October 31, 2022, the effective management fee rate was 0.70% of the Fund’s average daily net assets, exclusive of any applicable waivers/reimbursements.
New York Life Investments has contractually agreed to waive fees and/or reimburse expenses so that Total Annual Fund Operating Expenses (excluding taxes, interest, litigation, extraordinary expenses, brokerage and other transaction expenses relating to the purchase or sale of portfolio investments and acquired (underlying) fund fees and expenses) do not exceed the following percentages of daily net assets: Class A, 1.15% and Class I, 0.85%. New York Life Investments will apply an equivalent waiver or reimbursement, in an equal number of basis points of the Class A shares waiver/reimbursement to the Investor Class, Class B and Class C shares. This agreement will remain in effect until February 28, 2023, and shall renew automatically for one-year terms unless New York Life Investments provides written notice of termination prior to the start of the next term or upon approval of the Board.
During the year ended October 31, 2022, New York Life Investments earned fees from the Fund in the amount of $573,341 and waived fees and/or reimbursed expenses, including the waiver/reimbursement of certain class specific expenses in the amount of $178,325 and paid the Subadvisor fees in the amount of $197,508.
JPMorgan provides sub-administration and sub-accounting services to the Fund pursuant to an agreement with New York Life Investments. These services include calculating the daily NAVs of the Fund, maintaining the general ledger and sub-ledger accounts for the calculation of the Fund's NAVs, and assisting New York Life Investments in conducting various aspects of the Fund's administrative operations. For providing these services to the Fund, JPMorgan is compensated by New York Life Investments.
Pursuant to an agreement between the Trust and New York Life Investments, New York Life Investments is responsible for providing or procuring certain regulatory reporting services for the Fund. The Fund will reimburse New York Life Investments for the actual costs incurred by New York Life Investments in connection with providing or procuring these services for the Fund.
(B) Distribution and Service Fees. The Trust, on behalf of the Fund, has entered into a distribution agreement with NYLIFE Distributors LLC (the “Distributor”), an affiliate of New York Life Investments. The Fund has adopted distribution plans (the “Plans”) in accordance with the provisions of Rule 12b-1 under the 1940 Act.
Pursuant to the Class A and Investor Class Plans, the Distributor receives a monthly fee from the Class A and Investor Class shares at an annual rate of 0.25% of the average daily net assets of the Class A and Investor Class shares for distribution and/or service activities as designated by the Distributor. Pursuant to the Class B and Class C Plans, Class B and
Notes to Financial Statements (continued)
Class C shares pay the Distributor a monthly distribution fee at an annual rate of 0.75% of the average daily net assets of the Class B and Class C shares along with a service fee at an annual rate of 0.25% of the average daily net assets of the Class B and Class C shares, for a total 12b-1 fee of 1.00%. Class I shares are not subject to a distribution and/or service fee.
The Plans provide that the distribution and service fees are payable to the Distributor regardless of the amounts actually expended by the Distributor for distribution of the Fund's shares and service activities.
(C) Sales Charges. The Fund was advised by the Distributor that the amount of initial sales charges retained on sales of Class A and Investor Class shares during the year ended October 31, 2022, were $3,377 and $800, respectively.
The Fund was also advised that the Distributor retained CDSCs on redemptions of Class A, Class B and Class C shares during the year ended October 31, 2022, of $649, $59 and $26, respectively.
(D) Transfer, Dividend Disbursing and Shareholder Servicing Agent. NYLIM Service Company LLC, an affiliate of New York Life Investments, is the Fund's transfer, dividend disbursing and shareholder servicing agent pursuant to an agreement between NYLIM Service Company LLC and the Trust. NYLIM Service Company LLC has entered into an agreement with DST Asset Manager Solutions, Inc. ("DST"), pursuant to which DST performs certain transfer agent services on behalf of NYLIM Service Company LLC. New York Life Investments has contractually agreed to limit the transfer agency expenses charged to the Fund’s share classes to a maximum of 0.35% of that share class’s average daily net assets on an annual basis after deducting any applicable Fund or class-level expense reimbursement or small account fees. This agreement will remain in effect until February 28, 2023, and shall renew automatically for one-year terms unless New York Life Investments provides written notice of termination prior to the start of the next term or upon approval of the Board. During the year ended October 31, 2022, transfer agent expenses incurred by the Fund and any reimbursements, pursuant to the aforementioned Transfer Agency expense limitation agreement, were as follows:
| Class | Expense | Waived |
| Class A | $91,070 | $— |
| Investor Class | 58,801 | — |
| Class B | 4,417 | — |
| Class C | 12,560 | — |
| Class I | 5,679 | — |
(E) Small Account Fee. Shareholders with small accounts adversely impact the cost of providing transfer agency services. In an effort to reduce total transfer agency expenses, the Fund has implemented a small account fee on certain types of accounts. As described in the Fund's prospectus, certain shareholders with an account balance of less than $1,000 ($5,000 for Class A share accounts) are charged an annual per account fee of $20 (assessed semi-annually), the proceeds from which
offset transfer agent fees as reflected in the Statement of Operations. This small account fee will not apply to certain types of accounts as described further in the Fund’s prospectus.
Note 4-Federal Income Tax
As of October 31, 2022, the cost and unrealized appreciation (depreciation) of the Fund’s investment portfolio, including applicable derivative contracts and other financial instruments, as determined on a federal income tax basis, were as follows:
| | Federal Tax
Cost | Gross
Unrealized
Appreciation | Gross
Unrealized
(Depreciation) | Net
Unrealized
Appreciation/
(Depreciation) |
| Investments in Securities | $83,295,931 | $58,102 | $(23,095,430) | $(23,037,328) |
As of October 31, 2022, the components of accumulated gain (loss) on a tax basis were as follows:
Ordinary
income | Accumulated
Capital
and Other
Gain (Loss) | Other
Temporary
Differences | Unrealized
Appreciation
(Depreciation) | Total
Accumulated
Gain (Loss) |
| $— | $(25,637,821) | $(2,702,476) | $(23,047,089) | $(51,387,386) |
The difference between book-basis and tax-basis unrealized appreciation (depreciation) is primarily due to wash sale adjustments. The other temporary differences are primarily due to interest accruals on defaulted securities.
As of October 31, 2022, for federal income tax purposes, capital loss carryforwards of $25,637,821, as shown in the table below, were available to the extent provided by the regulations to offset future realized gains of the Fund. Accordingly, no capital gains distributions are expected to be paid to shareholders until net gains have been realized in excess of such amounts.
Capital Loss
Available Through | Short-Term
Capital Loss
Amounts (000’s) | Long-Term
Capital Loss
Amounts (000’s) |
| Unlimited | $10,358 | $15,280 |
During the years ended October 31, 2022 and October 31, 2021, the tax character of distributions paid as reflected in the Statements of Changes in Net Assets was as follows:
| | 2022 | 2021 |
| Distributions paid from: | | |
| Ordinary Income | $4,543,692 | $5,220,434 |
| Return of Capital | 348,479 | — |
| Total | $4,892,171 | $5,220,434 |
| 32 | MainStay Candriam Emerging Markets Debt Fund |
Note 5–Custodian
JPMorgan is the custodian of cash and securities held by the Fund. Custodial fees are charged to the Fund based on the Fund's net assets and/or the market value of securities held by the Fund and the number of certain transactions incurred by the Fund.
Note 6–Line of Credit
The Fund and certain other funds managed by New York Life Investments maintain a line of credit with a syndicate of banks in order to secure a source of funds for temporary purposes to meet unanticipated or excessive redemption requests.
Effective July 26, 2022, under the credit agreement (the “Credit Agreement”), the aggregate commitment amount is $600,000,000 with an additional uncommitted amount of $100,000,000. The commitment fee is an annual rate of 0.15% of the average commitment amount payable quarterly, regardless of usage, to JPMorgan, who serves as the agent to the syndicate. The commitment fee is allocated among the Fund and certain other funds managed by New York Life Investments based upon their respective net assets and other factors. Interest on any revolving credit loan is charged based upon the Federal Funds Rate, Daily Simple Secured Overnight Financing Rate ("SOFR") + 0.10%, or the Overnight Bank Funding Rate, whichever is higher. The Credit Agreement expires on July 25, 2023, although the Fund, certain other funds managed by New York Life Investments and the syndicate of banks may renew the Credit Agreement for an additional year on the same or different terms or enter into a credit agreement with a different syndicate of banks. Prior to July 26, 2022, the aggregate commitment amount and the commitment fee were the same as those under the current Credit Agreement. During the year ended October 31, 2022, there were no borrowings made or outstanding with respect to the Fund under the Credit Agreement.
Note 7–Interfund Lending Program
Pursuant to an exemptive order issued by the SEC, the Fund, along with certain other funds managed by New York Life Investments, may participate in an interfund lending program. The interfund lending program provides an alternative credit facility that permits the Fund and certain other funds managed by New York Life Investments to lend or borrow money for temporary purposes directly to or from one another, subject to the conditions of the exemptive order. During the year ended October 31, 2022, there were no interfund loans made or outstanding with respect to the Fund.
Note 8–Purchases and Sales of Securities (in 000’s)
During the year ended October 31, 2022, purchases and sales of securities, other than short-term securities, were $84,338 and $100,191, respectively.
Note 9–Capital Share Transactions
Transactions in capital shares for the years ended October 31, 2022 and October 31, 2021, were as follows:
| Class A | Shares | Amount |
| Year ended October 31, 2022: | | |
| Shares sold | 1,316,634 | $ 10,780,850 |
| Shares issued to shareholders in reinvestment of distributions | 441,165 | 3,682,467 |
| Shares redeemed | (3,131,520) | (25,516,770) |
| Net increase (decrease) in shares outstanding before conversion | (1,373,721) | (11,053,453) |
| Shares converted into Class A (See Note 1) | 26,691 | 222,143 |
| Shares converted from Class A (See Note 1) | (813) | (7,369) |
| Net increase (decrease) | (1,347,843) | $(10,838,679) |
| Year ended October 31, 2021: | | |
| Shares sold | 713,529 | $ 7,173,220 |
| Shares issued to shareholders in reinvestment of distributions | 375,840 | 3,784,034 |
| Shares redeemed | (1,340,827) | (13,453,470) |
| Net increase (decrease) in shares outstanding before conversion | (251,458) | (2,496,216) |
| Shares converted into Class A (See Note 1) | 134,443 | 1,350,648 |
| Net increase (decrease) | (117,015) | $ (1,145,568) |
| |
| Investor Class | Shares | Amount |
| Year ended October 31, 2022: | | |
| Shares sold | 24,505 | $ 206,699 |
| Shares issued to shareholders in reinvestment of distributions | 69,037 | 581,267 |
| Shares redeemed | (155,502) | (1,297,451) |
| Net increase (decrease) in shares outstanding before conversion | (61,960) | (509,485) |
| Shares converted into Investor Class (See Note 1) | 21,430 | 177,592 |
| Shares converted from Investor Class (See Note 1) | (15,482) | (131,527) |
| Net increase (decrease) | (56,012) | $ (463,420) |
| Year ended October 31, 2021: | | |
| Shares sold | 40,079 | $ 408,621 |
| Shares issued to shareholders in reinvestment of distributions | 57,221 | 582,738 |
| Shares redeemed | (157,005) | (1,594,511) |
| Net increase (decrease) in shares outstanding before conversion | (59,705) | (603,152) |
| Shares converted into Investor Class (See Note 1) | 58,165 | 584,574 |
| Shares converted from Investor Class (See Note 1) | (89,102) | (911,035) |
| Net increase (decrease) | (90,642) | $ (929,613) |
| |
Notes to Financial Statements (continued)
| Class B | Shares | Amount |
| Year ended October 31, 2022: | | |
| Shares sold | 1,003 | $ 8,854 |
| Shares issued to shareholders in reinvestment of distributions | 4,123 | 34,222 |
| Shares redeemed | (36,379) | (276,405) |
| Net increase (decrease) in shares outstanding before conversion | (31,253) | (233,329) |
| Shares converted from Class B (See Note 1) | (23,894) | (189,763) |
| Net increase (decrease) | (55,147) | $ (423,092) |
| Year ended October 31, 2021: | | |
| Shares sold | 841 | $ 8,312 |
| Shares issued to shareholders in reinvestment of distributions | 4,840 | 47,946 |
| Shares redeemed | (44,755) | (440,956) |
| Net increase (decrease) in shares outstanding before conversion | (39,074) | (384,698) |
| Shares converted from Class B (See Note 1) | (28,531) | (281,622) |
| Net increase (decrease) | (67,605) | $ (666,320) |
| |
| Class C | Shares | Amount |
| Year ended October 31, 2022: | | |
| Shares sold | 11,855 | $ 96,489 |
| Shares issued to shareholders in reinvestment of distributions | 13,736 | 114,445 |
| Shares redeemed | (182,507) | (1,497,503) |
| Net increase (decrease) in shares outstanding before conversion | (156,916) | (1,286,569) |
| Shares converted from Class C (See Note 1) | (9,547) | (78,445) |
| Net increase (decrease) | (166,463) | $ (1,365,014) |
| Year ended October 31, 2021: | | |
| Shares sold | 31,829 | $ 312,265 |
| Shares issued to shareholders in reinvestment of distributions | 19,879 | 197,409 |
| Shares redeemed | (268,085) | (2,624,073) |
| Net increase (decrease) in shares outstanding before conversion | (216,377) | (2,114,399) |
| Shares converted from Class C (See Note 1) | (76,752) | (742,565) |
| Net increase (decrease) | (293,129) | $ (2,856,964) |
| |
| Class I | Shares | Amount |
| Year ended October 31, 2022: | | |
| Shares sold | 238,664 | $ 1,864,518 |
| Shares issued to shareholders in reinvestment of distributions | 30,376 | 251,287 |
| Shares redeemed | (329,923) | (2,860,046) |
| Net increase (decrease) in shares outstanding before conversion | (60,883) | (744,241) |
| Shares converted into Class I (See Note 1) | 812 | 7,369 |
| Net increase (decrease) | (60,071) | $ (736,872) |
| Year ended October 31, 2021: | | |
| Shares sold | 241,535 | $ 2,435,828 |
| Shares issued to shareholders in reinvestment of distributions | 33,069 | 333,338 |
| Shares redeemed | (367,578) | (3,679,156) |
| Net increase (decrease) | (92,974) | $ (909,990) |
Note 10–Other Matters
As of the date of this report, interest rates in the United States and many parts of the world, including certain European countries, are ascending from historically low levels. Thus, the Fund currently faces a heightened level of risk associated with rising interest rates. This could be driven by a variety of factors, including but not limited to central bank monetary policies, changing inflation or real growth rates, general economic conditions, increasing bond issuances or reduced market demand for low yielding investments.
An outbreak of COVID-19, first detected in December 2019, has developed into a global pandemic and has resulted in travel restrictions, closure of international borders, certain businesses and securities markets, restrictions on securities trading activities, prolonged quarantines, supply chain disruptions, and lower consumer demand, as well as general concern and uncertainty. In 2022, many countries lifted some or all restrictions related to COVID-19. However, the continued impact of COVID-19 and related variants is uncertain and could further adversely affect the global economy, national economies, individual issuers and capital markets in unforeseeable ways and result in a substantial and extended economic downturn. Developments that disrupt global economies and financial markets, such as COVID-19, may magnify factors that affect the Fund's performance.
Note 11–Subsequent Events
In connection with the preparation of the financial statements of the Fund as of and for the year ended October 31, 2022, events and transactions subsequent to October 31, 2022, through the date the financial statements were issued have been evaluated by the Manager for possible adjustment and/or disclosure. No subsequent events requiring financial statement adjustment or disclosure have been identified.
| 34 | MainStay Candriam Emerging Markets Debt Fund |
Report of Independent Registered Public Accounting Firm
To the Shareholders of the Fund and Board of Trustees
The MainStay Funds:
Opinion on the Financial Statements
We have audited the accompanying statement of assets and liabilities of MainStay Candriam Emerging Markets Debt Fund (the Fund), one of the funds constituting The MainStay Funds, including the portfolio of investments, as of October 31, 2022, the related statement of operations for the year then ended, the statements of changes in net assets for each of the years in the two-year period then ended, and the related notes (collectively, the financial statements) and the financial highlights for each of the years in the five-year period then ended. In our opinion, the financial statements and financial highlights present fairly, in all material respects, the financial position of the Fund as of October 31, 2022, the results of its operations for the year then ended, the changes in its net assets for each of the years in the two-year period then ended, and the financial highlights for each of the years in the five-year period then ended, in conformity with U.S. generally accepted accounting principles.
Basis for Opinion
These financial statements and financial highlights are the responsibility of the Fund's management. Our responsibility is to express an opinion on these financial statements and financial highlights based on our audits. We are a public accounting firm registered with the Public Company Accounting Oversight Board (United States) (PCAOB) and are required to be independent with respect to the Fund in accordance with the U.S. federal securities laws and the applicable rules and regulations of the Securities and Exchange Commission and the PCAOB.
We conducted our audits in accordance with the standards of the PCAOB. Those standards require that we plan and perform the audit to obtain reasonable assurance about whether the financial statements and financial highlights are free of material misstatement, whether due to error or fraud. Our audits included performing procedures to assess the risks of material misstatement of the financial statements and financial highlights, whether due to error or fraud, and performing procedures that respond to those risks. Such procedures included examining, on a test basis, evidence regarding the amounts and disclosures in the financial statements and financial highlights. Such procedures also included confirmation of securities owned as of October 31, 2022, by correspondence with custodians and brokers; when replies were not received from brokers, we performed other auditing procedures. Our audits also included evaluating the accounting principles used and significant estimates made by management, as well as evaluating the overall presentation of the financial statements and financial highlights. We believe that our audits provide a reasonable basis for our opinion.

We have served as the auditor of one or more New York Life Investment Management investment companies since 2003.
Philadelphia, Pennsylvania
December 23, 2022
Federal Income Tax Information
(Unaudited)
The Fund is required under the Internal Revenue Code to advise shareholders in a written statement as to the federal tax status of dividends paid by the Fund during such fiscal years.
In February 2023, shareholders will receive an IRS Form 1099-DIV or substitute Form 1099, which will show the federal tax status of the distributions received by shareholders in calendar year 2022. The amounts that will be reported on such 1099-DIV or substitute Form 1099 will be the amounts you are to use on your federal income tax return and will differ from the amounts which we must report for the Fund's fiscal year ended October 31, 2022.
Proxy Voting Policies and Procedures and Proxy Voting Record
The Fund is required to file with the SEC its proxy voting record for the 12-month period ending June 30 on Form N-PX. A description of the policies and procedures that are used to vote proxies relating to portfolio securities of the Fund is available free of charge upon request by calling 800-624-6782 or visiting the SEC’s website at www.sec.gov. The most recent Form N-PX or proxy voting record is available free of charge upon request by calling 800-624-6782; visiting newyorklifeinvestments.com; or visiting the SEC’s website at www.sec.gov.
Shareholder Reports and Quarterly Portfolio Disclosure
The Fund is required to file its complete schedule of portfolio holdings with the SEC 60 days after its first and third fiscal quarter on Form N-PORT. The Fund's holdings report is available free of charge upon request by calling New York Life Investments at 800-624-6782.
| 36 | MainStay Candriam Emerging Markets Debt Fund |
Board of Trustees and Officers (Unaudited)
The Trustees and officers of the Fund are listed below. The Board oversees the MainStay Group of Funds (which consists of MainStay Funds and MainStay Funds Trust), MainStay VP Funds Trust, MainStay MacKay DefinedTerm Municipal Opportunities Fund, MainStay CBRE Global Infrastructure Megatrends Fund, the Manager and the Subadvisors, and elects the officers of the Funds who are responsible for the day-to-day operations of the Fund. Information pertaining to the Trustees and officers is set forth below. Each Trustee serves until his or her successor is
elected and qualified or until his or her resignation, death or removal. Under the Board’s retirement policy, unless an exception is made, a Trustee must tender his or her resignation by the end of the calendar year during which he or she reaches the age of 75. The business address of each Trustee and officer listed below is 51 Madison Avenue, New York, New York 10010. None of the Trustees are “interested persons” (as defined by the 1940 Act and rules adopted by the SEC thereunder) of the Fund (“Independent Trustees”).
| | Name and
Year of Birth | Term of Office,
Position(s) Held and
Length of Service | Principal Occupation(s)
During Past Five Years | Number of
Portfolios in
Fund Complex
Overseen by
Trustee | Other Directorships
Held by Trustee |
| | | | | | |
| | David H. Chow
1957 | MainStay Funds: Trustee since 2016, Advisory Board Member (June 2015 to December 2015);MainStay Funds Trust:
Trustee since January 2016, Advisory Board Member (June 2015 to December 2015) | Founder and CEO, DanCourt Management, LLC since 1999 | 78 | MainStay VP Funds Trust: Trustee since January 2016, Advisory Board Member (June 2015 to December 2015) (31 portfolios);
MainStay MacKay DefinedTerm Municipal Opportunities Fund: Trustee since January 2016, Advisory Board Member (June 2015 to December 2015);
MainStay CBRE Global Infrastructure Megatrends Fund: Trustee since June 2021; VanEck Vectors Group of Exchange-Traded Funds: Independent Chairman of the Board of Trustees since 2008 and Trustee since 2006 (56 portfolios); and Berea College of Kentucky: Trustee since 2009, Chair of the Investment Committee since 2018 |
| | Susan B. Kerley
1951 | MainStay Funds: Chairman since 2017 and Trustee since 2007;MainStay Funds Trust:
Chairman since 2017 and Trustee since 1990** | President, Strategic Management Advisors LLC since 1990 | 78 | MainStay VP Funds Trust: Chairman since January 2017 and Trustee since 2007 (31 portfolios)**;
MainStay MacKay DefinedTerm Municipal Opportunities Fund: Chairman since 2017 and Trustee since 2011;
MainStay CBRE Global Infrastructure Megatrends Fund: Trustee since June 2021; and Legg Mason Partners Funds: Trustee since 1991 (45 portfolios) |
| | Alan R. Latshaw
1951 | MainStay Funds: Trustee since 2006;MainStay Funds Trust:
Trustee since 2007*** | Retired; Partner, Ernst & Young LLP (2002 to 2003); Partner, Arthur Andersen LLP (1989 to 2002); Consultant to the MainStay Funds Audit and Compliance Committee (2004 to 2006) | 78 | MainStay VP Funds Trust: Trustee since 2007 (31 portfolios)**;
MainStay MacKay DefinedTerm Municipal Opportunities Fund: Trustee since 2011; and
MainStay CBRE Global Infrastructure Megatrends Fund: Trustee since June 2021 |
Board of Trustees and Officers (Unaudited) (continued)
| | Name and
Year of Birth | Term of Office,
Position(s) Held and
Length of Service | Principal Occupation(s)
During Past Five Years | Number of
Portfolios in
Fund Complex
Overseen by
Trustee | Other Directorships
Held by Trustee |
| | | | | | |
| | Karen Hammond
1956 | MainStay Funds: Trustee since December 2021, Advisory Board Member (June 2021 to December 2021);MainStay Funds Trust:
Trustee since December 2021, Advisory Board Member (June 2021 to December 2021)
| Retired, Managing Director, Devonshire Investors (2007 to 2013); Senior Vice President, Fidelity Management & Research Co. (2005 to 2007); Senior Vice President and Corporate Treasurer, FMR Corp. (2003 to 2005); Chief Operating Officer, Fidelity Investments Japan (2001 to 2003) | 78 | MainStay VP Funds Trust: Trustee since December 2021, Advisory Board Member (June 2021 to December 2021) (31 Portfolios);
MainStay MacKay DefinedTerm Municipal Opportunities Fund: Trustee since December 2021, Advisory Board Member (June 2021 to December 2021);
MainStay CBRE Global Infrastructure Megatrends Fund: Trustee since December 2021, Advisory Board Member (June 2021 to December 2021);
Two Harbors Investment Corp.: Director since 2018;
Rhode Island State Investment Commission: Member since 2017; and
Blue Cross Blue Shield of Rhode Island: Director since 2019 |
| | Jacques P. Perold
1958 | MainStay Funds: Trustee since 2016, Advisory Board Member (June 2015 toDecember 2015);MainStay Funds Trust:
Trustee since January 2016, Advisory Board Member (June 2015 to December 2015) | Founder and Chief Executive Officer, CapShift Advisors LLC (since 2018); President, Fidelity Management & Research Company (2009 to 2014); President and Chief Investment Officer, Geode Capital Management, LLC (2001 to 2009) | 78 | MainStay VP Funds Trust: Trustee since January 2016, Advisory Board Member (June 2015 to December 2015) (31 portfolios);
MainStay MacKay DefinedTerm Municipal Opportunities Fund: Trustee since January 2016, Advisory Board Member (June 2015 to December 2015);
MainStay CBRE Global Infrastructure Megatrends Fund: Trustee since June 2021; Partners in Health: Trustee since 2019; Allstate Corporation: Director since 2015; and MSCI Inc.: Director since 2017 |
| | Richard S. Trutanic
1952 | MainStay Funds: Trustee since 1994;MainStay Funds Trust:
Trustee since 2007*** | Chairman and Chief Executive Officer, Somerset & Company (financial advisory firm) since 2004; Managing Director, The Carlyle Group (private investment firm) (2002 to 2004); Senior Managing Director, Partner and Board Member, Groupe Arnault S.A. (private investment firm) (1999 to 2002) | 78 | MainStay VP Funds Trust: Trustee since 2007 (31 portfolios)**;
MainStay MacKay DefinedTerm Municipal Opportunities Fund: Trustee since 2011; and MainStay CBRE Global Infrastructure Megatrends Fund: Trustee since June 2021 |
| ** | Includes prior service as a Director of MainStay VP Series Fund, Inc., the predecessor to MainStay VP Funds Trust. |
| *** | Includes prior service as a Director/Trustee of certain predecessor entities to MainStay Funds Trust. |
| 38 | MainStay Candriam Emerging Markets Debt Fund |
| | Name and
Year of Birth | Position(s) Held and
Length of Service | Principal Occupation(s)
During Past Five Years | |
| | | | | |
| | Kirk C. Lehneis
1974 | President, MainStay Funds, MainStay Funds Trust since 2017 | Chief Operating Officer and Senior Managing Director (since 2016), New York Life Investment Management LLC and New York Life Investment Management Holdings LLC; Member of the Board of Managers (since 2017) and Senior Managing Director (since 2018), NYLIFE Distributors LLC; Chairman of the Board and Senior Managing Director, NYLIM Service Company LLC (since 2017); Trustee, President and Principal Executive Officer of IndexIQ Trust, IndexIQ ETF Trust and IndexIQ Active ETF Trust (since January 2018); President, MainStay CBRE Global Infrastructure Megatrends Fund (since 2021), MainStay MacKay DefinedTerm Municipal Opportunities Fund and MainStay VP Funds Trust (since 2017); Senior Managing Director, Global Product Development (From 2015-2016); Managing Director, Product Development (2010 to 2015), New York Life Investment Management LLC | |
| | Jack R. Benintende
1964 | Treasurer and Principal Financial and Accounting Officer, MainStay Funds (since 2007), MainStay Funds Trust (since 2009) | Managing Director, New York Life Investment Management LLC (since 2007); Treasurer and Principal Financial and Accounting Officer, MainStay CBRE Global Infrastructure Megatrends Fund (since 2021), MainStay MacKay DefinedTerm Municipal Opportunities Fund (since 2011) and MainStay VP Funds Trust (since 2007)** and Assistant Treasurer, New York Life Investment Management Holdings LLC (2008 to 2012) | |
| | J. Kevin Gao
1967 | Secretary and Chief Legal Officer, MainStay Funds and MainStay Funds Trust (since 2010) | Managing Director and Associate General Counsel, New York Life Investment Management LLC (since 2010); Secretary and Chief Legal Officer and MainStay CBRE Global Infrastructure Megatrends Fund (since 2021), MainStay MacKay DefinedTerm Municipal Opportunities Fund (since 2011) and MainStay VP Funds Trust (since 2010)** | |
| | Scott T. Harrington
1959 | Vice President— Administration, MainStay Funds (since 2009), MainStay Funds Trust (since 2009) | Managing Director, New York Life Investment Management LLC (including predecessor advisory organizations) (since 2000); Member of the Board of Directors, New York Life Trust Company (since 2009); Vice President—Administration, MainStay CBRE Global Infrastructure Megatrends Fund (since 2021), MainStay MacKay DefinedTerm Municipal Opportunities Fund (since 2011) and MainStay VP Funds Trust (since 2005)** | |
| | Kevin M. Gleason
1967 | Vice President and Chief Compliance Officer, MainStay Funds and MainStay Funds Trust (since June 2022) | Vice President and Chief Compliance Officer, IndexIQ, IndexIQ ETF Trust and Index IQ Active ETF Trust (since June 2022); Vice President and Chief Compliance Officer, MainStay CBRE Global Infrastructure Megatrends Fund, MainStay VP Funds Trust and MainStay MacKay DefinedTerm Municipal Opportunities Fund (since June 2022); Senior Vice President, Voya Investment Management and Chief Compliance Officer, Voya Family of Funds (2012-2022) | |
| * | The officers listed above are considered to be “interested persons” of the MainStay Group of Funds, MainStay VP Funds Trust, MainStay CBRE Global Infrastructure Megatrends Fund and MainStay MacKay DefinedTerm Municipal Opportunities Fund within the meaning of the 1940 Act because of their affiliation with the MainStay Group of Funds, New York Life Insurance Company and/or its affiliates, including New York Life Investment Management LLC, NYLIM Service Company LLC, NYLIFE Securities LLC and/or NYLIFE Distributors LLC, as described in detail in the column captioned “Principal Occupation(s) During Past Five Years.” Officers are elected annually by the Board. |
| ** | Includes prior service as an Officer of MainStay VP Series Fund, Inc., the predecessor to MainStay VP Funds Trust. |
Officers of the Trust (Who are not Trustees)*
This page intentionally left blank.
This page intentionally left blank.
This page intentionally left blank.
Equity
U.S. Equity
MainStay Epoch U.S. Equity Yield Fund
MainStay S&P 500 Index Fund1
MainStay Winslow Large Cap Growth Fund
MainStay WMC Enduring Capital Fund
MainStay WMC Growth Fund
MainStay WMC Small Companies Fund
MainStay WMC Value Fund
International Equity
MainStay Epoch International Choice Fund
MainStay MacKay International Equity Fund
MainStay WMC International Research Equity Fund
Emerging Markets Equity
MainStay Candriam Emerging Markets Equity Fund
Global Equity
MainStay Epoch Capital Growth Fund
MainStay Epoch Global Equity Yield Fund
Fixed Income
Taxable Income
MainStay Candriam Emerging Markets Debt Fund
MainStay Floating Rate Fund
MainStay MacKay High Yield Corporate Bond Fund
MainStay MacKay Short Duration High Yield Fund
MainStay MacKay Strategic Bond Fund
MainStay MacKay Total Return Bond Fund
MainStay MacKay U.S. Infrastructure Bond Fund
MainStay Short Term Bond Fund
Tax-Exempt Income
MainStay MacKay California Tax Free Opportunities Fund2
MainStay MacKay High Yield Municipal Bond Fund
MainStay MacKay New York Tax Free Opportunities Fund3
MainStay MacKay Short Term Municipal Fund
MainStay MacKay Strategic Municipal Allocation Fund
MainStay MacKay Tax Free Bond Fund
Money Market
MainStay Money Market Fund
Mixed Asset
MainStay Balanced Fund
MainStay Income Builder Fund
MainStay MacKay Convertible Fund
Speciality
MainStay CBRE Global Infrastructure Fund
MainStay CBRE Real Estate Fund
MainStay Cushing MLP Premier Fund
Asset Allocation
MainStay Conservative Allocation Fund
MainStay Conservative ETF Allocation Fund
MainStay Defensive ETF Allocation Fund
MainStay Equity Allocation Fund
MainStay Equity ETF Allocation Fund
MainStay ESG Multi-Asset Allocation Fund
MainStay Growth Allocation Fund
MainStay Growth ETF Allocation Fund
MainStay Moderate Allocation Fund
MainStay Moderate ETF Allocation Fund
Manager
New York Life Investment Management LLC
New York, New York
Subadvisors
Candriam4
Strassen, Luxembourg
CBRE Investment Management Listed Real Assets LLC
Radnor, Pennsylvania
Cushing Asset Management, LP
Dallas, Texas
Epoch Investment Partners, Inc.
New York, New York
MacKay Shields LLC4
New York, New York
NYL Investors LLC4
New York, New York
Wellington Management Company LLP
Boston, Massachusetts
Winslow Capital Management, LLC
Minneapolis, Minnesota
Legal Counsel
Dechert LLP
Washington, District of Columbia
Independent Registered Public Accounting Firm
KPMG LLP
Philadelphia, Pennsylvania
Distributor
NYLIFE Distributors LLC4
Jersey City, New Jersey
Custodian
JPMorgan Chase Bank, N.A.
New York, New York
1.
Prior to February 28, 2022, the Fund's name was MainStay MacKay S&P 500 Index Fund.
| 2. | This Fund is registered for sale in AZ, CA, NV, OR, TX, UT, WA and MI (Class A and Class I shares only), and CO, FL, GA, HI, ID, MA, MD, NH, NJ and NY (Class I shares only). |
| 3. | This Fund is registered for sale in CA, CT, DE, FL, MA, NJ, NY and VT. |
| 4. | An affiliate of New York Life Investment Management LLC. |
Not part of the Annual Report
For more information
800-624-6782
newyorklifeinvestments.com
“New York Life Investments” is both a service mark, and the common trade name, of certain investment advisors affiliated with New York Life Insurance Company. The MainStay Funds® are managed by New York Life Investment Management LLC and distributed by NYLIFE Distributors LLC, 30 Hudson Street, Jersey City, NJ 07302, a wholly owned subsidiary of New York Life Insurance Company. NYLIFE Distributors LLC is a Member FINRA/SIPC.
©2022 NYLIFE Distributors LLC. All rights reserved.
| 5013921.2MS229-22 | MSCEMD11-12/22 |
(NYLIM) NL218
MainStay Income Builder Fund
Message from the President and Annual Report
October 31, 2022
Sign up for e-delivery of your shareholder reports. For full details on e-delivery, including who can participate and what you can receive via e-delivery,
please log in to newyorklifeinvestments.com/accounts.
| Not FDIC/NCUA Insured | Not a Deposit | May Lose Value | No Bank Guarantee | Not Insured by Any Government Agency |
This page intentionally left blank
Message from the President
A series of economic and geopolitical challenges undermined equity and fixed-income markets during the 12-month reporting period ended October 31, 2022. Stocks and bonds alike trended lower in the face of sharply rising interest rates, increasing inflationary pressures, slowing economic growth and Russia’s invasion of Ukraine.
The reporting period began on a mixed note, with concerns about the spreading Omicron variant of the COVID-19 virus and increasingly hawkish statements from the U.S. Federal Reserve (the “Fed”) regarding mounting inflation, countered by bullish sentiment stemming from U.S. economic growth and strong corporate earnings. In January 2022, markets turned decisively negative as comments from the Fed raised the likelihood of rate hikes as early as March, and Russia issued increasingly aggressive threats toward Ukraine. The onset of Russia’s invasion in February exacerbated global inflationary pressures while increasing investor uncertainty. Domestic supply shortages, international trade imbalances and rising inflation caused GDP (gross domestic product) to contract in the first and second quarters of the year, although employment and consumer spending proved resilient. Prices for petroleum surged to multi-year highs, while many key agricultural chemicals and industrial metals climbed as well. Accelerating inflationary forces prompted the Fed to implement its most aggressive interest rate increases since the 1980s with a series of five sharp rate hikes, raising the federal funds rate from a range of 0.00% to 0.25% in March to 3.00% to 3.25% in September, with additional rate hikes expected before the end of the year. International central banks generally followed suit, raising rates by varying degrees in efforts to curb local inflation, although most increases remained significantly more modest than those in the United States. Relatively high U.S. interest rates and risk-averse international sentiment pushed U.S. dollar values higher compared to most other currencies, with the ensuing negative impact on global prices for food, fuel and other key, U.S.-dollar-denominated products.
The effects of these interrelated challenges were felt throughout U.S. and international financial markets. The S&P 500® Index, a widely regarded benchmark of U.S. market performance, declined by more than 14% during the reporting period. Although the energy sector generated strong gains, bolstered by elevated oil and gas prices, most other industry areas recorded losses. The more cyclical and growth-oriented sectors of consumer discretionary, real estate and information technology delivered the
weakest returns, while the traditionally defensive and value-oriented consumer staples, utilities and health care sectors outperformed. International stocks lagged compared to their U.S. counterparts, with some emerging markets, such as China, suffering particularly steep losses. A few markets, however, including Brazil, Mexico and the United Arab Emirates, ended the reporting period with little change. Fixed-income markets saw bond prices broadly decline as yields rose along with interest rates. Short-term yields rose faster than long-term yields, producing a yield curve inversion from July through the end of the reporting period, with long-term rates remaining below short-term rates. While floating-rate instruments, which feature variable interest rates that allow investors to benefit from a rising rate environment, provided a degree of insulation from inflation-driven trends, they were not immune to the market’s widespread declines.
While the Fed acknowledges the costs of rising rates in terms of weaker GDP growth and unsettled financial markets over the short term, its primary focus continues to be the longer-term economic impact of inflation. With the latest figures as of the date of this report showing that inflation remains above 8%, versus a target rate of just 2%, the Fed clearly has a distance yet to go, making further rate increases and market volatility more likely in the coming months. The question remains as to whether the Fed and other central banks will manage a so-called “soft landing,” curbing inflation while avoiding a persistent economic slowdown. If they prove successful, we expect that favorable inflation trends and increasingly attractive valuations in both equity and bond markets should eventually translate into sustainable improvements in the investment environment.
Whatever actions the Fed takes and however financial markets react, as a MainStay investor, you can depend on us to continue providing the insight, expertise and service that have long defined New York Life Investments. Thank you for trusting us to help you meet your investment needs.
Sincerely,
Kirk C. Lehneis
President
The opinions expressed are as of the date of this report and are subject to change. There is no guarantee that any forecast made will come to pass. This material does not constitute investment advice and is not intended as an endorsement of any specific investment. Past performance is no guarantee of future results.
Not part of the Annual Report
Investors should refer to the Fund’s Summary Prospectus and/or Prospectus and consider the Fund’s investment objectives, strategies, risks, charges and expenses carefully before investing. The Summary Prospectus and/or Prospectus contain this and other information about the Fund. You may obtain copies of the Fund’s Summary Prospectus, Prospectus and Statement of Additional Information, which includes information about The MainStay Funds' Trustees, free of charge, upon request, by calling toll-free 800-624-6782, by writing to NYLIFE Distributors LLC, Attn: MainStay Marketing Department, 30 Hudson Street, Jersey City, NJ 07302 or by sending an e-mail to MainStayShareholderServices@nylim.com. These documents are also available via the MainStay Funds’ website at newyorklifeinvestments.com. Please read the Fund’s Summary Prospectus and/or Prospectus carefully before investing.
Investment and Performance Comparison (Unaudited)
Performance data quoted represents past performance. Past performance is no guarantee of future results. Because of market volatility and other factors, current performance may be lower or higher than the figures shown. Investment return and principal value will fluctuate, and as a result, when shares are redeemed, they may be worth more or less than their original cost. The graph below depicts the historical performance of Class I shares of the Fund. Performance will vary from class to class based on differences in class-specific expenses and sales charges. For performance information current to the most recent month-end, please call 800-624-6782 or visit newyorklifeinvestments.com.
The performance table and graph do not reflect the deduction of taxes that a shareholder would pay on distributions or Fund share redemptions. Total returns reflect maximum applicable sales charges as indicated in the table below, if any, changes in share price, and reinvestment of dividend and capital gain distributions. The graph assumes the initial investment amount shown below and reflects the deduction of all sales charges that would have applied for the period of investment. Performance figures may reflect certain fee waivers and/or expense limitations, without which total returns may have been lower. For more information on share classes and current fee waivers and/or expense limitations (if any), please refer to the Notes to Financial Statements.
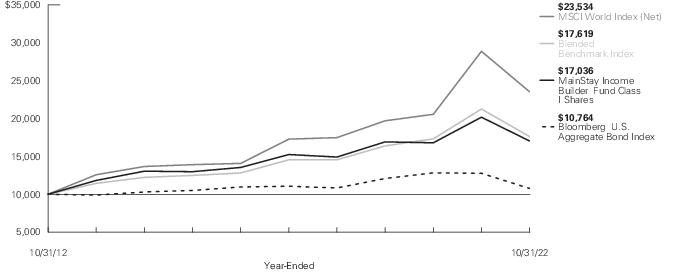
| Average Annual Total Returns for the Year-Ended October 31, 2022 |
| Class | Sales Charge | | Inception
Date | One
Year | Five
Years | Ten Years
or Since
Inception | Gross
Expense
Ratio1 |
| Class A Shares2 | Maximum 3% Initial Sales Charge | With sales charges | 1/3/1995 | -18.28% | 0.84% | 4.61% | 0.99% |
| | | Excluding sales charges | | -15.75 | 1.99 | 5.20 | 0.99 |
| Investor Class Shares3 | Maximum 2.5% Initial Sales Charge | With sales charges | 2/28/2008 | -17.99 | 0.68 | 4.43 | 1.18 |
| | | Excluding sales charges | | -15.89 | 1.83 | 5.03 | 1.18 |
| Class B Shares4 | Maximum 5% CDSC | With sales charges | 12/29/1987 | -20.46 | 0.74 | 4.24 | 1.93 |
| | if Redeemed Within the First Six Years of Purchase | Excluding sales charges | | -16.56 | 1.07 | 4.24 | 1.93 |
| Class C Shares | Maximum 1% CDSC | With sales charges | 9/1/1998 | -17.33 | 1.06 | 4.24 | 1.93 |
| | if Redeemed Within One Year of Purchase | Excluding sales charges | | -16.55 | 1.06 | 4.24 | 1.93 |
| Class I Shares | No Sales Charge | | 1/2/2004 | -15.55 | 2.25 | 5.47 | 0.74 |
| Class R2 Shares | No Sales Charge | | 2/27/2015 | -15.84 | 1.90 | 2.75 | 1.09 |
| Class R3 Shares | No Sales Charge | | 2/29/2016 | -16.09 | 1.64 | 4.34 | 1.34 |
| Class R6 Shares | No Sales Charge | | 2/28/2018 | -15.48 | N/A | 2.83 | 0.66 |
| SIMPLE Class Shares | No Sales Charge | | 8/31/2020 | -16.10 | N/A | -1.55 | 1.43 |
| 1. | The gross expense ratios presented reflect the Fund’s “Total Annual Fund Operating Expenses” from the most recent Prospectus, as supplemented, and may differ from other expense ratios disclosed in this report. |
| 2. | Prior to November 4, 2019, the maximum initial sales charge applicable was 5.5%, which is reflected in the applicable average annual total return figures shown. |
| 3. | Prior to June 30, 2020, the maximum initial sales charge was 3%, which is reflected in the applicable average annual total return figures shown. |
| 4. | Class B shares are closed to all new purchases as well as additional investments by existing Class B shareholders. |
The footnotes on the next page are an integral part of the table and graph and should be carefully read in conjunction with them.
| Benchmark Performance* | One
Year | Five
Years | Ten
Years |
| MSCI World Index (Net)1 | -18.48% | 6.37% | 8.94% |
| Bloomberg U.S. Aggregate Bond Index2 | -15.68 | -0.54 | 0.74 |
| Blended Benchmark Index3 | -17.10 | 3.90 | 5.83 |
| Morningstar Global Allocation Category Average4 | -15.06 | 1.42 | 3.18 |
| * | Returns for indices reflect no deductions for fees, expenses or taxes, except for foreign withholding taxes where applicable. Results assume reinvestment of all dividends and capital gains. An investment cannot be made directly in an index. |
| 1. | The MSCI World Index (Net) is the Fund's primary broad-based securities market index for comparison purposes. The MSCI World Index (Net) is a free float-adjusted market capitalization weighted index that is designed to measure the equity market performance of developed markets. |
| 2. | The Fund has selected the Bloomberg U.S. Aggregate Bond Index as a secondary benchmark. The Bloomberg U.S. Aggregate Bond Index measures performance of the investment-grade, U.S. dollar-denominated, fixed-rate taxable bond market, including Treasurys, government-related and corporate securities, mortgage-backed securities (agency fixed-rate and hybrid adjustable-rate mortgage pass-throughs), asset-backed securities and commercial mortgage-backed securities. |
| 3. | The Fund has selected the Blended Benchmark Index as an additional benchmark. The Blended Benchmark Index consists of the 60% MSCI World Index and 40% of the Bloomberg U.S. Aggregate Bond Index, respectively. |
| 4. | Global-allocation portfolios seek to provide both capital appreciation and income by investing in three major areas: stocks, bonds, and cash. While these portfolios do explore the whole world, most of them focus on the U.S., Canada, Japan, and the larger markets in Europe. It is rare for such portfolios to invest more than 10% of their assets in emerging markets. These portfolios typically have at least 10% of assets in bonds, less than 70% of assets in stocks, and at least 40% of assets in non-U.S. stocks or bonds. |
The footnotes on the preceding page are an integral part of the table and graph and should be carefully read in conjunction with them.
| 6 | MainStay Income Builder Fund |
Cost in Dollars of a $1,000 Investment in MainStay Income Builder Fund (Unaudited)
The example below is intended to describe the fees and expenses borne by shareholders during the six-month period from May 1, 2022 to October 31, 2022, and the impact of those costs on your investment.
Example
As a shareholder of the Fund you incur two types of costs: (1) transaction costs, including exchange fees and sales charges (loads) on purchases (as applicable), and (2) ongoing costs, including management fees, distribution and/or service (12b-1) fees and other Fund expenses (as applicable). This example is intended to help you understand your ongoing costs (in dollars) of investing in the Fund and to compare these costs with the ongoing costs of investing in other mutual funds. The example is based on an investment of $1,000 made at the beginning of the six-month period and held for the entire period from May 1, 2022 to October 31, 2022.
This example illustrates your Fund’s ongoing costs in two ways:
Actual Expenses
The second and third data columns in the table below provide information about actual account values and actual expenses. You may use the information in these columns, together with the amount you invested, to estimate the expenses that you paid during the six months ended October 31, 2022. Simply divide your account value by $1,000 (for example, an
$8,600 account value divided by $1,000 = 8.6), then multiply the result by the number under the heading entitled “Expenses Paid During Period” to estimate the expenses you paid on your account during this period.
Hypothetical Example for Comparison Purposes
The fourth and fifth data columns in the table below provide information about hypothetical account values and hypothetical expenses based on the Fund’s actual expense ratio and an assumed rate of return of 5% per year before expenses, which is not the Fund’s actual return. The hypothetical account values and expenses may not be used to estimate the actual ending account balances or expenses you paid for the six-month period shown. You may use this information to compare the ongoing costs of investing in the Fund with the ongoing costs of investing in other mutual funds. To do so, compare this 5% hypothetical example with the 5% hypothetical examples that appear in the shareholder reports of the other mutual funds.
Please note that the expenses shown in the table are meant to highlight your ongoing costs only and do not reflect any transactional costs, such as exchange fees or sales charges (loads). Therefore, the fourth and fifth data columns of the table are useful in comparing ongoing costs only and will not help you determine the relative total costs of owning different funds. In addition, if these transactional costs were included, your costs would have been higher.
| Share Class | Beginning
Account
Value
5/1/22 | Ending Account
Value (Based
on Actual
Returns and
Expenses)
10/31/22 | Expenses
Paid
During
Period1 | Ending Account
Value (Based
on Hypothetical
5% Annualized
Return and
Actual Expenses)
10/31/22 | Expenses
Paid
During
Period1 | Net Expense
Ratio
During
Period2 |
| Class A Shares | $1,000.00 | $926.70 | $5.10 | $1,019.91 | $ 5.35 | 1.05% |
| Investor Class Shares | $1,000.00 | $926.00 | $5.97 | $1,019.00 | $ 6.26 | 1.23% |
| Class B Shares | $1,000.00 | $922.40 | $9.55 | $1,015.27 | $10.01 | 1.97% |
| Class C Shares | $1,000.00 | $922.20 | $9.54 | $1,015.27 | $10.01 | 1.97% |
| Class I Shares | $1,000.00 | $927.60 | $3.89 | $1,021.17 | $ 4.08 | 0.80% |
| Class R2 Shares | $1,000.00 | $926.20 | $5.58 | $1,019.41 | $ 5.85 | 1.15% |
| Class R3 Shares | $1,000.00 | $925.10 | $6.79 | $1,018.15 | $ 7.12 | 1.40% |
| Class R6 Shares | $1,000.00 | $928.10 | $3.45 | $1,021.63 | $ 3.62 | 0.71% |
| SIMPLE Class Shares | $1,000.00 | $924.80 | $7.13 | $1,017.79 | $ 7.48 | 1.47% |
| 1. | Expenses are equal to the Fund’s annualized expense ratio of each class multiplied by the average account value over the period, divided by 365 and multiplied by 184 (to reflect the six-month period). The table above represents the actual expenses incurred during the six-month period. In addition to the fees and expenses which the Fund bears directly, it also indirectly bears a pro rata share of the fees and expenses of the underlying funds in which it invests. Such indirect expenses are not included in the above-reported expense figures. |
| 2. | Expenses are equal to the Fund's annualized expense ratio to reflect the six-month period. |
Portfolio Composition as of October 31, 2022 (Unaudited)
See Portfolio of Investments beginning on page 13 for specific holdings within these categories. The Fund's holdings are subject to change.
Top Ten Holdings and/or Issuers Held as of October 31, 2022 (excluding short-term investments) (Unaudited)
| 1. | GNMA, (zero coupon)-3.50%, due 8/16/41–2/20/52 |
| 2. | UMBS, 30 Year, 2.50%-4.00%, due 8/1/48–9/1/52 |
| 3. | FHLMC STACR REMIC Trust, 4.847%-6.747%, due 8/25/33–12/25/50 |
| 4. | U.S. Treasury Bonds, 3.00%-3.375%, due 8/15/42–8/15/52 |
| 5. | Bank of America Corp. |
| 6. | JPMorgan Chase & Co. |
| 7. | Apple, Inc. |
| 8. | Broadcom, Inc. |
| 9. | International Business Machines Corp. |
| 10. | Microsoft Corp. |
| 8 | MainStay Income Builder Fund |
Portfolio Management Discussion and Analysis (Unaudited)
Questions answered by portfolio managers Jae S. Yoon, CFA, and Jonathan Swaney of New York Life Investment Management LLC, the Fund’s Manager; Stephen R. Cianci, CFA, and Neil Moriarty III, of MacKay Shields LLC, the Subadvisor for the fixed-income portion of the Fund; and William W. Priest, CFA, Michael A. Welhoelter, CFA, John Tobin, PhD, CFA, and Kera Van Valen, CFA, of Epoch Investment Partners, Inc., the Subadvisor for the equity portion of the Fund.
How did MainStay Income Builder Fund perform relative to its benchmarks and peer group during the 12 months ended October 31, 2022?
For the 12 months ended October 31, 2022, Class I shares of MainStay Income Builder Fund returned −15.55%, outperforming the −18.48% return of the Fund’s primary benchmark, the MSCI World Index (Net). Over the same period, Class I shares outperformed the −15.68% return of the Bloomberg U.S. Aggregate Bond Index, which is the Fund’s secondary benchmark, and the −17.10% return of the Blended Benchmark Index, which is an additional benchmark of the Fund. For 12 months ended October 31, 2022, Class I shares of the Fund underperformed the −15.06% return of the Morningstar Global Allocation Category Average.1
During the reporting period, were there any market events that materially impacted the Fund’s performance or liquidity?
Along with the ongoing war in Ukraine, the defining occurrence of the reporting period was the rapid repricing of expectations for global monetary policy, especially in the United States. An exceptionally strong labor market, together with concerns regarding long-term inflation and few signs of a letup in underlying inflation pressures, led U.S. Federal Reserve (the “Fed”) officials to significantly adjust their outlook on monetary policy, and markets followed suit. With most major central banks continuing to battle high inflation through stepped-up policy rate increases, risk-free as well as risk assets performed poorly. Widespread substantial global monetary tightening occurred during the reporting period, with numerous central banks quickly tightening policies within a relatively short period of time.
During the reporting period, how was the Fund’s performance materially affected by investments in derivatives?
During the reporting period, the fixed-income portion of the Fund used U.S. Treasury futures as an overall adjustment to its duration2 and yield curve3 positioning. On a stand-alone absolute basis, these positions detracted from overall returns.
What factors affected the relative performance of the equity portion of the Fund during the reporting period?
The reporting period was characterized by heightened volatility and deteriorating macroeconomic conditions, with the implementation of increasingly restrictive monetary policy to fight inflation putting heavy pressure on price multiples. The eruption of war in Ukraine struck another blow to sentiment, fueling geopolitical tensions and straining supply chains still recovering from the pandemic. Global economies remain challenged by rising prices, and central bank officials messaged their commitment to curbing inflation, despite growing concerns of a recession on the horizon.
Amid this challenging environment, the equity portion of the Fund outperformed the MSCI World Index (Net) by a wide margin, providing significant downside protection. Low exposure to volatility, market sensitivity, and growth were tailwinds for relative return. Most sectors enhanced relative return, with the largest contributions coming in communication services and information technology. (Contributions take weightings and total returns into account.) Stock selection drove nearly all of the outperformance in communication services, owing largely to the Fund’s lack of exposure to two key Index components that saw substantial drops in share price. Stock selection also drove the Fund’s outperformance in information technology, mainly due to lack of exposure to some of the worst-performing IT services names in the MSCI World Index (Net).
During the reporting period, which sectors and countries were the strongest positive contributors to the relative performance of the equity portion of the Fund and which sectors and countries were particularly weak?
As mentioned above, underweight exposure to communication services, the weakest performing sector in the benchmark, contributed strongly to relative returns. Stock selection in the sector also added to relative performance. Stock selection and an underweight position in information technology, another weak-performing sector, further bolstered relative returns, as did stock selection in industrials.
On the negative side, stock selection in the energy sector was the biggest drag on the Fund’s relative returns, primarily due to lack of exposure to several strong-performing oil, gas & consumable
| 1. | See page 5 for other share class returns, which may be higher or lower than Class I share returns. See page 6 for more information on benchmark and peer group returns. |
| 2. | Duration is a measure of the price sensitivity of a fixed-income investment to changes in interest rates. Duration is expressed as a number of years and is considered a more accurate sensitivity gauge than average maturity. |
| 3. | The yield curve is a line that plots the yields of various securities of similar quality—typically U.S. Treasury issues—across a range of maturities. The U.S. Treasury yield curve serves as a benchmark for other debt and is used in economic forecasting. |
fuel stocks. By country, positions in China and Taiwan detracted, whereas positions in the United States and Canada enhanced relative performance.
During the reporting period, which individual stocks made the strongest positive contributions to absolute performance in the equity portion of the Fund and which stocks detracted the most?
Top positive contributors to the absolute performance of the equity portion of the Fund during the reporting period included pharmaceutical company AbbVie and global integrated energy company Chevron.
AbbVie develops and markets drugs in specialty therapeutic areas, such as immunology, oncology, and virology, among others. Shares generally traded higher over the reporting period in response to favorable quarterly earnings reports, as well as constructive news flow regarding clinical success and approvals for key drugs. While the market remained concerned about the revenue impact from the expected entry in 2023 of biosimilar competitors for the company’s blockbuster immunology drug Humira, AbbVie continued to advance key drugs in multiple therapeutic areas, such as Skyrizi and Rinvoq in immunology, Venclexta in oncology, and Vraylar in neuroscience, while Botox and Juvederm in aesthetics also continued to sell well. In our opinion, AbbVie is committed to distributing cash to shareholders via an attractive, growing, and well-covered dividend, share repurchases, and reduction of debt related to the 2020 Allergan acquisition.
Chevron explores, produces, and markets crude oil and natural gas. It also owns and operates downstream assets that include refining, chemicals, lubricants & additives, and fuel retail & marketing. Shares outperformed as oil and gas prices stayed at elevated levels, exacerbated by the prolonged war in Ukraine. While oil prices declined beginning in mid-June 2022, Chevron’s share price rose after the OPEC+ oil producing nations decided to cut production to reduce supply in early October. Strong refining margins also helped the company’s shares. In our opinion, Chevron’s integrated business model, geographic and product diversification, strong balance sheet, and continued efforts to manage costs and improve capital efficiencies allow the company to generate sustainable cash flow through commodity price cycles and return cash to shareholders via an attractive and growing dividend and share buybacks using excess free cash flow.
The most significant detractors from the Fund’s absolute performance during the same period were global software company Microsoft and medical device maker Medtronic.
Microsoft serves enterprises and consumers. Shares were pressured on persistent concerns that the company’s end markets were slowing. Although the PC market has declined, we believe that Microsoft’s movement towards a subscription-based business
model rather than relying on perpetual licenses, along with the continued growth of its cloud business, position the company to perform better than in past economic downturns, even if the world slips into a recession. We believe that management is dedicated to shareholder returns through continued improvements to its dividend and share repurchase plans.
Medtronic develops and sells therapeutic and diagnostic medical devices to treat a variety of conditions, including cardiac rhythm diseases, vascular and heart disease, spinal conditions and diabetes. The company has also developed a line of advanced surgical devices and systems. Medtronic's business faced ongoing challenges due to the COVID-19 pandemic, which depressed surgical procedure volumes and created supply-chain disruptions that led to product availability issues. While revenues, earnings and cash flows recovered from the lows reached during the peak of the pandemic, certain procedure volumes did not recover fully, and supply-chain shortages continued to plague certain products. We view these challenges as temporary macro headwinds and expect financial performance to continue to improve going forward. We also note that cash flow generation has continued to comfortably cover the dividend (which was increased by 8% in May) as well as share repurchases. Medtronic has a broad portfolio of medical devices serving multiple therapeutic areas that it sells to a global customer base. In our opinion, the company has a track record of innovation and a promising development pipeline, and it returned capital to owners through a consistently growing dividend and regular share repurchases, with a minimum combined payout of 50% of free cash flow.
What were some of the largest purchases and sales in the equity portion of the Fund during the reporting period?
The equity portion of the Fund initiated positions in pharmaceutical firm Eli Lilly and Company and global financial services firm Bank of America.
Eli Lilly discovers, develops and commercializes medicines in large, growing and defensive therapeutic areas with high unmet needs, including endocrinology, oncology, immunology and neurology. The company's diabetes franchise is particularly strong. We believe that the company has a favorable growth outlook with several promising drugs recently launched or awaiting approval, and a broad pipeline of drugs in various stages of clinical development. Eli Lilly returned cash to owners through a growing dividend and regular share repurchases. The dividend is targeted to grow in line with earnings and is well covered by free cash flow.
Bank of America holds over $3 trillion in assets, operating a diversified business model with four main business segments including consumer banking, global wealth & investment management, global banking and global markets. The company maintains a well-capitalized balance sheet with a core deposit
| 10 | MainStay Income Builder Fund |
franchise that supports improving profitability in a rising interest-rate environment. Bank of America returned excess capital to shareholders with an attractive, growing dividend, and regular share repurchases.
The equity portion of the Fund’s most significant sales during the same period included its entire positions in financial firms Generali and Tokio Marine.
Generali offers life and health insurance, savings products, property/casualty insurance, and asset management services to retail and commercial customers throughout Europe and across several Asian markets. We believe increasing local political uncertainty, rising interest rates, and weakening economic conditions heighten the risks to Generali's shareholder yield as a result of the company's orientation toward retail policyholders and its investment concentration in Italian government bonds. We sold the Fund’s position to reallocate capital to other opportunities.
A diversified insurance and asset management company, Tokio Marine is the largest insurer in Japan and has strong market positions in several markets outside Japan with dynamic growth prospects. While the company pays an attractive dividend, Tokio Marine's investment concentration in domestic equities exposes its capital base to a correction in Japanese equity prices, while the company's own strong share price performance has limited its prospective shareholder yield. We sold the Fund’s position in favor of other opportunities.
How did sector and country weightings change in the equity portion of the Fund during the reporting period?
During the reporting period, the most significant sector allocation changes in the equity portion of the Fund included decreased exposure to consumer discretionary and information technology, and increased exposure to health care and industrials. From a country perspective, the equity portion of the Fund’s most significant allocation changes included increased exposure to the United States, and reduced exposure to Canada and Germany. The equity portion of the Fund’s sector and country allocations are a result of our bottom-up fundamental investment process and reflect the companies and securities that we believe can collect and distribute sustainable, growing shareholder yield.
How was the equity portion of the Fund positioned at the end of the reporting period?
As of October 31, 2022, the equity portion of the Fund’s largest sector allocations on an absolute basis were to information technology and health care, while its smallest total sector allocations were to real estate, materials and energy. As of the same date, relative to the MSCI World Index (Net), the equity portion of the Fund held its most overweight exposure to utilities,
a defensive sector that is typically more heavily represented in the Fund. The most significant underweight exposures were to the information technology and consumer discretionary sectors. The portfolio's positioning in terms of sector allocations is an outcome of our bottom-up fundamental investment process and reflects where we are finding opportunities in which we are confident in our abilities to collect sustainable, growing shareholder yield.
What factors affected the relative performance of the fixed-income portion of the Fund during the reporting period?
The performance of the Bloomberg U.S. Aggregate Bond Index during the reporting period was primarily driven by substantial increases in interest rates. The Fund underperformed the Bloomberg U.S. Aggregate Bond Index largely due to overweight allocation to high-grade, high-yield corporates and emerging-market credit, which detracted from relative returns as spreads4 widened. Conversely, the Fund’s underweight allocation to agency mortgages made a positive contribution to relative performance.
What was the duration strategy of the fixed-income portion of the Fund during the reporting period?
The Fund’s strategy was to keep duration neutral to the Bloomberg U.S. Aggregate Bond Index through the first half of the reporting period, then to add duration as yields rose. As of October 31, 2022, the effective duration for the Fund was 6.60 years relative to the 6.10 years for the benchmark.
During the reporting period, which sectors were the strongest positive contributors to the relative performance of the fixed-income portion of the Fund and which sectors were particularly weak?
During the reporting period, as stated above, the Fund’s underweight exposure to agency mortgages contributed positively to returns relative to the Bloomberg U.S. Aggregate Bond Index. Conversely, high-grade and high-yield corporate bond positions detracted from relative performance. Within the Fund’s corporate exposure, the banking, autos, electric and midstream industries were among the most significant laggards.
What were some of the largest purchases and sales in the fixed-income portion of the Fund during the reporting period?
During the reporting period, the Fund added credits issued by private equity firm Starwood Capital Group. During the same period, the Fund reduced its exposure to investment bank and financial services providers Bank of America and JP Morgan
| 4. | The terms “spread” and “yield spread” may refer to the difference in yield between a security or type of security and comparable U.S. Treasury issues. The terms may also refer to the difference in yield between two specific securities or types of securities at a given time. |
Chase. In addition, the Fund sold its shares of Progress Residential Trust to provide liquidity to the Fund.
How did the sector weightings in the fixed-income portion of the Fund change during the reporting period?
During the reporting period, the Fund increased its exposure to agency mortgages and consumer asset-backed securities. During the same period, the Fund trimmed its exposure to bank loans, as well as emerging-market and investment-grade bonds.
How was the Fund positioned at the end of the reporting period?
As of October 31, 2022, relative to the Bloomberg U.S. Aggregate Bond Index, the Fund held overweight exposure to high-grade and high-yield corporate bonds, as well as securitized product. As of the same date, the Fund held underweight exposure to U.S. Treasury securities and agency mortgages.
The opinions expressed are those of the portfolio managers as of the date of this report and are subject to change. There is no guarantee that any forecasts will come to pass. This material does not constitute investment advice and is not intended as an endorsement of any specific investment.
| 12 | MainStay Income Builder Fund |
Portfolio of Investments October 31, 2022†
| | Principal
Amount | Value |
| Long-Term Bonds 40.8% |
| Asset-Backed Securities 4.4% |
| Automobile Asset-Backed Securities 1.2% |
| American Credit Acceptance Receivables Trust | | |
| Series 2021-3, Class D | | |
| 1.34%, due 11/15/27 (a) | $ 1,535,000 | $ 1,436,702 |
| Avis Budget Rental Car Funding AESOP LLC (a) | | |
| Series 2021-1A, Class A | | |
| 1.38%, due 8/20/27 | 2,700,000 | 2,300,251 |
| Series 2020-2A, Class A | | |
| 2.02%, due 2/20/27 | 845,000 | 747,214 |
| Series 2020-1A, Class A | | |
| 2.33%, due 8/20/26 | 635,000 | 575,333 |
| Carmax Auto Owner Trust | | |
| Series 2022-3, Class A3 | | |
| 3.97%, due 4/15/27 | 1,555,000 | 1,518,030 |
| Drive Auto Receivables Trust | | |
| Series 2021-2, Class D | | |
| 1.39%, due 3/15/29 | 1,200,000 | 1,085,157 |
| Enterprise Fleet Financing LLC | | |
| Series 2022-2, Class A3 | | |
| 4.79%, due 5/21/29 (a) | 815,000 | 791,108 |
| Flagship Credit Auto Trust | | |
| Series 2020-3, Class D | | |
| 2.50%, due 9/15/26 (a) | 580,000 | 532,573 |
| Ford Credit Auto Owner Trust | | |
| Series 2020-2, Class A | | |
| 1.06%, due 4/15/33 (a) | 1,105,000 | 969,663 |
| Ford Credit Floorplan Master Owner Trust | | |
| Series 2018-4, Class A | | |
| 4.06%, due 11/15/30 | 1,625,000 | 1,477,536 |
| Hertz Vehicle Financing III LP | | |
| Series 2021-2A, Class D | | |
| 4.34%, due 12/27/27 (a) | 3,070,000 | 2,457,072 |
| Hertz Vehicle Financing LLC | | |
| Series 2021-1A, Class B | | |
| 1.56%, due 12/26/25 (a) | 1,235,000 | 1,123,730 |
| J.P. Morgan Chase Bank NA | | |
| Series 2020-1, Class B | | |
| 0.991%, due 1/25/28 (a) | 173,189 | 169,911 |
| | | 15,184,280 |
| | Principal
Amount | Value |
| |
| Home Equity Asset-Backed Securities 0.1% |
| Carrington Mortgage Loan Trust | | |
| Series 2007-HE1, Class A3 | | |
| 3.776% (1 Month LIBOR + 0.19%), due 6/25/37 (b) | $ 1,306,784 | $ 1,266,206 |
| Equity One Mortgage Pass-Through Trust | | |
| Series 2003-3, Class AF4 | | |
| 5.495%, due 12/25/33 (c) | 15,606 | 15,488 |
| J.P. Morgan Mortgage Acquisition Trust | | |
| Series 2007-HE1, Class AF1 | | |
| 3.686% (1 Month LIBOR + 0.10%), due 3/25/47 (b) | 305,989 | 192,229 |
| MASTR Asset-Backed Securities Trust | | |
| Series 2006-HE4, Class A1 | | |
| 3.686% (1 Month LIBOR + 0.10%), due 11/25/36 (b) | 486,138 | 168,531 |
| | | 1,642,454 |
| Other Asset-Backed Securities 3.1% |
| American Airlines Pass-Through Trust | | |
| Series 2016-2, Class AA | | |
| 3.20%, due 6/15/28 | 504,560 | 420,516 |
| Series 2016-2, Class A | | |
| 3.65%, due 6/15/28 | 1,172,360 | 885,791 |
| Series 2013-2, Class A | | |
| 4.95%, due 1/15/23 | 1,587,700 | 1,571,500 |
| AMSR Trust | | |
| Series 2020-SFR4, Class A | | |
| 1.355%, due 11/17/37 (a) | 2,643,000 | 2,311,347 |
| British Airways Pass-Through Trust | | |
| Series 2021-1, Class A | | |
| 2.90%, due 3/15/35 (United Kingdom) (a) | 1,975,507 | 1,573,932 |
| CF Hippolyta Issuer LLC (a) | | |
| Series 2021-1A, Class A1 | | |
| 1.53%, due 3/15/61 | 2,457,449 | 2,106,671 |
| Series 2020-1, Class A1 | | |
| 1.69%, due 7/15/60 | 1,165,811 | 1,024,887 |
| Series 2020-1, Class A2 | | |
| 1.99%, due 7/15/60 | 1,154,632 | 942,375 |
| Crown Castle Towers LLC | | |
| 4.241%, due 7/15/28 (a) | 2,680,000 | 2,436,018 |
| CVS Pass-Through Trust | | |
| 5.789%, due 1/10/26 (a) | 76,914 | 76,411 |
| DB Master Finance LLC (a) | | |
| Series 2021-1A, Class A23 | | |
| 2.791%, due 11/20/51 | 2,238,087 | 1,661,549 |
The notes to the financial statements are an integral part of, and should be read in conjunction with, the financial statements.
13
Portfolio of Investments October 31, 2022† (continued)
| | Principal
Amount | Value |
| Asset-Backed Securities (continued) |
| Other Asset-Backed Securities (continued) |
DB Master Finance LLC (a)
(continued) | | |
| Series 2019-1A, Class A23 | | |
| 4.352%, due 5/20/49 | $ 402,550 | $ 354,362 |
| FirstKey Homes Trust | | |
| Series 2020-SFR1, Class A | | |
| 1.339%, due 8/17/37 (a) | 2,470,254 | 2,178,330 |
| Home Partners of America Trust (a) | | |
| Series 2021-2, Class A | | |
| 1.901%, due 12/17/26 | 685,978 | 583,582 |
| Series 2021-2, Class B | | |
| 2.302%, due 12/17/26 | 1,314,458 | 1,125,582 |
| MMAF Equipment Finance LLC | | |
| Series 2020-BA, Class A4 | | |
| 0.66%, due 11/15/27 (a) | 3,750,000 | 3,369,057 |
| Navient Private Education Refi Loan Trust (a) | | |
| Series 2021-BA, Class A | | |
| 0.94%, due 7/15/69 | 507,829 | 425,884 |
| Series 2020-EA, Class A | | |
| 1.69%, due 5/15/69 | 760,719 | 677,404 |
| Series 2021-EA, Class B | | |
| 2.03%, due 12/16/69 | 3,245,000 | 2,011,702 |
| New Economy Assets Phase 1 Sponsor LLC (a) | | |
| Series 2021-1, Class A1 | | |
| 1.91%, due 10/20/61 | 1,585,000 | 1,328,013 |
| Series 2021-1, Class B1 | | |
| 2.41%, due 10/20/61 | 1,535,000 | 1,243,203 |
| PFS Financing Corp. | | |
| Series 2022-D, Class A | | |
| 4.27%, due 8/15/27 (a) | 1,380,000 | 1,315,743 |
| Progress Residential Trust (a) | | |
| Series 2021-SFR1, Class A | | |
| 1.052%, due 4/17/38 | 1,563,616 | 1,316,459 |
| Series 2020-SFR3, Class A | | |
| 1.294%, due 10/17/27 | 1,580,461 | 1,404,762 |
| Series 2021-SFR4, Class B | | |
| 1.808%, due 5/17/38 | 1,780,000 | 1,515,558 |
| Sierra Timeshare Receivables Funding LLC | | |
| Series 2020-2A, Class A | | |
| 1.33%, due 7/20/37 (a) | 505,114 | 468,645 |
| Taco Bell Funding LLC | | |
| Series 2021-1A, Class A23 | | |
| 2.542%, due 8/25/51 (a) | 1,637,625 | 1,195,365 |
| | Principal
Amount | Value |
| |
| Other Asset-Backed Securities (continued) |
| U.S. Airways Pass-Through Trust | | |
| Series 2012-1, Class A | | |
| 5.90%, due 10/1/24 | $ 971,993 | $ 935,885 |
| United Airlines Pass-Through Trust | | |
| Series 2020-1, Class A | | |
| 5.875%, due 10/15/27 | 1,557,055 | 1,502,368 |
| | | 37,962,901 |
Total Asset-Backed Securities
(Cost $63,358,547) | | 54,789,635 |
| Corporate Bonds 20.5% |
| Aerospace & Defense 0.1% |
| Boeing Co. (The) | | |
| 3.75%, due 2/1/50 | 880,000 | 563,056 |
| Howmet Aerospace, Inc. | | |
| 3.00%, due 1/15/29 | 1,500,000 | 1,248,570 |
| | | 1,811,626 |
| Agriculture 0.2% |
| BAT Capital Corp. | | |
| 3.734%, due 9/25/40 (United Kingdom) | 2,105,000 | 1,325,265 |
| BAT International Finance plc | | |
| 4.448%, due 3/16/28 (United Kingdom) | 1,170,000 | 1,036,255 |
| | | 2,361,520 |
| Airlines 0.6% |
| American Airlines, Inc. (a) | | |
| 5.50%, due 4/20/26 | 1,400,000 | 1,333,250 |
| 5.75%, due 4/20/29 | 850,000 | 773,500 |
| Delta Air Lines, Inc. (a) | | |
| 4.50%, due 10/20/25 | 1,080,000 | 1,052,392 |
| 4.75%, due 10/20/28 | 2,125,000 | 1,976,858 |
| Mileage Plus Holdings LLC | | |
| 6.50%, due 6/20/27 (a) | 1,767,000 | 1,746,865 |
| | | 6,882,865 |
| Auto Manufacturers 1.1% |
| Ford Motor Credit Co. LLC | | |
| 2.30%, due 2/10/25 | 1,935,000 | 1,750,207 |
| 2.70%, due 8/10/26 | 940,000 | 814,491 |
| 3.35%, due 11/1/22 | 820,000 | 820,000 |
| 4.125%, due 8/17/27 | 1,650,000 | 1,465,282 |
| General Motors Co. | | |
| 5.60%, due 10/15/32 | 530,000 | 481,014 |
| General Motors Financial Co., Inc. | | |
| 2.35%, due 1/8/31 | 810,000 | 592,977 |
The notes to the financial statements are an integral part of, and should be read in conjunction with, the financial statements.
| 14 | MainStay Income Builder Fund |
| | Principal
Amount | Value |
| Corporate Bonds (continued) |
| Auto Manufacturers (continued) |
General Motors Financial Co., Inc.
(continued) | | |
| 2.70%, due 6/10/31 | $ 2,015,000 | $ 1,499,353 |
| 4.30%, due 4/6/29 | 1,125,000 | 988,091 |
| Nissan Motor Acceptance Co. LLC (a) | | |
| 1.125%, due 9/16/24 | 1,935,000 | 1,727,688 |
| 1.85%, due 9/16/26 | 3,205,000 | 2,514,476 |
| Volkswagen Group of America Finance LLC | | |
| 4.60%, due 6/8/29 (Germany) (a) | 840,000 | 762,328 |
| | | 13,415,907 |
| Banks 7.3% |
| Banco Santander SA | | |
| 5.294%, due 8/18/27 (Spain) | 1,800,000 | 1,659,961 |
| Bank of America Corp. | | |
| 2.087%, due 6/14/29 (d) | 1,690,000 | 1,367,560 |
| 2.496%, due 2/13/31 (d) | 1,600,000 | 1,257,069 |
| 2.572%, due 10/20/32 (d) | 1,195,000 | 901,557 |
| 2.687%, due 4/22/32 (d) | 1,110,000 | 857,867 |
| 3.194%, due 7/23/30 (d) | 1,425,000 | 1,192,130 |
| 3.384%, due 4/2/26 (d) | 1,115,000 | 1,047,474 |
| Series MM | | |
| 4.30%, due 1/28/25 (d)(e) | 2,184,000 | 1,807,806 |
| Series DD | | |
| 6.30%, due 3/10/26 (d)(e) | 2,085,000 | 2,033,000 |
| 8.57%, due 11/15/24 | 485,000 | 509,917 |
| Barclays plc (United Kingdom) (b)(e) | | |
| 4.375% (5 Year Treasury Constant Maturity Rate + 3.41%), due 3/15/28 | 2,000,000 | 1,327,418 |
| 8.00% (5 Year Treasury Constant Maturity Rate + 5.431%), due 3/15/29 | 1,605,000 | 1,437,846 |
| BNP Paribas SA (France) (a) | | |
| 3.052%, due 1/13/31 (d) | 2,395,000 | 1,862,592 |
| 4.625% (5 Year Treasury Constant Maturity Rate + 3.196%), due 1/12/27 (b)(e) | 1,450,000 | 1,109,970 |
| 4.625% (5 Year Treasury Constant Maturity Rate + 3.34%), due 2/25/31 (b)(e) | 2,090,000 | 1,444,712 |
| 7.75% (5 Year Treasury Constant Maturity Rate + 4.899%), due 8/16/29 (b)(e) | 550,000 | 518,559 |
| | Principal
Amount | Value |
| |
| Banks (continued) |
| BPCE SA | | |
| 2.045%, due 10/19/27 (France) (a)(d) | $ 1,255,000 | $ 1,042,370 |
| Citigroup, Inc. | | |
| 2.52%, due 11/3/32 (d) | 1,195,000 | 894,032 |
| 3.668%, due 7/24/28 (d) | 1,180,000 | 1,058,435 |
| 3.98%, due 3/20/30 (d) | 2,370,000 | 2,088,168 |
| Series Y | | |
| 4.15% (5 Year Treasury Constant Maturity Rate + 3.00%), due 11/15/26 (b)(e) | 2,005,000 | 1,566,097 |
| 5.30%, due 5/6/44 | 600,000 | 505,617 |
| 6.625%, due 6/15/32 | 770,000 | 779,326 |
| Citizens Bank NA | | |
| 6.064%, due 10/24/25 (d) | 1,095,000 | 1,102,799 |
| Citizens Financial Group, Inc. | | |
| 2.638%, due 9/30/32 | 2,715,000 | 1,930,772 |
| Credit Agricole SA | | |
| 4.75% (5 Year Treasury Constant Maturity Rate + 3.237%), due 3/23/29 (France) (a)(b)(e) | 2,340,000 | 1,680,306 |
| Credit Suisse Group AG (Switzerland) (a)(d) | | |
| 2.593%, due 9/11/25 | 1,500,000 | 1,332,084 |
| 3.091%, due 5/14/32 | 1,930,000 | 1,323,766 |
| 6.442%, due 8/11/28 | 1,170,000 | 1,056,020 |
| Deutsche Bank AG (Germany) | | |
| Series E | | |
| 0.962%, due 11/8/23 | 1,555,000 | 1,478,925 |
| 3.035%, due 5/28/32 (d) | 600,000 | 422,024 |
| 4.276% (SOFR + 1.219%), due 11/16/27 (b) | 1,945,000 | 1,672,874 |
| 5.371%, due 9/9/27 | 955,000 | 905,690 |
| First Horizon Bank | | |
| 5.75%, due 5/1/30 | 1,555,000 | 1,483,384 |
| First Horizon Corp. | | |
| 4.00%, due 5/26/25 | 2,100,000 | 2,010,876 |
| Freedom Mortgage Corp. | | |
| 7.625%, due 5/1/26 (a) | 860,000 | 679,434 |
| Goldman Sachs Group, Inc. (The) | | |
| 1.431%, due 3/9/27 (d) | 1,255,000 | 1,073,678 |
| 1.948%, due 10/21/27 (d) | 1,435,000 | 1,219,220 |
| 1.992%, due 1/27/32 (d) | 1,370,000 | 999,650 |
| 2.615%, due 4/22/32 (d) | 1,005,000 | 766,577 |
| 3.102%, due 2/24/33 (d) | 905,000 | 708,787 |
| 3.50%, due 11/16/26 | 1,085,000 | 994,982 |
| 4.075% (3 Month LIBOR + 1.17%), due 5/15/26 (b) | 2,245,000 | 2,215,781 |
The notes to the financial statements are an integral part of, and should be read in conjunction with, the financial statements.
15
Portfolio of Investments October 31, 2022† (continued)
| | Principal
Amount | Value |
| Corporate Bonds (continued) |
| Banks (continued) |
Goldman Sachs Group, Inc. (The)
(continued) | | |
| 6.75%, due 10/1/37 | $ 829,000 | $ 819,628 |
| HSBC Holdings plc (United Kingdom) (d) | | |
| 3.973%, due 5/22/30 | 2,365,000 | 1,949,474 |
| 7.336%, due 11/3/26 | 525,000 | 526,453 |
| JPMorgan Chase & Co. | | |
| 2.182%, due 6/1/28 (d) | 1,800,000 | 1,522,645 |
| 4.246% (SOFR + 1.18%), due 2/24/28 (b)(f) | 1,995,000 | 1,931,779 |
| 4.323%, due 4/26/28 (d) | 2,185,000 | 2,032,470 |
| Series HH | | |
| 4.60%, due 2/1/25 (d)(e) | 1,552,000 | 1,385,005 |
| Lloyds Banking Group plc (United Kingdom) | | |
| 4.582%, due 12/10/25 | 1,038,000 | 951,391 |
| 4.65%, due 3/24/26 | 2,540,000 | 2,334,380 |
| 4.976% (1 Year Treasury Constant Maturity Rate + 2.30%), due 8/11/33 (b) | 870,000 | 744,364 |
| Macquarie Group Ltd. | | |
| 2.871%, due 1/14/33 (Australia) (a)(d) | 1,925,000 | 1,420,346 |
| Mizuho Financial Group, Inc. | | |
| 3.261% (1 Year Treasury Constant Maturity Rate + 1.25%), due 5/22/30 (Japan) (b) | 1,290,000 | 1,072,814 |
| Morgan Stanley | | |
| 2.484%, due 9/16/36 (d) | 2,115,000 | 1,497,384 |
| 2.511%, due 10/20/32 (d) | 1,530,000 | 1,151,920 |
| 5.00%, due 11/24/25 | 1,980,000 | 1,975,397 |
| NatWest Group plc | | |
| 3.073% (1 Year Treasury Constant Maturity Rate + 2.55%), due 5/22/28 (United Kingdom) (b) | 3,705,000 | 3,145,717 |
| Societe Generale SA (France) (a)(b) | | |
| 3.337% (1 Year Treasury Constant Maturity Rate + 1.60%), due 1/21/33 | 1,590,000 | 1,165,561 |
| 4.75% (5 Year Treasury Constant Maturity Rate + 3.931%), due 5/26/26 (e) | 935,000 | 718,547 |
| 5.375% (5 Year Treasury Constant Maturity Rate + 4.514%), due 11/18/30 (e) | 2,600,000 | 1,883,314 |
| | Principal
Amount | Value |
| |
| Banks (continued) |
| Standard Chartered plc (United Kingdom) (a)(b) | | |
| 1.822% (1 Year Treasury Constant Maturity Rate + 0.95%), due 11/23/25 | $ 2,510,000 | $ 2,243,927 |
| 4.75% (5 Year Treasury Constant Maturity Rate + 3.805%), due 1/14/31 (e) | 1,225,000 | 817,371 |
| SVB Financial Group | | |
| Series C | | |
| 4.00% (5 Year Treasury Constant Maturity Rate + 3.202%), due 5/15/26 (b)(e) | 1,810,000 | 1,266,630 |
| UBS Group AG (Switzerland) (a)(b) | | |
| 4.375% (5 Year Treasury Constant Maturity Rate + 3.313%), due 2/10/31 (e) | 2,350,000 | 1,632,427 |
| 4.751% (1 Year Treasury Constant Maturity Rate + 1.75%), due 5/12/28 | 960,000 | 879,733 |
| Wachovia Corp. | | |
| 5.50%, due 8/1/35 | 315,000 | 286,610 |
| Wells Fargo & Co. | | |
| 2.879%, due 10/30/30 (d) | 900,000 | 738,417 |
| 4.897%, due 7/25/33 (d) | 935,000 | 855,474 |
| 4.90%, due 11/17/45 | 55,000 | 43,861 |
| Westpac Banking Corp. | | |
| 3.02% (5 Year Treasury Constant Maturity Rate + 1.53%), due 11/18/36 (Australia) (b) | 1,255,000 | 887,858 |
| | | 91,208,009 |
| Chemicals 0.3% |
| Braskem Netherlands Finance BV | | |
| 4.50%, due 1/10/28 (Brazil) (a) | 2,135,000 | 1,853,735 |
| Huntsman International LLC | | |
| 4.50%, due 5/1/29 | 1,862,000 | 1,621,784 |
| | | 3,475,519 |
| Commercial Services 0.3% |
| Ashtead Capital, Inc. | | |
| 4.00%, due 5/1/28 (United Kingdom) (a) | 935,000 | 820,968 |
| California Institute of Technology | | |
| 3.65%, due 9/1/19 | 898,000 | 531,877 |
| Carriage Services, Inc. | | |
| 4.25%, due 5/15/29 (a) | 680,000 | 523,314 |
The notes to the financial statements are an integral part of, and should be read in conjunction with, the financial statements.
| 16 | MainStay Income Builder Fund |
| | Principal
Amount | Value |
| Corporate Bonds (continued) |
| Commercial Services (continued) |
| Sodexo, Inc. | | |
| 2.718%, due 4/16/31 (France) (a) | $ 2,370,000 | $ 1,819,724 |
| | | 3,695,883 |
| Computers 0.6% |
| Dell International LLC | | |
| 3.375%, due 12/15/41 (a) | 2,090,000 | 1,297,092 |
| 4.90%, due 10/1/26 | 1,749,000 | 1,678,745 |
| 5.30%, due 10/1/29 | 810,000 | 758,310 |
| 8.10%, due 7/15/36 | 1,242,000 | 1,315,723 |
| NCR Corp. | | |
| 5.00%, due 10/1/28 (a) | 2,376,000 | 1,996,551 |
| | | 7,046,421 |
| Diversified Financial Services 1.9% |
| AerCap Ireland Capital DAC (Ireland) | | |
| 2.45%, due 10/29/26 | 1,585,000 | 1,338,446 |
| 3.30%, due 1/23/23 | 1,275,000 | 1,268,512 |
| Air Lease Corp. | | |
| 2.30%, due 2/1/25 | 1,915,000 | 1,750,498 |
| 2.75%, due 1/15/23 | 1,850,000 | 1,839,491 |
| 4.25%, due 9/15/24 | 1,185,000 | 1,152,695 |
| Aircastle Ltd. | | |
| 5.25% (5 Year Treasury Constant Maturity Rate + 4.41%), due 6/15/26 (a)(b)(e) | 1,765,000 | 1,319,953 |
| Ally Financial, Inc. | | |
| 3.875%, due 5/21/24 | 810,000 | 782,208 |
| Series C | | |
| 4.70% (7 Year Treasury Constant Maturity Rate + 3.481%), due 5/15/28 (b)(e) | 1,320,000 | 887,700 |
| 8.00%, due 11/1/31 | 1,685,000 | 1,728,154 |
| Aviation Capital Group LLC | | |
| 1.95%, due 1/30/26 (a) | 1,210,000 | 1,010,678 |
| Avolon Holdings Funding Ltd. (Ireland) (a) | | |
| 2.125%, due 2/21/26 | 1,515,000 | 1,242,121 |
| 2.875%, due 2/15/25 | 2,720,000 | 2,435,950 |
| Banco BTG Pactual SA (Brazil) (a) | | |
| 2.75%, due 1/11/26 | 2,630,000 | 2,301,250 |
| 4.50%, due 1/10/25 | 850,000 | 811,108 |
| Capital One Financial Corp. | | |
| 5.247%, due 7/26/30 (d) | 915,000 | 838,356 |
| Nomura Holdings, Inc. | | |
| 5.099%, due 7/3/25 (Japan) | 1,845,000 | 1,806,153 |
| | Principal
Amount | Value |
| |
| Diversified Financial Services (continued) |
| OneMain Finance Corp. | | |
| 3.50%, due 1/15/27 | $ 885,000 | $ 725,358 |
| 6.125%, due 3/15/24 | 540,000 | 527,591 |
| | | 23,766,222 |
| Electric 1.4% |
| AEP Texas, Inc. | | |
| 4.70%, due 5/15/32 | 1,135,000 | 1,033,159 |
| Alabama Power Co. | | |
| 3.00%, due 3/15/52 | 785,000 | 494,292 |
| Arizona Public Service Co. | | |
| 2.20%, due 12/15/31 | 1,930,000 | 1,423,128 |
| Calpine Corp. | | |
| 5.125%, due 3/15/28 (a) | 1,245,000 | 1,103,834 |
| Duquesne Light Holdings, Inc. | | |
| 3.616%, due 8/1/27 (a) | 2,265,000 | 1,999,163 |
| Edison International | | |
| Series B | | |
| 5.00% (5 Year Treasury Constant Maturity Rate + 3.901%), due 12/15/26 (b)(e) | 2,140,000 | 1,733,400 |
| Entergy Louisiana LLC | | |
| 4.00%, due 3/15/33 | 2,200,000 | 1,919,354 |
| Jersey Central Power & Light Co. | | |
| 2.75%, due 3/1/32 (a) | 1,655,000 | 1,287,789 |
| National Rural Utilities Cooperative Finance Corp. | | |
| 5.80%, due 1/15/33 | 1,065,000 | 1,077,854 |
| Nevada Power Co. | | |
| Series GG | | |
| 5.90%, due 5/1/53 | 530,000 | 523,198 |
| NSTAR Electric Co. | | |
| 4.95%, due 9/15/52 | 580,000 | 518,957 |
| Ohio Power Co. | | |
| Series R | | |
| 2.90%, due 10/1/51 | 1,000,000 | 597,047 |
| Southern California Edison Co. | | |
| Series E | | |
| 3.70%, due 8/1/25 | 870,000 | 835,072 |
| 4.00%, due 4/1/47 | 1,320,000 | 941,684 |
| Virginia Electric and Power Co. | | |
| 2.95%, due 11/15/51 | 1,035,000 | 639,634 |
| WEC Energy Group, Inc. | | |
| 5.018% (3 Month LIBOR + 2.113%), due 5/15/67 (b) | 1,095,000 | 903,375 |
| | | 17,030,940 |
The notes to the financial statements are an integral part of, and should be read in conjunction with, the financial statements.
17
Portfolio of Investments October 31, 2022† (continued)
| | Principal
Amount | Value |
| Corporate Bonds (continued) |
| Entertainment 0.1% |
| Warnermedia Holdings, Inc. | | |
| 4.279%, due 3/15/32 (a) | $ 1,340,000 | $ 1,082,383 |
| Environmental Control 0.1% |
| Stericycle, Inc. | | |
| 3.875%, due 1/15/29 (a) | 280,000 | 243,205 |
| Waste Connections, Inc. | | |
| 2.20%, due 1/15/32 | 1,100,000 | 846,314 |
| | | 1,089,519 |
| Food 0.2% |
| JBS USA LUX SA | | |
| 5.75%, due 4/1/33 (a) | 1,400,000 | 1,261,596 |
| Smithfield Foods, Inc. | | |
| 4.25%, due 2/1/27 (a) | 1,180,000 | 1,066,844 |
| | | 2,328,440 |
| Gas 0.3% |
| National Fuel Gas Co. | | |
| 2.95%, due 3/1/31 | 1,050,000 | 787,314 |
| Piedmont Natural Gas Co., Inc. | | |
| 5.05%, due 5/15/52 | 1,040,000 | 872,574 |
| Southern California Gas Co. | | |
| Series VV | | |
| 4.30%, due 1/15/49 (f) | 845,000 | 646,205 |
| Southern Co. Gas Capital Corp. | | |
| Series 21A | | |
| 3.15%, due 9/30/51 | 1,970,000 | 1,188,990 |
| | | 3,495,083 |
| Home Builders 0.1% |
| Thor Industries, Inc. | | |
| 4.00%, due 10/15/29 (a) | 891,000 | 720,623 |
| Insurance 0.8% |
| Athene Global Funding | | |
| 2.50%, due 3/24/28 (a) | 1,580,000 | 1,299,369 |
| Equitable Holdings, Inc. | | |
| 5.00%, due 4/20/48 | 2,305,000 | 1,848,542 |
| Peachtree Corners Funding Trust | | |
| 3.976%, due 2/15/25 (a) | 940,000 | 901,327 |
| Protective Life Corp. | | |
| 8.45%, due 10/15/39 | 1,640,000 | 1,846,055 |
| Reliance Standard Life Global Funding II | | |
| 2.50%, due 10/30/24 (a) | 2,420,000 | 2,276,481 |
| | Principal
Amount | Value |
| |
| Insurance (continued) |
| Voya Financial, Inc. | | |
| 3.65%, due 6/15/26 | $ 690,000 | $ 639,780 |
| Willis North America, Inc. | | |
| 2.95%, due 9/15/29 | 1,735,000 | 1,403,795 |
| 3.875%, due 9/15/49 | 440,000 | 289,745 |
| | | 10,505,094 |
| Internet 0.2% |
| Expedia Group, Inc. | | |
| 3.25%, due 2/15/30 | 1,890,000 | 1,523,184 |
| 3.80%, due 2/15/28 | 440,000 | 391,239 |
| 5.00%, due 2/15/26 | 60,000 | 57,980 |
| 6.25%, due 5/1/25 (a) | 207,000 | 206,650 |
| | | 2,179,053 |
| Lodging 0.2% |
| Hilton Domestic Operating Co., Inc. | | |
| 4.875%, due 1/15/30 | 299,000 | 267,979 |
| Las Vegas Sands Corp. | | |
| 3.20%, due 8/8/24 | 1,415,000 | 1,347,336 |
| Sands China Ltd. | | |
| 5.625%, due 8/8/25 (Macao) (c) | 1,310,000 | 1,156,678 |
| | | 2,771,993 |
| Media 0.2% |
| DISH DBS Corp. | | |
| 5.75%, due 12/1/28 (a) | 1,180,000 | 951,375 |
| Grupo Televisa SAB | | |
| 5.25%, due 5/24/49 (Mexico) | 930,000 | 765,576 |
| Time Warner Cable Enterprises LLC | | |
| 8.375%, due 3/15/23 | 800,000 | 808,711 |
| | | 2,525,662 |
| Mining 0.2% |
| Glencore Funding LLC | | |
| 1.625%, due 9/1/25 (Australia) (a) | 2,805,000 | 2,495,623 |
| Miscellaneous—Manufacturing 0.1% |
| Textron Financial Corp. | | |
| 4.64% (3 Month LIBOR + 1.735%), due 2/15/42 (a)(b) | 2,720,000 | 1,868,536 |
| Oil & Gas 0.2% |
| Gazprom PJSC Via Gaz Capital SA | | |
| 7.288%, due 8/16/37 (Russia) (a)(g) | 2,065,000 | 1,104,775 |
| Southwestern Energy Co. | | |
| 4.75%, due 2/1/32 | 479,000 | 413,473 |
The notes to the financial statements are an integral part of, and should be read in conjunction with, the financial statements.
| 18 | MainStay Income Builder Fund |
| | Principal
Amount | Value |
| Corporate Bonds (continued) |
| Oil & Gas (continued) |
| Valero Energy Corp. | | |
| 6.625%, due 6/15/37 | $ 1,050,000 | $ 1,051,635 |
| | | 2,569,883 |
| Packaging & Containers 0.1% |
| Berry Global, Inc. | | |
| 4.875%, due 7/15/26 (a) | 200,000 | 187,900 |
| Owens-Brockway Glass Container, Inc. | | |
| 6.625%, due 5/13/27 (a)(f) | 1,386,000 | 1,323,608 |
| | | 1,511,508 |
| Pharmaceuticals 0.4% |
| Becton Dickinson and Co. | | |
| 4.669%, due 6/6/47 | 935,000 | 782,416 |
| CVS Health Corp. | | |
| 4.78%, due 3/25/38 | 1,110,000 | 963,433 |
| Teva Pharmaceutical Finance Netherlands III BV (Israel) | | |
| 3.15%, due 10/1/26 | 2,995,000 | 2,530,775 |
| 4.75%, due 5/9/27 | 1,335,000 | 1,178,138 |
| | | 5,454,762 |
| Pipelines 1.1% |
| Cheniere Corpus Christi Holdings LLC | | |
| 2.742%, due 12/31/39 | 1,580,000 | 1,172,410 |
| DT Midstream, Inc. | | |
| 4.30%, due 4/15/32 (a) | 1,375,000 | 1,181,180 |
| Energy Transfer LP | | |
| 4.95%, due 6/15/28 | 980,000 | 912,806 |
| 5.35%, due 5/15/45 | 1,000,000 | 785,970 |
| Enterprise Products Operating LLC | | |
| 3.95%, due 1/31/60 | 1,460,000 | 969,640 |
| 4.20%, due 1/31/50 | 405,000 | 297,641 |
| Flex Intermediate Holdco LLC | | |
| 3.363%, due 6/30/31 (a) | 2,030,000 | 1,565,350 |
| Hess Midstream Operations LP (a) | | |
| 4.25%, due 2/15/30 | 320,000 | 273,648 |
| 5.50%, due 10/15/30 | 1,185,000 | 1,069,107 |
| Holly Energy Partners LP | | |
| 6.375%, due 4/15/27 (a) | 760,000 | 731,474 |
| MPLX LP | | |
| 2.65%, due 8/15/30 | 1,705,000 | 1,342,265 |
| Targa Resources Corp. | | |
| 4.20%, due 2/1/33 | 800,000 | 667,848 |
| Transcontinental Gas Pipe Line Co. LLC | | |
| 4.60%, due 3/15/48 | 2,070,000 | 1,632,591 |
| | Principal
Amount | Value |
| |
| Pipelines (continued) |
| Western Midstream Operating LP | | |
| 5.50%, due 2/1/50 (c) | $ 860,000 | $ 669,494 |
| | | 13,271,424 |
| Real Estate 0.1% |
| Realogy Group LLC | | |
| 5.75%, due 1/15/29 (a)(f) | 1,305,000 | 937,969 |
| Real Estate Investment Trusts 0.9% |
| American Tower Corp. | | |
| 3.375%, due 10/15/26 | 1,920,000 | 1,737,402 |
| 3.60%, due 1/15/28 | 1,025,000 | 908,314 |
| Digital Realty Trust LP | | |
| 4.45%, due 7/15/28 (f) | 2,255,000 | 2,079,815 |
| GLP Capital LP | | |
| 3.35%, due 9/1/24 | 1,280,000 | 1,199,064 |
| Invitation Homes Operating Partnership LP | | |
| 2.00%, due 8/15/31 | 1,600,000 | 1,123,167 |
| Iron Mountain, Inc. | | |
| 5.25%, due 7/15/30 (a) | 1,285,000 | 1,108,715 |
| Office Properties Income Trust | | |
| 2.40%, due 2/1/27 | 1,335,000 | 917,373 |
| Starwood Property Trust, Inc. (a) | | |
| 3.75%, due 12/31/24 | 1,695,000 | 1,584,537 |
| 4.375%, due 1/15/27 | 940,000 | 830,274 |
| | | 11,488,661 |
| Retail 0.5% |
| AutoNation, Inc. | | |
| 4.75%, due 6/1/30 | 1,680,000 | 1,446,544 |
| Nordstrom, Inc. | | |
| 4.00%, due 3/15/27 | 760,000 | 644,345 |
| 4.25%, due 8/1/31 (f) | 1,260,000 | 914,760 |
| QVC, Inc. | | |
| 4.375%, due 9/1/28 | 2,215,000 | 1,605,875 |
| Starbucks Corp. | | |
| 4.45%, due 8/15/49 | 515,000 | 411,105 |
| Victoria's Secret & Co. | | |
| 4.625%, due 7/15/29 (a) | 1,830,000 | 1,455,765 |
| | | 6,478,394 |
| Software 0.1% |
| Fidelity National Information Services, Inc. | | |
| 5.10%, due 7/15/32 | 655,000 | 616,529 |
| MSCI, Inc. | | |
| 3.25%, due 8/15/33 (a) | 965,000 | 745,991 |
The notes to the financial statements are an integral part of, and should be read in conjunction with, the financial statements.
19
Portfolio of Investments October 31, 2022† (continued)
| | Principal
Amount | Value |
| Corporate Bonds (continued) |
| Software (continued) |
| Oracle Corp. | | |
| 3.65%, due 3/25/41 | $ 575,000 | $ 389,390 |
| | | 1,751,910 |
| Telecommunications 0.8% |
| Altice France SA | | |
| 5.125%, due 7/15/29 (France) (a) | 2,100,000 | 1,581,668 |
| AT&T, Inc. | | |
| 3.50%, due 9/15/53 | 2,184,000 | 1,401,757 |
| Level 3 Financing, Inc. | | |
| 3.40%, due 3/1/27 (a) | 1,400,000 | 1,205,204 |
| Sprint Spectrum Co. LLC | | |
| 4.738%, due 3/20/25 (a) | 2,606,256 | 2,569,474 |
| T-Mobile US, Inc. | | |
| 2.625%, due 2/15/29 | 715,000 | 591,043 |
| Verizon Communications, Inc. | | |
| 4.005% (3 Month LIBOR + 1.10%), due 5/15/25 (b) | 2,705,000 | 2,703,214 |
| | | 10,052,360 |
Total Corporate Bonds
(Cost $305,520,090) | | 255,273,792 |
| Foreign Government Bonds 0.7% |
| Brazil 0.1% |
| Brazil Government Bond | | |
| 3.75%, due 9/12/31 (f) | 995,000 | 817,551 |
| Chile 0.3% |
| Chile Government Bond | | |
| 2.55%, due 7/27/33 (f) | 1,845,000 | 1,371,901 |
| Empresa Nacional del Petroleo | | |
| 3.45%, due 9/16/31 (a) | 2,340,000 | 1,818,788 |
| | | 3,190,689 |
| Colombia 0.1% |
| Colombia Government Bond | | |
| 3.25%, due 4/22/32 (f) | 1,780,000 | 1,181,299 |
| 4.50%, due 1/28/26 | 560,000 | 502,796 |
| | | 1,684,095 |
| Mexico 0.2% |
| Comision Federal de Electricidad | | |
| 3.875%, due 7/26/33 (a) | 2,755,000 | 1,962,937 |
| | Principal
Amount | Value |
| |
| Mexico (continued) |
| Mexico Government Bond | | |
| 3.75%, due 4/19/71 (f) | $ 1,860,000 | $ 1,075,645 |
| | | 3,038,582 |
Total Foreign Government Bonds
(Cost $12,083,464) | | 8,730,917 |
| Loan Assignments 0.1% |
| Diversified/Conglomerate Service 0.1% |
| TruGreen LP (b) | | |
| First Lien Second Refinancing Term Loan | | |
| 7.754% (1 Month LIBOR + 4.00%), due 11/2/27 | 754,349 | 695,887 |
| Second Lien Initial Term Loan | | |
| 11.615% (3 Month LIBOR + 8.50%), due 11/2/28 | 580,000 | 487,200 |
| | | 1,183,087 |
Total Loan Assignments
(Cost $1,319,519) | | 1,183,087 |
| Mortgage-Backed Securities 10.2% |
| Agency (Collateralized Mortgage Obligations) 3.7% |
| FHLMC | | |
| REMIC, Series 5187, Class SA | | |
| (zero coupon) (SOFR 30A + 1.80%), due 1/25/52 (b)(h) | 2,430,985 | 12,295 |
| REMIC, Series 5200, Class SA | | |
| 0.503% (SOFR 30A + 3.50%), due 2/25/52 (b)(h) | 2,702,231 | 77,709 |
| REMIC, Series 5021, Class SA | | |
| 0.553% (SOFR 30A + 3.55%), due 10/25/50 (b)(h) | 3,181,233 | 108,725 |
| REMIC, Series 5073, Class DG | | |
| 1.50%, due 8/25/38 | 408,587 | 400,774 |
| REMIC, Series 5038, Class KA | | |
| 1.50%, due 11/25/50 | 2,351,667 | 1,775,417 |
| REMIC, Series 5070, Class PI | | |
| 3.00%, due 8/25/50 (h) | 1,694,181 | 280,184 |
| REMIC, Series 5011, Class MI | | |
| 3.00%, due 9/25/50 (h) | 1,790,904 | 290,164 |
| REMIC, Series 5023, Class LI | | |
| 3.00%, due 10/25/50 (h) | 1,420,781 | 227,938 |
| REMIC, Series 5094, Class IP | | |
| 3.00%, due 4/25/51 (h) | 1,439,458 | 221,649 |
| REMIC, Series 5160 | | |
| 3.00%, due 10/25/51 (h) | 1,762,192 | 217,431 |
The notes to the financial statements are an integral part of, and should be read in conjunction with, the financial statements.
| 20 | MainStay Income Builder Fund |
| | Principal
Amount | Value |
| Mortgage-Backed Securities (continued) |
| Agency (Collateralized Mortgage Obligations) (continued) |
| FHLMC (continued) | | |
| REMIC, Series 5040 | | |
| 3.50%, due 11/25/50 (h) | $ 1,275,723 | $ 218,150 |
| FHLMC, Strips | | |
| Series 311 | | |
| (zero coupon), due 8/15/43 | 726,527 | 526,481 |
| Series 311, Class S1 | | |
| 2.538% (1 Month LIBOR + 5.95%), due 8/15/43 (b)(h) | 2,072,049 | 181,763 |
| FNMA | | |
| REMIC, Series 2022-3, Class YS | | |
| (zero coupon) (SOFR 30A + 2.55%), due 2/25/52 (b)(h) | 9,897,919 | 141,708 |
| REMIC, Series 2022-5, Class SN | | |
| (zero coupon) (SOFR 30A + 1.80%), due 2/25/52 (b)(h) | 1,359,938 | 5,603 |
| REMIC, Series 2021-40, Class SI | | |
| 2.364% (1 Month LIBOR + 5.95%), due 9/25/47 (b)(h) | 2,631,032 | 230,467 |
| REMIC, Series 2016-57, Class SN | | |
| 2.464% (1 Month LIBOR + 6.05%), due 6/25/46 (b)(h) | 2,116,104 | 198,281 |
| REMIC, Series 2021-34, Class MI | | |
| 2.50%, due 3/25/51 (h) | 3,980,345 | 521,102 |
| REMIC, Series 2021-12, Class JI | | |
| 2.50%, due 3/25/51 (h) | 1,392,686 | 212,045 |
| REMIC, Series 2021-10, Class LI | | |
| 2.50%, due 3/25/51 (h) | 937,129 | 143,342 |
| REMIC, Series 2021-54, Class HI | | |
| 2.50%, due 6/25/51 (h) | 645,194 | 80,476 |
| REMIC, Series 2013-77, Class CY | | |
| 3.00%, due 7/25/43 | 1,387,380 | 1,233,889 |
| REMIC, Series 2021-53, Class GI | | |
| 3.00%, due 7/25/48 (h) | 5,220,310 | 845,646 |
| REMIC, Series 2019-13, Class PE | | |
| 3.00%, due 3/25/49 | 824,995 | 732,351 |
| REMIC, Series 2021-85, Class BI | | |
| 3.00%, due 12/25/51 (h) | 3,939,523 | 614,366 |
| REMIC, Series 2021-12, Class GC | | |
| 3.50%, due 7/25/50 | 1,670,497 | 1,522,563 |
| REMIC, Series 2021-8, Class ID | | |
| 3.50%, due 3/25/51 (h) | 2,495,500 | 501,331 |
| REMIC, Series 2020-10, Class DA | | |
| 3.50%, due 3/25/60 | 1,598,035 | 1,458,865 |
| | Principal
Amount | Value |
| |
| Agency (Collateralized Mortgage Obligations) (continued) |
| GNMA | | |
| Series 2019-136, Class YS | | |
| (zero coupon) (1 Month LIBOR + 2.83%), due 11/20/49 (b)(h) | $ 2,955,012 | $ 7,780 |
| Series 2020-5, Class AS | | |
| (zero coupon) (1 Month LIBOR + 2.82%), due 1/20/50 (b)(h) | 1,530,309 | 7,335 |
| Series 2021-77, Class SN | | |
| (zero coupon) (1 Month LIBOR + 2.60%), due 5/20/51 (b)(h) | 7,090,596 | 31,255 |
| Series 2021-122, Class SA | | |
| (zero coupon) (SOFR 30A + 2.60%), due 7/20/51 (b)(h) | 4,299,342 | 36,856 |
| Series 2022-19, Class SG | | |
| (zero coupon) (SOFR 30A + 2.45%), due 1/20/52 (b)(h) | 6,331,219 | 62,563 |
| Series 2022-24, Class SC | | |
| (zero coupon) (SOFR 30A + 2.37%), due 2/20/52 (b)(h) | 32,451,762 | 313,620 |
| Series 2022-6, Class AS | | |
| 0.22% (SOFR 30A + 3.14%), due 1/20/52 (b)(h) | 717,103 | 10,379 |
| Series 2021-136, Class SB | | |
| 0.28% (SOFR 30A + 3.20%), due 8/20/51 (b)(h) | 11,567,073 | 290,663 |
| Series 2021-158, Class SB | | |
| 0.78% (SOFR 30A + 3.70%), due 9/20/51 (b)(h) | 3,806,552 | 161,811 |
| Series 2020-115, Class YA | | |
| 1.00%, due 8/20/50 | 1,776,518 | 1,341,754 |
| Series 2020-129, Class AG | | |
| 1.00%, due 9/20/50 | 2,484,057 | 1,849,532 |
| Series 2020-166, Class CA | | |
| 1.00%, due 11/20/50 | 1,699,772 | 1,273,813 |
| Series 2021-105, Class DB | | |
| 1.00%, due 6/20/51 | 1,756,945 | 1,301,887 |
| Series 2021-41, Class FS | | |
| 2.00% (SOFR 30A + 0.20%), due 10/20/50 (b)(h) | 3,728,487 | 428,964 |
| Series 2020-166, Class IC | | |
| 2.00%, due 11/20/50 (h) | 826,916 | 87,642 |
| Series 2020-188 | | |
| 2.00%, due 12/20/50 (h) | 3,635,696 | 384,794 |
| Series 2021-97, Class IN | | |
| 2.50%, due 8/20/49 (h) | 4,474,842 | 487,138 |
| Series 2022-1, Class IA | | |
| 2.50%, due 6/20/50 (h) | 626,653 | 88,698 |
The notes to the financial statements are an integral part of, and should be read in conjunction with, the financial statements.
21
Portfolio of Investments October 31, 2022† (continued)
| | Principal
Amount | Value |
| Mortgage-Backed Securities (continued) |
| Agency (Collateralized Mortgage Obligations) (continued) |
| GNMA (continued) | | |
| Series 2020-188, Class DI | | |
| 2.50%, due 12/20/50 (h) | $ 6,305,287 | $ 965,146 |
| Series 2021-1, Class PI | | |
| 2.50%, due 12/20/50 (h) | 795,214 | 104,580 |
| Series 2021-25, Class LI | | |
| 2.50%, due 2/20/51 (h) | 5,535,890 | 687,099 |
| Series 2021-83, Class FM | | |
| 2.50% (SOFR 30A + 0.51%), due 5/20/51 (b) | 3,158,106 | 2,640,997 |
| Series 2021-105, Class IE | | |
| 2.50%, due 6/20/51 (h) | 1,562,597 | 185,207 |
| Series 2021-160, Class ID | | |
| 2.50%, due 9/20/51 (h) | 3,510,724 | 504,575 |
| Series 2022-83 | | |
| 2.50%, due 11/20/51 (h) | 1,539,344 | 203,963 |
| Series 2021-44, Class IQ | | |
| 3.00%, due 3/20/51 (h) | 4,076,144 | 595,836 |
| Series 2021-74, Class HI | | |
| 3.00%, due 4/20/51 (h) | 4,276,052 | 645,231 |
| Series 2021-98, Class KI | | |
| 3.00%, due 6/20/51 (h) | 4,210,730 | 641,375 |
| Series 2021-97, Class FA | | |
| 3.00% (SOFR 30A + 0.40%), due 6/20/51 (b) | 837,688 | 735,246 |
| Series 2021-122, Class FA | | |
| 3.00% (SOFR 30A + 0.40%), due 7/20/51 (b) | 2,520,196 | 2,120,927 |
| Series 2021-136, Class TI | | |
| 3.00%, due 8/20/51 (h) | 1,843,917 | 271,315 |
| Series 2021-139, Class IA | | |
| 3.00%, due 8/20/51 (h) | 5,334,475 | 876,882 |
| Series 2021-158, Class NI | | |
| 3.00%, due 9/20/51 (h) | 5,025,178 | 785,901 |
| Series 2021-177, Class IM | | |
| 3.00%, due 10/20/51 (h) | 3,500,019 | 563,788 |
| Series 2022-10, Class NF | | |
| 3.00% (SOFR 30A + 0.50%), due 1/20/52 (b) | 895,946 | 780,747 |
| Series 2021-125, Class AF | | |
| 3.17% (SOFR 30A + 0.25%), due 7/20/51 (b) | 1,929,770 | 1,708,283 |
| Series 2021-96, Class FG | | |
| 3.22% (SOFR 30A + 0.30%), due 6/20/51 (b) | 1,964,760 | 1,733,058 |
| Series 2013-149, Class BA | | |
| 3.25%, due 8/16/41 | 3,655,159 | 3,450,173 |
| | Principal
Amount | Value |
| |
| Agency (Collateralized Mortgage Obligations) (continued) |
| GNMA (continued) | | |
| Series 2022-6, Class CF | | |
| 3.28% (SOFR 30A + 0.36%), due 1/20/52 (b) | $ 717,103 | $ 640,066 |
| Series 2019-136, Class YF | | |
| 3.50% (1 Month LIBOR + 0.67%), due 11/20/49 (b) | 1,436,360 | 1,255,773 |
| Series 2019-145, Class LF | | |
| 3.50% (1 Month LIBOR + 0.67%), due 11/20/49 (b) | 1,692,677 | 1,472,722 |
| Series 2020-5, Class AF | | |
| 3.50% (1 Month LIBOR + 0.68%), due 1/20/50 (b) | 762,537 | 660,998 |
| | | 45,377,087 |
| Commercial Mortgage Loans (Collateralized Mortgage Obligations) 3.6% |
| Arbor Multifamily Mortgage Securities Trust (a) | | |
| Series 2021-MF2, Class AS | | |
| 2.70%, due 6/15/54 (i) | 1,770,000 | 1,336,051 |
| Series 2021-MF3, Class AS | | |
| 2.748%, due 10/15/54 | 2,200,000 | 1,659,182 |
| Series 2022-MF4, Class A5 | | |
| 3.293%, due 2/15/55 (j) | 1,225,000 | 1,007,689 |
| Bayview Commercial Asset Trust | | |
| Series 2006-4A, Class A1 | | |
| 3.931% (1 Month LIBOR + 0.345%), due 12/25/36 (a)(b) | 42,598 | 38,943 |
| Benchmark Mortgage Trust | | |
| Series 2020-B19, Class A2 | | |
| 1.691%, due 9/15/53 | 1,775,000 | 1,581,433 |
| BX Commercial Mortgage Trust (a) | | |
| Series 2020-VIV2, Class C | | |
| 3.542%, due 3/9/44 (j) | 2,540,000 | 1,886,584 |
| Series 2020-VIV3, Class B | | |
| 3.544%, due 3/9/44 (j) | 847,236 | 665,553 |
| Series 2020-VIVA, Class D | | |
| 3.549%, due 3/11/44 (j) | 575,000 | 415,845 |
| Series 2021-XL2, Class A | | |
| 4.101% (1 Month LIBOR + 0.689%), due 10/15/38 (b) | 1,311,302 | 1,240,283 |
| Series 2021-VOLT, Class C | | |
| 4.512% (1 Month LIBOR + 1.10%), due 9/15/36 (b) | 2,310,000 | 2,130,792 |
| Series 2021-ACNT, Class D | | |
| 5.263% (1 Month LIBOR + 1.85%), due 11/15/38 (b) | 2,410,000 | 2,264,250 |
The notes to the financial statements are an integral part of, and should be read in conjunction with, the financial statements.
| 22 | MainStay Income Builder Fund |
| | Principal
Amount | Value |
| Mortgage-Backed Securities (continued) |
| Commercial Mortgage Loans (Collateralized Mortgage Obligations) (continued) |
| BX Trust (a) | | |
| Series 2019-OC11, Class B | | |
| 3.605%, due 12/9/41 | $ 250,000 | $ 198,188 |
| Series 2019-OC11, Class C | | |
| 3.856%, due 12/9/41 | 570,000 | 450,379 |
| Series 2019-OC11, Class D | | |
| 3.944%, due 12/9/41 (j) | 975,000 | 760,137 |
| Series 2021-LBA, Class AV | | |
| 4.213% (1 Month LIBOR + 0.80%), due 2/15/36 (b) | 1,910,000 | 1,794,209 |
| Series 2021-ARIA, Class E | | |
| 5.657% (1 Month LIBOR + 2.245%), due 10/15/36 (b) | 3,250,000 | 2,929,822 |
| BXHPP Trust | | |
| Series 2021-FILM, Class B | | |
| 4.312% (1 Month LIBOR + 0.90%), due 8/15/36 (a)(b) | 1,280,000 | 1,185,642 |
| Citigroup Commercial Mortgage Trust | | |
| Series 2016-GC36, Class A5 | | |
| 3.616%, due 2/10/49 | 560,000 | 517,534 |
| Extended Stay America Trust (a)(b) | | |
| Series 2021-ESH, Class C | | |
| 5.113% (1 Month LIBOR + 1.70%), due 7/15/38 | 2,259,885 | 2,138,222 |
| Series 2021-ESH, Class D | | |
| 5.663% (1 Month LIBOR + 2.25%), due 7/15/38 | 1,557,027 | 1,471,257 |
| FREMF Mortgage Trust (a)(j) | | |
| Series 2019-K99, Class B | | |
| 3.645%, due 10/25/52 | 290,000 | 250,302 |
| Series 2019-K98, Class C | | |
| 3.738%, due 10/25/52 | 780,000 | 666,411 |
| Series 2017-K71, Class B | | |
| 3.752%, due 11/25/50 | 607,208 | 545,977 |
| Series 2017-K63, Class C | | |
| 3.877%, due 2/25/50 | 1,700,000 | 1,538,285 |
| Series 2019-K94, Class B | | |
| 3.966%, due 7/25/52 | 1,895,000 | 1,669,596 |
| Series 2018-K78, Class B | | |
| 4.128%, due 6/25/51 | 355,000 | 324,161 |
| Series 2018-K81, Class B | | |
| 4.173%, due 9/25/51 | 345,000 | 313,020 |
| Series 2018-K76, Class B | | |
| 4.208%, due 6/25/51 | 370,000 | 339,016 |
| Series 2018-K79, Class B | | |
| 4.211%, due 7/25/51 | 330,000 | 300,687 |
| | Principal
Amount | Value |
| |
| Commercial Mortgage Loans (Collateralized Mortgage Obligations) (continued) |
FREMF Mortgage Trust (a)(j)
(continued) | | |
| Series 2018-K86, Class C | | |
| 4.294%, due 11/25/51 | $ 955,000 | $ 851,423 |
| Hudson Yards Mortgage Trust | | |
| Series 2019-30HY, Class A | | |
| 3.228%, due 7/10/39 (a) | 1,640,000 | 1,376,927 |
| Manhattan West Mortgage Trust | | |
| Series 2020-1MW, Class A | | |
| 2.13%, due 9/10/39 (a) | 2,910,000 | 2,448,539 |
| Morgan Stanley Bank of America Merrill Lynch Trust | | |
| Series 2016-C28, Class A4 | | |
| 3.544%, due 1/15/49 | 560,000 | 520,675 |
| Morgan Stanley Capital I Trust | | |
| Series 2015-UBS8, Class A4 | | |
| 3.809%, due 12/15/48 | 830,000 | 776,170 |
| Multifamily Connecticut Avenue Securities Trust | | |
| Series 2019-01, Class M10 | | |
| 6.836% (1 Month LIBOR + 3.25%), due 10/25/49 (a)(b) | 1,900,485 | 1,750,765 |
| One Bryant Park Trust | | |
| Series 2019-OBP, Class A | | |
| 2.516%, due 9/15/54 (a) | 4,550,000 | 3,624,198 |
| Wells Fargo Commercial Mortgage Trust | | |
| Series 2018-AUS, Class A | | |
| 4.058%, due 8/17/36 (a)(j) | 2,345,000 | 2,125,405 |
| | | 45,093,552 |
| Whole Loan (Collateralized Mortgage Obligations) 2.9% |
| FHLMC STACR REMIC Trust (a)(b) | | |
| Series 2022-DNA1, Class M1B | | |
| 4.847% (SOFR 30A + 1.85%), due 1/25/42 | 2,340,000 | 2,100,148 |
| Series 2020-DNA6, Class M2 | | |
| 4.997% (SOFR 30A + 2.00%), due 12/25/50 | 2,689,089 | 2,644,707 |
| Series 2021-HQA3, Class M2 | | |
| 5.097% (SOFR 30A + 2.10%), due 9/25/41 | 1,715,000 | 1,458,832 |
| Series 2021-HQA1, Class M2 | | |
| 5.247% (SOFR 30A + 2.25%), due 8/25/33 | 2,490,000 | 2,276,759 |
The notes to the financial statements are an integral part of, and should be read in conjunction with, the financial statements.
23
Portfolio of Investments October 31, 2022† (continued)
| | Principal
Amount | Value |
| Mortgage-Backed Securities (continued) |
| Whole Loan (Collateralized Mortgage Obligations) (continued) |
FHLMC STACR REMIC Trust (a)(b)
(continued) | | |
| Series 2022-DNA3, Class M1B | | |
| 5.897% (SOFR 30A + 2.90%), due 4/25/42 | $ 2,400,000 | $ 2,226,002 |
| Series 2021-HQA1, Class B1 | | |
| 5.997% (SOFR 30A + 3.00%), due 8/25/33 | 3,045,000 | 2,444,624 |
| Series 2021-DNA5, Class B1 | | |
| 6.047% (SOFR 30A + 3.05%), due 1/25/34 | 4,090,000 | 3,555,243 |
| Series 2021-HQA2, Class B1 | | |
| 6.147% (SOFR 30A + 3.15%), due 12/25/33 | 1,015,000 | 808,290 |
| Series 2021-HQA3, Class B1 | | |
| 6.347% (SOFR 30A + 3.35%), due 9/25/41 | 3,465,000 | 2,961,665 |
| Series 2022-DNA2, Class M2 | | |
| 6.747% (SOFR 30A + 3.75%), due 2/25/42 | 1,820,000 | 1,663,676 |
| FHLMC STACR Trust (a)(b) | | |
| Series 2018-DNA2, Class B1 | | |
| 7.286% (1 Month LIBOR + 3.70%), due 12/25/30 | 1,340,000 | 1,317,073 |
| Series 2019-DNA1, Class B1 | | |
| 8.236% (1 Month LIBOR + 4.65%), due 1/25/49 | 2,055,000 | 2,100,207 |
| FNMA (b) | | |
| Series 2018-C01, Class 1B1 | | |
| 7.136% (1 Month LIBOR + 3.55%), due 7/25/30 | 2,715,000 | 2,706,615 |
| Series 2017-C05, Class 1B1 | | |
| 7.186% (1 Month LIBOR + 3.60%), due 1/25/30 | 2,299,558 | 2,264,681 |
| J.P. Morgan Mortgage Trust | | |
| Series 2021-LTV2, Class A1 | | |
| 2.519%, due 5/25/52 (a)(i) | 875,519 | 671,223 |
| New Residential Mortgage Loan Trust (a) | | |
| Series 2019-5A, Class B7 | | |
| 4.359%, due 8/25/59 (j) | 2,861,264 | 1,711,905 |
| Series 2019-2A, Class B6 | | |
| 4.891%, due 12/25/57 (i) | 938,745 | 582,626 |
| | Principal
Amount | Value |
| |
| Whole Loan (Collateralized Mortgage Obligations) (continued) |
| NewRez Warehouse Securitization Trust | | |
| Series 2021-1, Class A | | |
| 4.336% (1 Month LIBOR + 0.75%), due 5/25/55 (a)(b) | $ 915,000 | $ 895,664 |
| STACR Trust | | |
| Series 2018-HRP2, Class B1 | | |
| 7.786% (1 Month LIBOR + 4.20%), due 2/25/47 (a)(b) | 1,900,000 | 1,843,909 |
| | | 36,233,849 |
Total Mortgage-Backed Securities
(Cost $140,122,009) | | 126,704,488 |
| Municipal Bond 0.1% |
| California 0.1% |
| Regents of the University of California Medical Center, Pooled, Revenue Bonds | | |
| Series N | | |
| 3.006%, due 5/15/50 | 2,580,000 | 1,613,115 |
Total Municipal Bond
(Cost $2,580,000) | | 1,613,115 |
| U.S. Government & Federal Agencies 4.8% |
| Federal Home Loan Mortgage Corporation (Mortgage Pass-Through Securities) 0.8% |
| UMBS, 20 Year | | |
| 2.50%, due 4/1/42 | 950,422 | 802,602 |
| UMBS, 30 Year | | |
| 3.00%, due 3/1/52 | 1,859,103 | 1,588,870 |
| 3.00%, due 4/1/52 | 4,091,013 | 3,486,637 |
| 3.50%, due 7/1/50 | 1,145,255 | 1,017,043 |
| 3.50%, due 7/1/52 | 3,107,273 | 2,734,065 |
| | | 9,629,217 |
| Federal National Mortgage Association (Mortgage Pass-Through Securities) 1.9% |
| UMBS, 20 Year | | |
| 2.50%, due 4/1/42 | 1,022,258 | 863,264 |
| UMBS, 30 Year | | |
| 2.50%, due 8/1/50 | 182,547 | 151,143 |
| 2.50%, due 10/1/50 | 140,377 | 115,834 |
| 3.00%, due 6/1/51 | 851,056 | 727,057 |
| 3.00%, due 11/1/51 | 1,293,325 | 1,103,683 |
| 3.00%, due 2/1/52 | 4,240,604 | 3,617,046 |
| 3.00%, due 2/1/52 | 1,157,092 | 986,432 |
The notes to the financial statements are an integral part of, and should be read in conjunction with, the financial statements.
| 24 | MainStay Income Builder Fund |
| | Principal
Amount | Value |
| U.S. Government & Federal Agencies (continued) |
| Federal National Mortgage Association (Mortgage Pass-Through Securities) (continued) |
| UMBS, 30 Year (continued) | | |
| 3.00%, due 3/1/52 | $ 1,521,551 | $ 1,297,070 |
| 3.00%, due 3/1/52 | 1,871,081 | 1,595,031 |
| 3.50%, due 9/1/52 | 2,738,433 | 2,409,641 |
| 4.00%, due 8/1/48 | 1,704,763 | 1,572,346 |
| 4.00%, due 2/1/49 | 313,910 | 290,497 |
| 4.00%, due 6/1/52 | 2,104,403 | 1,915,467 |
| 4.00%, due 6/1/52 | 3,277,709 | 2,982,815 |
| 4.00%, due 6/1/52 | 1,519,066 | 1,382,490 |
| 4.00%, due 7/1/52 | 3,349,791 | 3,049,036 |
| | | 24,058,852 |
| Government National Mortgage Association (Mortgage Pass-Through Securities) 0.0% ‡ |
| GNMA I, 30 Year | | |
| 6.50%, due 4/15/29 | 8 | 8 |
| 6.50%, due 8/15/29 | 4 | 4 |
| | | 12 |
| United States Treasury Bonds 1.7% |
| U.S. Treasury Bonds | | |
| 3.00%, due 8/15/52 | 6,470,000 | 5,181,055 |
| 3.375%, due 8/15/42 | 18,560,000 | 16,010,900 |
| | | 21,191,955 |
| United States Treasury Notes 0.4% |
| U.S. Treasury Notes | | |
| 2.75%, due 8/15/32 | 505,000 | 451,896 |
| 4.00%, due 10/31/29 | 3,760,000 | 3,724,750 |
| | | 4,176,646 |
Total U.S. Government & Federal Agencies
(Cost $67,011,356) | | 59,056,682 |
Total Long-Term Bonds
(Cost $591,994,985) | | 507,351,716 |
| |
| | Shares | |
| Common Stocks 56.1% |
| Aerospace & Defense 1.3% |
| BAE Systems plc (United Kingdom) | 445,524 | 4,160,989 |
| Lockheed Martin Corp. | 9,681 | 4,711,549 |
| Raytheon Technologies Corp. | 76,416 | 7,245,765 |
| | | 16,118,303 |
| | Shares | Value |
| |
| Air Freight & Logistics 1.0% |
| Deutsche Post AG (Registered) (Germany) | 195,443 | $ 6,935,893 |
| United Parcel Service, Inc., Class B | 35,816 | 6,008,850 |
| | | 12,944,743 |
| Auto Components 0.6% |
| Bridgestone Corp. (Japan) | 121,100 | 4,366,913 |
| Cie Generale des Etablissements Michelin SCA (France) | 124,922 | 3,186,352 |
| | | 7,553,265 |
| Automobiles 0.3% |
| Toyota Motor Corp. (Japan) | 250,600 | 3,470,935 |
| Banks 4.5% |
| Bank of America Corp. | 270,350 | 9,743,414 |
| BAWAG Group AG (Austria) (a)(k) | 53,610 | 2,591,786 |
| Columbia Banking System, Inc. | 208,846 | 6,990,076 |
| JPMorgan Chase & Co. | 76,858 | 9,674,885 |
| KeyCorp | 507,561 | 9,070,115 |
| PNC Financial Services Group, Inc. (The) | 27,788 | 4,496,932 |
| Royal Bank of Canada (Canada) (f) | 39,549 | 3,659,230 |
| Truist Financial Corp. | 82,083 | 3,676,497 |
| U.S. Bancorp | 137,072 | 5,818,706 |
| | | 55,721,641 |
| Beverages 1.4% |
| Coca-Cola Co. (The) | 103,785 | 6,211,532 |
| Coca-Cola Europacific Partners plc (United Kingdom) | 237,200 | 11,160,260 |
| | | 17,371,792 |
| Biotechnology 1.0% |
| AbbVie, Inc. | 55,842 | 8,175,269 |
| Amgen, Inc. | 17,177 | 4,643,802 |
| | | 12,819,071 |
| Capital Markets 0.3% |
| Lazard Ltd., Class A (f) | 109,437 | 4,126,869 |
| Chemicals 2.7% |
| Air Products and Chemicals, Inc. (f) | 20,536 | 5,142,214 |
| BASF SE (Germany) | 78,678 | 3,532,732 |
| Dow, Inc. | 71,632 | 3,348,080 |
| Linde plc (United Kingdom) | 36,726 | 10,920,476 |
| LyondellBasell Industries NV, Class A | 42,847 | 3,275,653 |
The notes to the financial statements are an integral part of, and should be read in conjunction with, the financial statements.
25
Portfolio of Investments October 31, 2022† (continued)
| | Shares | Value |
| Common Stocks (continued) |
| Chemicals (continued) |
| Nutrien Ltd. (Canada) | 90,447 | $ 7,642,772 |
| | | 33,861,927 |
| Commercial Services & Supplies 0.0% ‡ |
| Quad/Graphics, Inc. (k) | 10 | 28 |
| Communications Equipment 1.0% |
| Cisco Systems, Inc. | 277,671 | 12,614,593 |
| Construction & Engineering 0.3% |
| Vinci SA (France) | 43,589 | 4,013,899 |
| Diversified Telecommunication Services 2.1% |
| AT&T, Inc. | 257,584 | 4,695,756 |
| Deutsche Telekom AG (Registered) (Germany) | 619,051 | 11,724,097 |
| Orange SA (France) | 355,648 | 3,384,999 |
| TELUS Corp. (Canada) | 179,888 | 3,756,607 |
| Verizon Communications, Inc. | 81,809 | 3,057,203 |
| | | 26,618,662 |
| Electric Utilities 2.5% |
| American Electric Power Co., Inc. | 96,373 | 8,473,114 |
| Duke Energy Corp. | 38,155 | 3,555,283 |
| Entergy Corp. | 37,119 | 3,976,930 |
| Evergy, Inc. | 59,254 | 3,622,197 |
| Fortis, Inc. (Canada) | 85,793 | 3,347,082 |
| NextEra Energy, Inc. | 106,184 | 8,229,260 |
| | | 31,203,866 |
| Electrical Equipment 1.6% |
| Eaton Corp. plc | 46,488 | 6,976,454 |
| Emerson Electric Co. | 84,094 | 7,282,540 |
| Hubbell, Inc. | 21,397 | 5,081,360 |
| | | 19,340,354 |
| Entertainment 0.3% |
| Koei Tecmo Holdings Co. Ltd. (Japan) | 272,700 | 4,122,732 |
| Equity Real Estate Investment Trusts 1.2% |
| Iron Mountain, Inc. | 90,957 | 4,554,217 |
| Realty Income Corp. | 60,351 | 3,758,057 |
| Welltower, Inc. | 49,299 | 3,009,211 |
| WP Carey, Inc. (f) | 46,831 | 3,573,205 |
| | | 14,894,690 |
| | Shares | Value |
| |
| Food & Staples Retailing 0.9% |
| Walmart, Inc. | 82,454 | $ 11,735,678 |
| Food Products 0.9% |
| Danone SA (France) | 69,210 | 3,443,094 |
| Nestle SA (Registered) (Switzerland) | 44,035 | 4,795,103 |
| Orkla ASA (Norway) | 519,007 | 3,502,598 |
| | | 11,740,795 |
| Gas Utilities 0.5% |
| China Resources Gas Group Ltd. (China) | 1,096,900 | 2,808,748 |
| Snam SpA (Italy) | 697,775 | 3,104,472 |
| | | 5,913,220 |
| Health Care Equipment & Supplies 0.9% |
| Medtronic plc | 129,051 | 11,271,314 |
| Health Care Providers & Services 1.4% |
| CVS Health Corp. | 50,568 | 4,788,790 |
| UnitedHealth Group, Inc. | 22,387 | 12,428,143 |
| | | 17,216,933 |
| Hotels, Restaurants & Leisure 2.0% |
| McDonald's Corp. | 19,881 | 5,420,753 |
| Restaurant Brands International, Inc. (Canada) | 201,574 | 11,969,464 |
| Vail Resorts, Inc. | 33,536 | 7,348,744 |
| | | 24,738,961 |
| Household Durables 0.3% |
| Leggett & Platt, Inc. | 109,467 | 3,694,511 |
| Household Products 0.3% |
| Procter & Gamble Co. (The) | 26,089 | 3,513,406 |
| Industrial Conglomerates 0.9% |
| Honeywell International, Inc. | 35,313 | 7,204,558 |
| Siemens AG (Registered) (Germany) | 39,488 | 4,317,617 |
| | | 11,522,175 |
| Insurance 3.5% |
| Allianz SE (Registered) (Germany) | 20,010 | 3,602,983 |
| Arthur J. Gallagher & Co. | 29,738 | 5,563,385 |
| AXA SA (France) | 224,076 | 5,536,078 |
| Manulife Financial Corp. (Canada) | 416,601 | 6,904,871 |
| MetLife, Inc. | 129,965 | 9,514,738 |
The notes to the financial statements are an integral part of, and should be read in conjunction with, the financial statements.
| 26 | MainStay Income Builder Fund |
| | Shares | Value |
| Common Stocks (continued) |
| Insurance (continued) |
| Muenchener Rueckversicherungs-Gesellschaft AG (Registered) (Germany) | 15,981 | $ 4,223,108 |
| Travelers Cos., Inc. (The) | 42,192 | 7,782,736 |
| | | 43,127,899 |
| IT Services 1.2% |
| International Business Machines Corp. | 106,306 | 14,701,057 |
| Leisure Products 0.5% |
| Hasbro, Inc. | 88,611 | 5,781,868 |
| Machinery 0.7% |
| Cummins, Inc. | 35,953 | 8,790,868 |
| Media 0.8% |
| Comcast Corp., Class A | 169,971 | 5,394,880 |
| Omnicom Group, Inc. | 57,731 | 4,199,930 |
| | | 9,594,810 |
| Multi-Utilities 0.9% |
| Ameren Corp. | 45,528 | 3,711,442 |
| NiSource, Inc. | 138,359 | 3,554,443 |
| WEC Energy Group, Inc. | 42,108 | 3,845,724 |
| | | 11,111,609 |
| Oil, Gas & Consumable Fuels 2.8% |
| Chevron Corp. | 27,323 | 4,942,731 |
| Enbridge, Inc. (Canada) | 100,936 | 3,932,677 |
| Enterprise Products Partners LP | 227,001 | 5,731,775 |
| Magellan Midstream Partners LP | 82,159 | 4,432,478 |
| MPLX LP | 127,124 | 4,263,739 |
| TotalEnergies SE (France) | 211,424 | 11,512,581 |
| | | 34,815,981 |
| Personal Products 0.3% |
| Unilever plc (United Kingdom) | 86,554 | 3,945,094 |
| Pharmaceuticals 5.4% |
| AstraZeneca plc, Sponsored ADR (United Kingdom) | 202,717 | 11,921,787 |
| Bayer AG (Registered) (Germany) | 78,328 | 4,119,635 |
| Eli Lilly and Co. | 20,201 | 7,314,580 |
| GSK plc | 211,264 | 3,461,662 |
| Johnson & Johnson | 20,726 | 3,605,702 |
| Merck & Co., Inc. | 75,898 | 7,680,878 |
| | Shares | Value |
| |
| Pharmaceuticals (continued) |
| Novartis AG (Registered) (Switzerland) | 132,418 | $ 10,698,174 |
| Novo Nordisk A/S, Class B (Denmark) | 37,050 | 4,027,933 |
| Pfizer, Inc. | 74,519 | 3,468,859 |
| Roche Holding AG | 11,327 | 3,761,715 |
| Sanofi (France) | 78,335 | 6,760,614 |
| | | 66,821,539 |
| Professional Services 0.3% |
| RELX plc (United Kingdom) | 137,186 | 3,691,682 |
| Semiconductors & Semiconductor Equipment 4.3% |
| Analog Devices, Inc. | 94,880 | 13,531,786 |
| Broadcom, Inc. | 31,284 | 14,707,234 |
| Intel Corp. | 128,868 | 3,663,717 |
| KLA Corp. | 27,376 | 8,663,135 |
| Taiwan Semiconductor Manufacturing Co. Ltd., Sponsored ADR (Taiwan) | 91,315 | 5,620,438 |
| Texas Instruments, Inc. | 43,738 | 7,025,635 |
| | | 53,211,945 |
| Software 1.1% |
| Microsoft Corp. | 60,816 | 14,117,218 |
| Specialty Retail 0.4% |
| Home Depot, Inc. (The) | 14,861 | 4,400,788 |
| Technology Hardware, Storage & Peripherals 1.6% |
| Apple, Inc. | 96,640 | 14,818,778 |
| Samsung Electronics Co. Ltd., GDR (Republic of Korea) | 4,822 | 4,983,537 |
| | | 19,802,315 |
| Tobacco 1.5% |
| Altria Group, Inc. | 88,870 | 4,112,015 |
| British American Tobacco plc (United Kingdom) | 249,433 | 9,821,519 |
| Philip Morris International, Inc. | 53,016 | 4,869,519 |
| | | 18,803,053 |
| Trading Companies & Distributors 0.3% |
| MSC Industrial Direct Co., Inc., Class A | 51,889 | 4,305,749 |
The notes to the financial statements are an integral part of, and should be read in conjunction with, the financial statements.
27
Portfolio of Investments October 31, 2022† (continued)
| | Shares | | Value |
| Common Stocks (continued) |
| Wireless Telecommunication Services 0.3% |
| SK Telecom Co. Ltd. (Republic of Korea) | 93,783 | | $ 3,298,486 |
Total Common Stocks
(Cost $626,401,832) | | | 698,466,324 |
| Short-Term Investments 2.2% |
| Affiliated Investment Company 1.4% |
| MainStay U.S. Government Liquidity Fund, 2.905% (l) | 18,109,962 | | 18,109,962 |
| Unaffiliated Investment Companies 0.8% |
| Invesco Government & Agency Portfolio, 3.163% (l)(m) | 5,851,408 | | 5,851,408 |
| State Street Institutional U.S. Government Money Market Fund, 3.064% (l)(m) | 4,087,620 | | 4,087,620 |
Total Unaffiliated Investment Companies
(Cost $9,939,028) | | | 9,939,028 |
Total Short-Term Investments
(Cost $28,048,990) | | | 28,048,990 |
Total Investments
(Cost $1,246,445,807) | 99.1% | | 1,233,867,030 |
| Other Assets, Less Liabilities | 0.9 | | 10,721,992 |
| Net Assets | 100.0% | | $ 1,244,589,022 |
| † | Percentages indicated are based on Fund net assets. |
| ‡ | Less than one-tenth of a percent. |
| (a) | May be sold to institutional investors only under Rule 144A or securities offered pursuant to Section 4(a)(2) of the Securities Act of 1933, as amended. |
| (b) | Floating rate—Rate shown was the rate in effect as of October 31, 2022. |
| (c) | Step coupon—Rate shown was the rate in effect as of October 31, 2022. |
| (d) | Fixed to floating rate—Rate shown was the rate in effect as of October 31, 2022. |
| (e) | Security is perpetual and, thus, does not have a predetermined maturity date. The date shown, if applicable, reflects the next call date. |
| (f) | All or a portion of this security was held on loan. As of October 31, 2022, the aggregate market value of securities on loan was $17,531,555; the total market value of collateral held by the Fund was $18,211,734. The market value of the collateral held included non-cash collateral in the form of U.S. Treasury securities with a value of $8,272,706. The Fund received cash collateral with a value of $9,939,028. (See Note 2(L)) |
| (g) | Illiquid security—As of October 31, 2022, the total market value deemed illiquid under procedures approved by the Board of Trustees was $1,104,775, which represented 0.1% of the Fund’s net assets.(Unaudited) |
| (h) | Collateralized Mortgage Obligation Interest Only Strip—Pays a fixed or variable rate of interest based on mortgage loans or mortgage pass-through securities. The principal amount of the underlying pool represents the notional amount on which the current interest was calculated. The value of these stripped securities may be particularly sensitive to changes in prevailing interest rates and are typically more sensitive to changes in prepayment rates than traditional mortgage-backed securities. |
| (i) | Coupon rate may change based on changes of the underlying collateral or prepayments of principal. Rate shown was the rate in effect as of October 31, 2022. |
| (j) | Collateral strip rate—A bond whose interest was based on the weighted net interest rate of the collateral. The coupon rate adjusts periodically based on a predetermined schedule. Rate shown was the rate in effect as of October 31, 2022. |
| (k) | Non-income producing security. |
| (l) | Current yield as of October 31, 2022. |
| (m) | Represents a security purchased with cash collateral received for securities on loan. |
Investments in Affiliates (in 000's)
Investments in issuers considered to be affiliate(s) of the Fund during the year ended October 31, 2022 for purposes of Section 2(a)(3) of the Investment Company Act of 1940, as amended, were as follows:
| Affiliated Investment Companies | Value,
Beginning
of Year | Purchases
at Cost | Proceeds
from
Sales | Net
Realized
Gain/(Loss)
on Sales | Change in
Unrealized
Appreciation/
(Depreciation) | Value,
End of
Year | Dividend
Income | Other
Distributions | Shares
End of
Year |
| MainStay U.S. Government Liquidity Fund | $ 87,328 | $ 612,914 | $ (682,132) | $ — | $ — | $ 18,110 | $ 101 | $ — | 18,110 |
The notes to the financial statements are an integral part of, and should be read in conjunction with, the financial statements.
| 28 | MainStay Income Builder Fund |
Foreign Currency Forward Contracts
As of October 31, 2022, the Fund held the following foreign currency forward contracts1:
| Currency Purchased | Currency Sold | Counterparty | Settlement
Date | Unrealized
Appreciation
(Depreciation) |
| EUR | 935,000 | USD | 922,844 | JPMorgan Chase Bank N.A. | 11/7/22 | $ 1,485 |
| USD | 15,153,727 | AUD | 23,293,000 | JPMorgan Chase Bank N.A. | 11/7/22 | 252,330 |
| USD | 23,347,708 | EUR | 22,698,000 | JPMorgan Chase Bank N.A. | 11/7/22 | 908,756 |
| USD | 18,941,933 | EUR | 18,634,336 | JPMorgan Chase Bank N.A. | 2/6/23 | 378,091 |
| USD | 43,459 | GBP | 36,000 | JPMorgan Chase Bank N.A. | 11/7/22 | 2,169 |
| USD | 41,983 | GBP | 36,000 | JPMorgan Chase Bank N.A. | 2/6/23 | 564 |
| USD | 17,526,977 | JPY | 2,564,705,000 | JPMorgan Chase Bank N.A. | 11/7/22 | 269,562 |
| Total Unrealized Appreciation | 1,812,957 |
| AUD | 23,293,000 | USD | 16,218,403 | JPMorgan Chase Bank N.A. | 11/7/22 | (1,317,006) |
| AUD | 23,293,000 | USD | 15,205,833 | JPMorgan Chase Bank N.A. | 2/6/23 | (256,104) |
| EUR | 3,128,664 | USD | 3,119,876 | JPMorgan Chase Bank N.A. | 11/7/22 | (26,919) |
| EUR | 18,634,336 | USD | 18,800,927 | JPMorgan Chase Bank N.A. | 11/7/22 | (379,262) |
| GBP | 36,000 | USD | 41,862 | JPMorgan Chase Bank N.A. | 11/7/22 | (572) |
| JPY | 2,564,705,000 | USD | 18,914,619 | JPMorgan Chase Bank N.A. | 11/7/22 | (1,657,203) |
| JPY | 2,564,705,000 | USD | 17,747,104 | JPMorgan Chase Bank N.A. | 2/6/23 | (271,058) |
| Total Unrealized Depreciation | (3,908,124) |
| Net Unrealized Depreciation | $ (2,095,167) |
| 1. | Foreign Currency Forward Contracts are subject to limitations such that they cannot be “sold or repurchased,” although the Fund would be able to exit the transaction through other means, such as through the execution of an offsetting transaction. |
Futures Contracts
As of October 31, 2022, the Fund held the following futures contracts1:
| Type | Number of
Contracts | Expiration
Date | Value at
Trade Date | Current
Notional
Amount | Unrealized
Appreciation
(Depreciation)2 |
| Long Contracts | | | | | |
| E-Mini Energy Select Sector Index | 390 | December 2022 | $ 32,651,541 | $ 36,730,200 | $ 4,078,659 |
| E-Mini Health Care Select Sector Index | 202 | December 2022 | 26,691,109 | 27,171,020 | 479,911 |
| Russell 2000 E-Mini Index | 451 | December 2022 | 42,621,633 | 41,785,150 | (836,483) |
| S&P 500 E-Mini Index | 237 | December 2022 | 45,167,742 | 46,013,550 | 845,808 |
| U.S. Treasury 2 Year Notes | 296 | December 2022 | 61,544,350 | 60,497,312 | (1,047,038) |
| U.S. Treasury 5 Year Notes | 147 | December 2022 | 15,743,491 | 15,669,281 | (74,210) |
| U.S. Treasury 10 Year Notes | 331 | December 2022 | 38,552,376 | 36,606,531 | (1,945,845) |
| U.S. Treasury 10 Year Ultra Bonds | 312 | December 2022 | 37,469,834 | 36,187,125 | (1,282,709) |
| U.S. Treasury Long Bonds | 125 | December 2022 | 15,978,533 | 15,062,500 | (916,033) |
| U.S. Treasury Ultra Bonds | 107 | December 2022 | 15,980,035 | 13,659,219 | (2,320,816) |
| Yen Denominated Nikkei 225 Index | 304 | December 2022 | 27,917,149 | 28,162,346 | 245,197 |
| Total Long Contracts | | | | | (2,773,559) |
| Short Contracts | | | | | |
| E-Mini Financial Select Sector Index | (50) | December 2022 | (5,293,593) | (5,238,125) | 55,468 |
| E-Mini Industrial Equity Index | (81) | December 2022 | (7,785,494) | (7,713,630) | 71,864 |
| Euro STOXX 50 Index | (1,508) | December 2022 | (54,054,302) | (53,918,367) | 135,935 |
| FTSE 100 Index | (45) | December 2022 | (3,845,610) | (3,667,896) | 177,714 |
| S&P E-Mini Commercial Service Equity Index | (180) | December 2022 | (13,163,581) | (11,398,500) | 1,765,081 |
| Total Short Contracts | | | | | 2,206,062 |
| Net Unrealized Depreciation | | | | | $ (567,497) |
| 1. | As of October 31, 2022, cash in the amount of $18,589,068 was on deposit with a broker or futures commission merchant for futures transactions. |
| 2. | Represents the difference between the value of the contracts at the time they were opened and the value as of October 31, 2022. |
The notes to the financial statements are an integral part of, and should be read in conjunction with, the financial statements.
29
Portfolio of Investments October 31, 2022† (continued)
| Abbreviation(s): |
| ADR—American Depositary Receipt |
| AUD—Australia Dollar |
| EUR—Euro |
| FHLMC—Federal Home Loan Mortgage Corp. |
| FNMA—Federal National Mortgage Association |
| FREMF—Freddie Mac Multifamily |
| FTSE—Financial Times Stock Exchange |
| GBP—British Pound Sterling |
| GDR—Global Depositary Receipt |
| GNMA—Government National Mortgage Association |
| JPY—Japanese Yen |
| LIBOR—London Interbank Offered Rate |
| REMIC—Real Estate Mortgage Investment Conduit |
| SOFR—Secured Overnight Financing Rate |
| UMBS—Uniform Mortgage Backed Securities |
| USD—United States Dollar |
The notes to the financial statements are an integral part of, and should be read in conjunction with, the financial statements.
| 30 | MainStay Income Builder Fund |
The following is a summary of the fair valuations according to the inputs used as of October 31, 2022, for valuing the Fund’s assets and liabilities:
| Description | Quoted
Prices in
Active
Markets for
Identical
Assets
(Level 1) | | Significant
Other
Observable
Inputs
(Level 2) | | Significant
Unobservable
Inputs
(Level 3) | | Total |
| Asset Valuation Inputs | | | | | | | |
| Investments in Securities (a) | | | | | | | |
| Long-Term Bonds | | | | | | | |
| Asset-Backed Securities | $ — | | $ 54,789,635 | | $ — | | $ 54,789,635 |
| Corporate Bonds | — | | 255,273,792 | | — | | 255,273,792 |
| Foreign Government Bonds | — | | 8,730,917 | | — | | 8,730,917 |
| Loan Assignments | — | | 1,183,087 | | — | | 1,183,087 |
| Mortgage-Backed Securities | — | | 126,704,488 | | — | | 126,704,488 |
| Municipal Bond | — | | 1,613,115 | | — | | 1,613,115 |
| U.S. Government & Federal Agencies | — | | 59,056,682 | | — | | 59,056,682 |
| Total Long-Term Bonds | — | | 507,351,716 | | — | | 507,351,716 |
| Common Stocks | 698,466,324 | | — | | — | | 698,466,324 |
| Short-Term Investments | | | | | | | |
| Affiliated Investment Company | 18,109,962 | | — | | — | | 18,109,962 |
| Unaffiliated Investment Companies | 9,939,028 | | — | | — | | 9,939,028 |
| Total Short-Term Investments | 28,048,990 | | — | | — | | 28,048,990 |
| Total Investments in Securities | 726,515,314 | | 507,351,716 | | — | | 1,233,867,030 |
| Other Financial Instruments (b) | | | | | | | |
| Foreign Currency Forward Contracts | — | | 1,812,957 | | — | | 1,812,957 |
| Futures Contracts | 7,855,637 | | — | | — | | 7,855,637 |
| Total Other Financial Instruments | 7,855,637 | | 1,812,957 | | — | | 9,668,594 |
| Total Investments in Securities and Other Financial Instruments | $ 734,370,951 | | $ 509,164,673 | | $ — | | $ 1,243,535,624 |
| Liability Valuation Inputs | | | | | | | |
| Other Financial Instruments (b) | | | | | | | |
| Foreign Currency Forward Contracts | $ — | | $ (3,908,124) | | $ — | | $ (3,908,124) |
| Futures Contracts | (8,423,134) | | — | | — | | (8,423,134) |
| Total Other Financial Instruments | $ (8,423,134) | | $ (3,908,124) | | $ — | | $ (12,331,258) |
| (a) | For a complete listing of investments and their industries, see the Portfolio of Investments. |
| (b) | The value listed for these securities reflects unrealized appreciation (depreciation) as shown on the Portfolio of Investments. |
The notes to the financial statements are an integral part of, and should be read in conjunction with, the financial statements.
31
Statement of Assets and Liabilities as of October 31, 2022
| Assets |
Investment in unaffiliated securities, at value
(identified cost $1,228,335,845) including securities on loan of $17,531,555 | $1,215,757,068 |
Investment in affiliated investment companies, at value
(identified cost $18,109,962) | 18,109,962 |
| Cash | 82,641 |
Cash denominated in foreign currencies
(identified cost $135,698) | 135,683 |
| Cash collateral on deposit at broker for futures contracts | 18,589,068 |
| Receivables: | |
| Dividends and interest | 6,018,520 |
| Investment securities sold | 1,617,116 |
| Fund shares sold | 1,217,388 |
| Securities lending | 5,028 |
| Unrealized appreciation on foreign currency forward contracts | 1,812,957 |
| Other assets | 105,760 |
| Total assets | 1,263,451,191 |
| Liabilities |
| Cash collateral received for securities on loan | 9,939,028 |
| Payables: | |
| Fund shares redeemed | 1,438,347 |
| Investment securities purchased | 1,296,777 |
| Variation margin on futures contracts | 767,702 |
| Manager (See Note 3) | 644,505 |
| Transfer agent (See Note 3) | 274,788 |
| NYLIFE Distributors (See Note 3) | 223,701 |
| Shareholder communication | 170,689 |
| Professional fees | 28,957 |
| Custodian | 19,184 |
| Trustees | 416 |
| Accrued expenses | 24,900 |
| Distributions payable | 125,051 |
| Unrealized depreciation on foreign currency forward contracts | 3,908,124 |
| Total liabilities | 18,862,169 |
| Net assets | $1,244,589,022 |
| Composition of Net Assets |
| Shares of beneficial interest outstanding (par value of $.01 per share) unlimited number of shares authorized | $ 730,119 |
| Additional paid-in-capital | 1,351,389,026 |
| | 1,352,119,145 |
| Total distributable earnings (loss) | (107,530,123) |
| Net assets | $1,244,589,022 |
| Class A | |
| Net assets applicable to outstanding shares | $664,733,669 |
| Shares of beneficial interest outstanding | 39,170,882 |
| Net asset value per share outstanding | $ 16.97 |
| Maximum sales charge (3.00% of offering price) | 0.52 |
| Maximum offering price per share outstanding | $ 17.49 |
| Investor Class | |
| Net assets applicable to outstanding shares | $ 60,808,313 |
| Shares of beneficial interest outstanding | 3,579,464 |
| Net asset value per share outstanding | $ 16.99 |
| Maximum sales charge (2.50% of offering price) | 0.44 |
| Maximum offering price per share outstanding | $ 17.43 |
| Class B | |
| Net assets applicable to outstanding shares | $ 8,591,466 |
| Shares of beneficial interest outstanding | 501,877 |
| Net asset value and offering price per share outstanding | $ 17.12 |
| Class C | |
| Net assets applicable to outstanding shares | $ 76,893,660 |
| Shares of beneficial interest outstanding | 4,501,431 |
| Net asset value and offering price per share outstanding | $ 17.08 |
| Class I | |
| Net assets applicable to outstanding shares | $339,868,474 |
| Shares of beneficial interest outstanding | 19,798,602 |
| Net asset value and offering price per share outstanding | $ 17.17 |
| Class R2 | |
| Net assets applicable to outstanding shares | $ 1,712,743 |
| Shares of beneficial interest outstanding | 100,923 |
| Net asset value and offering price per share outstanding | $ 16.97 |
| Class R3 | |
| Net assets applicable to outstanding shares | $ 2,254,702 |
| Shares of beneficial interest outstanding | 132,880 |
| Net asset value and offering price per share outstanding | $ 16.97 |
| Class R6 | |
| Net assets applicable to outstanding shares | $ 89,691,617 |
| Shares of beneficial interest outstanding | 5,223,842 |
| Net asset value and offering price per share outstanding | $ 17.17 |
| SIMPLE Class | |
| Net assets applicable to outstanding shares | $ 34,378 |
| Shares of beneficial interest outstanding | 2,024 |
| Net asset value and offering price per share outstanding | $ 16.99 |
The notes to the financial statements are an integral part of, and should be read in conjunction with, the financial statements.
| 32 | MainStay Income Builder Fund |
Statement of Operations for the year ended October 31, 2022
| Investment Income (Loss) |
| Income | |
| Dividends-unaffiliated (net of foreign tax withholding of $1,215,005) | $ 24,282,118 |
| Interest | 23,431,243 |
| Securities lending, net | 151,905 |
| Dividends-affiliated | 101,259 |
| Total income | 47,966,525 |
| Expenses | |
| Manager (See Note 3) | 9,103,197 |
| Distribution/Service—Class A (See Note 3) | 1,894,236 |
| Distribution/Service—Investor Class (See Note 3) | 172,435 |
| Distribution/Service—Class B (See Note 3) | 124,002 |
| Distribution/Service—Class C (See Note 3) | 1,046,634 |
| Distribution/Service—Class R2 (See Note 3) | 6,172 |
| Distribution/Service—Class R3 (See Note 3) | 10,975 |
| Distribution/Service—SIMPLE Class (See Note 3) | 171 |
| Transfer agent (See Note 3) | 1,615,889 |
| Shareholder communication | 275,046 |
| Professional fees | 213,459 |
| Registration | 155,565 |
| Custodian | 97,188 |
| Trustees | 30,956 |
| Shareholder service (See Note 3) | 4,664 |
| Miscellaneous | 123,894 |
| Total expenses | 14,874,483 |
| Net investment income (loss) | 33,092,042 |
| Realized and Unrealized Gain (Loss) |
| Net realized gain (loss) on: | |
| Unaffiliated investment transactions | (13,435,073) |
| Futures transactions | (48,318,332) |
| Foreign currency transactions | (1,737,851) |
| Foreign currency forward transactions | (18,772,770) |
| Net realized gain (loss) | (82,264,026) |
| Net change in unrealized appreciation (depreciation) on: | |
| Unaffiliated investments | (192,376,335) |
| Futures contracts | (8,916,465) |
| Foreign currency forward contracts | 1,380,451 |
| Translation of other assets and liabilities in foreign currencies | (2,614,014) |
| Net change in unrealized appreciation (depreciation) | (202,526,363) |
| Net realized and unrealized gain (loss) | (284,790,389) |
| Net increase (decrease) in net assets resulting from operations | $(251,698,347) |
The notes to the financial statements are an integral part of, and should be read in conjunction with, the financial statements.
33
Statements of Changes in Net Assets
for the years ended October 31, 2022 and October 31, 2021
| | 2022 | 2021 |
| Increase (Decrease) in Net Assets |
| Operations: | | |
| Net investment income (loss) | $ 33,092,042 | $ 32,924,972 |
| Net realized gain (loss) | (82,264,026) | 123,184,175 |
| Net change in unrealized appreciation (depreciation) | (202,526,363) | 123,462,686 |
| Net increase (decrease) in net assets resulting from operations | (251,698,347) | 279,571,833 |
| Distributions to shareholders: | | |
| Class A | (59,730,525) | (18,176,751) |
| Investor Class | (5,452,199) | (1,829,216) |
| Class B | (979,036) | (282,317) |
| Class C | (8,023,824) | (2,183,521) |
| Class I | (35,876,071) | (13,104,698) |
| Class R2 | (207,016) | (74,013) |
| Class R3 | (151,022) | (40,509) |
| Class R6 | (8,154,514) | (2,830,897) |
| SIMPLE Class | (2,491) | (545) |
| | (118,576,698) | (38,522,467) |
| Distributions to shareholders from return of capital: | | |
| Class A | (465,612) | — |
| Investor Class | (42,501) | — |
| Class B | (7,632) | — |
| Class C | (62,547) | — |
| Class I | (279,661) | — |
| Class R2 | (1,614) | — |
| Class R3 | (1,177) | — |
| Class R6 | (63,566) | — |
| SIMPLE Class | (19) | — |
| | (924,329) | — |
| Total distributions to shareholders | (119,501,027) | (38,522,467) |
| Capital share transactions: | | |
| Net proceeds from sales of shares | 167,690,377 | 258,084,982 |
| Net asset value of shares issued to shareholders in reinvestment of distributions | 110,787,284 | 35,293,233 |
| Cost of shares redeemed | (328,996,310) | (298,729,082) |
| Increase (decrease) in net assets derived from capital share transactions | (50,518,649) | (5,350,867) |
| Net increase (decrease) in net assets | (421,718,023) | 235,698,499 |
| Net Assets |
| Beginning of year | 1,666,307,045 | 1,430,608,546 |
| End of year | $1,244,589,022 | $1,666,307,045 |
The notes to the financial statements are an integral part of, and should be read in conjunction with, the financial statements.
| 34 | MainStay Income Builder Fund |
Financial Highlights selected per share data and ratios
| | Year Ended October 31, |
| Class A | 2022 | | 2021 | | 2020 | | 2019 | | 2018 |
| Net asset value at beginning of year | $ 21.75 | | $ 18.61 | | $ 19.96 | | $ 18.51 | | $ 19.97 |
| Net investment income (loss) (a) | 0.42 | | 0.43 | | 0.44 | | 0.54 | | 0.52 |
| Net realized and unrealized gain (loss) | (3.63) | | 3.22 | | (0.61) | | 1.79 | | (0.97) |
| Total from investment operations | (3.21) | | 3.65 | | (0.17) | | 2.33 | | (0.45) |
| Less distributions: | | | | | | | | | |
| From net investment income | (0.42) | | (0.51) | | (0.42) | | (0.56) | | (0.52) |
| From net realized gain on investments | (1.14) | | — | | (0.76) | | (0.32) | | (0.49) |
| Return of capital | (0.01) | | — | | — | | — | | — |
| Total distributions | (1.57) | | (0.51) | | (1.18) | | (0.88) | | (1.01) |
| Net asset value at end of year | $ 16.97 | | $ 21.75 | | $ 18.61 | | $ 19.96 | | $ 18.51 |
| Total investment return (b) | (15.75)% | | 19.74% | | (0.90)% | | 13.09% | | (2.38)% |
| Ratios (to average net assets)/Supplemental Data: | | | | | | | | | |
| Net investment income (loss) | 2.24% | | 2.04% | | 2.32% | | 2.83% | | 2.72% |
| Net expenses (c) | 1.02% | | 0.99% | | 1.02% | | 1.02% | | 1.01% |
| Portfolio turnover rate | 61% | | 57%(d) | | 65%(d) | | 62%(d) | | 44%(d) |
| Net assets at end of year (in 000’s) | $ 664,734 | | $ 818,764 | | $ 638,250 | | $ 625,049 | | $ 571,206 |
| (a) | Per share data based on average shares outstanding during the year. |
| (b) | Total investment return is calculated exclusive of sales charges and assumes the reinvestment of dividends and distributions. For periods of less than one year, total return is not annualized. |
| (c) | In addition to the fees and expenses which the Fund bears directly, it also indirectly bears a pro-rata share of the fees and expenses of the underlying funds in which it invests. Such indirect expenses are not included in the above expense ratios. |
| (d) | The portfolio turnover rates not including mortgage dollar rolls were 56%, 62%, 54% and 36% for the years ended October 31, 2021, 2020, 2019 and 2018, respectively. |
| | Year Ended October 31, |
| Investor Class | 2022 | | 2021 | | 2020 | | 2019 | | 2018 |
| Net asset value at beginning of year | $ 21.77 | | $ 18.62 | | $ 19.98 | | $ 18.52 | | $ 19.99 |
| Net investment income (loss) (a) | 0.39 | | 0.40 | | 0.41 | | 0.51 | | 0.50 |
| Net realized and unrealized gain (loss) | (3.63) | | 3.22 | | (0.62) | | 1.80 | | (0.98) |
| Total from investment operations | (3.24) | | 3.62 | | (0.21) | | 2.31 | | (0.48) |
| Less distributions: | | | | | | | | | |
| From net investment income | (0.39) | | (0.47) | | (0.39) | | (0.53) | | (0.50) |
| From net realized gain on investments | (1.14) | | — | | (0.76) | | (0.32) | | (0.49) |
| Return of capital | (0.01) | | — | | — | | — | | — |
| Total distributions | (1.54) | | (0.47) | | (1.15) | | (0.85) | | (0.99) |
| Net asset value at end of year | $ 16.99 | | $ 21.77 | | $ 18.62 | | $ 19.98 | | $ 18.52 |
| Total investment return (b) | (15.89)% | | 19.56% | | (1.11)% | | 12.98% | | (2.56)% |
| Ratios (to average net assets)/Supplemental Data: | | | | | | | | | |
| Net investment income (loss) | 2.05% | | 1.88% | | 2.16% | | 2.70% | | 2.59% |
| Net expenses (c) | 1.20% | | 1.18% | | 1.17% | | 1.16% | | 1.13% |
| Expenses (before waiver/reimbursement) (c) | 1.20% | | 1.18% | | 1.17% | | 1.17% | | 1.14% |
| Portfolio turnover rate | 61% | | 57%(d) | | 65%(d) | | 62%(d) | | 44%(d) |
| Net assets at end of year (in 000's) | $ 60,808 | | $ 77,887 | | $ 79,992 | | $ 88,050 | | $ 85,132 |
| (a) | Per share data based on average shares outstanding during the year. |
| (b) | Total investment return is calculated exclusive of sales charges and assumes the reinvestment of dividends and distributions. For periods of less than one year, total return is not annualized. |
| (c) | In addition to the fees and expenses which the Fund bears directly, it also indirectly bears a pro-rata share of the fees and expenses of the underlying funds in which it invests. Such indirect expenses are not included in the above expense ratios. |
| (d) | The portfolio turnover rates not including mortgage dollar rolls were 56%, 62%, 54% and 36% for the years ended October 31, 2021, 2020, 2019 and 2018, respectively. |
The notes to the financial statements are an integral part of, and should be read in conjunction with, the financial statements.
35
Financial Highlights selected per share data and ratios
| | Year Ended October 31, |
| Class B | 2022 | | 2021 | | 2020 | | 2019 | | 2018 |
| Net asset value at beginning of year | $ 21.93 | | $ 18.75 | | $ 20.11 | | $ 18.64 | | $ 20.10 |
| Net investment income (loss) (a) | 0.25 | | 0.24 | | 0.27 | | 0.37 | | 0.36 |
| Net realized and unrealized gain (loss) | (3.67) | | 3.25 | | (0.62) | | 1.81 | | (0.98) |
| Total from investment operations | (3.42) | | 3.49 | | (0.35) | | 2.18 | | (0.62) |
| Less distributions: | | | | | | | | | |
| From net investment income | (0.24) | | (0.31) | | (0.25) | | (0.39) | | (0.35) |
| From net realized gain on investments | (1.14) | | — | | (0.76) | | (0.32) | | (0.49) |
| Return of capital | (0.01) | | — | | — | | — | | — |
| Total distributions | (1.39) | | (0.31) | | (1.01) | | (0.71) | | (0.84) |
| Net asset value at end of year | $ 17.12 | | $ 21.93 | | $ 18.75 | | $ 20.11 | | $ 18.64 |
| Total investment return (b) | (16.56)% | | 18.69% | | (1.84)% | | 12.11% | | (3.22)% |
| Ratios (to average net assets)/Supplemental Data: | | | | | | | | | |
| Net investment income (loss) | 1.28% | | 1.13% | | 1.42% | | 1.96% | | 1.85% |
| Net expenses (c) | 1.95% | | 1.93% | | 1.92% | | 1.91% | | 1.88% |
| Expenses (before waiver/reimbursement) (c) | 1.95% | | 1.93% | | 1.92% | | 1.92% | | 1.89% |
| Portfolio turnover rate | 61% | | 57%(d) | | 65%(d) | | 62%(d) | | 44%(d) |
| Net assets at end of year (in 000’s) | $ 8,591 | | $ 16,789 | | $ 19,409 | | $ 26,396 | | $ 30,343 |
| (a) | Per share data based on average shares outstanding during the year. |
| (b) | Total investment return is calculated exclusive of sales charges and assumes the reinvestment of dividends and distributions. For periods of less than one year, total return is not annualized. |
| (c) | In addition to the fees and expenses which the Fund bears directly, it also indirectly bears a pro-rata share of the fees and expenses of the underlying funds in which it invests. Such indirect expenses are not included in the above expense ratios. |
| (d) | The portfolio turnover rates not including mortgage dollar rolls were 56%, 62%, 54% and 36% for the years ended October 31, 2021, 2020, 2019 and 2018, respectively. |
| | Year Ended October 31, |
| Class C | 2022 | | 2021 | | 2020 | | 2019 | | 2018 |
| Net asset value at beginning of year | $ 21.88 | | $ 18.71 | | $ 20.07 | | $ 18.60 | | $ 20.07 |
| Net investment income (loss) (a) | 0.25 | | 0.24 | | 0.27 | | 0.37 | | 0.36 |
| Net realized and unrealized gain (loss) | (3.66) | | 3.24 | | (0.62) | | 1.81 | | (0.99) |
| Total from investment operations | (3.41) | | 3.48 | | (0.35) | | 2.18 | | (0.63) |
| Less distributions: | | | | | | | | | |
| From net investment income | (0.24) | | (0.31) | | (0.25) | | (0.39) | | (0.35) |
| From net realized gain on investments | (1.14) | | — | | (0.76) | | (0.32) | | (0.49) |
| Return of capital | (0.01) | | — | | — | | — | | — |
| Total distributions | (1.39) | | (0.31) | | (1.01) | | (0.71) | | (0.84) |
| Net asset value at end of year | $ 17.08 | | $ 21.88 | | $ 18.71 | | $ 20.07 | | $ 18.60 |
| Total investment return (b) | (16.55)% | | 18.68% | | (1.85)% | | 12.13% | | (3.28)% |
| Ratios (to average net assets)/Supplemental Data: | | | | | | | | | |
| Net investment income (loss) | 1.29% | | 1.13% | | 1.42% | | 1.95% | | 1.85% |
| Net expenses (c) | 1.95% | | 1.93% | | 1.92% | | 1.91% | | 1.88% |
| Expenses (before waiver/reimbursement) (c) | 1.95% | | 1.93% | | 1.92% | | 1.92% | | 1.89% |
| Portfolio turnover rate | 61% | | 57%(d) | | 65%(d) | | 62%(d) | | 44%(d) |
| Net assets at end of year (in 000’s) | $ 76,894 | | $ 132,596 | | $ 148,220 | | $ 191,737 | | $ 212,400 |
| (a) | Per share data based on average shares outstanding during the year. |
| (b) | Total investment return is calculated exclusive of sales charges and assumes the reinvestment of dividends and distributions. For periods of less than one year, total return is not annualized. |
| (c) | In addition to the fees and expenses which the Fund bears directly, it also indirectly bears a pro-rata share of the fees and expenses of the underlying funds in which it invests. Such indirect expenses are not included in the above expense ratios. |
| (d) | The portfolio turnover rates not including mortgage dollar rolls were 56%, 62%, 54% and 36% for the years ended October 31, 2021, 2020, 2019 and 2018, respectively. |
The notes to the financial statements are an integral part of, and should be read in conjunction with, the financial statements.
| 36 | MainStay Income Builder Fund |
Financial Highlights selected per share data and ratios
| | Year Ended October 31, |
| Class I | 2022 | | 2021 | | 2020 | | 2019 | | 2018 |
| Net asset value at beginning of year | $ 21.99 | | $ 18.80 | | $ 20.16 | | $ 18.68 | | $ 20.15 |
| Net investment income (loss) (a) | 0.48 | | 0.49 | | 0.49 | | 0.59 | | 0.58 |
| Net realized and unrealized gain (loss) | (3.68) | | 3.26 | | (0.62) | | 1.82 | | (0.99) |
| Total from investment operations | (3.20) | | 3.75 | | (0.13) | | 2.41 | | (0.41) |
| Less distributions: | | | | | | | | | |
| From net investment income | (0.47) | | (0.56) | | (0.47) | | (0.61) | | (0.57) |
| From net realized gain on investments | (1.14) | | — | | (0.76) | | (0.32) | | (0.49) |
| Return of capital | (0.01) | | — | | — | | — | | — |
| Total distributions | (1.62) | | (0.56) | | (1.23) | | (0.93) | | (1.06) |
| Net asset value at end of year | $ 17.17 | | $ 21.99 | | $ 18.80 | | $ 20.16 | | $ 18.68 |
| Total investment return (b) | (15.55)% | | 20.10% | | (0.69)% | | 13.41% | | (2.17)% |
| Ratios (to average net assets)/Supplemental Data: | | | | | | | | | |
| Net investment income (loss) | 2.48% | | 2.30% | | 2.57% | | 3.09% | | 3.03% |
| Net expenses (c) | 0.77% | | 0.74% | | 0.77% | | 0.77% | | 0.76% |
| Portfolio turnover rate | 61% | | 57%(d) | | 65%(d) | | 62%(d) | | 44%(d) |
| Net assets at end of year (in 000’s) | $ 339,868 | | $ 505,806 | | $ 448,922 | | $ 484,614 | | $ 499,675 |
| (a) | Per share data based on average shares outstanding during the year. |
| (b) | Total investment return is calculated exclusive of sales charges and assumes the reinvestment of dividends and distributions. Class I shares are not subject to sales charges. For periods of less than one year, total return is not annualized. |
| (c) | In addition to the fees and expenses which the Fund bears directly, it also indirectly bears a pro-rata share of the fees and expenses of the underlying funds in which it invests. Such indirect expenses are not included in the above expense ratios. |
| (d) | The portfolio turnover rates not including mortgage dollar rolls were 56%, 62%, 54% and 36% for the years ended October 31, 2021, 2020, 2019 and 2018, respectively. |
| | Year Ended October 31, |
| Class R2 | 2022 | | 2021 | | 2020 | | 2019 | | 2018 |
| Net asset value at beginning of year | $ 21.75 | | $ 18.61 | | $ 19.95 | | $ 18.50 | | $ 19.96 |
| Net investment income (loss) (a) | 0.41 | | 0.41 | | 0.42 | | 0.52 | | 0.50 |
| Net realized and unrealized gain (loss) | (3.64) | | 3.22 | | (0.59) | | 1.79 | | (0.97) |
| Total from investment operations | (3.23) | | 3.63 | | (0.17) | | 2.31 | | (0.47) |
| Less distributions: | | | | | | | | | |
| From net investment income | (0.40) | | (0.49) | | (0.41) | | (0.54) | | (0.50) |
| From net realized gain on investments | (1.14) | | — | | (0.76) | | (0.32) | | (0.49) |
| Return of capital | (0.01) | | — | | — | | — | | — |
| Total distributions | (1.55) | | (0.49) | | (1.17) | | (0.86) | | (0.99) |
| Net asset value at end of year | $ 16.97 | | $ 21.75 | | $ 18.61 | | $ 19.95 | | $ 18.50 |
| Total investment return (b) | (15.84)% | | 19.68% | | (1.00)% | | 12.98% | | (2.48)% |
| Ratios (to average net assets)/Supplemental Data: | | | | | | | | | |
| Net investment income (loss) | 2.15% | | 1.96% | | 2.21% | | 2.77% | | 2.61% |
| Net expenses (c) | 1.12% | | 1.09% | | 1.11% | | 1.12% | | 1.11% |
| Portfolio turnover rate | 61% | | 57%(d) | | 65%(d) | | 62%(d) | | 44%(d) |
| Net assets at end of year (in 000’s) | $ 1,713 | | $ 2,961 | | $ 3,044 | | $ 2,524 | | $ 3,587 |
| (a) | Per share data based on average shares outstanding during the year. |
| (b) | Total investment return is calculated exclusive of sales charges and assumes the reinvestment of dividends and distributions. Class R2 shares are not subject to sales charges. For periods of less than one year, total return is not annualized. |
| (c) | In addition to the fees and expenses which the Fund bears directly, it also indirectly bears a pro-rata share of the fees and expenses of the underlying funds in which it invests. Such indirect expenses are not included in the above expense ratios. |
| (d) | The portfolio turnover rates not including mortgage dollar rolls were 56%, 62%, 54% and 36% for the years ended October 31, 2021, 2020, 2019 and 2018, respectively. |
The notes to the financial statements are an integral part of, and should be read in conjunction with, the financial statements.
37
Financial Highlights selected per share data and ratios
| | Year Ended October 31, |
| Class R3 | 2022 | | 2021 | | 2020 | | 2019 | | 2018 |
| Net asset value at beginning of year | $ 21.75 | | $ 18.61 | | $ 19.96 | | $ 18.51 | | $ 19.97 |
| Net investment income (loss) (a) | 0.36 | | 0.36 | | 0.37 | | 0.45 | | 0.42 |
| Net realized and unrealized gain (loss) | (3.64) | | 3.22 | | (0.60) | | 1.82 | | (0.94) |
| Total from investment operations | (3.28) | | 3.58 | | (0.23) | | 2.27 | | (0.52) |
| Less distributions: | | | | | | | | | |
| From net investment income | (0.35) | | (0.44) | | (0.36) | | (0.50) | | (0.45) |
| From net realized gain on investments | (1.14) | | — | | (0.76) | | (0.32) | | (0.49) |
| Return of capital | (0.01) | | — | | — | | — | | — |
| Total distributions | (1.50) | | (0.44) | | (1.12) | | (0.82) | | (0.94) |
| Net asset value at end of year | $ 16.97 | | $ 21.75 | | $ 18.61 | | $ 19.96 | | $ 18.51 |
| Total investment return (b) | (16.09)% | | 19.39% | | (1.24)% | | 12.70% | | (2.73)% |
| Ratios (to average net assets)/Supplemental Data: | | | | | | | | | |
| Net investment income (loss) | 1.90% | | 1.70% | | 1.97% | | 2.34% | | 2.19% |
| Net expenses (c) | 1.37% | | 1.34% | | 1.37% | | 1.36% | | 1.35% |
| Portfolio turnover rate | 61% | | 57%(d) | | 65%(d) | | 62%(d) | | 44%(d) |
| Net assets at end of year (in 000’s) | $ 2,255 | | $ 2,088 | | $ 1,196 | | $ 590 | | $ 136 |
| (a) | Per share data based on average shares outstanding during the year. |
| (b) | Total investment return is calculated exclusive of sales charges and assumes the reinvestment of dividends and distributions. Class R3 shares are not subject to sales charges. For periods of less than one year, total return is not annualized. |
| (c) | In addition to the fees and expenses which the Fund bears directly, it also indirectly bears a pro-rata share of the fees and expenses of the underlying funds in which it invests. Such indirect expenses are not included in the above expense ratios. |
| (d) | The portfolio turnover rates not including mortgage dollar rolls were 56%, 62%, 54% and 36% for the years ended October 31, 2021, 2020, 2019 and 2018, respectively. |
| | Year Ended October 31, | | February 28, 2018^ through
October 31,
2018 |
| Class R6 | 2022 | | 2021 | | 2020 | | 2019 | |
| Net asset value at beginning of period | $ 21.99 | | $ 18.80 | | $ 20.16 | | $ 18.68 | | $ 19.19 |
| Net investment income (loss) (a) | 0.49 | | 0.51 | | 0.51 | | 0.61 | | 0.33 |
| Net realized and unrealized gain (loss) | (3.67) | | 3.26 | | (0.62) | | 1.82 | | (0.44) |
| Total from investment operations | (3.18) | | 3.77 | | (0.11) | | 2.43 | | (0.11) |
| Less distributions: | | | | | | | | | |
| From net investment income | (0.49) | | (0.58) | | (0.49) | | (0.63) | | (0.40) |
| From net realized gain on investments | (1.14) | | — | | (0.76) | | (0.32) | | — |
| Return of capital | (0.01) | | — | | — | | — | | — |
| Total distributions | (1.64) | | (0.58) | | (1.25) | | (0.95) | | (0.40) |
| Net asset value at end of period | $ 17.17 | | $ 21.99 | | $ 18.80 | | $ 20.16 | | $ 18.68 |
| Total investment return (b) | (15.48)% | | 20.20% | | (0.60)% | | 13.52% | | (0.61)% |
| Ratios (to average net assets)/Supplemental Data: | | | | | | | | | |
| Net investment income (loss) | 2.57% | | 2.38% | | 2.67% | | 3.18% | | 2.55%†† |
| Net expenses (c) | 0.68% | | 0.66% | | 0.67% | | 0.67% | | 0.66%†† |
| Portfolio turnover rate | 61% | | 57%(d) | | 65%(d) | | 62%(d) | | 44%(d) |
| Net assets at end of period (in 000’s) | $ 89,692 | | $ 109,387 | | $ 91,551 | | $ 101,685 | | $ 94,869 |
| ^ | Inception date. |
| †† | Annualized. |
| (a) | Per share data based on average shares outstanding during the period. |
| (b) | Total investment return is calculated exclusive of sales charges and assumes the reinvestment of dividends and distributions. Class R6 shares are not subject to sales charges. For periods of less than one year, total return is not annualized. |
| (c) | In addition to the fees and expenses which the Fund bears directly, it also indirectly bears a pro-rata share of the fees and expenses of the underlying funds in which it invests. Such indirect expenses are not included in the above expense ratios. |
| (d) | The portfolio turnover rates not including mortgage dollar rolls were 56%, 62%, 54% and 36% for the years ended October 31, 2021, 2020, 2019 and 2018, respectively. |
The notes to the financial statements are an integral part of, and should be read in conjunction with, the financial statements.
| 38 | MainStay Income Builder Fund |
Financial Highlights selected per share data and ratios
| | Year Ended October 31, | | August 31, 2020^ through
October 31, |
| SIMPLE Class | 2022 | | 2021 | | 2020 |
| Net asset value at beginning of period | $ 21.78 | | $ 18.62 | | $ 19.33 |
| Net investment income (loss) (a) | 0.20 | | 0.34 | | 0.04 |
| Net realized and unrealized gain (loss) | (3.50) | | 3.24 | | (0.69) |
| Total from investment operations | (3.30) | | 3.58 | | (0.65) |
| Less distributions: | | | | | |
| From net investment income | (0.34) | | (0.42) | | (0.06) |
| From net realized gain on investments | (1.14) | | — | | — |
| Return of capital | (0.01) | | — | | — |
| Total distributions | (1.49) | | (0.42) | | (0.06) |
| Net asset value at end of period | $ 16.99 | | $ 21.78 | | $ 18.62 |
| Total investment return (b) | (16.10)% | | 19.26% | | (3.39)% |
| Ratios (to average net assets)/Supplemental Data: | | | | | |
| Net investment income (loss) | 1.06% | | 1.61% | | 1.62%†† |
| Net expenses (c) | 1.45% | | 1.43% | | 1.43%†† |
| Portfolio turnover rate | 61% | | 57%(d) | | 65%(d) |
| Net assets at end of period (in 000’s) | $ 34 | | $ 29 | | $ 24 |
| ^ | Inception date. |
| †† | Annualized. |
| (a) | Per share data based on average shares outstanding during the period. |
| (b) | Total investment return is calculated exclusive of sales charges and assumes the reinvestment of dividends and distributions. SIMPLE Class shares are not subject to sales charges. For periods of less than one year, total return is not annualized. |
| (c) | In addition to the fees and expenses which the Fund bears directly, it also indirectly bears a pro-rata share of the fees and expenses of the underlying funds in which it invests. Such indirect expenses are not included in the above expense ratios. |
| (d) | The portfolio turnover rates not including mortgage dollar rolls were 56% and 62% for the years ended October 31, 2021 and 2020 respectively. |
The notes to the financial statements are an integral part of, and should be read in conjunction with, the financial statements.
39
Notes to Financial Statements
Note 1-Organization and Business
The MainStay Funds (the “Trust”) was organized on January 9, 1986, as a Massachusetts business trust. The Trust is registered under the Investment Company Act of 1940, as amended (the “1940 Act”), as an open-end management investment company, and is comprised of twelve funds (collectively referred to as the "Funds"). These financial statements and notes relate to the MainStay Income Builder Fund (the "Fund"), a “diversified” fund, as that term is defined in the 1940 Act, as interpreted or modified by regulatory authorities having jurisdiction, from time to time.
The following table lists the Fund's share classes that have been registered and commenced operations:
| Class | Commenced Operations |
| Class A | January 3, 1995 |
| Investor Class | February 28, 2008 |
| Class B | December 29, 1987 |
| Class C | September 1, 1998 |
| Class I | January 2, 2004 |
| Class R2 | February 27, 2015 |
| Class R3 | February 29, 2016 |
| Class R6 | February 28, 2018 |
| SIMPLE Class | August 31, 2020 |
Class B shares of the MainStay Group of Funds are closed to all new purchases as well as additional investments by existing Class B shareholders. Existing Class B shareholders may continue to reinvest dividends and capital gains distributions, as well as exchange their Class B shares for Class B shares of other funds in the MainStay Group of Funds as permitted by the current exchange privileges. Class B shareholders continue to be subject to any applicable contingent deferred sales charge ("CDSC") at the time of redemption. All other features of the Class B shares, including but not limited to the fees and expenses applicable to Class B shares, remain unchanged. Unless redeemed, Class B shareholders will remain in Class B shares of their respective fund until the Class B shares are converted to Class A or Investor Class shares pursuant to the applicable conversion schedule.
Class A and Investor Class shares are offered at net asset value (“NAV”) per share plus an initial sales charge. No initial sales charge applies to investments of $250,000 or more (and certain other qualified purchases) in Class A and Investor Class shares. However, a CDSC of 1.00% may be imposed on certain redemptions made within 18 months of the date of purchase on shares that were purchased without an initial sales charge. Class C shares are offered at NAV without an initial sales charge, although a 1.00% CDSC may be imposed on certain redemptions of such shares made within one year of the date of purchase of Class C shares. When Class B shares were offered, they were offered at NAV without an initial sales charge, although a CDSC that declines depending on the number of years a shareholder has held its Class B shares may be imposed on certain redemptions of such shares made within six years of the date of purchase of such shares. Class I, Class R2, Class R3, Class R6 and SIMPLE Class shares are offered at NAV without a sales
charge. Depending upon eligibility, Class B shares convert to either Class A or Investor Class shares at the end of the calendar quarter eight years after the date they were purchased. In addition, depending upon eligibility, Class C shares convert to either Class A or Investor Class shares at the end of the calendar quarter eight years after the date they were purchased. Additionally, Investor Class shares may convert automatically to Class A shares. SIMPLE Class shares convert to Class A shares, or Investor Class shares if you are not eligible to hold Class A shares, at the end of the calendar quarter, ten years after the date they were purchased. Share class conversions are based on the relevant NAVs of the two classes at the time of the conversion, and no sales load or other charge is imposed. Under certain circumstances and as may be permitted by the Trust’s multiple class plan pursuant to Rule 18f-3 under the 1940 Act, specified share classes of the Fund may be converted to one or more other share classes of the Fund as disclosed in the capital share transactions within these Notes. The classes of shares have the same voting (except for issues that relate solely to one class), dividend, liquidation and other rights, and the same terms and conditions, except that under distribution plans pursuant to Rule 12b-1 under the 1940 Act, Class B and Class C shares are subject to higher distribution and/or service fees than Class A, Investor Class, Class R2, Class R3 and SIMPLE Class shares. Class I and Class R6 shares are not subject to a distribution and/or service fee. Class R2 and Class R3 shares are subject to a shareholder service fee, which is in addition to fees paid under the distribution plans for Class R2 and Class R3 shares.
The Fund's investment objective is to seek current income consistent with reasonable opportunity for future growth of capital and income.
Note 2–Significant Accounting Policies
The Fund is an investment company and accordingly follows the investment company accounting and reporting guidance of the Financial Accounting Standards Board (“FASB”) Accounting Standards Codification Topic 946 Financial Services—Investment Companies. The Fund prepares its financial statements in accordance with generally accepted accounting principles (“GAAP”) in the United States of America and follows the significant accounting policies described below.
(A) Securities Valuation. Investments are usually valued as of the close of regular trading on the New York Stock Exchange (the "Exchange") (usually 4:00 p.m. Eastern time) on each day the Fund is open for business ("valuation date").
Effective September 8, 2022, and pursuant to Rule 2a-5 under the 1940 Act, the Board of Trustees of the Trust (the "Board") designated New York Life Investment Management LLC (“New York Life Investments” or the "Manager") as its Valuation Designee (the "Valuation Designee"). The Valuation Designee is responsible for performing fair valuations relating to all investments in the Fund’s portfolio for which market quotations are not readily available; periodically assessing and managing material valuation risks; establishing and applying fair value methodologies; testing fair valuation methodologies; evaluating and overseeing pricing services; segregation of valuation and portfolio management functions; providing
| 40 | MainStay Income Builder Fund |
quarterly, annual and prompt reporting to the Board, as appropriate; identifying potential conflicts of interest; and maintaining appropriate records. The Valuation Designee has established a valuation committee ("Valuation Committee") to assist in carrying out the Valuation Designee’s responsibilities and establish prices of securities for which market quotations are not readily available. The Fund’s and the Valuation Designee's policies and procedures ("Valuation Procedures") govern the Valuation Designee’s selection and application of methodologies for determining and calculating the fair value of Fund investments. The Valuation Designee may value Fund portfolio securities for which market quotations are not readily available and other Fund assets utilizing inputs from pricing services and other third-party sources (together, “Pricing Sources”). The Valuation Committee meets (in person, via electronic mail or via teleconference) on an ad-hoc basis to determine fair valuations and on a quarterly basis to review fair value events (excluding fair valuations from pricing services), including valuation risks and back-testing results, and preview reports to the Board.
The Valuation Committee establishes prices of securities for which market quotations are not readily available based on such methodologies and measurements on a regular basis after considering information that is reasonably available and deemed relevant by the Valuation Committee. The Board shall oversee the Valuation Designee and review fair valuation materials on a prompt, quarterly and annual basis and approve proposed revisions to the Valuation Procedures.
Investments for which market quotations are not readily available are valued at fair value as determined in good faith pursuant to the Valuation Procedures. A market quotation is readily available only when that quotation is a quoted price (unadjusted) in active markets for identical investments that the Fund can access at the measurement date, provided that a quotation will not be readily available if it is not reliable. Fair value measurements are determined within a framework that establishes a three-tier hierarchy that maximizes the use of observable market data and minimizes the use of unobservable inputs to establish a classification of fair value measurements for disclosure purposes. "Inputs" refer broadly to the assumptions that market participants would use in pricing the asset or liability, including assumptions about risk, such as the risk inherent in a particular valuation technique used to measure fair value using a pricing model and/or the risk inherent in the inputs for the valuation technique. Inputs may be observable or unobservable. Observable inputs reflect the assumptions market participants would use in pricing the asset or liability based on market data obtained from sources independent of the Fund. Unobservable inputs reflect the Fund’s own assumptions about the assumptions market participants would use in pricing the asset or liability based on the information available. The inputs or methodology used for valuing assets or liabilities may not be an indication of the risks associated with investing in those assets or liabilities. The three-tier hierarchy of inputs is summarized below.
| • | Level 1—quoted prices (unadjusted) in active markets for an identical asset or liability |
| • | Level 2—other significant observable inputs (including quoted prices for a similar asset or liability in active markets, interest rates and yield curves, prepayment speeds, credit risk, etc.) |
| • | Level 3—significant unobservable inputs (including the Fund's own assumptions about the assumptions that market participants would use in measuring fair value of an asset or liability) |
The level of an asset or liability within the fair value hierarchy is based on the lowest level of an input, both individually and in the aggregate, that is significant to the fair value measurement. The aggregate value by input level of the Fund’s assets and liabilities as of October 31, 2022, is included at the end of the Portfolio of Investments.
The Fund may use third-party vendor evaluations, whose prices may be derived from one or more of the following standard inputs, among others:
| • Broker/dealer quotes | • Benchmark securities |
| • Two-sided markets | • Reference data (corporate actions or material event notices) |
| • Bids/offers | • Monthly payment information |
| • Industry and economic events | • Reported trades |
An asset or liability for which a market quotation is not readily available is valued by methods deemed reasonable in good faith by the Valuation Committee, following the Valuation Procedures to represent fair value. Under these procedures, the Valuation Designee generally uses a market-based approach which may use related or comparable assets or liabilities, recent transactions, market multiples, book values and other relevant information. The Valuation Designee may also use an income-based valuation approach in which the anticipated future cash flows of the asset or liability are discounted to calculate fair value. Discounts may also be applied due to the nature and/or duration of any restrictions on the disposition of the asset or liability. Fair value represents a good faith approximation of the value of a security. Fair value determinations involve the consideration of a number of subjective factors, an analysis of applicable facts and circumstances and the exercise of judgment. As a result, it is possible that the fair value for a security determined in good faith in accordance with the Valuation Procedures may differ from valuations for the same security determined for other funds using their own valuation procedures. Although the Valuation Procedures are designed to value a security at the price the Fund may reasonably expect to receive upon the security's sale in an orderly transaction, there can be no assurance that any fair value determination thereunder would, in fact, approximate the amount that the Fund would actually realize upon the sale of the security or the price at which the security would trade if a reliable market price were readily available. During the year ended October 31, 2022, there were no material changes to the fair value methodologies.
Securities which may be valued in this manner include, but are not limited to: (i) a security for which trading has been halted or suspended or otherwise does not have a readily available market quotation on a given day; (ii) a debt security that has recently gone into default and for which there is not a current market quotation; (iii) a security of an issuer that
Notes to Financial Statements (continued)
has entered into a restructuring; (iv) a security that has been delisted from a national exchange; (v) a security subject to trading collars for which no or limited trading takes place; and (vi) a security whose principal market has been temporarily closed at a time when, under normal conditions, it would be open. Securities valued in this manner are generally categorized as Level 2 or 3 in the hierarchy.
Certain securities held by the Fund may principally trade in foreign markets. Events may occur between the time the foreign markets close and the time at which the Fund's NAVs are calculated. These events may include, but are not limited to, situations relating to a single issuer in a market sector, significant fluctuations in U.S. or foreign markets, natural disasters, armed conflicts, governmental actions or other developments not tied directly to the securities markets. Should the Valuation Designee conclude that such events may have affected the accuracy of the last price of such securities reported on the local foreign market, the Valuation Designee may, pursuant to the Valuation Procedures, adjust the value of the local price to reflect the estimated impact on the price of such securities as a result of such events. In this instance, securities are generally categorized as Level 3 in the hierarchy. Additionally, certain foreign equity securities are also fair valued whenever the movement of a particular index exceeds certain thresholds. In such cases, the securities are fair valued by applying factors provided by a third-party vendor in accordance with the Valuation Procedures and are generally categorized as Level 2 in the hierarchy. No foreign equity securities held by the Fund as of October 31, 2022 were fair valued in such a manner.
Equity securities are valued at the last quoted sales prices as of the close of regular trading on the relevant exchange on each valuation date. Securities that are not traded on the valuation date are valued at the mean of the last quoted bid and ask prices. Prices are normally taken from the principal market in which each security trades. These securities are generally categorized as Level 1 in the hierarchy.
Investments in mutual funds, including money market funds, are valued at their respective NAVs at the close of business each day on the valuation date. These securities are generally categorized as Level 1 in the hierarchy.
Futures contracts are valued at the last posted settlement price on the market where such futures are primarily traded. These securities are generally categorized as Level 1 in the hierarchy.
Municipal debt securities are valued at the evaluated mean prices supplied by a pricing agent or broker selected by the Manager, in consultation with the Subadvisor. The evaluations are market-based measurements processed through a pricing application and represents the pricing agent's good faith determination as to what a holder may receive in an orderly transaction under market conditions. The rules-based logic utilizes valuation techniques that reflect participants' assumptions and vary by asset class and per methodology, maximizing the use of relevant observable data including quoted prices for similar assets, benchmark yield curves and market corroborated inputs. The evaluated bid or mean prices are deemed by the Manager, in consultation with the Subadvisor, to be representative of market values, at the regular
close of trading of the Exchange on each valuation date. Municipal debt securities purchased on a delayed delivery basis are marked to market daily until settlement at the forward settlement date. Municipal debt securities are generally categorized as Level 2 in the hierarchy.
Debt securities (other than convertible and municipal bonds) are valued at the evaluated bid prices (evaluated mean prices in the case of convertible and municipal bonds) supplied by a pricing agent or broker selected by the Valuation Designee, in consultation with the Subadvisors. The evaluations are market-based measurements processed through a pricing application and represents the pricing agent’s good faith determination as to what a holder may receive in an orderly transaction under market conditions. The rules-based logic utilizes valuation techniques that reflect participants’ assumptions and vary by asset class and per methodology, maximizing the use of relevant observable data including quoted prices for similar assets, benchmark yield curves and market corroborated inputs. The evaluated bid or mean prices are deemed by the Valuation Designee, in consultation with the Subadvisors, to be representative of market values at the regular close of trading of the Exchange on each valuation date. Debt securities purchased on a delayed delivery basis are marked to market daily until settlement at the forward settlement date. Debt securities, including corporate bonds, U.S. government and federal agency bonds, municipal bonds, foreign bonds, convertible bonds, asset-backed securities and mortgage-backed securities are generally categorized as Level 2 in the hierarchy.
Foreign currency forward contracts are valued at their fair market values measured on the basis of the mean between the last current bid and ask prices based on dealer or exchange quotations and are generally categorized as Level 2 in the hierarchy.
Loan assignments, participations and commitments are valued at the average of bid quotations obtained from the engaged independent pricing service and are generally categorized as Level 2 in the hierarchy. Certain loan assignments, participations and commitments may be valued by utilizing significant unobservable inputs obtained from the pricing service and are generally categorized as Level 3 in the hierarchy. No securities held by the Fund as of October 31, 2022 were fair valued utilizing significant unobservable inputs obtained from the pricing service.
Temporary cash investments acquired in excess of 60 days to maturity at the time of purchase are valued using the latest bid prices or using valuations based on a matrix system (which considers such factors as security prices, yields, maturities and ratings), both as furnished by independent pricing services. Temporary cash investments that mature in 60 days or less at the time of purchase ("Short-Term Investments") are valued using the amortized cost method of valuation, unless the use of such method would be inappropriate. The amortized cost method involves valuing a security at its cost on the date of purchase and thereafter assuming a constant amortization to maturity of the difference between such cost and the value on maturity date. Amortized cost approximates the current fair value of a security. Securities valued using the amortized cost method are not valued using quoted prices in an active market and are generally categorized as Level 2 in the hierarchy.
| 42 | MainStay Income Builder Fund |
The information above is not intended to reflect an exhaustive list of the methodologies that may be used to value portfolio investments. The Valuation Procedures permit the use of a variety of valuation methodologies in connection with valuing portfolio investments. The methodology used for a specific type of investment may vary based on the market data available or other considerations. The methodologies summarized above may not represent the specific means by which portfolio investments are valued on any particular business day.
A portfolio investment may be classified as an illiquid investment under the Fund's written liquidity risk management program and related procedures (“Liquidity Program”). Illiquidity of an investment might prevent the sale of such investment at a time when the Manager or the Subadvisors might wish to sell, and these investments could have the effect of decreasing the overall level of the Fund's liquidity. Further, the lack of an established secondary market may make it more difficult to value illiquid investments, requiring the Fund to rely on judgments that may be somewhat subjective in measuring value, which could vary materially from the amount that the Fund could realize upon disposition. Difficulty in selling illiquid investments may result in a loss or may be costly to the Fund. An illiquid investment is any investment that the Manager or Subadvisors reasonably expects cannot be sold or disposed of in current market conditions in seven calendar days or less without the sale or disposition significantly changing the market value of the investment. The liquidity classification of each investment will be made using information obtained after reasonable inquiry and taking into account, among other things, relevant market, trading and investment-specific considerations in accordance with the Liquidity Program. Illiquid investments are often fair valued in accordance with the Fund's procedures described above. The liquidity of the Fund's investments was determined as of October 31, 2022, and can change at any time. Illiquid investments as of October 31, 2022, are shown in the Portfolio of Investments.
(B) Income Taxes. The Fund's policy is to comply with the requirements of the Internal Revenue Code of 1986, as amended (the “Internal Revenue Code”), applicable to regulated investment companies and to distribute all of its taxable income to the shareholders of the Fund within the allowable time limits.
The Manager evaluates the Fund’s tax positions to determine if the tax positions taken meet the minimum recognition threshold in connection with accounting for uncertainties in income tax positions taken or expected to be taken for the purposes of measuring and recognizing tax liabilities in the financial statements. Recognition of tax benefits of an uncertain tax position is permitted only to the extent the position is “more likely than not” to be sustained assuming examination by taxing authorities. The Manager analyzed the Fund's tax positions taken on federal, state and local income tax returns for all open tax years (for up to three tax years) and has concluded that no provisions for federal, state and local income tax are required in the Fund's financial statements. The Fund's federal, state and local income tax and federal excise tax returns for tax years for which the applicable statutes of limitations have not
expired are subject to examination by the Internal Revenue Service and state and local departments of revenue.
(C) Foreign Taxes. The Fund may be subject to foreign taxes on income and other transaction-based taxes imposed by certain countries in which it invests. A portion of the taxes on gains on investments or currency purchases/repatriation may be reclaimable. The Fund will accrue such taxes and reclaims as applicable, based upon its current interpretation of tax rules and regulations that exist in the markets in which it invests.
The Fund may be subject to taxation on realized capital gains, repatriation proceeds and other transaction-based taxes imposed by certain countries in which it invests. The Fund will accrue such taxes as applicable based upon its current interpretation of tax rules and regulations that exist in the market in which it invests. Capital gains taxes relating to positions still held are reflected as a liability in the Statement of Assets and Liabilities, as well as an adjustment to the Fund's net unrealized appreciation (depreciation). Taxes related to capital gains realized, if any, are reflected as part of net realized gain (loss) in the Statement of Operations. Changes in tax liabilities related to capital gains taxes on unrealized investment gains, if any, are reflected as part of the change in net unrealized appreciation (depreciation) on investments in the Statement of Operations. Transaction-based charges are generally assessed as a percentage of the transaction amount.
(D) Dividends and Distributions to Shareholders. Dividends and distributions are recorded on the ex-dividend date. The Fund intends to declare and pay dividends from net investment income, if any, at least monthly and distributions from net realized capital and currency gains, if any, at least annually. Unless a shareholder elects otherwise, all dividends and distributions are reinvested at NAV in the same class of shares of the Fund. Dividends and distributions to shareholders are determined in accordance with federal income tax regulations and may differ from determinations using GAAP.
(E) Security Transactions and Investment Income. The Fund records security transactions on the trade date. Realized gains and losses on security transactions are determined using the identified cost method. Dividend income is recognized on the ex-dividend date, net of any foreign tax withheld at the source, and interest income is accrued as earned using the effective interest rate method and includes any realized gains and losses from repayments of principal on mortgage-backed securities. Distributions received from real estate investment trusts may be classified as dividends, capital gains and/or return of capital. Discounts and premiums on securities purchased for the Fund are accreted and amortized, respectively, on the effective interest rate method. Income from payment-in-kind securities, to the extent the Fund held any such securities during the year ended October 31, 2022, is accreted daily based on the effective interest method.
Investment income and realized and unrealized gains and losses on investments of the Fund are allocated pro rata to the separate classes of
Notes to Financial Statements (continued)
shares based upon their relative net assets on the date the income is earned or realized and unrealized gains and losses are incurred.
The Fund may place a debt security on non-accrual status and reduce related interest income by ceasing current accruals and writing off all or a portion of any interest receivables when the collection of all or a portion of such interest has become doubtful. A debt security is removed from non-accrual status when the issuer resumes interest payments or when collectability of interest is reasonably assured.
(F) Expenses. Expenses of the Trust are allocated to the individual Funds in proportion to the net assets of the respective Funds when the expenses are incurred, except where direct allocations of expenses can be made. Expenses (other than transfer agent expenses and fees incurred under the shareholder services plans and/or the distribution plans further discussed in Note 3(B)) are allocated to separate classes of shares pro rata based upon their relative net assets on the date the expenses are incurred. The expenses borne by the Fund, including those of related parties to the Fund, are shown in the Statement of Operations.
Additionally, the Fund may invest in mutual funds, which are subject to management fees and other fees that may cause the costs of investing in mutual funds to be greater than the costs of owning the underlying securities directly. These indirect expenses of mutual funds are not included in the amounts shown as expenses in the Statement of Operations or in the expense ratios included in the Financial Highlights.
(G) Use of Estimates. In preparing financial statements in conformity with GAAP, the Manager makes estimates and assumptions that affect the reported amounts and disclosures in the financial statements. Actual results could differ from those estimates and assumptions.
(H) Futures Contracts. A futures contract is an agreement to purchase or sell a specified quantity of an underlying instrument at a specified future date and price, or to make or receive a cash payment based on the value of a financial instrument (e.g., foreign currency, interest rate, security or securities index). The Fund is subject to risks such as market price risk, leverage risk, liquidity risk, counterparty risk, operational risk, legal risk and/or interest rate risk in the normal course of investing in these contracts. Upon entering into a futures contract, the Fund is required to pledge to the broker or futures commission merchant an amount of cash and/or U.S. government securities equal to a certain percentage of the collateral amount, known as the “initial margin.” During the period the futures contract is open, changes in the value of the contract are recognized as unrealized appreciation or depreciation by marking to market such contract on a daily basis to reflect the market value of the contract at the end of each day’s trading. The Fund agrees to receive from or pay to the broker or futures commission merchant an amount of cash equal to the daily fluctuation in the value of the contract. Such receipts or payments are known as “variation margin.” When the futures contract is closed, the Fund records a realized gain or loss equal to the difference between the proceeds from (or cost of) the closing transaction and the Fund's basis in the contract.
The use of futures contracts involves, to varying degrees, elements of market risk in excess of the amount recognized in the Statement of Assets and Liabilities. The contract or notional amounts and variation margin reflect the extent of the Fund's involvement in open futures positions. There are several risks associated with the use of futures contracts as hedging techniques. There can be no assurance that a liquid market will exist at the time when the Fund seeks to close out a futures contract. If no liquid market exists, the Fund would remain obligated to meet margin requirements until the position is closed. Futures contracts may involve a small initial investment relative to the risk assumed, which could result in losses greater than if the Fund did not invest in futures contracts. Futures contracts may be more volatile than direct investments in the instrument underlying the futures and may not correlate to the underlying instrument, causing a given hedge not to achieve its objectives. The Fund's activities in futures contracts have minimal counterparty risk as they are conducted through regulated exchanges that guarantee the futures against default by the counterparty. In the event of a bankruptcy or insolvency of a futures commission merchant that holds margin on behalf of the Fund, the Fund may not be entitled to the return of the entire margin owed to the Fund, potentially resulting in a loss. The Fund may invest in futures contracts to seek enhanced returns or to reduce the risk of loss by hedging certain of its holdings. The Fund's investment in futures contracts and other derivatives may increase the volatility of the Fund's NAVs and may result in a loss to the Fund. Open futures contracts as of October 31, 2022, are shown in the Portfolio of Investments.
(I) Loan Assignments, Participations and Commitments. The Fund may invest in loan assignments and participations ("loans"). Commitments are agreements to make money available to a borrower in a specified amount, at a specified rate and within a specified time. The Fund records an investment when the borrower withdraws money on a commitment or when a funded loan is purchased (trade date) and records interest as earned. These loans pay interest at rates that are periodically reset by reference to a base lending rate plus a spread. These base lending rates are generally the prime rate offered by a designated U.S. bank, the London Interbank Offered Rate ("LIBOR") or an alternative reference rate.
The loans in which the Fund may invest are generally readily marketable, but may be subject to some restrictions on resale. For example, the Fund may be contractually obligated to receive approval from the agent bank and/or borrower prior to the sale of these investments. If the Fund purchases an assignment from a lender, the Fund will generally have direct contractual rights against the borrower in favor of the lender. If the Fund purchases a participation interest either from a lender or a participant, the Fund typically will have established a direct contractual relationship with the seller of the participation interest, but not with the borrower. Consequently, the Fund is subject to the credit risk of the lender or participant who sold the participation interest to the Fund, in addition to the usual credit risk of the borrower. In the event that the borrower, selling participant or intermediate participants become insolvent or enter into
| 44 | MainStay Income Builder Fund |
bankruptcy, the Fund may incur certain costs and delays in realizing payment, or may suffer a loss of principal and/or interest.
Unfunded commitments represent the remaining obligation of the Fund to the borrower. At any point in time, up to the maturity date of the issue, the borrower may demand the unfunded portion. Unfunded amounts, if any, are marked to market and any unrealized gains or losses are recorded in the Statement of Assets and Liabilities. As of October 31, 2022, the Fund did not hold any unfunded commitments.
(J) Foreign Currency Forward Contracts. The Fund may enter into foreign currency forward contracts, which are agreements to buy or sell foreign currencies on a specified future date at a specified rate. The Fund is subject to foreign currency exchange rate risk in the normal course of investing in these transactions. During the period the forward contract is open, changes in the value of the contract are recognized as unrealized appreciation or depreciation by marking to market such contract on a daily basis to reflect the market value of the contract at the end of each day’s trading. Cash movement occurs on the settlement date. When the forward contract is closed, the Fund records a realized gain or loss equal to the difference between the proceeds from (or cost of) the closing transaction and the Fund's basis in the contract. The Fund may purchase and sell foreign currency forward contracts for purposes of seeking to enhance portfolio returns and manage portfolio risk more efficiently. Foreign currency forward contracts may also be used to gain exposure to a particular currency or to hedge against the risk of loss due to changing currency exchange rates. Foreign currency forward contracts to purchase or sell a foreign currency may also be used in anticipation of future purchases or sales of securities denominated in foreign currency, even if the specific investments have not yet been selected.
The use of foreign currency forward contracts involves, to varying degrees, elements of risk in excess of the amount recognized in the Statement of Assets and Liabilities, including counterparty risk, market risk, leverage risk, operational risk, legal risk and liquidity risk. Counterparty risk is heightened for these instruments because foreign currency forward contracts are not exchange-traded and therefore no clearinghouse or exchange stands ready to meet the obligations under such contracts. Thus, the Fund faces the risk that its counterparties under such contracts may not perform their obligations. Market risk is the risk that the value of a foreign currency forward contract will depreciate due to unfavorable changes in exchange rates. Liquidity risk arises because the secondary market for foreign currency forward contracts may have less liquidity relative to markets for other securities and financial instruments. Liquidity risk also can arise when forward currency contracts create margin or settlement payment obligations for the Fund. Leverage risk is the risk that a foreign currency forward contract can magnify the Fund's gains and losses. Operational risk refers to risk related to potential operational issues (including documentation issues, settlement issues, systems failures, inadequate controls and human error), and legal risk refers to insufficient documentation, insufficient capacity or authority of the counterparty, or legality or enforceability of a foreign currency forward contract. Risks also arise from the possible movements in the foreign
exchange rates underlying these instruments. While the Fund may enter into forward contracts to reduce currency exchange risks, changes in currency exchange rates may result in poorer overall performance for the Fund than if it had not engaged in such transactions. Exchange rate movements can be large, depending on the currency, and can last for extended periods of time, affecting the value of the Fund's assets. Moreover, there may be an imperfect correlation between the Fund's holdings of securities denominated in a particular currency and forward contracts entered into by the Fund. Such imperfect correlation may prevent the Fund from achieving the intended hedge or expose the Fund to the risk of currency exchange loss. The unrealized appreciation (depreciation) on forward contracts also reflects the Fund's exposure at the valuation date to credit loss in the event of a counterparty’s failure to perform its obligations. Open foreign currency forward contracts as of October 31, 2022, are shown in the Portfolio of Investments.
(K) Foreign Currency Transactions. The Fund's books and records are maintained in U.S. dollars. Prices of securities denominated in foreign currency amounts are translated into U.S. dollars at the mean between the buying and selling rates last quoted by any major U.S. bank at the following dates:
(i) market value of investment securities, other assets and liabilities— at the valuation date; and
(ii) purchases and sales of investment securities, income and expenses—at the date of such transactions.
The assets and liabilities that are denominated in foreign currency amounts are presented at the exchange rates and market values at the close of the period. The realized and unrealized changes in net assets arising from fluctuations in exchange rates and market prices of securities are not separately presented.
Net realized gain (loss) on foreign currency transactions represents net currency gains or losses realized as a result of differences between the amounts of securities sale proceeds or purchase cost, dividends, interest and withholding taxes as recorded on the Fund's books, and the U.S. dollar equivalent amount actually received or paid. Net currency gains or losses from valuing such foreign currency denominated assets and liabilities, other than investments at valuation date exchange rates, are reflected in unrealized foreign exchange gains or losses.
(L) Securities Lending. In order to realize additional income, the Fund may engage in securities lending, subject to the limitations set forth in the 1940 Act and relevant guidance by the staff of the Securities and Exchange Commission (“SEC”). If the Fund engages in securities lending, the Fund will lend through its custodian, JPMorgan Chase Bank, N.A., ("JPMorgan"), acting as securities lending agent on behalf of the Fund. Under the current arrangement, JPMorgan will manage the Fund's collateral in accordance with the securities lending agency agreement between the Fund and JPMorgan, and indemnify the Fund against counterparty risk. The loans will be collateralized by cash (which may be invested in a money market fund) and/or non-cash collateral (which may include U.S. Treasury securities and/or U.S. government agency securities
Notes to Financial Statements (continued)
issued or guaranteed by the United States government or its agencies or instrumentalities) at least equal at all times to the market value of the securities loaned. Non-cash collateral held at year end is segregated and cannot be transferred by the Fund. The Fund bears the risk of delay in recovery of, or loss of rights in, the securities loaned. The Fund may also record a realized gain or loss on securities deemed sold due to a borrower’s inability to return securities on loan. The Fund bears the risk of any loss on investment of cash collateral. The Fund will receive compensation for lending its securities in the form of fees or it will retain a portion of interest earned on the investment of any cash collateral. The Fund will also continue to receive interest and dividends on the securities loaned and any gain or loss in the market price of the securities loaned that may occur during the term of the loan will be for the account of the Fund. Income earned from securities lending activities, if any, is reflected in the Statement of Operations. Securities on loan as of October 31, 2022, are shown in the Portfolio of Investments.
(M) Dollar Rolls. The Fund may enter into dollar roll transactions in which it sells mortgage-backed securities ("MBS") from its portfolio to a counterparty from whom it simultaneously agrees to buy a similar security on a delayed delivery basis. The Fund generally transfers MBS where the MBS are "to be announced," therefore, the Fund accounts for these transactions as purchases and sales.
When accounted for as purchase and sales, the securities sold in connection with the dollar rolls are removed from the portfolio and a realized gain or loss is recognized. The securities the Fund has agreed to acquire are included at market value in the Portfolio of Investments and liabilities for such purchase commitments are included as payables for investments purchased. During the roll period, the Fund foregoes principal and interest paid on the securities. The Fund is compensated by the difference between the current sales price and the forward price for the future as well as by the earnings on the cash proceeds of the initial sale. Dollar rolls may be renewed without physical delivery of the securities subject to the contract. Dollar roll transactions involve certain risks, including the risk that the securities returned to the Fund at the end of the roll period, while substantially similar, could be inferior to what was initially sold to the counterparty.
(N) Securities Risk. The ability of issuers of debt securities held by the Fund to meet their obligations may be affected by, among other things, economic or political developments in a specific country, industry or region. Debt securities are also subject to the risks associated with changes in interest rates.
The Fund may invest in high-yield debt securities (sometimes called “junk bonds”), which are generally considered speculative because they present a greater risk of loss, including default, than higher quality debt securities. These securities pay investors a premium—a higher interest rate or yield than investment grade debt securities—because of the increased risk of loss. These securities can also be subject to greater price volatility. In times of unusual or adverse market, economic or political conditions, these securities may experience higher than normal default rates.
The Fund may invest in foreign securities, which carry certain risks that are in addition to the usual risks inherent in domestic securities. These risks include those resulting from currency fluctuations, future adverse political or economic developments and possible imposition of currency exchange blockages or other foreign governmental laws or restrictions. These risks are likely to be greater in emerging markets than in developed markets. The ability of issuers of securities held by the Fund to meet their obligations may be affected by, among other things, economic or political developments in a specific country, industry or region.
The Fund may invest in loans which are usually rated below investment grade and are generally considered speculative because they present a greater risk of loss, including default, than higher rated debt securities. These investments pay investors a higher interest rate than investment grade debt securities because of the increased risk of loss. Although certain loans are collateralized, there is no guarantee that the value of the collateral will be sufficient to repay the loan. In a recession or serious credit event, the value of these investments could decline significantly. As a result, the Fund’s NAVs could go down and you could lose money.
In addition, loans generally are subject to extended settlement periods that may be longer than seven days. As a result, the Fund may be adversely affected by selling other investments at an unfavorable time and/or under unfavorable conditions or engaging in borrowing transactions, such as borrowing against its credit facility, to raise cash to meet redemption obligations or pursue other investment opportunities.
In certain circumstances, loans may not be deemed to be securities. As a result, the Fund may not have the protection of anti-fraud provisions of the federal securities laws. In such cases, the Fund generally must rely on the contractual provisions in the loan agreement and common-law fraud protections under applicable state law.
(O) Counterparty Credit Risk. In order to better define its contractual rights and to secure rights that will help the Fund mitigate its counterparty risk, the Fund may enter into an International Swaps and Derivatives Association, Inc. Master Agreement (“ISDA Master Agreement”) or similar agreement with its counterparties. An ISDA Master Agreement is a bilateral agreement between the Fund and a counterparty that governs certain OTC derivatives and typically contains collateral posting terms and netting provisions. Under an ISDA Master Agreement, the Fund may, under certain circumstances, offset with the counterparty certain derivative financial instruments’ payables and/ or receivables with collateral held and/or posted and create one single net payment. The provisions of the ISDA Master Agreement typically permit a single net payment in the event of default including the bankruptcy or insolvency of the counterparty. Bankruptcy or insolvency laws of a particular jurisdiction may restrict or prohibit the right of offset in bankruptcy, insolvency or other events. In addition, certain ISDA Master Agreements may contain provisions for early termination of OTC derivative transactions in the event the net assets of the Fund decline below specific levels or if the Fund fails to meet the terms of its ISDA Master Agreements. The result would cause the Fund to accelerate payment of any net liability owed to the counterparty.
| 46 | MainStay Income Builder Fund |
For financial reporting purposes, the Fund does not offset derivative assets and derivative liabilities that are subject to netting arrangements, if any, in the Statement of Assets and Liabilities.
(P) LIBOR Replacement Risk. The Fund may invest in certain debt securities, derivatives or other financial instruments that utilize the LIBOR, as a “benchmark” or “reference rate” for various interest rate calculations. As of January 1, 2022, the United Kingdom Financial Conduct Authority, which regulates LIBOR, ceased its active encouragement of banks to provide the quotations needed to sustain most LIBOR rates due to the absence of an active market for interbank unsecured lending and other reasons. However, the United Kingdom Financial Conduct Authority, the LIBOR administrator and other regulators announced that certain sterling and yen LIBOR settings would be calculated on a "synthetic" basis through the end of 2022 and the most widely used tenors of U.S. dollar LIBOR will continue until mid-2023. As a result, it is anticipated that the remaining LIBOR settings will be discontinued or will no longer be sufficiently robust to be representative of its underlying market around that time. Various financial industry groups will plan for that transition and certain regulators and industry groups have taken actions to establish alternative reference rates (e.g., the Secured Overnight Financing Rate, which measures the cost of overnight borrowings through repurchase agreement transactions collateralized with U.S. Treasury securities and is intended to replace U.S. dollar LIBOR with certain adjustments). However, there are challenges to converting certain contracts and transactions to a new benchmark and neither the full effects of the transition process nor its ultimate outcome is known.
The elimination of LIBOR or changes to other reference rates or any other changes or reforms to the determination or supervision of reference rates could have an adverse impact on the market for, or value of, any securities or payments linked to those reference rates, which may adversely affect the Fund's performance and/or net asset value. Uncertainty and risk also remain regarding the willingness and ability of issuers and lenders to include enhanced provisions in new and existing contracts or instruments. Consequently, the transition away from LIBOR to other reference rates may lead to increased volatility and illiquidity in markets that are tied to LIBOR, fluctuations in values of LIBOR-related investments or investments in issuers that utilize LIBOR, increased difficulty in borrowing or refinancing and diminished effectiveness of
hedging strategies, adversely affecting the Fund's performance. Furthermore, the risks associated with the expected discontinuation of LIBOR and transition may be exacerbated if the work necessary to effect an orderly transition to an alternative reference rate is not completed in a timely manner. While the transition away from LIBOR has already begun with no material adverse effect to the Fund's performance, the transition is expected to last through mid-2023 for some LIBOR tenors. The usefulness of LIBOR as a benchmark could deteriorate anytime during this transition period.
(Q) Indemnifications. Under the Trust’s organizational documents, its officers and trustees are indemnified against certain liabilities that may arise out of performance of their duties to the Trust. Additionally, in the normal course of business, the Fund enters into contracts with third-party service providers that contain a variety of representations and warranties and that may provide general indemnifications. The Fund's maximum exposure under these arrangements is unknown, as this would involve future claims that may be made against the Fund that have not yet occurred. The Manager believes that the risk of loss in connection with these potential indemnification obligations is remote. However, there can be no assurance that material liabilities related to such obligations will not arise in the future, which could adversely impact the Fund.
(R) Quantitative Disclosure of Derivative Holdings. The following tables show additional disclosures related to the Fund's derivative and hedging activities, including how such activities are accounted for and their effect on the Fund's financial positions, performance and cash flows.
The Fund entered into Treasury futures contracts to hedge against anticipated changes in interest rates that might otherwise have an adverse effect upon the value of the Fund’s securities. The Fund also entered into domestic and foreign equity index futures contracts to increase the equity sensitivity to the Fund.
Foreign currency forward contracts were used to gain exposure to a particular currency or to hedge against the risk of loss due to changing currency exchange rates. These derivatives are not accounted for as hedging instruments.
Fair value of derivative instruments as of October 31, 2022:
| Asset Derivatives | Foreign
Exchange
Contracts
Risk | Equity
Contracts
Risk | Total |
| Futures Contracts - Net Assets—Net unrealized appreciation on futures contracts (a) | $ — | $7,855,637 | $7,855,637 |
| Forward Contracts - Unrealized appreciation on foreign currency forward contracts | 1,812,957 | — | 1,812,957 |
| Total Fair Value | $1,812,957 | $7,855,637 | $9,668,594 |
| (a) | Includes cumulative appreciation (depreciation) of futures contracts as reported in the Portfolio of Investments. Only current day’s variation margin is reported within the Statement of Assets and Liabilities. |
Notes to Financial Statements (continued)
| Liability Derivatives | Foreign
Exchange
Contracts
Risk | Equity
Contracts
Risk | Interest
Rate
Contracts
Risk | Total |
| Futures Contracts - Net Assets—Net unrealized depreciation on futures contracts (a) | $ — | $(836,483) | $(7,586,651) | $ (8,423,134) |
| Forward Contracts - Unrealized depreciation on foreign currency forward contracts | (3,908,124) | — | — | (3,908,124) |
| Total Fair Value | $(3,908,124) | $(836,483) | $(7,586,651) | $(12,331,258) |
| (a) | Includes cumulative appreciation (depreciation) of futures contracts as reported in the Portfolio of Investments. Only current day’s variation margin is reported within the Statement of Assets and Liabilities. |
The effect of derivative instruments on the Statement of Operations for the year ended October 31, 2022:
| Net Realized Gain (Loss) from: | Foreign
Exchange
Contracts
Risk | Equity
Contracts
Risk | Interest
Rate
Contracts
Risk | Total |
| Futures Contracts | $ — | $(24,493,292) | $(23,825,040) | $(48,318,332) |
| Forward Contracts | (18,772,770) | — | — | (18,772,770) |
| Total Net Realized Gain (Loss) | $(18,772,770) | $(24,493,292) | $(23,825,040) | $(67,091,102) |
| Net Change in Unrealized Appreciation (Depreciation) | Foreign
Exchange
Contracts
Risk | Equity
Contracts
Risk | Interest
Rate
Contracts
Risk | Total |
| Futures Contracts | $ — | $(1,841,497) | $(7,074,968) | $(8,916,465) |
| Forward Contracts | 1,380,451 | — | — | 1,380,451 |
| Total Net Change in Unrealized Appreciation (Depreciation) | $1,380,451 | $(1,841,497) | $(7,074,968) | $(7,536,014) |
| Average Notional Amount | Total |
| Futures Contracts Long | $476,042,068 |
| Futures Contracts Short | $ (54,553,633) |
| Forward Contracts Long | $126,140,489 |
| Forward Contracts Short (a) | $ (80,544,373) |
| (a) | Positions were open for eight months during the reporting period. |
Note 3–Fees and Related Party Transactions
(A) Manager and Subadvisors. New York Life Investments, a registered investment adviser and an indirect, wholly-owned subsidiary of New York Life Insurance Company ("New York Life"), serves as the Fund's Manager, pursuant to an Amended and Restated Management Agreement ("Management Agreement"). The Manager provides offices, conducts clerical, recordkeeping and bookkeeping services and keeps most of the financial and accounting records required to be maintained by the Fund. Except for the portion of salaries and expenses that are the responsibility of the Fund, the Manager pays the salaries and expenses of all personnel affiliated with the Fund and certain operational expenses of the Fund. During a portion of the year ended October 31, 2022, the Fund reimbursed New York Life Investments in an amount equal to the portion of the compensation of the Chief Compliance Officer attributable to the Fund. Pursuant to the terms of an Amended and Restated Subadvisory Agreement with New York Life Investments, MacKay Shields LLC ("MacKay Shields" or "Subadvisor"), a registered investment adviser and
an indirect, wholly-owned subsidiary of New York Life, serves as a Subadvisor to the Fund and is responsible for the day-to-day portfolio management of the fixed-income portion of the Fund. Pursuant to the terms of an Amended and Restated Subadvisory Agreement with New York Life Investments, Epoch Investment Partners, Inc. (“Epoch” or “Subadvisor” and, together with MacKay Shields, the “Subadvisors”), a registered investment adviser, also serves as a Subadvisor to the Fund and is responsible for the day-to-day portfolio management of the equity portion of the Fund. Asset allocation decisions for the Fund are made by a committee chaired by New York Life Investments in collaboration with MacKay. New York Life Investments pays for the services of the Subadvisors.
Pursuant to the Management Agreement, the Fund pays the Manager a monthly fee for the services performed and the facilities furnished at an annual rate of the Fund’s average daily net assets as follows: 0.64% up to $500 million; 0.60% from $500 million to $1 billion; 0.575% from $1 billion to $5 billion; and 0.565% in excess of $5 billion, plus a fee for fund accounting services previously provided by New York Life Investments under a separate fund accounting agreement furnished at an annual rate of the Fund’s average daily net assets as follows: 0.05% up to $20 million; 0.0333% from $20 million to $100 million; and 0.01% in excess of $100 million. During the year ended October 31, 2022, the effective management fee rate was 0.62%, inclusive of a fee for fund accounting services of 0.01% of the Fund’s average daily net assets.
| 48 | MainStay Income Builder Fund |
In addition, New York Life Investments waived fees and/or reimbursed expenses so that Total Annual Fund Operating Expenses (excluding taxes, interest, litigation, extraordinary expenses, brokerage and other transaction expenses relating to the purchase or sale of portfolio investments, and acquired (underlying) fund fees and expenses) for Class R6 shares did not exceed those of Class I.
During the year ended October 31, 2022, New York Life Investments earned fees from the Fund in the amount of $9,103,197 and paid MacKay Shields and Epoch fees of $2,233,443 and $2,390,462, respectively.
JPMorgan provides sub-administration and sub-accounting services to the Fund pursuant to an agreement with New York Life Investments. These services include calculating the daily NAVs of the Fund, maintaining the general ledger and sub-ledger accounts for the calculation of the Fund's NAVs, and assisting New York Life Investments in conducting various aspects of the Fund's administrative operations. For providing these services to the Fund, JPMorgan is compensated by New York Life Investments.
Pursuant to an agreement between the Trust and New York Life Investments, New York Life Investments is responsible for providing or procuring certain regulatory reporting services for the Fund. The Fund will reimburse New York Life Investments for the actual costs incurred by New York Life Investments in connection with providing or procuring these services for the Fund.
(B) Distribution and Service Fees. The Trust, on behalf of the Fund, has entered into a distribution agreement with NYLIFE Distributors LLC (the “Distributor”), an affiliate of New York Life Investments. The Fund has adopted distribution plans (the “Plans”) in accordance with the provisions of Rule 12b-1 under the 1940 Act.
Pursuant to the Class A, Investor Class and Class R2 Plans, the Distributor receives a monthly fee from the Class A, Investor Class and Class R2 shares at an annual rate of 0.25% of the average daily net assets of the Class A, Investor Class and Class R2 shares for distribution and/or service activities as designated by the Distributor. Pursuant to the Class B and Class C Plans, Class B and Class C shares pay the Distributor a monthly distribution fee at an annual rate of 0.75% of the average daily net assets of the Class B and Class C shares, along with a service fee at an annual rate of 0.25% of the average daily net assets of the Class B and Class C shares, for a total 12b-1 fee of 1.00%. Pursuant to the Class R3 and SIMPLE Class Plans, Class R3 and SIMPLE Class shares pay the Distributor a monthly distribution fee at an annual rate of 0.25% of the average daily net assets of the Class R3 and SIMPLE Class shares, along with a service fee at an annual rate of 0.25% of the average daily net assets of the Class R3 and SIMPLE Class shares, for a total 12b-1 fee of 0.50%. Class I and Class R6 shares are not subject to a distribution and/or service fee.
The Plans provide that the distribution and service fees are payable to the Distributor regardless of the amounts actually expended by the Distributor for distribution of the Fund's shares and service activities.
In accordance with the Shareholder Services Plans for the Class R2 and Class R3 shares, the Manager has agreed to provide, through its affiliates or independent third parties, various shareholder and administrative support services to shareholders of the Class R2 and Class R3 shares. For its services, the Manager, its affiliates or independent third-party service providers are entitled to a shareholder service fee accrued daily and paid monthly at an annual rate of 0.10% of the average daily net assets of the Class R2 and Class R3 shares. This is in addition to any fees paid under the Class R2 and Class R3 Plans.
During the year ended October 31, 2022, shareholder service fees incurred by the Fund were as follows:
| |
| Class R2 | $2,469 |
| Class R3 | 2,195 |
(C) Sales Charges. The Fund was advised by the Distributor that the amount of initial sales charges retained on sales of Class A and Investor Class shares during the year ended October 31, 2022, were $40,251 and $4,710, respectively.
The Fund was also advised that the Distributor retained CDSCs on redemptions of Class A, Investor Class, Class B and Class C shares during the year ended October 31, 2022, of $41,251, $9, $2,795 and $7,548, respectively.
(D) Transfer, Dividend Disbursing and Shareholder Servicing Agent. NYLIM Service Company LLC, an affiliate of New York Life Investments, is the Fund's transfer, dividend disbursing and shareholder servicing agent pursuant to an agreement between NYLIM Service Company LLC and the Trust. NYLIM Service Company LLC has entered into an agreement with DST Asset Manager Solutions, Inc. ("DST"), pursuant to which DST performs certain transfer agent services on behalf of NYLIM Service Company LLC. New York Life Investments has contractually agreed to limit the transfer agency expenses charged to the Fund’s share classes to a maximum of 0.35% of that share class’s average daily net assets on an annual basis after deducting any applicable Fund or class-level expense reimbursement or small account fees. This agreement will remain in effect until February 28, 2023, and shall renew automatically for one-year terms unless New York Life Investments provides written notice of termination prior to the start of the next term or upon approval of the Board. During the year ended October 31, 2022, transfer agent expenses incurred by the Fund and any
Notes to Financial Statements (continued)
reimbursements, pursuant to the aforementioned Transfer Agency expense limitation agreement, were as follows:
| Class | Expense | Waived |
| Class A | $706,039 | $— |
| Investor Class | 187,548 | — |
| Class B | 33,734 | — |
| Class C | 284,561 | — |
| Class I | 395,595 | — |
| Class R2 | 2,275 | — |
| Class R3 | 2,061 | — |
| Class R6 | 3,983 | — |
| SIMPLE Class | 93 | — |
(E) Small Account Fee. Shareholders with small accounts adversely impact the cost of providing transfer agency services. In an effort to reduce total transfer agency expenses, the Fund has implemented a small account fee on certain types of accounts. As described in the Fund's prospectus, certain shareholders with an account balance of less than $1,000 ($5,000 for Class A share accounts) are charged an annual per account fee of $20 (assessed semi-annually), the proceeds from which offset transfer agent fees as reflected in the Statement of Operations. This small account fee will not apply to certain types of accounts as described further in the Fund’s prospectus.
(F) Capital. As of October 31, 2022, New York Life and its affiliates beneficially held shares of the Fund with the values and percentages of net assets as follows:
| Class R2 | $ 30,752 | 1.8% |
| Class R6 | 86,969,734 | 97.0 |
| SIMPLE Class | 24,144 | 70.2 |
Note 4-Federal Income Tax
As of October 31, 2022, the cost and unrealized appreciation (depreciation) of the Fund’s investment portfolio, including applicable derivative contracts and other financial instruments, as determined on a federal income tax basis, were as follows:
| | Federal Tax
Cost | Gross
Unrealized
Appreciation | Gross
Unrealized
(Depreciation) | Net
Unrealized
Appreciation/
(Depreciation) |
| Investments in Securities | $1,248,592,415 | $113,701,456 | $(128,426,841) | $(14,725,385) |
As of October 31, 2022, the components of accumulated gain (loss) on a tax basis were as follows:
Ordinary
income | Accumulated
Capital
and Other
Gain (Loss) | Other
Temporary
Differences | Unrealized
Appreciation
(Depreciation) | Total
Accumulated
Gain (Loss) |
| $— | $(88,545,354) | $(125,051) | $(18,859,718) | $(107,530,123) |
The difference between book-basis and tax-basis unrealized appreciation (depreciation) is primarily due to wash sale adjustments, mark to market of futures, mark to market of forwards, partnerships and cumulative bond amortization adjustments. The other temporary differences are primarily due to dividends payable.
The following table discloses the current year reclassifications between total distributable earnings (loss) and additional paid-in capital arising from permanent differences; net assets as of October 31, 2022 were not affected.
| | Total
Distributable
Earnings (Loss) | Additional
Paid-In
Capital |
| | $1,843 | $(1,843) |
The reclassifications for the Fund are primarily due to partnership adjustments.
As of October 31, 2022, for federal income tax purposes, capital loss carryforwards of $88,545,335, as shown in the table below, were available to the extent provided by the regulations to offset future realized gains of the Fund. Accordingly, no capital gains distributions are expected to be paid to shareholders until net gains have been realized in excess of such amounts.
Capital Loss
Available Through | Short-Term
Capital Loss
Amounts (000’s) | Long-Term
Capital Loss
Amounts (000’s) |
| Unlimited | $47,850 | $40,696 |
During the years ended October 31, 2022 and October 31, 2021, the tax character of distributions paid as reflected in the Statements of Changes in Net Assets was as follows:
| | 2022 | 2021 |
| Distributions paid from: | | |
| Ordinary Income | $ 66,389,313 | $38,522,467 |
| Long-Term Capital Gains | 52,187,385 | — |
| Return of Capital | 924,329 | — |
| Total | $119,501,027 | $38,522,467 |
Note 5–Custodian
JPMorgan is the custodian of cash and securities held by the Fund. Custodial fees are charged to the Fund based on the Fund's net assets and/or the market value of securities held by the Fund and the number of certain transactions incurred by the Fund.
Note 6–Line of Credit
The Fund and certain other funds managed by New York Life Investments maintain a line of credit with a syndicate of banks in order to secure a source of funds for temporary purposes to meet unanticipated or excessive redemption requests.
| 50 | MainStay Income Builder Fund |
Effective July 26, 2022, under the credit agreement (the “Credit Agreement”), the aggregate commitment amount is $600,000,000 with an additional uncommitted amount of $100,000,000. The commitment fee is an annual rate of 0.15% of the average commitment amount payable quarterly, regardless of usage, to JPMorgan, who serves as the agent to the syndicate. The commitment fee is allocated among the Fund and certain other funds managed by New York Life Investments based upon their respective net assets and other factors. Interest on any revolving credit loan is charged based upon the Federal Funds Rate, Daily Simple Secured Overnight Financing Rate ("SOFR") + 0.10%, or the Overnight Bank Funding Rate, whichever is higher. The Credit Agreement expires on July 25, 2023, although the Fund, certain other funds managed by New York Life Investments and the syndicate of banks may renew the Credit Agreement for an additional year on the same or different terms or enter into a credit agreement with a different syndicate of banks. Prior to July 26, 2022, the aggregate commitment amount and the commitment fee were the same as those under the current Credit Agreement. During the year ended October 31, 2022, there were no borrowings made or outstanding with respect to the Fund under the Credit Agreement.
Note 7–Interfund Lending Program
Pursuant to an exemptive order issued by the SEC, the Fund, along with certain other funds managed by New York Life Investments, may participate in an interfund lending program. The interfund lending program provides an alternative credit facility that permits the Fund and certain other funds managed by New York Life Investments to lend or borrow money for temporary purposes directly to or from one another, subject to the conditions of the exemptive order. During the year ended October 31, 2022, there were no interfund loans made or outstanding with respect to the Fund.
Note 8–Purchases and Sales of Securities (in 000’s)
During the year ended October 31, 2022, purchases and sales of U.S. government securities were $221,848 and $245,578, respectively. Purchases and sales of securities, other than U.S. government securities and short-term securities, were $642,981 and $753,924, respectively.
Note 9–Capital Share Transactions
Transactions in capital shares for the years ended October 31, 2022 and October 31, 2021, were as follows:
| Class A | Shares | Amount |
| Year ended October 31, 2022: | | |
| Shares sold | 4,935,609 | $ 96,706,936 |
| Shares issued to shareholders in reinvestment of distributions | 2,860,432 | 57,239,717 |
| Shares redeemed | (6,544,111) | (123,051,601) |
| Net increase (decrease) in shares outstanding before conversion | 1,251,930 | 30,895,052 |
| Shares converted into Class A (See Note 1) | 302,634 | 5,914,240 |
| Shares converted from Class A (See Note 1) | (20,489) | (355,945) |
| Net increase (decrease) | 1,534,075 | $ 36,453,347 |
| Year ended October 31, 2021: | | |
| Shares sold | 6,718,778 | $ 142,135,384 |
| Shares issued to shareholders in reinvestment of distributions | 822,923 | 17,256,179 |
| Shares redeemed | (5,138,682) | (108,230,051) |
| Net increase (decrease) in shares outstanding before conversion | 2,403,019 | 51,161,512 |
| Shares converted into Class A (See Note 1) | 947,002 | 19,889,012 |
| Shares converted from Class A (See Note 1) | (12,521) | (262,968) |
| Net increase (decrease) | 3,337,500 | $ 70,787,556 |
| |
| Investor Class | Shares | Amount |
| Year ended October 31, 2022: | | |
| Shares sold | 128,019 | $ 2,468,885 |
| Shares issued to shareholders in reinvestment of distributions | 272,544 | 5,471,647 |
| Shares redeemed | (291,315) | (5,532,511) |
| Net increase (decrease) in shares outstanding before conversion | 109,248 | 2,408,021 |
| Shares converted into Investor Class (See Note 1) | 57,030 | 1,086,744 |
| Shares converted from Investor Class (See Note 1) | (163,760) | (3,290,675) |
| Net increase (decrease) | 2,518 | $ 204,090 |
| Year ended October 31, 2021: | | |
| Shares sold | 223,896 | $ 4,726,482 |
| Shares issued to shareholders in reinvestment of distributions | 86,505 | 1,810,808 |
| Shares redeemed | (321,356) | (6,764,643) |
| Net increase (decrease) in shares outstanding before conversion | (10,955) | (227,353) |
| Shares converted into Investor Class (See Note 1) | 67,450 | 1,433,967 |
| Shares converted from Investor Class (See Note 1) | (774,517) | (16,270,731) |
| Net increase (decrease) | (718,022) | $ (15,064,117) |
| |
Notes to Financial Statements (continued)
| Class B | Shares | Amount |
| Year ended October 31, 2022: | | |
| Shares sold | 10,687 | $ 217,721 |
| Shares issued to shareholders in reinvestment of distributions | 38,866 | 794,933 |
| Shares redeemed | (197,793) | (3,825,274) |
| Net increase (decrease) in shares outstanding before conversion | (148,240) | (2,812,620) |
| Shares converted from Class B (See Note 1) | (115,518) | (2,199,922) |
| Net increase (decrease) | (263,758) | $ (5,012,542) |
| Year ended October 31, 2021: | | |
| Shares sold | 19,890 | $ 424,962 |
| Shares issued to shareholders in reinvestment of distributions | 10,799 | 226,696 |
| Shares redeemed | (179,895) | (3,820,460) |
| Net increase (decrease) in shares outstanding before conversion | (149,206) | (3,168,802) |
| Shares converted from Class B (See Note 1) | (120,192) | (2,566,421) |
| Net increase (decrease) | (269,398) | $ (5,735,223) |
| |
| Class C | Shares | Amount |
| Year ended October 31, 2022: | | |
| Shares sold | 215,648 | $ 4,232,502 |
| Shares issued to shareholders in reinvestment of distributions | 380,683 | 7,762,048 |
| Shares redeemed | (2,070,323) | (39,389,776) |
| Net increase (decrease) in shares outstanding before conversion | (1,473,992) | (27,395,226) |
| Shares converted from Class C (See Note 1) | (84,014) | (1,597,417) |
| Net increase (decrease) | (1,558,006) | $ (28,992,643) |
| Year ended October 31, 2021: | | |
| Shares sold | 430,737 | $ 9,167,564 |
| Shares issued to shareholders in reinvestment of distributions | 99,113 | 2,076,448 |
| Shares redeemed | (2,273,458) | (48,234,588) |
| Net increase (decrease) in shares outstanding before conversion | (1,743,608) | (36,990,576) |
| Shares converted from Class C (See Note 1) | (117,199) | (2,478,192) |
| Net increase (decrease) | (1,860,807) | $ (39,468,768) |
| |
| Class I | Shares | Amount |
| Year ended October 31, 2022: | | |
| Shares sold | 2,794,118 | $ 54,209,049 |
| Shares issued to shareholders in reinvestment of distributions | 1,544,583 | 31,269,065 |
| Shares redeemed | (7,570,244) | (144,284,186) |
| Net increase (decrease) in shares outstanding before conversion | (3,231,543) | (58,806,072) |
| Shares converted into Class I (See Note 1) | 28,295 | 491,409 |
| Shares converted from Class I (See Note 1) | (2,909) | (48,434) |
| Net increase (decrease) | (3,206,157) | $ (58,363,097) |
| Year ended October 31, 2021: | | |
| Shares sold | 4,197,725 | $ 89,307,598 |
| Shares issued to shareholders in reinvestment of distributions | 523,290 | 11,087,943 |
| Shares redeemed | (5,605,451) | (118,883,473) |
| Net increase (decrease) in shares outstanding before conversion | (884,436) | (18,487,932) |
| Shares converted into Class I (See Note 1) | 12,027 | 255,333 |
| Net increase (decrease) | (872,409) | $ (18,232,599) |
| |
| Class R2 | Shares | Amount |
| Year ended October 31, 2022: | | |
| Shares sold | 10,493 | $ 205,155 |
| Shares issued to shareholders in reinvestment of distributions | 2,953 | 59,140 |
| Shares redeemed | (48,655) | (863,716) |
| Net increase (decrease) | (35,209) | $ (599,421) |
| Year ended October 31, 2021: | | |
| Shares sold | 11,932 | $ 250,387 |
| Shares issued to shareholders in reinvestment of distributions | 1,273 | 26,494 |
| Shares redeemed | (40,653) | (863,142) |
| Net increase (decrease) | (27,448) | $ (586,261) |
| |
| Class R3 | Shares | Amount |
| Year ended October 31, 2022: | | |
| Shares sold | 40,831 | $ 769,068 |
| Shares issued to shareholders in reinvestment of distributions | 7,538 | 150,568 |
| Shares redeemed | (11,447) | (207,471) |
| Net increase (decrease) | 36,922 | $ 712,165 |
| Year ended October 31, 2021: | | |
| Shares sold | 54,676 | $ 1,117,408 |
| Shares issued to shareholders in reinvestment of distributions | 1,901 | 39,796 |
| Shares redeemed | (24,888) | (524,738) |
| Net increase (decrease) | 31,689 | $ 632,466 |
| |
| 52 | MainStay Income Builder Fund |
| Class R6 | Shares | Amount |
| Year ended October 31, 2022: | | |
| Shares sold | 461,312 | $ 8,868,522 |
| Shares issued to shareholders in reinvestment of distributions | 398,256 | 8,037,656 |
| Shares redeemed | (609,827) | (11,840,855) |
| Net increase (decrease) | 249,741 | $ 5,065,323 |
| Year ended October 31, 2021: | | |
| Shares sold | 514,043 | $ 10,955,197 |
| Shares issued to shareholders in reinvestment of distributions | 130,575 | 2,768,324 |
| Shares redeemed | (538,974) | (11,407,987) |
| Net increase (decrease) | 105,644 | $ 2,315,534 |
| |
| SIMPLE Class | Shares | Amount |
| Year ended October 31, 2022: | | |
| Shares sold | 620 | $ 12,539 |
| Shares issued to shareholders in reinvestment of distributions | 125 | 2,510 |
| Shares redeemed | (44) | (920) |
| Net increase (decrease) | 701 | $ 14,129 |
| Year ended October 31, 2021: | | |
| Shares issued to shareholders in reinvestment of distributions | 26 | $ 545 |
| Net increase (decrease) | 26 | $ 545 |
Note 10–Other Matters
As of the date of this report, interest rates in the United States and many parts of the world, including certain European countries, are ascending from historically low levels. Thus, the Fund currently faces a heightened level of risk associated with rising interest rates. This could be driven by a variety of factors, including but not limited to central bank monetary policies, changing inflation or real growth rates, general economic conditions, increasing bond issuances or reduced market demand for low yielding investments.
An outbreak of COVID-19, first detected in December 2019, has developed into a global pandemic and has resulted in travel restrictions, closure of international borders, certain businesses and securities markets, restrictions on securities trading activities, prolonged quarantines, supply chain disruptions, and lower consumer demand, as well as general concern and uncertainty. In 2022, many countries lifted some or all restrictions related to COVID-19. However, the continued impact of COVID-19 and related variants is uncertain and could further adversely affect the global economy, national economies, individual issuers and capital markets in unforeseeable ways and result in a substantial and extended economic downturn. Developments that disrupt global economies and financial markets, such as COVID-19, may magnify factors that affect the Fund's performance.
Note 11–Subsequent Events
In connection with the preparation of the financial statements of the Fund as of and for the year ended October 31, 2022, events and transactions subsequent to October 31, 2022, through the date the financial statements were issued have been evaluated by the Manager for possible adjustment and/or disclosure. No subsequent events requiring financial statement adjustment or disclosure have been identified.
Report of Independent Registered Public Accounting Firm
To the Shareholders of the Fund and Board of Trustees
The MainStay Funds:
Opinion on the Financial Statements
We have audited the accompanying statement of assets and liabilities of MainStay Income Builder Fund (the Fund), one of the funds constituting The MainStay Funds, including the portfolio of investments, as of October 31, 2022, the related statement of operations for the year then ended, the statements of changes in net assets for each of the years in the two-year period then ended, and the related notes (collectively, the financial statements) and the financial highlights for each of the years or periods in the five-year period then ended. In our opinion, the financial statements and financial highlights present fairly, in all material respects, the financial position of the Fund as of October 31, 2022, the results of its operations for the year then ended, the changes in its net assets for each of the years in the two-year period then ended, and the financial highlights for each of the years or periods in the five-year period then ended, in conformity with U.S. generally accepted accounting principles.
Basis for Opinion
These financial statements and financial highlights are the responsibility of the Fund's management. Our responsibility is to express an opinion on these financial statements and financial highlights based on our audits. We are a public accounting firm registered with the Public Company Accounting Oversight Board (United States) (PCAOB) and are required to be independent with respect to the Fund in accordance with the U.S. federal securities laws and the applicable rules and regulations of the Securities and Exchange Commission and the PCAOB.
We conducted our audits in accordance with the standards of the PCAOB. Those standards require that we plan and perform the audit to obtain reasonable assurance about whether the financial statements and financial highlights are free of material misstatement, whether due to error or fraud. Our audits included performing procedures to assess the risks of material misstatement of the financial statements and financial highlights, whether due to error or fraud, and performing procedures that respond to those risks. Such procedures included examining, on a test basis, evidence regarding the amounts and disclosures in the financial statements and financial highlights. Such procedures also included confirmation of securities owned as of October 31, 2022, by correspondence with custodians, the transfer agent, agent banks and brokers; when replies were not received from brokers or agent banks, we performed other auditing procedures. Our audits also included evaluating the accounting principles used and significant estimates made by management, as well as evaluating the overall presentation of the financial statements and financial highlights. We believe that our audits provide a reasonable basis for our opinion.

We have served as the auditor of one or more New York Life Investment Management investment companies since 2003.
Philadelphia, Pennsylvania
December 23, 2022
| 54 | MainStay Income Builder Fund |
Federal Income Tax Information
(Unaudited)
The Fund is required under the Internal Revenue Code to advise shareholders in a written statement as to the federal tax status of dividends paid by the Fund during such fiscal years. Accordingly, the Fund paid $52,386,413 as long term capital gain distributions.
In February 2023, shareholders will receive an IRS Form 1099-DIV or substitute Form 1099, which will show the federal tax status of the distributions received by shareholders in calendar year 2022. The amounts that will be reported on such 1099-DIV or substitute Form 1099 will be the amounts you are to use on your federal income tax return and will differ from the amounts which we must report for the Fund's fiscal year ended October 31, 2022.
Proxy Voting Policies and Procedures and Proxy Voting Record
The Fund is required to file with the SEC its proxy voting record for the 12-month period ending June 30 on Form N-PX. A description of the policies and procedures that are used to vote proxies relating to portfolio securities of the Fund is available free of charge upon request by calling 800-624-6782 or visiting the SEC’s website at www.sec.gov. The most recent Form N-PX or proxy voting record is available free of charge upon request by calling 800-624-6782; visiting newyorklifeinvestments.com; or visiting the SEC’s website at www.sec.gov.
Shareholder Reports and Quarterly Portfolio Disclosure
The Fund is required to file its complete schedule of portfolio holdings with the SEC 60 days after its first and third fiscal quarter on Form N-PORT. The Fund's holdings report is available free of charge upon request by calling New York Life Investments at 800-624-6782.
Board of Trustees and Officers (Unaudited)
The Trustees and officers of the Fund are listed below. The Board oversees the MainStay Group of Funds (which consists of MainStay Funds and MainStay Funds Trust), MainStay VP Funds Trust, MainStay MacKay DefinedTerm Municipal Opportunities Fund, MainStay CBRE Global Infrastructure Megatrends Fund, the Manager and the Subadvisors, and elects the officers of the Funds who are responsible for the day-to-day operations of the Fund. Information pertaining to the Trustees and officers is set forth below. Each Trustee serves until his or her successor is
elected and qualified or until his or her resignation, death or removal. Under the Board’s retirement policy, unless an exception is made, a Trustee must tender his or her resignation by the end of the calendar year during which he or she reaches the age of 75. The business address of each Trustee and officer listed below is 51 Madison Avenue, New York, New York 10010. None of the Trustees are “interested persons” (as defined by the 1940 Act and rules adopted by the SEC thereunder) of the Fund (“Independent Trustees”).
| | Name and
Year of Birth | Term of Office,
Position(s) Held and
Length of Service | Principal Occupation(s)
During Past Five Years | Number of
Portfolios in
Fund Complex
Overseen by
Trustee | Other Directorships
Held by Trustee |
| | | | | | |
| | David H. Chow
1957 | MainStay Funds: Trustee since 2016, Advisory Board Member (June 2015 to December 2015);MainStay Funds Trust:
Trustee since January 2016, Advisory Board Member (June 2015 to December 2015) | Founder and CEO, DanCourt Management, LLC since 1999 | 78 | MainStay VP Funds Trust: Trustee since January 2016, Advisory Board Member (June 2015 to December 2015) (31 portfolios);
MainStay MacKay DefinedTerm Municipal Opportunities Fund: Trustee since January 2016, Advisory Board Member (June 2015 to December 2015);
MainStay CBRE Global Infrastructure Megatrends Fund: Trustee since June 2021; VanEck Vectors Group of Exchange-Traded Funds: Independent Chairman of the Board of Trustees since 2008 and Trustee since 2006 (56 portfolios); and Berea College of Kentucky: Trustee since 2009, Chair of the Investment Committee since 2018 |
| | Susan B. Kerley
1951 | MainStay Funds: Chairman since 2017 and Trustee since 2007;MainStay Funds Trust:
Chairman since 2017 and Trustee since 1990** | President, Strategic Management Advisors LLC since 1990 | 78 | MainStay VP Funds Trust: Chairman since January 2017 and Trustee since 2007 (31 portfolios)**;
MainStay MacKay DefinedTerm Municipal Opportunities Fund: Chairman since 2017 and Trustee since 2011;
MainStay CBRE Global Infrastructure Megatrends Fund: Trustee since June 2021; and Legg Mason Partners Funds: Trustee since 1991 (45 portfolios) |
| | Alan R. Latshaw
1951 | MainStay Funds: Trustee since 2006;MainStay Funds Trust:
Trustee since 2007*** | Retired; Partner, Ernst & Young LLP (2002 to 2003); Partner, Arthur Andersen LLP (1989 to 2002); Consultant to the MainStay Funds Audit and Compliance Committee (2004 to 2006) | 78 | MainStay VP Funds Trust: Trustee since 2007 (31 portfolios)**;
MainStay MacKay DefinedTerm Municipal Opportunities Fund: Trustee since 2011; and
MainStay CBRE Global Infrastructure Megatrends Fund: Trustee since June 2021 |
| 56 | MainStay Income Builder Fund |
| | Name and
Year of Birth | Term of Office,
Position(s) Held and
Length of Service | Principal Occupation(s)
During Past Five Years | Number of
Portfolios in
Fund Complex
Overseen by
Trustee | Other Directorships
Held by Trustee |
| | | | | | |
| | Karen Hammond
1956 | MainStay Funds: Trustee since December 2021, Advisory Board Member (June 2021 to December 2021);MainStay Funds Trust:
Trustee since December 2021, Advisory Board Member (June 2021 to December 2021)
| Retired, Managing Director, Devonshire Investors (2007 to 2013); Senior Vice President, Fidelity Management & Research Co. (2005 to 2007); Senior Vice President and Corporate Treasurer, FMR Corp. (2003 to 2005); Chief Operating Officer, Fidelity Investments Japan (2001 to 2003) | 78 | MainStay VP Funds Trust: Trustee since December 2021, Advisory Board Member (June 2021 to December 2021) (31 Portfolios);
MainStay MacKay DefinedTerm Municipal Opportunities Fund: Trustee since December 2021, Advisory Board Member (June 2021 to December 2021);
MainStay CBRE Global Infrastructure Megatrends Fund: Trustee since December 2021, Advisory Board Member (June 2021 to December 2021);
Two Harbors Investment Corp.: Director since 2018;
Rhode Island State Investment Commission: Member since 2017; and
Blue Cross Blue Shield of Rhode Island: Director since 2019 |
| | Jacques P. Perold
1958 | MainStay Funds: Trustee since 2016, Advisory Board Member (June 2015 toDecember 2015);MainStay Funds Trust:
Trustee since January 2016, Advisory Board Member (June 2015 to December 2015) | Founder and Chief Executive Officer, CapShift Advisors LLC (since 2018); President, Fidelity Management & Research Company (2009 to 2014); President and Chief Investment Officer, Geode Capital Management, LLC (2001 to 2009) | 78 | MainStay VP Funds Trust: Trustee since January 2016, Advisory Board Member (June 2015 to December 2015) (31 portfolios);
MainStay MacKay DefinedTerm Municipal Opportunities Fund: Trustee since January 2016, Advisory Board Member (June 2015 to December 2015);
MainStay CBRE Global Infrastructure Megatrends Fund: Trustee since June 2021; Partners in Health: Trustee since 2019; Allstate Corporation: Director since 2015; and MSCI Inc.: Director since 2017 |
| | Richard S. Trutanic
1952 | MainStay Funds: Trustee since 1994;MainStay Funds Trust:
Trustee since 2007*** | Chairman and Chief Executive Officer, Somerset & Company (financial advisory firm) since 2004; Managing Director, The Carlyle Group (private investment firm) (2002 to 2004); Senior Managing Director, Partner and Board Member, Groupe Arnault S.A. (private investment firm) (1999 to 2002) | 78 | MainStay VP Funds Trust: Trustee since 2007 (31 portfolios)**;
MainStay MacKay DefinedTerm Municipal Opportunities Fund: Trustee since 2011; and MainStay CBRE Global Infrastructure Megatrends Fund: Trustee since June 2021 |
| ** | Includes prior service as a Director of MainStay VP Series Fund, Inc., the predecessor to MainStay VP Funds Trust. |
| *** | Includes prior service as a Director/Trustee of certain predecessor entities to MainStay Funds Trust. |
Board of Trustees and Officers (Unaudited) (continued)
| | Name and
Year of Birth | Position(s) Held and
Length of Service | Principal Occupation(s)
During Past Five Years | |
| | | | | |
| | Kirk C. Lehneis
1974 | President, MainStay Funds, MainStay Funds Trust since 2017 | Chief Operating Officer and Senior Managing Director (since 2016), New York Life Investment Management LLC and New York Life Investment Management Holdings LLC; Member of the Board of Managers (since 2017) and Senior Managing Director (since 2018), NYLIFE Distributors LLC; Chairman of the Board and Senior Managing Director, NYLIM Service Company LLC (since 2017); Trustee, President and Principal Executive Officer of IndexIQ Trust, IndexIQ ETF Trust and IndexIQ Active ETF Trust (since January 2018); President, MainStay CBRE Global Infrastructure Megatrends Fund (since 2021), MainStay MacKay DefinedTerm Municipal Opportunities Fund and MainStay VP Funds Trust (since 2017); Senior Managing Director, Global Product Development (From 2015-2016); Managing Director, Product Development (2010 to 2015), New York Life Investment Management LLC | |
| | Jack R. Benintende
1964 | Treasurer and Principal Financial and Accounting Officer, MainStay Funds (since 2007), MainStay Funds Trust (since 2009) | Managing Director, New York Life Investment Management LLC (since 2007); Treasurer and Principal Financial and Accounting Officer, MainStay CBRE Global Infrastructure Megatrends Fund (since 2021), MainStay MacKay DefinedTerm Municipal Opportunities Fund (since 2011) and MainStay VP Funds Trust (since 2007)** and Assistant Treasurer, New York Life Investment Management Holdings LLC (2008 to 2012) | |
| | J. Kevin Gao
1967 | Secretary and Chief Legal Officer, MainStay Funds and MainStay Funds Trust (since 2010) | Managing Director and Associate General Counsel, New York Life Investment Management LLC (since 2010); Secretary and Chief Legal Officer and MainStay CBRE Global Infrastructure Megatrends Fund (since 2021), MainStay MacKay DefinedTerm Municipal Opportunities Fund (since 2011) and MainStay VP Funds Trust (since 2010)** | |
| | Scott T. Harrington
1959 | Vice President— Administration, MainStay Funds (since 2009), MainStay Funds Trust (since 2009) | Managing Director, New York Life Investment Management LLC (including predecessor advisory organizations) (since 2000); Member of the Board of Directors, New York Life Trust Company (since 2009); Vice President—Administration, MainStay CBRE Global Infrastructure Megatrends Fund (since 2021), MainStay MacKay DefinedTerm Municipal Opportunities Fund (since 2011) and MainStay VP Funds Trust (since 2005)** | |
| | Kevin M. Gleason
1967 | Vice President and Chief Compliance Officer, MainStay Funds and MainStay Funds Trust (since June 2022) | Vice President and Chief Compliance Officer, IndexIQ, IndexIQ ETF Trust and Index IQ Active ETF Trust (since June 2022); Vice President and Chief Compliance Officer, MainStay CBRE Global Infrastructure Megatrends Fund, MainStay VP Funds Trust and MainStay MacKay DefinedTerm Municipal Opportunities Fund (since June 2022); Senior Vice President, Voya Investment Management and Chief Compliance Officer, Voya Family of Funds (2012-2022) | |
| * | The officers listed above are considered to be “interested persons” of the MainStay Group of Funds, MainStay VP Funds Trust, MainStay CBRE Global Infrastructure Megatrends Fund and MainStay MacKay DefinedTerm Municipal Opportunities Fund within the meaning of the 1940 Act because of their affiliation with the MainStay Group of Funds, New York Life Insurance Company and/or its affiliates, including New York Life Investment Management LLC, NYLIM Service Company LLC, NYLIFE Securities LLC and/or NYLIFE Distributors LLC, as described in detail in the column captioned “Principal Occupation(s) During Past Five Years.” Officers are elected annually by the Board. |
| ** | Includes prior service as an Officer of MainStay VP Series Fund, Inc., the predecessor to MainStay VP Funds Trust. |
Officers of the Trust (Who are not Trustees)*
| 58 | MainStay Income Builder Fund |
Equity
U.S. Equity
MainStay Epoch U.S. Equity Yield Fund
MainStay S&P 500 Index Fund1
MainStay Winslow Large Cap Growth Fund
MainStay WMC Enduring Capital Fund
MainStay WMC Growth Fund
MainStay WMC Small Companies Fund
MainStay WMC Value Fund
International Equity
MainStay Epoch International Choice Fund
MainStay MacKay International Equity Fund
MainStay WMC International Research Equity Fund
Emerging Markets Equity
MainStay Candriam Emerging Markets Equity Fund
Global Equity
MainStay Epoch Capital Growth Fund
MainStay Epoch Global Equity Yield Fund
Fixed Income
Taxable Income
MainStay Candriam Emerging Markets Debt Fund
MainStay Floating Rate Fund
MainStay MacKay High Yield Corporate Bond Fund
MainStay MacKay Short Duration High Yield Fund
MainStay MacKay Strategic Bond Fund
MainStay MacKay Total Return Bond Fund
MainStay MacKay U.S. Infrastructure Bond Fund
MainStay Short Term Bond Fund
Tax-Exempt Income
MainStay MacKay California Tax Free Opportunities Fund2
MainStay MacKay High Yield Municipal Bond Fund
MainStay MacKay New York Tax Free Opportunities Fund3
MainStay MacKay Short Term Municipal Fund
MainStay MacKay Strategic Municipal Allocation Fund
MainStay MacKay Tax Free Bond Fund
Money Market
MainStay Money Market Fund
Mixed Asset
MainStay Balanced Fund
MainStay Income Builder Fund
MainStay MacKay Convertible Fund
Speciality
MainStay CBRE Global Infrastructure Fund
MainStay CBRE Real Estate Fund
MainStay Cushing MLP Premier Fund
Asset Allocation
MainStay Conservative Allocation Fund
MainStay Conservative ETF Allocation Fund
MainStay Defensive ETF Allocation Fund
MainStay Equity Allocation Fund
MainStay Equity ETF Allocation Fund
MainStay ESG Multi-Asset Allocation Fund
MainStay Growth Allocation Fund
MainStay Growth ETF Allocation Fund
MainStay Moderate Allocation Fund
MainStay Moderate ETF Allocation Fund
Manager
New York Life Investment Management LLC
New York, New York
Subadvisors
Candriam4
Strassen, Luxembourg
CBRE Investment Management Listed Real Assets LLC
Radnor, Pennsylvania
Cushing Asset Management, LP
Dallas, Texas
Epoch Investment Partners, Inc.
New York, New York
MacKay Shields LLC4
New York, New York
NYL Investors LLC4
New York, New York
Wellington Management Company LLP
Boston, Massachusetts
Winslow Capital Management, LLC
Minneapolis, Minnesota
Legal Counsel
Dechert LLP
Washington, District of Columbia
Independent Registered Public Accounting Firm
KPMG LLP
Philadelphia, Pennsylvania
Distributor
NYLIFE Distributors LLC4
Jersey City, New Jersey
Custodian
JPMorgan Chase Bank, N.A.
New York, New York
1.
Prior to February 28, 2022, the Fund's name was MainStay MacKay S&P 500 Index Fund.
| 2. | This Fund is registered for sale in AZ, CA, NV, OR, TX, UT, WA and MI (Class A and Class I shares only), and CO, FL, GA, HI, ID, MA, MD, NH, NJ and NY (Class I shares only). |
| 3. | This Fund is registered for sale in CA, CT, DE, FL, MA, NJ, NY and VT. |
| 4. | An affiliate of New York Life Investment Management LLC. |
Not part of the Annual Report
For more information
800-624-6782
newyorklifeinvestments.com
“New York Life Investments” is both a service mark, and the common trade name, of certain investment advisors affiliated with New York Life Insurance Company. The MainStay Funds® are managed by New York Life Investment Management LLC and distributed by NYLIFE Distributors LLC, 30 Hudson Street, Jersey City, NJ 07302, a wholly owned subsidiary of New York Life Insurance Company. NYLIFE Distributors LLC is a Member FINRA/SIPC.
©2022 NYLIFE Distributors LLC. All rights reserved.
| 5013761.2MS229-22 | MSIB11-12/22 |
(NYLIM) NL216
MainStay MacKay Convertible Fund
Message from the President and Annual Report
October 31, 2022
Sign up for e-delivery of your shareholder reports. For full details on e-delivery, including who can participate and what you can receive via e-delivery,
please log in to newyorklifeinvestments.com/accounts.
| Not FDIC/NCUA Insured | Not a Deposit | May Lose Value | No Bank Guarantee | Not Insured by Any Government Agency |
This page intentionally left blank
Message from the President
A series of economic and geopolitical challenges undermined equity and fixed-income markets during the 12-month reporting period ended October 31, 2022. Stocks and bonds alike trended lower in the face of sharply rising interest rates, increasing inflationary pressures, slowing economic growth and Russia’s invasion of Ukraine.
The reporting period began on a mixed note, with concerns about the spreading Omicron variant of the COVID-19 virus and increasingly hawkish statements from the U.S. Federal Reserve (the “Fed”) regarding mounting inflation, countered by bullish sentiment stemming from U.S. economic growth and strong corporate earnings. In January 2022, markets turned decisively negative as comments from the Fed raised the likelihood of rate hikes as early as March, and Russia issued increasingly aggressive threats toward Ukraine. The onset of Russia’s invasion in February exacerbated global inflationary pressures while increasing investor uncertainty. Domestic supply shortages, international trade imbalances and rising inflation caused GDP (gross domestic product) to contract in the first and second quarters of the year, although employment and consumer spending proved resilient. Prices for petroleum surged to multi-year highs, while many key agricultural chemicals and industrial metals climbed as well. Accelerating inflationary forces prompted the Fed to implement its most aggressive interest rate increases since the 1980s with a series of five sharp rate hikes, raising the federal funds rate from a range of 0.00% to 0.25% in March to 3.00% to 3.25% in September, with additional rate hikes expected before the end of the year. International central banks generally followed suit, raising rates by varying degrees in efforts to curb local inflation, although most increases remained significantly more modest than those in the United States. Relatively high U.S. interest rates and risk-averse international sentiment pushed U.S. dollar values higher compared to most other currencies, with the ensuing negative impact on global prices for food, fuel and other key, U.S.-dollar-denominated products.
The effects of these interrelated challenges were felt throughout U.S. and international financial markets. The S&P 500® Index, a widely regarded benchmark of U.S. market performance, declined by more than 14% during the reporting period. Although the energy sector generated strong gains, bolstered by elevated oil and gas prices, most other industry areas recorded losses. The more cyclical and growth-oriented sectors of consumer discretionary, real estate and information technology delivered the
weakest returns, while the traditionally defensive and value-oriented consumer staples, utilities and health care sectors outperformed. International stocks lagged compared to their U.S. counterparts, with some emerging markets, such as China, suffering particularly steep losses. A few markets, however, including Brazil, Mexico and the United Arab Emirates, ended the reporting period with little change. Fixed-income markets saw bond prices broadly decline as yields rose along with interest rates. Short-term yields rose faster than long-term yields, producing a yield curve inversion from July through the end of the reporting period, with long-term rates remaining below short-term rates. While floating-rate instruments, which feature variable interest rates that allow investors to benefit from a rising rate environment, provided a degree of insulation from inflation-driven trends, they were not immune to the market’s widespread declines.
While the Fed acknowledges the costs of rising rates in terms of weaker GDP growth and unsettled financial markets over the short term, its primary focus continues to be the longer-term economic impact of inflation. With the latest figures as of the date of this report showing that inflation remains above 8%, versus a target rate of just 2%, the Fed clearly has a distance yet to go, making further rate increases and market volatility more likely in the coming months. The question remains as to whether the Fed and other central banks will manage a so-called “soft landing,” curbing inflation while avoiding a persistent economic slowdown. If they prove successful, we expect that favorable inflation trends and increasingly attractive valuations in both equity and bond markets should eventually translate into sustainable improvements in the investment environment.
Whatever actions the Fed takes and however financial markets react, as a MainStay investor, you can depend on us to continue providing the insight, expertise and service that have long defined New York Life Investments. Thank you for trusting us to help you meet your investment needs.
Sincerely,
Kirk C. Lehneis
President
The opinions expressed are as of the date of this report and are subject to change. There is no guarantee that any forecast made will come to pass. This material does not constitute investment advice and is not intended as an endorsement of any specific investment. Past performance is no guarantee of future results.
Not part of the Annual Report
Investors should refer to the Fund’s Summary Prospectus and/or Prospectus and consider the Fund’s investment objectives, strategies, risks, charges and expenses carefully before investing. The Summary Prospectus and/or Prospectus contain this and other information about the Fund. You may obtain copies of the Fund’s Summary Prospectus, Prospectus and Statement of Additional Information, which includes information about The MainStay Funds' Trustees, free of charge, upon request, by calling toll-free 800-624-6782, by writing to NYLIFE Distributors LLC, Attn: MainStay Marketing Department, 30 Hudson Street, Jersey City, NJ 07302 or by sending an e-mail to MainStayShareholderServices@nylim.com. These documents are also available via the MainStay Funds’ website at newyorklifeinvestments.com. Please read the Fund’s Summary Prospectus and/or Prospectus carefully before investing.
Investment and Performance Comparison (Unaudited)
Performance data quoted represents past performance. Past performance is no guarantee of future results. Because of market volatility and other factors, current performance may be lower or higher than the figures shown. Investment return and principal value will fluctuate, and as a result, when shares are redeemed, they may be worth more or less than their original cost. The graph below depicts the historical performance of Class I shares of the Fund. Performance will vary from class to class based on differences in class-specific expenses and sales charges. For performance information current to the most recent month-end, please call 800-624-6782 or visit newyorklifeinvestments.com.
The performance table and graph do not reflect the deduction of taxes that a shareholder would pay on distributions or Fund share redemptions. Total returns reflect maximum applicable sales charges as indicated in the table below, if any, changes in share price, and reinvestment of dividend and capital gain distributions. The graph assumes the initial investment amount shown below and reflects the deduction of all sales charges that would have applied for the period of investment. Performance figures may reflect certain fee waivers and/or expense limitations, without which total returns may have been lower. For more information on share classes and current fee waivers and/or expense limitations (if any), please refer to the Notes to Financial Statements.
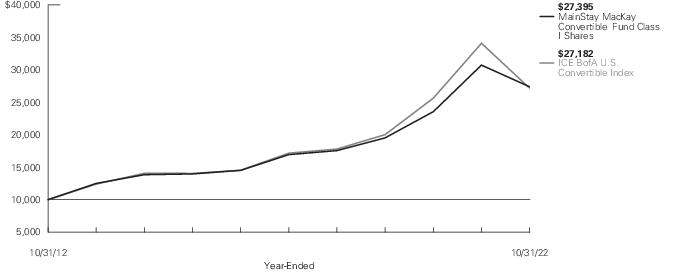
| Average Annual Total Returns for the Year-Ended October 31, 2022 |
| Class | Sales Charge | | Inception
Date | One
Year | Five
Years | Ten
Years | Gross
Expense
Ratio1 |
| Class A Shares | Maximum 5.5% Initial Sales Charge | With sales charges | 1/3/1995 | -16.01% | 8.49% | 9.65% | 0.92% |
| | | Excluding sales charges | | -11.12 | 9.72 | 10.27 | 0.92 |
| Investor Class Shares2 | Maximum 5% Initial Sales Charge | With sales charges | 2/28/2008 | -15.75 | 8.28 | 9.44 | 1.13 |
| | | Excluding sales charges | | -11.31 | 9.51 | 10.06 | 1.13 |
| Class B Shares3 | Maximum 5% CDSC | With sales charges | 5/1/1986 | -15.53 | 8.41 | 9.24 | 1.88 |
| | if Redeemed Within the First Six Years of Purchase | Excluding sales charges | | -11.97 | 8.70 | 9.24 | 1.88 |
| Class C Shares | Maximum 1% CDSC | With sales charges | 9/1/1998 | -12.70 | 8.70 | 9.25 | 1.88 |
| | if Redeemed Within One Year of Purchase | Excluding sales charges | | -11.99 | 8.70 | 9.25 | 1.88 |
| Class I Shares | No Sales Charge | | 11/28/2008 | -10.84 | 10.09 | 10.60 | 0.67 |
| 1. | The gross expense ratios presented reflect the Fund’s “Total Annual Fund Operating Expenses” from the most recent Prospectus, as supplemented, and may differ from other expense ratios disclosed in this report. |
| 2. | Prior to June 30, 2020, the maximum initial sales charge was 5.5%, which is reflected in the applicable average annual total return figures shown. |
| 3. | Class B shares are closed to all new purchases as well as additional investments by existing Class B shareholders. |
The footnotes on the next page are an integral part of the table and graph and should be carefully read in conjunction with them.
| Benchmark Performance* | One
Year | Five
Years | Ten
Years |
| ICE BofA U.S. Convertible Index1 | -20.26% | 9.63% | 10.52% |
| Morningstar Convertibles Category Average2 | -18.98 | 7.18 | 8.09 |
| * | Returns for indices reflect no deductions for fees, expenses or taxes, except for foreign withholding taxes where applicable. Results assume reinvestment of all dividends and capital gains. An investment cannot be made directly in an index. |
| 1. | The ICE BofA U.S. Convertible Index is the Fund’s primary broad–based securities market index for comparison purposes. The ICE BofA U.S. Convertible Index is a market-capitalization weighted index of domestic corporate convertible securities. In order to be included in this Index, bonds and preferred stocks must be convertible only to common stock. |
| 2. | The Morningstar Convertibles Category Average is representative of funds that are designed to offer some of the capital-appreciation potential of stock portfolios while also supplying some of the safety and yield of bond portfolios. Results are based on average total returns of similar funds with all dividends and capital gain distributions reinvested. |
The footnotes on the preceding page are an integral part of the table and graph and should be carefully read in conjunction with them.
| 6 | MainStay MacKay Convertible Fund |
Cost in Dollars of a $1,000 Investment in MainStay MacKay Convertible Fund (Unaudited)
The example below is intended to describe the fees and expenses borne by shareholders during the six-month period from May 1, 2022 to October 31, 2022, and the impact of those costs on your investment.
Example
As a shareholder of the Fund you incur two types of costs: (1) transaction costs, including exchange fees and sales charges (loads) on purchases (as applicable), and (2) ongoing costs, including management fees, distribution and/or service (12b-1) fees and other Fund expenses (as applicable). This example is intended to help you understand your ongoing costs (in dollars) of investing in the Fund and to compare these costs with the ongoing costs of investing in other mutual funds. The example is based on an investment of $1,000 made at the beginning of the six-month period and held for the entire period from May 1, 2022 to October 31, 2022.
This example illustrates your Fund’s ongoing costs in two ways:
Actual Expenses
The second and third data columns in the table below provide information about actual account values and actual expenses. You may use the information in these columns, together with the amount you invested, to estimate the expenses that you paid during the six months ended October 31, 2022. Simply divide your account value by $1,000 (for example, an
$8,600 account value divided by $1,000 = 8.6), then multiply the result by the number under the heading entitled “Expenses Paid During Period” to estimate the expenses you paid on your account during this period.
Hypothetical Example for Comparison Purposes
The fourth and fifth data columns in the table below provide information about hypothetical account values and hypothetical expenses based on the Fund’s actual expense ratio and an assumed rate of return of 5% per year before expenses, which is not the Fund’s actual return. The hypothetical account values and expenses may not be used to estimate the actual ending account balances or expenses you paid for the six-month period shown. You may use this information to compare the ongoing costs of investing in the Fund with the ongoing costs of investing in other mutual funds. To do so, compare this 5% hypothetical example with the 5% hypothetical examples that appear in the shareholder reports of the other mutual funds.
Please note that the expenses shown in the table are meant to highlight your ongoing costs only and do not reflect any transactional costs, such as exchange fees or sales charges (loads). Therefore, the fourth and fifth data columns of the table are useful in comparing ongoing costs only and will not help you determine the relative total costs of owning different funds. In addition, if these transactional costs were included, your costs would have been higher.
| Share Class | Beginning
Account
Value
5/1/22 | Ending Account
Value (Based
on Actual
Returns and
Expenses)
10/31/22 | Expenses
Paid
During
Period1 | Ending Account
Value (Based
on Hypothetical
5% Annualized
Return and
Actual Expenses)
10/31/22 | Expenses
Paid
During
Period1 | Net Expense
Ratio
During
Period2 |
| Class A Shares | $1,000.00 | $972.80 | $4.72 | $1,020.42 | $4.84 | 0.95% |
| Investor Class Shares | $1,000.00 | $971.30 | $5.66 | $1,019.46 | $5.80 | 1.14% |
| Class B Shares | $1,000.00 | $967.80 | $9.37 | $1,015.68 | $9.60 | 1.89% |
| Class C Shares | $1,000.00 | $967.80 | $9.37 | $1,015.68 | $9.60 | 1.89% |
| Class I Shares | $1,000.00 | $974.10 | $3.04 | $1,022.13 | $3.11 | 0.61% |
| 1. | Expenses are equal to the Fund’s annualized expense ratio of each class multiplied by the average account value over the period, divided by 365 and multiplied by 184 (to reflect the six-month period). The table above represents the actual expenses incurred during the six-month period. In addition to the fees and expenses which the Fund bears directly, it also indirectly bears a pro rata share of the fees and expenses of the underlying funds in which it invests. Such indirect expenses are not included in the above-reported expense figures. |
| 2. | Expenses are equal to the Fund's annualized expense ratio to reflect the six-month period. |
Portfolio Composition as of October 31, 2022 (Unaudited)
See Portfolio of Investments beginning on page 11 for specific holdings within these categories. The Fund's holdings are subject to change.
Top Ten Holdings and/or Issuers Held as of October 31, 2022 (excluding short-term investments) (Unaudited)
| 1. | Pioneer Natural Resources Co., 0.25%, due 5/15/25 |
| 2. | EQT Corp., 1.75%, due 5/1/26 |
| 3. | Elevance Health, Inc., 2.75%, due 10/15/42 |
| 4. | Danaher Corp., 5.00%, Series B |
| 5. | NICE Ltd., (zero coupon), due 9/15/25 |
| 6. | Palo Alto Networks, Inc., 0.375%-0.75%, due 7/1/23–6/1/25 |
| 7. | BioMarin Pharmaceutical, Inc., 1.25%, due 5/15/27 |
| 8. | Southwest Airlines Co., 1.25%, due 5/1/25 |
| 9. | Microchip Technology, Inc., 0.125%, due 11/15/24 |
| 10. | Helix Energy Solutions Group, Inc., 6.75%, due 2/15/26 |
| 8 | MainStay MacKay Convertible Fund |
Portfolio Management Discussion and Analysis (Unaudited)
Questions answered by portfolio manager Edward Silverstein, CFA, of MacKay Shields LLC, the Fund’s Subadvisor.
How did MainStay MacKay Convertible Fund perform relative to its benchmark and peer group during the 12 months ended October 31, 2022?
For the 12 months ended October 31, 2022, Class I shares of MainStay MacKay Convertible Fund returned −10.84%, outperforming the −20.26% return of the Fund’s benchmark, the ICE BofA U.S. Convertible Index (the "Index"). Over the same period, Class I shares also outperformed the −18.98% return of the Morningstar Convertibles Category Average.1
What factors affected the Fund’s relative performance during the reporting period?
The Fund outperformed the Index largely due to overweight energy sector exposure and underweight exposure to several richly valued securities in the information technology, consumer discretionary and alternative energy sectors. The Fund’s investment process, which generally favors more value-oriented companies based on their free-cash-flow profile, avoided many of the market’s most richly valued sectors, while identifying winners in energy.
During the reporting period, were there any market events that materially impacted the Fund’s performance or liquidity?
As mentioned above, the Fund’s performance relative to the Index was bolstered by underweight exposure to richly-valued information technology and consumer discretionary companies—many of which are prominently represented in the U.S. convertible market—that were vulnerable to sharp declines as interest rates rose. Returns also benefited from the strong absolute performance of the energy sector, to which the Fund held significantly overweight exposure. Conversely, widening credit spreads and the steep rise in interest rates that occurred during the reporting period undermined the Fund’s absolute returns.
During the reporting period, which sectors were the strongest positive contributors to the Fund’s relative performance and which sectors were particularly weak?
The energy sector made the strongest positive contribution to the Fund’s performance relative to the Index due to overweight allocation and favorable stock selection. (Contributions take weightings and total returns into account.) Security selection in the consumer discretionary and information technology sectors further enhanced relative returns. Conversely, an underweight allocation to the utilities sector, along with security selection in
communication services and financials holdings undermined relative returns.
During the reporting period, which individual stocks made the strongest positive contributions to the Fund’s absolute performance and which stocks detracted the most?
The top contributors to the Fund’s absolute performance during the reporting period included the convertible bonds of EQT, Pioneer Natural Resources and Elevance. The position in EQT, an Appalachian natural gas producer, rose sharply as the price for natural gas soared due to a colder than normal winter in the United States. In addition, shipments of liquified natural gas to Asia and Europe increased when countries in those regions sought alternative fuel sources to offset lost supply from Russia. The convertible bonds of petroleum producer Pioneer Natural Resources rose as the company benefited from elevated crude oil prices. Prices for crude oil approached record highs, with inventories well-below historical averages due a shortfall in U.S. production and elevated demand as most global pandemic-related lockdowns ended. The convertible bonds of health insurer Elevance (which changed its name from Anthem during the reporting period) rose as the company exceeded earnings estimates due to strong membership growth and below-average medical claims.
During the same period, the most significant detractors from the Fund’s absolute performance included the convertible bonds of NICE Systems, the convertible preferred shares of Danaher and the convertible bonds of MongoDB. The convertible bonds of Israeli call-center software firm NICE Systems declined despite the company’s better-than-expected earnings over several consecutive quarters. The decline in the company’s common shares and convertible bonds was likely due to the general market sell-off that hit richly valued technology shares particularly hard. The convertible preferred shares of laboratory and testing company Danaher fell, even though the company reported better-than-expected first-quarter 2022 earnings. Investors were likely concerned that Danaher’s testing business could experience a slowdown in COVID-19 testing, after a similarly situated life sciences company reported a return to more normalized levels of testing demand. The convertible bonds of database software management firm MongoDB declined due, in part, to the sharp market-wide sell-off of technology-related shares, and also as a result of lower sales guidance for the second half of 2022. The convertible bonds of media company, Match Group, fell as the
| 1. | See page 5 for other share class returns, which may be higher or lower than Class I share returns. See page 6 for more information on benchmark and peer group returns. |
company reported a slowdown in new users of its dating and other media sites.
What were some of the Fund’s largest purchases and sales during the reporting period?
During the reporting period, the Fund initiated positions in the convertible bonds of Dropbox and MGP Ingredients; and increased the size of its holding in Uber Technologies. We added the position in software developer Dropbox due to the company’s attractive valuation based on its free cash flow profile. We purchased the position in distillers MGP Ingredients when the company offered convertible bonds in an initial public offering. The Fund also made purchases in two health care companies: biotechnology firm Halozyme and medical device company Haemonetics, which was an additional purchase. Both firms appear to have solid fundamental businesses and generate free cash flow.
During the reporting period, the Fund parted with holdings that matured, the largest of which were Workday and Broadcom. In addition, we sold the Fund’s holding in Atlas Air Worldwide after it was announced that the company would be acquired by an investment firm. We also sold the Fund’s holding in pharmaceutical company Neurocrine Biosciences when the company tendered for a large portion of the outstanding bonds. Lastly, we sold the Fund’s holdings in Shopify and RingCentral, as the bonds lost most of their equity sensitivity and the yields-to-maturity were not sufficiently compelling to continue to hold the bonds for their value as straight debt.
How did the Fund’s sector weightings change during the reporting period?
During the reporting period, there were no material changes to the Fund’s sector positioning. At the margin, the Fund increased its exposure to the consumer staples, energy and real estate sectors and reduced its exposure to the industrials and financials sectors.
How was the Fund positioned at the end of the reporting period?
As of October 31, 2022, the Fund held overweight exposure to the energy, consumer staples and health care sectors. As of the same date, the Fund held underweight exposure to the financials, communication services, consumer discretionary, information technology, utilities, materials, industrials and real estate sectors.
The opinions expressed are those of the portfolio manager as of the date of this report and are subject to change. There is no guarantee that any forecasts will come to pass. This material does not constitute investment advice and is not intended as an endorsement of any specific investment.
| 10 | MainStay MacKay Convertible Fund |
Portfolio of Investments October 31, 2022†
| | Principal
Amount | Value |
| Long-Term Bonds 2.7% |
| Corporate Bonds 2.7% |
| Biotechnology 0.2% |
| Bridgebio Pharma, Inc. | | |
| 2.50%, due 3/15/27 | $ 6,975,000 | $ 4,074,998 |
| Commercial Services 0.5% |
| Block, Inc. | | |
| 0.25%, due 11/1/27 | 11,637,000 | 8,684,614 |
| Leisure Time 0.3% |
| NCL Corp. Ltd. | | |
| 5.375%, due 8/1/25 | 4,670,000 | 5,552,630 |
| Oil & Gas 0.1% |
| Valaris Ltd. | | |
| Series 1145 | | |
| 8.25% (8.25% Cash or 12.00% PIK), due 4/30/28 (a) | 1,461,000 | 1,437,259 |
| Oil & Gas Services 0.0% ‡ |
| Weatherford International Ltd. | | |
| 11.00%, due 12/1/24 (b) | 198,000 | 203,505 |
| Semiconductors 1.3% |
| Silicon Laboratories, Inc. | | |
| 0.625%, due 6/15/25 | 18,021,000 | 20,430,951 |
| Software 0.3% |
| Five9, Inc. | | |
| 0.50%, due 6/1/25 | 4,675,000 | 4,156,075 |
Total Corporate Bonds
(Cost $52,913,669) | | 44,540,032 |
Total Long-Term Bonds
(Cost $52,913,669) | | 44,540,032 |
| Convertible Securities 88.2% |
| Convertible Bonds 80.1% |
| Airlines 2.8% |
| American Airlines Group, Inc. | | |
| 6.50%, due 7/1/25 (c) | 7,040,000 | 7,923,520 |
| JetBlue Airways Corp. | | |
| 0.50%, due 4/1/26 | 4,632,000 | 3,453,156 |
| Southwest Airlines Co. | | |
| 1.25%, due 5/1/25 | 27,566,000 | 33,995,769 |
| | | 45,372,445 |
| | Principal
Amount | Value |
| |
| Auto Manufacturers 1.7% |
| Ford Motor Co. | | |
| (zero coupon), due 3/15/26 | $ 27,838,000 | $ 28,116,380 |
| Beverages 1.1% |
| MGP Ingredients, Inc. | | |
| 1.875%, due 11/15/41 (b) | 13,305,000 | 17,237,958 |
| Biotechnology 5.0% |
| Alnylam Pharmaceuticals, Inc. | | |
| 1.00%, due 9/15/27 (b) | 5,460,000 | 5,498,220 |
| BioMarin Pharmaceutical, Inc. | | |
| 1.25%, due 5/15/27 (c) | 34,659,000 | 34,846,131 |
| Guardant Health, Inc. | | |
| (zero coupon), due 11/15/27 | 7,026,000 | 5,001,810 |
| Halozyme Therapeutics, Inc. | | |
| 1.00%, due 8/15/28 (b) | 8,000,000 | 8,430,000 |
| Illumina, Inc. | | |
| (zero coupon), due 8/15/23 (c) | 18,223,000 | 17,668,661 |
| Ionis Pharmaceuticals, Inc. | | |
| (zero coupon), due 4/1/26 | 9,349,000 | 9,220,451 |
| | | 80,665,273 |
| Commercial Services 2.5% |
| Alarm.com Holdings, Inc. | | |
| (zero coupon), due 1/15/26 | 3,775,000 | 3,093,235 |
| Block, Inc. | | |
| (zero coupon), due 5/1/26 | 14,521,000 | 11,653,102 |
| Chegg, Inc. | | |
| (zero coupon), due 9/1/26 | 8,817,000 | 6,916,055 |
| Euronet Worldwide, Inc. | | |
| 0.75%, due 3/15/49 (c) | 11,900,000 | 11,074,437 |
| Repay Holdings Corp. | | |
| (zero coupon), due 2/1/26 (b) | 2,525,000 | 1,748,563 |
| Sabre GLBL, Inc. | | |
| 4.00%, due 4/15/25 | 1,835,000 | 1,874,453 |
| Shift4 Payments, Inc. | | |
| (zero coupon), due 12/15/25 | 3,720,000 | 3,373,575 |
| 0.50%, due 8/1/27 | 1,145,000 | 886,659 |
| | | 40,620,079 |
| Computers 2.5% |
| Lumentum Holdings, Inc. | | |
| 0.50%, due 12/15/26 | 25,385,000 | 24,940,762 |
| Parsons Corp. | | |
| 0.25%, due 8/15/25 | 4,641,000 | 5,337,150 |
| Zscaler, Inc. | | |
| 0.125%, due 7/1/25 (c) | 8,613,000 | 10,598,297 |
| | | 40,876,209 |
The notes to the financial statements are an integral part of, and should be read in conjunction with, the financial statements.
11
Portfolio of Investments October 31, 2022† (continued)
| | Principal
Amount | Value |
| Convertible Bonds (continued) |
| Cosmetics & Personal Care 0.5% |
| Beauty Health Co. (The) | | |
| 1.25%, due 10/1/26 (b)(c) | $ 10,567,000 | $ 8,390,198 |
| Diversified Financial Services 0.1% |
| Upstart Holdings, Inc. | | |
| 0.25%, due 8/15/26 | 2,265,000 | 1,249,997 |
| Electric 1.7% |
| NRG Energy, Inc. | | |
| 2.75%, due 6/1/48 | 23,454,000 | 27,546,723 |
| Energy-Alternate Sources 1.8% |
| Enphase Energy, Inc. | | |
| (zero coupon), due 3/1/26 | 9,485,000 | 11,671,292 |
| NextEra Energy Partners LP | | |
| (zero coupon), due 11/15/25 (b)(c) | 9,417,000 | 9,807,806 |
| SolarEdge Technologies, Inc. | | |
| (zero coupon), due 9/15/25 (c) | 7,790,000 | 8,728,695 |
| | | 30,207,793 |
| Entertainment 2.3% |
| Live Nation Entertainment, Inc. | | |
| 2.50%, due 3/15/23 | 6,833,000 | 8,294,616 |
| Marriott Vacations Worldwide Corp. | | |
| (zero coupon), due 1/15/26 | 3,110,000 | 3,190,860 |
| Vail Resorts, Inc. | | |
| (zero coupon), due 1/1/26 (c) | 28,521,000 | 25,383,690 |
| | | 36,869,166 |
| Food 1.1% |
| Chefs' Warehouse, Inc. (The) | | |
| 1.875%, due 12/1/24 | 11,507,000 | 12,479,341 |
| Post Holdings, Inc. | | |
| 2.50%, due 8/15/27 (b)(c) | 4,561,000 | 4,761,684 |
| | | 17,241,025 |
| Healthcare-Products 3.7% |
| CONMED Corp. | | |
| 2.25%, due 6/15/27 (b) | 23,095,000 | 20,288,957 |
| Exact Sciences Corp. | | |
| 0.375%, due 3/1/28 (c) | 22,800,000 | 14,719,680 |
| Haemonetics Corp. | | |
| (zero coupon), due 3/1/26 | 9,226,000 | 7,657,580 |
| Integra LifeSciences Holdings Corp. | | |
| 0.50%, due 8/15/25 | 8,670,000 | 8,089,110 |
| | Principal
Amount | Value |
| |
| Healthcare-Products (continued) |
| NuVasive, Inc. | | |
| 0.375%, due 3/15/25 | $ 8,085,000 | $ 7,013,738 |
| Omnicell, Inc. | | |
| 0.25%, due 9/15/25 | 2,760,000 | 2,766,900 |
| | | 60,535,965 |
| Healthcare-Services 4.2% |
| Elevance Health, Inc. | | |
| 2.75%, due 10/15/42 | 6,880,000 | 53,643,360 |
| Teladoc Health, Inc. | | |
| 1.25%, due 6/1/27 (c) | 19,458,000 | 14,667,100 |
| | | 68,310,460 |
| Internet 9.4% |
| Booking Holdings, Inc. | | |
| 0.75%, due 5/1/25 (c) | 10,000,000 | 12,986,299 |
| Etsy, Inc. | | |
| 0.25%, due 6/15/28 (c) | 25,139,000 | 19,583,281 |
| Expedia Group, Inc. | | |
| (zero coupon), due 2/15/26 | 2,822,000 | 2,438,881 |
| Match Group Financeco 2, Inc. | | |
| 0.875%, due 6/15/26 (b) | 12,450,000 | 10,831,500 |
| Okta, Inc. | | |
| 0.125%, due 9/1/25 | 5,611,000 | 4,738,490 |
| Palo Alto Networks, Inc. | | |
| 0.375%, due 6/1/25 | 9,385,000 | 16,559,832 |
| 0.75%, due 7/1/23 | 13,659,000 | 26,491,630 |
| Q2 Holdings, Inc. | | |
| 0.75%, due 6/1/26 | 4,395,000 | 3,568,740 |
| Snap, Inc. | | |
| (zero coupon), due 5/1/27 | 10,018,000 | 6,947,483 |
| 0.125%, due 3/1/28 (b) | 12,073,000 | 7,986,289 |
| Uber Technologies, Inc. | | |
| (zero coupon), due 12/15/25 (c) | 13,355,000 | 11,096,823 |
| Zendesk, Inc. | | |
| 0.625%, due 6/15/25 | 8,790,000 | 8,719,680 |
| Ziff Davis, Inc. | | |
| 1.75%, due 11/1/26 (b) | 5,220,000 | 5,081,670 |
| Zillow Group, Inc. | | |
| 2.75%, due 5/15/25 | 16,626,000 | 15,661,692 |
| | | 152,692,290 |
| Leisure Time 0.5% |
| NCL Corp. Ltd. | | |
| 6.00%, due 5/15/24 | 2,849,000 | 4,007,118 |
| Royal Caribbean Cruises Ltd. | | |
| 6.00%, due 8/15/25 (b) | 3,620,000 | 4,729,530 |
| | | 8,736,648 |
The notes to the financial statements are an integral part of, and should be read in conjunction with, the financial statements.
| 12 | MainStay MacKay Convertible Fund |
| | Principal
Amount | Value |
| Convertible Bonds (continued) |
| Machinery-Diversified 1.7% |
| Chart Industries, Inc. | | |
| 1.00%, due 11/15/24 (b) | $ 7,336,000 | $ 27,924,484 |
| Media 3.3% |
| Cable One, Inc. | | |
| 1.125%, due 3/15/28 | 17,808,000 | 13,106,688 |
| DISH Network Corp. | | |
| (zero coupon), due 12/15/25 | 18,871,000 | 12,798,312 |
| Liberty Media Corp. | | |
| 1.375%, due 10/15/23 | 11,345,000 | 14,578,325 |
| Liberty Media Corp.-Liberty Formula One | | |
| 2.25%, due 8/15/27 (b) | 13,561,000 | 12,537,145 |
| | | 53,020,470 |
| Oil & Gas 9.6% |
| EQT Corp. | | |
| 1.75%, due 5/1/26 | 22,078,000 | 63,021,651 |
| Permian Resources Operating LLC | | |
| 3.25%, due 4/1/28 | 14,317,000 | 25,169,286 |
| Pioneer Natural Resources Co. | | |
| 0.25%, due 5/15/25 | 26,272,000 | 67,532,176 |
| | | 155,723,113 |
| Oil & Gas Services 3.3% |
| Helix Energy Solutions Group, Inc. | | |
| 6.75%, due 2/15/26 | 21,575,000 | 29,100,360 |
| Oil States International, Inc. | | |
| 4.75%, due 4/1/26 | 25,301,000 | 25,207,386 |
| | | 54,307,746 |
| Pharmaceuticals 1.8% |
| Dexcom, Inc. | | |
| 0.25%, due 11/15/25 (c) | 16,375,000 | 18,086,187 |
| Pacira BioSciences, Inc. | | |
| 0.75%, due 8/1/25 | 11,078,000 | 10,814,898 |
| | | 28,901,085 |
| Real Estate Investment Trusts 0.7% |
| Summit Hotel Properties, Inc. | | |
| 1.50%, due 2/15/26 (c) | 12,566,000 | 11,466,475 |
| Retail 2.4% |
| Burlington Stores, Inc. | | |
| 2.25%, due 4/15/25 (c) | 19,158,000 | 19,493,265 |
| Cheesecake Factory, Inc. (The) | | |
| 0.375%, due 6/15/26 | 9,208,000 | 7,596,600 |
| | Principal
Amount | Value |
| |
| Retail (continued) |
| Patrick Industries, Inc. | | |
| 1.75%, due 12/1/28 (b)(c) | $ 16,362,000 | $ 12,050,613 |
| | | 39,140,478 |
| Semiconductors 3.9% |
| Impinj, Inc. | | |
| 1.125%, due 5/15/27 (b) | 4,665,000 | 5,787,399 |
| Microchip Technology, Inc. | | |
| 0.125%, due 11/15/24 (c) | 33,300,000 | 33,653,812 |
| ON Semiconductor Corp. | | |
| 1.625%, due 10/15/23 | 2,305,000 | 6,847,003 |
| Rambus, Inc. | | |
| 1.375%, due 2/1/23 | 5,201,000 | 8,321,206 |
| Wolfspeed, Inc. | | |
| 0.25%, due 2/15/28 (b) | 8,931,000 | 8,185,262 |
| | | 62,794,682 |
| Software 7.5% |
| Akamai Technologies, Inc. | | |
| 0.375%, due 9/1/27 | 16,529,000 | 16,330,652 |
| Bentley Systems, Inc. | | |
| 0.125%, due 1/15/26 (c) | 3,570,000 | 3,143,385 |
| Bill.com Holdings, Inc. | | |
| (zero coupon), due 12/1/25 (c) | 4,680,000 | 5,211,180 |
| Coupa Software, Inc. | | |
| 0.375%, due 6/15/26 | 10,679,000 | 8,500,484 |
| Datadog, Inc. | | |
| 0.125%, due 6/15/25 | 9,636,000 | 11,004,312 |
| DigitalOcean Holdings, Inc. | | |
| (zero coupon), due 12/1/26 (b) | 6,190,000 | 4,557,778 |
| Dropbox, Inc. | | |
| (zero coupon), due 3/1/28 (c) | 11,036,000 | 9,595,802 |
| Envestnet, Inc. | | |
| 1.75%, due 6/1/23 | 20,827,000 | 20,743,692 |
| Everbridge, Inc. | | |
| 0.125%, due 12/15/24 (c) | 12,641,000 | 11,172,116 |
| MongoDB, Inc. | | |
| 0.25%, due 1/15/26 | 7,075,000 | 7,978,831 |
| Splunk, Inc. | | |
| 0.50%, due 9/15/23 | 16,180,000 | 15,613,700 |
| Zynga, Inc. | | |
| (zero coupon), due 12/15/26 | 8,635,000 | 8,640,526 |
| | | 122,492,458 |
| Telecommunications 4.5% |
| Infinera Corp. | | |
| 2.50%, due 3/1/27 | 7,050,000 | 7,124,025 |
| InterDigital, Inc. | | |
| 2.00%, due 6/1/24 | 4,500,000 | 4,370,625 |
The notes to the financial statements are an integral part of, and should be read in conjunction with, the financial statements.
13
Portfolio of Investments October 31, 2022† (continued)
| | Principal
Amount | Value |
| Convertible Bonds (continued) |
| Telecommunications (continued) |
| NICE Ltd. | | |
| (zero coupon), due 9/15/25 (c) | $ 46,000,000 | $ 43,102,000 |
| Viavi Solutions, Inc. | | |
| 1.00%, due 3/1/24 | 14,679,000 | 17,985,445 |
| | | 72,582,095 |
| Trucking & Leasing 0.5% |
| Greenbrier Cos., Inc. (The) | | |
| 2.875%, due 4/15/28 | 8,991,000 | 8,091,900 |
Total Convertible Bonds
(Cost $1,228,601,719) | | 1,301,113,595 |
| |
| | Shares | |
| Convertible Preferred Stocks 8.1% |
| Banks 1.7% |
| Bank of America Corp. | |
| Series L | | |
| 7.25% (d) | 12,072 | 14,009,073 |
| Wells Fargo & Co. | |
| Series L | | |
| 7.50% (c)(d) | 11,552 | 13,464,203 |
| | | 27,473,276 |
| Capital Markets 0.6% |
| KKR Group Co., Inc. | |
| Series C | | |
| 6.00% | 165,650 | 10,058,268 |
| Electric Utilities 1.3% |
| PG&E Corp. | |
| 5.50% | 160,900 | 21,579,908 |
| Health Care Equipment & Supplies 0.2% |
| Becton Dickinson and Co. | |
| Series B | | |
| 6.00% | 86,450 | 4,213,573 |
| Independent Power and Renewable Electricity Producers 0.9% |
| AES Corp. (The) | |
| 6.875% | 147,100 | 14,490,821 |
| | Shares | | Value |
| |
| Life Sciences Tools & Services 2.8% |
| Danaher Corp. | | |
| Series B | | | |
| 5.00% (c) | 34,560 | | $ 45,149,148 |
| Machinery 0.6% |
| Stanley Black & Decker, Inc. | | |
| 5.25% | 182,200 | | 9,186,524 |
Total Convertible Preferred Stocks
(Cost $142,187,457) | | | 132,151,518 |
Total Convertible Securities
(Cost $1,370,789,176) | | | 1,433,265,113 |
| Common Stocks 2.2% |
| Banks 0.9% |
| Bank of America Corp. | 398,621 | | 14,366,301 |
| Energy Equipment & Services 0.7% |
| Weatherford International plc (e) | 272,914 | | 11,375,056 |
| Oil, Gas & Consumable Fuels 0.6% |
| Kosmos Energy Ltd. (e) | 613,446 | | 3,981,264 |
| PDC Energy, Inc. | 74,569 | | 5,379,408 |
| | | | 9,360,672 |
Total Common Stocks
(Cost $19,927,961) | | | 35,102,029 |
| Short-Term Investments 15.1% |
| Affiliated Investment Company 5.6% |
| MainStay U.S. Government Liquidity Fund, 2.905% (f)(g) | 90,285,826 | | 90,285,826 |
| Unaffiliated Investment Companies 9.5% |
| Invesco Government & Agency Portfolio, 3.163% (g)(h) | 109,650,392 | | 109,650,392 |
| State Street Institutional U.S. Government Money Market Fund, 3.064% (g)(h) | 45,000,000 | | 45,000,000 |
| | | | 154,650,392 |
Total Short-Term Investments
(Cost $244,936,218) | | | 244,936,218 |
Total Investments
(Cost $1,688,567,024) | 108.2% | | 1,757,843,392 |
| Other Assets, Less Liabilities | (8.2) | | (132,935,013) |
| Net Assets | 100.0% | | $ 1,624,908,379 |
The notes to the financial statements are an integral part of, and should be read in conjunction with, the financial statements.
| 14 | MainStay MacKay Convertible Fund |
| † | Percentages indicated are based on Fund net assets. |
| ‡ | Less than one-tenth of a percent. |
| (a) | PIK ("Payment-in-Kind")—issuer may pay interest or dividends with additional securities and/or in cash. |
| (b) | May be sold to institutional investors only under Rule 144A or securities offered pursuant to Section 4(a)(2) of the Securities Act of 1933, as amended. |
| (c) | All or a portion of this security was held on loan. As of October 31, 2022, the aggregate market value of securities on loan was $151,799,759. The Fund received cash collateral with a value of $154,650,392. (See Note 2(G)) |
| (d) | Security is perpetual and, thus, does not have a predetermined maturity date. The date shown, if applicable, reflects the next call date. |
| (e) | Non-income producing security. |
| (f) | As of October 31, 2022, the Fund's ownership exceeds 5% of the outstanding shares of the Underlying Fund's share class. |
| (g) | Current yield as of October 31, 2022. |
| (h) | Represents a security purchased with cash collateral received for securities on loan. |
Investments in Affiliates (in 000's)
Investments in issuers considered to be affiliate(s) of the Fund during the year ended October 31, 2022 for purposes of Section 2(a)(3) of the Investment Company Act of 1940, as amended, were as follows:
| Affiliated Investment Companies | Value,
Beginning
of Year | Purchases
at Cost | Proceeds
from
Sales | Net
Realized
Gain/(Loss)
on Sales | Change in
Unrealized
Appreciation/
(Depreciation) | Value,
End of
Year | Dividend
Income | Other
Distributions | Shares
End of
Year |
| MainStay U.S. Government Liquidity Fund | $ 113,964 | $ 402,938 | $ (426,616) | $ — | $ — | $ 90,286 | $ 560 | $ — | 90,286 |
The notes to the financial statements are an integral part of, and should be read in conjunction with, the financial statements.
15
Portfolio of Investments October 31, 2022† (continued)
The following is a summary of the fair valuations according to the inputs used as of October 31, 2022, for valuing the Fund’s assets:
| Description | Quoted
Prices in
Active
Markets for
Identical
Assets
(Level 1) | | Significant
Other
Observable
Inputs
(Level 2) | | Significant
Unobservable
Inputs
(Level 3) | | Total |
| Asset Valuation Inputs | | | | | | | |
| Investments in Securities (a) | | | | | | | |
| Long-Term Bonds | | | | | | | |
| Corporate Bonds | $ — | | $ 44,540,032 | | $ — | | $ 44,540,032 |
| Total Corporate Bonds | — | | 44,540,032 | | — | | 44,540,032 |
| Convertible Securities | | | | | | | |
| Convertible Bonds | — | | 1,301,113,595 | | — | | 1,301,113,595 |
| Convertible Preferred Stocks | 87,002,370 | | 45,149,148 | | — | | 132,151,518 |
| Total Convertible Securities | 87,002,370 | | 1,346,262,743 | | — | | 1,433,265,113 |
| Common Stocks | 35,102,029 | | — | | — | | 35,102,029 |
| Short-Term Investments | | | | | | | |
| Affiliated Investment Company | 90,285,826 | | — | | — | | 90,285,826 |
| Unaffiliated Investment Companies | 154,650,392 | | — | | — | | 154,650,392 |
| Total Short-Term Investments | 244,936,218 | | — | | — | | 244,936,218 |
| Total Investments in Securities | $ 367,040,617 | | $ 1,390,802,775 | | $ — | | $ 1,757,843,392 |
| (a) | For a complete listing of investments and their industries, see the Portfolio of Investments. |
The notes to the financial statements are an integral part of, and should be read in conjunction with, the financial statements.
| 16 | MainStay MacKay Convertible Fund |
Statement of Assets and Liabilities as of October 31, 2022
| Assets |
Investment in unaffiliated securities, at value
(identified cost $1,598,281,198) including securities on loan of $151,799,759 | $1,667,557,566 |
Investment in affiliated investment companies, at value
(identified cost $90,285,826) | 90,285,826 |
| Cash | 16,938 |
| Receivables: | |
| Investment securities sold | 17,530,091 |
| Dividends and interest | 3,918,070 |
| Fund shares sold | 2,880,274 |
| Securities lending | 234,544 |
| Other assets | 59,513 |
| Total assets | 1,782,482,822 |
| Liabilities |
| Cash collateral received for securities on loan | 154,650,392 |
| Payables: | |
| Fund shares redeemed | 1,615,679 |
| Manager (See Note 3) | 671,303 |
| Transfer agent (See Note 3) | 331,981 |
| NYLIFE Distributors (See Note 3) | 193,531 |
| Shareholder communication | 62,198 |
| Professional fees | 29,204 |
| Custodian | 9,158 |
| Accrued expenses | 10,997 |
| Total liabilities | 157,574,443 |
| Net assets | $1,624,908,379 |
| Composition of Net Assets |
| Shares of beneficial interest outstanding (par value of $.01 per share) unlimited number of shares authorized | $ 891,148 |
| Additional paid-in-capital | 1,517,178,739 |
| | 1,518,069,887 |
| Total distributable earnings (loss) | 106,838,492 |
| Net assets | $1,624,908,379 |
| Class A | |
| Net assets applicable to outstanding shares | $710,774,281 |
| Shares of beneficial interest outstanding | 39,005,682 |
| Net asset value per share outstanding | $ 18.22 |
| Maximum sales charge (5.50% of offering price) | 1.06 |
| Maximum offering price per share outstanding | $ 19.28 |
| Investor Class | |
| Net assets applicable to outstanding shares | $ 43,581,182 |
| Shares of beneficial interest outstanding | 2,392,605 |
| Net asset value per share outstanding | $ 18.21 |
| Maximum sales charge (5.00% of offering price) | 0.96 |
| Maximum offering price per share outstanding | $ 19.17 |
| Class B | |
| Net assets applicable to outstanding shares | $ 6,170,023 |
| Shares of beneficial interest outstanding | 347,545 |
| Net asset value and offering price per share outstanding | $ 17.75 |
| Class C | |
| Net assets applicable to outstanding shares | $ 38,836,786 |
| Shares of beneficial interest outstanding | 2,191,196 |
| Net asset value and offering price per share outstanding | $ 17.72 |
| Class I | |
| Net assets applicable to outstanding shares | $825,546,107 |
| Shares of beneficial interest outstanding | 45,177,761 |
| Net asset value and offering price per share outstanding | $ 18.27 |
The notes to the financial statements are an integral part of, and should be read in conjunction with, the financial statements.
17
Statement of Operations for the year ended October 31, 2022
| Investment Income (Loss) |
| Income | |
| Interest | $ 12,470,535 |
| Dividends-unaffiliated | 8,311,352 |
| Securities lending, net | 1,630,141 |
| Dividends-affiliated | 559,661 |
| Total income | 22,971,689 |
| Expenses | |
| Manager (See Note 3) | 9,787,826 |
| Distribution/Service—Class A (See Note 3) | 1,944,672 |
| Distribution/Service—Investor Class (See Note 3) | 117,743 |
| Distribution/Service—Class B (See Note 3) | 79,636 |
| Distribution/Service—Class C (See Note 3) | 455,312 |
| Transfer agent (See Note 3) | 1,904,903 |
| Professional fees | 182,191 |
| Registration | 118,830 |
| Shareholder communication | 94,286 |
| Custodian | 37,832 |
| Trustees | 37,128 |
| Miscellaneous | 75,623 |
| Total expenses before waiver/reimbursement | 14,835,982 |
| Expense waiver/reimbursement from Manager (See Note 3) | (638,454) |
| Net expenses | 14,197,528 |
| Net investment income (loss) | 8,774,161 |
| Realized and Unrealized Gain (Loss) |
| Net realized gain (loss) on unaffiliated investments | 42,015,068 |
| Net change in unrealized appreciation (depreciation) on unaffiliated investments | (273,994,065) |
| Net realized and unrealized gain (loss) | (231,978,997) |
| Net increase (decrease) in net assets resulting from operations | $(223,204,836) |
The notes to the financial statements are an integral part of, and should be read in conjunction with, the financial statements.
| 18 | MainStay MacKay Convertible Fund |
Statements of Changes in Net Assets
for the years ended October 31, 2022 and October 31, 2021
| | 2022 | 2021 |
| Increase (Decrease) in Net Assets |
| Operations: | | |
| Net investment income (loss) | $ 8,774,161 | $ 5,731,745 |
| Net realized gain (loss) | 42,015,068 | 418,909,274 |
| Net change in unrealized appreciation (depreciation) | (273,994,065) | 55,935,875 |
| Net increase (decrease) in net assets resulting from operations | (223,204,836) | 480,576,894 |
| Distributions to shareholders: | | |
| Class A | (166,284,769) | (49,364,131) |
| Investor Class | (9,946,970) | (4,182,074) |
| Class B | (1,897,436) | (728,517) |
| Class C | (10,369,117) | (3,711,279) |
| Class I | (192,363,201) | (65,504,118) |
| Total distributions to shareholders | (380,861,493) | (123,490,119) |
| Capital share transactions: | | |
| Net proceeds from sales of shares | 509,415,950 | 391,249,469 |
| Net asset value of shares issued to shareholders in reinvestment of distributions | 348,922,823 | 109,969,298 |
| Cost of shares redeemed | (632,144,077) | (487,172,790) |
| Increase (decrease) in net assets derived from capital share transactions | 226,194,696 | 14,045,977 |
| Net increase (decrease) in net assets | (377,871,633) | 371,132,752 |
| Net Assets |
| Beginning of year | 2,002,780,012 | 1,631,647,260 |
| End of year | $1,624,908,379 | $2,002,780,012 |
The notes to the financial statements are an integral part of, and should be read in conjunction with, the financial statements.
19
Financial Highlights selected per share data and ratios
| | Year Ended October 31, |
| Class A | 2022 | | 2021 | | 2020 | | 2019 | | 2018 |
| Net asset value at beginning of year | $ 25.40 | | $ 20.90 | | $ 17.81 | | $ 17.07 | | $ 17.75 |
| Net investment income (loss) (a) | 0.07 | | 0.05 | | 0.06 | | 0.12 | | 0.15 |
| Net realized and unrealized gain (loss) | (2.50) | | 6.01 | | 3.47 | | 1.60 | | 0.40 |
| Total from investment operations | (2.43) | | 6.06 | | 3.53 | | 1.72 | | 0.55 |
| Less distributions: | | | | | | | | | |
| From net investment income | (0.26) | | (0.13) | | (0.13) | | (0.15) | | (0.22) |
| From net realized gain on investments | (4.49) | | (1.43) | | (0.31) | | (0.83) | | (1.01) |
| Total distributions | (4.75) | | (1.56) | | (0.44) | | (0.98) | | (1.23) |
| Net asset value at end of year | $ 18.22 | | $ 25.40 | | $ 20.90 | | $ 17.81 | | $ 17.07 |
| Total investment return (b) | (11.12)% | | 30.06% | | 20.27% | | 10.75% | | 3.28% |
| Ratios (to average net assets)/Supplemental Data: | | | | | | | | | |
| Net investment income (loss) | 0.37% | | 0.19% | | 0.33% | | 0.67% | | 0.87% |
| Net expenses (c) | 0.93% | | 0.91% | | 0.96% | | 0.98% | | 0.98% |
| Expenses (before waiver/reimbursement) (c) | 0.93% | | 0.91% | | 0.96% | | 0.98% | | 0.98% |
| Portfolio turnover rate | 14% | | 49% | | 46% | | 23% | | 43% |
| Net assets at end of year (in 000’s) | $ 710,774 | | $ 891,433 | | $ 657,626 | | $ 545,605 | | $ 518,381 |
| (a) | Per share data based on average shares outstanding during the year. |
| (b) | Total investment return is calculated exclusive of sales charges and assumes the reinvestment of dividends and distributions. For periods of less than one year, total return is not annualized. |
| (c) | In addition to the fees and expenses which the Fund bears directly, it also indirectly bears a pro-rata share of the fees and expenses of the underlying funds in which it invests. Such indirect expenses are not included in the above expense ratios. |
| | Year Ended October 31, |
| Investor Class | 2022 | | 2021 | | 2020 | | 2019 | | 2018 |
| Net asset value at beginning of year | $ 25.39 | | $ 20.90 | | $ 17.80 | | $ 17.07 | | $ 17.75 |
| Net investment income (loss) (a) | 0.03 | | (0.00)‡ | | 0.03 | | 0.09 | | 0.13 |
| Net realized and unrealized gain (loss) | (2.50) | | 6.00 | | 3.47 | | 1.59 | | 0.39 |
| Total from investment operations | (2.47) | | 6.00 | | 3.50 | | 1.68 | | 0.52 |
| Less distributions: | | | | | | | | | |
| From net investment income | (0.22) | | (0.08) | | (0.09) | | (0.12) | | (0.19) |
| From net realized gain on investments | (4.49) | | (1.43) | | (0.31) | | (0.83) | | (1.01) |
| Total distributions | (4.71) | | (1.51) | | (0.40) | | (0.95) | | (1.20) |
| Net asset value at end of year | $ 18.21 | | $ 25.39 | | $ 20.90 | | $ 17.80 | | $ 17.07 |
| Total investment return (b) | (11.31)% | | 29.77% | | 20.08% | | 10.50% | | 3.12% |
| Ratios (to average net assets)/Supplemental Data: | | | | | | | | | |
| Net investment income (loss) | 0.17% | | (0.01)% | | 0.13% | | 0.51% | | 0.72% |
| Net expenses (c) | 1.12% | | 1.12% | | 1.16% | | 1.15% | | 1.13% |
| Expenses (before waiver/reimbursement) (c) | 1.12% | | 1.12% | | 1.16% | | 1.17% | | 1.14% |
| Portfolio turnover rate | 14% | | 49% | | 46% | | 23% | | 43% |
| Net assets at end of year (in 000's) | $ 43,581 | | $ 53,738 | | $ 57,829 | | $ 59,242 | | $ 52,723 |
| ‡ | Less than one cent per share. |
| (a) | Per share data based on average shares outstanding during the year. |
| (b) | Total investment return is calculated exclusive of sales charges and assumes the reinvestment of dividends and distributions. For periods of less than one year, total return is not annualized. |
| (c) | In addition to the fees and expenses which the Fund bears directly, it also indirectly bears a pro-rata share of the fees and expenses of the underlying funds in which it invests. Such indirect expenses are not included in the above expense ratios. |
The notes to the financial statements are an integral part of, and should be read in conjunction with, the financial statements.
| 20 | MainStay MacKay Convertible Fund |
Financial Highlights selected per share data and ratios
| | Year Ended October 31, |
| Class B | 2022 | | 2021 | | 2020 | | 2019 | | 2018 |
| Net asset value at beginning of year | $ 24.95 | | $ 20.67 | | $ 17.68 | | $ 16.98 | | $ 17.67 |
| Net investment income (loss) (a) | (0.11) | | (0.18) | | (0.11) | | (0.04) | | (0.01) |
| Net realized and unrealized gain (loss) | (2.45) | | 5.93 | | 3.44 | | 1.60 | | 0.39 |
| Total from investment operations | (2.56) | | 5.75 | | 3.33 | | 1.56 | | 0.38 |
| Less distributions: | | | | | | | | | |
| From net investment income | (0.15) | | (0.04) | | (0.03) | | (0.03) | | (0.06) |
| From net realized gain on investments | (4.49) | | (1.43) | | (0.31) | | (0.83) | | (1.01) |
| Total distributions | (4.64) | | (1.47) | | (0.34) | | (0.86) | | (1.07) |
| Net asset value at end of year | $ 17.75 | | $ 24.95 | | $ 20.67 | | $ 17.68 | | $ 16.98 |
| Total investment return (b) | (11.97)% | | 28.79% | | 19.15% | | 9.76% | | 2.35% |
| Ratios (to average net assets)/Supplemental Data: | | | | | | | | | |
| Net investment income (loss) | (0.59)% | | (0.76)% | | (0.61)% | | (0.23)% | | (0.03)% |
| Net expenses (c) | 1.87% | | 1.87% | | 1.91% | | 1.90% | | 1.88% |
| Expenses (before waiver/reimbursement) (c) | 1.87% | | 1.87% | | 1.91% | | 1.92% | | 1.89% |
| Portfolio turnover rate | 14% | | 49% | | 46% | | 23% | | 43% |
| Net assets at end of year (in 000’s) | $ 6,170 | | $ 10,226 | | $ 10,454 | | $ 11,786 | | $ 15,051 |
| (a) | Per share data based on average shares outstanding during the year. |
| (b) | Total investment return is calculated exclusive of sales charges and assumes the reinvestment of dividends and distributions. For periods of less than one year, total return is not annualized. |
| (c) | In addition to the fees and expenses which the Fund bears directly, it also indirectly bears a pro-rata share of the fees and expenses of the underlying funds in which it invests. Such indirect expenses are not included in the above expense ratios. |
| | Year Ended October 31, |
| Class C | 2022 | | 2021 | | 2020 | | 2019 | | 2018 |
| Net asset value at beginning of year | $ 24.92 | | $ 20.64 | | $ 17.65 | | $ 16.96 | | $ 17.65 |
| Net investment income (loss) (a) | (0.11) | | (0.18) | | (0.11) | | (0.04) | | (0.00)‡ |
| Net realized and unrealized gain (loss) | (2.45) | | 5.93 | | 3.44 | | 1.59 | | 0.38 |
| Total from investment operations | (2.56) | | 5.75 | | 3.33 | | 1.55 | | 0.38 |
| Less distributions: | | | | | | | | | |
| From net investment income | (0.15) | | (0.04) | | (0.03) | | (0.03) | | (0.06) |
| From net realized gain on investments | (4.49) | | (1.43) | | (0.31) | | (0.83) | | (1.01) |
| Total distributions | (4.64) | | (1.47) | | (0.34) | | (0.86) | | (1.07) |
| Net asset value at end of year | $ 17.72 | | $ 24.92 | | $ 20.64 | | $ 17.65 | | $ 16.96 |
| Total investment return (b) | (11.99)% | | 28.84% | | 19.18% | | 9.71% | | 2.35% |
| Ratios (to average net assets)/Supplemental Data: | | | | | | | | | |
| Net investment income (loss) | (0.58)% | | (0.77)% | | (0.61)% | | (0.23)% | | (0.03)% |
| Net expenses (c) | 1.87% | | 1.87% | | 1.91% | | 1.90% | | 1.88% |
| Expenses (before waiver/reimbursement) (c) | 1.87% | | 1.87% | | 1.91% | | 1.92% | | 1.89% |
| Portfolio turnover rate | 14% | | 49% | | 46% | | 23% | | 43% |
| Net assets at end of year (in 000’s) | $ 38,837 | | $ 55,754 | | $ 52,999 | | $ 60,891 | | $ 80,830 |
| ‡ | Less than one cent per share. |
| (a) | Per share data based on average shares outstanding during the year. |
| (b) | Total investment return is calculated exclusive of sales charges and assumes the reinvestment of dividends and distributions. For periods of less than one year, total return is not annualized. |
| (c) | In addition to the fees and expenses which the Fund bears directly, it also indirectly bears a pro-rata share of the fees and expenses of the underlying funds in which it invests. Such indirect expenses are not included in the above expense ratios. |
The notes to the financial statements are an integral part of, and should be read in conjunction with, the financial statements.
21
Financial Highlights selected per share data and ratios
| | Year Ended October 31, |
| Class I | 2022 | | 2021 | | 2020 | | 2019 | | 2018 |
| Net asset value at beginning of year | $ 25.46 | | $ 20.95 | | $ 17.85 | | $ 17.11 | | $ 17.79 |
| Net investment income (loss) (a) | 0.13 | | 0.12 | | 0.13 | | 0.18 | | 0.22 |
| Net realized and unrealized gain (loss) | (2.51) | | 6.02 | | 3.48 | | 1.60 | | 0.39 |
| Total from investment operations | (2.38) | | 6.14 | | 3.61 | | 1.78 | | 0.61 |
| Less distributions: | | | | | | | | | |
| From net investment income | (0.32) | | (0.20) | | (0.20) | | (0.21) | | (0.28) |
| From net realized gain on investments | (4.49) | | (1.43) | | (0.31) | | (0.83) | | (1.01) |
| Total distributions | (4.81) | | (1.63) | | (0.51) | | (1.04) | | (1.29) |
| Net asset value at end of year | $ 18.27 | | $ 25.46 | �� | $ 20.95 | | $ 17.85 | | $ 17.11 |
| Total investment return (b) | (10.84)% | | 30.43% | | 20.71% | | 11.14% | | 3.65% |
| Ratios (to average net assets)/Supplemental Data: | | | | | | | | | |
| Net investment income (loss) | 0.69% | | 0.49% | | 0.68% | | 1.04% | | 1.25% |
| Net expenses (c) | 0.61% | | 0.61% | | 0.61% | | 0.61% | | 0.61% |
| Expenses (before waiver/reimbursement) (c) | 0.68% | | 0.66% | | 0.71% | | 0.73% | | 0.73% |
| Portfolio turnover rate | 14% | | 49% | | 46% | | 23% | | 43% |
| Net assets at end of year (in 000’s) | $ 825,546 | | $ 991,630 | | $ 852,739 | | $ 773,865 | | $ 683,594 |
| (a) | Per share data based on average shares outstanding during the year. |
| (b) | Total investment return is calculated exclusive of sales charges and assumes the reinvestment of dividends and distributions. Class I shares are not subject to sales charges. For periods of less than one year, total return is not annualized. |
| (c) | In addition to the fees and expenses which the Fund bears directly, it also indirectly bears a pro-rata share of the fees and expenses of the underlying funds in which it invests. Such indirect expenses are not included in the above expense ratios. |
The notes to the financial statements are an integral part of, and should be read in conjunction with, the financial statements.
| 22 | MainStay MacKay Convertible Fund |
Notes to Financial Statements
Note 1-Organization and Business
The MainStay Funds (the “Trust”) was organized on January 9, 1986, as a Massachusetts business trust. The Trust is registered under the Investment Company Act of 1940, as amended (the “1940 Act”), as an open-end management investment company, and is comprised of twelve funds (collectively referred to as the "Funds"). These financial statements and notes relate to the MainStay MacKay Convertible Fund (the "Fund"), a “diversified” fund, as that term is defined in the 1940 Act, as interpreted or modified by regulatory authorities having jurisdiction, from time to time.
The following table lists the Fund's share classes that have been registered and commenced operations:
| Class | Commenced Operations |
| Class A | January 3, 1995 |
| Investor Class | February 28, 2008 |
| Class B | May 1, 1986 |
| Class C | September 1, 1998 |
| Class I | November 28, 2008 |
| Class R6 | N/A* |
| SIMPLE Class | N/A* |
| * | Class R6 shares were registered for sale effective as of February 28, 2017 and SIMPLE Class shares were registered for sale effective as of August 31, 2020 but have not yet commenced operations. |
Class B shares of the MainStay Group of Funds are closed to all new purchases as well as additional investments by existing Class B shareholders. Existing Class B shareholders may continue to reinvest dividends and capital gains distributions, as well as exchange their Class B shares for Class B shares of other funds in the MainStay Group of Funds as permitted by the current exchange privileges. Class B shareholders continue to be subject to any applicable contingent deferred sales charge ("CDSC") at the time of redemption. All other features of the Class B shares, including but not limited to the fees and expenses applicable to Class B shares, remain unchanged. Unless redeemed, Class B shareholders will remain in Class B shares of their respective fund until the Class B shares are converted to Class A or Investor Class shares pursuant to the applicable conversion schedule.
Class A and Investor Class shares are offered at net asset value (“NAV”) per share plus an initial sales charge. No initial sales charge applies to investments of $1 million or more (and certain other qualified purchases) in Class A and Investor Class shares. However, a CDSC of 1.00% may be imposed on certain redemptions made within 18 months of the date of purchase on shares that were purchased without an initial sales charge. Class C shares are offered at NAV without an initial sales charge, although a 1.00% CDSC may be imposed on certain redemptions of such shares made within one year of the date of purchase of Class C shares. When Class B shares were offered, they were offered at NAV without an initial sales charge, although a CDSC that declines depending on the number of years a shareholder held its Class B shares may be imposed on certain redemptions of such shares made within six years of the date of purchase of such shares. Class I shares are offered at NAV without a
sales charge. Class R6 and SIMPLE Class shares are expected to be offered at NAV without a sales charge if such shares are offered in the future. Depending upon eligibility, Class B shares convert to either Class A or Investor Class shares at the end of the calendar quarter eight years after the date they were purchased. In addition, depending upon eligibility, Class C shares convert to either Class A or Investor Class shares at the end of the calendar quarter eight years after the date they were purchased. Additionally, Investor Class shares may convert automatically to Class A shares. Under certain circumstances and as may be permitted by the Trust’s multiple class plan pursuant to Rule 18f-3 under the 1940 Act, specified share classes of the Fund may be converted to one or more other share classes of the Fund as disclosed in the capital share transactions within these Notes. The classes of shares have the same voting (except for issues that relate solely to one class), dividend, liquidation and other rights, and the same terms and conditions, except that under distribution plans pursuant to Rule 12b-1 under the 1940 Act, Class B and Class C shares are subject to higher distribution and/or service fees than Class A, Investor Class and SIMPLE Class shares. Class I and Class R6 shares are not subject to a distribution and/or service fee.
The Fund's investment objective is to seek capital appreciation together with current income.
Note 2–Significant Accounting Policies
The Fund is an investment company and accordingly follows the investment company accounting and reporting guidance of the Financial Accounting Standards Board (“FASB”) Accounting Standards Codification Topic 946 Financial Services—Investment Companies. The Fund prepares its financial statements in accordance with generally accepted accounting principles (“GAAP”) in the United States of America and follows the significant accounting policies described below.
(A) Securities Valuation. Investments are usually valued as of the close of regular trading on the New York Stock Exchange (the "Exchange") (usually 4:00 p.m. Eastern time) on each day the Fund is open for business ("valuation date").
Effective September 8, 2022, and pursuant to Rule 2a-5 under the 1940 Act, the Board of Trustees of the Trust (the "Board") designated New York Life Investment Management LLC (“New York Life Investments” or the "Manager") as its Valuation Designee (the "Valuation Designee"). The Valuation Designee is responsible for performing fair valuations relating to all investments in the Fund’s portfolio for which market quotations are not readily available; periodically assessing and managing material valuation risks; establishing and applying fair value methodologies; testing fair valuation methodologies; evaluating and overseeing pricing services; segregation of valuation and portfolio management functions; providing quarterly, annual and prompt reporting to the Board, as appropriate; identifying potential conflicts of interest; and maintaining appropriate records. The Valuation Designee has established a valuation committee ("Valuation Committee") to assist in carrying out the Valuation Designee’s responsibilities and establish prices of securities for which market
Notes to Financial Statements (continued)
quotations are not readily available. The Fund’s and the Valuation Designee's policies and procedures ("Valuation Procedures") govern the Valuation Designee’s selection and application of methodologies for determining and calculating the fair value of Fund investments. The Valuation Designee may value Fund portfolio securities for which market quotations are not readily available and other Fund assets utilizing inputs from pricing services and other third-party sources (together, “Pricing Sources”). The Valuation Committee meets (in person, via electronic mail or via teleconference) on an ad-hoc basis to determine fair valuations and on a quarterly basis to review fair value events (excluding fair valuations from pricing services), including valuation risks and back-testing results, and preview reports to the Board.
The Valuation Committee establishes prices of securities for which market quotations are not readily available based on such methodologies and measurements on a regular basis after considering information that is reasonably available and deemed relevant by the Valuation Committee. The Board shall oversee the Valuation Designee and review fair valuation materials on a prompt, quarterly and annual basis and approve proposed revisions to the Valuation Procedures.
Investments for which market quotations are not readily available are valued at fair value as determined in good faith pursuant to the Valuation Procedures. A market quotation is readily available only when that quotation is a quoted price (unadjusted) in active markets for identical investments that the Fund can access at the measurement date, provided that a quotation will not be readily available if it is not reliable. Fair value measurements are determined within a framework that establishes a three-tier hierarchy that maximizes the use of observable market data and minimizes the use of unobservable inputs to establish a classification of fair value measurements for disclosure purposes. "Inputs" refer broadly to the assumptions that market participants would use in pricing the asset or liability, including assumptions about risk, such as the risk inherent in a particular valuation technique used to measure fair value using a pricing model and/or the risk inherent in the inputs for the valuation technique. Inputs may be observable or unobservable. Observable inputs reflect the assumptions market participants would use in pricing the asset or liability based on market data obtained from sources independent of the Fund. Unobservable inputs reflect the Fund’s own assumptions about the assumptions market participants would use in pricing the asset or liability based on the information available. The inputs or methodology used for valuing assets or liabilities may not be an indication of the risks associated with investing in those assets or liabilities. The three-tier hierarchy of inputs is summarized below.
| • | Level 1—quoted prices (unadjusted) in active markets for an identical asset or liability |
| • | Level 2—other significant observable inputs (including quoted prices for a similar asset or liability in active markets, interest rates and yield curves, prepayment speeds, credit risk, etc.) |
| • | Level 3—significant unobservable inputs (including the Fund's own assumptions about the assumptions that market participants would use in measuring fair value of an asset or liability) |
The level of an asset or liability within the fair value hierarchy is based on the lowest level of an input, both individually and in the aggregate, that is significant to the fair value measurement. The aggregate value by input level of the Fund’s assets and liabilities as of October 31, 2022, is included at the end of the Portfolio of Investments.
The Fund may use third-party vendor evaluations, whose prices may be derived from one or more of the following standard inputs, among others:
| • Benchmark yields | • Reported trades |
| • Broker/dealer quotes | • Issuer spreads |
| • Two-sided markets | • Benchmark securities |
| • Bids/offers | • Reference data (corporate actions or material event notices) |
| • Industry and economic events | • Comparable bonds |
| • Monthly payment information | |
An asset or liability for which a market quotation is not readily available is valued by methods deemed reasonable in good faith by the Valuation Committee, following the Valuation Procedures to represent fair value. Under these procedures, the Valuation Designee generally uses a market-based approach which may use related or comparable assets or liabilities, recent transactions, market multiples, book values and other relevant information. The Valuation Designee may also use an income-based valuation approach in which the anticipated future cash flows of the asset or liability are discounted to calculate fair value. Discounts may also be applied due to the nature and/or duration of any restrictions on the disposition of the asset or liability. Fair value represents a good faith approximation of the value of a security. Fair value determinations involve the consideration of a number of subjective factors, an analysis of applicable facts and circumstances and the exercise of judgment. As a result, it is possible that the fair value for a security determined in good faith in accordance with the Valuation Procedures may differ from valuations for the same security determined for other funds using their own valuation procedures. Although the Valuation Procedures are designed to value a security at the price the Fund may reasonably expect to receive upon the security's sale in an orderly transaction, there can be no assurance that any fair value determination thereunder would, in fact, approximate the amount that the Fund would actually realize upon the sale of the security or the price at which the security would trade if a reliable market price were readily available. During the year ended October 31, 2022, there were no material changes to the fair value methodologies.
Securities which may be valued in this manner include, but are not limited to: (i) a security for which trading has been halted or suspended or otherwise does not have a readily available market quotation on a given day; (ii) a debt security that has recently gone into default and for which there is not a current market quotation; (iii) a security of an issuer that has entered into a restructuring; (iv) a security that has been delisted from a national exchange; (v) a security subject to trading collars for which no or limited trading takes place; and (vi) a security whose principal market has been temporarily closed at a time when, under normal
| 24 | MainStay MacKay Convertible Fund |
conditions, it would be open. Securities valued in this manner are generally categorized as Level 2 or 3 in the hierarchy.
Equity securities are valued at the last quoted sales prices as of the close of regular trading on the relevant exchange on each valuation date. Securities that are not traded on the valuation date are valued at the mean of the last quoted bid and ask prices. Prices are normally taken from the principal market in which each security trades. These securities are generally categorized as Level 1 in the hierarchy.
Certain convertible preferred stocks may be valued utilizing evaluated prices based on market inputs obtained from the pricing vendor and are generally categorized as Level 2 in the hierarchy. Securities that were fair valued in such a manner as of October 31, 2022, are shown in the Portfolio of Investments.
Investments in mutual funds, including money market funds, are valued at their respective NAVs at the close of business each day on the valuation date. These securities are generally categorized as Level 1 in the hierarchy.
Debt securities (other than convertible and municipal bonds) are valued at the evaluated bid prices (evaluated mean prices in the case of convertible and municipal bonds) supplied by a pricing agent or broker selected by the Valuation Designee, in consultation with the Subadvisor. The evaluations are market-based measurements processed through a pricing application and represents the pricing agent’s good faith determination as to what a holder may receive in an orderly transaction under market conditions. The rules-based logic utilizes valuation techniques that reflect participants’ assumptions and vary by asset class and per methodology, maximizing the use of relevant observable data including quoted prices for similar assets, benchmark yield curves and market corroborated inputs. The evaluated bid or mean prices are deemed by the Valuation Designee, in consultation with the Subadvisor, to be representative of market values at the regular close of trading of the Exchange on each valuation date. Debt securities purchased on a delayed delivery basis are marked to market daily until settlement at the forward settlement date. Debt securities, including corporate bonds, U.S. government and federal agency bonds, municipal bonds, foreign bonds, convertible bonds, asset-backed securities and mortgage-backed securities are generally categorized as Level 2 in the hierarchy.
Temporary cash investments acquired in excess of 60 days to maturity at the time of purchase are valued using the latest bid prices or using valuations based on a matrix system (which considers such factors as security prices, yields, maturities and ratings), both as furnished by independent pricing services. Temporary cash investments that mature in 60 days or less at the time of purchase ("Short-Term Investments") are valued using the amortized cost method of valuation, unless the use of such method would be inappropriate. The amortized cost method involves valuing a security at its cost on the date of purchase and thereafter assuming a constant amortization to maturity of the difference between such cost and the value on maturity date. Amortized cost approximates the current fair value of a security. Securities valued using the amortized
cost method are not valued using quoted prices in an active market and are generally categorized as Level 2 in the hierarchy.
The information above is not intended to reflect an exhaustive list of the methodologies that may be used to value portfolio investments. The Valuation Procedures permit the use of a variety of valuation methodologies in connection with valuing portfolio investments. The methodology used for a specific type of investment may vary based on the market data available or other considerations. The methodologies summarized above may not represent the specific means by which portfolio investments are valued on any particular business day.
(B) Income Taxes. The Fund's policy is to comply with the requirements of the Internal Revenue Code of 1986, as amended (the “Internal Revenue Code”), applicable to regulated investment companies and to distribute all of its taxable income to the shareholders of the Fund within the allowable time limits.
The Manager evaluates the Fund’s tax positions to determine if the tax positions taken meet the minimum recognition threshold in connection with accounting for uncertainties in income tax positions taken or expected to be taken for the purposes of measuring and recognizing tax liabilities in the financial statements. Recognition of tax benefits of an uncertain tax position is permitted only to the extent the position is “more likely than not” to be sustained assuming examination by taxing authorities. The Manager analyzed the Fund's tax positions taken on federal, state and local income tax returns for all open tax years (for up to three tax years) and has concluded that no provisions for federal, state and local income tax are required in the Fund's financial statements. The Fund's federal, state and local income tax and federal excise tax returns for tax years for which the applicable statutes of limitations have not expired are subject to examination by the Internal Revenue Service and state and local departments of revenue.
(C) Dividends and Distributions to Shareholders. Dividends and distributions are recorded on the ex-dividend date. The Fund intends to declare and pay dividends from net investment income, if any, at least quarterly and distributions from net realized capital and currency gains, if any, at least annually. Unless a shareholder elects otherwise, all dividends and distributions are reinvested at NAV in the same class of shares of the Fund. Dividends and distributions to shareholders are determined in accordance with federal income tax regulations and may differ from determinations using GAAP.
(D) Security Transactions and Investment Income. The Fund records security transactions on the trade date. Realized gains and losses on security transactions are determined using the identified cost method. Dividend income is recognized on the ex-dividend date, net of any foreign tax withheld at the source, and interest income is accrued as earned using the effective interest rate method. Distributions received from real estate investment trusts may be classified as dividends, capital gains and/or return of capital. Discounts and premiums on securities purchased for the Fund are accreted and amortized, respectively, on the effective
Notes to Financial Statements (continued)
interest rate method. Premium associated with the conversion feature on a convertible bond is not amortized.
Investment income and realized and unrealized gains and losses on investments of the Fund are allocated pro rata to the separate classes of shares based upon their relative net assets on the date the income is earned or realized and unrealized gains and losses are incurred.
The Fund may place a debt security on non-accrual status and reduce related interest income by ceasing current accruals and writing off all or a portion of any interest receivables when the collection of all or a portion of such interest has become doubtful. A debt security is removed from non-accrual status when the issuer resumes interest payments or when collectability of interest is reasonably assured.
(E) Expenses. Expenses of the Trust are allocated to the individual Funds in proportion to the net assets of the respective Funds when the expenses are incurred, except where direct allocations of expenses can be made. Expenses (other than transfer agent expenses and fees incurred under the shareholder services plans and/or the distribution plans further discussed in Note 3(B)) are allocated to separate classes of shares pro rata based upon their relative net assets on the date the expenses are incurred. The expenses borne by the Fund, including those of related parties to the Fund, are shown in the Statement of Operations.
Additionally, the Fund may invest in mutual funds, which are subject to management fees and other fees that may cause the costs of investing in mutual funds to be greater than the costs of owning the underlying securities directly. These indirect expenses of mutual funds are not included in the amounts shown as expenses in the Statement of Operations or in the expense ratios included in the Financial Highlights.
(F) Use of Estimates. In preparing financial statements in conformity with GAAP, the Manager makes estimates and assumptions that affect the reported amounts and disclosures in the financial statements. Actual results could differ from those estimates and assumptions.
(G) Securities Lending. In order to realize additional income, the Fund may engage in securities lending, subject to the limitations set forth in the 1940 Act and relevant guidance by the staff of the Securities and Exchange Commission (“SEC”). If the Fund engages in securities lending, the Fund will lend through its custodian, JPMorgan Chase Bank, N.A., ("JPMorgan"), acting as securities lending agent on behalf of the Fund. Under the current arrangement, JPMorgan will manage the Fund's collateral in accordance with the securities lending agency agreement between the Fund and JPMorgan, and indemnify the Fund against counterparty risk. The loans will be collateralized by cash (which may be invested in a money market fund) and/or non-cash collateral (which may include U.S. Treasury securities and/or U.S. government agency securities issued or guaranteed by the United States government or its agencies or instrumentalities) at least equal at all times to the market value of the securities loaned. Non-cash collateral held at year end is segregated and cannot be transferred by the Fund. The Fund bears the risk of delay in recovery of, or loss of rights in, the securities loaned. The Fund may also record a realized gain or loss on securities deemed sold due to a
borrower’s inability to return securities on loan. The Fund bears the risk of any loss on investment of cash collateral. The Fund will receive compensation for lending its securities in the form of fees or it will retain a portion of interest earned on the investment of any cash collateral. The Fund will also continue to receive interest and dividends on the securities loaned and any gain or loss in the market price of the securities loaned that may occur during the term of the loan will be for the account of the Fund. Income earned from securities lending activities, if any, is reflected in the Statement of Operations. Securities on loan as of October 31, 2022, are shown in the Portfolio of Investments.
(H) Debt and Convertible Securities Risk. The ability of issuers of debt securities held by the Fund to meet their obligations may be affected by, among other things, economic or political developments in a specific country, industry or region. Debt securities are also subject to the risks associated with changes in interest rates.
Convertible securities may be subordinate to other securities. In part, the total return for a convertible security depends upon the performance of the underlying stock into which it can be converted. Also, issuers of convertible securities are often not as strong financially as those issuing securities with higher credit ratings, are more likely to encounter financial difficulties and typically are more vulnerable to changes in the economy, such as a recession or a sustained period of rising interest rates, which could affect their ability to make interest and principal payments.
(I) Indemnifications. Under the Trust’s organizational documents, its officers and trustees are indemnified against certain liabilities that may arise out of performance of their duties to the Trust. Additionally, in the normal course of business, the Fund enters into contracts with third-party service providers that contain a variety of representations and warranties and that may provide general indemnifications. The Fund's maximum exposure under these arrangements is unknown, as this would involve future claims that may be made against the Fund that have not yet occurred. The Manager believes that the risk of loss in connection with these potential indemnification obligations is remote. However, there can be no assurance that material liabilities related to such obligations will not arise in the future, which could adversely impact the Fund.
Note 3–Fees and Related Party Transactions
(A) Manager and Subadvisor. New York Life Investments, a registered investment adviser and an indirect, wholly-owned subsidiary of New York Life Insurance Company ("New York Life"), serves as the Fund's Manager, pursuant to an Amended and Restated Management Agreement ("Management Agreement"). The Manager provides offices, conducts clerical, recordkeeping and bookkeeping services and keeps most of the financial and accounting records required to be maintained by the Fund. Except for the portion of salaries and expenses that are the responsibility of the Fund, the Manager pays the salaries and expenses of all personnel affiliated with the Fund and certain operational expenses of the Fund. During a portion of the year ended October 31, 2022, the Fund reimbursed New York Life Investments in an amount equal to the portion of the compensation of the Chief Compliance Officer attributable to the
| 26 | MainStay MacKay Convertible Fund |
Fund. MacKay Shields LLC ("MacKay Shields" or the "Subadvisor"), a registered investment adviser and an indirect, wholly-owned subsidiary of New York Life, serves as the Subadvisor to the Fund and is responsible for the day-to-day portfolio management of the Fund. Pursuant to the terms of an Amended and Restated Subadvisory Agreement ("Subadvisory Agreement") between New York Life Investments and MacKay Shields, New York Life Investments pays for the services of the Subadvisor.
Pursuant to the Management Agreement, the Fund pays the Manager a monthly fee for the services performed and the facilities furnished at an annual rate of the Fund’s average daily net assets as follows: 0.60% up to $500 million; 0.55% from $500 million to $1 billion; 0.50% from $1 billion to $2 billion; and 0.49% in excess of $2 billion, plus a fee for fund accounting services previously provided by New York Life Investments under a separate fund accounting agreement furnished at an annual rate of the Fund’s average daily net assets as follows: 0.05% up to $20 million; 0.0333% from $20 million to $100 million; and 0.01% in excess of $100 million. During the year ended October 31, 2022, the effective management fee rate was 0.55%, inclusive of a fee for fund accounting services of 0.01% of the Fund’s average daily net assets.
New York Life Investments has contractually agreed to waive fees and/or reimburse expenses so that Total Annual Fund Operating Expenses (excluding taxes, interest, litigation, extraordinary expenses, brokerage and other transaction expenses relating to the purchase or sale of portfolio investments and acquired (underlying) fund fees and expenses) of Class I shares do not exceed 0.61% of the Fund's average net assets. This agreement will remain in effect until February 28, 2023, and shall renew automatically for one-year terms unless New York Life Investments provides written notice of termination prior to the start of the next term or upon approval of the Board.
During the year ended October 31, 2022, New York Life Investments earned fees from the Fund in the amount of $9,787,826 and waived fees and/or reimbursed expenses in the amount of $638,454 and paid the Subadvisor fees of $4,473,267.
JPMorgan provides sub-administration and sub-accounting services to the Fund pursuant to an agreement with New York Life Investments. These services include calculating the daily NAVs of the Fund, maintaining the general ledger and sub-ledger accounts for the calculation of the Fund's NAVs, and assisting New York Life Investments in conducting various aspects of the Fund's administrative operations. For providing these services to the Fund, JPMorgan is compensated by New York Life Investments.
Pursuant to an agreement between the Trust and New York Life Investments, New York Life Investments is responsible for providing or procuring certain regulatory reporting services for the Fund. The Fund will reimburse New York Life Investments for the actual costs incurred by New York Life Investments in connection with providing or procuring these services for the Fund.
(B) Distribution and Service Fees. The Trust, on behalf of the Fund, has entered into a distribution agreement with NYLIFE Distributors LLC (the “Distributor”), an affiliate of New York Life Investments. The Fund has adopted distribution plans (the “Plans”) in accordance with the provisions of Rule 12b-1 under the 1940 Act.
Pursuant to the Class A and Investor Class Plans, the Distributor receives a monthly fee from the Class A and Investor Class shares at an annual rate of 0.25% of the average daily net assets of the Class A and Investor Class shares for distribution and/or service activities as designated by the Distributor. Pursuant to the Class B and Class C Plans, Class B and Class C shares pay the Distributor a monthly distribution fee at an annual rate of 0.75% of the average daily net assets of the Class B and Class C shares along with a service fee at an annual rate of 0.25% of the average daily net assets of the Class B and Class C shares, for a total 12b-1 fee of 1.00%. Class I shares are not subject to a distribution and/or service fee.
The Plans provide that the distribution and service fees are payable to the Distributor regardless of the amounts actually expended by the Distributor for distribution of the Fund's shares and service activities.
(C) Sales Charges. The Fund was advised by the Distributor that the amount of initial sales charges retained on sales of Class A and Investor Class shares during the year ended October 31, 2022, were $123,687 and $9,429, respectively.
The Fund was also advised that the Distributor retained CDSCs on redemptions of Class A, Class B and Class C shares during the year ended October 31, 2022, of $11,279, $1,237 and $8,299, respectively.
(D) Transfer, Dividend Disbursing and Shareholder Servicing Agent. NYLIM Service Company LLC, an affiliate of New York Life Investments, is the Fund's transfer, dividend disbursing and shareholder servicing agent pursuant to an agreement between NYLIM Service Company LLC and the Trust. NYLIM Service Company LLC has entered into an agreement with DST Asset Manager Solutions, Inc. ("DST"), pursuant to which DST performs certain transfer agent services on behalf of NYLIM Service Company LLC. New York Life Investments has contractually agreed to limit the transfer agency expenses charged to the Fund’s share classes to a maximum of 0.35% of that share class’s average daily net assets on an annual basis after deducting any applicable Fund or class-level expense reimbursement or small account fees. This agreement will remain in effect until February 28, 2023, and shall renew automatically for one-year terms unless New York Life Investments provides written notice of termination prior to the start of the next term or upon approval of the Board. During the year ended October 31, 2022, transfer agent expenses incurred by the Fund and any
Notes to Financial Statements (continued)
reimbursements, pursuant to the aforementioned Transfer Agency expense limitation agreement, were as follows:
| Class | Expense | Waived |
| Class A | $752,060 | $— |
| Investor Class | 136,533 | — |
| Class B | 23,016 | — |
| Class C | 131,775 | — |
| Class I | 861,519 | — |
(E) Small Account Fee. Shareholders with small accounts adversely impact the cost of providing transfer agency services. In an effort to reduce total transfer agency expenses, the Fund has implemented a small account fee on certain types of accounts. As described in the Fund's prospectus, certain shareholders with an account balance of less than $1,000 ($5,000 for Class A share accounts) are charged an annual per account fee of $20 (assessed semi-annually), the proceeds from which offset transfer agent fees as reflected in the Statement of Operations. This small account fee will not apply to certain types of accounts as described further in the Fund’s prospectus.
(F) Capital. As of October 31, 2022, New York Life and its affiliates beneficially held shares of the Fund with the values and percentages of net assets as follows:
Note 4-Federal Income Tax
As of October 31, 2022, the cost and unrealized appreciation (depreciation) of the Fund’s investment portfolio, including applicable derivative contracts and other financial instruments, as determined on a federal income tax basis, were as follows:
| | Federal Tax
Cost | Gross
Unrealized
Appreciation | Gross
Unrealized
(Depreciation) | Net
Unrealized
Appreciation/
(Depreciation) |
| Investments in Securities | $1,700,114,398 | $224,789,593 | $(167,060,599) | $57,728,994 |
As of October 31, 2022, the components of accumulated gain (loss) on a tax basis were as follows:
Ordinary
income | Accumulated
Capital
and Other
Gain (Loss) | Other
Temporary
Differences | Unrealized
Appreciation
(Depreciation) | Total
Accumulated
Gain (Loss) |
| $23,267,564 | $27,270,245 | $(1,428,311) | $57,728,994 | $106,838,492 |
The difference between book-basis and tax-basis unrealized appreciation (depreciation) is primarily due to cumulative convertible bond, contingent payment debt instruments (CPDI), and debt to equity adjustments. The other temporary differences are primarily due to defaulted bond income accruals.
During the years ended October 31, 2022 and October 31, 2021, the tax character of distributions paid as reflected in the Statements of Changes in Net Assets was as follows:
| | 2022 | 2021 |
| Distributions paid from: | | |
| Ordinary Income | $ 65,835,785 | $ 22,294,305 |
| Long-Term Capital Gains | 315,025,708 | 101,195,814 |
| Total | $380,861,493 | $123,490,119 |
Note 5–Custodian
JPMorgan is the custodian of cash and securities held by the Fund. Custodial fees are charged to the Fund based on the Fund's net assets and/or the market value of securities held by the Fund and the number of certain transactions incurred by the Fund.
Note 6–Line of Credit
The Fund and certain other funds managed by New York Life Investments maintain a line of credit with a syndicate of banks in order to secure a source of funds for temporary purposes to meet unanticipated or excessive redemption requests.
Effective July 26, 2022, under the credit agreement (the “Credit Agreement”), the aggregate commitment amount is $600,000,000 with an additional uncommitted amount of $100,000,000. The commitment fee is an annual rate of 0.15% of the average commitment amount payable quarterly, regardless of usage, to JPMorgan, who serves as the agent to the syndicate. The commitment fee is allocated among the Fund and certain other funds managed by New York Life Investments based upon their respective net assets and other factors. Interest on any revolving credit loan is charged based upon the Federal Funds Rate, Daily Simple Secured Overnight Financing Rate ("SOFR") + 0.10%, or the Overnight Bank Funding Rate, whichever is higher. The Credit Agreement expires on July 25, 2023, although the Fund, certain other funds managed by New York Life Investments and the syndicate of banks may renew the Credit Agreement for an additional year on the same or different terms or enter into a credit agreement with a different syndicate of banks. Prior to July 26, 2022, the aggregate commitment amount and the commitment fee were the same as those under the current Credit Agreement. During the year ended October 31, 2022, there were no borrowings made or outstanding with respect to the Fund under the Credit Agreement.
Note 7–Interfund Lending Program
Pursuant to an exemptive order issued by the SEC, the Fund, along with certain other funds managed by New York Life Investments, may participate in an interfund lending program. The interfund lending program provides an alternative credit facility that permits the Fund and certain other funds managed by New York Life Investments to lend or borrow money for temporary purposes directly to or from one another, subject to the conditions of the exemptive order. During the year ended
| 28 | MainStay MacKay Convertible Fund |
October 31, 2022, there were no interfund loans made or outstanding with respect to the Fund.
Note 8–Purchases and Sales of Securities (in 000’s)
During the year ended October 31, 2022, purchases and sales of securities, other than short-term securities, were $241,741 and $367,652, respectively.
Note 9–Capital Share Transactions
Transactions in capital shares for the years ended October 31, 2022 and October 31, 2021, were as follows:
| Class A | Shares | Amount |
| Year ended October 31, 2022: | | |
| Shares sold | 3,750,826 | $ 74,532,551 |
| Shares issued to shareholders in reinvestment of distributions | 8,083,712 | 160,959,710 |
| Shares redeemed | (7,855,742) | (151,662,870) |
| Net increase (decrease) in shares outstanding before conversion | 3,978,796 | 83,829,391 |
| Shares converted into Class A (See Note 1) | 265,425 | 5,163,988 |
| Shares converted from Class A (See Note 1) | (335,288) | (5,961,835) |
| Net increase (decrease) | 3,908,933 | $ 83,031,544 |
| Year ended October 31, 2021: | | |
| Shares sold | 5,285,332 | $ 126,501,641 |
| Shares issued to shareholders in reinvestment of distributions | 2,139,264 | 47,470,507 |
| Shares redeemed | (4,849,726) | (115,920,808) |
| Net increase (decrease) in shares outstanding before conversion | 2,574,870 | 58,051,340 |
| Shares converted into Class A (See Note 1) | 1,081,489 | 25,339,661 |
| Shares converted from Class A (See Note 1) | (19,008) | (458,361) |
| Net increase (decrease) | 3,637,351 | $ 82,932,640 |
| |
| Investor Class | Shares | Amount |
| Year ended October 31, 2022: | | |
| Shares sold | 97,525 | $ 1,926,381 |
| Shares issued to shareholders in reinvestment of distributions | 497,142 | 9,905,355 |
| Shares redeemed | (214,831) | (4,107,217) |
| Net increase (decrease) in shares outstanding before conversion | 379,836 | 7,724,519 |
| Shares converted into Investor Class (See Note 1) | 52,537 | 1,002,519 |
| Shares converted from Investor Class (See Note 1) | (156,412) | (3,098,448) |
| Net increase (decrease) | 275,961 | $ 5,628,590 |
| Year ended October 31, 2021: | | |
| Shares sold | 213,974 | $ 5,108,766 |
| Shares issued to shareholders in reinvestment of distributions | 188,154 | 4,165,962 |
| Shares redeemed | (205,771) | (4,914,608) |
| Net increase (decrease) in shares outstanding before conversion | 196,357 | 4,360,120 |
| Shares converted into Investor Class (See Note 1) | 61,379 | 1,489,594 |
| Shares converted from Investor Class (See Note 1) | (908,162) | (21,202,336) |
| Net increase (decrease) | (650,426) | $ (15,352,622) |
| |
| Class B | Shares | Amount |
| Year ended October 31, 2022: | | |
| Shares sold | 4,956 | $ 106,694 |
| Shares issued to shareholders in reinvestment of distributions | 90,227 | 1,763,027 |
| Shares redeemed | (52,530) | (974,121) |
| Net increase (decrease) in shares outstanding before conversion | 42,653 | 895,600 |
| Shares converted from Class B (See Note 1) | (105,008) | (1,946,782) |
| Net increase (decrease) | (62,355) | $ (1,051,182) |
| Year ended October 31, 2021: | | |
| Shares sold | 21,411 | $ 501,679 |
| Shares issued to shareholders in reinvestment of distributions | 31,173 | 683,004 |
| Shares redeemed | (62,432) | (1,473,676) |
| Net increase (decrease) in shares outstanding before conversion | (9,848) | (288,993) |
| Shares converted from Class B (See Note 1) | (86,082) | (2,040,685) |
| Net increase (decrease) | (95,930) | $ (2,329,678) |
| |
Notes to Financial Statements (continued)
| Class C | Shares | Amount |
| Year ended October 31, 2022: | | |
| Shares sold | 347,776 | $ 6,600,757 |
| Shares issued to shareholders in reinvestment of distributions | 510,200 | 9,953,997 |
| Shares redeemed | (847,078) | (15,740,177) |
| Net increase (decrease) in shares outstanding before conversion | 10,898 | 814,577 |
| Shares converted from Class C (See Note 1) | (57,418) | (1,065,137) |
| Net increase (decrease) | (46,520) | $ (250,560) |
| Year ended October 31, 2021: | | |
| Shares sold | 362,202 | $ 8,480,082 |
| Shares issued to shareholders in reinvestment of distributions | 162,889 | 3,564,001 |
| Shares redeemed | (702,549) | (16,493,148) |
| Net increase (decrease) in shares outstanding before conversion | (177,458) | (4,449,065) |
| Shares converted from Class C (See Note 1) | (152,398) | (3,586,031) |
| Net increase (decrease) | (329,856) | $ (8,035,096) |
| |
| Class I | Shares | Amount |
| Year ended October 31, 2022: | | |
| Shares sold | 21,817,856 | $ 426,249,567 |
| Shares issued to shareholders in reinvestment of distributions | 8,343,567 | 166,340,734 |
| Shares redeemed | (24,263,729) | (459,659,692) |
| Net increase (decrease) in shares outstanding before conversion | 5,897,694 | 132,930,609 |
| Shares converted into Class I (See Note 1) | 334,156 | 5,956,868 |
| Shares converted from Class I (See Note 1) | (2,889) | (51,173) |
| Net increase (decrease) | 6,228,961 | $ 138,836,304 |
| Year ended October 31, 2021: | | |
| Shares sold | 10,387,931 | $ 250,657,301 |
| Shares issued to shareholders in reinvestment of distributions | 2,426,302 | 54,085,824 |
| Shares redeemed | (14,587,388) | (348,370,550) |
| Net increase (decrease) in shares outstanding before conversion | (1,773,155) | (43,627,425) |
| Shares converted into Class I (See Note 1) | 18,947 | 458,158 |
| Net increase (decrease) | (1,754,208) | $ (43,169,267) |
Note 10–Other Matters
As of the date of this report, interest rates in the United States and many parts of the world, including certain European countries, are ascending from historically low levels. Thus, the Fund currently faces a heightened level of risk associated with rising interest rates. This could be driven by a variety of factors, including but not limited to central bank monetary policies, changing inflation or real growth rates, general economic conditions, increasing bond issuances or reduced market demand for low yielding investments.
An outbreak of COVID-19, first detected in December 2019, has developed into a global pandemic and has resulted in travel restrictions, closure of international borders, certain businesses and securities markets, restrictions on securities trading activities, prolonged quarantines, supply chain disruptions, and lower consumer demand, as well as general concern and uncertainty. In 2022, many countries lifted some or all restrictions related to COVID-19. However, the continued impact of COVID-19 and related variants is uncertain and could further adversely affect the global economy, national economies, individual issuers and capital markets in unforeseeable ways and result in a substantial and extended economic downturn. Developments that disrupt global economies and financial markets, such as COVID-19, may magnify factors that affect the Fund's performance.
Note 11–Subsequent Events
In connection with the preparation of the financial statements of the Fund as of and for the year ended October 31, 2022, events and transactions subsequent to October 31, 2022, through the date the financial statements were issued have been evaluated by the Manager for possible adjustment and/or disclosure. No subsequent events requiring financial statement adjustment or disclosure have been identified.
| 30 | MainStay MacKay Convertible Fund |
Report of Independent Registered Public Accounting Firm
To the Shareholders of the Fund and Board of Trustees
The MainStay Funds:
Opinion on the Financial Statements
We have audited the accompanying statement of assets and liabilities of MainStay MacKay Convertible Fund (the Fund), one of the funds constituting The MainStay Funds, including the portfolio of investments, as of October 31, 2022, the related statement of operations for the year then ended, the statements of changes in net assets for each of the years in the two-year period then ended, and the related notes (collectively, the financial statements) and the financial highlights for each of the years in the five-year period then ended. In our opinion, the financial statements and financial highlights present fairly, in all material respects, the financial position of the Fund as of October 31, 2022, the results of its operations for the year then ended, the changes in its net assets for each of the years in the two-year period then ended, and the financial highlights for each of the years in the five-year period then ended, in conformity with U.S. generally accepted accounting principles.
Basis for Opinion
These financial statements and financial highlights are the responsibility of the Fund's management. Our responsibility is to express an opinion on these financial statements and financial highlights based on our audits. We are a public accounting firm registered with the Public Company Accounting Oversight Board (United States) (PCAOB) and are required to be independent with respect to the Fund in accordance with the U.S. federal securities laws and the applicable rules and regulations of the Securities and Exchange Commission and the PCAOB.
We conducted our audits in accordance with the standards of the PCAOB. Those standards require that we plan and perform the audit to obtain reasonable assurance about whether the financial statements and financial highlights are free of material misstatement, whether due to error or fraud. Our audits included performing procedures to assess the risks of material misstatement of the financial statements and financial highlights, whether due to error or fraud, and performing procedures that respond to those risks. Such procedures included examining, on a test basis, evidence regarding the amounts and disclosures in the financial statements and financial highlights. Such procedures also included confirmation of securities owned as of October 31, 2022, by correspondence with custodians and the transfer agent. Our audits also included evaluating the accounting principles used and significant estimates made by management, as well as evaluating the overall presentation of the financial statements and financial highlights. We believe that our audits provide a reasonable basis for our opinion.

We have served as the auditor of one or more New York Life Investment Management investment companies since 2003.
Philadelphia, Pennsylvania
December 23, 2022
Federal Income Tax Information
(Unaudited)
The Fund is required under the Internal Revenue Code to advise shareholders in a written statement as to the federal tax status of dividends paid by the Fund during such fiscal years. Accordingly, the Fund paid $315,025,708 as long term capital gain distributions.
For the fiscal year ended October 31, 2022, the Fund designated approximately $8,319,140 under the Internal Revenue Code as qualified dividend income eligible for reduced tax rates.
The dividends paid by the Fund during the fiscal year ended October 31, 2022 should be multiplied by 10.19% to arrive at the amount eligible for the corporate dividend-received deduction.
In February 2023, shareholders will receive an IRS Form 1099-DIV or substitute Form 1099, which will show the federal tax status of the distributions received by shareholders in calendar year 2022. The amounts that will be reported on such 1099-DIV or substitute Form 1099 will be the amounts you are to use on your federal income tax return and will differ from the amounts which we must report for the Fund's fiscal year ended October 31, 2022.
Proxy Voting Policies and Procedures and Proxy Voting Record
The Fund is required to file with the SEC its proxy voting record for the 12-month period ending June 30 on Form N-PX. A description of the policies and procedures that are used to vote proxies relating to portfolio securities of the Fund is available free of charge upon request by calling 800-624-6782 or visiting the SEC’s website at www.sec.gov. The most recent Form N-PX or proxy voting record is available free of charge upon request by calling 800-624-6782; visiting newyorklifeinvestments.com; or visiting the SEC’s website at www.sec.gov.
Shareholder Reports and Quarterly Portfolio Disclosure
The Fund is required to file its complete schedule of portfolio holdings with the SEC 60 days after its first and third fiscal quarter on Form N-PORT. The Fund's holdings report is available free of charge upon request by calling New York Life Investments at 800-624-6782.
| 32 | MainStay MacKay Convertible Fund |
Board of Trustees and Officers (Unaudited)
The Trustees and officers of the Fund are listed below. The Board oversees the MainStay Group of Funds (which consists of MainStay Funds and MainStay Funds Trust), MainStay VP Funds Trust, MainStay MacKay DefinedTerm Municipal Opportunities Fund, MainStay CBRE Global Infrastructure Megatrends Fund, the Manager and the Subadvisors, and elects the officers of the Funds who are responsible for the day-to-day operations of the Fund. Information pertaining to the Trustees and officers is set forth below. Each Trustee serves until his or her successor is
elected and qualified or until his or her resignation, death or removal. Under the Board’s retirement policy, unless an exception is made, a Trustee must tender his or her resignation by the end of the calendar year during which he or she reaches the age of 75. The business address of each Trustee and officer listed below is 51 Madison Avenue, New York, New York 10010. None of the Trustees are “interested persons” (as defined by the 1940 Act and rules adopted by the SEC thereunder) of the Fund (“Independent Trustees”).
| | Name and
Year of Birth | Term of Office,
Position(s) Held and
Length of Service | Principal Occupation(s)
During Past Five Years | Number of
Portfolios in
Fund Complex
Overseen by
Trustee | Other Directorships
Held by Trustee |
| | | | | | |
| | David H. Chow
1957 | MainStay Funds: Trustee since 2016, Advisory Board Member (June 2015 to December 2015);MainStay Funds Trust:
Trustee since January 2016, Advisory Board Member (June 2015 to December 2015) | Founder and CEO, DanCourt Management, LLC since 1999 | 78 | MainStay VP Funds Trust: Trustee since January 2016, Advisory Board Member (June 2015 to December 2015) (31 portfolios);
MainStay MacKay DefinedTerm Municipal Opportunities Fund: Trustee since January 2016, Advisory Board Member (June 2015 to December 2015);
MainStay CBRE Global Infrastructure Megatrends Fund: Trustee since June 2021; VanEck Vectors Group of Exchange-Traded Funds: Independent Chairman of the Board of Trustees since 2008 and Trustee since 2006 (56 portfolios); and Berea College of Kentucky: Trustee since 2009, Chair of the Investment Committee since 2018 |
| | Susan B. Kerley
1951 | MainStay Funds: Chairman since 2017 and Trustee since 2007;MainStay Funds Trust:
Chairman since 2017 and Trustee since 1990** | President, Strategic Management Advisors LLC since 1990 | 78 | MainStay VP Funds Trust: Chairman since January 2017 and Trustee since 2007 (31 portfolios)**;
MainStay MacKay DefinedTerm Municipal Opportunities Fund: Chairman since 2017 and Trustee since 2011;
MainStay CBRE Global Infrastructure Megatrends Fund: Trustee since June 2021; and Legg Mason Partners Funds: Trustee since 1991 (45 portfolios) |
| | Alan R. Latshaw
1951 | MainStay Funds: Trustee since 2006;MainStay Funds Trust:
Trustee since 2007*** | Retired; Partner, Ernst & Young LLP (2002 to 2003); Partner, Arthur Andersen LLP (1989 to 2002); Consultant to the MainStay Funds Audit and Compliance Committee (2004 to 2006) | 78 | MainStay VP Funds Trust: Trustee since 2007 (31 portfolios)**;
MainStay MacKay DefinedTerm Municipal Opportunities Fund: Trustee since 2011; and
MainStay CBRE Global Infrastructure Megatrends Fund: Trustee since June 2021 |
Board of Trustees and Officers (Unaudited) (continued)
| | Name and
Year of Birth | Term of Office,
Position(s) Held and
Length of Service | Principal Occupation(s)
During Past Five Years | Number of
Portfolios in
Fund Complex
Overseen by
Trustee | Other Directorships
Held by Trustee |
| | | | | | |
| | Karen Hammond
1956 | MainStay Funds: Trustee since December 2021, Advisory Board Member (June 2021 to December 2021);MainStay Funds Trust:
Trustee since December 2021, Advisory Board Member (June 2021 to December 2021)
| Retired, Managing Director, Devonshire Investors (2007 to 2013); Senior Vice President, Fidelity Management & Research Co. (2005 to 2007); Senior Vice President and Corporate Treasurer, FMR Corp. (2003 to 2005); Chief Operating Officer, Fidelity Investments Japan (2001 to 2003) | 78 | MainStay VP Funds Trust: Trustee since December 2021, Advisory Board Member (June 2021 to December 2021) (31 Portfolios);
MainStay MacKay DefinedTerm Municipal Opportunities Fund: Trustee since December 2021, Advisory Board Member (June 2021 to December 2021);
MainStay CBRE Global Infrastructure Megatrends Fund: Trustee since December 2021, Advisory Board Member (June 2021 to December 2021);
Two Harbors Investment Corp.: Director since 2018;
Rhode Island State Investment Commission: Member since 2017; and
Blue Cross Blue Shield of Rhode Island: Director since 2019 |
| | Jacques P. Perold
1958 | MainStay Funds: Trustee since 2016, Advisory Board Member (June 2015 toDecember 2015);MainStay Funds Trust:
Trustee since January 2016, Advisory Board Member (June 2015 to December 2015) | Founder and Chief Executive Officer, CapShift Advisors LLC (since 2018); President, Fidelity Management & Research Company (2009 to 2014); President and Chief Investment Officer, Geode Capital Management, LLC (2001 to 2009) | 78 | MainStay VP Funds Trust: Trustee since January 2016, Advisory Board Member (June 2015 to December 2015) (31 portfolios);
MainStay MacKay DefinedTerm Municipal Opportunities Fund: Trustee since January 2016, Advisory Board Member (June 2015 to December 2015);
MainStay CBRE Global Infrastructure Megatrends Fund: Trustee since June 2021; Partners in Health: Trustee since 2019; Allstate Corporation: Director since 2015; and MSCI Inc.: Director since 2017 |
| | Richard S. Trutanic
1952 | MainStay Funds: Trustee since 1994;MainStay Funds Trust:
Trustee since 2007*** | Chairman and Chief Executive Officer, Somerset & Company (financial advisory firm) since 2004; Managing Director, The Carlyle Group (private investment firm) (2002 to 2004); Senior Managing Director, Partner and Board Member, Groupe Arnault S.A. (private investment firm) (1999 to 2002) | 78 | MainStay VP Funds Trust: Trustee since 2007 (31 portfolios)**;
MainStay MacKay DefinedTerm Municipal Opportunities Fund: Trustee since 2011; and MainStay CBRE Global Infrastructure Megatrends Fund: Trustee since June 2021 |
| ** | Includes prior service as a Director of MainStay VP Series Fund, Inc., the predecessor to MainStay VP Funds Trust. |
| *** | Includes prior service as a Director/Trustee of certain predecessor entities to MainStay Funds Trust. |
| 34 | MainStay MacKay Convertible Fund |
| | Name and
Year of Birth | Position(s) Held and
Length of Service | Principal Occupation(s)
During Past Five Years | |
| | | | | |
| | Kirk C. Lehneis
1974 | President, MainStay Funds, MainStay Funds Trust since 2017 | Chief Operating Officer and Senior Managing Director (since 2016), New York Life Investment Management LLC and New York Life Investment Management Holdings LLC; Member of the Board of Managers (since 2017) and Senior Managing Director (since 2018), NYLIFE Distributors LLC; Chairman of the Board and Senior Managing Director, NYLIM Service Company LLC (since 2017); Trustee, President and Principal Executive Officer of IndexIQ Trust, IndexIQ ETF Trust and IndexIQ Active ETF Trust (since January 2018); President, MainStay CBRE Global Infrastructure Megatrends Fund (since 2021), MainStay MacKay DefinedTerm Municipal Opportunities Fund and MainStay VP Funds Trust (since 2017); Senior Managing Director, Global Product Development (From 2015-2016); Managing Director, Product Development (2010 to 2015), New York Life Investment Management LLC | |
| | Jack R. Benintende
1964 | Treasurer and Principal Financial and Accounting Officer, MainStay Funds (since 2007), MainStay Funds Trust (since 2009) | Managing Director, New York Life Investment Management LLC (since 2007); Treasurer and Principal Financial and Accounting Officer, MainStay CBRE Global Infrastructure Megatrends Fund (since 2021), MainStay MacKay DefinedTerm Municipal Opportunities Fund (since 2011) and MainStay VP Funds Trust (since 2007)** and Assistant Treasurer, New York Life Investment Management Holdings LLC (2008 to 2012) | |
| | J. Kevin Gao
1967 | Secretary and Chief Legal Officer, MainStay Funds and MainStay Funds Trust (since 2010) | Managing Director and Associate General Counsel, New York Life Investment Management LLC (since 2010); Secretary and Chief Legal Officer and MainStay CBRE Global Infrastructure Megatrends Fund (since 2021), MainStay MacKay DefinedTerm Municipal Opportunities Fund (since 2011) and MainStay VP Funds Trust (since 2010)** | |
| | Scott T. Harrington
1959 | Vice President— Administration, MainStay Funds (since 2009), MainStay Funds Trust (since 2009) | Managing Director, New York Life Investment Management LLC (including predecessor advisory organizations) (since 2000); Member of the Board of Directors, New York Life Trust Company (since 2009); Vice President—Administration, MainStay CBRE Global Infrastructure Megatrends Fund (since 2021), MainStay MacKay DefinedTerm Municipal Opportunities Fund (since 2011) and MainStay VP Funds Trust (since 2005)** | |
| | Kevin M. Gleason
1967 | Vice President and Chief Compliance Officer, MainStay Funds and MainStay Funds Trust (since June 2022) | Vice President and Chief Compliance Officer, IndexIQ, IndexIQ ETF Trust and Index IQ Active ETF Trust (since June 2022); Vice President and Chief Compliance Officer, MainStay CBRE Global Infrastructure Megatrends Fund, MainStay VP Funds Trust and MainStay MacKay DefinedTerm Municipal Opportunities Fund (since June 2022); Senior Vice President, Voya Investment Management and Chief Compliance Officer, Voya Family of Funds (2012-2022) | |
| * | The officers listed above are considered to be “interested persons” of the MainStay Group of Funds, MainStay VP Funds Trust, MainStay CBRE Global Infrastructure Megatrends Fund and MainStay MacKay DefinedTerm Municipal Opportunities Fund within the meaning of the 1940 Act because of their affiliation with the MainStay Group of Funds, New York Life Insurance Company and/or its affiliates, including New York Life Investment Management LLC, NYLIM Service Company LLC, NYLIFE Securities LLC and/or NYLIFE Distributors LLC, as described in detail in the column captioned “Principal Occupation(s) During Past Five Years.” Officers are elected annually by the Board. |
| ** | Includes prior service as an Officer of MainStay VP Series Fund, Inc., the predecessor to MainStay VP Funds Trust. |
Officers of the Trust (Who are not Trustees)*
This page intentionally left blank.
This page intentionally left blank.
This page intentionally left blank.
Equity
U.S. Equity
MainStay Epoch U.S. Equity Yield Fund
MainStay S&P 500 Index Fund1
MainStay Winslow Large Cap Growth Fund
MainStay WMC Enduring Capital Fund
MainStay WMC Growth Fund
MainStay WMC Small Companies Fund
MainStay WMC Value Fund
International Equity
MainStay Epoch International Choice Fund
MainStay MacKay International Equity Fund
MainStay WMC International Research Equity Fund
Emerging Markets Equity
MainStay Candriam Emerging Markets Equity Fund
Global Equity
MainStay Epoch Capital Growth Fund
MainStay Epoch Global Equity Yield Fund
Fixed Income
Taxable Income
MainStay Candriam Emerging Markets Debt Fund
MainStay Floating Rate Fund
MainStay MacKay High Yield Corporate Bond Fund
MainStay MacKay Short Duration High Yield Fund
MainStay MacKay Strategic Bond Fund
MainStay MacKay Total Return Bond Fund
MainStay MacKay U.S. Infrastructure Bond Fund
MainStay Short Term Bond Fund
Tax-Exempt Income
MainStay MacKay California Tax Free Opportunities Fund2
MainStay MacKay High Yield Municipal Bond Fund
MainStay MacKay New York Tax Free Opportunities Fund3
MainStay MacKay Short Term Municipal Fund
MainStay MacKay Strategic Municipal Allocation Fund
MainStay MacKay Tax Free Bond Fund
Money Market
MainStay Money Market Fund
Mixed Asset
MainStay Balanced Fund
MainStay Income Builder Fund
MainStay MacKay Convertible Fund
Speciality
MainStay CBRE Global Infrastructure Fund
MainStay CBRE Real Estate Fund
MainStay Cushing MLP Premier Fund
Asset Allocation
MainStay Conservative Allocation Fund
MainStay Conservative ETF Allocation Fund
MainStay Defensive ETF Allocation Fund
MainStay Equity Allocation Fund
MainStay Equity ETF Allocation Fund
MainStay ESG Multi-Asset Allocation Fund
MainStay Growth Allocation Fund
MainStay Growth ETF Allocation Fund
MainStay Moderate Allocation Fund
MainStay Moderate ETF Allocation Fund
Manager
New York Life Investment Management LLC
New York, New York
Subadvisors
Candriam4
Strassen, Luxembourg
CBRE Investment Management Listed Real Assets LLC
Radnor, Pennsylvania
Cushing Asset Management, LP
Dallas, Texas
Epoch Investment Partners, Inc.
New York, New York
MacKay Shields LLC4
New York, New York
NYL Investors LLC4
New York, New York
Wellington Management Company LLP
Boston, Massachusetts
Winslow Capital Management, LLC
Minneapolis, Minnesota
Legal Counsel
Dechert LLP
Washington, District of Columbia
Independent Registered Public Accounting Firm
KPMG LLP
Philadelphia, Pennsylvania
Distributor
NYLIFE Distributors LLC4
Jersey City, New Jersey
Custodian
JPMorgan Chase Bank, N.A.
New York, New York
1.
Prior to February 28, 2022, the Fund's name was MainStay MacKay S&P 500 Index Fund.
| 2. | This Fund is registered for sale in AZ, CA, NV, OR, TX, UT, WA and MI (Class A and Class I shares only), and CO, FL, GA, HI, ID, MA, MD, NH, NJ and NY (Class I shares only). |
| 3. | This Fund is registered for sale in CA, CT, DE, FL, MA, NJ, NY and VT. |
| 4. | An affiliate of New York Life Investment Management LLC. |
Not part of the Annual Report
For more information
800-624-6782
newyorklifeinvestments.com
“New York Life Investments” is both a service mark, and the common trade name, of certain investment advisors affiliated with New York Life Insurance Company. The MainStay Funds® are managed by New York Life Investment Management LLC and distributed by NYLIFE Distributors LLC, 30 Hudson Street, Jersey City, NJ 07302, a wholly owned subsidiary of New York Life Insurance Company. NYLIFE Distributors LLC is a Member FINRA/SIPC.
©2022 NYLIFE Distributors LLC. All rights reserved.
| 5013891.2MS229-22 | MSC11-12/22 |
(NYLIM) NL210
MainStay MacKay High Yield Corporate Bond Fund
Message from the President and Annual Report
October 31, 2022
Sign up for e-delivery of your shareholder reports. For full details on e-delivery, including who can participate and what you can receive via e-delivery,
please log in to newyorklifeinvestments.com/accounts.
| Not FDIC/NCUA Insured | Not a Deposit | May Lose Value | No Bank Guarantee | Not Insured by Any Government Agency |
This page intentionally left blank
Message from the President
A series of economic and geopolitical challenges undermined equity and fixed-income markets during the 12-month reporting period ended October 31, 2022. Stocks and bonds alike trended lower in the face of sharply rising interest rates, increasing inflationary pressures, slowing economic growth and Russia’s invasion of Ukraine.
The reporting period began on a mixed note, with concerns about the spreading Omicron variant of the COVID-19 virus and increasingly hawkish statements from the U.S. Federal Reserve (the “Fed”) regarding mounting inflation, countered by bullish sentiment stemming from U.S. economic growth and strong corporate earnings. In January 2022, markets turned decisively negative as comments from the Fed raised the likelihood of rate hikes as early as March, and Russia issued increasingly aggressive threats toward Ukraine. The onset of Russia’s invasion in February exacerbated global inflationary pressures while increasing investor uncertainty. Domestic supply shortages, international trade imbalances and rising inflation caused GDP (gross domestic product) to contract in the first and second quarters of the year, although employment and consumer spending proved resilient. Prices for petroleum surged to multi-year highs, while many key agricultural chemicals and industrial metals climbed as well. Accelerating inflationary forces prompted the Fed to implement its most aggressive interest rate increases since the 1980s with a series of five sharp rate hikes, raising the federal funds rate from a range of 0.00% to 0.25% in March to 3.00% to 3.25% in September, with additional rate hikes expected before the end of the year. International central banks generally followed suit, raising rates by varying degrees in efforts to curb local inflation, although most increases remained significantly more modest than those in the United States. Relatively high U.S. interest rates and risk-averse international sentiment pushed U.S. dollar values higher compared to most other currencies, with the ensuing negative impact on global prices for food, fuel and other key, U.S.-dollar-denominated products.
The effects of these interrelated challenges were felt throughout U.S. and international financial markets. The S&P 500® Index, a widely regarded benchmark of U.S. market performance, declined by more than 14% during the reporting period. Although the energy sector generated strong gains, bolstered by elevated oil and gas prices, most other industry areas recorded losses. The more cyclical and growth-oriented sectors of consumer discretionary, real estate and information technology delivered the
weakest returns, while the traditionally defensive and value-oriented consumer staples, utilities and health care sectors outperformed. International stocks lagged compared to their U.S. counterparts, with some emerging markets, such as China, suffering particularly steep losses. A few markets, however, including Brazil, Mexico and the United Arab Emirates, ended the reporting period with little change. Fixed-income markets saw bond prices broadly decline as yields rose along with interest rates. Short-term yields rose faster than long-term yields, producing a yield curve inversion from July through the end of the reporting period, with long-term rates remaining below short-term rates. While floating-rate instruments, which feature variable interest rates that allow investors to benefit from a rising rate environment, provided a degree of insulation from inflation-driven trends, they were not immune to the market’s widespread declines.
While the Fed acknowledges the costs of rising rates in terms of weaker GDP growth and unsettled financial markets over the short term, its primary focus continues to be the longer-term economic impact of inflation. With the latest figures as of the date of this report showing that inflation remains above 8%, versus a target rate of just 2%, the Fed clearly has a distance yet to go, making further rate increases and market volatility more likely in the coming months. The question remains as to whether the Fed and other central banks will manage a so-called “soft landing,” curbing inflation while avoiding a persistent economic slowdown. If they prove successful, we expect that favorable inflation trends and increasingly attractive valuations in both equity and bond markets should eventually translate into sustainable improvements in the investment environment.
Whatever actions the Fed takes and however financial markets react, as a MainStay investor, you can depend on us to continue providing the insight, expertise and service that have long defined New York Life Investments. Thank you for trusting us to help you meet your investment needs.
Sincerely,
Kirk C. Lehneis
President
The opinions expressed are as of the date of this report and are subject to change. There is no guarantee that any forecast made will come to pass. This material does not constitute investment advice and is not intended as an endorsement of any specific investment. Past performance is no guarantee of future results.
Not part of the Annual Report
Investors should refer to the Fund’s Summary Prospectus and/or Prospectus and consider the Fund’s investment objectives, strategies, risks, charges and expenses carefully before investing. The Summary Prospectus and/or Prospectus contain this and other information about the Fund. You may obtain copies of the Fund’s Summary Prospectus, Prospectus and Statement of Additional Information, which includes information about The MainStay Funds' Trustees, free of charge, upon request, by calling toll-free 800-624-6782, by writing to NYLIFE Distributors LLC, Attn: MainStay Marketing Department, 30 Hudson Street, Jersey City, NJ 07302 or by sending an e-mail to MainStayShareholderServices@nylim.com. These documents are also available via the MainStay Funds’ website at newyorklifeinvestments.com. Please read the Fund’s Summary Prospectus and/or Prospectus carefully before investing.
Investment and Performance Comparison (Unaudited)
Performance data quoted represents past performance. Past performance is no guarantee of future results. Because of market volatility and other factors, current performance may be lower or higher than the figures shown. Investment return and principal value will fluctuate, and as a result, when shares are redeemed, they may be worth more or less than their original cost. The graph below depicts the historical performance of Class I shares of the Fund. Performance will vary from class to class based on differences in class-specific expenses and sales charges. For performance information current to the most recent month-end, please call 800-624-6782 or visit newyorklifeinvestments.com.
The performance table and graph do not reflect the deduction of taxes that a shareholder would pay on distributions or Fund share redemptions. Total returns reflect maximum applicable sales charges as indicated in the table below, if any, changes in share price, and reinvestment of dividend and capital gain distributions. The graph assumes the initial investment amount shown below and reflects the deduction of all sales charges that would have applied for the period of investment. Performance figures may reflect certain fee waivers and/or expense limitations, without which total returns may have been lower. For more information on share classes and current fee waivers and/or expense limitations (if any), please refer to the Notes to Financial Statements.

| Average Annual Total Returns for the Year-Ended October 31, 2022 |
| Class | Sales Charge | | Inception
Date | One
Year | Five
Years | Ten Years
or Since
Inception | Gross
Expense
Ratio1 |
| Class A Shares | Maximum 4.5% Initial Sales Charge | With sales charges | 1/3/1995 | -12.98% | 1.18% | 3.36% | 0.95% |
| | | Excluding sales charges | | -8.88 | 2.12 | 3.84 | 0.95 |
| Investor Class Shares2 | Maximum 4% Initial Sales Charge | With sales charges | 2/28/2008 | -12.55 | 1.10 | 3.31 | 1.08 |
| | | Excluding sales charges | | -8.90 | 2.04 | 3.79 | 1.08 |
| Class B Shares3 | Maximum 5% CDSC | With sales charges | 5/1/1986 | -13.95 | 0.96 | 3.01 | 1.83 |
| | if Redeemed Within the First Six Years of Purchase | Excluding sales charges | | -9.61 | 1.29 | 3.01 | 1.83 |
| Class C Shares | Maximum 1% CDSC | With sales charges | 9/1/1998 | -10.48 | 1.28 | 3.00 | 1.83 |
| | if Redeemed Within One Year of Purchase | Excluding sales charges | | -9.62 | 1.28 | 3.00 | 1.83 |
| Class I Shares | No Sales Charge | | 1/2/2004 | -8.65 | 2.36 | 4.11 | 0.70 |
| Class R1 Shares | No Sales Charge | | 6/29/2012 | -8.77 | 2.25 | 3.99 | 0.80 |
| Class R2 Shares | No Sales Charge | | 5/1/2008 | -8.98 | 2.02 | 3.74 | 1.05 |
| Class R3 Shares | No Sales Charge | | 2/29/2016 | -9.07 | 1.77 | 4.54 | 1.30 |
| Class R6 Shares | No Sales Charge | | 6/17/2013 | -8.36 | 2.51 | 4.02 | 0.56 |
| SIMPLE Class Shares | No Sales Charge | | 8/31/2020 | -9.14 | N/A | -0.79 | 1.33 |
| 1. | The gross expense ratios presented reflect the Fund’s “Total Annual Fund Operating Expenses” from the most recent Prospectus, as supplemented, and may differ from other expense ratios disclosed in this report. |
| 2. | Prior to June 30, 2020, the maximum initial sales charge was 4.5%, which is reflected in the applicable average annual total return figures shown. |
| 3. | Class B shares are closed to all new purchases as well as additional investments by existing Class B shareholders. |
The footnotes on the next page are an integral part of the table and graph and should be carefully read in conjunction with them.
| Benchmark Performance* | One
Year | Five
Years | Ten
Years |
| ICE BofA U.S. High Yield Constrained Index1 | -11.45% | 1.88% | 4.06% |
| Morningstar High Yield Bond Category Average2 | -11.11 | 1.19 | 3.07 |
| * | Returns for indices reflect no deductions for fees, expenses or taxes, except for foreign withholding taxes where applicable. Results assume reinvestment of all dividends and capital gains. An investment cannot be made directly in an index. |
| 1. | The ICE BofA U.S. High Yield Constrained Index is the Fund's primary broad-based securities market index for comparison purposes. The ICE BofA U.S. High Yield Constrained Index is a market value-weighted index of all domestic and Yankee high-yield bonds, including deferred interest bonds and payment-in-kind securities. Issuers included in the Index have maturities of one year or more and have a credit rating lower than BBB-/Baa3, but are not in default. No single issuer may constitute greater than 2% of the Index. |
| 2. | The Morningstar High Yield Bond Category Average is representative of funds that concentrate on lower-quality bonds, which are riskier than those of higher-quality companies. These portfolios primarily invest in U.S. high-income debt securities where at least 65% or more of bond assets are not rated or are rated by a major agency such as Standard & Poor’s or Moody’s at the level of BB and below. Results are based on average total returns of similar funds with all dividends and capital gain distributions reinvested. |
The footnotes on the preceding page are an integral part of the table and graph and should be carefully read in conjunction with them.
| 6 | MainStay MacKay High Yield Corporate Bond Fund |
Cost in Dollars of a $1,000 Investment in MainStay MacKay High Yield Corporate Bond Fund (Unaudited)
The example below is intended to describe the fees and expenses borne by shareholders during the six-month period from May 1, 2022 to October 31, 2022, and the impact of those costs on your investment.
Example
As a shareholder of the Fund you incur two types of costs: (1) transaction costs, including exchange fees and sales charges (loads) on purchases (as applicable), and (2) ongoing costs, including management fees, distribution and/or service (12b-1) fees and other Fund expenses (as applicable). This example is intended to help you understand your ongoing costs (in dollars) of investing in the Fund and to compare these costs with the ongoing costs of investing in other mutual funds. The example is based on an investment of $1,000 made at the beginning of the six-month period and held for the entire period from May 1, 2022 to October 31, 2022.
This example illustrates your Fund’s ongoing costs in two ways:
Actual Expenses
The second and third data columns in the table below provide information about actual account values and actual expenses. You may use the information in these columns, together with the amount you invested, to estimate the expenses that you paid during the six months ended October 31, 2022. Simply divide your account value by $1,000 (for example, an
$8,600 account value divided by $1,000 = 8.6), then multiply the result by the number under the heading entitled “Expenses Paid During Period” to estimate the expenses you paid on your account during this period.
Hypothetical Example for Comparison Purposes
The fourth and fifth data columns in the table below provide information about hypothetical account values and hypothetical expenses based on the Fund’s actual expense ratio and an assumed rate of return of 5% per year before expenses, which is not the Fund’s actual return. The hypothetical account values and expenses may not be used to estimate the actual ending account balances or expenses you paid for the six-month period shown. You may use this information to compare the ongoing costs of investing in the Fund with the ongoing costs of investing in other mutual funds. To do so, compare this 5% hypothetical example with the 5% hypothetical examples that appear in the shareholder reports of the other mutual funds.
Please note that the expenses shown in the table are meant to highlight your ongoing costs only and do not reflect any transactional costs, such as exchange fees or sales charges (loads). Therefore, the fourth and fifth data columns of the table are useful in comparing ongoing costs only and will not help you determine the relative total costs of owning different funds. In addition, if these transactional costs were included, your costs would have been higher.
| Share Class | Beginning
Account
Value
5/1/22 | Ending Account
Value (Based
on Actual
Returns and
Expenses)
10/31/22 | Expenses
Paid
During
Period1 | Ending Account
Value (Based
on Hypothetical
5% Annualized
Return and
Actual Expenses)
10/31/22 | Expenses
Paid
During
Period1 | Net Expense
Ratio
During
Period2 |
| Class A Shares | $1,000.00 | $962.60 | $4.75 | $1,020.37 | $4.89 | 0.96% |
| Investor Class Shares | $1,000.00 | $964.20 | $5.40 | $1,019.71 | $5.55 | 1.09% |
| Class B Shares | $1,000.00 | $959.50 | $9.09 | $1,015.93 | $9.35 | 1.84% |
| Class C Shares | $1,000.00 | $959.50 | $9.09 | $1,015.93 | $9.35 | 1.84% |
| Class I Shares | $1,000.00 | $963.90 | $3.51 | $1,021.63 | $3.62 | 0.71% |
| Class R1 Shares | $1,000.00 | $963.20 | $4.01 | $1,021.12 | $4.13 | 0.81% |
| Class R2 Shares | $1,000.00 | $962.10 | $5.24 | $1,019.86 | $5.40 | 1.06% |
| Class R3 Shares | $1,000.00 | $962.50 | $6.48 | $1,018.60 | $6.67 | 1.31% |
| Class R6 Shares | $1,000.00 | $964.60 | $2.87 | $1,022.28 | $2.96 | 0.58% |
| SIMPLE Class Shares | $1,000.00 | $961.10 | $6.62 | $1,018.45 | $6.82 | 1.34% |
| 1. | Expenses are equal to the Fund’s annualized expense ratio of each class multiplied by the average account value over the period, divided by 365 and multiplied by 184 (to reflect the six-month period). The table above represents the actual expenses incurred during the six-month period. In addition to the fees and expenses which the Fund bears directly, it also indirectly bears a pro rata share of the fees and expenses of the underlying funds in which it invests. Such indirect expenses are not included in the above-reported expense figures. |
| 2. | Expenses are equal to the Fund's annualized expense ratio to reflect the six-month period. |
Portfolio Composition as of October 31, 2022 (Unaudited)
‡ Less than one-tenth of percent.
See Portfolio of Investments beginning on page 11 for specific holdings within these categories. The Fund's holdings are subject to change.
Top Ten Holdings and/or Issuers Held as of October 31, 2022 (excluding short-term investments) (Unaudited)
| 1. | CCO Holdings LLC, 4.25%-5.375%, due 5/1/27–1/15/34 |
| 2. | HCA, Inc., 3.50%-8.36%, due 4/15/24–11/6/33 |
| 3. | Carnival Corp., 4.00%-10.50%, due 2/1/26–5/1/29 |
| 4. | TransDigm, Inc., 4.625%-8.00%, due 12/15/25–5/1/29 |
| 5. | MSCI, Inc., 3.25%-4.00%, due 11/15/29–8/15/33 |
| 6. | VICI Properties LP, 3.875%-5.75%, due 5/1/24–2/15/29 |
| 7. | Yum! Brands, Inc., 3.625%-5.375%, due 1/15/30–4/1/32 |
| 8. | Sprint Capital Corp., 6.875%, due 11/15/28 |
| 9. | Gulfport Energy Corp. |
| 10. | T-Mobile US, Inc., 2.625%-5.375%, due 4/15/27–2/15/31 |
| 8 | MainStay MacKay High Yield Corporate Bond Fund |
Portfolio Management Discussion and Analysis (Unaudited)
Questions answered by portfolio manager Andrew Susser of MacKay Shields LLC, the Fund’s Subadvisor.
How did MainStay MacKay High Yield Corporate Bond Fund perform relative to its benchmark and peer group during the 12 months ended October 31, 2022?
For the 12 months ended October 31, 2022, Class I shares of MainStay MacKay High Yield Corporate Bond Fund returned −8.65%, outperforming the −11.45% return of the Fund’s benchmark, the ICE BofA U.S. High Yield Constrained Index (the “Index”). Over the same period, Class I shares also outperformed the −11.11% return of the Morningstar High Yield Bond Category Average.1
What factors affected the Fund’s relative performance during the reporting period?
The high-yield market finished 2021 on a high note, with the Index up over 1.8% in December. However, the positive sentiment at the end of 2021 did not spill over into the new year, as risk assets sold-off on inflationary fears, expected tighter monetary policy and the mounting tensions and eventual Russian invasion of Ukraine. The selling pressure in risk assets picked up steam in the second quarter of 2022 as interest rate fears gave way to fears of a recession; the Index declined 9.97%, while the S&P 500® Index of U.S. large-cap equities fell 16.11%.
The high-yield market started the third quarter in rally mode and was up almost 8% for the first half of the quarter, before inflation and employment data led to dramatically higher rates. The 5-Year Treasury rate increased 105 basis points to 4.06% by the end of the quarter. (A basis point is one one-hundredth of a percentage point.) Relatively speaking, the high-yield market (−0.68%) performed well compared to the S&P 500® Index2 and the Bloomberg U.S. Aggregate Bond Index,3 which declined 5.28% and 4.75%, respectively during the quarter. By the end of the reporting period, the Index had declined about 12%, while the average dollar price on the Index was below $86.
Although total returns were negative in this challenging environment, the Fund outperformed the Index, largely due to
strong security selection, a lower duration, and underweight exposure to CCC-rated4 credits.
During the reporting period, were there any market events that materially impacted the Fund’s performance or liquidity?
As described above, the sell-off in risk assets, coupled with a sharp move higher in Treasury yields, had a negative impact on the high-yield market during the reporting period.
What was the Fund’s duration5 strategy during the reporting period?
The Fund’s duration is the result of our bottom-up fundamental analysis and is a residual of the investment process. However, the Fund maintained a lower duration than the Index throughout the reporting period, which was beneficial to returns. As of October 31, 2022, the Fund’s modified duration to worst6 was 3.75 years, while the modified duration to worst of the Index was 4.41 years.
During the reporting period, which sectors were the strongest positive contributors to the Fund’s relative performance and which sectors were particularly weak?
Security selection and overweight exposure to the energy sector compared to the Index made the largest contributions to the Fund’s relative returns during the reporting period. (Contributions take weightings and total returns into account.) Credits from oil & gas exploration & production companies Talos Energy and Chord Energy were two of the Fund’s better performers. Additionally, security selection in health care and retail contributed positively, as did an underweight position and strong selection in telecommunications. Conversely, security selection in services and leisure detracted from relative returns.
| 1. | See page 5 for other share class returns, which may be higher or lower than Class I share returns. See page 6 for more information on benchmark and peer group returns. |
| 2. | The S&P 500® Index is widely regarded as the standard index for measuring large-cap U.S. stock market performance. |
| 3. | The Bloomberg U.S. Aggregate Bond Index is a broad-based benchmark that measures the performance of the investment grade, U.S. dollar-denominated, fixed-rate taxable bond market, including Treasurys, government-related and corporate securities, mortgage-backed securities (agency fixed-rate and hybrid adjustable rate mortgage pass-throughs), asset-backed securities, and commercial mortgage-backed securities. |
| 4. | An obligation rated ‘CCC’ by Standard & Poor’s (“S&P”) is deemed by S&P to be currently vulnerable to nonpayment and is dependent upon favorable business, financial and economic conditions for the obligor to meet its financial commitment on the obligation. It is the opinion of S&P that in the event of adverse business, financial or economic conditions, the obligor is not likely to have the capacity to meet its financial commitment on the obligation. When applied to Fund holdings, ratings are based solely on the creditworthiness of the bonds in the portfolio and are not meant to represent the security or safety of the Fund. |
| 5. | Duration is a measure of the price sensitivity of a fixed-income investment to changes in interest rates. Duration is expressed as a number of years and is considered a more accurate sensitivity gauge than average maturity. |
| 6. | Modified duration is inversely related to the approximate percentage change in price for a given change in yield. Duration to worst is the duration of a bond computed using the bond’s nearest call date or maturity, whichever comes first. This measure ignores future cash flow fluctuations due to embedded optionality. |
From a credit-quality perspective, the Fund’s underweight exposure to BB-rated7 instruments with long maturities contributed positively to relative performance, as those bonds were negatively impacted by the sharp rise in Treasury yields. Underweight exposure to CCC-rated bonds and strong selection in the group also proved beneficial, since they were particularly vulnerable to a slowing economy and the sell-off in equity markets.
What were some of the Fund’s largest purchases and sales during the reporting period?
During the reporting period, we sold the Fund’s entire positions in real estate investment trust MGM Growth Properties, media company Meredith and data analytics company Nielsen Holdings. The Fund initiated positions in energy company Summit Midstream Partners, computer security software company MacAfee and chemicals manufacturer LSB Industries.
How did the Fund’s sector weightings change during the reporting period?
During the reporting period there were no material changes to the Fund’s sector weightings. On the margin, we slightly increased exposure to the health care, leisure and retail sectors, and we trimmed holdings in the media, services and automotive sectors.
How was the Fund positioned at the end of the reporting period?
As of October 31, 2022, the Fund held overweight exposure relative to the Index in the energy, materials and health care sectors, and underweight exposure in the telecommunications, technology and financials sectors.
| 7. | An obligation rated ‘BB’ is deemed by S&P to be less vulnerable to nonpayment than other speculative issues. In the opinion of S&P, however, the obligor faces major ongoing uncertainties or exposure to adverse business, financial or economic conditions which could lead to the obligor’s inadequate capacity to meet its financial commitment on the obligation. When applied to Fund holdings, ratings are based solely on the creditworthiness of the bonds in the portfolio and are not meant to represent the security or safety of the Fund. |
The opinions expressed are those of the portfolio manager as of the date of this report and are subject to change. There is no guarantee that any forecasts will come to pass. This material does not constitute investment advice and is not intended as an endorsement of any specific investment.
| 10 | MainStay MacKay High Yield Corporate Bond Fund |
Portfolio of Investments October 31, 2022†
| | Principal
Amount | Value |
| Long-Term Bonds 90.8% |
| Convertible Bonds 1.3% |
| Investment Companies 0.2% |
| Ares Capital Corp. | | |
| 4.625%, due 3/1/24 | $ 14,285,000 | $ 15,561,722 |
| Media 0.5% |
| DISH Network Corp. | | |
| 2.375%, due 3/15/24 | 37,079,000 | 33,769,699 |
| 3.375%, due 8/15/26 | 30,780,000 | 21,361,320 |
| | | 55,131,019 |
| Oil & Gas 0.3% |
| Gulfport Energy Operating Corp. | | |
| 10.00% (10.00% Cash or 15.00% PIK), due 12/29/49 (a)(b) | 4,051,000 | 24,961,452 |
| Oil & Gas Services 0.3% |
| Forum Energy Technologies, Inc. | | |
| 9.00% (6.25% Cash and 2.75% PIK), due 8/4/25 (b) | 34,886,987 | 34,712,909 |
Total Convertible Bonds
(Cost $114,454,674) | | 130,367,102 |
| Corporate Bonds 86.1% |
| Advertising 1.1% |
| Lamar Media Corp. | | |
| 3.625%, due 1/15/31 | 38,590,000 | 31,450,850 |
| 3.75%, due 2/15/28 | 21,000,000 | 18,429,600 |
| 4.00%, due 2/15/30 | 18,500,000 | 15,708,535 |
| 4.875%, due 1/15/29 | 5,000,000 | 4,523,500 |
| Outfront Media Capital LLC (c) | | |
| 4.25%, due 1/15/29 | 8,475,000 | 6,991,875 |
| 4.625%, due 3/15/30 | 6,305,000 | 5,215,559 |
| 5.00%, due 8/15/27 | 19,500,000 | 17,554,095 |
| 6.25%, due 6/15/25 | 15,216,000 | 15,004,650 |
| | | 114,878,664 |
| Aerospace & Defense 1.9% |
| F-Brasile SpA | | |
| Series XR | | |
| 7.375%, due 8/15/26 (c) | 23,280,000 | 18,391,200 |
| Rolls-Royce plc | | |
| 5.75%, due 10/15/27 (c) | 7,000,000 | 6,334,790 |
| TransDigm UK Holdings plc | | |
| 6.875%, due 5/15/26 | 18,100,000 | 17,665,871 |
| | Principal
Amount | Value |
| |
| Aerospace & Defense (continued) |
| TransDigm, Inc. | | |
| 4.625%, due 1/15/29 | $ 31,700,000 | $ 26,993,501 |
| 4.875%, due 5/1/29 | 22,920,000 | 19,487,845 |
| 6.25%, due 3/15/26 (c) | 84,230,000 | 83,085,314 |
| 7.50%, due 3/15/27 | 11,915,000 | 11,740,803 |
| 8.00%, due 12/15/25 (c) | 13,000,000 | 13,227,500 |
| | | 196,926,824 |
| Agriculture 0.0% ‡ |
| Darling Ingredients, Inc. | | |
| 6.00%, due 6/15/30 (c) | 2,025,000 | 1,949,063 |
| Airlines 1.0% |
| American Airlines, Inc. (c) | | |
| 5.50%, due 4/20/26 | 16,200,000 | 15,427,612 |
| 5.75%, due 4/20/29 | 11,500,000 | 10,465,000 |
| Delta Air Lines, Inc. | | |
| 4.50%, due 10/20/25 (c) | 17,200,000 | 16,760,312 |
| 4.75%, due 10/20/28 (c) | 23,500,000 | 21,861,726 |
| 7.00%, due 5/1/25 (c) | 3,506,000 | 3,554,337 |
| 7.375%, due 1/15/26 | 7,000,000 | 7,146,930 |
| Mileage Plus Holdings LLC | | |
| 6.50%, due 6/20/27 (c) | 17,964,500 | 17,759,794 |
| Spirit Loyalty Cayman Ltd. | | |
| 8.00%, due 9/20/25 (c) | 4,487,951 | 4,558,861 |
| | | 97,534,572 |
| Auto Manufacturers 1.7% |
| Ford Holdings LLC | | |
| 9.30%, due 3/1/30 | 30,695,000 | 34,378,400 |
| Ford Motor Co. | | |
| 6.10%, due 8/19/32 | 7,730,000 | 7,075,308 |
| Ford Motor Credit Co. LLC | | |
| 3.375%, due 11/13/25 | 12,000,000 | 10,886,520 |
| 4.00%, due 11/13/30 | 25,000,000 | 20,219,500 |
| 4.125%, due 8/17/27 | 2,000,000 | 1,776,100 |
| 4.271%, due 1/9/27 | 7,500,000 | 6,771,675 |
| 4.389%, due 1/8/26 | 2,500,000 | 2,306,723 |
| 5.125%, due 6/16/25 | 13,000,000 | 12,542,400 |
| 5.584%, due 3/18/24 | 3,660,000 | 3,604,671 |
| General Motors Financial Co., Inc. | | |
| 4.35%, due 4/9/25 | 5,000,000 | 4,793,451 |
| 5.25%, due 3/1/26 | 10,000,000 | 9,690,033 |
| JB Poindexter & Co., Inc. | | |
| 7.125%, due 4/15/26 (c) | 51,815,000 | 49,391,612 |
| PM General Purchaser LLC | | |
| 9.50%, due 10/1/28 (c) | 15,000,000 | 12,895,687 |
| | | 176,332,080 |
The notes to the financial statements are an integral part of, and should be read in conjunction with, the financial statements.
11
Portfolio of Investments October 31, 2022† (continued)
| | Principal
Amount | Value |
| Corporate Bonds (continued) |
| Auto Parts & Equipment 1.8% |
| Adient Global Holdings Ltd. | | |
| 4.875%, due 8/15/26 (c) | $ 24,525,000 | $ 21,949,875 |
| Dealer Tire LLC | | |
| 8.00%, due 2/1/28 (c) | 19,640,000 | 17,177,126 |
| IHO Verwaltungs GmbH (b)(c) | | |
| 4.75% (4.75% Cash or 5.50% PIK), due 9/15/26 | 34,785,000 | 29,293,044 |
| 6.00% (6.00% Cash or 6.75% PIK), due 5/15/27 | 41,874,000 | 35,959,298 |
| 6.375% (6.375% Cash or 7.125% PIK), due 5/15/29 | 38,980,000 | 33,262,803 |
| Real Hero Merger Sub 2, Inc. | | |
| 6.25%, due 2/1/29 (c) | 40,945,000 | 29,354,509 |
| Tenneco, Inc. | | |
| 7.875%, due 1/15/29 (c) | 12,000,000 | 11,854,862 |
| | | 178,851,517 |
| Biotechnology 0.1% |
| Emergent BioSolutions, Inc. | | |
| 3.875%, due 8/15/28 (c) | 5,495,000 | 3,294,472 |
| Grifols Escrow Issuer SA | | |
| 4.75%, due 10/15/28 (c) | 11,595,000 | 9,058,594 |
| | | 12,353,066 |
| Building Materials 1.3% |
| Builders FirstSource, Inc. | | |
| 6.375%, due 6/15/32 (c) | 12,850,000 | 11,818,145 |
| James Hardie International Finance DAC | | |
| 5.00%, due 1/15/28 (c) | 31,840,000 | 28,795,038 |
| Koppers, Inc. | | |
| 6.00%, due 2/15/25 (c) | 29,475,000 | 26,380,125 |
| New Enterprise Stone & Lime Co., Inc. | | |
| 5.25%, due 7/15/28 (c) | 10,300,000 | 8,961,000 |
| PGT Innovations, Inc. | | |
| 4.375%, due 10/1/29 (c) | 16,000,000 | 13,269,600 |
| Summit Materials LLC (c) | | |
| 5.25%, due 1/15/29 | 16,775,000 | 15,319,098 |
| 6.50%, due 3/15/27 | 22,730,000 | 21,810,179 |
| | | 126,353,185 |
| Chemicals 2.5% |
| ASP Unifrax Holdings, Inc. (c) | | |
| 5.25%, due 9/30/28 | 18,610,000 | 14,790,317 |
| 7.50%, due 9/30/29 | 21,280,000 | 14,257,600 |
| Avient Corp. | | |
| 5.25%, due 3/15/23 | 26,406,000 | 26,338,891 |
| | Principal
Amount | Value |
| |
| Chemicals (continued) |
| Avient Corp. (continued) | | |
| 5.75%, due 5/15/25 (c) | $ 8,550,000 | $ 8,369,766 |
| 7.125%, due 8/1/30 (c) | 13,415,000 | 12,828,362 |
| Cheever Escrow Issuer LLC | | |
| 7.125%, due 10/1/27 (c) | 7,400,000 | 6,793,200 |
| CVR Partners LP | | |
| 6.125%, due 6/15/28 (c) | 6,175,000 | 5,586,893 |
| GPD Cos., Inc. | | |
| 10.125%, due 4/1/26 (c) | 32,307,000 | 28,883,711 |
| Innophos Holdings, Inc. | | |
| 9.375%, due 2/15/28 (c) | 29,011,000 | 27,620,213 |
| Iris Holdings, Inc. | | |
| 8.75% (8.75% Cash or 9.50% PIK), due 2/15/26 (b)(c) | 21,105,000 | 18,557,788 |
| Mativ Holdings, Inc. | | |
| 6.875%, due 10/1/26 (c) | 12,500,000 | 11,453,842 |
| NOVA Chemicals Corp. (c) | | |
| 4.875%, due 6/1/24 | 9,810,000 | 9,540,225 |
| 5.25%, due 6/1/27 | 15,600,000 | 13,924,248 |
| SCIH Salt Holdings, Inc. (c) | | |
| 4.875%, due 5/1/28 | 8,000,000 | 6,943,960 |
| 6.625%, due 5/1/29 | 26,055,000 | 20,912,883 |
| SCIL IV LLC | | |
| 5.375%, due 11/1/26 (c) | 11,200,000 | 8,903,216 |
| SK Invictus Intermediate II SARL | | |
| 5.00%, due 10/30/29 (c) | 26,085,000 | 21,334,139 |
| | | 257,039,254 |
| Coal 0.1% |
| Coronado Finance Pty. Ltd. | | |
| 10.75%, due 5/15/26 (c) | 9,820,000 | 10,225,075 |
| Commercial Services 2.6% |
| AMN Healthcare, Inc. | | |
| 4.625%, due 10/1/27 (c) | 5,500,000 | 5,145,745 |
| Ashtead Capital, Inc. (c) | | |
| 4.00%, due 5/1/28 | 10,900,000 | 9,570,637 |
| 4.25%, due 11/1/29 | 7,000,000 | 6,087,943 |
| Cimpress plc | | |
| 7.00%, due 6/15/26 (c) | 11,740,000 | 7,014,650 |
| Gartner, Inc. (c) | | |
| 3.75%, due 10/1/30 | 19,870,000 | 16,690,717 |
| 4.50%, due 7/1/28 | 4,000,000 | 3,706,920 |
| Graham Holdings Co. | | |
| 5.75%, due 6/1/26 (c) | 39,695,000 | 38,702,625 |
| HealthEquity, Inc. | | |
| 4.50%, due 10/1/29 (c) | 4,000,000 | 3,495,000 |
The notes to the financial statements are an integral part of, and should be read in conjunction with, the financial statements.
| 12 | MainStay MacKay High Yield Corporate Bond Fund |
| | Principal
Amount | Value |
| Corporate Bonds (continued) |
| Commercial Services (continued) |
| Korn Ferry | | |
| 4.625%, due 12/15/27 (c) | $ 10,685,000 | $ 9,719,717 |
| MPH Acquisition Holdings LLC (c) | | |
| 5.50%, due 9/1/28 | 11,150,000 | 9,625,245 |
| 5.75%, due 11/1/28 | 19,705,000 | 15,222,113 |
| NESCO Holdings II, Inc. | | |
| 5.50%, due 4/15/29 (c) | 14,440,000 | 12,657,671 |
| Ritchie Bros Auctioneers, Inc. | | |
| 5.375%, due 1/15/25 (c) | 30,925,000 | 30,461,125 |
| Service Corp. International | | |
| 3.375%, due 8/15/30 | 10,000,000 | 8,072,242 |
| United Rentals North America, Inc. | | |
| 3.75%, due 1/15/32 | 8,000,000 | 6,480,000 |
| 3.875%, due 2/15/31 | 17,500,000 | 14,507,500 |
| 4.875%, due 1/15/28 | 10,700,000 | 9,951,000 |
| 5.25%, due 1/15/30 | 3,500,000 | 3,246,250 |
| Williams Scotsman International, Inc. (c) | | |
| 4.625%, due 8/15/28 | 16,700,000 | 15,082,605 |
| 6.125%, due 6/15/25 | 17,550,000 | 17,515,426 |
| WW International, Inc. | | |
| 4.50%, due 4/15/29 (c) | 36,685,000 | 20,167,657 |
| | | 263,122,788 |
| Computers 0.3% |
| Condor Merger Sub, Inc. | | |
| 7.375%, due 2/15/30 (c) | 42,125,000 | 34,840,463 |
| Cosmetics & Personal Care 0.3% |
| Edgewell Personal Care Co. (c) | | |
| 4.125%, due 4/1/29 | 22,500,000 | 19,216,237 |
| 5.50%, due 6/1/28 | 13,505,000 | 12,701,858 |
| | | 31,918,095 |
| Distribution & Wholesale 0.3% |
| G-III Apparel Group Ltd. | | |
| 7.875%, due 8/15/25 (c) | 22,000,000 | 20,836,860 |
| H&E Equipment Services, Inc. | | |
| 3.875%, due 12/15/28 (c) | 10,525,000 | 8,893,309 |
| | | 29,730,169 |
| Diversified Financial Services 2.2% |
| AG TTMT Escrow Issuer LLC | | |
| 8.625%, due 9/30/27 (c) | 19,690,000 | 19,763,837 |
| Credit Acceptance Corp. | | |
| 5.125%, due 12/31/24 (c) | 15,215,000 | 14,148,136 |
| 6.625%, due 3/15/26 | 32,875,000 | 31,096,462 |
| | Principal
Amount | Value |
| |
| Diversified Financial Services (continued) |
| Enact Holdings, Inc. | | |
| 6.50%, due 8/15/25 (c) | $ 25,600,000 | $ 25,218,560 |
| Jane Street Group | | |
| 4.50%, due 11/15/29 (c) | 3,000,000 | 2,651,580 |
| Jefferies Finance LLC | | |
| 5.00%, due 8/15/28 (c) | 37,570,000 | 29,493,577 |
| LPL Holdings, Inc. (c) | | |
| 4.00%, due 3/15/29 | 29,810,000 | 26,017,870 |
| 4.375%, due 5/15/31 | 11,000,000 | 9,580,615 |
| 4.625%, due 11/15/27 | 13,650,000 | 12,571,255 |
| Oxford Finance LLC | | |
| 6.375%, due 2/1/27 (c) | 9,830,000 | 8,994,450 |
| PennyMac Financial Services, Inc. (c) | | |
| 4.25%, due 2/15/29 | 13,000,000 | 9,847,500 |
| 5.75%, due 9/15/31 | 9,500,000 | 7,153,437 |
| PRA Group, Inc. | | |
| 7.375%, due 9/1/25 (c) | 16,400,000 | 15,687,328 |
| Radian Group, Inc. | | |
| 4.875%, due 3/15/27 | 5,000,000 | 4,423,950 |
| StoneX Group, Inc. | | |
| 8.625%, due 6/15/25 (c) | 8,196,000 | 8,093,550 |
| | | 224,742,107 |
| Electric 1.6% |
| Clearway Energy Operating LLC | | |
| 4.75%, due 3/15/28 (c) | 22,940,000 | 21,189,611 |
| DPL, Inc. | | |
| 4.125%, due 7/1/25 | 20,325,000 | 19,187,207 |
| Keystone Power Pass-Through Holders LLC | | |
| 13.00% (1.00% Cash and 12.00% PIK), due 6/1/24 (a)(b)(c) | 7,889,279 | 4,733,567 |
| Leeward Renewable Energy Operations LLC | | |
| 4.25%, due 7/1/29 (c) | 16,665,000 | 13,498,650 |
| NextEra Energy Operating Partners LP | | |
| 3.875%, due 10/15/26 (c) | 16,330,000 | 15,137,094 |
| NRG Energy, Inc. | | |
| 6.625%, due 1/15/27 | 3,220,000 | 3,221,449 |
| Pattern Energy Operations LP | | |
| 4.50%, due 8/15/28 (c) | 17,500,000 | 15,737,971 |
| PG&E Corp. | | |
| 5.00%, due 7/1/28 | 19,460,000 | 17,539,201 |
| 5.25%, due 7/1/30 | 13,000,000 | 11,511,435 |
The notes to the financial statements are an integral part of, and should be read in conjunction with, the financial statements.
13
Portfolio of Investments October 31, 2022† (continued)
| | Principal
Amount | Value |
| Corporate Bonds (continued) |
| Electric (continued) |
| Vistra Corp. (c)(d)(e) | | |
| 7.00% (5 Year Treasury Constant Maturity Rate + 5.74%), due 12/15/26 | $ 11,280,000 | $ 9,978,342 |
| 8.00% (5 Year Treasury Constant Maturity Rate + 6.93%), due 10/15/26 | 31,800,000 | 30,210,000 |
| | | 161,944,527 |
| Electrical Components & Equipment 0.1% |
| WESCO Distribution, Inc. | | |
| 7.125%, due 6/15/25 (c) | 6,665,000 | 6,729,651 |
| Engineering & Construction 0.5% |
| Great Lakes Dredge & Dock Corp. | | |
| 5.25%, due 6/1/29 (c) | 13,000,000 | 10,279,931 |
| Railworks Holdings LP | | |
| 8.25%, due 11/15/28 (c) | 9,425,000 | 8,661,934 |
| TopBuild Corp. | | |
| 4.125%, due 2/15/32 (c) | 16,250,000 | 12,723,318 |
| Weekley Homes LLC | | |
| 4.875%, due 9/15/28 (c) | 21,580,000 | 17,381,783 |
| | | 49,046,966 |
| Entertainment 2.8% |
| Affinity Gaming | | |
| 6.875%, due 12/15/27 (c) | 12,640,000 | 10,551,268 |
| Allen Media LLC | | |
| 10.50%, due 2/15/28 (c) | 14,870,000 | 6,026,068 |
| Boyne USA, Inc. | | |
| 4.75%, due 5/15/29 (c) | 9,465,000 | 8,281,875 |
| CCM Merger, Inc. | | |
| 6.375%, due 5/1/26 (c) | 5,000,000 | 4,560,709 |
| CDI Escrow Issuer, Inc. | | |
| 5.75%, due 4/1/30 (c) | 20,000,000 | 18,050,200 |
| Churchill Downs, Inc. (c) | | |
| 4.75%, due 1/15/28 | 53,025,000 | 46,859,253 |
| 5.50%, due 4/1/27 | 38,727,000 | 37,014,492 |
| International Game Technology plc | | |
| 6.25%, due 1/15/27 (c) | 25,700,000 | 25,462,532 |
| Jacobs Entertainment, Inc. | | |
| 6.75%, due 2/15/29 (c) | 25,354,000 | 22,353,861 |
| Live Nation Entertainment, Inc. | | |
| 6.50%, due 5/15/27 (c) | 39,280,000 | 39,068,367 |
| Merlin Entertainments Ltd. | | |
| 5.75%, due 6/15/26 (c) | 35,100,000 | 32,639,306 |
| | Principal
Amount | Value |
| |
| Entertainment (continued) |
| Midwest Gaming Borrower LLC | | |
| 4.875%, due 5/1/29 (c) | $ 6,000,000 | $ 5,073,826 |
| Motion Bondco DAC | | |
| 6.625%, due 11/15/27 (c) | 15,100,000 | 12,632,358 |
| Vail Resorts, Inc. | | |
| 6.25%, due 5/15/25 (c) | 10,095,000 | 10,044,525 |
| | | 278,618,640 |
| Food 1.6% |
| B&G Foods, Inc. | | |
| 5.25%, due 4/1/25 | 24,375,000 | 22,151,269 |
| Kraft Heinz Foods Co. | | |
| 3.875%, due 5/15/27 | 10,000,000 | 9,369,528 |
| 6.50%, due 2/9/40 | 18,749,000 | 18,923,113 |
| 6.875%, due 1/26/39 | 31,650,000 | 32,582,309 |
| Lamb Weston Holdings, Inc. | | |
| 4.875%, due 5/15/28 (c) | 5,000,000 | 4,647,840 |
| Land O'Lakes Capital Trust I | | |
| 7.45%, due 3/15/28 (c) | 18,586,000 | 18,493,070 |
| Nathan's Famous, Inc. | | |
| 6.625%, due 11/1/25 (c) | 2,934,000 | 2,912,745 |
| Post Holdings, Inc. | | |
| 5.50%, due 12/15/29 (c) | 3,000,000 | 2,699,760 |
| Simmons Foods, Inc. | | |
| 4.625%, due 3/1/29 (c) | 22,340,000 | 18,641,236 |
| TreeHouse Foods, Inc. | | |
| 4.00%, due 9/1/28 | 14,000,000 | 11,812,500 |
| United Natural Foods, Inc. | | |
| 6.75%, due 10/15/28 (c) | 22,868,000 | 22,087,515 |
| | | 164,320,885 |
| Food Service 0.3% |
| Aramark Services, Inc. | | |
| 6.375%, due 5/1/25 (c) | 26,315,000 | 26,032,311 |
| Forest Products & Paper 0.8% |
| Glatfelter Corp. | | |
| 4.75%, due 11/15/29 (c) | 9,550,000 | 6,147,813 |
| Mercer International, Inc. | | |
| 5.125%, due 2/1/29 | 39,710,000 | 32,611,837 |
| 5.50%, due 1/15/26 | 2,585,000 | 2,421,769 |
| Smurfit Kappa Treasury Funding DAC | | |
| 7.50%, due 11/20/25 | 36,120,000 | 37,713,431 |
| | | 78,894,850 |
| Gas 0.5% |
| AmeriGas Partners LP | | |
| 5.625%, due 5/20/24 | 15,106,000 | 14,761,333 |
The notes to the financial statements are an integral part of, and should be read in conjunction with, the financial statements.
| 14 | MainStay MacKay High Yield Corporate Bond Fund |
| | Principal
Amount | Value |
| Corporate Bonds (continued) |
| Gas (continued) |
| AmeriGas Partners LP (continued) | | |
| 5.75%, due 5/20/27 | $ 13,560,000 | $ 12,504,761 |
| 5.875%, due 8/20/26 | 25,075,000 | 23,457,714 |
| | | 50,723,808 |
| Hand & Machine Tools 0.1% |
| Werner FinCo LP | | |
| 8.75%, due 7/15/25 (c) | 13,030,000 | 11,010,350 |
| Healthcare-Products 1.2% |
| Garden Spinco Corp. | | |
| 8.625%, due 7/20/30 (c) | 15,500,000 | 15,942,606 |
| Hologic, Inc. (c) | | |
| 3.25%, due 2/15/29 | 39,100,000 | 33,227,180 |
| 4.625%, due 2/1/28 | 10,205,000 | 9,541,675 |
| Teleflex, Inc. | | |
| 4.25%, due 6/1/28 (c) | 43,155,000 | 39,046,644 |
| 4.625%, due 11/15/27 | 5,000,000 | 4,711,750 |
| Varex Imaging Corp. | | |
| 7.875%, due 10/15/27 (c) | 16,202,000 | 15,812,521 |
| | | 118,282,376 |
| Healthcare-Services 5.0% |
| Acadia Healthcare Co., Inc. (c) | | |
| 5.00%, due 4/15/29 | 10,000,000 | 9,024,500 |
| 5.50%, due 7/1/28 | 10,840,000 | 10,057,352 |
| Catalent Pharma Solutions, Inc. (c) | | |
| 3.125%, due 2/15/29 | 27,560,000 | 22,552,348 |
| 3.50%, due 4/1/30 | 16,655,000 | 13,448,913 |
| 5.00%, due 7/15/27 | 15,395,000 | 14,473,917 |
| Centene Corp. | | |
| 3.00%, due 10/15/30 | 20,000,000 | 16,100,000 |
| 3.375%, due 2/15/30 | 5,000,000 | 4,154,000 |
| 4.625%, due 12/15/29 | 15,070,000 | 13,638,350 |
| CHS/Community Health Systems, Inc. | | |
| 5.25%, due 5/15/30 (c) | 13,100,000 | 9,071,750 |
| DaVita, Inc. (c) | | |
| 3.75%, due 2/15/31 | 10,000,000 | 7,230,300 |
| 4.625%, due 6/1/30 | 16,790,000 | 13,089,904 |
| Encompass Health Corp. | | |
| 4.50%, due 2/1/28 | 25,720,000 | 23,016,828 |
| 4.625%, due 4/1/31 | 8,200,000 | 6,765,000 |
| 4.75%, due 2/1/30 | 24,390,000 | 20,792,475 |
| HCA, Inc. | | |
| 3.50%, due 9/1/30 | 9,210,000 | 7,629,564 |
| 5.25%, due 4/15/25 | 7,000,000 | 6,879,515 |
| | Principal
Amount | Value |
| |
| Healthcare-Services (continued) |
| HCA, Inc. (continued) | | |
| 5.375%, due 2/1/25 | $ 26,525,000 | $ 26,190,122 |
| 5.375%, due 9/1/26 | 4,170,000 | 4,055,493 |
| 5.625%, due 9/1/28 | 10,000,000 | 9,606,724 |
| 5.875%, due 2/15/26 | 25,000,000 | 24,758,604 |
| 5.875%, due 2/1/29 | 4,565,000 | 4,456,036 |
| 7.50%, due 11/6/33 | 44,975,000 | 44,934,836 |
| 7.58%, due 9/15/25 | 11,020,000 | 11,400,363 |
| 7.69%, due 6/15/25 | 31,650,000 | 32,644,836 |
| 8.36%, due 4/15/24 | 4,524,000 | 4,623,150 |
| IQVIA, Inc. (c) | | |
| 5.00%, due 10/15/26 | 30,113,000 | 28,706,121 |
| 5.00%, due 5/15/27 | 5,000,000 | 4,764,400 |
| Legacy LifePoint Health LLC | | |
| 6.75%, due 4/15/25 (c) | 9,700,000 | 8,584,500 |
| LifePoint Health, Inc. | | |
| 5.375%, due 1/15/29 (c) | 17,978,000 | 11,485,425 |
| ModivCare Escrow Issuer, Inc. | | |
| 5.00%, due 10/1/29 (c) | 18,500,000 | 15,744,530 |
| ModivCare, Inc. | | |
| 5.875%, due 11/15/25 (c) | 8,410,000 | 7,988,873 |
| Molina Healthcare, Inc. (c) | | |
| 3.875%, due 11/15/30 | 13,500,000 | 11,472,262 |
| 3.875%, due 5/15/32 | 10,300,000 | 8,590,200 |
| 4.375%, due 6/15/28 | 6,335,000 | 5,681,608 |
| RegionalCare Hospital Partners Holdings, Inc. | | |
| 9.75%, due 12/1/26 (c) | 43,390,000 | 34,594,847 |
| Tenet Healthcare Corp. | | |
| 6.125%, due 6/15/30 (c) | 12,100,000 | 11,169,994 |
| | | 509,377,640 |
| Holding Companies-Diversified 0.4% |
| Stena International SA (c) | | |
| 5.75%, due 3/1/24 | 6,000,000 | 5,625,006 |
| 6.125%, due 2/1/25 | 34,995,000 | 32,736,241 |
| | | 38,361,247 |
| Home Builders 2.0% |
| Adams Homes, Inc. | | |
| 7.50%, due 2/15/25 (c) | 24,475,000 | 19,801,362 |
| Ashton Woods USA LLC | | |
| 6.625%, due 1/15/28 (c) | 5,000,000 | 4,245,326 |
| Brookfield Residential Properties, Inc. | | |
| 6.25%, due 9/15/27 (c) | 17,360,000 | 15,146,600 |
| Century Communities, Inc. | | |
| 3.875%, due 8/15/29 (c) | 16,245,000 | 12,793,587 |
| 6.75%, due 6/1/27 | 26,205,000 | 25,015,290 |
The notes to the financial statements are an integral part of, and should be read in conjunction with, the financial statements.
15
Portfolio of Investments October 31, 2022† (continued)
| | Principal
Amount | Value |
| Corporate Bonds (continued) |
| Home Builders (continued) |
| Installed Building Products, Inc. | | |
| 5.75%, due 2/1/28 (c) | $ 25,430,000 | $ 22,473,762 |
| M/I Homes, Inc. | | |
| 3.95%, due 2/15/30 | 7,950,000 | 5,903,562 |
| 4.95%, due 2/1/28 | 7,500,000 | 6,434,925 |
| Meritage Homes Corp. | | |
| 3.875%, due 4/15/29 (c) | 22,415,000 | 18,014,936 |
| 5.125%, due 6/6/27 | 8,515,000 | 7,624,360 |
| Shea Homes LP (c) | | |
| 4.75%, due 2/15/28 | 26,925,000 | 22,710,968 |
| 4.75%, due 4/1/29 | 9,875,000 | 8,050,298 |
| STL Holding Co. LLC | | |
| 7.50%, due 2/15/26 (c) | 12,000,000 | 10,456,320 |
| Winnebago Industries, Inc. | | |
| 6.25%, due 7/15/28 (c) | 21,255,000 | 19,778,896 |
| | | 198,450,192 |
| Household Products & Wares 0.3% |
| Central Garden & Pet Co. | | |
| 4.125%, due 10/15/30 | 12,060,000 | 9,968,448 |
| 4.125%, due 4/30/31 (c) | 11,000,000 | 9,130,000 |
| Spectrum Brands, Inc. | | |
| 5.75%, due 7/15/25 | 7,787,000 | 7,683,277 |
| | | 26,781,725 |
| Housewares 0.2% |
| Newell Brands, Inc. | | |
| 4.875%, due 6/1/25 | 2,035,000 | 1,964,711 |
| Scotts Miracle-Gro Co. (The) | | |
| 4.00%, due 4/1/31 | 14,300,000 | 10,955,230 |
| 4.375%, due 2/1/32 | 5,430,000 | 4,109,613 |
| 4.50%, due 10/15/29 | 4,500,000 | 3,647,452 |
| | | 20,677,006 |
| Insurance 1.0% |
| BroadStreet Partners, Inc. | | |
| 5.875%, due 4/15/29 (c) | 11,800,000 | 9,470,367 |
| Fairfax Financial Holdings Ltd. | | |
| 8.30%, due 4/15/26 | 5,435,000 | 5,770,337 |
| Fidelity & Guaranty Life Holdings, Inc. | | |
| 5.50%, due 5/1/25 (c) | 14,850,000 | 14,516,041 |
| MGIC Investment Corp. | | |
| 5.25%, due 8/15/28 | 23,675,000 | 21,478,670 |
| NMI Holdings, Inc. | | |
| 7.375%, due 6/1/25 (c) | 16,000,000 | 15,984,640 |
| Ryan Specialty Group LLC | | |
| 4.375%, due 2/1/30 (c) | 6,500,000 | 5,557,500 |
| | Principal
Amount | Value |
| |
| Insurance (continued) |
| USI, Inc. | | |
| 6.875%, due 5/1/25 (c) | $ 26,670,000 | $ 25,869,479 |
| | | 98,647,034 |
| Internet 2.1% |
| Cars.com, Inc. | | |
| 6.375%, due 11/1/28 (c) | 21,200,000 | 18,369,376 |
| Netflix, Inc. | | |
| 4.875%, due 4/15/28 | 10,131,000 | 9,614,420 |
| 4.875%, due 6/15/30 (c) | 5,000,000 | 4,629,938 |
| 5.375%, due 11/15/29 (c) | 8,430,000 | 8,008,500 |
| 5.75%, due 3/1/24 | 24,961,000 | 24,961,000 |
| 5.875%, due 2/15/25 | 7,411,000 | 7,448,055 |
| 5.875%, due 11/15/28 | 32,450,000 | 32,206,625 |
| Northwest Fiber LLC | | |
| 4.75%, due 4/30/27 (c) | 5,500,000 | 4,944,164 |
| NortonLifeLock, Inc. (c) | | |
| 6.75%, due 9/30/27 | 10,000,000 | 9,857,950 |
| 7.125%, due 9/30/30 | 10,000,000 | 9,829,900 |
| Uber Technologies, Inc. (c) | | |
| 6.25%, due 1/15/28 | 4,125,000 | 3,918,750 |
| 7.50%, due 5/15/25 | 12,075,000 | 12,081,038 |
| 7.50%, due 9/15/27 | 23,710,000 | 23,704,520 |
| VeriSign, Inc. | | |
| 4.75%, due 7/15/27 | 19,419,000 | 18,618,031 |
| 5.25%, due 4/1/25 | 26,661,000 | 26,406,121 |
| | | 214,598,388 |
| Investment Companies 1.5% |
| Compass Group Diversified Holdings LLC (c) | | |
| 5.00%, due 1/15/32 | 12,250,000 | 8,928,713 |
| 5.25%, due 4/15/29 | 34,750,000 | 29,885,000 |
| FS Energy and Power Fund | | |
| 7.50%, due 8/15/23 (c) | 84,732,000 | 84,986,196 |
| Icahn Enterprises LP | | |
| 5.25%, due 5/15/27 | 13,130,000 | 12,097,851 |
| 6.25%, due 5/15/26 | 12,770,000 | 12,265,585 |
| | | 148,163,345 |
| Iron & Steel 1.0% |
| Allegheny Ludlum LLC | | |
| 6.95%, due 12/15/25 | 22,688,000 | 22,121,717 |
| Big River Steel LLC | | |
| 6.625%, due 1/31/29 (c) | 29,600,000 | 27,837,467 |
| Mineral Resources Ltd. (c) | | |
| 8.00%, due 11/1/27 | 3,500,000 | 3,442,985 |
The notes to the financial statements are an integral part of, and should be read in conjunction with, the financial statements.
| 16 | MainStay MacKay High Yield Corporate Bond Fund |
| | Principal
Amount | Value |
| Corporate Bonds (continued) |
| Iron & Steel (continued) |
Mineral Resources Ltd. (c)
(continued) | | |
| 8.125%, due 5/1/27 | $ 49,640,000 | $ 49,391,800 |
| 8.50%, due 5/1/30 | 1,159,000 | 1,139,707 |
| | | 103,933,676 |
| Leisure Time 2.1% |
| Carnival Corp. (c) | | |
| 4.00%, due 8/1/28 | 38,000,000 | 30,615,650 |
| 5.75%, due 3/1/27 | 69,855,000 | 48,408,467 |
| 6.00%, due 5/1/29 | 33,500,000 | 22,219,461 |
| 7.625%, due 3/1/26 | 14,160,000 | 10,647,612 |
| 9.875%, due 8/1/27 | 31,843,000 | 29,693,598 |
| 10.50%, due 2/1/26 | 29,445,000 | 28,854,922 |
| Carnival Holdings Bermuda Ltd. | | |
| 10.375%, due 5/1/28 (c) | 10,000,000 | 10,125,800 |
| Royal Caribbean Cruises Ltd. (c) | | |
| 5.375%, due 7/15/27 | 12,400,000 | 9,638,717 |
| 5.50%, due 4/1/28 | 22,000,000 | 16,940,000 |
| | | 207,144,227 |
| Lodging 1.8% |
| Boyd Gaming Corp. | | |
| 4.75%, due 12/1/27 | 38,570,000 | 35,535,312 |
| 4.75%, due 6/15/31 (c) | 47,500,000 | 40,125,150 |
| Hilton Domestic Operating Co., Inc. | | |
| 3.75%, due 5/1/29 (c) | 5,000,000 | 4,259,525 |
| 4.00%, due 5/1/31 (c) | 39,340,000 | 32,886,179 |
| 4.875%, due 1/15/30 | 26,250,000 | 23,526,563 |
| 5.375%, due 5/1/25 (c) | 5,000,000 | 4,925,000 |
| 5.75%, due 5/1/28 (c) | 12,500,000 | 12,062,500 |
| Hyatt Hotels Corp. (f) | | |
| 5.625%, due 4/23/25 | 7,715,000 | 7,579,566 |
| 6.00%, due 4/23/30 | 8,095,000 | 7,672,743 |
| Marriott International, Inc. | | |
| Series GG | | |
| 3.50%, due 10/15/32 | 9,200,000 | 7,347,934 |
| Series FF | | |
| 4.625%, due 6/15/30 | 3,000,000 | 2,691,161 |
| Station Casinos LLC | | |
| 4.50%, due 2/15/28 (c) | 7,000,000 | 6,030,500 |
| | | 184,642,133 |
| Machinery—Construction & Mining 0.3% |
| Terex Corp. | | |
| 5.00%, due 5/15/29 (c) | 7,000,000 | 6,244,350 |
| | Principal
Amount | Value |
| |
| Machinery—Construction & Mining (continued) |
| Vertiv Group Corp. | | |
| 4.125%, due 11/15/28 (c) | $ 32,405,000 | $ 28,188,461 |
| | | 34,432,811 |
| Machinery-Diversified 0.5% |
| Briggs & Stratton Corp. Escrow Claim Shares | | |
| 6.875%, due 12/15/20 (g)(h) | 9,200,000 | 92,000 |
| Stevens Holding Co., Inc. | | |
| 6.125%, due 10/1/26 (c) | 16,258,000 | 16,279,136 |
| TK Elevator Holdco GmbH | | |
| 7.625%, due 7/15/28 (c) | 12,126,000 | 10,022,442 |
| TK Elevator U.S. Newco, Inc. | | |
| 5.25%, due 7/15/27 (c) | 27,000,000 | 24,198,750 |
| | | 50,592,328 |
| Media 5.3% |
| Block Communications, Inc. | | |
| 4.875%, due 3/1/28 (c) | 15,000,000 | 13,035,450 |
| Cable One, Inc. | | |
| 4.00%, due 11/15/30 (c) | 37,800,000 | 30,765,420 |
| CCO Holdings LLC | | |
| 4.25%, due 2/1/31 (c) | 36,815,000 | 29,083,850 |
| 4.25%, due 1/15/34 (c) | 28,050,000 | 20,616,750 |
| 4.50%, due 8/15/30 (c) | 42,430,000 | 34,434,491 |
| 4.50%, due 5/1/32 | 42,900,000 | 33,891,000 |
| 4.50%, due 6/1/33 (c) | 14,500,000 | 10,995,504 |
| 4.75%, due 3/1/30 (c) | 31,835,000 | 26,754,134 |
| 5.00%, due 2/1/28 (c) | 22,000,000 | 19,910,000 |
| 5.125%, due 5/1/27 (c) | 41,225,000 | 38,194,138 |
| 5.375%, due 6/1/29 (c) | 13,495,000 | 12,056,163 |
| CSC Holdings LLC (c) | | |
| 5.75%, due 1/15/30 | 23,900,000 | 18,283,500 |
| 6.50%, due 2/1/29 | 7,000,000 | 6,597,500 |
| Diamond Sports Group LLC | | |
| 6.625%, due 8/15/27 (c) | 7,000,000 | 341,250 |
| DIRECTV Financing LLC | | |
| 5.875%, due 8/15/27 (c) | 34,000,000 | 30,620,400 |
| DISH DBS Corp. | | |
| 7.75%, due 7/1/26 | 18,675,000 | 15,757,778 |
| LCPR Senior Secured Financing DAC (c) | | |
| 5.125%, due 7/15/29 | 13,150,000 | 11,078,875 |
| 6.75%, due 10/15/27 | 48,312,000 | 45,050,940 |
| News Corp. (c) | | |
| 3.875%, due 5/15/29 | 42,070,000 | 36,159,165 |
| 5.125%, due 2/15/32 | 11,110,000 | 9,915,675 |
| Sirius XM Radio, Inc. (c) | | |
| 3.875%, due 9/1/31 | 6,000,000 | 4,800,000 |
The notes to the financial statements are an integral part of, and should be read in conjunction with, the financial statements.
17
Portfolio of Investments October 31, 2022† (continued)
| | Principal
Amount | Value |
| Corporate Bonds (continued) |
| Media (continued) |
| Sirius XM Radio, Inc. (c) (continued) | | |
| 4.00%, due 7/15/28 | $ 2,970,000 | $ 2,553,241 |
| 5.00%, due 8/1/27 | 8,000,000 | 7,360,000 |
| 5.50%, due 7/1/29 | 11,590,000 | 10,689,457 |
| Sterling Entertainment Enterprises LLC | | |
| 10.25%, due 1/15/25 (a)(h)(i) | 20,000,000 | 18,360,000 |
| Videotron Ltd. | | |
| 5.375%, due 6/15/24 (c) | 17,850,000 | 17,733,618 |
| Virgin Media Finance plc | | |
| 5.00%, due 7/15/30 (c) | 17,275,000 | 13,843,974 |
| VZ Secured Financing BV | | |
| 5.00%, due 1/15/32 (c) | 22,545,000 | 17,970,394 |
| | | 536,852,667 |
| Metal Fabricate & Hardware 0.3% |
| Advanced Drainage Systems, Inc. (c) | | |
| 5.00%, due 9/30/27 | 18,315,000 | 16,982,400 |
| 6.375%, due 6/15/30 | 12,615,000 | 12,191,010 |
| Park-Ohio Industries, Inc. | | |
| 6.625%, due 4/15/27 | 3,500,000 | 2,450,000 |
| | | 31,623,410 |
| Mining 1.8% |
| Arconic Corp. | | |
| 6.00%, due 5/15/25 (c) | 8,695,000 | 8,609,702 |
| Century Aluminum Co. | | |
| 7.50%, due 4/1/28 (c) | 28,550,000 | 24,494,758 |
| Compass Minerals International, Inc. (c) | | |
| 4.875%, due 7/15/24 | 7,000,000 | 6,632,986 |
| 6.75%, due 12/1/27 | 31,535,000 | 29,665,816 |
| Constellium SE | | |
| 3.75%, due 4/15/29 (c) | 10,000,000 | 7,820,000 |
| Eldorado Gold Corp. | | |
| 6.25%, due 9/1/29 (c) | 3,480,000 | 2,814,798 |
| First Quantum Minerals Ltd. (c) | | |
| 6.875%, due 10/15/27 | 14,000,000 | 13,017,585 |
| 7.50%, due 4/1/25 | 5,000,000 | 4,850,000 |
| IAMGOLD Corp. | | |
| 5.75%, due 10/15/28 (c) | 35,825,000 | 24,002,750 |
| Novelis Corp. (c) | | |
| 3.25%, due 11/15/26 | 22,500,000 | 19,692,826 |
| 3.875%, due 8/15/31 | 22,845,000 | 17,698,250 |
| 4.75%, due 1/30/30 | 31,800,000 | 27,015,531 |
| | | 186,315,002 |
| | Principal
Amount | Value |
| |
| Miscellaneous—Manufacturing 0.9% |
| Amsted Industries, Inc. (c) | | |
| 4.625%, due 5/15/30 | $ 2,100,000 | $ 1,732,500 |
| 5.625%, due 7/1/27 | 24,395,000 | 22,565,375 |
| EnPro Industries, Inc. | | |
| 5.75%, due 10/15/26 | 21,784,000 | 20,803,720 |
| FXI Holdings, Inc. | | |
| 7.875%, due 11/1/24 (c) | 1,195,000 | 1,025,286 |
| Gates Global LLC | | |
| 6.25%, due 1/15/26 (c) | 2,850,000 | 2,736,000 |
| Hillenbrand, Inc. | | |
| 5.00%, due 9/15/26 (f) | 5,000,000 | 4,707,435 |
| 5.75%, due 6/15/25 | 7,000,000 | 6,947,500 |
| LSB Industries, Inc. | | |
| 6.25%, due 10/15/28 (c) | 31,805,000 | 28,875,441 |
| | | 89,393,257 |
| Office Furnishings 0.1% |
| Interface, Inc. | | |
| 5.50%, due 12/1/28 (c) | 16,952,000 | 13,376,163 |
| Oil & Gas 6.4% |
| Ascent Resources Utica Holdings LLC (c) | | |
| 7.00%, due 11/1/26 | 14,500,000 | 14,282,500 |
| 9.00%, due 11/1/27 | 11,295,000 | 13,779,900 |
| California Resources Corp. | | |
| 7.125%, due 2/1/26 (c) | 11,000,000 | 10,788,910 |
| Chevron USA, Inc. | | |
| 3.85%, due 1/15/28 | 5,560,000 | 5,264,393 |
| 3.90%, due 11/15/24 | 4,000,000 | 3,928,415 |
| Civitas Resources, Inc. | | |
| 5.00%, due 10/15/26 (c) | 5,500,000 | 5,062,420 |
| Colgate Energy Partners III LLC | | |
| 7.75%, due 2/15/26 (c) | 20,645,000 | 20,535,818 |
| Comstock Resources, Inc. | | |
| 6.75%, due 3/1/29 (c) | 8,080,000 | 7,736,600 |
| Encino Acquisition Partners Holdings LLC | | |
| 8.50%, due 5/1/28 (c) | 41,705,000 | 39,072,972 |
| EQT Corp. | | |
| 6.125%, due 2/1/25 (f) | 14,749,000 | 14,785,430 |
| Gulfport Energy Corp. | | |
| 8.00%, due 5/17/26 | 1,362,721 | 1,358,633 |
| 8.00%, due 5/17/26 (c) | 30,637,302 | 30,545,390 |
| Gulfport Energy Operating Corp. Escrow Claim Shares (g)(i) | | |
| 6.00%, due 10/15/24 | 50,754,000 | — |
| 6.375%, due 5/15/25 | 24,354,000 | — |
The notes to the financial statements are an integral part of, and should be read in conjunction with, the financial statements.
| 18 | MainStay MacKay High Yield Corporate Bond Fund |
| | Principal
Amount | Value |
| Corporate Bonds (continued) |
| Oil & Gas (continued) |
Gulfport Energy Operating Corp. Escrow Claim Shares (g)(i)
(continued) | | |
| 6.375%, due 1/15/26 | $ 11,915,000 | $ — |
| 6.625%, due 5/1/23 | 17,072,000 | — |
| Hilcorp Energy I LP (c) | | |
| 5.75%, due 2/1/29 | 5,000,000 | 4,575,000 |
| 6.00%, due 4/15/30 | 8,000,000 | 7,244,032 |
| 6.25%, due 4/15/32 | 8,750,000 | 8,025,762 |
| Laredo Petroleum, Inc. | | |
| 7.75%, due 7/31/29 (c) | 17,830,000 | 16,938,500 |
| Marathon Oil Corp. | | |
| 4.40%, due 7/15/27 | 6,825,000 | 6,358,080 |
| 6.80%, due 3/15/32 | 5,000,000 | 5,093,741 |
| Matador Resources Co. | | |
| 5.875%, due 9/15/26 | 25,545,000 | 25,097,962 |
| Moss Creek Resources Holdings, Inc. | | |
| 7.50%, due 1/15/26 (c) | 9,465,000 | 8,707,800 |
| Occidental Petroleum Corp. | | |
| 5.55%, due 3/15/26 | 30,505,000 | 30,962,575 |
| 5.875%, due 9/1/25 | 6,000,000 | 6,045,000 |
| 6.125%, due 1/1/31 | 3,000,000 | 3,007,890 |
| 6.375%, due 9/1/28 | 6,635,000 | 6,734,251 |
| 6.45%, due 9/15/36 | 6,850,000 | 6,795,063 |
| 6.625%, due 9/1/30 | 7,270,000 | 7,561,200 |
| 6.95%, due 7/1/24 | 13,950,000 | 14,293,309 |
| 7.15%, due 5/15/28 | 4,000,000 | 4,079,280 |
| Parkland Corp. (c) | | |
| 4.50%, due 10/1/29 | 16,535,000 | 13,922,139 |
| 4.625%, due 5/1/30 | 14,000,000 | 11,645,410 |
| 5.875%, due 7/15/27 | 12,025,000 | 11,298,028 |
| PDC Energy, Inc. | | |
| 6.125%, due 9/15/24 | 11,454,000 | 11,340,344 |
| Permian Resources Operating LLC (c) | | |
| 5.375%, due 1/15/26 | 18,867,000 | 17,428,391 |
| 6.875%, due 4/1/27 | 23,400,000 | 22,698,000 |
| ROCC Holdings LLC | | |
| 9.25%, due 8/15/26 (c) | 12,600,000 | 12,430,278 |
| Rockcliff Energy II LLC | | |
| 5.50%, due 10/15/29 (c) | 36,935,000 | 32,895,419 |
| Southwestern Energy Co. | | |
| 4.75%, due 2/1/32 | 3,000,000 | 2,589,600 |
| 5.375%, due 3/15/30 | 15,330,000 | 14,180,250 |
| 5.70%, due 1/23/25 (f) | 3,504,000 | 3,443,581 |
| 7.75%, due 10/1/27 | 2,500,000 | 2,571,675 |
| | Principal
Amount | Value |
| |
| Oil & Gas (continued) |
| Sunoco LP | | |
| 6.00%, due 4/15/27 | $ 19,965,000 | $ 19,561,707 |
| Talos Production, Inc. | | |
| 12.00%, due 1/15/26 | 81,465,000 | 86,389,559 |
| Transocean Guardian Ltd. | | |
| 5.875%, due 1/15/24 (c) | 7,113,320 | 6,914,645 |
| Transocean Pontus Ltd. | | |
| 6.125%, due 8/1/25 (c) | 3,777,200 | 3,635,895 |
| Transocean Poseidon Ltd. | | |
| 6.875%, due 2/1/27 (c) | 27,908,125 | 26,722,030 |
| Transocean Sentry Ltd. | | |
| 5.375%, due 5/15/23 (c) | 9,341,819 | 9,178,337 |
| Viper Energy Partners LP | | |
| 5.375%, due 11/1/27 (c) | 9,425,000 | 8,864,920 |
| | | 646,371,034 |
| Oil & Gas Services 0.9% |
| Bristow Group, Inc. | | |
| 6.875%, due 3/1/28 (c) | 30,000,000 | 27,768,577 |
| Nine Energy Service, Inc. | | |
| 8.75%, due 11/1/23 (c) | 36,055,000 | 31,454,743 |
| Weatherford International Ltd. (c) | | |
| 6.50%, due 9/15/28 | 21,645,000 | 20,670,975 |
| 8.625%, due 4/30/30 | 14,595,000 | 13,755,788 |
| | | 93,650,083 |
| Packaging & Containers 0.4% |
| ARD Finance SA | | |
| 6.50% (6.50% Cash or 7.25% PIK), due 6/30/27 (b)(c) | 13,208,936 | 9,477,412 |
| Cascades, Inc. (c) | | |
| 5.125%, due 1/15/26 | 11,306,000 | 10,153,693 |
| 5.375%, due 1/15/28 | 23,385,000 | 20,000,021 |
| | | 39,631,126 |
| Pharmaceuticals 2.8% |
| 1375209 BC Ltd. | | |
| 9.00%, due 1/30/28 (c) | 8,000,000 | 7,740,000 |
| 180 Medical, Inc. | | |
| 3.875%, due 10/15/29 (c) | 20,670,000 | 17,466,150 |
| Bausch Health Cos., Inc. (c) | | |
| 5.00%, due 1/30/28 | 8,815,000 | 3,417,840 |
| 5.25%, due 1/30/30 | 2,000,000 | 775,000 |
| 6.25%, due 2/15/29 | 9,000,000 | 3,510,000 |
| 7.00%, due 1/15/28 | 7,000,000 | 2,800,000 |
| 7.25%, due 5/30/29 | 5,000,000 | 1,910,900 |
| 11.00%, due 9/30/28 | 19,972,000 | 15,378,440 |
| 14.00%, due 10/15/30 | 1,974,000 | 1,130,115 |
The notes to the financial statements are an integral part of, and should be read in conjunction with, the financial statements.
19
Portfolio of Investments October 31, 2022† (continued)
| | Principal
Amount | Value |
| Corporate Bonds (continued) |
| Pharmaceuticals (continued) |
| BellRing Brands, Inc. | | |
| 7.00%, due 3/15/30 (c) | $ 18,880,000 | $ 17,828,384 |
| Cheplapharm Arzneimittel GmbH | | |
| 5.50%, due 1/15/28 (c) | 1,000,000 | 829,300 |
| Jazz Securities DAC | | |
| 4.375%, due 1/15/29 (c) | 47,390,000 | 42,058,625 |
| Organon & Co. (c) | | |
| 4.125%, due 4/30/28 | 34,700,000 | 30,564,454 |
| 5.125%, due 4/30/31 | 23,000,000 | 19,533,210 |
| Owens & Minor, Inc. (c) | | |
| 4.50%, due 3/31/29 | 22,155,000 | 17,155,946 |
| 6.625%, due 4/1/30 | 23,545,000 | 19,572,959 |
| Par Pharmaceutical, Inc. | | |
| 7.50%, due 4/1/27 (c)(g)(j) | 39,082,000 | 29,874,750 |
| Prestige Brands, Inc. (c) | | |
| 3.75%, due 4/1/31 | 30,125,000 | 24,160,551 |
| 5.125%, due 1/15/28 | 26,650,000 | 24,765,045 |
| | | 280,471,669 |
| Pipelines 5.5% |
| ANR Pipeline Co. | | |
| 7.375%, due 2/15/24 | 2,555,000 | 2,571,165 |
| Antero Midstream Partners LP (c) | | |
| 5.375%, due 6/15/29 | 5,500,000 | 5,017,650 |
| 5.75%, due 3/1/27 | 4,000,000 | 3,809,200 |
| 5.75%, due 1/15/28 | 8,000,000 | 7,537,120 |
| Cheniere Energy Partners LP | | |
| 4.00%, due 3/1/31 | 25,000,000 | 21,077,125 |
| CNX Midstream Partners LP | | |
| 4.75%, due 4/15/30 (c) | 4,000,000 | 3,290,000 |
| Crestwood Midstream Partners LP | | |
| 8.00%, due 4/1/29 (c) | 6,500,000 | 6,500,000 |
| DT Midstream, Inc. (c) | | |
| 4.125%, due 6/15/29 | 3,500,000 | 3,025,750 |
| 4.375%, due 6/15/31 | 12,205,000 | 10,282,712 |
| Energy Transfer LP | | |
| 4.40%, due 3/15/27 | 14,700,000 | 13,636,413 |
| 4.95%, due 5/15/28 | 16,000,000 | 14,830,507 |
| EnLink Midstream LLC | | |
| 6.50%, due 9/1/30 (c) | 6,220,000 | 6,111,150 |
| EQM Midstream Partners LP (c) | | |
| 4.50%, due 1/15/29 | 7,705,000 | 6,549,250 |
| 4.75%, due 1/15/31 | 11,005,000 | 9,196,878 |
| 6.00%, due 7/1/25 | 4,497,000 | 4,355,412 |
| 6.50%, due 7/1/27 | 8,900,000 | 8,677,500 |
| 7.50%, due 6/1/27 | 5,000,000 | 4,937,500 |
| 7.50%, due 6/1/30 | 4,935,000 | 4,799,287 |
| | Principal
Amount | Value |
| |
| Pipelines (continued) |
| FTAI Infra Escrow Holdings LLC | | |
| 10.50%, due 6/1/27 (c) | $ 20,100,000 | $ 19,708,050 |
| Genesis Energy LP | | |
| 6.25%, due 5/15/26 | 13,670,000 | 12,790,814 |
| 7.75%, due 2/1/28 | 19,925,000 | 19,003,469 |
| 8.00%, due 1/15/27 | 23,870,000 | 23,107,115 |
| Harvest Midstream I LP | | |
| 7.50%, due 9/1/28 (c) | 26,675,000 | 25,573,875 |
| Hess Midstream Operations LP (c) | | |
| 4.25%, due 2/15/30 | 4,000,000 | 3,420,600 |
| 5.625%, due 2/15/26 | 1,000,000 | 980,770 |
| Holly Energy Partners LP (c) | | |
| 5.00%, due 2/1/28 | 9,870,000 | 8,920,458 |
| 6.375%, due 4/15/27 | 5,625,000 | 5,413,868 |
| ITT Holdings LLC | | |
| 6.50%, due 8/1/29 (c) | 20,080,000 | 16,134,380 |
| MPLX LP | | |
| 4.875%, due 12/1/24 | 12,000,000 | 11,779,847 |
| New Fortress Energy, Inc. | | |
| 6.50%, due 9/30/26 (c) | 8,555,000 | 8,298,350 |
| NGL Energy Operating LLC | | |
| 7.50%, due 2/1/26 (c) | 14,060,000 | 12,719,218 |
| NGPL PipeCo LLC (c) | | |
| 4.875%, due 8/15/27 | 12,555,000 | 11,665,695 |
| 7.768%, due 12/15/37 | 5,000,000 | 4,977,739 |
| NuStar Logistics LP | | |
| 5.75%, due 10/1/25 | 3,000,000 | 2,892,694 |
| 6.00%, due 6/1/26 | 15,000,000 | 14,544,000 |
| PBF Logistics LP | | |
| 6.875%, due 5/15/23 | 6,050,000 | 6,053,025 |
| Plains All American Pipeline LP | | |
| Series B | | |
| 6.125%, due 11/28/22 (e)(k) | 45,303,000 | 37,624,141 |
| Rockies Express Pipeline LLC (c) | | |
| 3.60%, due 5/15/25 | 7,000,000 | 6,510,000 |
| 4.80%, due 5/15/30 | 15,220,000 | 12,860,900 |
| Ruby Pipeline LLC | | |
| 8.00%, due 4/1/22 (c)(f)(g)(j) | 54,771,242 | 46,692,484 |
| Summit Midstream Holdings LLC | | |
| 8.50%, due 10/15/26 (c) | 29,715,000 | 28,526,400 |
| Tallgrass Energy Partners LP (c) | | |
| 5.50%, due 1/15/28 | 3,350,000 | 3,003,744 |
| 6.00%, due 3/1/27 | 19,000,000 | 17,929,764 |
| 7.50%, due 10/1/25 | 8,500,000 | 8,584,575 |
| Targa Resources Partners LP | | |
| 5.00%, due 1/15/28 | 6,320,000 | 5,827,700 |
| 6.50%, due 7/15/27 | 5,116,000 | 5,077,476 |
The notes to the financial statements are an integral part of, and should be read in conjunction with, the financial statements.
| 20 | MainStay MacKay High Yield Corporate Bond Fund |
| | Principal
Amount | Value |
| Corporate Bonds (continued) |
| Pipelines (continued) |
| TransMontaigne Partners LP | | |
| 6.125%, due 2/15/26 | $ 25,447,000 | $ 21,757,169 |
| Western Midstream Operating LP | | |
| 4.65%, due 7/1/26 | 5,000,000 | 4,737,500 |
| 4.75%, due 8/15/28 | 12,000,000 | 11,070,000 |
| 5.50%, due 2/1/50 (f) | 3,000,000 | 2,335,442 |
| | | 556,725,881 |
| Real Estate 0.7% |
| Howard Hughes Corp. (The) (c) | | |
| 4.125%, due 2/1/29 | 10,000,000 | 7,815,291 |
| 4.375%, due 2/1/31 | 8,500,000 | 6,386,900 |
| Newmark Group, Inc. | | |
| 6.125%, due 11/15/23 | 43,914,000 | 43,770,840 |
| Realogy Group LLC | | |
| 5.25%, due 4/15/30 (c) | 24,850,000 | 17,231,487 |
| | | 75,204,518 |
| Real Estate Investment Trusts 2.4% |
| CTR Partnership LP | | |
| 3.875%, due 6/30/28 (c) | 12,425,000 | 10,479,707 |
| GLP Capital LP | | |
| 5.25%, due 6/1/25 | 10,000,000 | 9,643,380 |
| 5.30%, due 1/15/29 | 14,080,000 | 12,680,995 |
| 5.375%, due 11/1/23 | 6,000,000 | 5,932,440 |
| 5.375%, due 4/15/26 | 5,620,000 | 5,364,627 |
| Host Hotels & Resorts LP | | |
| Series I | | |
| 3.50%, due 9/15/30 | 12,090,000 | 9,482,132 |
| MPT Operating Partnership LP | | |
| 4.625%, due 8/1/29 | 2,000,000 | 1,584,460 |
| 5.00%, due 10/15/27 | 21,025,000 | 17,992,774 |
| 5.25%, due 8/1/26 | 6,500,000 | 5,862,480 |
| RHP Hotel Properties LP | | |
| 4.50%, due 2/15/29 (c) | 11,255,000 | 9,876,263 |
| 4.75%, due 10/15/27 | 28,050,000 | 25,891,272 |
| VICI Properties LP (c) | | |
| 3.875%, due 2/15/29 | 37,650,000 | 31,702,787 |
| 4.625%, due 6/15/25 | 14,000,000 | 13,120,899 |
| 5.625%, due 5/1/24 | 55,960,000 | 55,247,070 |
| 5.75%, due 2/1/27 | 26,800,000 | 25,318,496 |
| | | 240,179,782 |
| Retail 5.2% |
| 1011778 B.C. Unlimited Liability Co. (c) | | |
| 3.50%, due 2/15/29 | 9,305,000 | 7,792,938 |
| 3.875%, due 1/15/28 | 26,885,000 | 23,629,899 |
| | Principal
Amount | Value |
| |
| Retail (continued) |
| 1011778 B.C. Unlimited Liability Co. (c) (continued) | | |
| 4.00%, due 10/15/30 | $ 55,052,000 | $ 44,936,195 |
| Asbury Automotive Group, Inc. | | |
| 4.50%, due 3/1/28 | 23,137,000 | 20,058,738 |
| 4.625%, due 11/15/29 (c) | 13,005,000 | 10,696,612 |
| 4.75%, due 3/1/30 | 16,525,000 | 13,537,908 |
| 5.00%, due 2/15/32 (c) | 10,850,000 | 8,747,812 |
| CEC Entertainment LLC | | |
| 6.75%, due 5/1/26 (c) | 19,390,000 | 18,136,737 |
| Dave & Buster's, Inc. | | |
| 7.625%, due 11/1/25 (c) | 9,240,000 | 9,217,916 |
| Group 1 Automotive, Inc. | | |
| 4.00%, due 8/15/28 (c) | 16,250,000 | 13,363,837 |
| Ken Garff Automotive LLC | | |
| 4.875%, due 9/15/28 (c) | 25,535,000 | 21,199,729 |
| KFC Holding Co. | | |
| 4.75%, due 6/1/27 (c) | 18,287,000 | 17,456,587 |
| LCM Investments Holdings II LLC | | |
| 4.875%, due 5/1/29 (c) | 46,870,000 | 39,535,782 |
| Lithia Motors, Inc. | | |
| 4.375%, due 1/15/31 (c) | 5,000,000 | 4,059,650 |
| Murphy Oil USA, Inc. | | |
| 4.75%, due 9/15/29 | 7,500,000 | 6,750,000 |
| 5.625%, due 5/1/27 | 10,417,000 | 9,996,466 |
| NMG Holding Co., Inc. | | |
| 7.125%, due 4/1/26 (c) | 78,035,000 | 74,151,198 |
| Papa John's International, Inc. | | |
| 3.875%, due 9/15/29 (c) | 18,284,000 | 14,854,519 |
| Patrick Industries, Inc. (c) | | |
| 4.75%, due 5/1/29 | 6,760,000 | 5,103,800 |
| 7.50%, due 10/15/27 | 21,040,000 | 19,276,257 |
| Sonic Automotive, Inc. (c) | | |
| 4.625%, due 11/15/29 | 11,890,000 | 9,308,919 |
| 4.875%, due 11/15/31 | 10,000,000 | 7,544,220 |
| Ultra Resources, Inc. Escrow Claim Shares | | |
| 6.875%, due 4/15/22 (a)(g)(i) | 28,880,000 | — |
| Yum! Brands, Inc. | | |
| 3.625%, due 3/15/31 | 40,870,000 | 32,798,175 |
| 4.625%, due 1/31/32 | 40,600,000 | 34,714,218 |
| 4.75%, due 1/15/30 (c) | 33,885,000 | 30,284,719 |
| 5.375%, due 4/1/32 | 30,000,000 | 26,834,100 |
| | | 523,986,931 |
| Software 3.9% |
| ACI Worldwide, Inc. | | |
| 5.75%, due 8/15/26 (c) | 9,284,000 | 8,819,800 |
The notes to the financial statements are an integral part of, and should be read in conjunction with, the financial statements.
21
Portfolio of Investments October 31, 2022† (continued)
| | Principal
Amount | Value |
| Corporate Bonds (continued) |
| Software (continued) |
| AthenaHealth Group, Inc. | | |
| 6.50%, due 2/15/30 (c) | $ 23,500,000 | $ 18,330,000 |
| Camelot Finance SA | | |
| 4.50%, due 11/1/26 (c) | 15,990,000 | 14,938,825 |
| Clarivate Science Holdings Corp. (c) | | |
| 3.875%, due 7/1/28 | 23,869,000 | 20,469,564 |
| 4.875%, due 7/1/29 | 48,911,000 | 40,779,546 |
| CWT Travel Group, Inc. | | |
| 8.50%, due 11/19/26 (c) | 8,513,374 | 7,257,651 |
| Fair Isaac Corp. (c) | | |
| 4.00%, due 6/15/28 | 5,000,000 | 4,524,200 |
| 5.25%, due 5/15/26 | 12,250,000 | 12,123,825 |
| MSCI, Inc. (c) | | |
| 3.25%, due 8/15/33 | 23,000,000 | 17,780,111 |
| 3.625%, due 9/1/30 | 31,855,000 | 26,618,038 |
| 3.625%, due 11/1/31 | 27,375,000 | 22,530,583 |
| 3.875%, due 2/15/31 | 44,255,000 | 37,289,706 |
| 4.00%, due 11/15/29 | 34,330,000 | 29,809,426 |
| Open Text Corp. (c) | | |
| 3.875%, due 2/15/28 | 17,385,000 | 14,880,517 |
| 3.875%, due 12/1/29 | 14,100,000 | 11,174,250 |
| Open Text Holdings, Inc. (c) | | |
| 4.125%, due 2/15/30 | 30,047,000 | 23,924,924 |
| 4.125%, due 12/1/31 | 5,681,000 | 4,274,952 |
| PTC, Inc. (c) | | |
| 3.625%, due 2/15/25 | 11,000,000 | 10,483,330 |
| 4.00%, due 2/15/28 | 35,619,000 | 32,261,387 |
| SS&C Technologies, Inc. | | |
| 5.50%, due 9/30/27 (c) | 22,995,000 | 21,380,548 |
| Veritas US, Inc. | | |
| 7.50%, due 9/1/25 (c) | 15,500,000 | 13,048,373 |
| | | 392,699,556 |
| Telecommunications 3.7% |
| Connect Finco SARL | | |
| 6.75%, due 10/1/26 (c) | 55,400,000 | 52,076,000 |
| Hughes Satellite Systems Corp. | | |
| 5.25%, due 8/1/26 | 8,000,000 | 7,636,720 |
| 6.625%, due 8/1/26 | 12,000,000 | 11,304,000 |
| Quebecor Media, Inc. | | |
| 5.75%, due 1/15/23 | 20,170,000 | 20,157,898 |
| Sprint Capital Corp. | | |
| 6.875%, due 11/15/28 | 104,520,000 | 107,862,550 |
| Sprint Corp. | | |
| 7.875%, due 9/15/23 | 46,900,000 | 47,669,301 |
| Switch Ltd. | | |
| 3.75%, due 9/15/28 (c) | 18,195,000 | 18,376,950 |
| | Principal
Amount | Value |
| |
| Telecommunications (continued) |
| T-Mobile US, Inc. | | |
| 2.625%, due 2/15/29 | $ 9,690,000 | $ 8,010,081 |
| 2.875%, due 2/15/31 | 34,390,000 | 27,684,638 |
| 4.75%, due 2/1/28 | 38,055,000 | 36,018,296 |
| 5.375%, due 4/15/27 | 33,000,000 | 32,555,628 |
| | | 369,352,062 |
| Toys, Games & Hobbies 0.3% |
| Mattel, Inc. (c) | | |
| 3.375%, due 4/1/26 | 5,000,000 | 4,560,581 |
| 3.75%, due 4/1/29 | 10,000,000 | 8,629,525 |
| 5.875%, due 12/15/27 | 21,275,000 | 20,644,834 |
| | | 33,834,940 |
| Transportation 0.6% |
| Seaspan Corp. | | |
| 5.50%, due 8/1/29 (c) | 18,315,000 | 14,105,827 |
| Watco Cos. LLC | | |
| 6.50%, due 6/15/27 (c) | 47,150,000 | 44,375,113 |
| XPO Escrow Sub LLC | | |
| 7.50%, due 11/15/27 (c) | 5,000,000 | 4,987,500 |
| | | 63,468,440 |
Total Corporate Bonds
(Cost $9,721,541,482) | | 8,711,339,559 |
| Loan Assignments 3.4% |
| Automobile 0.1% |
| Dealer Tire LLC | |
| Term Loan B1 | |
| 7.365% (1 Month LIBOR + 4.25%), due 12/12/25 (d) | 10,885,289 | 10,683,911 |
| Beverage, Food & Tobacco 0.1% |
| United Natural Foods, Inc. | |
| Initial Term Loan | |
| 7.093% (1 Month LIBOR + 3.25%), due 10/22/25 (d) | 12,793,288 | 12,678,148 |
| Chemicals, Plastics & Rubber 0.1% |
| Jazz Pharmaceuticals plc | |
| Initial Dollar Term Loan | |
| 7.254% (1 Month LIBOR + 3.50%), due 5/5/28 (d) | 11,786,372 | 11,635,365 |
The notes to the financial statements are an integral part of, and should be read in conjunction with, the financial statements.
| 22 | MainStay MacKay High Yield Corporate Bond Fund |
| | Principal
Amount | Value |
| Loan Assignments (continued) |
| Electronics 0.1% |
| Camelot U.S. Acquisition 1 Co. (d) | |
| Initial Term Loan | |
| 6.754% (1 Month LIBOR + 3.00%), due 10/30/26 | $ 4,314,279 | $ 4,233,386 |
| Amendment No. 2 Incremental Term Loan | |
| 6.754% (1 Month LIBOR + 3.00%), due 10/30/26 | 4,385,625 | 4,307,780 |
| | | 8,541,166 |
| Finance 0.1% |
| RealTruck Group, Inc. | |
| Initial Term Loan | |
| 7.254% (1 Month LIBOR + 3.50%), due 1/31/28 (d) | 9,785,940 | 8,379,211 |
| Healthcare, Education & Childcare 0.3% |
| LifePoint Health, Inc. | |
| First Lien Term Loan B | |
| 8.165% (3 Month LIBOR + 3.75%), due 11/16/25 (d) | 23,303,924 | 20,515,773 |
| Organon & Co. | |
| Dollar Term Loan | |
| 6.188% (3 Month LIBOR + 3.00%), due 6/2/28 (d) | 10,239,166 | 9,964,900 |
| | | 30,480,673 |
| Insurance 0.2% |
| USI, Inc. | |
| 2017 New Term Loan | |
| 6.424% (3 Month LIBOR + 2.75%), due 5/16/24 (d) | 17,250,679 | 17,009,894 |
| Leisure, Amusement, Motion Pictures & Entertainment 0.0% ‡ |
| NASCAR Holdings LLC | |
| Initial Term Loan | |
| 5.615% (1 Month LIBOR + 2.50%), due 10/19/26 (d) | 3,601,064 | 3,583,058 |
| Manufacturing 0.1% |
| Adient U.S. LLC | |
| Term Loan B1 | |
| 7.004% (1 Month LIBOR + 3.25%), due 4/10/28 (d) | 10,020,265 | 9,657,030 |
| | Principal
Amount | Value |
| |
| Media 0.4% |
| DIRECTV Financing LLC | |
| Closing Date Term Loan | |
| 8.754% (1 Month LIBOR + 5.00%), due 8/2/27 (d) | $ 38,971,759 | $ 36,952,788 |
| Oil & Gas 0.5% |
| Ascent Resources Utica Holdings LLC | |
| Second Lien Term Loan | |
| 12.941% (3 Month LIBOR + 9.00%), due 11/1/25 (d) | 9,011,000 | 9,446,529 |
| PetroQuest Energy LLC (a)(i) | |
| Term Loan | |
| TBD, due 1/1/28 | 2,810,418 | 2,810,418 |
| 2020 Term Loan | |
| 10.628% (9.21% PIK), due 9/19/26 (b) | 2,160,349 | 2,160,349 |
| Term Loan | |
| 11.254% (10.62% PIK) (1 Month LIBOR + 7.50%), due 11/8/23 (b)(d) | 21,093,836 | 21,093,836 |
| TransMontaigne Operating Co. LP | |
| Tranche Term Loan B 6.989% - 7.072% | |
| (1 Month LIBOR + 3.50%), due 11/17/28 (d) | 14,500,475 | 13,974,833 |
| | | 49,485,965 |
| Retail 0.8% |
| Great Outdoors Group LLC | |
| Term Loan B2 | |
| 7.504% (1 Month LIBOR + 3.75%), due 3/6/28 (d) | 89,678,040 | 84,259,962 |
| Services: Business 0.1% |
| GIP II Blue Holding LP | |
| Initial Term Loan | |
| 8.174% (3 Month LIBOR + 4.50%), due 9/29/28 (d) | 11,680,043 | 11,555,942 |
| Icon plc (d) | |
| Lux Term Loan | |
| 5.938% (3 Month LIBOR + 2.25%), due 7/3/28 | 3,118,417 | 3,084,636 |
| U.S. Term Loan | |
| 5.938% (3 Month LIBOR + 2.25%), due 7/3/28 | 776,956 | 768,539 |
| | | 15,409,117 |
The notes to the financial statements are an integral part of, and should be read in conjunction with, the financial statements.
23
Portfolio of Investments October 31, 2022† (continued)
| | Principal
Amount | Value |
| Loan Assignments (continued) |
| Utilities 0.5% |
| PG&E Corp. | |
| Term Loan | |
| 6.813% (1 Month LIBOR + 3.00%), due 6/23/25 (d) | $ 48,539,293 | $ 47,665,586 |
Total Loan Assignments
(Cost $356,869,406) | | 346,421,874 |
Total Long-Term Bonds
(Cost $10,192,865,562) | | 9,188,128,535 |
| |
| | Shares | |
| Common Stocks 2.4% |
| Distributors 0.1% |
| ATD New Holdings, Inc. (l) | 142,545 | 10,886,874 |
| Electric Utilities 0.0% ‡ |
| Keycon Power Holdings LLC (a)(i)(l) | 38,880 | 389 |
| Electrical Equipment 0.0% ‡ |
| Energy Technologies, Inc. (a)(i)(l) | 16,724 | 3,344,800 |
| Hotels, Restaurants & Leisure 0.1% |
| Carlson Travel, Inc. (a)(h)(l) | 1,954,050 | 13,189,838 |
| Carlson Travel, Inc. (a)(h)(i)(l) | 25,452 | — |
| | | 13,189,838 |
| Independent Power and Renewable Electricity Producers 0.4% |
| GenOn Energy, Inc. (h) | 386,241 | 40,555,305 |
| Metals & Mining 0.1% |
| Franco-Nevada Corp. | 65,000 | 8,032,700 |
| Neenah Enterprises, Inc. (a)(h)(i)(l) | 720,961 | 167,624 |
| | | 8,200,324 |
| Oil, Gas & Consumable Fuels 1.7% |
| California Resources Corp. | 41,116 | 1,854,743 |
| Chord Energy Corp. | 102,111 | 15,632,173 |
| Gulfport Energy Corp. (l) | 1,195,301 | 106,991,392 |
| PetroQuest Energy, Inc. (a)(i)(l) | 28,470,873 | — |
| Talos Energy, Inc. (l) | 2,074,193 | 44,138,827 |
| | | 168,617,135 |
| | Shares | | Value |
| |
| Software 0.0% ‡ |
| ASG warrant Corp. (a)(i)(l) | 12,502 | | $ — |
Total Common Stocks
(Cost $291,710,625) | | | 244,794,665 |
| Preferred Stocks 0.3% |
| Electrical Equipment 0.3% |
| Energy Technologies Ltd. (a)(i)(l) | 37,258 | | 24,217,700 |
| Oil, Gas & Consumable Fuels 0.0% ‡ |
| Gulfport Energy Operating Corp., 10.00%(10.00% Cash or 15.00% PIK) (a)(b)(h)(i)(l) | 150 | | 831,843 |
Total Preferred Stocks
(Cost $35,662,837) | | | 25,049,543 |
| Exchange-Traded Funds 0.4% |
| iShares Gold Trust (l) | 929,500 | | 28,795,910 |
| SPDR Gold Shares (l) | 70,336 | | 10,684,742 |
Total Exchange-Traded Funds
(Cost $35,418,973) | | | 39,480,652 |
| |
| | Number of
Warrants | | |
| Warrants 0.0% ‡ |
| Hotels, Restaurants & Leisure 0.0% ‡ |
| CWT Travel Holdings, Inc. (i)(l) | | | |
| Expires 11/19/26 | 169,236 | | 11,694 |
| Expires 11/19/28 | 178,143 | | 34,097 |
| | | | 45,791 |
| Oil, Gas & Consumable Fuels 0.0% ‡ |
| California Resources Corp. | | | |
| Expires 10/27/24 (l) | 36,093 | | 512,520 |
Total Warrants
(Cost $32,627,513) | | | 558,311 |
Total Investments
(Cost $10,588,285,510) | 93.9% | | 9,498,011,706 |
| Other Assets, Less Liabilities | 6.1 | | 619,142,726 |
| Net Assets | 100.0% | | $ 10,117,154,432 |
The notes to the financial statements are an integral part of, and should be read in conjunction with, the financial statements.
| 24 | MainStay MacKay High Yield Corporate Bond Fund |
| † | Percentages indicated are based on Fund net assets. |
| ‡ | Less than one-tenth of a percent. |
| (a) | Illiquid security—As of October 31, 2022, the total market value deemed illiquid under procedures approved by the Board of Trustees was $115,871,816, which represented 1.1% of the Fund’s net assets.(Unaudited) |
| (b) | PIK ("Payment-in-Kind")—issuer may pay interest or dividends with additional securities and/or in cash. |
| (c) | May be sold to institutional investors only under Rule 144A or securities offered pursuant to Section 4(a)(2) of the Securities Act of 1933, as amended. |
| (d) | Floating rate—Rate shown was the rate in effect as of October 31, 2022. |
| (e) | Security is perpetual and, thus, does not have a predetermined maturity date. The date shown, if applicable, reflects the next call date. |
| (f) | Step coupon—Rate shown was the rate in effect as of October 31, 2022. |
| (g) | Issue in non-accrual status. |
| (h) | Restricted security. (See Note 5) |
| (i) | Security in which significant unobservable inputs (Level 3) were used in determining fair value. |
| (j) | Issue in default. |
| (k) | Fixed to floating rate—Rate shown was the rate in effect as of October 31, 2022. |
| (l) | Non-income producing security. |
| Abbreviation(s): |
| LIBOR—London Interbank Offered Rate |
| SPDR—Standard & Poor’s Depositary Receipt |
| TBD—To Be Determined |
The following is a summary of the fair valuations according to the inputs used as of October 31, 2022, for valuing the Fund’s assets:
| Description | Quoted
Prices in
Active
Markets for
Identical
Assets
(Level 1) | | Significant
Other
Observable
Inputs
(Level 2) | | Significant
Unobservable
Inputs
(Level 3) | | Total |
| Asset Valuation Inputs | | | | | | | |
| Investments in Securities (a) | | | | | | | |
| Long-Term Bonds | | | | | | | |
| Convertible Bonds | $ — | | $ 130,367,102 | | $ — | | $ 130,367,102 |
| Corporate Bonds | — | | 8,692,979,559 | | 18,360,000 | | 8,711,339,559 |
| Loan Assignments | — | | 320,357,271 | | 26,064,603 | | 346,421,874 |
| Total Long-Term Bonds | — | | 9,143,703,932 | | 44,424,603 | | 9,188,128,535 |
| Common Stocks | 176,649,835 | | 64,632,017 | | 3,512,813 | | 244,794,665 |
| Preferred Stocks | — | | — | | 25,049,543 | | 25,049,543 |
| Exchange-Traded Funds | 39,480,652 | | — | | — | | 39,480,652 |
| Warrants | 512,520 | | — | | 45,791 | | 558,311 |
| Total Investments in Securities | $ 216,643,007 | | $ 9,208,335,949 | | $ 73,032,750 | | $ 9,498,011,706 |
| (a) | For a complete listing of investments and their industries, see the Portfolio of Investments. |
The notes to the financial statements are an integral part of, and should be read in conjunction with, the financial statements.
25
Statement of Assets and Liabilities as of October 31, 2022
| Assets |
Investment in securities, at value
(identified cost $10,588,285,510) | $ 9,498,011,706 |
| Cash | 486,044,220 |
| Receivables: | |
| Interest | 149,351,282 |
| Fund shares sold | 27,279,001 |
| Investment securities sold | 3,944,750 |
| Other assets | 1,243,678 |
| Total assets | 10,165,874,637 |
| Liabilities |
| Payables: | |
| Fund shares redeemed | 26,117,939 |
| Investment securities purchased | 10,958,475 |
| Manager (See Note 3) | 4,626,434 |
| Transfer agent (See Note 3) | 1,785,046 |
| Shareholder communication | 1,240,378 |
| NYLIFE Distributors (See Note 3) | 799,935 |
| Professional fees | 147,716 |
| Custodian | 34,528 |
| Trustees | 1,923 |
| Accrued expenses | 74,962 |
| Distributions payable | 2,932,869 |
| Total liabilities | 48,720,205 |
| Net assets | $10,117,154,432 |
| Composition of Net Assets |
| Shares of beneficial interest outstanding (par value of $.01 per share) unlimited number of shares authorized | $ 20,738,446 |
| Additional paid-in-capital | 11,477,790,774 |
| | 11,498,529,220 |
| Total distributable earnings (loss) | (1,381,374,788) |
| Net assets | $10,117,154,432 |
| Class A | |
| Net assets applicable to outstanding shares | $3,074,182,414 |
| Shares of beneficial interest outstanding | 629,614,735 |
| Net asset value per share outstanding | $ 4.88 |
| Maximum sales charge (4.50% of offering price) | 0.23 |
| Maximum offering price per share outstanding | $ 5.11 |
| Investor Class | |
| Net assets applicable to outstanding shares | $ 116,960,981 |
| Shares of beneficial interest outstanding | 23,787,051 |
| Net asset value per share outstanding | $ 4.92 |
| Maximum sales charge (4.00% of offering price) | 0.21 |
| Maximum offering price per share outstanding | $ 5.13 |
| Class B | |
| Net assets applicable to outstanding shares | $ 13,032,238 |
| Shares of beneficial interest outstanding | 2,681,810 |
| Net asset value and offering price per share outstanding | $ 4.86 |
| Class C | |
| Net assets applicable to outstanding shares | $ 133,295,305 |
| Shares of beneficial interest outstanding | 27,408,828 |
| Net asset value and offering price per share outstanding | $ 4.86 |
| Class I | |
| Net assets applicable to outstanding shares | $3,159,577,492 |
| Shares of beneficial interest outstanding | 646,954,507 |
| Net asset value and offering price per share outstanding | $ 4.88 |
| Class R1 | |
| Net assets applicable to outstanding shares | $ 52,498 |
| Shares of beneficial interest outstanding | 10,772 |
| Net asset value and offering price per share outstanding | $ 4.87 |
| Class R2 | |
| Net assets applicable to outstanding shares | $ 6,948,777 |
| Shares of beneficial interest outstanding | 1,422,687 |
| Net asset value and offering price per share outstanding | $ 4.88 |
| Class R3 | |
| Net assets applicable to outstanding shares | $ 3,481,622 |
| Shares of beneficial interest outstanding | 713,795 |
| Net asset value and offering price per share outstanding | $ 4.88 |
| Class R6 | |
| Net assets applicable to outstanding shares | $3,609,590,660 |
| Shares of beneficial interest outstanding | 741,243,802 |
| Net asset value and offering price per share outstanding | $ 4.87 |
| SIMPLE Class | |
| Net assets applicable to outstanding shares | $ 32,445 |
| Shares of beneficial interest outstanding | 6,597 |
| Net asset value and offering price per share outstanding | $ 4.92 |
The notes to the financial statements are an integral part of, and should be read in conjunction with, the financial statements.
| 26 | MainStay MacKay High Yield Corporate Bond Fund |
Statement of Operations for the year ended October 31, 2022
| Investment Income (Loss) |
| Income | |
| Interest | $ 605,214,085 |
| Dividends (net of foreign tax withholding of $12,285) | 4,326,358 |
| Other | 4,968,821 |
| Total income | 614,509,264 |
| Expenses | |
| Manager (See Note 3) | 59,788,878 |
| Distribution/Service—Class A (See Note 3) | 8,635,313 |
| Distribution/Service—Investor Class (See Note 3) | 318,321 |
| Distribution/Service—Class B (See Note 3) | 197,211 |
| Distribution/Service—Class C (See Note 3) | 1,705,026 |
| Distribution/Service—Class R2 (See Note 3) | 20,725 |
| Distribution/Service—Class R3 (See Note 3) | 18,022 |
| Distribution/Service—SIMPLE Class (See Note 3) | 163 |
| Transfer agent (See Note 3) | 10,552,141 |
| Shareholder communication | 1,596,633 |
| Professional fees | 786,777 |
| Registration | 308,304 |
| Trustees | 229,190 |
| Custodian | 147,935 |
| Shareholder service (See Note 3) | 11,947 |
| Miscellaneous | 432,719 |
| Total expenses | 84,749,305 |
| Net investment income (loss) | 529,759,959 |
| Realized and Unrealized Gain (Loss) |
| Net realized gain (loss) on investments | (2,040,502) |
| Net change in unrealized appreciation (depreciation) on investments | (1,544,808,534) |
| Net realized and unrealized gain (loss) | (1,546,849,036) |
| Net increase (decrease) in net assets resulting from operations | $(1,017,089,077) |
The notes to the financial statements are an integral part of, and should be read in conjunction with, the financial statements.
27
Statements of Changes in Net Assets
for the years ended October 31, 2022 and October 31, 2021
| | 2022 | 2021 |
| Increase (Decrease) in Net Assets |
| Operations: | | |
| Net investment income (loss) | $ 529,759,959 | $ 561,954,069 |
| Net realized gain (loss) | (2,040,502) | 219,481,230 |
| Net change in unrealized appreciation (depreciation) | (1,544,808,534) | 336,122,360 |
| Net increase (decrease) in net assets resulting from operations | (1,017,089,077) | 1,117,557,659 |
| Distributions to shareholders: | | |
| Class A | (159,359,781) | (176,416,889) |
| Investor Class | (5,731,011) | (6,494,080) |
| Class B | (728,522) | (1,264,772) |
| Class C | (6,351,592) | (9,396,090) |
| Class I | (179,733,684) | (186,334,257) |
| Class R1 | (2,576) | (2,744) |
| Class R2 | (372,409) | (475,941) |
| Class R3 | (154,687) | (129,139) |
| Class R6 | (181,305,286) | (190,139,469) |
| SIMPLE Class | (1,390) | (1,106) |
| | (533,740,938) | (570,654,487) |
| Distributions to shareholders from return of capital: | | |
| Class A | (10,959,485) | (19,429,957) |
| Investor Class | (394,133) | (715,236) |
| Class B | (50,102) | (139,298) |
| Class C | (436,811) | (1,034,853) |
| Class I | (12,360,639) | (20,522,222) |
| Class R1 | (177) | (302) |
| Class R2 | (25,611) | (52,419) |
| Class R3 | (10,638) | (14,223) |
| Class R6 | (12,468,721) | (20,941,315) |
| SIMPLE Class | (96) | (122) |
| | (36,706,413) | (62,849,947) |
| Total distributions to shareholders | (570,447,351) | (633,504,434) |
| Capital share transactions: | | |
| Net proceeds from sales of shares | 3,247,300,040 | 3,657,661,509 |
| Net asset value of shares issued to shareholders in reinvestment of distributions | 531,741,895 | 591,279,027 |
| Cost of shares redeemed | (4,185,037,510) | (4,586,290,263) |
| Increase (decrease) in net assets derived from capital share transactions | (405,995,575) | (337,349,727) |
| Net increase (decrease) in net assets | (1,993,532,003) | 146,703,498 |
| | 2022 | 2021 |
| Net Assets |
| Beginning of year | $12,110,686,435 | $11,963,982,937 |
| End of year | $10,117,154,432 | $12,110,686,435 |
The notes to the financial statements are an integral part of, and should be read in conjunction with, the financial statements.
| 28 | MainStay MacKay High Yield Corporate Bond Fund |
Financial Highlights selected per share data and ratios
| | Year Ended October 31, |
| Class A | 2022 | | 2021 | | 2020 | | 2019 | | 2018 |
| Net asset value at beginning of year | $ 5.63 | | $ 5.41 | | $ 5.61 | | $ 5.52 | | $ 5.77 |
| Net investment income (loss) (a) | 0.24 | | 0.25 | | 0.29 | | 0.29 | | 0.29 |
| Net realized and unrealized gain (loss) | (0.73) | | 0.25 | | (0.17) | | 0.12 | | (0.22) |
| Total from investment operations | (0.49) | | 0.50 | | 0.12 | | 0.41 | | 0.07 |
| Less distributions: | | | | | | | | | |
| From net investment income | (0.24) | | (0.25) | | (0.29) | | (0.29) | | (0.29) |
| Return of capital | (0.02) | | (0.03) | | (0.03) | | (0.03) | | (0.03) |
| Total distributions | (0.26) | | (0.28) | | (0.32) | | (0.32) | | (0.32) |
| Net asset value at end of year | $ 4.88 | | $ 5.63 | | $ 5.41 | | $ 5.61 | | $ 5.52 |
| Total investment return (b) | (8.88)% | | 9.37% | | 2.26% | | 7.58% | | 1.29% |
| Ratios (to average net assets)/Supplemental Data: | | | | | | | | | |
| Net investment income (loss) | 4.58% | | 4.38% | | 5.35% | | 5.21% | | 5.15% |
| Net expenses (c) | 0.95% | | 0.95% | | 0.97% | | 0.99% | | 0.99% |
| Portfolio turnover rate | 16% | | 40% | | 38% | | 30% | | 30% |
| Net assets at end of year (in 000’s) | $ 3,074,182 | | $ 3,901,512 | | $ 3,525,782 | | $ 3,405,587 | | $ 3,290,659 |
| (a) | Per share data based on average shares outstanding during the year. |
| (b) | Total investment return is calculated exclusive of sales charges and assumes the reinvestment of dividends and distributions. For periods of less than one year, total return is not annualized. |
| (c) | In addition to the fees and expenses which the Fund bears directly, it also indirectly bears a pro-rata share of the fees and expenses of the underlying funds in which it invests. Such indirect expenses are not included in the above expense ratios. |
| | Year Ended October 31, |
| Investor Class | 2022 | | 2021 | | 2020 | | 2019 | | 2018 |
| Net asset value at beginning of year | $ 5.67 | | $ 5.45 | | $ 5.65 | | $ 5.57 | | $ 5.82 |
| Net investment income (loss) (a) | 0.24 | | 0.24 | | 0.29 | | 0.29 | | 0.29 |
| Net realized and unrealized gain (loss) | (0.73) | | 0.26 | | (0.17) | | 0.11 | | (0.22) |
| Total from investment operations | (0.49) | | 0.50 | | 0.12 | | 0.40 | | 0.07 |
| Less distributions: | | | | | | | | | |
| From net investment income | (0.24) | | (0.25) | | (0.29) | | (0.29) | | (0.29) |
| Return of capital | (0.02) | | (0.03) | | (0.03) | | (0.03) | | (0.03) |
| Total distributions | (0.26) | | (0.28) | | (0.32) | | (0.32) | | (0.32) |
| Net asset value at end of year | $ 4.92 | | $ 5.67 | | $ 5.45 | | $ 5.65 | | $ 5.57 |
| Total investment return (b) | (8.90)% | | 9.25% | | 2.24% | | 7.33% | | 1.29% |
| Ratios (to average net assets)/Supplemental Data: | | | | | | | | | |
| Net investment income (loss) | 4.45% | | 4.26% | | 5.27% | | 5.15% | | 5.12% |
| Net expenses (c) | 1.09% | | 1.08% | | 1.06% | | 1.05% | | 1.03% |
| Portfolio turnover rate | 16% | | 40% | | 38% | | 30% | | 30% |
| Net assets at end of year (in 000's) | $ 116,961 | | $ 139,214 | | $ 149,726 | | $ 162,260 | | $ 159,970 |
| (a) | Per share data based on average shares outstanding during the year. |
| (b) | Total investment return is calculated exclusive of sales charges and assumes the reinvestment of dividends and distributions. For periods of less than one year, total return is not annualized. |
| (c) | In addition to the fees and expenses which the Fund bears directly, it also indirectly bears a pro-rata share of the fees and expenses of the underlying funds in which it invests. Such indirect expenses are not included in the above expense ratios. |
The notes to the financial statements are an integral part of, and should be read in conjunction with, the financial statements.
29
Financial Highlights selected per share data and ratios
| | Year Ended October 31, |
| Class B | 2022 | | 2021 | | 2020 | | 2019 | | 2018 |
| Net asset value at beginning of year | $ 5.60 | | $ 5.38 | | $ 5.58 | | $ 5.50 | | $ 5.74 |
| Net investment income (loss) (a) | 0.19 | | 0.20 | | 0.25 | | 0.24 | | 0.25 |
| Net realized and unrealized gain (loss) | (0.72) | | 0.25 | | (0.18) | | 0.11 | | (0.21) |
| Total from investment operations | (0.53) | | 0.45 | | 0.07 | | 0.35 | | 0.04 |
| Less distributions: | | | | | | | | | |
| From net investment income | (0.20) | | (0.21) | | (0.24) | | (0.25) | | (0.26) |
| Return of capital | (0.01) | | (0.02) | | (0.03) | | (0.02) | | (0.02) |
| Total distributions | (0.21) | | (0.23) | | (0.27) | | (0.27) | | (0.28) |
| Net asset value at end of year | $ 4.86 | | $ 5.60 | | $ 5.38 | | $ 5.58 | | $ 5.50 |
| Total investment return (b) | (9.61)% | | 8.52% | | 1.39% | | 6.52% | | 0.64% |
| Ratios (to average net assets)/Supplemental Data: | | | | | | | | | |
| Net investment income (loss) | 3.64% | | 3.56% | | 4.55% | | 4.41% | | 4.37% |
| Net expenses (c) | 1.84% | | 1.83% | | 1.81% | | 1.80% | | 1.78% |
| Portfolio turnover rate | 16% | | 40% | | 38% | | 30% | | 30% |
| Net assets at end of year (in 000’s) | $ 13,032 | | $ 26,622 | | $ 45,661 | | $ 63,517 | | $ 81,221 |
| (a) | Per share data based on average shares outstanding during the year. |
| (b) | Total investment return is calculated exclusive of sales charges and assumes the reinvestment of dividends and distributions. For periods of less than one year, total return is not annualized. |
| (c) | In addition to the fees and expenses which the Fund bears directly, it also indirectly bears a pro-rata share of the fees and expenses of the underlying funds in which it invests. Such indirect expenses are not included in the above expense ratios. |
| | Year Ended October 31, |
| Class C | 2022 | | 2021 | | 2020 | | 2019 | | 2018 |
| Net asset value at beginning of year | $ 5.60 | | $ 5.39 | | $ 5.59 | | $ 5.50 | | $ 5.74 |
| Net investment income (loss) (a) | 0.19 | | 0.20 | | 0.25 | | 0.24 | | 0.25 |
| Net realized and unrealized gain (loss) | (0.72) | | 0.24 | | (0.18) | | 0.12 | | (0.21) |
| Total from investment operations | (0.53) | | 0.44 | | 0.07 | | 0.36 | | 0.04 |
| Less distributions: | | | | | | | | | |
| From net investment income | (0.20) | | (0.21) | | (0.24) | | (0.25) | | (0.26) |
| Return of capital | (0.01) | | (0.02) | | (0.03) | | (0.02) | | (0.02) |
| Total distributions | (0.21) | | (0.23) | | (0.27) | | (0.27) | | (0.28) |
| Net asset value at end of year | $ 4.86 | | $ 5.60 | | $ 5.39 | | $ 5.59 | | $ 5.50 |
| Total investment return (b) | (9.62)% | | 8.31% | | 1.39% | | 6.71% | | 0.64% |
| Ratios (to average net assets)/Supplemental Data: | | | | | | | | | |
| Net investment income (loss) | 3.66% | | 3.54% | | 4.54% | | 4.41% | | 4.36% |
| Net expenses (c) | 1.84% | | 1.83% | | 1.81% | | 1.80% | | 1.78% |
| Portfolio turnover rate | 16% | | 40% | | 38% | | 30% | | 30% |
| Net assets at end of year (in 000’s) | $ 133,295 | | $ 214,696 | | $ 297,431 | | $ 373,760 | | $ 550,819 |
| (a) | Per share data based on average shares outstanding during the year. |
| (b) | Total investment return is calculated exclusive of sales charges and assumes the reinvestment of dividends and distributions. For periods of less than one year, total return is not annualized. |
| (c) | In addition to the fees and expenses which the Fund bears directly, it also indirectly bears a pro-rata share of the fees and expenses of the underlying funds in which it invests. Such indirect expenses are not included in the above expense ratios. |
The notes to the financial statements are an integral part of, and should be read in conjunction with, the financial statements.
| 30 | MainStay MacKay High Yield Corporate Bond Fund |
Financial Highlights selected per share data and ratios
| | Year Ended October 31, |
| Class I | 2022 | | 2021 | | 2020 | | 2019 | | 2018 |
| Net asset value at beginning of year | $ 5.63 | | $ 5.41 | | $ 5.61 | | $ 5.53 | | $ 5.78 |
| Net investment income (loss) (a) | 0.25 | | 0.26 | | 0.30 | | 0.30 | | 0.31 |
| Net realized and unrealized gain (loss) | (0.73) | | 0.26 | | (0.17) | | 0.11 | | (0.22) |
| Total from investment operations | (0.48) | | 0.52 | | 0.13 | | 0.41 | | 0.09 |
| Less distributions: | | | | | | | | | |
| From net investment income | (0.25) | | (0.27) | | (0.30) | | (0.30) | | (0.31) |
| Return of capital | (0.02) | | (0.03) | | (0.03) | | (0.03) | | (0.03) |
| Total distributions | (0.27) | | (0.30) | | (0.33) | | (0.33) | | (0.34) |
| Net asset value at end of year | $ 4.88 | | $ 5.63 | | $ 5.41 | | $ 5.61 | | $ 5.53 |
| Total investment return (b) | (8.65)% | | 9.65% | | 2.56% | | 7.68% | | 1.57% |
| Ratios (to average net assets)/Supplemental Data: | | | | | | | | | |
| Net investment income (loss) | 4.82% | | 4.62% | | 5.60% | | 5.45% | | 5.40% |
| Net expenses (c) | 0.70% | | 0.70% | | 0.72% | | 0.74% | | 0.74% |
| Portfolio turnover rate | 16% | | 40% | | 38% | | 30% | | 30% |
| Net assets at end of year (in 000’s) | $ 3,159,577 | | $ 4,116,697 | | $ 3,509,954 | | $ 3,451,487 | | $ 3,709,306 |
| (a) | Per share data based on average shares outstanding during the year. |
| (b) | Total investment return is calculated exclusive of sales charges and assumes the reinvestment of dividends and distributions. Class I shares are not subject to sales charges. For periods of less than one year, total return is not annualized. |
| (c) | In addition to the fees and expenses which the Fund bears directly, it also indirectly bears a pro-rata share of the fees and expenses of the underlying funds in which it invests. Such indirect expenses are not included in the above expense ratios. |
| | Year Ended October 31, |
| Class R1 | 2022 | | 2021 | | 2020 | | 2019 | | 2018 |
| Net asset value at beginning of year | $ 5.62 | | $ 5.40 | | $ 5.60 | | $ 5.52 | | $ 5.77 |
| Net investment income (loss) (a) | 0.25 | | 0.25 | | 0.30 | | 0.30 | | 0.30 |
| Net realized and unrealized gain (loss) | (0.73) | | 0.26 | | (0.17) | | 0.11 | | (0.22) |
| Total from investment operations | (0.48) | | 0.51 | | 0.13 | | 0.41 | | 0.08 |
| Less distributions: | | | | | | | | | |
| From net investment income | (0.25) | | (0.26) | | (0.30) | | (0.30) | | (0.30) |
| Return of capital | (0.02) | | (0.03) | | (0.03) | | (0.03) | | (0.03) |
| Total distributions | (0.27) | | (0.29) | | (0.33) | | (0.33) | | (0.33) |
| Net asset value at end of year | $ 4.87 | | $ 5.62 | | $ 5.40 | | $ 5.60 | | $ 5.52 |
| Total investment return (b) | (8.77)% | | 9.55% | | 2.45% | | 7.58% | | 1.46% |
| Ratios (to average net assets)/Supplemental Data: | | | | | | | | | |
| Net investment income (loss) | 4.74% | | 4.51% | | 5.52% | | 5.36% | | 5.25% |
| Net expenses (c) | 0.80% | | 0.80% | | 0.82% | | 0.84% | | 0.84% |
| Portfolio turnover rate | 16% | | 40% | | 38% | | 30% | | 30% |
| Net assets at end of year (in 000’s) | $ 52 | | $ 62 | | $ 51 | | $ 53 | | $ 72 |
| (a) | Per share data based on average shares outstanding during the year. |
| (b) | Total investment return is calculated exclusive of sales charges and assumes the reinvestment of dividends and distributions. Class R1 shares are not subject to sales charges. For periods of less than one year, total return is not annualized. |
| (c) | In addition to the fees and expenses which the Fund bears directly, it also indirectly bears a pro-rata share of the fees and expenses of the underlying funds in which it invests. Such indirect expenses are not included in the above expense ratios. |
The notes to the financial statements are an integral part of, and should be read in conjunction with, the financial statements.
31
Financial Highlights selected per share data and ratios
| | Year Ended October 31, |
| Class R2 | 2022 | | 2021 | | 2020 | | 2019 | | 2018 |
| Net asset value at beginning of year | $ 5.63 | | $ 5.41 | | $ 5.61 | | $ 5.52 | | $ 5.77 |
| Net investment income (loss) (a) | 0.23 | | 0.24 | | 0.29 | | 0.28 | | 0.29 |
| Net realized and unrealized gain (loss) | (0.73) | | 0.26 | | (0.18) | | 0.12 | | (0.22) |
| Total from investment operations | (0.50) | | 0.50 | | 0.11 | | 0.40 | | 0.07 |
| Less distributions: | | | | | | | | | |
| From net investment income | (0.23) | | (0.25) | | (0.28) | | (0.29) | | (0.29) |
| Return of capital | (0.02) | | (0.03) | | (0.03) | | (0.02) | | (0.03) |
| Total distributions | (0.25) | | (0.28) | | (0.31) | | (0.31) | | (0.32) |
| Net asset value at end of year | $ 4.88 | | $ 5.63 | | $ 5.41 | | $ 5.61 | | $ 5.52 |
| Total investment return (b) | (8.98)% | | 9.28% | | 2.17% | | 7.49% | | 1.20% |
| Ratios (to average net assets)/Supplemental Data: | | | | | | | | | |
| Net investment income (loss) | 4.45% | | 4.28% | | 5.26% | | 5.10% | | 5.06% |
| Net expenses (c) | 1.05% | | 1.05% | | 1.07% | | 1.09% | | 1.09% |
| Portfolio turnover rate | 16% | | 40% | | 38% | | 30% | | 30% |
| Net assets at end of year (in 000’s) | $ 6,949 | | $ 10,640 | | $ 13,006 | | $ 13,866 | | $ 11,116 |
| (a) | Per share data based on average shares outstanding during the year. |
| (b) | Total investment return is calculated exclusive of sales charges and assumes the reinvestment of dividends and distributions. Class R2 shares are not subject to sales charges. For periods of less than one year, total return is not annualized. |
| (c) | In addition to the fees and expenses which the Fund bears directly, it also indirectly bears a pro-rata share of the fees and expenses of the underlying funds in which it invests. Such indirect expenses are not included in the above expense ratios. |
| | Year Ended October 31, |
| Class R3 | 2022 | | 2021 | | 2020 | | 2019 | | 2018 |
| Net asset value at beginning of year | $ 5.62 | | $ 5.40 | | $ 5.60 | | $ 5.52 | | $ 5.77 |
| Net investment income (loss) (a) | 0.22 | | 0.22 | | 0.27 | | 0.27 | | 0.27 |
| Net realized and unrealized gain (loss) | (0.72) | | 0.26 | | (0.17) | | 0.11 | | (0.22) |
| Total from investment operations | (0.50) | | 0.48 | | 0.10 | | 0.38 | | 0.05 |
| Less distributions: | | | | | | | | | |
| From net investment income | (0.22) | | (0.23) | | (0.27) | | (0.28) | | (0.28) |
| Return of capital | (0.02) | | (0.03) | | (0.03) | | (0.02) | | (0.02) |
| Total distributions | (0.24) | | (0.26) | | (0.30) | | (0.30) | | (0.30) |
| Net asset value at end of year | $ 4.88 | | $ 5.62 | | $ 5.40 | | $ 5.60 | | $ 5.52 |
| Total investment return (b) | (9.07)% | | 9.01% | | 1.90% | | 7.03% | | 0.96% |
| Ratios (to average net assets)/Supplemental Data: | | | | | | | | | |
| Net investment income (loss) | 4.25% | | 3.98% | | 4.96% | | 4.84% | | 4.77% |
| Net expenses (c) | 1.30% | | 1.30% | | 1.32% | | 1.34% | | 1.34% |
| Portfolio turnover rate | 16% | | 40% | | 38% | | 30% | | 30% |
| Net assets at end of year (in 000’s) | $ 3,482 | | $ 3,630 | | $ 1,924 | | $ 1,281 | | $ 606 |
| (a) | Per share data based on average shares outstanding during the year. |
| (b) | Total investment return is calculated exclusive of sales charges and assumes the reinvestment of dividends and distributions. Class R3 shares are not subject to sales charges. For periods of less than one year, total return is not annualized. |
| (c) | In addition to the fees and expenses which the Fund bears directly, it also indirectly bears a pro-rata share of the fees and expenses of the underlying funds in which it invests. Such indirect expenses are not included in the above expense ratios. |
The notes to the financial statements are an integral part of, and should be read in conjunction with, the financial statements.
| 32 | MainStay MacKay High Yield Corporate Bond Fund |
Financial Highlights selected per share data and ratios
| | Year Ended October 31, |
| Class R6 | 2022 | | 2021 | | 2020 | | 2019 | | 2018 |
| Net asset value at beginning of year | $ 5.61 | | $ 5.40 | | $ 5.60 | | $ 5.52 | | $ 5.77 |
| Net investment income (loss) (a) | 0.26 | | 0.27 | | 0.31 | | 0.31 | | 0.31 |
| Net realized and unrealized gain (loss) | (0.72) | | 0.24 | | (0.17) | | 0.11 | | (0.21) |
| Total from investment operations | (0.46) | | 0.51 | | 0.14 | | 0.42 | | 0.10 |
| Less distributions: | | | | | | | | | |
| From net investment income | (0.26) | | (0.27) | | (0.31) | | (0.31) | | (0.32) |
| Return of capital | (0.02) | | (0.03) | | (0.03) | | (0.03) | | (0.03) |
| Total distributions | (0.28) | | (0.30) | | (0.34) | | (0.34) | | (0.35) |
| Net asset value at end of year | $ 4.87 | | $ 5.61 | | $ 5.40 | | $ 5.60 | | $ 5.52 |
| Total investment return (b) | (8.36)% | | 9.64% | | 2.70% | | 7.84% | | 1.71% |
| Ratios (to average net assets)/Supplemental Data: | | | | | | | | | |
| Net investment income (loss) | 4.98% | | 4.79% | | 5.65% | | 5.60% | | 5.54% |
| Net expenses (c) | 0.57% | | 0.57% | | 0.58% | | 0.58% | | 0.58% |
| Portfolio turnover rate | 16% | | 40% | | 38% | | 30% | | 30% |
| Net assets at end of year (in 000’s) | $ 3,609,591 | | $ 3,697,586 | | $ 4,420,424 | | $ 2,180,977 | | $ 904,028 |
| (a) | Per share data based on average shares outstanding during the year. |
| (b) | Total investment return is calculated exclusive of sales charges and assumes the reinvestment of dividends and distributions. Class R6 shares are not subject to sales charges. For periods of less than one year, total return is not annualized. |
| (c) | In addition to the fees and expenses which the Fund bears directly, it also indirectly bears a pro-rata share of the fees and expenses of the underlying funds in which it invests. Such indirect expenses are not included in the above expense ratios. |
| | Year Ended October 31, | | August 31, 2020^ through
October 31, |
| SIMPLE Class | 2022 | | 2021 | | 2020 |
| Net asset value at beginning of period | $ 5.67 | | $ 5.45 | | $ 5.54 |
| Net investment income (loss) (a) | 0.22 | | 0.23 | | 0.04 |
| Net realized and unrealized gain (loss) | (0.73) | | 0.25 | | (0.08) |
| Total from investment operations | (0.51) | | 0.48 | | (0.04) |
| Less distributions: | | | | | |
| From net investment income | (0.22) | | (0.23) | | (0.05) |
| Return of capital | (0.02) | | (0.03) | | (0.00)‡ |
| Total distributions | (0.24) | | (0.26) | | (0.05) |
| Net asset value at end of period | $ 4.92 | | $ 5.67 | | $ 5.45 |
| Total investment return (b) | (9.14)% | | 8.98% | | (0.72)% |
| Ratios (to average net assets)/Supplemental Data: | | | | | |
| Net investment income (loss) | 4.23% | | 4.00% | | 4.74%†† |
| Net expenses (c) | 1.34% | | 1.33% | | 1.30%†† |
| Portfolio turnover rate | 16% | | 40% | | 38% |
| Net assets at end of period (in 000’s) | $ 32 | | $ 27 | | $ 25 |
| ^ | Inception date. |
| ‡ | Less than one cent per share. |
| †† | Annualized. |
| (a) | Per share data based on average shares outstanding during the period. |
| (b) | Total investment return is calculated exclusive of sales charges and assumes the reinvestment of dividends and distributions. SIMPLE Class shares are not subject to sales charges. For periods of less than one year, total return is not annualized. |
| (c) | In addition to the fees and expenses which the Fund bears directly, it also indirectly bears a pro-rata share of the fees and expenses of the underlying funds in which it invests. Such indirect expenses are not included in the above expense ratios. |
The notes to the financial statements are an integral part of, and should be read in conjunction with, the financial statements.
33
Notes to Financial Statements
Note 1-Organization and Business
The MainStay Funds (the “Trust”) was organized on January 9, 1986, as a Massachusetts business trust. The Trust is registered under the Investment Company Act of 1940, as amended (the “1940 Act”), as an open-end management investment company, and is comprised of twelve funds (collectively referred to as the "Funds"). These financial statements and notes relate to the MainStay MacKay High Yield Corporate Bond Fund (the "Fund"), a “diversified” fund, as that term is defined in the 1940 Act, as interpreted or modified by regulatory authorities having jurisdiction, from time to time.
The following table lists the Fund's share classes that have been registered and commenced operations:
| Class | Commenced Operations |
| Class A | January 3, 1995 |
| Investor Class | February 28, 2008 |
| Class B | May 1, 1986 |
| Class C | September 1, 1998 |
| Class I | January 2, 2004 |
| Class R1 | June 29, 2012 |
| Class R2 | May 1, 2008 |
| Class R3 | February 29, 2016 |
| Class R6 | June 17, 2013 |
| SIMPLE Class | August 31, 2020 |
Class B shares of the MainStay Group of Funds are closed to all new purchases as well as additional investments by existing Class B shareholders. Existing Class B shareholders may continue to reinvest dividends and capital gains distributions, as well as exchange their Class B shares for Class B shares of other funds in the MainStay Group of Funds as permitted by the current exchange privileges. Class B shareholders continue to be subject to any applicable contingent deferred sales charge ("CDSC") at the time of redemption. All other features of the Class B shares, including but not limited to the fees and expenses applicable to Class B shares, remain unchanged. Unless redeemed, Class B shareholders will remain in Class B shares of their respective fund until the Class B shares are converted to Class A or Investor Class shares pursuant to the applicable conversion schedule.
Class A and Investor Class shares are offered at net asset value (“NAV”) per share plus an initial sales charge. No initial sales charge applies to investments of $1 million or more (and certain other qualified purchases) in Class A and Investor Class shares. However, a CDSC of 1.00% may be imposed on certain redemptions made within 18 months of the date of purchase on shares that were purchased without an initial sales charge. Class C shares are offered at NAV without an initial sales charge, although a 1.00% CDSC may be imposed on certain redemptions of such shares made within one year of the date of purchase of Class C shares. When Class B shares were offered, they were offered at NAV without an initial sales charge, although a CDSC that declines depending on the number of years a shareholder held its Class B shares may be imposed on certain redemptions of such shares made within six years of the date
of purchase of such shares. Class I, Class R1, Class R2, Class R3, Class R6 and SIMPLE Class shares are offered at NAV without a sales charge. Depending upon eligibility, Class B shares convert to either Class A or Investor Class shares at the end of the calendar quarter eight years after the date they were purchased. In addition, depending upon eligibility, Class C shares convert to either Class A or Investor Class shares at the end of the calendar quarter eight years after the date they were purchased. Additionally, Investor Class shares may convert automatically to Class A shares. SIMPLE Class shares convert to Class A shares, or Investor Class shares if you are not eligible to hold Class A shares, at the end of the calendar quarter, ten years after the date they were purchased. Share class conversions are based on the relevant NAVs of the two classes at the time of the conversion, and no sales load or other charge is imposed. Under certain circumstances and as may be permitted by the Trust’s multiple class plan pursuant to Rule 18f-3 under the 1940 Act, specified share classes of the Fund may be converted to one or more other share classes of the Fund as disclosed in the capital share trans-actions within these Notes. The classes of shares have the same voting (except for issues that relate solely to one class), dividend, liquidation and other rights, and the same terms and conditions, except that under distribution plans pursuant to Rule 12b-1 under the 1940 Act, Class B and Class C shares are subject to higher distribution and/or service fees than Class A, Investor Class, Class R2, Class R3 and SIMPLE Class shares. Class I, Class R1 and Class R6 shares are not subject to a distribution and/or service fee. Class R1, Class R2 and Class R3 shares are subject to a shareholder service fee, which is in addition to fees paid under the distribution plans for Class R2 and Class R3 shares.
The Fund's investment objective is to seek maximum current income through investment in a diversified portfolio of high-yield debt securities. Capital appreciation is a secondary objective.
Note 2–Significant Accounting Policies
The Fund is an investment company and accordingly follows the investment company accounting and reporting guidance of the Financial Accounting Standards Board (“FASB”) Accounting Standards Codification Topic 946 Financial Services—Investment Companies. The Fund prepares its financial statements in accordance with generally accepted accounting principles (“GAAP”) in the United States of America and follows the significant accounting policies described below.
(A) Securities Valuation. Investments are usually valued as of the close of regular trading on the New York Stock Exchange (the "Exchange") (usually 4:00 p.m. Eastern time) on each day the Fund is open for business ("valuation date").
Effective September 8, 2022, and pursuant to Rule 2a-5 under the 1940 Act, the Board of Trustees of the Trust (the "Board") designated New York Life Investment Management LLC (“New York Life Investments” or the "Manager") as its Valuation Designee (the "Valuation Designee"). The Valuation Designee is responsible for performing fair valuations relating to all investments in the Fund’s portfolio for which market quotations are not readily available; periodically assessing and managing material valuation
| 34 | MainStay MacKay High Yield Corporate Bond Fund |
risks; establishing and applying fair value methodologies; testing fair valuation methodologies; evaluating and overseeing pricing services; segregation of valuation and portfolio management functions; providing quarterly, annual and prompt reporting to the Board, as appropriate; identifying potential conflicts of interest; and maintaining appropriate records. The Valuation Designee has established a valuation committee ("Valuation Committee") to assist in carrying out the Valuation Designee’s responsibilities and establish prices of securities for which market quotations are not readily available. The Fund’s and the Valuation Designee's policies and procedures ("Valuation Procedures") govern the Valuation Designee’s selection and application of methodologies for determining and calculating the fair value of Fund investments. The Valuation Designee may value Fund portfolio securities for which market quotations are not readily available and other Fund assets utilizing inputs from pricing services and other third-party sources (together, “Pricing Sources”). The Valuation Committee meets (in person, via electronic mail or via teleconference) on an ad-hoc basis to determine fair valuations and on a quarterly basis to review fair value events (excluding fair valuations from pricing services), including valuation risks and back-testing results, and preview reports to the Board.
The Valuation Committee establishes prices of securities for which market quotations are not readily available based on such methodologies and measurements on a regular basis after considering information that is reasonably available and deemed relevant by the Valuation Committee. The Board shall oversee the Valuation Designee and review fair valuation materials on a prompt, quarterly and annual basis and approve proposed revisions to the Valuation Procedures.
Investments for which market quotations are not readily available are valued at fair value as determined in good faith pursuant to the Valuation Procedures. A market quotation is readily available only when that quotation is a quoted price (unadjusted) in active markets for identical investments that the Fund can access at the measurement date, provided that a quotation will not be readily available if it is not reliable. Fair value measurements are determined within a framework that establishes a three-tier hierarchy that maximizes the use of observable market data and minimizes the use of unobservable inputs to establish a classification of fair value measurements for disclosure purposes. "Inputs" refer broadly to the assumptions that market participants would use in pricing the asset or liability, including assumptions about risk, such as the risk inherent in a particular valuation technique used to measure fair value using a pricing model and/or the risk inherent in the inputs for the valuation technique. Inputs may be observable or unobservable. Observable inputs reflect the assumptions market participants would use in pricing the asset or liability based on market data obtained from sources independent of the Fund. Unobservable inputs reflect the Fund’s own assumptions about the assumptions market participants would use in pricing the asset or liability based on the information available. The inputs or methodology used for valuing assets or liabilities may not be an indication of the risks associated with investing in those assets or liabilities. The three-tier hierarchy of inputs is summarized below.
| • | Level 1—quoted prices (unadjusted) in active markets for an identical asset or liability |
| • | Level 2—other significant observable inputs (including quoted prices for a similar asset or liability in active markets, interest rates and yield curves, prepayment speeds, credit risk, etc.) |
| • | Level 3—significant unobservable inputs (including the Fund's own assumptions about the assumptions that market participants would use in measuring fair value of an asset or liability) |
The level of an asset or liability within the fair value hierarchy is based on the lowest level of an input, both individually and in the aggregate, that is significant to the fair value measurement. The aggregate value by input level of the Fund’s assets and liabilities as of October 31, 2022, is included at the end of the Portfolio of Investments.
The Fund may use third-party vendor evaluations, whose prices may be derived from one or more of the following standard inputs, among others:
| • Benchmark yields | • Reported trades |
| • Broker/dealer quotes | • Issuer spreads |
| • Two-sided markets | • Benchmark securities |
| • Bids/offers | • Reference data (corporate actions or material event notices) |
| • Industry and economic events | • Comparable bonds |
| • Monthly payment information | |
An asset or liability for which a market quotation is not readily available is valued by methods deemed reasonable in good faith by the Valuation Committee, following the Valuation Procedures to represent fair value. Under these procedures, the Valuation Designee generally uses a market-based approach which may use related or comparable assets or liabilities, recent transactions, market multiples, book values and other relevant information. The Valuation Designee may also use an income-based valuation approach in which the anticipated future cash flows of the asset or liability are discounted to calculate fair value. Discounts may also be applied due to the nature and/or duration of any restrictions on the disposition of the asset or liability. Fair value represents a good faith approximation of the value of a security. Fair value determinations involve the consideration of a number of subjective factors, an analysis of applicable facts and circumstances and the exercise of judgment. As a result, it is possible that the fair value for a security determined in good faith in accordance with the Valuation Procedures may differ from valuations for the same security determined for other funds using their own valuation procedures. Although the Valuation Procedures are designed to value a security at the price the Fund may reasonably expect to receive upon the security's sale in an orderly transaction, there can be no assurance that any fair value determination thereunder would, in fact, approximate the amount that the Fund would actually realize upon the sale of the security or the price at which the security would trade if a reliable market price were readily available. During the year ended October 31, 2022, there were no material changes to the fair value methodologies.
Notes to Financial Statements (continued)
Securities which may be valued in this manner include, but are not limited to: (i) a security for which trading has been halted or suspended or otherwise does not have a readily available market quotation on a given day; (ii) a debt security that has recently gone into default and for which there is not a current market quotation; (iii) a security of an issuer that has entered into a restructuring; (iv) a security that has been delisted from a national exchange; (v) a security subject to trading collars for which no or limited trading takes place; and (vi) a security whose principal market has been temporarily closed at a time when, under normal conditions, it would be open. Securities valued in this manner are generally categorized as Level 2 or 3 in the hierarchy.
Equity securities, including exchange-traded funds ("ETFs"), are valued at the last quoted sales prices as of the close of regular trading on the relevant exchange on each valuation date. Securities that are not traded on the valuation date are valued at the mean of the last quoted bid and ask prices. Prices are normally taken from the principal market in which each security trades. These securities are generally categorized as Level 1 in the hierarchy.
Debt securities (other than convertible and municipal bonds) are valued at the evaluated bid prices (evaluated mean prices in the case of convertible and municipal bonds) supplied by a pricing agent or broker selected by the Valuation Designee, in consultation with the Subadvisor. The evaluations are market-based measurements processed through a pricing application and represents the pricing agent’s good faith determination as to what a holder may receive in an orderly transaction under market conditions. The rules-based logic utilizes valuation techniques that reflect participants’ assumptions and vary by asset class and per methodology, maximizing the use of relevant observable data including quoted prices for similar assets, benchmark yield curves and market corroborated inputs. The evaluated bid or mean prices are deemed by the Valuation Designee, in consultation with the Subadvisor, to be representative of market values at the regular close of trading of the Exchange on each valuation date. Debt securities purchased on a delayed delivery basis are marked to market daily until settlement at the forward settlement date. Debt securities, including corporate bonds, U.S. government and federal agency bonds, municipal bonds, foreign bonds, convertible bonds, asset-backed securities and mortgage-backed securities are generally categorized as Level 2 in the hierarchy.
Loan assignments, participations and commitments are valued at the average of bid quotations obtained from the engaged independent pricing service and are generally categorized as Level 2 in the hierarchy. Certain loan assignments, participations and commitments may be valued by utilizing significant unobservable inputs obtained from the pricing service and are generally categorized as Level 3 in the hierarchy. No securities held by the Fund as of October 31, 2022 were fair valued utilizing significant unobservable inputs obtained from the pricing service.
The information above is not intended to reflect an exhaustive list of the methodologies that may be used to value portfolio investments. The Valuation Procedures permit the use of a variety of valuation methodologies in connection with valuing portfolio investments. The
methodology used for a specific type of investment may vary based on the market data available or other considerations. The methodologies summarized above may not represent the specific means by which portfolio investments are valued on any particular business day.
A portfolio investment may be classified as an illiquid investment under the Fund's written liquidity risk management program and related procedures (“Liquidity Program”). Illiquidity of an investment might prevent the sale of such investment at a time when the Manager or the Subadvisor might wish to sell, and these investments could have the effect of decreasing the overall level of the Fund's liquidity. Further, the lack of an established secondary market may make it more difficult to value illiquid investments, requiring the Fund to rely on judgments that may be somewhat subjective in measuring value, which could vary materially from the amount that the Fund could realize upon disposition. Difficulty in selling illiquid investments may result in a loss or may be costly to the Fund. An illiquid investment is any investment that the Manager or Subadvisor reasonably expects cannot be sold or disposed of in current market conditions in seven calendar days or less without the sale or disposition significantly changing the market value of the investment. The liquidity classification of each investment will be made using information obtained after reasonable inquiry and taking into account, among other things, relevant market, trading and investment-specific considerations in accordance with the Liquidity Program. Illiquid investments are often fair valued in accordance with the Fund's procedures described above. The liquidity of the Fund's investments was determined as of October 31, 2022, and can change at any time. Illiquid investments as of October 31, 2022, are shown in the Portfolio of Investments.
(B) Income Taxes. The Fund’s policy is to comply with the requirements of the Internal Revenue Code of 1986, as amended (the “Internal Revenue Code”), applicable to regulated investment companies and to distribute all of its taxable income to the shareholders of the Fund within the allowable time limits.
The Manager evaluates the Fund’s tax positions to determine if the tax positions taken meet the minimum recognition threshold in connection with accounting for uncertainties in income tax positions taken or expected to be taken for the purposes of measuring and recognizing tax liabilities in the financial statements. Recognition of tax benefits of an uncertain tax position is permitted only to the extent the position is “more likely than not” to be sustained assuming examination by taxing authorities. The Manager analyzed the Fund’s tax positions taken on federal, state and local income tax returns for all open tax years (for up to three tax years) and has concluded that no provisions for federal, state and local income tax are required in the Fund’s financial statements. The Fund’s federal, state and local income tax and federal excise tax returns for tax years for which the applicable statutes of limitations have not expired are subject to examination by the Internal Revenue Service and state and local departments of revenue.
| 36 | MainStay MacKay High Yield Corporate Bond Fund |
(C) Dividends and Distributions to Shareholders. Dividends and distributions are recorded on the ex-dividend date. The Fund intends to declare and pay dividends from net investment income, if any, at least monthly and distributions from net realized capital and currency gains, if any, at least annually. Unless a shareholder elects otherwise, all dividends and distributions are reinvested at NAV in the same class of shares of the Fund. Dividends and distributions to shareholders are determined in accordance with federal income tax regulations and may differ from determinations using GAAP.
Effective with the January 2023 distribution, which is expected to be paid on January 31, 2023, the Fund will begin to pay a floating dividend rather than a fixed rate dividend each month.
(D) Security Transactions and Investment Income. The Fund records security transactions on the trade date. Realized gains and losses on security transactions are determined using the identified cost method. Dividend income is recognized on the ex-dividend date, net of any foreign tax withheld at the source, and interest income is accrued as earned using the effective interest rate method. Distributions received from real estate investment trusts may be classified as dividends, capital gains and/or return of capital. Discounts and premiums on securities purchased for the Fund are accreted and amortized, respectively, on the effective interest rate method. Income from payment-in-kind securities is accreted daily based on the effective interest method.
Investment income and realized and unrealized gains and losses on investments of the Fund are allocated pro rata to the separate classes of shares based upon their relative net assets on the date the income is earned or realized and unrealized gains and losses are incurred.
The Fund may place a debt security on non-accrual status and reduce related interest income by ceasing current accruals and writing off all or a portion of any interest receivables when the collection of all or a portion of such interest has become doubtful. A debt security is removed from non-accrual status when the issuer resumes interest payments or when collectability of interest is reasonably assured.
(E) Expenses. Expenses of the Trust are allocated to the individual Funds in proportion to the net assets of the respective Funds when the expenses are incurred, except where direct allocations of expenses can be made. Expenses (other than transfer agent expenses and fees incurred under the shareholder services plans and/or the distribution plans further discussed in Note 3(B)) are allocated to separate classes of shares pro rata based upon their relative net assets on the date the expenses are incurred. The expenses borne by the Fund, including those of related parties to the Fund, are shown in the Statement of Operations.
Additionally, the Fund may invest in ETFs and mutual funds, which are subject to management fees and other fees that may cause the costs of investing in ETFs and mutual funds to be greater than the costs of owning the underlying securities directly. These indirect expenses of ETFs and mutual funds are not included in the amounts shown as expenses in the Statement of Operations or in the expense ratios included in the Financial Highlights.
(F) Use of Estimates. In preparing financial statements in conformity with GAAP, the Manager makes estimates and assumptions that affect the reported amounts and disclosures in the financial statements. Actual results could differ from those estimates and assumptions.
(G) Loan Assignments, Participations and Commitments. The Fund may invest in loan assignments and participations ("loans"). Commitments are agreements to make money available to a borrower in a specified amount, at a specified rate and within a specified time. The Fund records an investment when the borrower withdraws money on a commitment or when a funded loan is purchased (trade date) and records interest as earned. These loans pay interest at rates that are periodically reset by reference to a base lending rate plus a spread. These base lending rates are generally the prime rate offered by a designated U.S. bank, the London Interbank Offered Rate ("LIBOR") or an alternative reference rate.
The loans in which the Fund may invest are generally readily marketable, but may be subject to some restrictions on resale. For example, the Fund may be contractually obligated to receive approval from the agent bank and/or borrower prior to the sale of these investments. If the Fund purchases an assignment from a lender, the Fund will generally have direct contractual rights against the borrower in favor of the lender. If the Fund purchases a participation interest either from a lender or a participant, the Fund typically will have established a direct contractual relationship with the seller of the participation interest, but not with the borrower. Consequently, the Fund is subject to the credit risk of the lender or participant who sold the participation interest to the Fund, in addition to the usual credit risk of the borrower. In the event that the borrower, selling participant or intermediate participants become insolvent or enter into bankruptcy, the Fund may incur certain costs and delays in realizing payment, or may suffer a loss of principal and/or interest.
Unfunded commitments represent the remaining obligation of the Fund to the borrower. At any point in time, up to the maturity date of the issue, the borrower may demand the unfunded portion. Unfunded amounts, if any, are marked to market and any unrealized gains or losses are recorded in the Statement of Assets and Liabilities. As of October 31, 2022, the Fund did not hold any unfunded commitments.
(H) Rights and Warrants. Rights are certificates that permit the holder to purchase a certain number of shares, or a fractional share, of a new stock from the issuer at a specific price. Warrants are instruments that entitle the holder to buy an equity security at a specific price for a specific period of time. These investments can provide a greater potential for profit or loss than an equivalent investment in the underlying security. Prices of these investments do not necessarily move in tandem with the prices of the underlying securities.
There is risk involved in the purchase of rights and warrants in that these investments are speculative investments. The Fund could also lose the entire value of its investment in warrants if such warrants are not exercised by the date of its expiration. The Fund is exposed to risk until
Notes to Financial Statements (continued)
the sale or exercise of each right or warrant is completed. Warrants as of October 31, 2022 are shown in the Portfolio of Investments.
(I) Debt Securities Risk. The ability of issuers of debt securities held by the Fund to meet their obligations may be affected by, among other things, economic or political developments in a specific country, industry or region. Debt securities are also subject to the risks associated with changes in interest rates. The Fund primarily invests in high-yield debt securities (commonly referred to as “junk bonds”), which are considered speculative because they present a greater risk of loss, including default, than higher rated debt securities. These securities pay investors a premium—a higher interest rate or yield than investment grade debt securities—because of the increased risk of loss. These securities can also be subject to greater price volatility. In times of unusual or adverse market, economic or political conditions, these securities may experience higher than normal default rates.
The loans in which the Fund invests are usually rated below investment grade, or if unrated, determined by the Subadvisor to be of comparable quality (commonly referred to as “junk bonds”) and are generally considered speculative because they present a greater risk of loss, including default, than higher quality debt securities. Moreover, such securities may, under certain circumstances, be particularly susceptible to liquidity and valuation risks.
Although certain loans are collateralized, there is no guarantee that the value of the collateral will be sufficient to repay the loan. In a recession or serious credit event, the value of these investments could decline significantly. As a result, the Fund’s NAVs could go down and you could lose money.
In addition, loans generally are subject to extended settlement periods that may be longer than seven days. As a result, the Fund may be adversely affected by selling other investments at an unfavorable time and/or under unfavorable conditions or engaging in borrowing transactions, such as borrowing against its credit facility, to raise cash to meet redemption obligations or pursue other investment opportunities.
In certain circumstances, loans may not be deemed to be securities. As a result, the Fund may not have the protection of the anti-fraud provisions of the federal securities laws. In such cases, the Fund generally must rely on the contractual provisions in the loan agreement and common-law fraud protections under applicable state law.
(J) LIBOR Replacement Risk. The Fund may invest in certain debt securities, derivatives or other financial instruments that utilize the LIBOR, as a “benchmark” or “reference rate” for various interest rate calculations. As of January 1, 2022, the United Kingdom Financial Conduct Authority, which regulates LIBOR, ceased its active encouragement of banks to provide the quotations needed to sustain most LIBOR rates due to the absence of an active market for interbank unsecured lending and other reasons. However, the United Kingdom Financial Conduct Authority, the LIBOR administrator and other regulators announced that certain sterling and yen LIBOR settings would be calculated on a "synthetic" basis through the end of 2022 and the most
widely used tenors of U.S. dollar LIBOR will continue until mid-2023. As a result, it is anticipated that the remaining LIBOR settings will be discontinued or will no longer be sufficiently robust to be representative of its underlying market around that time. Various financial industry groups will plan for that transition and certain regulators and industry groups have taken actions to establish alternative reference rates (e.g., the Secured Overnight Financing Rate, which measures the cost of overnight borrowings through repurchase agreement transactions collateralized with U.S. Treasury securities and is intended to replace U.S. dollar LIBOR with certain adjustments). However, there are challenges to converting certain contracts and transactions to a new benchmark and neither the full effects of the transition process nor its ultimate outcome is known.
The elimination of LIBOR or changes to other reference rates or any other changes or reforms to the determination or supervision of reference rates could have an adverse impact on the market for, or value of, any securities or payments linked to those reference rates, which may adversely affect the Fund's performance and/or net asset value. Uncertainty and risk also remain regarding the willingness and ability of issuers and lenders to include enhanced provisions in new and existing contracts or instruments. Consequently, the transition away from LIBOR to other reference rates may lead to increased volatility and illiquidity in markets that are tied to LIBOR, fluctuations in values of LIBOR-related investments or investments in issuers that utilize LIBOR, increased difficulty in borrowing or refinancing and diminished effectiveness of hedging strategies, adversely affecting the Fund's performance. Furthermore, the risks associated with the expected discontinuation of LIBOR and transition may be exacerbated if the work necessary to effect an orderly transition to an alternative reference rate is not completed in a timely manner. While the transition away from LIBOR has already begun with no material adverse effect to the Fund's performance, the transition is expected to last through mid-2023 for some LIBOR tenors. The usefulness of LIBOR as a benchmark could deteriorate anytime during this transition period.
(K) Indemnifications. Under the Trust’s organizational documents, its officers and trustees are indemnified against certain liabilities that may arise out of performance of their duties to the Trust. Additionally, in the normal course of business, the Fund enters into contracts with third-party service providers that contain a variety of representations and warranties and that may provide general indemnifications. The Fund's maximum exposure under these arrangements is unknown, as this would involve future claims that may be made against the Fund that have not yet occurred. The Manager believes that the risk of loss in connection with these potential indemnification obligations is remote. However, there can be no assurance that material liabilities related to such obligations will not arise in the future, which could adversely impact the Fund.
Note 3–Fees and Related Party Transactions
(A) Manager and Subadvisor. New York Life Investments, a registered investment adviser and an indirect, wholly-owned subsidiary of New York Life Insurance Company ("New York Life"), serves as the Fund's
| 38 | MainStay MacKay High Yield Corporate Bond Fund |
Manager, pursuant to an Amended and Restated Management Agreement ("Management Agreement"). The Manager provides offices, conducts clerical, recordkeeping and bookkeeping services and keeps most of the financial and accounting records required to be maintained by the Fund. Except for the portion of salaries and expenses that are the responsibility of the Fund, the Manager pays the salaries and expenses of all personnel affiliated with the Fund and certain operational expenses of the Fund. During a portion of the year ended October 31, 2022, the Fund reimbursed New York Life Investments in an amount equal to the portion of the compensation of the Chief Compliance Officer attributable to the Fund. MacKay Shields LLC ("MacKay Shields" or the "Subadvisor"), a registered investment adviser and an indirect, wholly-owned subsidiary of New York Life, serves as the Subadvisor to the Fund and is responsible for the day-to-day portfolio management of the Fund. Pursuant to the terms of an Amended and Restated Subadvisory Agreement ("Subadvisory Agreement") between New York Life Investments and MacKay Shields, New York Life Investments pays for the services of the Subadvisor.
Pursuant to the Management Agreement, the Fund pays the Manager a monthly fee for the services performed and the facilities furnished at an annual rate of the Fund’s average daily net assets as follows: 0.60% up to $500 million; 0.55% from $500 million up to $5 billion; 0.525% from $5 billion up to $7 billion; 0.50% from $7 billion up to $10 billion; 0.49% from $10 billion to $15 billion; and 0.48% in excess of $15 billion, plus a fee for fund accounting services previously provided by New York Life Investments under a separate fund accounting agreement furnished at an annual rate of the Fund’s average daily net assets as follows: 0.05% up to $20 million; 0.0333% from $20 million to $100 million; and 0.01% in excess of $100 million. During the year ended October 31, 2022, the effective management fee rate was 0.54%, inclusive of a fee for fund accounting services of 0.01% of the Fund’s average daily net assets.
New York Life Investments has contractually agreed to waive fees and/or reimburse expenses so that Total Annual Fund Operating Expenses (excluding taxes, interest, litigation, extraordinary expenses, brokerage and other transaction expenses relating to the purchase or sale of portfolio investments and acquired (underlying) fund fees and expenses) of Class R6 do not exceed those of Class I. This agreement will remain in effect until February 28, 2023, and shall renew automatically for one-year terms unless New York Life Investments provides written notice of termination prior to the start of the next term or upon approval of the Board.
During the year ended October 31, 2022, New York Life Investments earned fees from the Fund in the amount of $59,788,878 and paid the Subadvisor in the amount of $29,325,504.
JPMorgan provides sub-administration and sub-accounting services to the Fund pursuant to an agreement with New York Life Investments. These services include calculating the daily NAVs of the Fund, maintaining the general ledger and sub-ledger accounts for the calculation of the Fund's NAVs, and assisting New York Life Investments in conducting various aspects of the Fund's administrative operations. For
providing these services to the Fund, JPMorgan is compensated by New York Life Investments.
Pursuant to an agreement between the Trust and New York Life Investments, New York Life Investments is responsible for providing or procuring certain regulatory reporting services for the Fund. The Fund will reimburse New York Life Investments for the actual costs incurred by New York Life Investments in connection with providing or procuring these services for the Fund.
(B) Distribution and Service Fees. The Trust, on behalf of the Fund, has entered into a distribution agreement with NYLIFE Distributors LLC (the “Distributor”), an affiliate of New York Life Investments. The Fund has adopted distribution plans (the “Plans”) in accordance with the provisions of Rule 12b-1 under the 1940 Act.
Pursuant to the Class A, Investor Class and Class R2 Plans, the Distributor receives a monthly fee from the Class A, Investor Class and Class R2 shares at an annual rate of 0.25% of the average daily net assets of the Class A, Investor Class and Class R2 shares for distribution and/or service activities as designated by the Distributor. Pursuant to the Class B and Class C Plans, Class B and Class C shares pay the Distributor a monthly distribution fee at an annual rate of 0.75% of the average daily net assets of the Class B and Class C shares, along with a service fee at an annual rate of 0.25% of the average daily net assets of the Class B and Class C shares, for a total 12b-1 fee of 1.00%. Pursuant to the Class R3 and SIMPLE Class Plans, Class R3 and SIMPLE Class shares pay the Distributor a monthly distribution fee at an annual rate of 0.25% of the average daily net assets of the Class R3 and SIMPLE Class shares, along with a service fee at an annual rate of 0.25% of the average daily net assets of the Class R3 and SIMPLE Class shares, for a total 12b-1 fee of 0.50%. Class I, Class R1 and Class R6 shares are not subject to a distribution and/or service fee.
The Plans provide that the distribution and service fees are payable to the Distributor regardless of the amounts actually expended by the Distributor for distribution of the Fund's shares and service activities.
In accordance with the Shareholder Services Plans for the Class R1, Class R2 and Class R3 shares, the Manager has agreed to provide, through its affiliates or independent third parties, various shareholder and administrative support services to shareholders of the Class R1, Class R2 and Class R3 shares. For its services, the Manager, its affiliates or independent third-party service providers are entitled to a shareholder service fee accrued daily and paid monthly at an annual rate of 0.10% of the average daily net assets of the Class R1, Class R2 and Class R3 shares. This is in addition to any fees paid under the Class R2 and Class R3 Plans.
Notes to Financial Statements (continued)
During the year ended October 31, 2022, shareholder service fees incurred by the Fund were as follows:
| |
| Class R1 | $ 53 |
| Class R2 | 8,290 |
| Class R3 | 3,604 |
(C) Sales Charges. The Fund was advised by the Distributor that the amount of initial sales charges retained on sales of Class A and Investor Class shares during the year ended October 31, 2022, were $459,819 and $23,777, respectively.
The Fund was also advised that the Distributor retained CDSCs on redemptions of Class A, Class B and Class C shares during the year ended October 31, 2022, of $88,658, $2,087 and $11,347, respectively.
(D) Transfer, Dividend Disbursing and Shareholder Servicing Agent. NYLIM Service Company LLC, an affiliate of New York Life Investments, is the Fund's transfer, dividend disbursing and shareholder servicing agent pursuant to an agreement between NYLIM Service Company LLC and the Trust. NYLIM Service Company LLC has entered into an agreement with DST Asset Manager Solutions, Inc. ("DST"), pursuant to which DST performs certain transfer agent services on behalf of NYLIM Service Company LLC. New York Life Investments has contractually agreed to limit the transfer agency expenses charged to the Fund’s share classes to a maximum of 0.35% of that share class’s average daily net assets on an annual basis after deducting any applicable Fund or class-level expense reimbursement or small account fees. This agreement will remain in effect until February 28, 2023, and shall renew automatically for one-year terms unless New York Life Investments provides written notice of termination prior to the start of the next term or upon approval of the Board. During the year ended October 31, 2022, transfer agent expenses incurred by the Fund and any reimbursements, pursuant to the aforementioned Transfer Agency expense limitation agreement, were as follows:
| Class | Expense | Waived |
| Class A | $4,597,309 | $— |
| Investor Class | 340,151 | — |
| Class B | 52,836 | — |
| Class C | 456,306 | — |
| Class I | 4,945,501 | — |
| Class R1 | 71 | — |
| Class R2 | 10,994 | — |
| Class R3 | 4,819 | — |
| Class R6 | 144,067 | — |
| SIMPLE Class | 87 | — |
(E) Small Account Fee. Shareholders with small accounts adversely impact the cost of providing transfer agency services. In an effort to reduce total transfer agency expenses, the Fund has implemented a small account fee on certain types of accounts. As described in the Fund's
prospectus, certain shareholders with an account balance of less than $1,000 ($5,000 for Class A share accounts) are charged an annual per account fee of $20 (assessed semi-annually), the proceeds from which offset transfer agent fees as reflected in the Statement of Operations. This small account fee will not apply to certain types of accounts as described further in the Fund’s prospectus.
(F) Capital. As of October 31, 2022, New York Life and its affiliates beneficially held shares of the Fund with the values and percentages of net assets as follows:
| Class I | $10,899,883 | 0.3% |
| Class R1 | 38,696 | 73.7 |
| SIMPLE Class | 24,479 | 75.4 |
Note 4-Federal Income Tax
As of October 31, 2022, the cost and unrealized appreciation (depreciation) of the Fund’s investment portfolio, including applicable derivative contracts and other financial instruments, as determined on a federal income tax basis, were as follows:
| | Federal Tax
Cost | Gross
Unrealized
Appreciation | Gross
Unrealized
(Depreciation) | Net
Unrealized
Appreciation/
(Depreciation) |
| Investments in Securities | $10,562,487,370 | $136,650,122 | $(1,201,125,786) | $(1,064,475,664) |
As of October 31, 2022, the components of accumulated gain (loss) on a tax basis were as follows:
Ordinary
income | Accumulated
Capital
and Other
Gain (Loss) | Other
Temporary
Differences | Unrealized
Appreciation
(Depreciation) | Total
Accumulated
Gain (Loss) |
| $— | $(313,938,826) | $(2,932,869) | $(1,064,503,093) | $(1,381,374,788) |
The difference between book-basis and tax-basis unrealized appreciation (depreciation) is primarily due to wash sales and cumulative bond amortization adjustments. The other temporary differences are primarily due to dividends payable.
As of October 31, 2022, for federal income tax purposes, capital loss carryforwards of $313,938,826, as shown in the table below, were available to the extent provided by the regulations to offset future realized gains of the Fund. Accordingly, no capital gains distributions are expected to be paid to shareholders until net gains have been realized in excess of such amounts.
Capital Loss
Available Through | Short-Term
Capital Loss
Amounts (000’s) | Long-Term
Capital Loss
Amounts (000’s) |
| Unlimited | $22,588 | $291,351 |
| 40 | MainStay MacKay High Yield Corporate Bond Fund |
During the years ended October 31, 2022 and October 31, 2021, the tax character of distributions paid as reflected in the Statements of Changes in Net Assets was as follows:
| | 2022 | 2021 |
| Distributions paid from: | | |
| Ordinary Income | $533,740,938 | $570,654,487 |
| Return of Capital | 36,706,413 | 62,849,947 |
| Total | $570,447,351 | $633,504,434 |
Note 5–Restricted Securities
Restricted securities are subject to legal or contractual restrictions on resale. Private placement securities are generally considered to be restricted except for those securities traded between qualified institutional investors under the provisions of Rule 144A of the Securities Act of 1933, as amended. Disposal of restricted securities may involve time consuming negotiations and expenses, and prompt sale at an acceptable price may be difficult to achieve.
As of October 31, 2022, restricted securities held by the Fund were as follows:
| Security | Date(s) of
Acquisition | Principal
Amount/
Shares | Cost | 10/31/22
Value | Percent of
Net Assets |
| Briggs & Stratton Corp. Escrow Claim Shares |
Corporate Bond
6.875%, due 12/15/20 | 2/26/21 | $ 9,200,000 | $ 9,323,706 | $ 92,000 | 0.0%‡ |
| Carlson Travel, Inc. |
| Common Stock | 9/4/20 - 12/23/21 | 1,979,502 | 48,453,024 | 13,189,838 | 0.1 |
| GenOn Energy, Inc. |
| Common Stock | 12/14/18 | 386,241 | 43,250,890 | 40,555,305 | 0.4 |
| Gulfport Energy Operating Corp. |
| Preferred Stock | 8/4/21 - 12/16/21 | 150 | 148,000 | 831,843 | 0.0‡ |
| Neenah Enterprises, Inc. |
| Common Stock | 4/12/20 | 720,961 | — | 167,624 | 0.0‡ |
| Sterling Entertainment Enterprises LLC |
Corporate Bond
10.25%, due 1/15/25 | 12/28/17 | $ 20,000,000 | 19,882,005 | 18,360,000 | 0.2 |
| Total | | | $121,057,625 | $ 73,196,610 | 0.7% |
| ‡ | Less than one-tenth of a percent. |
Note 6–Custodian
JPMorgan is the custodian of cash and securities held by the Fund. Custodial fees are charged to the Fund based on the Fund's net assets and/or the market value of securities held by the Fund and the number of certain transactions incurred by the Fund.
Note 7–Line of Credit
The Fund and certain other funds managed by New York Life Investments maintain a line of credit with a syndicate of banks in order to secure a source of funds for temporary purposes to meet unanticipated or excessive redemption requests.
Effective July 26, 2022, under the credit agreement (the “Credit Agreement”), the aggregate commitment amount is $600,000,000 with an additional uncommitted amount of $100,000,000. The commitment
fee is an annual rate of 0.15% of the average commitment amount payable quarterly, regardless of usage, to JPMorgan, who serves as the agent to the syndicate. The commitment fee is allocated among the Fund and certain other funds managed by New York Life Investments based upon their respective net assets and other factors. Interest on any revolving credit loan is charged based upon the Federal Funds Rate, Daily Simple Secured Overnight Financing Rate ("SOFR") + 0.10%, or the Overnight Bank Funding Rate, whichever is higher. The Credit Agreement expires on July 25, 2023, although the Fund, certain other funds managed by New York Life Investments and the syndicate of banks may renew the Credit Agreement for an additional year on the same or different terms or enter into a credit agreement with a different syndicate of banks. Prior to July 26, 2022, the aggregate commitment amount and the commitment fee were the same as those under the current Credit Agreement. During the year ended October 31, 2022, there were no
Notes to Financial Statements (continued)
borrowings made or outstanding with respect to the Fund under the Credit Agreement.
Note 8–Interfund Lending Program
Pursuant to an exemptive order issued by the SEC, the Fund, along with certain other funds managed by New York Life Investments, may participate in an interfund lending program. The interfund lending program provides an alternative credit facility that permits the Fund and certain other funds managed by New York Life Investments to lend or borrow money for temporary purposes directly to or from one another, subject to the conditions of the exemptive order. During the year ended October 31, 2022, there were no interfund loans made or outstanding with respect to the Fund.
Note 9–Purchases and Sales of Securities (in 000’s)
During the year ended October 31, 2022, purchases and sales of securities, other than short-term securities, were $1,689,065 and $2,150,623, respectively.
The Fund may purchase securities from or sell securities to other portfolios managed by the Subadvisor. These interportfolio transactions are primarily used for cash management purposes and are made pursuant to Rule 17a-7 under the 1940 Act. During the year ended October 31, 2022, such purchases were $999.
Note 10–Capital Share Transactions
Transactions in capital shares for the years ended October 31, 2022 and October 31, 2021, were as follows:
| Class A | Shares | Amount |
| Year ended October 31, 2022: | | |
| Shares sold | 96,269,574 | $ 504,848,483 |
| Shares issued to shareholders in reinvestment of distributions | 28,431,851 | 148,029,559 |
| Shares redeemed | (193,311,873) | (1,015,581,405) |
| Net increase (decrease) in shares outstanding before conversion | (68,610,448) | (362,703,363) |
| Shares converted into Class A (See Note 1) | 5,071,164 | 26,422,459 |
| Shares converted from Class A (See Note 1) | (233,056) | (1,222,885) |
| Net increase (decrease) | (63,772,340) | $ (337,503,789) |
| Year ended October 31, 2021: | | |
| Shares sold | 182,959,300 | $ 1,025,339,543 |
| Shares issued to shareholders in reinvestment of distributions | 30,312,090 | 170,864,213 |
| Shares redeemed | (184,263,914) | (1,037,267,473) |
| Net increase (decrease) in shares outstanding before conversion | 29,007,476 | 158,936,283 |
| Shares converted into Class A (See Note 1) | 13,304,124 | 74,965,256 |
| Shares converted from Class A (See Note 1) | (738,769) | (4,105,394) |
| Net increase (decrease) | 41,572,831 | $ 229,796,145 |
| |
| Investor Class | Shares | Amount |
| Year ended October 31, 2022: | | |
| Shares sold | 1,314,685 | $ 7,006,900 |
| Shares issued to shareholders in reinvestment of distributions | 1,121,506 | 5,871,610 |
| Shares redeemed | (2,565,213) | (13,569,137) |
| Net increase (decrease) in shares outstanding before conversion | (129,022) | (690,627) |
| Shares converted into Investor Class (See Note 1) | 647,159 | 3,427,758 |
| Shares converted from Investor Class (See Note 1) | (1,299,262) | (6,923,010) |
| Net increase (decrease) | (781,125) | $ (4,185,879) |
| Year ended October 31, 2021: | | |
| Shares sold | 2,019,528 | $ 11,484,430 |
| Shares issued to shareholders in reinvestment of distributions | 1,208,390 | 6,860,244 |
| Shares redeemed | (2,683,946) | (15,254,757) |
| Net increase (decrease) in shares outstanding before conversion | 543,972 | 3,089,917 |
| Shares converted into Investor Class (See Note 1) | 1,170,092 | 6,648,892 |
| Shares converted from Investor Class (See Note 1) | (4,618,620) | (26,265,419) |
| Net increase (decrease) | (2,904,556) | $ (16,526,610) |
| |
| 42 | MainStay MacKay High Yield Corporate Bond Fund |
| Class B | Shares | Amount |
| Year ended October 31, 2022: | | |
| Shares sold | 51,684 | $ 276,043 |
| Shares issued to shareholders in reinvestment of distributions | 128,906 | 673,604 |
| Shares redeemed | (1,235,556) | (6,393,498) |
| Net increase (decrease) in shares outstanding before conversion | (1,054,966) | (5,443,851) |
| Shares converted from Class B (See Note 1) | (1,019,213) | (5,298,623) |
| Net increase (decrease) | (2,074,179) | $ (10,742,474) |
| Year ended October 31, 2021: | | |
| Shares sold | 88,863 | $ 498,977 |
| Shares issued to shareholders in reinvestment of distributions | 223,935 | 1,254,633 |
| Shares redeemed | (2,893,905) | (16,203,403) |
| Net increase (decrease) in shares outstanding before conversion | (2,581,107) | (14,449,793) |
| Shares converted from Class B (See Note 1) | (1,142,315) | (6,416,728) |
| Net increase (decrease) | (3,723,422) | $ (20,866,521) |
| |
| Class C | Shares | Amount |
| Year ended October 31, 2022: | | |
| Shares sold | 1,972,074 | $ 10,211,162 |
| Shares issued to shareholders in reinvestment of distributions | 1,235,498 | 6,431,044 |
| Shares redeemed | (12,067,962) | (63,194,114) |
| Net increase (decrease) in shares outstanding before conversion | (8,860,390) | (46,551,908) |
| Shares converted from Class C (See Note 1) | (2,062,605) | (10,660,509) |
| Net increase (decrease) | (10,922,995) | $ (57,212,417) |
| Year ended October 31, 2021: | | |
| Shares sold | 5,342,346 | $ 29,948,303 |
| Shares issued to shareholders in reinvestment of distributions | 1,751,952 | 9,827,127 |
| Shares redeemed | (17,257,202) | (96,733,225) |
| Net increase (decrease) in shares outstanding before conversion | (10,162,904) | (56,957,795) |
| Shares converted from Class C (See Note 1) | (6,710,654) | (37,512,191) |
| Net increase (decrease) | (16,873,558) | $ (94,469,986) |
| |
| Class I | Shares | Amount |
| Year ended October 31, 2022: | | |
| Shares sold | 287,464,303 | $ 1,510,050,594 |
| Shares issued to shareholders in reinvestment of distributions | 34,206,122 | 178,206,439 |
| Shares redeemed | (406,328,774) | (2,107,290,774) |
| Net increase (decrease) in shares outstanding before conversion | (84,658,349) | (419,033,741) |
| Shares converted into Class I (See Note 1) | 252,101 | 1,317,383 |
| Shares converted from Class I (See Note 1) | (115,407) | (559,921) |
| Net increase (decrease) | (84,521,655) | $ (418,276,279) |
| Year ended October 31, 2021: | | |
| Shares sold | 252,182,456 | $ 1,423,359,102 |
| Shares issued to shareholders in reinvestment of distributions | 34,136,456 | 192,459,085 |
| Shares redeemed | (200,939,792) | (1,134,669,152) |
| Net increase (decrease) in shares outstanding before conversion | 85,379,120 | 481,149,035 |
| Shares converted into Class I (See Note 1) | 745,634 | 4,142,155 |
| Shares converted from Class I (See Note 1) | (3,354,187) | (18,908,988) |
| Net increase (decrease) | 82,770,567 | $ 466,382,202 |
| |
| Class R1 | Shares | Amount |
| Year ended October 31, 2022: | | |
| Shares sold | 2,588 | $ 12,727 |
| Shares issued to shareholders in reinvestment of distributions | 531 | 2,753 |
| Shares redeemed | (3,382) | (17,585) |
| Net increase (decrease) | (263) | $ (2,105) |
| Year ended October 31, 2021: | | |
| Shares sold | 1,473 | $ 8,263 |
| Shares issued to shareholders in reinvestment of distributions | 541 | 3,046 |
| Shares redeemed | (366) | (2,073) |
| Net increase (decrease) | 1,648 | $ 9,236 |
| |
Notes to Financial Statements (continued)
| Class R2 | Shares | Amount |
| Year ended October 31, 2022: | | |
| Shares sold | 313,412 | $ 1,646,320 |
| Shares issued to shareholders in reinvestment of distributions | 57,136 | 298,793 |
| Shares redeemed | (831,012) | (4,462,692) |
| Net increase (decrease) in shares outstanding before conversion | (460,464) | (2,517,579) |
| Shares converted from Class R2 (See Note 1) | (7,330) | (35,801) |
| Net increase (decrease) | (467,794) | $ (2,553,380) |
| Year ended October 31, 2021: | | |
| Shares sold | 452,963 | $ 2,558,748 |
| Shares issued to shareholders in reinvestment of distributions | 76,461 | 431,139 |
| Shares redeemed | (1,040,259) | (5,766,291) |
| Net increase (decrease) in shares outstanding before conversion | (510,835) | (2,776,404) |
| Shares converted from Class R2 (See Note 1) | (2,744) | (15,506) |
| Net increase (decrease) | (513,579) | $ (2,791,910) |
| |
| Class R3 | Shares | Amount |
| Year ended October 31, 2022: | | |
| Shares sold | 196,243 | $ 1,015,558 |
| Shares issued to shareholders in reinvestment of distributions | 29,907 | 155,148 |
| Shares redeemed | (139,286) | (714,740) |
| Net increase (decrease) in shares outstanding before conversion | 86,864 | 455,966 |
| Shares converted from Class R3 (See Note 1) | (19,036) | (93,846) |
| Net increase (decrease) | 67,828 | $ 362,120 |
| Year ended October 31, 2021: | | |
| Shares sold | 365,846 | $ 2,061,921 |
| Shares issued to shareholders in reinvestment of distributions | 24,106 | 135,884 |
| Shares redeemed | (99,976) | (563,591) |
| Net increase (decrease) | 289,976 | $ 1,634,214 |
| |
| Class R6 | Shares | Amount |
| Year ended October 31, 2022: | | |
| Shares sold | 234,416,558 | $ 1,212,223,525 |
| Shares issued to shareholders in reinvestment of distributions | 37,129,569 | 192,071,459 |
| Shares redeemed | (187,677,935) | (973,813,565) |
| Net increase (decrease) in shares outstanding before conversion | 83,868,192 | 430,481,419 |
| Shares converted into Class R6 (See Note 1) | 1,001 | 5,033 |
| Shares converted from Class R6 (See Note 1) | (1,230,526) | (6,378,038) |
| Net increase (decrease) | 82,638,667 | $ 424,108,414 |
| Year ended October 31, 2021: | | |
| Shares sold | 206,190,406 | $ 1,162,402,222 |
| Shares issued to shareholders in reinvestment of distributions | 37,259,768 | 209,442,428 |
| Shares redeemed | (405,022,996) | (2,279,825,918) |
| Net increase (decrease) in shares outstanding before conversion | (161,572,822) | (907,981,268) |
| Shares converted into Class R6 (See Note 1) | 3,360,148 | 18,908,988 |
| Shares converted from Class R6 (See Note 1) | (2,026,448) | (11,445,445) |
| Net increase (decrease) | (160,239,122) | $ (900,517,725) |
| |
| SIMPLE Class | Shares | Amount |
| Year ended October 31, 2022: | | |
| Shares sold | 1,542 | $ 8,728 |
| Shares issued to shareholders in reinvestment of distributions | 285 | 1,486 |
| Net increase (decrease) | 1,827 | $ 10,214 |
| Year ended October 31, 2021: | | |
| Shares issued to shareholders in reinvestment of distributions | 216 | $ 1,228 |
| Shares redeemed | (774) | (4,380) |
| Net increase (decrease) in shares outstanding before conversion | (558) | (3,152) |
| Shares converted into SIMPLE Class (See Note 1) | 774 | 4,380 |
| Net increase (decrease) | 216 | $ 1,228 |
Note 11–Other Matters
As of the date of this report, interest rates in the United States and many parts of the world, including certain European countries, are ascending from historically low levels. Thus, the Fund currently faces a heightened level of risk associated with rising interest rates. This could be driven by a variety of factors, including but not limited to central bank monetary policies, changing inflation or real growth rates, general economic conditions, increasing bond issuances or reduced market demand for low yielding investments.
An outbreak of COVID-19, first detected in December 2019, has developed into a global pandemic and has resulted in travel restrictions,
| 44 | MainStay MacKay High Yield Corporate Bond Fund |
closure of international borders, certain businesses and securities markets, restrictions on securities trading activities, prolonged quarantines, supply chain disruptions, and lower consumer demand, as well as general concern and uncertainty. In 2022, many countries lifted some or all restrictions related to COVID-19. However, the continued impact of COVID-19 and related variants is uncertain and could further adversely affect the global economy, national economies, individual issuers and capital markets in unforeseeable ways and result in a substantial and extended economic downturn. Developments that disrupt global economies and financial markets, such as COVID-19, may magnify factors that affect the Fund's performance.
Note 12–Subsequent Events
In connection with the preparation of the financial statements of the Fund as of and for the year ended October 31, 2022, events and transactions subsequent to October 31, 2022, through the date the financial statements were issued have been evaluated by the Manager for possible adjustment and/or disclosure. No subsequent events requiring financial statement adjustment or disclosure have been identified.
Report of Independent Registered Public Accounting Firm
To the Shareholders of the Fund and Board of Trustees
The MainStay Funds:
Opinion on the Financial Statements
We have audited the accompanying statement of assets and liabilities of MainStay MacKay High Yield Corporate Bond Fund (the Fund), one of the funds constituting The MainStay Funds, including the portfolio of investments, as of October 31, 2022, the related statement of operations for the year then ended, the statements of changes in net assets for each of the years in the two-year period then ended, and the related notes (collectively, the financial statements) and the financial highlights for each of the years or periods in the five-year period then ended. In our opinion, the financial statements and financial highlights present fairly, in all material respects, the financial position of the Fund as of October 31, 2022, the results of its operations for the year then ended, the changes in its net assets for each of the years in the two-year period then ended, and the financial highlights for each of the years or periods in the five-year period then ended, in conformity with U.S. generally accepted accounting principles.
Basis for Opinion
These financial statements and financial highlights are the responsibility of the Fund's management. Our responsibility is to express an opinion on these financial statements and financial highlights based on our audits. We are a public accounting firm registered with the Public Company Accounting Oversight Board (United States) (PCAOB) and are required to be independent with respect to the Fund in accordance with the U.S. federal securities laws and the applicable rules and regulations of the Securities and Exchange Commission and the PCAOB.
We conducted our audits in accordance with the standards of the PCAOB. Those standards require that we plan and perform the audit to obtain reasonable assurance about whether the financial statements and financial highlights are free of material misstatement, whether due to error or fraud. Our audits included performing procedures to assess the risks of material misstatement of the financial statements and financial highlights, whether due to error or fraud, and performing procedures that respond to those risks. Such procedures included examining, on a test basis, evidence regarding the amounts and disclosures in the financial statements and financial highlights. Such procedures also included confirmation of securities owned as of October 31, 2022, by correspondence with custodians, agent banks and brokers; when replies were not received from agent banks and brokers, we performed other auditing procedures. Our audits also included evaluating the accounting principles used and significant estimates made by management, as well as evaluating the overall presentation of the financial statements and financial highlights. We believe that our audits a reasonable basis for our opinion.

We have served as the auditor of one or more New York Life Investment Management investment companies since 2003.
Philadelphia, Pennsylvania
December 23, 2022
| 46 | MainStay MacKay High Yield Corporate Bond Fund |
Federal Income Tax Information
(Unaudited)
The Fund is required under the Internal Revenue Code to advise shareholders in a written statement as to the federal tax status of dividends paid by the Fund during such fiscal years.
For the fiscal year ended October 31, 2022, the Fund designated approximately $323,872 under the Internal Revenue Code as qualified dividend income eligible for reduced tax rates.
The dividends paid by the Fund during the fiscal year ended October 31, 2022 should be multiplied by 0.05% to arrive at the amount eligible for the corporate dividend-received deduction.
In February 2023, shareholders will receive an IRS Form 1099-DIV or substitute Form 1099, which will show the federal tax status of the distributions received by shareholders in calendar year 2022. The amounts that will be reported on such 1099-DIV or substitute Form 1099 will be the amounts you are to use on your federal income tax return and will differ from the amounts which we must report for the Fund's fiscal year ended October 31, 2022.
Proxy Voting Policies and Procedures and Proxy Voting Record
The Fund is required to file with the SEC its proxy voting record for the 12-month period ending June 30 on Form N-PX. A description of the policies and procedures that are used to vote proxies relating to portfolio securities of the Fund is available free of charge upon request by calling 800-624-6782 or visiting the SEC’s website at www.sec.gov. The most recent Form N-PX or proxy voting record is available free of charge upon request by calling 800-624-6782; visiting newyorklifeinvestments.com; or visiting the SEC’s website at www.sec.gov.
Shareholder Reports and Quarterly Portfolio Disclosure
The Fund is required to file its complete schedule of portfolio holdings with the SEC 60 days after its first and third fiscal quarter on Form N-PORT. The Fund's holdings report is available free of charge upon request by calling New York Life Investments at 800-624-6782.
Board of Trustees and Officers (Unaudited)
The Trustees and officers of the Fund are listed below. The Board oversees the MainStay Group of Funds (which consists of MainStay Funds and MainStay Funds Trust), MainStay VP Funds Trust, MainStay MacKay DefinedTerm Municipal Opportunities Fund, MainStay CBRE Global Infrastructure Megatrends Fund, the Manager and the Subadvisors, and elects the officers of the Funds who are responsible for the day-to-day operations of the Fund. Information pertaining to the Trustees and officers is set forth below. Each Trustee serves until his or her successor is
elected and qualified or until his or her resignation, death or removal. Under the Board’s retirement policy, unless an exception is made, a Trustee must tender his or her resignation by the end of the calendar year during which he or she reaches the age of 75. The business address of each Trustee and officer listed below is 51 Madison Avenue, New York, New York 10010. None of the Trustees are “interested persons” (as defined by the 1940 Act and rules adopted by the SEC thereunder) of the Fund (“Independent Trustees”).
| | Name and
Year of Birth | Term of Office,
Position(s) Held and
Length of Service | Principal Occupation(s)
During Past Five Years | Number of
Portfolios in
Fund Complex
Overseen by
Trustee | Other Directorships
Held by Trustee |
| | | | | | |
| | Yie-Hsin Hung*
1962 | MainStay Funds: Trustee
since 2017;
MainStay Funds Trust:
Trustee since 2017 | Senior Vice President of New York Life since joining in 2010, Member of the Executive Management Committee since 2017, Chief Executive Officer, New York Life Investment Management Holdings LLC & New York Life Investment Management LLC since 2015. Senior Managing Director and Co-President of New York Life Investment Management LLC from January 2014 to May 2015. Previously held positions of increasing responsibility, including head of NYLIM International, Alternative Growth Businesses, and Institutional investments since joining New York Life in 2010 | 78 | MainStay VP Funds Trust:
Trustee since 2017 (31 portfolios);
MainStay MacKay DefinedTerm Municipal Opportunities Fund: Trustee
since 2017;
MainStay CBRE Global Infrastructure Megatrends Fund: Trustee
since March 2021; and
Turtle Beach Corporation: Director since April 2021 |
| * | This Trustee is considered to be an “interested person” of the MainStay Group of Funds, MainStay VP Funds Trust, MainStay CBRE Global Infrastructure Megatrends Fund and MainStay MacKay DefinedTerm Municipal Opportunities Fund, within the meaning of the 1940 Act because of her affiliation with New York Life Insurance Company, New York Life Investment Management LLC, Candriam Belgium S.A., Candriam Luxembourg S.C.A., IndexIQ Advisors LLC, MacKay Shields LLC, NYL Investors LLC, NYLIFE Securities LLC and/or NYLIFE Distributors LLC, as described in detail above in the column entitled “Principal Occupation(s) During Past Five Years.” |
| | |
| 48 | MainStay MacKay High Yield Corporate Bond Fund |
| | Name and
Year of Birth | Term of Office,
Position(s) Held and
Length of Service | Principal Occupation(s)
During Past Five Years | Number of
Portfolios in
Fund Complex
Overseen by
Trustee | Other Directorships
Held by Trustee |
| | | | | | |
| | David H. Chow
1957 | MainStay Funds: Trustee since 2016, Advisory Board Member (June 2015 to December 2015);MainStay Funds Trust:
Trustee since January 2016, Advisory Board Member (June 2015 to December 2015) | Founder and CEO, DanCourt Management, LLC since 1999 | 78 | MainStay VP Funds Trust: Trustee since January 2016, Advisory Board Member (June 2015 to December 2015) (31 portfolios);
MainStay MacKay DefinedTerm Municipal Opportunities Fund: Trustee since January 2016, Advisory Board Member (June 2015 to December 2015);
MainStay CBRE Global Infrastructure Megatrends Fund: Trustee since June 2021; VanEck Vectors Group of Exchange-Traded Funds: Independent Chairman of the Board of Trustees since 2008 and Trustee since 2006 (56 portfolios); and Berea College of Kentucky: Trustee since 2009, Chair of the Investment Committee since 2018 |
| | Susan B. Kerley
1951 | MainStay Funds: Chairman since 2017 and Trustee since 2007;MainStay Funds Trust:
Chairman since 2017 and Trustee since 1990** | President, Strategic Management Advisors LLC since 1990 | 78 | MainStay VP Funds Trust: Chairman since January 2017 and Trustee since 2007 (31 portfolios)**;
MainStay MacKay DefinedTerm Municipal Opportunities Fund: Chairman since 2017 and Trustee since 2011;
MainStay CBRE Global Infrastructure Megatrends Fund: Trustee since June 2021; and Legg Mason Partners Funds: Trustee since 1991 (45 portfolios) |
| | Alan R. Latshaw
1951 | MainStay Funds: Trustee since 2006;MainStay Funds Trust:
Trustee since 2007*** | Retired; Partner, Ernst & Young LLP (2002 to 2003); Partner, Arthur Andersen LLP (1989 to 2002); Consultant to the MainStay Funds Audit and Compliance Committee (2004 to 2006) | 78 | MainStay VP Funds Trust: Trustee since 2007 (31 portfolios)**;
MainStay MacKay DefinedTerm Municipal Opportunities Fund: Trustee since 2011; and
MainStay CBRE Global Infrastructure Megatrends Fund: Trustee since June 2021 |
| | Karen Hammond
1956 | MainStay Funds: Trustee since December 2021, Advisory Board Member (June 2021 to December 2021);MainStay Funds Trust:
Trustee since December 2021, Advisory Board Member (June 2021 to December 2021)
| Retired, Managing Director, Devonshire Investors (2007 to 2013); Senior Vice President, Fidelity Management & Research Co. (2005 to 2007); Senior Vice President and Corporate Treasurer, FMR Corp. (2003 to 2005); Chief Operating Officer, Fidelity Investments Japan (2001 to 2003) | 78 | MainStay VP Funds Trust: Trustee since December 2021, Advisory Board Member (June 2021 to December 2021) (31 Portfolios);
MainStay MacKay DefinedTerm Municipal Opportunities Fund: Trustee since December 2021, Advisory Board Member (June 2021 to December 2021);
MainStay CBRE Global Infrastructure Megatrends Fund: Trustee since December 2021, Advisory Board Member (June 2021 to December 2021);
Two Harbors Investment Corp.: Director since 2018;
Rhode Island State Investment Commission: Member since 2017; and
Blue Cross Blue Shield of Rhode Island: Director since 2019 |
Board of Trustees and Officers (Unaudited) (continued)
| | Name and
Year of Birth | Term of Office,
Position(s) Held and
Length of Service | Principal Occupation(s)
During Past Five Years | Number of
Portfolios in
Fund Complex
Overseen by
Trustee | Other Directorships
Held by Trustee |
| | | | | | |
| | Jacques P. Perold
1958 | MainStay Funds: Trustee since 2016, Advisory Board Member (June 2015 toDecember 2015);MainStay Funds Trust:
Trustee since January 2016, Advisory Board Member (June 2015 to December 2015) | Founder and Chief Executive Officer, CapShift Advisors LLC (since 2018); President, Fidelity Management & Research Company (2009 to 2014); President and Chief Investment Officer, Geode Capital Management, LLC (2001 to 2009) | 78 | MainStay VP Funds Trust: Trustee since January 2016, Advisory Board Member (June 2015 to December 2015) (31 portfolios);
MainStay MacKay DefinedTerm Municipal Opportunities Fund: Trustee since January 2016, Advisory Board Member (June 2015 to December 2015);
MainStay CBRE Global Infrastructure Megatrends Fund: Trustee since June 2021; Partners in Health: Trustee since 2019; Allstate Corporation: Director since 2015; and MSCI Inc.: Director since 2017 |
| | Richard S. Trutanic
1952 | MainStay Funds: Trustee since 1994;MainStay Funds Trust:
Trustee since 2007*** | Chairman and Chief Executive Officer, Somerset & Company (financial advisory firm) since 2004; Managing Director, The Carlyle Group (private investment firm) (2002 to 2004); Senior Managing Director, Partner and Board Member, Groupe Arnault S.A. (private investment firm) (1999 to 2002) | 78 | MainStay VP Funds Trust: Trustee since 2007 (31 portfolios)**;
MainStay MacKay DefinedTerm Municipal Opportunities Fund: Trustee since 2011; and MainStay CBRE Global Infrastructure Megatrends Fund: Trustee since June 2021 |
| ** | Includes prior service as a Director of MainStay VP Series Fund, Inc., the predecessor to MainStay VP Funds Trust. |
| *** | Includes prior service as a Director/Trustee of certain predecessor entities to MainStay Funds Trust. |
| 50 | MainStay MacKay High Yield Corporate Bond Fund |
| | Name and
Year of Birth | Position(s) Held and
Length of Service | Principal Occupation(s)
During Past Five Years | |
| | | | | |
| | Kirk C. Lehneis
1974 | President, MainStay Funds, MainStay Funds Trust since 2017 | Chief Operating Officer and Senior Managing Director (since 2016), New York Life Investment Management LLC and New York Life Investment Management Holdings LLC; Member of the Board of Managers (since 2017) and Senior Managing Director (since 2018), NYLIFE Distributors LLC; Chairman of the Board and Senior Managing Director, NYLIM Service Company LLC (since 2017); Trustee, President and Principal Executive Officer of IndexIQ Trust, IndexIQ ETF Trust and IndexIQ Active ETF Trust (since January 2018); President, MainStay CBRE Global Infrastructure Megatrends Fund (since 2021), MainStay MacKay DefinedTerm Municipal Opportunities Fund and MainStay VP Funds Trust (since 2017); Senior Managing Director, Global Product Development (From 2015-2016); Managing Director, Product Development (2010 to 2015), New York Life Investment Management LLC | |
| | Jack R. Benintende
1964 | Treasurer and Principal Financial and Accounting Officer, MainStay Funds (since 2007), MainStay Funds Trust (since 2009) | Managing Director, New York Life Investment Management LLC (since 2007); Treasurer and Principal Financial and Accounting Officer, MainStay CBRE Global Infrastructure Megatrends Fund (since 2021), MainStay MacKay DefinedTerm Municipal Opportunities Fund (since 2011) and MainStay VP Funds Trust (since 2007)** and Assistant Treasurer, New York Life Investment Management Holdings LLC (2008 to 2012) | |
| | J. Kevin Gao
1967 | Secretary and Chief Legal Officer, MainStay Funds and MainStay Funds Trust (since 2010) | Managing Director and Associate General Counsel, New York Life Investment Management LLC (since 2010); Secretary and Chief Legal Officer and MainStay CBRE Global Infrastructure Megatrends Fund (since 2021), MainStay MacKay DefinedTerm Municipal Opportunities Fund (since 2011) and MainStay VP Funds Trust (since 2010)** | |
| | Scott T. Harrington
1959 | Vice President— Administration, MainStay Funds (since 2009), MainStay Funds Trust (since 2009) | Managing Director, New York Life Investment Management LLC (including predecessor advisory organizations) (since 2000); Member of the Board of Directors, New York Life Trust Company (since 2009); Vice President—Administration, MainStay CBRE Global Infrastructure Megatrends Fund (since 2021), MainStay MacKay DefinedTerm Municipal Opportunities Fund (since 2011) and MainStay VP Funds Trust (since 2005)** | |
| | Kevin M. Gleason
1967 | Vice President and Chief Compliance Officer, MainStay Funds and MainStay Funds Trust (since June 2022) | Vice President and Chief Compliance Officer, IndexIQ, IndexIQ ETF Trust and Index IQ Active ETF Trust (since June 2022); Vice President and Chief Compliance Officer, MainStay CBRE Global Infrastructure Megatrends Fund, MainStay VP Funds Trust and MainStay MacKay DefinedTerm Municipal Opportunities Fund (since June 2022); Senior Vice President, Voya Investment Management and Chief Compliance Officer, Voya Family of Funds (2012-2022) | |
| * | The officers listed above are considered to be “interested persons” of the MainStay Group of Funds, MainStay VP Funds Trust, MainStay CBRE Global Infrastructure Megatrends Fund and MainStay MacKay DefinedTerm Municipal Opportunities Fund within the meaning of the 1940 Act because of their affiliation with the MainStay Group of Funds, New York Life Insurance Company and/or its affiliates, including New York Life Investment Management LLC, NYLIM Service Company LLC, NYLIFE Securities LLC and/or NYLIFE Distributors LLC, as described in detail in the column captioned “Principal Occupation(s) During Past Five Years.” Officers are elected annually by the Board. |
| ** | Includes prior service as an Officer of MainStay VP Series Fund, Inc., the predecessor to MainStay VP Funds Trust. |
Officers of the Trust (Who are not Trustees)*
This page intentionally left blank.
This page intentionally left blank.
This page intentionally left blank.
Equity
U.S. Equity
MainStay Epoch U.S. Equity Yield Fund
MainStay S&P 500 Index Fund1
MainStay Winslow Large Cap Growth Fund
MainStay WMC Enduring Capital Fund
MainStay WMC Growth Fund
MainStay WMC Small Companies Fund
MainStay WMC Value Fund
International Equity
MainStay Epoch International Choice Fund
MainStay MacKay International Equity Fund
MainStay WMC International Research Equity Fund
Emerging Markets Equity
MainStay Candriam Emerging Markets Equity Fund
Global Equity
MainStay Epoch Capital Growth Fund
MainStay Epoch Global Equity Yield Fund
Fixed Income
Taxable Income
MainStay Candriam Emerging Markets Debt Fund
MainStay Floating Rate Fund
MainStay MacKay High Yield Corporate Bond Fund
MainStay MacKay Short Duration High Yield Fund
MainStay MacKay Strategic Bond Fund
MainStay MacKay Total Return Bond Fund
MainStay MacKay U.S. Infrastructure Bond Fund
MainStay Short Term Bond Fund
Tax-Exempt Income
MainStay MacKay California Tax Free Opportunities Fund2
MainStay MacKay High Yield Municipal Bond Fund
MainStay MacKay New York Tax Free Opportunities Fund3
MainStay MacKay Short Term Municipal Fund
MainStay MacKay Strategic Municipal Allocation Fund
MainStay MacKay Tax Free Bond Fund
Money Market
MainStay Money Market Fund
Mixed Asset
MainStay Balanced Fund
MainStay Income Builder Fund
MainStay MacKay Convertible Fund
Speciality
MainStay CBRE Global Infrastructure Fund
MainStay CBRE Real Estate Fund
MainStay Cushing MLP Premier Fund
Asset Allocation
MainStay Conservative Allocation Fund
MainStay Conservative ETF Allocation Fund
MainStay Defensive ETF Allocation Fund
MainStay Equity Allocation Fund
MainStay Equity ETF Allocation Fund
MainStay ESG Multi-Asset Allocation Fund
MainStay Growth Allocation Fund
MainStay Growth ETF Allocation Fund
MainStay Moderate Allocation Fund
MainStay Moderate ETF Allocation Fund
Manager
New York Life Investment Management LLC
New York, New York
Subadvisors
Candriam4
Strassen, Luxembourg
CBRE Investment Management Listed Real Assets LLC
Radnor, Pennsylvania
Cushing Asset Management, LP
Dallas, Texas
Epoch Investment Partners, Inc.
New York, New York
MacKay Shields LLC4
New York, New York
NYL Investors LLC4
New York, New York
Wellington Management Company LLP
Boston, Massachusetts
Winslow Capital Management, LLC
Minneapolis, Minnesota
Legal Counsel
Dechert LLP
Washington, District of Columbia
Independent Registered Public Accounting Firm
KPMG LLP
Philadelphia, Pennsylvania
Distributor
NYLIFE Distributors LLC4
Jersey City, New Jersey
Custodian
JPMorgan Chase Bank, N.A.
New York, New York
1.
Prior to February 28, 2022, the Fund's name was MainStay MacKay S&P 500 Index Fund.
| 2. | This Fund is registered for sale in AZ, CA, NV, OR, TX, UT, WA and MI (Class A and Class I shares only), and CO, FL, GA, HI, ID, MA, MD, NH, NJ and NY (Class I shares only). |
| 3. | This Fund is registered for sale in CA, CT, DE, FL, MA, NJ, NY and VT. |
| 4. | An affiliate of New York Life Investment Management LLC. |
Not part of the Annual Report
For more information
800-624-6782
newyorklifeinvestments.com
“New York Life Investments” is both a service mark, and the common trade name, of certain investment advisors affiliated with New York Life Insurance Company. The MainStay Funds® are managed by New York Life Investment Management LLC and distributed by NYLIFE Distributors LLC, 30 Hudson Street, Jersey City, NJ 07302, a wholly owned subsidiary of New York Life Insurance Company. NYLIFE Distributors LLC is a Member FINRA/SIPC.
©2022 NYLIFE Distributors LLC. All rights reserved.
| 5013763.2MS229-22 | MSHY11-12/22 |
(NYLIM) NL212
MainStay MacKay International Equity Fund
Message from the President and Annual Report
October 31, 2022
Sign up for e-delivery of your shareholder reports. For full details on e-delivery, including who can participate and what you can receive via e-delivery,
please log in to newyorklifeinvestments.com/accounts.
| Not FDIC/NCUA Insured | Not a Deposit | May Lose Value | No Bank Guarantee | Not Insured by Any Government Agency |
This page intentionally left blank
Message from the President
A series of economic and geopolitical challenges undermined equity and fixed-income markets during the 12-month reporting period ended October 31, 2022. Stocks and bonds alike trended lower in the face of sharply rising interest rates, increasing inflationary pressures, slowing economic growth and Russia’s invasion of Ukraine.
The reporting period began on a mixed note, with concerns about the spreading Omicron variant of the COVID-19 virus and increasingly hawkish statements from the U.S. Federal Reserve (the “Fed”) regarding mounting inflation, countered by bullish sentiment stemming from U.S. economic growth and strong corporate earnings. In January 2022, markets turned decisively negative as comments from the Fed raised the likelihood of rate hikes as early as March, and Russia issued increasingly aggressive threats toward Ukraine. The onset of Russia’s invasion in February exacerbated global inflationary pressures while increasing investor uncertainty. Domestic supply shortages, international trade imbalances and rising inflation caused GDP (gross domestic product) to contract in the first and second quarters of the year, although employment and consumer spending proved resilient. Prices for petroleum surged to multi-year highs, while many key agricultural chemicals and industrial metals climbed as well. Accelerating inflationary forces prompted the Fed to implement its most aggressive interest rate increases since the 1980s with a series of five sharp rate hikes, raising the federal funds rate from a range of 0.00% to 0.25% in March to 3.00% to 3.25% in September, with additional rate hikes expected before the end of the year. International central banks generally followed suit, raising rates by varying degrees in efforts to curb local inflation, although most increases remained significantly more modest than those in the United States. Relatively high U.S. interest rates and risk-averse international sentiment pushed U.S. dollar values higher compared to most other currencies, with the ensuing negative impact on global prices for food, fuel and other key, U.S.-dollar-denominated products.
The effects of these interrelated challenges were felt throughout U.S. and international financial markets. The S&P 500® Index, a widely regarded benchmark of U.S. market performance, declined by more than 14% during the reporting period. Although the energy sector generated strong gains, bolstered by elevated oil and gas prices, most other industry areas recorded losses. The more cyclical and growth-oriented sectors of consumer discretionary, real estate and information technology delivered the
weakest returns, while the traditionally defensive and value-oriented consumer staples, utilities and health care sectors outperformed. International stocks lagged compared to their U.S. counterparts, with some emerging markets, such as China, suffering particularly steep losses. A few markets, however, including Brazil, Mexico and the United Arab Emirates, ended the reporting period with little change. Fixed-income markets saw bond prices broadly decline as yields rose along with interest rates. Short-term yields rose faster than long-term yields, producing a yield curve inversion from July through the end of the reporting period, with long-term rates remaining below short-term rates. While floating-rate instruments, which feature variable interest rates that allow investors to benefit from a rising rate environment, provided a degree of insulation from inflation-driven trends, they were not immune to the market’s widespread declines.
While the Fed acknowledges the costs of rising rates in terms of weaker GDP growth and unsettled financial markets over the short term, its primary focus continues to be the longer-term economic impact of inflation. With the latest figures as of the date of this report showing that inflation remains above 8%, versus a target rate of just 2%, the Fed clearly has a distance yet to go, making further rate increases and market volatility more likely in the coming months. The question remains as to whether the Fed and other central banks will manage a so-called “soft landing,” curbing inflation while avoiding a persistent economic slowdown. If they prove successful, we expect that favorable inflation trends and increasingly attractive valuations in both equity and bond markets should eventually translate into sustainable improvements in the investment environment.
Whatever actions the Fed takes and however financial markets react, as a MainStay investor, you can depend on us to continue providing the insight, expertise and service that have long defined New York Life Investments. Thank you for trusting us to help you meet your investment needs.
Sincerely,
Kirk C. Lehneis
President
The opinions expressed are as of the date of this report and are subject to change. There is no guarantee that any forecast made will come to pass. This material does not constitute investment advice and is not intended as an endorsement of any specific investment. Past performance is no guarantee of future results.
Not part of the Annual Report
Investors should refer to the Fund’s Summary Prospectus and/or Prospectus and consider the Fund’s investment objectives, strategies, risks, charges and expenses carefully before investing. The Summary Prospectus and/or Prospectus contain this and other information about the Fund. You may obtain copies of the Fund’s Summary Prospectus, Prospectus and Statement of Additional Information, which includes information about The MainStay Funds' Trustees, free of charge, upon request, by calling toll-free 800-624-6782, by writing to NYLIFE Distributors LLC, Attn: MainStay Marketing Department, 30 Hudson Street, Jersey City, NJ 07302 or by sending an e-mail to MainStayShareholderServices@nylim.com. These documents are also available via the MainStay Funds’ website at newyorklifeinvestments.com. Please read the Fund’s Summary Prospectus and/or Prospectus carefully before investing.
Investment and Performance Comparison (Unaudited)
Performance data quoted represents past performance. Past performance is no guarantee of future results. Because of market volatility and other factors, current performance may be lower or higher than the figures shown. Investment return and principal value will fluctuate, and as a result, when shares are redeemed, they may be worth more or less than their original cost. The graph below depicts the historical performance of Class I shares of the Fund. Performance will vary from class to class based on differences in class-specific expenses and sales charges. For performance information current to the most recent month-end, please call 800-624-6782 or visit newyorklifeinvestments.com.
The performance table and graph do not reflect the deduction of taxes that a shareholder would pay on distributions or Fund share redemptions. Total returns reflect maximum applicable sales charges as indicated in the table below, if any, changes in share price, and reinvestment of dividend and capital gain distributions. The graph assumes the initial investment amount shown below and reflects the deduction of all sales charges that would have applied for the period of investment. Performance figures may reflect certain fee waivers and/or expense limitations, without which total returns may have been lower. For more information on share classes and current fee waivers and/or expense limitations (if any), please refer to the Notes to Financial Statements.

| Average Annual Total Returns for the Year-Ended October 31, 2022 |
| Class | Sales Charge | | Inception
Date | One
Year | Five
Years | Ten Years
or Since
Inception | Gross
Expense
Ratio1 |
| Class A Shares | Maximum 5.5% Initial Sales Charge | With sales charges | 1/3/1995 | -36.56% | -0.13% | 3.59% | 1.33% |
| | | Excluding sales charges | | -32.87 | 1.01 | 4.17 | 1.33 |
| Investor Class Shares2 | Maximum 5% Initial Sales Charge | With sales charges | 2/28/2008 | -36.42 | -0.48 | 3.23 | 1.71 |
| | | Excluding sales charges | | -33.07 | 0.65 | 3.81 | 1.71 |
| Class B Shares3 | Maximum 5% CDSC | With sales charges | 9/13/1994 | -36.43 | -0.42 | 3.03 | 2.46 |
| | if Redeemed Within the First Six Years of Purchase | Excluding sales charges | | -33.62 | -0.11 | 3.03 | 2.46 |
| Class C Shares | Maximum 1% CDSC | With sales charges | 9/1/1998 | -34.15 | -0.12 | 3.03 | 2.46 |
| | if Redeemed Within One Year of Purchase | Excluding sales charges | | -33.58 | -0.12 | 3.03 | 2.46 |
| Class I Shares | No Sales Charge | | 1/2/2004 | -32.66 | 1.33 | 4.48 | 1.08 |
| Class R1 Shares | No Sales Charge | | 1/2/2004 | -32.79 | 1.16 | 4.33 | 1.18 |
| Class R2 Shares | No Sales Charge | | 1/2/2004 | -32.95 | 0.89 | 4.07 | 1.43 |
| Class R3 Shares | No Sales Charge | | 4/28/2006 | -33.09 | 0.65 | 3.81 | 1.68 |
| Class R6 Shares | No Sales Charge | | 2/28/2019 | -32.64 | N/A | 1.92 | 0.98 |
| 1. | The gross expense ratios presented reflect the Fund’s “Total Annual Fund Operating Expenses” from the most recent Prospectus, as supplemented, and may differ from other expense ratios disclosed in this report. |
| 2. | Prior to June 30, 2020, the maximum initial sales charge was 5.5%, which is reflected in the applicable average annual total return figures shown. |
| 3. | Class B shares are closed to all new purchases as well as additional investments by existing Class B shareholders. |
The footnotes on the next page are an integral part of the table and graph and should be carefully read in conjunction with them.
| Benchmark Performance* | One
Year | Five
Years | Ten
Years |
| MSCI ACWI® ex USA Index (Net)1 | -24.73% | -0.60% | 3.27% |
| MSCI EAFE Index® (Net)2 | -23.00 | -0.09 | 4.13 |
| Morningstar Foreign Large Growth Category Average3 | -32.72 | 0.40 | 4.36 |
| * | Returns for indices reflect no deductions for fees, expenses or taxes, except for foreign withholding taxes where applicable. Results assume reinvestment of all dividends and capital gains. An investment cannot be made directly in an index. |
| 1. | The Fund has selected the MSCI ACWI® (All Country World Index) ex USA Index (Net) as its primary benchmark. The MSCI ACWI® ex USA Index (Net) is a free float-adjusted market capitalization weighted index that is designed to measure the equity market performance of developed and emerging markets, excluding the U.S. |
| 2. | The MSCI EAFE® Index (Net) is the Fund's secondary benchmark. The MSCI EAFE® Index (Net) consists of international stocks representing the developed world outside of North America. |
| 3. | The Morningstar Foreign Large Growth Category Average is representative of funds that focus on high-priced growth stocks, mainly outside of the United States. Most of these funds divide their assets among a dozen or more developed markets, including Japan, Britain, France, and Germany. These funds primarily invest in stocks that have market caps in the top 70% of each economically integrated market and will have less than 20% of assets invested in U.S. stocks. Results are based on average total returns of similar funds with all dividends and capital gain distributions reinvested. |
The footnotes on the preceding page are an integral part of the table and graph and should be carefully read in conjunction with them.
| 6 | MainStay MacKay International Equity Fund |
Cost in Dollars of a $1,000 Investment in MainStay MacKay International Equity Fund (Unaudited)
The example below is intended to describe the fees and expenses borne by shareholders during the six-month period from May 1, 2022 to October 31, 2022, and the impact of those costs on your investment.
Example
As a shareholder of the Fund you incur two types of costs: (1) transaction costs, including exchange fees and sales charges (loads) on purchases (as applicable), and (2) ongoing costs, including management fees, distribution and/or service (12b-1) fees and other Fund expenses (as applicable). This example is intended to help you understand your ongoing costs (in dollars) of investing in the Fund and to compare these costs with the ongoing costs of investing in other mutual funds. The example is based on an investment of $1,000 made at the beginning of the six-month period and held for the entire period from May 1, 2022 to October 31, 2022.
This example illustrates your Fund’s ongoing costs in two ways:
Actual Expenses
The second and third data columns in the table below provide information about actual account values and actual expenses. You may use the information in these columns, together with the amount you invested, to estimate the expenses that you paid during the six months ended October 31, 2022. Simply divide your account value by $1,000 (for example, an
$8,600 account value divided by $1,000 = 8.6), then multiply the result by the number under the heading entitled “Expenses Paid During Period” to estimate the expenses you paid on your account during this period.
Hypothetical Example for Comparison Purposes
The fourth and fifth data columns in the table below provide information about hypothetical account values and hypothetical expenses based on the Fund’s actual expense ratio and an assumed rate of return of 5% per year before expenses, which is not the Fund’s actual return. The hypothetical account values and expenses may not be used to estimate the actual ending account balances or expenses you paid for the six-month period shown. You may use this information to compare the ongoing costs of investing in the Fund with the ongoing costs of investing in other mutual funds. To do so, compare this 5% hypothetical example with the 5% hypothetical examples that appear in the shareholder reports of the other mutual funds.
Please note that the expenses shown in the table are meant to highlight your ongoing costs only and do not reflect any transactional costs, such as exchange fees or sales charges (loads). Therefore, the fourth and fifth data columns of the table are useful in comparing ongoing costs only and will not help you determine the relative total costs of owning different funds. In addition, if these transactional costs were included, your costs would have been higher.
| Share Class | Beginning
Account
Value
5/1/22 | Ending Account
Value (Based
on Actual
Returns and
Expenses)
10/31/22 | Expenses
Paid
During
Period1 | Ending Account
Value (Based
on Hypothetical
5% Annualized
Return and
Actual Expenses)
10/31/22 | Expenses
Paid
During
Period1 | Net Expense
Ratio
During
Period2 |
| Class A Shares | $1,000.00 | $858.30 | $ 5.71 | $1,019.05 | $ 6.21 | 1.22% |
| Investor Class Shares | $1,000.00 | $857.40 | $ 7.12 | $1,017.54 | $ 7.73 | 1.52% |
| Class B Shares | $1,000.00 | $853.70 | $10.61 | $1,013.76 | $11.52 | 2.27% |
| Class C Shares | $1,000.00 | $853.70 | $10.61 | $1,013.76 | $11.52 | 2.27% |
| Class I Shares | $1,000.00 | $859.80 | $ 3.98 | $1,020.92 | $ 4.33 | 0.85% |
| Class R1 Shares | $1,000.00 | $858.70 | $ 5.01 | $1,019.81 | $ 5.45 | 1.07% |
| Class R2 Shares | $1,000.00 | $857.80 | $ 6.18 | $1,018.55 | $ 6.72 | 1.32% |
| Class R3 Shares | $1,000.00 | $857.00 | $ 7.35 | $1,017.29 | $ 7.98 | 1.57% |
| Class R6 Shares | $1,000.00 | $860.00 | $ 3.89 | $1,021.02 | $ 4.23 | 0.83% |
| 1. | Expenses are equal to the Fund’s annualized expense ratio of each class multiplied by the average account value over the period, divided by 365 and multiplied by 184 (to reflect the six-month period). The table above represents the actual expenses incurred during the six-month period. In addition to the fees and expenses which the Fund bears directly, it also indirectly bears a pro rata share of the fees and expenses of the underlying funds in which it invests. Such indirect expenses are not included in the above-reported expense figures. |
| 2. | Expenses are equal to the Fund's annualized expense ratio to reflect the six-month period. |
Country Composition as of October 31, 2022 (Unaudited)
| France | 12.4% |
| United States | 12.2 |
| United Kingdom | 11.3 |
| Switzerland | 11.2 |
| Netherlands | 9.7 |
| Germany | 9.5 |
| Japan | 7.0 |
| India | 5.8 |
| China | 3.9 |
| Hong Kong | 3.8% |
| Israel | 3.4 |
| Sweden | 2.6 |
| Denmark | 2.5 |
| Italy | 1.0 |
| Other Assets, Less Liabilities | 3.7 |
| | 100.0% |
See Portfolio of Investments beginning on page 10 for specific holdings within these categories. The Fund's holdings are subject to change.
Top Ten Holdings and/or Issuers Held as of October 31, 2022 (excluding short-term investments) (Unaudited)
| 1. | ICON plc |
| 2. | HDFC Bank Ltd. |
| 3. | Teleperformance |
| 4. | TE Connectivity Ltd. |
| 5. | Adyen NV |
| 6. | Globant SA |
| 7. | Tencent Holdings Ltd. |
| 8. | AIA Group Ltd. |
| 9. | Lonza Group AG (Registered) |
| 10. | NICE Ltd., Sponsored ADR |
| 8 | MainStay MacKay International Equity Fund |
Portfolio Management Discussion and Analysis (Unaudited)
Questions answered by portfolio managers Carlos Garcia-Tunon, CFA, Ian Murdoch, CFA, and Lawrence Rosenberg, CFA, of MacKay Shields LLC, the Fund’s Subadvisor.
How did MainStay MacKay International Equity Fund perform relative to its benchmarks and peer group during the 12 months ended October 31, 2022?
For the 12 months ended October 31, 2022, Class I shares of MainStay MacKay International Equity Fund returned −32.66%, underperforming the −24.73% return of the Fund’s primary benchmark, the MSCI ACWI® (All Country World Index) ex USA Index (Net) (the “Index”), and the −23.00% return of the Fund’s secondary benchmark, the MSCI EAFE Index® (Net). Over the same period, Class I shares outperformed the −32.72% return of the Morningstar Foreign Large Growth Category Average.1
What factors affected the Fund’s relative performance during the reporting period?
Observed through a multi-factor lens, the Fund’s underperformance relative to the MSCI ACWI® ex USA Index (Net) was predominantly due to its emphasis on growth stocks over value stocks. Based on the Fund’s active weights relative to the Index, relative returns suffered primarily due to negative contributions from stock selection on both a country and sector basis, as well as a negative contribution from sector allocation. (Contributions take weightings and total returns into account.) These negative selection and allocation effects were partially offset by a positive contribution from country allocation.
During the reporting period, were there any market events that materially impacted the Fund’s performance or liquidity?
Risk assets declined toward the beginning of the reporting period due to Russia’s invasion of Ukraine and expectations for accelerated global monetary policy tightening, which was exacerbated by the conflict’s upward pressure on energy and food prices. The decline in international equities accelerated in the second half of the reporting period as the Ukraine conflict, China COVID lockdowns, and the continued prospect of higher interest rates combined to weigh on investor sentiment.
During the reporting period, which sectors were the strongest positive contributors to the Fund’s relative performance and which sectors were particularly weak?
During the reporting period, the sectors making the strongest positive contribution to the Fund’s performance relative to the Index were information technology, industrials and real estate. During the same period, the weakest contributors to relative performance were the health care, financials and consumer discretionary sectors.
During the reporting period, which individual stocks made the strongest positive contributions to the Fund’s absolute performance and which stocks detracted the most?
The top contributors to the Fund’s absolute performance during the reporting period included UK home emergency and repair services provider HomeServe, French prepaid corporate services provider Edenred, and Japanese e-commerce provider of industrial supply products MonotaRO. The most significant detractors from absolute performance during the same period were China-based Internet gaming and value-added services provider Tencent, UK-domiciled Asia-focused life insurer Prudential, and Brazil-based vertically integrated health care provider Hapvida.
What were some of the Fund’s largest purchases and sales during the reporting period?
During the reporting period, the Fund’s largest initial purchase was in Hong Kong-based pan-Asian life insurer AIA Group, while the largest increased position was in Netherlands-based payment solutions provider Adyen. The Fund’s largest full sale was in Japan-based online services provider CyberAgent, while the largest decreased position size was in Ireland-domiciled global professional services company Aon.
How did the Fund’s sector and/or country weightings change during the reporting period?
During the reporting period, the Fund’s largest increases in sector exposure relative to the Index were in information technology and industrials, while the most significant decreases were in consumer discretionary and communication services.
How was the Fund positioned at the end of the reporting period?
As of October 31, 2022, the Fund’s largest overweight exposures relative to the MSCI ACWI® ex USA Index (Net) were to the information technology and health care sectors. As of the same date, the Fund’s most significant underweight exposures were to the consumer discretionary and energy sectors.
| 1. | See page 5 for other share class returns, which may be higher or lower than Class I share returns. See page 6 for more information on benchmark and peer group returns. |
The opinions expressed are those of the portfolio managers as of the date of this report and are subject to change. There is no guarantee that any forecasts will come to pass. This material does not constitute investment advice and is not intended as an endorsement of any specific investment.
Portfolio of Investments October 31, 2022†
| | Shares | Value |
| Common Stocks 96.0% |
| China 3.9% |
| Tencent Holdings Ltd. (Interactive Media & Services) | 437,499 | $ 11,459,084 |
| Denmark 2.5% |
| Chr Hansen Holding A/S (Chemicals) | 131,989 | 7,329,705 |
| France 12.4% |
| BioMerieux (Health Care Equipment & Supplies) | 55,323 | 4,895,416 |
| Dassault Systemes SE (Software) | 77,951 | 2,615,341 |
| Edenred (IT Services) | 170,728 | 8,766,792 |
| Sartorius Stedim Biotech (Life Sciences Tools & Services) | 22,710 | 7,208,742 |
| Teleperformance (Professional Services) | 50,037 | 13,415,532 |
| | | 36,901,823 |
| Germany 9.5% |
| Carl Zeiss Meditec AG (Health Care Equipment & Supplies) | 29,325 | 3,551,552 |
| Deutsche Boerse AG (Capital Markets) | 48,255 | 7,851,830 |
| Nemetschek SE (Software) | 81,894 | 3,913,859 |
| Scout24 SE (Interactive Media & Services) (a) | 120,199 | 6,162,652 |
| Symrise AG (Chemicals) | 66,015 | 6,742,484 |
| | | 28,222,377 |
| Hong Kong 3.8% |
| AIA Group Ltd. (Insurance) | 1,491,000 | 11,292,217 |
| India 5.8% |
| HDFC Bank Ltd. (Banks) | 786,819 | 14,226,475 |
| Housing Development Finance Corp. Ltd. (Diversified Financial Services) | 97,635 | 2,913,097 |
| | | 17,139,572 |
| Israel 3.4% |
| NICE Ltd., Sponsored ADR (Software) (b) | 53,979 | 10,250,072 |
| Italy 1.0% |
| Reply SpA (IT Services) | 28,582 | 3,109,903 |
| Japan 7.0% |
| Benefit One, Inc. (Professional Services) | 203,800 | 2,828,899 |
| Menicon Co. Ltd. (Health Care Equipment & Supplies) | 127,400 | 2,182,237 |
| | Shares | Value |
| |
| Japan (continued) |
| MonotaRO Co. Ltd. (Trading Companies & Distributors) | 269,000 | $ 4,102,976 |
| Relo Group, Inc. (Real Estate Management & Development) | 330,500 | 4,672,054 |
| SMS Co. Ltd. (Professional Services) | 119,700 | 2,753,112 |
| TechnoPro Holdings, Inc. (Professional Services) | 177,500 | 4,231,733 |
| | | 20,771,011 |
| Netherlands 9.7% |
| Adyen NV (IT Services) (a)(b) | 8,321 | 11,945,061 |
| IMCD NV (Trading Companies & Distributors) | 73,566 | 9,545,720 |
| Koninklijke DSM NV (Chemicals) | 62,974 | 7,424,523 |
| | | 28,915,304 |
| Sweden 2.6% |
| Hexagon AB, Class B (Electronic Equipment, Instruments & Components) | 548,996 | 5,429,696 |
| MIPS AB (Leisure Products) | 75,740 | 2,451,679 |
| | | 7,881,375 |
| Switzerland 11.2% |
| Belimo Holding AG (Registered) (Building Products) | 9,537 | 3,885,850 |
| Lonza Group AG (Registered) (Life Sciences Tools & Services) | 20,040 | 10,314,691 |
| Straumann Holding AG (Health Care Equipment & Supplies) | 60,956 | 5,806,145 |
| TE Connectivity Ltd. (Electronic Equipment, Instruments & Components) | 108,408 | 13,250,710 |
| | | 33,257,396 |
| United Kingdom 11.3% |
| Diageo plc (Beverages) | 217,917 | 8,991,662 |
| Experian plc (Professional Services) | 285,082 | 9,069,095 |
| HomeServe plc (Commercial Services & Supplies) | 191,153 | 2,599,881 |
| Linde plc (Chemicals) | 19,555 | 5,814,679 |
| St James's Place plc (Capital Markets) | 577,551 | 7,053,873 |
| | | 33,529,190 |
| United States 11.9% |
| Accenture plc, Class A (IT Services) | 10,700 | 3,037,730 |
| Aon plc, Class A (Insurance) | 11,731 | 3,302,159 |
| Globant SA (IT Services) (b) | 61,799 | 11,660,235 |
| ICON plc (Life Sciences Tools & Services) (b) | 73,286 | 14,498,901 |
The notes to the financial statements are an integral part of, and should be read in conjunction with, the financial statements.
| 10 | MainStay MacKay International Equity Fund |
| | Shares | | Value |
| Common Stocks (continued) |
| United States (continued) |
| STERIS plc (Health Care Equipment & Supplies) | 17,423 | | $ 3,006,862 |
| | | | 35,505,887 |
Total Common Stocks
(Cost $296,978,532) | | | 285,564,916 |
| Short-Term Investment 0.3% |
| Affiliated Investment Company 0.3% |
| United States 0.3% |
| MainStay U.S. Government Liquidity Fund, 2.905% (c) | 831,090 | | 831,090 |
Total Short-Term Investment
(Cost $831,090) | | | 831,090 |
Total Investments
(Cost $297,809,622) | 96.3% | | 286,396,006 |
| Other Assets, Less Liabilities | 3.7 | | 11,135,874 |
| Net Assets | 100.0% | | $ 297,531,880 |
| † | Percentages indicated are based on Fund net assets. |
| (a) | May be sold to institutional investors only under Rule 144A or securities offered pursuant to Section 4(a)(2) of the Securities Act of 1933, as amended. |
| (b) | Non-income producing security. |
| (c) | Current yield as of October 31, 2022. |
Investments in Affiliates (in 000's)
Investments in issuers considered to be affiliate(s) of the Fund during the year ended October 31, 2022 for purposes of Section 2(a)(3) of the Investment Company Act of 1940, as amended, were as follows:
| Affiliated Investment Companies | Value,
Beginning
of Year | Purchases
at Cost | Proceeds
from
Sales | Net
Realized
Gain/(Loss)
on Sales | Change in
Unrealized
Appreciation/
(Depreciation) | Value,
End of
Year | Dividend
Income | Other
Distributions | Shares
End of
Year |
| MainStay U.S. Government Liquidity Fund | $ 611 | $ 52,095 | $ (51,875) | $ — | $ — | $ 831 | $ 8 | $ — | 831 |
| Abbreviation(s): |
| ADR—American Depositary Receipt |
The notes to the financial statements are an integral part of, and should be read in conjunction with, the financial statements.
11
Portfolio of Investments October 31, 2022† (continued)
The following is a summary of the fair valuations according to the inputs used as of October 31, 2022, for valuing the Fund’s assets:
| Description | Quoted
Prices in
Active
Markets for
Identical
Assets
(Level 1) | | Significant
Other
Observable
Inputs
(Level 2) | | Significant
Unobservable
Inputs
(Level 3) | | Total |
| Asset Valuation Inputs | | | | | | | |
| Investments in Securities (a) | | | | | | | |
| Common Stocks | $ 285,564,916 | | $ — | | $ — | | $ 285,564,916 |
| Short-Term Investment | | | | | | | |
| Affiliated Investment Company | 831,090 | | — | | — | | 831,090 |
| Total Investments in Securities | $ 286,396,006 | | $ — | | $ — | | $ 286,396,006 |
| (a) | For a complete listing of investments and their industries, see the Portfolio of Investments. |
The notes to the financial statements are an integral part of, and should be read in conjunction with, the financial statements.
| 12 | MainStay MacKay International Equity Fund |
The table below sets forth the diversification of the Fund’s investments by industry.
Industry Diversification
| | Value | | Percent † |
| Banks | $ 14,226,475 | | 4.8% |
| Beverages | 8,991,662 | | 3.0 |
| Building Products | 3,885,850 | | 1.3 |
| Capital Markets | 14,905,703 | | 5.0 |
| Chemicals | 27,311,391 | | 9.3 |
| Commercial Services & Supplies | 2,599,881 | | 0.9 |
| Diversified Financial Services | 2,913,097 | | 1.0 |
| Electronic Equipment, Instruments & Components | 18,680,406 | | 6.3 |
| Health Care Equipment & Supplies | 19,442,212 | | 6.4 |
| Insurance | 14,594,376 | | 4.9 |
| Interactive Media & Services | 17,621,736 | | 6.0 |
| IT Services | 38,519,721 | | 12.9 |
| Leisure Products | 2,451,679 | | 0.8 |
| Life Sciences Tools & Services | 32,022,334 | | 10.8 |
| Professional Services | 32,298,371 | | 10.8 |
| Real Estate Management & Development | 4,672,054 | | 1.6 |
| Software | 16,779,272 | | 5.6 |
| Trading Companies & Distributors | 13,648,696 | | 4.6 |
| | 285,564,916 | | 96.0 |
| Short-Term Investment | 831,090 | | 0.3 |
| Other Assets, Less Liabilities | 11,135,874 | | 3.7 |
| Net Assets | $297,531,880 | | 100.0% |
| † | Percentages indicated are based on Fund net assets. |
The notes to the financial statements are an integral part of, and should be read in conjunction with, the financial statements.
13
Statement of Assets and Liabilities as of October 31, 2022
| Assets |
Investment in unaffiliated securities, at value
(identified cost $296,978,532) | $285,564,916 |
Investment in affiliated investment companies, at value
(identified cost $831,090) | 831,090 |
| Cash | 211 |
Cash denominated in foreign currencies
(identified cost $9,677,598) | 9,651,092 |
| Receivables: | |
| Investment securities sold | 1,295,550 |
| Dividends | 371,488 |
| Foreign capital gains tax (See Note 2) | 103,547 |
| Fund shares sold | 80,710 |
| Securities lending | 1,782 |
| Other assets | 36,736 |
| Total assets | 297,937,122 |
| Liabilities |
| Payables: | |
| Manager (See Note 3) | 150,766 |
| Fund shares redeemed | 113,923 |
| Transfer agent (See Note 3) | 40,907 |
| Shareholder communication | 40,313 |
| Custodian | 18,913 |
| NYLIFE Distributors (See Note 3) | 16,391 |
| Professional fees | 12,069 |
| Trustees | 60 |
| Accrued expenses | 11,900 |
| Total liabilities | 405,242 |
| Net assets | $297,531,880 |
| Composition of Net Assets |
| Shares of beneficial interest outstanding (par value of $.01 per share) unlimited number of shares authorized | $ 213,806 |
| Additional paid-in-capital | 349,367,065 |
| | 349,580,871 |
| Total distributable earnings (loss) | (52,048,991) |
| Net assets | $297,531,880 |
| Class A | |
| Net assets applicable to outstanding shares | $ 53,872,726 |
| Shares of beneficial interest outstanding | 3,901,406 |
| Net asset value per share outstanding | $ 13.81 |
| Maximum sales charge (5.50% of offering price) | 0.80 |
| Maximum offering price per share outstanding | $ 14.61 |
| Investor Class | |
| Net assets applicable to outstanding shares | $ 13,855,508 |
| Shares of beneficial interest outstanding | 1,024,408 |
| Net asset value per share outstanding | $ 13.53 |
| Maximum sales charge (5.00% of offering price) | 0.71 |
| Maximum offering price per share outstanding | $ 14.24 |
| Class B | |
| Net assets applicable to outstanding shares | $ 871,172 |
| Shares of beneficial interest outstanding | 77,349 |
| Net asset value and offering price per share outstanding | $ 11.26 |
| Class C | |
| Net assets applicable to outstanding shares | $ 1,152,519 |
| Shares of beneficial interest outstanding | 102,371 |
| Net asset value and offering price per share outstanding | $ 11.26 |
| Class I | |
| Net assets applicable to outstanding shares | $ 31,033,021 |
| Shares of beneficial interest outstanding | 2,219,490 |
| Net asset value and offering price per share outstanding | $ 13.98 |
| Class R1 | |
| Net assets applicable to outstanding shares | $ 96,610 |
| Shares of beneficial interest outstanding | 6,969 |
| Net asset value and offering price per share outstanding | $ 13.86 |
| Class R2 | |
| Net assets applicable to outstanding shares | $ 164,710 |
| Shares of beneficial interest outstanding | 11,924 |
| Net asset value and offering price per share outstanding | $ 13.81 |
| Class R3 | |
| Net assets applicable to outstanding shares | $ 695,818 |
| Shares of beneficial interest outstanding | 51,401 |
| Net asset value and offering price per share outstanding | $ 13.54 |
| Class R6 | |
| Net assets applicable to outstanding shares | $195,789,796 |
| Shares of beneficial interest outstanding | 13,985,304 |
| Net asset value and offering price per share outstanding | $ 14.00 |
The notes to the financial statements are an integral part of, and should be read in conjunction with, the financial statements.
| 14 | MainStay MacKay International Equity Fund |
Statement of Operations for the year ended October 31, 2022
| Investment Income (Loss) |
| Income | |
| Dividends-unaffiliated (net of foreign tax withholding of $300,562) | $ 3,842,012 |
| Securities lending, net | 52,831 |
| Dividends-affiliated | 8,161 |
| Total income | 3,903,004 |
| Expenses | |
| Manager (See Note 3) | 3,199,310 |
| Distribution/Service—Class A (See Note 3) | 172,985 |
| Distribution/Service—Investor Class (See Note 3) | 43,271 |
| Distribution/Service—Class B (See Note 3) | 14,333 |
| Distribution/Service—Class C (See Note 3) | 17,105 |
| Distribution/Service—Class R2 (See Note 3) | 496 |
| Distribution/Service—Class R3 (See Note 3) | 4,069 |
| Transfer agent (See Note 3) | 231,588 |
| Professional fees | 131,207 |
| Registration | 116,170 |
| Custodian | 82,024 |
| Shareholder communication | 58,625 |
| Trustees | 7,515 |
| Shareholder service (See Note 3) | 1,140 |
| Miscellaneous | 36,643 |
| Total expenses before waiver/reimbursement | 4,116,481 |
| Expense waiver/reimbursement from Manager (See Note 3) | (698,531) |
| Net expenses | 3,417,950 |
| Net investment income (loss) | 485,054 |
| Realized and Unrealized Gain (Loss) |
| Net realized gain (loss) on: | |
| Unaffiliated investment transactions | (36,091,876) |
| Foreign currency transactions | (1,108,852) |
| Net realized gain (loss) | (37,200,728) |
| Net change in unrealized appreciation (depreciation) on: | |
| Unaffiliated investments(a) | (107,032,731) |
| Translation of other assets and liabilities in foreign currencies | (284,433) |
| Net change in unrealized appreciation (depreciation) | (107,317,164) |
| Net realized and unrealized gain (loss) | (144,517,892) |
| Net increase (decrease) in net assets resulting from operations | $(144,032,838) |
| (a) | Net change in unrealized appreciation (depreciation) on investments recorded net of foreign capital gains tax in the amount of $480,892. |
The notes to the financial statements are an integral part of, and should be read in conjunction with, the financial statements.
15
Statements of Changes in Net Assets
for the years ended October 31, 2022 and October 31, 2021
| | 2022 | 2021 |
| Increase (Decrease) in Net Assets |
| Operations: | | |
| Net investment income (loss) | $ 485,054 | $ 1,100,518 |
| Net realized gain (loss) | (37,200,728) | 58,265,906 |
| Net change in unrealized appreciation (depreciation) | (107,317,164) | 53,839,920 |
| Net increase (decrease) in net assets resulting from operations | (144,032,838) | 113,206,344 |
| Distributions to shareholders: | | |
| Class A | (11,213,676) | (2,496,321) |
| Investor Class | (2,781,204) | (878,981) |
| Class B | (311,669) | (104,666) |
| Class C | (353,778) | (133,782) |
| Class I | (6,710,826) | (1,460,845) |
| Class R1 | (18,831) | (5,793) |
| Class R2 | (33,750) | (19,645) |
| Class R3 | (120,330) | (47,741) |
| Class R6 | (34,544,245) | (8,406,730) |
| Total distributions to shareholders | (56,088,309) | (13,554,504) |
| Capital share transactions: | | |
| Net proceeds from sales of shares | 38,368,459 | 44,435,679 |
| Net asset value of shares issued to shareholders in reinvestment of distributions | 55,903,961 | 13,508,107 |
| Cost of shares redeemed | (37,926,779) | (43,961,450) |
| Increase (decrease) in net assets derived from capital share transactions | 56,345,641 | 13,982,336 |
| Net increase (decrease) in net assets | (143,775,506) | 113,634,176 |
| Net Assets |
| Beginning of year | 441,307,386 | 327,673,210 |
| End of year | $ 297,531,880 | $441,307,386 |
The notes to the financial statements are an integral part of, and should be read in conjunction with, the financial statements.
| 16 | MainStay MacKay International Equity Fund |
Financial Highlights selected per share data and ratios
| | Year Ended October 31, |
| Class A | 2022 | | 2021 | | 2020 | | 2019 | | 2018 |
| Net asset value at beginning of year | $ 23.67 | | $ 18.27 | | $ 17.12 | | $ 15.48 | | $ 16.38 |
| Net investment income (loss) (a) | (0.02) | | 0.01 | | (0.01) | | 0.09 | | 0.03 |
| Net realized and unrealized gain (loss) | (6.87) | | 6.13 | | 1.68 | | 1.70 | | (0.84) |
| Total from investment operations | (6.89) | | 6.14 | | 1.67 | | 1.79 | | (0.81) |
| Less distributions: | | | | | | | | | |
| From net investment income | (0.01) | | — | | (0.05) | | — | | (0.09) |
| From net realized gain on investments | (2.96) | | (0.74) | | (0.47) | | (0.15) | | — |
| Total distributions | (2.97) | | (0.74) | | (0.52) | | (0.15) | | (0.09) |
| Net asset value at end of year | $ 13.81 | | $ 23.67 | | $ 18.27 | | $ 17.12 | | $ 15.48 |
| Total investment return (b) | (32.87)% | | 34.31% | | 9.84% | | 11.74% | | (4.98)% |
| Ratios (to average net assets)/Supplemental Data: | | | | | | | | | |
| Net investment income (loss) | (0.11)% | | 0.05% | | (0.09)% | | 0.57% | | 0.17% |
| Net expenses (c) | 1.19% | | 1.18% | | 1.21% | | 1.21% | | 1.32% |
| Expenses (before waiver/reimbursement) (c) | 1.38% | | 1.33% | | 1.40% | | 1.35% | | 1.32% |
| Portfolio turnover rate | 94% | | 101% | | 135% | | 58% | | 53% |
| Net assets at end of year (in 000’s) | $ 53,873 | | $ 89,076 | | $ 61,795 | | $ 57,566 | | $ 59,304 |
| (a) | Per share data based on average shares outstanding during the year. |
| (b) | Total investment return is calculated exclusive of sales charges and assumes the reinvestment of dividends and distributions. For periods of less than one year, total return is not annualized. |
| (c) | In addition to the fees and expenses which the Fund bears directly, it also indirectly bears a pro-rata share of the fees and expenses of the underlying funds in which it invests. Such indirect expenses are not included in the above expense ratios. |
| | Year Ended October 31, |
| Investor Class | 2022 | | 2021 | | 2020 | | 2019 | | 2018 |
| Net asset value at beginning of year | $ 23.30 | | $ 18.06 | | $ 16.94 | | $ 15.38 | | $ 16.27 |
| Net investment income (loss) (a) | (0.08) | | (0.06) | | (0.07) | | 0.03 | | (0.03) |
| Net realized and unrealized gain (loss) | (6.73) | | 6.04 | | 1.66 | | 1.68 | | (0.83) |
| Total from investment operations | (6.81) | | 5.98 | | 1.59 | | 1.71 | | (0.86) |
| Less distributions: | | | | | | | | | |
| From net investment income | — | | — | | — | | — | | (0.03) |
| From net realized gain on investments | (2.96) | | (0.74) | | (0.47) | | (0.15) | | — |
| Total distributions | (2.96) | | (0.74) | | (0.47) | | (0.15) | | (0.03) |
| Net asset value at end of year | $ 13.53 | | $ 23.30 | | $ 18.06 | | $ 16.94 | | $ 15.38 |
| Total investment return (b) | (33.07)% | | 33.80% | | 9.40% | | 11.36% | | (5.31)% |
| Ratios (to average net assets)/Supplemental Data: | | | | | | | | | |
| Net investment income (loss) | (0.45)% | | (0.30)% | | (0.43)% | | 0.21% | | (0.19)% |
| Net expenses (c) | 1.54% | | 1.56% | | 1.56% | | 1.59% | | 1.66% |
| Expenses (before waiver/reimbursement) (c) | 1.72% | | 1.71% | | 1.75% | | 1.75% | | 1.70% |
| Portfolio turnover rate | 94% | | 101% | | 135% | | 58% | | 53% |
| Net assets at end of year (in 000's) | $ 13,856 | | $ 21,990 | | $ 21,699 | | $ 23,870 | | $ 21,679 |
| (a) | Per share data based on average shares outstanding during the year. |
| (b) | Total investment return is calculated exclusive of sales charges and assumes the reinvestment of dividends and distributions. For periods of less than one year, total return is not annualized. |
| (c) | In addition to the fees and expenses which the Fund bears directly, it also indirectly bears a pro-rata share of the fees and expenses of the underlying funds in which it invests. Such indirect expenses are not included in the above expense ratios. |
The notes to the financial statements are an integral part of, and should be read in conjunction with, the financial statements.
17
Financial Highlights selected per share data and ratios
| | Year Ended October 31, |
| Class B | 2022 | | 2021 | | 2020 | | 2019 | | 2018 |
| Net asset value at beginning of year | $ 20.05 | | $ 15.74 | | $ 14.94 | | $ 13.68 | | $ 14.55 |
| Net investment income (loss) (a) | (0.17) | | (0.20) | | (0.18) | | (0.08) | | (0.14) |
| Net realized and unrealized gain (loss) | (5.66) | | 5.25 | | 1.45 | | 1.49 | | (0.73) |
| Total from investment operations | (5.83) | | 5.05 | | 1.27 | | 1.41 | | (0.87) |
| Less distributions: | | | | | | | | | |
| From net realized gain on investments | (2.96) | | (0.74) | | (0.47) | | (0.15) | | — |
| Net asset value at end of year | $ 11.26 | | $ 20.05 | | $ 15.74 | | $ 14.94 | | $ 13.68 |
| Total investment return (b) | (33.62)% | | 32.84% | | 8.57% | | 10.49% | | (5.98)% |
| Ratios (to average net assets)/Supplemental Data: | | | | | | | | | |
| Net investment income (loss) | (1.20)% | | (1.06)% | | (1.20)% | | (0.59)% | | (0.95)% |
| Net expenses (c) | 2.29% | | 2.31% | | 2.31% | | 2.35% | | 2.41% |
| Expenses (before waiver/reimbursement) (c) | 2.47% | | 2.46% | | 2.50% | | 2.50% | | 2.44% |
| Portfolio turnover rate | 94% | | 101% | | 135% | | 58% | | 53% |
| Net assets at end of year (in 000’s) | $ 871 | | $ 2,192 | | $ 2,368 | | $ 3,345 | | $ 4,404 |
| (a) | Per share data based on average shares outstanding during the year. |
| (b) | Total investment return is calculated exclusive of sales charges and assumes the reinvestment of dividends and distributions. For periods of less than one year, total return is not annualized. |
| (c) | In addition to the fees and expenses which the Fund bears directly, it also indirectly bears a pro-rata share of the fees and expenses of the underlying funds in which it invests. Such indirect expenses are not included in the above expense ratios. |
| | Year Ended October 31, |
| Class C | 2022 | | 2021 | | 2020 | | 2019 | | 2018 |
| Net asset value at beginning of year | $ 20.04 | | $ 15.75 | | $ 14.93 | | $ 13.68 | | $ 14.56 |
| Net investment income (loss) (a) | (0.17) | | (0.21) | | (0.18) | | (0.09) | | (0.14) |
| Net realized and unrealized gain (loss) | (5.65) | | 5.24 | | 1.47 | | 1.49 | | (0.74) |
| Total from investment operations | (5.82) | | 5.03 | | 1.29 | | 1.40 | | (0.88) |
| Less distributions: | | | | | | | | | |
| From net realized gain on investments | (2.96) | | (0.74) | | (0.47) | | (0.15) | | — |
| Net asset value at end of year | $ 11.26 | | $ 20.04 | | $ 15.75 | | $ 14.93 | | $ 13.68 |
| Total investment return (b) | (33.58)% | | 32.69% | | 8.64% | | 10.49% | | (6.04)% |
| Ratios (to average net assets)/Supplemental Data: | | | | | | | | | |
| Net investment income (loss) | (1.21)% | | (1.12)% | | (1.20)% | | (0.65)% | | (0.93)% |
| Net expenses (c) | 2.29% | | 2.31% | | 2.31% | | 2.35% | | 2.41% |
| Expenses (before waiver/reimbursement) (c) | 2.47% | | 2.46% | | 2.50% | | 2.50% | | 2.44% |
| Portfolio turnover rate | 94% | | 101% | | 135% | | 58% | | 53% |
| Net assets at end of year (in 000’s) | $ 1,153 | | $ 2,470 | | $ 2,952 | | $ 3,915 | | $ 6,960 |
| (a) | Per share data based on average shares outstanding during the year. |
| (b) | Total investment return is calculated exclusive of sales charges and assumes the reinvestment of dividends and distributions. For periods of less than one year, total return is not annualized. |
| (c) | In addition to the fees and expenses which the Fund bears directly, it also indirectly bears a pro-rata share of the fees and expenses of the underlying funds in which it invests. Such indirect expenses are not included in the above expense ratios. |
The notes to the financial statements are an integral part of, and should be read in conjunction with, the financial statements.
| 18 | MainStay MacKay International Equity Fund |
Financial Highlights selected per share data and ratios
| | Year Ended October 31, |
| Class I | 2022 | | 2021 | | 2020 | | 2019 | | 2018 |
| Net asset value at beginning of year | $ 23.93 | | $ 18.43 | | $ 17.28 | | $ 15.57 | | $ 16.48 |
| Net investment income (loss) (a) | 0.04 | | 0.09 | | 0.05 | | 0.09 | | 0.07 |
| Net realized and unrealized gain (loss) | (6.94) | | 6.17 | | 1.69 | | 1.78 | | (0.85) |
| Total from investment operations | (6.90) | | 6.26 | | 1.74 | | 1.87 | | (0.78) |
| Less distributions: | | | | | | | | | |
| From net investment income | (0.09) | | (0.02) | | (0.12) | | (0.01) | | (0.13) |
| From net realized gain on investments | (2.96) | | (0.74) | | (0.47) | | (0.15) | | — |
| Total distributions | (3.05) | | (0.76) | | (0.59) | | (0.16) | | (0.13) |
| Net asset value at end of year | $ 13.98 | | $ 23.93 | | $ 18.43 | | $ 17.28 | | $ 15.57 |
| Total investment return (b) | (32.66)% | | 34.72% | | 10.22% | | 12.19% | | (4.80)% |
| Ratios (to average net assets)/Supplemental Data: | | | | | | | | | |
| Net investment income (loss) | 0.23% | | 0.39% | | 0.27% | | 0.55% | | 0.42% |
| Net expenses (c) | 0.85% | | 0.85% | | 0.85% | | 0.92% | | 1.07% |
| Expenses (before waiver/reimbursement) (c) | 1.13% | | 1.08% | | 1.16% | | 1.10% | | 1.07% |
| Portfolio turnover rate | 94% | | 101% | | 135% | | 58% | | 53% |
| Net assets at end of year (in 000’s) | $ 31,033 | | $ 53,914 | | $ 35,880 | | $ 43,280 | | $ 213,030 |
| (a) | Per share data based on average shares outstanding during the year. |
| (b) | Total investment return is calculated exclusive of sales charges and assumes the reinvestment of dividends and distributions. Class I shares are not subject to sales charges. For periods of less than one year, total return is not annualized. |
| (c) | In addition to the fees and expenses which the Fund bears directly, it also indirectly bears a pro-rata share of the fees and expenses of the underlying funds in which it invests. Such indirect expenses are not included in the above expense ratios. |
| | Year Ended October 31, |
| Class R1 | 2022 | | 2021 | | 2020 | | 2019 | | 2018 |
| Net asset value at beginning of year | $ 23.75 | | $ 18.31 | | $ 17.15 | | $ 15.48 | | $ 16.38 |
| Net investment income (loss) (a) | 0.01 | | 0.05 | | (0.01) | | 0.05 | | 0.05 |
| Net realized and unrealized gain (loss) | (6.90) | | 6.13 | | 1.71 | | 1.77 | | (0.84) |
| Total from investment operations | (6.89) | | 6.18 | | 1.70 | | 1.82 | | (0.79) |
| Less distributions: | | | | | | | | | |
| From net investment income | (0.04) | | — | | (0.07) | | — | | (0.11) |
| From net realized gain on investments | (2.96) | | (0.74) | | (0.47) | | (0.15) | | — |
| Total distributions | (3.00) | | (0.74) | | (0.54) | | (0.15) | | (0.11) |
| Net asset value at end of year | $ 13.86 | | $ 23.75 | | $ 18.31 | | $ 17.15 | | $ 15.48 |
| Total investment return (b) | (32.79)% | | 34.46% | | 10.05% | | 11.93% | | (4.86)% |
| Ratios (to average net assets)/Supplemental Data: | | | | | | | | | |
| Net investment income (loss) | 0.05% | | 0.23% | | (0.05)% | | 0.33% | | 0.29% |
| Net expenses (c) | 1.04% | | 1.03% | | 1.06% | | 1.11% | | 1.17% |
| Expenses (before waiver/reimbursement) (c) | 1.23% | | 1.18% | | 1.25% | | 1.19% | | 1.17% |
| Portfolio turnover rate | 94% | | 101% | | 135% | | 58% | | 53% |
| Net assets at end of year (in 000’s) | $ 97 | | $ 157 | | $ 143 | | $ 265 | | $ 2,109 |
| (a) | Per share data based on average shares outstanding during the year. |
| (b) | Total investment return is calculated exclusive of sales charges and assumes the reinvestment of dividends and distributions. Class R1 shares are not subject to sales charges. For periods of less than one year, total return is not annualized. |
| (c) | In addition to the fees and expenses which the Fund bears directly, it also indirectly bears a pro-rata share of the fees and expenses of the underlying funds in which it invests. Such indirect expenses are not included in the above expense ratios. |
The notes to the financial statements are an integral part of, and should be read in conjunction with, the financial statements.
19
Financial Highlights selected per share data and ratios
| | Year Ended October 31, |
| Class R2 | 2022 | | 2021 | | 2020 | | 2019 | | 2018 |
| Net asset value at beginning of year | $ 23.68 | | $ 18.30 | | $ 17.15 | | $ 15.52 | | $ 16.42 |
| Net investment income (loss) (a) | (0.04) | | (0.01) | | (0.03) | | 0.06 | | (0.02) |
| Net realized and unrealized gain (loss) | (6.87) | | 6.13 | | 1.68 | | 1.72 | | (0.80) |
| Total from investment operations | (6.91) | | 6.12 | | 1.65 | | 1.78 | | (0.82) |
| Less distributions: | | | | | | | | | |
| From net investment income | — | | — | | (0.03) | | — | | (0.08) |
| From net realized gain on investments | (2.96) | | (0.74) | | (0.47) | | (0.15) | | — |
| Total distributions | (2.96) | | (0.74) | | (0.50) | | (0.15) | | (0.08) |
| Net asset value at end of year | $ 13.81 | | $ 23.68 | | $ 18.30 | | $ 17.15 | | $ 15.52 |
| Total investment return (b) | (32.95)% | | 34.14% | | 9.72% | | 11.64% | | (5.06)%(c) |
| Ratios (to average net assets)/Supplemental Data: | | | | | | | | | |
| Net investment income (loss) | (0.22)% | | (0.06)% | | (0.18)% | | 0.38% | | (0.13)% |
| Net expenses (d) | 1.29% | | 1.28% | | 1.31% | | 1.31% | | 1.42% |
| Expenses (before waiver/reimbursement) (d) | 1.48% | | 1.43% | | 1.50% | | 1.45% | | 1.42% |
| Portfolio turnover rate | 94% | | 101% | | 135% | | 58% | | 53% |
| Net assets at end of year (in 000’s) | $ 165 | | $ 291 | | $ 486 | | $ 454 | | $ 602 |
| (a) | Per share data based on average shares outstanding during the year. |
| (b) | Total investment return is calculated exclusive of sales charges and assumes the reinvestment of dividends and distributions. Class R2 shares are not subject to sales charges. For periods of less than one year, total return is not annualized. |
| (c) | Total investment return may reflect adjustments to conform to generally accepted accounting principles. |
| (d) | In addition to the fees and expenses which the Fund bears directly, it also indirectly bears a pro-rata share of the fees and expenses of the underlying funds in which it invests. Such indirect expenses are not included in the above expense ratios. |
| | Year Ended October 31, |
| Class R3 | 2022 | | 2021 | | 2020 | | 2019 | | 2018 |
| Net asset value at beginning of year | $ 23.32 | | $ 18.08 | | $ 16.96 | | $ 15.38 | | $ 16.29 |
| Net investment income (loss) (a) | (0.07) | | (0.06) | | (0.08) | | 0.03 | | (0.04) |
| Net realized and unrealized gain (loss) | (6.75) | | 6.04 | | 1.67 | | 1.70 | | (0.83) |
| Total from investment operations | (6.82) | | 5.98 | | 1.59 | | 1.73 | | (0.87) |
| Less distributions: | | | | | | | | | |
| From net investment income | — | | — | | — | | — | | (0.04) |
| From net realized gain on investments | (2.96) | | (0.74) | | (0.47) | | (0.15) | | — |
| Total distributions | (2.96) | | (0.74) | | (0.47) | | (0.15) | | (0.04) |
| Net asset value at end of year | $ 13.54 | | $ 23.32 | | $ 18.08 | | $ 16.96 | | $ 15.38 |
| Total investment return (b) | (33.09)% | | 33.77% | | 9.46% | | 11.35% | | (5.39)%(c) |
| Ratios (to average net assets)/Supplemental Data: | | | | | | | | | |
| Net investment income (loss) | (0.45)% | | (0.28)% | | (0.46)% | | 0.22% | | (0.21)% |
| Net expenses (d) | 1.54% | | 1.53% | | 1.56% | | 1.56% | | 1.67% |
| Expenses (before waiver/reimbursement) (d) | 1.73% | | 1.68% | | 1.75% | | 1.70% | | 1.67% |
| Portfolio turnover rate | 94% | | 101% | | 135% | | 58% | | 53% |
| Net assets at end of year (in 000’s) | $ 696 | | $ 942 | | $ 1,140 | | $ 1,154 | | $ 1,057 |
| (a) | Per share data based on average shares outstanding during the year. |
| (b) | Total investment return is calculated exclusive of sales charges and assumes the reinvestment of dividends and distributions. Class R3 shares are not subject to sales charges. For periods of less than one year, total return is not annualized. |
| (c) | Total investment return may reflect adjustments to conform to generally accepted accounting principles. |
| (d) | In addition to the fees and expenses which the Fund bears directly, it also indirectly bears a pro-rata share of the fees and expenses of the underlying funds in which it invests. Such indirect expenses are not included in the above expense ratios. |
The notes to the financial statements are an integral part of, and should be read in conjunction with, the financial statements.
| 20 | MainStay MacKay International Equity Fund |
Financial Highlights selected per share data and ratios
| | Year Ended October 31, | | February 28, 2019^ through
October 31,
2019 |
| Class R6 | 2022 | | 2021 | | 2020 | |
| Net asset value at beginning of period | $ 23.95 | | $ 18.45 | | $ 17.28 | | $ 16.13 |
| Net investment income (loss) (a) | 0.04 | | 0.09 | | 0.05 | | 0.15 |
| Net realized and unrealized gain (loss) | (6.94) | | 6.18 | | 1.70 | | 1.00 |
| Total from investment operations | (6.90) | | 6.27 | | 1.75 | | 1.15 |
| Less distributions: | | | | | | | |
| From net investment income | (0.09) | | (0.03) | | (0.11) | | — |
| From net realized gain on investments | (2.96) | | (0.74) | | (0.47) | | — |
| Total distributions | (3.05) | | (0.77) | | (0.58) | | — |
| Net asset value at end of period | $ 14.00 | | $ 23.95 | | $ 18.45 | | $ 17.28 |
| Total investment return (b) | (32.64)% | | 34.74% | | 10.27% | | 7.13% |
| Ratios (to average net assets)/Supplemental Data: | | | | | | | |
| Net investment income (loss) | 0.26% | | 0.40% | | 0.31% | | 1.37%†† |
| Net expenses (c) | 0.83% | | 0.83% | | 0.83% | | 0.83%†† |
| Expenses (before waiver/reimbursement) (c) | 1.01% | | 0.98% | | 1.02% | | 1.00%†† |
| Portfolio turnover rate | 94% | | 101% | | 135% | | 58% |
| Net assets at end of period (in 000’s) | $ 195,790 | | $ 270,274 | | $ 201,210 | | $ 177,483 |
| ^ | Inception date. |
| †† | Annualized. |
| (a) | Per share data based on average shares outstanding during the period. |
| (b) | Total investment return is calculated exclusive of sales charges and assumes the reinvestment of dividends and distributions. Class R6 shares are not subject to sales charges. For periods of less than one year, total return is not annualized. |
| (c) | In addition to the fees and expenses which the Fund bears directly, it also indirectly bears a pro-rata share of the fees and expenses of the underlying funds in which it invests. Such indirect expenses are not included in the above expense ratios. |
The notes to the financial statements are an integral part of, and should be read in conjunction with, the financial statements.
21
Notes to Financial Statements
Note 1-Organization and Business
The MainStay Funds (the “Trust”) was organized on January 9, 1986, as a Massachusetts business trust. The Trust is registered under the Investment Company Act of 1940, as amended (the “1940 Act”), as an open-end management investment company, and is comprised of twelve funds (collectively referred to as the "Funds"). These financial statements and notes relate to the MainStay MacKay International Equity Fund (the "Fund"), a “diversified” fund, as that term is defined in the 1940 Act, as interpreted or modified by regulatory authorities having jurisdiction, from time to time.
The following table lists the Fund's share classes that have been registered and commenced operations:
| Class | Commenced Operations |
| Class A | January 3, 1995 |
| Investor Class | February 28, 2008 |
| Class B | September 13, 1994 |
| Class C | September 1, 1998 |
| Class I | January 2, 2004 |
| Class R1 | January 2, 2004 |
| Class R2 | January 2, 2004 |
| Class R3 | April 28, 2006 |
| Class R6 | February 28, 2019 |
| SIMPLE Class | N/A* |
| * | SIMPLE Class shares were registered for sale effective as of August 31, 2020 but have not yet commenced operations. |
Class B shares of the MainStay Group of Funds are closed to all new purchases as well as additional investments by existing Class B shareholders. Existing Class B shareholders may continue to reinvest dividends and capital gains distributions, as well as exchange their Class B shares for Class B shares of other funds in the MainStay Group of Funds as permitted by the current exchange privileges. Class B shareholders continue to be subject to any applicable contingent deferred sales charge ("CDSC") at the time of redemption. All other features of the Class B shares, including but not limited to the fees and expenses applicable to Class B shares, remain unchanged. Unless redeemed, Class B shareholders will remain in Class B shares of their respective fund until the Class B shares are converted to Class A or Investor Class shares pursuant to the applicable conversion schedule.
Class A and Investor Class shares are offered at net asset value (“NAV”) per share plus an initial sales charge. No initial sales charge applies to investments of $1 million or more (and certain other qualified purchases) in Class A and Investor Class shares. However, a CDSC of 1.00% may be imposed on certain redemptions made within 18 months of the date of purchase on shares that were purchased without an initial sales charge. Class C shares are offered at NAV without an initial sales charge, although a 1.00% CDSC may be imposed on certain redemptions of such shares made within one year of the date of purchase of Class C shares. When Class B shares were offered, they were offered at NAV without an initial sales charge, although a CDSC that declines depending on the
number of years a shareholder held its Class B shares may be imposed on certain redemptions of such shares made within six years of the date of purchase of such shares. Class I, Class R1, Class R2, Class R3 and Class R6 shares are offered at NAV without a sales charge. SIMPLE Class shares are expected to be offered at NAV without a sales charge if such shares are offered in the future. Depending upon eligibility, Class B shares convert to either Class A or Investor Class shares at the end of the calendar quarter eight years after the date they were purchased. In addition, depending upon eligibility, Class C shares convert to either Class A or Investor Class shares at the end of the calendar quarter eight years after the date they were purchased. Additionally, Investor Class shares may convert automatically to Class A shares. Under certain circumstances and as may be permitted by the Trust’s multiple class plan pursuant to Rule 18f-3 under the 1940 Act, specified share classes of the Fund may be converted to one or more other share classes of the Fund as disclosed in the capital share transactions within these Notes. The classes of shares have the same voting (except for issues that relate solely to one class), dividend, liquidation and other rights, and the same terms and conditions, except that under distribution plans pursuant to Rule 12b-1 under the 1940 Act, Class B and Class C shares are subject to higher distribution and/or service fees than Class A, Investor Class, Class R2, Class R3 and SIMPLE Class shares. Class I, Class R1 and Class R6 shares are not subject to a distribution and/or service fee. Class R1, Class R2 and Class R3 shares are subject to a shareholder service fee, which is in addition to fees paid under the distribution plans for Class R2 and Class R3 shares.
The Fund's investment objective is to seek long-term growth of capital.
Note 2–Significant Accounting Policies
The Fund is an investment company and accordingly follows the investment company accounting and reporting guidance of the Financial Accounting Standards Board (“FASB”) Accounting Standards Codification Topic 946 Financial Services—Investment Companies. The Fund prepares its financial statements in accordance with generally accepted accounting principles (“GAAP”) in the United States of America and follows the significant accounting policies described below.
(A) Securities Valuation. Investments are usually valued as of the close of regular trading on the New York Stock Exchange (the "Exchange") (usually 4:00 p.m. Eastern time) on each day the Fund is open for business ("valuation date").
Effective September 8, 2022, and pursuant to Rule 2a-5 under the 1940 Act, the Board of Trustees of the Trust (the "Board") designated New York Life Investment Management LLC (“New York Life Investments” or the "Manager") as its Valuation Designee (the "Valuation Designee"). The Valuation Designee is responsible for performing fair valuations relating to all investments in the Fund’s portfolio for which market quotations are not readily available; periodically assessing and managing material valuation risks; establishing and applying fair value methodologies; testing fair valuation methodologies; evaluating and overseeing pricing services; segregation of valuation and portfolio management functions; providing
| 22 | MainStay MacKay International Equity Fund |
quarterly, annual and prompt reporting to the Board, as appropriate; identifying potential conflicts of interest; and maintaining appropriate records. The Valuation Designee has established a valuation committee ("Valuation Committee") to assist in carrying out the Valuation Designee’s responsibilities and establish prices of securities for which market quotations are not readily available. The Fund’s and the Valuation Designee's policies and procedures ("Valuation Procedures") govern the Valuation Designee’s selection and application of methodologies for determining and calculating the fair value of Fund investments. The Valuation Designee may value Fund portfolio securities for which market quotations are not readily available and other Fund assets utilizing inputs from pricing services and other third-party sources (together, “Pricing Sources”). The Valuation Committee meets (in person, via electronic mail or via teleconference) on an ad-hoc basis to determine fair valuations and on a quarterly basis to review fair value events (excluding fair valuations from pricing services), including valuation risks and back-testing results, and preview reports to the Board.
The Valuation Committee establishes prices of securities for which market quotations are not readily available based on such methodologies and measurements on a regular basis after considering information that is reasonably available and deemed relevant by the Valuation Committee. The Board shall oversee the Valuation Designee and review fair valuation materials on a prompt, quarterly and annual basis and approve proposed revisions to the Valuation Procedures.
Investments for which market quotations are not readily available are valued at fair value as determined in good faith pursuant to the Valuation Procedures. A market quotation is readily available only when that quotation is a quoted price (unadjusted) in active markets for identical investments that the Fund can access at the measurement date, provided that a quotation will not be readily available if it is not reliable. Fair value measurements are determined within a framework that establishes a three-tier hierarchy that maximizes the use of observable market data and minimizes the use of unobservable inputs to establish a classification of fair value measurements for disclosure purposes. "Inputs" refer broadly to the assumptions that market participants would use in pricing the asset or liability, including assumptions about risk, such as the risk inherent in a particular valuation technique used to measure fair value using a pricing model and/or the risk inherent in the inputs for the valuation technique. Inputs may be observable or unobservable. Observable inputs reflect the assumptions market participants would use in pricing the asset or liability based on market data obtained from sources independent of the Fund. Unobservable inputs reflect the Fund’s own assumptions about the assumptions market participants would use in pricing the asset or liability based on the information available. The inputs or methodology used for valuing assets or liabilities may not be an indication of the risks associated with investing in those assets or liabilities. The three-tier hierarchy of inputs is summarized below.
| • | Level 1—quoted prices (unadjusted) in active markets for an identical asset or liability |
| • | Level 2—other significant observable inputs (including quoted prices for a similar asset or liability in active markets, interest rates and yield curves, prepayment speeds, credit risk, etc.) |
| • | Level 3—significant unobservable inputs (including the Fund's own assumptions about the assumptions that market participants would use in measuring fair value of an asset or liability) |
The level of an asset or liability within the fair value hierarchy is based on the lowest level of an input, both individually and in the aggregate, that is significant to the fair value measurement. The aggregate value by input level of the Fund’s assets and liabilities as of October 31, 2022, is included at the end of the Portfolio of Investments.
The Fund may use third-party vendor evaluations, whose prices may be derived from one or more of the following standard inputs, among others:
| • Broker/dealer quotes | • Benchmark securities |
| • Two-sided markets | • Reference data (corporate actions or material event notices) |
| • Bids/offers | • Monthly payment information |
| • Industry and economic events | • Reported trades |
An asset or liability for which a market quotation is not readily available is valued by methods deemed reasonable in good faith by the Valuation Committee, following the Valuation Procedures to represent fair value. Under these procedures, the Valuation Designee generally uses a market-based approach which may use related or comparable assets or liabilities, recent transactions, market multiples, book values and other relevant information. The Valuation Designee may also use an income-based valuation approach in which the anticipated future cash flows of the asset or liability are discounted to calculate fair value. Discounts may also be applied due to the nature and/or duration of any restrictions on the disposition of the asset or liability. Fair value represents a good faith approximation of the value of a security. Fair value determinations involve the consideration of a number of subjective factors, an analysis of applicable facts and circumstances and the exercise of judgment. As a result, it is possible that the fair value for a security determined in good faith in accordance with the Valuation Procedures may differ from valuations for the same security determined for other funds using their own valuation procedures. Although the Valuation Procedures are designed to value a security at the price the Fund may reasonably expect to receive upon the security's sale in an orderly transaction, there can be no assurance that any fair value determination thereunder would, in fact, approximate the amount that the Fund would actually realize upon the sale of the security or the price at which the security would trade if a reliable market price were readily available. During the year ended October 31, 2022, there were no material changes to the fair value methodologies.
Securities which may be valued in this manner include, but are not limited to: (i) a security for which trading has been halted or suspended or otherwise does not have a readily available market quotation on a given day; (ii) a debt security that has recently gone into default and for which there is not a current market quotation; (iii) a security of an issuer that
Notes to Financial Statements (continued)
has entered into a restructuring; (iv) a security that has been delisted from a national exchange; (v) a security subject to trading collars for which no or limited trading takes place; and (vi) a security whose principal market has been temporarily closed at a time when, under normal conditions, it would be open. Securities valued in this manner are generally categorized as Level 2 or 3 in the hierarchy.
Certain securities held by the Fund may principally trade in foreign markets. Events may occur between the time the foreign markets close and the time at which the Fund's NAVs are calculated. These events may include, but are not limited to, situations relating to a single issuer in a market sector, significant fluctuations in U.S. or foreign markets, natural disasters, armed conflicts, governmental actions or other developments not tied directly to the securities markets. Should the Valuation Designee conclude that such events may have affected the accuracy of the last price of such securities reported on the local foreign market, the Valuation Designee may, pursuant to the Valuation Procedures, adjust the value of the local price to reflect the estimated impact on the price of such securities as a result of such events. In this instance, securities are generally categorized as Level 3 in the hierarchy. Additionally, certain foreign equity securities are also fair valued whenever the movement of a particular index exceeds certain thresholds. In such cases, the securities are fair valued by applying factors provided by a third-party vendor in accordance with the Valuation Procedures and are generally categorized as Level 2 in the hierarchy. No foreign equity securities held by the Fund as of October 31, 2022 were fair valued in such a manner.
If the principal market of certain foreign equity securities is closed in observance of a local foreign holiday, these securities are valued using the last closing price of regular trading on the relevant exchange and fair valued by applying factors provided by a third-party vendor in accordance with the Valuation Procedures. These securities are generally categorized as Level 2 in the hierarchy. No securities held by the Fund as of October 31, 2022, were fair valued in such a manner.
Equity securities are valued at the last quoted sales prices as of the close of regular trading on the relevant exchange on each valuation date. Securities that are not traded on the valuation date are valued at the mean of the last quoted bid and ask prices. Prices are normally taken from the principal market in which each security trades. These securities are generally categorized as Level 1 in the hierarchy.
Investments in mutual funds, including money market funds, are valued at their respective NAVs at the close of business each day on the valuation date. These securities are generally categorized as Level 1 in the hierarchy.
Temporary cash investments acquired in excess of 60 days to maturity at the time of purchase are valued using the latest bid prices or using valuations based on a matrix system (which considers such factors as security prices, yields, maturities and ratings), both as furnished by independent pricing services. Temporary cash investments that mature in 60 days or less at the time of purchase ("Short-Term Investments") are valued using the amortized cost method of valuation, unless the use of such method would be inappropriate. The amortized cost method involves
valuing a security at its cost on the date of purchase and thereafter assuming a constant amortization to maturity of the difference between such cost and the value on maturity date. Amortized cost approximates the current fair value of a security. Securities valued using the amortized cost method are not valued using quoted prices in an active market and are generally categorized as Level 2 in the hierarchy.
The information above is not intended to reflect an exhaustive list of the methodologies that may be used to value portfolio investments. The Valuation Procedures permit the use of a variety of valuation methodologies in connection with valuing portfolio investments. The methodology used for a specific type of investment may vary based on the market data available or other considerations. The methodologies summarized above may not represent the specific means by which portfolio investments are valued on any particular business day.
(B) Income Taxes. The Fund's policy is to comply with the requirements of the Internal Revenue Code of 1986, as amended (the “Internal Revenue Code”), applicable to regulated investment companies and to distribute all of its taxable income to the shareholders of the Fund within the allowable time limits.
The Manager evaluates the Fund’s tax positions to determine if the tax positions taken meet the minimum recognition threshold in connection with accounting for uncertainties in income tax positions taken or expected to be taken for the purposes of measuring and recognizing tax liabilities in the financial statements. Recognition of tax benefits of an uncertain tax position is permitted only to the extent the position is “more likely than not” to be sustained assuming examination by taxing authorities. The Manager analyzed the Fund's tax positions taken on federal, state and local income tax returns for all open tax years (for up to three tax years) and has concluded that no provisions for federal, state and local income tax are required in the Fund's financial statements. The Fund's federal, state and local income tax and federal excise tax returns for tax years for which the applicable statutes of limitations have not expired are subject to examination by the Internal Revenue Service and state and local departments of revenue.
(C) Foreign Taxes. The Fund may be subject to foreign taxes on income and other transaction-based taxes imposed by certain countries in which it invests. A portion of the taxes on gains on investments or currency purchases/repatriation may be reclaimable. The Fund will accrue such taxes and reclaims as applicable, based upon its current interpretation of tax rules and regulations that exist in the markets in which it invests.
The Fund may be subject to taxation on realized capital gains, repatriation proceeds and other transaction-based taxes imposed by certain countries in which it invests. The Fund will accrue such taxes as applicable based upon its current interpretation of tax rules and regulations that exist in the market in which it invests. Capital gains taxes relating to positions still held are reflected as a liability in the Statement of Assets and Liabilities, as well as an adjustment to the Fund's net unrealized appreciation (depreciation). Taxes related to capital gains realized, if any, are reflected
| 24 | MainStay MacKay International Equity Fund |
as part of net realized gain (loss) in the Statement of Operations. Changes in tax liabilities related to capital gains taxes on unrealized investment gains, if any, are reflected as part of the change in net unrealized appreciation (depreciation) on investments in the Statement of Operations. Transaction-based charges are generally assessed as a percentage of the transaction amount.
(D) Dividends and Distributions to Shareholders. Dividends and distributions are recorded on the ex-dividend date. The Fund intends to declare and pay dividends from net investment income and distributions from net realized capital and currency gains, if any, at least annually. Unless a shareholder elects otherwise, all dividends and distributions are reinvested at NAV in the same class of shares of the Fund. Dividends and distributions to shareholders are determined in accordance with federal income tax regulations and may differ from determinations using GAAP.
(E) Security Transactions and Investment Income. The Fund records security transactions on the trade date. Realized gains and losses on security transactions are determined using the identified cost method. Dividend income is recognized on the ex-dividend date, net of any foreign tax withheld at the source, and interest income is accrued as earned using the effective interest rate method. Distributions received from real estate investment trusts may be classified as dividends, capital gains and/or return of capital.
Investment income and realized and unrealized gains and losses on investments of the Fund are allocated pro rata to the separate classes of shares based upon their relative net assets on the date the income is earned or realized and unrealized gains and losses are incurred.
(F) Expenses. Expenses of the Trust are allocated to the individual Funds in proportion to the net assets of the respective Funds when the expenses are incurred, except where direct allocations of expenses can be made. Expenses (other than transfer agent expenses and fees incurred under the shareholder services plans and/or the distribution plans further discussed in Note 3(B)) are allocated to separate classes of shares pro rata based upon their relative net assets on the date the expenses are incurred. The expenses borne by the Fund, including those of related parties to the Fund, are shown in the Statement of Operations.
Additionally, the Fund may invest in mutual funds, which are subject to management fees and other fees that may cause the costs of investing in mutual funds to be greater than the costs of owning the underlying securities directly. These indirect expenses of mutual funds are not included in the amounts shown as expenses in the Statement of Operations or in the expense ratios included in the Financial Highlights.
(G) Use of Estimates. In preparing financial statements in conformity with GAAP, the Manager makes estimates and assumptions that affect the reported amounts and disclosures in the financial statements. Actual results could differ from those estimates and assumptions.
(H) Foreign Currency Transactions. The Fund's books and records are maintained in U.S. dollars. Prices of securities denominated in foreign currency amounts are translated into U.S. dollars at the mean between
the buying and selling rates last quoted by any major U.S. bank at the following dates:
(i) market value of investment securities, other assets and liabilities— at the valuation date; and
(ii) purchases and sales of investment securities, income and expenses—at the date of such transactions.
The assets and liabilities that are denominated in foreign currency amounts are presented at the exchange rates and market values at the close of the period. The realized and unrealized changes in net assets arising from fluctuations in exchange rates and market prices of securities are not separately presented.
Net realized gain (loss) on foreign currency transactions represents net currency gains or losses realized as a result of differences between the amounts of securities sale proceeds or purchase cost, dividends, interest and withholding taxes as recorded on the Fund's books, and the U.S. dollar equivalent amount actually received or paid. Net currency gains or losses from valuing such foreign currency denominated assets and liabilities, other than investments at valuation date exchange rates, are reflected in unrealized foreign exchange gains or losses.
(I) Securities Lending. In order to realize additional income, the Fund may engage in securities lending, subject to the limitations set forth in the 1940 Act and relevant guidance by the staff of the Securities and Exchange Commission (“SEC”). If the Fund engages in securities lending, the Fund will lend through its custodian, JPMorgan Chase Bank, N.A., ("JPMorgan"), acting as securities lending agent on behalf of the Fund. Under the current arrangement, JPMorgan will manage the Fund's collateral in accordance with the securities lending agency agreement between the Fund and JPMorgan, and indemnify the Fund against counterparty risk. The loans will be collateralized by cash (which may be invested in a money market fund) and/or non-cash collateral (which may include U.S. Treasury securities and/or U.S. government agency securities issued or guaranteed by the United States government or its agencies or instrumentalities) at least equal at all times to the market value of the securities loaned. Non-cash collateral held at year end is segregated and cannot be transferred by the Fund. The Fund bears the risk of delay in recovery of, or loss of rights in, the securities loaned. The Fund may also record a realized gain or loss on securities deemed sold due to a borrower’s inability to return securities on loan. The Fund bears the risk of any loss on investment of cash collateral. The Fund will receive compensation for lending its securities in the form of fees or it will retain a portion of interest earned on the investment of any cash collateral. The Fund will also continue to receive interest and dividends on the securities loaned and any gain or loss in the market price of the securities loaned that may occur during the term of the loan will be for the account of the Fund. Income earned from securities lending activities, if any, is reflected in the Statement of Operations. As of October 31, 2022, the Fund did not have any portfolio securities on loan.
Notes to Financial Statements (continued)
(J) Foreign Securities Risk. The Fund may invest in foreign securities, which carry certain risks that are in addition to the usual risks inherent in domestic securities. These risks include those resulting from currency fluctuations, future adverse political or economic developments and possible imposition of currency exchange blockages or other foreign governmental laws or restrictions. These risks are likely to be greater in emerging markets than in developed markets. The ability of issuers of debt securities held by the Fund to meet their obligations may be affected by, among other things, economic or political developments in a specific country, industry or region.
(K) Indemnifications. Under the Trust’s organizational documents, its officers and trustees are indemnified against certain liabilities that may arise out of performance of their duties to the Trust. Additionally, in the normal course of business, the Fund enters into contracts with third-party service providers that contain a variety of representations and warranties and that may provide general indemnifications. The Fund's maximum exposure under these arrangements is unknown, as this would involve future claims that may be made against the Fund that have not yet occurred. The Manager believes that the risk of loss in connection with these potential indemnification obligations is remote. However, there can be no assurance that material liabilities related to such obligations will not arise in the future, which could adversely impact the Fund.
Note 3–Fees and Related Party Transactions
(A) Manager and Subadvisor. New York Life Investments, a registered investment adviser and an indirect, wholly-owned subsidiary of New York Life Insurance Company ("New York Life"), serves as the Fund's Manager, pursuant to an Amended and Restated Management Agreement ("Management Agreement"). The Manager provides offices, conducts clerical, recordkeeping and bookkeeping services and keeps most of the financial and accounting records required to be maintained by the Fund. Except for the portion of salaries and expenses that are the responsibility of the Fund, the Manager pays the salaries and expenses of all personnel affiliated with the Fund and certain operational expenses of the Fund. During a portion of the year ended October 31, 2022, the Fund reimbursed New York Life Investments in an amount equal to the portion of the compensation of the Chief Compliance Officer attributable to the Fund. MacKay Shields LLC ("MacKay Shields" or the "Subadvisor"), a registered investment adviser and an indirect, wholly-owned subsidiary of New York Life, serves as the Subadvisor to the Fund and is responsible for the day-to-day portfolio management of the Fund. Pursuant to the terms of an Amended and Restated Subadvisory Agreement ("Subadvisory Agreement") between New York Life Investments and MacKay Shields, New York Life Investments pays for the services of the Subadvisor.
Pursuant to the Management Agreement, the Fund pays the Manager a monthly fee for the services performed and the facilities furnished at an annual rate of the Fund’s average daily net assets as follows: 0.89% up to $500 million; and 0.85% in excess of $500 million. During the year ended October 31, 2022, the effective management fee rate was 0.89%
of the Fund’s average daily net assets, exclusive of any applicable waivers/reimbursements.
New York Life Investments has contractually agreed to waive fees and/or reimburse expenses so that Total Annual Fund Operating Expenses (excluding taxes, interest, litigation, extraordinary expenses, brokerage and other transaction expenses relating to the purchase or sale of portfolio investments and acquired (underlying) fund fees and expenses) do not exceed the following percentages of daily net assets: Class I, 0.85% and Class R6, 0.83%. New York Life Investments will apply an equivalent waiver or reimbursement, in an equal number of basis points of the Class R6 shares waiver/reimbursement to the Class A, Investor Class, Class B, Class C, Class R1, Class R2 and Class R3 shares. This agreement will remain in effect until February 28, 2023, and shall renew automatically for one-year terms unless New York Life Investments provides written notice of termination prior to the start of the next term or upon approval of the Board.
New York Life Investments has agreed to voluntarily waive fees and/or reimburse expenses of the appropriate class of the Fund so that Total Annual Fund Operating Expenses (excluding taxes, interest, litigation, extraordinary expenses, brokerage and other transaction expenses relating to the purchase and sale of portfolio investments, and acquired (underlying) fund fees and expenses) of a class do not exceed the following percentages of average daily net assets: Investor Class, 1.85%; Class B, 2.60%; and Class C, 2.60%. These voluntary waivers or reimbursements may be discontinued at any time without notice.
During the year ended October 31, 2022, New York Life Investments earned fees from the Fund in the amount of $3,199,310 and waived fees and/or reimbursed expenses in the amount of $698,531 and paid the Subadvisor fees of $1,253,613.
JPMorgan provides sub-administration and sub-accounting services to the Fund pursuant to an agreement with New York Life Investments. These services include calculating the daily NAVs of the Fund, maintaining the general ledger and sub-ledger accounts for the calculation of the Fund's NAVs, and assisting New York Life Investments in conducting various aspects of the Fund's administrative operations. For providing these services to the Fund, JPMorgan is compensated by New York Life Investments.
Pursuant to an agreement between the Trust and New York Life Investments, New York Life Investments is responsible for providing or procuring certain regulatory reporting services for the Fund. The Fund will reimburse New York Life Investments for the actual costs incurred by New York Life Investments in connection with providing or procuring these services for the Fund.
(B) Distribution and Service Fees. The Trust, on behalf of the Fund, has entered into a distribution agreement with NYLIFE Distributors LLC (the “Distributor”), an affiliate of New York Life Investments. The Fund has adopted distribution plans (the “Plans”) in accordance with the provisions of Rule 12b-1 under the 1940 Act.
| 26 | MainStay MacKay International Equity Fund |
Pursuant to the Class A, Investor Class and Class R2 Plans, the Distributor receives a monthly fee from the Class A, Investor Class and Class R2 shares at an annual rate of 0.25% of the average daily net assets of the Class A, Investor Class and Class R2 shares for distribution and/or service activities as designated by the Distributor. Pursuant to the Class B and Class C Plans, Class B and Class C shares pay the Distributor a monthly distribution fee at an annual rate of 0.75% of the average daily net assets of the Class B and Class C shares, along with a service fee at an annual rate of 0.25% of the average daily net assets of the Class B and Class C shares, for a total 12b-1 fee of 1.00%. Pursuant to the Class R3 Plan, Class R3 shares pay the Distributor a monthly distribution fee at an annual rate of 0.25% of the average daily net assets of the Class R3 shares, along with a service fee at an annual rate of 0.25% of the average daily net assets of the Class R3 shares, for a total 12b-1 fee of 0.50%. Class I, Class R1 and Class R6 shares are not subject to a distribution and/or service fee.
The Plans provide that the distribution and service fees are payable to the Distributor regardless of the amounts actually expended by the Distributor for distribution of the Fund's shares and service activities.
In accordance with the Shareholder Services Plans for the Class R1, Class R2 and Class R3 shares, the Manager has agreed to provide, through its affiliates or independent third parties, various shareholder and administrative support services to shareholders of the Class R1, Class R2 and Class R3 shares. For its services, the Manager, its affiliates or independent third-party service providers are entitled to a shareholder service fee accrued daily and paid monthly at an annual rate of 0.10% of the average daily net assets of the Class R1, Class R2 and Class R3 shares. This is in addition to any fees paid under the Class R2 and Class R3 Plans.
During the year ended October 31, 2022, shareholder service fees incurred by the Fund were as follows:
| |
| Class R1 | $127 |
| Class R2 | 199 |
| Class R3 | 814 |
(C) Sales Charges. The Fund was advised by the Distributor that the amount of initial sales charges retained on sales of Class A and Investor Class shares during the year ended October 31, 2022, were $7,043 and $2,582, respectively.
The Fund was also advised that the Distributor retained CDSCs on redemptions of Class A, Class B and Class C shares during the year ended October 31, 2022, of $1,782, $193 and $86, respectively.
(D) Transfer, Dividend Disbursing and Shareholder Servicing Agent. NYLIM Service Company LLC, an affiliate of New York Life Investments, is the Fund's transfer, dividend disbursing and shareholder servicing agent pursuant to an agreement between NYLIM Service Company LLC and the Trust. NYLIM Service Company LLC has entered into an agreement with DST Asset Manager Solutions, Inc. ("DST"),
pursuant to which DST performs certain transfer agent services on behalf of NYLIM Service Company LLC. New York Life Investments has contractually agreed to limit the transfer agency expenses charged to the Fund’s share classes to a maximum of 0.35% of that share class’s average daily net assets on an annual basis after deducting any applicable Fund or class-level expense reimbursement or small account fees. This agreement will remain in effect until February 28, 2023, and shall renew automatically for one-year terms unless New York Life Investments provides written notice of termination prior to the start of the next term or upon approval of the Board. During the year ended October 31, 2022, transfer agent expenses incurred by the Fund and any reimbursements, pursuant to the aforementioned Transfer Agency expense limitation agreement, were as follows:
| Class | Expense | Waived |
| Class A | $80,870 | $— |
| Investor Class | 79,884 | — |
| Class B | 6,669 | — |
| Class C | 7,937 | — |
| Class I | 45,706 | — |
| Class R1 | 151 | — |
| Class R2 | 232 | — |
| Class R3 | 960 | — |
| Class R6 | 9,179 | — |
(E) Small Account Fee. Shareholders with small accounts adversely impact the cost of providing transfer agency services. In an effort to reduce total transfer agency expenses, the Fund has implemented a small account fee on certain types of accounts. As described in the Fund's prospectus, certain shareholders with an account balance of less than $1,000 ($5,000 for Class A share accounts) are charged an annual per account fee of $20 (assessed semi-annually), the proceeds from which offset transfer agent fees as reflected in the Statement of Operations. This small account fee will not apply to certain types of accounts as described further in the Fund’s prospectus.
(F) Capital. As of October 31, 2022, New York Life and its affiliates beneficially held shares of the Fund with the values and percentages of net assets as follows:
| Class I | $ 12,404,086 | 40.0% |
| Class R6 | 147,676,735 | 75.4 |
Notes to Financial Statements (continued)
Note 4-Federal Income Tax
As of October 31, 2022, the cost and unrealized appreciation (depreciation) of the Fund’s investment portfolio, including applicable derivative contracts and other financial instruments, as determined on a federal income tax basis, were as follows:
| | Federal Tax
Cost | Gross
Unrealized
Appreciation | Gross
Unrealized
(Depreciation) | Net
Unrealized
Appreciation/
(Depreciation) |
| Investments in Securities | $305,436,717 | $18,782,622 | $(37,823,333) | $(19,040,711) |
As of October 31, 2022, the components of accumulated gain (loss) on a tax basis were as follows:
Ordinary
income | Accumulated
Capital
and Other
Gain (Loss) | Other
Temporary
Differences | Unrealized
Appreciation
(Depreciation) | Total
Accumulated
Gain (Loss) |
| $1,448,153 | $(34,363,901) | $— | $(19,133,243) | $(52,048,991) |
The difference between book-basis and tax-basis unrealized appreciation (depreciation) is primarily due to wash sale adjustments and Passive Foreign Investment Company (“PFIC”) adjustments.
The following table discloses the current year reclassifications between total distributable earnings (loss) and additional paid-in capital arising from permanent differences; net assets as of October 31, 2022 were not affected.
| | Total
Distributable
Earnings (Loss) | Additional
Paid-In
Capital |
| | $3,168 | $(3,168) |
The reclassifications for the Fund are primarily due to equalization.
As of October 31, 2022, for federal income tax purposes, capital loss carryforwards of $34,363,901, as shown in the table below, were available to the extent provided by the regulations to offset future realized gains of the Fund. Accordingly, no capital gains distributions are expected to be paid to shareholders until net gains have been realized in excess of such amounts.
Capital Loss
Available Through | Short-Term
Capital Loss
Amounts (000’s) | Long-Term
Capital Loss
Amounts (000’s) |
| Unlimited | $34,364 | $— |
During the years ended October 31, 2022 and October 31, 2021, the tax character of distributions paid as reflected in the Statements of Changes in Net Assets was as follows:
| | 2022 | 2021 |
| Distributions paid from: | | |
| Ordinary Income | $22,641,609 | $ 8,006,740 |
| Long-Term Capital Gains | 33,446,700 | 5,547,764 |
| Total | $56,088,309 | $13,554,504 |
Note 5–Custodian
JPMorgan is the custodian of cash and securities held by the Fund. Custodial fees are charged to the Fund based on the Fund's net assets and/or the market value of securities held by the Fund and the number of certain transactions incurred by the Fund.
Note 6–Line of Credit
The Fund and certain other funds managed by New York Life Investments maintain a line of credit with a syndicate of banks in order to secure a source of funds for temporary purposes to meet unanticipated or excessive redemption requests.
Effective July 26, 2022, under the credit agreement (the “Credit Agreement”), the aggregate commitment amount is $600,000,000 with an additional uncommitted amount of $100,000,000. The commitment fee is an annual rate of 0.15% of the average commitment amount payable quarterly, regardless of usage, to JPMorgan, who serves as the agent to the syndicate. The commitment fee is allocated among the Fund and certain other funds managed by New York Life Investments based upon their respective net assets and other factors. Interest on any revolving credit loan is charged based upon the Federal Funds Rate, Daily Simple Secured Overnight Financing Rate ("SOFR") + 0.10%, or the Overnight Bank Funding Rate, whichever is higher. The Credit Agreement expires on July 25, 2023, although the Fund, certain other funds managed by New York Life Investments and the syndicate of banks may renew the Credit Agreement for an additional year on the same or different terms or enter into a credit agreement with a different syndicate of banks. Prior to July 26, 2022, the aggregate commitment amount and the commitment fee were the same as those under the current Credit Agreement. During the year ended October 31, 2022, there were no borrowings made or outstanding with respect to the Fund under the Credit Agreement.
Note 7–Interfund Lending Program
Pursuant to an exemptive order issued by the SEC, the Fund, along with certain other funds managed by New York Life Investments, may participate in an interfund lending program. The interfund lending program provides an alternative credit facility that permits the Fund and certain other funds managed by New York Life Investments to lend or borrow money for temporary purposes directly to or from one another, subject to the conditions of the exemptive order. During the year ended
| 28 | MainStay MacKay International Equity Fund |
October 31, 2022, there were no interfund loans made or outstanding with respect to the Fund.
Note 8–Purchases and Sales of Securities (in 000’s)
During the year ended October 31, 2022, purchases and sales of securities, other than short-term securities, were $328,447 and $329,435, respectively.
Note 9–Capital Share Transactions
Transactions in capital shares for the years ended October 31, 2022 and October 31, 2021, were as follows:
| Class A | Shares | Amount |
| Year ended October 31, 2022: | | |
| Shares sold | 289,482 | $ 4,856,586 |
| Shares issued to shareholders in reinvestment of distributions | 560,771 | 11,086,447 |
| Shares redeemed | (753,863) | (12,494,554) |
| Net increase (decrease) in shares outstanding before conversion | 96,390 | 3,448,479 |
| Shares converted into Class A (See Note 1) | 43,392 | 762,030 |
| Shares converted from Class A (See Note 1) | (2,051) | (29,683) |
| Net increase (decrease) | 137,731 | $ 4,180,826 |
| Year ended October 31, 2021: | | |
| Shares sold | 439,982 | $ 9,546,189 |
| Shares issued to shareholders in reinvestment of distributions | 122,230 | 2,462,926 |
| Shares redeemed | (481,241) | (10,442,551) |
| Net increase (decrease) in shares outstanding before conversion | 80,971 | 1,566,564 |
| Shares converted into Class A (See Note 1) | 301,169 | 6,650,481 |
| Shares converted from Class A (See Note 1) | (115) | (2,340) |
| Net increase (decrease) | 382,025 | $ 8,214,705 |
| |
| Investor Class | Shares | Amount |
| Year ended October 31, 2022: | | |
| Shares sold | 31,347 | $ 526,561 |
| Shares issued to shareholders in reinvestment of distributions | 142,976 | 2,776,584 |
| Shares redeemed | (83,625) | (1,399,796) |
| Net increase (decrease) in shares outstanding before conversion | 90,698 | 1,903,349 |
| Shares converted into Investor Class (See Note 1) | 15,324 | 257,757 |
| Shares converted from Investor Class (See Note 1) | (25,373) | (450,746) |
| Net increase (decrease) | 80,649 | $ 1,710,360 |
| Year ended October 31, 2021: | | |
| Shares sold | 53,338 | $ 1,151,658 |
| Shares issued to shareholders in reinvestment of distributions | 44,113 | 877,859 |
| Shares redeemed | (92,836) | (1,997,436) |
| Net increase (decrease) in shares outstanding before conversion | 4,615 | 32,081 |
| Shares converted into Investor Class (See Note 1) | 22,666 | 486,379 |
| Shares converted from Investor Class (See Note 1) | (284,938) | (6,205,441) |
| Net increase (decrease) | (257,657) | $ (5,686,981) |
| |
| Class B | Shares | Amount |
| Year ended October 31, 2022: | | |
| Shares sold | 1,124 | $ 15,284 |
| Shares issued to shareholders in reinvestment of distributions | 19,144 | 311,669 |
| Shares redeemed | (16,841) | (230,567) |
| Net increase (decrease) in shares outstanding before conversion | 3,427 | 96,386 |
| Shares converted from Class B (See Note 1) | (35,411) | (491,479) |
| Net increase (decrease) | (31,984) | $ (395,093) |
| Year ended October 31, 2021: | | |
| Shares sold | 2,841 | $ 51,762 |
| Shares issued to shareholders in reinvestment of distributions | 6,071 | 104,666 |
| Shares redeemed | (19,104) | (357,112) |
| Net increase (decrease) in shares outstanding before conversion | (10,192) | (200,684) |
| Shares converted from Class B (See Note 1) | (30,867) | (579,598) |
| Net increase (decrease) | (41,059) | $ (780,282) |
| |
Notes to Financial Statements (continued)
| Class C | Shares | Amount |
| Year ended October 31, 2022: | | |
| Shares sold | 10,958 | $ 160,195 |
| Shares issued to shareholders in reinvestment of distributions | 21,744 | 353,778 |
| Shares redeemed | (48,237) | (687,659) |
| Net increase (decrease) in shares outstanding before conversion | (15,535) | (173,686) |
| Shares converted from Class C (See Note 1) | (5,356) | (77,562) |
| Net increase (decrease) | (20,891) | $ (251,248) |
| Year ended October 31, 2021: | | |
| Shares sold | 9,708 | $ 182,118 |
| Shares issued to shareholders in reinvestment of distributions | 7,760 | 133,783 |
| Shares redeemed | (62,839) | (1,151,894) |
| Net increase (decrease) in shares outstanding before conversion | (45,371) | (835,993) |
| Shares converted from Class C (See Note 1) | (18,849) | (349,481) |
| Net increase (decrease) | (64,220) | $ (1,185,474) |
| |
| Class I | Shares | Amount |
| Year ended October 31, 2022: | | |
| Shares sold | 287,164 | $ 5,134,297 |
| Shares issued to shareholders in reinvestment of distributions | 334,732 | 6,681,247 |
| Shares redeemed | (657,717) | (11,940,886) |
| Net increase (decrease) in shares outstanding before conversion | (35,821) | (125,342) |
| Shares converted into Class I (See Note 1) | 2,027 | 29,683 |
| Net increase (decrease) | (33,794) | $ (95,659) |
| Year ended October 31, 2021: | | |
| Shares sold | 508,899 | $ 11,312,447 |
| Shares issued to shareholders in reinvestment of distributions | 71,624 | 1,454,680 |
| Shares redeemed | (274,230) | (6,066,101) |
| Net increase (decrease) | 306,293 | $ 6,701,026 |
| |
| Class R1 | Shares | Amount |
| Year ended October 31, 2022: | | |
| Shares sold | 1,471 | $ 24,401 |
| Shares issued to shareholders in reinvestment of distributions | 950 | 18,831 |
| Shares redeemed | (2,084) | (33,689) |
| Net increase (decrease) | 337 | $ 9,543 |
| Year ended October 31, 2021: | | |
| Shares sold | 977 | $ 21,179 |
| Shares issued to shareholders in reinvestment of distributions | 287 | 5,793 |
| Shares redeemed | (2,424) | (53,729) |
| Net increase (decrease) | (1,160) | $ (26,757) |
| |
| Class R2 | Shares | Amount |
| Year ended October 31, 2022: | | |
| Shares sold | 742 | $ 11,889 |
| Shares issued to shareholders in reinvestment of distributions | 577 | 11,421 |
| Shares redeemed | (1,689) | (36,585) |
| Net increase (decrease) | (370) | $ (13,275) |
| Year ended October 31, 2021: | | |
| Shares sold | 787 | $ 16,945 |
| Shares issued to shareholders in reinvestment of distributions | 697 | 14,076 |
| Shares redeemed | (15,737) | (367,300) |
| Net increase (decrease) | (14,253) | $ (336,279) |
| |
| Class R3 | Shares | Amount |
| Year ended October 31, 2022: | | |
| Shares sold | 7,202 | $ 124,556 |
| Shares issued to shareholders in reinvestment of distributions | 6,160 | 119,739 |
| Shares redeemed | (2,370) | (36,864) |
| Net increase (decrease) | 10,992 | $ 207,431 |
| Year ended October 31, 2021: | | |
| Shares sold | 9,642 | $ 204,513 |
| Shares issued to shareholders in reinvestment of distributions | 2,389 | 47,594 |
| Shares redeemed | (34,705) | (776,187) |
| Net increase (decrease) | (22,674) | $ (524,080) |
| |
| Class R6 | Shares | Amount |
| Year ended October 31, 2022: | | |
| Shares sold | 1,629,080 | $ 27,514,690 |
| Shares issued to shareholders in reinvestment of distributions | 1,728,941 | 34,544,245 |
| Shares redeemed | (655,742) | (11,066,179) |
| Net increase (decrease) | 2,702,279 | $ 50,992,756 |
| Year ended October 31, 2021: | | |
| Shares sold | 982,195 | $ 21,948,868 |
| Shares issued to shareholders in reinvestment of distributions | 413,514 | 8,406,730 |
| Shares redeemed | (1,021,160) | (22,749,140) |
| Net increase (decrease) | 374,549 | $ 7,606,458 |
Note 10–Other Matters
As of the date of this report, interest rates in the United States and many parts of the world, including certain European countries, are ascending from historically low levels. Thus, the Fund currently faces a heightened level of risk associated with rising interest rates. This could be driven by a variety of factors, including but not limited to central bank monetary policies, changing inflation or real growth rates, general economic conditions, increasing bond issuances or reduced market demand for low yielding investments.
| 30 | MainStay MacKay International Equity Fund |
An outbreak of COVID-19, first detected in December 2019, has developed into a global pandemic and has resulted in travel restrictions, closure of international borders, certain businesses and securities markets, restrictions on securities trading activities, prolonged quarantines, supply chain disruptions, and lower consumer demand, as well as general concern and uncertainty. In 2022, many countries lifted some or all restrictions related to COVID-19. However, the continued impact of COVID-19 and related variants is uncertain and could further adversely affect the global economy, national economies, individual issuers and capital markets in unforeseeable ways and result in a substantial and extended economic downturn. Developments that disrupt global economies and financial markets, such as COVID-19, may magnify factors that affect the Fund's performance.
Note 11–Subsequent Events
In connection with the preparation of the financial statements of the Fund as of and for the year ended October 31, 2022, events and transactions subsequent to October 31, 2022, through the date the financial statements were issued have been evaluated by the Manager for possible adjustment and/or disclosure. No subsequent events requiring financial statement adjustment or disclosure have been identified.
Report of Independent Registered Public Accounting Firm
To the Shareholders of the Fund and Board of Trustees
The MainStay Funds:
Opinion on the Financial Statements
We have audited the accompanying statement of assets and liabilities of MainStay MacKay International Equity Fund (the Fund), one of the funds constituting The MainStay Funds, including the portfolio of investments, as of October 31, 2022, the related statement of operations for the year then ended, the statements of changes in net assets for each of the years in the two-year period then ended, and the related notes (collectively, the financial statements) and the financial highlights for each of the years or periods in the five-year period then ended. In our opinion, the financial statements and financial highlights present fairly, in all material respects, the financial position of the Fund as of October 31, 2022, the results of its operations for the year then ended, the changes in its net assets for each of the years in the two-year period then ended, and the financial highlights for each of the years or periods in the five-year period then ended, in conformity with U.S. generally accepted accounting principles.
Basis for Opinion
These financial statements and financial highlights are the responsibility of the Fund's management. Our responsibility is to express an opinion on these financial statements and financial highlights based on our audits. We are a public accounting firm registered with the Public Company Accounting Oversight Board (United States) (PCAOB) and are required to be independent with respect to the Fund in accordance with the U.S. federal securities laws and the applicable rules and regulations of the Securities and Exchange Commission and the PCAOB.
We conducted our audits in accordance with the standards of the PCAOB. Those standards require that we plan and perform the audit to obtain reasonable assurance about whether the financial statements and financial highlights are free of material misstatement, whether due to error or fraud. Our audits included performing procedures to assess the risks of material misstatement of the financial statements and financial highlights, whether due to error or fraud, and performing procedures that respond to those risks. Such procedures included examining, on a test basis, evidence regarding the amounts and disclosures in the financial statements and financial highlights. Such procedures also included confirmation of securities owned as of October 31, 2022, by correspondence with the custodian and the transfer agent. Our audits also included evaluating the accounting principles used and significant estimates made by management, as well as evaluating the overall presentation of the financial statements and financial highlights. We believe that our audits provide a reasonable basis for our opinion.

We have served as the auditor of one or more New York Life Investment Management investment companies since 2003.
Philadelphia, Pennsylvania
December 23, 2022
| 32 | MainStay MacKay International Equity Fund |
Federal Income Tax Information
(Unaudited)
The Fund is required under the Internal Revenue Code to advise shareholders in a written statement as to the federal tax status of dividends paid by the Fund during such fiscal years. Accordingly, the Fund paid $33,444,777 as long term capital gain distributions.
For the fiscal year ended October 31, 2022, the Fund designated approximately $5,428,797 under the Internal Revenue Code as qualified dividend income eligible for reduced tax rates.
In accordance with federal tax law, the Fund elected to provide each shareholder with their portion of the Fund’s foreign taxes paid and the income sourced from foreign countries. Accordingly, the Fund made the following designations regarding its fiscal year ended October 31, 2022:
• the total amount of taxes credited to foreign countries was $279,655.
• the total amount of income sourced from foreign countries was $1,280,895.
In February 2023, shareholders will receive an IRS Form 1099-DIV or substitute Form 1099, which will show the federal tax status of the distributions received by shareholders in calendar year 2022. The amounts that will be reported on such 1099-DIV or substitute Form 1099 will be the amounts you are to use on your federal income tax return and will differ from the amounts which we must report for the Fund's fiscal year ended October 31, 2022.
Proxy Voting Policies and Procedures and Proxy Voting Record
The Fund is required to file with the SEC its proxy voting record for the 12-month period ending June 30 on Form N-PX. A description of the policies and procedures that are used to vote proxies relating to portfolio securities of the Fund is available free of charge upon request by calling 800-624-6782 or visiting the SEC’s website at www.sec.gov. The most recent Form N-PX or proxy voting record is available free of charge upon request by calling 800-624-6782; visiting newyorklifeinvestments.com; or visiting the SEC’s website at www.sec.gov.
Shareholder Reports and Quarterly Portfolio Disclosure
The Fund is required to file its complete schedule of portfolio holdings with the SEC 60 days after its first and third fiscal quarter on Form N-PORT. The Fund's holdings report is available free of charge upon request by calling New York Life Investments at 800-624-6782.
Board of Trustees and Officers (Unaudited)
The Trustees and officers of the Fund are listed below. The Board oversees the MainStay Group of Funds (which consists of MainStay Funds and MainStay Funds Trust), MainStay VP Funds Trust, MainStay MacKay DefinedTerm Municipal Opportunities Fund, MainStay CBRE Global Infrastructure Megatrends Fund, the Manager and the Subadvisors, and elects the officers of the Funds who are responsible for the day-to-day operations of the Fund. Information pertaining to the Trustees and officers is set forth below. Each Trustee serves until his or her successor is
elected and qualified or until his or her resignation, death or removal. Under the Board’s retirement policy, unless an exception is made, a Trustee must tender his or her resignation by the end of the calendar year during which he or she reaches the age of 75. The business address of each Trustee and officer listed below is 51 Madison Avenue, New York, New York 10010. None of the Trustees are “interested persons” (as defined by the 1940 Act and rules adopted by the SEC thereunder) of the Fund (“Independent Trustees”).
| | Name and
Year of Birth | Term of Office,
Position(s) Held and
Length of Service | Principal Occupation(s)
During Past Five Years | Number of
Portfolios in
Fund Complex
Overseen by
Trustee | Other Directorships
Held by Trustee |
| | | | | | |
| | David H. Chow
1957 | MainStay Funds: Trustee since 2016, Advisory Board Member (June 2015 to December 2015);MainStay Funds Trust:
Trustee since January 2016, Advisory Board Member (June 2015 to December 2015) | Founder and CEO, DanCourt Management, LLC since 1999 | 78 | MainStay VP Funds Trust: Trustee since January 2016, Advisory Board Member (June 2015 to December 2015) (31 portfolios);
MainStay MacKay DefinedTerm Municipal Opportunities Fund: Trustee since January 2016, Advisory Board Member (June 2015 to December 2015);
MainStay CBRE Global Infrastructure Megatrends Fund: Trustee since June 2021; VanEck Vectors Group of Exchange-Traded Funds: Independent Chairman of the Board of Trustees since 2008 and Trustee since 2006 (56 portfolios); and Berea College of Kentucky: Trustee since 2009, Chair of the Investment Committee since 2018 |
| | Susan B. Kerley
1951 | MainStay Funds: Chairman since 2017 and Trustee since 2007;MainStay Funds Trust:
Chairman since 2017 and Trustee since 1990** | President, Strategic Management Advisors LLC since 1990 | 78 | MainStay VP Funds Trust: Chairman since January 2017 and Trustee since 2007 (31 portfolios)**;
MainStay MacKay DefinedTerm Municipal Opportunities Fund: Chairman since 2017 and Trustee since 2011;
MainStay CBRE Global Infrastructure Megatrends Fund: Trustee since June 2021; and Legg Mason Partners Funds: Trustee since 1991 (45 portfolios) |
| | Alan R. Latshaw
1951 | MainStay Funds: Trustee since 2006;MainStay Funds Trust:
Trustee since 2007*** | Retired; Partner, Ernst & Young LLP (2002 to 2003); Partner, Arthur Andersen LLP (1989 to 2002); Consultant to the MainStay Funds Audit and Compliance Committee (2004 to 2006) | 78 | MainStay VP Funds Trust: Trustee since 2007 (31 portfolios)**;
MainStay MacKay DefinedTerm Municipal Opportunities Fund: Trustee since 2011; and
MainStay CBRE Global Infrastructure Megatrends Fund: Trustee since June 2021 |
| 34 | MainStay MacKay International Equity Fund |
| | Name and
Year of Birth | Term of Office,
Position(s) Held and
Length of Service | Principal Occupation(s)
During Past Five Years | Number of
Portfolios in
Fund Complex
Overseen by
Trustee | Other Directorships
Held by Trustee |
| | | | | | |
| | Karen Hammond
1956 | MainStay Funds: Trustee since December 2021, Advisory Board Member (June 2021 to December 2021);MainStay Funds Trust:
Trustee since December 2021, Advisory Board Member (June 2021 to December 2021)
| Retired, Managing Director, Devonshire Investors (2007 to 2013); Senior Vice President, Fidelity Management & Research Co. (2005 to 2007); Senior Vice President and Corporate Treasurer, FMR Corp. (2003 to 2005); Chief Operating Officer, Fidelity Investments Japan (2001 to 2003) | 78 | MainStay VP Funds Trust: Trustee since December 2021, Advisory Board Member (June 2021 to December 2021) (31 Portfolios);
MainStay MacKay DefinedTerm Municipal Opportunities Fund: Trustee since December 2021, Advisory Board Member (June 2021 to December 2021);
MainStay CBRE Global Infrastructure Megatrends Fund: Trustee since December 2021, Advisory Board Member (June 2021 to December 2021);
Two Harbors Investment Corp.: Director since 2018;
Rhode Island State Investment Commission: Member since 2017; and
Blue Cross Blue Shield of Rhode Island: Director since 2019 |
| | Jacques P. Perold
1958 | MainStay Funds: Trustee since 2016, Advisory Board Member (June 2015 toDecember 2015);MainStay Funds Trust:
Trustee since January 2016, Advisory Board Member (June 2015 to December 2015) | Founder and Chief Executive Officer, CapShift Advisors LLC (since 2018); President, Fidelity Management & Research Company (2009 to 2014); President and Chief Investment Officer, Geode Capital Management, LLC (2001 to 2009) | 78 | MainStay VP Funds Trust: Trustee since January 2016, Advisory Board Member (June 2015 to December 2015) (31 portfolios);
MainStay MacKay DefinedTerm Municipal Opportunities Fund: Trustee since January 2016, Advisory Board Member (June 2015 to December 2015);
MainStay CBRE Global Infrastructure Megatrends Fund: Trustee since June 2021; Partners in Health: Trustee since 2019; Allstate Corporation: Director since 2015; and MSCI Inc.: Director since 2017 |
| | Richard S. Trutanic
1952 | MainStay Funds: Trustee since 1994;MainStay Funds Trust:
Trustee since 2007*** | Chairman and Chief Executive Officer, Somerset & Company (financial advisory firm) since 2004; Managing Director, The Carlyle Group (private investment firm) (2002 to 2004); Senior Managing Director, Partner and Board Member, Groupe Arnault S.A. (private investment firm) (1999 to 2002) | 78 | MainStay VP Funds Trust: Trustee since 2007 (31 portfolios)**;
MainStay MacKay DefinedTerm Municipal Opportunities Fund: Trustee since 2011; and MainStay CBRE Global Infrastructure Megatrends Fund: Trustee since June 2021 |
| ** | Includes prior service as a Director of MainStay VP Series Fund, Inc., the predecessor to MainStay VP Funds Trust. |
| *** | Includes prior service as a Director/Trustee of certain predecessor entities to MainStay Funds Trust. |
Board of Trustees and Officers (Unaudited) (continued)
| | Name and
Year of Birth | Position(s) Held and
Length of Service | Principal Occupation(s)
During Past Five Years | |
| | | | | |
| | Kirk C. Lehneis
1974 | President, MainStay Funds, MainStay Funds Trust since 2017 | Chief Operating Officer and Senior Managing Director (since 2016), New York Life Investment Management LLC and New York Life Investment Management Holdings LLC; Member of the Board of Managers (since 2017) and Senior Managing Director (since 2018), NYLIFE Distributors LLC; Chairman of the Board and Senior Managing Director, NYLIM Service Company LLC (since 2017); Trustee, President and Principal Executive Officer of IndexIQ Trust, IndexIQ ETF Trust and IndexIQ Active ETF Trust (since January 2018); President, MainStay CBRE Global Infrastructure Megatrends Fund (since 2021), MainStay MacKay DefinedTerm Municipal Opportunities Fund and MainStay VP Funds Trust (since 2017); Senior Managing Director, Global Product Development (From 2015-2016); Managing Director, Product Development (2010 to 2015), New York Life Investment Management LLC | |
| | Jack R. Benintende
1964 | Treasurer and Principal Financial and Accounting Officer, MainStay Funds (since 2007), MainStay Funds Trust (since 2009) | Managing Director, New York Life Investment Management LLC (since 2007); Treasurer and Principal Financial and Accounting Officer, MainStay CBRE Global Infrastructure Megatrends Fund (since 2021), MainStay MacKay DefinedTerm Municipal Opportunities Fund (since 2011) and MainStay VP Funds Trust (since 2007)** and Assistant Treasurer, New York Life Investment Management Holdings LLC (2008 to 2012) | |
| | J. Kevin Gao
1967 | Secretary and Chief Legal Officer, MainStay Funds and MainStay Funds Trust (since 2010) | Managing Director and Associate General Counsel, New York Life Investment Management LLC (since 2010); Secretary and Chief Legal Officer and MainStay CBRE Global Infrastructure Megatrends Fund (since 2021), MainStay MacKay DefinedTerm Municipal Opportunities Fund (since 2011) and MainStay VP Funds Trust (since 2010)** | |
| | Scott T. Harrington
1959 | Vice President— Administration, MainStay Funds (since 2009), MainStay Funds Trust (since 2009) | Managing Director, New York Life Investment Management LLC (including predecessor advisory organizations) (since 2000); Member of the Board of Directors, New York Life Trust Company (since 2009); Vice President—Administration, MainStay CBRE Global Infrastructure Megatrends Fund (since 2021), MainStay MacKay DefinedTerm Municipal Opportunities Fund (since 2011) and MainStay VP Funds Trust (since 2005)** | |
| | Kevin M. Gleason
1967 | Vice President and Chief Compliance Officer, MainStay Funds and MainStay Funds Trust (since June 2022) | Vice President and Chief Compliance Officer, IndexIQ, IndexIQ ETF Trust and Index IQ Active ETF Trust (since June 2022); Vice President and Chief Compliance Officer, MainStay CBRE Global Infrastructure Megatrends Fund, MainStay VP Funds Trust and MainStay MacKay DefinedTerm Municipal Opportunities Fund (since June 2022); Senior Vice President, Voya Investment Management and Chief Compliance Officer, Voya Family of Funds (2012-2022) | |
| * | The officers listed above are considered to be “interested persons” of the MainStay Group of Funds, MainStay VP Funds Trust, MainStay CBRE Global Infrastructure Megatrends Fund and MainStay MacKay DefinedTerm Municipal Opportunities Fund within the meaning of the 1940 Act because of their affiliation with the MainStay Group of Funds, New York Life Insurance Company and/or its affiliates, including New York Life Investment Management LLC, NYLIM Service Company LLC, NYLIFE Securities LLC and/or NYLIFE Distributors LLC, as described in detail in the column captioned “Principal Occupation(s) During Past Five Years.” Officers are elected annually by the Board. |
| ** | Includes prior service as an Officer of MainStay VP Series Fund, Inc., the predecessor to MainStay VP Funds Trust. |
Officers of the Trust (Who are not Trustees)*
| 36 | MainStay MacKay International Equity Fund |
This page intentionally left blank.
This page intentionally left blank.
Equity
U.S. Equity
MainStay Epoch U.S. Equity Yield Fund
MainStay S&P 500 Index Fund1
MainStay Winslow Large Cap Growth Fund
MainStay WMC Enduring Capital Fund
MainStay WMC Growth Fund
MainStay WMC Small Companies Fund
MainStay WMC Value Fund
International Equity
MainStay Epoch International Choice Fund
MainStay MacKay International Equity Fund
MainStay WMC International Research Equity Fund
Emerging Markets Equity
MainStay Candriam Emerging Markets Equity Fund
Global Equity
MainStay Epoch Capital Growth Fund
MainStay Epoch Global Equity Yield Fund
Fixed Income
Taxable Income
MainStay Candriam Emerging Markets Debt Fund
MainStay Floating Rate Fund
MainStay MacKay High Yield Corporate Bond Fund
MainStay MacKay Short Duration High Yield Fund
MainStay MacKay Strategic Bond Fund
MainStay MacKay Total Return Bond Fund
MainStay MacKay U.S. Infrastructure Bond Fund
MainStay Short Term Bond Fund
Tax-Exempt Income
MainStay MacKay California Tax Free Opportunities Fund2
MainStay MacKay High Yield Municipal Bond Fund
MainStay MacKay New York Tax Free Opportunities Fund3
MainStay MacKay Short Term Municipal Fund
MainStay MacKay Strategic Municipal Allocation Fund
MainStay MacKay Tax Free Bond Fund
Money Market
MainStay Money Market Fund
Mixed Asset
MainStay Balanced Fund
MainStay Income Builder Fund
MainStay MacKay Convertible Fund
Speciality
MainStay CBRE Global Infrastructure Fund
MainStay CBRE Real Estate Fund
MainStay Cushing MLP Premier Fund
Asset Allocation
MainStay Conservative Allocation Fund
MainStay Conservative ETF Allocation Fund
MainStay Defensive ETF Allocation Fund
MainStay Equity Allocation Fund
MainStay Equity ETF Allocation Fund
MainStay ESG Multi-Asset Allocation Fund
MainStay Growth Allocation Fund
MainStay Growth ETF Allocation Fund
MainStay Moderate Allocation Fund
MainStay Moderate ETF Allocation Fund
Manager
New York Life Investment Management LLC
New York, New York
Subadvisors
Candriam4
Strassen, Luxembourg
CBRE Investment Management Listed Real Assets LLC
Radnor, Pennsylvania
Cushing Asset Management, LP
Dallas, Texas
Epoch Investment Partners, Inc.
New York, New York
MacKay Shields LLC4
New York, New York
NYL Investors LLC4
New York, New York
Wellington Management Company LLP
Boston, Massachusetts
Winslow Capital Management, LLC
Minneapolis, Minnesota
Legal Counsel
Dechert LLP
Washington, District of Columbia
Independent Registered Public Accounting Firm
KPMG LLP
Philadelphia, Pennsylvania
Distributor
NYLIFE Distributors LLC4
Jersey City, New Jersey
Custodian
JPMorgan Chase Bank, N.A.
New York, New York
1.
Prior to February 28, 2022, the Fund's name was MainStay MacKay S&P 500 Index Fund.
| 2. | This Fund is registered for sale in AZ, CA, NV, OR, TX, UT, WA and MI (Class A and Class I shares only), and CO, FL, GA, HI, ID, MA, MD, NH, NJ and NY (Class I shares only). |
| 3. | This Fund is registered for sale in CA, CT, DE, FL, MA, NJ, NY and VT. |
| 4. | An affiliate of New York Life Investment Management LLC. |
Not part of the Annual Report
For more information
800-624-6782
newyorklifeinvestments.com
“New York Life Investments” is both a service mark, and the common trade name, of certain investment advisors affiliated with New York Life Insurance Company. The MainStay Funds® are managed by New York Life Investment Management LLC and distributed by NYLIFE Distributors LLC, 30 Hudson Street, Jersey City, NJ 07302, a wholly owned subsidiary of New York Life Insurance Company. NYLIFE Distributors LLC is a Member FINRA/SIPC.
©2022 NYLIFE Distributors LLC. All rights reserved.
| 5013945.2MS229-22 | MSIE11-12/22 |
(NYLIM) NL213
MainStay MacKay Strategic Bond Fund
Message from the President and Annual Report
October 31, 2022
Sign up for e-delivery of your shareholder reports. For full details on e-delivery, including who can participate and what you can receive via e-delivery,
please log in to newyorklifeinvestments.com/accounts.
| Not FDIC/NCUA Insured | Not a Deposit | May Lose Value | No Bank Guarantee | Not Insured by Any Government Agency |
This page intentionally left blank
Message from the President
A series of economic and geopolitical challenges undermined equity and fixed-income markets during the 12-month reporting period ended October 31, 2022. Stocks and bonds alike trended lower in the face of sharply rising interest rates, increasing inflationary pressures, slowing economic growth and Russia’s invasion of Ukraine.
The reporting period began on a mixed note, with concerns about the spreading Omicron variant of the COVID-19 virus and increasingly hawkish statements from the U.S. Federal Reserve (the “Fed”) regarding mounting inflation, countered by bullish sentiment stemming from U.S. economic growth and strong corporate earnings. In January 2022, markets turned decisively negative as comments from the Fed raised the likelihood of rate hikes as early as March, and Russia issued increasingly aggressive threats toward Ukraine. The onset of Russia’s invasion in February exacerbated global inflationary pressures while increasing investor uncertainty. Domestic supply shortages, international trade imbalances and rising inflation caused GDP (gross domestic product) to contract in the first and second quarters of the year, although employment and consumer spending proved resilient. Prices for petroleum surged to multi-year highs, while many key agricultural chemicals and industrial metals climbed as well. Accelerating inflationary forces prompted the Fed to implement its most aggressive interest rate increases since the 1980s with a series of five sharp rate hikes, raising the federal funds rate from a range of 0.00% to 0.25% in March to 3.00% to 3.25% in September, with additional rate hikes expected before the end of the year. International central banks generally followed suit, raising rates by varying degrees in efforts to curb local inflation, although most increases remained significantly more modest than those in the United States. Relatively high U.S. interest rates and risk-averse international sentiment pushed U.S. dollar values higher compared to most other currencies, with the ensuing negative impact on global prices for food, fuel and other key, U.S.-dollar-denominated products.
The effects of these interrelated challenges were felt throughout U.S. and international financial markets. The S&P 500® Index, a widely regarded benchmark of U.S. market performance, declined by more than 14% during the reporting period. Although the energy sector generated strong gains, bolstered by elevated oil and gas prices, most other industry areas recorded losses. The more cyclical and growth-oriented sectors of consumer discretionary, real estate and information technology delivered the
weakest returns, while the traditionally defensive and value-oriented consumer staples, utilities and health care sectors outperformed. International stocks lagged compared to their U.S. counterparts, with some emerging markets, such as China, suffering particularly steep losses. A few markets, however, including Brazil, Mexico and the United Arab Emirates, ended the reporting period with little change. Fixed-income markets saw bond prices broadly decline as yields rose along with interest rates. Short-term yields rose faster than long-term yields, producing a yield curve inversion from July through the end of the reporting period, with long-term rates remaining below short-term rates. While floating-rate instruments, which feature variable interest rates that allow investors to benefit from a rising rate environment, provided a degree of insulation from inflation-driven trends, they were not immune to the market’s widespread declines.
While the Fed acknowledges the costs of rising rates in terms of weaker GDP growth and unsettled financial markets over the short term, its primary focus continues to be the longer-term economic impact of inflation. With the latest figures as of the date of this report showing that inflation remains above 8%, versus a target rate of just 2%, the Fed clearly has a distance yet to go, making further rate increases and market volatility more likely in the coming months. The question remains as to whether the Fed and other central banks will manage a so-called “soft landing,” curbing inflation while avoiding a persistent economic slowdown. If they prove successful, we expect that favorable inflation trends and increasingly attractive valuations in both equity and bond markets should eventually translate into sustainable improvements in the investment environment.
Whatever actions the Fed takes and however financial markets react, as a MainStay investor, you can depend on us to continue providing the insight, expertise and service that have long defined New York Life Investments. Thank you for trusting us to help you meet your investment needs.
Sincerely,
Kirk C. Lehneis
President
The opinions expressed are as of the date of this report and are subject to change. There is no guarantee that any forecast made will come to pass. This material does not constitute investment advice and is not intended as an endorsement of any specific investment. Past performance is no guarantee of future results.
Not part of the Annual Report
Investors should refer to the Fund’s Summary Prospectus and/or Prospectus and consider the Fund’s investment objectives, strategies, risks, charges and expenses carefully before investing. The Summary Prospectus and/or Prospectus contain this and other information about the Fund. You may obtain copies of the Fund’s Summary Prospectus, Prospectus and Statement of Additional Information, which includes information about The MainStay Funds' Trustees, free of charge, upon request, by calling toll-free 800-624-6782, by writing to NYLIFE Distributors LLC, Attn: MainStay Marketing Department, 30 Hudson Street, Jersey City, NJ 07302 or by sending an e-mail to MainStayShareholderServices@nylim.com. These documents are also available via the MainStay Funds’ website at newyorklifeinvestments.com. Please read the Fund’s Summary Prospectus and/or Prospectus carefully before investing.
Investment and Performance Comparison (Unaudited)
Performance data quoted represents past performance. Past performance is no guarantee of future results. Because of market volatility and other factors, current performance may be lower or higher than the figures shown. Investment return and principal value will fluctuate, and as a result, when shares are redeemed, they may be worth more or less than their original cost. The graph below depicts the historical performance of Class I shares of the Fund. Performance will vary from class to class based on differences in class-specific expenses and sales charges. For performance information current to the most recent month-end, please call 800-624-6782 or visit newyorklifeinvestments.com.
The performance table and graph do not reflect the deduction of taxes that a shareholder would pay on distributions or Fund share redemptions. Total returns reflect maximum applicable sales charges as indicated in the table below, if any, changes in share price, and reinvestment of dividend and capital gain distributions. The graph assumes the initial investment amount shown below and reflects the deduction of all sales charges that would have applied for the period of investment. Performance figures may reflect certain fee waivers and/or expense limitations, without which total returns may have been lower. For more information on share classes and current fee waivers and/or expense limitations (if any), please refer to the Notes to Financial Statements.

| Average Annual Total Returns for the Year-Ended October 31, 2022 |
| Class | Sales Charge | | Inception
Date | One
Year | Five
Years | Ten Years
or Since
Inception | Gross
Expense
Ratio1 |
| Class A Shares | Maximum 4.5% Initial Sales Charge | With sales charges | 2/28/1997 | -14.53% | -0.57% | 1.21% | 1.08% |
| | | Excluding sales charges | | -10.51 | 0.35 | 1.68 | 1.08 |
| Investor Class Shares2 | Maximum 4% Initial Sales Charge | With sales charges | 2/28/2008 | -14.23 | -0.65 | 1.14 | 1.21 |
| | | Excluding sales charges | | -10.65 | 0.27 | 1.61 | 1.21 |
| Class B Shares3 | Maximum 5% CDSC | With sales charges | 2/28/1997 | -15.63 | -0.85 | 0.86 | 1.96 |
| | if Redeemed Within the First Six Years of Purchase | Excluding sales charges | | -11.27 | -0.49 | 0.86 | 1.96 |
| Class C Shares | Maximum 1% CDSC | With sales charges | 9/1/1998 | -12.25 | -0.49 | 0.86 | 1.96 |
| | if Redeemed Within One Year of Purchase | Excluding sales charges | | -11.38 | -0.49 | 0.86 | 1.96 |
| Class I Shares | No Sales Charge | | 1/2/2004 | -10.19 | 0.62 | 1.95 | 0.83 |
| Class R2 Shares | No Sales Charge | | 2/28/2014 | -10.69 | 0.25 | 0.99 | 1.18 |
| Class R3 Shares | No Sales Charge | | 2/29/2016 | -10.83 | -0.01 | 2.04 | 1.43 |
| Class R6 Shares | No Sales Charge | | 2/28/2018 | -10.23 | N/A | 0.82 | 0.70 |
| 1. | The gross expense ratios presented reflect the Fund’s “Total Annual Fund Operating Expenses” from the most recent Prospectus, as supplemented, and may differ from other expense ratios disclosed in this report. |
| 2. | Prior to June 30, 2020, the maximum initial sales charge was 4.5%, which is reflected in the applicable average annual total return figures shown. |
| 3. | Class B shares are closed to all new purchases as well as additional investments by existing Class B shareholders. |
The footnotes on the next page are an integral part of the table and graph and should be carefully read in conjunction with them.
| Benchmark Performance* | One
Year | Five
Years | Ten
Years |
| Bloomberg U.S. Aggregate Bond Index1 | -15.68% | -0.54% | 0.74% |
| ICE BofA U.S. Dollar 3-Month Deposit Offered Rate Constant Maturity Index2 | 0.64 | 1.34 | 0.91 |
| Morningstar Nontraditional Bond Category Average3 | -7.96 | 0.42 | 1.13 |
| * | Returns for indices reflect no deductions for fees, expenses or taxes, except for foreign withholding taxes where applicable. Results assume reinvestment of all dividends and capital gains. An investment cannot be made directly in an index. |
| 1. | The Bloomberg U.S. Aggregate Bond Index is the Fund's primary benchmark. The Bloomberg U.S. Aggregate Bond Index is a broad-based benchmark that measures performance of the investment-grade, U.S. dollar denominated, fixed-rate taxable bond market, including Treasurys, government-related and corporate securities, mortgage-backed securities (agency fixed-rate and hybrid adjustable-rate mortgage pass-throughs), asset-backed securities and commercial mortgage-backed securities. |
| 2. | The Fund has selected the ICE BofA U.S. Dollar 3-Month Deposit Offered Rate Constant Maturity Index as a secondary benchmark. The ICE BofA U.S. Dollar 3-Month Deposit Offered Rate Constant Maturity Index is unmanaged and tracks the performance of a synthetic asset paying a deposit offered rate to a stated maturity. The index is based on the assumed purchase at par of a synthetic instrument having exactly its stated maturity and with a coupon equal to that day’s fixing rate. That issue is assumed to be sold the following business day (priced at a yield equal to the current day fixing rate) and rolled into a new instrument. |
| 3. | The Fund has selected the Morningstar Nontraditional Bond Category Average as an additional benchmark. The Morningstar Nontraditional Bond Category Average contains funds that pursue strategies divergent in one or more ways from conventional practice in the broader bond-fund universe. Morningstar category averages are equal-weighted returns based on constituents of the category at the end of the period. |
The footnotes on the preceding page are an integral part of the table and graph and should be carefully read in conjunction with them.
| 6 | MainStay MacKay Strategic Bond Fund |
Cost in Dollars of a $1,000 Investment in MainStay MacKay Strategic Bond Fund (Unaudited)
The example below is intended to describe the fees and expenses borne by shareholders during the six-month period from May 1, 2022 to October 31, 2022, and the impact of those costs on your investment.
Example
As a shareholder of the Fund you incur two types of costs: (1) transaction costs, including exchange fees and sales charges (loads) on purchases (as applicable), and (2) ongoing costs, including management fees, distribution and/or service (12b-1) fees and other Fund expenses (as applicable). This example is intended to help you understand your ongoing costs (in dollars) of investing in the Fund and to compare these costs with the ongoing costs of investing in other mutual funds. The example is based on an investment of $1,000 made at the beginning of the six-month period and held for the entire period from May 1, 2022 to October 31, 2022.
This example illustrates your Fund’s ongoing costs in two ways:
Actual Expenses
The second and third data columns in the table below provide information about actual account values and actual expenses. You may use the information in these columns, together with the amount you invested, to estimate the expenses that you paid during the six months ended October 31, 2022. Simply divide your account value by $1,000 (for example, an
$8,600 account value divided by $1,000 = 8.6), then multiply the result by the number under the heading entitled “Expenses Paid During Period” to estimate the expenses you paid on your account during this period.
Hypothetical Example for Comparison Purposes
The fourth and fifth data columns in the table below provide information about hypothetical account values and hypothetical expenses based on the Fund’s actual expense ratio and an assumed rate of return of 5% per year before expenses, which is not the Fund’s actual return. The hypothetical account values and expenses may not be used to estimate the actual ending account balances or expenses you paid for the six-month period shown. You may use this information to compare the ongoing costs of investing in the Fund with the ongoing costs of investing in other mutual funds. To do so, compare this 5% hypothetical example with the 5% hypothetical examples that appear in the shareholder reports of the other mutual funds.
Please note that the expenses shown in the table are meant to highlight your ongoing costs only and do not reflect any transactional costs, such as exchange fees or sales charges (loads). Therefore, the fourth and fifth data columns of the table are useful in comparing ongoing costs only and will not help you determine the relative total costs of owning different funds. In addition, if these transactional costs were included, your costs would have been higher.
| Share Class | Beginning
Account
Value
5/1/22 | Ending Account
Value (Based
on Actual
Returns and
Expenses)
10/31/22 | Expenses
Paid
During
Period1 | Ending Account
Value (Based
on Hypothetical
5% Annualized
Return and
Actual Expenses)
10/31/22 | Expenses
Paid
During
Period1 | Net Expense
Ratio
During
Period2 |
| Class A Shares | $1,000.00 | $947.90 | $5.16 | $1,019.91 | $5.35 | 1.05% |
| Investor Class Shares | $1,000.00 | $946.50 | $5.84 | $1,019.21 | $6.06 | 1.19% |
| Class B Shares | $1,000.00 | $943.20 | $9.50 | $1,015.43 | $9.86 | 1.94% |
| Class C Shares | $1,000.00 | $943.10 | $9.50 | $1,015.43 | $9.86 | 1.94% |
| Class I Shares | $1,000.00 | $949.60 | $3.44 | $1,021.68 | $3.57 | 0.70% |
| Class R2 Shares | $1,000.00 | $947.40 | $5.64 | $1,019.41 | $5.85 | 1.15% |
| Class R3 Shares | $1,000.00 | $946.10 | $6.87 | $1,018.15 | $7.12 | 1.40% |
| Class R6 Shares | $1,000.00 | $948.80 | $3.24 | $1,021.88 | $3.36 | 0.66% |
| 1. | Expenses are equal to the Fund’s annualized expense ratio of each class multiplied by the average account value over the period, divided by 365 and multiplied by 184 (to reflect the six-month period). The table above represents the actual expenses incurred during the six-month period. In addition to the fees and expenses which the Fund bears directly, it also indirectly bears a pro rata share of the fees and expenses of the underlying funds in which it invests. Such indirect expenses are not included in the above-reported expense figures. |
| 2. | Expenses are equal to the Fund's annualized expense ratio to reflect the six-month period. |
Portfolio Composition as of October 31, 2022 (Unaudited)
‡ Less than one-tenth of a percent.
See Portfolio of Investments beginning on page 11 for specific holdings within these categories. The Fund's holdings are subject to change.
Top Ten Holdings and/or Issuers Held as of October 31, 2022 (excluding short-term investments) (Unaudited)
| 1. | FHLMC STACR REMIC Trust, 4.497%-6.747%, due 8/25/33–12/25/50 |
| 2. | U.S. Treasury Notes, 2.75%-4.00%, due 10/31/29–8/15/32 |
| 3. | FNMA, (zero coupon)-8.086%, due 11/25/29–3/25/60 |
| 4. | BX Trust, 3.605%-5.657%, due 1/15/34–12/9/41 |
| 5. | GNMA, (zero coupon)-3.50%, due 8/20/49–7/20/52 |
| 6. | UMBS, 30 Year, 3.50%-4.00%, due 6/1/52–7/1/52 |
| 7. | BX Commercial Mortgage Trust, 3.542%-5.61%, due 9/15/36–3/11/44 |
| 8. | FREMF Mortgage Trust, 3.854%-4.383%, due 10/25/28–2/25/52 |
| 9. | Bank of America Corp., 2.087%-8.57%, due 11/15/24–6/14/29 |
| 10. | CF Hippolyta Issuer LLC, 1.69%-2.60%, due 7/15/60–3/15/61 |
| 8 | MainStay MacKay Strategic Bond Fund |
Portfolio Management Discussion and Analysis (Unaudited)
Questions answered by portfolio managers Stephen R. Cianci, CFA, Matt Jacob, Neil Moriarty III, Shu-Yang Tan, CFA, and Lesya Paisley, CFA, of MacKay Shields LLC, the Fund’s Subadvisor.
How did MainStay MacKay Strategic Bond Fund perform relative to its benchmarks and peer group during the 12 months ended October 31, 2022?
For the 12 months ended October 31, 2022, Class I shares of MainStay MacKay Strategic Bond Fund returned −10.19%, outperforming the −15.68% return of the Fund’s primary benchmark, the Bloomberg U.S. Aggregate Bond Index (the "Index"), and underperforming the 0.64% return of the Fund’s secondary benchmark, the ICE BofA U.S. Dollar 3-Month Deposit Offered Rate Constant Maturity Index. Over the same period, Class I shares underperformed the −7.96% return of the Morningstar Nontraditional Bond Category Average.1
Were there any changes to the Fund during the reporting period?
Effective February 28, 2022, Lesya Paisley was added as a portfolio manager of the Fund.
What factors affected the Fund’s relative performance during the reporting period?
Relative to the Bloomberg U.S. Aggregate Bond Index, the Fund’s performance benefited from shorter duration2 posture, as well as slightly underweight exposure to investment-grade corporate bonds. Conversely, the Fund’s overweight allocation to high-yield corporates, preferred debt and emerging-market debt detracted from relative returns.
During the reporting period, were there any market events that materially impacted the Fund’s performance or liquidity?
Along with the ongoing war in Ukraine, the defining occurrence of the reporting period was the rapid repricing of expectations for global monetary policy, especially in the United States. An exceptionally strong labor market, together with concerns regarding long-term inflation and few signs of a letup in underlying inflation pressures led U.S. Federal Reserve officials to significantly adjust their outlook on monetary policy, and markets followed suit. With most major central banks continuing to battle high inflation through stepped-up policy rate increases, risk-free as well as risk assets performed poorly. Widespread, substantial global monetary tightening occurred during the reporting period,
with numerous central banks quickly tightening policies within a relatively short period of time.
During the reporting period, how was the Fund’s performance materially affected by investments in derivatives?
During the reporting period, the Fund used U.S. Treasury futures to hedge its duration. This position had a positive impact on returns as rates rose.
What was the Fund’s duration strategy during the reporting period?
The Fund does not track a fixed-income index and can demonstrate a low correlation to the Bloomberg U.S. Aggregate Bond Index. The average duration of the Fund will normally vary from 0 to 7 years. Duration positioning is based on what is most appropriate at a given point in the cycle. During the reporting period, the Team extended the Fund’s duration posture as interest rates rose throughout the year. As of October 31, 2022, the overall duration of the Fund remained in the middle of its allowable range, with an effective duration of 3.5 years relative to 6.1 years for the Index.
During the reporting period, which sectors were the strongest positive contributors to the Fund’s relative performance and which sectors were particularly weak?
During the reporting period, as stated above, the Fund’s shorter duration relative to the Index and underweight exposure to investment-grade corporates made positive contributions to performance. (Contributions take weightings and total returns into account.) Conversely, overweight exposure to high-yield corporate bonds detracted from relative returns. Within the Fund’s corporate exposure, the banking, retail and midstream industries were among the most significant laggards.
What were some of the Fund’s largest purchases and sales during the reporting period?
During the reporting period, the Fund purchased credit risk transfer deals issued by Freddie Mac (the Federal Home Loan Mortgage Corporation) and Fannie Mae (the Federal National Mortgage Association) with the STACR and CAS labels/Hertz/Starwood. These purchases reflect the positive
| 1. | See page 5 for other share class returns, which may be higher or lower than Class I share returns. See page 6 for more information on benchmark and peer group returns. |
| 2. | Duration is a measure of the price sensitivity of a fixed-income investment to changes in interest rates. Duration is expressed as a number of years and is considered a more accurate sensitivity gauge than average maturity. |
outlook the Fund’s management team has on the housing market and the resiliency of the consumer.
The Fund sold partial positions in Brazil government bonds and Dell International, as well as Performance Food Group (“PFGC”). Brazil spreads3 held up well during the risk-off tone of the market, so we took the opportunity to lighten the Fund’s holdings. Liquidation of PFGC was part of a risk reduction trade and a move from credits rated B to BB.4
How did the Fund’s sector weightings change during the reporting period?
During the reporting period, the Fund’s effective duration increased from 2.0 years to 3.5 years. In addition, the Fund increased its exposure to agency mortgages and consumer asset-backed securities. During the same period, the Fund trimmed its exposure to bank loans and emerging-market bonds.
How was the Fund positioned at the end of the reporting period?
As of October 31, 2022, relative to the Bloomberg U.S. Aggregate Bond Index, the Fund held overweight exposure to high-yield corporate bonds and securitized assets. As of the same date, the Fund held underweight exposure to U.S. Treasury securities and agency mortgages.
| 3. | The terms “spread” and “yield spread” may refer to the difference in yield between a security or type of security and comparable U.S. Treasury issues. The terms may also refer to the difference in yield between two specific securities or types of securities at a given time. |
| 4. | An obligation rated ‘B’ by Standard & Poor’s (“S&P”) is deemed by S&P to be more vulnerable to nonpayment than obligations rated ‘BB,’ but in the opinion of S&P, the obligor currently has the capacity to meet its financial commitment on the obligation. It is the opinion of S&P that adverse business, financial, or economic conditions will likely impair the obligor's capacity or willingness to meet its financial commitment on the obligation. An obligation rated ‘BB’ by S&P is deemed by S&P to be less vulnerable to nonpayment than other speculative issues. In the opinion of S&P, however, the obligor faces major ongoing uncertainties or exposure to adverse business, financial or economic conditions which could lead to the obligor’s inadequate capacity to meet its financial commitment on the obligation. When applied to Fund holdings, ratings are based solely on the creditworthiness of the bonds in the portfolio and are not meant to represent the security or safety of the Fund. |
The opinions expressed are those of the portfolio managers as of the date of this report and are subject to change. There is no guarantee that any forecasts will come to pass. This material does not constitute investment advice and is not intended as an endorsement of any specific investment.
| 10 | MainStay MacKay Strategic Bond Fund |
Portfolio of Investments October 31, 2022†
| | Principal
Amount | Value |
| Long-Term Bonds 97.2% |
| Asset-Backed Securities 14.9% |
| Automobile Asset-Backed Securities 7.3% |
| American Credit Acceptance Receivables Trust (a) | |
| Series 2021-2, Class D | | |
| 1.34%, due 7/13/27 | $ 1,000,000 | $ 937,438 |
| Series 2021-4, Class D | | |
| 1.82%, due 2/14/28 | 1,520,000 | 1,376,962 |
| Series 2022-1, Class D | | |
| 2.46%, due 3/13/28 | 2,210,000 | 1,959,747 |
| Series 2020-2, Class C | | |
| 3.88%, due 4/13/26 | 1,750,007 | 1,739,376 |
| Avis Budget Rental Car Funding AESOP LLC (a) | |
| Series 2021-1A, Class A | | |
| 1.38%, due 8/20/27 | 2,000,000 | 1,703,890 |
| Series 2020-2A, Class A | | |
| 2.02%, due 2/20/27 | 1,275,000 | 1,127,453 |
| Series 2020-1A, Class A | | |
| 2.33%, due 8/20/26 | 560,000 | 507,380 |
| CPS Auto Receivables Trust (a) | |
| Series 2021-A, Class E | | |
| 2.53%, due 3/15/28 | 3,000,000 | 2,727,146 |
| Series 2021-C, Class E | | |
| 3.21%, due 9/15/28 | 1,720,000 | 1,479,794 |
| Series 2020-C, Class E | | |
| 4.22%, due 5/17/27 | 2,215,000 | 2,097,697 |
| Series 2019-C, Class E | | |
| 4.30%, due 7/15/25 | 1,030,000 | 1,015,707 |
| Drive Auto Receivables Trust | |
| Series 2021-2, Class D | | |
| 1.39%, due 3/15/29 | 1,000,000 | 904,298 |
| Series 2021-1, Class D | | |
| 1.45%, due 1/16/29 | 2,215,000 | 2,038,999 |
| Enterprise Fleet Financing LLC | |
| Series 2022-2, Class A3 | | |
| 4.79%, due 5/21/29 (a) | 690,000 | 669,773 |
| Exeter Automobile Receivables Trust | |
| Series 2021-3A, Class E | | |
| 3.04%, due 12/15/28 (a) | 1,500,000 | 1,293,768 |
| Flagship Credit Auto Trust (a) | |
| Series 2021-2, Class D | | |
| 1.59%, due 6/15/27 | 290,000 | 254,820 |
| Series 2021-3, Class D | | |
| 1.65%, due 9/15/27 | 900,000 | 782,863 |
| Series 2021-4, Class C | | |
| 1.96%, due 12/15/27 | 960,000 | 878,922 |
| Series 2021-4, Class D | | |
| 2.26%, due 12/15/27 | 1,900,000 | 1,635,676 |
| | Principal
Amount | Value |
| |
| Automobile Asset-Backed Securities (continued) |
| Flagship Credit Auto Trust (a) (continued) | |
| Series 2020-1, Class E | | |
| 3.52%, due 6/15/27 | $ 2,590,000 | $ 2,298,091 |
| Series 2019-2, Class E | | |
| 4.52%, due 12/15/26 | 1,315,000 | 1,215,685 |
| Series 2020-3, Class E | | |
| 4.98%, due 12/15/27 | 1,090,000 | 954,991 |
| GLS Auto Receivables Issuer Trust (a) | |
| Series 2021-2A, Class D | | |
| 1.42%, due 4/15/27 | 935,000 | 839,568 |
| Series 2021-3A, Class D | | |
| 1.48%, due 7/15/27 | 2,635,000 | 2,329,053 |
| Series 2021-4A, Class D | | |
| 2.48%, due 10/15/27 | 1,650,000 | 1,465,398 |
| Series 2020-1A, Class C | | |
| 2.72%, due 11/17/25 | 2,200,000 | 2,163,290 |
| Series 2020-1A, Class D | | |
| 3.68%, due 11/16/26 | 1,070,000 | 1,025,847 |
| Hertz Vehicle Financing III LP (a) | |
| Series 2021-2A, Class C | | |
| 2.52%, due 12/27/27 | 3,285,000 | 2,708,620 |
| Series 2021-2A, Class D | | |
| 4.34%, due 12/27/27 | 3,450,000 | 2,761,204 |
| Hertz Vehicle Financing LLC | |
| Series 2021-1A, Class C | | |
| 2.05%, due 12/26/25 (a) | 870,000 | 779,096 |
| Santander Drive Auto Receivables Trust | |
| Series 2021-4, Class D | | |
| 1.67%, due 10/15/27 | 2,385,000 | 2,198,744 |
| Series 2022-2, Class B | | |
| 3.44%, due 9/15/27 | 1,825,000 | 1,737,318 |
| | | 47,608,614 |
| Home Equity Asset-Backed Securities 0.3% |
| Carrington Mortgage Loan Trust | |
| Series 2007-HE1, Class A3 | | |
| 3.776% (1 Month LIBOR + 0.19%), due 6/25/37 (b) | 1,162,745 | 1,126,640 |
| First NLC Trust | |
| Series 2007-1, Class A1 | | |
| 3.656% (1 Month LIBOR + 0.07%), due 8/25/37 (a)(b) | 241,782 | 129,284 |
| GSAA Home Equity Trust | |
| Series 2007-8, Class A3 | | |
| 4.486% (1 Month LIBOR + 0.90%), due 8/25/37 (b) | 39,208 | 37,689 |
The notes to the financial statements are an integral part of, and should be read in conjunction with, the financial statements.
11
Portfolio of Investments October 31, 2022† (continued)
| | Principal
Amount | Value |
| Asset-Backed Securities (continued) |
| Home Equity Asset-Backed Securities (continued) |
| J.P. Morgan Mortgage Acquisition Trust | |
| Series 2007-HE1, Class AF1 | | |
| 3.686% (1 Month LIBOR + 0.10%), due 3/25/47 (b) | $ 84,769 | $ 53,254 |
| MASTR Asset-Backed Securities Trust | |
| Series 2006-HE4, Class A1 | | |
| 3.686% (1 Month LIBOR + 0.10%), due 11/25/36 (b) | 68,658 | 23,802 |
| Morgan Stanley ABS Capital I, Inc. Trust (b) | |
| Series 2007-HE4, Class A2A | | |
| 3.696% (1 Month LIBOR + 0.11%), due 2/25/37 | 73,419 | 23,955 |
| Series 2007-HE7, Class M1 | | |
| 5.586% (1 Month LIBOR + 2.00%), due 7/25/37 | 635,000 | 466,203 |
| | | 1,860,827 |
| Other Asset-Backed Securities 7.3% |
| American Airlines Pass-Through Trust | |
| Series 2019-1, Class B | | |
| 3.85%, due 2/15/28 | 819,719 | 665,079 |
| Series 2021-1, Class B | | |
| 3.95%, due 7/11/30 | 1,220,000 | 953,883 |
| Series 2016-1, Class A | | |
| 4.10%, due 1/15/28 | 910,810 | 713,807 |
| Series 2013-2, Class A | | |
| 4.95%, due 1/15/23 | 1,200,885 | 1,188,631 |
| AMSR Trust (a) | |
| Series 2020-SFR4, Class A | | |
| 1.355%, due 11/17/37 | 4,150,000 | 3,629,243 |
| Series 2020-SFR5, Class A | | |
| 1.379%, due 11/17/37 | 1,518,000 | 1,328,514 |
| CF Hippolyta Issuer LLC (a) | |
| Series 2020-1, Class A1 | | |
| 1.69%, due 7/15/60 | 950,936 | 835,986 |
| Series 2021-1A, Class B1 | | |
| 1.98%, due 3/15/61 | 4,043,054 | 3,395,576 |
| Series 2020-1, Class A2 | | |
| 1.99%, due 7/15/60 | 1,474,170 | 1,203,172 |
| Series 2020-1, Class B1 | | |
| 2.28%, due 7/15/60 | 2,157,893 | 1,851,540 |
| Series 2020-1, Class B2 | | |
| 2.60%, due 7/15/60 | 2,441,345 | 1,902,947 |
| Crown Castle Towers LLC | |
| 4.241%, due 7/15/28 (a) | 2,325,000 | 2,113,337 |
| CVS Pass-Through Trust | |
| 5.789%, due 1/10/26 (a) | 24,523 | 24,363 |
| | Principal
Amount | Value |
| |
| Other Asset-Backed Securities (continued) |
| DB Master Finance LLC (a) | |
| Series 2021-1A, Class A23 | | |
| 2.791%, due 11/20/51 | $ 1,766,650 | $ 1,311,556 |
| Series 2019-1A, Class A23 | | |
| 4.352%, due 5/20/49 | 1,406,500 | 1,238,133 |
| FirstKey Homes Trust (a) | |
| Series 2020-SFR2, Class A | | |
| 1.266%, due 10/19/37 | 2,351,188 | 2,057,577 |
| Series 2020-SFR1, Class A | | |
| 1.339%, due 8/17/37 | 3,635,936 | 3,206,256 |
| Series 2021-SFR2, Class B | | |
| 1.607%, due 9/17/38 | 805,000 | 675,332 |
| Series 2021-SFR1, Class B | | |
| 1.788%, due 8/17/38 | 2,345,000 | 1,959,242 |
| Hilton Grand Vacations Trust | |
| Series 2019-AA, Class B | | |
| 2.54%, due 7/25/33 (a) | 1,245,509 | 1,158,475 |
| Home Partners of America Trust | |
| Series 2021-2, Class B | | |
| 2.302%, due 12/17/26 (a) | 1,718,532 | 1,471,595 |
| MVW LLC | |
| Series 2021-1WA, Class B | | |
| 1.44%, due 1/22/41 (a) | 1,497,979 | 1,357,180 |
| Navient Private Education Refi Loan Trust (a) | |
| Series 2021-BA, Class A | | |
| 0.94%, due 7/15/69 | 708,528 | 594,197 |
| Series 2021-EA, Class B | | |
| 2.03%, due 12/16/69 | 2,450,000 | 1,518,851 |
| Series 2020-GA, Class B | | |
| 2.50%, due 9/16/69 | 1,145,000 | 837,239 |
| Series 2020-HA, Class B | | |
| 2.78%, due 1/15/69 | 1,820,000 | 1,415,673 |
| New Economy Assets Phase 1 Sponsor LLC (a) | |
| Series 2021-1, Class A1 | | |
| 1.91%, due 10/20/61 | 1,260,000 | 1,055,707 |
| Series 2021-1, Class B1 | | |
| 2.41%, due 10/20/61 | 1,215,000 | 984,033 |
| PFS Financing Corp. | |
| Series 2022-D, Class B | | |
| 4.90%, due 8/15/27 (a) | 2,175,000 | 2,056,701 |
| Progress Residential Trust (a) | |
| Series 2020-SFR3, Class B | | |
| 1.495%, due 10/17/27 | 1,400,000 | 1,216,494 |
| Series 2021-SFR4, Class B | | |
| 1.808%, due 5/17/38 | 1,340,000 | 1,140,926 |
| Taco Bell Funding LLC | |
| Series 2021-1A, Class A23 | | |
| 2.542%, due 8/25/51 (a) | 1,369,650 | 999,760 |
The notes to the financial statements are an integral part of, and should be read in conjunction with, the financial statements.
| 12 | MainStay MacKay Strategic Bond Fund |
| | Principal
Amount | Value |
| Asset-Backed Securities (continued) |
| Other Asset-Backed Securities (continued) |
| United Airlines Pass-Through Trust | |
| Series 2020-1, Class A | | |
| 5.875%, due 10/15/27 | $ 1,205,334 | $ 1,163,000 |
| | | 47,224,005 |
Total Asset-Backed Securities
(Cost $108,487,386) | | 96,693,446 |
| Corporate Bonds 41.2% |
| Aerospace & Defense 0.2% |
| Howmet Aerospace, Inc. | | |
| 3.00%, due 1/15/29 (c) | 1,500,000 | 1,248,570 |
| Agriculture 0.3% |
| BAT Capital Corp. | | |
| 3.734%, due 9/25/40 | 1,330,000 | 837,341 |
| BAT International Finance plc | | |
| 4.448%, due 3/16/28 | 1,460,000 | 1,293,105 |
| | | 2,130,446 |
| Airlines 1.1% |
| American Airlines, Inc. (a) | | |
| 5.50%, due 4/20/26 | 1,100,000 | 1,047,554 |
| 5.75%, due 4/20/29 | 2,450,000 | 2,229,500 |
| Delta Air Lines, Inc. (a) | | |
| 4.50%, due 10/20/25 | 845,000 | 823,399 |
| 4.75%, due 10/20/28 | 1,680,000 | 1,562,881 |
| Mileage Plus Holdings LLC | | |
| 6.50%, due 6/20/27 (a) | 1,444,000 | 1,427,545 |
| | | 7,090,879 |
| Auto Manufacturers 1.8% |
| Ford Motor Credit Co. LLC | | |
| 2.30%, due 2/10/25 | 2,280,000 | 2,062,260 |
| 3.35%, due 11/1/22 | 1,115,000 | 1,115,000 |
| 4.125%, due 8/17/27 | 2,315,000 | 2,055,836 |
| General Motors Co. | | |
| 5.60%, due 10/15/32 | 625,000 | 567,233 |
| General Motors Financial Co., Inc. | | |
| 2.35%, due 1/8/31 | 1,178,000 | 862,379 |
| 2.70%, due 6/10/31 | 1,525,000 | 1,134,746 |
| 4.30%, due 4/6/29 | 1,090,000 | 957,350 |
| Nissan Motor Acceptance Co. LLC | | |
| 1.85%, due 9/16/26 (a) | 3,610,000 | 2,832,218 |
| | | 11,587,022 |
| | Principal
Amount | Value |
| |
| Auto Parts & Equipment 0.3% |
| Dana, Inc. | | |
| 4.50%, due 2/15/32 | $ 2,845,000 | $ 2,175,247 |
| Banks 13.9% |
| Banco Santander SA | | |
| 4.175% (1 Year Treasury Constant Maturity Rate + 2.00%), due 3/24/28 (b) | 2,400,000 | 2,115,571 |
| Bank of America Corp. | | |
| 2.087%, due 6/14/29 (d) | 1,275,000 | 1,031,739 |
| 3.384%, due 4/2/26 (d) | 1,700,000 | 1,597,046 |
| Series MM | | |
| 4.30%, due 1/28/25 (d)(e) | 2,021,000 | 1,672,883 |
| 4.948%, due 7/22/28 (d) | 1,640,000 | 1,564,277 |
| Series DD | | |
| 6.30%, due 3/10/26 (d)(e) | 3,570,000 | 3,480,964 |
| 8.57%, due 11/15/24 | 1,645,000 | 1,729,512 |
| Barclays plc (b)(e) | | |
| 4.375% (5 Year Treasury Constant Maturity Rate + 3.41%), due 3/15/28 | 2,710,000 | 1,798,652 |
| 8.00% (5 Year Treasury Constant Maturity Rate + 5.431%), due 3/15/29 | 1,315,000 | 1,178,048 |
| BNP Paribas SA (a) | | |
| 3.052%, due 1/13/31 (d) | 1,650,000 | 1,283,205 |
| 4.625% (5 Year Treasury Constant Maturity Rate + 3.196%), due 1/12/27 (b)(e) | 1,315,000 | 1,006,628 |
| 4.625% (5 Year Treasury Constant Maturity Rate + 3.34%), due 2/25/31 (b)(e) | 1,610,000 | 1,112,913 |
| 7.75% (5 Year Treasury Constant Maturity Rate + 4.899%), due 8/16/29 (b)(e) | 960,000 | 905,122 |
| BPCE SA | | |
| 2.045%, due 10/19/27 (a)(d) | 2,240,000 | 1,860,485 |
| Citigroup, Inc. | | |
| 2.52%, due 11/3/32 (d) | 2,115,000 | 1,582,324 |
| Series Y | | |
| 4.15% (5 Year Treasury Constant Maturity Rate + 3.00%), due 11/15/26 (b)(e) | 1,590,000 | 1,241,942 |
| Series M | | |
| 6.30%, due 5/15/24 (d)(e) | 3,260,000 | 3,039,950 |
The notes to the financial statements are an integral part of, and should be read in conjunction with, the financial statements.
13
Portfolio of Investments October 31, 2022† (continued)
| | Principal
Amount | Value |
| Corporate Bonds (continued) |
| Banks (continued) |
| Citizens Financial Group, Inc. | | |
| Series G | | |
| 4.00% (5 Year Treasury Constant Maturity Rate + 3.215%), due 10/6/26 (b)(e) | $ 1,095,000 | $ 866,163 |
| Credit Agricole SA | | |
| 4.75% (5 Year Treasury Constant Maturity Rate + 3.237%), due 3/23/29 (a)(b)(e) | 2,370,000 | 1,701,848 |
| Credit Suisse Group AG (a)(d) | | |
| 3.091%, due 5/14/32 | 1,485,000 | 1,018,545 |
| 6.442%, due 8/11/28 | 1,325,000 | 1,195,920 |
| Deutsche Bank AG | | |
| 3.035%, due 5/28/32 (d) | 460,000 | 323,552 |
| 4.875% (USISDA05 + 2.553%), due 12/1/32 (b) | 3,390,000 | 2,688,011 |
| 5.371%, due 9/9/27 | 1,520,000 | 1,441,517 |
| First Horizon Bank | | |
| 5.75%, due 5/1/30 | 1,673,000 | 1,595,950 |
| Freedom Mortgage Corp. | | |
| 7.625%, due 5/1/26 (a) | 895,000 | 707,086 |
| Goldman Sachs Group, Inc. (The) | | |
| 1.948%, due 10/21/27 (d) | 3,260,000 | 2,769,795 |
| Series V | | |
| 4.125% (5 Year Treasury Constant Maturity Rate + 2.949%), due 11/10/26 (b)(e) | 2,150,000 | 1,687,750 |
| HSBC Holdings plc | | |
| 7.336%, due 11/3/26 (d) | 2,325,000 | 2,331,436 |
| Intesa Sanpaolo SpA | | |
| 4.198% (1 Year Treasury Constant Maturity Rate + 2.60%), due 6/1/32 (a)(b) | 3,430,000 | 2,321,879 |
| JPMorgan Chase & Co. (d) | | |
| 1.764%, due 11/19/31 | 2,897,000 | 2,108,089 |
| Series HH | | |
| 4.60%, due 2/1/25 (e) | 1,327,000 | 1,184,215 |
| KeyBank NA | | |
| 4.15%, due 8/8/25 | 1,585,000 | 1,530,634 |
| Lloyds Banking Group plc | | |
| 4.582%, due 12/10/25 | 1,365,000 | 1,251,106 |
| 4.65%, due 3/24/26 | 1,985,000 | 1,824,309 |
| 4.976% (1 Year Treasury Constant Maturity Rate + 2.30%), due 8/11/33 (b) | 995,000 | 851,313 |
| Macquarie Group Ltd. | | |
| 2.871%, due 1/14/33 (a)(d) | 1,490,000 | 1,099,385 |
| | Principal
Amount | Value |
| |
| Banks (continued) |
| Mizuho Financial Group, Inc. | | |
| 5.414% (1 Year Treasury Constant Maturity Rate + 2.05%), due 9/13/28 (b)(c) | $ 1,800,000 | $ 1,735,521 |
| Morgan Stanley (d) | | |
| 2.484%, due 9/16/36 | 2,170,000 | 1,536,323 |
| 2.511%, due 10/20/32 | 3,225,000 | 2,428,067 |
| NatWest Group plc (b) | | |
| 3.073% (1 Year Treasury Constant Maturity Rate + 2.55%), due 5/22/28 | 2,145,000 | 1,821,205 |
| 4.60% (5 Year Treasury Constant Maturity Rate + 3.10%), due 6/28/31 (e) | 2,650,000 | 1,710,979 |
| Popular, Inc. | | |
| 6.125%, due 9/14/23 | 1,582,000 | 1,582,775 |
| Santander Holdings USA, Inc. | | |
| 3.40%, due 1/18/23 | 1,500,000 | 1,493,334 |
| Societe Generale SA (a)(b)(e) | | |
| 4.75% (5 Year Treasury Constant Maturity Rate + 3.931%), due 5/26/26 | 2,130,000 | 1,636,905 |
| 5.375% (5 Year Treasury Constant Maturity Rate + 4.514%), due 11/18/30 | 2,200,000 | 1,593,573 |
| Standard Chartered plc | | |
| 4.75% (5 Year Treasury Constant Maturity Rate + 3.805%), due 1/14/31 (a)(b)(e) | 2,770,000 | 1,848,260 |
| SVB Financial Group | | |
| Series C | | |
| 4.00% (5 Year Treasury Constant Maturity Rate + 3.202%), due 5/15/26 (b)(e) | 1,385,000 | 969,217 |
| Synchrony Bank | | |
| 5.40%, due 8/22/25 | 1,805,000 | 1,744,807 |
| Texas Capital Bancshares, Inc. | | |
| 4.00% (5 Year Treasury Constant Maturity Rate + 3.15%), due 5/6/31 (b) | 2,205,000 | 1,909,344 |
| UBS Group AG (a)(b) | | |
| 4.375% (5 Year Treasury Constant Maturity Rate + 3.313%), due 2/10/31 (e) | 2,555,000 | 1,774,831 |
| 4.751% (1 Year Treasury Constant Maturity Rate + 1.75%), due 5/12/28 | 1,070,000 | 980,536 |
The notes to the financial statements are an integral part of, and should be read in conjunction with, the financial statements.
| 14 | MainStay MacKay Strategic Bond Fund |
| | Principal
Amount | Value |
| Corporate Bonds (continued) |
| Banks (continued) |
| Wells Fargo & Co. (d) | | |
| 2.879%, due 10/30/30 | $ 270,000 | $ 221,525 |
| 3.584%, due 5/22/28 | 380,000 | 342,044 |
| 4.897%, due 7/25/33 | 2,330,000 | 2,131,822 |
| Series S | | |
| 5.90%, due 6/15/24 (e) | 3,295,000 | 2,988,153 |
| Westpac Banking Corp. | | |
| 3.02% (5 Year Treasury Constant Maturity Rate + 1.53%), due 11/18/36 (b) | 1,692,000 | 1,197,016 |
| | | 90,346,001 |
| Chemicals 0.4% |
| Alpek SAB de CV | | |
| 3.25%, due 2/25/31 (a) | 1,255,000 | 959,756 |
| Braskem Netherlands Finance BV | | |
| 4.50%, due 1/10/28 (a) | 1,650,000 | 1,432,629 |
| | | 2,392,385 |
| Commercial Services 0.3% |
| Ashtead Capital, Inc. | | |
| 4.25%, due 11/1/29 (a) | 1,640,000 | 1,426,318 |
| California Institute of Technology | | |
| 3.65%, due 9/1/19 | 1,118,000 | 662,181 |
| | | 2,088,499 |
| Computers 0.5% |
| Dell International LLC | | |
| 8.10%, due 7/15/36 | 879,000 | 931,176 |
| NCR Corp. (a) | | |
| 5.00%, due 10/1/28 | 2,339,000 | 1,965,460 |
| 6.125%, due 9/1/29 | 472,000 | 449,857 |
| | | 3,346,493 |
| Diversified Financial Services 4.0% |
| AerCap Ireland Capital DAC | | |
| 3.00%, due 10/29/28 | 1,650,000 | 1,332,987 |
| Air Lease Corp. | | |
| 2.30%, due 2/1/25 | 3,275,000 | 2,993,671 |
| 3.25%, due 3/1/25 | 4,000,000 | 3,726,981 |
| Aircastle Ltd. | | |
| 5.25% (5 Year Treasury Constant Maturity Rate + 4.41%), due 6/15/26 (a)(b)(e) | 2,030,000 | 1,518,133 |
| | Principal
Amount | Value |
| |
| Diversified Financial Services (continued) |
| Ally Financial, Inc. | | |
| Series C | | |
| 4.70% (7 Year Treasury Constant Maturity Rate + 3.481%), due 5/15/28 (b)(e) | $ 1,090,000 | $ 733,025 |
| 5.75%, due 11/20/25 | 3,820,000 | 3,675,142 |
| 8.00%, due 11/1/31 | 1,890,000 | 1,938,405 |
| Avolon Holdings Funding Ltd. | | |
| 3.25%, due 2/15/27 (a) | 2,125,000 | 1,736,060 |
| Banco BTG Pactual SA | | |
| 2.75%, due 1/11/26 (a) | 3,860,000 | 3,377,500 |
| Capital One Financial Corp. | | |
| 5.247%, due 7/26/30 (d) | 1,340,000 | 1,227,756 |
| Nomura Holdings, Inc. | | |
| 5.099%, due 7/3/25 | 1,660,000 | 1,625,048 |
| OneMain Finance Corp. | | |
| 3.50%, due 1/15/27 | 2,935,000 | 2,405,566 |
| | | 26,290,274 |
| Electric 2.1% |
| AEP Texas, Inc. | | |
| 4.70%, due 5/15/32 | 1,175,000 | 1,069,569 |
| Calpine Corp. | | |
| 5.125%, due 3/15/28 (a) | 2,505,000 | 2,220,968 |
| Dominion Energy, Inc. | | |
| Series C | | |
| 4.35% (5 Year Treasury Constant Maturity Rate + 3.195%), due 1/15/27 (b)(e) | 780,000 | 645,286 |
| Edison International | | |
| Series B | | |
| 5.00% (5 Year Treasury Constant Maturity Rate + 3.901%), due 12/15/26 (b)(e) | 2,690,000 | 2,178,900 |
| Ohio Power Co. | | |
| Series R | | |
| 2.90%, due 10/1/51 | 955,000 | 570,180 |
| Pacific Gas and Electric Co. | | |
| 3.50%, due 8/1/50 | 1,855,000 | 1,131,525 |
| Sempra Energy | | |
| 4.125% (5 Year Treasury Constant Maturity Rate + 2.868%), due 4/1/52 (b) | 2,150,000 | 1,617,875 |
| WEC Energy Group, Inc. | | |
| 5.018% (3 Month LIBOR + 2.113%), due 5/15/67 (b) | 5,495,000 | 4,533,375 |
| | | 13,967,678 |
The notes to the financial statements are an integral part of, and should be read in conjunction with, the financial statements.
15
Portfolio of Investments October 31, 2022† (continued)
| | Principal
Amount | Value |
| Corporate Bonds (continued) |
| Environmental Control 0.2% |
| Covanta Holding Corp. | | |
| 4.875%, due 12/1/29 (a) | $ 950,000 | $ 808,877 |
| Stericycle, Inc. | | |
| 3.875%, due 1/15/29 (a) | 630,000 | 547,212 |
| | | 1,356,089 |
| Food 0.7% |
| JBS USA LUX SA | | |
| 5.75%, due 4/1/33 (a) | 1,460,000 | 1,315,664 |
| Kraft Heinz Foods Co. | | |
| 5.00%, due 7/15/35 | 583,000 | 535,257 |
| Smithfield Foods, Inc. | | |
| 3.00%, due 10/15/30 (a) | 1,520,000 | 1,155,065 |
| U.S. Foods, Inc. | | |
| 4.625%, due 6/1/30 (a)(c) | 1,550,000 | 1,344,656 |
| | | 4,350,642 |
| Gas 0.5% |
| National Fuel Gas Co. | | |
| 2.95%, due 3/1/31 | 1,695,000 | 1,270,950 |
| Piedmont Natural Gas Co., Inc. | | |
| 5.05%, due 5/15/52 | 1,070,000 | 897,744 |
| Southern Co. Gas Capital Corp. | | |
| Series 21A | | |
| 3.15%, due 9/30/51 | 1,500,000 | 905,323 |
| | | 3,074,017 |
| Home Builders 0.4% |
| Thor Industries, Inc. | | |
| 4.00%, due 10/15/29 (a) | 1,230,000 | 994,799 |
| Toll Brothers Finance Corp. | | |
| 3.80%, due 11/1/29 | 1,780,000 | 1,445,325 |
| 4.35%, due 2/15/28 | 303,000 | 262,600 |
| | | 2,702,724 |
| Household Products & Wares 0.4% |
| Kronos Acquisition Holdings, Inc. | | |
| 5.00%, due 12/31/26 (a) | 2,770,000 | 2,510,922 |
| Insurance 1.2% |
| Athene Global Funding | | |
| 2.50%, due 3/24/28 (a) | 1,740,000 | 1,430,951 |
| Lincoln National Corp. | | |
| 5.299% (3 Month LIBOR + 2.358%), due 5/17/66 (b) | 3,537,000 | 2,732,479 |
| NMI Holdings, Inc. | | |
| 7.375%, due 6/1/25 (a) | 685,000 | 684,342 |
| | Principal
Amount | Value |
| |
| Insurance (continued) |
| Protective Life Corp. | | |
| 8.45%, due 10/15/39 | $ 2,476,000 | $ 2,787,093 |
| Willis North America, Inc. | | |
| 3.875%, due 9/15/49 | 425,000 | 279,868 |
| | | 7,914,733 |
| Internet 0.6% |
| Expedia Group, Inc. | | |
| 3.25%, due 2/15/30 | 2,345,000 | 1,889,876 |
| Match Group Holdings II LLC (a) | | |
| 3.625%, due 10/1/31 | 2,520,000 | 1,920,895 |
| 4.125%, due 8/1/30 (c) | 122,000 | 99,675 |
| | | 3,910,446 |
| Lodging 1.5% |
| Hilton Domestic Operating Co., Inc. | | |
| 4.875%, due 1/15/30 | 538,000 | 482,182 |
| 5.375%, due 5/1/25 (a)(c) | 935,000 | 920,975 |
| Hyatt Hotels Corp. | | |
| 1.80%, due 10/1/24 | 3,920,000 | 3,656,281 |
| Marriott International, Inc. | | |
| 3.75%, due 10/1/25 | 4,253,000 | 4,049,923 |
| Series X | | |
| 4.00%, due 4/15/28 | 605,000 | 545,560 |
| | | 9,654,921 |
| Media 0.5% |
| DISH DBS Corp. | | |
| 5.75%, due 12/1/28 (a) | 1,250,000 | 1,007,812 |
| Grupo Televisa SAB | | |
| 5.25%, due 5/24/49 | 1,335,000 | 1,098,972 |
| Time Warner Cable Enterprises LLC | | |
| 8.375%, due 3/15/23 | 1,087,000 | 1,098,836 |
| | | 3,205,620 |
| Mining 0.3% |
| Industrias Penoles SAB de CV | | |
| 4.75%, due 8/6/50 (a) | 2,627,000 | 1,875,721 |
| Miscellaneous—Manufacturing 0.3% |
| Textron Financial Corp. | | |
| 4.64% (3 Month LIBOR + 1.735%), due 2/15/42 (a)(b)(c) | 2,905,000 | 1,995,624 |
| Oil & Gas 0.4% |
| EQT Corp. | | |
| 5.678%, due 10/1/25 | 1,610,000 | 1,591,513 |
The notes to the financial statements are an integral part of, and should be read in conjunction with, the financial statements.
| 16 | MainStay MacKay Strategic Bond Fund |
| | Principal
Amount | Value |
| Corporate Bonds (continued) |
| Oil & Gas (continued) |
| Gazprom PJSC Via Gaz Capital SA | | |
| 7.288%, due 8/16/37 (a)(f) | $ 2,520,000 | $ 1,348,200 |
| | | 2,939,713 |
| Packaging & Containers 0.4% |
| Berry Global, Inc. | | |
| 4.875%, due 7/15/26 (a) | 1,240,000 | 1,164,980 |
| Owens-Brockway Glass Container, Inc. | | |
| 6.625%, due 5/13/27 (a) | 1,740,000 | 1,661,672 |
| | | 2,826,652 |
| Pharmaceuticals 0.6% |
| Teva Pharmaceutical Finance Netherlands III BV | | |
| 3.15%, due 10/1/26 | 2,146,000 | 1,813,370 |
| 4.75%, due 5/9/27 | 2,345,000 | 2,069,463 |
| | | 3,882,833 |
| Pipelines 4.0% |
| Cheniere Corpus Christi Holdings LLC | | |
| 2.742%, due 12/31/39 | 1,710,000 | 1,268,874 |
| CNX Midstream Partners LP | | |
| 4.75%, due 4/15/30 (a) | 2,570,000 | 2,113,825 |
| DCP Midstream Operating LP | | |
| 3.25%, due 2/15/32 | 3,090,000 | 2,460,114 |
| DT Midstream, Inc. | | |
| 4.30%, due 4/15/32 (a) | 1,715,000 | 1,473,254 |
| Energy Transfer LP | | |
| Series H | | |
| 6.50% (5 Year Treasury Constant Maturity Rate + 5.694%), due 11/15/26 (b)(e) | 2,520,000 | 2,167,200 |
| Enterprise Products Operating LLC | | |
| 3.95%, due 1/31/60 | 1,630,000 | 1,082,544 |
| 4.20%, due 1/31/50 | 520,000 | 382,157 |
| Flex Intermediate Holdco LLC | | |
| 3.363%, due 6/30/31 (a) | 1,540,000 | 1,187,507 |
| Hess Midstream Operations LP (a) | | |
| 4.25%, due 2/15/30 | 2,630,000 | 2,249,044 |
| 5.625%, due 2/15/26 | 367,000 | 359,943 |
| Holly Energy Partners LP | | |
| 6.375%, due 4/15/27 (a) | 1,140,000 | 1,097,210 |
| Kinder Morgan, Inc. | | |
| 7.75%, due 1/15/32 | 2,035,000 | 2,211,902 |
| MPLX LP | | |
| 4.00%, due 3/15/28 | 560,000 | 506,603 |
| Plains All American Pipeline LP | | |
| 3.80%, due 9/15/30 | 1,040,000 | 867,078 |
| | Principal
Amount | Value |
| |
| Pipelines (continued) |
| Sabine Pass Liquefaction LLC | | |
| 5.75%, due 5/15/24 | $ 2,146,000 | $ 2,143,553 |
| Targa Resources Corp. | | |
| 4.20%, due 2/1/33 | 725,000 | 605,237 |
| Venture Global Calcasieu Pass LLC | | |
| 3.875%, due 11/1/33 (a) | 1,690,000 | 1,356,225 |
| Western Midstream Operating LP | | |
| 5.50%, due 2/1/50 (g) | 1,800,000 | 1,401,265 |
| Williams Cos., Inc. (The) | | |
| 3.50%, due 10/15/51 | 1,425,000 | 912,254 |
| | | 25,845,789 |
| Real Estate 0.1% |
| Realogy Group LLC | | |
| 5.25%, due 4/15/30 (a) | 1,060,000 | 735,025 |
| Real Estate Investment Trusts 1.1% |
| GLP Capital LP | | |
| 3.35%, due 9/1/24 | 1,535,000 | 1,437,939 |
| Iron Mountain, Inc. (a) | | |
| 4.875%, due 9/15/29 | 1,686,000 | 1,449,539 |
| 5.25%, due 7/15/30 | 395,000 | 340,811 |
| Office Properties Income Trust | | |
| 2.65%, due 6/15/26 | 1,520,000 | 1,108,323 |
| Starwood Property Trust, Inc. | | |
| 3.625%, due 7/15/26 (a) | 3,172,000 | 2,759,640 |
| | | 7,096,252 |
| Retail 1.3% |
| AutoNation, Inc. | | |
| 4.75%, due 6/1/30 | 2,300,000 | 1,980,387 |
| Nordstrom, Inc. | | |
| 4.00%, due 3/15/27 | 595,000 | 504,455 |
| 4.25%, due 8/1/31 (c) | 2,860,000 | 2,076,360 |
| QVC, Inc. | | |
| 4.375%, due 9/1/28 | 2,305,000 | 1,671,125 |
| Victoria's Secret & Co. | | |
| 4.625%, due 7/15/29 (a)(c) | 2,775,000 | 2,207,512 |
| | | 8,439,839 |
| Semiconductors 0.3% |
| Broadcom, Inc. (a) | | |
| 3.469%, due 4/15/34 | 2,040,000 | 1,526,954 |
| 3.75%, due 2/15/51 | 620,000 | 397,374 |
| | | 1,924,328 |
| Software 0.2% |
| MSCI, Inc. | | |
| 3.25%, due 8/15/33 (a) | 1,175,000 | 908,332 |
The notes to the financial statements are an integral part of, and should be read in conjunction with, the financial statements.
17
Portfolio of Investments October 31, 2022† (continued)
| | Principal
Amount | Value |
| Corporate Bonds (continued) |
| Software (continued) |
| Oracle Corp. | | |
| 3.65%, due 3/25/41 | $ 450,000 | $ 304,740 |
| | | 1,213,072 |
| Telecommunications 1.3% |
| Altice France SA | | |
| 5.125%, due 7/15/29 (a) | 2,405,000 | 1,811,386 |
| AT&T, Inc. | | |
| 3.65%, due 6/1/51 | 1,485,000 | 987,768 |
| Sprint Corp. | | |
| 7.875%, due 9/15/23 | 3,620,000 | 3,679,379 |
| T-Mobile US, Inc. | | |
| 2.625%, due 2/15/29 | 660,000 | 545,578 |
| Verizon Communications, Inc. | | |
| 4.016%, due 12/3/29 | 1,495,000 | 1,347,436 |
| | | 8,371,547 |
Total Corporate Bonds
(Cost $320,149,271) | | 268,490,003 |
| Foreign Government Bonds 2.3% |
| Brazil 0.2% |
| Brazil Government Bond | | |
| 3.75%, due 9/12/31 (c) | 1,245,000 | 1,022,966 |
| Chile 0.5% |
| Chile Government Bond | | |
| 2.55%, due 7/27/33 | 1,795,000 | 1,334,722 |
| Empresa Nacional del Petroleo | | |
| 3.45%, due 9/16/31 (a) | 2,540,000 | 1,974,241 |
| | | 3,308,963 |
| Colombia 0.3% |
| Colombia Government Bond | | |
| 3.25%, due 4/22/32 | 2,335,000 | 1,549,625 |
| 4.50%, due 1/28/26 (c) | 500,000 | 448,925 |
| | | 1,998,550 |
| Mexico 1.3% |
| Comision Federal de Electricidad (a) | | |
| 3.875%, due 7/26/33 | 2,385,000 | 1,699,313 |
| 4.677%, due 2/9/51 | 1,855,000 | 1,130,948 |
| Mexico Government Bond | | |
| 3.75%, due 4/19/71 | 1,480,000 | 855,889 |
| | Principal
Amount | Value |
| |
| Mexico (continued) |
| Petroleos Mexicanos | | |
| 6.50%, due 3/13/27 | $ 2,535,000 | $ 2,222,943 |
| 6.75%, due 9/21/47 | 4,835,000 | 2,912,027 |
| | | 8,821,120 |
Total Foreign Government Bonds
(Cost $21,348,862) | | 15,151,599 |
| Loan Assignments 0.4% |
| Diversified/Conglomerate Service 0.2% |
| TruGreen LP (b) | |
| First Lien Second Refinancing Term Loan | |
| 7.754% (1 Month LIBOR + 4.00%), due 11/2/27 | 768,029 | 708,507 |
| Second Lien Initial Term Loan | |
| 11.615% (3 Month LIBOR + 8.50%), due 11/2/28 | 450,000 | 378,000 |
| | | 1,086,507 |
| Utilities 0.2% |
| Southwestern Energy Co. | |
| Initial Term Loan | |
| 6.203% (3 Month LIBOR + 2.50%), due 6/22/27 (b) | 1,315,063 | 1,292,871 |
Total Loan Assignments
(Cost $2,514,996) | | 2,379,378 |
| Mortgage-Backed Securities 31.0% |
| Agency (Collateralized Mortgage Obligations) 4.8% |
| FHLMC | |
| REMIC, Series 4839, Class WO | | |
| (zero coupon), due 8/15/56 | 1,115,100 | 730,972 |
| REMIC, Series 5200, Class SA | | |
| 0.503% (SOFR 30A + 3.50%), due 2/25/52 (b)(h) | 2,840,197 | 81,676 |
| REMIC, Series 5021, Class SA | | |
| 0.553% (SOFR 30A + 3.55%), due 10/25/50 (b)(h) | 3,429,170 | 117,199 |
| REMIC, Series 5070, Class IG | | |
| 1.50%, due 1/25/44 (h) | 6,973,941 | 373,045 |
| REMIC, Series 4924, Class NS | | |
| 2.464% (1 Month LIBOR + 6.05%), due 10/25/49 (b)(h) | 1,965,252 | 157,220 |
| REMIC, Series 4957, Class SB | | |
| 2.464% (1 Month LIBOR + 6.05%), due 11/25/49 (b)(h) | 1,128,862 | 100,186 |
The notes to the financial statements are an integral part of, and should be read in conjunction with, the financial statements.
| 18 | MainStay MacKay Strategic Bond Fund |
| | Principal
Amount | Value |
| Mortgage-Backed Securities (continued) |
| Agency (Collateralized Mortgage Obligations) (continued) |
| FHLMC (continued) | |
| REMIC, Series 5031, Class IQ | | |
| 2.50%, due 10/25/50 (h) | $ 1,693,174 | $ 262,865 |
| REMIC, Series 5038, Class IB | | |
| 2.50%, due 10/25/50 (h) | 1,109,774 | 183,883 |
| REMIC, Series 5149, Class LI | | |
| 2.50%, due 10/25/51 (h) | 4,085,214 | 548,730 |
| REMIC, Series 5205, Class KI | | |
| 3.00%, due 12/25/48 (h) | 2,002,251 | 249,325 |
| REMIC, Series 5152, Class BI | | |
| 3.00%, due 7/25/50 (h) | 2,889,384 | 445,520 |
| REMIC, Series 5023, Class LI | | |
| 3.00%, due 10/25/50 (h) | 1,432,117 | 229,757 |
| REMIC, Series 5094, Class IP | | |
| 3.00%, due 4/25/51 (h) | 1,292,164 | 198,969 |
| REMIC, Series 5176, Class PI | | |
| 3.00%, due 7/25/51 (h) | 1,239,471 | 181,905 |
| REMIC, Series 5160 | | |
| 3.00%, due 10/25/51 (h) | 1,762,192 | 217,431 |
| REMIC, Series 5155, Class KI | | |
| 3.00%, due 10/25/51 (h) | 2,608,529 | 392,070 |
| REMIC, Series 5167, Class GI | | |
| 3.00%, due 11/25/51 (h) | 4,370,789 | 618,745 |
| REMIC, Series 5191 | | |
| 3.50%, due 9/25/50 (h) | 2,484,209 | 429,947 |
| REMIC, Series 5036 | | |
| 3.50%, due 11/25/50 (h) | 2,816,053 | 586,342 |
| REMIC, Series 5040 | | |
| 3.50%, due 11/25/50 (h) | 1,556,814 | 266,217 |
| FHLMC, Strips | |
| Series 311 | | |
| (zero coupon), due 8/15/43 | 778,035 | 563,806 |
| Series 311, Class S1 | | |
| 2.538% (1 Month LIBOR + 5.95%), due 8/15/43 (b)(h) | 2,387,420 | 209,428 |
| Series 358 | | |
| 3.50%, due 10/15/47 (h) | 661,636 | 110,425 |
| FNMA | |
| REMIC, Series 2013-110, Class CO | | |
| (zero coupon), due 12/25/39 | 1,333,563 | 1,087,577 |
| REMIC, Series 2013-105, Class QO | | |
| (zero coupon), due 5/25/40 | 359,097 | 291,035 |
| REMIC, Series 2013-105, Class KO | | |
| (zero coupon), due 10/25/43 | 413,392 | 358,144 |
| REMIC, Series 2013-110, Class DO | | |
| (zero coupon), due 11/25/43 | 591,892 | 476,171 |
| | Principal
Amount | Value |
| |
| Agency (Collateralized Mortgage Obligations) (continued) |
| FNMA (continued) | |
| REMIC, Series 2021-81, Class SA | | |
| (zero coupon) (SOFR 30A + 2.60%), due 12/25/51 (b)(h) | $ 12,752,139 | $ 142,320 |
| REMIC, Series 2022-3, Class YS | | |
| (zero coupon) (SOFR 30A + 2.55%), due 2/25/52 (b)(h) | 8,639,382 | 123,690 |
| REMIC, Series 2022-5, Class SN | | |
| (zero coupon) (SOFR 30A + 1.80%), due 2/25/52 (b)(h) | 1,533,447 | 6,317 |
| REMIC, Series 2021-40, Class SI | | |
| 2.364% (1 Month LIBOR + 5.95%), due 9/25/47 (b)(h) | 3,239,210 | 283,741 |
| REMIC, Series 2016-57, Class SN | | |
| 2.464% (1 Month LIBOR + 6.05%), due 6/25/46 (b)(h) | 2,449,792 | 229,548 |
| REMIC, Series 2019-32, Class SB | | |
| 2.464% (1 Month LIBOR + 6.05%), due 6/25/49 (b)(h) | 1,903,592 | 169,358 |
| REMIC, Series 2020-23, Class PS | | |
| 2.464% (1 Month LIBOR + 6.05%), due 2/25/50 (b)(h) | 2,860,433 | 272,393 |
| REMIC, Series 2021-7, Class EI | | |
| 2.50%, due 2/25/51 (h) | 2,875,407 | 400,475 |
| REMIC, Series 2021-12, Class JI | | |
| 2.50%, due 3/25/51 (h) | 1,463,784 | 222,870 |
| REMIC, Series 2021-10, Class LI | | |
| 2.50%, due 3/25/51 (h) | 984,579 | 150,600 |
| REMIC, Series 2021-54, Class HI | | |
| 2.50%, due 6/25/51 (h) | 791,187 | 98,686 |
| REMIC, Series 2021-85, Class BI | | |
| 3.00%, due 12/25/51 (h) | 3,459,410 | 539,493 |
| REMIC, Series 2021-8, Class ID | | |
| 3.50%, due 3/25/51 (h) | 2,629,556 | 528,262 |
| REMIC, Series 2020-10, Class DA | | |
| 3.50%, due 3/25/60 | 1,675,274 | 1,529,377 |
| GNMA | |
| Series 2019-136, Class YS | | |
| (zero coupon) (1 Month LIBOR + 2.83%), due 11/20/49 (b)(h) | 1,860,286 | 4,898 |
| Series 2021-77, Class KS | | |
| (zero coupon) (SOFR 30A + 2.60%), due 5/20/51 (b)(h) | 9,222,448 | 77,192 |
| Series 2021-122, Class SA | | |
| (zero coupon) (SOFR 30A + 2.60%), due 7/20/51 (b)(h) | 2,175,780 | 18,652 |
The notes to the financial statements are an integral part of, and should be read in conjunction with, the financial statements.
19
Portfolio of Investments October 31, 2022† (continued)
| | Principal
Amount | Value |
| Mortgage-Backed Securities (continued) |
| Agency (Collateralized Mortgage Obligations) (continued) |
| GNMA (continued) | |
| Series 2021-213, Class ES | | |
| (zero coupon) (SOFR 30A + 1.70%), due 12/20/51 (b)(h) | $ 13,202,212 | $ 37,106 |
| Series 2022-19, Class SG | | |
| (zero coupon) (SOFR 30A + 2.45%), due 1/20/52 (b)(h) | 7,607,712 | 75,176 |
| Series 2022-24, Class SC | | |
| (zero coupon) (SOFR 30A + 2.37%), due 2/20/52 (b)(h) | 34,230,006 | 330,806 |
| Series 2022-6, Class AS | | |
| 0.22% (SOFR 30A + 3.14%), due 1/20/52 (b)(h) | 884,427 | 12,801 |
| Series 2021-158, Class SB | | |
| 0.78% (SOFR 30A + 3.70%), due 9/20/51 (b)(h) | 4,096,023 | 174,116 |
| Series 2020-115, Class YA | | |
| 1.00%, due 8/20/50 | 1,604,080 | 1,211,516 |
| Series 2020-129, Class AG | | |
| 1.00%, due 9/20/50 | 2,242,320 | 1,669,544 |
| Series 2020-166, Class CA | | |
| 1.00%, due 11/20/50 | 2,270,190 | 1,701,287 |
| Series 2022-121, Class SG | | |
| 1.05% (SOFR 30A + 3.97%), due 7/20/52 (b)(h) | 9,908,953 | 159,866 |
| Series 2020-146, Class LI | | |
| 2.00%, due 10/20/50 (h) | 3,523,743 | 373,447 |
| Series 2021-41, Class FS | | |
| 2.00% (SOFR 30A + 0.20%), due 10/20/50 (b)(h) | 4,586,602 | 527,690 |
| Series 2020-166, Class IC | | |
| 2.00%, due 11/20/50 (h) | 1,493,043 | 158,243 |
| Series 2020-176, Class AI | | |
| 2.00%, due 11/20/50 (h) | 8,726,552 | 965,041 |
| Series 2020-188 | | |
| 2.00%, due 12/20/50 (h) | 3,126,854 | 330,940 |
| Series 2021-57, Class AI | | |
| 2.00%, due 2/20/51 (h) | 4,896,216 | 513,724 |
| Series 2021-30, Class HI | | |
| 2.00%, due 2/20/51 (h) | 4,029,894 | 438,798 |
| Series 2021-205, Class GA | | |
| 2.00%, due 11/20/51 | 647,868 | 524,855 |
| Series 2021-97, Class IN | | |
| 2.50%, due 8/20/49 (h) | 5,507,178 | 599,520 |
| Series 2022-1, Class IA | | |
| 2.50%, due 6/20/50 (h) | 777,243 | 110,013 |
| | Principal
Amount | Value |
| |
| Agency (Collateralized Mortgage Obligations) (continued) |
| GNMA (continued) | |
| Series 2021-56, Class FE | | |
| 2.50% (SOFR 30A + 0.20%), due 10/20/50 (b)(h) | $ 4,546,793 | $ 607,859 |
| Series 2021-1, Class PI | | |
| 2.50%, due 12/20/50 (h) | 999,046 | 131,386 |
| Series 2021-57, Class IB | | |
| 2.50%, due 2/20/51 (h) | 3,184,222 | 446,366 |
| Series 2021-25, Class LI | | |
| 2.50%, due 2/20/51 (h) | 2,609,605 | 323,897 |
| Series 2021-149, Class CI | | |
| 2.50%, due 8/20/51 (h) | 3,376,083 | 479,304 |
| Series 2021-162, Class KI | | |
| 2.50%, due 9/20/51 (h) | 3,009,695 | 436,154 |
| Series 2022-83 | | |
| 2.50%, due 11/20/51 (h) | 1,908,786 | 252,914 |
| Series 2021-97, Class FA | | |
| 3.00% (SOFR 30A + 0.40%), due 6/20/51 (b) | 998,457 | 876,353 |
| Series 2021-158, Class NI | | |
| 3.00%, due 9/20/51 (h) | 4,950,702 | 774,253 |
| Series 2021-177, Class IM | | |
| 3.00%, due 10/20/51 (h) | 3,076,783 | 495,612 |
| Series 2022-6, Class CF | | |
| 3.28% (SOFR 30A + 0.36%), due 1/20/52 (b) | 884,427 | 789,415 |
| Series 2019-145, Class LF | | |
| 3.50% (1 Month LIBOR + 0.67%), due 11/20/49 (b) | 2,003,328 | 1,743,004 |
| | | 31,537,468 |
| Commercial Mortgage Loans (Collateralized Mortgage Obligations) 13.0% |
| BAMLL Commercial Mortgage Securities Trust (a)(b) | |
| Series 2022-DKLX, Class E | | |
| 7.503% (1 Month SOFR + 4.127%), due 1/15/39 | 1,095,000 | 1,021,056 |
| Series 2022-DKLX, Class F | | |
| 8.333% (1 Month SOFR + 4.957%), due 1/15/39 | 1,250,000 | 1,149,862 |
| Bayview Commercial Asset Trust (a)(b) | |
| Series 2006-4A, Class A1 | | |
| 3.931% (1 Month LIBOR + 0.345%), due 12/25/36 | 9,099 | 8,318 |
| Series 2005-3A, Class A1 | | |
| 4.066% (1 Month LIBOR + 0.48%), due 11/25/35 | 745,090 | 673,496 |
The notes to the financial statements are an integral part of, and should be read in conjunction with, the financial statements.
| 20 | MainStay MacKay Strategic Bond Fund |
| | Principal
Amount | Value |
| Mortgage-Backed Securities (continued) |
| Commercial Mortgage Loans (Collateralized Mortgage Obligations) (continued) |
| BOCA Commercial Mortgage Trust | |
| Series 2022-BOCA, Class A | | |
| 5.145% (1 Month SOFR + 1.77%), due 5/15/39 (a)(b) | $ 1,485,000 | $ 1,445,222 |
| BX Commercial Mortgage Trust (a) | |
| Series 2020-VIV2, Class C | | |
| 3.542%, due 3/9/44 (i) | 1,705,000 | 1,266,388 |
| Series 2020-VIV3, Class B | | |
| 3.544%, due 3/9/44 (i) | 925,000 | 726,641 |
| Series 2020-VIVA, Class D | | |
| 3.549%, due 3/11/44 (i) | 1,250,000 | 904,010 |
| Series 2021-XL2, Class A | | |
| 4.101% (1 Month LIBOR + 0.689%), due 10/15/38 (b) | 1,130,592 | 1,069,360 |
| Series 2021-VOLT, Class D | | |
| 5.062% (1 Month LIBOR + 1.65%), due 9/15/36 (b) | 2,165,000 | 2,002,451 |
| Series 2021-ACNT, Class D | | |
| 5.263% (1 Month LIBOR + 1.85%), due 11/15/38 (b) | 1,615,000 | 1,517,329 |
| Series 2021-VOLT, Class E | | |
| 5.412% (1 Month LIBOR + 2.00%), due 9/15/36 (b) | 2,845,000 | 2,615,411 |
| Series 2021-ACNT, Class E | | |
| 5.61% (1 Month LIBOR + 2.197%), due 11/15/38 (b) | 2,500,000 | 2,304,747 |
| BX Trust (a) | |
| Series 2019-OC11, Class B | | |
| 3.605%, due 12/9/41 | 205,000 | 162,514 |
| Series 2019-OC11, Class C | | |
| 3.856%, due 12/9/41 | 1,145,000 | 904,708 |
| Series 2019-OC11, Class D | | |
| 3.944%, due 12/9/41 (i) | 865,000 | 674,378 |
| Series 2019-OC11, Class E | | |
| 3.944%, due 12/9/41 (i) | 3,995,000 | 2,956,625 |
| Series 2021-RISE, Class A | | |
| 4.16% (1 Month LIBOR + 0.748%), due 11/15/36 (b) | 1,885,000 | 1,782,456 |
| Series 2021-LBA, Class AJV | | |
| 4.213% (1 Month LIBOR + 0.80%), due 2/15/36 (b) | 1,725,000 | 1,620,424 |
| Series 2021-MFM1, Class C | | |
| 4.612% (1 Month LIBOR + 1.20%), due 1/15/34 (b) | 2,695,000 | 2,539,794 |
| | Principal
Amount | Value |
| |
| Commercial Mortgage Loans (Collateralized Mortgage Obligations) (continued) |
| BX Trust (a) (continued) | |
| Series 2018-GW, Class C | | |
| 4.632% (1 Month LIBOR + 1.22%), due 5/15/35 (b) | $ 940,000 | $ 891,167 |
| Series 2021-RISE, Class B | | |
| 4.662% (1 Month LIBOR + 1.25%), due 11/15/36 (b) | 760,000 | 719,189 |
| Series 2021-MFM1, Class D | | |
| 4.912% (1 Month LIBOR + 1.50%), due 1/15/34 (b) | 1,815,000 | 1,687,750 |
| Series 2021-LBA, Class DV | | |
| 5.013% (1 Month LIBOR + 1.60%), due 2/15/36 (b) | 1,270,000 | 1,148,953 |
| Series 2021-RISE, Class D | | |
| 5.162% (1 Month LIBOR + 1.75%), due 11/15/36 (b) | 2,590,000 | 2,390,050 |
| Series 2021-ARIA, Class E | | |
| 5.657% (1 Month LIBOR + 2.245%), due 10/15/36 (b) | 3,400,000 | 3,065,045 |
| BXHPP Trust (a)(b) | |
| Series 2021-FILM, Class B | | |
| 4.312% (1 Month LIBOR + 0.90%), due 8/15/36 | 140,000 | 129,680 |
| Series 2021-FILM, Class C | | |
| 4.512% (1 Month LIBOR + 1.10%), due 8/15/36 | 1,090,000 | 999,699 |
| Series 2021-FILM, Class D | | |
| 4.912% (1 Month LIBOR + 1.50%), due 8/15/36 | 585,000 | 530,720 |
| BXSC Commercial Mortgage Trust | |
| Series 2022-WSS, Class D | | |
| 6.564% (1 Month SOFR + 3.188%), due 3/15/35 (a)(b) | 1,150,000 | 1,082,119 |
| Commercial Mortgage Trust | |
| Series 2012-CR4, Class AM | | |
| 3.251%, due 10/15/45 | 1,050,000 | 1,008,552 |
| Series 2013-CR9, Class B | | |
| 4.29%, due 7/10/45 (a)(i) | 1,020,000 | 981,170 |
| CSMC WEST Trust | |
| Series 2020-WEST, Class A | | |
| 3.04%, due 2/15/35 (a) | 1,925,000 | 1,499,007 |
| DROP Mortgage Trust | |
| Series 2021-FILE, Class A | | |
| 4.56% (1 Month LIBOR + 1.15%), due 10/15/43 (a)(b) | 1,430,000 | 1,367,333 |
The notes to the financial statements are an integral part of, and should be read in conjunction with, the financial statements.
21
Portfolio of Investments October 31, 2022† (continued)
| | Principal
Amount | Value |
| Mortgage-Backed Securities (continued) |
| Commercial Mortgage Loans (Collateralized Mortgage Obligations) (continued) |
| Extended Stay America Trust (a)(b) | |
| Series 2021-ESH, Class C | | |
| 5.113% (1 Month LIBOR + 1.70%), due 7/15/38 | $ 107,381 | $ 101,600 |
| Series 2021-ESH, Class D | | |
| 5.663% (1 Month LIBOR + 2.25%), due 7/15/38 | 3,694,888 | 3,491,354 |
| FREMF Mortgage Trust (a)(i) | |
| Series 2018-K73, Class B | | |
| 3.854%, due 2/25/51 | 855,000 | 770,417 |
| Series 2017-K63, Class C | | |
| 3.877%, due 2/25/50 | 1,275,000 | 1,153,714 |
| Series 2018-K154, Class B | | |
| 4.023%, due 11/25/32 | 1,750,000 | 1,470,127 |
| Series 2018-K78, Class B | | |
| 4.128%, due 6/25/51 | 970,000 | 885,736 |
| Series 2018-K155, Class B | | |
| 4.166%, due 4/25/33 | 2,135,000 | 1,815,596 |
| Series 2018-K81, Class C | | |
| 4.173%, due 9/25/51 | 1,385,000 | 1,223,764 |
| Series 2018-K81, Class B | | |
| 4.173%, due 9/25/51 | 465,000 | 421,897 |
| Series 2018-K84, Class C | | |
| 4.185%, due 10/25/28 | 475,000 | 424,472 |
| Series 2018-K76, Class B | | |
| 4.208%, due 6/25/51 | 360,000 | 329,853 |
| Series 2018-K79, Class B | | |
| 4.211%, due 7/25/51 | 615,000 | 560,371 |
| Series 2018-K80, Class C | | |
| 4.231%, due 8/25/50 | 1,000,000 | 899,208 |
| Series 2019-K88, Class C | | |
| 4.383%, due 2/25/52 | 1,505,000 | 1,330,556 |
| Hudson Yards Mortgage Trust | |
| Series 2019-30HY, Class A | | |
| 3.228%, due 7/10/39 (a) | 2,595,000 | 2,178,735 |
| J.P. Morgan Chase Commercial Mortgage Securities Trust (a) | |
| Series 2019-OSB, Class A | | |
| 3.397%, due 6/5/39 | 1,665,000 | 1,408,666 |
| Series 2018-AON, Class B | | |
| 4.379%, due 7/5/31 | 2,060,000 | 1,874,600 |
| Manhattan West Mortgage Trust | |
| Series 2020-1MW, Class A | | |
| 2.13%, due 9/10/39 (a) | 1,725,000 | 1,451,454 |
| | Principal
Amount | Value |
| |
| Commercial Mortgage Loans (Collateralized Mortgage Obligations) (continued) |
| Multifamily Connecticut Avenue Securities Trust (a)(b) | |
| Series 2019-01, Class M10 | | |
| 6.836% (1 Month LIBOR + 3.25%), due 10/25/49 | $ 2,452,394 | $ 2,259,194 |
| Series 2020-01, Class M10 | | |
| 7.336% (1 Month LIBOR + 3.75%), due 3/25/50 | 1,420,000 | 1,316,416 |
| One Bryant Park Trust | |
| Series 2019-OBP, Class A | | |
| 2.516%, due 9/15/54 (a) | 4,665,000 | 3,715,799 |
| SLG Office Trust (a) | |
| Series 2021-OVA, Class A | | |
| 2.585%, due 7/15/41 | 645,000 | 501,611 |
| Series 2021-OVA, Class D | | |
| 2.851%, due 7/15/41 | 1,290,000 | 926,680 |
| SMRT | |
| Series 2022-MINI, Class D | | |
| 5.326% (1 Month SOFR + 1.95%), due 1/15/39 (a)(b) | 2,650,000 | 2,464,849 |
| UBS-Barclays Commercial Mortgage Trust | |
| Series 2013-C6, Class B | | |
| 3.875%, due 4/10/46 (a)(j) | 2,360,000 | 2,283,698 |
| Wells Fargo Commercial Mortgage Trust | |
| Series 2018-AUS, Class A | | |
| 4.058%, due 8/17/36 (a)(i) | 2,395,000 | 2,170,723 |
| WFRBS Commercial Mortgage Trust | |
| Series 2014-C21, Class AS | | |
| 3.891%, due 8/15/47 | 2,175,000 | 2,052,506 |
| | | 84,329,220 |
| Whole Loan (Collateralized Mortgage Obligations) 13.2% |
| Alternative Loan Trust | |
| Series 2005-31, Class 1A1 | | |
| 4.146% (1 Month LIBOR + 0.56%), due 8/25/35 (b) | 1,889,518 | 1,633,881 |
| Connecticut Avenue Securities Trust (a)(b) | |
| Series 2020-R02, Class 2M2 | | |
| 5.586% (1 Month LIBOR + 2.00%), due 1/25/40 | 1,559,527 | 1,531,474 |
| Series 2021-R01, Class 1B1 | | |
| 6.097% (SOFR 30A + 3.10%), due 10/25/41 | 4,025,000 | 3,635,676 |
| Series 2020-SBT1, Class 1M2 | | |
| 7.236% (1 Month LIBOR + 3.65%), due 2/25/40 | 1,270,000 | 1,232,497 |
The notes to the financial statements are an integral part of, and should be read in conjunction with, the financial statements.
| 22 | MainStay MacKay Strategic Bond Fund |
| | Principal
Amount | Value |
| Mortgage-Backed Securities (continued) |
| Whole Loan (Collateralized Mortgage Obligations) (continued) |
| FHLMC STACR REMIC Trust (a)(b) | |
| Series 2021-DNA6, Class M2 | | |
| 4.497% (SOFR 30A + 1.50%), due 10/25/41 | $ 1,041,000 | $ 955,399 |
| Series 2020-DNA6, Class M2 | | |
| 4.997% (SOFR 30A + 2.00%), due 12/25/50 | 3,068,726 | 3,018,078 |
| Series 2021-HQA2, Class M2 | | |
| 5.047% (SOFR 30A + 2.05%), due 12/25/33 | 2,155,000 | 1,898,083 |
| Series 2021-HQA3, Class M2 | | |
| 5.097% (SOFR 30A + 2.10%), due 9/25/41 | 2,615,000 | 2,224,400 |
| Series 2021-HQA1, Class M2 | | |
| 5.247% (SOFR 30A + 2.25%), due 8/25/33 | 2,540,000 | 2,322,477 |
| Series 2022-DNA3, Class M1B | | |
| 5.897% (SOFR 30A + 2.90%), due 4/25/42 | 2,495,000 | 2,314,114 |
| Series 2020-HQA1, Class B1 | | |
| 5.936% (1 Month LIBOR + 2.35%), due 1/25/50 | 1,815,000 | 1,634,527 |
| Series 2021-HQA1, Class B1 | | |
| 5.997% (SOFR 30A + 3.00%), due 8/25/33 | 3,781,290 | 3,035,741 |
| Series 2020-DNA6, Class B1 | | |
| 5.997% (SOFR 30A + 3.00%), due 12/25/50 | 3,030,000 | 2,780,075 |
| Series 2021-DNA5, Class B1 | | |
| 6.047% (SOFR 30A + 3.05%), due 1/25/34 | 2,610,000 | 2,268,749 |
| Series 2020-DNA2, Class B1 | | |
| 6.086% (1 Month LIBOR + 2.50%), due 2/25/50 | 3,015,000 | 2,867,762 |
| Series 2021-HQA2, Class B1 | | |
| 6.147% (SOFR 30A + 3.15%), due 12/25/33 | 2,380,000 | 1,895,300 |
| Series 2021-HQA3, Class B1 | | |
| 6.347% (SOFR 30A + 3.35%), due 9/25/41 | 4,030,000 | 3,444,592 |
| Series 2022-DNA1, Class B1 | | |
| 6.397% (SOFR 30A + 3.40%), due 1/25/42 | 3,710,295 | 3,208,017 |
| Series 2021-DNA3, Class B1 | | |
| 6.497% (SOFR 30A + 3.50%), due 10/25/33 | 2,860,000 | 2,446,519 |
| | Principal
Amount | Value |
| |
| Whole Loan (Collateralized Mortgage Obligations) (continued) |
| FHLMC STACR REMIC Trust (a)(b) (continued) | |
| Series 2022-DNA2, Class M2 | | |
| 6.747% (SOFR 30A + 3.75%), due 2/25/42 | $ 1,690,000 | $ 1,544,842 |
| FHLMC STACR Trust (a)(b) | |
| Series 2019-DNA3, Class B1 | | |
| 6.836% (1 Month LIBOR + 3.25%), due 7/25/49 | 2,125,000 | 2,022,701 |
| Series 2018-DNA2, Class B1 | | |
| 7.286% (1 Month LIBOR + 3.70%), due 12/25/30 | 2,850,000 | 2,801,237 |
| Series 2019-DNA2, Class B1 | | |
| 7.936% (1 Month LIBOR + 4.35%), due 3/25/49 | 895,000 | 895,000 |
| Series 2019-DNA1, Class B1 | | |
| 8.236% (1 Month LIBOR + 4.65%), due 1/25/49 | 2,495,000 | 2,549,887 |
| FHLMC Structured Agency Credit Risk Debt Notes | |
| Series 2021-DNA2, Class B1 | | |
| 6.397% (SOFR 30A + 3.40%), due 8/25/33 (a)(b) | 1,365,000 | 1,176,997 |
| FNMA (b) | |
| Series 2017-C07, Class 2M2 | | |
| 6.086% (1 Month LIBOR + 2.50%), due 5/25/30 | 3,031,363 | 3,016,318 |
| Series 2021-R02, Class 2B1 | | |
| 6.297% (SOFR 30A + 3.30%), due 11/25/41 (a) | 1,450,000 | 1,277,595 |
| Series 2017-C04, Class 2M2 | | |
| 6.436% (1 Month LIBOR + 2.85%), due 11/25/29 | 2,038,858 | 2,059,872 |
| Series 2018-C01, Class 1B1 | | |
| 7.136% (1 Month LIBOR + 3.55%), due 7/25/30 | 3,555,000 | 3,544,020 |
| Series 2017-C07, Class 1B1 | | |
| 7.586% (1 Month LIBOR + 4.00%), due 5/25/30 | 2,940,000 | 2,971,234 |
| Series 2018-C06, Class 2B1 | | |
| 7.686% (1 Month LIBOR + 4.10%), due 3/25/31 | 995,000 | 990,272 |
| Series 2018-C05, Class 1B1 | | |
| 7.836% (1 Month LIBOR + 4.25%), due 1/25/31 | 1,451,000 | 1,464,506 |
| Series 2018-C04, Class 2B1 | | |
| 8.086% (1 Month LIBOR + 4.50%), due 12/25/30 | 1,432,000 | 1,448,439 |
The notes to the financial statements are an integral part of, and should be read in conjunction with, the financial statements.
23
Portfolio of Investments October 31, 2022† (continued)
| | Principal
Amount | Value |
| Mortgage-Backed Securities (continued) |
| Whole Loan (Collateralized Mortgage Obligations) (continued) |
| Galton Funding Mortgage Trust | |
| Series 2018-2, Class A51 | | |
| 4.50%, due 10/25/58 (a)(j) | $ 429,281 | $ 401,588 |
| GreenPoint Mortgage Funding Trust | |
| Series 2007-AR3, Class A1 | | |
| 4.026% (1 Month LIBOR + 0.44%), due 6/25/37 (b) | 381,677 | 345,609 |
| New Residential Mortgage Loan Trust (a) | |
| Series 2019-5A, Class B7 | | |
| 4.359%, due 8/25/59 (i) | 2,242,824 | 1,341,890 |
| Series 2019-4A, Class B6 | | |
| 4.667%, due 12/25/58 (j) | 2,079,290 | 1,221,313 |
| Series 2019-2A, Class B6 | | |
| 4.891%, due 12/25/57 (j) | 845,315 | 524,640 |
| NewRez Warehouse Securitization Trust | |
| Series 2021-1, Class B | | |
| 4.486% (1 Month LIBOR + 0.90%), due 5/25/55 (a)(b) | 3,085,000 | 3,018,049 |
| Sequoia Mortgage Trust | |
| Series 2018-7, Class B3 | | |
| 4.253%, due 9/25/48 (a)(j) | 1,378,158 | 1,103,244 |
| STACR Trust (a)(b) | |
| Series 2018-HRP2, Class M3 | | |
| 5.986% (1 Month LIBOR + 2.40%), due 2/25/47 | 3,035,421 | 2,932,618 |
| Series 2018-HRP2, Class B1 | | |
| 7.786% (1 Month LIBOR + 4.20%), due 2/25/47 | 2,435,000 | 2,363,115 |
| WaMu Mortgage Pass-Through Certificates Trust | |
| Series 2006-AR9, Class 2A | | |
| 2.419% (12 Month Monthly Treasury Average Index + 1.048%), due 8/25/46 (b) | 561,666 | 485,897 |
| | | 85,848,244 |
Total Mortgage-Backed Securities
(Cost $220,215,119) | | 201,714,932 |
| | Principal
Amount | Value |
| Municipal Bond 0.3% |
| California 0.3% |
Regents of the University of California Medical Center, Pooled
Revenue Bonds | | |
| Series N | | |
| 3.006%, due 5/15/50 | $ 2,760,000 | $ 1,725,658 |
Total Municipal Bond
(Cost $2,760,000) | | 1,725,658 |
| U.S. Government & Federal Agencies 7.1% |
| Federal Home Loan Mortgage Corporation (Mortgage Pass-Through Security) 0.3% |
| UMBS, 30 Year | | |
| 3.50%, due 7/1/52 | 2,495,682 | 2,195,932 |
| Federal National Mortgage Association (Mortgage Pass-Through Securities) 1.9% |
| UMBS, 30 Year | | |
| 4.00%, due 6/1/52 | 10,103,083 | 9,196,013 |
| 4.00%, due 7/1/52 | 3,276,438 | 2,982,269 |
| | | 12,178,282 |
| United States Treasury Bonds 0.8% |
| U.S. Treasury Bonds | | |
| 3.00%, due 8/15/52 | 2,820,000 | 2,258,203 |
| 3.375%, due 8/15/42 | 3,230,000 | 2,786,380 |
| | | 5,044,583 |
| United States Treasury Notes 4.1% |
| U.S. Treasury Notes | | |
| 2.75%, due 8/15/32 | 22,290,000 | 19,946,067 |
| 4.00%, due 10/31/29 | 7,245,000 | 7,177,078 |
| | | 27,123,145 |
Total U.S. Government & Federal Agencies
(Cost $50,741,624) | | 46,541,942 |
Total Long-Term Bonds
(Cost $726,217,258) | | 632,696,958 |
| |
| | Shares | |
| Common Stocks 0.0% ‡ |
| Commercial Services & Supplies 0.0% ‡ |
| Quad/Graphics, Inc. (k) | 14 | 39 |
The notes to the financial statements are an integral part of, and should be read in conjunction with, the financial statements.
| 24 | MainStay MacKay Strategic Bond Fund |
| | Shares | | Value |
| Common Stocks (continued) ‡ |
| Tobacco 0.0% ‡ |
| Turning Point Brands, Inc. | 6,802 | | $ 160,255 |
Total Common Stocks
(Cost $0) | | | 160,294 |
| Short-Term Investments 2.2% |
| Affiliated Investment Company 1.6% |
| MainStay U.S. Government Liquidity Fund, 2.905% (l) | 10,062,379 | | 10,062,379 |
| Unaffiliated Investment Company 0.6% |
| Invesco Government & Agency Portfolio, 3.163% (l)(m) | 3,978,300 | | 3,978,300 |
Total Short-Term Investments
(Cost $14,040,679) | | | 14,040,679 |
Total Investments
(Cost $740,257,937) | 99.4% | | 646,897,931 |
| Other Assets, Less Liabilities | 0.6 | | 4,182,322 |
| Net Assets | 100.0% | | $ 651,080,253 |
| † | Percentages indicated are based on Fund net assets. |
| ‡ | Less than one-tenth of a percent. |
| (a) | May be sold to institutional investors only under Rule 144A or securities offered pursuant to Section 4(a)(2) of the Securities Act of 1933, as amended. |
| (b) | Floating rate—Rate shown was the rate in effect as of October 31, 2022. |
| (c) | All or a portion of this security was held on loan. As of October 31, 2022, the aggregate market value of securities on loan was $4,719,550; the total market value of collateral held by the Fund was $4,892,114. The market value of the collateral held included non-cash collateral in the form of U.S. Treasury securities with a value of $913,814. The Fund received cash collateral with a value of $3,978,300. (See Note 2(L)) |
| (d) | Fixed to floating rate—Rate shown was the rate in effect as of October 31, 2022. |
| (e) | Security is perpetual and, thus, does not have a predetermined maturity date. The date shown, if applicable, reflects the next call date. |
| (f) | Illiquid security—As of October 31, 2022, the total market value deemed illiquid under procedures approved by the Board of Trustees was $1,348,200, which represented 0.2% of the Fund’s net assets.(Unaudited) |
| (g) | Step coupon—Rate shown was the rate in effect as of October 31, 2022. |
| (h) | Collateralized Mortgage Obligation Interest Only Strip—Pays a fixed or variable rate of interest based on mortgage loans or mortgage pass-through securities. The principal amount of the underlying pool represents the notional amount on which the current interest was calculated. The value of these stripped securities may be particularly sensitive to changes in prevailing interest rates and are typically more sensitive to changes in prepayment rates than traditional mortgage-backed securities. |
| (i) | Collateral strip rate—A bond whose interest was based on the weighted net interest rate of the collateral. The coupon rate adjusts periodically based on a predetermined schedule. Rate shown was the rate in effect as of October 31, 2022. |
| (j) | Coupon rate may change based on changes of the underlying collateral or prepayments of principal. Rate shown was the rate in effect as of October 31, 2022. |
| (k) | Non-income producing security. |
| (l) | Current yield as of October 31, 2022. |
| (m) | Represents a security purchased with cash collateral received for securities on loan. |
Investments in Affiliates (in 000's)
Investments in issuers considered to be affiliate(s) of the Fund during the year ended October 31, 2022 for purposes of Section 2(a)(3) of the Investment Company Act of 1940, as amended, were as follows:
| Affiliated Investment Companies | Value,
Beginning
of Year | Purchases
at Cost | Proceeds
from
Sales | Net
Realized
Gain/(Loss)
on Sales | Change in
Unrealized
Appreciation/
(Depreciation) | Value,
End of
Year | Dividend
Income | Other
Distributions | Shares
End of
Year |
| MainStay U.S. Government Liquidity Fund | $ 53,259 | $ 348,239 | $ (391,436) | $ — | $ — | $ 10,062 | $ 121 | $ — | 10,062 |
The notes to the financial statements are an integral part of, and should be read in conjunction with, the financial statements.
25
Portfolio of Investments October 31, 2022† (continued)
Futures Contracts
As of October 31, 2022, the Fund held the following futures contracts1:
| Type | Number of
Contracts | Expiration
Date | Value at
Trade Date | Current
Notional
Amount | Unrealized
Appreciation
(Depreciation)2 |
| Long Contracts | | | | | |
| U.S. Treasury 10 Year Ultra Bonds | 513 | December 2022 | $ 63,728,136 | $ 59,499,984 | $ (4,228,152) |
| U.S. Treasury Long Bonds | 48 | December 2022 | �� 6,145,549 | 5,784,000 | (361,549) |
| Total Long Contracts | | | | | (4,589,701) |
| Short Contracts | | | | | |
| U.S. Treasury 2 Year Notes | (151) | December 2022 | (31,218,676) | (30,861,804) | 356,872 |
| U.S. Treasury 5 Year Notes | (451) | December 2022 | (50,065,699) | (48,073,781) | 1,991,918 |
| U.S. Treasury 10 Year Notes | (620) | December 2022 | (71,601,535) | (68,568,125) | 3,033,410 |
| U.S. Treasury Ultra Bonds | (11) | December 2022 | (1,497,480) | (1,404,219) | 93,261 |
| Total Short Contracts | | | | | 5,475,461 |
| Net Unrealized Appreciation | | | | | $ 885,760 |
| 1. | As of October 31, 2022, cash in the amount of $1,046,103 was on deposit with a broker or futures commission merchant for futures transactions. |
| 2. | Represents the difference between the value of the contracts at the time they were opened and the value as of October 31, 2022. |
Swap Contracts
As of October 31, 2022, the Fund held the following centrally cleared interest swap agreements1:
Notional
Amount | Currency | Expiration
Date | Payments
made by Fund | Payments
Received by Fund | Payment Frequency
Paid/Received | Upfront
Premiums
Paid/
(Received) | | Value | | Unrealized
Appreciation/
(Depreciation) |
| $ 40,000,000 | USD | 3/16/23 | Fixed 2.793% | 3 month USD LIBOR | Semi-Annually/Quarterly | $ — | | $ 263,171 | | $ 263,171 |
| 41,000,000 | USD | 3/29/23 | Fixed 2.762% | 3 month USD LIBOR | Semi-Annually/Quarterly | — | | 301,558 | | 301,558 |
| | | | | | | $ — | | $ 564,729 | | $ 564,729 |
| 1. | As of October 31, 2022, cash in the amount of $136,995 was on deposit with a broker for centrally cleared swap agreements. |
| Abbreviation(s): |
| FHLMC—Federal Home Loan Mortgage Corp. |
| FNMA—Federal National Mortgage Association |
| FREMF—Freddie Mac Multifamily |
| GNMA—Government National Mortgage Association |
| LIBOR—London Interbank Offered Rate |
| REMIC—Real Estate Mortgage Investment Conduit |
| SOFR—Secured Overnight Financing Rate |
| UMBS—Uniform Mortgage Backed Securities |
| USD—United States Dollar |
| USISDA—U.S. dollar International Swaps and Derivatives Association |
The notes to the financial statements are an integral part of, and should be read in conjunction with, the financial statements.
| 26 | MainStay MacKay Strategic Bond Fund |
The following is a summary of the fair valuations according to the inputs used as of October 31, 2022, for valuing the Fund’s assets and liabilities:
| Description | Quoted
Prices in
Active
Markets for
Identical
Assets
(Level 1) | | Significant
Other
Observable
Inputs
(Level 2) | | Significant
Unobservable
Inputs
(Level 3) | | Total |
| Asset Valuation Inputs | | | | | | | |
| Investments in Securities (a) | | | | | | | |
| Long-Term Bonds | | | | | | | |
| Asset-Backed Securities | $ — | | $ 96,693,446 | | $ — | | $ 96,693,446 |
| Corporate Bonds | — | | 268,490,003 | | — | | 268,490,003 |
| Foreign Government Bonds | — | | 15,151,599 | | — | | 15,151,599 |
| Loan Assignments | — | | 2,379,378 | | — | | 2,379,378 |
| Mortgage-Backed Securities | — | | 201,714,932 | | — | | 201,714,932 |
| Municipal Bond | — | | 1,725,658 | | — | | 1,725,658 |
| U.S. Government & Federal Agencies | — | | 46,541,942 | | — | | 46,541,942 |
| Total Long-Term Bonds | — | | 632,696,958 | | — | | 632,696,958 |
| Common Stocks | 160,294 | | — | | — | | 160,294 |
| Short-Term Investments | | | | | | | |
| Affiliated Investment Company | 10,062,379 | | — | | — | | 10,062,379 |
| Unaffiliated Investment Company | 3,978,300 | | — | | — | | 3,978,300 |
| Total Short-Term Investments | 14,040,679 | | — | | — | | 14,040,679 |
| Total Investments in Securities | 14,200,973 | | 632,696,958 | | — | | 646,897,931 |
| Other Financial Instruments (b) | | | | | | | |
| Futures Contracts | 5,475,461 | | — | | — | | 5,475,461 |
| Interest Rate Swaps | — | | 564,729 | | — | | 564,729 |
| Total Other Financial Instruments | 5,475,461 | | 564,729 | | — | | 6,040,190 |
| Total Investments in Securities and Other Financial Instruments | $ 19,676,434 | | $ 633,261,687 | | $ — | | $ 652,938,121 |
| Liability Valuation Inputs | | | | | | | |
| Other Financial Instruments | | | | | | | |
| Futures Contracts (b) | $ (4,589,701) | | $ — | | $ — | | $ (4,589,701) |
| (a) | For a complete listing of investments and their industries, see the Portfolio of Investments. |
| (b) | The value listed for these securities reflects unrealized appreciation (depreciation) as shown on the Portfolio of Investments. |
The notes to the financial statements are an integral part of, and should be read in conjunction with, the financial statements.
27
Statement of Assets and Liabilities as of October 31, 2022
| Assets |
Investment in unaffiliated securities, at value
(identified cost $730,195,558) including securities on loan of $4,719,550 | $ 636,835,552 |
Investment in affiliated investment companies, at value
(identified cost $10,062,379) | 10,062,379 |
| Cash | 61,152 |
Cash denominated in foreign currencies
(identified cost $497) | 438 |
| Cash collateral on deposit at broker for futures contracts | 1,046,103 |
| Cash collateral on deposit at broker for swap contracts | 136,995 |
| Receivables: | |
| Fund shares sold | 5,686,942 |
| Dividends and interest | 4,816,427 |
| Investment securities sold | 1,724,330 |
| Variation margin on futures contracts | 169,687 |
| Variation margin on centrally cleared swap contracts | 31,379 |
| Securities lending | 4,723 |
| Other assets | 32,508 |
| Total assets | 660,608,615 |
| Liabilities |
| Cash collateral received for securities on loan | 3,978,300 |
| Payables: | |
| Investment securities purchased | 2,939,947 |
| Fund shares redeemed | 1,681,221 |
| Manager (See Note 3) | 301,042 |
| Transfer agent (See Note 3) | 164,420 |
| Shareholder communication | 63,495 |
| NYLIFE Distributors (See Note 3) | 61,584 |
| Professional fees | 18,291 |
| Custodian | 13,225 |
| Accrued expenses | 6,545 |
| Distributions payable | 300,292 |
| Total liabilities | 9,528,362 |
| Net assets | $ 651,080,253 |
| Composition of Net Assets |
| Shares of beneficial interest outstanding (par value of $.01 per share) unlimited number of shares authorized | $ 819,569 |
| Additional paid-in-capital | 912,771,931 |
| | 913,591,500 |
| Total distributable earnings (loss) | (262,511,247) |
| Net assets | $ 651,080,253 |
| Class A | |
| Net assets applicable to outstanding shares | $178,507,538 |
| Shares of beneficial interest outstanding | 22,486,256 |
| Net asset value per share outstanding | $ 7.94 |
| Maximum sales charge (4.50% of offering price) | 0.37 |
| Maximum offering price per share outstanding | $ 8.31 |
| Investor Class | |
| Net assets applicable to outstanding shares | $ 13,795,223 |
| Shares of beneficial interest outstanding | 1,722,032 |
| Net asset value per share outstanding | $ 8.01 |
| Maximum sales charge (4.00% of offering price) | 0.33 |
| Maximum offering price per share outstanding | $ 8.34 |
| Class B | |
| Net assets applicable to outstanding shares | $ 1,326,825 |
| Shares of beneficial interest outstanding | 167,959 |
| Net asset value and offering price per share outstanding | $ 7.90 |
| Class C | |
| Net assets applicable to outstanding shares | $ 20,804,405 |
| Shares of beneficial interest outstanding | 2,635,779 |
| Net asset value and offering price per share outstanding | $ 7.89 |
| Class I | |
| Net assets applicable to outstanding shares | $433,814,230 |
| Shares of beneficial interest outstanding | 54,588,924 |
| Net asset value and offering price per share outstanding | $ 7.95 |
| Class R2 | |
| Net assets applicable to outstanding shares | $ 982,787 |
| Shares of beneficial interest outstanding | 123,752 |
| Net asset value and offering price per share outstanding | $ 7.94 |
| Class R3 | |
| Net assets applicable to outstanding shares | $ 500,682 |
| Shares of beneficial interest outstanding | 63,049 |
| Net asset value and offering price per share outstanding | $ 7.94 |
| Class R6 | |
| Net assets applicable to outstanding shares | $ 1,348,563 |
| Shares of beneficial interest outstanding | 169,149 |
| Net asset value and offering price per share outstanding | $ 7.97 |
The notes to the financial statements are an integral part of, and should be read in conjunction with, the financial statements.
| 28 | MainStay MacKay Strategic Bond Fund |
Statement of Operations for the year ended October 31, 2022
| Investment Income (Loss) |
| Income | |
| Interest | $ 26,116,613 |
| Dividends-affiliated | 120,582 |
| Securities lending, net | 75,694 |
| Dividends-unaffiliated | 1,598 |
| Total income | 26,314,487 |
| Expenses | |
| Manager (See Note 3) | 4,171,449 |
| Transfer agent (See Note 3) | 979,118 |
| Distribution/Service—Class A (See Note 3) | 470,267 |
| Distribution/Service—Investor Class (See Note 3) | 38,376 |
| Distribution/Service—Class B (See Note 3) | 22,675 |
| Distribution/Service—Class C (See Note 3) | 342,383 |
| Distribution/Service—Class R2 (See Note 3) | 2,561 |
| Distribution/Service—Class R3 (See Note 3) | 2,947 |
| Registration | 137,137 |
| Professional fees | 115,787 |
| Custodian | 59,079 |
| Shareholder communication | 58,292 |
| Trustees | 13,462 |
| Shareholder service (See Note 3) | 1,613 |
| Miscellaneous | 31,426 |
| Total expenses before waiver/reimbursement | 6,446,572 |
| Expense waiver/reimbursement from Manager (See Note 3) | (407,855) |
| Net expenses | 6,038,717 |
| Net investment income (loss) | 20,275,770 |
| Realized and Unrealized Gain (Loss) |
| Net realized gain (loss) on: | |
| Unaffiliated investment transactions | (7,712,885) |
| Futures transactions | 22,524,053 |
| Swap transactions | (1,255,466) |
| Foreign currency transactions | (18,722) |
| Foreign currency forward transactions | 107,896 |
| Net realized gain (loss) | 13,644,876 |
| Net change in unrealized appreciation (depreciation) on: | |
| Unaffiliated investments | (111,773,883) |
| Futures contracts | (2,480,945) |
| Swap contracts | 3,186,533 |
| Foreign currency forward contracts | (99,122) |
| Translation of other assets and liabilities in foreign currencies | (165) |
| Net change in unrealized appreciation (depreciation) | (111,167,582) |
| Net realized and unrealized gain (loss) | (97,522,706) |
| Net increase (decrease) in net assets resulting from operations | $ (77,246,936) |
The notes to the financial statements are an integral part of, and should be read in conjunction with, the financial statements.
29
Statements of Changes in Net Assets
for the years ended October 31, 2022 and October 31, 2021
| | 2022 | 2021 |
| Increase (Decrease) in Net Assets |
| Operations: | | |
| Net investment income (loss) | $ 20,275,770 | $ 17,093,965 |
| Net realized gain (loss) | 13,644,876 | 21,145,313 |
| Net change in unrealized appreciation (depreciation) | (111,167,582) | (993,238) |
| Net increase (decrease) in net assets resulting from operations | (77,246,936) | 37,246,040 |
| Distributions to shareholders: | | |
| Class A | (4,730,207) | (3,635,420) |
| Investor Class | (353,497) | (323,097) |
| Class B | (31,662) | (45,962) |
| Class C | (480,971) | (629,126) |
| Class I | (12,885,438) | (9,317,197) |
| Class R2 | (24,679) | (19,150) |
| Class R3 | (12,448) | (5,926) |
| Class R6 | (39,398) | (24,072) |
| | (18,558,300) | (13,999,950) |
| Distributions to shareholders from return of capital: | | |
| Class A | — | (221,004) |
| Investor Class | — | (19,642) |
| Class B | — | (2,794) |
| Class C | — | (38,246) |
| Class I | — | (566,411) |
| Class R2 | — | (1,164) |
| Class R3 | — | (360) |
| Class R6 | — | (1,463) |
| | — | (851,084) |
| Total distributions to shareholders | (18,558,300) | (14,851,034) |
| Capital share transactions: | | |
| Net proceeds from sales of shares | 301,260,901 | 165,058,912 |
| Net asset value of shares issued to shareholders in reinvestment of distributions | 16,426,709 | 13,300,032 |
| Cost of shares redeemed | (281,548,790) | (160,495,682) |
| Increase (decrease) in net assets derived from capital share transactions | 36,138,820 | 17,863,262 |
| Net increase (decrease) in net assets | (59,666,416) | 40,258,268 |
| Net Assets |
| Beginning of year | 710,746,669 | 670,488,401 |
| End of year | $ 651,080,253 | $ 710,746,669 |
The notes to the financial statements are an integral part of, and should be read in conjunction with, the financial statements.
| 30 | MainStay MacKay Strategic Bond Fund |
Financial Highlights selected per share data and ratios
| | Year Ended October 31, |
| Class A | 2022 | | 2021 | | 2020 | | 2019 | | 2018 |
| Net asset value at beginning of year | $ 9.10 | | $ 8.80 | | $ 8.74 | | $ 8.65 | | $ 8.90 |
| Net investment income (loss) (a) | 0.24 | | 0.22 | | 0.22 | | 0.23 | | 0.24 |
| Net realized and unrealized gain (loss) | (1.19) | | 0.27 | | 0.06 | | 0.11 | | (0.22) |
| Total from investment operations | (0.95) | | 0.49 | | 0.28 | | 0.34 | | 0.02 |
| Less distributions: | | | | | | | | | |
| From net investment income | (0.21) | | (0.18) | | (0.21) | | (0.25) | | (0.27) |
| Return of capital | — | | (0.01) | | (0.01) | | — | | (0.00)‡ |
| Total distributions | (0.21) | | (0.19) | | (0.22) | | (0.25) | | (0.27) |
| Net asset value at end of year | $ 7.94 | | $ 9.10 | | $ 8.80 | | $ 8.74 | | $ 8.65 |
| Total investment return (b) | (10.51)% | | 5.61% | | 3.27% | | 3.99% | | 0.25% |
| Ratios (to average net assets)/Supplemental Data: | | | | | | | | | |
| Net investment income (loss) | 2.75% | | 2.43% | | 2.60% | | 2.66% | | 2.69% |
| Net expenses (c) | 1.04% | | 1.07%(d) | | 1.18%(d) | | 1.27%(d) | | 1.25%(d) |
| Portfolio turnover rate | 86% | | 53% | | 56%(e) | | 50%(e) | | 22% |
| Net assets at end of year (in 000’s) | $ 178,508 | | $ 192,190 | | $ 175,682 | | $ 197,686 | | $ 220,618 |
| ‡ | Less than one cent per share. |
| (a) | Per share data based on average shares outstanding during the year. |
| (b) | Total investment return is calculated exclusive of sales charges and assumes the reinvestment of dividends and distributions. For periods of less than one year, total return is not annualized. |
| (c) | In addition to the fees and expenses which the Fund bears directly, it also indirectly bears a pro-rata share of the fees and expenses of the underlying funds in which it invests. Such indirect expenses are not included in the above expense ratios. |
| (d) | The expense ratios presented below show the impact of short sales expense: |
| Year Ended | | Net Expenses
(excluding short
sale expenses) | | Short Sales
Expenses |
| October 31, 2021 | | 1.04% | | 0.03% |
| October 31, 2020 | | 1.07% | | 0.11% |
| October 31, 2019 | | 1.07% | | 0.20% |
| October 31, 2018 | | 1.03% | | 0.22% |
| (e) | The portfolio turnover rate not including mortgage dollar rolls was 53% and 44% for the years ended October 31, 2020 and 2019, respectively. |
The notes to the financial statements are an integral part of, and should be read in conjunction with, the financial statements.
31
Financial Highlights selected per share data and ratios
| | Year Ended October 31, |
| Investor Class | 2022 | | 2021 | | 2020 | | 2019 | | 2018 |
| Net asset value at beginning of year | $ 9.18 | | $ 8.88 | | $ 8.81 | | $ 8.72 | | $ 8.97 |
| Net investment income (loss) (a) | 0.22 | | 0.21 | | 0.22 | | 0.23 | | 0.24 |
| Net realized and unrealized gain (loss) | (1.19) | | 0.27 | | 0.06 | | 0.11 | | (0.22) |
| Total from investment operations | (0.97) | | 0.48 | | 0.28 | | 0.34 | | 0.02 |
| Less distributions: | | | | | | | | | |
| From net investment income | (0.20) | | (0.17) | | (0.20) | | (0.25) | | (0.27) |
| Return of capital | — | | (0.01) | | (0.01) | | — | | (0.00)‡ |
| Total distributions | (0.20) | | (0.18) | | (0.21) | | (0.25) | | (0.27) |
| Net asset value at end of year | $ 8.01 | | $ 9.18 | | $ 8.88 | | $ 8.81 | | $ 8.72 |
| Total investment return (b) | (10.65)% | | 5.41% | | 3.29% | | 3.93% | | 0.23% |
| Ratios (to average net assets)/Supplemental Data: | | | | | | | | | |
| Net investment income (loss) | 2.59% | | 2.30% | | 2.54% | | 2.63% | | 2.68% |
| Net expenses (c) | 1.18% | | 1.20%(d) | | 1.24%(d) | | 1.29%(d) | | 1.27%(d) |
| Portfolio turnover rate | 86% | | 53% | | 56%(e) | | 50%(e) | | 22% |
| Net assets at end of year (in 000's) | $ 13,795 | | $ 16,874 | | $ 18,139 | | $ 19,748 | | $ 20,451 |
| ‡ | Less than one cent per share. |
| (a) | Per share data based on average shares outstanding during the year. |
| (b) | Total investment return is calculated exclusive of sales charges and assumes the reinvestment of dividends and distributions. For periods of less than one year, total return is not annualized. |
| (c) | In addition to the fees and expenses which the Fund bears directly, it also indirectly bears a pro-rata share of the fees and expenses of the underlying funds in which it invests. Such indirect expenses are not included in the above expense ratios. |
| (d) | The expense ratios presented below show the impact of short sales expense: |
| Year Ended | | Net Expenses
(excluding short
sale expenses) | | Short Sales
Expenses |
| October 31, 2021 | | 1.17% | | 0.03% |
| October 31, 2020 | | 1.13% | | 0.11% |
| October 31, 2019 | | 1.09% | | 0.20% |
| October 31, 2018 | | 1.05% | | 0.22% |
| (e) | The portfolio turnover rate not including mortgage dollar rolls was 53% and 44% for the years ended October 31, 2020 and 2019, respectively. |
The notes to the financial statements are an integral part of, and should be read in conjunction with, the financial statements.
| 32 | MainStay MacKay Strategic Bond Fund |
Financial Highlights selected per share data and ratios
| | Year Ended October 31, |
| Class B | 2022 | | 2021 | | 2020 | | 2019 | | 2018 |
| Net asset value at beginning of year | $ 9.06 | | $ 8.76 | | $ 8.70 | | $ 8.61 | | $ 8.86 |
| Net investment income (loss) (a) | 0.15 | | 0.14 | | 0.15 | | 0.16 | | 0.17 |
| Net realized and unrealized gain (loss) | (1.17) | | 0.27 | | 0.06 | | 0.11 | | (0.22) |
| Total from investment operations | (1.02) | | 0.41 | | 0.21 | | 0.27 | | (0.05) |
| Less distributions: | | | | | | | | | |
| From net investment income | (0.14) | | (0.10) | | (0.15) | | (0.18) | | (0.20) |
| Return of capital | — | | (0.01) | | (0.00)‡ | | — | | (0.00)‡ |
| Total distributions | (0.14) | | (0.11) | | (0.15) | | (0.18) | | (0.20) |
| Net asset value at end of year | $ 7.90 | | $ 9.06 | | $ 8.76 | | $ 8.70 | | $ 8.61 |
| Total investment return (b) | (11.27)% | | 4.57% | | 2.44% | | 3.20% | | (0.52)% |
| Ratios (to average net assets)/Supplemental Data: | | | | | | | | | |
| Net investment income (loss) | 1.74% | | 1.55% | | 1.77% | | 1.90% | | 1.92% |
| Net expenses (c) | 1.93% | | 1.95%(d) | | 2.00%(d) | | 2.04%(d) | | 2.02%(d) |
| Portfolio turnover rate | 86% | | 53% | | 56%(e) | | 50%(e) | | 22% |
| Net assets at end of year (in 000’s) | $ 1,327 | | $ 3,191 | | $ 4,872 | | $ 7,970 | | $ 11,015 |
| ‡ | Less than one cent per share. |
| (a) | Per share data based on average shares outstanding during the year. |
| (b) | Total investment return is calculated exclusive of sales charges and assumes the reinvestment of dividends and distributions. For periods of less than one year, total return is not annualized. |
| (c) | In addition to the fees and expenses which the Fund bears directly, it also indirectly bears a pro-rata share of the fees and expenses of the underlying funds in which it invests. Such indirect expenses are not included in the above expense ratios. |
| (d) | The expense ratios presented below show the impact of short sales expense: |
| Year Ended | | Net Expenses
(excluding short
sale expenses) | | Short Sales
Expenses |
| October 31, 2021 | | 1.92% | | 0.03% |
| October 31, 2020 | | 1.89% | | 0.11% |
| October 31, 2019 | | 1.84% | | 0.20% |
| October 31, 2018 | | 1.80% | | 0.22% |
| (e) | The portfolio turnover rate not including mortgage dollar rolls was 53% and 44% for the years ended October 31, 2020 and 2019, respectively. |
The notes to the financial statements are an integral part of, and should be read in conjunction with, the financial statements.
33
Financial Highlights selected per share data and ratios
| | Year Ended October 31, |
| Class C | 2022 | | 2021 | | 2020 | | 2019 | | 2018 |
| Net asset value at beginning of year | $ 9.05 | | $ 8.75 | | $ 8.69 | | $ 8.60 | | $ 8.85 |
| Net investment income (loss) (a) | 0.15 | | 0.14 | | 0.15 | | 0.16 | | 0.17 |
| Net realized and unrealized gain (loss) | (1.17) | | 0.27 | | 0.06 | | 0.11 | | (0.22) |
| Total from investment operations | (1.02) | | 0.41 | | 0.21 | | 0.27 | | (0.05) |
| Less distributions: | | | | | | | | | |
| From net investment income | (0.14) | | (0.10) | | (0.15) | | (0.18) | | (0.20) |
| Return of capital | — | | (0.01) | | (0.00)‡ | | — | | (0.00)‡ |
| Total distributions | (0.14) | | (0.11) | | (0.15) | | (0.18) | | (0.20) |
| Net asset value at end of year | $ 7.89 | | $ 9.05 | | $ 8.75 | | $ 8.69 | | $ 8.60 |
| Total investment return (b) | (11.38)% | | 4.69% | | 2.45% | | 3.21% | | (0.52)% |
| Ratios (to average net assets)/Supplemental Data: | | | | | | | | | |
| Net investment income (loss) | 1.75% | | 1.55% | | 1.78% | | 1.90% | | 1.92% |
| Net expenses (c) | 1.93% | | 1.95%(d) | | 2.00%(d) | | 2.04%(d) | | 2.02%(d) |
| Portfolio turnover rate | 86% | | 53% | | 56%(e) | | 50%(e) | | 22% |
| Net assets at end of year (in 000’s) | $ 20,804 | | $ 46,537 | | $ 65,158 | | $ 91,598 | | $ 128,279 |
| ‡ | Less than one cent per share. |
| (a) | Per share data based on average shares outstanding during the year. |
| (b) | Total investment return is calculated exclusive of sales charges and assumes the reinvestment of dividends and distributions. For periods of less than one year, total return is not annualized. |
| (c) | In addition to the fees and expenses which the Fund bears directly, it also indirectly bears a pro-rata share of the fees and expenses of the underlying funds in which it invests. Such indirect expenses are not included in the above expense ratios. |
| (d) | The expense ratios presented below show the impact of short sales expense: |
| Year Ended | | Net Expenses
(excluding short
sale expenses) | | Short Sales
Expenses |
| October 31, 2021 | | 1.92% | | 0.03% |
| October 31, 2020 | | 1.89% | | 0.11% |
| October 31, 2019 | | 1.84% | | 0.20% |
| October 31, 2018 | | 1.80% | | 0.22% |
| (e) | The portfolio turnover rate not including mortgage dollar rolls was 53% and 44% for the years ended October 31, 2020 and 2019, respectively. |
The notes to the financial statements are an integral part of, and should be read in conjunction with, the financial statements.
| 34 | MainStay MacKay Strategic Bond Fund |
Financial Highlights selected per share data and ratios
| | Year Ended October 31, |
| Class I | 2022 | | 2021 | | 2020 | | 2019 | | 2018 |
| Net asset value at beginning of year | $ 9.11 | | $ 8.81 | | $ 8.75 | | $ 8.66 | | $ 8.91 |
| Net investment income (loss) (a) | 0.27 | | 0.25 | | 0.24 | | 0.25 | | 0.26 |
| Net realized and unrealized gain (loss) | (1.19) | | 0.27 | | 0.06 | | 0.11 | | (0.22) |
| Total from investment operations | (0.92) | | 0.52 | | 0.30 | | 0.36 | | 0.04 |
| Less distributions: | | | | | | | | | |
| From net investment income | (0.24) | | (0.21) | | (0.23) | | (0.27) | | (0.29) |
| Return of capital | — | | (0.01) | | (0.01) | | — | | (0.00)‡ |
| Total distributions | (0.24) | | (0.22) | | (0.24) | | (0.27) | | (0.29) |
| Net asset value at end of year | $ 7.95 | | $ 9.11 | | $ 8.81 | | $ 8.75 | | $ 8.66 |
| Total investment return (b) | (10.19)% | | 5.88% | | 3.53% | | 4.24% | | 0.51% |
| Ratios (to average net assets)/Supplemental Data: | | | | | | | | | |
| Net investment income (loss) | 3.09% | | 2.70% | | 2.83% | | 2.91% | | 2.94% |
| Net expenses (c) | 0.70% | | 0.79%(d) | | 0.94%(d) | | 1.02%(d) | | 1.00%(d) |
| Expenses (before waiver/reimbursement) (c) | 0.79% | | 0.82% | | 0.94% | | 1.02% | | 1.00% |
| Portfolio turnover rate | 86% | | 53% | | 56%(e) | | 50%(e) | | 22% |
| Net assets at end of year (in 000’s) | $ 433,814 | | $ 448,881 | | $ 404,964 | | $ 604,981 | | $ 717,129 |
| ‡ | Less than one cent per share. |
| (a) | Per share data based on average shares outstanding during the year. |
| (b) | Total investment return is calculated exclusive of sales charges and assumes the reinvestment of dividends and distributions. Class I shares are not subject to sales charges. For periods of less than one year, total return is not annualized. |
| (c) | In addition to the fees and expenses which the Fund bears directly, it also indirectly bears a pro-rata share of the fees and expenses of the underlying funds in which it invests. Such indirect expenses are not included in the above expense ratios. |
| (d) | The expense ratios presented below show the impact of short sales expense: |
| Year Ended | | Net Expenses
(excluding short
sale expenses) | | Short Sales
Expenses |
| October 31, 2021 | | 0.76% | | 0.03% |
| October 31, 2020 | | 0.83% | | 0.11% |
| October 31, 2019 | | 0.82% | | 0.20% |
| October 31, 2018 | | 0.78% | | 0.22% |
| (e) | The portfolio turnover rate not including mortgage dollar rolls was 53% and 44% for the years ended October 31, 2020 and 2019, respectively. |
The notes to the financial statements are an integral part of, and should be read in conjunction with, the financial statements.
35
Financial Highlights selected per share data and ratios
| | Year Ended October 31, |
| Class R2 | 2022 | | 2021 | | 2020 | | 2019 | | 2018 |
| Net asset value at beginning of year | $ 9.11 | | $ 8.81 | | $ 8.74 | | $ 8.65 | | $ 8.90 |
| Net investment income (loss) (a) | 0.23 | | 0.21 | | 0.21 | | 0.22 | | 0.23 |
| Net realized and unrealized gain (loss) | (1.19) | | 0.27 | | 0.07 | | 0.11 | | (0.22) |
| Total from investment operations | (0.96) | | 0.48 | | 0.28 | | 0.33 | | 0.01 |
| Less distributions: | | | | | | | | | |
| From net investment income | (0.21) | | (0.17) | | (0.20) | | (0.24) | | (0.26) |
| Return of capital | — | | (0.01) | | (0.01) | | — | | (0.00)‡ |
| Total distributions | (0.21) | | (0.18) | | (0.21) | | (0.24) | | (0.26) |
| Net asset value at end of year | $ 7.94 | | $ 9.11 | | $ 8.81 | | $ 8.74 | | $ 8.65 |
| Total investment return (b) | (10.69)% | | 5.49% | | 3.27% | | 3.89% | | 0.16% |
| Ratios (to average net assets)/Supplemental Data: | | | | | | | | | |
| Net investment income (loss) | 2.64% | | 2.33% | | 2.49% | | 2.54% | | 2.67% |
| Net expenses (c) | 1.14% | | 1.17%(d) | | 1.29%(d) | | 1.37%(d) | | 1.34%(d) |
| Portfolio turnover rate | 86% | | 53% | | 56%(e) | | 50%(e) | | 22% |
| Net assets at end of year (in 000’s) | $ 983 | | $ 1,047 | | $ 934 | | $ 7,232 | | $ 6,657 |
| ‡ | Less than one cent per share. |
| (a) | Per share data based on average shares outstanding during the year. |
| (b) | Total investment return is calculated exclusive of sales charges and assumes the reinvestment of dividends and distributions. Class R2 shares are not subject to sales charges. For periods of less than one year, total return is not annualized. |
| (c) | In addition to the fees and expenses which the Fund bears directly, it also indirectly bears a pro-rata share of the fees and expenses of the underlying funds in which it invests. Such indirect expenses are not included in the above expense ratios. |
| (d) | The expense ratios presented below show the impact of short sales expense: |
| Year Ended | | Net Expenses
(excluding short
sale expenses) | | Short Sales
Expenses |
| October 31, 2021 | | 1.14% | | 0.03% |
| October 31, 2020 | | 1.18% | | 0.11% |
| October 31, 2019 | | 1.17% | | 0.20% |
| October 31, 2018 | | 1.14% | | 0.20% |
| (e) | The portfolio turnover rate not including mortgage dollar rolls was 53% and 44% for the years ended October 31, 2020 and 2019, respectively. |
The notes to the financial statements are an integral part of, and should be read in conjunction with, the financial statements.
| 36 | MainStay MacKay Strategic Bond Fund |
Financial Highlights selected per share data and ratios
| | Year Ended October 31, |
| Class R3 | 2022 | | 2021 | | 2020 | | 2019 | | 2018 |
| Net asset value at beginning of year | $ 9.10 | | $ 8.80 | | $ 8.74 | | $ 8.65 | | $ 8.90 |
| Net investment income (loss) (a) | 0.20 | | 0.19 | | 0.20 | | 0.20 | | 0.21 |
| Net realized and unrealized gain (loss) | (1.18) | | 0.27 | | 0.05 | | 0.11 | | (0.22) |
| Total from investment operations | (0.98) | | 0.46 | | 0.25 | | 0.31 | | (0.01) |
| Less distributions: | | | | | | | | | |
| From net investment income | (0.18) | | (0.15) | | (0.18) | | (0.22) | | (0.24) |
| Return of capital | — | | (0.01) | | (0.01) | | — | | (0.00)‡ |
| Total distributions | (0.18) | | (0.16) | | (0.19) | | (0.22) | | (0.24) |
| Net asset value at end of year | $ 7.94 | | $ 9.10 | | $ 8.80 | | $ 8.74 | | $ 8.65 |
| Total investment return (b) | (10.83)% | | 5.21% | | 2.90% | | 3.63% | | (0.09)% |
| Ratios (to average net assets)/Supplemental Data: | | | | | | | | | |
| Net investment income (loss) | 2.38% | | 2.05% | | 2.27% | | 2.29% | | 2.36% |
| Net expenses (c) | 1.39% | | 1.42%(d) | | 1.52%(d) | | 1.62%(d) | | 1.60%(d) |
| Portfolio turnover rate | 86% | | 53% | | 56%(e) | | 50%(e) | | 22% |
| Net assets at end of year (in 000’s) | $ 501 | | $ 619 | | $ 276 | | $ 218 | | $ 190 |
| ‡ | Less than one cent per share. |
| (a) | Per share data based on average shares outstanding during the year. |
| (b) | Total investment return is calculated exclusive of sales charges and assumes the reinvestment of dividends and distributions. Class R3 shares are not subject to sales charges. For periods of less than one year, total return is not annualized. |
| (c) | In addition to the fees and expenses which the Fund bears directly, it also indirectly bears a pro-rata share of the fees and expenses of the underlying funds in which it invests. Such indirect expenses are not included in the above expense ratios. |
| (d) | The expense ratios presented below show the impact of short sales expense: |
| Year Ended | | Net Expenses
(excluding short
sale expenses) | | Short Sales
Expenses |
| October 31, 2021 | | 1.39% | | 0.03% |
| October 31, 2020 | | 1.41% | | 0.11% |
| October 31, 2019 | | 1.42% | | 0.20% |
| October 31, 2018 | | 1.38% | | 0.22% |
| (e) | The portfolio turnover rate not including mortgage dollar rolls was 53% and 44% for the years ended October 31, 2020 and 2019, respectively. |
The notes to the financial statements are an integral part of, and should be read in conjunction with, the financial statements.
37
Financial Highlights selected per share data and ratios
| | Year Ended October 31, | | February 28, 2018^ through
October 31,
2018 |
| Class R6 | 2022 | | 2021 | | 2020 | | 2019 | |
| Net asset value at beginning of period | $ 9.14 | | $ 8.84 | | $ 8.75 | | $ 8.66 | | $ 8.83 |
| Net investment income (loss) (a) | 0.27 | | 0.26 | | 0.25 | | 0.27 | | 0.19 |
| Net realized and unrealized gain (loss) | (1.19) | | 0.26 | | 0.09 | | 0.11 | | (0.14) |
| Total from investment operations | (0.92) | | 0.52 | | 0.34 | | 0.38 | | 0.05 |
| Less distributions: | | | | | | | | | |
| From net investment income | (0.25) | | (0.21) | | (0.24) | | (0.29) | | (0.22) |
| Return of capital | — | | (0.01) | | (0.01) | | — | | (0.00)‡ |
| Total distributions | (0.25) | | (0.22) | | (0.25) | | (0.29) | | (0.22) |
| Net asset value at end of period | $ 7.97 | | $ 9.14 | | $ 8.84 | | $ 8.75 | | $ 8.66 |
| Total investment return (b) | (10.23)% | | 5.97% | | 4.04% | | 4.43% | | 0.54% |
| Ratios (to average net assets)/Supplemental Data: | | | | | | | | | |
| Net investment income (loss) | 3.14% | | 2.83% | | 2.88% | | 3.13% | | 3.18%†† |
| Net expenses (c) | 0.66% | | 0.69%(d) | | 0.82%(d) | | 0.84%(d) | | 0.85%††(d) |
| Portfolio turnover rate | 86% | | 53% | | 56%(e) | | 50%(e) | | 22% |
| Net assets at end of period (in 000’s) | $ 1,349 | | $ 1,407 | | $ 465 | | $ 22,632 | | $ 52,504 |
| ^ | Inception date. |
| ‡ | Less than one cent per share. |
| †† | Annualized. |
| (a) | Per share data based on average shares outstanding during the period. |
| (b) | Total investment return is calculated exclusive of sales charges and assumes the reinvestment of dividends and distributions. Class R6 shares are not subject to sales charges. For periods of less than one year, total return is not annualized. |
| (c) | In addition to the fees and expenses which the Fund bears directly, it also indirectly bears a pro-rata share of the fees and expenses of the underlying funds in which it invests. Such indirect expenses are not included in the above expense ratios. |
| (d) | The expense ratios presented below show the impact of short sales expense: |
| Period Ended | | Net Expenses
(excluding short
sale expenses) | | Short Sales
Expenses |
| October 31, 2021 | | 0.67% | | 0.02% |
| October 31, 2020 | | 0.66% | | 0.16% |
| October 31, 2019 | | 0.64% | | 0.20% |
| October 31, 2018 | | 0.62% | | 0.23% |
| (e) | The portfolio turnover rate not including mortgage dollar rolls was 53% and 44% for the years ended October 31, 2020 and 2019, respectively. |
The notes to the financial statements are an integral part of, and should be read in conjunction with, the financial statements.
| 38 | MainStay MacKay Strategic Bond Fund |
Notes to Financial Statements
Note 1-Organization and Business
The MainStay Funds (the “Trust”) was organized on January 9, 1986, as a Massachusetts business trust. The Trust is registered under the Investment Company Act of 1940, as amended (the “1940 Act”), as an open-end management investment company, and is comprised of twelve funds (collectively referred to as the "Funds"). These financial statements and notes relate to the MainStay MacKay Strategic Bond Fund (the "Fund"), a “diversified” fund, as that term is defined in the 1940 Act, as interpreted or modified by regulatory authorities having jurisdiction, from time to time.
The following table lists the Fund's share classes that have been registered and commenced operations:
| Class | Commenced Operations |
| Class A | February 28, 1997 |
| Investor Class | February 28, 2008 |
| Class B | February 28, 1997 |
| Class C | September 1, 1998 |
| Class I | January 2, 2004 |
| Class R2 | February 28, 2014 |
| Class R3 | February 29, 2016 |
| Class R6 | February 28, 2018 |
| SIMPLE Class | N/A* |
| * | SIMPLE Class shares were registered for sale effective as of August 31, 2020 but have not yet commenced operations. |
Class B shares of the MainStay Group of Funds are closed to all new purchases as well as additional investments by existing Class B shareholders. Existing Class B shareholders may continue to reinvest dividends and capital gains distributions, as well as exchange their Class B shares for Class B shares of other funds in the MainStay Group of Funds as permitted by the current exchange privileges. Class B shareholders continue to be subject to any applicable contingent deferred sales charge ("CDSC") at the time of redemption. All other features of the Class B shares, including but not limited to the fees and expenses applicable to Class B shares, remain unchanged. Unless redeemed, Class B shareholders will remain in Class B shares of their respective fund until the Class B shares are converted to Class A or Investor Class shares pursuant to the applicable conversion schedule.
Class A and Investor Class shares are offered at net asset value (“NAV”) per share plus an initial sales charge. No initial sales charge applies to investments of $1 million or more (and certain other qualified purchases) in Class A and Investor Class shares. However, a CDSC of 1.00% may be imposed on certain redemptions made within 18 months of the date of purchase on shares that were purchased without an initial sales charge. Class C shares are offered at NAV without an initial sales charge, although a 1.00% CDSC may be imposed on certain redemptions of such shares made within one year of the date of purchase of Class C shares. When Class B shares were offered, they were offered at NAV without an initial sales charge, although a CDSC that declines depending on the number of years a shareholder held its Class B shares may be imposed
on certain redemptions of such shares made within six years of the date of purchase of such shares. Class I, Class R2, Class R3 and Class R6 shares are offered at NAV without a sales charge. SIMPLE Class shares are expected to be offered at NAV without a sales charge if such shares are offered in the future. Depending upon eligibility, Class B shares convert to either Class A or Investor Class shares at the end of the calendar quarter eight years after the date they were purchased. In addition, depending upon eligibility, Class C shares convert to either Class A or Investor Class shares at the end of the calendar quarter eight years after the date they were purchased. Additionally, Investor Class shares may convert automatically to Class A shares. Under certain circumstances and as may be permitted by the Trust’s multiple class plan pursuant to Rule 18f-3 under the 1940 Act, specified share classes of the Fund may be converted to one or more other share classes of the Fund as disclosed in the capital share transactions within these Notes. The classes of shares have the same voting (except for issues that relate solely to one class), dividend, liquidation and other rights, and the same terms and conditions, except that under distribution plans pursuant to Rule 12b-1 under the 1940 Act, Class B and Class C shares are subject to higher distribution and/or service fees than Class A, Investor Class, Class R2 and SIMPLE Class shares. Class I and Class R6 shares are not subject to a distribution and/or service fee. Class R2 and Class R3 shares are subject to a shareholder service fee. This is in addition to any fees paid under a distribution plan, where applicable.
The Fund's investment objective is to seek total return by investing primarily in domestic and foreign debt securities.
Note 2–Significant Accounting Policies
The Fund is an investment company and accordingly follows the investment company accounting and reporting guidance of the Financial Accounting Standards Board (“FASB”) Accounting Standards Codification Topic 946 Financial Services—Investment Companies. The Fund prepares its financial statements in accordance with generally accepted accounting principles (“GAAP”) in the United States of America and follows the significant accounting policies described below.
(A) Securities Valuation. Investments are usually valued as of the close of regular trading on the New York Stock Exchange (the "Exchange") (usually 4:00 p.m. Eastern time) on each day the Fund is open for business ("valuation date").
Effective September 8, 2022, and pursuant to Rule 2a-5 under the 1940 Act, the Board of Trustees of the Trust (the "Board") designated New York Life Investment Management LLC (“New York Life Investments” or the "Manager") as its Valuation Designee (the "Valuation Designee"). The Valuation Designee is responsible for performing fair valuations relating to all investments in the Fund’s portfolio for which market quotations are not readily available; periodically assessing and managing material valuation risks; establishing and applying fair value methodologies; testing fair valuation methodologies; evaluating and overseeing pricing services; segregation of valuation and portfolio management functions; providing quarterly, annual and prompt reporting to the Board, as appropriate;
Notes to Financial Statements (continued)
identifying potential conflicts of interest; and maintaining appropriate records. The Valuation Designee has established a valuation committee ("Valuation Committee") to assist in carrying out the Valuation Designee’s responsibilities and establish prices of securities for which market quotations are not readily available. The Fund’s and the Valuation Designee's policies and procedures ("Valuation Procedures") govern the Valuation Designee’s selection and application of methodologies for determining and calculating the fair value of Fund investments. The Valuation Designee may value Fund portfolio securities for which market quotations are not readily available and other Fund assets utilizing inputs from pricing services and other third-party sources (together, “Pricing Sources”). The Valuation Committee meets (in person, via electronic mail or via teleconference) on an ad-hoc basis to determine fair valuations and on a quarterly basis to review fair value events (excluding fair valuations from pricing services), including valuation risks and back-testing results, and preview reports to the Board.
The Valuation Committee establishes prices of securities for which market quotations are not readily available based on such methodologies and measurements on a regular basis after considering information that is reasonably available and deemed relevant by the Valuation Committee. The Board shall oversee the Valuation Designee and review fair valuation materials on a prompt, quarterly and annual basis and approve proposed revisions to the Valuation Procedures.
Investments for which market quotations are not readily available are valued at fair value as determined in good faith pursuant to the Valuation Procedures. A market quotation is readily available only when that quotation is a quoted price (unadjusted) in active markets for identical investments that the Fund can access at the measurement date, provided that a quotation will not be readily available if it is not reliable. Fair value measurements are determined within a framework that establishes a three-tier hierarchy that maximizes the use of observable market data and minimizes the use of unobservable inputs to establish a classification of fair value measurements for disclosure purposes. "Inputs" refer broadly to the assumptions that market participants would use in pricing the asset or liability, including assumptions about risk, such as the risk inherent in a particular valuation technique used to measure fair value using a pricing model and/or the risk inherent in the inputs for the valuation technique. Inputs may be observable or unobservable. Observable inputs reflect the assumptions market participants would use in pricing the asset or liability based on market data obtained from sources independent of the Fund. Unobservable inputs reflect the Fund’s own assumptions about the assumptions market participants would use in pricing the asset or liability based on the information available. The inputs or methodology used for valuing assets or liabilities may not be an indication of the risks associated with investing in those assets or liabilities. The three-tier hierarchy of inputs is summarized below.
| • | Level 1—quoted prices (unadjusted) in active markets for an identical asset or liability |
| • | Level 2—other significant observable inputs (including quoted prices for a similar asset or liability in active markets, interest rates and yield curves, prepayment speeds, credit risk, etc.) |
| • | Level 3—significant unobservable inputs (including the Fund's own assumptions about the assumptions that market participants would use in measuring fair value of an asset or liability) |
The level of an asset or liability within the fair value hierarchy is based on the lowest level of an input, both individually and in the aggregate, that is significant to the fair value measurement. The aggregate value by input level of the Fund’s assets and liabilities as of October 31, 2022, is included at the end of the Portfolio of Investments.
The Fund may use third-party vendor evaluations, whose prices may be derived from one or more of the following standard inputs, among others:
| • Benchmark yields | • Reported trades |
| • Broker/dealer quotes | • Issuer spreads |
| • Two-sided markets | • Benchmark securities |
| • Bids/offers | • Reference data (corporate actions or material event notices) |
| • Industry and economic events | • Comparable bonds |
| • Monthly payment information | |
An asset or liability for which a market quotation is not readily available is valued by methods deemed reasonable in good faith by the Valuation Committee, following the Valuation Procedures to represent fair value. Under these procedures, the Valuation Designee generally uses a market-based approach which may use related or comparable assets or liabilities, recent transactions, market multiples, book values and other relevant information. The Valuation Designee may also use an income-based valuation approach in which the anticipated future cash flows of the asset or liability are discounted to calculate fair value. Discounts may also be applied due to the nature and/or duration of any restrictions on the disposition of the asset or liability. Fair value represents a good faith approximation of the value of a security. Fair value determinations involve the consideration of a number of subjective factors, an analysis of applicable facts and circumstances and the exercise of judgment. As a result, it is possible that the fair value for a security determined in good faith in accordance with the Valuation Procedures may differ from valuations for the same security determined for other funds using their own valuation procedures. Although the Valuation Procedures are designed to value a security at the price the Fund may reasonably expect to receive upon the security's sale in an orderly transaction, there can be no assurance that any fair value determination thereunder would, in fact, approximate the amount that the Fund would actually realize upon the sale of the security or the price at which the security would trade if a reliable market price were readily available. During the year ended October 31, 2022, there were no material changes to the fair value methodologies.
Securities which may be valued in this manner include, but are not limited to: (i) a security for which trading has been halted or suspended or
| 40 | MainStay MacKay Strategic Bond Fund |
otherwise does not have a readily available market quotation on a given day; (ii) a debt security that has recently gone into default and for which there is not a current market quotation; (iii) a security of an issuer that has entered into a restructuring; (iv) a security that has been delisted from a national exchange; (v) a security subject to trading collars for which no or limited trading takes place; and (vi) a security whose principal market has been temporarily closed at a time when, under normal conditions, it would be open. Securities valued in this manner are generally categorized as Level 2 or 3 in the hierarchy.
Equity securities are valued at the last quoted sales prices as of the close of regular trading on the relevant exchange on each valuation date. Securities that are not traded on the valuation date are valued at the mean of the last quoted bid and ask prices. Prices are normally taken from the principal market in which each security trades. These securities are generally categorized as Level 1 in the hierarchy.
Investments in mutual funds, including money market funds, are valued at their respective NAVs at the close of business each day on the valuation date. These securities are generally categorized as Level 1 in the hierarchy.
Futures contracts are valued at the last posted settlement price on the market where such futures are primarily traded. These securities are generally categorized as Level 1 in the hierarchy.
Swaps are marked to market daily based upon quotations from pricing agents, brokers or market makers. These securities are generally categorized as Level 2 in the hierarchy.
Debt securities (other than convertible and municipal bonds) are valued at the evaluated bid prices (evaluated mean prices in the case of convertible and municipal bonds) supplied by a pricing agent or broker selected by the Valuation Designee, in consultation with the Subadvisor. The evaluations are market-based measurements processed through a pricing application and represents the pricing agent’s good faith determination as to what a holder may receive in an orderly transaction under market conditions. The rules-based logic utilizes valuation techniques that reflect participants’ assumptions and vary by asset class and per methodology, maximizing the use of relevant observable data including quoted prices for similar assets, benchmark yield curves and market corroborated inputs. The evaluated bid or mean prices are deemed by the Valuation Designee, in consultation with the Subadvisor, to be representative of market values at the regular close of trading of the Exchange on each valuation date. Debt securities purchased on a delayed delivery basis are marked to market daily until settlement at the forward settlement date. Debt securities, including corporate bonds, U.S. government and federal agency bonds, municipal bonds, foreign bonds, convertible bonds, asset-backed securities and mortgage-backed securities are generally categorized as Level 2 in the hierarchy.
Loan assignments, participations and commitments are valued at the average of bid quotations obtained from the engaged independent pricing service and are generally categorized as Level 2 in the hierarchy. Certain loan assignments, participations and commitments may be valued by
utilizing significant unobservable inputs obtained from the pricing service and are generally categorized as Level 3 in the hierarchy. No securities held by the Fund as of October 31, 2022 were fair valued utilizing significant unobservable inputs obtained from the pricing service.
Temporary cash investments acquired in excess of 60 days to maturity at the time of purchase are valued using the latest bid prices or using valuations based on a matrix system (which considers such factors as security prices, yields, maturities and ratings), both as furnished by independent pricing services. Temporary cash investments that mature in 60 days or less at the time of purchase ("Short-Term Investments") are valued using the amortized cost method of valuation, unless the use of such method would be inappropriate. The amortized cost method involves valuing a security at its cost on the date of purchase and thereafter assuming a constant amortization to maturity of the difference between such cost and the value on maturity date. Amortized cost approximates the current fair value of a security. Securities valued using the amortized cost method are not valued using quoted prices in an active market and are generally categorized as Level 2 in the hierarchy.
The information above is not intended to reflect an exhaustive list of the methodologies that may be used to value portfolio investments. The Valuation Procedures permit the use of a variety of valuation methodologies in connection with valuing portfolio investments. The methodology used for a specific type of investment may vary based on the market data available or other considerations. The methodologies summarized above may not represent the specific means by which portfolio investments are valued on any particular business day.
A portfolio investment may be classified as an illiquid investment under the Fund's written liquidity risk management program and related procedures (“Liquidity Program”). Illiquidity of an investment might prevent the sale of such investment at a time when the Manager or the Subadvisor might wish to sell, and these investments could have the effect of decreasing the overall level of the Fund's liquidity. Further, the lack of an established secondary market may make it more difficult to value illiquid investments, requiring the Fund to rely on judgments that may be somewhat subjective in measuring value, which could vary materially from the amount that the Fund could realize upon disposition. Difficulty in selling illiquid investments may result in a loss or may be costly to the Fund. An illiquid investment is any investment that the Manager or Subadvisor reasonably expects cannot be sold or disposed of in current market conditions in seven calendar days or less without the sale or disposition significantly changing the market value of the investment. The liquidity classification of each investment will be made using information obtained after reasonable inquiry and taking into account, among other things, relevant market, trading and investment-specific considerations in accordance with the Liquidity Program. Illiquid investments are often fair valued in accordance with the Fund's procedures described above. The liquidity of the Fund's investments was determined as of October 31, 2022, and can change at any time. Illiquid investments as of October 31, 2022, are shown in the Portfolio of Investments.
Notes to Financial Statements (continued)
(B) Income Taxes. The Fund's policy is to comply with the requirements of the Internal Revenue Code of 1986, as amended (the “Internal Revenue Code”), applicable to regulated investment companies and to distribute all of its taxable income to the shareholders of the Fund within the allowable time limits.
The Manager evaluates the Fund’s tax positions to determine if the tax positions taken meet the minimum recognition threshold in connection with accounting for uncertainties in income tax positions taken or expected to be taken for the purposes of measuring and recognizing tax liabilities in the financial statements. Recognition of tax benefits of an uncertain tax position is permitted only to the extent the position is “more likely than not” to be sustained assuming examination by taxing authorities. The Manager analyzed the Fund's tax positions taken on federal, state and local income tax returns for all open tax years (for up to three tax years) and has concluded that no provisions for federal, state and local income tax are required in the Fund's financial statements. The Fund's federal, state and local income tax and federal excise tax returns for tax years for which the applicable statutes of limitations have not expired are subject to examination by the Internal Revenue Service and state and local departments of revenue.
(C) Dividends and Distributions to Shareholders. Dividends and distributions are recorded on the ex-dividend date. The Fund intends to declare and pay dividends from net investment income, if any, at least monthly and distributions from net realized capital and currency gains, if any, at least annually. Unless a shareholder elects otherwise, all dividends and distributions are reinvested at NAV in the same class of shares of the Fund. Dividends and distributions to shareholders are determined in accordance with federal income tax regulations and may differ from determinations using GAAP.
(D) Security Transactions and Investment Income. The Fund records security transactions on the trade date. Realized gains and losses on security transactions are determined using the identified cost method. Dividend income is recognized on the ex-dividend date, net of any foreign tax withheld at the source, and interest income is accrued as earned using the effective interest rate method and includes any realized gains and losses from repayments of principal on mortgage-backed securities. Distributions received from real estate investment trusts may be classified as dividends, capital gains and/or return of capital. Discounts and premiums on securities purchased for the Fund are accreted and amortized, respectively, on the effective interest rate method.
Investment income and realized and unrealized gains and losses on investments of the Fund are allocated pro rata to the separate classes of shares based upon their relative net assets on the date the income is earned or realized and unrealized gains and losses are incurred.
The Fund may place a debt security on non-accrual status and reduce related interest income by ceasing current accruals and writing off all or a portion of any interest receivables when the collection of all or a portion of such interest has become doubtful. A debt security is removed from
non-accrual status when the issuer resumes interest payments or when collectability of interest is reasonably assured.
(E) Expenses. Expenses of the Trust are allocated to the individual Funds in proportion to the net assets of the respective Funds when the expenses are incurred, except where direct allocations of expenses can be made. Expenses (other than transfer agent expenses and fees incurred under the shareholder services plans and/or the distribution plans further discussed in Note 3(B)) are allocated to separate classes of shares pro rata based upon their relative net assets on the date the expenses are incurred. The expenses borne by the Fund, including those of related parties to the Fund, are shown in the Statement of Operations.
Additionally, the Fund may invest in mutual funds, which are subject to management fees and other fees that may cause the costs of investing in mutual funds to be greater than the costs of owning the underlying securities directly. These indirect expenses of mutual funds are not included in the amounts shown as expenses in the Statement of Operations or in the expense ratios included in the Financial Highlights.
(F) Use of Estimates. In preparing financial statements in conformity with GAAP, the Manager makes estimates and assumptions that affect the reported amounts and disclosures in the financial statements. Actual results could differ from those estimates and assumptions.
(G) Futures Contracts. A futures contract is an agreement to purchase or sell a specified quantity of an underlying instrument at a specified future date and price, or to make or receive a cash payment based on the value of a financial instrument (e.g., foreign currency, interest rate, security or securities index). The Fund is subject to risks such as market price risk, leverage risk, liquidity risk, counterparty risk, operational risk, legal risk and/or interest rate risk in the normal course of investing in these contracts. Upon entering into a futures contract, the Fund is required to pledge to the broker or futures commission merchant an amount of cash and/or U.S. government securities equal to a certain percentage of the collateral amount, known as the “initial margin.” During the period the futures contract is open, changes in the value of the contract are recognized as unrealized appreciation or depreciation by marking to market such contract on a daily basis to reflect the market value of the contract at the end of each day’s trading. The Fund agrees to receive from or pay to the broker or futures commission merchant an amount of cash equal to the daily fluctuation in the value of the contract. Such receipts or payments are known as “variation margin.” When the futures contract is closed, the Fund records a realized gain or loss equal to the difference between the proceeds from (or cost of) the closing transaction and the Fund's basis in the contract.
The use of futures contracts involves, to varying degrees, elements of market risk in excess of the amount recognized in the Statement of Assets and Liabilities. The contract or notional amounts and variation margin reflect the extent of the Fund's involvement in open futures positions. There are several risks associated with the use of futures contracts as hedging techniques. There can be no assurance that a liquid market will exist at the time when the Fund seeks to close out a futures
| 42 | MainStay MacKay Strategic Bond Fund |
contract. If no liquid market exists, the Fund would remain obligated to meet margin requirements until the position is closed. Futures contracts may involve a small initial investment relative to the risk assumed, which could result in losses greater than if the Fund did not invest in futures contracts. Futures contracts may be more volatile than direct investments in the instrument underlying the futures and may not correlate to the underlying instrument, causing a given hedge not to achieve its objectives. The Fund's activities in futures contracts have minimal counterparty risk as they are conducted through regulated exchanges that guarantee the futures against default by the counterparty. In the event of a bankruptcy or insolvency of a futures commission merchant that holds margin on behalf of the Fund, the Fund may not be entitled to the return of the entire margin owed to the Fund, potentially resulting in a loss. The Fund may invest in futures contracts to seek enhanced returns or to reduce the risk of loss by hedging certain of its holdings. The Fund's investment in futures contracts and other derivatives may increase the volatility of the Fund's NAVs and may result in a loss to the Fund. Open futures contracts as of October 31, 2022, are shown in the Portfolio of Investments.
(H) Loan Assignments, Participations and Commitments. The Fund may invest in loan assignments and participations ("loans"). Commitments are agreements to make money available to a borrower in a specified amount, at a specified rate and within a specified time. The Fund records an investment when the borrower withdraws money on a commitment or when a funded loan is purchased (trade date) and records interest as earned. These loans pay interest at rates that are periodically reset by reference to a base lending rate plus a spread. These base lending rates are generally the prime rate offered by a designated U.S. bank, the London Interbank Offered Rate ("LIBOR") or an alternative reference rate.
The loans in which the Fund may invest are generally readily marketable, but may be subject to some restrictions on resale. For example, the Fund may be contractually obligated to receive approval from the agent bank and/or borrower prior to the sale of these investments. If the Fund purchases an assignment from a lender, the Fund will generally have direct contractual rights against the borrower in favor of the lender. If the Fund purchases a participation interest either from a lender or a participant, the Fund typically will have established a direct contractual relationship with the seller of the participation interest, but not with the borrower. Consequently, the Fund is subject to the credit risk of the lender or participant who sold the participation interest to the Fund, in addition to the usual credit risk of the borrower. In the event that the borrower, selling participant or intermediate participants become insolvent or enter into bankruptcy, the Fund may incur certain costs and delays in realizing payment, or may suffer a loss of principal and/or interest.
Unfunded commitments represent the remaining obligation of the Fund to the borrower. At any point in time, up to the maturity date of the issue, the borrower may demand the unfunded portion. Unfunded amounts, if any, are marked to market and any unrealized gains or losses are recorded in
the Statement of Assets and Liabilities. As of October 31, 2022, the Fund did not hold any unfunded commitments.
(I) Swap Contracts. The Fund may enter into credit default, interest rate, equity, index and currency exchange rate swap contracts (“swaps”). In a typical swap transaction, two parties agree to exchange the future returns (or differentials in rates of future returns) earned or realized at periodic intervals on a particular investment or instrument based on a notional principal amount. Generally, the Fund will enter into a swap on a net basis, which means that the two payment streams under the swap are netted, with the Fund receiving or paying (as the case may be) only the net amount of the two payment streams. Therefore, the Fund's current obligation under a swap generally will be equal to the net amount to be paid or received under the swap, based on the relative value of notional positions attributable to each counterparty to the swap. The payments may be adjusted for transaction costs, interest payments, the amount of interest paid on the investment or instrument or other factors. Collateral, in the form of cash or securities, may be required to be held in segregated accounts with the custodian bank or broker in accordance with the terms of the swap. Swap agreements are privately negotiated in the over the counter (“OTC”) market and may be executed in a multilateral or other trade facilities platform, such as a registered commodities exchange (“centrally cleared swaps”).
Certain standardized swaps, including certain credit default and interest rate swaps, are subject to mandatory clearing and exchange-trading, and more types of standardized swaps are expected to be subject to mandatory clearing and exchange-trading in the future. The counterparty risk for exchange-traded and cleared derivatives is expected to be generally lower than for uncleared derivatives, but cleared contracts are not risk-free. In a cleared derivative transaction, the Fund typically enters into the transaction with a financial institution counterparty, and performance of the transaction is effectively guaranteed by a central clearinghouse, thereby reducing or eliminating the Fund's exposure to the credit risk of its original counterparty. The Fund will be required to post specified levels of margin with the clearinghouse or at the instruction of the clearinghouse; the margin required by a clearinghouse may be greater than the margin the Fund would be required to post in an uncleared transaction. As of October 31, 2022, all swap positions outstanding are shown in the Portfolio of Investments.
Swaps are marked to market daily based upon quotations from pricing agents, brokers, or market makers and the change in value, if any, is recorded as unrealized appreciation or depreciation. Any payments made or received upon entering into a swap would be amortized or accreted over the life of the swap and recorded as a realized gain or loss. Early termination of a swap is recorded as a realized gain or loss. Daily changes in valuation of centrally cleared swaps, if any, are recorded as a receivable or payable for the change in value as appropriate on the Statement of Assets and Liabilities.
The Fund bears the risk of loss of the amount expected to be received under a swap in the event of the default or bankruptcy of the swap counterparty. The Fund may be able to eliminate its exposure under a
Notes to Financial Statements (continued)
swap either by assignment or other disposition, or by entering into an offsetting swap with the same party or a similar credit-worthy party. Swaps are not actively traded on financial markets. Entering into swaps involves elements of credit, market, leverage, liquidity, operational, counterparty and legal/documentation risk in excess of the amounts recognized on the Statement of Assets and Liabilities. Such risks involve the possibilities that there will be no liquid market for these swaps, that the counterparty to the swaps may default on its obligation to perform or disagree as to the meaning of the contractual terms in the swaps and that there may be unfavorable changes in interest rates, the price of the index or the security underlying these transactions, among other risks.
Interest Rate Swaps : An interest rate swap is an agreement between two parties where one stream of future interest payments is exchanged for another based on a specified principal amount. Interest rate swaps often exchange a fixed payment for a floating payment that is linked to an interest rate (most often LIBOR). The Fund will typically use interest rate swaps to limit, or manage, its exposure to fluctuations in interest rates, or to obtain a marginally lower interest rate than it would have been able to get without the swap.
(J) Foreign Currency Forward Contracts. The Fund may enter into foreign currency forward contracts, which are agreements to buy or sell foreign currencies on a specified future date at a specified rate. The Fund is subject to foreign currency exchange rate risk in the normal course of investing in these transactions. During the period the forward contract is open, changes in the value of the contract are recognized as unrealized appreciation or depreciation by marking to market such contract on a daily basis to reflect the market value of the contract at the end of each day’s trading. Cash movement occurs on the settlement date. When the forward contract is closed, the Fund records a realized gain or loss equal to the difference between the proceeds from (or cost of) the closing transaction and the Fund's basis in the contract. The Fund may purchase and sell foreign currency forward contracts for purposes of seeking to enhance portfolio returns and manage portfolio risk more efficiently. Foreign currency forward contracts may also be used to gain exposure to a particular currency or to hedge against the risk of loss due to changing currency exchange rates. Foreign currency forward contracts to purchase or sell a foreign currency may also be used in anticipation of future purchases or sales of securities denominated in foreign currency, even if the specific investments have not yet been selected.
The use of foreign currency forward contracts involves, to varying degrees, elements of risk in excess of the amount recognized in the Statement of Assets and Liabilities, including counterparty risk, market risk, leverage risk, operational risk, legal risk and liquidity risk. Counterparty risk is heightened for these instruments because foreign currency forward contracts are not exchange-traded and therefore no clearinghouse or exchange stands ready to meet the obligations under such contracts. Thus, the Fund faces the risk that its counterparties under such contracts may not perform their obligations. Market risk is the risk that the value of a foreign currency forward contract will depreciate due to unfavorable changes in exchange rates. Liquidity risk arises because
the secondary market for foreign currency forward contracts may have less liquidity relative to markets for other securities and financial instruments. Liquidity risk also can arise when forward currency contracts create margin or settlement payment obligations for the Fund. Leverage risk is the risk that a foreign currency forward contract can magnify the Fund's gains and losses. Operational risk refers to risk related to potential operational issues (including documentation issues, settlement issues, systems failures, inadequate controls and human error), and legal risk refers to insufficient documentation, insufficient capacity or authority of the counterparty, or legality or enforceability of a foreign currency forward contract. Risks also arise from the possible movements in the foreign exchange rates underlying these instruments. While the Fund may enter into forward contracts to reduce currency exchange risks, changes in currency exchange rates may result in poorer overall performance for the Fund than if it had not engaged in such transactions. Exchange rate movements can be large, depending on the currency, and can last for extended periods of time, affecting the value of the Fund's assets. Moreover, there may be an imperfect correlation between the Fund's holdings of securities denominated in a particular currency and forward contracts entered into by the Fund. Such imperfect correlation may prevent the Fund from achieving the intended hedge or expose the Fund to the risk of currency exchange loss. The unrealized appreciation (depreciation) on forward contracts also reflects the Fund's exposure at the valuation date to credit loss in the event of a counterparty’s failure to perform its obligations. As of October 31, 2022, the Fund did not hold any foreign currency forward contracts.
(K) Foreign Currency Transactions. The Fund's books and records are maintained in U.S. dollars. Prices of securities denominated in foreign currency amounts are translated into U.S. dollars at the mean between the buying and selling rates last quoted by any major U.S. bank at the following dates:
(i) market value of investment securities, other assets and liabilities— at the valuation date; and
(ii) purchases and sales of investment securities, income and expenses—at the date of such transactions.
The assets and liabilities that are denominated in foreign currency amounts are presented at the exchange rates and market values at the close of the period. The realized and unrealized changes in net assets arising from fluctuations in exchange rates and market prices of securities are not separately presented.
Net realized gain (loss) on foreign currency transactions represents net currency gains or losses realized as a result of differences between the amounts of securities sale proceeds or purchase cost, dividends, interest and withholding taxes as recorded on the Fund's books, and the U.S. dollar equivalent amount actually received or paid. Net currency gains or losses from valuing such foreign currency denominated assets and liabilities, other than investments at valuation date exchange rates, are reflected in unrealized foreign exchange gains or losses.
| 44 | MainStay MacKay Strategic Bond Fund |
(L) Securities Lending. In order to realize additional income, the Fund may engage in securities lending, subject to the limitations set forth in the 1940 Act and relevant guidance by the staff of the Securities and Exchange Commission (“SEC”). If the Fund engages in securities lending, the Fund will lend through its custodian, JPMorgan Chase Bank, N.A., ("JPMorgan"), acting as securities lending agent on behalf of the Fund. Under the current arrangement, JPMorgan will manage the Fund's collateral in accordance with the securities lending agency agreement between the Fund and JPMorgan, and indemnify the Fund against counterparty risk. The loans will be collateralized by cash (which may be invested in a money market fund) and/or non-cash collateral (which may include U.S. Treasury securities and/or U.S. government agency securities issued or guaranteed by the United States government or its agencies or instrumentalities) at least equal at all times to the market value of the securities loaned. Non-cash collateral held at year end is segregated and cannot be transferred by the Fund. The Fund bears the risk of delay in recovery of, or loss of rights in, the securities loaned. The Fund may also record a realized gain or loss on securities deemed sold due to a borrower’s inability to return securities on loan. The Fund bears the risk of any loss on investment of cash collateral. The Fund will receive compensation for lending its securities in the form of fees or it will retain a portion of interest earned on the investment of any cash collateral. The Fund will also continue to receive interest and dividends on the securities loaned and any gain or loss in the market price of the securities loaned that may occur during the term of the loan will be for the account of the Fund. Income earned from securities lending activities, if any, is reflected in the Statement of Operations. Securities on loan as of October 31, 2022, are shown in the Portfolio of Investments.
(M) Dollar Rolls. The Fund may enter into dollar roll transactions in which it sells mortgage-backed securities ("MBS") from its portfolio to a counterparty from whom it simultaneously agrees to buy a similar security on a delayed delivery basis. The Fund generally transfers MBS where the MBS are "to be announced," therefore, the Fund accounts for these transactions as purchases and sales.
When accounted for as purchase and sales, the securities sold in connection with the dollar rolls are removed from the portfolio and a realized gain or loss is recognized. The securities the Fund has agreed to acquire are included at market value in the Portfolio of Investments and liabilities for such purchase commitments are included as payables for investments purchased. During the roll period, the Fund foregoes principal and interest paid on the securities. The Fund is compensated by the difference between the current sales price and the forward price for the future as well as by the earnings on the cash proceeds of the initial sale. Dollar rolls may be renewed without physical delivery of the securities subject to the contract. Dollar roll transactions involve certain risks, including the risk that the securities returned to the Fund at the end of the roll period, while substantially similar, could be inferior to what was initially sold to the counterparty.
(N) Debt and Foreign Securities Risk. The ability of issuers of debt securities held by the Fund to meet their obligations may be affected by, among other things, economic or political developments in a specific country, industry or region. Debt securities are also subject to the risks associated with changes in interest rates. The Fund primarily invests in high yield debt securities (commonly referred to as “junk bonds”), which are considered speculative because they present a greater risk of loss, including default, than higher rated debt securities. These securities pay investors a premium—a higher interest rate or yield than investment grade debt securities—because of the increased risk of loss. These securities can also be subject to greater price volatility. In times of unusual or adverse market, economic or political conditions, these securities may experience higher than normal default rates.
Investments in the Fund are not guaranteed, even though some of the Fund’s underlying investments are guaranteed by the U.S. government or its agencies or instrumentalities. The principal risk of mortgage-related and asset-backed securities is that the underlying debt may be prepaid ahead of schedule, if interest rates fall, thereby reducing the value of the Fund’s investment. If interest rates rise, less of the debt may be prepaid and the Fund may lose money because the Fund may be unable to invest in higher yielding assets. The Fund is subject to interest-rate risk and can lose principal value when interest rates rise. Bonds are also subject to credit risk, in which the bond issuer may fail to pay interest and principal in a timely manner.
The Fund may invest in loans which are usually rated below investment grade and are generally considered speculative because they present a greater risk of loss, including default, than higher rated debt securities. These investments pay investors a higher interest rate than investment grade debt securities because of the increased risk of loss. Although certain loans are collateralized, there is no guarantee that the value of the collateral will be sufficient to repay the loan. In a recession or serious credit event, the value of these investments could decline significantly. As a result of these and other events, the Fund’s NAVs could go down and you could lose money.
In addition, loans generally are subject to the extended settlement periods that may be longer than seven days. As a result, the Fund may be adversely affected by selling other investments at an unfavorable time and/or under unfavorable conditions or engaging in borrowing transactions, such as borrowing against its credit facility, to raise cash to meet redemption obligations or pursue other investment opportunities.
In certain circumstances, loans may not be deemed to be securities. As a result, the Fund may not have the protection of anti-fraud provisions of the federal securities laws. In such cases, the Fund generally must rely on the contractual provisions in the loan agreement and common-law fraud protections under applicable state law.
The ability of issuers of debt securities held by the Fund to meet their obligations may be affected by, among other things, economic or political developments in a specific country, industry or region. Debt securities are also subject to the risks associated with changes in interest rates. The
Notes to Financial Statements (continued)
Fund may invest in foreign securities, which carry certain risks that are in addition to the usual risks inherent in domestic securities. These risks include those resulting from currency fluctuations, future adverse political or economic developments and possible imposition of currency exchange blockages or other foreign governmental laws or restrictions. These risks are likely to be greater in emerging markets than in developed markets. The ability of issuers of debt securities held by the Fund to meet their obligations may be affected by, among other things, economic or political developments in a specific country, industry or region.
(O) Counterparty Credit Risk. In order to better define its contractual rights and to secure rights that will help the Fund mitigate its counterparty risk, the Fund may enter into an International Swaps and Derivatives Association, Inc. Master Agreement (“ISDA Master Agreement”) or similar agreement with its counterparties. An ISDA Master Agreement is a bilateral agreement between the Fund and a counterparty that governs certain OTC derivatives and typically contains collateral posting terms and netting provisions. Under an ISDA Master Agreement, the Fund may, under certain circumstances, offset with the counterparty certain derivative financial instruments’ payables and/ or receivables with collateral held and/or posted and create one single net payment. The provisions of the ISDA Master Agreement typically permit a single net payment in the event of default including the bankruptcy or insolvency of the counterparty. Bankruptcy or insolvency laws of a particular jurisdiction may restrict or prohibit the right of offset in bankruptcy, insolvency or other events. In addition, certain ISDA Master Agreements may contain provisions for early termination of OTC derivative transactions in the event the net assets of the Fund decline below specific levels or if the Fund fails to meet the terms of its ISDA Master Agreements. The result would cause the Fund to accelerate payment of any net liability owed to the counterparty.
For financial reporting purposes, the Fund does not offset derivative assets and derivative liabilities that are subject to netting arrangements, if any, in the Statement of Assets and Liabilities.
(P) LIBOR Replacement Risk. The Fund may invest in certain debt securities, derivatives or other financial instruments that utilize the LIBOR, as a “benchmark” or “reference rate” for various interest rate calculations. As of January 1, 2022, the United Kingdom Financial Conduct Authority, which regulates LIBOR, ceased its active encouragement of banks to provide the quotations needed to sustain most LIBOR rates due to the absence of an active market for interbank unsecured lending and other reasons. However, the United Kingdom Financial Conduct Authority, the LIBOR administrator and other regulators announced that certain sterling and yen LIBOR settings would be calculated on a "synthetic" basis through the end of 2022 and the most widely used tenors of U.S. dollar LIBOR will continue until mid-2023. As a result, it is anticipated that the remaining LIBOR settings will be discontinued or will no longer be sufficiently robust to be representative of its underlying market around that time. Various financial industry groups will plan for that transition and certain regulators and industry groups have taken actions to establish alternative reference rates (e.g., the
Secured Overnight Financing Rate, which measures the cost of overnight borrowings through repurchase agreement transactions collateralized with U.S. Treasury securities and is intended to replace U.S. dollar LIBOR with certain adjustments). However, there are challenges to converting certain contracts and transactions to a new benchmark and neither the full effects of the transition process nor its ultimate outcome is known.
The elimination of LIBOR or changes to other reference rates or any other changes or reforms to the determination or supervision of reference rates could have an adverse impact on the market for, or value of, any securities or payments linked to those reference rates, which may adversely affect the Fund's performance and/or net asset value. Uncertainty and risk also remain regarding the willingness and ability of issuers and lenders to include enhanced provisions in new and existing contracts or instruments. Consequently, the transition away from LIBOR to other reference rates may lead to increased volatility and illiquidity in markets that are tied to LIBOR, fluctuations in values of LIBOR-related investments or investments in issuers that utilize LIBOR, increased difficulty in borrowing or refinancing and diminished effectiveness of hedging strategies, adversely affecting the Fund's performance. Furthermore, the risks associated with the expected discontinuation of LIBOR and transition may be exacerbated if the work necessary to effect an orderly transition to an alternative reference rate is not completed in a timely manner. While the transition away from LIBOR has already begun with no material adverse effect to the Fund's performance, the transition is expected to last through mid-2023 for some LIBOR tenors. The usefulness of LIBOR as a benchmark could deteriorate anytime during this transition period.
(Q) Indemnifications. Under the Trust’s organizational documents, its officers and trustees are indemnified against certain liabilities that may arise out of performance of their duties to the Trust. Additionally, in the normal course of business, the Fund enters into contracts with third-party service providers that contain a variety of representations and warranties and that may provide general indemnifications. The Fund's maximum exposure under these arrangements is unknown, as this would involve future claims that may be made against the Fund that have not yet occurred. The Manager believes that the risk of loss in connection with these potential indemnification obligations is remote. However, there can be no assurance that material liabilities related to such obligations will not arise in the future, which could adversely impact the Fund.
(R) Quantitative Disclosure of Derivative Holdings. The following tables show additional disclosures related to the Fund's derivative and hedging activities, including how such activities are accounted for and their effect on the Fund's financial positions, performance and cash flows.
The Fund entered into futures contracts to help manage the duration and yield curve positioning of the portfolio while minimizing the exposure to wider bid/ask spreads in traditional bonds. The Fund entered into interest rate and credit default swap contracts in order to obtain a desired return at a lower cost to the Fund, rather than directly investing in an instrument yielding that desired return or to hedge against credit and interest rate
| 46 | MainStay MacKay Strategic Bond Fund |
risk. The Fund also entered into foreign currency forward contracts to gain exposure to a particular currency or to hedge against the risk of loss
due to changing currency exchange rates. These derivatives are not accounted for as hedging instruments.
Fair value of derivative instruments as of October 31, 2022:
| Asset Derivatives | Interest
Rate
Contracts
Risk | Total |
| Futures Contracts - Net Assets—Net unrealized appreciation on futures contracts (a) | $5,475,461 | $5,475,461 |
| Centrally Cleared Swap Contracts - Net Assets—Net unrealized appreciation on swap contracts (b) | 564,729 | 564,729 |
| Total Fair Value | $6,040,190 | $6,040,190 |
| (a) | Includes cumulative appreciation (depreciation) of futures contracts as reported in the Portfolio of Investments. Only current day’s variation margin is reported within the Statement of Assets and Liabilities. |
| (b) | Includes cumulative appreciation (depreciation) of centrally cleared swap agreements as reported in the Portfolio of Investments. Only the current day’s variation margin is reported within the Statement of Assets and Liabilities. |
| Liability Derivatives | Interest
Rate
Contracts
Risk | Total |
| Futures Contracts - Net Assets—Net unrealized depreciation on futures contracts (a) | $(4,589,701) | $(4,589,701) |
| Total Fair Value | $(4,589,701) | $(4,589,701) |
| (a) | Includes cumulative appreciation (depreciation) of futures contracts as reported in the Portfolio of Investments. Only current day’s variation margin is reported within the Statement of Assets and Liabilities. |
The effect of derivative instruments on the Statement of Operations for the year ended October 31, 2022:
| Net Realized Gain (Loss) from: | Foreign
Exchange
Contracts
Risk | Interest
Rate
Contracts
Risk | Total |
| Futures Contracts | $ — | $22,524,053 | $22,524,053 |
| Swap Contracts | — | (1,255,466) | (1,255,466) |
| Forward Contracts | 107,896 | — | 107,896 |
| Total Net Realized Gain (Loss) | $107,896 | $21,268,587 | $21,376,483 |
| Net Change in Unrealized Appreciation (Depreciation) | Foreign
Exchange
Contracts
Risk | Interest
Rate
Contracts
Risk | Total |
| Futures Contracts | $ — | $(2,480,945) | $(2,480,945) |
| Swap Contracts | — | 3,186,533 | 3,186,533 |
| Forward Contracts | (99,122) | — | (99,122) |
| Total Net Change in Unrealized Appreciation (Depreciation) | $(99,122) | $ 705,588 | $ 606,466 |
| Average Notional Amount | Total |
| Futures Contracts Long | $ 31,795,170 |
| Futures Contracts Short | $(196,703,065) |
| Swap Contracts Long | $ 81,000,000 |
| Forward Contracts Long (a) | $ 4,229,291 |
| Forward Contracts Short (a) | $ (4,266,464) |
| (a) | Positions were open three months during the reporting period. |
Note 3–Fees and Related Party Transactions
(A) Manager and Subadvisor. New York Life Investments, a registered investment adviser and an indirect, wholly-owned subsidiary of New York Life Insurance Company ("New York Life"), serves as the Fund's Manager, pursuant to an Amended and Restated Management Agreement ("Management Agreement"). The Manager provides offices, conducts clerical, recordkeeping and bookkeeping services and keeps most of the financial and accounting records required to be maintained by the Fund. Except for the portion of salaries and expenses that are the responsibility of the Fund, the Manager pays the salaries and expenses of all personnel
Notes to Financial Statements (continued)
affiliated with the Fund and certain operational expenses of the Fund. During a portion of the year ended October 31, 2022, the Fund reimbursed New York Life Investments in an amount equal to the portion of the compensation of the Chief Compliance Officer attributable to the Fund. MacKay Shields LLC ("MacKay Shields" or the "Subadvisor"), a registered investment adviser and an indirect, wholly-owned subsidiary of New York Life, serves as the Subadvisor to the Fund and is responsible for the day-to-day portfolio management of the Fund. Pursuant to the terms of an Amended and Restated Subadvisory Agreement ("Subadvisory Agreement") between New York Life Investments and MacKay Shields, New York Life Investments pays for the services of the Subadvisor.
Pursuant to the Management Agreement, the Fund pays the Manager a monthly fee for the services performed and the facilities furnished at an annual rate of the Fund’s average daily net assets as follows: 0.60% up to $500 million; 0.55% from $500 million to $1 billion; 0.50% from $1 billion to $5 billion; and 0.475% in excess of $5 billion, plus a fee for fund accounting services previously provided by New York Life Investments under a separate fund accounting agreement furnished at an annual rate of the Fund’s average daily net assets as follows: 0.05% up to $20 million; 0.0333% from $20 million to $100 million; and 0.01% in excess of $100 million. During the year ended October 31, 2022, the effective management fee rate was 0.60%, inclusive of a fee for fund accounting services of 0.01% of the Fund’s average daily net assets.
New York Life Investments has contractually agreed to waive fees and/or reimburse expenses so that Total Annual Fund Operating Expenses (excluding taxes, interest expenses (including interest on securities sold short), litigation, extraordinary expenses, brokerage and other transaction expenses relating to the purchase or sale of portfolio investments and acquired (underlying) fund fees and expenses) for Class I shares do not exceed 0.70% of its average daily net assets, and, for Class R6, do not exceed those of Class I. This agreement will remain in effect until February 28, 2023, and shall renew automatically for one-year terms unless New York Life Investments provides written notice of termination prior to the start of the next term or upon approval of the Board.
During the year ended October 31, 2022, New York Life Investments earned fees from the Fund in the amount of $4,171,449 and waived and/or reimbursed in the amount of $407,855 and paid the Subadvisor in the amount of $1,833,695.
JPMorgan provides sub-administration and sub-accounting services to the Fund pursuant to an agreement with New York Life Investments. These services include calculating the daily NAVs of the Fund, maintaining the general ledger and sub-ledger accounts for the calculation of the Fund's NAVs, and assisting New York Life Investments in conducting various aspects of the Fund's administrative operations. For providing these services to the Fund, JPMorgan is compensated by New York Life Investments.
Pursuant to an agreement between the Trust and New York Life Investments, New York Life Investments is responsible for providing or procuring certain regulatory reporting services for the Fund. The Fund will
reimburse New York Life Investments for the actual costs incurred by New York Life Investments in connection with providing or procuring these services for the Fund.
(B) Distribution and Service Fees. The Trust, on behalf of the Fund, has entered into a distribution agreement with NYLIFE Distributors LLC (the “Distributor”), an affiliate of New York Life Investments. The Fund has adopted distribution plans (the “Plans”) in accordance with the provisions of Rule 12b-1 under the 1940 Act.
Pursuant to the Class A, Investor Class and Class R2 Plans, the Distributor receives a monthly fee from the Class A, Investor Class and Class R2 shares at an annual rate of 0.25% of the average daily net assets of the Class A, Investor Class and Class R2 shares for distribution and/or service activities as designated by the Distributor. Pursuant to the Class B and Class C Plans, Class B and Class C shares pay the Distributor a monthly distribution fee at an annual rate of 0.75% of the average daily net assets of the Class B and Class C shares, along with a service fee at an annual rate of 0.25% of the average daily net assets of the Class B and Class C shares, for a total 12b-1 fee of 1.00%. Pursuant to the Class R3 Plan, Class R3 shares pay the Distributor a monthly distribution fee at an annual rate of 0.25% of the average daily net assets of the Class R3 shares, along with a service fee at an annual rate of 0.25% of the average daily net assets of the Class R3 shares, for a total 12b-1 fee of 0.50%. Class I and Class R6 shares are not subject to a distribution and/or service fee.
The Plans provide that the distribution and service fees are payable to the Distributor regardless of the amounts actually expended by the Distributor for distribution of the Fund's shares and service activities.
In accordance with the Shareholder Services Plans for the Class R2 and Class R3 shares, the Manager has agreed to provide, through its affiliates or independent third parties, various shareholder and administrative support services to shareholders of the Class R2 and Class R3 shares. For its services, the Manager, its affiliates or independent third-party service providers are entitled to a shareholder service fee accrued daily and paid monthly at an annual rate of 0.10% of the average daily net assets of the Class R2 and Class R3 shares. This is in addition to any fees paid under the Class R2 and Class R3 Plans.
During the year ended October 31, 2022, shareholder service fees incurred by the Fund were as follows:
| |
| Class R2 | $1,024 |
| Class R3 | 589 |
(C) Sales Charges. The Fund was advised by the Distributor that the amount of initial sales charges retained on sales of Class A and Investor Class shares during the year ended October 31, 2022, were $12,257 and $2,366, respectively.
The Fund was also advised that the Distributor retained CDSCs on redemptions of Class A, Class B and Class C shares during the year ended October 31, 2022, of $20,618, $1,394 and $907, respectively.
| 48 | MainStay MacKay Strategic Bond Fund |
(D) Transfer, Dividend Disbursing and Shareholder Servicing Agent. NYLIM Service Company LLC, an affiliate of New York Life Investments, is the Fund's transfer, dividend disbursing and shareholder servicing agent pursuant to an agreement between NYLIM Service Company LLC and the Trust. NYLIM Service Company LLC has entered into an agreement with DST Asset Manager Solutions, Inc. ("DST"), pursuant to which DST performs certain transfer agent services on behalf of NYLIM Service Company LLC. New York Life Investments has contractually agreed to limit the transfer agency expenses charged to the Fund’s share classes to a maximum of 0.35% of that share class’s average daily net assets on an annual basis after deducting any applicable Fund or class-level expense reimbursement or small account fees. This agreement will remain in effect until February 28, 2023, and shall renew automatically for one-year terms unless New York Life Investments provides written notice of termination prior to the start of the next term or upon approval of the Board. During the year ended October 31, 2022, transfer agent expenses incurred by the Fund and any reimbursements, pursuant to the aforementioned Transfer Agency expense limitation agreement, were as follows:
| Class | Expense | Waived |
| Class A | $245,485 | $— |
| Investor Class | 41,544 | — |
| Class B | 6,127 | — |
| Class C | 92,516 | — |
| Class I | 591,288 | — |
| Class R2 | 1,336 | — |
| Class R3 | 768 | — |
| Class R6 | 54 | — |
(E) Small Account Fee. Shareholders with small accounts adversely impact the cost of providing transfer agency services. In an effort to reduce total transfer agency expenses, the Fund has implemented a small account fee on certain types of accounts. As described in the Fund's prospectus, certain shareholders with an account balance of less than $1,000 ($5,000 for Class A share accounts) are charged an annual per account fee of $20 (assessed semi-annually), the proceeds from which offset transfer agent fees as reflected in the Statement of Operations. This small account fee will not apply to certain types of accounts as described further in the Fund’s prospectus.
(F) Capital. As of October 31, 2022, New York Life and its affiliates beneficially held shares of the Fund with the values and percentages of net assets as follows:
| Class I | $1,066,104 | 0.2% |
| Class R3 | 28,514 | 5.7 |
| Class R6 | 25,882 | 1.9 |
Note 4-Federal Income Tax
As of October 31, 2022, the cost and unrealized appreciation (depreciation) of the Fund’s investment portfolio, including applicable derivative contracts and other financial instruments, as determined on a federal income tax basis, were as follows:
| | Federal Tax
Cost | Gross
Unrealized
Appreciation | Gross
Unrealized
(Depreciation) | Net
Unrealized
Appreciation/
(Depreciation) |
| Investments in Securities | $741,065,524 | $1,476,988 | $(95,080,530) | $(93,603,542) |
As of October 31, 2022, the components of accumulated gain (loss) on a tax basis were as follows:
Ordinary
income | Accumulated
Capital
and Other
Gain (Loss) | Other
Temporary
Differences | Unrealized
Appreciation
(Depreciation) | Total
Accumulated
Gain (Loss) |
| $765,992 | $(169,373,876) | $(300,292) | $(93,603,071) | $(262,511,247) |
The difference between book-basis and tax-basis unrealized appreciation (depreciation) is primarily due to mark to market of futures contracts, cumulative bond amortization and wash sale adjustments. The other temporary differences are primarily due to dividends payable.
As of October 31, 2022, for federal income tax purposes, capital loss carryforwards of $169,373,198, as shown in the table below, were available to the extent provided by the regulations to offset future realized gains of the Fund. Accordingly, no capital gains distributions are expected to be paid to shareholders until net gains have been realized in excess of such amounts.
Capital Loss
Available Through | Short-Term
Capital Loss
Amounts (000’s) | Long-Term
Capital Loss
Amounts (000’s) |
| Unlimited | $23,746 | $145,627 |
The Fund utilized $11,202,259 of capital loss carryforwards during the year ended October 31, 2022.
During the years ended October 31, 2022 and October 31, 2021, the tax character of distributions paid as reflected in the Statements of Changes in Net Assets was as follows:
| | 2022 | 2021 |
| Distributions paid from: | | |
| Ordinary Income | $18,558,300 | $13,999,950 |
| Return of Capital | — | 851,084 |
| Total | $18,558,300 | $14,851,034 |
Notes to Financial Statements (continued)
Note 5–Custodian
JPMorgan is the custodian of cash and securities held by the Fund. Custodial fees are charged to the Fund based on the Fund's net assets and/or the market value of securities held by the Fund and the number of certain transactions incurred by the Fund.
Note 6–Line of Credit
The Fund and certain other funds managed by New York Life Investments maintain a line of credit with a syndicate of banks in order to secure a source of funds for temporary purposes to meet unanticipated or excessive redemption requests.
Effective July 26, 2022, under the credit agreement (the “Credit Agreement”), the aggregate commitment amount is $600,000,000 with an additional uncommitted amount of $100,000,000. The commitment fee is an annual rate of 0.15% of the average commitment amount payable quarterly, regardless of usage, to JPMorgan, who serves as the agent to the syndicate. The commitment fee is allocated among the Fund and certain other funds managed by New York Life Investments based upon their respective net assets and other factors. Interest on any revolving credit loan is charged based upon the Federal Funds Rate, Daily Simple Secured Overnight Financing Rate ("SOFR") + 0.10%, or the Overnight Bank Funding Rate, whichever is higher. The Credit Agreement expires on July 25, 2023, although the Fund, certain other funds managed by New York Life Investments and the syndicate of banks may renew the Credit Agreement for an additional year on the same or different terms or enter into a credit agreement with a different syndicate of banks. Prior to July 26, 2022, the aggregate commitment amount and the commitment fee were the same as those under the current Credit Agreement. During the year ended October 31, 2022, there were no borrowings made or outstanding with respect to the Fund under the Credit Agreement.
Note 7–Interfund Lending Program
Pursuant to an exemptive order issued by the SEC, the Fund, along with certain other funds managed by New York Life Investments, may participate in an interfund lending program. The interfund lending program provides an alternative credit facility that permits the Fund and certain other funds managed by New York Life Investments to lend or borrow money for temporary purposes directly to or from one another, subject to the conditions of the exemptive order. During the year ended October 31, 2022, there were no interfund loans made or outstanding with respect to the Fund.
Note 8–Purchases and Sales of Securities (in 000’s)
During the year ended October 31, 2022, purchases and sales of U.S. government securities were $271,241 and $254,606, respectively. Purchases and sales of securities, other than U.S. government securities and short-term securities, were $387,706 and $301,430, respectively.
Note 9–Capital Share Transactions
Transactions in capital shares for the years ended October 31, 2022 and October 31, 2021, were as follows:
| Class A | Shares | Amount |
| Year ended October 31, 2022: | | |
| Shares sold | 5,239,194 | $ 44,969,613 |
| Shares issued to shareholders in reinvestment of distributions | 516,644 | 4,347,022 |
| Shares redeemed | (4,555,605) | (38,840,159) |
| Net increase (decrease) in shares outstanding before conversion | 1,200,233 | 10,476,476 |
| Shares converted into Class A (See Note 1) | 194,631 | 1,666,342 |
| Shares converted from Class A (See Note 1) | (22,766) | (195,017) |
| Net increase (decrease) | 1,372,098 | $ 11,947,801 |
| Year ended October 31, 2021: | | |
| Shares sold | 4,142,465 | $ 37,695,529 |
| Shares issued to shareholders in reinvestment of distributions | 386,703 | 3,514,807 |
| Shares redeemed | (3,881,418) | (35,230,020) |
| Net increase (decrease) in shares outstanding before conversion | 647,750 | 5,980,316 |
| Shares converted into Class A (See Note 1) | 598,420 | 5,426,216 |
| Shares converted from Class A (See Note 1) | (90,110) | (816,457) |
| Net increase (decrease) | 1,156,060 | $ 10,590,075 |
| |
| Investor Class | Shares | Amount |
| Year ended October 31, 2022: | | |
| Shares sold | 72,504 | $ 632,849 |
| Shares issued to shareholders in reinvestment of distributions | 40,927 | 347,822 |
| Shares redeemed | (217,500) | (1,884,049) |
| Net increase (decrease) in shares outstanding before conversion | (104,069) | (903,378) |
| Shares converted into Investor Class (See Note 1) | 88,587 | 767,005 |
| Shares converted from Investor Class (See Note 1) | (100,049) | (872,203) |
| Net increase (decrease) | (115,531) | $ (1,008,576) |
| Year ended October 31, 2021: | | |
| Shares sold | 113,560 | $ 1,040,464 |
| Shares issued to shareholders in reinvestment of distributions | 36,650 | 335,936 |
| Shares redeemed | (273,230) | (2,505,424) |
| Net increase (decrease) in shares outstanding before conversion | (123,020) | (1,129,024) |
| Shares converted into Investor Class (See Note 1) | 155,880 | 1,424,394 |
| Shares converted from Investor Class (See Note 1) | (238,288) | (2,185,706) |
| Net increase (decrease) | (205,428) | $ (1,890,336) |
| |
| 50 | MainStay MacKay Strategic Bond Fund |
| Class B | Shares | Amount |
| Year ended October 31, 2022: | | |
| Shares sold | 11,822 | $ 106,766 |
| Shares issued to shareholders in reinvestment of distributions | 3,034 | 25,484 |
| Shares redeemed | (145,596) | (1,238,760) |
| Net increase (decrease) in shares outstanding before conversion | (130,740) | (1,106,510) |
| Shares converted from Class B (See Note 1) | (53,740) | (458,368) |
| Net increase (decrease) | (184,480) | $ (1,564,878) |
| Year ended October 31, 2021: | | |
| Shares sold | 8,800 | $ 78,983 |
| Shares issued to shareholders in reinvestment of distributions | 4,318 | 39,009 |
| Shares redeemed | (146,647) | (1,325,666) |
| Net increase (decrease) in shares outstanding before conversion | (133,529) | (1,207,674) |
| Shares converted from Class B (See Note 1) | (70,410) | (635,484) |
| Net increase (decrease) | (203,939) | $ (1,843,158) |
| |
| Class C | Shares | Amount |
| Year ended October 31, 2022: | | |
| Shares sold | 192,791 | $ 1,643,823 |
| Shares issued to shareholders in reinvestment of distributions | 55,328 | 463,896 |
| Shares redeemed | (2,628,674) | (22,246,426) |
| Net increase (decrease) in shares outstanding before conversion | (2,380,555) | (20,138,707) |
| Shares converted from Class C (See Note 1) | (126,672) | (1,073,171) |
| Net increase (decrease) | (2,507,227) | $ (21,211,878) |
| Year ended October 31, 2021: | | |
| Shares sold | 471,716 | $ 4,268,995 |
| Shares issued to shareholders in reinvestment of distributions | 72,232 | 652,329 |
| Shares redeemed | (2,400,170) | (21,673,078) |
| Net increase (decrease) in shares outstanding before conversion | (1,856,222) | (16,751,754) |
| Shares converted from Class C (See Note 1) | (447,633) | (4,024,920) |
| Net increase (decrease) | (2,303,855) | $ (20,776,674) |
| |
| Class I | Shares | Amount |
| Year ended October 31, 2022: | | |
| Shares sold | 29,577,873 | $ 253,024,297 |
| Shares issued to shareholders in reinvestment of distributions | 1,323,433 | 11,171,084 |
| Shares redeemed | (25,595,708) | (216,538,337) |
| Net increase (decrease) in shares outstanding before conversion | 5,305,598 | 47,657,044 |
| Shares converted into Class I (See Note 1) | 23,007 | 197,262 |
| Shares converted from Class I (See Note 1) | (4,001) | (31,850) |
| Net increase (decrease) | 5,324,604 | $ 47,822,456 |
| Year ended October 31, 2021: | | |
| Shares sold | 13,192,767 | $ 120,262,456 |
| Shares issued to shareholders in reinvestment of distributions | 956,891 | 8,707,229 |
| Shares redeemed | (10,934,086) | (99,338,416) |
| Net increase (decrease) in shares outstanding before conversion | 3,215,572 | 29,631,269 |
| Shares converted into Class I (See Note 1) | 89,508 | 811,957 |
| Net increase (decrease) | 3,305,080 | $ 30,443,226 |
| |
| Class R2 | Shares | Amount |
| Year ended October 31, 2022: | | |
| Shares sold | 13,401 | $ 116,403 |
| Shares issued to shareholders in reinvestment of distributions | 2,933 | 24,679 |
| Shares redeemed | (7,531) | (65,679) |
| Net increase (decrease) | 8,803 | $ 75,403 |
| Year ended October 31, 2021: | | |
| Shares sold | 14,072 | $ 127,816 |
| Shares issued to shareholders in reinvestment of distributions | 2,234 | 20,315 |
| Shares redeemed | (7,400) | (67,031) |
| Net increase (decrease) | 8,906 | $ 81,100 |
| |
| Class R3 | Shares | Amount |
| Year ended October 31, 2022: | | |
| Shares sold | 7,736 | $ 66,560 |
| Shares issued to shareholders in reinvestment of distributions | 874 | 7,363 |
| Shares redeemed | (13,572) | (114,643) |
| Net increase (decrease) | (4,962) | $ (40,720) |
| Year ended October 31, 2021: | | |
| Shares sold | 57,029 | $ 519,396 |
| Shares issued to shareholders in reinvestment of distributions | 536 | 4,872 |
| Shares redeemed | (20,844) | (189,665) |
| Net increase (decrease) | 36,721 | $ 334,603 |
| |
Notes to Financial Statements (continued)
| Class R6 | Shares | Amount |
| Year ended October 31, 2022: | | |
| Shares sold | 82,311 | $ 700,590 |
| Shares issued to shareholders in reinvestment of distributions | 4,657 | 39,359 |
| Shares redeemed | (71,763) | (620,737) |
| Net increase (decrease) | 15,205 | $ 119,212 |
| Year ended October 31, 2021: | | |
| Shares sold | 116,756 | $ 1,065,273 |
| Shares issued to shareholders in reinvestment of distributions | 2,794 | 25,535 |
| Shares redeemed | (18,194) | (166,382) |
| Net increase (decrease) | 101,356 | $ 924,426 |
Note 10–Other Matters
As of the date of this report, interest rates in the United States and many parts of the world, including certain European countries, are ascending from historically low levels. Thus, the Fund currently faces a heightened level of risk associated with rising interest rates. This could be driven by a variety of factors, including but not limited to central bank monetary policies, changing inflation or real growth rates, general economic conditions, increasing bond issuances or reduced market demand for low yielding investments.
An outbreak of COVID-19, first detected in December 2019, has developed into a global pandemic and has resulted in travel restrictions, closure of international borders, certain businesses and securities markets, restrictions on securities trading activities, prolonged quarantines, supply chain disruptions, and lower consumer demand, as well as general concern and uncertainty. In 2022, many countries lifted some or all restrictions related to COVID-19. However, the continued impact of COVID-19 and related variants is uncertain and could further adversely affect the global economy, national economies, individual issuers and capital markets in unforeseeable ways and result in a substantial and extended economic downturn. Developments that disrupt global economies and financial markets, such as COVID-19, may magnify factors that affect the Fund's performance.
Note 11–Subsequent Events
In connection with the preparation of the financial statements of the Fund as of and for the year ended October 31, 2022, events and transactions subsequent to October 31, 2022, through the date the financial statements were issued have been evaluated by the Manager for possible adjustment and/or disclosure. No subsequent events requiring financial statement adjustment or disclosure have been identified.
| 52 | MainStay MacKay Strategic Bond Fund |
Report of Independent Registered Public Accounting Firm
To the Shareholders of the Fund and Board of Trustees
The MainStay Funds:
Opinion on the Financial Statements
We have audited the accompanying statement of assets and liabilities of MainStay MacKay Strategic Bond Fund (the Fund), one of the funds constituting The MainStay Funds, including the portfolio of investments, as of October 31, 2022, the related statement of operations for the year then ended, the statements of changes in net assets for each of the years in the two-year period then ended, and the related notes (collectively, the financial statements) and the financial highlights for each of the years or periods in the five-year period then ended. In our opinion, the financial statements and financial highlights present fairly, in all material respects, the financial position of the Fund as of October 31, 2022, the results of its operations for the year then ended, the changes in its net assets for each of the years in the two-year period then ended, and the financial highlights for each of the years or periods in the five-year period then ended, in conformity with U.S. generally accepted accounting principles.
Basis for Opinion
These financial statements and financial highlights are the responsibility of the Fund's management. Our responsibility is to express an opinion on these financial statements and financial highlights based on our audits. We are a public accounting firm registered with the Public Company Accounting Oversight Board (United States) (PCAOB) and are required to be independent with respect to the Fund in accordance with the U.S. federal securities laws and the applicable rules and regulations of the Securities and Exchange Commission and the PCAOB.
We conducted our audits in accordance with the standards of the PCAOB. Those standards require that we plan and perform the audit to obtain reasonable assurance about whether the financial statements and financial highlights are free of material misstatement, whether due to error or fraud. Our audits included performing procedures to assess the risks of material misstatement of the financial statements and financial highlights, whether due to error or fraud, and performing procedures that respond to those risks. Such procedures included examining, on a test basis, evidence regarding the amounts and disclosures in the financial statements and financial highlights. Such procedures also included confirmation of securities owned as of October 31, 2022, by correspondence with custodians, the transfer agent, agent banks and brokers; when replies were not received from agent banks and brokers, we performed other auditing procedures. Our audits also included evaluating the accounting principles used and significant estimates made by management, as well as evaluating the overall presentation of the financial statements and financial highlights. We believe that our audits provide a reasonable basis for our opinion.

We have served as the auditor of one or more New York Life Investment Management investment companies since 2003.
Philadelphia, Pennsylvania
December 23, 2022
Federal Income Tax Information
(Unaudited)
The Fund is required under the Internal Revenue Code to advise shareholders in a written statement as to the federal tax status of dividends paid by the Fund during such fiscal years.
For the fiscal year ended October 31, 2022, the Fund designated approximately $1,534 under the Internal Revenue Code as qualified dividend income eligible for reduced tax rates.
The dividends paid by the Fund during the fiscal year ended October 31, 2022 should be multiplied by 0.01% to arrive at the amount eligible for the corporate dividend-received deduction.
In February 2023, shareholders will receive an IRS Form 1099-DIV or substitute Form 1099, which will show the federal tax status of the distributions received by shareholders in calendar year 2022. The amounts that will be reported on such 1099-DIV or substitute Form 1099 will be the amounts you are to use on your federal income tax return and will differ from the amounts which we must report for the Fund's fiscal year ended October 31, 2022.
Proxy Voting Policies and Procedures and Proxy Voting Record
The Fund is required to file with the SEC its proxy voting record for the 12-month period ending June 30 on Form N-PX. A description of the policies and procedures that are used to vote proxies relating to portfolio securities of the Fund is available free of charge upon request by calling 800-624-6782 or visiting the SEC’s website at www.sec.gov. The most recent Form N-PX or proxy voting record is available free of charge upon request by calling 800-624-6782; visiting newyorklifeinvestments.com; or visiting the SEC’s website at www.sec.gov.
Shareholder Reports and Quarterly Portfolio Disclosure
The Fund is required to file its complete schedule of portfolio holdings with the SEC 60 days after its first and third fiscal quarter on Form N-PORT. The Fund's holdings report is available free of charge upon request by calling New York Life Investments at 800-624-6782.
| 54 | MainStay MacKay Strategic Bond Fund |
Board of Trustees and Officers (Unaudited)
The Trustees and officers of the Fund are listed below. The Board oversees the MainStay Group of Funds (which consists of MainStay Funds and MainStay Funds Trust), MainStay VP Funds Trust, MainStay MacKay DefinedTerm Municipal Opportunities Fund, MainStay CBRE Global Infrastructure Megatrends Fund, the Manager and the Subadvisors, and elects the officers of the Funds who are responsible for the day-to-day operations of the Fund. Information pertaining to the Trustees and officers is set forth below. Each Trustee serves until his or her successor is
elected and qualified or until his or her resignation, death or removal. Under the Board’s retirement policy, unless an exception is made, a Trustee must tender his or her resignation by the end of the calendar year during which he or she reaches the age of 75. The business address of each Trustee and officer listed below is 51 Madison Avenue, New York, New York 10010. None of the Trustees are “interested persons” (as defined by the 1940 Act and rules adopted by the SEC thereunder) of the Fund (“Independent Trustees”).
| | Name and
Year of Birth | Term of Office,
Position(s) Held and
Length of Service | Principal Occupation(s)
During Past Five Years | Number of
Portfolios in
Fund Complex
Overseen by
Trustee | Other Directorships
Held by Trustee |
| | | | | | |
| | David H. Chow
1957 | MainStay Funds: Trustee since 2016, Advisory Board Member (June 2015 to December 2015);MainStay Funds Trust:
Trustee since January 2016, Advisory Board Member (June 2015 to December 2015) | Founder and CEO, DanCourt Management, LLC since 1999 | 78 | MainStay VP Funds Trust: Trustee since January 2016, Advisory Board Member (June 2015 to December 2015) (31 portfolios);
MainStay MacKay DefinedTerm Municipal Opportunities Fund: Trustee since January 2016, Advisory Board Member (June 2015 to December 2015);
MainStay CBRE Global Infrastructure Megatrends Fund: Trustee since June 2021; VanEck Vectors Group of Exchange-Traded Funds: Independent Chairman of the Board of Trustees since 2008 and Trustee since 2006 (56 portfolios); and Berea College of Kentucky: Trustee since 2009, Chair of the Investment Committee since 2018 |
| | Susan B. Kerley
1951 | MainStay Funds: Chairman since 2017 and Trustee since 2007;MainStay Funds Trust:
Chairman since 2017 and Trustee since 1990** | President, Strategic Management Advisors LLC since 1990 | 78 | MainStay VP Funds Trust: Chairman since January 2017 and Trustee since 2007 (31 portfolios)**;
MainStay MacKay DefinedTerm Municipal Opportunities Fund: Chairman since 2017 and Trustee since 2011;
MainStay CBRE Global Infrastructure Megatrends Fund: Trustee since June 2021; and Legg Mason Partners Funds: Trustee since 1991 (45 portfolios) |
| | Alan R. Latshaw
1951 | MainStay Funds: Trustee since 2006;MainStay Funds Trust:
Trustee since 2007*** | Retired; Partner, Ernst & Young LLP (2002 to 2003); Partner, Arthur Andersen LLP (1989 to 2002); Consultant to the MainStay Funds Audit and Compliance Committee (2004 to 2006) | 78 | MainStay VP Funds Trust: Trustee since 2007 (31 portfolios)**;
MainStay MacKay DefinedTerm Municipal Opportunities Fund: Trustee since 2011; and
MainStay CBRE Global Infrastructure Megatrends Fund: Trustee since June 2021 |
Board of Trustees and Officers (Unaudited) (continued)
| | Name and
Year of Birth | Term of Office,
Position(s) Held and
Length of Service | Principal Occupation(s)
During Past Five Years | Number of
Portfolios in
Fund Complex
Overseen by
Trustee | Other Directorships
Held by Trustee |
| | | | | | |
| | Karen Hammond
1956 | MainStay Funds: Trustee since December 2021, Advisory Board Member (June 2021 to December 2021);MainStay Funds Trust:
Trustee since December 2021, Advisory Board Member (June 2021 to December 2021)
| Retired, Managing Director, Devonshire Investors (2007 to 2013); Senior Vice President, Fidelity Management & Research Co. (2005 to 2007); Senior Vice President and Corporate Treasurer, FMR Corp. (2003 to 2005); Chief Operating Officer, Fidelity Investments Japan (2001 to 2003) | 78 | MainStay VP Funds Trust: Trustee since December 2021, Advisory Board Member (June 2021 to December 2021) (31 Portfolios);
MainStay MacKay DefinedTerm Municipal Opportunities Fund: Trustee since December 2021, Advisory Board Member (June 2021 to December 2021);
MainStay CBRE Global Infrastructure Megatrends Fund: Trustee since December 2021, Advisory Board Member (June 2021 to December 2021);
Two Harbors Investment Corp.: Director since 2018;
Rhode Island State Investment Commission: Member since 2017; and
Blue Cross Blue Shield of Rhode Island: Director since 2019 |
| | Jacques P. Perold
1958 | MainStay Funds: Trustee since 2016, Advisory Board Member (June 2015 toDecember 2015);MainStay Funds Trust:
Trustee since January 2016, Advisory Board Member (June 2015 to December 2015) | Founder and Chief Executive Officer, CapShift Advisors LLC (since 2018); President, Fidelity Management & Research Company (2009 to 2014); President and Chief Investment Officer, Geode Capital Management, LLC (2001 to 2009) | 78 | MainStay VP Funds Trust: Trustee since January 2016, Advisory Board Member (June 2015 to December 2015) (31 portfolios);
MainStay MacKay DefinedTerm Municipal Opportunities Fund: Trustee since January 2016, Advisory Board Member (June 2015 to December 2015);
MainStay CBRE Global Infrastructure Megatrends Fund: Trustee since June 2021; Partners in Health: Trustee since 2019; Allstate Corporation: Director since 2015; and MSCI Inc.: Director since 2017 |
| | Richard S. Trutanic
1952 | MainStay Funds: Trustee since 1994;MainStay Funds Trust:
Trustee since 2007*** | Chairman and Chief Executive Officer, Somerset & Company (financial advisory firm) since 2004; Managing Director, The Carlyle Group (private investment firm) (2002 to 2004); Senior Managing Director, Partner and Board Member, Groupe Arnault S.A. (private investment firm) (1999 to 2002) | 78 | MainStay VP Funds Trust: Trustee since 2007 (31 portfolios)**;
MainStay MacKay DefinedTerm Municipal Opportunities Fund: Trustee since 2011; and MainStay CBRE Global Infrastructure Megatrends Fund: Trustee since June 2021 |
| ** | Includes prior service as a Director of MainStay VP Series Fund, Inc., the predecessor to MainStay VP Funds Trust. |
| *** | Includes prior service as a Director/Trustee of certain predecessor entities to MainStay Funds Trust. |
| 56 | MainStay MacKay Strategic Bond Fund |
| | Name and
Year of Birth | Position(s) Held and
Length of Service | Principal Occupation(s)
During Past Five Years | |
| | | | | |
| | Kirk C. Lehneis
1974 | President, MainStay Funds, MainStay Funds Trust since 2017 | Chief Operating Officer and Senior Managing Director (since 2016), New York Life Investment Management LLC and New York Life Investment Management Holdings LLC; Member of the Board of Managers (since 2017) and Senior Managing Director (since 2018), NYLIFE Distributors LLC; Chairman of the Board and Senior Managing Director, NYLIM Service Company LLC (since 2017); Trustee, President and Principal Executive Officer of IndexIQ Trust, IndexIQ ETF Trust and IndexIQ Active ETF Trust (since January 2018); President, MainStay CBRE Global Infrastructure Megatrends Fund (since 2021), MainStay MacKay DefinedTerm Municipal Opportunities Fund and MainStay VP Funds Trust (since 2017); Senior Managing Director, Global Product Development (From 2015-2016); Managing Director, Product Development (2010 to 2015), New York Life Investment Management LLC | |
| | Jack R. Benintende
1964 | Treasurer and Principal Financial and Accounting Officer, MainStay Funds (since 2007), MainStay Funds Trust (since 2009) | Managing Director, New York Life Investment Management LLC (since 2007); Treasurer and Principal Financial and Accounting Officer, MainStay CBRE Global Infrastructure Megatrends Fund (since 2021), MainStay MacKay DefinedTerm Municipal Opportunities Fund (since 2011) and MainStay VP Funds Trust (since 2007)** and Assistant Treasurer, New York Life Investment Management Holdings LLC (2008 to 2012) | |
| | J. Kevin Gao
1967 | Secretary and Chief Legal Officer, MainStay Funds and MainStay Funds Trust (since 2010) | Managing Director and Associate General Counsel, New York Life Investment Management LLC (since 2010); Secretary and Chief Legal Officer and MainStay CBRE Global Infrastructure Megatrends Fund (since 2021), MainStay MacKay DefinedTerm Municipal Opportunities Fund (since 2011) and MainStay VP Funds Trust (since 2010)** | |
| | Scott T. Harrington
1959 | Vice President— Administration, MainStay Funds (since 2009), MainStay Funds Trust (since 2009) | Managing Director, New York Life Investment Management LLC (including predecessor advisory organizations) (since 2000); Member of the Board of Directors, New York Life Trust Company (since 2009); Vice President—Administration, MainStay CBRE Global Infrastructure Megatrends Fund (since 2021), MainStay MacKay DefinedTerm Municipal Opportunities Fund (since 2011) and MainStay VP Funds Trust (since 2005)** | |
| | Kevin M. Gleason
1967 | Vice President and Chief Compliance Officer, MainStay Funds and MainStay Funds Trust (since June 2022) | Vice President and Chief Compliance Officer, IndexIQ, IndexIQ ETF Trust and Index IQ Active ETF Trust (since June 2022); Vice President and Chief Compliance Officer, MainStay CBRE Global Infrastructure Megatrends Fund, MainStay VP Funds Trust and MainStay MacKay DefinedTerm Municipal Opportunities Fund (since June 2022); Senior Vice President, Voya Investment Management and Chief Compliance Officer, Voya Family of Funds (2012-2022) | |
| * | The officers listed above are considered to be “interested persons” of the MainStay Group of Funds, MainStay VP Funds Trust, MainStay CBRE Global Infrastructure Megatrends Fund and MainStay MacKay DefinedTerm Municipal Opportunities Fund within the meaning of the 1940 Act because of their affiliation with the MainStay Group of Funds, New York Life Insurance Company and/or its affiliates, including New York Life Investment Management LLC, NYLIM Service Company LLC, NYLIFE Securities LLC and/or NYLIFE Distributors LLC, as described in detail in the column captioned “Principal Occupation(s) During Past Five Years.” Officers are elected annually by the Board. |
| ** | Includes prior service as an Officer of MainStay VP Series Fund, Inc., the predecessor to MainStay VP Funds Trust. |
Officers of the Trust (Who are not Trustees)*
This page intentionally left blank.
Equity
U.S. Equity
MainStay Epoch U.S. Equity Yield Fund
MainStay S&P 500 Index Fund1
MainStay Winslow Large Cap Growth Fund
MainStay WMC Enduring Capital Fund
MainStay WMC Growth Fund
MainStay WMC Small Companies Fund
MainStay WMC Value Fund
International Equity
MainStay Epoch International Choice Fund
MainStay MacKay International Equity Fund
MainStay WMC International Research Equity Fund
Emerging Markets Equity
MainStay Candriam Emerging Markets Equity Fund
Global Equity
MainStay Epoch Capital Growth Fund
MainStay Epoch Global Equity Yield Fund
Fixed Income
Taxable Income
MainStay Candriam Emerging Markets Debt Fund
MainStay Floating Rate Fund
MainStay MacKay High Yield Corporate Bond Fund
MainStay MacKay Short Duration High Yield Fund
MainStay MacKay Strategic Bond Fund
MainStay MacKay Total Return Bond Fund
MainStay MacKay U.S. Infrastructure Bond Fund
MainStay Short Term Bond Fund
Tax-Exempt Income
MainStay MacKay California Tax Free Opportunities Fund2
MainStay MacKay High Yield Municipal Bond Fund
MainStay MacKay New York Tax Free Opportunities Fund3
MainStay MacKay Short Term Municipal Fund
MainStay MacKay Strategic Municipal Allocation Fund
MainStay MacKay Tax Free Bond Fund
Money Market
MainStay Money Market Fund
Mixed Asset
MainStay Balanced Fund
MainStay Income Builder Fund
MainStay MacKay Convertible Fund
Speciality
MainStay CBRE Global Infrastructure Fund
MainStay CBRE Real Estate Fund
MainStay Cushing MLP Premier Fund
Asset Allocation
MainStay Conservative Allocation Fund
MainStay Conservative ETF Allocation Fund
MainStay Defensive ETF Allocation Fund
MainStay Equity Allocation Fund
MainStay Equity ETF Allocation Fund
MainStay ESG Multi-Asset Allocation Fund
MainStay Growth Allocation Fund
MainStay Growth ETF Allocation Fund
MainStay Moderate Allocation Fund
MainStay Moderate ETF Allocation Fund
Manager
New York Life Investment Management LLC
New York, New York
Subadvisors
Candriam4
Strassen, Luxembourg
CBRE Investment Management Listed Real Assets LLC
Radnor, Pennsylvania
Cushing Asset Management, LP
Dallas, Texas
Epoch Investment Partners, Inc.
New York, New York
MacKay Shields LLC4
New York, New York
NYL Investors LLC4
New York, New York
Wellington Management Company LLP
Boston, Massachusetts
Winslow Capital Management, LLC
Minneapolis, Minnesota
Legal Counsel
Dechert LLP
Washington, District of Columbia
Independent Registered Public Accounting Firm
KPMG LLP
Philadelphia, Pennsylvania
Distributor
NYLIFE Distributors LLC4
Jersey City, New Jersey
Custodian
JPMorgan Chase Bank, N.A.
New York, New York
1.
Prior to February 28, 2022, the Fund's name was MainStay MacKay S&P 500 Index Fund.
| 2. | This Fund is registered for sale in AZ, CA, NV, OR, TX, UT, WA and MI (Class A and Class I shares only), and CO, FL, GA, HI, ID, MA, MD, NH, NJ and NY (Class I shares only). |
| 3. | This Fund is registered for sale in CA, CT, DE, FL, MA, NJ, NY and VT. |
| 4. | An affiliate of New York Life Investment Management LLC. |
Not part of the Annual Report
For more information
800-624-6782
newyorklifeinvestments.com
“New York Life Investments” is both a service mark, and the common trade name, of certain investment advisors affiliated with New York Life Insurance Company. The MainStay Funds® are managed by New York Life Investment Management LLC and distributed by NYLIFE Distributors LLC, 30 Hudson Street, Jersey City, NJ 07302, a wholly owned subsidiary of New York Life Insurance Company. NYLIFE Distributors LLC is a Member FINRA/SIPC.
©2022 NYLIFE Distributors LLC. All rights reserved.
| 5013948.2MS229-22 | MSSB11-12/22 |
(NYLIM) NL052
MainStay MacKay Tax Free Bond Fund
Message from the President and Annual Report
October 31, 2022
Sign up for e-delivery of your shareholder reports. For full details on e-delivery, including who can participate and what you can receive via e-delivery,
please log in to newyorklifeinvestments.com/accounts.
| Not FDIC/NCUA Insured | Not a Deposit | May Lose Value | No Bank Guarantee | Not Insured by Any Government Agency |
This page intentionally left blank
Message from the President
A series of economic and geopolitical challenges undermined equity and fixed-income markets during the 12-month reporting period ended October 31, 2022. Stocks and bonds alike trended lower in the face of sharply rising interest rates, increasing inflationary pressures, slowing economic growth and Russia’s invasion of Ukraine.
The reporting period began on a mixed note, with concerns about the spreading Omicron variant of the COVID-19 virus and increasingly hawkish statements from the U.S. Federal Reserve (the “Fed”) regarding mounting inflation, countered by bullish sentiment stemming from U.S. economic growth and strong corporate earnings. In January 2022, markets turned decisively negative as comments from the Fed raised the likelihood of rate hikes as early as March, and Russia issued increasingly aggressive threats toward Ukraine. The onset of Russia’s invasion in February exacerbated global inflationary pressures while increasing investor uncertainty. Domestic supply shortages, international trade imbalances and rising inflation caused GDP (gross domestic product) to contract in the first and second quarters of the year, although employment and consumer spending proved resilient. Prices for petroleum surged to multi-year highs, while many key agricultural chemicals and industrial metals climbed as well. Accelerating inflationary forces prompted the Fed to implement its most aggressive interest rate increases since the 1980s with a series of five sharp rate hikes, raising the federal funds rate from a range of 0.00% to 0.25% in March to 3.00% to 3.25% in September, with additional rate hikes expected before the end of the year. International central banks generally followed suit, raising rates by varying degrees in efforts to curb local inflation, although most increases remained significantly more modest than those in the United States. Relatively high U.S. interest rates and risk-averse international sentiment pushed U.S. dollar values higher compared to most other currencies, with the ensuing negative impact on global prices for food, fuel and other key, U.S.-dollar-denominated products.
The effects of these interrelated challenges were felt throughout U.S. and international financial markets. The S&P 500® Index, a widely regarded benchmark of U.S. market performance, declined by more than 14% during the reporting period. Although the energy sector generated strong gains, bolstered by elevated oil and gas prices, most other industry areas recorded losses. The more cyclical and growth-oriented sectors of consumer discretionary, real estate and information technology delivered the
weakest returns, while the traditionally defensive and value-oriented consumer staples, utilities and health care sectors outperformed. International stocks lagged compared to their U.S. counterparts, with some emerging markets, such as China, suffering particularly steep losses. A few markets, however, including Brazil, Mexico and the United Arab Emirates, ended the reporting period with little change. Fixed-income markets saw bond prices broadly decline as yields rose along with interest rates. Short-term yields rose faster than long-term yields, producing a yield curve inversion from July through the end of the reporting period, with long-term rates remaining below short-term rates. While floating-rate instruments, which feature variable interest rates that allow investors to benefit from a rising rate environment, provided a degree of insulation from inflation-driven trends, they were not immune to the market’s widespread declines.
While the Fed acknowledges the costs of rising rates in terms of weaker GDP growth and unsettled financial markets over the short term, its primary focus continues to be the longer-term economic impact of inflation. With the latest figures as of the date of this report showing that inflation remains above 8%, versus a target rate of just 2%, the Fed clearly has a distance yet to go, making further rate increases and market volatility more likely in the coming months. The question remains as to whether the Fed and other central banks will manage a so-called “soft landing,” curbing inflation while avoiding a persistent economic slowdown. If they prove successful, we expect that favorable inflation trends and increasingly attractive valuations in both equity and bond markets should eventually translate into sustainable improvements in the investment environment.
Whatever actions the Fed takes and however financial markets react, as a MainStay investor, you can depend on us to continue providing the insight, expertise and service that have long defined New York Life Investments. Thank you for trusting us to help you meet your investment needs.
Sincerely,
Kirk C. Lehneis
President
The opinions expressed are as of the date of this report and are subject to change. There is no guarantee that any forecast made will come to pass. This material does not constitute investment advice and is not intended as an endorsement of any specific investment. Past performance is no guarantee of future results.
Not part of the Annual Report
Investors should refer to the Fund’s Summary Prospectus and/or Prospectus and consider the Fund’s investment objectives, strategies, risks, charges and expenses carefully before investing. The Summary Prospectus and/or Prospectus contain this and other information about the Fund. You may obtain copies of the Fund’s Summary Prospectus, Prospectus and Statement of Additional Information, which includes information about The MainStay Funds' Trustees, free of charge, upon request, by calling toll-free 800-624-6782, by writing to NYLIFE Distributors LLC, Attn: MainStay Marketing Department, 30 Hudson Street, Jersey City, NJ 07302 or by sending an e-mail to MainStayShareholderServices@nylim.com. These documents are also available via the MainStay Funds’ website at newyorklifeinvestments.com. Please read the Fund’s Summary Prospectus and/or Prospectus carefully before investing.
Investment and Performance Comparison (Unaudited)
Performance data quoted represents past performance. Past performance is no guarantee of future results. Because of market volatility and other factors, current performance may be lower or higher than the figures shown. Investment return and principal value will fluctuate, and as a result, when shares are redeemed, they may be worth more or less than their original cost. The graph below depicts the historical performance of Class I shares of the Fund. Performance will vary from class to class based on differences in class-specific expenses and sales charges. For performance information current to the most recent month-end, please call 800-624-6782 or visit newyorklifeinvestments.com.
The performance table and graph do not reflect the deduction of taxes that a shareholder would pay on distributions or Fund share redemptions. Total returns reflect maximum applicable sales charges as indicated in the table below, if any, changes in share price, and reinvestment of dividend and capital gain distributions. The graph assumes the initial investment amount shown below and reflects the deduction of all sales charges that would have applied for the period of investment. Performance figures may reflect certain fee waivers and/or expense limitations, without which total returns may have been lower. For more information on share classes and current fee waivers and/or expense limitations (if any), please refer to the Notes to Financial Statements.
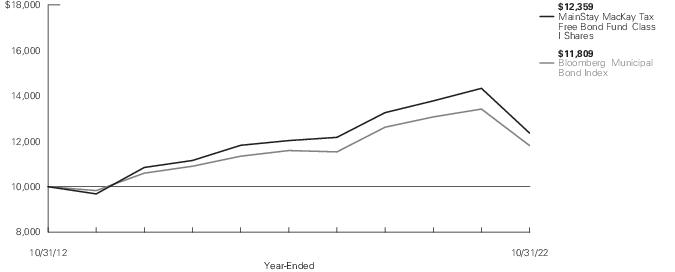
| Average Annual Total Returns for the Year-Ended October 31, 2022 |
| Class | Sales Charge | | Inception
Date | One
Year | Five
Years | Ten Years
or Since
Inception | Gross
Expense
Ratio1 |
| Class A Shares2 | Maximum 3% Initial Sales Charge | With sales charges | 1/3/1995 | -17.83% | -0.63% | 1.42% | 0.73% |
| | | Excluding sales charges | | -13.96 | 0.29 | 1.89 | 0.73 |
| Investor Class Shares3, 4 | Maximum 2.5% Initial Sales Charge | With sales charges | 2/28/2008 | -17.45 | -0.63 | 1.41 | 0.76 |
| | | Excluding sales charges | | -14.01 | 0.29 | 1.88 | 0.76 |
| Class B Shares5 | Maximum 5% CDSC | With sales charges | 5/1/1986 | -18.37 | -0.30 | 1.63 | 1.01 |
| | if Redeemed Within the First Six Years of Purchase | Excluding sales charges | | -14.19 | 0.06 | 1.63 | 1.01 |
| Class C Shares | Maximum 1% CDSC | With sales charges | 9/1/1998 | -15.03 | 0.03 | 1.62 | 1.01 |
| | if Redeemed Within One Year of Purchase | Excluding sales charges | | -14.19 | 0.03 | 1.62 | 1.01 |
| Class C2 Shares | Maximum 1% CDSC | With sales charges | 8/31/2020 | -15.16 | N/A | -5.68 | 1.16 |
| | if Redeemed Within One Year of Purchase | Excluding sales charges | | -14.32 | N/A | -5.68 | 1.16 |
| Class I Shares | No Sales Charge | | 12/21/2009 | -13.75 | 0.54 | 2.14 | 0.48 |
| Class R6 Shares | No Sales Charge | | 11/1/2019 | -13.68 | N/A | -2.23 | 0.43 |
| 1. | The gross expense ratios presented reflect the Fund’s “Total Annual Fund Operating Expenses” from the most recent Prospectus, as supplemented, and may differ from other expense ratios disclosed in this report. |
| 2. | Prior to August 10, 2022, the maximum initial sales charge was 4.5%, which is reflected in the applicable average annual total return figures shown. |
| 3. | Prior to June 30, 2020, the maximum initial sales charge was 4.5%, which is reflected in the applicable average annual total return figures shown. |
| 4. | Prior to August 10, 2022, the maximum initial sales charge was 4%, which is reflected in the applicable average annual total return figures shown. |
| 5. | Class B shares are closed to all new purchases as well as additional investments by existing Class B shareholders. |
The footnotes on the next page are an integral part of the table and graph and should be carefully read in conjunction with them.
| Benchmark Performance* | One
Year | Five
Years | Ten
Years |
| Bloomberg Municipal Bond Index1 | -11.98% | 0.37% | 1.68% |
| Morningstar Muni National Long Category Average2 | -15.58 | -0.28 | 1.21 |
| * | Returns for indices reflect no deductions for fees, expenses or taxes, except for foreign withholding taxes where applicable. Results assume reinvestment of all dividends and capital gains. An investment cannot be made directly in an index. |
| 1. | The Bloomberg Municipal Bond Index is the Fund's primary broad-based securities market index for comparison purposes. The Bloomberg Municipal Bond Index is considered representative of the broad-based market for investment-grade, tax-exempt bonds with a maturity of at least one year. Bonds subject to the alternative minimum tax or with floating or zero coupons are excluded. |
| 2. | The Morningstar Muni National Long Category Average is representative of funds that invest in bonds issued by various state and local governments to fund public projects. The income from these bonds is generally free from federal taxes. These portfolios have durations of more than 7 years. Results are based on average total returns of similar funds with all dividends and capital gain distributions reinvested. |
The footnotes on the preceding page are an integral part of the table and graph and should be carefully read in conjunction with them.
| 6 | MainStay MacKay Tax Free Bond Fund |
Cost in Dollars of a $1,000 Investment in MainStay MacKay Tax Free Bond Fund (Unaudited)
The example below is intended to describe the fees and expenses borne by shareholders during the six-month period from May 1, 2022 to October 31, 2022, and the impact of those costs on your investment.
Example
As a shareholder of the Fund you incur two types of costs: (1) transaction costs, including exchange fees and sales charges (loads) on purchases (as applicable), and (2) ongoing costs, including management fees, distribution and/or service (12b-1) fees and other Fund expenses (as applicable). This example is intended to help you understand your ongoing costs (in dollars) of investing in the Fund and to compare these costs with the ongoing costs of investing in other mutual funds. The example is based on an investment of $1,000 made at the beginning of the six-month period and held for the entire period from May 1, 2022 to October 31, 2022.
This example illustrates your Fund’s ongoing costs in two ways:
Actual Expenses
The second and third data columns in the table below provide information about actual account values and actual expenses. You may use the information in these columns, together with the amount you invested, to estimate the expenses that you paid during the six months ended October 31, 2022. Simply divide your account value by $1,000 (for example, an
$8,600 account value divided by $1,000 = 8.6), then multiply the result by the number under the heading entitled “Expenses Paid During Period” to estimate the expenses you paid on your account during this period.
Hypothetical Example for Comparison Purposes
The fourth and fifth data columns in the table below provide information about hypothetical account values and hypothetical expenses based on the Fund’s actual expense ratio and an assumed rate of return of 5% per year before expenses, which is not the Fund’s actual return. The hypothetical account values and expenses may not be used to estimate the actual ending account balances or expenses you paid for the six-month period shown. You may use this information to compare the ongoing costs of investing in the Fund with the ongoing costs of investing in other mutual funds. To do so, compare this 5% hypothetical example with the 5% hypothetical examples that appear in the shareholder reports of the other mutual funds.
Please note that the expenses shown in the table are meant to highlight your ongoing costs only and do not reflect any transactional costs, such as exchange fees or sales charges (loads). Therefore, the fourth and fifth data columns of the table are useful in comparing ongoing costs only and will not help you determine the relative total costs of owning different funds. In addition, if these transactional costs were included, your costs would have been higher.
| Share Class | Beginning
Account
Value
5/1/22 | Ending Account
Value (Based
on Actual
Returns and
Expenses)
10/31/22 | Expenses
Paid
During
Period1 | Ending Account
Value (Based
on Hypothetical
5% Annualized
Return and
Actual Expenses)
10/31/22 | Expenses
Paid
During
Period1 | Net Expense
Ratio
During
Period2 |
| Class A Shares | $1,000.00 | $944.10 | $3.72 | $1,021.37 | $3.87 | 0.76% |
| Investor Class Shares | $1,000.00 | $944.20 | $3.87 | $1,021.22 | $4.02 | 0.79% |
| Class B Shares | $1,000.00 | $942.80 | $5.09 | $1,019.96 | $5.30 | 1.04% |
| Class C Shares | $1,000.00 | $942.80 | $5.09 | $1,019.96 | $5.30 | 1.04% |
| Class C2 Shares | $1,000.00 | $942.10 | $5.83 | $1,019.21 | $6.06 | 1.19% |
| Class I Shares | $1,000.00 | $945.30 | $2.50 | $1,022.63 | $2.60 | 0.51% |
| Class R6 Shares | $1,000.00 | $945.60 | $2.21 | $1,022.94 | $2.29 | 0.45% |
| 1. | Expenses are equal to the Fund’s annualized expense ratio of each class multiplied by the average account value over the period, divided by 365 and multiplied by 184 (to reflect the six-month period). The table above represents the actual expenses incurred during the six-month period. In addition to the fees and expenses which the Fund bears directly, it also indirectly bears a pro rata share of the fees and expenses of the underlying funds in which it invests. Such indirect expenses are not included in the above-reported expense figures. |
| 2. | Expenses are equal to the Fund's annualized expense ratio to reflect the six-month period. |
Portfolio Composition as of October 31, 2022 (Unaudited)
| New York | 18.7% |
| California | 15.3 |
| Illinois | 9.2 |
| Texas | 7.5 |
| Florida | 7.4 |
| Georgia | 4.3 |
| New Jersey | 4.2 |
| Utah | 3.2 |
| Alabama | 2.2 |
| Pennsylvania | 1.9 |
| Nebraska | 1.6 |
| Colorado | 1.5 |
| Washington | 1.5 |
| Connecticut | 1.5 |
| South Carolina | 1.4 |
| District of Columbia | 1.3 |
| Maryland | 1.2 |
| Ohio | 1.1 |
| Michigan | 1.1 |
| Massachusetts | 1.1 |
| U.S. Virgin Islands | 1.1 |
| Nevada | 0.9 |
| Kentucky | 0.8 |
| Iowa | 0.8 |
| Arizona | 0.7 |
| Louisiana | 0.5 |
| Puerto Rico | 0.5 |
| Missouri | 0.5 |
| Minnesota | 0.5% |
| Tennessee | 0.4 |
| Virginia | 0.4 |
| Oklahoma | 0.4 |
| Indiana | 0.4 |
| Montana | 0.4 |
| Guam | 0.3 |
| Arkansas | 0.3 |
| Kansas | 0.2 |
| Oregon | 0.2 |
| Rhode Island | 0.2 |
| Wisconsin | 0.2 |
| Hawaii | 0.2 |
| Idaho | 0.1 |
| New Hampshire | 0.1 |
| North Dakota | 0.1 |
| South Dakota | 0.1 |
| Vermont | 0.1 |
| Alaska | 0.0‡ |
| Maine | 0.0‡ |
| Mississippi | 0.0‡ |
| Delaware | 0.0‡ |
| New Mexico | 0.0‡ |
| Short–Term Investment | 1.7 |
| Other Assets, Less Liabilities | 0.7 |
| | 100.0% |
| ‡ | Less than one–tenth of a percent. |
See Portfolio of Investments beginning on page 11 for specific holdings within these categories. The Fund's holdings are subject to change.
Top Ten Holdings and/or Issuers Held as of October 31, 2022 (excluding short-term investments) (Unaudited)
| 1. | State of California, 3.00%-5.25%, due 11/1/28–9/1/52 |
| 2. | New York State Dormitory Authority, 3.00%-5.00%, due 3/15/34–3/15/45 |
| 3. | New York City Transitional Finance Authority, 1.60%-5.25%, due 5/1/32–2/1/51 |
| 4. | Metropolitan Transportation Authority, 1.60%-5.25%, due 11/15/26–11/15/50 |
| 5. | Triborough Bridge & Tunnel Authority, 2.417%-5.50%, due 1/1/32–5/15/52 |
| 6. | New York State Urban Development Corp., 3.00%-5.00%, due 3/15/30–3/15/50 |
| 7. | Black Belt Energy Gas District, 2.59%-4.00%, due 10/1/49–4/1/53 |
| 8. | California Health Facilities Financing Authority, 3.00%-5.00%, due 10/1/35–8/15/51 |
| 9. | New Jersey Transportation Trust Fund Authority, (zero coupon)-5.25%, due 12/15/26–6/15/46 |
| 10. | Chicago Transit Authority Sales Tax Receipts Fund, 4.00%-5.25%, due 12/1/46–12/1/50 |
| 8 | MainStay MacKay Tax Free Bond Fund |
Portfolio Management Discussion and Analysis (Unaudited)
Questions answered by portfolio managers John Loffredo, CFA, Robert DiMella, CFA, Michael Petty, David Dowden, Scott Sprauer, Frances Lewis and Michael Denlinger, CFA, of MacKay Shields LLC, the Fund’s Subadvisor.
How did MainStay MacKay Tax Free Bond Fund perform relative to its benchmark and peer group during the 12 months ended October 31, 2022?
For the 12 months ended October 31, 2022, Class I shares of MainStay MacKay Tax Free Bond Fund returned −13.75%, underperforming the −11.98% return of the Fund’s benchmark, the Bloomberg Municipal Bond Index (the "Index"). Over the same period, Class I shares outperformed the −15.58% return of the Morningstar Muni National Long Category Average.1
What factors affected the Fund’s relative performance during the reporting period?
During the reporting period, both municipal and U.S. Treasury rates rose, with the municipal yield curve2 steepening as outflows persisted. As a result, ratios cheapened across the curve, most notably on the long end. The Fund’s yield curve positioning led to underperformance relative to the Index, as the increase in rates resulted in overweight exposure to bonds maturing in 15+ years, detracting from relative performance.
In addition, the Fund’s overweight exposure to bonds with coupons of 4% detracted from relative returns. From a rating perspective, the Fund’s overweight exposure to bonds rated AA-A detracted from relative performance; however, the negative impact of this position was partially offset by the positive effect of the Fund’s underweight exposure to AAA-rated bonds.3 Overweight exposure to holdings from the states of New York and Illinois also detracted from performance. New York has been slow to rebound from pre-Covid levels, while the highly liquid nature of Illinois bonds moved prices further. However, underweight exposure to Massachusetts bonds made a positive contribution to the Fund’s performance. (Contributions take weightings and total returns into account.)
During the reporting period, were there any market events that materially impacted the Fund’s performance or liquidity?
During the reporting period, markets extended their historic drawdown driven by the combination of rising U.S. Treasury yields, ongoing monetary policy tightening and geopolitical uncertainty.
The municipal market mirrored this broader sell-off, and many investors reacted by withdrawing money from their municipal holdings. The municipal market experienced record outflows, which ultimately drove municipal rates higher.
During the reporting period, how was the Fund’s performance materially affected by investments in derivatives?
The Fund will employ U.S. Treasury futures hedges at times, typically as a paired strategy with longer maturity bonds, to dampen duration4 and interest rate sensitivity. During the reporting period, the hedge was a positive contributor to Fund performance as municipal exposure on the long end of the curve underperformed the overall market.
What was the Fund’s duration strategy during the reporting period?
We do not make interest rate forecasts or duration bets. Rather, we aim to adopt a duration-neutral posture in the Fund relative to the Index. As of October 31, 2022, the modified duration to worst5 for the Fund was 7.25 years compared to 6.71 years for the Index.
During the reporting period, which sectors were the strongest positive contributors to the Fund’s relative performance and which sectors were particularly weak?
During the reporting period, the Fund held underweight exposure to the state general obligation, education and housing sectors, which contributed positively to relative performance. Conversely, the Fund held overweight exposure to the special tax, transportation and electric sectors detracted from relative performance.
What were some of the Fund’s largest purchases and sales during the reporting period?
As the Fund remains focused on diversification and liquidity, no individual purchase or sale was considered significant, although sector overweights or security structure, in their entirety, did have an impact.
| 1. | See page 5 for other share class returns, which may be higher or lower than Class I share returns. See page 6 for more information on benchmark and peer group returns. |
| 2. | The yield curve is a line that plots the yields of various securities of similar quality—typically U.S. Treasury issues—across a range of maturities. The U.S. Treasury yield curve serves as a benchmark for other debt and is used in economic forecasting. |
| 3. | An obligation rated ‘AAA’ has the highest rating assigned by Standard & Poor’s (“S&P”), and in the opinion of S&P, the obligor’s capacity to meet its financial commitment on the obligation is extremely strong. An obligation rated ‘AA’ by S&P is deemed by S&P to differ from the highest-rated obligations only to a small degree. In the opinion of S&P, the obligor's capacity to meet its financial commitment on the obligation is very strong. An obligation rated ‘A’ by S&P is deemed by S&P to be somewhat more susceptible to the adverse effects of changes in circumstances and economic conditions than obligations in higher-rated categories. In the opinion of S&P, however, the obligor's capacity to meet its financial commitment on the obligation is still strong. When applied to Fund holdings, ratings are based solely on the creditworthiness of the bonds in the portfolio and are not meant to represent the security or safety of the Fund. |
| 4. | Duration is a measure of the price sensitivity of a fixed-income investment to changes in interest rates. Duration is expressed as a number of years and is considered a more accurate sensitivity gauge than average maturity. |
| 5. | Modified duration is inversely related to the approximate percentage change in price for a given change in yield. Duration to worst is the duration of a bond computed using the bond’s nearest call date or maturity, whichever comes first. This measure ignores future cash flow fluctuations due to embedded optionality. |
How did the Fund’s sector weighting change during the reporting period?
During the reporting period, there were no material changes to the weightings in the Fund. There were small increases to the Fund’s water/sewer, special tax and electric sector exposures. In addition, there was an increase of higher-quality credit exposure to AAA-rated bonds, as well as an increase to bonds maturing 15 years and over. Conversely, there was a decrease in the Fund’s exposure to the prerefunded/ETM (escrowed to maturity), housing and transportation sectors. Across the credit spectrum, there was a decrease in A-rated bonds.
How was the Fund positioned at the end of the reporting period?
As of October 31, 2022, the Fund maintained overweight exposure to the long end of the curve. We believe there are more compelling ratios on the longer end of the curve, which are likely to contribute to outperformance over time. In addition, the Fund held overweight exposure to the special tax, electric and IDR/PCR (industry development revenue/pollution control revenue) sectors. Across states, the Fund held overweight exposure to Illinois and Florida bonds. From a credit perspective, the Fund held overweight exposure to AA-rated bonds. At the same time, the Fund held underweight positions in the state general obligation, prerefunded and hospital sectors, as well underweight positions in A-rated credits and bonds from the state of Massachusetts.
The opinions expressed are those of the portfolio managers as of the date of this report and are subject to change. There is no guarantee that any forecasts will come to pass. This material does not constitute investment advice and is not intended as an endorsement of any specific investment.
| 10 | MainStay MacKay Tax Free Bond Fund |
Portfolio of Investments October 31, 2022†
| | Principal
Amount | Value |
| Municipal Bonds 97.6% |
| Long-Term Municipal Bonds 93.5% |
| Alabama 1.5% |
| Black Belt Energy Gas District, Project No.5, Revenue Bonds | | |
| Series A-1 | | |
| 4.00%, due 10/1/49 (a) | $ 7,000,000 | $ 6,725,517 |
| Black Belt Energy Gas District, Gas Project No.6, Revenue Bonds | | |
| Series B | | |
| 4.00%, due 10/1/52 (a) | 8,860,000 | ���8,531,833 |
| Black Belt Energy Gas District, Gas Project No.7, Revenue Bonds | | |
| Series C-1 | | |
| 4.00%, due 10/1/52 (a) | 26,250,000 | 25,277,721 |
| Black Belt Energy Gas District, Revenue Bonds | | |
| Series B-1 | | |
| 4.00%, due 4/1/53 (a) | 13,350,000 | 12,671,472 |
| City of Birmingham AL, Unlimited General Obligation | | |
| Series A | | |
| 5.00%, due 3/1/43 | 2,650,000 | 2,666,210 |
| County of Jefferson AL, Sewer, Revenue Bonds, Sub. Lien | | |
| Series D | | |
| 6.00%, due 10/1/42 | 5,160,000 | 5,503,994 |
| Lower Alabama Gas District (The), Gas Project, Project No. 2, Revenue Bonds | | |
| 4.00%, due 12/1/50 (a) | 750,000 | 728,473 |
| Lower Alabama Gas District (The), Revenue Bonds | | |
| Series A | | |
| 5.00%, due 9/1/46 | 8,950,000 | 8,425,533 |
| Southeast Energy Authority, A Cooperative District, Project No. 1, Revenue Bonds | | |
| Series A | | |
| 4.00%, due 11/1/51 (a) | 10,655,000 | 9,951,662 |
| Southeast Energy Authority, A Cooperative District, Project No. 2, Revenue Bonds | | |
| Series B | | |
| 4.00%, due 12/1/51 (a) | 16,000,000 | 14,413,912 |
| | Principal
Amount | Value |
| |
| Alabama (continued) |
| University of South Alabama, Revenue Bonds | | |
| Insured: AGM | | |
| 4.00%, due 11/1/35 | $ 2,000,000 | $ 1,906,894 |
| | | 96,803,221 |
| Alaska 0.0% ‡ |
| Alaska Industrial Development & Export Authority, Greater Fairbanks Community Hospital Foundation Obligated Group, Revenue Bonds | | |
| 5.00%, due 4/1/32 | 3,300,000 | 3,302,125 |
| Arizona 0.7% |
| Arizona Department of Transportation, State Highway Fund, Revenue Bonds | | |
| 5.00%, due 7/1/31 | 9,000,000 | 9,226,054 |
| Arizona Industrial Development Authority, Provident Group, NCCU Properties LLC, Central University Project, Revenue Bonds | | |
| Series A, Insured: BAM | | |
| 4.00%, due 6/1/44 | 940,000 | 810,817 |
| City of Phoenix AZ, Unlimited General Obligation | | |
| 5.00%, due 7/1/26 | 3,500,000 | 3,699,374 |
| City of Phoenix AZ Civic Improvement Corp., Water System, Revenue Bonds, Junior Lien | | |
| Series A | | |
| 5.00%, due 7/1/44 | 10,780,000 | 11,230,462 |
| Gilbert Water Resource Municipal Property Corp., Utility System, Revenue Bonds, Senior Lien | | |
| 5.00%, due 7/15/33 | 6,500,000 | 7,202,114 |
| Maricopa County Unified School District No. 090 Saddle Mountain, Unlimited General Obligation | | |
| Insured: AGM | | |
| 4.00%, due 7/1/35 | 6,375,000 | 6,350,079 |
The notes to the financial statements are an integral part of, and should be read in conjunction with, the financial statements.
11
Portfolio of Investments October 31, 2022† (continued)
| | Principal
Amount | Value |
| Long-Term Municipal Bonds (continued) |
| Arizona (continued) |
| Salt River Project Agricultural Improvement & Power District, Revenue Bonds | | |
| Series A | | |
| 5.00%, due 1/1/33 | $ 4,250,000 | $ 4,484,243 |
| | | 43,003,143 |
| Arkansas 0.3% |
| County of Pulaski AR, Arkansas Children's Hospital, Revenue Bonds | | |
| 5.00%, due 3/1/34 | 2,000,000 | 2,062,932 |
| Little Rock School District, Limited General Obligation | | |
| Series A, Insured: BAM State Aid Withholding | | |
| 3.00%, due 2/1/46 | 4,155,000 | 2,899,034 |
| Series A, Insured: BAM State Aid Withholding | | |
| 3.00%, due 2/1/50 | 6,700,000 | 4,418,161 |
| Series A, Insured: BAM State Aid Withholding | | |
| 3.00%, due 2/1/51 | 6,500,000 | 4,259,246 |
| Springdale Public Facilities Board, Arkansas Children's Northwest, Inc., Revenue Bonds | | |
| 5.00%, due 3/1/34 | 2,640,000 | 2,679,098 |
| University of Arkansas, UALR Campus, Revenue Bonds | | |
| 5.00%, due 10/1/30 | 1,110,000 | 1,160,924 |
| 5.00%, due 10/1/31 | 1,205,000 | 1,257,604 |
| | | 18,736,999 |
| California 15.0% |
| Alameda Corridor Transportation Authority, Revenue Bonds | | |
| Series C, Insured: AGM | | |
| 5.00%, due 10/1/52 | 5,000,000 | 4,996,621 |
| Alta Loma School District, Unlimited General Obligation | | |
| Series C | | |
| 4.00%, due 8/1/45 | 4,000,000 | 3,518,578 |
| Anaheim City School District, Election of 2010, Unlimited General Obligation | | |
| Insured: AGM | | |
| 5.00%, due 8/1/51 | 9,500,000 | 9,913,007 |
| | Principal
Amount | Value |
| |
| California (continued) |
| Antelope Valley Community College District, Election of 2016, Unlimited General Obligation | | |
| Series B | | |
| 3.00%, due 8/1/50 | $ 4,000,000 | $ 2,712,800 |
| Cabrillo Unified School District, Election of 2018, Unlimited General Obligation | | |
| Series B, Insured: AGM-CR | | |
| 5.00%, due 8/1/50 | 4,355,000 | 4,473,668 |
| California Community Choice Financing Authority, Clean Energy Project, Green Bond, Revenue Bonds | | |
| Series B-1 | | |
| 4.00%, due 2/1/52 (a) | 9,300,000 | 8,682,006 |
| California Health Facilities Financing Authority, CommonSpirit Health, Revenue Bonds | | |
| Series A | | |
| 3.00%, due 4/1/44 | 2,075,000 | 1,343,866 |
| Series A | | |
| 4.00%, due 4/1/49 | 9,200,000 | 7,101,187 |
| California Health Facilities Financing Authority, Cedars Sinai Health System, Revenue Bonds | | |
| Series A, Insured: BAM | | |
| 3.00%, due 8/15/51 | 4,500,000 | 3,058,023 |
| Series A, Insured: BAM | | |
| 4.00%, due 8/15/48 | 83,425,000 | 73,992,127 |
| Series A | | |
| 5.00%, due 8/15/51 | 2,950,000 | 2,997,034 |
| California Health Facilities Financing Authority, Providence St. Joseph Health Obligated Group, Revenue Bonds | | |
| Series A | | |
| 4.00%, due 10/1/35 | 1,230,000 | 1,144,252 |
| California Infrastructure and Economic Development Bank, California State Teachers' Retirement System, Revenue Bonds | | |
| 5.00%, due 8/1/49 | 8,950,000 | 9,068,340 |
The notes to the financial statements are an integral part of, and should be read in conjunction with, the financial statements.
| 12 | MainStay MacKay Tax Free Bond Fund |
| | Principal
Amount | Value |
| Long-Term Municipal Bonds (continued) |
| California (continued) |
| California Municipal Finance Authority, Community Health System, Revenue Bonds | | |
| Series A, Insured: AGM-CR | | |
| 4.00%, due 2/1/41 | $ 2,500,000 | $ 2,238,732 |
| California Municipal Finance Authority, Southern California Institute of Architecture Project, Revenue Bonds | | |
| 5.00%, due 12/1/26 | 470,000 | 480,389 |
| 5.00%, due 12/1/27 | 495,000 | 506,595 |
| 5.00%, due 12/1/28 | 520,000 | 531,243 |
| California Municipal Finance Authority, CHF-Davis I LLC, West Village Student Housing Project, Revenue Bonds | | |
| 5.00%, due 5/15/32 | 1,570,000 | 1,567,139 |
| Insured: BAM | | |
| 5.00%, due 5/15/32 | 1,500,000 | 1,536,728 |
| Insured: BAM | | |
| 5.00%, due 5/15/36 | 3,650,000 | 3,690,231 |
| Insured: BAM | | |
| 5.00%, due 5/15/39 | 8,715,000 | 8,753,310 |
| Insured: BAM | | |
| 5.00%, due 5/15/43 | 10,650,000 | 10,593,756 |
| California Public Finance Authority, Hoag Memorial Hospital Presbyterian, Revenue Bonds | | |
| Series A | | |
| 4.00%, due 7/15/51 | 20,500,000 | 17,661,832 |
| California State Public Works Board, Revenue Bonds | | |
| Series C | | |
| 5.00%, due 8/1/35 | 7,250,000 | 7,805,088 |
| California State University, Systemwide, Revenue Bonds | | |
| Series C | | |
| 4.00%, due 11/1/45 | 10,000,000 | 8,779,345 |
| Series A | | |
| 5.00%, due 11/1/47 | 10,225,000 | 10,453,174 |
| Series A | | |
| 5.00%, due 11/1/48 | 13,645,000 | 14,030,138 |
| Carlsbad Unified School District, Election of 2018, Unlimited General Obligation | | |
| Series B | | |
| 3.00%, due 8/1/46 | 2,975,000 | 2,039,922 |
| | Principal
Amount | Value |
| |
| California (continued) |
| Center Unified School District, Election of 2008, Unlimited General Obligation | | |
| Series B, Insured: BAM | | |
| 3.00%, due 8/1/51 | $ 5,000,000 | $ 3,326,050 |
| Chino Valley Unified School District, Election 2016, Limited General Obligation | | |
| Series B, Insured: AGM-CR | | |
| 3.375%, due 8/1/50 | 8,370,000 | 5,984,745 |
| City & County of San Francisco CA, Certificate of Participation | | |
| Series A | | |
| 4.00%, due 4/1/38 | 4,010,000 | 3,746,904 |
| City & County of San Francisco CA, South Van Ness Project, Certificate of Participation | | |
| Series A | | |
| 4.00%, due 4/1/43 | 4,500,000 | 4,011,544 |
| City of Escondido CA, Unlimited General Obligation | | |
| 5.00%, due 9/1/36 | 4,250,000 | 4,397,531 |
| City of Los Angeles CA, Department of Airports, Revenue Bonds (b) | | |
| Series D | | |
| 3.00%, due 5/15/39 | 4,280,000 | 3,244,186 |
| Series D | | |
| 4.00%, due 5/15/40 | 2,200,000 | 1,926,132 |
| Series E | | |
| 5.00%, due 5/15/36 | 2,955,000 | 3,096,340 |
| Series A | | |
| 5.00%, due 5/15/44 | 3,785,000 | 3,725,097 |
| Series E | | |
| 5.00%, due 5/15/44 | 8,950,000 | 9,140,438 |
| City of Los Angeles CA, Department of Airports, Revenue Bonds, Senior Lien | | |
| Series C | | |
| 5.00%, due 5/15/45 (b) | 3,500,000 | 3,504,810 |
| Series I | | |
| 5.00%, due 5/15/48 | 6,050,000 | 6,232,395 |
| Series H | | |
| 5.25%, due 5/15/47 (b) | 8,650,000 | 8,757,181 |
| Series G | | |
| 5.50%, due 5/15/36 (b) | 7,785,000 | 8,199,720 |
| Series G | | |
| 5.50%, due 5/15/40 (b) | 7,000,000 | 7,261,750 |
The notes to the financial statements are an integral part of, and should be read in conjunction with, the financial statements.
13
Portfolio of Investments October 31, 2022† (continued)
| | Principal
Amount | Value |
| Long-Term Municipal Bonds (continued) |
| California (continued) |
| City of Los Angeles CA, Wastewater System, Revenue Bonds | | |
| Series A | | |
| 5.00%, due 6/1/48 | $ 9,050,000 | $ 9,316,499 |
| City of Sacramento CA, Transient Occupancy Tax, Revenue Bonds | | |
| Series A | | |
| 5.00%, due 6/1/29 | 2,915,000 | 3,091,263 |
| Series A | | |
| 5.00%, due 6/1/30 | 4,170,000 | 4,425,714 |
| Series A | | |
| 5.00%, due 6/1/32 | 2,260,000 | 2,384,239 |
| Series A | | |
| 5.00%, due 6/1/33 | 1,225,000 | 1,288,336 |
| City of San Jose CA, Unlimited General Obligation | | |
| Series A | | |
| 5.00%, due 9/1/45 | 6,400,000 | 6,771,364 |
| Series A | | |
| 5.00%, due 9/1/46 | 6,600,000 | 6,971,732 |
| Coachella Valley Unified School District, Election 2005, Unlimited General Obligation | | |
| Series F, Insured: BAM | | |
| 5.00%, due 8/1/46 | 12,930,000 | 13,252,285 |
| Coast Community College District, Election 2012, Unlimited General Obligation | | |
| Series D | | |
| 4.50%, due 8/1/39 | 10,000,000 | 10,539,656 |
| Compton Unified School District, Unlimited General Obligation | | |
| Series B, Insured: BAM | | |
| (zero coupon), due 6/1/38 | 1,250,000 | 584,476 |
| Series B, Insured: BAM | | |
| (zero coupon), due 6/1/39 | 4,855,000 | 2,139,212 |
| Corona-Norco Unified School District, Election 2014, Unlimited General Obligation | | |
| Series C | | |
| 4.00%, due 8/1/49 | 6,200,000 | 5,532,339 |
| Cotati-Rohnert Park Unified School District, Election 2016, Unlimited General Obligation | | |
| Series C, Insured: AGM | | |
| 5.00%, due 8/1/42 | 2,615,000 | 2,685,323 |
| | Principal
Amount | Value |
| |
| California (continued) |
| El Camino Community College District Foundation (The), Election of 2002, Unlimited General Obligation | | |
| Series C | | |
| (zero coupon), due 8/1/38 | $ 12,000,000 | $ 5,829,271 |
| Evergreen School District, Election of 2014, Unlimited General Obligation | | |
| 4.00%, due 8/1/41 | 4,000,000 | 3,572,749 |
| Firebaugh-Las Deltas Unified School District, Election 2016, Unlimited General Obligation | | |
| Series A, Insured: AGM | | |
| 5.25%, due 8/1/41 | 2,500,000 | 2,608,182 |
| Fontana Public Facilities Financing Authority, City of Fontana, Revenue Bonds | | |
| Series A, Insured: BAM | | |
| 5.00%, due 9/1/32 | 1,320,000 | 1,352,892 |
| Foothill-Eastern Transportation Corridor Agency, Revenue Bonds | | |
| Series B-2, Insured: AGM-CR | | |
| 3.50%, due 1/15/53 | 4,265,000 | 3,190,341 |
| Grossmont-Cuyamaca Community College District, Election of 2012, Unlimited General Obligation | | |
| Series B | | |
| 4.00%, due 8/1/47 | 6,000,000 | 5,315,552 |
| Jurupa Unified School District, Election 2014, Unlimited General Obligation | | |
| Series C | | |
| 5.25%, due 8/1/43 | 4,700,000 | 4,970,663 |
| Kern Community College District, Election 2016, Unlimited General Obligation | | |
| Series C, Insured: BAM | | |
| 3.00%, due 8/1/46 | 4,200,000 | 2,875,056 |
| Live Oak Elementary School District, Certificate of Participation | | |
| Insured: AGM | | |
| 5.00%, due 8/1/39 | 2,705,000 | 2,791,964 |
| Los Angeles County Metropolitan Transportation Authority, Sales Tax, Revenue Bonds | | |
| Series A | | |
| 4.00%, due 6/1/36 | 5,000,000 | 4,897,987 |
The notes to the financial statements are an integral part of, and should be read in conjunction with, the financial statements.
| 14 | MainStay MacKay Tax Free Bond Fund |
| | Principal
Amount | Value |
| Long-Term Municipal Bonds (continued) |
| California (continued) |
| Los Angeles County Public Works Financing Authority, Revenue Bonds | | |
| Series E-1 | | |
| 5.00%, due 12/1/44 | $ 3,575,000 | $ 3,732,452 |
| Los Angeles Department of Water & Power, Revenue Bonds | | |
| Series B | | |
| 5.00%, due 7/1/33 | 5,500,000 | 5,553,019 |
| Los Angeles Unified School District, Unlimited General Obligation | | |
| Series C | | |
| 4.00%, due 7/1/33 | 3,000,000 | 2,973,644 |
| Series C | | |
| 4.00%, due 7/1/38 | 6,000,000 | 5,627,382 |
| Series A | | |
| 5.00%, due 7/1/32 | 7,480,000 | 8,186,853 |
| Series A | | |
| 5.00%, due 7/1/33 | 8,020,000 | 8,741,415 |
| Los Angeles Unified School District, Election of 2008, Unlimited General Obligation | | |
| Series B-1, Insured: AGM-CR | | |
| 5.25%, due 7/1/42 | 43,405,000 | 45,735,801 |
| Murrieta Valley Unified School District, Election of 2014, Unlimited General Obligation | | |
| 5.25%, due 9/1/51 | 5,300,000 | 5,667,121 |
| North Lake Tahoe Public Financing Authority, Health & Human Services Center, Revenue Bonds | | |
| 4.50%, due 12/1/52 | 4,645,000 | 4,408,406 |
| Oakland Unified School District, Alameda County, Unlimited General Obligation | | |
| Insured: AGM | | |
| 5.00%, due 8/1/27 | 1,160,000 | 1,211,868 |
| Insured: AGM | | |
| 5.00%, due 8/1/28 | 1,755,000 | 1,833,048 |
| Insured: AGM | | |
| 5.00%, due 8/1/29 | 2,535,000 | 2,644,451 |
| Ontario Montclair School District, Election of 2016, Unlimited General Obligation | | |
| Series A | | |
| 5.00%, due 8/1/46 | 3,500,000 | 3,599,243 |
| | Principal
Amount | Value |
| |
| California (continued) |
| Orange County Sanitation District, Revenue Bonds | | |
| Series A | | |
| 5.00%, due 2/1/30 | $ 9,000,000 | $ 9,237,963 |
| Paramount Unified School District, Election 2006, Unlimited General Obligation | | |
| Insured: BAM | | |
| (zero coupon), due 8/1/43 | 23,300,000 | 5,909,511 |
| Peninsula Corridor Joint Powers Board, Green Bond, Revenue Bonds | | |
| Series A | | |
| 5.00%, due 6/1/47 | 3,250,000 | 3,410,026 |
| Peralta Community College District, Unlimited General Obligation | | |
| Series A | | |
| 4.00%, due 8/1/39 | 4,500,000 | 4,018,977 |
| Richmond Joint Powers Financing Authority, Civic Center Project, Revenue Bonds | | |
| Series A, Insured: AGM | | |
| 5.00%, due 11/1/36 | 3,000,000 | 3,131,314 |
| Riverside County Transportation Commission, Sales Tax, Revenue Bonds | | |
| Series B | | |
| 4.00%, due 6/1/36 | 17,950,000 | 17,511,121 |
| Sacramento Area Flood Control Agency, Consolidated Capital Assessment District No. 2, Special Assessment | | |
| Series A | | |
| 5.00%, due 10/1/36 | 3,445,000 | 3,582,802 |
| Sacramento City Unified School District, Election of 2020, Unlimited General Obligation | | |
| Series A, Insured: BAM | | |
| 5.50%, due 8/1/47 | 4,525,000 | 4,870,905 |
| Series A, Insured: BAM | | |
| 5.50%, due 8/1/52 | 14,000,000 | 15,025,342 |
| San Bernardino City Unified School District, Election 2012, Unlimited General Obligation | | |
| Series A, Insured: AGM | | |
| 5.00%, due 8/1/30 | 1,000,000 | 1,013,726 |
The notes to the financial statements are an integral part of, and should be read in conjunction with, the financial statements.
15
Portfolio of Investments October 31, 2022† (continued)
| | Principal
Amount | Value |
| Long-Term Municipal Bonds (continued) |
| California (continued) |
| San Diego Association of Governments, South Bay Expressway, Revenue Bonds, Senior Lien | | |
| Series A | | |
| 5.00%, due 7/1/30 | $ 2,225,000 | $ 2,353,201 |
| Series A | | |
| 5.00%, due 7/1/32 | 1,800,000 | 1,893,909 |
| Series A | | |
| 5.00%, due 7/1/38 | 1,150,000 | 1,197,480 |
| San Diego County Water Authority, Revenue Bonds | | |
| Series A | | |
| 5.00%, due 5/1/47 | 4,000,000 | 4,249,455 |
| San Diego Public Facilities Financing Authority, Capital Improvement Projects, Revenue Bonds | | |
| Series A | | |
| 5.00%, due 10/15/44 | 2,500,000 | 2,556,896 |
| San Diego Unified School District, Election of 2012, Unlimited General Obligation | | |
| Series M-2 | | |
| 3.00%, due 7/1/50 | 5,250,000 | 3,640,545 |
| Series I | | |
| 5.00%, due 7/1/41 | 4,000,000 | 4,080,925 |
| San Francisco Bay Area Rapid Transit District, Election of 2016, Unlimited General Obligation | | |
| Series C-1 | | |
| 3.00%, due 8/1/50 | 4,000,000 | 2,775,225 |
| San Francisco City & County Airport Commission, San Francisco International Airport, Revenue Bonds, Second Series | | |
| Series A | | |
| 5.00%, due 5/1/34 (b) | 7,750,000 | 7,878,679 |
| San Francisco City & County Airport Commission, San Francisco International Airport, Revenue Bonds | | |
| Series A | | |
| 5.00%, due 5/1/49 (b) | 55,055,000 | 52,890,127 |
| | Principal
Amount | Value |
| |
| California (continued) |
| San Jose Evergreen Community College District, Election of 2016, Unlimited General Obligation | | |
| Series B | | |
| 3.00%, due 9/1/41 | $ 1,065,000 | $ 797,911 |
| San Leandro Unified School District, Election of 2020, Unlimited General Obligation | | |
| Series B | | |
| 5.25%, due 8/1/48 | 11,500,000 | 12,138,003 |
| San Marcos Schools Financing Authority, San Marcos Unified School District, Revenue Bonds | | |
| Insured: AGM | | |
| 5.00%, due 8/15/34 | 1,000,000 | 1,046,163 |
| Insured: AGM | | |
| 5.00%, due 8/15/35 | 1,000,000 | 1,044,154 |
| Insured: AGM | | |
| 5.00%, due 8/15/36 | 1,100,000 | 1,147,224 |
| San Mateo Union High School District, Capital Appreciation, Election of 2010, Unlimited General Obligation | | |
| Series A | | |
| (zero coupon), due 9/1/41 | 7,000,000 | 6,152,046 |
| Santa Monica Community College District, Election 2016, Unlimited General Obligation | | |
| Series A | | |
| 4.00%, due 8/1/47 | 7,630,000 | 6,703,295 |
| Sierra Joint Community College District, Election 2018, Unlimited General Obligation | | |
| Series A | | |
| 4.00%, due 8/1/53 | 3,000,000 | 2,608,137 |
| Simi Valley Unified School District, Unlimited General Obligation | | |
| Series C | | |
| 4.00%, due 8/1/50 | 11,000,000 | 9,514,944 |
| State of California, Various Purpose, Unlimited General Obligation | | |
| 3.00%, due 10/1/36 | 6,060,000 | 5,049,725 |
| 4.00%, due 11/1/35 | 2,200,000 | 2,170,086 |
| 4.00%, due 3/1/36 | 31,385,000 | 30,744,859 |
| 4.00%, due 10/1/36 | 3,400,000 | 3,325,994 |
| 4.00%, due 10/1/37 | 9,075,000 | 8,814,543 |
| 4.00%, due 10/1/39 | 6,075,000 | 5,752,360 |
| 4.00%, due 3/1/46 | 20,765,000 | 18,735,923 |
The notes to the financial statements are an integral part of, and should be read in conjunction with, the financial statements.
| 16 | MainStay MacKay Tax Free Bond Fund |
| | Principal
Amount | Value |
| Long-Term Municipal Bonds (continued) |
| California (continued) |
State of California, Various Purpose, Unlimited General Obligation
(continued) | | |
| 5.00%, due 11/1/28 | $ 8,000,000 | $ 8,144,902 |
| 5.00%, due 10/1/31 | 4,500,000 | 5,018,273 |
| 5.00%, due 10/1/32 | 6,250,000 | 6,413,441 |
| Series B | | |
| 5.00%, due 11/1/32 | 32,050,000 | 36,025,758 |
| 5.00%, due 9/1/41 | 3,400,000 | 3,616,149 |
| 5.00%, due 4/1/42 | 3,500,000 | 3,722,813 |
| 5.00%, due 9/1/42 | 35,000,000 | 37,307,431 |
| 5.00%, due 8/1/46 | 6,460,000 | 6,612,029 |
| 5.00%, due 9/1/52 | 8,700,000 | 9,095,400 |
| 5.25%, due 10/1/39 | 4,885,000 | 5,089,823 |
| Sunnyvale School District, Election of 2013, Unlimited General Obligation | | |
| Series C | | |
| 3.00%, due 9/1/44 | 7,000,000 | 5,090,047 |
| Sweetwater Union High School District, Unlimited General Obligation | | |
| Insured: BAM | | |
| 4.00%, due 8/1/47 | 10,325,000 | 8,914,785 |
| Tahoe-Truckee Unified School District, Election 2014, Unlimited General Obligation | | |
| Series B | | |
| 5.00%, due 8/1/41 | 2,200,000 | 2,281,722 |
| Temecula Valley Unified School District, Election 2012, Unlimited General Obligation | | |
| Series D | | |
| 3.00%, due 8/1/44 | 3,500,000 | 2,550,787 |
| Series D | | |
| 3.00%, due 8/1/47 | 4,500,000 | 3,166,533 |
| Twin Rivers Unified School District, Election 2006, Unlimited General Obligation | | |
| Series 2008, Insured: AGM | | |
| (zero coupon), due 8/1/32 | 4,620,000 | 2,981,778 |
| University of California, Revenue Bonds | | |
| Series AI | | |
| 5.00%, due 5/15/33 | 21,500,000 | 21,675,745 |
| Series AV | | |
| 5.00%, due 5/15/42 | 1,725,000 | 1,783,246 |
| | Principal
Amount | Value |
| |
| California (continued) |
| University of California, Revenue Bonds (continued) | | |
| Series AZ | | |
| 5.25%, due 5/15/58 | $ 5,155,000 | $ 5,364,510 |
| Val Verde Unified School District, Election of 2012, Unlimited General Obligation | | |
| Series F, Insured: AGM | | |
| 3.00%, due 8/1/47 | 7,000,000 | 4,773,643 |
| Val Verde Unified School District, Election of 2020, Unlimited General Obligation | | |
| Series B, Insured: AGM | | |
| 4.00%, due 8/1/51 | 7,210,000 | 6,150,616 |
| Victor Valley Community College District, Unlimited General Obligation | | |
| Series A | | |
| 4.00%, due 8/1/39 | 8,105,000 | 7,380,594 |
| Series A | | |
| 4.00%, due 8/1/44 | 5,500,000 | 4,801,358 |
| Walnut Valley Unified School District, Election of 2016, Unlimited General Obligation | | |
| Series C | | |
| 5.00%, due 8/1/45 | 4,285,000 | 4,568,064 |
| Westminster School District, Election 2008, Unlimited General Obligation | | |
| Series B, Insured: BAM | | |
| (zero coupon), due 8/1/48 | 13,900,000 | 2,423,354 |
| | | 978,452,049 |
| Colorado 1.5% |
| Adams State University, Revenue Bonds | | |
| Series A, Insured: State Higher Education Intercept Program | | |
| 4.00%, due 5/15/39 | 1,085,000 | 991,267 |
| Series A, Insured: State Higher Education Intercept Program | | |
| 4.00%, due 5/15/42 | 1,500,000 | 1,330,844 |
| City & County of Denver CO, Airport System, Revenue Bonds (b) | | |
| Series A | | |
| 5.00%, due 12/1/25 | 4,620,000 | 4,738,488 |
| Series A | | |
| 5.00%, due 12/1/34 | 6,250,000 | 6,252,148 |
The notes to the financial statements are an integral part of, and should be read in conjunction with, the financial statements.
17
Portfolio of Investments October 31, 2022† (continued)
| | Principal
Amount | Value |
| Long-Term Municipal Bonds (continued) |
| Colorado (continued) |
City & County of Denver CO, Airport System, Revenue Bonds (b)
(continued) | | |
| Series A | | |
| 5.00%, due 12/1/43 | $ 11,690,000 | $ 11,288,574 |
| Series A | | |
| 5.25%, due 12/1/48 | 4,040,000 | 3,989,837 |
| Series A | | |
| 5.50%, due 11/15/35 | 5,500,000 | 5,793,090 |
| Series A | | |
| 5.50%, due 11/15/38 | 7,750,000 | 8,096,855 |
| Series A | | |
| 5.50%, due 11/15/40 | 6,680,000 | 6,913,856 |
| City & County of Denver CO, Convention Center Expansion Project, Certificate of Participation | | |
| Series A | | |
| 5.375%, due 6/1/43 | 4,500,000 | 4,685,655 |
| City of Colorado Springs CO, Utilities System, Revenue Bonds | | |
| Series A-2 | | |
| 5.00%, due 11/15/44 | 3,000,000 | 3,045,328 |
| Series B | | |
| 5.00%, due 11/15/47 | 11,750,000 | 12,378,261 |
| Colorado Health Facilities Authority, AdventHealth Obligated Group, Revenue Bonds | | |
| Series A | | |
| 3.00%, due 11/15/51 | 8,500,000 | 5,570,005 |
| Colorado Health Facilities Authority, Intermountain Healthcare Obligated Group, Revenue Bonds | | |
| Series B | | |
| 4.00%, due 1/1/40 | 5,745,000 | 5,268,066 |
| Denver Convention Center Hotel Authority, Revenue Bonds, Senior Lien | | |
| 5.00%, due 12/1/36 | 1,000,000 | 986,760 |
| Regional Transportation District, Certificate of Participation | | |
| Series A | | |
| 4.50%, due 6/1/44 | 9,075,000 | 9,136,388 |
| Regional Transportation District Sales Tax, Fastracks Project, Revenue Bonds | | |
| Series A | | |
| 5.00%, due 11/1/31 | 6,750,000 | 7,426,494 |
| | Principal
Amount | Value |
| |
| Colorado (continued) |
| Vista Ridge Metropolitan District, Unlimited General Obligation | | |
| Series A, Insured: BAM | | |
| 5.00%, due 12/1/31 | $ 1,250,000 | $ 1,306,104 |
| | | 99,198,020 |
| Connecticut 1.5% |
| City of Bridgeport CT, Unlimited General Obligation | | |
| Series D, Insured: AGM | | |
| 5.00%, due 8/15/33 | 2,590,000 | 2,701,088 |
| Series D, Insured: AGM | | |
| 5.00%, due 8/15/34 | 2,590,000 | 2,696,536 |
| Series D, Insured: AGM | | |
| 5.00%, due 8/15/35 | 2,840,000 | 2,952,219 |
| Series D, Insured: AGM | | |
| 5.00%, due 8/15/36 | 2,840,000 | 2,949,418 |
| City of Hartford CT, Unlimited General Obligation | | |
| Series A, Insured: State Guaranteed | | |
| 5.00%, due 4/1/28 | 2,500,000 | 2,503,245 |
| Series A, Insured: State Guaranteed | | |
| 5.00%, due 4/1/29 | 895,000 | 896,148 |
| Series A, Insured: AGM State Guaranteed | | |
| 5.00%, due 4/1/32 | 195,000 | 195,234 |
| Series C, Insured: AGM State Guaranteed | | |
| 5.00%, due 7/15/32 | 6,670,000 | 6,873,253 |
| Series C, Insured: AGM State Guaranteed | | |
| 5.00%, due 7/15/34 | 2,500,000 | 2,568,964 |
| State of Connecticut, Transportation Infrastructure, Special Tax, Revenue Bonds | | |
| Series A | | |
| 3.125%, due 5/1/40 | 3,750,000 | 2,863,064 |
| Series A, Insured: BAM | | |
| 4.00%, due 5/1/39 | 5,000,000 | 4,741,378 |
| Series A | | |
| 5.00%, due 9/1/30 | 4,250,000 | 4,357,199 |
| Series A, Insured: BAM | | |
| 5.00%, due 9/1/31 | 12,870,000 | 13,579,797 |
| Series A | | |
| 5.00%, due 9/1/33 | 11,700,000 | 12,172,209 |
The notes to the financial statements are an integral part of, and should be read in conjunction with, the financial statements.
| 18 | MainStay MacKay Tax Free Bond Fund |
| | Principal
Amount | Value |
| Long-Term Municipal Bonds (continued) |
| Connecticut (continued) |
| State of Connecticut, Transportation Infrastructure, Special Tax, Revenue Bonds (continued) | | |
| Series A | | |
| 5.00%, due 1/1/36 | $ 3,575,000 | $ 3,733,829 |
| State of Connecticut, Unlimited General Obligation | | |
| Series A | | |
| 4.00%, due 4/15/38 | 2,300,000 | 2,146,044 |
| Series F | | |
| 5.00%, due 9/15/28 | 11,510,000 | 12,453,879 |
| Series C | | |
| 5.00%, due 6/15/33 | 1,775,000 | 1,871,633 |
| Series C | | |
| 5.00%, due 6/15/34 | 1,375,000 | 1,443,989 |
| Series A | | |
| 5.00%, due 4/15/35 | 5,250,000 | 5,451,963 |
| Series A | | |
| 5.00%, due 4/15/36 | 1,800,000 | 1,889,440 |
| Series A | | |
| 5.00%, due 4/15/39 | 1,250,000 | 1,298,498 |
| State of Connecticut Clean Water Fund, State Revolving Fund, Revenue Bonds | | |
| Series A | | |
| 5.00%, due 5/1/33 | 2,500,000 | 2,647,122 |
| University of Connecticut, Revenue Bonds | | |
| Series A | | |
| 5.00%, due 11/1/35 | 3,490,000 | 3,634,316 |
| | | 98,620,465 |
| Delaware 0.0% ‡ |
| Delaware State Health Facilities Authority, Christiana Care Health System, Revenue Bonds | | |
| Series A | | |
| 5.00%, due 10/1/36 | 3,435,000 | 3,550,911 |
| District of Columbia 1.3% |
| District of Columbia, Revenue Bonds | | |
| Series C | | |
| 5.00%, due 12/1/31 | 6,500,000 | 7,244,145 |
| Series C | | |
| 5.00%, due 12/1/32 | 6,000,000 | 6,719,301 |
| Series A | | |
| 5.00%, due 7/1/36 | 8,175,000 | 8,926,832 |
| | Principal
Amount | Value |
| |
| District of Columbia (continued) |
District of Columbia, Revenue Bonds
(continued) | | |
| Series A | | |
| 5.50%, due 7/1/47 | $ 21,480,000 | $ 23,257,255 |
| District of Columbia, Friendship Public Charter School, Inc., Revenue Bonds | | |
| Series A | | |
| 5.00%, due 6/1/42 | 4,750,000 | 4,756,576 |
| Metropolitan Washington Airports Authority, Revenue Bonds (b) | | |
| Series A | | |
| 4.00%, due 10/1/40 | 3,000,000 | 2,611,908 |
| Series A | | |
| 5.00%, due 10/1/36 | 4,000,000 | 3,973,125 |
| Metropolitan Washington Airports Authority, Dulles Toll Road, Metrorail & Capital Improvement Project, Revenue Bonds, Sub. Lien | | |
| Series B, Insured: AGM | | |
| 4.00%, due 10/1/53 | 1,535,000 | 1,220,475 |
| Metropolitan Washington Airports Authority, Dulles Toll Road, Metrorail & Capital Improvement Project, Revenue Bonds, Second Lien | | |
| Series C, Insured: AGC | | |
| 6.50%, due 10/1/41 | 7,100,000 | 7,897,646 |
| Metropolitan Washington Airports Authority, Dulles Toll Road, Metrorail & Capital Improvement Project, Revenue Bonds, Senior Lien | | |
| Series B | | |
| 6.50%, due 10/1/44 | 6,340,000 | 6,884,815 |
| Washington Metropolitan Area Transit Authority, Green bond, Revenue Bonds | | |
| Series A, Insured: BAM | | |
| 3.00%, due 7/15/36 | 5,425,000 | 4,474,346 |
| Series A | | |
| 4.00%, due 7/15/46 | 6,000,000 | 5,167,698 |
| | | 83,134,122 |
The notes to the financial statements are an integral part of, and should be read in conjunction with, the financial statements.
19
Portfolio of Investments October 31, 2022† (continued)
| | Principal
Amount | Value |
| Long-Term Municipal Bonds (continued) |
| Florida 7.4% |
| City of Cape Coral FL, Water & Sewer, Revenue Bonds | | |
| 4.00%, due 10/1/42 | $ 12,500,000 | $ 11,053,395 |
| City of Gainesville FL, Revenue Bonds | | |
| Series A | | |
| 5.00%, due 10/1/47 | 16,280,000 | 16,462,281 |
| City of Miami Beach FL, Beach Parking, Revenue Bonds | | |
| Insured: BAM | | |
| 5.00%, due 9/1/40 | 2,500,000 | 2,579,672 |
| City of Miami FL, Parking System, Revenue Bonds | | |
| Insured: BAM | | |
| 4.00%, due 10/1/33 | 1,520,000 | 1,531,325 |
| Insured: BAM | | |
| 4.00%, due 10/1/36 | 2,845,000 | 2,786,010 |
| Insured: BAM | | |
| 4.00%, due 10/1/37 | 2,535,000 | 2,448,652 |
| Insured: BAM | | |
| 4.00%, due 10/1/38 | 1,675,000 | 1,535,843 |
| Insured: BAM | | |
| 4.00%, due 10/1/39 | 2,520,000 | 2,331,916 |
| City of Orlando FL, Tourist Development Tax, Revenue Bonds, Third Lien | | |
| Series C, Insured: AGC | | |
| 5.50%, due 11/1/38 | 1,600,000 | 1,601,651 |
| City of South Miami FL, Miami Health Facilities Authority, Inc., Revenue Bonds | | |
| 5.00%, due 8/15/42 | 18,115,000 | 17,856,767 |
| City of Tampa FL, Revenue Bonds | | |
| Series C, Insured: BAM | | |
| 3.00%, due 10/1/36 | 4,690,000 | 3,881,788 |
| City of Tampa FL, Water & Wastewater System, Revenue Bonds | | |
| Series A | | |
| 5.25%, due 10/1/57 | 17,000,000 | 18,088,240 |
| County of Broward FL, Tourist Development Tax, Revenue Bonds | | |
| 4.00%, due 9/1/41 | 12,250,000 | 10,812,954 |
| 4.00%, due 9/1/51 | 6,970,000 | 5,842,181 |
| Insured: BAM | | |
| 4.00%, due 9/1/51 | 9,050,000 | 7,745,020 |
| | Principal
Amount | Value |
| |
| Florida (continued) |
| County of Broward FL, Airport System, Revenue Bonds | | |
| Series A | | |
| 5.00%, due 10/1/49 (b) | $ 6,500,000 | $ 6,188,501 |
| County of Broward FL, Convention Center Hotel, Revenue Bonds | | |
| 5.50%, due 1/1/55 | 25,000,000 | 26,657,462 |
| County of Lee FL, Airport, Revenue Bonds (b) | | |
| Series A | | |
| 5.00%, due 10/1/30 | 6,000,000 | 6,143,327 |
| Series A | | |
| 5.00%, due 10/1/32 | 2,200,000 | 2,240,713 |
| Series B | | |
| 5.00%, due 10/1/37 | 4,000,000 | 3,902,807 |
| Series B | | |
| 5.00%, due 10/1/46 | 5,000,000 | 4,777,415 |
| County of Miami-Dade FL, Water & Sewer System, Revenue Bonds | | |
| Insured: BAM | | |
| 3.00%, due 10/1/36 | 2,100,000 | 1,703,422 |
| Series B | | |
| 4.00%, due 10/1/38 | 5,400,000 | 5,020,187 |
| Series A | | |
| 4.00%, due 10/1/44 | 8,550,000 | 7,405,499 |
| Series B, Insured: BAM | | |
| 4.00%, due 10/1/49 | 41,880,000 | 35,537,194 |
| Series B | | |
| 5.00%, due 10/1/33 | 4,500,000 | 4,641,056 |
| County of Miami-Dade FL, Transit System, Revenue Bonds | | |
| Series A | | |
| 4.00%, due 7/1/49 | 7,900,000 | 6,468,039 |
| 5.00%, due 7/1/45 | 14,870,000 | 15,320,061 |
| 5.00%, due 7/1/46 | 11,190,000 | 11,464,067 |
| 5.00%, due 7/1/48 | 5,215,000 | 5,283,116 |
| 5.00%, due 7/1/51 | 26,000,000 | 26,286,996 |
| County of Miami-Dade FL, Seaport Department, Revenue Bonds | | |
| Series B-1 | | |
| 4.00%, due 10/1/50 (b) | 10,000,000 | 8,117,956 |
| County of Sarasota FL, Utility System, Revenue Bonds | | |
| 5.25%, due 10/1/47 | 10,000,000 | 10,662,522 |
| County of Seminole FL, Water & Sewer, Revenue Bonds | | |
| Series A | | |
| 4.00%, due 10/1/29 | 4,500,000 | 4,546,314 |
The notes to the financial statements are an integral part of, and should be read in conjunction with, the financial statements.
| 20 | MainStay MacKay Tax Free Bond Fund |
| | Principal
Amount | Value |
| Long-Term Municipal Bonds (continued) |
| Florida (continued) |
| Greater Orlando Aviation Authority, Revenue Bonds | | |
| Series A | | |
| 5.00%, due 10/1/33 (b) | $ 1,205,000 | $ 1,220,343 |
| Hillsborough County Aviation Authority, Tampa International Airport, Revenue Bonds (b) | | |
| Series A | | |
| 5.00%, due 10/1/29 | 2,250,000 | 2,330,577 |
| Series A | | |
| 5.00%, due 10/1/47 | 7,250,000 | 7,031,681 |
| JEA Electric System, Revenue Bonds | | |
| Series B | | |
| 4.00%, due 10/1/36 | 3,750,000 | 3,477,766 |
| Miami-Dade County Health Facilities Authority, Nicklaus Children's Hospital Project, Revenue Bonds | | |
| Series A, Insured: AGM-CR | | |
| 4.00%, due 8/1/46 | 5,460,000 | 4,650,356 |
| Series A, Insured: AGM-CR | | |
| 4.00%, due 8/1/51 | 21,000,000 | 17,415,781 |
| North Sumter County Utility Dependent District, Sumter Water Conservation Authority Project, Revenue Bonds | | |
| Insured: AGM | | |
| 5.00%, due 10/1/46 | 8,950,000 | 9,175,323 |
| Insured: AGM | | |
| 5.00%, due 10/1/52 | 6,250,000 | 6,337,674 |
| Orange County Health Facilities Authority, Presbyterian Retirement Communities, Inc., Revenue Bonds | | |
| 5.00%, due 8/1/31 | 1,500,000 | 1,556,226 |
| Putnam County Development Authority, Seminole Electric Cooperative, Inc., Revenue Bonds | | |
| Series A | | |
| 5.00%, due 3/15/42 | 4,250,000 | 4,405,902 |
| School Board of Miami-Dade County (The), Unlimited General Obligation | | |
| Series A, Insured: BAM | | |
| 5.00%, due 3/15/34 | 6,010,000 | 6,540,860 |
| Series A, Insured: BAM | | |
| 5.00%, due 3/15/35 | 6,360,000 | 6,829,877 |
| | Principal
Amount | Value |
| |
| Florida (continued) |
| School Board of Miami-Dade County (The), Unlimited General Obligation (continued) | | |
| Series A, Insured: BAM | | |
| 5.00%, due 3/15/39 | $ 8,945,000 | $ 9,462,479 |
| Series A, Insured: BAM | | |
| 5.00%, due 3/15/40 | 9,010,000 | 9,512,559 |
| Series A, Insured: BAM | | |
| 5.00%, due 3/15/47 | 14,745,000 | 15,306,211 |
| School District of Broward County, Unlimited General Obligation | | |
| 5.00%, due 7/1/46 | 7,000,000 | 7,287,474 |
| South Broward Hospital District, Revenue Bonds | | |
| Insured: BAM | | |
| 3.00%, due 5/1/51 | 25,990,000 | 16,962,470 |
| State of Florida, Capital Outlay, Unlimited General Obligation | | |
| Series C | | |
| 3.15%, due 6/1/29 | 5,000,000 | 4,824,158 |
| Series C | | |
| 4.00%, due 6/1/32 | 3,650,000 | 3,670,587 |
| State of Florida Department of Transportation, Turnpike System, Revenue Bonds | | |
| Series C | | |
| 3.00%, due 7/1/51 | 12,500,000 | 8,488,286 |
| Series A | | |
| 4.00%, due 7/1/32 | 4,500,000 | 4,503,661 |
| Village Community Development District No. 8, Special Assessment | | |
| Insured: AGM | | |
| 3.50%, due 5/1/40 | 5,250,000 | 4,428,830 |
| West Palm Beach Community Redevelopment Agency, City center community redevelopment, Tax Allocation | | |
| Insured: AGM-CR | | |
| 5.00%, due 3/1/34 | 8,950,000 | 9,604,878 |
| Insured: AGM-CR | | |
| 5.00%, due 3/1/35 | 9,520,000 | 10,171,852 |
| Wildwood Utility Dependent District, South Sumter Utility Project, Revenue Bonds, Senior Lien | | |
| Insured: BAM | | |
| 5.00%, due 10/1/52 | 6,000,000 | 6,045,203 |
| | | 480,165,363 |
The notes to the financial statements are an integral part of, and should be read in conjunction with, the financial statements.
21
Portfolio of Investments October 31, 2022† (continued)
| | Principal
Amount | Value |
| Long-Term Municipal Bonds (continued) |
| Georgia 3.3% |
| Brookhaven Development Authority, Children's Healthcare of Atlanta, Revenue Bonds | | |
| Series A | | |
| 4.00%, due 7/1/44 | $ 25,435,000 | $ 22,349,714 |
| Series A | | |
| 4.00%, due 7/1/49 | 2,325,000 | 1,973,201 |
| City of Atlanta GA, Water & Wastewater, Revenue Bonds | | |
| Series C | | |
| 4.00%, due 11/1/37 | 5,000,000 | 4,742,294 |
| 5.00%, due 11/1/29 | 4,500,000 | 4,655,195 |
| City of Atlanta GA, Public Improvement, Unlimited General Obligation | | |
| Series A-1 | | |
| 5.00%, due 12/1/42 | 12,500,000 | 13,162,268 |
| City of Dalton (The) GA, Georgia Combined Utilities, Revenue Bonds | | |
| 5.00%, due 3/1/30 | 2,055,000 | 2,147,542 |
| Cobb County Kennestone Hospital Authority, Wellstar Health System, Revenue Bonds | | |
| Series A, Insured: AGM-CR | | |
| 4.00%, due 4/1/52 | 21,250,000 | 17,875,232 |
| Coweta County Development Authority, Piedmont Healthcare, Inc., Revenue Bonds | | |
| Series A | | |
| 5.00%, due 7/1/44 | 4,250,000 | 4,182,312 |
| Georgia Ports Authority, Revenue Bonds | | |
| 5.25%, due 7/1/43 | 7,595,000 | 8,078,958 |
| 5.25%, due 7/1/52 | 5,000,000 | 5,261,270 |
| Main Street Natural Gas, Inc., Revenue Bonds | | |
| Series C | | |
| 4.00%, due 3/1/50 (a) | 2,500,000 | 2,400,556 |
| Series C | | |
| 4.00%, due 5/1/52 (a) | 7,360,000 | 6,895,537 |
| Series A | | |
| 4.00%, due 7/1/52 (a) | 9,000,000 | 8,698,351 |
| Series A | | |
| 4.00%, due 9/1/52 (a) | 22,440,000 | 20,692,889 |
| Series A | | |
| 5.00%, due 5/15/35 | 2,750,000 | 2,712,419 |
| | Principal
Amount | Value |
| |
| Georgia (continued) |
| Main Street Natural Gas, Inc., Revenue Bonds (continued) | | |
| Series A | | |
| 5.00%, due 5/15/36 | $ 3,200,000 | $ 3,145,238 |
| Municipal Electric Authority of Georgia, Project One Subordinated Bonds, Revenue Bonds | | |
| Series A, Insured: AGM-CR | | |
| 4.00%, due 1/1/41 | 2,545,000 | 2,279,638 |
| Series A, Insured: BAM | | |
| 4.00%, due 1/1/49 | 4,050,000 | 3,406,967 |
| Series A | | |
| 5.00%, due 1/1/35 | 4,250,000 | 4,262,827 |
| Series A | | |
| 5.00%, due 1/1/45 | 2,185,000 | 2,097,874 |
| Series A, Insured: BAM | | |
| 5.00%, due 1/1/45 | 3,300,000 | 3,244,396 |
| Municipal Electric Authority of Georgia, Plant Vogtle Units 3 & 4 Project, Revenue Bonds | | |
| Series A, Insured: BAM | | |
| 4.00%, due 1/1/49 | 6,600,000 | 5,653,206 |
| Series A | | |
| 5.00%, due 1/1/37 | 1,000,000 | 998,292 |
| Series A, Insured: BAM | | |
| 5.00%, due 1/1/49 | 38,870,000 | 38,104,331 |
| Series A, Insured: BAM | | |
| 5.00%, due 1/1/59 | 4,605,000 | 4,466,835 |
| Series A, Insured: AGM-CR | | |
| 5.00%, due 1/1/59 | 5,250,000 | 5,092,483 |
| Series B | | |
| 5.00%, due 1/1/59 | 1,895,000 | 1,701,073 |
| Series A | | |
| 5.00%, due 1/1/63 | 2,905,000 | 2,579,978 |
| Private Colleges & Universities Authority, Savannah College of Art & Design, Revenue Bonds | | |
| 4.00%, due 4/1/44 | 8,150,000 | 6,915,097 |
| Private Colleges & Universities Authority, Emory University, Revenue Bonds | | |
| Series B | | |
| 5.00%, due 9/1/30 | 5,500,000 | 6,087,670 |
| | | 215,863,643 |
The notes to the financial statements are an integral part of, and should be read in conjunction with, the financial statements.
| 22 | MainStay MacKay Tax Free Bond Fund |
| | Principal
Amount | Value |
| Long-Term Municipal Bonds (continued) |
| Guam 0.3% |
| Antonio B Won Pat International Airport Authority, Revenue Bonds (b) | | |
| Series C, Insured: AGM | | |
| 6.125%, due 10/1/43 | $ 3,575,000 | $ 3,650,621 |
| Series C, Insured: AGM | | |
| 6.125%, due 10/1/43 | 925,000 | 944,566 |
| Guam Government Waterworks Authority, Water and Wastewater System, Revenue Bonds | | |
| 5.00%, due 7/1/40 | 1,730,000 | 1,731,967 |
| 5.00%, due 1/1/46 | 4,500,000 | 4,372,700 |
| Series A | | |
| 5.00%, due 1/1/50 | 1,660,000 | 1,575,801 |
| 5.25%, due 7/1/33 | 1,000,000 | 1,013,375 |
| Guam Power Authority, Revenue Bonds | | |
| Series A, Insured: AGM | | |
| 5.00%, due 10/1/44 | 655,000 | 665,336 |
| Territory of Guam, Section 30, Revenue Bonds | | |
| Series A | | |
| 5.00%, due 12/1/27 | 2,265,000 | 2,267,508 |
| Series A | | |
| 5.00%, due 12/1/34 | 2,290,000 | 2,202,364 |
| | | 18,424,238 |
| Hawaii 0.2% |
| City & County Honolulu HI, Wastewater System, Revenue Bonds, Senior Lien | | |
| Series A | | |
| 5.00%, due 7/1/51 | 7,500,000 | 7,776,119 |
| State of Hawaii Department of Budget & Finance, Hawaiian Electric Co., Inc., Revenue Bonds | | |
| Insured: AGM-CR | | |
| 3.50%, due 10/1/49 (b) | 6,200,000 | 4,443,175 |
| | | 12,219,294 |
| Idaho 0.1% |
| Idaho Housing & Finance Association, Federal Highway Trust Fund, Revenue Bonds | | |
| Series A | | |
| 5.00%, due 7/15/37 | 8,750,000 | 9,109,930 |
| | Principal
Amount | Value |
| |
| Illinois 9.2% |
| Chicago Board of Education, Capital Appreciation, School Reform, Unlimited General Obligation | | |
| Series A, Insured: NATL-RE | | |
| (zero coupon), due 12/1/26 | $ 17,995,000 | $ 14,869,000 |
| Chicago Board of Education, Unlimited General Obligation | | |
| Series A, Insured: AGM | | |
| 5.00%, due 12/1/27 | 7,300,000 | 7,517,795 |
| Chicago Board of Education, Revenue Bonds | | |
| 6.00%, due 4/1/46 | 17,560,000 | 17,878,725 |
| Chicago O'Hare International Airport, General, Revenue Bonds, Senior Lien | | |
| Series A, Insured: AGM | | |
| 4.00%, due 1/1/36 | 8,500,000 | 7,922,752 |
| Series A, Insured: BAM | | |
| 4.00%, due 1/1/37 | 10,690,000 | 9,852,706 |
| Series D | | |
| 5.00%, due 1/1/47 (b) | 4,500,000 | 4,271,691 |
| Series A, Insured: AGM | | |
| 5.25%, due 1/1/45 (b) | 10,000,000 | 9,835,174 |
| Series A, Insured: AGM | | |
| 5.50%, due 1/1/53 (b) | 20,400,000 | 20,552,904 |
| Chicago O'Hare International Airport, Passenger Facility Charge, Revenue Bonds | | |
| Series A | | |
| 5.00%, due 1/1/30 | 2,915,000 | 2,917,307 |
| Series B | | |
| 5.00%, due 1/1/31 (b) | 2,000,000 | 2,000,453 |
| Chicago O'Hare International Airport, Revenue Bonds | | |
| Series A | | |
| 5.00%, due 1/1/32 (b) | 13,550,000 | 13,634,453 |
| Chicago Park District, Limited Tax, Limited General Obligation | | |
| Series A, Insured: BAM | | |
| 4.00%, due 1/1/31 | 1,955,000 | 1,845,431 |
| Series A | | |
| 5.00%, due 1/1/28 | 1,000,000 | 1,020,141 |
| Series A | | |
| 5.00%, due 1/1/31 | 1,000,000 | 1,017,448 |
| Series A | | |
| 5.00%, due 1/1/35 | 2,000,000 | 2,020,358 |
The notes to the financial statements are an integral part of, and should be read in conjunction with, the financial statements.
23
Portfolio of Investments October 31, 2022† (continued)
| | Principal
Amount | Value |
| Long-Term Municipal Bonds (continued) |
| Illinois (continued) |
| Chicago Park District, Personal Property Replacement Tax, Unlimited General Obligation | | |
| Series D, Insured: BAM | | |
| 4.00%, due 1/1/34 | $ 3,805,000 | $ 3,455,513 |
| Chicago Park District, Unlimited General Obligation | | |
| Series F-2 | | |
| 4.00%, due 1/1/38 | 1,150,000 | 977,759 |
| Series F-2 | | |
| 5.00%, due 1/1/37 | 2,050,000 | 2,082,385 |
| Chicago Park District, Special Recreation Activity Alternate Revenue Source, Unlimited General Obligation | | |
| Insured: BAM | | |
| 5.00%, due 11/15/30 | 1,435,000 | 1,509,451 |
| Chicago Transit Authority Sales Tax Receipts Fund, Revenue Bonds, Second Lien | | |
| Series A, Insured: BAM | | |
| 4.00%, due 12/1/50 | 35,000,000 | 28,157,801 |
| 5.00%, due 12/1/46 | 4,780,000 | 4,547,825 |
| Series A, Insured: BAM | | |
| 5.00%, due 12/1/46 | 42,500,000 | 43,020,634 |
| Chicago Transit Authority Sales Tax Receipts Fund, Revenue Bonds | | |
| 5.25%, due 12/1/49 | 10,000,000 | 10,050,886 |
| City of Chicago Heights IL, Unlimited General Obligation | | |
| Series B, Insured: BAM | | |
| 5.25%, due 12/1/34 | 2,115,000 | 2,233,505 |
| City of Chicago IL, Unlimited General Obligation | | |
| Series A | | |
| 4.00%, due 1/1/35 | 2,300,000 | 1,958,421 |
| Series A | | |
| 4.00%, due 1/1/36 | 4,000,000 | 3,366,849 |
| Series B | | |
| 4.00%, due 1/1/37 | 5,000,000 | 4,147,452 |
| Series A | | |
| 5.00%, due 1/1/30 | 1,385,000 | 1,365,600 |
| Series A | | |
| 5.00%, due 1/1/33 | 2,825,000 | 2,708,352 |
| Series A | | |
| 5.00%, due 1/1/34 | 9,005,000 | 8,553,108 |
| | Principal
Amount | Value |
| |
| Illinois (continued) |
| City of Chicago IL, Unlimited General Obligation (continued) | | |
| Series A | | |
| 5.50%, due 1/1/49 | $ 8,950,000 | $ 8,672,977 |
| Series A | | |
| 6.00%, due 1/1/38 | 38,550,000 | 39,275,156 |
| Series A, Insured: BAM | | |
| 6.00%, due 1/1/38 | 5,250,000 | 5,469,281 |
| City of Chicago IL, Waterworks, Revenue Bonds, Second Lien | | |
| 4.00%, due 11/1/37 | 1,250,000 | 1,145,993 |
| 5.00%, due 11/1/27 | 1,655,000 | 1,686,245 |
| Series 2, Insured: AGM | | |
| 5.00%, due 11/1/28 | 2,000,000 | 2,081,818 |
| 5.00%, due 11/1/29 | 1,700,000 | 1,729,879 |
| Series 2, Insured: AGM | | |
| 5.00%, due 11/1/30 | 2,500,000 | 2,595,116 |
| Series 2, Insured: AGM | | |
| 5.00%, due 11/1/32 | 4,250,000 | 4,388,844 |
| Series 2, Insured: AGM | | |
| 5.00%, due 11/1/33 | 9,050,000 | 9,292,544 |
| Series 2, Insured: AGM | | |
| 5.00%, due 11/1/38 | 3,000,000 | 3,038,462 |
| Insured: AGM | | |
| 5.25%, due 11/1/33 | 4,250,000 | 4,411,106 |
| Insured: AGM | | |
| 5.25%, due 11/1/34 | 1,860,000 | 1,915,663 |
| Insured: AGM | | |
| 5.25%, due 11/1/35 | 2,525,000 | 2,597,245 |
| City of Chicago IL, Wastewater Transmission Project, Revenue Bonds, Second Lien | | |
| 5.00%, due 1/1/28 | 1,000,000 | 1,004,081 |
| Series B, Insured: AGM-CR | | |
| 5.00%, due 1/1/30 | 6,735,000 | 6,961,349 |
| 5.00%, due 1/1/33 | 2,000,000 | 2,008,645 |
| Series B | | |
| 5.00%, due 1/1/33 | 2,240,000 | 2,244,960 |
| Insured: BAM | | |
| 5.00%, due 1/1/44 | 11,840,000 | 11,882,745 |
| Series A, Insured: AGM | | |
| 5.25%, due 1/1/42 | 3,500,000 | 3,571,168 |
| City of Chicago IL, Motor Fuel Tax, Revenue Bonds | | |
| Insured: AGM | | |
| 5.00%, due 1/1/33 | 3,975,000 | 4,053,723 |
The notes to the financial statements are an integral part of, and should be read in conjunction with, the financial statements.
| 24 | MainStay MacKay Tax Free Bond Fund |
| | Principal
Amount | Value |
| Long-Term Municipal Bonds (continued) |
| Illinois (continued) |
| Cook County Community College District No. 508, Unlimited General Obligation | | |
| Insured: BAM | | |
| 5.50%, due 12/1/38 | $ 4,250,000 | $ 4,346,093 |
| Cook County Community High School District No. 212 Leyden, Revenue Bonds | | |
| Series C, Insured: BAM | | |
| 5.00%, due 12/1/30 | 2,870,000 | 2,956,884 |
| Series C, Insured: BAM | | |
| 5.00%, due 12/1/31 | 2,360,000 | 2,426,662 |
| Du Page Cook & Will Counties Community College District No. 502, Unlimited General Obligation | | |
| Series A | | |
| 5.00%, due 6/1/26 | 4,100,000 | 4,135,638 |
| Illinois Finance Authority, Carle Foundation Obligated Group (The), Revenue Bonds | | |
| Series A | | |
| 4.00%, due 8/15/39 | 6,500,000 | 5,733,509 |
| Illinois Municipal Electric Agency, Revenue Bonds | | |
| Series A | | |
| 4.00%, due 2/1/34 | 5,950,000 | 5,802,946 |
| Illinois Sports Facilities Authority (The), Revenue Bonds | | |
| Insured: AGM | | |
| 5.25%, due 6/15/31 | 4,250,000 | 4,322,339 |
| Illinois State Toll Highway Authority, Revenue Bonds, Senior Lien | | |
| Series B | | |
| 5.00%, due 1/1/34 | 3,500,000 | 3,549,013 |
| Metropolitan Pier & Exposition Authority, McCormick Place Expansion Project, Capital Appreciation, Revenue Bonds | | |
| Series A, Insured: NATL-RE | | |
| (zero coupon), due 6/15/36 | 52,950,000 | 25,090,961 |
| Series B-1, Insured: AGM | | |
| (zero coupon), due 6/15/43 | 13,970,000 | 4,636,358 |
| | Principal
Amount | Value |
| |
| Illinois (continued) |
| Metropolitan Water Reclamation District of Greater Chicago, Limited General Obligation | | |
| Series C | | |
| 5.00%, due 12/1/32 | $ 3,000,000 | $ 3,223,398 |
| Rock Island County Public Building Commission, County of Rock Island, Revenue Bonds | | |
| Insured: AGM | | |
| 5.00%, due 12/1/36 | 2,395,000 | 2,517,287 |
| Sales Tax Securitization Corp., Revenue Bonds | | |
| Series A, Insured: BAM | | |
| 4.00%, due 1/1/48 | 14,250,000 | 11,613,445 |
| Series A | | |
| 5.00%, due 1/1/28 | 3,935,000 | 4,086,928 |
| Series A | | |
| 5.00%, due 1/1/48 | 6,250,000 | 6,197,931 |
| Series C | | |
| 5.25%, due 1/1/34 | 8,000,000 | 8,273,858 |
| Sales Tax Securitization Corp., Revenue Bonds, Second Lien | | |
| Series A | | |
| 5.00%, due 1/1/32 | 4,400,000 | 4,563,254 |
| Sangamon County School District No. 186 Springfield, Unlimited General Obligation | | |
| Series C, Insured: AGM | | |
| 5.00%, due 6/1/34 | 1,000,000 | 1,045,564 |
| Series C, Insured: AGM | | |
| 5.00%, due 6/1/38 | 1,635,000 | 1,690,241 |
| Southern Illinois University, Housing & Auxiliary Facilities System, Revenue Bonds | | |
| Series B, Insured: BAM | | |
| 5.00%, due 4/1/26 | 1,175,000 | 1,205,742 |
| Series B, Insured: BAM | | |
| 5.00%, due 4/1/29 | 1,620,000 | 1,654,883 |
| Series B, Insured: BAM | | |
| 5.00%, due 4/1/30 | 1,000,000 | 1,020,379 |
| State of Illinois, Sales Tax, Revenue Bonds | | |
| Series A | | |
| 3.00%, due 6/15/33 | 3,000,000 | 2,497,586 |
| State of Illinois, Sales Tax, Revenue Bonds, Junior Lien | | |
| Series C | | |
| 5.00%, due 6/15/30 | 3,250,000 | 3,372,975 |
The notes to the financial statements are an integral part of, and should be read in conjunction with, the financial statements.
25
Portfolio of Investments October 31, 2022† (continued)
| | Principal
Amount | Value |
| Long-Term Municipal Bonds (continued) |
| Illinois (continued) |
| State of Illinois, Unlimited General Obligation | | |
| Series C | | |
| 4.00%, due 10/1/40 | $ 4,500,000 | $ 3,661,365 |
| Insured: BAM | | |
| 4.00%, due 6/1/41 | 9,050,000 | 7,547,097 |
| Series D | | |
| 5.00%, due 11/1/26 | 7,775,000 | 7,830,910 |
| 5.00%, due 2/1/27 | 4,230,000 | 4,258,616 |
| 5.00%, due 1/1/28 | 5,405,000 | 5,417,165 |
| Series D | | |
| 5.00%, due 11/1/28 | 6,580,000 | 6,591,513 |
| 5.25%, due 2/1/32 | 9,050,000 | 9,067,979 |
| 5.50%, due 5/1/39 | 13,475,000 | 13,546,519 |
| Series A | | |
| 5.50%, due 3/1/47 | 5,000,000 | 4,840,947 |
| 5.75%, due 5/1/45 | 4,500,000 | 4,514,045 |
| Series A | | |
| 6.00%, due 5/1/27 | 8,690,000 | 9,089,458 |
| United City of Yorkville IL, Special Tax | | |
| Insured: AGM | | |
| 5.00%, due 3/1/32 | 3,267,000 | 3,368,949 |
| Village of Bellwood IL, Unlimited General Obligation | | |
| Insured: AGM | | |
| 5.00%, due 12/1/29 | 1,500,000 | 1,566,283 |
| Village of Rosemont IL, Corporate Purpose, Unlimited General Obligation | | |
| Series A, Insured: AGM | | |
| 5.00%, due 12/1/40 | 7,190,000 | 7,529,326 |
| Village of Schaumburg IL, Unlimited General Obligation | | |
| Series A | | |
| 4.00%, due 12/1/41 | 33,800,000 | 31,354,364 |
| Western Illinois Economic Development Authority, City of Quincy, Revenue Bonds | | |
| Series B, Insured: BAM | | |
| 4.00%, due 12/1/34 | 1,500,000 | 1,467,987 |
| Will County School District No. 114, Manhattan, Unlimited General Obligation | | |
| Insured: BAM | | |
| 5.50%, due 1/1/49 | 6,510,000 | 6,804,853 |
| | | 599,740,129 |
| | Principal
Amount | Value |
| |
| Indiana 0.4% |
| Greater Clark Building Corp., Revenue Bonds | | |
| Insured: State Intercept | | |
| 6.00%, due 7/15/38 | $ 6,000,000 | $ 6,868,908 |
| Indiana University, Revenue Bonds | | |
| Series A | | |
| 4.00%, due 6/1/39 | 2,595,000 | 2,414,377 |
| Indianapolis Local Public Improvement Bond Bank, Revenue Bonds | | |
| Series A, Insured: AGM | | |
| 4.00%, due 6/1/41 | 13,165,000 | 11,553,590 |
| Merrillville Multi School Building Corp., Revenue Bonds | | |
| Insured: State Intercept | | |
| 5.00%, due 1/15/42 | 5,640,000 | 5,843,750 |
| | | 26,680,625 |
| Iowa 0.8% |
| City of Coralville IA, Certificate of Participation | | |
| Series E | | |
| 4.00%, due 6/1/23 | 1,320,000 | 1,315,924 |
| Iowa Finance Authority, Mortgage-Backed Securities Program, Revenue Bonds | | |
| Series A, Insured: GNMA / FNMA / FHLMC | | |
| 4.00%, due 7/1/47 | 2,035,000 | 1,986,100 |
| PEFA, Inc., Revenue Bonds | | |
| 5.00%, due 9/1/49 (a) | 45,425,000 | 45,394,874 |
| Waterloo Community School District, Infrastructure Sales Services & Use Tax, Revenue Bonds | | |
| Insured: AGM | | |
| 4.00%, due 7/1/29 | 4,000,000 | 4,080,034 |
| | | 52,776,932 |
| Kansas 0.2% |
| City of Hutchinson KS, Hutchinson Regional Medical Center, Inc., Revenue Bonds | | |
| 5.00%, due 12/1/26 | 565,000 | 565,569 |
| 5.00%, due 12/1/28 | 410,000 | 404,745 |
| 5.00%, due 12/1/30 | 500,000 | 486,687 |
| University of Kansas Hospital Authority, KU Health System, Revenue Bonds | | |
| 5.00%, due 9/1/33 | 2,500,000 | 2,552,371 |
The notes to the financial statements are an integral part of, and should be read in conjunction with, the financial statements.
| 26 | MainStay MacKay Tax Free Bond Fund |
| | Principal
Amount | Value |
| Long-Term Municipal Bonds (continued) |
| Kansas (continued) |
| University of Kansas Hospital Authority, KU Health System, Revenue Bonds (continued) | | |
| 5.00%, due 9/1/35 | $ 2,550,000 | $ 2,576,781 |
| 5.00%, due 9/1/45 | 4,650,000 | 4,552,022 |
| | | 11,138,175 |
| Kentucky 0.5% |
| Fayette County School District Finance Corp., Fayette County School District, Revenue Bonds | | |
| Series A, Insured: State Intercept | | |
| 4.00%, due 5/1/38 | 2,420,000 | 2,250,342 |
| Kentucky Public Energy Authority, Gas Supply, Revenue Bonds | | |
| Series A | | |
| 4.00%, due 4/1/48 (a) | 15,250,000 | 15,066,539 |
| Louisville, Unlimited General Obligation | | |
| Series A | | |
| 4.00%, due 4/1/35 | 4,000,000 | 3,947,687 |
| Louisville/Jefferson County Metropolitan Government, UofL Health Project, Revenue Bonds | | |
| Series A, Insured: AGM | | |
| 5.00%, due 5/15/47 | 8,950,000 | 8,890,986 |
| | | 30,155,554 |
| Louisiana 0.5% |
| City of New Orleans LA, Public Improvement, Unlimited General Obligation | | |
| Series A | | |
| 5.00%, due 12/1/40 | 5,000,000 | 5,112,939 |
| City of Shreveport LA, Unlimited General Obligation | | |
| Insured: BAM | | |
| 5.00%, due 8/1/30 | 4,605,000 | 4,812,581 |
| New Orleans Aviation Board, North Terminal Project, Revenue Bonds | | |
| Series B | | |
| 5.00%, due 1/1/40 (b) | 5,000,000 | 4,809,731 |
| Port New Orleans Board of Commissioners, Revenue Bonds | | |
| Series D | | |
| 5.00%, due 4/1/50 | 6,425,000 | 6,450,004 |
| | Principal
Amount | Value |
| |
| Louisiana (continued) |
| State of Louisiana, Unlimited General Obligation | | |
| Series A | | |
| 4.00%, due 2/1/34 | $ 8,880,000 | $ 8,940,676 |
| | | 30,125,931 |
| Maine 0.0% ‡ |
| Maine State Housing Authority, Revenue Bonds | | |
| Series F | | |
| 3.65%, due 11/15/42 | 1,110,000 | 1,088,897 |
| Maryland 1.2% |
| City of Baltimore MD, Water Project, Revenue Bonds | | |
| Series A | | |
| 4.00%, due 7/1/37 | 3,215,000 | 3,051,213 |
| Maryland Stadium Authority, Construction and Revitalization Program, Revenue Bonds | | |
| Series A, Insured: State Intercept | | |
| 5.00%, due 5/1/42 | 22,270,000 | 22,910,937 |
| State of Maryland, Department of Transportation, Revenue Bonds | | |
| Series A | | |
| 3.00%, due 10/1/33 | 5,575,000 | 4,895,444 |
| State of Maryland, State and Local Facilities Loan, Unlimited General Obligation | | |
| Series A | | |
| 5.00%, due 6/1/33 | 4,500,000 | 5,030,655 |
| Series A | | |
| 5.00%, due 6/1/37 | 36,380,000 | 40,052,779 |
| | | 75,941,028 |
| Massachusetts 1.1% |
| City of Boston MA, Unlimited General Obligation | | |
| Series A | | |
| 5.00%, due 11/1/41 | 12,500,000 | 13,497,505 |
| Commonwealth of Massachusetts, Limited General Obligation | | |
| Series D | | |
| 3.00%, due 5/1/35 | 5,790,000 | 4,938,629 |
| Series B | | |
| 3.00%, due 2/1/48 | 6,500,000 | 4,598,359 |
| Series B | | |
| 3.00%, due 4/1/49 | 4,115,000 | 2,886,384 |
The notes to the financial statements are an integral part of, and should be read in conjunction with, the financial statements.
27
Portfolio of Investments October 31, 2022† (continued)
| | Principal
Amount | Value |
| Long-Term Municipal Bonds (continued) |
| Massachusetts (continued) |
| Commonwealth of Massachusetts, Unlimited General Obligation | | |
| Series C | | |
| 5.00%, due 10/1/52 | $ 3,500,000 | $ 3,631,751 |
| Commonwealth of Massachusetts Transportation Fund, Rail Enhancement Program, Revenue Bonds | | |
| Series A | | |
| 4.00%, due 6/1/50 | 8,700,000 | 7,471,598 |
| Series A | | |
| 5.00%, due 6/1/50 | 15,000,000 | 15,511,187 |
| Commonwealth of Massachusetts Transportation Fund, Accelerated Bridge Program, Revenue Bonds | | |
| Series A | | |
| 5.00%, due 6/1/44 | 5,000,000 | 5,046,510 |
| Massachusetts Development Finance Agency, WGBH Educational Foundation, Revenue Bonds | | |
| 4.00%, due 1/1/33 | 1,000,000 | 990,997 |
| Massachusetts Development Finance Agency, Partners Healthcare System Issue, Revenue Bonds | | |
| Series O-2 | | |
| 5.00%, due 7/1/27 | 5,000,000 | 5,178,474 |
| Massachusetts Development Finance Agency, Dana-Farber Cancer Institute, Revenue Bonds | | |
| Series N | | |
| 5.00%, due 12/1/41 | 7,000,000 | 7,004,148 |
| | | 70,755,542 |
| Michigan 1.1% |
| Downriver Utility Wastewater Authority, Revenue Bonds | | |
| Insured: AGM | | |
| 5.00%, due 4/1/31 | 1,600,000 | 1,690,760 |
| Great Lakes Water Authority, Water Supply System, Revenue Bonds, Senior Lien | | |
| Series C | | |
| 5.25%, due 7/1/35 | 18,200,000 | 18,996,974 |
| | Principal
Amount | Value |
| |
| Michigan (continued) |
| Lincoln Consolidated School District, Unlimited General Obligation | | |
| Series A, Insured: AGM Q-SBLF | | |
| 5.00%, due 5/1/28 | $ 2,030,000 | $ 2,135,477 |
| Series A, Insured: AGM Q-SBLF | | |
| 5.00%, due 5/1/30 | 1,455,000 | 1,518,397 |
| Series A, Insured: AGM Q-SBLF | | |
| 5.00%, due 5/1/40 | 1,500,000 | 1,555,877 |
| Livonia Public Schools, Unlimited General Obligation | | |
| Series II, Insured: AGM | | |
| 5.00%, due 5/1/40 | 3,865,000 | 4,016,672 |
| Michigan Finance Authority, Tobacco Settlement Asset-Backed, Revenue Bonds, Senior Lien | | |
| Series A, Class 1 | | |
| 4.00%, due 6/1/36 | 2,000,000 | 1,775,115 |
| Michigan Finance Authority, Wayne County Criminal Justice Center Project, Revenue Bonds, Senior Lien | | |
| 5.00%, due 11/1/25 | 1,000,000 | 1,044,572 |
| 5.00%, due 11/1/27 | 1,200,000 | 1,282,612 |
| Michigan Finance Authority, BHSH System Obligated Group, Revenue Bonds | | |
| 5.00%, due 4/15/28 | 7,100,000 | 7,596,759 |
| Michigan Finance Authority, Great Lakes Water Authority Sewage Disposal System, Revenue Bonds, Second Lien | | |
| Series C-7, Insured: NATL-RE | | |
| 5.00%, due 7/1/32 | 2,250,000 | 2,286,798 |
| Michigan Finance Authority, Great Lakes Water Authority Sewage Disposal System, Revenue Bonds, Senior Lien | | |
| Series C-3, Insured: AGM | | |
| 5.00%, due 7/1/33 | 2,750,000 | 2,785,678 |
| Michigan Finance Authority, Great Lakes Water Authority Water Supply System, Revenue Bonds | | |
| Series D-1, Insured: AGM | | |
| 5.00%, due 7/1/35 | 2,000,000 | 2,024,022 |
| Series D-6, Insured: NATL-RE | | |
| 5.00%, due 7/1/36 | 6,650,000 | 6,726,671 |
The notes to the financial statements are an integral part of, and should be read in conjunction with, the financial statements.
| 28 | MainStay MacKay Tax Free Bond Fund |
| | Principal
Amount | Value |
| Long-Term Municipal Bonds (continued) |
| Michigan (continued) |
| Michigan State Building Authority, Revenue Bonds | | |
| Series I | | |
| 3.00%, due 10/15/51 | $ 5,000,000 | $ 3,374,556 |
| State of Michigan, Trunk Line, Revenue Bonds | | |
| Series A | | |
| 4.00%, due 11/15/44 | 14,000,000 | 12,635,430 |
| | | 71,446,370 |
| Minnesota 0.5% |
| City of Rochester MN, Mayo Clinic, Revenue Bonds | | |
| 4.00%, due 11/15/39 | 14,425,000 | 13,416,361 |
| County of Rice MN, Unlimited General Obligation | | |
| Series A, Insured: MN CRED PROG | | |
| 5.00%, due 2/1/44 | 5,000,000 | 5,310,682 |
| Metropolitan Council, Minneapolis-St.Paul Metropolitan Area, Unlimited General Obligation | | |
| Series A | | |
| 3.00%, due 3/1/29 | 5,750,000 | 5,436,911 |
| Minnesota Housing Finance Agency, Residential Housing Finance, Revenue Bonds | | |
| Series E, Insured: GNMA / FNMA / FHLMC | | |
| 4.25%, due 1/1/49 | 2,690,000 | 2,661,388 |
| Minnesota Office of Higher Education, Student Loan Program, Revenue Bonds, Senior Lien | | |
| 2.65%, due 11/1/38 (b) | 240,000 | 181,063 |
| Minnesota Public Facilities Authority, Revenue Bonds | | |
| Series A | | |
| 5.00%, due 3/1/31 | 5,600,000 | 5,861,945 |
| White Bear Lake Independent School District No. 624, Unlimited General Obligation | | |
| Series A, Insured: SD CRED PROG | | |
| 3.00%, due 2/1/43 | 4,310,000 | 3,157,111 |
| | | 36,025,461 |
| | Principal
Amount | Value |
| |
| Mississippi 0.0% ‡ |
| Mississippi Home Corp., Single Family Mortgage Housing, Revenue Bonds | | |
| Series A, Insured: GNMA / FNMA / FHLMC | | |
| 4.00%, due 12/1/44 | $ 1,140,000 | $ 1,122,092 |
| Missouri 0.5% |
| City of Kansas City MO, Improvement Downtown Arena Project, Revenue Bonds | | |
| Series E | | |
| 5.00%, due 4/1/40 | 9,005,000 | 9,087,473 |
| Kansas City Industrial Development Authority, Airport, Revenue Bonds | | |
| Series A, Insured: AGM | | |
| 5.00%, due 3/1/57 (b) | 4,905,000 | 4,625,795 |
| Metropolitan St. Louis Sewer District, Revenue Bonds | | |
| Series B | | |
| 5.25%, due 5/1/52 | 8,800,000 | 9,372,671 |
| Missouri Housing Development Commission, First Place Homeownership Loan Program, Revenue Bonds | | |
| Series A, Insured: GNMA / FNMA / FHLMC | | |
| 4.25%, due 5/1/47 | 325,000 | 321,582 |
| Series A, Insured: GNMA / FNMA / FHLMC | | |
| 4.25%, due 5/1/49 | 2,405,000 | 2,382,223 |
| Springfield School District No. R-12, Unlimited General Obligation | | |
| 4.00%, due 3/1/35 | 2,640,000 | 2,613,940 |
| St. Louis Municipal Finance Corp., Convention Center Expansion, Revenue Bonds | | |
| Insured: AGM | | |
| 5.00%, due 10/1/49 | 4,510,000 | 4,350,009 |
| | | 32,753,693 |
| Montana 0.4% |
| Montana Board of Housing, Single Family Mortgage, Revenue Bonds | | |
| Series B | | |
| 3.40%, due 12/1/33 | 685,000 | 624,535 |
| Series B | | |
| 3.60%, due 6/1/37 | 890,000 | 795,634 |
The notes to the financial statements are an integral part of, and should be read in conjunction with, the financial statements.
29
Portfolio of Investments October 31, 2022† (continued)
| | Principal
Amount | Value |
| Long-Term Municipal Bonds (continued) |
| Montana (continued) |
| Montana Facility Finance Authority, Benefis Health System Obligated Group, Revenue Bonds | | |
| 5.00%, due 2/15/30 | $ 1,790,000 | $ 1,830,174 |
| 5.00%, due 2/15/31 | 1,500,000 | 1,527,645 |
| 5.00%, due 2/15/33 | 1,320,000 | 1,332,690 |
| 5.00%, due 2/15/34 | 1,200,000 | 1,207,809 |
| Montana State Board of Regents, University of Montana/Missoula, Revenue Bonds | | |
| Insured: AGM | | |
| 5.25%, due 11/15/52 | 5,000,000 | 5,273,583 |
| Silver Bow County School District No. 1, School Building, Unlimited General Obligation | | |
| 4.00%, due 7/1/32 | 1,945,000 | 1,939,430 |
| 4.00%, due 7/1/33 | 2,020,000 | 2,013,259 |
| Yellowstone County K-12, School District No. 26 Lockwood, Unlimited General Obligation | | |
| 5.00%, due 7/1/29 | 2,260,000 | 2,434,072 |
| 5.00%, due 7/1/30 | 2,250,000 | 2,419,034 |
| 5.00%, due 7/1/31 | 2,515,000 | 2,695,532 |
| 5.00%, due 7/1/32 | 2,800,000 | 2,991,927 |
| | | 27,085,324 |
| Nebraska 1.6% |
| Central Plains Energy, Nebraska Gas Project No. 3, Revenue Bonds | | |
| Series A | | |
| 5.00%, due 9/1/42 | 13,095,000 | 12,546,115 |
| Central Plains Energy, Nebraska Gas Project No. 4, Revenue Bonds | | |
| Series A | | |
| 5.00%, due 3/1/50 (a) | 13,315,000 | 13,323,633 |
| Nebraska Investment Finance Authority, Single Family Housing, Revenue Bonds | | |
| Series C | | |
| 4.00%, due 9/1/48 | 2,625,000 | 2,582,845 |
| Omaha Public Power District, Electric System, Revenue Bonds | | |
| Series A | | |
| 4.00%, due 2/1/51 | 8,700,000 | 7,383,565 |
| Series A, Insured: AGM-CR | | |
| 4.00%, due 2/1/51 | 30,000,000 | 26,041,143 |
| | Principal
Amount | Value |
| |
| Nebraska (continued) |
Omaha Public Power District, Electric System, Revenue Bonds
(continued) | | |
| Series A | | |
| 5.00%, due 2/1/46 | $ 18,750,000 | $ 19,654,684 |
| Series A | | |
| 5.00%, due 2/1/47 | 20,000,000 | 21,062,296 |
| | | 102,594,281 |
| Nevada 0.9% |
| City of Reno NV, Capital Improvement, Revenue Bonds | | |
| Series A-1, Insured: AGM | | |
| 4.00%, due 6/1/46 | 1,600,000 | 1,338,982 |
| Clark County School District, Limited General Obligation | | |
| Series B, Insured: BAM | | |
| 3.00%, due 6/15/36 | 5,750,000 | 4,590,709 |
| Series C | | |
| 4.00%, due 6/15/32 | 4,250,000 | 4,245,942 |
| County of Clark NV, Park Improvement, Limited General Obligation | | |
| 4.00%, due 12/1/35 | 7,475,000 | 7,270,616 |
| Las Vegas Convention & Visitors Authority, Convention Center Expansion, Revenue Bonds | | |
| Series B | | |
| 4.00%, due 7/1/49 | 27,700,000 | 22,381,160 |
| Series B | | |
| 5.00%, due 7/1/31 | 1,245,000 | 1,318,001 |
| Series B | | |
| 5.00%, due 7/1/43 | 9,415,000 | 9,543,422 |
| Las Vegas Valley Water District, Limited General Obligation | | |
| 5.00%, due 6/1/33 | 8,000,000 | 8,217,879 |
| Las Vegas Valley Water District, Water Improvement, Limited General Obligation | | |
| Series A | | |
| 5.00%, due 6/1/46 | 3,165,000 | 3,228,982 |
| | | 62,135,693 |
| New Hampshire 0.1% |
| City of Manchester NH, General Airport, Revenue Bonds | | |
| Series A, Insured: AGM | | |
| 5.00%, due 1/1/26 | 1,800,000 | 1,801,774 |
The notes to the financial statements are an integral part of, and should be read in conjunction with, the financial statements.
| 30 | MainStay MacKay Tax Free Bond Fund |
| | Principal
Amount | Value |
| Long-Term Municipal Bonds (continued) |
| New Hampshire (continued) |
| New Hampshire Business Finance Authority, Pennichuck Water Works, Inc., Revenue Bonds | | |
| Series A | | |
| 4.00%, due 4/1/50 (b) | $ 4,775,000 | $ 3,852,346 |
| | | 5,654,120 |
| New Jersey 3.8% |
| Atlantic County Improvement Authority (The), Stockton University, Revenue Bonds | | |
| Series A, Insured: AGM | | |
| 5.00%, due 7/1/31 | 2,170,000 | 2,257,624 |
| Series A, Insured: AGM | | |
| 5.00%, due 7/1/32 | 1,305,000 | 1,355,829 |
| Series A, Insured: AGM | | |
| 5.00%, due 7/1/33 | 1,395,000 | 1,446,197 |
| City of Atlantic City NJ, Unlimited General Obligation | | |
| Series B, Insured: AGM State Aid Withholding | | |
| 5.00%, due 3/1/32 | 2,900,000 | 3,027,015 |
| New Brunswick Parking Authority, City Guaranteed Parking, Revenue Bonds | | |
| Series A, Insured: BAM MUN GOVT GTD | | |
| 5.00%, due 9/1/28 | 2,250,000 | 2,361,392 |
| Series A, Insured: BAM MUN GOVT GTD | | |
| 5.00%, due 9/1/29 | 2,120,000 | 2,223,540 |
| Series A, Insured: BAM MUN GOVT GTD | | |
| 5.00%, due 9/1/30 | 3,855,000 | 4,034,839 |
| Series A, Insured: BAM MUN GOVT GTD | | |
| 5.00%, due 9/1/31 | 5,980,000 | 6,239,919 |
| New Jersey Building Authority, Revenue Bonds | | |
| Series A, Insured: BAM | | |
| 5.00%, due 6/15/25 | 2,015,000 | 2,081,450 |
| Series A, Insured: BAM | | |
| 5.00%, due 6/15/28 | 1,805,000 | 1,868,924 |
| | Principal
Amount | Value |
| |
| New Jersey (continued) |
| New Jersey Economic Development Authority, The Goethals Bridge Replacement Project, Revenue Bonds (b) | | |
| 5.00%, due 1/1/28 | $ 1,000,000 | $ 995,308 |
| 5.50%, due 1/1/26 | 1,000,000 | 1,005,831 |
| New Jersey Economic Development Authority, State of New Jersey Motor Vehicle Surcharge, Revenue Bonds | | |
| Series A, Insured: BAM | | |
| 5.00%, due 7/1/28 | 2,000,000 | 2,073,876 |
| New Jersey Educational Facilities Authority, Stockton University, Revenue Bonds | | |
| Series A, Insured: BAM | | |
| 5.00%, due 7/1/29 | 4,025,000 | 4,172,003 |
| Series A, Insured: BAM | | |
| 5.00%, due 7/1/30 | 4,250,000 | 4,401,455 |
| Series A, Insured: BAM | | |
| 5.00%, due 7/1/31 | 3,000,000 | 3,101,422 |
| New Jersey Health Care Facilities Financing Authority, Hackensack Meridian Health, Inc., Revenue Bonds | | |
| Series A | | |
| 5.00%, due 7/1/38 | 8,900,000 | 9,141,666 |
| New Jersey Transportation Trust Fund Authority, Transportation System, Revenue Bonds | | |
| Series C, Insured: NATL-RE | | |
| (zero coupon), due 12/15/27 | 8,360,000 | 6,720,668 |
| Series C, Insured: NATL-RE | | |
| (zero coupon), due 12/15/30 | 18,075,000 | 12,486,235 |
| Series C, Insured: AGM | | |
| (zero coupon), due 12/15/34 | 27,400,000 | 15,029,642 |
| Series A | | |
| 5.00%, due 12/15/26 | 3,750,000 | 3,893,559 |
| Series AA | | |
| 5.00%, due 6/15/44 | 11,955,000 | 11,507,882 |
| Series BB | | |
| 5.00%, due 6/15/44 | 12,155,000 | 11,700,402 |
| Series AA | | |
| 5.00%, due 6/15/46 | 6,515,000 | 6,252,023 |
| Series AA | | |
| 5.25%, due 6/15/43 | 9,155,000 | 9,167,994 |
The notes to the financial statements are an integral part of, and should be read in conjunction with, the financial statements.
31
Portfolio of Investments October 31, 2022† (continued)
| | Principal
Amount | Value |
| Long-Term Municipal Bonds (continued) |
| New Jersey (continued) |
| New Jersey Transportation Trust Fund Authority, Federal Highway Reimbursement, Revenue Bonds | | |
| Series A | | |
| 5.00%, due 6/15/28 | $ 4,300,000 | $ 4,433,248 |
| Series A | | |
| 5.00%, due 6/15/29 | 7,480,000 | 7,696,908 |
| New Jersey Turnpike Authority, Revenue Bonds | | |
| Series E | | |
| 5.00%, due 1/1/45 | 2,150,000 | 2,174,117 |
| Series B | | |
| 5.25%, due 1/1/52 | 38,170,000 | 39,741,371 |
| Newark Housing Authority Scholarship Foundation A New Jersey Non (The), Police Facility, Revenue Bonds | | |
| Insured: AGM MUN GOVT GTD | | |
| 5.00%, due 12/1/38 | 1,740,000 | 1,787,108 |
| South Jersey Transportation Authority, Revenue Bonds | | |
| Series A, Insured: BAM | | |
| 5.00%, due 11/1/45 | 2,000,000 | 1,997,939 |
| State of New Jersey, COVID-19 General Obligation Emergency Bonds, Unlimited General Obligation | | |
| Series A | | |
| 4.00%, due 6/1/30 | 20,000,000 | 20,201,890 |
| 4.00%, due 6/1/32 | 2,845,000 | 2,827,538 |
| State of New Jersey, Various Purpose, Unlimited General Obligation | | |
| 5.00%, due 6/1/38 | 9,770,000 | 10,165,749 |
| 5.00%, due 6/1/41 | 11,700,000 | 12,106,409 |
| Tobacco Settlement Financing Corp., Revenue Bonds | | |
| Series A | | |
| 5.00%, due 6/1/31 | 2,500,000 | 2,561,833 |
| Series A | | |
| 5.00%, due 6/1/33 | 5,700,000 | 5,796,604 |
| Series A | | |
| 5.00%, due 6/1/34 | 1,500,000 | 1,519,588 |
| Series A | | |
| 5.00%, due 6/1/36 | 5,200,000 | 5,248,495 |
| | Principal
Amount | Value |
| |
| New Jersey (continued) |
| Township of Edison NJ, Unlimited General Obligation | | |
| 2.00%, due 3/15/36 | $ 4,795,000 | $ 3,354,422 |
| | | 250,159,914 |
| New Mexico 0.0% ‡ |
| New Mexico Hospital Equipment Loan Council, Presbyterian Healthcare Services, Revenue Bonds | | |
| Series A | | |
| 4.00%, due 8/1/37 | 3,900,000 | 3,575,086 |
| New York 17.9% |
| Battery Park City Authority, Revenue Bonds, Senior Lien | | |
| Series A | | |
| 5.00%, due 11/1/49 | 8,300,000 | 8,649,280 |
| City of New York NY, Unlimited General Obligation | | |
| Series A, Insured: BAM | | |
| 3.00%, due 8/1/36 | 9,420,000 | 7,710,258 |
| Series A-1 | | |
| 4.00%, due 8/1/37 | 2,000,000 | 1,851,494 |
| Series A-1 | | |
| 4.00%, due 8/1/38 | 6,400,000 | 5,843,830 |
| Series A-1 | | |
| 4.00%, due 8/1/42 | 3,000,000 | 2,633,326 |
| Series A | | |
| 4.00%, due 8/1/44 | 8,750,000 | 7,584,755 |
| Series D-1 | | |
| 4.00%, due 3/1/50 | 13,610,000 | 11,559,708 |
| Series A | | |
| 5.00%, due 8/1/32 | 6,000,000 | 6,562,469 |
| Series A-1 | | |
| 5.00%, due 9/1/37 | 4,500,000 | 4,773,723 |
| Series C | | |
| 5.00%, due 8/1/42 | 2,410,000 | 2,479,219 |
| Series B-1 | | |
| 5.25%, due 10/1/32 | 17,850,000 | 19,047,071 |
| Series E | | |
| 5.50%, due 8/1/25 | 5,000,000 | 5,081,346 |
| City of New York NY, Limited General Obligation | | |
| Series F-1 | | |
| 5.00%, due 3/1/43 | 4,565,000 | 4,692,626 |
The notes to the financial statements are an integral part of, and should be read in conjunction with, the financial statements.
| 32 | MainStay MacKay Tax Free Bond Fund |
| | Principal
Amount | Value |
| Long-Term Municipal Bonds (continued) |
| New York (continued) |
| City of Yonkers NY, Unlimited General Obligation | | |
| Series D, Insured: AGM State Aid Withholding | | |
| 4.00%, due 3/15/42 | $ 4,500,000 | $ 3,921,941 |
| County of Suffolk NY, Public Improvement, Limited General Obligation | | |
| Series A, Insured: BAM | | |
| 4.00%, due 4/1/32 | 4,280,000 | 4,295,371 |
| Series B, Insured: AGM | | |
| 5.00%, due 10/15/28 | 3,520,000 | 3,792,013 |
| Hudson Yards Infrastructure Corp., Second Indenture, Revenue Bonds | | |
| Series A | | |
| 4.00%, due 2/15/37 | 2,175,000 | 1,996,979 |
| Long Island Power Authority, Electric System, Revenue Bonds | | |
| 5.00%, due 9/1/37 | 2,000,000 | 2,069,705 |
| Series A, Insured: BAM | | |
| 5.00%, due 9/1/39 | 9,000,000 | 9,153,872 |
| Series B | | |
| 5.00%, due 9/1/45 | 8,070,000 | 8,272,672 |
| Metropolitan Transportation Authority, Green Bond, Revenue Bonds | | |
| Series A-1, Insured: AGM | | |
| 4.00%, due 11/15/42 | 6,895,000 | 5,894,632 |
| Series A-1 | | |
| 5.00%, due 11/15/41 | 2,410,000 | 2,290,561 |
| Series D-1 | | |
| 5.00%, due 11/15/44 | 11,050,000 | 10,327,057 |
| Metropolitan Transportation Authority, Revenue Bonds | | |
| Series D | | |
| 5.00%, due 11/15/26 | 2,000,000 | 2,001,054 |
| Series D-1 | | |
| 5.00%, due 11/15/26 | 2,285,000 | 2,333,456 |
| Series A-1 | | |
| 5.00%, due 11/15/37 | 1,300,000 | 1,260,411 |
| Series C | | |
| 5.00%, due 11/15/38 | 6,700,000 | 6,472,784 |
| Series A-1 | | |
| 5.00%, due 11/15/40 | 4,390,000 | 4,189,527 |
| Series C | | |
| 5.00%, due 11/15/42 | 9,025,000 | 8,534,679 |
| | Principal
Amount | Value |
| |
| New York (continued) |
Metropolitan Transportation Authority, Revenue Bonds
(continued) | | |
| Series B | | |
| 5.00%, due 11/15/43 | $ 1,575,000 | $ 1,480,247 |
| Series E | | |
| 5.00%, due 11/15/43 | 2,500,000 | 2,349,598 |
| Series C-1 | | |
| 5.25%, due 11/15/29 | 2,230,000 | 2,270,343 |
| Series B | | |
| 5.25%, due 11/15/35 | 2,370,000 | 2,374,797 |
| Metropolitan Transportation Authority, Climate Certified Green Bond, Revenue Bonds | | |
| Series C, Insured: BAM | | |
| 5.00%, due 11/15/44 | 13,245,000 | 13,351,628 |
| Metropolitan Transportation Authority, Dedicated Tax Fund, Revenue Bonds | | |
| Series A | | |
| 5.00%, due 11/15/46 | 13,040,000 | 13,249,061 |
| Series A | | |
| 5.00%, due 11/15/48 | 6,060,000 | 6,146,526 |
| Series A | | |
| 5.00%, due 11/15/49 | 5,500,000 | 5,574,837 |
| New York City Municipal Water Finance Authority, Water & Sewer System Second General Resolution, Revenue Bonds | | |
| Series BB-1, Insured: BAM | | |
| 3.00%, due 6/15/44 | 19,500,000 | 14,015,492 |
| Series FF-2 | | |
| 4.00%, due 6/15/41 | 7,275,000 | 6,544,721 |
| Series AA-2 | | |
| 4.00%, due 6/15/42 | 3,915,000 | 3,485,370 |
| Series AA-2 | | |
| 4.00%, due 6/15/43 | 6,450,000 | 5,700,557 |
| Series AA | | |
| 5.00%, due 6/15/37 | 4,000,000 | 4,138,636 |
| Series AA | | |
| 5.00%, due 6/15/38 | 3,000,000 | 3,093,453 |
| Series FF | | |
| 5.00%, due 6/15/38 | 4,815,000 | 5,008,491 |
| Series EE | | |
| 5.00%, due 6/15/45 | 4,000,000 | 4,095,666 |
| Series DD-1 | | |
| 5.00%, due 6/15/48 | 3,965,000 | 4,036,697 |
The notes to the financial statements are an integral part of, and should be read in conjunction with, the financial statements.
33
Portfolio of Investments October 31, 2022† (continued)
| | Principal
Amount | Value |
| Long-Term Municipal Bonds (continued) |
| New York (continued) |
New York City Municipal Water Finance Authority, Water & Sewer System Second General Resolution, Revenue Bonds
(continued) | | |
| Series GG-1 | | |
| 5.00%, due 6/15/48 | $ 4,600,000 | $ 4,705,502 |
| Series BB | | |
| 5.00%, due 6/15/49 | 7,400,000 | 7,498,104 |
| Series CC-1 | | |
| 5.00%, due 6/15/51 | 11,555,000 | 11,802,131 |
| New York City Transitional Finance Authority, Building Aid, Revenue Bonds | | |
| Series S-1, Insured: State Aid Withholding | | |
| 3.00%, due 7/15/49 | 10,500,000 | 7,138,873 |
| Series S-1, Insured: State Aid Withholding | | |
| 4.00%, due 7/15/35 | 4,320,000 | 4,151,376 |
| Series S-1A, Insured: State Aid Withholding | | |
| 4.00%, due 7/15/36 | 3,250,000 | 3,090,808 |
| Series S-1, Insured: State Aid Withholding | | |
| 4.00%, due 7/15/40 | 7,000,000 | 6,336,173 |
| Series S-1, Insured: State Aid Withholding | | |
| 5.00%, due 7/15/33 | 5,310,000 | 5,424,006 |
| Series S-1, Insured: State Aid Withholding | | |
| 5.00%, due 7/15/36 | 8,950,000 | 9,104,323 |
| Series S-1, Insured: State Aid Withholding | | |
| 5.00%, due 7/15/43 | 7,630,000 | 7,738,429 |
| New York City Transitional Finance Authority, Future Tax Secured, Revenue Bonds | | |
| Series A-1 | | |
| 4.00%, due 11/1/37 | 7,000,000 | 6,500,906 |
| Series E-1 | | |
| 4.00%, due 2/1/39 | 6,330,000 | 5,779,810 |
| Series C-1 | | |
| 4.00%, due 2/1/40 | 4,500,000 | 4,075,407 |
| Series C-1 | | |
| 4.00%, due 5/1/40 | 3,500,000 | 3,166,894 |
| | Principal
Amount | Value |
| |
| New York (continued) |
| New York City Transitional Finance Authority, Future Tax Secured, Revenue Bonds (continued) | | |
| Series C-1 | | |
| 4.00%, due 5/1/40 | $ 6,035,000 | $ 5,460,631 |
| Series C-1 | | |
| 4.00%, due 11/1/40 | 8,500,000 | 7,676,384 |
| Series C-1 | | |
| 4.00%, due 11/1/42 | 8,670,000 | 7,677,555 |
| Series C-3 | | |
| 4.00%, due 5/1/44 | 12,000,000 | 10,484,628 |
| Series C-1 | | |
| 4.00%, due 5/1/45 | 19,500,000 | 16,865,952 |
| Series E-1 | | |
| 4.00%, due 2/1/46 | 16,985,000 | 14,620,229 |
| Series F-1 | | |
| 5.00%, due 5/1/32 | 3,500,000 | 3,660,462 |
| Series A-1 | | |
| 5.00%, due 5/1/33 | 8,975,000 | 9,258,924 |
| Series A-2 | | |
| 5.00%, due 8/1/33 | 4,000,000 | 4,174,798 |
| Series A-2 | | |
| 5.00%, due 8/1/34 | 6,895,000 | 7,169,817 |
| Series A-1 | | |
| 5.00%, due 8/1/40 | 10,300,000 | 10,525,765 |
| Series E-1 | | |
| 5.00%, due 2/1/43 | 3,750,000 | 3,801,030 |
| Series C-1 | | |
| 5.00%, due 2/1/51 | 10,000,000 | 10,158,655 |
| Series A-1 | | |
| 5.25%, due 8/1/40 | 7,500,000 | 7,938,922 |
| New York Convention Center Development Corp., Hotel Unit Fee, Revenue Bonds, Sub. Lien | | |
| Series B, Insured: BAM | | |
| (zero coupon), due 11/15/36 | 5,050,000 | 2,479,964 |
| New York Liberty Development Corp., Bank of America Tower at One Bryant Park Project, Revenue Bonds | | |
| 2.45%, due 9/15/69 | 11,625,000 | 9,742,424 |
| New York Liberty Development Corp., 1 World Trade Center, Revenue Bonds | | |
| Insured: BAM | | |
| 3.00%, due 2/15/42 | 3,800,000 | 2,780,744 |
| 4.00%, due 2/15/43 | 10,000,000 | 8,450,955 |
The notes to the financial statements are an integral part of, and should be read in conjunction with, the financial statements.
| 34 | MainStay MacKay Tax Free Bond Fund |
| | Principal
Amount | Value |
| Long-Term Municipal Bonds (continued) |
| New York (continued) |
| New York State Dormitory Authority, State Personal Income Tax, Revenue Bonds | | |
| Series A | | |
| 3.00%, due 3/15/39 | $ 18,500,000 | $ 13,964,792 |
| Series E | | |
| 3.00%, due 3/15/41 | 2,250,000 | 1,651,518 |
| Series A | | |
| 4.00%, due 3/15/36 | 2,500,000 | 2,365,057 |
| Series D | | |
| 4.00%, due 2/15/37 | 5,500,000 | 5,137,027 |
| Series A | | |
| 4.00%, due 3/15/37 | 4,250,000 | 3,968,416 |
| Series A | | |
| 4.00%, due 3/15/37 | 3,450,000 | 3,221,420 |
| Series D | | |
| 4.00%, due 2/15/39 | 5,000,000 | 4,570,034 |
| Series A | | |
| 4.00%, due 3/15/39 | 18,200,000 | 16,629,833 |
| Series A | | |
| 4.00%, due 3/15/41 | 3,430,000 | 3,065,409 |
| Series E | | |
| 4.00%, due 3/15/42 | 9,000,000 | 7,957,891 |
| Series A | | |
| 4.00%, due 3/15/43 | 7,000,000 | 6,151,273 |
| Series E | | |
| 4.00%, due 3/15/45 | 2,800,000 | 2,433,039 |
| Series E | | |
| 5.00%, due 3/15/34 | 3,690,000 | 3,807,058 |
| Series E | | |
| 5.00%, due 2/15/35 | 3,155,000 | 3,345,992 |
| Series A | | |
| 5.00%, due 3/15/36 | 9,000,000 | 9,458,523 |
| Series A | | |
| 5.00%, due 3/15/41 | 4,000,000 | 4,156,706 |
| New York State Dormitory Authority, School Districts Financing Program, Revenue Bonds | | |
| Series A, Insured: AGM | | |
| 5.00%, due 10/1/34 | 5,000 | 5,424 |
| Series A, Insured: BAM | | |
| 5.00%, due 10/1/36 | 4,000,000 | 4,205,880 |
| New York State Dormitory Authority, University Facilities, Revenue Bonds | | |
| Series A | | |
| 5.00%, due 7/1/36 | 1,000,000 | 1,039,494 |
| | Principal
Amount | Value |
| |
| New York (continued) |
| New York State Dormitory Authority, University Facilities, Revenue Bonds (continued) | | |
| Series A | | |
| 5.00%, due 7/1/38 | $ 1,000,000 | $ 1,034,406 |
| New York State Dormitory Authority, Sales Tax, Revenue Bonds | | |
| Series A | | |
| 5.00%, due 3/15/40 | 21,130,000 | 21,728,607 |
| Series C | | |
| 5.00%, due 3/15/40 | 13,350,000 | 13,728,201 |
| Series E | | |
| 5.00%, due 3/15/40 | 4,250,000 | 4,380,264 |
| Series C | | |
| 5.00%, due 3/15/41 | 30,070,000 | 30,890,192 |
| Series A | | |
| 5.00%, due 3/15/43 | 6,600,000 | 6,755,064 |
| New York State Dormitory Authority, Sales tax, Revenue Bonds | | |
| Series C | | |
| 5.00%, due 3/15/41 | 7,280,000 | 7,453,684 |
| New York State Environmental Facilities Corp., Clean Water & Drinking Water, Revenue Bonds | | |
| Series B | | |
| 3.00%, due 6/15/38 | 8,400,000 | 6,681,869 |
| New York State Thruway Authority, General Revenue Junior Indebtedness Obligation, Revenue Bonds | | |
| Series B, Insured: BAM | | |
| 4.00%, due 1/1/39 | 14,930,000 | 13,400,757 |
| Series B | | |
| 4.00%, due 1/1/41 | 4,000,000 | 3,531,587 |
| Series B, Insured: AGM | | |
| 4.00%, due 1/1/50 | 4,990,000 | 4,063,102 |
| New York State Thruway Authority, General Revenue Junior Indebtedness Obligation, Revenue Bonds, Junior Lien | | |
| Series B, Insured: BAM | | |
| 4.00%, due 1/1/45 | 4,900,000 | 4,118,067 |
| Series A | | |
| 5.00%, due 1/1/46 | 4,500,000 | 4,480,617 |
The notes to the financial statements are an integral part of, and should be read in conjunction with, the financial statements.
35
Portfolio of Investments October 31, 2022† (continued)
| | Principal
Amount | Value |
| Long-Term Municipal Bonds (continued) |
| New York (continued) |
| New York State Thruway Authority, State Personal Income Tax, Revenue Bonds | | |
| Series C | | |
| 4.125%, due 3/15/57 | $ 8,225,000 | $ 6,833,610 |
| Series A | | |
| 5.00%, due 3/15/34 | 16,950,000 | 18,411,507 |
| New York State Thruway Authority, Revenue Bonds | | |
| Series N | | |
| 5.00%, due 1/1/34 | 9,780,000 | 10,305,863 |
| Series N | | |
| 5.00%, due 1/1/36 | 14,660,000 | 15,261,311 |
| Series N | | |
| 5.00%, due 1/1/38 | 4,415,000 | 4,557,090 |
| New York State Urban Development Corp., Personal Income Tax, Revenue Bonds | | |
| Series C | | |
| 3.00%, due 3/15/40 | 17,335,000 | 13,237,852 |
| Series A | | |
| 3.00%, due 3/15/50 | 11,460,000 | 7,854,000 |
| Series A | | |
| 4.00%, due 3/15/38 | 2,005,000 | 1,850,646 |
| Series E | | |
| 4.00%, due 3/15/46 | 2,770,000 | 2,379,890 |
| Series A | | |
| 5.00%, due 3/15/42 | 16,000,000 | 16,547,509 |
| New York State Urban Development Corp., Sales Tax, Revenue Bonds | | |
| Series A | | |
| 3.00%, due 3/15/41 | 9,000,000 | 6,646,388 |
| Series A | | |
| 3.00%, due 3/15/42 | 9,000,000 | 6,554,594 |
| Series A | | |
| 4.00%, due 3/15/37 | 15,000,000 | 14,096,313 |
| Series A | | |
| 4.00%, due 3/15/42 | 9,180,000 | 8,201,560 |
| Series A | | |
| 5.00%, due 3/15/36 | 5,610,000 | 5,857,208 |
| New York State Urban Development Corp., State Personal Income Tax, Revenue Bonds | | |
| Series A | | |
| 5.00%, due 3/15/30 | 11,050,000 | 11,504,565 |
| Series A | | |
| 5.00%, due 3/15/43 | 9,285,000 | 9,458,623 |
| | Principal
Amount | Value |
| |
| New York (continued) |
| New York Transportation Development Corp., LaGuardia Airport Terminal B Redevelopment Project, Revenue Bonds (b) | | |
| Series A, Insured: AGM-CR | | |
| 4.00%, due 7/1/31 | $ 9,875,000 | $ 9,328,400 |
| Series A, Insured: AGM | | |
| 4.00%, due 7/1/35 | 11,330,000 | 10,164,575 |
| Series A, Insured: AGM | | |
| 4.00%, due 7/1/37 | 12,520,000 | 11,007,141 |
| New York Transportation Development Corp., Terminal 4 JFK International Airport Project, Revenue Bonds (b) | | |
| 5.00%, due 12/1/27 | 4,500,000 | 4,542,286 |
| 5.00%, due 12/1/28 | 4,500,000 | 4,521,331 |
| 5.00%, due 12/1/29 | 8,300,000 | 8,266,235 |
| 5.00%, due 12/1/30 | 1,700,000 | 1,690,434 |
| Onondaga County Trust for Cultural Resources, Syracuse University Project, Revenue Bonds | | |
| 5.00%, due 12/1/43 | 13,810,000 | 14,333,250 |
| 5.00%, due 12/1/45 | 5,940,000 | 6,148,176 |
| Port Authority of New York & New Jersey, Revenue Bonds | | |
| Series 223 | | |
| 4.00%, due 7/15/35 (b) | 3,670,000 | 3,333,720 |
| Series 222, Insured: BAM | | |
| 4.00%, due 7/15/39 | 5,000,000 | 4,568,196 |
| Series 223 | | |
| 4.00%, due 7/15/39 (b) | 2,090,000 | 1,826,400 |
| Series 221 | | |
| 4.00%, due 7/15/40 (b) | 3,000,000 | 2,604,742 |
| Series 218 | | |
| 4.00%, due 11/1/41 (b) | 10,815,000 | 9,313,122 |
| Series 223 | | |
| 4.00%, due 7/15/46 (b) | 4,425,000 | 3,645,072 |
| Series 218 | | |
| 5.00%, due 11/1/44 (b) | 3,000,000 | 2,805,589 |
| Series 234 | | |
| 5.25%, due 8/1/47 (b) | 9,000,000 | 9,173,279 |
| Series 231 | | |
| 5.50%, due 8/1/39 (b) | 8,000,000 | 8,524,531 |
| Series 231 | | |
| 5.50%, due 8/1/47 (b) | 19,000,000 | 19,878,043 |
The notes to the financial statements are an integral part of, and should be read in conjunction with, the financial statements.
| 36 | MainStay MacKay Tax Free Bond Fund |
| | Principal
Amount | Value |
| Long-Term Municipal Bonds (continued) |
| New York (continued) |
| Rensselaer City School District, Certificate of Participation | | |
| Insured: AGM State Aid Withholding | | |
| 5.00%, due 6/1/30 | $ 1,880,000 | $ 1,956,547 |
| Insured: AGM State Aid Withholding | | |
| 5.00%, due 6/1/32 | 2,000,000 | 2,079,394 |
| State of New York, Unlimited General Obligation | | |
| Series A | | |
| 3.00%, due 3/15/34 | 2,500,000 | 2,154,158 |
| Suffolk County Water Authority, Waterworks, Revenue Bonds | | |
| Series A | | |
| 3.75%, due 6/1/36 | 16,270,000 | 14,770,674 |
| Triborough Bridge & Tunnel Authority, Payroll Mobility Tax, Revenue Bonds, Senior Lien | | |
| Series C-3 | | |
| 3.00%, due 5/15/51 | 5,000,000 | 3,291,109 |
| Series D-2 | | |
| 5.25%, due 5/15/47 | 24,000,000 | 25,189,114 |
| Series D-2 | | |
| 5.50%, due 5/15/52 | 22,710,000 | 24,198,463 |
| Triborough Bridge & Tunnel Authority, MTA Bridges & Tunnels, Revenue Bonds | | |
| Series C | | |
| 4.00%, due 11/15/41 | 10,750,000 | 9,323,729 |
| Series B | | |
| 5.00%, due 11/15/35 | 7,660,000 | 7,890,285 |
| Series B | | |
| 5.00%, due 11/15/37 | 3,100,000 | 3,167,201 |
| Series A | | |
| 5.00%, due 11/15/41 | 5,000,000 | 5,105,055 |
| Series A | | |
| 5.00%, due 11/15/42 | 5,255,000 | 5,382,902 |
| Series A | | |
| 5.00%, due 11/15/46 | 10,195,000 | 10,277,525 |
| Series A | | |
| 5.00%, due 11/15/46 | 2,500,000 | 2,544,329 |
| Triborough Bridge & Tunnel Authority, Sales Tax, Revenue Bonds | | |
| Series A | | |
| 5.25%, due 5/15/52 | 21,750,000 | 22,708,464 |
| | Principal
Amount | Value |
| |
| New York (continued) |
| TSASC, Inc., Tobacco Settlement Bonds, Revenue Bonds | | |
| Series A | | |
| 5.00%, due 6/1/34 | $ 6,190,000 | $ 6,254,855 |
| Series A | | |
| 5.00%, due 6/1/35 | 2,615,000 | 2,638,218 |
| Utility Debt Securitization Authority, Revenue Bonds | | |
| Series E-1 | | |
| 5.00%, due 12/15/39 | 10,000,000 | 10,769,335 |
| | | 1,165,948,131 |
| North Dakota 0.1% |
| City of Grand Forks ND, Altru Health System Obligated Group, Revenue Bonds | | |
| Insured: AGM | | |
| 3.00%, due 12/1/46 | 7,710,000 | 5,343,984 |
| State Board of Higher Education of the State of North Dakota, University of North Dakota Housing & Auxiliary Facilities, Revenue Bonds | | |
| Series A, Insured: AGM | | |
| 4.00%, due 4/1/44 | 3,250,000 | 2,881,371 |
| | | 8,225,355 |
| Ohio 1.0% |
| American Municipal Power, Inc., Prairie State Energy Campus Project, Revenue Bonds | | |
| Series A, Insured: BAM | | |
| 4.00%, due 2/15/34 | 24,435,000 | 23,196,568 |
| Series A, Insured: BAM | | |
| 5.00%, due 2/15/33 | 3,700,000 | 3,946,673 |
| Buckeye Tobacco Settlement Financing Authority, Revenue Bonds, Senior Lien | | |
| Series A-2, Class 1 | | |
| 5.00%, due 6/1/36 | 3,000,000 | 3,057,813 |
| Clermont County Port Authority, West Clermont Local School District Project, Revenue Bonds | | |
| Insured: BAM | | |
| 5.00%, due 12/1/32 | 2,200,000 | 2,279,624 |
| Insured: BAM | | |
| 5.00%, due 12/1/33 | 1,335,000 | 1,382,531 |
The notes to the financial statements are an integral part of, and should be read in conjunction with, the financial statements.
37
Portfolio of Investments October 31, 2022† (continued)
| | Principal
Amount | Value |
| Long-Term Municipal Bonds (continued) |
| Ohio (continued) |
| Cleveland-Cuyahoga County Port Authority, Annual Appropriation Bonds, Revenue Bonds | | |
| 6.00%, due 11/15/25 | $ 1,630,000 | $ 1,633,468 |
| County of Franklin OH, Nationwide Children's Hospital, Inc., Revenue Bonds | | |
| Series C | | |
| 4.00%, due 11/1/40 | 3,000,000 | 2,693,425 |
| Ohio Higher Educational Facility Commission, Ashtabula County Medical Center Obligated Group, Revenue Bonds | | |
| 5.00%, due 1/1/23 | 200,000 | 200,223 |
| 5.00%, due 1/1/30 | 210,000 | 214,780 |
| 5.00%, due 1/1/34 | 360,000 | 363,018 |
| 5.25%, due 1/1/36 | 495,000 | 503,717 |
| 5.25%, due 1/1/52 | 2,500,000 | 2,425,730 |
| Ohio Housing Finance Agency, Residential Mortgage, Revenue Bonds | | |
| Series A, Insured: GNMA / FNMA / FHLMC | | |
| 4.50%, due 9/1/48 | 2,955,000 | 2,942,634 |
| Ohio Water Development Authority Water Pollution Control Loan Fund, Green Bond, Revenue Bonds | | |
| Series A | | |
| 4.00%, due 12/1/46 | 3,270,000 | 2,889,468 |
| State of Ohio, Cleveland Clinic Health System Obligated Group, Revenue Bonds | | |
| 4.00%, due 1/1/46 | 5,530,000 | 4,809,724 |
| University of Cincinnati, Revenue Bonds | | |
| Series A | | |
| 5.00%, due 6/1/45 | 11,675,000 | 11,982,989 |
| Series C | | |
| 5.00%, due 6/1/46 | 2,500,000 | 2,543,079 |
| West Carrollton City School District, Unlimited General Obligation | | |
| Series A, Insured: SD CRED PROG | | |
| 4.00%, due 12/1/56 | 1,200,000 | 992,327 |
| | | 68,057,791 |
| | Principal
Amount | Value |
| |
| Oklahoma 0.4% |
| Garfield County Educational Facilities Authority, Enid Public Schools Project, Revenue Bonds | | |
| Series A | | |
| 5.00%, due 9/1/28 | $ 4,250,000 | $ 4,453,630 |
| Series A | | |
| 5.00%, due 9/1/29 | 3,870,000 | 4,045,560 |
| Lincoln County Educational Facilities Authority, Stroud Public Schools Project, Revenue Bonds | | |
| 5.00%, due 9/1/28 | 2,700,000 | 2,797,097 |
| 5.00%, due 9/1/29 | 2,120,000 | 2,188,629 |
| Oklahoma Housing Finance Agency, Revenue Bonds | | |
| Series A | | |
| 4.75%, due 9/1/48 | 1,920,000 | 1,923,352 |
| Oklahoma Turnpike Authority, Revenue Bonds, Second Series | | |
| Series C | | |
| 4.00%, due 1/1/42 | 4,500,000 | 4,222,604 |
| Weatherford Industrial Trust, Custer County Independent School District No. 26 Weatherford, Revenue Bonds | | |
| 5.00%, due 3/1/31 | 1,820,000 | 1,956,268 |
| 5.00%, due 3/1/33 | 2,000,000 | 2,134,939 |
| | | 23,722,079 |
| Oregon 0.2% |
| Port of Portland, Airport, Revenue Bonds | | |
| Series A | | |
| 5.00%, due 7/1/37 (b) | 9,350,000 | 9,285,736 |
| State of Oregon Housing & Community Services Department, Single Family Mortgage Program, Revenue Bonds | | |
| Series C | | |
| 4.50%, due 7/1/49 | 5,005,000 | 4,989,786 |
| | | 14,275,522 |
| Pennsylvania 1.9% |
| City of Philadelphia PA, Unlimited General Obligation | | |
| Series A | | |
| 5.00%, due 5/1/32 | 4,000,000 | 4,218,164 |
The notes to the financial statements are an integral part of, and should be read in conjunction with, the financial statements.
| 38 | MainStay MacKay Tax Free Bond Fund |
| | Principal
Amount | Value |
| Long-Term Municipal Bonds (continued) |
| Pennsylvania (continued) |
| City of Philadelphia PA, Water & Wastewater, Revenue Bonds | | |
| Series C | | |
| 5.50%, due 6/1/52 | $ 12,000,000 | $ 12,568,973 |
| Commonwealth Financing Authority, Tobacco Master Settlement Payment, Revenue Bonds | | |
| Insured: AGM | | |
| 4.00%, due 6/1/39 | 5,250,000 | 4,787,648 |
| Insured: BAM | | |
| 5.00%, due 6/1/31 | 8,950,000 | 9,338,227 |
| Commonwealth Financing Authority, Revenue Bonds | | |
| Series B-1, Insured: AGM | | |
| 5.00%, due 6/1/25 | 2,500,000 | 2,591,955 |
| Commonwealth of Pennsylvania, Unlimited General Obligation, First Series | | |
| 4.00%, due 4/1/32 | 9,000,000 | 9,002,227 |
| Pennsylvania Economic Development Financing Authority, UPMC Obligated Group, Revenue Bonds | | |
| Series A | | |
| 4.00%, due 11/15/36 | 4,465,000 | 4,013,016 |
| Pennsylvania Higher Educational Facilities Authority, University of Pennsylvania Health System, Revenue Bonds | | |
| Series B | | |
| 4.00%, due 8/15/42 | 5,875,000 | 5,235,468 |
| 4.00%, due 8/15/49 | 21,140,000 | 17,905,777 |
| 5.00%, due 8/15/49 | 4,750,000 | 4,753,097 |
| Pennsylvania State University (The), Revenue Bonds | | |
| Series A | | |
| 5.00%, due 9/1/48 | 5,000,000 | 5,113,306 |
| Pennsylvania Turnpike Commission, Revenue Bonds | | |
| Series A, Insured: BAM | | |
| 5.00%, due 12/1/44 | 8,975,000 | 9,069,505 |
| Pittsburgh Water & Sewer Authority, Revenue Bonds, First Lien | | |
| Series A, Insured: AGM | | |
| 5.00%, due 9/1/44 | 3,780,000 | 3,896,129 |
| | Principal
Amount | Value |
| |
| Pennsylvania (continued) |
| State Public School Building Authority, Philadelphia Community College, Revenue Bonds | | |
| Series A, Insured: BAM | | |
| 5.00%, due 6/15/28 | $ 4,755,000 | $ 4,886,655 |
| State Public School Building Authority, School District of Philadelphia (The), Revenue Bonds | | |
| Series A, Insured: AGM State Aid Withholding | | |
| 5.00%, due 6/1/31 | 26,975,000 | 27,845,772 |
| | | 125,225,919 |
| Puerto Rico 0.5% |
| Puerto Rico Commonwealth Aqueduct & Sewer Authority, Revenue Bonds, Senior Lien | | |
| Series A, Insured: AGC-ICC | | |
| 6.125%, due 7/1/24 | 290,000 | 296,489 |
| Puerto Rico Electric Power Authority, Revenue Bonds | | |
| Series DDD, Insured: AGM | | |
| 3.625%, due 7/1/23 | 3,115,000 | 3,099,238 |
| Series UU, Insured: AGC | | |
| 4.25%, due 7/1/27 | 2,345,000 | 2,301,418 |
| Series NN, Insured: NATL-RE | | |
| 4.75%, due 7/1/33 | 1,140,000 | 1,069,873 |
| Series PP, Insured: NATL-RE | | |
| 5.00%, due 7/1/23 | 855,000 | 854,279 |
| Series SS, Insured: NATL-RE | | |
| 5.00%, due 7/1/23 | 825,000 | 824,304 |
| Series UU, Insured: AGM | | |
| 5.00%, due 7/1/23 | 2,040,000 | 2,069,860 |
| Series PP, Insured: NATL-RE | | |
| 5.00%, due 7/1/24 | 2,665,000 | 2,659,775 |
| Series UU, Insured: AGM | | |
| 5.00%, due 7/1/24 | 4,165,000 | 4,225,965 |
| Series TT, Insured: AGM-CR | | |
| 5.00%, due 7/1/27 | 500,000 | 509,348 |
| Series SS, Insured: AGM | | |
| 5.00%, due 7/1/30 | 550,000 | 560,282 |
| Series VV, Insured: NATL-RE | | |
| 5.25%, due 7/1/26 | 1,575,000 | 1,569,753 |
| Series VV, Insured: NATL-RE | | |
| 5.25%, due 7/1/29 | 1,470,000 | 1,458,844 |
| Series VV, Insured: NATL-RE | | |
| 5.25%, due 7/1/32 | 1,225,000 | 1,202,812 |
The notes to the financial statements are an integral part of, and should be read in conjunction with, the financial statements.
39
Portfolio of Investments October 31, 2022† (continued)
| | Principal
Amount | Value |
| Long-Term Municipal Bonds (continued) |
| Puerto Rico (continued) |
| Puerto Rico Electric Power Authority, Revenue Bonds (continued) | | |
| Series VV, Insured: NATL-RE | | |
| 5.25%, due 7/1/34 | $ 550,000 | $ 535,926 |
| Puerto Rico Highway & Transportation Authority, Revenue Bonds | | |
| Series D, Insured: AGM | | |
| 5.00%, due 7/1/27 | 2,240,000 | 2,255,628 |
| Series J, Insured: NATL-RE | | |
| 5.00%, due 7/1/29 | 650,000 | 643,323 |
| Series L, Insured: NATL-RE | | |
| 5.25%, due 7/1/24 | 2,195,000 | 2,195,990 |
| Puerto Rico Municipal Finance Agency, Revenue Bonds | | |
| Series A, Insured: AGM | | |
| 5.00%, due 8/1/27 | 290,000 | 294,131 |
| Series A, Insured: AGM | | |
| 5.00%, due 8/1/30 | 1,440,000 | 1,460,513 |
| Series C, Insured: AGC | | |
| 5.25%, due 8/1/23 | 340,000 | 344,961 |
| Puerto Rico Sales Tax Financing Corp., Revenue Bonds | | |
| Insured: BHAC-CR | | |
| (zero coupon), due 8/1/54 | 98,098 | 24,383 |
| | | 30,457,095 |
| Rhode Island 0.2% |
| Providence Public Building Authority, Various Capital Projects, Revenue Bonds | | |
| Series A, Insured: AGM | | |
| 5.875%, due 6/15/26 | 1,285,000 | 1,287,723 |
| Rhode Island Health and Educational Building Corp., Lifespan Obligated Group, Revenue Bonds | | |
| 5.00%, due 5/15/26 | 4,500,000 | 4,566,557 |
| Rhode Island Health and Educational Building Corp., Public Schools Financing Program, Revenue Bonds | | |
| Series B | | |
| 5.00%, due 5/15/33 | 1,045,000 | 1,121,043 |
| Series B | | |
| 5.00%, due 5/15/34 | 1,095,000 | 1,172,077 |
| Series B | | |
| 5.00%, due 5/15/35 | 1,150,000 | 1,225,143 |
| | Principal
Amount | Value |
| |
| Rhode Island (continued) |
| Rhode Island Health and Educational Building Corp., Public Schools Financing Program, Revenue Bonds (continued) | | |
| Series B | | |
| 5.00%, due 5/15/36 | $ 1,205,000 | $ 1,278,867 |
| Series B | | |
| 5.00%, due 5/15/37 | 1,265,000 | 1,336,637 |
| | | 11,988,047 |
| South Carolina 1.4% |
| Patriots Energy Group Financing Agency, Gas Supply, Revenue Bonds | | |
| Series A | | |
| 4.00%, due 10/1/48 (a) | 3,605,000 | 3,588,853 |
| South Carolina Public Service Authority, Santee Cooper Project, Revenue Bonds | | |
| Series B | | |
| 4.00%, due 12/1/29 | 4,417,000 | 4,281,077 |
| Series A, Insured: BAM | | |
| 4.00%, due 12/1/52 | 24,360,000 | 20,111,329 |
| Series B, Insured: BAM | | |
| 4.00%, due 12/1/55 | 4,488,000 | 3,683,452 |
| Series A | | |
| 5.00%, due 12/1/31 | 2,500,000 | 2,598,238 |
| Series A | | |
| 5.00%, due 12/1/36 | 13,500,000 | 13,650,297 |
| Series B | | |
| 5.00%, due 12/1/51 | 2,000,000 | 1,921,550 |
| South Carolina Public Service Authority, Revenue Bonds | | |
| Series A, Insured: BAM | | |
| 4.00%, due 12/1/40 | 5,750,000 | 5,093,812 |
| Series A | | |
| 5.00%, due 12/1/32 | 9,000,000 | 9,134,195 |
| Series B | | |
| 5.00%, due 12/1/56 | 1,500,000 | 1,428,378 |
| South Carolina Transportation Infrastructure Bank, Revenue Bonds | | |
| Series A | | |
| 5.00%, due 10/1/36 | 13,450,000 | 13,924,336 |
The notes to the financial statements are an integral part of, and should be read in conjunction with, the financial statements.
| 40 | MainStay MacKay Tax Free Bond Fund |
| | Principal
Amount | Value |
| Long-Term Municipal Bonds (continued) |
| South Carolina (continued) |
| Sumter Two School Facilities, Inc., Sumter School District Project, Revenue Bonds | | |
| Series C, Insured: BAM | | |
| 5.00%, due 12/1/27 | $ 1,100,000 | $ 1,145,846 |
| University of South Carolina, Campus Village Project, Revenue Bonds | | |
| Series A | | |
| 4.00%, due 5/1/51 | 9,300,000 | 7,954,863 |
| | | 88,516,226 |
| South Dakota 0.1% |
| South Dakota Conservancy District, State Revolving Fund Program, Revenue Bonds | | |
| 5.00%, due 8/1/37 | 1,750,000 | 1,854,042 |
| 5.00%, due 8/1/38 | 2,500,000 | 2,642,984 |
| | | 4,497,026 |
| Tennessee 0.4% |
| Metropolitan Government of Nashville & Davidson County, Unlimited General Obligation | | |
| Series A | | |
| 4.00%, due 1/1/40 | 4,750,000 | 4,355,668 |
| Metropolitan Nashville Airport Authority (The), Revenue Bonds (b) | | |
| Series B | | |
| 5.00%, due 7/1/44 | 10,975,000 | 10,536,615 |
| Series B | | |
| 5.00%, due 7/1/54 | 5,000,000 | 4,716,501 |
| Tennessee Energy Acquisition Corp., Revenue Bonds | | |
| 4.00%, due 11/1/49 (a) | 1,250,000 | 1,215,357 |
| Tennessee Housing Development Agency, Revenue Bonds | | |
| 4.50%, due 7/1/49 | 4,240,000 | 4,222,311 |
| | | 25,046,452 |
| Texas 7.0% |
| Argyle Independent School District, Unlimited General Obligation | | |
| Insured: PSF-GTD | | |
| 5.00%, due 8/15/47 | 10,000,000 | 10,474,710 |
| | Principal
Amount | Value |
| |
| Texas (continued) |
| Bexar County Hospital District, Certificates of Obligation, Limited General Obligation | | |
| 4.00%, due 2/15/37 | $ 3,700,000 | $ 3,436,986 |
| Celina Independent School District, Unlimited General Obligation | | |
| Insured: PSF-GTD | | |
| 5.00%, due 2/15/52 | 14,365,000 | 14,922,815 |
| Central Texas Turnpike System, Revenue Bonds, First Tier | | |
| Series A, Insured: AMBAC | | |
| (zero coupon), due 8/15/28 | 7,500,000 | 5,916,018 |
| Series A | | |
| 5.00%, due 8/15/39 | 3,320,000 | 3,422,394 |
| Central Texas Turnpike System, Revenue Bonds | | |
| Series C | | |
| 5.00%, due 8/15/34 | 4,250,000 | 4,288,618 |
| Series C | | |
| 5.00%, due 8/15/42 | 2,135,000 | 2,142,261 |
| City of Arlington TX, Special Tax, Senior Lien | | |
| Series A, Insured: AGM | | |
| 5.00%, due 2/15/48 | 8,000,000 | 8,073,935 |
| City of Austin TX, Airport System, Revenue Bonds | | |
| 5.00%, due 11/15/44 | 11,865,000 | 11,387,335 |
| Series B | | |
| 5.00%, due 11/15/48 (b) | 12,000,000 | 11,432,009 |
| 5.00%, due 11/15/52 | 11,500,000 | 10,927,645 |
| 5.25%, due 11/15/47 | 13,500,000 | 13,338,466 |
| City of Celina TX, Limited General Obligation | | |
| 5.00%, due 9/1/47 | 8,000,000 | 8,252,190 |
| City of Dallas TX, Hotel Occupancy Tax, Revenue Bonds | | |
| 4.00%, due 8/15/36 | 1,150,000 | 1,032,417 |
| City of El Paso TX, Limited General Obligation | | |
| Insured: BAM | | |
| 4.00%, due 8/15/42 | 17,040,000 | 15,301,215 |
| City of Georgetown TX, Utility System, Revenue Bonds | | |
| Insured: AGM | | |
| 5.25%, due 8/15/52 | 5,000,000 | 5,197,872 |
The notes to the financial statements are an integral part of, and should be read in conjunction with, the financial statements.
41
Portfolio of Investments October 31, 2022† (continued)
| | Principal
Amount | Value |
| Long-Term Municipal Bonds (continued) |
| Texas (continued) |
| City of Houston TX, Public Improvement, Limited General Obligation | | |
| Series A | | |
| 5.00%, due 3/1/28 | $ 3,695,000 | $ 3,909,131 |
| City of Houston TX, Hotel Occupancy Tax & Special Tax, Revenue Bonds | | |
| 5.00%, due 9/1/31 | 2,450,000 | 2,476,350 |
| 5.00%, due 9/1/34 | 1,550,000 | 1,560,432 |
| City of Lubbock TX, Revenue Bonds | | |
| Insured: AGM-CR | | |
| 4.00%, due 4/15/51 | 6,590,000 | 5,552,602 |
| City of New Braunfels TX, Utility System, Revenue Bonds | | |
| 5.00%, due 7/1/53 | 3,000,000 | 3,079,839 |
| City of San Antonio TX, Electric & Gas Systems, Revenue Bonds | | |
| 4.00%, due 2/1/28 | 3,000,000 | 3,052,107 |
| Collin County Community College District, Limited General Obligation | | |
| 3.50%, due 8/15/37 | 4,500,000 | 3,821,563 |
| Dallas Area Rapid Transit, Revenue Bonds, Senior Lien | | |
| Series B | | |
| 4.00%, due 12/1/36 | 4,000,000 | 3,864,765 |
| Series A | | |
| 5.00%, due 12/1/45 | 6,320,000 | 6,571,224 |
| Dallas Fort Worth International Airport, Revenue Bonds | | |
| Series B, Insured: BAM | | |
| 4.00%, due 11/1/35 | 21,040,000 | 19,712,210 |
| Fort Bend Grand Parkway Toll Road Authority, Revenue Bonds, Sub. Lien | | |
| 3.00%, due 3/1/46 | 6,500,000 | 4,567,718 |
| Fredericksburg Independent School District, Unlimited General Obligation | | |
| Insured: PSF-GTD | | |
| 5.00%, due 2/15/47 | 8,195,000 | 8,561,524 |
| Grand Parkway Transportation Corp., Revenue Bonds, First Tier | | |
| Series C, Insured: AGM-CR | | |
| 4.00%, due 10/1/49 | 22,865,000 | 19,397,031 |
| | Principal
Amount | Value |
| |
| Texas (continued) |
| Harris County Cultural Education Facilities Finance Corp., Texas Children's Hospital, Revenue Bonds | | |
| Series A | | |
| 3.00%, due 10/1/51 | $ 12,005,000 | $ 7,736,106 |
| Harris County Cultural Education Facilities Finance Corp., Memorial Hermann Health System, Revenue Bonds | | |
| Series A | | |
| 5.00%, due 7/1/38 | 3,780,000 | 3,810,050 |
| Love Field Airport Modernization Corp., Revenue Bonds | | |
| Insured: AGM | | |
| 4.00%, due 11/1/38 (b) | 6,000,000 | 5,236,883 |
| Lower Colorado River Authority, LCRA Transmission Services Corp., Revenue Bonds | | |
| Insured: AGM-CR | | |
| 5.00%, due 5/15/51 | 6,570,000 | 6,633,659 |
| North Texas Municipal Water District, Sabine Creek Regional Wastewater System, Revenue Bonds | | |
| Insured: AGM | | |
| 4.375%, due 6/1/52 | 7,500,000 | 6,751,912 |
| North Texas Tollway Authority, Revenue Bonds, First Tier | | |
| Series A | | |
| 3.00%, due 1/1/38 | 11,100,000 | 8,793,159 |
| Series A | | |
| 4.125%, due 1/1/39 | 2,500,000 | 2,319,243 |
| Series A | | |
| 4.125%, due 1/1/40 | 5,000,000 | 4,635,343 |
| Series A | | |
| 5.25%, due 1/1/38 | 7,000,000 | 7,493,915 |
| North Texas Tollway Authority, Revenue Bonds, Second Tier | | |
| Series B | | |
| 3.00%, due 1/1/51 | 12,260,000 | 8,065,037 |
| North Texas Tollway Authority, Revenue Bonds | | |
| Series A | | |
| 5.00%, due 1/1/34 | 1,400,000 | 1,426,209 |
| Series A | | |
| 5.00%, due 1/1/35 | 2,700,000 | 2,739,718 |
The notes to the financial statements are an integral part of, and should be read in conjunction with, the financial statements.
| 42 | MainStay MacKay Tax Free Bond Fund |
| | Principal
Amount | Value |
| Long-Term Municipal Bonds (continued) |
| Texas (continued) |
| North Texas Tollway Authority, Revenue Bonds (continued) | | |
| Series A, Insured: BAM | | |
| 5.00%, due 1/1/38 | $ 8,575,000 | $ 8,653,308 |
| Series B | | |
| 5.00%, due 1/1/45 | 5,500,000 | 5,556,040 |
| Prosper Independent School District, Unlimited General Obligation | | |
| Insured: PSF-GTD | | |
| 5.00%, due 2/15/48 | 5,000,000 | 5,161,597 |
| San Antonio Water System, Revenue Bonds, Junior Lien | | |
| Series B | | |
| 5.25%, due 5/15/52 | 45,000,000 | 47,470,972 |
| Southwest Higher Education Authority, Inc., Southern Methodist University Project, Revenue Bonds | | |
| Series A | | |
| 4.00%, due 10/1/42 | 3,500,000 | 3,093,610 |
| State of Texas, Unlimited General Obligation | | |
| Series A | | |
| 3.30%, due 10/1/29 | 11,500,000 | 11,208,488 |
| Series B | | |
| 5.00%, due 8/1/39 | 2,000,000 | 2,051,502 |
| Series B | | |
| 5.00%, due 8/1/41 | 5,000,000 | 5,113,069 |
| Tarrant County Cultural Education Facilities Finance Corp., Buckner Retirement Services, Revenue Bonds | | |
| Series A | | |
| 5.00%, due 11/15/24 | 1,305,000 | 1,324,463 |
| Series A | | |
| 5.00%, due 11/15/25 | 1,370,000 | 1,399,609 |
| Series A | | |
| 5.00%, due 11/15/26 | 1,190,000 | 1,222,736 |
| Series B | | |
| 5.00%, due 11/15/46 | 3,090,000 | 3,013,474 |
| Tarrant Regional Water District Water Supply System, Revenue Bonds | | |
| 5.00%, due 3/1/48 | 5,000,000 | 5,172,338 |
| | Principal
Amount | Value |
| |
| Texas (continued) |
| Texas Department of Housing & Community Affairs, Residential Mortgage, Revenue Bonds | | |
| Series A, Insured: GNMA / FNMA | | |
| 4.75%, due 1/1/49 | $ 15,000 | $ 15,025 |
| Texas Municipal Gas Acquisition & Supply Corp. III, Gas Supply, Revenue Bonds | | |
| 5.00%, due 12/15/26 | 3,450,000 | 3,502,110 |
| 5.00%, due 12/15/27 | 8,930,000 | 9,066,681 |
| 5.00%, due 12/15/29 | 3,250,000 | 3,292,513 |
| 5.00%, due 12/15/30 | 1,085,000 | 1,096,624 |
| 5.00%, due 12/15/31 | 7,975,000 | 8,022,037 |
| 5.00%, due 12/15/32 | 2,500,000 | 2,502,671 |
| Texas Municipal Power Agency, Revenue Bonds | | |
| Insured: AGM | | |
| 3.00%, due 9/1/39 | 1,200,000 | 902,465 |
| Texas Private Activity Bond Surface Transportation Corp., LBJ Infrastructure Group LLC, Revenue Bonds, Senior Lien | | |
| Series A | | |
| 4.00%, due 6/30/35 | 2,300,000 | 2,053,542 |
| Texas Public Finance Authority, Financing System-Texas Southern University, Revenue Bonds | | |
| Insured: BAM | | |
| 4.00%, due 5/1/31 | 1,000,000 | 984,760 |
| Insured: BAM | | |
| 4.00%, due 5/1/32 | 1,295,000 | 1,267,023 |
| Texas State Technical College, Revenue Bonds | | |
| Series A, Insured: AGM | | |
| 5.50%, due 8/1/42 (c) | 4,000,000 | 4,188,178 |
| Texas State University System, Revenue Bonds | | |
| Series A | | |
| 4.00%, due 3/15/35 | 1,800,000 | 1,753,935 |
| Texas Water Development Board, State Revolving Fund, Revenue Bonds | | |
| 5.00%, due 8/1/41 | 17,340,000 | 18,335,807 |
| Texas Water Development Board, State Water Implementation Fund, Revenue Bonds | | |
| Series A | | |
| 5.00%, due 10/15/45 | 3,000,000 | 3,069,123 |
The notes to the financial statements are an integral part of, and should be read in conjunction with, the financial statements.
43
Portfolio of Investments October 31, 2022† (continued)
| | Principal
Amount | Value |
| Long-Term Municipal Bonds (continued) |
| Texas (continued) |
| Town of Prosper TX, Certificates Of Obligation, Limited General Obligation | | |
| 4.00%, due 2/15/31 | $ 1,235,000 | $ 1,259,702 |
| Van Alstyne Independent School District, Unlimited General Obligation | | |
| Insured: PSF-GTD | | |
| 5.00%, due 2/15/47 | 11,000,000 | 11,531,104 |
| | | 454,599,122 |
| U.S. Virgin Islands 1.1% |
| Matching Fund Special Purpose Securitization Corp., Revenue Bonds | | |
| Series A | | |
| 5.00%, due 10/1/30 | 12,555,000 | 12,710,771 |
| Series A | | |
| 5.00%, due 10/1/32 | 12,555,000 | 12,649,181 |
| Series A | | |
| 5.00%, due 10/1/39 | 37,670,000 | 37,144,101 |
| Virgin Islands Public Finance Authority, Revenue Bonds | | |
| 5.00%, due 9/1/30 (d) | 5,000,000 | 5,159,100 |
| Series C, Insured: AGM-CR | | |
| 5.00%, due 10/1/39 | 5,120,000 | 5,182,678 |
| | | 72,845,831 |
| Utah 3.2% |
| City of Salt Lake City UT, Airport, Revenue Bonds (b) | | |
| Series A, Insured: BAM | | |
| 4.00%, due 7/1/41 | 7,500,000 | 6,382,608 |
| Series A, Insured: AGM-CR | | |
| 4.00%, due 7/1/51 | 30,000,000 | 24,002,940 |
| Series A | | |
| 5.00%, due 7/1/32 | 4,000,000 | 4,067,679 |
| Series A | | |
| 5.00%, due 7/1/42 | 11,840,000 | 11,500,378 |
| Series A, Insured: BAM | | |
| 5.00%, due 7/1/43 | 20,305,000 | 19,940,720 |
| Series A | | |
| 5.00%, due 7/1/46 | 5,000,000 | 4,778,455 |
| Series A | | |
| 5.00%, due 7/1/47 | 10,000,000 | 9,540,069 |
| Series A | | |
| 5.25%, due 7/1/48 | 4,960,000 | 4,898,729 |
| | Principal
Amount | Value |
| |
| Utah (continued) |
| City of Salt Lake City UT, Public Utilities, Revenue Bonds | | |
| 5.00%, due 2/1/52 | $ 13,375,000 | $ 13,984,503 |
| County of Utah UT, IHC Health Services, Inc., Revenue Bonds | | |
| Series A | | |
| 5.00%, due 5/15/45 | 3,000,000 | 3,025,178 |
| Series B | | |
| 5.00%, due 5/15/46 | 7,590,000 | 7,699,969 |
| Intermountain Power Agency, Revenue Bonds | | |
| Series A | | |
| 4.00%, due 7/1/36 | 10,000,000 | 9,572,855 |
| Series A | | |
| 5.00%, due 7/1/32 | 3,500,000 | 3,856,699 |
| Series A | | |
| 5.00%, due 7/1/33 | 6,250,000 | 6,855,301 |
| Series A | | |
| 5.00%, due 7/1/43 | 2,000,000 | 2,101,526 |
| Series A | | |
| 5.00%, due 7/1/45 | 20,845,000 | 21,816,869 |
| Park City School District, Unlimited General Obligation | | |
| Insured: School Bond Guaranty | | |
| 5.00%, due 2/1/33 | 3,300,000 | 3,651,035 |
| State of Utah, Unlimited General Obligation | | |
| 3.00%, due 7/1/33 | 5,750,000 | 5,158,611 |
| Utah Charter School Finance Authority, Syracuse Arts Academy Project, Revenue Bonds | | |
| Series A, Insured: BAM UT CSCE | | |
| 3.00%, due 4/15/42 | 1,000,000 | 705,780 |
| Utah Charter School Finance Authority, Spectrum Academy Project, Revenue Bonds | | |
| Insured: UT CSCE | | |
| 4.00%, due 4/15/45 | 2,000,000 | 1,643,912 |
| Utah Housing Corp., Mortgage-Backed, Revenue Bonds | | |
| Series H, Insured: GNMA | | |
| 4.50%, due 10/21/48 | 642,103 | 638,917 |
| Series J, Insured: GNMA | | |
| 4.50%, due 12/21/48 | 579,869 | 577,065 |
| Series A, Insured: GNMA | | |
| 4.50%, due 1/21/49 | 1,781,312 | 1,772,701 |
The notes to the financial statements are an integral part of, and should be read in conjunction with, the financial statements.
| 44 | MainStay MacKay Tax Free Bond Fund |
| | Principal
Amount | Value |
| Long-Term Municipal Bonds (continued) |
| Utah (continued) |
| Utah Housing Corp., Mortgage-Backed, Revenue Bonds (continued) | | |
| Series B, Insured: GNMA | | |
| 4.50%, due 2/21/49 | $ 1,234,592 | $ 1,228,466 |
| Insured: GNMA | | |
| 5.00%, due 7/21/52 | 15,011,533 | 15,017,407 |
| Series G-2, Insured: GNMA | | |
| 5.00%, due 8/21/52 | 22,450,838 | 22,469,740 |
| Utah Infrastructure Agency, Revenue Bonds | | |
| 5.00%, due 10/15/38 | 1,990,000 | 2,069,953 |
| 5.00%, due 10/15/41 | 2,175,000 | 2,251,553 |
| | | 211,209,618 |
| Vermont 0.1% |
| University of Vermont and State Agricultural College, Revenue Bonds | | |
| 4.125%, due 10/1/45 | 5,050,000 | 4,425,385 |
| Virginia 0.4% |
| Arlington County Industrial Development Authority, Virginia Hospital Center, Revenue Bonds | | |
| 3.75%, due 7/1/50 | 4,000,000 | 3,172,542 |
| 4.00%, due 7/1/45 | 5,000,000 | 4,254,326 |
| Fairfax County Industrial Development Authority, Inova Health System Project, Revenue Bonds | | |
| 3.50%, due 5/15/39 | 5,450,000 | 4,635,033 |
| Hampton Roads Transportation Accountability Commission, Revenue Bonds | | |
| Series A | | |
| 4.00%, due 7/1/52 | 10,000,000 | 8,575,987 |
| Hampton Roads Transportation Accountability Commission, Revenue Bonds, Senior Lien | | |
| Series A | | |
| 5.00%, due 7/1/45 | 5,000,000 | 5,240,291 |
| | | 25,878,179 |
| | Principal
Amount | Value |
| |
| Washington 1.5% |
| City of Seattle WA, Municipal Light & Power, Revenue Bonds | | |
| 5.00%, due 7/1/52 | $ 7,790,000 | $ 8,145,459 |
| Energy Northwest, Bonneville Power Administration, Revenue Bonds | | |
| Series C | | |
| 5.00%, due 7/1/28 | 12,000,000 | 12,313,163 |
| Series A | | |
| 5.00%, due 7/1/35 | 4,500,000 | 4,821,035 |
| Series A | | |
| 5.00%, due 7/1/36 | 6,500,000 | 6,994,468 |
| Port of Seattle, Intermediate Lien, Revenue Bonds (b) | | |
| Series C | | |
| 5.00%, due 5/1/37 | 4,000,000 | 4,050,009 |
| Series C | | |
| 5.00%, due 8/1/38 | 9,465,000 | 9,383,819 |
| State of Washington, Various Purpose, Unlimited General Obligation | | |
| Series R-C | | |
| 4.00%, due 8/1/36 | 3,500,000 | 3,394,196 |
| Series C | | |
| 5.00%, due 2/1/29 | 6,200,000 | 6,760,676 |
| Series A-1 | | |
| 5.00%, due 8/1/35 | 5,000,000 | 5,435,707 |
| Series A | | |
| 5.00%, due 8/1/44 | 6,000,000 | 6,252,973 |
| Series A | | |
| 5.00%, due 8/1/44 | 7,500,000 | 7,882,219 |
| Series A | | |
| 5.00%, due 8/1/47 | 12,055,000 | 12,586,519 |
| State of Washington, Unlimited General Obligation | | |
| Series B | | |
| 5.00%, due 2/1/29 | 5,000,000 | 5,452,158 |
| University of Washington, Revenue Bonds | | |
| Series A | | |
| 4.00%, due 4/1/39 | 2,095,000 | 1,952,452 |
| Washington Higher Education Facilities Authority, Seattle Pacific University Project, Revenue Bonds | | |
| Series A | | |
| 5.00%, due 10/1/45 | 1,375,000 | 1,289,804 |
The notes to the financial statements are an integral part of, and should be read in conjunction with, the financial statements.
45
Portfolio of Investments October 31, 2022† (continued)
| | Principal
Amount | Value |
| Long-Term Municipal Bonds (continued) |
| Washington (continued) |
| Washington State Housing Finance Commission, Single Family Program, Revenue Bonds | | |
| Series 1N | | |
| 4.00%, due 6/1/49 | $ 200,000 | $ 196,924 |
| | | 96,911,581 |
| Wisconsin 0.2% |
| State of Wisconsin, Unlimited General Obligation | | |
| Series B | | |
| 5.00%, due 5/1/31 | 5,470,000 | 5,957,991 |
| Wisconsin Center District, Junior Dedicated, Revenue Bonds, Junior Lien | | |
| Series A | | |
| 5.00%, due 12/15/31 | 3,165,000 | 3,171,704 |
| Series A | | |
| 5.00%, due 12/15/32 | 2,600,000 | 2,605,508 |
| | | 11,735,203 |
Total Long-Term Municipal Bonds
(Cost $6,524,644,380) | | 6,095,102,932 |
| Short-Term Municipal Notes 4.1% |
| Alabama 0.7% |
| Black Belt Energy Gas District, Gas Project No.7, Revenue Bonds | | |
| Series C-2 | | |
| 2.59%, due 10/1/52 (e) | 46,200,000 | 43,191,673 |
| California 0.3% |
| Metropolitan Water District of Southern California, Waterworks, Revenue Bonds | | |
| Series C | | |
| 2.51%, due 7/1/47 (e) | 13,550,000 | 13,485,605 |
| Modesto Irrigation District, Domestic Water Project, Revenue Bonds | | |
| Series F, Insured: NATL-RE | | |
| 2.645%, due 9/1/27 (e) | 7,500,000 | 7,430,432 |
| | | 20,916,037 |
| | Principal
Amount | Value |
| |
| Georgia 1.0% |
| Development Authority of Appling County, Oglethorpe Power Corp. Project, Revenue Bonds | | |
| Series A | | |
| 1.50%, due 1/1/38 (e) | $ 2,500,000 | $ 2,309,648 |
| Development Authority of Burke County (The), Oglethorpe Power Corp. Project, Revenue Bonds | | |
| Series A | | |
| 1.50%, due 1/1/40 (e) | 6,615,000 | 6,111,327 |
| Development Authority of Burke County (The), Georgia Power Co. Vogtle Project, Revenue Bonds, First Series (e) | | |
| 1.79%, due 7/1/49 | 6,200,000 | 6,200,000 |
| 1.85%, due 11/1/48 | 41,435,000 | 41,435,000 |
| 1.89%, due 11/1/52 | 4,700,000 | 4,700,000 |
| Development Authority of Monroe County (The), Oglethorpe Power Corp. Scherer Project, Revenue Bonds | | |
| Series A | | |
| 1.50%, due 1/1/39 (e) | 3,500,000 | 3,233,506 |
| | | 63,989,481 |
| Kentucky 0.3% |
| Kentucky Public Energy Authority, Gas Supply, Revenue Bonds | | |
| Series A-2 | | |
| 3.244%, due 8/1/52 (e) | 19,660,000 | 17,714,297 |
| New Jersey 0.4% |
| New Jersey Turnpike Authority, Revenue Bonds | | |
| Series D-1 | | |
| 2.90%, due 1/1/24 (e) | 23,250,000 | 23,220,884 |
| New York 0.8% |
| Metropolitan Transportation Authority, Revenue Bonds (e) | | |
| Series E-1 | | |
| 1.60%, due 11/15/50 | 10,000,000 | 10,000,000 |
| Series D-2B, Insured: AGM | | |
| 2.594%, due 11/1/32 | 25,350,000 | 24,787,225 |
The notes to the financial statements are an integral part of, and should be read in conjunction with, the financial statements.
| 46 | MainStay MacKay Tax Free Bond Fund |
| | Principal
Amount | Value |
| Short-Term Municipal Notes (continued) |
| New York (continued) |
| New York City Transitional Finance Authority, Future Tax Secured, Revenue Bonds | | |
| Series G-6 | | |
| 1.60%, due 5/1/34 (e) | $ 15,475,000 | $ 15,475,000 |
| Triborough Bridge & Tunnel Authority, MTA Bridges & Tunnels, Revenue Bonds | | |
| Series B-4A | | |
| 2.417%, due 1/1/32 (e) | 2,720,000 | 2,672,160 |
| | | 52,934,385 |
| Ohio 0.1% |
| Ohio Higher Educational Facility Commission, Cleveland Clinic Health System Obligated Group, Revenue Bonds | | |
| Series B-4 | | |
| 1.60%, due 1/1/43 (e) | 9,000,000 | 9,000,000 |
| Texas 0.5% |
| Texas Municipal Gas Acquisition & Supply Corp. II, Revenue Bonds | | |
| Series C | | |
| 2.863%, due 9/15/27 (e) | 34,230,000 | 32,869,679 |
Total Short-Term Municipal Notes
(Cost $272,032,315) | | 263,836,436 |
Total Municipal Bonds
(Cost $6,796,676,695) | | 6,358,939,368 |
| |
| | Shares | | Value |
| Short-Term Investment 1.7% |
| Unaffiliated Investment Company 1.7% |
| BlackRock Liquidity Funds MuniCash, 1.826% (f) | 112,235,489 | | $ 112,224,266 |
Total Short-Term Investment
(Cost $112,224,266) | | | 112,224,266 |
Total Investments
(Cost $6,908,900,961) | 99.3% | | 6,471,163,634 |
| Other Assets, Less Liabilities | 0.7 | | 47,830,130 |
| Net Assets | 100.0% | | $ 6,518,993,764 |
| † | Percentages indicated are based on Fund net assets. |
| ‡ | Less than one-tenth of a percent. |
| (a) | Coupon rate may change based on changes of the underlying collateral or prepayments of principal. Rate shown was the rate in effect as of October 31, 2022. |
| (b) | Interest on these securities was subject to alternative minimum tax. |
| (c) | Delayed delivery security. |
| (d) | May be sold to institutional investors only under Rule 144A or securities offered pursuant to Section 4(a)(2) of the Securities Act of 1933, as amended. |
| (e) | Variable-rate demand notes (VRDNs)—Provide the right to sell the security at face value on either that day or within the rate-reset period. VRDNs will normally trade as if the maturity is the earlier put date, even though stated maturity is longer. The interest rate is reset on the put date at a stipulated daily, weekly, monthly, quarterly, or other specified time interval to reflect current market conditions. These securities do not indicate a reference rate and spread in their description. The maturity date shown is the final maturity. |
| (f) | Current yield as of October 31, 2022. |
Futures Contracts
As of October 31, 2022, the Fund held the following futures contracts1:
| Type | Number of
Contracts | Expiration
Date | Value at
Trade Date | Current
Notional
Amount | Unrealized
Appreciation
(Depreciation)2 |
| Short Contracts | | | | | |
| U.S. Treasury 10 Year Notes | (3,450) | December 2022 | $ (405,033,302) | $ (381,548,438) | $ 23,484,864 |
| U.S. Treasury Long Bonds | (500) | December 2022 | (68,218,591) | (60,250,000) | 7,968,591 |
| Net Unrealized Appreciation | | | | | $ 31,453,455 |
| 1. | As of October 31, 2022, cash in the amount of $8,800,000 was on deposit with a broker or futures commission merchant for futures transactions. |
| 2. | Represents the difference between the value of the contracts at the time they were opened and the value as of October 31, 2022. |
The notes to the financial statements are an integral part of, and should be read in conjunction with, the financial statements.
47
Portfolio of Investments October 31, 2022† (continued)
| Abbreviation(s): |
| AGC—Assured Guaranty Corp. |
| AGM—Assured Guaranty Municipal Corp. |
| AMBAC—Ambac Assurance Corp. |
| BAM—Build America Mutual Assurance Co. |
| BHAC—Berkshire Hathaway Assurance Corp. |
| CR—Custodial Receipts |
| FHLMC—Federal Home Loan Mortgage Corp. |
| FNMA—Federal National Mortgage Association |
| GNMA—Government National Mortgage Association |
| ICC—Insured Custody Certificates |
| MN CRED PROG—Minnesota State Credit Enhancement Program |
| MUN GOVT GTD—Municipal Government Guaranteed |
| NATL-RE—National Public Finance Guarantee Corp. |
| PSF-GTD—Permanent School Fund Guaranteed |
| Q-SBLF—Qualified School Board Loan Fund |
| SD CRED PROG—School District Credit Enhancement Program |
| UT CSCE—Utah Charter School Credit Enhancement Program |
The following is a summary of the fair valuations according to the inputs used as of October 31, 2022, for valuing the Fund’s assets:
| Description | Quoted
Prices in
Active
Markets for
Identical
Assets
(Level 1) | | Significant
Other
Observable
Inputs
(Level 2) | | Significant
Unobservable
Inputs
(Level 3) | | Total |
| Asset Valuation Inputs | | | | | | | |
| Investments in Securities (a) | | | | | | | |
| Municipal Bonds | | | | | | | |
| Long-Term Municipal Bonds | $ — | | $ 6,095,102,932 | | $ — | | $ 6,095,102,932 |
| Short-Term Municipal Notes | — | | 263,836,436 | | — | | 263,836,436 |
| Total Municipal Bonds | — | | 6,358,939,368 | | — | | 6,358,939,368 |
| Short-Term Investment | | | | | | | |
| Unaffiliated Investment Company | 112,224,266 | | — | | — | | 112,224,266 |
| Total Investments in Securities | 112,224,266 | | 6,358,939,368 | | — | | 6,471,163,634 |
| Other Financial Instruments | | | | | | | |
| Futures Contracts (b) | 31,453,455 | | — | | — | | 31,453,455 |
| Total Investments in Securities and Other Financial Instruments | $ 143,677,721 | | $ 6,358,939,368 | | $ — | | $ 6,502,617,089 |
| (a) | For a complete listing of investments and their industries, see the Portfolio of Investments. |
| (b) | The value listed for these securities reflects unrealized appreciation (depreciation) as shown on the Portfolio of Investments. |
The notes to the financial statements are an integral part of, and should be read in conjunction with, the financial statements.
| 48 | MainStay MacKay Tax Free Bond Fund |
Statement of Assets and Liabilities as of October 31, 2022
| Assets |
Investment in securities, at value
(identified cost $6,908,900,961) | $ 6,471,163,634 |
| Cash | 1,493 |
| Cash collateral on deposit at broker for futures contracts | 8,800,000 |
| Receivables: | |
| Fund shares sold | 85,230,378 |
| Investment securities sold | 84,550,033 |
| Interest | 81,522,828 |
| Variation margin on futures contracts | 1,776,589 |
| Other assets | 117,440 |
| Total assets | 6,733,162,395 |
| Liabilities |
| Payables: | |
| Investment securities purchased | 157,373,216 |
| Fund shares redeemed | 47,215,830 |
| Manager (See Note 3) | 2,338,776 |
| Transfer agent (See Note 3) | 692,478 |
| NYLIFE Distributors (See Note 3) | 395,680 |
| Shareholder communication | 286,295 |
| Professional fees | 111,576 |
| Custodian | 40,878 |
| Trustees | 1,651 |
| Accrued expenses | 80,337 |
| Distributions payable | 5,631,914 |
| Total liabilities | 214,168,631 |
| Net assets | $ 6,518,993,764 |
| Composition of Net Assets |
| Shares of beneficial interest outstanding (par value of $.01 per share) unlimited number of shares authorized | $ 7,363,975 |
| Additional paid-in-capital | 7,669,015,007 |
| | 7,676,378,982 |
| Total distributable earnings (loss) | (1,157,385,218) |
| Net assets | $ 6,518,993,764 |
| Class A | |
| Net assets applicable to outstanding shares | $1,552,536,583 |
| Shares of beneficial interest outstanding | 175,417,655 |
| Net asset value per share outstanding | $ 8.85 |
| Maximum sales charge (3.00% of offering price) | 0.27 |
| Maximum offering price per share outstanding | $ 9.12 |
| Investor Class | |
| Net assets applicable to outstanding shares | $ 6,621,801 |
| Shares of beneficial interest outstanding | 744,834 |
| Net asset value per share outstanding | $ 8.89 |
| Maximum sales charge (2.50% of offering price) | 0.23 |
| Maximum offering price per share outstanding | $ 9.12 |
| Class B | |
| Net assets applicable to outstanding shares | $ 3,958,977 |
| Shares of beneficial interest outstanding | 447,451 |
| Net asset value and offering price per share outstanding | $ 8.85 |
| Class C | |
| Net assets applicable to outstanding shares | $ 125,521,459 |
| Shares of beneficial interest outstanding | 14,179,207 |
| Net asset value and offering price per share outstanding | $ 8.85 |
| Class C2 | |
| Net assets applicable to outstanding shares | $ 3,920,305 |
| Shares of beneficial interest outstanding | 443,141 |
| Net asset value and offering price per share outstanding | $ 8.85 |
| Class I | |
| Net assets applicable to outstanding shares | $4,357,421,758 |
| Shares of beneficial interest outstanding | 492,207,477 |
| Net asset value and offering price per share outstanding | $ 8.85 |
| Class R6 | |
| Net assets applicable to outstanding shares | $ 469,012,881 |
| Shares of beneficial interest outstanding | 52,957,767 |
| Net asset value and offering price per share outstanding | $ 8.86 |
The notes to the financial statements are an integral part of, and should be read in conjunction with, the financial statements.
49
Statement of Operations for the year ended October 31, 2022
| Investment Income (Loss) |
| Income | |
| Interest | $ 225,558,942 |
| Expenses | |
| Manager (See Note 3) | 32,730,055 |
| Distribution/Service—Class A (See Note 3) | 5,251,693 |
| Distribution/Service—Investor Class (See Note 3) | 19,282 |
| Distribution/Service—Class B (See Note 3) | 28,212 |
| Distribution/Service—Class C (See Note 3) | 807,280 |
| Distribution/Service—Class C2 (See Note 3) | 22,909 |
| Transfer agent (See Note 3) | 5,072,965 |
| Shareholder communication | 568,877 |
| Professional fees | 555,004 |
| Registration | 336,399 |
| Custodian | 215,018 |
| Trustees | 172,266 |
| Miscellaneous | 306,041 |
| Total expenses | 46,086,001 |
| Net investment income (loss) | 179,472,941 |
| Realized and Unrealized Gain (Loss) |
| Net realized gain (loss) on: | |
| Unaffiliated investment transactions | (710,870,712) |
| In-kind Transactions | 34,551,632 |
| Futures transactions | 108,068,896 |
| Net realized gain (loss) | (568,250,184) |
| Net change in unrealized appreciation (depreciation) on: | |
| Unaffiliated investments | (814,565,584) |
| Futures contracts | 19,381,827 |
| Net change in unrealized appreciation (depreciation) | (795,183,757) |
| Net realized and unrealized gain (loss) | (1,363,433,941) |
| Net increase (decrease) in net assets resulting from operations | $(1,183,961,000) |
The notes to the financial statements are an integral part of, and should be read in conjunction with, the financial statements.
| 50 | MainStay MacKay Tax Free Bond Fund |
Statements of Changes in Net Assets
for the years ended October 31, 2022 and October 31, 2021
| | 2022 | 2021 |
| Increase (Decrease) in Net Assets |
| Operations: | | |
| Net investment income (loss) | $ 179,472,941 | $ 152,448,970 |
| Net realized gain (loss) | (568,250,184) | 52,825,004 |
| Net change in unrealized appreciation (depreciation) | (795,183,757) | 96,257,712 |
| Net increase (decrease) in net assets resulting from operations | (1,183,961,000) | 301,531,686 |
| Distributions to shareholders: | | |
| Class A | (63,381,043) | (62,271,084) |
| Investor Class | (229,133) | (194,857) |
| Class B | (153,810) | (154,197) |
| Class C | (4,398,849) | (4,017,163) |
| Class C2 | (90,208) | (28,298) |
| Class I | (168,558,373) | (123,894,470) |
| Class R6 | (15,713,711) | (6,007,788) |
| Total distributions to shareholders | (252,525,127) | (196,567,857) |
| Capital share transactions: | | |
| Net proceeds from sales of shares | 6,084,451,250 | 3,301,684,748 |
| Net asset value of shares issued to shareholders in reinvestment of distributions | 183,548,070 | 144,640,383 |
| Cost of shares redeemed | (6,715,327,651) | (1,760,456,507) |
| Redemptions in-kind | (930,537,398) | — |
| Increase (decrease) in net assets derived from capital share transactions | (1,377,865,729) | 1,685,868,624 |
| Net increase (decrease) in net assets | (2,814,351,856) | 1,790,832,453 |
| Net Assets |
| Beginning of year | 9,333,345,620 | 7,542,513,167 |
| End of year | $ 6,518,993,764 | $ 9,333,345,620 |
The notes to the financial statements are an integral part of, and should be read in conjunction with, the financial statements.
51
Financial Highlights selected per share data and ratios
| | Year Ended October 31, |
| Class A | 2022 | | 2021 | | 2020 | | 2019 | | 2018 |
| Net asset value at beginning of year | $ 10.60 | | $ 10.43 | | $ 10.33 | | $ 9.80 | | $ 10.02 |
| Net investment income (loss) | 0.20(a) | | 0.17(a) | | 0.26 | | 0.30 | | 0.31 |
| Net realized and unrealized gain (loss) | (1.66) | | 0.23 | | 0.11 | | 0.53 | | (0.22) |
| Total from investment operations | (1.46) | | 0.40 | | 0.37 | | 0.83 | | 0.09 |
| Less distributions: | | | | | | | | | |
| From net investment income | (0.26) | | (0.23) | | (0.27) | | (0.30) | | (0.31) |
| From net realized gain on investments | (0.03) | | — | | — | | — | | — |
| Total distributions | (0.29) | | (0.23) | | (0.27) | | (0.30) | | (0.31) |
| Net asset value at end of year | $ 8.85 | | $ 10.60 | | $ 10.43 | | $ 10.33 | | $ 9.80 |
| Total investment return (b) | (13.96)% | | 3.84% | | 3.66% | | 8.55% | | 0.94% |
| Ratios (to average net assets)/Supplemental Data: | | | | | | | | | |
| Net investment income (loss) | 2.03% | | 1.63% | | 2.04% | | 2.93% | | 3.15% |
| Net expenses (c) | 0.75% | | 0.73% | | 0.75% | | 0.78% | | 0.80% |
| Portfolio turnover rate | 127% (d)(e) | | 39%(d) | | 72%(d) | | 38%(d) | | 40% |
| Net assets at end of year (in 000’s) | $ 1,552,537 | | $ 3,134,090 | | $ 2,674,765 | | $ 1,728,643 | | $ 1,405,803 |
| (a) | Per share data based on average shares outstanding during the year. |
| (b) | Total investment return is calculated exclusive of sales charges and assumes the reinvestment of dividends and distributions. For periods of less than one year, total return is not annualized. |
| (c) | In addition to the fees and expenses which the Fund bears directly, it also indirectly bears a pro-rata share of the fees and expenses of the underlying funds in which it invests. Such indirect expenses are not included in the above expense ratios. |
| (d) | The portfolio turnover rate includes variable rate demand notes. |
| (e) | The portfolio turnover rate excludes in-kind transactions. |
| | Year Ended October 31, |
| Investor Class | 2022 | | 2021 | | 2020 | | 2019 | | 2018 |
| Net asset value at beginning of year | $ 10.65 | | $ 10.48 | | $ 10.38 | | $ 9.84 | | $ 10.06 |
| Net investment income (loss) | 0.20(a) | | 0.17(a) | | 0.20 | | 0.30 | | 0.32 |
| Net realized and unrealized gain (loss) | (1.67) | | 0.23 | | 0.17 | | 0.54 | | (0.22) |
| Total from investment operations | (1.47) | | 0.40 | | 0.37 | | 0.84 | | 0.10 |
| Less distributions: | | | | | | | | | |
| From net investment income | (0.26) | | (0.23) | | (0.27) | | (0.30) | | (0.32) |
| From net realized gain on investments | (0.03) | | — | | — | | — | | — |
| Total distributions | (0.29) | | (0.23) | | (0.27) | | (0.30) | | (0.32) |
| Net asset value at end of year | $ 8.89 | | $ 10.65 | | $ 10.48 | | $ 10.38 | | $ 9.84 |
| Total investment return (b) | (14.01)% | | 3.80% | | 3.64% | | 8.63% | | 0.97% |
| Ratios (to average net assets)/Supplemental Data: | | | | | | | | | |
| Net investment income (loss) | 2.07% | | 1.61% | | 2.04% | | 2.95% | | 3.17% |
| Net expenses (c) | 0.77% | | 0.76% | | 0.76% | | 0.77% | | 0.78% |
| Portfolio turnover rate | 127% (d)(e) | | 39%(d) | | 72%(d) | | 38%(d) | | 40% |
| Net assets at end of year (in 000's) | $ 6,622 | | $ 9,027 | | $ 9,334 | | $ 9,815 | | $ 9,690 |
| (a) | Per share data based on average shares outstanding during the year. |
| (b) | Total investment return is calculated exclusive of sales charges and assumes the reinvestment of dividends and distributions. For periods of less than one year, total return is not annualized. |
| (c) | In addition to the fees and expenses which the Fund bears directly, it also indirectly bears a pro-rata share of the fees and expenses of the underlying funds in which it invests. Such indirect expenses are not included in the above expense ratios. |
| (d) | The portfolio turnover rate includes variable rate demand notes. |
| (e) | The portfolio turnover rate excludes in-kind transactions. |
The notes to the financial statements are an integral part of, and should be read in conjunction with, the financial statements.
| 52 | MainStay MacKay Tax Free Bond Fund |
Financial Highlights selected per share data and ratios
| | Year Ended October 31, |
| Class B | 2022 | | 2021 | | 2020 | | 2019 | | 2018 |
| Net asset value at beginning of year | $ 10.60 | | $ 10.43 | | $ 10.33 | | $ 9.80 | | $ 10.01 |
| Net investment income (loss) | 0.18(a) | | 0.15(a) | | 0.12 | | 0.27 | | 0.29 |
| Net realized and unrealized gain (loss) | (1.66) | | 0.22 | | 0.23 | | 0.53 | | (0.21) |
| Total from investment operations | (1.48) | | 0.37 | | 0.35 | | 0.80 | | 0.08 |
| Less distributions: | | | | | | | | | |
| From net investment income | (0.24) | | (0.20) | | (0.25) | | (0.27) | | (0.29) |
| From net realized gain on investments | (0.03) | | — | | — | | — | | — |
| Total distributions | (0.27) | | (0.20) | | (0.25) | | (0.27) | | (0.29) |
| Net asset value at end of year | $ 8.85 | | $ 10.60 | | $ 10.43 | | $ 10.33 | | $ 9.80 |
| Total investment return (b) | (14.19)% | | 3.56% | | 3.38% | | 8.28% | | 0.81% |
| Ratios (to average net assets)/Supplemental Data: | | | | | | | | | |
| Net investment income (loss) | 1.80% | | 1.38% | | 1.80% | | 2.71% | | 2.92% |
| Net expenses (c) | 1.02% | | 1.01% | | 1.01% | | 1.02% | | 1.03% |
| Portfolio turnover rate | 127% (d)(e) | | 39%(d) | | 72%(d) | | 38%(d) | | 40% |
| Net assets at end of year (in 000’s) | $ 3,959 | | $ 7,006 | | $ 9,286 | | $ 12,354 | | $ 14,704 |
| (a) | Per share data based on average shares outstanding during the year. |
| (b) | Total investment return is calculated exclusive of sales charges and assumes the reinvestment of dividends and distributions. For periods of less than one year, total return is not annualized. |
| (c) | In addition to the fees and expenses which the Fund bears directly, it also indirectly bears a pro-rata share of the fees and expenses of the underlying funds in which it invests. Such indirect expenses are not included in the above expense ratios. |
| (d) | The portfolio turnover rate includes variable rate demand notes. |
| (e) | The portfolio turnover rate excludes in-kind transactions. |
| | Year Ended October 31, |
| Class C | 2022 | | 2021 | | 2020 | | 2019 | | 2018 |
| Net asset value at beginning of year | $ 10.60 | | $ 10.44 | | $ 10.34 | | $ 9.80 | | $ 10.02 |
| Net investment income (loss) | 0.18(a) | | 0.15(a) | | 0.18 | | 0.27 | | 0.29 |
| Net realized and unrealized gain (loss) | (1.66) | | 0.21 | | 0.17 | | 0.54 | | (0.22) |
| Total from investment operations | (1.48) | | 0.36 | | 0.35 | | 0.81 | | 0.07 |
| Less distributions: | | | | | | | | | |
| From net investment income | (0.24) | | (0.20) | | (0.25) | | (0.27) | | (0.29) |
| From net realized gain on investments | (0.03) | | — | | — | | — | | — |
| Total distributions | (0.27) | | (0.20) | | (0.25) | | (0.27) | | (0.29) |
| Net asset value at end of year | $ 8.85 | | $ 10.60 | | $ 10.44 | | $ 10.34 | | $ 9.80 |
| Total investment return (b) | (14.19)% | | 3.46% | | 3.38% | | 8.39% | | 0.71% |
| Ratios (to average net assets)/Supplemental Data: | | | | | | | | | |
| Net investment income (loss) | 1.81% | | 1.37% | | 1.79% | | 2.69% | | 2.92% |
| Net expenses (c) | 1.02% | | 1.01% | | 1.01% | | 1.02% | | 1.03% |
| Portfolio turnover rate | 127% (d)(e) | | 39%(d) | | 72%(d) | | 38%(d) | | 40% |
| Net assets at end of year (in 000’s) | $ 125,521 | | $ 194,545 | | $ 220,146 | | $ 225,762 | | $ 213,883 |
| (a) | Per share data based on average shares outstanding during the year. |
| (b) | Total investment return is calculated exclusive of sales charges and assumes the reinvestment of dividends and distributions. For periods of less than one year, total return is not annualized. |
| (c) | In addition to the fees and expenses which the Fund bears directly, it also indirectly bears a pro-rata share of the fees and expenses of the underlying funds in which it invests. Such indirect expenses are not included in the above expense ratios. |
| (d) | The portfolio turnover rate includes variable rate demand notes. |
| (e) | The portfolio turnover rate excludes in-kind transactions. |
The notes to the financial statements are an integral part of, and should be read in conjunction with, the financial statements.
53
Financial Highlights selected per share data and ratios
| | Year Ended October 31, | | August 31, 2020^ through
October 31,
2020 |
| Class C2 | 2022 | | 2021 | |
| Net asset value at beginning of period | $ 10.60 | | $ 10.43 | | $ 10.52 |
| Net investment income (loss) | 0.17(a) | | 0.12(a) | | 0.03 |
| Net realized and unrealized gain (loss) | (1.67) | | 0.23 | | (0.09) |
| Total from investment operations | (1.50) | | 0.35 | | (0.06) |
| Less distributions: | | | | | |
| From net investment income | (0.22) | | (0.18) | | (0.03) |
| From net realized gain on investments | (0.03) | | — | | — |
| Total distributions | (0.25) | | (0.18) | | (0.03) |
| Net asset value at end of period | $ 8.85 | | $ 10.60 | | $ 10.43 |
| Total investment return (b) | (14.32)% | | 3.39% | | (0.54)% |
| Ratios (to average net assets)/Supplemental Data: | | | | | |
| Net investment income (loss) | 1.75% | | 1.12% | | 1.02%†† |
| Net expenses (c) | 1.17% | | 1.15% | | 1.15%†† |
| Portfolio turnover rate (d) | 127%(e) | | 39% | | 72% |
| Net assets at end of period (in 000’s) | $ 3,920 | | $ 2,990 | | $ 251 |
| ^ | Inception date. |
| †† | Annualized. |
| (a) | Per share data based on average shares outstanding during the period. |
| (b) | Total investment return is calculated exclusive of sales charges and assumes the reinvestment of dividends and distributions. For periods of less than one year, total return is not annualized. |
| (c) | In addition to the fees and expenses which the Fund bears directly, it also indirectly bears a pro-rata share of the fees and expenses of the underlying funds in which it invests. Such indirect expenses are not included in the above expense ratios. |
| (d) | The portfolio turnover rate includes variable rate demand notes. |
| (e) | The portfolio turnover rate excludes in-kind transactions. |
| | Year Ended October 31, |
| Class I | 2022 | | 2021 | | 2020 | | 2019 | | 2018 |
| Net asset value at beginning of year | $ 10.60 | | $ 10.44 | | $ 10.34 | | $ 9.80 | | $ 10.02 |
| Net investment income (loss) | 0.23(a) | | 0.20(a) | | 0.29 | | 0.32 | | 0.34 |
| Net realized and unrealized gain (loss) | (1.66) | | 0.22 | | 0.11 | | 0.54 | | (0.22) |
| Total from investment operations | (1.43) | | 0.42 | | 0.40 | | 0.86 | | 0.12 |
| Less distributions: | | | | | | | | | |
| From net investment income | (0.29) | | (0.26) | | (0.30) | | (0.32) | | (0.34) |
| From net realized gain on investments | (0.03) | | — | | — | | — | | — |
| Total distributions | (0.32) | | (0.26) | | (0.30) | | (0.32) | | (0.34) |
| Net asset value at end of year | $ 8.85 | | $ 10.60 | | $ 10.44 | | $ 10.34 | | $ 9.80 |
| Total investment return (b) | (13.75)% | | 4.00% | | 3.91% | | 8.93% | | 1.19% |
| Ratios (to average net assets)/Supplemental Data: | | | | | | | | | |
| Net investment income (loss) | 2.33% | | 1.87% | | 2.28% | | 3.14% | | 3.40% |
| Net expenses (c) | 0.50% | | 0.48% | | 0.50% | | 0.52% | | 0.55% |
| Portfolio turnover rate | 127% (d)(e) | | 39%(d) | | 72%(d) | | 38%(d) | | 40% |
| Net assets at end of year (in 000’s) | $ 4,357,422 | | $ 5,709,408 | | $ 4,430,985 | | $ 2,866,903 | | $ 1,320,591 |
| (a) | Per share data based on average shares outstanding during the year. |
| (b) | Total investment return is calculated exclusive of sales charges and assumes the reinvestment of dividends and distributions. Class I shares are not subject to sales charges. For periods of less than one year, total return is not annualized. |
| (c) | In addition to the fees and expenses which the Fund bears directly, it also indirectly bears a pro-rata share of the fees and expenses of the underlying funds in which it invests. Such indirect expenses are not included in the above expense ratios. |
| (d) | The portfolio turnover rate includes variable rate demand notes. |
| (e) | The portfolio turnover rate excludes in-kind transactions. |
The notes to the financial statements are an integral part of, and should be read in conjunction with, the financial statements.
| 54 | MainStay MacKay Tax Free Bond Fund |
Financial Highlights selected per share data and ratios
| | Year Ended October 31, | | November 1, 2019^ through
October 31, |
| Class R6 | 2022 | | 2021 | | 2020 |
| Net asset value at beginning of period | $ 10.61 | | $ 10.44 | | $ 10.34 |
| Net investment income (loss) | 0.24(a) | | 0.21(a) | | 0.27 |
| Net realized and unrealized gain (loss) | (1.66) | | 0.22 | | 0.13 |
| Total from investment operations | (1.42) | | 0.43 | | 0.40 |
| Less distributions: | | | | | |
| From net investment income | (0.30) | | (0.26) | | (0.30) |
| From net realized gain on investments | (0.03) | | — | | — |
| Total distributions | (0.33) | | (0.26) | | (0.30) |
| Net asset value at end of period | $ 8.86 | | $ 10.61 | | $ 10.44 |
| Total investment return (b) | (13.68)% | | 4.15% | | 3.95% |
| Ratios (to average net assets)/Supplemental Data: | | | | | |
| Net investment income (loss) | 2.51% | | 1.92% | | 2.27% |
| Net expenses (c) | 0.44% | | 0.43% | | 0.44% |
| Portfolio turnover rate (d) | 127%(e) | | 39% | | 72% |
| Net assets at end of period (in 000’s) | $ 469,013 | | $ 276,280 | | $ 197,746 |
| ^ | Inception date. |
| (a) | Per share data based on average shares outstanding during the period. |
| (b) | Total investment return is calculated exclusive of sales charges and assumes the reinvestment of dividends and distributions. Class R6 shares are not subject to sales charges. For periods of less than one year, total return is not annualized. |
| (c) | In addition to the fees and expenses which the Fund bears directly, it also indirectly bears a pro-rata share of the fees and expenses of the underlying funds in which it invests. Such indirect expenses are not included in the above expense ratios. |
| (d) | The portfolio turnover rate includes variable rate demand notes. |
| (e) | The portfolio turnover rate excludes in-kind transactions. |
The notes to the financial statements are an integral part of, and should be read in conjunction with, the financial statements.
55
Notes to Financial Statements
Note 1-Organization and Business
The MainStay Funds (the “Trust”) was organized on January 9, 1986, as a Massachusetts business trust. The Trust is registered under the Investment Company Act of 1940, as amended (the “1940 Act”), as an open-end management investment company, and is comprised of twelve funds (collectively referred to as the "Funds"). These financial statements and notes relate to the MainStay MacKay Tax Free Bond Fund (the "Fund"), a “diversified” fund, as that term is defined in the 1940 Act, as interpreted or modified by regulatory authorities having jurisdiction, from time to time.
The following table lists the Fund's share classes that have been registered and commenced operations:
| Class | Commenced Operations |
| Class A | January 3, 1995 |
| Investor Class | February 28, 2008 |
| Class B | May 1, 1986 |
| Class C | September 1, 1998 |
| Class C2 | August 31, 2020 |
| Class I | December 21, 2009 |
| Class R6 | November 1, 2019 |
| SIMPLE Class | N/A* |
| * | SIMPLE Class shares were registered for sale effective as of August 31, 2020 but have not yet commenced operations. |
Class B shares of the MainStay Group of Funds are closed to all new purchases as well as additional investments by existing Class B shareholders. Existing Class B shareholders may continue to reinvest dividends and capital gains distributions, as well as exchange their Class B shares for Class B shares of other funds in the MainStay Group of Funds as permitted by the current exchange privileges. Class B shareholders continue to be subject to any applicable contingent deferred sales charge ("CDSC") at the time of redemption. All other features of the Class B shares, including but not limited to the fees and expenses applicable to Class B shares, remain unchanged. Unless redeemed, Class B shareholders will remain in Class B shares of their respective fund until the Class B shares are converted to Class A or Investor Class shares pursuant to the applicable conversion schedule.
Class A and Investor Class shares are offered at net asset value (“NAV”) per share plus an initial sales charge. No initial sales charge applies to investments of $250,000 or more (and certain other qualified purchases) in Class A and Investor Class shares. However, a CDSC of 1.00% may be imposed on certain redemptions made within 18 months of the date of purchase on shares that were purchased without an initial sales charge. Class C and Class C2 shares are offered at NAV without an initial sales charge, although a 1.00% CDSC may be imposed on certain redemptions of such shares made within one year of the date of purchase of Class C and Class C2 shares. When Class B shares were offered, they were offered at NAV without an initial sales charge, although a CDSC that declines depending on the number of years a shareholder held its Class B shares may be imposed on certain redemptions of such shares made
within six years of the date of purchase of such shares. Class I and Class R6 shares are offered at NAV without a sales charge. SIMPLE Class shares are expected to be offered at NAV without a sales charge if such shares are offered in the future. Depending upon eligibility, Class B shares convert to either Class A or Investor Class shares at the end of the calendar quarter eight years after the date they were purchased. In addition, depending upon eligibility, Class C and Class C2 shares convert to either Class A or Investor Class shares at the end of the calendar quarter eight years after the date they were purchased. Additionally, Investor Class shares may convert automatically to Class A shares. Under certain circumstances and as may be permitted by the Trust’s multiple class plan pursuant to Rule 18f-3 under the 1940 Act, specified share classes of the Fund may be converted to one or more other share classes of the Fund as disclosed in the capital share transactions within these Notes. The classes of shares have the same voting (except for issues that relate solely to one class), dividend, liquidation and other rights, and the same terms and conditions, except that under distribution plans pursuant to Rule 12b-1 under the 1940 Act, Class B, Class C, Class C2 and SIMPLE Class shares are subject to higher distribution and/or service fees than Class A and Investor Class shares. Class I and Class R6 shares are not subject to a distribution and/or service fee.
The Fund's investment objective is to seek current income exempt from regular federal income tax.
Note 2–Significant Accounting Policies
The Fund is an investment company and accordingly follows the investment company accounting and reporting guidance of the Financial Accounting Standards Board (“FASB”) Accounting Standards Codification Topic 946 Financial Services—Investment Companies. The Fund prepares its financial statements in accordance with generally accepted accounting principles (“GAAP”) in the United States of America and follows the significant accounting policies described below.
(A) Securities Valuation. Investments are usually valued as of the close of regular trading on the New York Stock Exchange (the "Exchange") (usually 4:00 p.m. Eastern time) on each day the Fund is open for business ("valuation date").
Effective September 8, 2022, and pursuant to Rule 2a-5 under the 1940 Act, the Board of Trustees of the Trust (the "Board") designated New York Life Investment Management LLC (“New York Life Investments” or the "Manager") as its Valuation Designee (the "Valuation Designee"). The Valuation Designee is responsible for performing fair valuations relating to all investments in the Fund’s portfolio for which market quotations are not readily available; periodically assessing and managing material valuation risks; establishing and applying fair value methodologies; testing fair valuation methodologies; evaluating and overseeing pricing services; segregation of valuation and portfolio management functions; providing quarterly, annual and prompt reporting to the Board, as appropriate; identifying potential conflicts of interest; and maintaining appropriate records. The Valuation Designee has established a valuation committee ("Valuation Committee") to assist in carrying out the Valuation Designee’s
| 56 | MainStay MacKay Tax Free Bond Fund |
responsibilities and establish prices of securities for which market quotations are not readily available. The Fund’s and the Valuation Designee's policies and procedures ("Valuation Procedures") govern the Valuation Designee’s selection and application of methodologies for determining and calculating the fair value of Fund investments. The Valuation Designee may value Fund portfolio securities for which market quotations are not readily available and other Fund assets utilizing inputs from pricing services and other third-party sources (together, “Pricing Sources”). The Valuation Committee meets (in person, via electronic mail or via teleconference) on an ad-hoc basis to determine fair valuations and on a quarterly basis to review fair value events (excluding fair valuations from pricing services), including valuation risks and back-testing results, and preview reports to the Board.
The Valuation Committee establishes prices of securities for which market quotations are not readily available based on such methodologies and measurements on a regular basis after considering information that is reasonably available and deemed relevant by the Valuation Committee. The Board shall oversee the Valuation Designee and review fair valuation materials on a prompt, quarterly and annual basis and approve proposed revisions to the Valuation Procedures.
Investments for which market quotations are not readily available are valued at fair value as determined in good faith pursuant to the Valuation Procedures. A market quotation is readily available only when that quotation is a quoted price (unadjusted) in active markets for identical investments that the Fund can access at the measurement date, provided that a quotation will not be readily available if it is not reliable. Fair value measurements are determined within a framework that establishes a three-tier hierarchy that maximizes the use of observable market data and minimizes the use of unobservable inputs to establish a classification of fair value measurements for disclosure purposes. "Inputs" refer broadly to the assumptions that market participants would use in pricing the asset or liability, including assumptions about risk, such as the risk inherent in a particular valuation technique used to measure fair value using a pricing model and/or the risk inherent in the inputs for the valuation technique. Inputs may be observable or unobservable. Observable inputs reflect the assumptions market participants would use in pricing the asset or liability based on market data obtained from sources independent of the Fund. Unobservable inputs reflect the Fund’s own assumptions about the assumptions market participants would use in pricing the asset or liability based on the information available. The inputs or methodology used for valuing assets or liabilities may not be an indication of the risks associated with investing in those assets or liabilities. The three-tier hierarchy of inputs is summarized below.
| • | Level 1—quoted prices (unadjusted) in active markets for an identical asset or liability |
| • | Level 2—other significant observable inputs (including quoted prices for a similar asset or liability in active markets, interest rates and yield curves, prepayment speeds, credit risk, etc.) |
| • | Level 3—significant unobservable inputs (including the Fund's own assumptions about the assumptions that market participants would use in measuring fair value of an asset or liability) |
The level of an asset or liability within the fair value hierarchy is based on the lowest level of an input, both individually and in the aggregate, that is significant to the fair value measurement. The aggregate value by input level of the Fund’s assets and liabilities as of October 31, 2022, is included at the end of the Portfolio of Investments.
The Fund may use third-party vendor evaluations, whose prices may be derived from one or more of the following standard inputs, among others:
| • Benchmark yields | • Reported trades |
| • Broker/dealer quotes | • Issuer spreads |
| • Two-sided markets | • Benchmark securities |
| • Bids/offers | • Reference data (corporate actions or material event notices) |
| • Industry and economic events | • Comparable bonds |
| • Monthly payment information | |
An asset or liability for which a market quotation is not readily available is valued by methods deemed reasonable in good faith by the Valuation Committee, following the Valuation Procedures to represent fair value. Under these procedures, the Valuation Designee generally uses a market-based approach which may use related or comparable assets or liabilities, recent transactions, market multiples, book values and other relevant information. The Valuation Designee may also use an income-based valuation approach in which the anticipated future cash flows of the asset or liability are discounted to calculate fair value. Discounts may also be applied due to the nature and/or duration of any restrictions on the disposition of the asset or liability. Fair value represents a good faith approximation of the value of a security. Fair value determinations involve the consideration of a number of subjective factors, an analysis of applicable facts and circumstances and the exercise of judgment. As a result, it is possible that the fair value for a security determined in good faith in accordance with the Valuation Procedures may differ from valuations for the same security determined for other funds using their own valuation procedures. Although the Valuation Procedures are designed to value a security at the price the Fund may reasonably expect to receive upon the security's sale in an orderly transaction, there can be no assurance that any fair value determination thereunder would, in fact, approximate the amount that the Fund would actually realize upon the sale of the security or the price at which the security would trade if a reliable market price were readily available. During the year ended October 31, 2022, there were no material changes to the fair value methodologies.
Securities which may be valued in this manner include, but are not limited to: (i) a security for which trading has been halted or suspended or otherwise does not have a readily available market quotation on a given day; (ii) a debt security that has recently gone into default and for which there is not a current market quotation; (iii) a security of an issuer that has entered into a restructuring; (iv) a security that has been delisted
Notes to Financial Statements (continued)
from a national exchange; (v) a security subject to trading collars for which no or limited trading takes place; and (vi) a security whose principal market has been temporarily closed at a time when, under normal conditions, it would be open. Securities valued in this manner are generally categorized as Level 2 or 3 in the hierarchy.
Investments in mutual funds, including money market funds, are valued at their respective NAVs at the close of business each day on the valuation date. These securities are generally categorized as Level 1 in the hierarchy.
Futures contracts are valued at the last posted settlement price on the market where such futures are primarily traded. These securities are generally categorized as Level 1 in the hierarchy.
Municipal debt securities are valued at the evaluated mean prices supplied by a pricing agent or broker selected by the Manager, in consultation with the Subadvisor. The evaluations are market-based measurements processed through a pricing application and represents the pricing agent's good faith determination as to what a holder may receive in an orderly transaction under market conditions. The rules-based logic utilizes valuation techniques that reflect participants' assumptions and vary by asset class and per methodology, maximizing the use of relevant observable data including quoted prices for similar assets, benchmark yield curves and market corroborated inputs. The evaluated bid or mean prices are deemed by the Manager, in consultation with the Subadvisor, to be representative of market values, at the regular close of trading of the Exchange on each valuation date. Municipal debt securities purchased on a delayed delivery basis are marked to market daily until settlement at the forward settlement date. Municipal debt securities are generally categorized as Level 2 in the hierarchy.
Temporary cash investments acquired in excess of 60 days to maturity at the time of purchase are valued using the latest bid prices or using valuations based on a matrix system (which considers such factors as security prices, yields, maturities and ratings), both as furnished by independent pricing services. Temporary cash investments that mature in 60 days or less at the time of purchase ("Short-Term Investments") are valued using the amortized cost method of valuation, unless the use of such method would be inappropriate. The amortized cost method involves valuing a security at its cost on the date of purchase and thereafter assuming a constant amortization to maturity of the difference between such cost and the value on maturity date. Amortized cost approximates the current fair value of a security. Securities valued using the amortized cost method are not valued using quoted prices in an active market and are generally categorized as Level 2 in the hierarchy.
The information above is not intended to reflect an exhaustive list of the methodologies that may be used to value portfolio investments. The Valuation Procedures permit the use of a variety of valuation methodologies in connection with valuing portfolio investments. The methodology used for a specific type of investment may vary based on the market data available or other considerations. The methodologies summarized above may not represent the specific means by which portfolio investments are valued on any particular business day.
(B) Income Taxes. The Fund's policy is to comply with the requirements of the Internal Revenue Code of 1986, as amended (the “Internal Revenue Code”), applicable to regulated investment companies and to distribute all of its taxable income to the shareholders of the Fund within the allowable time limits.
The Manager evaluates the Fund’s tax positions to determine if the tax positions taken meet the minimum recognition threshold in connection with accounting for uncertainties in income tax positions taken or expected to be taken for the purposes of measuring and recognizing tax liabilities in the financial statements. Recognition of tax benefits of an uncertain tax position is permitted only to the extent the position is “more likely than not” to be sustained assuming examination by taxing authorities. The Manager analyzed the Fund's tax positions taken on federal, state and local income tax returns for all open tax years (for up to three tax years) and has concluded that no provisions for federal, state and local income tax are required in the Fund's financial statements. The Fund's federal, state and local income tax and federal excise tax returns for tax years for which the applicable statutes of limitations have not expired are subject to examination by the Internal Revenue Service and state and local departments of revenue.
(C) Dividends and Distributions to Shareholders. Dividends and distributions are recorded on the ex-dividend date. The Fund intends to declare dividends from net investment income, if any, daily and intends to pay them at least monthly and declares and pays distributions from net realized capital gains, if any, at least annually. Unless a shareholder elects otherwise, all dividends and distributions are reinvested at NAV in the same class of shares of the Fund. Dividends and distributions to shareholders are determined in accordance with federal income tax regulations and may differ from determinations using GAAP.
(D) Security Transactions and Investment Income. The Fund records security transactions on the trade date. Realized gains and losses on security transactions are determined using the identified cost method. Discounts and premiums on securities purchased, other than temporary cash investments that mature in 60 days or less at the time of purchase, for the Fund are accreted and amortized, respectively, on the effective interest rate method.
Investment income and realized and unrealized gains and losses on investments of the Fund are allocated pro rata to the separate classes of shares based upon their relative net assets on the date the income is earned or realized and unrealized gains and losses are incurred.
The Fund may place a debt security on non-accrual status and reduce related interest income by ceasing current accruals and writing off all or a portion of any interest receivables when the collection of all or a portion of such interest has become doubtful. A debt security is removed from non-accrual status when the issuer resumes interest payments or when collectability of interest is reasonably assured.
(E) Expenses. Expenses of the Trust are allocated to the individual Funds in proportion to the net assets of the respective Funds when the expenses are incurred, except where direct allocations of expenses can
| 58 | MainStay MacKay Tax Free Bond Fund |
be made. Expenses (other than transfer agent expenses and fees incurred under the shareholder services plans and/or the distribution plans further discussed in Note 3(B)) are allocated to separate classes of shares pro rata based upon their relative net assets on the date the expenses are incurred. The expenses borne by the Fund, including those of related parties to the Fund, are shown in the Statement of Operations.
Additionally, the Fund may invest in mutual funds, which are subject to management fees and other fees that may cause the costs of investing in mutual funds to be greater than the costs of owning the underlying securities directly. These indirect expenses of mutual funds are not included in the amounts shown as expenses in the Statement of Operations or in the expense ratios included in the Financial Highlights.
(F) Use of Estimates. In preparing financial statements in conformity with GAAP, the Manager makes estimates and assumptions that affect the reported amounts and disclosures in the financial statements. Actual results could differ from those estimates and assumptions.
(G) Futures Contracts. A futures contract is an agreement to purchase or sell a specified quantity of an underlying instrument at a specified future date and price, or to make or receive a cash payment based on the value of a financial instrument (e.g., foreign currency, interest rate, security or securities index). The Fund is subject to risks such as market price risk, leverage risk, liquidity risk, counterparty risk, operational risk, legal risk and/or interest rate risk in the normal course of investing in these contracts. Upon entering into a futures contract, the Fund is required to pledge to the broker or futures commission merchant an amount of cash and/or U.S. government securities equal to a certain percentage of the collateral amount, known as the “initial margin.” During the period the futures contract is open, changes in the value of the contract are recognized as unrealized appreciation or depreciation by marking to market such contract on a daily basis to reflect the market value of the contract at the end of each day’s trading. The Fund agrees to receive from or pay to the broker or futures commission merchant an amount of cash equal to the daily fluctuation in the value of the contract. Such receipts or payments are known as “variation margin.” When the futures contract is closed, the Fund records a realized gain or loss equal to the difference between the proceeds from (or cost of) the closing transaction and the Fund's basis in the contract.
The use of futures contracts involves, to varying degrees, elements of market risk in excess of the amount recognized in the Statement of Assets and Liabilities. The contract or notional amounts and variation margin reflect the extent of the Fund's involvement in open futures positions. There are several risks associated with the use of futures contracts as hedging techniques. There can be no assurance that a liquid market will exist at the time when the Fund seeks to close out a futures contract. If no liquid market exists, the Fund would remain obligated to meet margin requirements until the position is closed. Futures contracts may involve a small initial investment relative to the risk assumed, which could result in losses greater than if the Fund did not invest in futures contracts. Futures contracts may be more volatile than direct investments in the instrument underlying the futures and may not correlate to the
underlying instrument, causing a given hedge not to achieve its objectives. The Fund's activities in futures contracts have minimal counterparty risk as they are conducted through regulated exchanges that guarantee the futures against default by the counterparty. In the event of a bankruptcy or insolvency of a futures commission merchant that holds margin on behalf of the Fund, the Fund may not be entitled to the return of the entire margin owed to the Fund, potentially resulting in a loss. The Fund may invest in futures contracts to seek enhanced returns or to reduce the risk of loss by hedging certain of its holdings. The Fund's investment in futures contracts and other derivatives may increase the volatility of the Fund's NAVs and may result in a loss to the Fund. Open futures contracts as of October 31, 2022, are shown in the Portfolio of Investments.
(H) Delayed Delivery Transactions. The Fund may purchase or sell securities on a delayed delivery basis. These transactions involve a commitment by the Fund to purchase or sell securities for a predetermined price or yield, with payment and delivery taking place beyond the customary settlement period. When delayed delivery purchases are outstanding, the Fund will designate liquid assets in an amount sufficient to meet the purchase price. When purchasing a security on a delayed delivery basis, the Fund assumes the rights and risks of ownership of the security, including the risk of price and yield fluctuations, and takes such fluctuations into account when determining its NAV. The Fund may dispose of or renegotiate a delayed delivery transaction after it is entered into, and may sell delayed delivery securities before they are delivered, which may result in a realized gain or loss. When the Fund has sold a security it owns on a delayed delivery basis, the Fund does not participate in future gains and losses with respect to the security. Delayed delivery transactions as of October 31, 2022, are shown in the Portfolio of Investments.
(I) Municipal Bond Risk. The Fund may invest more heavily in municipal bonds from certain cities, states, territories or regions than others, which may increase the Fund’s exposure to losses resulting from economic, political, regulatory occurrences, or declines in tax revenue impacting these particular cities, states, territories or regions. In addition, many state and municipal governments that issue securities are under significant economic and financial stress and may not be able to satisfy their obligations, and these events may be made worse due to economic challenges posed by COVID-19. The Fund may invest a substantial amount of its assets in municipal bonds whose interest is paid solely from revenues of similar projects, such as tobacco settlement bonds. If the Fund concentrates its investments in this manner, it assumes the legal and economic risks relating to such projects and this may have a significant impact on the Fund’s investment performance.
Certain of the issuers in which the Fund may invest have recently experienced, or may experience, significant financial difficulties and repeated credit rating downgrades. On May 3, 2017, the Commonwealth of Puerto Rico (the "Commonwealth") began proceedings pursuant to the Puerto Rico Oversight, Management, and Economic Stability Act (“PROMESA”) to seek bankruptcy-type protections from approximately
Notes to Financial Statements (continued)
$74 billion in debt and approximately $48 billion in unfunded pension obligations. In addition, the economic downturn following the outbreak of COVID-19 and the resulting pressure on Puerto Rico’s budget have further contributed to its financial challenges. The federal government has passed certain relief packages, including the Coronavirus Aid, Relief, and Economic Security Act and the American Rescue Plan, which include an aggregate of more than $7 billion in disaster relief funds for the U.S. territories, including Puerto Rico. However, there can be no assurances that the federal funds allocated to the Commonwealth will be sufficient to address the economic challenges arising from COVID-19.
The Commonwealth concluded its Title III restructuring proceedings on behalf of itself and certain instrumentalities effective March 15th, 2022. Approximately $18.75 billion of claims related to debt guaranteed under Puerto Rico's constitution including the Commonwealth of Puerto Rico and Public Building Authority were restructured with issuance of $7.4 billion in new Puerto Rico General Obligation Bonds, $7.1 billion of cash, and $3.5 billion of new Contingent Value instruments. In addition the Commonwealth's exit from the restructuring proceedings resolved certain claims relating to the Commonwealth Employee Retirement System, Convention Center, Highway Authority, and Infrastructure Financing Authority. Several of Commonwealth's agencies are still under Title III restructuring proceedings including the Highway Authority and Electric Authority.
Puerto Rico’s debt restructuring process and other economic, political, social, environmental or health factors or developments could occur rapidly and may significantly affect the value of municipal securities of Puerto Rico. Due to the ongoing budget impact from COVID-19 on the Commonwealth’s finances, the Federal Oversight and Management Board for Puerto Rico or the Commonwealth itself could seek to revise or even terminate earlier agreements reached with certain creditors prior to the outbreak of COVID-19. Any agreement between the Federal Oversight and Management Board and creditors is subject to approval by the judge overseeing the Title III proceedings. The composition of the Federal Oversight and Management Board has changed during the recent period due to existing members either stepping down or being replaced following the expiration of a member's term. There is no assurance that board members will approve the restructuring agreements the prior board had negotiated.
The Fund’s vulnerability to potential losses associated with such developments may be reduced through investing in municipal securities that feature credit enhancements (such as bond insurance). The bond insurance provider pays both principal and interest when due to the bond holder. The magnitude of Puerto Rico’s debt restructuring or other adverse economic developments could pose significant strains on the ability of municipal securities insurers to meet all future claims. As of October 31, 2022, 100.0% of the Puerto Rico municipal securities held by the Fund were insured.
(J) Indemnifications. Under the Trust’s organizational documents, its officers and trustees are indemnified against certain liabilities that may arise out of performance of their duties to the Trust. Additionally, in the
normal course of business, the Fund enters into contracts with third-party service providers that contain a variety of representations and warranties and that may provide general indemnifications. The Fund's maximum exposure under these arrangements is unknown, as this would involve future claims that may be made against the Fund that have not yet occurred. The Manager believes that the risk of loss in connection with these potential indemnification obligations is remote. However, there can be no assurance that material liabilities related to such obligations will not arise in the future, which could adversely impact the Fund.
(K) Quantitative Disclosure of Derivative Holdings. The following tables show additional disclosures related to the Fund's derivative and hedging activities, including how such activities are accounted for and their effect on the Fund's financial positions, performance and cash flows.
The Fund entered into futures contracts to help manage the duration and yield curve positioning of the portfolio. These derivatives are not accounted for as hedging instruments.
Fair value of derivative instruments as of October 31, 2022:
| Asset Derivatives | Interest
Rate
Contracts
Risk | Total |
| Futures Contracts - Net Assets—Net unrealized appreciation on futures contracts (a) | $31,453,455 | $31,453,455 |
| Total Fair Value | $31,453,455 | $31,453,455 |
| (a) | Includes cumulative appreciation (depreciation) of futures contracts as reported in the Portfolio of Investments. Only current day’s variation margin is reported within the Statement of Assets and Liabilities. |
The effect of derivative instruments on the Statement of Operations for the year ended October 31, 2022:
| Net Realized Gain (Loss) from: | Interest
Rate
Contracts
Risk | Total |
| Futures Contracts | $108,068,896 | $108,068,896 |
| Total Net Realized Gain (Loss) | $108,068,896 | $108,068,896 |
| Net Change in Unrealized Appreciation (Depreciation) | Interest
Rate
Contracts
Risk | Total |
| Futures Contracts | $19,381,827 | $19,381,827 |
| Total Net Change in Unrealized Appreciation (Depreciation) | $19,381,827 | $19,381,827 |
| Average Notional Amount | Total |
| Futures Contracts Short | $(788,538,216) |
| 60 | MainStay MacKay Tax Free Bond Fund |
Note 3–Fees and Related Party Transactions
(A) Manager and Subadvisor. New York Life Investments, a registered investment adviser and an indirect, wholly-owned subsidiary of New York Life Insurance Company ("New York Life"), serves as the Fund's Manager, pursuant to an Amended and Restated Management Agreement ("Management Agreement"). The Manager provides offices, conducts clerical, recordkeeping and bookkeeping services and keeps most of the financial and accounting records required to be maintained by the Fund. Except for the portion of salaries and expenses that are the responsibility of the Fund, the Manager pays the salaries and expenses of all personnel affiliated with the Fund and certain operational expenses of the Fund. During a portion of the year ended October 31, 2022, the Fund reimbursed New York Life Investments in an amount equal to the portion of the compensation of the Chief Compliance Officer attributable to the Fund. MacKay Shields LLC ("MacKay Shields" or the "Subadvisor"), a registered investment adviser and an indirect, wholly-owned subsidiary of New York Life, serves as the Subadvisor to the Fund and is responsible for the day-to-day portfolio management of the Fund. Pursuant to the terms of an Amended and Restated Subadvisory Agreement ("Subadvisory Agreement") between New York Life Investments and MacKay Shields, New York Life Investments pays for the services of the Subadvisor.
Effective February 28, 2022, pursuant to the Management Agreement, the Fund pays the Manager a monthly fee for the services performed and the facilities furnished at an annual rate of the Fund’s average daily net assets as follows: 0.45% up to $500 million; 0.425% from $500 million to $1 billion; 0.40% from $1 billion to $5 billion; 0.39% from $5 billion to $7 billion; 0.38% from $7 billion to $9 billion; and 0.37% in excess of $9 billion, plus a fee for fund accounting services previously provided by New York Life Investments under a separate fund accounting agreement furnished at an annual rate of the Fund’s average daily net assets as follows: 0.05% up to $20 million; 0.0333% from $20 million to $100 million; and 0.01% in excess of $100 million. During the year ended October 31, 2022, the effective management fee rate was 0.41%, inclusive of a fee for fund accounting services of 0.01% of the Fund's average daily net assets.
Prior to February 28, 2022, the Fund paid the Manager a monthly fee for the services performed and the facilities furnished at an annual rate of the Fund’s average daily net assets as follows: 0.45% up to $500 million; 0.425% from $500 million to $1 billion; 0.40% from $1 billion to $5 billion; 0.39% from $5 billion to $7 billion; and 0.38% in excess of $7 billion, plus a fee for fund accounting services previously provided by New York Life Investments under a separate fund accounting agreement furnished at an annual rate of the Fund’s average daily net assets as follows: 0.05% up to $20 million; 0.0333% from $20 million to $100 million; and 0.01% in excess of $100 million.
In addition, New York Life Investments waived fees and/or reimbursed expenses so that Total Annual Fund Operating Expenses (excluding taxes, interest, litigation, extraordinary expenses, brokerage and other transaction expenses relating to the purchase or sale of portfolio
investments, and acquired (underlying) fund fees and expenses) for Class R6 shares did not exceed those of Class I.
During the year ended October 31, 2022, New York Life Investments earned fees from the Fund in the amount of $32,730,055 and paid the Subadvisor in the amount of $15,952,673. There were no waived fees and/or reimbursed expenses.
JPMorgan Chase Bank, N.A. ("JPMorgan") provides sub-administration and sub-accounting services to the Fund pursuant to an agreement with New York Life Investments. These services include calculating the daily NAVs of the Fund, maintaining the general ledger and sub-ledger accounts for the calculation of the Fund's NAVs, and assisting New York Life Investments in conducting various aspects of the Fund's administrative operations. For providing these services to the Fund, JPMorgan is compensated by New York Life Investments.
Pursuant to an agreement between the Trust and New York Life Investments, New York Life Investments is responsible for providing or procuring certain regulatory reporting services for the Fund. The Fund will reimburse New York Life Investments for the actual costs incurred by New York Life Investments in connection with providing or procuring these services for the Fund.
(B) Distribution and Service Fees. The Trust, on behalf of the Fund, has entered into a distribution agreement with NYLIFE Distributors LLC (the “Distributor”), an affiliate of New York Life Investments. The Fund has adopted distribution plans (the “Plans”) in accordance with the provisions of Rule 12b-1 under the 1940 Act.
Pursuant to the Class A and Investor Class Plans, the Distributor receives a monthly fee from the Class A and Investor Class shares at an annual rate of 0.25% of the average daily net assets of the Class A and Investor Class shares for distribution and/or service activities as designated by the Distributor. Pursuant to the Class B and Class C Plans, Class B and Class C shares pay the Distributor a monthly distribution fee at an annual rate of 0.25% of the average daily net assets of the Class B and Class C shares along with a service fee at an annual rate of 0.25% of the average daily net assets of the Class B and Class C shares, for a total 12b-1 fee of 0.50%. Pursuant to the Class C2 Plan, Class C2 shares pay the Distributor a monthly distribution fee at an annual rate of 0.40% of the average daily net assets of the Class C2 shares, along with a service fee at an annual rate of 0.25% of the average daily net assets of the Class C2 shares, for a total 12b-1 fee of 0.65%. Class I and Class R6 shares are not subject to a distribution and/or service fee.
The Plans provide that the distribution and service fees are payable to the Distributor regardless of the amounts actually expended by the Distributor for distribution of the Fund's shares and service activities.
(C) Sales Charges. The Fund was advised by the Distributor that the amount of initial sales charges retained on sales of Class A and Investor Class shares during the year ended October 31, 2022, were $30,083 and $1,623, respectively.
Notes to Financial Statements (continued)
The Fund was also advised that the Distributor retained CDSCs on redemptions of Class A, Investor Class, Class B and Class C shares during the year ended October 31, 2022, of $267,363, $24, $2,370 and $16,700, respectively.
(D) Transfer, Dividend Disbursing and Shareholder Servicing Agent. NYLIM Service Company LLC, an affiliate of New York Life Investments, is the Fund's transfer, dividend disbursing and shareholder servicing agent pursuant to an agreement between NYLIM Service Company LLC and the Trust. NYLIM Service Company LLC has entered into an agreement with DST Asset Manager Solutions, Inc. ("DST"), pursuant to which DST performs certain transfer agent services on behalf of NYLIM Service Company LLC. New York Life Investments has contractually agreed to limit the transfer agency expenses charged to the Fund’s share classes to a maximum of 0.35% of that share class’s average daily net assets on an annual basis after deducting any applicable Fund or class-level expense reimbursement or small account fees. This agreement will remain in effect until February 28, 2023, and shall renew automatically for one-year terms unless New York Life Investments provides written notice of termination prior to the start of the next term or upon approval of the Board. During the year ended October 31, 2022, transfer agent expenses incurred by the Fund and any reimbursements, pursuant to the aforementioned Transfer Agency expense limitation agreement, were as follows:
| Class | Expense | Waived |
| Class A | $1,423,205 | $— |
| Investor Class | 6,363 | — |
| Class B | 4,644 | — |
| Class C | 132,927 | — |
| Class C2 | 2,918 | — |
| Class I | 3,483,390 | — |
| Class R6 | 19,518 | — |
(E) Small Account Fee. Shareholders with small accounts adversely impact the cost of providing transfer agency services. In an effort to reduce total transfer agency expenses, the Fund has implemented a small account fee on certain types of accounts. As described in the Fund's prospectus, certain shareholders with an account balance of less than $1,000 ($5,000 for Class A share accounts) are charged an annual per account fee of $20 (assessed semi-annually), the proceeds from which offset transfer agent fees as reflected in the Statement of Operations. This small account fee will not apply to certain types of accounts as described further in the Fund’s prospectus.
(F) Capital. As of October 31, 2022, New York Life and its affiliates beneficially held shares of the Fund with the values and percentages of net assets as follows:
| Class C2 | $21,969 | 0.6% |
| Class R6 | 23,288 | 0.0‡ |
| ‡ | Less than one-tenth of a percent. |
Note 4-Federal Income Tax
As of October 31, 2022, the cost and unrealized appreciation (depreciation) of the Fund’s investment portfolio, including applicable derivative contracts and other financial instruments, as determined on a federal income tax basis, were as follows:
| | Federal Tax
Cost | Gross
Unrealized
Appreciation | Gross
Unrealized
(Depreciation) | Net
Unrealized
Appreciation/
(Depreciation) |
| Investments in Securities | $6,965,212,554 | $3,353,954 | $(497,402,874) | $(494,048,920) |
As of October 31, 2022, the components of accumulated gain (loss) on a tax basis were as follows:
Ordinary
income | Undistributed
Tax Exempt
Income | Accumulated
Capital
and Other
Gain (Loss) | Other
Temporary
Differences | Unrealized
Appreciation
(Depreciation) | Total
Accumulated
Gain (Loss) |
| $— | $5,001,954 | $(662,706,338) | $(5,631,914) | $(494,048,920) | $(1,157,385,218) |
The difference between book-basis and tax-basis unrealized appreciation (depreciation) is primarily due to mark to market of futures contracts, cumulative bond amortization and wash sales adjustments. The other temporary differences are primarily due to dividends payable.
The following table discloses the current year reclassifications between total distributable earnings (loss) and additional paid-in capital arising from permanent differences; net assets as of October 31, 2022 were not affected.
| | Total
Distributable
Earnings (Loss) | Additional
Paid-In
Capital |
| | $(24,566,087) | $24,566,087 |
The reclassifications for the Fund are primarily due to redemption in-kind adjustments.
As of October 31, 2022, for federal income tax purposes, capital loss carryforwards of $662,706,338, as shown in the table below, were available to the extent provided by the regulations to offset future realized gains of the Fund. Accordingly, no capital gains distributions are expected
| 62 | MainStay MacKay Tax Free Bond Fund |
to be paid to shareholders until net gains have been realized in excess of such amounts.
Capital Loss
Available Through | Short-Term
Capital Loss
Amounts (000’s) | Long-Term
Capital Loss
Amounts (000’s) |
| Unlimited | $435,013 | $227,693 |
During the years ended October 31, 2022 and October 31, 2021, the tax character of distributions paid as reflected in the Statements of Changes in Net Assets was as follows:
| | 2022 | 2021 |
| Distributions paid from: | | |
| Ordinary Income | $ 3,636,127 | $ 1,569,420 |
| Long-Term Capital Gains | 26,911,851 | — |
| Exempt Interest Dividends | 221,977,149 | 194,998,437 |
| Total | $252,525,127 | $196,567,857 |
Note 5–Custodian
JPMorgan is the custodian of cash and securities held by the Fund. Custodial fees are charged to the Fund based on the Fund's net assets and/or the market value of securities held by the Fund and the number of certain transactions incurred by the Fund.
Note 6–Line of Credit
The Fund and certain other funds managed by New York Life Investments maintain a line of credit with a syndicate of banks in order to secure a source of funds for temporary purposes to meet unanticipated or excessive redemption requests.
Effective July 26, 2022, under the credit agreement (the “Credit Agreement”), the aggregate commitment amount is $600,000,000 with an additional uncommitted amount of $100,000,000. The commitment fee is an annual rate of 0.15% of the average commitment amount payable quarterly, regardless of usage, to JPMorgan, who serves as the agent to the syndicate. The commitment fee is allocated among the Fund and certain other funds managed by New York Life Investments based upon their respective net assets and other factors. Interest on any revolving credit loan is charged based upon the Federal Funds Rate, Daily Simple Secured Overnight Financing Rate ("SOFR") + 0.10%, or the Overnight Bank Funding Rate, whichever is higher. The Credit Agreement expires on July 25, 2023, although the Fund, certain other funds managed by New York Life Investments and the syndicate of banks may renew the Credit Agreement for an additional year on the same or different terms or enter into a credit agreement with a different syndicate of banks. Prior to July 26, 2022, the aggregate commitment amount and the commitment fee were the same as those under the current Credit Agreement. During the year ended October 31, 2022, there were no borrowings made or outstanding with respect to the Fund under the Credit Agreement.
Note 7–Interfund Lending Program
Pursuant to an exemptive order issued by the SEC, the Fund, along with certain other funds managed by New York Life Investments, may participate in an interfund lending program. The interfund lending program provides an alternative credit facility that permits the Fund and certain other funds managed by New York Life Investments to lend or borrow money for temporary purposes directly to or from one another, subject to the conditions of the exemptive order. During the year ended October 31, 2022, there were no interfund loans made or outstanding with respect to the Fund.
Note 8–Purchases and Sales of Securities (in 000’s)
During the year ended October 31, 2022, purchases and sales of securities, other than short-term securities and in-kind transactions, were $9,826,544 and $9,953,555, respectively.
Note 9–Capital Share Transactions
Transactions in capital shares for the years ended October 31, 2022 and October 31, 2021, were as follows:
| Class A | Shares | Amount |
| Year ended October 31, 2022: | | |
| Shares sold | 130,380,923 | $ 1,314,002,747 |
| Shares issued to shareholders in reinvestment of distributions | 5,421,368 | 53,611,172 |
| Shares redeemed | (167,369,579) | (1,665,629,660) |
| Shares redeemed in connection with in-kind transactions | (88,883,335) | (930,537,398) |
| Net increase (decrease) in shares outstanding before conversion | (120,450,623) | (1,228,553,139) |
| Shares converted into Class A (See Note 1) | 452,466 | 4,319,856 |
| Shares converted from Class A (See Note 1) | (241,624) | (2,235,525) |
| Net increase (decrease) | (120,239,781) | $(1,226,468,808) |
| Year ended October 31, 2021: | | |
| Shares sold | 99,478,301 | $ 1,062,918,922 |
| Shares issued to shareholders in reinvestment of distributions | 5,084,065 | 54,338,767 |
| Shares redeemed | (65,780,209) | (702,941,180) |
| Net increase (decrease) in shares outstanding before conversion | 38,782,157 | 414,316,509 |
| Shares converted into Class A (See Note 1) | 681,707 | 7,257,068 |
| Shares converted from Class A (See Note 1) | (159,616) | (1,709,072) |
| Net increase (decrease) | 39,304,248 | $ 419,864,505 |
| |
Notes to Financial Statements (continued)
| Investor Class | Shares | Amount |
| Year ended October 31, 2022: | | |
| Shares sold | 47,829 | $ 477,956 |
| Shares issued to shareholders in reinvestment of distributions | 22,092 | 217,249 |
| Shares redeemed | (131,140) | (1,340,625) |
| Net increase (decrease) in shares outstanding before conversion | (61,219) | (645,420) |
| Shares converted into Investor Class (See Note 1) | 15,813 | 157,272 |
| Shares converted from Investor Class (See Note 1) | (57,552) | (572,273) |
| Net increase (decrease) | (102,958) | $ (1,060,421) |
| Year ended October 31, 2021: | | |
| Shares sold | 161,146 | $ 1,727,078 |
| Shares issued to shareholders in reinvestment of distributions | 17,057 | 183,105 |
| Shares redeemed | (115,386) | (1,241,105) |
| Net increase (decrease) in shares outstanding before conversion | 62,817 | 669,078 |
| Shares converted into Investor Class (See Note 1) | 53,106 | 568,532 |
| Shares converted from Investor Class (See Note 1) | (158,778) | (1,706,829) |
| Net increase (decrease) | (42,855) | $ (469,219) |
| |
| Class B | Shares | Amount |
| Year ended October 31, 2022: | | |
| Shares sold | 4,936 | $ 47,640 |
| Shares issued to shareholders in reinvestment of distributions | 14,760 | 145,103 |
| Shares redeemed | (209,782) | (2,027,969) |
| Net increase (decrease) in shares outstanding before conversion | (190,086) | (1,835,226) |
| Shares converted from Class B (See Note 1) | (23,583) | (229,631) |
| Net increase (decrease) | (213,669) | $ (2,064,857) |
| Year ended October 31, 2021: | | |
| Shares sold | 981 | $ 10,463 |
| Shares issued to shareholders in reinvestment of distributions | 13,643 | 145,760 |
| Shares redeemed | (201,005) | (2,144,217) |
| Net increase (decrease) in shares outstanding before conversion | (186,381) | (1,987,994) |
| Shares converted from Class B (See Note 1) | (42,736) | (456,262) |
| Net increase (decrease) | (229,117) | $ (2,444,256) |
| |
| Class C | Shares | Amount |
| Year ended October 31, 2022: | | |
| Shares sold | 2,218,065 | $ 21,391,995 |
| Shares issued to shareholders in reinvestment of distributions | 352,474 | 3,461,431 |
| Shares redeemed | (6,602,650) | (64,058,583) |
| Net increase (decrease) in shares outstanding before conversion | (4,032,111) | (39,205,157) |
| Shares converted from Class C (See Note 1) | (136,858) | (1,334,457) |
| Net increase (decrease) | (4,168,969) | $ (40,539,614) |
| Year ended October 31, 2021: | | |
| Shares sold | 3,305,683 | $ 35,365,767 |
| Shares issued to shareholders in reinvestment of distributions | 290,475 | 3,105,096 |
| Shares redeemed | (5,862,251) | (62,577,165) |
| Net increase (decrease) in shares outstanding before conversion | (2,266,093) | (24,106,302) |
| Shares converted from Class C (See Note 1) | (479,209) | (5,096,642) |
| Net increase (decrease) | (2,745,302) | $ (29,202,944) |
| |
| Class C2 | Shares | Amount |
| Year ended October 31, 2022: | | |
| Shares sold | 226,213 | $ 2,213,594 |
| Shares issued to shareholders in reinvestment of distributions | 9,314 | 90,208 |
| Shares redeemed | (74,555) | (706,592) |
| Net increase (decrease) | 160,972 | $ 1,597,210 |
| Year ended October 31, 2021: | | |
| Shares sold | 258,813 | $ 2,765,102 |
| Shares issued to shareholders in reinvestment of distributions | 2,647 | 28,298 |
| Shares redeemed | (3,318) | (35,775) |
| Net increase (decrease) | 258,142 | $ 2,757,625 |
| |
| 64 | MainStay MacKay Tax Free Bond Fund |
| Class I | Shares | Amount |
| Year ended October 31, 2022: | | |
| Shares sold | 355,933,328 | $ 3,455,802,105 |
| Shares issued to shareholders in reinvestment of distributions | 12,832,922 | 125,526,725 |
| Shares redeemed | (385,037,502) | (3,678,587,460) |
| Net increase (decrease) in shares outstanding before conversion | (16,271,252) | (97,258,630) |
| Shares converted into Class I (See Note 1) | 277,634 | 2,599,530 |
| Shares converted from Class I (See Note 1) | (30,259,512) | (303,254,838) |
| Net increase (decrease) | (46,253,130) | $ (397,913,938) |
| Year ended October 31, 2021: | | |
| Shares sold | 196,260,720 | $ 2,100,235,655 |
| Shares issued to shareholders in reinvestment of distributions | 8,112,416 | 86,740,578 |
| Shares redeemed | (89,967,840) | (962,334,386) |
| Net increase (decrease) in shares outstanding before conversion | 114,405,296 | 1,224,641,847 |
| Shares converted into Class I (See Note 1) | 142,757 | 1,529,574 |
| Shares converted from Class I (See Note 1) | (639,170) | (6,825,840) |
| Net increase (decrease) | 113,908,883 | $ 1,219,345,581 |
| |
| Class R6 | Shares | Amount |
| Year ended October 31, 2022: | | |
| Shares sold | 133,667,628 | $ 1,290,515,213 |
| Shares issued to shareholders in reinvestment of distributions | 52,050 | 496,182 |
| Shares redeemed | (136,777,292) | (1,302,976,762) |
| Net increase (decrease) in shares outstanding before conversion | (3,057,614) | (11,965,367) |
| Shares converted into Class R6 (See Note 1) | 30,237,243 | 303,054,035 |
| Shares converted from Class R6 (See Note 1) | (263,796) | (2,503,969) |
| Net increase (decrease) | 26,915,833 | $ 288,584,699 |
| Year ended October 31, 2021: | | |
| Shares sold | 9,221,629 | $ 98,661,761 |
| Shares issued to shareholders in reinvestment of distributions | 9,235 | 98,779 |
| Shares redeemed | (2,727,931) | (29,182,679) |
| Net increase (decrease) in shares outstanding before conversion | 6,502,933 | 69,577,861 |
| Shares converted into Class R6 (See Note 1) | 636,397 | 6,804,674 |
| Shares converted from Class R6 (See Note 1) | (33,992) | (365,203) |
| Net increase (decrease) | 7,105,338 | $ 76,017,332 |
Note 10–Other Matters
As of the date of this report, interest rates in the United States and many parts of the world, including certain European countries, are ascending from historically low levels. Thus, the Fund currently faces a heightened level of risk associated with rising interest rates. This could be driven by a variety of factors, including but not limited to central bank monetary policies, changing inflation or real growth rates, general economic conditions, increasing bond issuances or reduced market demand for low yielding investments.
An outbreak of COVID-19, first detected in December 2019, has developed into a global pandemic and has resulted in travel restrictions, closure of international borders, certain businesses and securities markets, restrictions on securities trading activities, prolonged quarantines, supply chain disruptions, and lower consumer demand, as well as general concern and uncertainty. In 2022, many countries lifted some or all restrictions related to COVID-19. However, the continued impact of COVID-19 and related variants is uncertain and could further adversely affect the global economy, national economies, individual issuers and capital markets in unforeseeable ways and result in a substantial and extended economic downturn. Developments that disrupt global economies and financial markets, such as COVID-19, may magnify factors that affect the Fund's performance.
Note 11–Subsequent Events
In connection with the preparation of the financial statements of the Fund as of and for the year ended October 31, 2022, events and transactions subsequent to October 31, 2022, through the date the financial statements were issued have been evaluated by the Manager for possible adjustment and/or disclosure. No subsequent events requiring financial statement adjustment or disclosure have been identified.
Report of Independent Registered Public Accounting Firm
To the Shareholders of the Fund and Board of Trustees
The MainStay Funds:
Opinion on the Financial Statements
We have audited the accompanying statement of assets and liabilities of MainStay MacKay Tax Free Bond Fund (the Fund), one of the funds constituting The MainStay Funds, including the portfolio of investments, as of October 31, 2022, the related statement of operations for the year then ended, the statements of changes in net assets for each of the years in the two-year period then ended, and the related notes (collectively, the financial statements) and the financial highlights for each of the years or periods in the five-year period then ended. In our opinion, the financial statements and financial highlights present fairly, in all material respects, the financial position of the Fund as of October 31, 2022, the results of its operations for the year then ended, the changes in its net assets for each of the years in the two-year period then ended, and the financial highlights for each of the years or periods in the five-year period then ended, in conformity with U.S. generally accepted accounting principles.
Basis for Opinion
These financial statements and financial highlights are the responsibility of the Fund's management. Our responsibility is to express an opinion on these financial statements and financial highlights based on our audits. We are a public accounting firm registered with the Public Company Accounting Oversight Board (United States) (PCAOB) and are required to be independent with respect to the Fund in accordance with the U.S. federal securities laws and the applicable rules and regulations of the Securities and Exchange Commission and the PCAOB.
We conducted our audits in accordance with the standards of the PCAOB. Those standards require that we plan and perform the audit to obtain reasonable assurance about whether the financial statements and financial highlights are free of material misstatement, whether due to error or fraud. Our audits included performing procedures to assess the risks of material misstatement of the financial statements and financial highlights, whether due to error or fraud, and performing procedures that respond to those risks. Such procedures included examining, on a test basis, evidence regarding the amounts and disclosures in the financial statements and financial highlights. Such procedures also included confirmation of securities owned as of October 31, 2022, by correspondence with custodians and brokers; when replies were not received from brokers, we performed other auditing procedures. Our audits also included evaluating the accounting principles used and significant estimates made by management, as well as evaluating the overall presentation of the financial statements and financial highlights. We believe that our audits provide a reasonable basis for our opinion.

We have served as the auditor of one or more New York Life Investment Management investment companies since 2003.
Philadelphia, Pennsylvania
December 23, 2022
| 66 | MainStay MacKay Tax Free Bond Fund |
Federal Income Tax Information
(Unaudited)
The Fund is required under the Internal Revenue Code to advise shareholders in a written statement as to the federal tax status of dividends paid by the Fund during such fiscal years. Accordingly, the Fund paid $26,917,528 as long term capital gain distributions.
For Federal individual income tax purposes, the Fund designated 98.4% of the ordinary income dividends paid during its fiscal year ended October 31, 2022 as attributable to interest income from Tax Exempt Municipal Bonds. Such dividends are currently exempt from Federal income taxes under Section 103(a) of the Internal Revenue Code.
In February 2023, shareholders will receive an IRS Form 1099-DIV or substitute Form 1099, which will show the federal tax status of the distributions received by shareholders in calendar year 2022. The amounts that will be reported on such 1099-DIV or substitute Form 1099 will be the amounts you are to use on your federal income tax return and will differ from the amounts which we must report for the Fund's fiscal year ended October 31, 2022.
Proxy Voting Policies and Procedures and Proxy Voting Record
The Fund is required to file with the SEC its proxy voting record for the 12-month period ending June 30 on Form N-PX. A description of the policies and procedures that are used to vote proxies relating to portfolio securities of the Fund is available free of charge upon request by calling 800-624-6782 or visiting the SEC’s website at www.sec.gov. The most recent Form N-PX or proxy voting record is available free of charge upon request by calling 800-624-6782; visiting newyorklifeinvestments.com; or visiting the SEC’s website at www.sec.gov.
Shareholder Reports and Quarterly Portfolio Disclosure
The Fund is required to file its complete schedule of portfolio holdings with the SEC 60 days after its first and third fiscal quarter on Form N-PORT. The Fund's holdings report is available free of charge upon request by calling New York Life Investments at 800-624-6782.
Board of Trustees and Officers (Unaudited)
The Trustees and officers of the Fund are listed below. The Board oversees the MainStay Group of Funds (which consists of MainStay Funds and MainStay Funds Trust), MainStay VP Funds Trust, MainStay MacKay DefinedTerm Municipal Opportunities Fund, MainStay CBRE Global Infrastructure Megatrends Fund, the Manager and the Subadvisors, and elects the officers of the Funds who are responsible for the day-to-day operations of the Fund. Information pertaining to the Trustees and officers is set forth below. Each Trustee serves until his or her successor is
elected and qualified or until his or her resignation, death or removal. Under the Board’s retirement policy, unless an exception is made, a Trustee must tender his or her resignation by the end of the calendar year during which he or she reaches the age of 75. The business address of each Trustee and officer listed below is 51 Madison Avenue, New York, New York 10010. None of the Trustees are “interested persons” (as defined by the 1940 Act and rules adopted by the SEC thereunder) of the Fund (“Independent Trustees”).
| | Name and
Year of Birth | Term of Office,
Position(s) Held and
Length of Service | Principal Occupation(s)
During Past Five Years | Number of
Portfolios in
Fund Complex
Overseen by
Trustee | Other Directorships
Held by Trustee |
| | | | | | |
| | David H. Chow
1957 | MainStay Funds: Trustee since 2016, Advisory Board Member (June 2015 to December 2015);MainStay Funds Trust:
Trustee since January 2016, Advisory Board Member (June 2015 to December 2015) | Founder and CEO, DanCourt Management, LLC since 1999 | 78 | MainStay VP Funds Trust: Trustee since January 2016, Advisory Board Member (June 2015 to December 2015) (31 portfolios);
MainStay MacKay DefinedTerm Municipal Opportunities Fund: Trustee since January 2016, Advisory Board Member (June 2015 to December 2015);
MainStay CBRE Global Infrastructure Megatrends Fund: Trustee since June 2021; VanEck Vectors Group of Exchange-Traded Funds: Independent Chairman of the Board of Trustees since 2008 and Trustee since 2006 (56 portfolios); and Berea College of Kentucky: Trustee since 2009, Chair of the Investment Committee since 2018 |
| | Susan B. Kerley
1951 | MainStay Funds: Chairman since 2017 and Trustee since 2007;MainStay Funds Trust:
Chairman since 2017 and Trustee since 1990** | President, Strategic Management Advisors LLC since 1990 | 78 | MainStay VP Funds Trust: Chairman since January 2017 and Trustee since 2007 (31 portfolios)**;
MainStay MacKay DefinedTerm Municipal Opportunities Fund: Chairman since 2017 and Trustee since 2011;
MainStay CBRE Global Infrastructure Megatrends Fund: Trustee since June 2021; and Legg Mason Partners Funds: Trustee since 1991 (45 portfolios) |
| | Alan R. Latshaw
1951 | MainStay Funds: Trustee since 2006;MainStay Funds Trust:
Trustee since 2007*** | Retired; Partner, Ernst & Young LLP (2002 to 2003); Partner, Arthur Andersen LLP (1989 to 2002); Consultant to the MainStay Funds Audit and Compliance Committee (2004 to 2006) | 78 | MainStay VP Funds Trust: Trustee since 2007 (31 portfolios)**;
MainStay MacKay DefinedTerm Municipal Opportunities Fund: Trustee since 2011; and
MainStay CBRE Global Infrastructure Megatrends Fund: Trustee since June 2021 |
| 68 | MainStay MacKay Tax Free Bond Fund |
| | Name and
Year of Birth | Term of Office,
Position(s) Held and
Length of Service | Principal Occupation(s)
During Past Five Years | Number of
Portfolios in
Fund Complex
Overseen by
Trustee | Other Directorships
Held by Trustee |
| | | | | | |
| | Karen Hammond
1956 | MainStay Funds: Trustee since December 2021, Advisory Board Member (June 2021 to December 2021);MainStay Funds Trust:
Trustee since December 2021, Advisory Board Member (June 2021 to December 2021)
| Retired, Managing Director, Devonshire Investors (2007 to 2013); Senior Vice President, Fidelity Management & Research Co. (2005 to 2007); Senior Vice President and Corporate Treasurer, FMR Corp. (2003 to 2005); Chief Operating Officer, Fidelity Investments Japan (2001 to 2003) | 78 | MainStay VP Funds Trust: Trustee since December 2021, Advisory Board Member (June 2021 to December 2021) (31 Portfolios);
MainStay MacKay DefinedTerm Municipal Opportunities Fund: Trustee since December 2021, Advisory Board Member (June 2021 to December 2021);
MainStay CBRE Global Infrastructure Megatrends Fund: Trustee since December 2021, Advisory Board Member (June 2021 to December 2021);
Two Harbors Investment Corp.: Director since 2018;
Rhode Island State Investment Commission: Member since 2017; and
Blue Cross Blue Shield of Rhode Island: Director since 2019 |
| | Jacques P. Perold
1958 | MainStay Funds: Trustee since 2016, Advisory Board Member (June 2015 toDecember 2015);MainStay Funds Trust:
Trustee since January 2016, Advisory Board Member (June 2015 to December 2015) | Founder and Chief Executive Officer, CapShift Advisors LLC (since 2018); President, Fidelity Management & Research Company (2009 to 2014); President and Chief Investment Officer, Geode Capital Management, LLC (2001 to 2009) | 78 | MainStay VP Funds Trust: Trustee since January 2016, Advisory Board Member (June 2015 to December 2015) (31 portfolios);
MainStay MacKay DefinedTerm Municipal Opportunities Fund: Trustee since January 2016, Advisory Board Member (June 2015 to December 2015);
MainStay CBRE Global Infrastructure Megatrends Fund: Trustee since June 2021; Partners in Health: Trustee since 2019; Allstate Corporation: Director since 2015; and MSCI Inc.: Director since 2017 |
| | Richard S. Trutanic
1952 | MainStay Funds: Trustee since 1994;MainStay Funds Trust:
Trustee since 2007*** | Chairman and Chief Executive Officer, Somerset & Company (financial advisory firm) since 2004; Managing Director, The Carlyle Group (private investment firm) (2002 to 2004); Senior Managing Director, Partner and Board Member, Groupe Arnault S.A. (private investment firm) (1999 to 2002) | 78 | MainStay VP Funds Trust: Trustee since 2007 (31 portfolios)**;
MainStay MacKay DefinedTerm Municipal Opportunities Fund: Trustee since 2011; and MainStay CBRE Global Infrastructure Megatrends Fund: Trustee since June 2021 |
| ** | Includes prior service as a Director of MainStay VP Series Fund, Inc., the predecessor to MainStay VP Funds Trust. |
| *** | Includes prior service as a Director/Trustee of certain predecessor entities to MainStay Funds Trust. |
Board of Trustees and Officers (Unaudited) (continued)
| | Name and
Year of Birth | Position(s) Held and
Length of Service | Principal Occupation(s)
During Past Five Years | |
| | | | | |
| | Kirk C. Lehneis
1974 | President, MainStay Funds, MainStay Funds Trust since 2017 | Chief Operating Officer and Senior Managing Director (since 2016), New York Life Investment Management LLC and New York Life Investment Management Holdings LLC; Member of the Board of Managers (since 2017) and Senior Managing Director (since 2018), NYLIFE Distributors LLC; Chairman of the Board and Senior Managing Director, NYLIM Service Company LLC (since 2017); Trustee, President and Principal Executive Officer of IndexIQ Trust, IndexIQ ETF Trust and IndexIQ Active ETF Trust (since January 2018); President, MainStay CBRE Global Infrastructure Megatrends Fund (since 2021), MainStay MacKay DefinedTerm Municipal Opportunities Fund and MainStay VP Funds Trust (since 2017); Senior Managing Director, Global Product Development (From 2015-2016); Managing Director, Product Development (2010 to 2015), New York Life Investment Management LLC | |
| | Jack R. Benintende
1964 | Treasurer and Principal Financial and Accounting Officer, MainStay Funds (since 2007), MainStay Funds Trust (since 2009) | Managing Director, New York Life Investment Management LLC (since 2007); Treasurer and Principal Financial and Accounting Officer, MainStay CBRE Global Infrastructure Megatrends Fund (since 2021), MainStay MacKay DefinedTerm Municipal Opportunities Fund (since 2011) and MainStay VP Funds Trust (since 2007)** and Assistant Treasurer, New York Life Investment Management Holdings LLC (2008 to 2012) | |
| | J. Kevin Gao
1967 | Secretary and Chief Legal Officer, MainStay Funds and MainStay Funds Trust (since 2010) | Managing Director and Associate General Counsel, New York Life Investment Management LLC (since 2010); Secretary and Chief Legal Officer and MainStay CBRE Global Infrastructure Megatrends Fund (since 2021), MainStay MacKay DefinedTerm Municipal Opportunities Fund (since 2011) and MainStay VP Funds Trust (since 2010)** | |
| | Scott T. Harrington
1959 | Vice President— Administration, MainStay Funds (since 2009), MainStay Funds Trust (since 2009) | Managing Director, New York Life Investment Management LLC (including predecessor advisory organizations) (since 2000); Member of the Board of Directors, New York Life Trust Company (since 2009); Vice President—Administration, MainStay CBRE Global Infrastructure Megatrends Fund (since 2021), MainStay MacKay DefinedTerm Municipal Opportunities Fund (since 2011) and MainStay VP Funds Trust (since 2005)** | |
| | Kevin M. Gleason
1967 | Vice President and Chief Compliance Officer, MainStay Funds and MainStay Funds Trust (since June 2022) | Vice President and Chief Compliance Officer, IndexIQ, IndexIQ ETF Trust and Index IQ Active ETF Trust (since June 2022); Vice President and Chief Compliance Officer, MainStay CBRE Global Infrastructure Megatrends Fund, MainStay VP Funds Trust and MainStay MacKay DefinedTerm Municipal Opportunities Fund (since June 2022); Senior Vice President, Voya Investment Management and Chief Compliance Officer, Voya Family of Funds (2012-2022) | |
| * | The officers listed above are considered to be “interested persons” of the MainStay Group of Funds, MainStay VP Funds Trust, MainStay CBRE Global Infrastructure Megatrends Fund and MainStay MacKay DefinedTerm Municipal Opportunities Fund within the meaning of the 1940 Act because of their affiliation with the MainStay Group of Funds, New York Life Insurance Company and/or its affiliates, including New York Life Investment Management LLC, NYLIM Service Company LLC, NYLIFE Securities LLC and/or NYLIFE Distributors LLC, as described in detail in the column captioned “Principal Occupation(s) During Past Five Years.” Officers are elected annually by the Board. |
| ** | Includes prior service as an Officer of MainStay VP Series Fund, Inc., the predecessor to MainStay VP Funds Trust. |
Officers of the Trust (Who are not Trustees)*
| 70 | MainStay MacKay Tax Free Bond Fund |
Equity
U.S. Equity
MainStay Epoch U.S. Equity Yield Fund
MainStay S&P 500 Index Fund1
MainStay Winslow Large Cap Growth Fund
MainStay WMC Enduring Capital Fund
MainStay WMC Growth Fund
MainStay WMC Small Companies Fund
MainStay WMC Value Fund
International Equity
MainStay Epoch International Choice Fund
MainStay MacKay International Equity Fund
MainStay WMC International Research Equity Fund
Emerging Markets Equity
MainStay Candriam Emerging Markets Equity Fund
Global Equity
MainStay Epoch Capital Growth Fund
MainStay Epoch Global Equity Yield Fund
Fixed Income
Taxable Income
MainStay Candriam Emerging Markets Debt Fund
MainStay Floating Rate Fund
MainStay MacKay High Yield Corporate Bond Fund
MainStay MacKay Short Duration High Yield Fund
MainStay MacKay Strategic Bond Fund
MainStay MacKay Total Return Bond Fund
MainStay MacKay U.S. Infrastructure Bond Fund
MainStay Short Term Bond Fund
Tax-Exempt Income
MainStay MacKay California Tax Free Opportunities Fund2
MainStay MacKay High Yield Municipal Bond Fund
MainStay MacKay New York Tax Free Opportunities Fund3
MainStay MacKay Short Term Municipal Fund
MainStay MacKay Strategic Municipal Allocation Fund
MainStay MacKay Tax Free Bond Fund
Money Market
MainStay Money Market Fund
Mixed Asset
MainStay Balanced Fund
MainStay Income Builder Fund
MainStay MacKay Convertible Fund
Speciality
MainStay CBRE Global Infrastructure Fund
MainStay CBRE Real Estate Fund
MainStay Cushing MLP Premier Fund
Asset Allocation
MainStay Conservative Allocation Fund
MainStay Conservative ETF Allocation Fund
MainStay Defensive ETF Allocation Fund
MainStay Equity Allocation Fund
MainStay Equity ETF Allocation Fund
MainStay ESG Multi-Asset Allocation Fund
MainStay Growth Allocation Fund
MainStay Growth ETF Allocation Fund
MainStay Moderate Allocation Fund
MainStay Moderate ETF Allocation Fund
Manager
New York Life Investment Management LLC
New York, New York
Subadvisors
Candriam4
Strassen, Luxembourg
CBRE Investment Management Listed Real Assets LLC
Radnor, Pennsylvania
Cushing Asset Management, LP
Dallas, Texas
Epoch Investment Partners, Inc.
New York, New York
MacKay Shields LLC4
New York, New York
NYL Investors LLC4
New York, New York
Wellington Management Company LLP
Boston, Massachusetts
Winslow Capital Management, LLC
Minneapolis, Minnesota
Legal Counsel
Dechert LLP
Washington, District of Columbia
Independent Registered Public Accounting Firm
KPMG LLP
Philadelphia, Pennsylvania
Distributor
NYLIFE Distributors LLC4
Jersey City, New Jersey
Custodian
JPMorgan Chase Bank, N.A.
New York, New York
1.
Prior to February 28, 2022, the Fund's name was MainStay MacKay S&P 500 Index Fund.
| 2. | This Fund is registered for sale in AZ, CA, NV, OR, TX, UT, WA and MI (Class A and Class I shares only), and CO, FL, GA, HI, ID, MA, MD, NH, NJ and NY (Class I shares only). |
| 3. | This Fund is registered for sale in CA, CT, DE, FL, MA, NJ, NY and VT. |
| 4. | An affiliate of New York Life Investment Management LLC. |
Not part of the Annual Report
For more information
800-624-6782
newyorklifeinvestments.com
“New York Life Investments” is both a service mark, and the common trade name, of certain investment advisors affiliated with New York Life Insurance Company. The MainStay Funds® are managed by New York Life Investment Management LLC and distributed by NYLIFE Distributors LLC, 30 Hudson Street, Jersey City, NJ 07302, a wholly owned subsidiary of New York Life Insurance Company. NYLIFE Distributors LLC is a Member FINRA/SIPC.
©2022 NYLIFE Distributors LLC. All rights reserved.
| 5013754.2MS229-22 | MST11-12/22 |
(NYLIM) NL215
MainStay MacKay U.S. Infrastructure Bond Fund
Message from the President and Annual Report
October 31, 2022
Sign up for e-delivery of your shareholder reports. For full details on e-delivery, including who can participate and what you can receive via e-delivery,
please log in to newyorklifeinvestments.com/accounts.
| Not FDIC/NCUA Insured | Not a Deposit | May Lose Value | No Bank Guarantee | Not Insured by Any Government Agency |
This page intentionally left blank
Message from the President
A series of economic and geopolitical challenges undermined equity and fixed-income markets during the 12-month reporting period ended October 31, 2022. Stocks and bonds alike trended lower in the face of sharply rising interest rates, increasing inflationary pressures, slowing economic growth and Russia’s invasion of Ukraine.
The reporting period began on a mixed note, with concerns about the spreading Omicron variant of the COVID-19 virus and increasingly hawkish statements from the U.S. Federal Reserve (the “Fed”) regarding mounting inflation, countered by bullish sentiment stemming from U.S. economic growth and strong corporate earnings. In January 2022, markets turned decisively negative as comments from the Fed raised the likelihood of rate hikes as early as March, and Russia issued increasingly aggressive threats toward Ukraine. The onset of Russia’s invasion in February exacerbated global inflationary pressures while increasing investor uncertainty. Domestic supply shortages, international trade imbalances and rising inflation caused GDP (gross domestic product) to contract in the first and second quarters of the year, although employment and consumer spending proved resilient. Prices for petroleum surged to multi-year highs, while many key agricultural chemicals and industrial metals climbed as well. Accelerating inflationary forces prompted the Fed to implement its most aggressive interest rate increases since the 1980s with a series of five sharp rate hikes, raising the federal funds rate from a range of 0.00% to 0.25% in March to 3.00% to 3.25% in September, with additional rate hikes expected before the end of the year. International central banks generally followed suit, raising rates by varying degrees in efforts to curb local inflation, although most increases remained significantly more modest than those in the United States. Relatively high U.S. interest rates and risk-averse international sentiment pushed U.S. dollar values higher compared to most other currencies, with the ensuing negative impact on global prices for food, fuel and other key, U.S.-dollar-denominated products.
The effects of these interrelated challenges were felt throughout U.S. and international financial markets. The S&P 500® Index, a widely regarded benchmark of U.S. market performance, declined by more than 14% during the reporting period. Although the energy sector generated strong gains, bolstered by elevated oil and gas prices, most other industry areas recorded losses. The more cyclical and growth-oriented sectors of consumer discretionary, real estate and information technology delivered the
weakest returns, while the traditionally defensive and value-oriented consumer staples, utilities and health care sectors outperformed. International stocks lagged compared to their U.S. counterparts, with some emerging markets, such as China, suffering particularly steep losses. A few markets, however, including Brazil, Mexico and the United Arab Emirates, ended the reporting period with little change. Fixed-income markets saw bond prices broadly decline as yields rose along with interest rates. Short-term yields rose faster than long-term yields, producing a yield curve inversion from July through the end of the reporting period, with long-term rates remaining below short-term rates. While floating-rate instruments, which feature variable interest rates that allow investors to benefit from a rising rate environment, provided a degree of insulation from inflation-driven trends, they were not immune to the market’s widespread declines.
While the Fed acknowledges the costs of rising rates in terms of weaker GDP growth and unsettled financial markets over the short term, its primary focus continues to be the longer-term economic impact of inflation. With the latest figures as of the date of this report showing that inflation remains above 8%, versus a target rate of just 2%, the Fed clearly has a distance yet to go, making further rate increases and market volatility more likely in the coming months. The question remains as to whether the Fed and other central banks will manage a so-called “soft landing,” curbing inflation while avoiding a persistent economic slowdown. If they prove successful, we expect that favorable inflation trends and increasingly attractive valuations in both equity and bond markets should eventually translate into sustainable improvements in the investment environment.
Whatever actions the Fed takes and however financial markets react, as a MainStay investor, you can depend on us to continue providing the insight, expertise and service that have long defined New York Life Investments. Thank you for trusting us to help you meet your investment needs.
Sincerely,
Kirk C. Lehneis
President
The opinions expressed are as of the date of this report and are subject to change. There is no guarantee that any forecast made will come to pass. This material does not constitute investment advice and is not intended as an endorsement of any specific investment. Past performance is no guarantee of future results.
Not part of the Annual Report
Investors should refer to the Fund’s Summary Prospectus and/or Prospectus and consider the Fund’s investment objectives, strategies, risks, charges and expenses carefully before investing. The Summary Prospectus and/or Prospectus contain this and other information about the Fund. You may obtain copies of the Fund’s Summary Prospectus, Prospectus and Statement of Additional Information, which includes information about The MainStay Funds' Trustees, free of charge, upon request, by calling toll-free 800-624-6782, by writing to NYLIFE Distributors LLC, Attn: MainStay Marketing Department, 30 Hudson Street, Jersey City, NJ 07302 or by sending an e-mail to MainStayShareholderServices@nylim.com. These documents are also available via the MainStay Funds’ website at newyorklifeinvestments.com. Please read the Fund’s Summary Prospectus and/or Prospectus carefully before investing.
Investment and Performance Comparison (Unaudited)
Performance data quoted represents past performance. Past performance is no guarantee of future results. Because of market volatility and other factors, current performance may be lower or higher than the figures shown. Investment return and principal value will fluctuate, and as a result, when shares are redeemed, they may be worth more or less than their original cost. The graph below depicts the historical performance of Class I shares of the Fund. Performance will vary from class to class based on differences in class-specific expenses and sales charges. For performance information current to the most recent month-end, please call 800-624-6782 or visit newyorklifeinvestments.com.
The performance table and graph do not reflect the deduction of taxes that a shareholder would pay on distributions or Fund share redemptions. Total returns reflect maximum applicable sales charges as indicated in the table below, if any, changes in share price, and reinvestment of dividend and capital gain distributions. The graph assumes the initial investment amount shown below and reflects the deduction of all sales charges that would have applied for the period of investment. Performance figures may reflect certain fee waivers and/or expense limitations, without which total returns may have been lower. For more information on share classes and current fee waivers and/or expense limitations (if any), please refer to the Notes to Financial Statements.
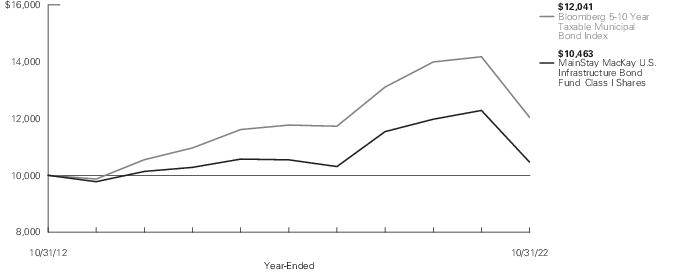
| Average Annual Total Returns for the Year-Ended October 31, 2022 |
| Class | Sales Charge | | Inception
Date1 | One
Year | Five
Years | Ten Years
or Since
Inception | Gross
Expense
Ratio2 |
| Class A Shares3 | Maximum 3% Initial Sales Charge | With sales charges | 1/3/1995 | -18.81% | -1.30% | -0.26% | 0.96% |
| | | Excluding sales charges | | -14.98 | -0.39 | 0.20 | 0.96 |
| Investor Class Shares4 | Maximum 2.5% Initial Sales Charge | With sales charges | 2/28/2008 | -18.54 | -1.57 | -0.52 | 1.33 |
| | | Excluding sales charges | | -15.14 | -0.66 | -0.06 | 1.33 |
| Class B Shares5 | Maximum 5% CDSC | With sales charges | 5/1/1986 | -19.96 | -1.80 | -0.82 | 2.08 |
| | if Redeemed Within the First Six Years of Purchase | Excluding sales charges | | -15.84 | -1.43 | -0.82 | 2.08 |
| Class C Shares | Maximum 1% CDSC | With sales charges | 9/1/1998 | -16.66 | -1.41 | -0.81 | 2.08 |
| | if Redeemed Within One Year of Purchase | Excluding sales charges | | -15.84 | -1.41 | -0.81 | 2.08 |
| Class I Shares | No Sales Charge | | 1/2/2004 | -14.83 | -0.16 | 0.45 | 0.71 |
| Class R6 Shares | No Sales Charge | | 11/1/2019 | -14.66 | N/A | -3.10 | 0.56 |
| 1. | Effective February 28, 2019 and June 21, 2019, the Fund modified its principal investment strategies. The past performance in the bar chart and table prior to those dates reflects the Fund’s prior principal investment strategies. |
| 2. | The gross expense ratios presented reflect the Fund’s “Total Annual Fund Operating Expenses” from the most recent Prospectus, as supplemented, and may differ from other expense ratios disclosed in this report. |
| 3. | Prior to August 10, 2022, the maximum initial sales charge was 4.5%, which is reflected in the applicable average annual total return figures shown. |
| 4. | Prior to August 10, 2022, the maximum initial sales charge was 4%, which is reflected in the applicable average annual total return figures shown. |
| 5. | Class B shares are closed to all new purchases as well as additional investments by existing Class B shareholders. |
The footnotes on the next page are an integral part of the table and graph and should be carefully read in conjunction with them.
| Benchmark Performance* | One
Year | Five
Years | Ten
Years |
| Bloomberg 5-10 Year Taxable Municipal Bond Index1 | -15.05% | 0.46% | 1.88% |
| Morningstar Intermediate Core Bond Category Average2 | -15.94 | -0.78 | 0.64 |
| * | Returns for indices reflect no deductions for fees, expenses or taxes, except for foreign withholding taxes where applicable. Results assume reinvestment of all dividends and capital gains. An investment cannot be made directly in an index. |
| 1. | The Fund has selected the Bloomberg 5-10 Year Taxable Municipal Bond Index as its primary benchmark. The Bloomberg 5-10 Year Taxable Municipal Bond Index is the 5-10 year component of the Bloomberg Taxable Municipal Bond Index. |
| 2. | The Morningstar Intermediate Core Bond Category Average is representative of funds that invest primarily in investment-grade U.S. fixed-income issues including government, corporate, and securitized debt, and hold less than 5% in below-investment-grade exposures. Their durations (a measure of interest-rate sensitivity) typically range between 75% and 125% of the three-year average of the effective duration of the Morningstar Core Bond Index. Results are based on average total returns of similar funds with all dividends and capital gain distributions reinvested. |
The footnotes on the preceding page are an integral part of the table and graph and should be carefully read in conjunction with them.
| 6 | MainStay MacKay U.S. Infrastructure Bond Fund |
Cost in Dollars of a $1,000 Investment in MainStay MacKay U.S. Infrastructure Bond Fund (Unaudited)
The example below is intended to describe the fees and expenses borne by shareholders during the six-month period from May 1, 2022 to October 31, 2022, and the impact of those costs on your investment.
Example
As a shareholder of the Fund you incur two types of costs: (1) transaction costs, including exchange fees and sales charges (loads) on purchases (as applicable), and (2) ongoing costs, including management fees, distribution and/or service (12b-1) fees and other Fund expenses (as applicable). This example is intended to help you understand your ongoing costs (in dollars) of investing in the Fund and to compare these costs with the ongoing costs of investing in other mutual funds. The example is based on an investment of $1,000 made at the beginning of the six-month period and held for the entire period from May 1, 2022 to October 31, 2022.
This example illustrates your Fund’s ongoing costs in two ways:
Actual Expenses
The second and third data columns in the table below provide information about actual account values and actual expenses. You may use the information in these columns, together with the amount you invested, to estimate the expenses that you paid during the six months ended October 31, 2022. Simply divide your account value by $1,000 (for example, an
$8,600 account value divided by $1,000 = 8.6), then multiply the result by the number under the heading entitled “Expenses Paid During Period” to estimate the expenses you paid on your account during this period.
Hypothetical Example for Comparison Purposes
The fourth and fifth data columns in the table below provide information about hypothetical account values and hypothetical expenses based on the Fund’s actual expense ratio and an assumed rate of return of 5% per year before expenses, which is not the Fund’s actual return. The hypothetical account values and expenses may not be used to estimate the actual ending account balances or expenses you paid for the six-month period shown. You may use this information to compare the ongoing costs of investing in the Fund with the ongoing costs of investing in other mutual funds. To do so, compare this 5% hypothetical example with the 5% hypothetical examples that appear in the shareholder reports of the other mutual funds.
Please note that the expenses shown in the table are meant to highlight your ongoing costs only and do not reflect any transactional costs, such as exchange fees or sales charges (loads). Therefore, the fourth and fifth data columns of the table are useful in comparing ongoing costs only and will not help you determine the relative total costs of owning different funds. In addition, if these transactional costs were included, your costs would have been higher.
| Share Class | Beginning
Account
Value
5/1/22 | Ending Account
Value (Based
on Actual
Returns and
Expenses)
10/31/22 | Expenses
Paid
During
Period1 | Ending Account
Value (Based
on Hypothetical
5% Annualized
Return and
Actual Expenses)
10/31/22 | Expenses
Paid
During
Period1 | Net Expense
Ratio
During
Period2 |
| Class A Shares | $1,000.00 | $930.80 | $4.14 | $1,020.92 | $4.33 | 0.85% |
| Investor Class Shares | $1,000.00 | $930.10 | $5.16 | $1,019.86 | $5.40 | 1.06% |
| Class B Shares | $1,000.00 | $926.40 | $8.64 | $1,016.23 | $9.05 | 1.78% |
| Class C Shares | $1,000.00 | $926.40 | $8.89 | $1,015.98 | $9.30 | 1.83% |
| Class I Shares | $1,000.00 | $931.50 | $2.92 | $1,022.18 | $3.06 | 0.60% |
| Class R6 Shares | $1,000.00 | $931.90 | $2.58 | $1,022.53 | $2.70 | 0.53% |
| 1. | Expenses are equal to the Fund’s annualized expense ratio of each class multiplied by the average account value over the period, divided by 365 and multiplied by 184 (to reflect the six-month period). The table above represents the actual expenses incurred during the six-month period. In addition to the fees and expenses which the Fund bears directly, it also indirectly bears a pro rata share of the fees and expenses of the underlying funds in which it invests. Such indirect expenses are not included in the above-reported expense figures. |
| 2. | Expenses are equal to the Fund's annualized expense ratio to reflect the six-month period. |
Portfolio Composition as of October 31, 2022 (Unaudited)
See Portfolio of Investments beginning on page 11 for specific holdings within these categories. The Fund's holdings are subject to change.
Top Ten Holdings and/or Issuers Held as of October 31, 2022 (excluding short-term investments) (Unaudited)
| 1. | Texas Transportation Commission State Highway Fund, 5.178%, due 4/1/30 |
| 2. | Commonwealth of Massachusetts, 1.52%-4.91%, due 5/1/29–11/1/30 |
| 3. | State of Rhode Island, 4.79%-4.90%, due 8/1/31–8/1/32 |
| 4. | State of Connecticut, 2.677%-5.85%, due 9/15/27–3/15/32 |
| 5. | State of California, 3.00%-4.50%, due 4/1/29–4/1/33 |
| 6. | City of Chicago IL, 5.00%-7.781%, due 1/1/33–1/1/35 |
| 7. | State of New Jersey, 2.30%-2.90%, due 6/1/27–6/1/33 |
| 8. | Port of Oakland, 1.949%-2.199%, due 5/1/28–5/1/31 |
| 9. | State of New York, 1.74%, due 3/15/29 |
| 10. | California Community Choice Financing Authority, 4.00%, due 2/1/52 |
| 8 | MainStay MacKay U.S. Infrastructure Bond Fund |
Portfolio Management Discussion and Analysis (Unaudited)
Questions answered by portfolio managers John Loffredo, CFA, Robert DiMella, CFA, Michael Petty, David Dowden, Scott Sprauer, Frances Lewis, Robert Burke, CFA, John Lawlor and Michael Denlinger, CFA, of MacKay Shields LLC, the Fund’s Subadvisor.
How did MainStay MacKay U.S. Infrastructure Bond Fund perform relative to its benchmarks and peer group during the 12 months ended October 31, 2022?
For the 12 months ended October 31, 2022, Class I shares of MainStay MacKay U.S. Infrastructure Bond Fund returned −14.83%, outperforming the −15.05% return of the Fund’s benchmark, the Bloomberg 5–10 Year Taxable Municipal Bond Index (the “Index”). Over the same period, Class I shares also outperformed the −15.94% return of the Morningstar Intermediate Core Bond Category Average.1
What factors affected the Fund’s relative performance during the reporting period?
During the reporting period, the Fund outperformed the Index due, in part, to security selection and allocation. The Fund’s underweight exposure to New York bonds made a positive contribution to relative performance, as New York has been slow to rebound from pre-Covid levels. (Contributions take weightings and total returns into account.) From a rating perspective, underweight exposure to bonds rated AAA and AA added to relative returns; however, this positive effect was partially offset by the negative effect of the Fund’s overweight exposure to bonds rated A and BBB.2
The Fund’s yield curve3 positioning also enhanced relative performance. During the reporting period, both municipal and U.S. Treasury rates rose, with the municipal yield curve flattening in sympathy with the Treasury curve as outflows persisted. The increase in rates resulted in the Fund’s overweight exposure to bonds maturing in 15+ years, detracting from relative performance. Additionally, the Fund’s overweight exposure to bonds with coupons of 2% detracted from the return. Furthermore, overweight exposure to holdings from the state of Illinois detracted from performance, as their highly liquid nature moved prices further.
During the reporting period, were there any market events that materially impacted the Fund’s performance or liquidity?
During the reporting period, markets extended their historic drawdown driven by the combination of rising U.S. Treasury yields, ongoing monetary policy tightening and geopolitical uncertainty. The municipal market mirrored this broader sell-off, and many investors reacted by withdrawing money from their municipal holdings. The municipal market experienced record tax-exempt outflows, which ultimately drove municipal rates higher.
What was the Fund’s duration strategy during the reporting period?
We do not make interest rate forecasts or duration bets. Rather, we aim to adopt a duration-neutral posture in the Fund relative to the Index. As of October 31, 2022, the modified duration to worst5 for the Fund was 5.95 years compared to 6.04 years for the Index.
During the reporting period, which sectors were the strongest positive contributors to the Fund’s relative performance and which sectors were particularly weak?
During the reporting period, the Fund’s underweight exposure to the state and local general obligation and education sectors made positive contributions to the Fund’s returns relative to the Index. Conversely, the Fund held overweight exposure to the hospital and transportation sectors, which weakened relative returns.
What were some of the Fund’s largest purchases and sales during the reporting period?
As the Fund remains focused on diversification and liquidity, no individual purchase or sale was considered significant, although sector overweights or security structure, in their entirety, did have an impact.
| 1. | See page 5 for other share class returns, which may be higher or lower than Class I share returns. See page 6 for more information on benchmark and peer group returns. |
| 2. | An obligation rated ‘AAA’ has the highest rating assigned by Standard & Poor’s (“S&P”), and in the opinion of S&P, the obligor’s capacity to meet its financial commitment on the obligation is extremely strong. An obligation rated ‘AA’ by S&P is deemed by S&P to differ from the highest-rated obligations only to a small degree. In the opinion of S&P, the obligor's capacity to meet its financial commitment on the obligation is very strong. An obligation rated ‘A’ by S&P is deemed by S&P to be somewhat more susceptible to the adverse effects of changes in circumstances and economic conditions than obligations in higher-rated categories. In the opinion of S&P, however, the obligor's capacity to meet its financial commitment on the obligation is still strong. An obligation rated ‘BBB’ by S&P is deemed by S&P to exhibit adequate protection parameters. In the opinion of S&P, however, adverse economic conditions or changing circumstances are more likely to lead to a weakened capacity of the obligor to meet its financial commitment on the obligation. When applied to Fund holdings, ratings are based solely on the creditworthiness of the bonds in the portfolio and are not meant to represent the security or safety of the Fund. |
| 3. | The yield curve is a line that plots the yields of various securities of similar quality—typically U.S. Treasury issues—across a range of maturities. The U.S. Treasury yield curve serves as a benchmark for other debt and is used in economic forecasting. |
| 5. | Modified duration is inversely related to the approximate percentage change in price for a given change in yield. Duration to worst is the duration of a bond computed using the bond’s nearest call date or maturity, whichever comes first. This measure ignores future cash flow fluctuations due to embedded optionality. |
How did the Fund’s sector weighting change during the reporting period?
During the reporting period, there were no material changes to the weightings in the Fund. There were small increases to the Fund’s IDR/PCR (industry development revenue/pollution control revenue) and special tax exposures, and a large increase in State GO exposures. In addition, there was an increase of higher-quality credit exposure to AAA-rated bonds, as well as an increase to bonds from the state of Illinois. Conversely, there was a decrease in the Fund’s exposure to the leasing, electric and education sectors, as well as a decrease in AA-rated bonds.
How was the Fund positioned at the end of the reporting period?
As of October 31, 2022, the Fund maintained overweight exposure to the long end of the curve. We believe there are more compelling opportunities on the longer end of the curve, which are likely to contribute to outperformance over time. From a geographic perspective, the Fund held overweight exposure to bonds from Illinois. From a credit perspective, the Fund held overweight exposure to BBB-rated bonds. At the same time, the Fund held underweight positions in the local general obligation and leasing sectors, as well underweight positions in AA-rated credits and bonds from the state of Texas.
The opinions expressed are those of the portfolio managers as of the date of this report and are subject to change. There is no guarantee that any forecasts will come to pass. This material does not constitute investment advice and is not intended as an endorsement of any specific investment.
| 10 | MainStay MacKay U.S. Infrastructure Bond Fund |
Portfolio of Investments October 31, 2022†
| | Principal
Amount | Value |
| Long-Term Bonds 94.9% |
| Corporate Bonds 2.3% |
| Commercial Services 0.4% |
| Howard University | | |
| Series 2020, Insured: AGM | | |
| 2.516%, due 10/1/25 | $ 1,230,000 | $ 1,129,205 |
| Southern New Hampshire University | | |
| 1.95%, due 1/1/25 | 1,000,000 | 922,894 |
| | | 2,052,099 |
| Healthcare-Services 1.9% |
| CommonSpirit Health | | |
| 6.073%, due 11/1/27 | 4,750,000 | 4,757,787 |
| Rogers Memorial Hospital, Inc. | | |
| Series 2019 | | |
| 3.792%, due 7/1/39 | 2,480,000 | 1,827,343 |
| Southeast Alaska Regional Health Consortium | | |
| 2.262%, due 7/1/31 | 3,000,000 | 2,316,708 |
| Sun Health Services | | |
| Series 19B | | |
| 2.98%, due 11/15/27 | 925,000 | 858,074 |
| | | 9,759,912 |
Total Corporate Bonds
(Cost $13,305,233) | | 11,812,011 |
| Municipal Bonds 92.5% |
| Alabama 0.3% |
Alabama Federal Aid Highway Finance Authority
Revenue Bonds | | |
| Series B | | |
| 1.856%, due 9/1/29 | 2,160,000 | 1,750,129 |
| Alaska 0.8% |
Alaska Municipal Bond Bank Authority
Revenue Bonds | | |
| Series 2 | | |
| 2.022%, due 12/1/30 | 5,045,000 | 4,039,578 |
| Arizona 0.5% |
Arizona Industrial Development Authority, Voyager Foundation Inc., Project
Revenue Bonds | | |
| Series 2020 | | |
| 3.65%, due 10/1/29 | 1,115,000 | 969,986 |
| | Principal
Amount | Value |
| |
| Arizona (continued) |
Arizona Industrial Development Authority, Voyager Foundation Inc., Project
Revenue Bonds (continued) | | |
| Series 2020 | | |
| 3.90%, due 10/1/34 | $ 1,900,000 | $ 1,532,485 |
| | | 2,502,471 |
| California 19.3% |
California Community Choice Financing Authority, Clean Energy Project, Green Bond
Revenue Bonds | | |
| Series B-1 | | |
| 4.00%, due 2/1/52 (a) | 10,000,000 | 9,335,490 |
California Educational Facilities Authority, Chapman University
Revenue Bonds | | |
| Series A | | |
| 3.661%, due 4/1/33 | 3,300,000 | 2,803,536 |
California Infrastructure and Economic Development Bank, J. David Gladstone Institutes (The)
Revenue Bonds | | |
| 3.20%, due 10/1/29 | 1,785,000 | 1,571,262 |
California Municipal Finance Authority, Harvey Mudd College
Revenue Bonds | | |
| 2.262%, due 12/1/30 | 1,520,000 | 1,226,023 |
California State University
Revenue Bonds | | |
| Series D | | |
| 1.69%, due 11/1/29 | 1,110,000 | 872,340 |
California Statewide Communities Development Authority, Front Porch Communities & Services
Revenue Bonds | | |
| Series B | | |
| 2.14%, due 4/1/30 | 5,395,000 | 4,291,379 |
| Series B | | |
| 2.34%, due 4/1/32 | 1,975,000 | 1,502,616 |
| Series B | | |
| 2.51%, due 4/1/34 | 2,500,000 | 1,830,344 |
Central Basin Municipal Water District
Revenue Bonds | | |
| Series B, Insured: BAM | | |
| 3.56%, due 8/1/33 | 1,345,000 | 1,086,235 |
The notes to the financial statements are an integral part of, and should be read in conjunction with, the financial statements.
11
Portfolio of Investments October 31, 2022† (continued)
| | Principal
Amount | Value |
| Municipal Bonds (continued) |
| California (continued) |
Chabot-Las Positas Community College District
Unlimited General Obligation | | |
| 1.287%, due 8/1/27 | $ 1,415,000 | $ 1,198,863 |
City & County of San Francisco CA
Unlimited General Obligation | | |
| Series D | | |
| 3.75%, due 6/15/31 | 2,815,000 | 2,595,799 |
City of San Buenaventura CA, Water
Revenue Bonds | | |
| 2.727%, due 1/1/40 | 2,000,000 | 1,364,649 |
East Bay Municipal Utility District, Wastewater System
Revenue Bonds | | |
| Series B | | |
| 5.026%, due 6/1/32 | 2,000,000 | 1,983,956 |
Foothill-De Anza Community College District, Election of 2006
Unlimited General Obligation | | |
| Series E | | |
| 2.896%, due 8/1/31 | 1,025,000 | 854,770 |
Foothill-Eastern Transportation Corridor Agency
Revenue Bonds, Senior Lien | | |
| Series B, Insured: AGM | | |
| 2.191%, due 1/15/32 | 1,000,000 | 753,373 |
Golden State Tobacco Securitization Corp., Tobacco Settlement
Revenue Bonds | | |
| Series B, Insured: State Appropriations | | |
| 1.60%, due 6/1/26 | 2,100,000 | 1,854,484 |
| Series B, Insured: State Appropriations | | |
| 2.086%, due 6/1/28 | 4,450,000 | 3,719,993 |
Los Angeles Community College District
Unlimited General Obligation | | |
| 1.606%, due 8/1/28 | 4,795,000 | 4,051,087 |
| 2.106%, due 8/1/32 | 3,000,000 | 2,316,386 |
Marin Community College District, Election of 2016
Unlimited General Obligation | | |
| Series A-1 | | |
| 3.272%, due 8/1/27 | 1,425,000 | 1,329,150 |
| | Principal
Amount | Value |
| |
| California (continued) |
Oxnard Financing Authority
Revenue Bonds | | |
| Series B | | |
| 6.819%, due 6/1/30 | $ 7,500,000 | $ 7,913,504 |
Port of Oakland
Revenue Bonds, Senior Lien | | |
| Series R | | |
| 1.949%, due 5/1/28 | 6,260,000 | 5,189,181 |
| Series R | | |
| 2.049%, due 5/1/29 | 2,185,000 | 1,750,651 |
| Series R | | |
| 2.099%, due 5/1/30 | 1,005,000 | 780,966 |
| Series R | | |
| 2.199%, due 5/1/31 | 2,250,000 | 1,704,684 |
San Diego Community College District
Unlimited General Obligation | | |
| 1.633%, due 8/1/27 | 2,290,000 | 1,976,894 |
| 2.113%, due 8/1/31 | 3,000,000 | 2,355,302 |
San Francisco City & County Public Utilities Commission, Wastewater
Revenue Bonds | | |
| Series B | | |
| 5.60%, due 10/1/30 | 6,620,000 | 6,827,258 |
San Jose Evergreen Community College District
Unlimited General Obligation | | |
| 1.676%, due 9/1/28 | 1,355,000 | 1,142,392 |
San Jose Unified School District
Unlimited General Obligation | | |
| 1.847%, due 8/1/33 | 1,685,000 | 1,212,277 |
San Luis Unit, Westlands Water District Financing Authority
Revenue Bonds | | |
| Series A, Insured: AGM | | |
| 2.412%, due 9/1/29 | 1,150,000 | 959,891 |
Santa Monica Community College District, Election 2016
Unlimited General Obligation | | |
| Series B-1 | | |
| 3.697%, due 8/1/29 | 1,960,000 | 1,835,139 |
Santa Monica-Malibu Unified School District
Unlimited General Obligation | | |
| .989%, due 7/1/26 | 1,100,000 | 959,197 |
| 1.51%, due 7/1/30 | 1,260,000 | 973,730 |
The notes to the financial statements are an integral part of, and should be read in conjunction with, the financial statements.
| 12 | MainStay MacKay U.S. Infrastructure Bond Fund |
| | Principal
Amount | Value |
| Municipal Bonds (continued) |
| California (continued) |
Silicon Valley Clean Water
Revenue Bonds | | |
| Series A | | |
| 1.932%, due 8/1/30 | $ 1,000,000 | $ 789,904 |
State of California, Various Purpose
Unlimited General Obligation | | |
| 3.00%, due 11/1/30 | 1,000,000 | 855,183 |
| 3.00%, due 11/1/31 | 5,500,000 | 4,616,973 |
| 3.05%, due 4/1/29 | 2,000,000 | 1,767,718 |
| 4.50%, due 4/1/33 | 3,000,000 | 2,837,322 |
State of California Department of Water Resources, Central Valley Project
Revenue Bonds | | |
| Series BC | | |
| 1.16%, due 12/1/27 | 1,020,000 | 846,345 |
University of California
Revenue Bonds | | |
| Series BI | | |
| 1.997%, due 5/15/31 | 1,195,000 | 926,814 |
| Series AW | | |
| 3.65%, due 5/15/33 | 2,250,000 | 1,940,812 |
Yosemite Community College District
Unlimited General Obligation | | |
| 2.35%, due 8/1/29 | 1,000,000 | 848,068 |
| | | 97,551,940 |
| Colorado 1.8% |
City & County of Denver CO, Airport System
Revenue Bonds | | |
| Series C | | |
| 2.237%, due 11/15/30 | 1,065,000 | 840,606 |
Colorado Bridge Enterprise, Central 70 Project
Revenue Bonds | | |
| Series A | | |
| 2.543%, due 12/31/32 | 5,670,000 | 4,798,747 |
Colorado Housing and Finance Authority
Revenue Bonds | | |
| Series G-1, Insured: GNMA | | |
| 3.65%, due 11/1/46 | 730,000 | 696,343 |
Denver City & County School District No. 1
Certificate of Participation | | |
| Series B | | |
| 4.242%, due 12/15/37 | 600,000 | 532,442 |
| | Principal
Amount | Value |
| |
| Colorado (continued) |
Metro Wastewater Reclamation District
Revenue Bonds | | |
| Series B | | |
| 5.775%, due 4/1/29 | $ 2,170,000 | $ 2,241,050 |
| | | 9,109,188 |
| Connecticut 2.6% |
State of Connecticut
Unlimited General Obligation | | |
| Series A | | |
| 2.677%, due 7/1/30 | 3,805,000 | 3,148,279 |
| Series A | | |
| 3.85%, due 9/15/27 | 3,250,000 | 3,080,218 |
| Series A | | |
| 3.975%, due 6/15/29 | 1,000,000 | 922,752 |
| Series A | | |
| 5.85%, due 3/15/32 | 3,935,000 | 4,079,590 |
Town of Hamden CT
Unlimited General Obligation | | |
| Series B, Insured: BAM | | |
| 2.80%, due 8/1/31 | 2,500,000 | 2,026,335 |
| | | 13,257,174 |
| District of Columbia 0.3% |
District of Columbia
Revenue Bonds | | |
| Series B | | |
| 3.759%, due 7/1/29 | 1,870,000 | 1,754,366 |
| Florida 3.1% |
City of Miami FL, Street & Sidewalk Improvement Program
Revenue Bonds | | |
| Series B, Insured: AGM | | |
| 4.592%, due 1/1/33 (b) | 1,115,000 | 1,044,930 |
County of Broward FL, Convention Center Hotel
Revenue Bonds, First Tier | | |
| 4.00%, due 1/1/41 | 2,150,000 | 1,989,231 |
County of Miami-Dade FL, Aviation
Revenue Bonds | | |
| Series E | | |
| 2.599%, due 10/1/31 | 1,025,000 | 819,167 |
| Series B | | |
| 3.135%, due 10/1/27 | 1,835,000 | 1,665,085 |
| Series B | | |
| 3.406%, due 10/1/32 | 1,500,000 | 1,261,318 |
The notes to the financial statements are an integral part of, and should be read in conjunction with, the financial statements.
13
Portfolio of Investments October 31, 2022† (continued)
| | Principal
Amount | Value |
| Municipal Bonds (continued) |
| Florida (continued) |
County of Miami-Dade FL, Aviation
Revenue Bonds (continued) | | |
| Series C | | |
| 4.062%, due 10/1/31 | $ 5,000,000 | $ 4,506,399 |
Florida Development Finance Corp., UF Health Jacksonville Project
Revenue Bonds | | |
| Series B, Insured: AGM | | |
| 3.223%, due 2/1/32 | 5,500,000 | 4,433,620 |
| | | 15,719,750 |
| Georgia 0.5% |
City of Atlanta GA, Water & Wastewater
Revenue Bonds | | |
| 2.257%, due 11/1/35 | 3,310,000 | 2,453,617 |
| Guam 2.1% |
Antonio B Won Pat International Airport Authority
Revenue Bonds | | |
| Series A | | |
| 2.499%, due 10/1/25 | 1,180,000 | 1,078,820 |
| Series A | | |
| 2.699%, due 10/1/26 | 610,000 | 543,287 |
| Series A | | |
| 2.899%, due 10/1/27 | 825,000 | 719,739 |
| Series A | | |
| 3.099%, due 10/1/28 | 765,000 | 656,234 |
Guam Government Waterworks Authority
Revenue Bonds | | |
| Series B | | |
| 2.75%, due 7/1/30 | 6,500,000 | 5,334,133 |
| Series B | | |
| 3.25%, due 7/1/34 | 2,000,000 | 1,574,731 |
Port Authority of Guam
Revenue Bonds | | |
| Series C | | |
| 4.532%, due 7/1/27 | 500,000 | 473,917 |
| | | 10,380,861 |
| Hawaii 2.1% |
City & County Honolulu HI
Unlimited General Obligation | | |
| Series D | | |
| 3.068%, due 10/1/30 | 1,980,000 | 1,722,606 |
| | Principal
Amount | Value |
| |
| Hawaii (continued) |
City & County Honolulu HI
Unlimited General Obligation
(continued) | | |
| Series A | | |
| 5.668%, due 12/1/30 | $ 1,000,000 | $ 1,037,402 |
State of Hawaii
Unlimited General Obligation | | |
| Series FZ | | |
| 1.595%, due 8/1/31 | 10,825,000 | 8,095,956 |
| | | 10,855,964 |
| Idaho 0.3% |
Idaho Housing & Finance Association, Gem Prep: Meridian Project
Revenue Bonds | | |
| Series A, Insured: School Bond Guaranty | | |
| 4.00%, due 5/1/42 | 1,820,000 | 1,510,339 |
| Illinois 9.2% |
Chicago O'Hare International Airport, General
Revenue Bonds, Senior Lien | | |
| Series D | | |
| 2.316%, due 1/1/29 | 3,790,000 | 3,201,780 |
| Series D | | |
| 2.346%, due 1/1/30 | 4,960,000 | 4,082,652 |
City of Chicago Heights IL
Unlimited General Obligation | | |
| Series A, Insured: BAM | | |
| 7.25%, due 12/1/34 | 3,815,000 | 4,235,827 |
City of Chicago IL
Unlimited General Obligation | | |
| Series A | | |
| 5.00%, due 1/1/33 | 6,340,000 | 6,078,212 |
| Series B, Insured: AGM-CR | | |
| 7.375%, due 1/1/33 | 1,200,000 | 1,285,223 |
City of Chicago IL, Taxable Project
Unlimited General Obligation | | |
| Series C-1, Insured: BAM | | |
| 7.781%, due 1/1/35 | 2,195,000 | 2,439,012 |
County of Cook IL
Unlimited General Obligation | | |
| Series C | | |
| 5.79%, due 11/15/29 | 1,290,000 | 1,301,145 |
County of Cook IL, Build America Bonds
Unlimited General Obligation | | |
| 6.229%, due 11/15/34 | 1,000,000 | 1,034,762 |
The notes to the financial statements are an integral part of, and should be read in conjunction with, the financial statements.
| 14 | MainStay MacKay U.S. Infrastructure Bond Fund |
| | Principal
Amount | Value |
| Municipal Bonds (continued) |
| Illinois (continued) |
County of Cook IL, Build America Bonds
Unlimited General Obligation
(continued) | | |
| Insured: AGM-CR | | |
| 6.229%, due 11/15/34 | $ 1,725,000 | $ 1,793,456 |
| Series B | | |
| 6.36%, due 11/15/33 | 1,500,000 | 1,560,969 |
Sales Tax Securitization Corp.
Revenue Bonds | | |
| Series C | | |
| 3.23%, due 1/1/28 | 2,160,000 | 1,932,248 |
| 3.372%, due 1/1/31 | 2,300,000 | 1,952,391 |
| Series B | | |
| 3.422%, due 1/1/32 | 3,000,000 | 2,508,125 |
Sangamon County Water Reclamation District, Alternative Revenue Source
Unlimited General Obligation | | |
| Series B | | |
| 2.907%, due 1/1/34 | 1,885,000 | 1,452,243 |
State of Illinois, Sales Tax
Revenue Bonds, Junior Lien | | |
| Series B | | |
| 2.159%, due 6/15/29 | 2,500,000 | 1,966,769 |
| Series B | | |
| 2.509%, due 6/15/32 | 1,000,000 | 731,006 |
State of Illinois, Sales Tax
Revenue Bonds | | |
| 3.45%, due 6/15/29 | 3,170,000 | 2,713,786 |
State of Illinois
Unlimited General Obligation | | |
| Insured: AGM-CR | | |
| 5.10%, due 6/1/33 | 3,000,000 | 2,821,054 |
State of Illinois, Build America Bonds
Unlimited General Obligation | | |
| Series 3, Insured: AGM-CR | | |
| 6.725%, due 4/1/35 | 1,510,000 | 1,567,921 |
| Series 5 | | |
| 7.35%, due 7/1/35 | 1,782,857 | 1,827,518 |
| | | 46,486,099 |
| Indiana 1.1% |
Indianapolis Local Public Improvement Bond Bank
Revenue Bonds | | |
| Series A-2 | | |
| 5.854%, due 1/15/30 | 5,300,000 | 5,401,819 |
| | Principal
Amount | Value |
| |
| Kentucky 1.0% |
Kenton County Airport Board, Customer Facility Charge
Revenue Bonds | | |
| 4.489%, due 1/1/39 | $ 3,800,000 | $ 3,238,354 |
Kentucky Economic Development Finance Authority, Louisville Arena Project
Revenue Bonds | | |
| Series B, Insured: AGM | | |
| 4.435%, due 12/1/38 | 2,000,000 | 1,599,360 |
| | | 4,837,714 |
| Maryland 2.1% |
Maryland Community Development Administration, Department of Housing & Community Development
Revenue Bonds | | |
| Series D | | |
| 2.644%, due 3/1/50 | 1,120,000 | 1,033,854 |
Maryland Economic Development Corp., Purple Line Light Project, Green Bond (c)
Revenue Bonds | | |
| Series B | | |
| 5.00%, due 6/30/41 | 2,500,000 | 2,433,974 |
| Series B | | |
| 5.00%, due 12/31/41 | 2,500,000 | 2,432,930 |
Maryland Stadium Authority, Baltimore City Public School Construction
Revenue Bonds | | |
| Series C, Insured: State Intercept | | |
| 1.907%, due 5/1/28 | 1,770,000 | 1,505,227 |
Maryland State Transportation Authority
Revenue Bonds | | |
| Series B | | |
| 5.604%, due 7/1/30 | 3,000,000 | 3,066,084 |
| | | 10,472,069 |
| Massachusetts 4.5% |
Commonwealth of Massachusetts
Limited General Obligation | | |
| Series E | | |
| 1.52%, due 11/1/30 | 2,000,000 | 1,535,700 |
| Series A | | |
| 4.91%, due 5/1/29 | 1,805,000 | 1,779,776 |
The notes to the financial statements are an integral part of, and should be read in conjunction with, the financial statements.
15
Portfolio of Investments October 31, 2022† (continued)
| | Principal
Amount | Value |
| Municipal Bonds (continued) |
| Massachusetts (continued) |
Commonwealth of Massachusetts, COVID-19 Recovery Assessment
Revenue Bonds | | |
| Series A | | |
| 3.769%, due 7/15/29 | $ 9,000,000 | $ 8,450,765 |
Massachusetts Bay Transportation Authority, Sales Tax
Revenue Bonds | | |
| Series B | | |
| 2.235%, due 7/1/31 | 7,795,000 | 6,206,202 |
Massachusetts Development Finance Agency, Lesley University
Revenue Bonds | | |
| Series B | | |
| 3.165%, due 7/1/32 | 1,705,000 | 1,384,104 |
Massachusetts Development Finance Agency, Wellforce Obligated Group
Revenue Bonds | | |
| Series B, Insured: AGM | | |
| 4.496%, due 7/1/33 | 2,545,000 | 2,302,969 |
Massachusetts Water Resources Authority
Revenue Bonds | | |
| Series F | | |
| 2.223%, due 8/1/27 | 1,050,000 | 928,288 |
| | | 22,587,804 |
| Michigan 0.6% |
Michigan Finance Authority, Local Government Loan Program
Revenue Bonds | | |
| Series C-1, Insured: State Aid Direct Deposit | | |
| 3.585%, due 11/1/35 | 1,000,000 | 812,904 |
| Series E, Insured: State Aid Direct Deposit | | |
| 8.369%, due 11/1/35 | 715,000 | 831,090 |
Michigan State Building Authority
Revenue Bonds | | |
| Series II | | |
| 1.812%, due 10/15/31 | 2,000,000 | 1,542,510 |
| | | 3,186,504 |
| | Principal
Amount | Value |
| |
| Minnesota 0.2% |
Western Minnesota Municipal Power Agency
Revenue Bonds | | |
| Series A | | |
| 2.595%, due 1/1/29 | $ 1,000,000 | $ 862,167 |
| Mississippi 0.2% |
State of Mississippi
Unlimited General Obligation | | |
| Series B | | |
| 1.849%, due 6/1/30 | 1,400,000 | 1,128,652 |
| New Jersey 4.3% |
City of Bayonne NJ
Unlimited General Obligation | | |
| Insured: AGM SCH BD RES FD | | |
| 1.792%, due 8/1/29 | 2,875,000 | 2,259,196 |
City of Bayonne NJ, General Improvement
Unlimited General Obligation | | |
| Insured: AGM | | |
| 1.942%, due 7/1/30 | 1,065,000 | 815,974 |
New Jersey Turnpike Authority
Revenue Bonds | | |
| Series B | | |
| 1.713%, due 1/1/29 | 3,235,000 | 2,634,498 |
| Series B | | |
| 4.25%, due 1/1/43 | 5,000,000 | 4,670,650 |
South Jersey Transportation Authority
Revenue Bonds | | |
| Series B, Insured: BAM | | |
| 2.381%, due 11/1/27 | 1,975,000 | 1,721,452 |
State of New Jersey
Unlimited General Obligation | | |
| Series A | | |
| 2.30%, due 6/1/27 | 1,000,000 | 886,421 |
| Series A | | |
| 2.85%, due 6/1/32 | 5,765,000 | 4,599,164 |
| Series A, Insured: BAM | | |
| 2.90%, due 6/1/33 | 5,180,000 | 4,162,776 |
| | | 21,750,131 |
The notes to the financial statements are an integral part of, and should be read in conjunction with, the financial statements.
| 16 | MainStay MacKay U.S. Infrastructure Bond Fund |
| | Principal
Amount | Value |
| Municipal Bonds (continued) |
| New York 8.6% |
Brookhaven Local Development Corp., Long Island Community Hospital Project
Revenue Bonds | | |
| Series B | | |
| 4.50%, due 10/1/25 | $ 2,045,000 | $ 2,000,537 |
Brookhaven Local Development Corp., Long Island Community Hospital Health Care Services Foundation
Revenue Bonds | | |
| Series B, Insured: AGM-CR | �� | |
| 6.00%, due 10/1/30 | 1,855,000 | 1,942,343 |
City of New York NY
Unlimited General Obligation | | |
| Series D | | |
| 1.723%, due 8/1/29 | 1,300,000 | 1,032,451 |
| Series D-3 | | |
| 1.97%, due 3/1/31 | 3,000,000 | 2,301,904 |
| Series C-3 | | |
| 2.36%, due 8/1/31 | 2,000,000 | 1,567,065 |
| Series D-2 | | |
| 3.86%, due 12/1/28 | 1,000,000 | 922,377 |
Metropolitan Transportation Authority, Dedicated Tax Fund
Revenue Bonds | | |
| Series A | | |
| 5.00%, due 11/15/48 | 5,000,000 | 5,071,391 |
New York City Transitional Finance Authority, Future Tax Secured
Revenue Bonds | | |
| Series E-3 | | |
| 1.97%, due 2/1/33 | 1,000,000 | 731,654 |
| Series D-3 | | |
| 2.50%, due 11/1/33 | 1,150,000 | 874,814 |
| Series D-3 | | |
| 5.65%, due 11/1/35 | 6,000,000 | 5,959,272 |
New York Power Authority
Revenue Bonds | | |
| Series A, Insured: AGM | | |
| 5.749%, due 11/15/33 | 1,000,000 | 1,046,394 |
New York State Energy Research & Development Authority, Residential Solar And Energy Efficiency Financing, Green Bond
Revenue Bonds | | |
| Series A | | |
| 3.62%, due 4/1/25 | 750,000 | 724,245 |
| | Principal
Amount | Value |
| |
| New York (continued) |
New York State Energy Research & Development Authority, Residential Solar And Energy Efficiency Financing, Green Bond
Revenue Bonds (continued) | | |
| Series A | | |
| 3.77%, due 4/1/26 | $ 1,045,000 | $ 1,000,806 |
| Series A | | |
| 3.927%, due 4/1/27 | 995,000 | 947,785 |
New York State Environmental Facilities Corp., State Revolving Fund
Revenue Bonds | | |
| Series D | | |
| 3.321%, due 1/15/31 | 1,645,000 | 1,452,018 |
| Series B | | |
| 3.716%, due 6/15/32 | 2,000,000 | 1,782,281 |
New York State Urban Development Corp., Sales Tax
Revenue Bonds | | |
| Series A | | |
| 5.00%, due 3/15/36 | 2,520,000 | 2,631,045 |
State of New York
Unlimited General Obligation | | |
| Series B | | |
| 1.74%, due 3/15/29 | 11,475,000 | 9,403,725 |
Triborough Bridge & Tunnel Authority
Revenue Bonds | | |
| Series A-2 | | |
| 5.45%, due 11/15/32 | 1,985,000 | 2,034,863 |
| | | 43,426,970 |
| North Carolina 0.4% |
County of Guilford NC, Public Improvement
Unlimited General Obligation | | |
| Series B | | |
| 5.361%, due 8/1/28 | 2,250,000 | 2,258,574 |
| Ohio 3.5% |
American Municipal Power, Inc., Hydroelectric Projects
Revenue Bonds | | |
| Series A | | |
| 7.334%, due 2/15/28 | 4,225,000 | 4,511,944 |
The notes to the financial statements are an integral part of, and should be read in conjunction with, the financial statements.
17
Portfolio of Investments October 31, 2022† (continued)
| | Principal
Amount | Value |
| Municipal Bonds (continued) |
| Ohio (continued) |
County of Cuyahoga OH, Quicken Loans Arena Project
Revenue Bonds | | |
| Series C | | |
| 3.126%, due 7/1/28 | $ 1,000,000 | $ 913,384 |
JobsOhio Beverage System
Revenue Bonds | | |
| Series B | | |
| 3.985%, due 1/1/29 | 2,050,000 | 1,966,797 |
Northeast Ohio Regional Sewer District, Wastewater Improvement
Revenue Bonds | | |
| 5.438%, due 11/15/32 | 3,650,000 | 3,750,289 |
Ohio Higher Educational Facility Commission, Ashtabula County Medical Center Obligated Group
Revenue Bonds | | |
| 5.25%, due 1/1/42 | 2,000,000 | 1,993,921 |
State of Ohio, Build America Bonds
Unlimited General Obligation | | |
| Series B | | |
| 5.462%, due 9/1/30 | 2,000,000 | 2,062,200 |
Summit County Development Finance Authority, Franciscan University of Steubenville Project
Revenue Bonds | | |
| Series B | | |
| 5.125%, due 11/1/48 | 1,000,000 | 855,069 |
| Series A | | |
| 6.00%, due 11/1/48 (b) | 1,750,000 | 1,672,301 |
| | | 17,725,905 |
| Oklahoma 0.3% |
Oklahoma Municipal Power Authority, Power Suply System
Revenue Bonds | | |
| Series B, Insured: AGM | | |
| 2.351%, due 1/1/33 | 2,075,000 | 1,638,646 |
| Oregon 1.2% |
Metro
Unlimited General Obligation | | |
| 3.10%, due 6/1/31 | 1,000,000 | 869,494 |
Oregon State Lottery
Revenue Bonds | | |
| Series B | | |
| 3.821%, due 4/1/31 | 3,600,000 | 3,229,924 |
| | Principal
Amount | Value |
| |
| Oregon (continued) |
State of Oregon, Department of Transportation
Revenue Bonds, Senior Lien | | |
| Series B | | |
| 1.53%, due 11/15/30 | $ 1,750,000 | $ 1,355,289 |
State of Oregon
Unlimited General Obligation | | |
| Series C | | |
| 1.975%, due 5/1/31 | 1,000,000 | 793,802 |
| | | 6,248,509 |
| Pennsylvania 2.2% |
Authority Improvement Municipalities, Carlow University
Revenue Bonds | | |
| Series B | | |
| 5.00%, due 11/1/53 | 1,000,000 | 659,961 |
City of Philadelphia PA
Unlimited General Obligation | | |
| Series B, Insured: AGM | | |
| 1.618%, due 7/15/29 | 2,505,000 | 2,008,231 |
| Series B, Insured: AGM | | |
| 1.738%, due 7/15/30 | 2,250,000 | 1,758,077 |
City of Philadelphia PA, Water & Wastewater
Revenue Bonds | | |
| Series B | | |
| 2.334%, due 11/1/34 | 1,000,000 | 723,657 |
Commonwealth of Pennsylvania
Unlimited General Obligation | | |
| 1.625%, due 8/1/28 | 1,250,000 | 1,030,642 |
| 2.05%, due 8/1/31 | 4,000,000 | 3,077,361 |
University of Pittsburgh-of the Commonwealth System of Higher Education
Revenue Bonds | | |
| Series B | | |
| 3.596%, due 9/15/30 | 2,000,000 | 1,787,243 |
| | | 11,045,172 |
| Rhode Island 2.3% |
State of Rhode Island
Unlimited General Obligation | | |
| Series B | | |
| 4.79%, due 8/1/31 | 4,000,000 | 3,985,101 |
| Series B | | |
| 4.90%, due 8/1/32 | 7,445,000 | 7,380,146 |
| | | 11,365,247 |
The notes to the financial statements are an integral part of, and should be read in conjunction with, the financial statements.
| 18 | MainStay MacKay U.S. Infrastructure Bond Fund |
| | Principal
Amount | Value |
| Municipal Bonds (continued) |
| Tennessee 0.2% |
Metropolitan Government Nashville & Davidson County Health & Educational Facilities Board, Lipscomb University Project
Revenue Bonds | | |
| Series B | | |
| 4.409%, due 10/1/34 | $ 1,280,000 | $ 1,084,178 |
| Texas 9.1% |
Central Texas Regional Mobility Authority
Revenue Bonds, Senior Lien | | |
| Series C | | |
| 2.085%, due 1/1/28 | 1,395,000 | 1,189,016 |
City of Austin TX, Rental Car Special Facility
Revenue Bonds | | |
| Insured: AGM | | |
| 1.475%, due 11/15/28 | 1,500,000 | 1,203,724 |
City of Austin TX, Airport System
Revenue Bonds | | |
| 5.00%, due 11/15/38 | 2,000,000 | 1,971,975 |
City of Dallas TX, Waterworks & Sewer System
Revenue Bonds | | |
| Series B | | |
| 3.648%, due 10/1/30 | 2,000,000 | 1,799,089 |
| Series B | | |
| 3.748%, due 10/1/31 | 1,000,000 | 888,616 |
City of Garland TX, Electric Utility System
Revenue Bonds | | |
| Series B, Insured: AGM | | |
| 2.172%, due 3/1/32 | 1,850,000 | 1,400,868 |
City of Houston TX, Airport System
Revenue Bonds, Sub. Lien | | |
| Series C | | |
| 2.085%, due 7/1/28 | 3,530,000 | 2,969,574 |
| Series C, Insured: BAM | | |
| 2.485%, due 7/1/32 | 3,795,000 | 2,961,233 |
| Series C | | |
| 2.485%, due 7/1/32 | 1,470,000 | 1,132,933 |
City of Houston TX, Combined Utility System
Revenue Bonds, First Lien | | |
| Series B | | |
| 3.828%, due 5/15/28 | 2,575,000 | 2,442,982 |
| | Principal
Amount | Value |
| |
| Texas (continued) |
Dallas Area Rapid Transit
Revenue Bonds | | |
| Series C | | |
| 1.946%, due 12/1/31 | $ 1,730,000 | $ 1,322,272 |
Dallas Fort Worth International Airport
Revenue Bonds | | |
| Series A | | |
| 2.354%, due 11/1/27 | 2,155,000 | 1,889,679 |
| Series C | | |
| 2.416%, due 11/1/32 | 1,000,000 | 769,232 |
| Series A | | |
| 2.454%, due 11/1/29 | 1,000,000 | 836,154 |
San Antonio Education Facilities Corp., University of the Incarnate Word Project
Revenue Bonds | | |
| Series B | | |
| 2.65%, due 4/1/30 | 1,100,000 | 872,243 |
| Series B | | |
| 2.73%, due 4/1/31 | 750,000 | 580,754 |
State of Texas
Unlimited General Obligation | | |
| 2.526%, due 10/1/31 | 1,000,000 | 824,038 |
| 2.604%, due 4/1/30 | 2,500,000 | 2,145,011 |
Texas Transportation Commission, Mobility Fund
Unlimited General Obligation | | |
| 1.533%, due 10/1/29 | 8,490,000 | 6,747,174 |
Texas Transportation Commission State Highway Fund
Revenue Bonds, First Tier | | |
| Series B | | |
| 5.178%, due 4/1/30 | 12,030,000 | 11,856,899 |
| | | 45,803,466 |
| U.S. Virgin Islands 1.2% |
Matching Fund Special Purpose Securitization Corp.
Revenue Bonds | | |
| Series B | | |
| 6.00%, due 10/1/25 | 5,875,000 | 5,846,769 |
| Utah 1.2% |
County of Salt Lake UT, Convention Hotel
Revenue Bonds | | |
| 5.25%, due 10/1/34 (b) | 3,610,000 | 3,186,425 |
The notes to the financial statements are an integral part of, and should be read in conjunction with, the financial statements.
19
Portfolio of Investments October 31, 2022† (continued)
| | Principal
Amount | Value |
| Municipal Bonds (continued) |
| Utah (continued) |
Utah Transit Authority
Revenue Bonds, Senior Lien | | |
| 1.72%, due 12/15/27 | $ 1,500,000 | $ 1,292,316 |
Utah Transit Authority
Revenue Bonds | | |
| 1.783%, due 12/15/30 | 2,000,000 | 1,577,749 |
| | | 6,056,490 |
| Virginia 2.0% |
Farmville Industrial Development Authority, Longwood University Student Housing Project
Revenue Bonds | | |
| Series B | | |
| 5.00%, due 1/1/34 | 2,000,000 | 1,821,678 |
Fredericksburg Economic Development Authority, Fredericksburg Stadium Project
Revenue Bonds | | |
| Series A | | |
| 4.00%, due 9/1/29 (b) | 1,975,000 | 1,898,891 |
Hampton Roads Sanitation District
Revenue Bonds | | |
| Series B | | |
| 5.814%, due 11/1/29 | 4,775,000 | 4,910,067 |
Virginia Small Business Financing Authority, 95 Express Lanes LLC
Revenue Bonds, Senior Lien | | |
| 4.00%, due 1/1/39 (c) | 2,000,000 | 1,686,195 |
| | | 10,316,831 |
| Washington 2.7% |
County of King WA, Sewer
Revenue Bonds | | |
| Series B | | |
| 1.30%, due 1/1/28 | 2,140,000 | 1,785,317 |
Energy Northwest, Bonneville Power Administration
Revenue Bonds | | |
| Series B | | |
| 2.166%, due 7/1/32 | 2,740,000 | 2,094,401 |
Port of Seattle, Intermediate Lien
Revenue Bonds | | |
| Series C | | |
| 3.768%, due 8/1/28 | 2,000,000 | 1,861,458 |
| Series C | | |
| 3.913%, due 8/1/30 | 2,200,000 | 2,012,017 |
| | Principal
Amount | Value |
| |
| Washington (continued) |
Port of Seattle, Intermediate Lien
Revenue Bonds (continued) | | |
| Series C | | |
| 3.993%, due 8/1/31 | $ 2,120,000 | $ 1,926,273 |
| Series C | | |
| 4.093%, due 8/1/32 | 1,000,000 | 905,199 |
Spokane Public Facilities District, Sales & Lodging tax
Revenue Bonds | | |
| Series B | | |
| 1.996%, due 12/1/30 | 1,950,000 | 1,549,069 |
Washington Higher Education Facilities Authority, Whitman College Project
Revenue Bonds | | |
| Series B | | |
| 2.337%, due 1/1/29 | 1,825,000 | 1,491,314 |
| | | 13,625,048 |
| West Virginia 0.5% |
County of Ohio WV, Special District Excise Tax
Revenue Bonds | | |
| Series A | | |
| 4.00%, due 3/1/40 | 3,500,000 | 2,512,298 |
| Wisconsin 0.2% |
State of Wisconsin
Unlimited General Obligation | | |
| Series 1 | | |
| 2.501%, due 5/1/32 | 1,000,000 | 803,076 |
Total Municipal Bonds
(Cost $498,063,332) | | 467,355,515 |
| U.S. Government & Federal Agencies 0.1% |
| Federal Home Loan Mortgage Corporation (Mortgage Pass-Through Securities) 0.1% |
| FHLMC Gold Pools, 30 Year | | |
| 4.00%, due 10/1/48 | 122,764 | 114,038 |
| 6.50%, due 4/1/37 | 23,205 | 24,472 |
| | | 138,510 |
The notes to the financial statements are an integral part of, and should be read in conjunction with, the financial statements.
| 20 | MainStay MacKay U.S. Infrastructure Bond Fund |
| | Principal
Amount | | Value |
| U.S. Government & Federal Agencies (continued) |
| Government National Mortgage Association (Mortgage Pass-Through Security) 0.0% ‡ |
| GNMA I, 30 Year | | | |
| 6.50%, due 4/15/31 | $ 85,503 | | $ 88,363 |
Total U.S. Government & Federal Agencies
(Cost $233,498) | | | 226,873 |
Total Long-Term Bonds
(Cost $511,602,063) | | | 479,394,399 |
| |
| | Shares | | |
| Short-Term Investments 8.5% |
| Affiliated Investment Company 8.0% |
| MainStay U.S. Government Liquidity Fund, 2.905% (d) | 40,536,681 | | 40,536,681 |
| |
| | Principal
Amount | | |
| Short-Term Municipal Note 0.5% |
| County of Sacramento CA Insured: AGM | | | |
| 4.75%, due 7/10/30 (e) | $ 2,500,000 | | 2,488,110 |
Total Short-Term Municipal Note
(Cost $2,495,421) | | | 2,488,110 |
Total Short-Term Investments
(Cost $43,032,102) | | | 43,024,791 |
Total Investments
(Cost $554,634,165) | 103.4% | | 522,419,190 |
| Other Assets, Less Liabilities | (3.4) | | (17,163,056) |
| Net Assets | 100.0% | | $ 505,256,134 |
| † | Percentages indicated are based on Fund net assets. |
| ‡ | Less than one-tenth of a percent. |
| (a) | Coupon rate may change based on changes of the underlying collateral or prepayments of principal. Rate shown was the rate in effect as of October 31, 2022. |
| (b) | May be sold to institutional investors only under Rule 144A or securities offered pursuant to Section 4(a)(2) of the Securities Act of 1933, as amended. |
| (c) | Interest on these securities was subject to alternative minimum tax. |
| (d) | Current yield as of October 31, 2022. |
| (e) | Variable-rate demand notes (VRDNs)—Provide the right to sell the security at face value on either that day or within the rate-reset period. VRDNs will normally trade as if the maturity is the earlier put date, even though stated maturity is longer. The interest rate is reset on the put date at a stipulated daily, weekly, monthly, quarterly, or other specified time interval to reflect current market conditions. These securities do not indicate a reference rate and spread in their description. The maturity date shown is the final maturity. |
Investments in Affiliates (in 000's)
Investments in issuers considered to be affiliate(s) of the Fund during the year ended October 31, 2022 for purposes of Section 2(a)(3) of the Investment Company Act of 1940, as amended, were as follows:
| Affiliated Investment Companies | Value,
Beginning
of Year | Purchases
at Cost | Proceeds
from
Sales | Net
Realized
Gain/(Loss)
on Sales | Change in
Unrealized
Appreciation/
(Depreciation) | Value,
End of
Year | Dividend
Income | Other
Distributions | Shares
End of
Year |
| MainStay U.S. Government Liquidity Fund | $ 44,540 | $ 529,168 | $ (533,171) | $ — | $ — | $ 40,537 | $ 238 | $ — | 40,537 |
The notes to the financial statements are an integral part of, and should be read in conjunction with, the financial statements.
21
Portfolio of Investments October 31, 2022† (continued)
Futures Contracts
As of October 31, 2022, the Fund held the following futures contracts1:
| Type | Number of
Contracts | Expiration
Date | Value at
Trade Date | Current
Notional
Amount | Unrealized
Appreciation
(Depreciation)2 |
| Short Contracts | | | | | |
| U.S. Treasury 10 Year Notes | (250) | December 2022 | $ (29,350,239) | $ (27,648,437) | $ 1,701,802 |
| 1. | As of October 31, 2022, cash in the amount of $500,000 was on deposit with a broker or futures commission merchant for futures transactions. |
| 2. | Represents the difference between the value of the contracts at the time they were opened and the value as of October 31, 2022. |
| Abbreviation(s): |
| AGM—Assured Guaranty Municipal Corp. |
| BAM—Build America Mutual Assurance Co. |
| CR—Custodial Receipts |
| FHLMC—Federal Home Loan Mortgage Corp. |
| GNMA—Government National Mortgage Association |
The following is a summary of the fair valuations according to the inputs used as of October 31, 2022, for valuing the Fund’s assets:
| Description | Quoted
Prices in
Active
Markets for
Identical
Assets
(Level 1) | | Significant
Other
Observable
Inputs
(Level 2) | | Significant
Unobservable
Inputs
(Level 3) | | Total |
| Asset Valuation Inputs | | | | | | | |
| Investments in Securities (a) | | | | | | | |
| Long-Term Bonds | | | | | | | |
| Corporate Bonds | $ — | | $ 11,812,011 | | $ — | | $ 11,812,011 |
| Municipal Bonds | — | | 467,355,515 | | — | | 467,355,515 |
| U.S. Government & Federal Agencies | — | | 226,873 | | — | | 226,873 |
| Total Long-Term Bonds | — | | 479,394,399 | | — | | 479,394,399 |
| Short-Term Investments | | | | | | | |
| Affiliated Investment Company | 40,536,681 | | — | | — | | 40,536,681 |
| Short-Term Municipal Note | — | | 2,488,110 | | — | | 2,488,110 |
| Total Short-Term Investments | 40,536,681 | | 2,488,110 | | — | | 43,024,791 |
| Total Investments in Securities | 40,536,681 | | 481,882,509 | | — | | 522,419,190 |
| Other Financial Instruments | | | | | | | |
| Futures Contracts (b) | 1,701,802 | | — | | — | | 1,701,802 |
| Total Investments in Securities and Other Financial Instruments | $ 42,238,483 | | $ 481,882,509 | | $ — | | $ 524,120,992 |
| (a) | For a complete listing of investments and their industries, see the Portfolio of Investments. |
| (b) | The value listed for these securities reflects unrealized appreciation (depreciation) as shown on the Portfolio of Investments. |
The notes to the financial statements are an integral part of, and should be read in conjunction with, the financial statements.
| 22 | MainStay MacKay U.S. Infrastructure Bond Fund |
Statement of Assets and Liabilities as of October 31, 2022
| Assets |
Investment in unaffiliated securities, at value
(identified cost $514,097,484) | $481,882,509 |
Investment in affiliated investment companies, at value
(identified cost $40,536,681) | 40,536,681 |
| Cash | 197 |
| Cash collateral on deposit at broker for futures contracts | 500,000 |
| Receivables: | |
| Investment securities sold | 8,491,415 |
| Dividends and interest | 5,173,852 |
| Fund shares sold | 1,412,821 |
| Variation margin on futures contracts | 101,563 |
| Other assets | 41,492 |
| Total assets | 538,140,530 |
| Liabilities |
| Payables: | |
| Investment securities purchased | 30,708,518 |
| Fund shares redeemed | 1,320,092 |
| Manager (See Note 3) | 148,163 |
| Transfer agent (See Note 3) | 128,410 |
| Shareholder communication | 38,604 |
| NYLIFE Distributors (See Note 3) | 26,317 |
| Custodian | 16,871 |
| Professional fees | 14,806 |
| Trustees | 9 |
| Accrued expenses | 7,373 |
| Distributions payable | 475,233 |
| Total liabilities | 32,884,396 |
| Net assets | $505,256,134 |
| Composition of Net Assets |
| Shares of beneficial interest outstanding (par value of $.01 per share) unlimited number of shares authorized | $ 695,005 |
| Additional paid-in-capital | 600,159,743 |
| | 600,854,748 |
| Total distributable earnings (loss) | (95,598,614) |
| Net assets | $505,256,134 |
| Class A | |
| Net assets applicable to outstanding shares | $ 75,779,653 |
| Shares of beneficial interest outstanding | 10,521,378 |
| Net asset value per share outstanding | $ 7.20 |
| Maximum sales charge (3.00% of offering price) | 0.22 |
| Maximum offering price per share outstanding | $ 7.42 |
| Investor Class | |
| Net assets applicable to outstanding shares | $ 13,974,159 |
| Shares of beneficial interest outstanding | 1,931,316 |
| Net asset value per share outstanding | $ 7.24 |
| Maximum sales charge (2.50% of offering price) | 0.19 |
| Maximum offering price per share outstanding | $ 7.43 |
| Class B | |
| Net assets applicable to outstanding shares | $ 622,641 |
| Shares of beneficial interest outstanding | 86,436 |
| Net asset value and offering price per share outstanding | $ 7.20 |
| Class C | |
| Net assets applicable to outstanding shares | $ 7,036,625 |
| Shares of beneficial interest outstanding | 977,415 |
| Net asset value and offering price per share outstanding | $ 7.20 |
| Class I | |
| Net assets applicable to outstanding shares | $297,386,389 |
| Shares of beneficial interest outstanding | 40,829,292 |
| Net asset value and offering price per share outstanding | $ 7.28 |
| Class R6 | |
| Net assets applicable to outstanding shares | $110,456,667 |
| Shares of beneficial interest outstanding | 15,154,619 |
| Net asset value and offering price per share outstanding | $ 7.29 |
The notes to the financial statements are an integral part of, and should be read in conjunction with, the financial statements.
23
Statement of Operations for the year ended October 31, 2022
| Investment Income (Loss) |
| Income | |
| Interest | $ 17,397,667 |
| Dividends-affiliated | 238,292 |
| Total income | 17,635,959 |
| Expenses | |
| Manager (See Note 3) | 2,861,914 |
| Transfer agent (See Note 3) | 798,429 |
| Distribution/Service—Class A (See Note 3) | 233,812 |
| Distribution/Service—Investor Class (See Note 3) | 40,331 |
| Distribution/Service—Class B (See Note 3) | 9,543 |
| Distribution/Service—Class C (See Note 3) | 78,466 |
| Registration | 113,386 |
| Custodian | 84,861 |
| Professional fees | 84,535 |
| Shareholder communication | 71,790 |
| Trustees | 12,501 |
| Miscellaneous | 30,625 |
| Total expenses before waiver/reimbursement | 4,420,193 |
| Expense waiver/reimbursement from Manager (See Note 3) | (622,639) |
| Net expenses | 3,797,554 |
| Net investment income (loss) | 13,838,405 |
| Realized and Unrealized Gain (Loss) |
| Net realized gain (loss) on: | |
| Unaffiliated investment transactions | (69,671,943) |
| Futures transactions | 5,542,123 |
| Net realized gain (loss) | (64,129,820) |
| Net change in unrealized appreciation (depreciation) on: | |
| Unaffiliated investments | (43,120,721) |
| Futures contracts | 1,128,320 |
| Net change in unrealized appreciation (depreciation) | (41,992,401) |
| Net realized and unrealized gain (loss) | (106,122,221) |
| Net increase (decrease) in net assets resulting from operations | $ (92,283,816) |
The notes to the financial statements are an integral part of, and should be read in conjunction with, the financial statements.
| 24 | MainStay MacKay U.S. Infrastructure Bond Fund |
Statements of Changes in Net Assets
for the years ended October 31, 2022 and October 31, 2021
| | 2022 | 2021 |
| Increase (Decrease) in Net Assets |
| Operations: | | |
| Net investment income (loss) | $ 13,838,405 | $ 9,528,665 |
| Net realized gain (loss) | (64,129,820) | 4,665,614 |
| Net change in unrealized appreciation (depreciation) | (41,992,401) | (930,526) |
| Net increase (decrease) in net assets resulting from operations | (92,283,816) | 13,263,753 |
| Distributions to shareholders: | | |
| Class A | (2,991,990) | (2,956,871) |
| Investor Class | (464,952) | (450,420) |
| Class B | (21,454) | (28,456) |
| Class C | (166,814) | (145,405) |
| Class I | (10,840,872) | (9,030,341) |
| Class R6 | (4,569,870) | (3,572,136) |
| Total distributions to shareholders | (19,055,952) | (16,183,629) |
| Capital share transactions: | | |
| Net proceeds from sales of shares | 323,563,093 | 319,836,169 |
| Net asset value of shares issued to shareholders in reinvestment of distributions | 13,320,339 | 11,662,330 |
| Cost of shares redeemed | (336,252,102) | (221,362,280) |
| Increase (decrease) in net assets derived from capital share transactions | 631,330 | 110,136,219 |
| Net increase (decrease) in net assets | (110,708,438) | 107,216,343 |
| Net Assets |
| Beginning of year | 615,964,572 | 508,748,229 |
| End of year | $ 505,256,134 | $ 615,964,572 |
The notes to the financial statements are an integral part of, and should be read in conjunction with, the financial statements.
25
Financial Highlights selected per share data and ratios
| | Year Ended October 31, |
| Class A | 2022 | | 2021 | | 2020 | | 2019 | | 2018 |
| Net asset value at beginning of year | $ 8.74 | | $ 8.77 | | $ 8.64 | | $ 7.93 | | $ 8.33 |
| Net investment income (loss) (a) | 0.18 | | 0.13 | | 0.16 | | 0.21 | | 0.19 |
| Net realized and unrealized gain (loss) | (1.47) | | 0.07 | | 0.14 | | 0.71 | | (0.40) |
| Total from investment operations | (1.29) | | 0.20 | | 0.30 | | 0.92 | | (0.21) |
| Less distributions: | | | | | | | | | |
| From net investment income | (0.18) | | (0.13) | | (0.17) | | (0.21) | | (0.19) |
| From net realized gain on investments | (0.07) | | (0.10) | | — | | — | | — |
| Return of capital | — | | — | | — | | (0.00)‡ | | — |
| Total distributions | (0.25) | | (0.23) | | (0.17) | | (0.21) | | (0.19) |
| Net asset value at end of year | $ 7.20 | | $ 8.74 | | $ 8.77 | | $ 8.64 | | $ 7.93 |
| Total investment return (b) | (14.98)% | | 2.36% | | 3.45% | | 11.76% | | (2.54)% |
| Ratios (to average net assets)/Supplemental Data: | | | | | | | | | |
| Net investment income (loss) | 2.20% | | 1.49% | | 1.84% | | 2.52% | | 2.31% |
| Net expenses (c) | 0.85% | | 0.85% | | 0.85% | | 0.89% | | 1.00% |
| Expenses (before waiver/reimbursement) (c) | 0.98% | | 0.96% | | 0.98% | | 1.02% | | 1.04% |
| Portfolio turnover rate | 170%(d) | | 51%(d) | | 89%(d) | | 124%(d) | | 58%(e) |
| Net assets at end of year (in 000’s) | $ 75,780 | | $ 111,626 | | $ 103,475 | | $ 84,513 | | $ 68,269 |
| ‡ | Less than one cent per share. |
| (a) | Per share data based on average shares outstanding during the year. |
| (b) | Total investment return is calculated exclusive of sales charges and assumes the reinvestment of dividends and distributions. For periods of less than one year, total return is not annualized. |
| (c) | In addition to the fees and expenses which the Fund bears directly, it also indirectly bears a pro-rata share of the fees and expenses of the underlying funds in which it invests. Such indirect expenses are not included in the above expense ratios. |
| (d) | The portfolio turnover rate includes variable rate demand notes. |
| (e) | The portfolio turnover rate not including mortgage dollar rolls was 52% for the year ended October 31, 2018. |
The notes to the financial statements are an integral part of, and should be read in conjunction with, the financial statements.
| 26 | MainStay MacKay U.S. Infrastructure Bond Fund |
Financial Highlights selected per share data and ratios
| | Year Ended October 31, |
| Investor Class | 2022 | | 2021 | | 2020 | | 2019 | | 2018 |
| Net asset value at beginning of year | $ 8.78 | | $ 8.81 | | $ 8.68 | | $ 7.97 | | $ 8.36 |
| Net investment income (loss) (a) | 0.16 | | 0.10 | | 0.14 | | 0.19 | | 0.16 |
| Net realized and unrealized gain (loss) | (1.47) | | 0.07 | | 0.13 | | 0.71 | | (0.39) |
| Total from investment operations | (1.31) | | 0.17 | | 0.27 | | 0.90 | | (0.23) |
| Less distributions: | | | | | | | | | |
| From net investment income | (0.16) | | (0.10) | | (0.14) | | (0.19) | | (0.16) |
| From net realized gain on investments | (0.07) | | (0.10) | | — | | — | | — |
| Return of capital | — | | — | | — | | (0.00)‡ | | — |
| Total distributions | (0.23) | | (0.20) | | (0.14) | | (0.19) | | (0.16) |
| Net asset value at end of year | $ 7.24 | | $ 8.78 | | $ 8.81 | | $ 8.68 | | $ 7.97 |
| Total investment return (b) | (15.14)% | | 2.02% | | 3.14% | | 11.36% | | (2.72)% |
| Ratios (to average net assets)/Supplemental Data: | | | | | | | | | |
| Net investment income (loss) | 1.95% | | 1.16% | | 1.57% | | 2.21% | | 1.98% |
| Net expenses (c) | 1.12% | | 1.17% | | 1.15% | | 1.21% | | 1.33% |
| Expenses (before waiver/reimbursement) (c) | 1.25% | | 1.33% | | 1.28% | | 1.35% | | 1.44% |
| Portfolio turnover rate | 170%(d) | | 51%(d) | | 89%(d) | | 124%(d) | | 58%(e) |
| Net assets at end of year (in 000's) | $ 13,974 | | $ 17,994 | | $ 19,459 | | $ 20,520 | | $ 21,012 |
| ‡ | Less than one cent per share. |
| (a) | Per share data based on average shares outstanding during the year. |
| (b) | Total investment return is calculated exclusive of sales charges and assumes the reinvestment of dividends and distributions. For periods of less than one year, total return is not annualized. |
| (c) | In addition to the fees and expenses which the Fund bears directly, it also indirectly bears a pro-rata share of the fees and expenses of the underlying funds in which it invests. Such indirect expenses are not included in the above expense ratios. |
| (d) | The portfolio turnover rate includes variable rate demand notes. |
| (e) | The portfolio turnover rate not including mortgage dollar rolls was 52% for the year ended October 31, 2018. |
The notes to the financial statements are an integral part of, and should be read in conjunction with, the financial statements.
27
Financial Highlights selected per share data and ratios
| | Year Ended October 31, |
| Class B | 2022 | | 2021 | | 2020 | | 2019 | | 2018 |
| Net asset value at beginning of year | $ 8.74 | | $ 8.77 | | $ 8.64 | | $ 7.94 | | $ 8.33 |
| Net investment income (loss) (a) | 0.09 | | 0.04 | | 0.07 | | 0.12 | | 0.10 |
| Net realized and unrealized gain (loss) | (1.46) | | 0.07 | | 0.14 | | 0.70 | | (0.39) |
| Total from investment operations | (1.37) | | 0.11 | | 0.21 | | 0.82 | | (0.29) |
| Less distributions: | | | | | | | | | |
| From net investment income | (0.10) | | (0.04) | | (0.08) | | (0.12) | | (0.10) |
| From net realized gain on investments | (0.07) | | (0.10) | | — | | — | | — |
| Return of capital | — | | — | | — | | (0.00)‡ | | — |
| Total distributions | (0.17) | | (0.14) | | (0.08) | | (0.12) | | (0.10) |
| Net asset value at end of year | $ 7.20 | | $ 8.74 | | $ 8.77 | | $ 8.64 | | $ 7.94 |
| Total investment return (b) | (15.84)% | | 1.28% | | 2.39% | | 10.46% | | (3.46)% |
| Ratios (to average net assets)/Supplemental Data: | | | | | | | | | |
| Net investment income (loss) | 1.11% | | 0.42% | | 0.85% | | 1.46% | | 1.23% |
| Net expenses (c) | 1.87% | | 1.92% | | 1.90% | | 1.96% | | 2.08% |
| Expenses (before waiver/reimbursement) (c) | 2.00% | | 2.08% | | 2.03% | | 2.10% | | 2.19% |
| Portfolio turnover rate | 170%(d) | | 51%(d) | | 89%(d) | | 124%(d) | | 58%(e) |
| Net assets at end of year (in 000’s) | $ 623 | | $ 1,343 | | $ 1,902 | | $ 2,621 | | $ 3,224 |
| ‡ | Less than one cent per share. |
| (a) | Per share data based on average shares outstanding during the year. |
| (b) | Total investment return is calculated exclusive of sales charges and assumes the reinvestment of dividends and distributions. For periods of less than one year, total return is not annualized. |
| (c) | In addition to the fees and expenses which the Fund bears directly, it also indirectly bears a pro-rata share of the fees and expenses of the underlying funds in which it invests. Such indirect expenses are not included in the above expense ratios. |
| (d) | The portfolio turnover rate includes variable rate demand notes. |
| (e) | The portfolio turnover rate not including mortgage dollar rolls was 52% for the year ended October 31, 2018. |
The notes to the financial statements are an integral part of, and should be read in conjunction with, the financial statements.
| 28 | MainStay MacKay U.S. Infrastructure Bond Fund |
Financial Highlights selected per share data and ratios
| | Year Ended October 31, |
| Class C | 2022 | | 2021 | | 2020 | | 2019 | | 2018 |
| Net asset value at beginning of year | $ 8.74 | | $ 8.77 | | $ 8.64 | | $ 7.93 | | $ 8.32 |
| Net investment income (loss) (a) | 0.11 | | 0.04 | | 0.08 | | 0.12 | | 0.10 |
| Net realized and unrealized gain (loss) | (1.48) | | 0.07 | | 0.13 | | 0.71 | | (0.39) |
| Total from investment operations | (1.37) | | 0.11 | | 0.21 | | 0.83 | | (0.29) |
| Less distributions: | | | | | | | | | |
| From net investment income | (0.10) | | (0.04) | | (0.08) | | (0.12) | | (0.10) |
| From net realized gain on investments | (0.07) | | (0.10) | | — | | — | | — |
| Return of capital | — | | — | | — | | (0.00)‡ | | — |
| Total distributions | (0.17) | | (0.14) | | (0.08) | | (0.12) | | (0.10) |
| Net asset value at end of year | $ 7.20 | | $ 8.74 | | $ 8.77 | | $ 8.64 | | $ 7.93 |
| Total investment return (b) | (15.84)% | | 1.27% | | 2.38% | | 10.59% | | (3.46)% |
| Ratios (to average net assets)/Supplemental Data: | | | | | | | | | |
| Net investment income (loss) | 1.38% | | 0.42% | | 0.88% | | 1.47% | | 1.23% |
| Net expenses (c) | 1.87% | | 1.92% | | 1.90% | | 1.96% | | 2.08% |
| Expenses (before waiver/reimbursement) (c) | 2.00% | | 2.08% | | 2.02% | | 2.10% | | 2.19% |
| Portfolio turnover rate | 170%(d) | | 51%(d) | | 89%(d) | | 124%(d) | | 58%(e) |
| Net assets at end of year (in 000’s) | $ 7,037 | | $ 6,481 | | $ 8,708 | | $ 14,152 | | $ 7,612 |
| ‡ | Less than one cent per share. |
| (a) | Per share data based on average shares outstanding during the year. |
| (b) | Total investment return is calculated exclusive of sales charges and assumes the reinvestment of dividends and distributions. For periods of less than one year, total return is not annualized. |
| (c) | In addition to the fees and expenses which the Fund bears directly, it also indirectly bears a pro-rata share of the fees and expenses of the underlying funds in which it invests. Such indirect expenses are not included in the above expense ratios. |
| (d) | The portfolio turnover rate includes variable rate demand notes. |
| (e) | The portfolio turnover rate not including mortgage dollar rolls was 52% for the year ended October 31, 2018. |
The notes to the financial statements are an integral part of, and should be read in conjunction with, the financial statements.
29
Financial Highlights selected per share data and ratios
| | Year Ended October 31, |
| Class I | 2022 | | 2021 | | 2020 | | 2019 | | 2018 |
| Net asset value at beginning of year | $ 8.84 | | $ 8.87 | | $ 8.73 | | $ 8.02 | | $ 8.42 |
| Net investment income (loss) (a) | 0.20 | | 0.15 | | 0.17 | | 0.24 | | 0.21 |
| Net realized and unrealized gain (loss) | (1.49) | | 0.07 | | 0.16 | | 0.71 | | (0.40) |
| Total from investment operations | (1.29) | | 0.22 | | 0.33 | | 0.95 | | (0.19) |
| Less distributions: | | | | | | | | | |
| From net investment income | (0.20) | | (0.15) | | (0.19) | | (0.24) | | (0.21) |
| From net realized gain on investments | (0.07) | | (0.10) | | — | | — | | — |
| Return of capital | — | | — | | — | | (0.00)‡ | | — |
| Total distributions | (0.27) | | (0.25) | | (0.19) | | (0.24) | | (0.21) |
| Net asset value at end of year | $ 7.28 | | $ 8.84 | | $ 8.87 | | $ 8.73 | | $ 8.02 |
| Total investment return (b) | (14.83)% | | 2.58% | | 3.78% | | 11.95% | | (2.26)% |
| Ratios (to average net assets)/Supplemental Data: | | | | | | | | | |
| Net investment income (loss) | 2.47% | | 1.71% | | 1.97% | | 2.64% | | 2.56% |
| Net expenses (c) | 0.60% | | 0.60% | | 0.60% | | 0.60% | | 0.75% |
| Expenses (before waiver/reimbursement) (c) | 0.73% | | 0.71% | | 0.72% | | 0.74% | | 0.79% |
| Portfolio turnover rate | 170%(d) | | 51%(d) | | 89%(d) | | 124%(d) | | 58%(e) |
| Net assets at end of year (in 000’s) | $ 297,386 | | $ 329,021 | | $ 292,000 | | $ 177,305 | | $ 5,003 |
| ‡ | Less than one cent per share. |
| (a) | Per share data based on average shares outstanding during the year. |
| (b) | Total investment return is calculated exclusive of sales charges and assumes the reinvestment of dividends and distributions. Class I shares are not subject to sales charges. For periods of less than one year, total return is not annualized. |
| (c) | In addition to the fees and expenses which the Fund bears directly, it also indirectly bears a pro-rata share of the fees and expenses of the underlying funds in which it invests. Such indirect expenses are not included in the above expense ratios. |
| (d) | The portfolio turnover rate includes variable rate demand notes. |
| (e) | The portfolio turnover rate not including mortgage dollar rolls was 52% for the year ended October 31, 2018. |
The notes to the financial statements are an integral part of, and should be read in conjunction with, the financial statements.
| 30 | MainStay MacKay U.S. Infrastructure Bond Fund |
Financial Highlights selected per share data and ratios
| | Year Ended October 31, | | November 1, 2019^ through
October 31, |
| Class R6 | 2022 | | 2021 | | 2020 |
| Net asset value at beginning of period | $ 8.84 | | $ 8.87 | | $ 8.72 |
| Net investment income (loss) (a) | 0.20 | | 0.16 | | 0.19 |
| Net realized and unrealized gain (loss) | (1.47) | | 0.07 | | 0.15 |
| Total from investment operations | (1.27) | | 0.23 | | 0.34 |
| Less distributions: | | | | | |
| From net investment income | (0.21) | | (0.16) | | (0.19) |
| From net realized gain on investments | (0.07) | | (0.10) | | — |
| Total distributions | (0.28) | | (0.26) | | (0.19) |
| Net asset value at end of period | $ 7.29 | | $ 8.84 | | $ 8.87 |
| Total investment return (b) | (14.66)% | | 2.65% | | 3.85% |
| Ratios (to average net assets)/Supplemental Data: | | | | | |
| Net investment income (loss) | 2.50% | | 1.77% | | 2.16% |
| Net expenses (c) | 0.53% | | 0.53% | | 0.53% |
| Expenses (before waiver/reimbursement) (c) | 0.57% | | 0.56% | | 0.58% |
| Portfolio turnover rate (d) | 170% | | 51% | | 89% |
| Net assets at end of period (in 000’s) | $ 110,457 | | $ 149,500 | | $ 83,204 |
| ^ | Inception date. |
| (a) | Per share data based on average shares outstanding during the period. |
| (b) | Total investment return is calculated exclusive of sales charges and assumes the reinvestment of dividends and distributions. Class R6 shares are not subject to sales charges. For periods of less than one year, total return is not annualized. |
| (c) | In addition to the fees and expenses which the Fund bears directly, it also indirectly bears a pro-rata share of the fees and expenses of the underlying funds in which it invests. Such indirect expenses are not included in the above expense ratios. |
| (d) | The portfolio turnover rate includes variable rate demand notes. |
The notes to the financial statements are an integral part of, and should be read in conjunction with, the financial statements.
31
4.Duration is a measure of the price sensitivity of a fixed-income investment to changes in interest rates. Duration is expressed as a number of years and is considered a more accurate sensitivity gauge than average maturity.
Notes to Financial Statements
Note 1-Organization and Business
The MainStay Funds (the “Trust”) was organized on January 9, 1986, as a Massachusetts business trust. The Trust is registered under the Investment Company Act of 1940, as amended (the “1940 Act”), as an open-end management investment company, and is comprised of twelve funds (collectively referred to as the "Funds"). These financial statements and notes relate to the MainStay MacKay U.S. Infrastructure Bond Fund (the "Fund"), a “diversified” fund, as that term is defined in the 1940 Act, as interpreted or modified by regulatory authorities having jurisdiction, from time to time.
The following table lists the Fund's share classes that have been registered and commenced operations:
| Class | Commenced Operations |
| Class A | January 3, 1995 |
| Investor Class | February 28, 2008 |
| Class B | May 1, 1986 |
| Class C | September 1, 1998 |
| Class I | January 2, 2004 |
| Class R6 | November 1, 2019 |
| SIMPLE Class | N/A* |
| * | SIMPLE Class shares were registered for sale effective as of August 31, 2020 but have not yet commenced operations. |
Class B shares of the MainStay Group of Funds are closed to all new purchases as well as additional investments by existing Class B shareholders. Existing Class B shareholders may continue to reinvest dividends and capital gains distributions, as well as exchange their Class B shares for Class B shares of other funds in the MainStay Group of Funds as permitted by the current exchange privileges. Class B shareholders continue to be subject to any applicable contingent deferred sales charge ("CDSC") at the time of redemption. All other features of the Class B shares, including but not limited to the fees and expenses applicable to Class B shares, remain unchanged. Unless redeemed, Class B shareholders will remain in Class B shares of their respective fund until the Class B shares are converted to Class A or Investor Class shares pursuant to the applicable conversion schedule.
Class A and Investor Class shares are offered at net asset value (“NAV”) per share plus an initial sales charge. No initial sales charge applies to investments of $250,000 or more (and certain other qualified purchases) in Class A and Investor Class shares. A CDSC of 1.00% may be imposed on certain redemptions of Class A and Investor Class shares made within 18 months of the date of purchase on shares that were purchased without an initial sales charge. Class C shares are offered at NAV without an initial sales charge, although a 1.00% CDSC may be imposed on certain redemptions of such shares made within one year of the date of purchase of Class C shares. Investments in Class C shares are subject to a purchase maximum of $250,000. When Class B shares were offered, they were offered at NAV without an initial sales charge, although a CDSC that declines depending on the number of years a shareholder held its Class B shares may be imposed on certain redemptions of such shares
made within six years of the date of purchase of such shares. Class I and Class R6 shares are offered at NAV without a sales charge. SIMPLE Class shares are expected to be offered at NAV without a sales charge if such shares are offered in the future. Depending upon eligibility, Class B shares convert to either Class A or Investor Class shares at the end of the calendar quarter eight years after the date they were purchased. In addition, depending upon eligibility, Class C shares convert to either Class A or Investor Class shares at the end of the calendar quarter eight years after the date they were purchased. Additionally, Investor Class shares may convert automatically to Class A shares. Under certain circumstances and as may be permitted by the Trust’s multiple class plan pursuant to Rule 18f-3 under the 1940 Act, specified share classes of the Fund may be converted to one or more other share classes of the Fund as disclosed in the capital share transactions within these Notes. The classes of shares have the same voting (except for issues that relate solely to one class), dividend, liquidation and other rights, and the same terms and conditions, except that under distribution plans pursuant to Rule 12b-1 under the 1940 Act, Class B and Class C shares are subject to higher distribution and/or service fees than Class A, Investor Class and SIMPLE Class shares. Class I and Class R6 shares are not subject to a distribution and/or service fee.
The Fund's investment objective is to seek current income.
Note 2–Significant Accounting Policies
The Fund is an investment company and accordingly follows the investment company accounting and reporting guidance of the Financial Accounting Standards Board (“FASB”) Accounting Standards Codification Topic 946 Financial Services—Investment Companies. The Fund prepares its financial statements in accordance with generally accepted accounting principles (“GAAP”) in the United States of America and follows the significant accounting policies described below.
(A) Securities Valuation. Investments are usually valued as of the close of regular trading on the New York Stock Exchange (the "Exchange") (usually 4:00 p.m. Eastern time) on each day the Fund is open for business ("valuation date").
Effective September 8, 2022, and pursuant to Rule 2a-5 under the 1940 Act, the Board of Trustees of the Trust (the "Board") designated New York Life Investment Management LLC (“New York Life Investments” or the "Manager") as its Valuation Designee (the "Valuation Designee"). The Valuation Designee is responsible for performing fair valuations relating to all investments in the Fund’s portfolio for which market quotations are not readily available; periodically assessing and managing material valuation risks; establishing and applying fair value methodologies; testing fair valuation methodologies; evaluating and overseeing pricing services; segregation of valuation and portfolio management functions; providing quarterly, annual and prompt reporting to the Board, as appropriate; identifying potential conflicts of interest; and maintaining appropriate records. The Valuation Designee has established a valuation committee ("Valuation Committee") to assist in carrying out the Valuation Designee’s responsibilities and establish prices of securities for which market
| 32 | MainStay MacKay U.S. Infrastructure Bond Fund |
quotations are not readily available. The Fund’s and the Valuation Designee's policies and procedures ("Valuation Procedures") govern the Valuation Designee’s selection and application of methodologies for determining and calculating the fair value of Fund investments. The Valuation Designee may value Fund portfolio securities for which market quotations are not readily available and other Fund assets utilizing inputs from pricing services and other third-party sources (together, “Pricing Sources”). The Valuation Committee meets (in person, via electronic mail or via teleconference) on an ad-hoc basis to determine fair valuations and on a quarterly basis to review fair value events (excluding fair valuations from pricing services), including valuation risks and back-testing results, and preview reports to the Board.
The Valuation Committee establishes prices of securities for which market quotations are not readily available based on such methodologies and measurements on a regular basis after considering information that is reasonably available and deemed relevant by the Valuation Committee. The Board shall oversee the Valuation Designee and review fair valuation materials on a prompt, quarterly and annual basis and approve proposed revisions to the Valuation Procedures.
Investments for which market quotations are not readily available are valued at fair value as determined in good faith pursuant to the Valuation Procedures. A market quotation is readily available only when that quotation is a quoted price (unadjusted) in active markets for identical investments that the Fund can access at the measurement date, provided that a quotation will not be readily available if it is not reliable. Fair value measurements are determined within a framework that establishes a three-tier hierarchy that maximizes the use of observable market data and minimizes the use of unobservable inputs to establish a classification of fair value measurements for disclosure purposes. "Inputs" refer broadly to the assumptions that market participants would use in pricing the asset or liability, including assumptions about risk, such as the risk inherent in a particular valuation technique used to measure fair value using a pricing model and/or the risk inherent in the inputs for the valuation technique. Inputs may be observable or unobservable. Observable inputs reflect the assumptions market participants would use in pricing the asset or liability based on market data obtained from sources independent of the Fund. Unobservable inputs reflect the Fund’s own assumptions about the assumptions market participants would use in pricing the asset or liability based on the information available. The inputs or methodology used for valuing assets or liabilities may not be an indication of the risks associated with investing in those assets or liabilities. The three-tier hierarchy of inputs is summarized below.
| • | Level 1—quoted prices (unadjusted) in active markets for an identical asset or liability |
| • | Level 2—other significant observable inputs (including quoted prices for a similar asset or liability in active markets, interest rates and yield curves, prepayment speeds, credit risk, etc.) |
| • | Level 3—significant unobservable inputs (including the Fund's own assumptions about the assumptions that market participants would use in measuring fair value of an asset or liability) |
The level of an asset or liability within the fair value hierarchy is based on the lowest level of an input, both individually and in the aggregate, that is significant to the fair value measurement. The aggregate value by input level of the Fund’s assets and liabilities as of October 31, 2022, is included at the end of the Portfolio of Investments.
The Fund may use third-party vendor evaluations, whose prices may be derived from one or more of the following standard inputs, among others:
| • Benchmark yields | • Reported trades |
| • Broker/dealer quotes | • Issuer spreads |
| • Two-sided markets | • Benchmark securities |
| • Bids/offers | • Reference data (corporate actions or material event notices) |
| • Industry and economic events | • Comparable bonds |
| • Monthly payment information | |
An asset or liability for which a market quotation is not readily available is valued by methods deemed reasonable in good faith by the Valuation Committee, following the Valuation Procedures to represent fair value. Under these procedures, the Valuation Designee generally uses a market-based approach which may use related or comparable assets or liabilities, recent transactions, market multiples, book values and other relevant information. The Valuation Designee may also use an income-based valuation approach in which the anticipated future cash flows of the asset or liability are discounted to calculate fair value. Discounts may also be applied due to the nature and/or duration of any restrictions on the disposition of the asset or liability. Fair value represents a good faith approximation of the value of a security. Fair value determinations involve the consideration of a number of subjective factors, an analysis of applicable facts and circumstances and the exercise of judgment. As a result, it is possible that the fair value for a security determined in good faith in accordance with the Valuation Procedures may differ from valuations for the same security determined for other funds using their own valuation procedures. Although the Valuation Procedures are designed to value a security at the price the Fund may reasonably expect to receive upon the security's sale in an orderly transaction, there can be no assurance that any fair value determination thereunder would, in fact, approximate the amount that the Fund would actually realize upon the sale of the security or the price at which the security would trade if a reliable market price were readily available. During the year ended October 31, 2022, there were no material changes to the fair value methodologies.
Securities which may be valued in this manner include, but are not limited to: (i) a security for which trading has been halted or suspended or otherwise does not have a readily available market quotation on a given day; (ii) a debt security that has recently gone into default and for which there is not a current market quotation; (iii) a security of an issuer that has entered into a restructuring; (iv) a security that has been delisted from a national exchange; (v) a security subject to trading collars for which no or limited trading takes place; and (vi) a security whose principal market has been temporarily closed at a time when, under normal
Notes to Financial Statements (continued)
conditions, it would be open. Securities valued in this manner are generally categorized as Level 2 or 3 in the hierarchy.
Investments in mutual funds, including money market funds, are valued at their respective NAVs at the close of business each day on the valuation date. These securities are generally categorized as Level 1 in the hierarchy.
Futures contracts are valued at the last posted settlement price on the market where such futures are primarily traded. These securities are generally categorized as Level 1 in the hierarchy.
Debt securities (other than convertible and municipal bonds) are valued at the evaluated bid prices (evaluated mean prices in the case of convertible and municipal bonds) supplied by a pricing agent or broker selected by the Valuation Designee, in consultation with the Subadvisor. The evaluations are market-based measurements processed through a pricing application and represents the pricing agent’s good faith determination as to what a holder may receive in an orderly transaction under market conditions. The rules-based logic utilizes valuation techniques that reflect participants’ assumptions and vary by asset class and per methodology, maximizing the use of relevant observable data including quoted prices for similar assets, benchmark yield curves and market corroborated inputs. The evaluated bid or mean prices are deemed by the Valuation Designee, in consultation with the Subadvisor, to be representative of market values at the regular close of trading of the Exchange on each valuation date. Debt securities purchased on a delayed delivery basis are marked to market daily until settlement at the forward settlement date. Debt securities, including corporate bonds, U.S. government and federal agency bonds, municipal bonds, foreign bonds, convertible bonds, asset-backed securities and mortgage-backed securities are generally categorized as Level 2 in the hierarchy.
Temporary cash investments acquired in excess of 60 days to maturity at the time of purchase are valued using the latest bid prices or using valuations based on a matrix system (which considers such factors as security prices, yields, maturities and ratings), both as furnished by independent pricing services. Temporary cash investments that mature in 60 days or less at the time of purchase ("Short-Term Investments") are valued using the amortized cost method of valuation, unless the use of such method would be inappropriate. The amortized cost method involves valuing a security at its cost on the date of purchase and thereafter assuming a constant amortization to maturity of the difference between such cost and the value on maturity date. Amortized cost approximates the current fair value of a security. Securities valued using the amortized cost method are not valued using quoted prices in an active market and are generally categorized as Level 2 in the hierarchy.
The information above is not intended to reflect an exhaustive list of the methodologies that may be used to value portfolio investments. The Valuation Procedures permit the use of a variety of valuation methodologies in connection with valuing portfolio investments. The methodology used for a specific type of investment may vary based on the market data available or other considerations. The methodologies
summarized above may not represent the specific means by which portfolio investments are valued on any particular business day.
(B) Income Taxes. The Fund's policy is to comply with the requirements of the Internal Revenue Code of 1986, as amended (the “Internal Revenue Code”), applicable to regulated investment companies and to distribute all of its taxable income to the shareholders of the Fund within the allowable time limits.
The Manager evaluates the Fund’s tax positions to determine if the tax positions taken meet the minimum recognition threshold in connection with accounting for uncertainties in income tax positions taken or expected to be taken for the purposes of measuring and recognizing tax liabilities in the financial statements. Recognition of tax benefits of an uncertain tax position is permitted only to the extent the position is “more likely than not” to be sustained assuming examination by taxing authorities. The Manager analyzed the Fund's tax positions taken on federal, state and local income tax returns for all open tax years (for up to three tax years) and has concluded that no provisions for federal, state and local income tax are required in the Fund's financial statements. The Fund's federal, state and local income tax and federal excise tax returns for tax years for which the applicable statutes of limitations have not expired are subject to examination by the Internal Revenue Service and state and local departments of revenue.
(C) Dividends and Distributions to Shareholders. Dividends and distributions are recorded on the ex-dividend date. The Fund intends to declare dividends from net investment income, if any, daily and intends to pay them at least monthly and pays distributions from net realized capital and currency gains, if any, at least annually. Unless a shareholder elects otherwise, all dividends and distributions are reinvested at NAV in the same class of shares of the Fund. Dividends and distributions to shareholders are determined in accordance with federal income tax regulations and may differ from determinations using GAAP.
(D) Security Transactions and Investment Income. The Fund records security transactions on the trade date. Realized gains and losses on security transactions are determined using the identified cost method. Interest income is accrued as earned using the effective interest rate method and includes any realized gains and losses from repayments of principal on mortgage-backed securities. Distributions received from real estate investment trusts may be classified as dividends, capital gains and/or return of capital. Discounts and premiums on securities purchased, other than temporary cash investments that mature in 60 days or less at the time of purchase, for the Fund are accreted and amortized, respectively, on the effective interest rate method.
Investment income and realized and unrealized gains and losses on investments of the Fund are allocated pro rata to the separate classes of shares based upon their relative net assets on the date the income is earned or realized and unrealized gains and losses are incurred.
The Fund may place a debt security on non-accrual status and reduce related interest income by ceasing current accruals and writing off all or a portion of any interest receivables when the collection of all or a portion of
| 34 | MainStay MacKay U.S. Infrastructure Bond Fund |
such interest has become doubtful. A debt security is removed from non-accrual status when the issuer resumes interest payments or when collectability of interest is reasonably assured.
(E) Expenses. Expenses of the Trust are allocated to the individual Funds in proportion to the net assets of the respective Funds when the expenses are incurred, except where direct allocations of expenses can be made. Expenses (other than transfer agent expenses and fees incurred under the shareholder services plans and/or the distribution plans further discussed in Note 3(B)) are allocated to separate classes of shares pro rata based upon their relative net assets on the date the expenses are incurred. The expenses borne by the Fund, including those of related parties to the Fund, are shown in the Statement of Operations.
Additionally, the Fund may invest in mutual funds, which are subject to management fees and other fees that may cause the costs of investing in mutual funds to be greater than the costs of owning the underlying securities directly. These indirect expenses of mutual funds are not included in the amounts shown as expenses in the Statement of Operations or in the expense ratios included in the Financial Highlights.
(F) Use of Estimates. In preparing financial statements in conformity with GAAP, the Manager makes estimates and assumptions that affect the reported amounts and disclosures in the financial statements. Actual results could differ from those estimates and assumptions.
(G) Futures Contracts. A futures contract is an agreement to purchase or sell a specified quantity of an underlying instrument at a specified future date and price, or to make or receive a cash payment based on the value of a financial instrument (e.g., foreign currency, interest rate, security or securities index). The Fund is subject to risks such as market price risk, leverage risk, liquidity risk, counterparty risk, operational risk, legal risk and/or interest rate risk in the normal course of investing in these contracts. Upon entering into a futures contract, the Fund is required to pledge to the broker or futures commission merchant an amount of cash and/or U.S. government securities equal to a certain percentage of the collateral amount, known as the “initial margin.” During the period the futures contract is open, changes in the value of the contract are recognized as unrealized appreciation or depreciation by marking to market such contract on a daily basis to reflect the market value of the contract at the end of each day’s trading. The Fund agrees to receive from or pay to the broker or futures commission merchant an amount of cash equal to the daily fluctuation in the value of the contract. Such receipts or payments are known as “variation margin.” When the futures contract is closed, the Fund records a realized gain or loss equal to the difference between the proceeds from (or cost of) the closing transaction and the Fund's basis in the contract.
The use of futures contracts involves, to varying degrees, elements of market risk in excess of the amount recognized in the Statement of Assets and Liabilities. The contract or notional amounts and variation margin reflect the extent of the Fund's involvement in open futures positions. There are several risks associated with the use of futures contracts as hedging techniques. There can be no assurance that a liquid
market will exist at the time when the Fund seeks to close out a futures contract. If no liquid market exists, the Fund would remain obligated to meet margin requirements until the position is closed. Futures contracts may involve a small initial investment relative to the risk assumed, which could result in losses greater than if the Fund did not invest in futures contracts. Futures contracts may be more volatile than direct investments in the instrument underlying the futures and may not correlate to the underlying instrument, causing a given hedge not to achieve its objectives. The Fund's activities in futures contracts have minimal counterparty risk as they are conducted through regulated exchanges that guarantee the futures against default by the counterparty. In the event of a bankruptcy or insolvency of a futures commission merchant that holds margin on behalf of the Fund, the Fund may not be entitled to the return of the entire margin owed to the Fund, potentially resulting in a loss. The Fund may invest in futures contracts to seek enhanced returns or to reduce the risk of loss by hedging certain of its holdings. The Fund's investment in futures contracts and other derivatives may increase the volatility of the Fund's NAVs and may result in a loss to the Fund. Open futures contracts as of October 31, 2022, are shown in the Portfolio of Investments.
(H) Securities Lending. In order to realize additional income, the Fund may engage in securities lending, subject to the limitations set forth in the 1940 Act and relevant guidance by the staff of the Securities and Exchange Commission (“SEC”). If the Fund engages in securities lending, the Fund will lend through its custodian, JPMorgan Chase Bank, N.A., ("JPMorgan"), acting as securities lending agent on behalf of the Fund. Under the current arrangement, JPMorgan will manage the Fund's collateral in accordance with the securities lending agency agreement between the Fund and JPMorgan, and indemnify the Fund against counterparty risk. The loans will be collateralized by cash (which may be invested in a money market fund) and/or non-cash collateral (which may include U.S. Treasury securities and/or U.S. government agency securities issued or guaranteed by the United States government or its agencies or instrumentalities) at least equal at all times to the market value of the securities loaned. Non-cash collateral held at year end is segregated and cannot be transferred by the Fund. The Fund bears the risk of delay in recovery of, or loss of rights in, the securities loaned. The Fund may also record a realized gain or loss on securities deemed sold due to a borrower’s inability to return securities on loan. The Fund bears the risk of any loss on investment of cash collateral. The Fund will receive compensation for lending its securities in the form of fees or it will retain a portion of interest earned on the investment of any cash collateral. The Fund will also continue to receive interest and dividends on the securities loaned and any gain or loss in the market price of the securities loaned that may occur during the term of the loan will be for the account of the Fund. Income earned from securities lending activities, if any, is reflected in the Statement of Operations. As of October 31, 2022, the Fund did not have any portfolio securities on loan.
(I) Government, Infrastructure Investment and Municipal Bond Risk. Investments in the Fund are not guaranteed, even though some of the Fund’s underlying investments are guaranteed by the U.S.
Notes to Financial Statements (continued)
government or its agencies or instrumentalities. The principal risk of mortgage-related and asset-backed securities is that the underlying debt may be prepaid ahead of schedule, if interest rates fall, thereby reducing the value of the Fund’s investment. If interest rates rise, less of the debt may be prepaid and the Fund may lose money because the Fund may be unable to invest in higher yielding assets. The Fund is subject to interest-rate risk and can lose principal value when interest rates rise. Bonds are also subject to credit risk, in which the bond issuer may fail to pay interest and principal in a timely manner.
The Fund’s investments in infrastructure-related securities will expose the Fund to potential adverse economic, regulatory, political, legal and other changes affecting such investments. Issuers of securities in infrastructure-related businesses are subject to a variety of factors that may adversely affect their business or operations, including high interest costs in connection with capital construction programs, high leverage, costs associated with environmental or other regulations and the effects of economic slowdowns. Rising interest rates could lead to higher financing costs and reduced earnings for infrastructure companies.
Municipal bond risks include the inability of the issuer to repay the obligation, the relative lack of information about certain issuers, and the possibility of future tax and legislative changes, which could affect the market for and value of municipal securities.
Municipalities continue to experience political, economic and financial difficulties in the current economic environment. The ability of a municipal issuer to make payments and the value of municipal bonds can be affected by uncertainties in the municipal securities market. Such uncertainties could cause increased volatility in the municipal securities market and could negatively impact the Fund’s net asset value, and/or the distributions paid by the Fund.
(J) LIBOR Replacement Risk. The Fund may invest in certain debt securities, derivatives or other financial instruments that utilize the London Interbank Offered Rate ("LIBOR"), as a “benchmark” or “reference rate” for various interest rate calculations. As of January 1, 2022, the United Kingdom Financial Conduct Authority, which regulates LIBOR, ceased its active encouragement of banks to provide the quotations needed to sustain most LIBOR rates due to the absence of an active market for interbank unsecured lending and other reasons. However, the United Kingdom Financial Conduct Authority, the LIBOR administrator and other regulators announced that certain sterling and yen LIBOR settings would be calculated on a "synthetic" basis through the end of 2022 and the most widely used tenors of U.S. dollar LIBOR will continue until mid-2023. As a result, it is anticipated that the remaining LIBOR settings will be discontinued or will no longer be sufficiently robust to be representative of its underlying market around that time. Various financial industry groups will plan for that transition and certain regulators and industry groups have taken actions to establish alternative reference rates (e.g., the Secured Overnight Financing Rate, which measures the cost of overnight borrowings through repurchase agreement transactions collateralized with U.S. Treasury securities and is intended to replace U.S. dollar LIBOR with certain adjustments). However, there are challenges to
converting certain contracts and transactions to a new benchmark and neither the full effects of the transition process nor its ultimate outcome is known.
The elimination of LIBOR or changes to other reference rates or any other changes or reforms to the determination or supervision of reference rates could have an adverse impact on the market for, or value of, any securities or payments linked to those reference rates, which may adversely affect the Fund's performance and/or net asset value. Uncertainty and risk also remain regarding the willingness and ability of issuers and lenders to include enhanced provisions in new and existing contracts or instruments. Consequently, the transition away from LIBOR to other reference rates may lead to increased volatility and illiquidity in markets that are tied to LIBOR, fluctuations in values of LIBOR-related investments or investments in issuers that utilize LIBOR, increased difficulty in borrowing or refinancing and diminished effectiveness of hedging strategies, adversely affecting the Fund's performance. Furthermore, the risks associated with the expected discontinuation of LIBOR and transition may be exacerbated if the work necessary to effect an orderly transition to an alternative reference rate is not completed in a timely manner. While the transition away from LIBOR has already begun with no material adverse effect to the Fund's performance, the transition is expected to last through mid-2023 for some LIBOR tenors. The usefulness of LIBOR as a benchmark could deteriorate anytime during this transition period.
(K) Indemnifications. Under the Trust’s organizational documents, its officers and trustees are indemnified against certain liabilities that may arise out of performance of their duties to the Trust. Additionally, in the normal course of business, the Fund enters into contracts with third-party service providers that contain a variety of representations and warranties and that may provide general indemnifications. The Fund's maximum exposure under these arrangements is unknown, as this would involve future claims that may be made against the Fund that have not yet occurred. The Manager believes that the risk of loss in connection with these potential indemnification obligations is remote. However, there can be no assurance that material liabilities related to such obligations will not arise in the future, which could adversely impact the Fund.
(L) Quantitative Disclosure of Derivative Holdings. The following tables show additional disclosures related to the Fund's derivative and hedging activities, including how such activities are accounted for and their effect on the Fund's financial positions, performance and cash flows.
The Fund entered into futures contracts to help manage the duration and yield curve positioning of the portfolio. These derivatives are not accounted for as hedging instruments.
| 36 | MainStay MacKay U.S. Infrastructure Bond Fund |
Fair value of derivative instruments as of October 31, 2022:
| Asset Derivatives | Interest
Rate
Contracts
Risk | Total |
| Futures Contracts - Net Assets—Net unrealized appreciation on futures contracts (a) | $1,701,802 | $1,701,802 |
| Total Fair Value | $1,701,802 | $1,701,802 |
| (a) | Includes cumulative appreciation (depreciation) of futures contracts as reported in the Portfolio of Investments. Only current day’s variation margin is reported within the Statement of Assets and Liabilities. |
The effect of derivative instruments on the Statement of Operations for the year ended October 31, 2022:
| Net Realized Gain (Loss) from: | Interest
Rate
Contracts
Risk | Total |
| Futures Contracts | $5,542,123 | $5,542,123 |
| Total Net Realized Gain (Loss) | $5,542,123 | $5,542,123 |
| Net Change in Unrealized Appreciation (Depreciation) | Interest
Rate
Contracts
Risk | Total |
| Futures Contracts | $1,128,320 | $1,128,320 |
| Total Net Change in Unrealized Appreciation (Depreciation) | $1,128,320 | $1,128,320 |
| Average Notional Amount | Total |
| Futures Contracts Short | $(42,284,818) |
Note 3–Fees and Related Party Transactions
(A) Manager and Subadvisor. New York Life Investments, a registered investment adviser and an indirect, wholly-owned subsidiary of New York Life Insurance Company ("New York Life"), serves as the Fund's Manager, pursuant to an Amended and Restated Management Agreement ("Management Agreement"). The Manager provides offices, conducts clerical, recordkeeping and bookkeeping services and keeps most of the financial and accounting records required to be maintained by the Fund. Except for the portion of salaries and expenses that are the responsibility of the Fund, the Manager pays the salaries and expenses of all personnel affiliated with the Fund and certain operational expenses of the Fund. During a portion of the year ended October 31, 2022, the Fund reimbursed New York Life Investments in an amount equal to the portion of the compensation of the Chief Compliance Officer attributable to the Fund. MacKay Shields LLC ("MacKay Shields" or the "Subadvisor"), a registered investment adviser and an indirect, wholly-owned subsidiary of New York Life, serves as the Subadvisor to the Fund and is responsible for the day-to-day portfolio management of the Fund. Pursuant to the terms of an Amended and Restated Subadvisory Agreement
("Subadvisory Agreement") between New York Life Investments and MacKay Shields, New York Life Investments pays for the services of the Subadvisor.
Pursuant to the Management Agreement, the Fund pays the Manager a monthly fee for the services performed and the facilities furnished at an annual rate of the Fund’s average daily net assets as follows: 0.50% up to $500 million; 0.475% from $500 million to $1 billion; and 0.45% in excess of $1 billion. During the year ended October 31, 2022, the effective management fee rate was 0.50% of the Fund’s average daily net assets, exclusive of any applicable waivers/reimbursements.
New York Life Investments has contractually agreed to waive fees and/or reimburse expenses so that Total Annual Fund Operating Expenses (excluding taxes, interest, litigation, extraordinary expenses, brokerage and other transaction expenses relating to the purchase or sale of portfolio investments and acquired (underlying) fund fees and expenses) do not exceed the following percentages of daily net assets: Class A, 0.85% and Class R6, 0.53%. New York Life Investments will apply an equivalent waiver or reimbursement, in an equal number of basis points of basis points of the Class A shares waiver/ reimbursement to Investor Class, Class B, Class C and Class I shares. This agreement will remain in effect until February 28, 2023, and shall renew automatically for one-year terms unless New York Life Investments provides written notice of termination prior to the start of the next term or upon approval of the Board.
During the year ended October 31, 2022, New York Life Investments earned fees from the Fund in the amount of $2,861,914 and waived fees and/or reimbursed expenses, including the waiver/reimbursement of certain class specific expenses in the amount of $622,639 and paid the Subadvisor fees in the amount of $1,119,638.
JPMorgan Chase Bank, N.A. ("JPMorgan") provides sub-administration and sub-accounting services to the Fund pursuant to an agreement with New York Life Investments. These services include calculating the daily NAVs of the Fund, maintaining the general ledger and sub-ledger accounts for the calculation of the Fund's NAVs, and assisting New York Life Investments in conducting various aspects of the Fund's administrative operations. For providing these services to the Fund, JPMorgan is compensated by New York Life Investments.
Pursuant to an agreement between the Trust and New York Life Investments, New York Life Investments is responsible for providing or procuring certain regulatory reporting services for the Fund. The Fund will reimburse New York Life Investments for the actual costs incurred by New York Life Investments in connection with providing or procuring these services for the Fund.
(B) Distribution and Service Fees. The Trust, on behalf of the Fund, has entered into a distribution agreement with NYLIFE Distributors LLC (the “Distributor”), an affiliate of New York Life Investments. The Fund has adopted distribution plans (the “Plans”) in accordance with the provisions of Rule 12b-1 under the 1940 Act.
Notes to Financial Statements (continued)
Pursuant to the Class A and Investor Class Plans, the Distributor receives a monthly fee from the Class A and Investor Class shares at an annual rate of 0.25% of the average daily net assets of the Class A and Investor Class shares for distribution and/or service activities as designated by the Distributor. Pursuant to the Class B and Class C Plans, Class B and Class C shares pay the Distributor a monthly distribution fee at an annual rate of 0.75% of the average daily net assets of the Class B and Class C shares along with a service fee at an annual rate of 0.25% of the average daily net assets of the Class B and Class C shares, for a total 12b-1 fee of 1.00%. Class I and Class R6 shares are not subject to a distribution and/or service fee.
The Plans provide that the distribution and service fees are payable to the Distributor regardless of the amounts actually expended by the Distributor for distribution of the Fund's shares and service activities.
(C) Sales Charges. The Fund was advised by the Distributor that the amount of initial sales charges retained on sales of Class A and Investor Class shares during the year ended October 31, 2022, were $2,615 and $1,205, respectively.
The Fund was also advised that the Distributor retained CDSCs on redemptions of Class A and Investor Class shares during the year ended October 31, 2022, of $22,814 and $9, respectively.
(D) Transfer, Dividend Disbursing and Shareholder Servicing Agent. NYLIM Service Company LLC, an affiliate of New York Life Investments, is the Fund's transfer, dividend disbursing and shareholder servicing agent pursuant to an agreement between NYLIM Service Company LLC and the Trust. NYLIM Service Company LLC has entered into an agreement with DST Asset Manager Solutions, Inc. ("DST"), pursuant to which DST performs certain transfer agent services on behalf of NYLIM Service Company LLC. New York Life Investments has contractually agreed to limit the transfer agency expenses charged to the Fund’s share classes to a maximum of 0.35% of that share class’s average daily net assets on an annual basis after deducting any applicable Fund or class-level expense reimbursement or small account fees. This agreement will remain in effect until February 28, 2023, and shall renew automatically for one-year terms unless New York Life Investments provides written notice of termination prior to the start of the next term or upon approval of the Board. During the year ended October 31, 2022, transfer agent expenses incurred by the Fund and any reimbursements, pursuant to the aforementioned Transfer Agency expense limitation agreement, were as follows:
| Class | Expense | Waived |
| Class A | $151,119 | $— |
| Investor Class | 69,074 | — |
| Class B | 4,111 | — |
| Class C | 33,528 | — |
| Class I | 535,301 | — |
| Class R6 | 5,296 | — |
(E) Small Account Fee. Shareholders with small accounts adversely impact the cost of providing transfer agency services. In an effort to reduce total transfer agency expenses, the Fund has implemented a small account fee on certain types of accounts. As described in the Fund's prospectus, certain shareholders with an account balance of less than $1,000 ($5,000 for Class A share accounts) are charged an annual per account fee of $20 (assessed semi-annually), the proceeds from which offset transfer agent fees as reflected in the Statement of Operations. This small account fee will not apply to certain types of accounts as described further in the Fund’s prospectus.
(F) Capital. As of October 31, 2022, New York Life and its affiliates beneficially held shares of the Fund with the values and percentages of net assets as follows:
| ‡ | Less than one-tenth of a percent. |
Note 4-Federal Income Tax
As of October 31, 2022, the cost and unrealized appreciation (depreciation) of the Fund’s investment portfolio, including applicable derivative contracts and other financial instruments, as determined on a federal income tax basis, were as follows:
| | Federal Tax
Cost | Gross
Unrealized
Appreciation | Gross
Unrealized
(Depreciation) | Net
Unrealized
Appreciation/
(Depreciation) |
| Investments in Securities | $556,564,046 | $253,991 | $(34,398,847) | $(34,144,856) |
As of October 31, 2022, the components of accumulated gain (loss) on a tax basis were as follows:
Ordinary
income | Accumulated
Capital
and Other
Gain (Loss) | Other
Temporary
Differences | Unrealized
Appreciation
(Depreciation) | Total
Accumulated
Gain (Loss) |
| $553,822 | $(61,532,347) | $(475,233) | $(34,144,856) | $(95,598,614) |
The difference between book-basis and tax-basis unrealized appreciation (depreciation) is primarily due to mark to market of futures contracts, cumulative bond amortization and wash sales adjustments.
As of October 31, 2022, for federal income tax purposes, capital loss carryforwards of $61,532,347, as shown in the table below, were available to the extent provided by the regulations to offset future realized gains of the Fund. Accordingly, no capital gains distributions are expected to be paid to shareholders until net gains have been realized in excess of such amounts.
Capital Loss
Available Through | Short-Term
Capital Loss
Amounts (000’s) | Long-Term
Capital Loss
Amounts (000’s) |
| Unlimited | $34,774 | $26,758 |
| 38 | MainStay MacKay U.S. Infrastructure Bond Fund |
During the years ended October 31, 2022 and October 31, 2021, the tax character of distributions paid as reflected in the Statements of Changes in Net Assets was as follows:
| | 2022 | 2021 |
| Distributions paid from: | | |
| Ordinary Income | $16,251,597 | $16,183,629 |
| Long-Term Capital Gains | 2,804,355 | — |
| Total | $19,055,952 | $16,183,629 |
Note 5–Custodian
JPMorgan is the custodian of cash and securities held by the Fund. Custodial fees are charged to the Fund based on the Fund's net assets and/or the market value of securities held by the Fund and the number of certain transactions incurred by the Fund.
Note 6–Line of Credit
The Fund and certain other funds managed by New York Life Investments maintain a line of credit with a syndicate of banks in order to secure a source of funds for temporary purposes to meet unanticipated or excessive redemption requests.
Effective July 26, 2022, under the credit agreement (the “Credit Agreement”), the aggregate commitment amount is $600,000,000 with an additional uncommitted amount of $100,000,000. The commitment fee is an annual rate of 0.15% of the average commitment amount payable quarterly, regardless of usage, to JPMorgan, who serves as the agent to the syndicate. The commitment fee is allocated among the Fund and certain other funds managed by New York Life Investments based upon their respective net assets and other factors. Interest on any revolving credit loan is charged based upon the Federal Funds Rate, Daily Simple Secured Overnight Financing Rate ("SOFR") + 0.10%, or the Overnight Bank Funding Rate, whichever is higher. The Credit Agreement expires on July 25, 2023, although the Fund, certain other funds managed by New York Life Investments and the syndicate of banks may renew the Credit Agreement for an additional year on the same or different terms or enter into a credit agreement with a different syndicate of banks. Prior to July 26, 2022, the aggregate commitment amount and the commitment fee were the same as those under the current Credit Agreement. During the year ended October 31, 2022, there were no borrowings made or outstanding with respect to the Fund under the Credit Agreement.
Note 7–Interfund Lending Program
Pursuant to an exemptive order issued by the SEC, the Fund, along with certain other funds managed by New York Life Investments, may participate in an interfund lending program. The interfund lending program provides an alternative credit facility that permits the Fund and certain other funds managed by New York Life Investments to lend or borrow money for temporary purposes directly to or from one another, subject to the conditions of the exemptive order. During the year ended
October 31, 2022, there were no interfund loans made or outstanding with respect to the Fund.
Note 8–Purchases and Sales of Securities (in 000’s)
During the year ended October 31, 2022, purchases and sales of securities, other than short-term securities, were $923,830 and $917,376, respectively.
Note 9–Capital Share Transactions
Transactions in capital shares for the years ended October 31, 2022 and October 31, 2021, were as follows:
| Class A | Shares | Amount |
| Year ended October 31, 2022: | | |
| Shares sold | 1,339,045 | $ 10,623,586 |
| Shares issued to shareholders in reinvestment of distributions | 338,782 | 2,751,730 |
| Shares redeemed | (4,065,381) | (32,494,364) |
| Net increase (decrease) in shares outstanding before conversion | (2,387,554) | (19,119,048) |
| Shares converted into Class A (See Note 1) | 136,281 | 1,091,052 |
| Net increase (decrease) | (2,251,273) | $ (18,027,996) |
| Year ended October 31, 2021: | | |
| Shares sold | 3,243,597 | $ 28,520,389 |
| Shares issued to shareholders in reinvestment of distributions | 312,146 | 2,745,125 |
| Shares redeemed | (2,814,703) | (24,731,219) |
| Net increase (decrease) in shares outstanding before conversion | 741,040 | 6,534,295 |
| Shares converted into Class A (See Note 1) | 233,023 | 2,040,783 |
| Net increase (decrease) | 974,063 | $ 8,575,078 |
| |
Notes to Financial Statements (continued)
| Investor Class | Shares | Amount |
| Year ended October 31, 2022: | | |
| Shares sold | 49,196 | $ 406,321 |
| Shares issued to shareholders in reinvestment of distributions | 55,770 | 453,075 |
| Shares redeemed | (211,433) | (1,711,769) |
| Net increase (decrease) in shares outstanding before conversion | (106,467) | (852,373) |
| Shares converted into Investor Class (See Note 1) | 24,384 | 197,255 |
| Shares converted from Investor Class (See Note 1) | (36,410) | (294,644) |
| Net increase (decrease) | (118,493) | $ (949,762) |
| Year ended October 31, 2021: | | |
| Shares sold | 46,213 | $ 407,507 |
| Shares issued to shareholders in reinvestment of distributions | 49,608 | 438,291 |
| Shares redeemed | (192,589) | (1,701,261) |
| Net increase (decrease) in shares outstanding before conversion | (96,768) | (855,463) |
| Shares converted into Investor Class (See Note 1) | 41,622 | 365,724 |
| Shares converted from Investor Class (See Note 1) | (104,097) | (921,180) |
| Net increase (decrease) | (159,243) | $ (1,410,919) |
| |
| Class B | Shares | Amount |
| Year ended October 31, 2022: | | |
| Shares sold | 908 | $ 7,260 |
| Shares issued to shareholders in reinvestment of distributions | 2,398 | 19,643 |
| Shares redeemed | (31,334) | (256,127) |
| Net increase (decrease) in shares outstanding before conversion | (28,028) | (229,224) |
| Shares converted from Class B (See Note 1) | (39,207) | (316,544) |
| Net increase (decrease) | (67,235) | $ (545,768) |
| Year ended October 31, 2021: | | |
| Shares sold | 3,916 | $ 34,199 |
| Shares issued to shareholders in reinvestment of distributions | 2,946 | 25,919 |
| Shares redeemed | (25,637) | (225,034) |
| Net increase (decrease) in shares outstanding before conversion | (18,775) | (164,916) |
| Shares converted from Class B (See Note 1) | (44,355) | (389,025) |
| Net increase (decrease) | (63,130) | $ (553,941) |
| |
| Class C | Shares | Amount |
| Year ended October 31, 2022: | | |
| Shares sold | 1,674,506 | $ 13,419,612 |
| Shares issued to shareholders in reinvestment of distributions | 19,536 | 155,146 |
| Shares redeemed | (1,432,935) | (11,189,460) |
| Net increase (decrease) in shares outstanding before conversion | 261,107 | 2,385,298 |
| Shares converted from Class C (See Note 1) | (25,380) | (202,703) |
| Net increase (decrease) | 235,727 | $ 2,182,595 |
| Year ended October 31, 2021: | | |
| Shares sold | 199,251 | $ 1,753,337 |
| Shares issued to shareholders in reinvestment of distributions | 14,417 | 126,836 |
| Shares redeemed | (378,685) | (3,316,090) |
| Net increase (decrease) in shares outstanding before conversion | (165,017) | (1,435,917) |
| Shares converted from Class C (See Note 1) | (86,340) | (748,419) |
| Net increase (decrease) | (251,357) | $ (2,184,336) |
| |
| Class I | Shares | Amount |
| Year ended October 31, 2022: | | |
| Shares sold | 30,421,882 | $ 247,802,802 |
| Shares issued to shareholders in reinvestment of distributions | 1,184,397 | 9,631,745 |
| Shares redeemed | (27,984,055) | (225,779,233) |
| Net increase (decrease) in shares outstanding before conversion | 3,622,224 | 31,655,314 |
| Shares converted into Class I (See Note 1) | 1,613 | 12,578 |
| Shares converted from Class I (See Note 1) | (27,235) | (204,537) |
| Net increase (decrease) | 3,596,602 | $ 31,463,355 |
| Year ended October 31, 2021: | | |
| Shares sold | 23,803,402 | $ 211,714,321 |
| Shares issued to shareholders in reinvestment of distributions | 906,427 | 8,061,200 |
| Shares redeemed | (20,410,262) | (181,052,686) |
| Net increase (decrease) | 4,299,567 | $ 38,722,835 |
| |
| 40 | MainStay MacKay U.S. Infrastructure Bond Fund |
| Class R6 | Shares | Amount |
| Year ended October 31, 2022: | | |
| Shares sold | 6,403,249 | $ 51,303,512 |
| Shares issued to shareholders in reinvestment of distributions | 36,712 | 309,000 |
| Shares redeemed | (8,157,515) | (64,821,149) |
| Net increase (decrease) in shares outstanding before conversion | (1,717,554) | (13,208,637) |
| Shares converted from Class R6 (See Note 1) | (33,326) | (282,457) |
| Net increase (decrease) | (1,750,880) | $ (13,491,094) |
| Year ended October 31, 2021: | | |
| Shares sold | 8,698,022 | $ 77,406,416 |
| Shares issued to shareholders in reinvestment of distributions | 29,780 | 264,959 |
| Shares redeemed | (1,160,797) | (10,335,990) |
| Net increase (decrease) in shares outstanding before conversion | 7,567,005 | 67,335,385 |
| Shares converted from Class R6 (See Note 1) | (39,110) | (347,883) |
| Net increase (decrease) | 7,527,895 | $ 66,987,502 |
Note 10–Other Matters
As of the date of this report, interest rates in the United States and many parts of the world, including certain European countries, are ascending from historically low levels. Thus, the Fund currently faces a heightened level of risk associated with rising interest rates. This could be driven by a variety of factors, including but not limited to central bank monetary policies, changing inflation or real growth rates, general economic conditions, increasing bond issuances or reduced market demand for low yielding investments.
An outbreak of COVID-19, first detected in December 2019, has developed into a global pandemic and has resulted in travel restrictions, closure of international borders, certain businesses and securities markets, restrictions on securities trading activities, prolonged quarantines, supply chain disruptions, and lower consumer demand, as well as general concern and uncertainty. In 2022, many countries lifted some or all restrictions related to COVID-19. However, the continued impact of COVID-19 and related variants is uncertain and could further adversely affect the global economy, national economies, individual issuers and capital markets in unforeseeable ways and result in a substantial and extended economic downturn. Developments that disrupt global economies and financial markets, such as COVID-19, may magnify factors that affect the Fund's performance.
Note 11–Subsequent Events
In connection with the preparation of the financial statements of the Fund as of and for the year ended October 31, 2022, events and transactions subsequent to October 31, 2022, through the date the financial statements were issued have been evaluated by the Manager for possible
adjustment and/or disclosure. No subsequent events requiring financial statement adjustment or disclosure have been identified.
Report of Independent Registered Public Accounting Firm
To the Shareholders of the Fund and Board of Trustees
The MainStay Funds:
Opinion on the Financial Statements
We have audited the accompanying statement of assets and liabilities of MainStay MacKay U.S. Infrastructure Bond Fund (the Fund), one of the funds constituting The MainStay Funds, including the portfolio of investments, as of October 31, 2022, the related statement of operations for the year then ended, the statements of changes in net assets for each of the years in the two-year period then ended, and the related notes (collectively, the financial statements) and the financial highlights for each of the years or periods in the five-year period then ended. In our opinion, the financial statements and financial highlights present fairly, in all material respects, the financial position of the Fund as of October 31, 2022, the results of its operations for the year then ended, the changes in its net assets for each of the years in the two-year period then ended, and the financial highlights for each of the years or periods in the five-year period then ended, in conformity with U.S. generally accepted accounting principles.
Basis for Opinion
These financial statements and financial highlights are the responsibility of the Fund's management. Our responsibility is to express an opinion on these financial statements and financial highlights based on our audits. We are a public accounting firm registered with the Public Company Accounting Oversight Board (United States) (PCAOB) and are required to be independent with respect to the Fund in accordance with the U.S. federal securities laws and the applicable rules and regulations of the Securities and Exchange Commission and the PCAOB.
We conducted our audits in accordance with the standards of the PCAOB. Those standards require that we plan and perform the audit to obtain reasonable assurance about whether the financial statements and financial highlights are free of material misstatement, whether due to error or fraud. Our audits included performing procedures to assess the risks of material misstatement of the financial statements and financial highlights, whether due to error or fraud, and performing procedures that respond to those risks. Such procedures included examining, on a test basis, evidence regarding the amounts and disclosures in the financial statements and financial highlights. Such procedures also included confirmation of securities owned as of October 31, 2022, by correspondence with the custodian, the transfer agent and brokers; when replies were not received from brokers, we performed other auditing procedures. Our audits also included evaluating the accounting principles used and significant estimates made by management, as well as evaluating the overall presentation of the financial statements and financial highlights. We believe that our audits provide a reasonable basis for our opinion.

We have served as the auditor of one or more New York Life Investment Management investment companies since 2003.
Philadelphia, Pennsylvania
December 23, 2022
| 42 | MainStay MacKay U.S. Infrastructure Bond Fund |
Federal Income Tax Information
(Unaudited)
The Fund is required under the Internal Revenue Code to advise shareholders in a written statement as to the federal tax status of dividends paid by the Fund during such fiscal years.
Accordingly, the Fund paid $2,804,490 as long term capital gain distributions.
In February 2023, shareholders will receive an IRS Form 1099-DIV or substitute Form 1099, which will show the federal tax status of the distributions received by shareholders in calendar year 2022. The amounts that will be reported on such 1099-DIV or substitute Form 1099 will be the amounts you are to use on your federal income tax return and will differ from the amounts which we must report for the Fund's fiscal year ended October 31, 2022.
Proxy Voting Policies and Procedures and Proxy Voting Record
The Fund is required to file with the SEC its proxy voting record for the 12-month period ending June 30 on Form N-PX. A description of the policies and procedures that are used to vote proxies relating to portfolio securities of the Fund is available free of charge upon request by calling 800-624-6782 or visiting the SEC’s website at www.sec.gov. The most recent Form N-PX or proxy voting record is available free of charge upon request by calling 800-624-6782; visiting newyorklifeinvestments.com; or visiting the SEC’s website at www.sec.gov.
Shareholder Reports and Quarterly Portfolio Disclosure
The Fund is required to file its complete schedule of portfolio holdings with the SEC 60 days after its first and third fiscal quarter on Form N-PORT. The Fund's holdings report is available free of charge upon request by calling New York Life Investments at 800-624-6782.
Board of Trustees and Officers (Unaudited)
The Trustees and officers of the Fund are listed below. The Board oversees the MainStay Group of Funds (which consists of MainStay Funds and MainStay Funds Trust), MainStay VP Funds Trust, MainStay MacKay DefinedTerm Municipal Opportunities Fund, MainStay CBRE Global Infrastructure Megatrends Fund, the Manager and the Subadvisors, and elects the officers of the Funds who are responsible for the day-to-day operations of the Fund. Information pertaining to the Trustees and officers is set forth below. Each Trustee serves until his or her successor is
elected and qualified or until his or her resignation, death or removal. Under the Board’s retirement policy, unless an exception is made, a Trustee must tender his or her resignation by the end of the calendar year during which he or she reaches the age of 75. The business address of each Trustee and officer listed below is 51 Madison Avenue, New York, New York 10010. None of the Trustees are “interested persons” (as defined by the 1940 Act and rules adopted by the SEC thereunder) of the Fund (“Independent Trustees”).
| | Name and
Year of Birth | Term of Office,
Position(s) Held and
Length of Service | Principal Occupation(s)
During Past Five Years | Number of
Portfolios in
Fund Complex
Overseen by
Trustee | Other Directorships
Held by Trustee |
| | | | | | |
| | David H. Chow
1957 | MainStay Funds: Trustee since 2016, Advisory Board Member (June 2015 to December 2015);MainStay Funds Trust:
Trustee since January 2016, Advisory Board Member (June 2015 to December 2015) | Founder and CEO, DanCourt Management, LLC since 1999 | 78 | MainStay VP Funds Trust: Trustee since January 2016, Advisory Board Member (June 2015 to December 2015) (31 portfolios);
MainStay MacKay DefinedTerm Municipal Opportunities Fund: Trustee since January 2016, Advisory Board Member (June 2015 to December 2015);
MainStay CBRE Global Infrastructure Megatrends Fund: Trustee since June 2021; VanEck Vectors Group of Exchange-Traded Funds: Independent Chairman of the Board of Trustees since 2008 and Trustee since 2006 (56 portfolios); and Berea College of Kentucky: Trustee since 2009, Chair of the Investment Committee since 2018 |
| | Susan B. Kerley
1951 | MainStay Funds: Chairman since 2017 and Trustee since 2007;MainStay Funds Trust:
Chairman since 2017 and Trustee since 1990** | President, Strategic Management Advisors LLC since 1990 | 78 | MainStay VP Funds Trust: Chairman since January 2017 and Trustee since 2007 (31 portfolios)**;
MainStay MacKay DefinedTerm Municipal Opportunities Fund: Chairman since 2017 and Trustee since 2011;
MainStay CBRE Global Infrastructure Megatrends Fund: Trustee since June 2021; and Legg Mason Partners Funds: Trustee since 1991 (45 portfolios) |
| | Alan R. Latshaw
1951 | MainStay Funds: Trustee since 2006;MainStay Funds Trust:
Trustee since 2007*** | Retired; Partner, Ernst & Young LLP (2002 to 2003); Partner, Arthur Andersen LLP (1989 to 2002); Consultant to the MainStay Funds Audit and Compliance Committee (2004 to 2006) | 78 | MainStay VP Funds Trust: Trustee since 2007 (31 portfolios)**;
MainStay MacKay DefinedTerm Municipal Opportunities Fund: Trustee since 2011; and
MainStay CBRE Global Infrastructure Megatrends Fund: Trustee since June 2021 |
| 44 | MainStay MacKay U.S. Infrastructure Bond Fund |
| | Name and
Year of Birth | Term of Office,
Position(s) Held and
Length of Service | Principal Occupation(s)
During Past Five Years | Number of
Portfolios in
Fund Complex
Overseen by
Trustee | Other Directorships
Held by Trustee |
| | | | | | |
| | Karen Hammond
1956 | MainStay Funds: Trustee since December 2021, Advisory Board Member (June 2021 to December 2021);MainStay Funds Trust:
Trustee since December 2021, Advisory Board Member (June 2021 to December 2021)
| Retired, Managing Director, Devonshire Investors (2007 to 2013); Senior Vice President, Fidelity Management & Research Co. (2005 to 2007); Senior Vice President and Corporate Treasurer, FMR Corp. (2003 to 2005); Chief Operating Officer, Fidelity Investments Japan (2001 to 2003) | 78 | MainStay VP Funds Trust: Trustee since December 2021, Advisory Board Member (June 2021 to December 2021) (31 Portfolios);
MainStay MacKay DefinedTerm Municipal Opportunities Fund: Trustee since December 2021, Advisory Board Member (June 2021 to December 2021);
MainStay CBRE Global Infrastructure Megatrends Fund: Trustee since December 2021, Advisory Board Member (June 2021 to December 2021);
Two Harbors Investment Corp.: Director since 2018;
Rhode Island State Investment Commission: Member since 2017; and
Blue Cross Blue Shield of Rhode Island: Director since 2019 |
| | Jacques P. Perold
1958 | MainStay Funds: Trustee since 2016, Advisory Board Member (June 2015 toDecember 2015);MainStay Funds Trust:
Trustee since January 2016, Advisory Board Member (June 2015 to December 2015) | Founder and Chief Executive Officer, CapShift Advisors LLC (since 2018); President, Fidelity Management & Research Company (2009 to 2014); President and Chief Investment Officer, Geode Capital Management, LLC (2001 to 2009) | 78 | MainStay VP Funds Trust: Trustee since January 2016, Advisory Board Member (June 2015 to December 2015) (31 portfolios);
MainStay MacKay DefinedTerm Municipal Opportunities Fund: Trustee since January 2016, Advisory Board Member (June 2015 to December 2015);
MainStay CBRE Global Infrastructure Megatrends Fund: Trustee since June 2021; Partners in Health: Trustee since 2019; Allstate Corporation: Director since 2015; and MSCI Inc.: Director since 2017 |
| | Richard S. Trutanic
1952 | MainStay Funds: Trustee since 1994;MainStay Funds Trust:
Trustee since 2007*** | Chairman and Chief Executive Officer, Somerset & Company (financial advisory firm) since 2004; Managing Director, The Carlyle Group (private investment firm) (2002 to 2004); Senior Managing Director, Partner and Board Member, Groupe Arnault S.A. (private investment firm) (1999 to 2002) | 78 | MainStay VP Funds Trust: Trustee since 2007 (31 portfolios)**;
MainStay MacKay DefinedTerm Municipal Opportunities Fund: Trustee since 2011; and MainStay CBRE Global Infrastructure Megatrends Fund: Trustee since June 2021 |
| ** | Includes prior service as a Director of MainStay VP Series Fund, Inc., the predecessor to MainStay VP Funds Trust. |
| *** | Includes prior service as a Director/Trustee of certain predecessor entities to MainStay Funds Trust. |
Board of Trustees and Officers (Unaudited) (continued)
| | Name and
Year of Birth | Position(s) Held and
Length of Service | Principal Occupation(s)
During Past Five Years | |
| | | | | |
| | Kirk C. Lehneis
1974 | President, MainStay Funds, MainStay Funds Trust since 2017 | Chief Operating Officer and Senior Managing Director (since 2016), New York Life Investment Management LLC and New York Life Investment Management Holdings LLC; Member of the Board of Managers (since 2017) and Senior Managing Director (since 2018), NYLIFE Distributors LLC; Chairman of the Board and Senior Managing Director, NYLIM Service Company LLC (since 2017); Trustee, President and Principal Executive Officer of IndexIQ Trust, IndexIQ ETF Trust and IndexIQ Active ETF Trust (since January 2018); President, MainStay CBRE Global Infrastructure Megatrends Fund (since 2021), MainStay MacKay DefinedTerm Municipal Opportunities Fund and MainStay VP Funds Trust (since 2017); Senior Managing Director, Global Product Development (From 2015-2016); Managing Director, Product Development (2010 to 2015), New York Life Investment Management LLC | |
| | Jack R. Benintende
1964 | Treasurer and Principal Financial and Accounting Officer, MainStay Funds (since 2007), MainStay Funds Trust (since 2009) | Managing Director, New York Life Investment Management LLC (since 2007); Treasurer and Principal Financial and Accounting Officer, MainStay CBRE Global Infrastructure Megatrends Fund (since 2021), MainStay MacKay DefinedTerm Municipal Opportunities Fund (since 2011) and MainStay VP Funds Trust (since 2007)** and Assistant Treasurer, New York Life Investment Management Holdings LLC (2008 to 2012) | |
| | J. Kevin Gao
1967 | Secretary and Chief Legal Officer, MainStay Funds and MainStay Funds Trust (since 2010) | Managing Director and Associate General Counsel, New York Life Investment Management LLC (since 2010); Secretary and Chief Legal Officer and MainStay CBRE Global Infrastructure Megatrends Fund (since 2021), MainStay MacKay DefinedTerm Municipal Opportunities Fund (since 2011) and MainStay VP Funds Trust (since 2010)** | |
| | Scott T. Harrington
1959 | Vice President— Administration, MainStay Funds (since 2009), MainStay Funds Trust (since 2009) | Managing Director, New York Life Investment Management LLC (including predecessor advisory organizations) (since 2000); Member of the Board of Directors, New York Life Trust Company (since 2009); Vice President—Administration, MainStay CBRE Global Infrastructure Megatrends Fund (since 2021), MainStay MacKay DefinedTerm Municipal Opportunities Fund (since 2011) and MainStay VP Funds Trust (since 2005)** | |
| | Kevin M. Gleason
1967 | Vice President and Chief Compliance Officer, MainStay Funds and MainStay Funds Trust (since June 2022) | Vice President and Chief Compliance Officer, IndexIQ, IndexIQ ETF Trust and Index IQ Active ETF Trust (since June 2022); Vice President and Chief Compliance Officer, MainStay CBRE Global Infrastructure Megatrends Fund, MainStay VP Funds Trust and MainStay MacKay DefinedTerm Municipal Opportunities Fund (since June 2022); Senior Vice President, Voya Investment Management and Chief Compliance Officer, Voya Family of Funds (2012-2022) | |
| * | The officers listed above are considered to be “interested persons” of the MainStay Group of Funds, MainStay VP Funds Trust, MainStay CBRE Global Infrastructure Megatrends Fund and MainStay MacKay DefinedTerm Municipal Opportunities Fund within the meaning of the 1940 Act because of their affiliation with the MainStay Group of Funds, New York Life Insurance Company and/or its affiliates, including New York Life Investment Management LLC, NYLIM Service Company LLC, NYLIFE Securities LLC and/or NYLIFE Distributors LLC, as described in detail in the column captioned “Principal Occupation(s) During Past Five Years.” Officers are elected annually by the Board. |
| ** | Includes prior service as an Officer of MainStay VP Series Fund, Inc., the predecessor to MainStay VP Funds Trust. |
Officers of the Trust (Who are not Trustees)*
| 46 | MainStay MacKay U.S. Infrastructure Bond Fund |
Equity
U.S. Equity
MainStay Epoch U.S. Equity Yield Fund
MainStay S&P 500 Index Fund1
MainStay Winslow Large Cap Growth Fund
MainStay WMC Enduring Capital Fund
MainStay WMC Growth Fund
MainStay WMC Small Companies Fund
MainStay WMC Value Fund
International Equity
MainStay Epoch International Choice Fund
MainStay MacKay International Equity Fund
MainStay WMC International Research Equity Fund
Emerging Markets Equity
MainStay Candriam Emerging Markets Equity Fund
Global Equity
MainStay Epoch Capital Growth Fund
MainStay Epoch Global Equity Yield Fund
Fixed Income
Taxable Income
MainStay Candriam Emerging Markets Debt Fund
MainStay Floating Rate Fund
MainStay MacKay High Yield Corporate Bond Fund
MainStay MacKay Short Duration High Yield Fund
MainStay MacKay Strategic Bond Fund
MainStay MacKay Total Return Bond Fund
MainStay MacKay U.S. Infrastructure Bond Fund
MainStay Short Term Bond Fund
Tax-Exempt Income
MainStay MacKay California Tax Free Opportunities Fund2
MainStay MacKay High Yield Municipal Bond Fund
MainStay MacKay New York Tax Free Opportunities Fund3
MainStay MacKay Short Term Municipal Fund
MainStay MacKay Strategic Municipal Allocation Fund
MainStay MacKay Tax Free Bond Fund
Money Market
MainStay Money Market Fund
Mixed Asset
MainStay Balanced Fund
MainStay Income Builder Fund
MainStay MacKay Convertible Fund
Speciality
MainStay CBRE Global Infrastructure Fund
MainStay CBRE Real Estate Fund
MainStay Cushing MLP Premier Fund
Asset Allocation
MainStay Conservative Allocation Fund
MainStay Conservative ETF Allocation Fund
MainStay Defensive ETF Allocation Fund
MainStay Equity Allocation Fund
MainStay Equity ETF Allocation Fund
MainStay ESG Multi-Asset Allocation Fund
MainStay Growth Allocation Fund
MainStay Growth ETF Allocation Fund
MainStay Moderate Allocation Fund
MainStay Moderate ETF Allocation Fund
Manager
New York Life Investment Management LLC
New York, New York
Subadvisors
Candriam4
Strassen, Luxembourg
CBRE Investment Management Listed Real Assets LLC
Radnor, Pennsylvania
Cushing Asset Management, LP
Dallas, Texas
Epoch Investment Partners, Inc.
New York, New York
MacKay Shields LLC4
New York, New York
NYL Investors LLC4
New York, New York
Wellington Management Company LLP
Boston, Massachusetts
Winslow Capital Management, LLC
Minneapolis, Minnesota
Legal Counsel
Dechert LLP
Washington, District of Columbia
Independent Registered Public Accounting Firm
KPMG LLP
Philadelphia, Pennsylvania
Distributor
NYLIFE Distributors LLC4
Jersey City, New Jersey
Custodian
JPMorgan Chase Bank, N.A.
New York, New York
1.
Prior to February 28, 2022, the Fund's name was MainStay MacKay S&P 500 Index Fund.
| 2. | This Fund is registered for sale in AZ, CA, NV, OR, TX, UT, WA and MI (Class A and Class I shares only), and CO, FL, GA, HI, ID, MA, MD, NH, NJ and NY (Class I shares only). |
| 3. | This Fund is registered for sale in CA, CT, DE, FL, MA, NJ, NY and VT. |
| 4. | An affiliate of New York Life Investment Management LLC. |
Not part of the Annual Report
For more information
800-624-6782
newyorklifeinvestments.com
“New York Life Investments” is both a service mark, and the common trade name, of certain investment advisors affiliated with New York Life Insurance Company. The MainStay Funds® are managed by New York Life Investment Management LLC and distributed by NYLIFE Distributors LLC, 30 Hudson Street, Jersey City, NJ 07302, a wholly owned subsidiary of New York Life Insurance Company. NYLIFE Distributors LLC is a Member FINRA/SIPC.
©2022 NYLIFE Distributors LLC. All rights reserved.
| 5013941.2MS229-22 | MSINF11-12/22 |
(NYLIM) NL211
MainStay Money Market Fund
Message from the President and Annual Report
October 31, 2022
Sign up for e-delivery of your shareholder reports. For full details on e-delivery, including who can participate and what you can receive via e-delivery,
please log in to newyorklifeinvestments.com/accounts.
| Not FDIC/NCUA Insured | Not a Deposit | May Lose Value | No Bank Guarantee | Not Insured by Any Government Agency |
This page intentionally left blank
Message from the President
A series of economic and geopolitical challenges undermined equity and fixed-income markets during the 12-month reporting period ended October 31, 2022. Stocks and bonds alike trended lower in the face of sharply rising interest rates, increasing inflationary pressures, slowing economic growth and Russia’s invasion of Ukraine.
The reporting period began on a mixed note, with concerns about the spreading Omicron variant of the COVID-19 virus and increasingly hawkish statements from the U.S. Federal Reserve (the “Fed”) regarding mounting inflation, countered by bullish sentiment stemming from U.S. economic growth and strong corporate earnings. In January 2022, markets turned decisively negative as comments from the Fed raised the likelihood of rate hikes as early as March, and Russia issued increasingly aggressive threats toward Ukraine. The onset of Russia’s invasion in February exacerbated global inflationary pressures while increasing investor uncertainty. Domestic supply shortages, international trade imbalances and rising inflation caused GDP (gross domestic product) to contract in the first and second quarters of the year, although employment and consumer spending proved resilient. Prices for petroleum surged to multi-year highs, while many key agricultural chemicals and industrial metals climbed as well. Accelerating inflationary forces prompted the Fed to implement its most aggressive interest rate increases since the 1980s with a series of five sharp rate hikes, raising the federal funds rate from a range of 0.00% to 0.25% in March to 3.00% to 3.25% in September, with additional rate hikes expected before the end of the year. International central banks generally followed suit, raising rates by varying degrees in efforts to curb local inflation, although most increases remained significantly more modest than those in the United States. Relatively high U.S. interest rates and risk-averse international sentiment pushed U.S. dollar values higher compared to most other currencies, with the ensuing negative impact on global prices for food, fuel and other key, U.S.-dollar-denominated products.
The effects of these interrelated challenges were felt throughout U.S. and international financial markets. The S&P 500® Index, a widely regarded benchmark of U.S. market performance, declined by more than 14% during the reporting period. Although the energy sector generated strong gains, bolstered by elevated oil and gas prices, most other industry areas recorded losses. The more cyclical and growth-oriented sectors of consumer discretionary, real estate and information technology delivered the
weakest returns, while the traditionally defensive and value-oriented consumer staples, utilities and health care sectors outperformed. International stocks lagged compared to their U.S. counterparts, with some emerging markets, such as China, suffering particularly steep losses. A few markets, however, including Brazil, Mexico and the United Arab Emirates, ended the reporting period with little change. Fixed-income markets saw bond prices broadly decline as yields rose along with interest rates. Short-term yields rose faster than long-term yields, producing a yield curve inversion from July through the end of the reporting period, with long-term rates remaining below short-term rates. While floating-rate instruments, which feature variable interest rates that allow investors to benefit from a rising rate environment, provided a degree of insulation from inflation-driven trends, they were not immune to the market’s widespread declines.
While the Fed acknowledges the costs of rising rates in terms of weaker GDP growth and unsettled financial markets over the short term, its primary focus continues to be the longer-term economic impact of inflation. With the latest figures as of the date of this report showing that inflation remains above 8%, versus a target rate of just 2%, the Fed clearly has a distance yet to go, making further rate increases and market volatility more likely in the coming months. The question remains as to whether the Fed and other central banks will manage a so-called “soft landing,” curbing inflation while avoiding a persistent economic slowdown. If they prove successful, we expect that favorable inflation trends and increasingly attractive valuations in both equity and bond markets should eventually translate into sustainable improvements in the investment environment.
Whatever actions the Fed takes and however financial markets react, as a MainStay investor, you can depend on us to continue providing the insight, expertise and service that have long defined New York Life Investments. Thank you for trusting us to help you meet your investment needs.
Sincerely,
Kirk C. Lehneis
President
The opinions expressed are as of the date of this report and are subject to change. There is no guarantee that any forecast made will come to pass. This material does not constitute investment advice and is not intended as an endorsement of any specific investment. Past performance is no guarantee of future results.
Not part of the Annual Report
An investment in the Fund is not insured or guaranteed by the Federal Deposit Insurance Corporation or any other government agency. Although the Fund seeks to preserve the value of your investment at $1.00 per share, it is possible to lose money by investing in the Fund. The Fund’s sponsor has no legal obligation to provide financial support to the Fund, and you should not expect that the sponsor will provide financial support at any time. The Fund may impose a fee upon the sale of your shares or may temporarily suspend your ability to sell shares if the Fund’s liquidity falls below required minimums because of market conditions or other factors.
Investors should refer to the Fund’s Summary Prospectus and/or Prospectus and consider the Fund’s investment objectives, strategies, risks, charges and expenses carefully before investing. The Summary Prospectus and/or Prospectus contain this and other information about the Fund. You may obtain copies of the Fund’s Summary Prospectus, Prospectus and Statement of Additional Information, which includes information about The MainStay Funds' Trustees, free of charge, upon request, by calling toll-free 800-624-6782, by writing to NYLIFE Distributors LLC, Attn: MainStay Marketing Department, 30 Hudson Street, Jersey City, NJ 07302 or by sending an e-mail to MainStayShareholderServices@nylim.com. These documents are also available via the MainStay Funds’ website at newyorklifeinvestments.com. Please read the Fund’s Summary Prospectus and/or Prospectus carefully before investing.
Investment and Performance Comparison (Unaudited)
Performance data quoted represents past performance. Past performance is no guarantee of future results. Because of market volatility and other factors, current performance may be lower or higher than the figures shown. Investment return and principal value will fluctuate, and as a result, when shares are redeemed, they may be worth more or less than their original cost. The graph below depicts the historical performance of Class A2 shares of the Fund. Performance will vary from class to class based on differences in class-specific expenses. For performance information current to the most recent month-end, please call 800-624-6782 or visit newyorklifeinvestments.com.
The performance table and graph do not reflect the deduction of taxes that a shareholder would pay on distributions or Fund share redemptions. Total returns reflect changes in share price, and reinvestment of dividend and capital gain distributions. The graph assumes the initial investment amount shown below. Performance figures may reflect certain fee waivers and/or expense limitations, without which total returns may have been lower. For more information on share classes and current fee waivers and/or expense limitations (if any), please refer to the Notes to Financial Statements.

| Average Annual Total Returns for the Year-Ended October 31, 2022 |
| Class | Sales Charge | | Inception
Date | One
Year | Five
Years | Ten Years
or Since
Inception | Gross
Expense
Ratio1 |
| Class A Shares2 | No Sales Charge | | 1/3/1995 | 0.70% | 0.84% | 0.46% | 0.54% |
| Investor Class Shares2 | No Sales Charge | | 2/28/2008 | 0.56 | 0.70 | 0.37 | 0.96 |
| Class B Shares2, 3 | No Sales Charge | | 5/1/1986 | 0.56 | 0.70 | 0.37 | 0.96 |
| Class C Shares2 | No Sales Charge | | 9/1/1998 | 0.56 | 0.70 | 0.37 | 0.96 |
| SIMPLE Class Shares2 | No Sales Charge | | 8/31/2020 | 0.56 | N/A | 0.26 | 0.96 |
| 1. | The gross expense ratios presented reflect the Fund’s “Total Annual Fund Operating Expenses” from the most recent Prospectus, as supplemented, and may differ from other expense ratios disclosed in this report. |
| 2. | As of October 31, 2022, MainStay Money Market Fund had an effective 7-day yield of 2.83% for Class A, 2.53% for Investor Class, 2.53% for Class B, 2.53% for Class C and 2.53% for SIMPLE Class shares. The 7-day current yield was 2.79% for Class A, 2.50% for Investor Class, 2.50% for Class B, 2.50% for Class C and 2.50% for SIMPLE Class shares. These yields reflect certain expense limitations. Had these expense limitations not been in effect, the effective 7-day yield would have been 2.83%, 2.66%, 2.66%, 2.66% and 2.66%, for Class A, Investor Class, Class B, Class C and SIMPLE Class shares, respectively, and the 7-day current yield would have been 2.79%, 2.63%, 2.63%, 2.63% and 2.63%, for Class A, Investor Class, Class B, Class C and SIMPLE Class shares, respectively. The current yield reflects the Fund’s earnings better than the Fund’s total return. |
| 3. | Class B shares are closed to all new purchases as well as additional investments by existing Class B shareholders. |
The footnotes on the next page are an integral part of the table and graph and should be carefully read in conjunction with them.
| Benchmark Performance* | One
Year | Five
Years | Ten
Years |
| Average Lipper Money Market Fund1 | 0.75% | 0.92% | 0.53% |
| * | Returns for indices reflect no deductions for fees, expenses or taxes, except for foreign withholding taxes where applicable. Results assume reinvestment of all dividends and capital gains. An investment cannot be made directly in an index. |
| 1. | The Average Lipper Money Market Fund is an equally weighted performance average adjusted for capital gains distributions and income dividends of all of the money market funds in the Lipper Universe. Lipper Inc., a wholly-owned subsidiary of Thomson Reuters, is an independent monitor of mutual fund performance. Results do not reflect any deduction of sales charges. Lipper averages are not class specific. Lipper returns are unaudited. Results are based on average total returns of similar funds with all dividend and capital gain distributions reinvested. |
The footnotes on the preceding page are an integral part of the table and graph and should be carefully read in conjunction with them.
| 6 | MainStay Money Market Fund |
Cost in Dollars of a $1,000 Investment in MainStay Money Market Fund (Unaudited)
The example below is intended to describe the fees and expenses borne by shareholders during the six-month period from May 1, 2022 to October 31, 2022, and the impact of those costs on your investment.
Example
As a shareholder of the Fund you incur two types of costs: (1) transaction costs, including exchange fees and sales charges (loads) on purchases (as applicable), and (2) ongoing costs, including management fees, distribution and/or service (12b-1) fees and other Fund expenses (as applicable). This example is intended to help you understand your ongoing costs (in dollars) of investing in the Fund and to compare these costs with the ongoing costs of investing in other mutual funds. The example is based on an investment of $1,000 made at the beginning of the six-month period and held for the entire period from May 1, 2022 to October 31, 2022.
This example illustrates your Fund’s ongoing costs in two ways:
Actual Expenses
The second and third data columns in the table below provide information about actual account values and actual expenses. You may use the information in these columns, together with the amount you invested, to estimate the expenses that you paid during the six months ended October 31, 2022. Simply divide your account value by $1,000 (for example, an
$8,600 account value divided by $1,000 = 8.6), then multiply the result by the number under the heading entitled “Expenses Paid During Period” to estimate the expenses you paid on your account during this period.
Hypothetical Example for Comparison Purposes
The fourth and fifth data columns in the table below provide information about hypothetical account values and hypothetical expenses based on the Fund’s actual expense ratio and an assumed rate of return of 5% per year before expenses, which is not the Fund’s actual return. The hypothetical account values and expenses may not be used to estimate the actual ending account balances or expenses you paid for the six-month period shown. You may use this information to compare the ongoing costs of investing in the Fund with the ongoing costs of investing in other mutual funds. To do so, compare this 5% hypothetical example with the 5% hypothetical examples that appear in the shareholder reports of the other mutual funds.
Please note that the expenses shown in the table are meant to highlight your ongoing costs only and do not reflect any transactional costs, such as exchange fees or sales charges (loads). Therefore, the fourth and fifth data columns of the table are useful in comparing ongoing costs only and will not help you determine the relative total costs of owning different funds. In addition, if these transactional costs were included, your costs would have been higher.
| Share Class | Beginning
Account
Value
5/1/22 | Ending Account
Value (Based
on Actual
Returns and
Expenses)
10/31/22 | Expenses
Paid
During
Period1 | Ending Account
Value (Based
on Hypothetical
5% Annualized
Return and
Actual Expenses)
10/31/22 | Expenses
Paid
During
Period1 | Net Expense
Ratio
During
Period2 |
| Class A Shares | $1,000.00 | $1,007.00 | $2.58 | $1,022.63 | $2.60 | 0.51% |
| Investor Class Shares | $1,000.00 | $1,005.50 | $4.04 | $1,021.17 | $4.08 | 0.80% |
| Class B Shares | $1,000.00 | $1,005.50 | $4.04 | $1,021.17 | $4.08 | 0.80% |
| Class C Shares | $1,000.00 | $1,005.50 | $4.04 | $1,021.17 | $4.08 | 0.80% |
| SIMPLE Class Shares | $1,000.00 | $1,005.50 | $4.04 | $1,021.17 | $4.08 | 0.80% |
| 1. | Expenses are equal to the Fund’s annualized expense ratio of each class multiplied by the average account value over the period, divided by 365 and multiplied by 184 (to reflect the six-month period). The table above represents the actual expenses incurred during the six-month period. In addition to the fees and expenses which the Fund bears directly, it also indirectly bears a pro rata share of the fees and expenses of the underlying funds in which it invests. Such indirect expenses are not included in the above-reported expense figures. |
| 2. | Expenses are equal to the Fund's annualized expense ratio to reflect the six-month period. |
Portfolio Composition as of October 31, 2022 (Unaudited)
‡ Less than one-tenth of a percent.
See Portfolio of Investments beginning on page 10 for specific holdings within these categories. The Fund's holdings are subject to change.
| 8 | MainStay Money Market Fund |
Portfolio Management Discussion and Analysis (Unaudited)
Questions answered by NYL Investors LLC, the Fund’s Subadvisor.
How did MainStay Money Market Fund perform relative to its benchmark and peer group during the 12 months ended October 31, 2022?
For the 12 months ended October 31, 2022, Class A shares of MainStay Money Market Fund provided a 7-day effective yield of 2.83% and a 7-day current yield of 2.79%. For the 12 months ended October 31, 2022, Class A shares returned 0.70%, underperforming the 0.75% return of the Average Lipper Money Market Fund.1
What factors affected the Fund’s relative performance during the reporting period?
During the reporting period, the Fund benefited from continued upward pressure on interest rates since the U.S. Federal Reserve (the “Fed”) began hiking rates in March 2022. Investor demand continually increased, with cash flooding the front-end of the yield curve.2 Investors tried to stay ahead of the Fed and benefit from rate hikes that occurred at every meeting since March. Supply was not able to keep up with the cash inflows into money market funds, driving Treasury bill and agency discount note rates lower than the effective federal funds rate. Commercial paper interest rates remained higher than the effective federal funds rate, providing a yield pickup unavailable in Treasury bills or agency discount notes.
What was the Fund’s duration3 strategy during the reporting period?
During the reporting period, the Fund generally maintained a duration shorter than that of the Bloomberg 1 Month T-Bill Index (the “Index”). The Fund’s strategy throughout the reporting period was to keep the duration of the Fund as short as possible in order to stay in front of each Fed monetary policy meeting, with the expectation that the Fed would tighten monetary policy by raising interest rates at each meeting. The shorter duration profile of the Fund allowed it to reinvest maturing securities at higher interest rates after each subsequent meeting. As of October 31, 2022, the Fund’s duration was 0.02 years compared to a duration of 0.08 years for the Index.
During the reporting period, which sectors were the strongest positive contributors to the Fund’s relative performance and which sectors were particularly weak?
During the reporting period, the Fund maintained overweight exposure compared to the Index in the Tier 14 commercial paper
subcomponent, which helped gradually increase relative performance. Within the industrial subsector of the Fund’s commercial paper holdings, the best performers included BASF, Stanley Black & Decker and Toyota Motor. Within the financial subsector, holdings in Sumitomo Mitsui Trust Bank, Bank of Montreal and BNP Paribas were the most helpful to gradually increase performance. The Fund also maintained an overweight position in tri-party repurchase positions, which proved helpful in gradually increasing relative performance.
During the same period, the Fund maintained underweight exposure to the Treasury sector, which detracted from relative performance.
What were some of the Fund’s largest purchases and sales during the reporting period?
The top issuers purchased during the reporting period included Wisconsin Public Service Corporation, Automatic Data Processing, National Rural Utilities Cooperative Finance, Stanley Black & Decker and UnitedHealth Group. Sales during the reporting period were limited to U.S. Treasury bills.
How did the Fund’s sector weightings change during the reporting period?
The Fund’s allocation to the Treasury sector was reduced from 30% to 12% during the reporting period. Conversely, the Fund’s allocation to commercial paper was increased from 63% to 82%. The latter allocation change was undertaken to take advantage of the yield premium being offered on commercial paper over matched duration Treasuries. In addition to the sector weighting changes, the Fund’s duration was shortened from 0.10 years to 0.02 years.
| 1. | See page 5 for other share class returns, which may be higher or lower than Class A share returns. See page 6 for more information on benchmark and peer group returns. |
| 2. | The yield curve is a line that plots the yields of various securities of similar quality—typically U.S. Treasury issues—across a range of maturities. The U.S. Treasury yield curve serves as a benchmark for other debt and is used in economic forecasting. |
| 3. | Duration is a measure of the price sensitivity of a fixed-income investment to changes in interest rates. Duration is expressed as a number of years and is considered a more accurate sensitivity gauge than average maturity. |
| 4. | Tier 1 commercial paper may carry A-1 or above ratings from Standard & Poor’s, P-1 from Moody’s and/or F1 or above from Fitch. |
The opinions expressed are those of the portfolio manager as of the date of this report and are subject to change. There is no guarantee that any forecasts will come to pass. This material does not constitute investment advice and is not intended as an endorsement of any specific investment.
Portfolio of Investments October 31, 2022†
| | Principal
Amount | Value |
| Short-Term Investments 100.0% |
| Commercial Paper 81.7% |
| Army and Air Force Exchange Service | | |
| 3.474%, due 11/10/22 | $ 20,000,000 | $ 19,982,650 |
| Caterpillar Financial Services Corp. | | |
| 3.316%, due 11/9/22 | 20,000,000 | 19,985,289 |
| Credit Agricole Corporate and Investment Bank | | |
| 3.265%, due 11/10/22 | 20,000,000 | 19,983,700 |
| Cummins, Inc. | | |
| 3.407%, due 11/8/22 | 20,000,000 | 19,986,778 |
| Emerson Electric Co. | | |
| 3.124%, due 11/7/22 | 20,000,000 | 19,989,600 |
| John Deere Canada ULC | | |
| 3.275%, due 11/7/22 | 20,000,000 | 19,989,100 |
| Kimberly-Clark Corp. | | |
| 3.506%, due 11/14/22 | 20,000,000 | 19,974,722 |
| Massachusetts Mutual Life Insurance Co. | | |
| 3.154%, due 11/9/22 | 20,000,000 | 19,986,000 |
| National Rural Utilities Cooperative Finance Corp. | | |
| 3.869%, due 11/17/22 | 20,000,000 | 19,965,689 |
| Nestle Finance International Ltd. | | |
| 3.615%, due 11/15/22 | 20,000,000 | 19,971,922 |
| Northern Illinois Gas Co. | | |
| 3.306%, due 11/1/22 | 20,000,000 | 20,000,000 |
| Novartis Finance Corp. | | |
| 3.559%, due 11/21/22 | 20,000,000 | 19,960,556 |
| Rockwell Automation, Inc. | | |
| 3.555%, due 11/10/22 | 20,000,000 | 19,982,250 |
| Schlumberger Investment SA | | |
| 3.559%, due 11/14/22 | 20,000,000 | 19,974,361 |
| Southern California Gas Co. | | |
| 3.204%, due 11/3/22 | 20,000,000 | 19,996,444 |
| Stanley Black & Decker, Inc. | | |
| 3.251%, due 11/4/22 | 20,000,000 | 19,994,583 |
| Toyota Motor Credit Corp. | | |
| 3.108%, due 11/2/22 | 20,000,000 | 19,998,278 |
| UnitedHealth Group, Inc. | | |
| 3.414%, due 11/3/22 | 20,000,000 | 19,996,211 |
| Walmart, Inc. | | |
| 3.254%, due 11/7/22 | 20,000,000 | 19,989,167 |
| Wisconsin Public Service Corp. | | |
| 3.202%, due 11/1/22 | 20,000,000 | 20,000,000 |
Total Commercial Paper
(Cost $399,707,300) | | 399,707,300 |
| | Principal
Amount | | Value |
| |
| Repurchase Agreements 6.5% |
RBC Capital Markets LLC
3.00%, dated 10/31/22
due 11/1/22
Proceeds at Maturity $6,915,576
(Collateralized by United States Treasury securities with rates between 0.75% and 3.50% and maturity dates between 11/15/24 and 02/15/39, with a Principal Amount of $7,653,700 and a Market Value of $7,053,909) | 6,915,000 | | $ 6,915,000 |
TD Securities (U.S.A) LLC
3.01%, dated 10/31/22
due 11/1/22
Proceeds at Maturity $25,002,090
(Collateralized by United States Treasury securities with rates between 1.63% and 1.88% and maturity dates between 01/31/23 and 11/30/26, with a Principal Amount of $26,706,100 and a Market Value of $25,500,038) | 25,000,000 | | 25,000,000 |
Total Repurchase Agreements
(Cost $31,915,000) | | | 31,915,000 |
| U.S. Treasury Debt 11.8% |
| U.S. Treasury Bills (a) | | | |
| 2.629%, due 11/1/22 | $ 21,000,000 | | 21,000,000 |
| 2.898%, due 11/8/22 | 15,000,000 | | 14,991,565 |
| 3.103%, due 11/15/22 | 4,540,000 | | 4,534,531 |
| 3.387%, due 11/22/22 | 17,000,000 | | 16,966,502 |
Total U.S. Treasury Debt
(Cost $57,492,598) | | | 57,492,598 |
Total Short-Term Investments
(Cost $489,114,898) | 100.0% | | 489,114,898 |
| Other Assets, Less Liabilities | (0.0)‡ | | (175,985) |
| Net Assets | 100.0% | | $ 488,938,913 |
| † | Percentages indicated are based on Fund net assets. |
| ‡ | Less than one-tenth of a percent. |
| (a) | Interest rate shown represents yield to maturity. |
The notes to the financial statements are an integral part of, and should be read in conjunction with, the financial statements.
| 10 | MainStay Money Market Fund |
The following is a summary of the fair valuations according to the inputs used as of October 31, 2022, for valuing the Fund’s assets:
| Description | Quoted
Prices in
Active
Markets for
Identical
Assets
(Level 1) | | Significant
Other
Observable
Inputs
(Level 2) | | Significant
Unobservable
Inputs
(Level 3) | | Total |
| Asset Valuation Inputs | | | | | | | |
| Investments in Securities (a) | | | | | | | |
| Short-Term Investments | | | | | | | |
| Commercial Paper | $ — | | $ 399,707,300 | | $ — | | $ 399,707,300 |
| Repurchase Agreements | — | | 31,915,000 | | — | | 31,915,000 |
| U.S. Treasury Debt | — | | 57,492,598 | | — | | 57,492,598 |
| Total Investments in Securities | $ — | | $ 489,114,898 | | $ — | | $ 489,114,898 |
| (a) | For a complete listing of investments and their industries, see the Portfolio of Investments. |
The notes to the financial statements are an integral part of, and should be read in conjunction with, the financial statements.
11
Statement of Assets and Liabilities as of October 31, 2022
| Assets |
Investment in securities, at value
(amortized cost $457,199,898) | $457,199,898 |
Repurchase agreements, at value
(amortized cost $31,915,000) | 31,915,000 |
| Cash | 614 |
| Receivables: | |
| Fund shares sold | 473,209 |
| Interest | 2,666 |
| Other assets | 46,374 |
| Total assets | 489,637,761 |
| Liabilities |
| Payables: | |
| Fund shares redeemed | 346,150 |
| Manager (See Note 3) | 169,216 |
| Transfer agent (See Note 3) | 116,623 |
| Shareholder communication | 21,377 |
| Professional fees | 12,870 |
| Custodian | 5,164 |
| Trustees | 195 |
| Accrued expenses | 8,595 |
| Dividends payable | 18,658 |
| Total liabilities | 698,848 |
| Net assets | $488,938,913 |
| Composition of Net Assets |
| Shares of beneficial interest outstanding (par value of $.01 per share) unlimited number of shares authorized | $ 4,889,557 |
| Additional paid-in-capital | 484,025,439 |
| | 488,914,996 |
| Total distributable earnings (loss) | 23,917 |
| Net assets | $488,938,913 |
| Class A | |
| Net assets applicable to outstanding shares | $427,378,485 |
| Shares of beneficial interest outstanding | 427,381,908 |
| Net asset value and offering price per share outstanding | $ 1.00 |
| Investor Class | |
| Net assets applicable to outstanding shares | $ 19,326,578 |
| Shares of beneficial interest outstanding | 19,336,369 |
| Net asset value and offering price per share outstanding | $ 1.00 |
| Class B | |
| Net assets applicable to outstanding shares | $ 23,696,146 |
| Shares of beneficial interest outstanding | 23,699,636 |
| Net asset value and offering price per share outstanding | $ 1.00 |
| Class C | |
| Net assets applicable to outstanding shares | $ 18,463,878 |
| Shares of beneficial interest outstanding | 18,463,910 |
| Net asset value and offering price per share outstanding | $ 1.00 |
| SIMPLE Class | |
| Net assets applicable to outstanding shares | $ 73,826 |
| Shares of beneficial interest outstanding | 73,827 |
| Net asset value and offering price per share outstanding | $ 1.00 |
The notes to the financial statements are an integral part of, and should be read in conjunction with, the financial statements.
| 12 | MainStay Money Market Fund |
Statement of Operations for the year ended October 31, 2022
| Investment Income (Loss) |
| Income | |
| Interest | $5,026,275 |
| Expenses | |
| Manager (See Note 3) | 1,809,235 |
| Transfer agent (See Note 3) | 525,616 |
| Registration | 110,337 |
| Professional fees | 81,687 |
| Custodian | 12,689 |
| Shareholder communication | 10,580 |
| Trustees | 9,549 |
| Miscellaneous | 15,816 |
| Total expenses before waiver/reimbursement | 2,575,509 |
| Expense waiver/reimbursement from Manager (See Note 3) | (815,497) |
| Net expenses | 1,760,012 |
| Net investment income (loss) | 3,266,263 |
| Realized Gain (Loss) |
| Net realized gain (loss) on investments | (8,910) |
| Net increase (decrease) in net assets resulting from operations | $3,257,353 |
The notes to the financial statements are an integral part of, and should be read in conjunction with, the financial statements.
13
Statements of Changes in Net Assets
for the years ended October 31, 2022 and October 31, 2021
| | 2022 | 2021 |
| Increase (Decrease) in Net Assets |
| Operations: | | |
| Net investment income (loss) | $ 3,266,263 | $ 45,564 |
| Net realized gain (loss) | (8,910) | 2,652 |
| Net increase (decrease) in net assets resulting from operations | 3,257,353 | 48,216 |
| Distributions to shareholders: | | |
| Class A | (2,920,592) | (38,110) |
| Investor Class | (109,797) | (2,527) |
| Class B | (132,408) | (2,768) |
| Class C | (103,073) | (2,115) |
| SIMPLE Class | (394) | (4) |
| Total distributions to shareholders | (3,266,264) | (45,524) |
| Capital share transactions: | | |
| Net proceeds from sales of shares | 533,186,206 | 368,286,798 |
| Net asset value of shares issued to shareholders in reinvestment of distributions | 3,179,577 | 36,445 |
| Cost of shares redeemed | (467,932,037) | (449,690,249) |
| Increase (decrease) in net assets derived from capital share transactions | 68,433,746 | (81,367,006) |
| Net increase (decrease) in net assets | 68,424,835 | (81,364,314) |
| Net Assets |
| Beginning of year | 420,514,078 | 501,878,392 |
| End of year | $ 488,938,913 | $ 420,514,078 |
The notes to the financial statements are an integral part of, and should be read in conjunction with, the financial statements.
| 14 | MainStay Money Market Fund |
Financial Highlights selected per share data and ratios
| | Year Ended October 31, |
| Class A | 2022 | | 2021 | | 2020 | | 2019 | | 2018 |
| Net asset value at beginning of year | $ 1.00 | | $ 1.00 | | $ 1.00 | | $ 1.00 | | $ 1.00 |
| Net investment income (loss) (a) | 0.01 | | 0.00‡ | | 0.00‡ | | 0.02 | | 0.01 |
| Net realized and unrealized gain (loss) | 0.00‡ | | 0.00‡ | | 0.00‡ | | 0.00‡ | | (0.00)‡ |
| Total from investment operations | 0.01 | | 0.00‡ | | 0.00‡ | | 0.02 | | 0.01 |
| Less distributions: | | | | | | | | | |
| From net investment income | (0.01) | | (0.00)‡ | | (0.00)‡ | | (0.02) | | (0.01) |
| Net asset value at end of year | $ 1.00 | | $ 1.00 | | $ 1.00 | | $ 1.00 | | $ 1.00 |
| Total investment return (b) | 0.70% | | 0.01% | | 0.45% | | 1.84% | | 1.21% |
| Ratios (to average net assets)/Supplemental Data: | | | | | | | | | |
| Net investment income (loss) | 0.75% | | 0.01% | | 0.37% | | 1.82% | | 1.20% |
| Net expenses | 0.37% | | 0.12% | | 0.39% | | 0.56% | | 0.57% |
| Expenses (before waiver/reimbursement) | 0.52% | | 0.54% | | 0.55% | | 0.56% | | 0.57% |
| Net assets at end of year (in 000’s) | $ 427,378 | | $ 354,743 | | $ 415,041 | | $ 290,421 | | $ 235,855 |
| ‡ | Less than one cent per share. |
| (a) | Per share data based on average shares outstanding during the year. |
| (b) | Total investment return is calculated exclusive of sales charges and assumes the reinvestment of distributions. For periods of less than one year, total return is not annualized. |
| | Year Ended October 31, |
| Investor Class | 2022 | | 2021 | | 2020 | | 2019 | | 2018 |
| Net asset value at beginning of year | $ 1.00 | | $ 1.00 | | $ 1.00 | | $ 1.00 | | $ 1.00 |
| Net investment income (loss) (a) | 0.01 | | 0.00‡ | | 0.00‡ | | 0.02 | | 0.01 |
| Net realized and unrealized gain (loss) | 0.00‡ | | 0.00‡ | | 0.00‡ | | 0.00‡ | | (0.00)‡ |
| Total from investment operations | 0.01 | | 0.00‡ | | 0.00‡ | | 0.02 | | 0.01 |
| Less distributions: | | | | | | | | | |
| From net investment income | (0.01) | | (0.00)‡ | | (0.00)‡ | | (0.02) | | (0.01) |
| Net asset value at end of year | $ 1.00 | | $ 1.00 | | $ 1.00 | | $ 1.00 | | $ 1.00 |
| Total investment return (b) | 0.56% | | 0.01% | | 0.35% | | 1.59% | | 0.98% |
| Ratios (to average net assets)/Supplemental Data: | | | | | | | | | |
| Net investment income (loss) | 0.53% | | 0.01% | | 0.33% | | 1.58% | | 0.97% |
| Net expenses | 0.49% | | 0.12% | | 0.51% | | 0.80% | | 0.80% |
| Expenses (before waiver/reimbursement) | 0.84% | | 0.96% | | 0.91% | | 0.88% | | 0.84% |
| Net assets at end of year (in 000's) | $ 19,327 | | $ 22,096 | | $ 28,427 | | $ 28,133 | | $ 26,548 |
| ‡ | Less than one cent per share. |
| (a) | Per share data based on average shares outstanding during the year. |
| (b) | Total investment return is calculated exclusive of sales charges and assumes the reinvestment of distributions. For periods of less than one year, total return is not annualized. |
The notes to the financial statements are an integral part of, and should be read in conjunction with, the financial statements.
15
Financial Highlights selected per share data and ratios
| | Year Ended October 31, |
| Class B | 2022 | | 2021 | | 2020 | | 2019 | | 2018 |
| Net asset value at beginning of year | $ 1.00 | | $ 1.00 | | $ 1.00 | | $ 1.00 | | $ 1.00 |
| Net investment income (loss) (a) | 0.01 | | 0.00‡ | | 0.00‡ | | 0.02 | | 0.01 |
| Net realized and unrealized gain (loss) | 0.00‡ | | 0.00‡ | | 0.00‡ | | 0.00‡ | | (0.00)‡ |
| Total from investment operations | 0.01 | | 0.00‡ | | 0.00‡ | | 0.02 | | 0.01 |
| Less distributions: | | | | | | | | | |
| From net investment income | (0.01) | | (0.00)‡ | | (0.00)‡ | | (0.02) | | (0.01) |
| Net asset value at end of year | $ 1.00 | | $ 1.00 | | $ 1.00 | | $ 1.00 | | $ 1.00 |
| Total investment return (b) | 0.56% | | 0.01% | | 0.35% | | 1.59% | | 0.98% |
| Ratios (to average net assets)/Supplemental Data: | | | | | | | | | |
| Net investment income (loss) | 0.54% | | 0.01% | | 0.35% | | 1.59% | | 0.96% |
| Net expenses | 0.49% | | 0.12% | | 0.52% | | 0.80% | | 0.80% |
| Expenses (before waiver/reimbursement) | 0.84% | | 0.97% | | 0.90% | | 0.88% | | 0.84% |
| Net assets at end of year (in 000’s) | $ 23,696 | | $ 25,709 | | $ 30,215 | | $ 32,981 | | $ 37,284 |
| ‡ | Less than one cent per share. |
| (a) | Per share data based on average shares outstanding during the year. |
| (b) | Total investment return is calculated exclusive of sales charges and assumes the reinvestment of distributions. For periods of less than one year, total return is not annualized. |
| | Year Ended October 31, |
| Class C | 2022 | | 2021 | | 2020 | | 2019 | | 2018 |
| Net asset value at beginning of year | $ 1.00 | | $ 1.00 | | $ 1.00 | | $ 1.00 | | $ 1.00 |
| Net investment income (loss) (a) | 0.01 | | 0.00‡ | | 0.00‡ | | 0.02 | | 0.01 |
| Net realized and unrealized gain (loss) | 0.00‡ | | 0.00‡ | | 0.00‡ | | 0.00‡ | | (0.00)‡ |
| Total from investment operations | 0.01 | | 0.00‡ | | 0.00‡ | | 0.02 | | 0.01 |
| Less distributions: | | | | | | | | | |
| From net investment income | (0.01) | | (0.00)‡ | | (0.00)‡ | | (0.02) | | (0.01) |
| Net asset value at end of year | $ 1.00 | | $ 1.00 | | $ 1.00 | | $ 1.00 | | $ 1.00 |
| Total investment return (b) | 0.56% | | 0.01% | | 0.35% | | 1.60% | | 0.98% |
| Ratios (to average net assets)/Supplemental Data: | | | | | | | | | |
| Net investment income (loss) | 0.55% | | 0.01% | | 0.27% | | 1.59% | | 0.94% |
| Net expenses | 0.52% | | 0.12% | | 0.50% | | 0.80% | | 0.80% |
| Expenses (before waiver/reimbursement) | 0.84% | | 0.96% | | 0.90% | | 0.88% | | 0.84% |
| Net assets at end of year (in 000’s) | $ 18,464 | | $ 17,941 | | $ 28,171 | | $ 20,308 | | $ 22,983 |
| ‡ | Less than one cent per share. |
| (a) | Per share data based on average shares outstanding during the year. |
| (b) | Total investment return is calculated exclusive of sales charges and assumes the reinvestment of distributions. For periods of less than one year, total return is not annualized. |
The notes to the financial statements are an integral part of, and should be read in conjunction with, the financial statements.
| 16 | MainStay Money Market Fund |
Financial Highlights selected per share data and ratios
| | Year Ended October 31, | | August 31, 2020^ through
October 31, |
| SIMPLE Class | 2022 | | 2021 | | 2020 |
| Net asset value at beginning of period | $ 1.00 | | $ 1.00 | | $ 1.00 |
| Net investment income (loss) (a) | 0.01 | | 0.00‡ | | (0.00)‡ |
| Net realized and unrealized gain (loss) | 0.00‡ | | 0.00‡ | | 0.00‡ |
| Total from investment operations | 0.01 | | 0.00‡ | | 0.00‡ |
| Less distributions: | | | | | |
| From net investment income | (0.01) | | (0.00)‡ | | (0.00)‡ |
| Net asset value at end of period | $ 1.00 | | $ 1.00 | | $ 1.00 |
| Total investment return (b) | 0.56% | | 0.01% | | 0.00%‡‡ |
| Ratios (to average net assets)/Supplemental Data: | | | | | |
| Net investment income (loss) | 0.58% | | 0.01% | | (0.02)%†† |
| Net expenses | 0.51% | | 0.12% | | 0.19%†† |
| Expenses (before waiver/reimbursement) | 0.84% | | 0.97% | | 0.95%†† |
| Net assets at end of period (in 000’s) | $ 74 | | $ 25 | | $ 25 |
| ^ | Inception date. |
| ‡ | Less than one cent per share. |
| ‡‡ | Less than one-tenth percent. |
| †† | Annualized. |
| (a) | Per share data based on average shares outstanding during the period. |
| (b) | Total investment return is calculated exclusive of sales charges and assumes the reinvestment of dividends and distributions. SIMPLE Class shares are not subject to sales charges. For periods of less than one year, total return is not annualized. |
The notes to the financial statements are an integral part of, and should be read in conjunction with, the financial statements.
17
Notes to Financial Statements
Note 1-Organization and Business
The MainStay Funds (the “Trust”) was organized on January 9, 1986, as a Massachusetts business trust. The Trust is registered under the Investment Company Act of 1940, as amended (the “1940 Act”), as an open-end management investment company, and is comprised of twelve funds (collectively referred to as the "Funds"). These financial statements and notes relate to the MainStay Money Market Fund (the "Fund"), a “diversified” fund, as that term is defined in the 1940 Act, as interpreted or modified by regulatory authorities having jurisdiction, from time to time.
The following table lists the Fund's share classes that have been registered and commenced operations:
| Class | Commenced Operations |
| Class A | January 3, 1995 |
| Investor Class | February 28, 2008 |
| Class B | May 1, 1986 |
| Class C | September 1, 1998 |
| SIMPLE Class | August 31, 2020 |
| Class R6 | N/A* |
| * | Class R6 shares were registered for sale effective as of February 28, 2020 but have not yet commenced operations. |
Class A, Class C, Investor Class and SIMPLE Class shares are offered at net asset value (“NAV”) without an initial sales charge. Class R6 shares are expected to be offered at net asset value (“NAV”) without an initial sales charge if such shares are offered in the future. Class B shares of the MainStay Group of Funds are closed to all new purchases as well as additional investments by existing Class B shareholders. Existing Class B shareholders may continue to reinvest dividends and capital gains distributions, as well as exchange their Class B shares for Class B shares of other funds in the MainStay Group of Funds as permitted by the current exchange privileges. All other features of the Class B shares, including but not limited to the fees and expenses applicable to Class B shares, remain unchanged. Unless redeemed, Class B shareholders will remain in Class B shares of their respective fund until the Class B shares are converted to Class A or Investor Class shares pursuant to the applicable conversion schedule. Depending upon eligibility, Class B shares convert to either Class A or Investor Class shares at the end of the calendar quarter eight years after the date they were purchased. Additionally, Investor Class shares may convert automatically to Class A shares. SIMPLE Class shares convert to Class A shares, or Investor Class shares if you are not eligible to hold Class A shares, at the end of the calendar quarter, ten years after the date they were purchased. Share class conversions are based on the relevant NAVs of the two classes at the time of the conversion, and no sales load or other charge is imposed. Under certain circumstances and as may be permitted by the Trust’s multiple class plan pursuant to Rule 18f-3 under the 1940 Act, specified share classes of the Fund may be converted to one or more other share classes of the Fund as disclosed in the capital share transactions within these Notes. The classes of shares have the same voting (except for issues that relate solely to one class), dividend, liquidation and other rights, and the same terms and conditions.
The Fund's investment objective is to seek a high level of current income while preserving capital and maintaining liquidity.
Note 2–Significant Accounting Policies
The Fund is an investment company and accordingly follows the investment company accounting and reporting guidance of the Financial Accounting Standards Board (“FASB”) Accounting Standards Codification Topic 946 Financial Services—Investment Companies. The Fund prepares its financial statements in accordance with generally accepted accounting principles (“GAAP”) in the United States of America and follows the significant accounting policies described below.
(A) Valuation of Shares. You could lose money by investing in the Fund. Although the Fund seeks to preserve the value of your investment at $1.00 per share by using the amortized cost method of valuation, it cannot guarantee it will do so. The Fund may impose a fee upon the sale of your shares or may temporarily suspend your ability to sell shares if the Fund's liquidity falls below required minimums because of market conditions or other factors. An investment in the Fund is not insured or guaranteed by the Federal Deposit Insurance Corporation or any other government agency. The Fund's sponsor has no legal obligation to provide financial support to the Fund, and you should not expect that the sponsor will provide financial support to the Fund at any time.
(B) Securities Valuation. Securities are valued using the amortized cost method of valuation, unless the use of such method would be inappropriate per the requirements of Rule 2a-7 under the 1940 Act. The amortized cost method involves valuing a security at its cost on the date of purchase and thereafter assuming a constant amortization to maturity of the difference between such cost and the value on maturity date. Amortized cost approximates the current fair value of a security.
Effective September 8, 2022, and pursuant to Rule 2a-5 under the 1940 Act, the Board of Trustees of the Trust (the "Board") designated New York Life Investment Management LLC (“New York Life Investments” or the "Manager") as its Valuation Designee (the "Valuation Designee"). The Valuation Designee is responsible for performing fair valuations relating to all investments in the Fund’s portfolio for which market quotations are not readily available; periodically assessing and managing material valuation risks; establishing and applying fair value methodologies; testing fair valuation methodologies; evaluating and overseeing pricing services; segregation of valuation and portfolio management functions; providing quarterly, annual and prompt reporting to the Board, as appropriate; identifying potential conflicts of interest; and maintaining appropriate records. The Valuation Designee has established a valuation committee ("Valuation Committee") to assist in carrying out the Valuation Designee’s responsibilities and establish prices of securities for which market quotations are not readily available. The Fund’s and the Valuation Designee's policies and procedures ("Valuation Procedures") govern the Valuation Designee’s selection and application of methodologies for determining and calculating the fair value of Fund investments. The Valuation Designee may value Fund portfolio securities for which market quotations are not readily available and other Fund assets utilizing inputs
from pricing services and other third-party sources (together, “Pricing Sources”). The Valuation Committee meets (in person, via electronic mail or via teleconference) on an ad-hoc basis to determine fair valuations and on a quarterly basis to review fair value events (excluding fair valuations from pricing services), including valuation risks and back-testing results, and preview reports to the Board.
The Valuation Committee establishes prices of securities for which market quotations are not readily available based on such methodologies and measurements on a regular basis after considering information that is reasonably available and deemed relevant by the Valuation Committee. The Board shall oversee the Valuation Designee and review fair valuation materials on a prompt, quarterly and annual basis and approve proposed revisions to the Valuation Procedures.
Investments for which market quotations are not readily available are valued at fair value as determined in good faith pursuant to the Valuation Procedures. A market quotation is readily available only when that quotation is a quoted price (unadjusted) in active markets for identical investments that the Fund can access at the measurement date, provided that a quotation will not be readily available if it is not reliable. Fair value measurements are determined within a framework that establishes a three-tier hierarchy that maximizes the use of observable market data and minimizes the use of unobservable inputs to establish a classification of fair value measurements for disclosure purposes. "Inputs" refer broadly to the assumptions that market participants would use in pricing the asset or liability, including assumptions about risk, such as the risk inherent in a particular valuation technique used to measure fair value using a pricing model and/or the risk inherent in the inputs for the valuation technique. Inputs may be observable or unobservable. Observable inputs reflect the assumptions market participants would use in pricing the asset or liability based on market data obtained from sources independent of the Fund. Unobservable inputs reflect the Fund’s own assumptions about the assumptions market participants would use in pricing the asset or liability based on the information available. The inputs or methodology used for valuing assets or liabilities may not be an indication of the risks associated with investing in those assets or liabilities. The three-tier hierarchy of inputs is summarized below.
| • | Level 1—quoted prices (unadjusted) in active markets for an identical asset or liability |
| • | Level 2—other significant observable inputs (including quoted prices for a similar asset or liability in active markets, interest rates and yield curves, prepayment speeds, credit risk, etc.) |
| • | Level 3—significant unobservable inputs (including the Fund's own assumptions about the assumptions that market participants would use in measuring fair value of an asset or liability) |
Securities valued at amortized cost are not obtained from a quoted price in an active market and are generally categorized as Level 2 in the hierarchy. The level of an asset or liability within the fair value hierarchy is based on the lowest level of an input, both individually and in the aggregate, that is significant to the fair value measurement. As of October
31, 2022, the aggregate value by input level of the Fund’s assets and liabilities is included at the end of the Portfolio of Investments.
The Fund may use third-party vendor evaluations, whose prices may be derived from one or more of the following standard inputs, among others:
| • Benchmark yields | • Reported trades |
| • Broker/dealer quotes | • Issuer spreads |
| • Two-sided markets | • Benchmark securities |
| • Bids/offers | • Reference data (corporate actions or material event notices) |
| • Industry and economic events | • Comparable bonds |
| • Monthly payment information | |
An asset or liability for which a market quotation is not readily available is valued by methods deemed reasonable in good faith by the Valuation Committee, following the Valuation Procedures to represent fair value. Under these procedures, the Valuation Designee generally uses a market-based approach which may use related or comparable assets or liabilities, recent transactions, market multiples, book values and other relevant information. The Valuation Designee may also use an income-based valuation approach in which the anticipated future cash flows of the asset or liability are discounted to calculate fair value. Discounts may also be applied due to the nature and/or duration of any restrictions on the disposition of the asset or liability. Fair value represents a good faith approximation of the value of a security. Fair value determinations involve the consideration of a number of subjective factors, an analysis of applicable facts and circumstances and the exercise of judgment. As a result, it is possible that the fair value for a security determined in good faith in accordance with the Valuation Procedures may differ from valuations for the same security determined for other funds using their own valuation procedures. Although the Valuation Procedures are designed to value a security at the price the Fund may reasonably expect to receive upon the security's sale in an orderly transaction, there can be no assurance that any fair value determination thereunder would, in fact, approximate the amount that the Fund would actually realize upon the sale of the security or the price at which the security would trade if a reliable market price were readily available. During the year ended October 31, 2022, there were no material changes to the fair value methodologies.
Securities which may be valued in this manner include, but are not limited to: (i) a security for which trading has been halted or suspended or otherwise does not have a readily available market quotation on a given day; (ii) a debt security that has recently gone into default and for which there is not a current market quotation; (iii) a security of an issuer that has entered into a restructuring; (iv) a security that has been delisted from a national exchange; (v) a security subject to trading collars for which no or limited trading takes place; and (vi) a security whose principal market has been temporarily closed at a time when, under normal conditions, it would be open. Securities valued in this manner are generally categorized as Level 2 or 3 in the hierarchy.
Notes to Financial Statements (continued)
The information above is not intended to reflect an exhaustive list of the methodologies that may be used to value portfolio investments. The Valuation Procedures permit the use of a variety of valuation methodologies in connection with valuing portfolio investments. The methodology used for a specific type of investment may vary based on the market data available or other considerations. The methodologies summarized above may not represent the specific means by which portfolio investments are valued on any particular business day.
(C) Income Taxes. The Fund's policy is to comply with the requirements of the Internal Revenue Code of 1986, as amended (the “Internal Revenue Code”), applicable to regulated investment companies and to distribute all of its taxable income to the shareholders of the Fund within the allowable time limits.
The Manager evaluates the Fund’s tax positions to determine if the tax positions taken meet the minimum recognition threshold in connection with accounting for uncertainties in income tax positions taken or expected to be taken for the purposes of measuring and recognizing tax liabilities in the financial statements. Recognition of tax benefits of an uncertain tax position is permitted only to the extent the position is “more likely than not” to be sustained assuming examination by taxing authorities. The Manager analyzed the Fund's tax positions taken on federal, state and local income tax returns for all open tax years (for up to three tax years) and has concluded that no provisions for federal, state and local income tax are required in the Fund's financial statements. The Fund's federal, state and local income tax and federal excise tax returns for tax years for which the applicable statutes of limitations have not expired are subject to examination by the Internal Revenue Service and state and local departments of revenue.
(D) Dividends and Distributions to Shareholders. Dividends and distributions are recorded on the ex-dividend date. The Fund intends to declare dividends from net investment income, if any, daily and intends to pay them at least monthly and declares and pays distributions from net realized capital and currency gains, if any, at least annually. Unless a shareholder elects otherwise, all dividends and distributions are reinvested at NAV in the same class of shares of the Fund. Dividends and distributions to shareholders are determined in accordance with federal income tax regulations and may differ from determinations using GAAP.
(E) Security Transactions and Investment Income. The Fund records security transactions on the trade date. Realized gains and losses on security transactions are determined using the identified cost method. Dividends and distributions received by the Fund from the Underlying Funds are recorded on the ex-dividend date.
Investment income and realized and unrealized gains and losses on investments of the Fund are allocated pro rata to the separate classes of shares based upon their relative net assets on the date the income is earned or realized and unrealized gains and losses are incurred.
(F) Expenses. Expenses of the Trust are allocated to the individual Funds in proportion to the net assets of the respective Funds when the expenses are incurred, except where direct allocations of expenses can
be made. Expenses (other than transfer agent expenses and fees incurred under the shareholder services plans and/or the distribution plans further discussed in Note 3(B)) are allocated to separate classes of shares pro rata based upon their relative net assets on the date the expenses are incurred. The expenses borne by the Fund, including those of related parties to the Fund, are shown in the Statement of Operations.
(G) Use of Estimates. In preparing financial statements in conformity with GAAP, the Manager makes estimates and assumptions that affect the reported amounts and disclosures in the financial statements. Actual results could differ from those estimates and assumptions.
(H) Repurchase Agreements. The Fund may enter into repurchase agreements (i.e., buy a security from another party with the agreement that it will be sold back in the future) to earn income. The Fund may enter into repurchase agreements only with counterparties, usually financial institutions, that are deemed by the Manager or the Subadvisor to be creditworthy, pursuant to guidelines established by the Board. During the term of any repurchase agreement, the Manager or the Subadvisor will continue to monitor the creditworthiness of the counterparty. Under the 1940 Act, repurchase agreements are considered to be collateralized loans by the Fund to the counterparty secured by the securities transferred to the Fund.
Repurchase agreements are subject to counterparty risk, meaning the Fund could lose money by the counterparty’s failure to perform under the terms of the agreement. The Fund mitigates this risk by ensuring the repurchase agreement is collateralized by cash, U.S. government securities, fixed income securities and/or other securities. The collateral is held by the Fund's custodian and valued daily on a mark to market basis to determine if the value, including accrued interest, exceeds the repurchase price. In the event of the counterparty’s default on the obligation to repurchase, the Fund has the right to liquidate the collateral and apply the proceeds in satisfaction of the obligation. Under certain circumstances, such as in the event of default or bankruptcy by the counterparty, realization and/or retention of the collateral may be limited or subject to delay, to legal proceedings and possible realized loss to the Fund. Repurchase agreements as of October 31, 2022, are shown in the Portfolio of Investments.
(I) Debt Securities Risk. The Fund’s investments may include securities such as variable rate notes, floaters and mortgage-related and asset-backed securities. If expectations about changes in interest rates or assessments of an issuer’s credit worthiness or market conditions are incorrect, investments in these types of securities could lose money for the Fund.
The Fund may also invest in U.S. dollar-denominated securities of foreign issuers, which carry certain risks in addition to the usual risks inherent in domestic instruments. These risks include those resulting from future adverse political or economic developments and possible imposition of foreign governmental laws or restrictions. The ability of issuers of debt securities held by the Fund to meet their obligations may be affected by,
among other things, economic or political developments in a specific country, industry or region.
(J) LIBOR Replacement Risk. The Fund may invest in certain debt securities, derivatives or other financial instruments that utilize the London Interbank Offered Rate ("LIBOR"), as a “benchmark” or “reference rate” for various interest rate calculations. As of January 1, 2022, the United Kingdom Financial Conduct Authority, which regulates LIBOR, ceased its active encouragement of banks to provide the quotations needed to sustain most LIBOR rates due to the absence of an active market for interbank unsecured lending and other reasons. However, the United Kingdom Financial Conduct Authority, the LIBOR administrator and other regulators announced that certain sterling and yen LIBOR settings would be calculated on a "synthetic" basis through the end of 2022 and the most widely used tenors of U.S. dollar LIBOR will continue until mid-2023. As a result, it is anticipated that the remaining LIBOR settings will be discontinued or will no longer be sufficiently robust to be representative of its underlying market around that time. Various financial industry groups will plan for that transition and certain regulators and industry groups have taken actions to establish alternative reference rates (e.g., the Secured Overnight Financing Rate, which measures the cost of overnight borrowings through repurchase agreement transactions collateralized with U.S. Treasury securities and is intended to replace U.S. dollar LIBOR with certain adjustments). However, there are challenges to converting certain contracts and transactions to a new benchmark and neither the full effects of the transition process nor its ultimate outcome is known.
The elimination of LIBOR or changes to other reference rates or any other changes or reforms to the determination or supervision of reference rates could have an adverse impact on the market for, or value of, any securities or payments linked to those reference rates, which may adversely affect the Fund's performance and/or net asset value. Uncertainty and risk also remain regarding the willingness and ability of issuers and lenders to include enhanced provisions in new and existing contracts or instruments. Consequently, the transition away from LIBOR to other reference rates may lead to increased volatility and illiquidity in markets that are tied to LIBOR, fluctuations in values of LIBOR-related investments or investments in issuers that utilize LIBOR, increased difficulty in borrowing or refinancing and diminished effectiveness of hedging strategies, adversely affecting the Fund's performance. Furthermore, the risks associated with the expected discontinuation of LIBOR and transition may be exacerbated if the work necessary to effect an orderly transition to an alternative reference rate is not completed in a timely manner. While the transition away from LIBOR has already begun with no material adverse effect to the Fund's performance, the transition is expected to last through mid-2023 for some LIBOR tenors. The usefulness of LIBOR as a benchmark could deteriorate anytime during this transition period.
(K) Indemnifications. Under the Trust’s organizational documents, its officers and trustees are indemnified against certain liabilities that may arise out of performance of their duties to the Trust. Additionally, in the
normal course of business, the Fund enters into contracts with third-party service providers that contain a variety of representations and warranties and that may provide general indemnifications. The Fund's maximum exposure under these arrangements is unknown, as this would involve future claims that may be made against the Fund that have not yet occurred. The Manager believes that the risk of loss in connection with these potential indemnification obligations is remote. However, there can be no assurance that material liabilities related to such obligations will not arise in the future, which could adversely impact the Fund.
Note 3–Fees and Related Party Transactions
(A) Manager and Subadvisor. New York Life Investments, a registered investment adviser and an indirect, wholly-owned subsidiary of New York Life Insurance Company ("New York Life"), serves as the Fund's Manager pursuant to an Amended and Restated Management Agreement ("Management Agreement"). The Manager provides offices, conducts clerical, recordkeeping and bookkeeping services and keeps most of the financial and accounting records required to be maintained by the Fund. Except for the portion of salaries and expenses that are the responsibility of the Fund, the Manager pays the salaries and expenses of all personnel affiliated with the Fund and certain operational expenses of the Fund. During a portion of the year ended October 31, 2022, the Fund reimbursed New York Life Investments in an amount equal to the portion of the compensation of the Chief Compliance Officer attributable to the Fund. NYL Investors LLC ("NYL Investors" or ''Subadvisor''), a registered investment adviser and a direct, wholly-owned subsidiary of New York Life, serves as the Subadvisor to the Fund and is responsible for the day-to-day portfolio management of the Fund. Pursuant to the terms of a Subadvisory Agreement ("Subadvisory Agreement") between New York Life Investments and NYL Investors, New York Life Investments pays for the services of the Subadvisor.
Pursuant to the Management Agreement, the Fund pays the Manager a monthly fee for the services performed and the facilities furnished at an annual rate of the Fund’s average daily net assets as follows: 0.40% up to $500 million; 0.35% from $500 million to $1 billion; and 0.30% in excess of $1 billion. During the year ended October 31, 2022, the effective management fee rate was 0.40% of the Fund’s average daily net assets, exclusive of any applicable waivers/reimbursements.
New York Life Investments has contractually agreed to waive fees and/or reimburse expenses so that Total Annual Fund Operating Expenses (excluding taxes, interest, litigation, extraordinary expenses, brokerage and other transaction expenses relating to the purchase or sale of portfolio investments and acquired (underlying) fund fees and expenses) do not exceed the following percentages of average daily net assets: Class A, 0.70%; Investor Class, 0.80%; Class B, 0.80%; Class C, 0.80% and SIMPLE Class, 0.80%. This agreement will remain in effect until February 28, 2023, and shall renew automatically for one-year terms unless New York Life Investments provides written notice of termination prior to the start of the next term or upon approval of the Board.
Notes to Financial Statements (continued)
New York Life Investments may voluntarily waive fees or reimburse expenses of the Fund to the extent it deems appropriate to enhance the yield of the Fund’s during periods when expenses have a significant impact on the yield of the Fund, as applicable, because of low interest rates. This expense limitation policy is voluntary and in addition to any contractual arrangements that may be in place with respect to the Fund and described in the Fund’s prospectus.
During the year ended October 31, 2022, New York Life Investments earned fees from the Fund in the amount of $1,809,235 and paid the Subadvisor in the amount of $891,275. Additionally, New York Life Investments reimbursed expenses in the amount of $815,497, without which the Fund's total returns would have been lower.
JPMorgan Chase Bank, N.A. ("JPMorgan") provides sub-administration and sub-accounting services to the Fund pursuant to an agreement with New York Life Investments. These services include calculating the daily NAVs of the Fund, maintaining the general ledger and sub-ledger accounts for the calculation of the Fund's NAVs, and assisting New York Life Investments in conducting various aspects of the Fund's administrative operations. For providing these services to the Fund, JPMorgan is compensated by New York Life Investments.
Pursuant to an agreement between the Trust and New York Life Investments, New York Life Investments is responsible for providing or procuring certain regulatory reporting services for the Fund. The Fund will reimburse New York Life Investments for the actual costs incurred by New York Life Investments in connection with providing or procuring these services for the Fund.
(B) Sales Charges. Although the Fund does not assess a CDSC upon redemption of Class B or Class C shares of the Fund, the applicable CDSC will be assessed when shares are redeemed from the Fund if the shareholder previously exchanged his or her investment into the Fund from another fund within the MainStay Group of Funds. The Fund was advised that the Distributor received from shareholders the proceeds from CDSCs of Class A, Class B and Class C during the year ended October 31, 2022, of $236,451, $14,964 and $4,201, respectively.
(C) Transfer, Dividend Disbursing and Shareholder Servicing Agent. NYLIM Service Company LLC, an affiliate of New York Life Investments, is the Fund's transfer, dividend disbursing and shareholder servicing agent pursuant to an agreement between NYLIM Service Company LLC and the Trust. NYLIM Service Company LLC has entered into an agreement with DST Asset Manager Solutions, Inc. ("DST"), pursuant to which DST performs certain transfer agent services on behalf of NYLIM Service Company LLC. New York Life Investments has contractually agreed to limit the transfer agency expenses charged to the Fund’s share classes to a maximum of 0.35% of that share class’s average daily net assets on an annual basis after deducting any applicable Fund or class-level expense reimbursement or small account fees. This agreement will remain in effect until February 28, 2023, and shall renew automatically for one-year terms unless New York Life Investments provides written notice of termination prior to the start of the
next term or upon approval of the Board. During the year ended October 31, 2022, transfer agent expenses incurred by the Fund and any reimbursements, pursuant to the aforementioned Transfer Agency expense limitation agreement, were as follows:
| Class | Expense | Waived |
| Class A | $278,205 | $— |
| Investor Class | 80,464 | — |
| Class B | 95,238 | — |
| Class C | 71,449 | — |
| SIMPLE Class | 260 | — |
(D) Small Account Fee. Shareholders with small accounts adversely impact the cost of providing transfer agency services. In an effort to reduce total transfer agency expenses, the Fund has implemented a small account fee on certain types of accounts. As described in the Fund's prospectus, certain shareholders with an account balance of less than $1,000 ($5,000 for Class A share accounts) are charged an annual per account fee of $20 (assessed semi-annually), the proceeds from which offset transfer agent fees as reflected in the Statement of Operations. This small account fee will not apply to certain types of accounts as described further in the Fund’s prospectus.
(E) Capital. As of October 31, 2022, New York Life and its affiliates beneficially held shares of the Fund with the values and percentages of net assets as follows:
Note 4-Federal Income Tax
The amortized cost also represents the aggregate cost for federal income tax purposes.
As of October 31, 2022, the components of accumulated gain (loss) on a tax basis were as follows:
Ordinary
income | Accumulated
Capital
and Other
Gain (Loss) | Other
Temporary
Differences | Unrealized
Appreciation
(Depreciation) | Total
Accumulated
Gain (Loss) |
| $51,620 | $(9,046) | $(18,657) | $— | $23,917 |
The other temporary differences are primarily due to dividends payable.
The following table discloses the current year reclassifications between total distributable earnings (loss) and additional paid-in capital arising from permanent differences; net assets as of October 31, 2022 were not affected.
| | Total
Distributable
Earnings (Loss) | Additional
Paid-In
Capital |
| | $1,559 | $(1,559) |
The reclassifications for the Fund are primarily due to excise taxes paid.
As of October 31, 2022, for federal income tax purposes, capital loss carryforwards of $9,046, as shown in the table below, were available to the extent provided by the regulations to offset future realized gains of the Fund. Accordingly, no capital gains distributions are expected to be paid to shareholders until net gains have been realized in excess of such amounts.
Capital Loss
Available Through | Short-Term
Capital Loss
Amounts (000’s) | Long-Term
Capital Loss
Amounts (000’s) |
| Unlimited | $9 | $— |
During the years ended October 31, 2022 and October 31, 2021, the tax character of distributions paid as reflected in the Statements of Changes in Net Assets was as follows:
| | 2022 | 2021 |
| Distributions paid from: | | |
| Ordinary Income | $3,266,264 | $45,524 |
Note 5–Custodian
JPMorgan is the custodian of cash and securities held by the Fund. Custodial fees are charged to the Fund based on the Fund's net assets and/or the market value of securities held by the Fund and the number of certain transactions incurred by the Fund.
Note 6–Interfund Lending Program
Pursuant to an exemptive order issued by the SEC, the Fund, along with certain other funds managed by New York Life Investments, may participate in an interfund lending program. The interfund lending program provides an alternative credit facility that permits the Fund and certain other funds managed by New York Life Investments to lend or borrow money for temporary purposes directly to or from one another, subject to the conditions of the exemptive order. During the year ended October 31, 2022, there were no interfund loans made or outstanding with respect to the Fund.
Note 7–Capital Share Transactions
Transactions in capital shares for the years ended October 31, 2022 and October 31, 2021, were as follows:
| Class A (at $1 per share) | Shares |
| Year ended October 31, 2022: | |
| Shares sold | 501,242,230 |
| Shares issued to shareholders in reinvestment of distributions | 2,840,624 |
| Shares redeemed | (437,742,190) |
| Net increase (decrease) in shares outstanding before conversion | 66,340,664 |
| Shares converted into Class A (See Note 1) | 6,333,245 |
| Shares converted from Class A (See Note 1) | (31,127) |
| Net increase (decrease) | 72,642,782 |
| Year ended October 31, 2021: | |
| Shares sold | 340,675,734 |
| Shares issued to shareholders in reinvestment of distributions | 20,131 |
| Shares redeemed | (410,827,373) |
| Shares converted into Class A (See Note 1) | 9,888,238 |
| Shares converted from Class A (See Note 1) | (55,680) |
| Net increase (decrease) | (60,298,950) |
| |
| Investor Class (at $1 per share) | Shares |
| Year ended October 31, 2022: | |
| Shares sold | 15,993,287 |
| Shares issued to shareholders in reinvestment of distributions | 106,552 |
| Shares redeemed | (12,623,425) |
| Net increase (decrease) in shares outstanding before conversion | 3,476,414 |
| Shares converted into Investor Class (See Note 1) | 54,453 |
| Shares converted from Investor Class (See Note 1) | (6,299,663) |
| Net increase (decrease) | (2,768,796) |
| Year ended October 31, 2021: | |
| Shares sold | 16,943,609 |
| Shares issued to shareholders in reinvestment of distributions | 811 |
| Shares redeemed | (14,259,565) |
| Shares converted into Investor Class (See Note 1) | 175,065 |
| Shares converted from Investor Class (See Note 1) | (9,191,211) |
| Net increase (decrease) | (6,331,291) |
| |
| Class B (at $1 per share) | Shares |
| Year ended October 31, 2022: | |
| Shares sold | 1,717,725 |
| Shares issued to shareholders in reinvestment of distributions | 130,661 |
| Shares redeemed | (3,810,689) |
| Net increase (decrease) in shares outstanding before conversion | (1,962,303) |
| Shares converted from Class B (See Note 1) | (50,239) |
| Net increase (decrease) | (2,012,542) |
| Year ended October 31, 2021: | |
| Shares sold | 1,636,627 |
| Shares issued to shareholders in reinvestment of distributions | 2,084 |
| Shares redeemed | (6,104,060) |
| Shares converted from Class B (See Note 1) | (40,794) |
| Net increase (decrease) | (4,506,143) |
| |
Notes to Financial Statements (continued)
| Class C (at $1 per share) | Shares |
| Year ended October 31, 2022: | |
| Shares sold | 14,098,553 |
| Shares issued to shareholders in reinvestment of distributions | 101,346 |
| Shares redeemed | (13,669,897) |
| Net increase (decrease) in shares outstanding before conversion | 530,002 |
| Shares converted from Class C (See Note 1) | (6,668) |
| Net increase (decrease) | 523,334 |
| Year ended October 31, 2021: | |
| Shares sold | 9,030,802 |
| Shares issued to shareholders in reinvestment of distributions | 1,824 |
| Shares redeemed | (18,486,789) |
| Shares converted from Class C (See Note 1) | (775,618) |
| Net increase (decrease) | (10,229,781) |
| |
| SIMPLE Class (at $1 per share) | Shares |
| Year ended October 31, 2022: | |
| Shares sold | 134,386 |
| Shares issued to shareholders in reinvestment of distributions | 393 |
| Shares redeemed | (85,956) |
| Net increase (decrease) | 48,823 |
| Year ended October 31, 2021: | |
| Shares issued to shareholders in reinvestment of distributions | 3 |
| Net increase (decrease) | 3 |
Note 8–Other Matters
As of the date of this report, interest rates in the United States and many parts of the world, including certain European countries, are ascending from historically low levels. Thus, the Fund currently faces a heightened level of risk associated with rising interest rates. This could be driven by a variety of factors, including but not limited to central bank monetary policies, changing inflation or real growth rates, general economic conditions, increasing bond issuances or reduced market demand for low yielding investments.
An outbreak of COVID-19, first detected in December 2019, has developed into a global pandemic and has resulted in travel restrictions, closure of international borders, certain businesses and securities markets, restrictions on securities trading activities, prolonged quarantines, supply chain disruptions, and lower consumer demand, as well as general concern and uncertainty. In 2022, many countries lifted some or all restrictions related to COVID-19. However, the continued impact of COVID-19 and related variants is uncertain and could further adversely affect the global economy, national economies, individual issuers and capital markets in unforeseeable ways and result in a substantial and extended economic downturn. Developments that disrupt global economies and financial markets, such as COVID-19, may magnify factors that affect the Fund's performance.
Note 9–Subsequent Events
In connection with the preparation of the financial statements of the Fund as of and for the year ended October 31, 2022, events and transactions subsequent to October 31, 2022, through the date the financial statements were issued have been evaluated by the Manager for possible adjustment and/or disclosure. No subsequent events requiring financial statement adjustment or disclosure have been identified.
Report of Independent Registered Public Accounting Firm
To the Shareholders of the Fund and Board of Trustees
The MainStay Funds:
Opinion on the Financial Statements
We have audited the accompanying statement of assets and liabilities of MainStay Money Market Fund (the Fund), one of the funds constituting The MainStay Funds, including the portfolio of investments, as of October 31, 2022, the related statement of operations for the year then ended, the statements of changes in net assets for each of the years in the two-year period then ended, and the related notes (collectively, the financial statements) and the financial highlights for each of the years or periods in the five-year period then ended. In our opinion, the financial statements and financial highlights present fairly, in all material respects, the financial position of the Fund as of October 31, 2022, the results of its operations for the year then ended, the changes in its net assets for each of the years in the two-year period then ended, and the financial highlights for each of the years or periods in the five-year period then ended, in conformity with U.S. generally accepted accounting principles.
Basis for Opinion
These financial statements and financial highlights are the responsibility of the Fund's management. Our responsibility is to express an opinion on these financial statements and financial highlights based on our audits. We are a public accounting firm registered with the Public Company Accounting Oversight Board (United States) (PCAOB) and are required to be independent with respect to the Fund in accordance with the U.S. federal securities laws and the applicable rules and regulations of the Securities and Exchange Commission and the PCAOB.
We conducted our audits in accordance with the standards of the PCAOB. Those standards require that we plan and perform the audit to obtain reasonable assurance about whether the financial statements and financial highlights are free of material misstatement, whether due to error or fraud. Our audits included performing procedures to assess the risks of material misstatement of the financial statements and financial highlights, whether due to error or fraud, and performing procedures that respond to those risks. Such procedures included examining, on a test basis, evidence regarding the amounts and disclosures in the financial statements and financial highlights. Such procedures also included confirmation of securities owned as of October 31, 2022, by correspondence with the custodian and brokers. Our audits also included evaluating the accounting principles used and significant estimates made by management, as well as evaluating the overall presentation of the financial statements and financial highlights. We believe that our audits provide a reasonable basis for our opinion.

We have served as the auditor of one or more New York Life Investment Management investment companies since 2003.
Philadelphia, Pennsylvania
December 23, 2022
Federal Income Tax Information
(Unaudited)
In February 2023, shareholders will receive an IRS Form 1099-DIV or substitute Form 1099, which will show the federal tax status of the distributions received by shareholders in calendar year 2022. The amounts that will be reported on such 1099-DIV or substitute Form 1099 will be the amounts you are to use on your federal income tax return and will differ from the amounts which we must report for the Fund's fiscal year ended October 31, 2022.
Proxy Voting Policies and Procedures and Proxy Voting Record
The Fund is required to file with the SEC its proxy voting record for the 12-month period ending June 30 on Form N-PX. A description of the policies and procedures that are used to vote proxies relating to portfolio securities of the Fund is available free of charge upon request by calling 800-624-6782 or visiting the SEC’s website at www.sec.gov. The most recent Form N-PX or proxy voting record is available free of charge upon request by calling 800-624-6782; visiting newyorklifeinvestments.com; or visiting the SEC’s website at www.sec.gov.
Shareholder Reports and Quarterly Portfolio Disclosure
The Fund is required to file a Form N-MFP every month disclosing its portfolio holdings. The Fund's Form N-MFP is available free of charge upon request by calling New York Life Investments at 800-624-6782.
Board of Trustees and Officers (Unaudited)
The Trustees and officers of the Fund are listed below. The Board oversees the MainStay Group of Funds (which consists of MainStay Funds and MainStay Funds Trust), MainStay VP Funds Trust, MainStay MacKay DefinedTerm Municipal Opportunities Fund, MainStay CBRE Global Infrastructure Megatrends Fund, the Manager and the Subadvisors, and elects the officers of the Funds who are responsible for the day-to-day operations of the Fund. Information pertaining to the Trustees and officers is set forth below. Each Trustee serves until his or her successor is
elected and qualified or until his or her resignation, death or removal. Under the Board’s retirement policy, unless an exception is made, a Trustee must tender his or her resignation by the end of the calendar year during which he or she reaches the age of 75. The business address of each Trustee and officer listed below is 51 Madison Avenue, New York, New York 10010. None of the Trustees are “interested persons” (as defined by the 1940 Act and rules adopted by the SEC thereunder) of the Fund (“Independent Trustees”).
| | Name and
Year of Birth | Term of Office,
Position(s) Held and
Length of Service | Principal Occupation(s)
During Past Five Years | Number of
Portfolios in
Fund Complex
Overseen by
Trustee | Other Directorships
Held by Trustee |
| | | | | | |
| | David H. Chow
1957 | MainStay Funds: Trustee since 2016, Advisory Board Member (June 2015 to December 2015);MainStay Funds Trust:
Trustee since January 2016, Advisory Board Member (June 2015 to December 2015) | Founder and CEO, DanCourt Management, LLC since 1999 | 78 | MainStay VP Funds Trust: Trustee since January 2016, Advisory Board Member (June 2015 to December 2015) (31 portfolios);
MainStay MacKay DefinedTerm Municipal Opportunities Fund: Trustee since January 2016, Advisory Board Member (June 2015 to December 2015);
MainStay CBRE Global Infrastructure Megatrends Fund: Trustee since June 2021; VanEck Vectors Group of Exchange-Traded Funds: Independent Chairman of the Board of Trustees since 2008 and Trustee since 2006 (56 portfolios); and Berea College of Kentucky: Trustee since 2009, Chair of the Investment Committee since 2018 |
| | Susan B. Kerley
1951 | MainStay Funds: Chairman since 2017 and Trustee since 2007;MainStay Funds Trust:
Chairman since 2017 and Trustee since 1990** | President, Strategic Management Advisors LLC since 1990 | 78 | MainStay VP Funds Trust: Chairman since January 2017 and Trustee since 2007 (31 portfolios)**;
MainStay MacKay DefinedTerm Municipal Opportunities Fund: Chairman since 2017 and Trustee since 2011;
MainStay CBRE Global Infrastructure Megatrends Fund: Trustee since June 2021; and Legg Mason Partners Funds: Trustee since 1991 (45 portfolios) |
| | Alan R. Latshaw
1951 | MainStay Funds: Trustee since 2006;MainStay Funds Trust:
Trustee since 2007*** | Retired; Partner, Ernst & Young LLP (2002 to 2003); Partner, Arthur Andersen LLP (1989 to 2002); Consultant to the MainStay Funds Audit and Compliance Committee (2004 to 2006) | 78 | MainStay VP Funds Trust: Trustee since 2007 (31 portfolios)**;
MainStay MacKay DefinedTerm Municipal Opportunities Fund: Trustee since 2011; and
MainStay CBRE Global Infrastructure Megatrends Fund: Trustee since June 2021 |
Board of Trustees and Officers (Unaudited) (continued)
| | Name and
Year of Birth | Term of Office,
Position(s) Held and
Length of Service | Principal Occupation(s)
During Past Five Years | Number of
Portfolios in
Fund Complex
Overseen by
Trustee | Other Directorships
Held by Trustee |
| | | | | | |
| | Karen Hammond
1956 | MainStay Funds: Trustee since December 2021, Advisory Board Member (June 2021 to December 2021);MainStay Funds Trust:
Trustee since December 2021, Advisory Board Member (June 2021 to December 2021)
| Retired, Managing Director, Devonshire Investors (2007 to 2013); Senior Vice President, Fidelity Management & Research Co. (2005 to 2007); Senior Vice President and Corporate Treasurer, FMR Corp. (2003 to 2005); Chief Operating Officer, Fidelity Investments Japan (2001 to 2003) | 78 | MainStay VP Funds Trust: Trustee since December 2021, Advisory Board Member (June 2021 to December 2021) (31 Portfolios);
MainStay MacKay DefinedTerm Municipal Opportunities Fund: Trustee since December 2021, Advisory Board Member (June 2021 to December 2021);
MainStay CBRE Global Infrastructure Megatrends Fund: Trustee since December 2021, Advisory Board Member (June 2021 to December 2021);
Two Harbors Investment Corp.: Director since 2018;
Rhode Island State Investment Commission: Member since 2017; and
Blue Cross Blue Shield of Rhode Island: Director since 2019 |
| | Jacques P. Perold
1958 | MainStay Funds: Trustee since 2016, Advisory Board Member (June 2015 toDecember 2015);MainStay Funds Trust:
Trustee since January 2016, Advisory Board Member (June 2015 to December 2015) | Founder and Chief Executive Officer, CapShift Advisors LLC (since 2018); President, Fidelity Management & Research Company (2009 to 2014); President and Chief Investment Officer, Geode Capital Management, LLC (2001 to 2009) | 78 | MainStay VP Funds Trust: Trustee since January 2016, Advisory Board Member (June 2015 to December 2015) (31 portfolios);
MainStay MacKay DefinedTerm Municipal Opportunities Fund: Trustee since January 2016, Advisory Board Member (June 2015 to December 2015);
MainStay CBRE Global Infrastructure Megatrends Fund: Trustee since June 2021; Partners in Health: Trustee since 2019; Allstate Corporation: Director since 2015; and MSCI Inc.: Director since 2017 |
| | Richard S. Trutanic
1952 | MainStay Funds: Trustee since 1994;MainStay Funds Trust:
Trustee since 2007*** | Chairman and Chief Executive Officer, Somerset & Company (financial advisory firm) since 2004; Managing Director, The Carlyle Group (private investment firm) (2002 to 2004); Senior Managing Director, Partner and Board Member, Groupe Arnault S.A. (private investment firm) (1999 to 2002) | 78 | MainStay VP Funds Trust: Trustee since 2007 (31 portfolios)**;
MainStay MacKay DefinedTerm Municipal Opportunities Fund: Trustee since 2011; and MainStay CBRE Global Infrastructure Megatrends Fund: Trustee since June 2021 |
| ** | Includes prior service as a Director of MainStay VP Series Fund, Inc., the predecessor to MainStay VP Funds Trust. |
| *** | Includes prior service as a Director/Trustee of certain predecessor entities to MainStay Funds Trust. |
| 28 | MainStay Money Market Fund |
| | Name and
Year of Birth | Position(s) Held and
Length of Service | Principal Occupation(s)
During Past Five Years | |
| | | | | |
| | Kirk C. Lehneis
1974 | President, MainStay Funds, MainStay Funds Trust since 2017 | Chief Operating Officer and Senior Managing Director (since 2016), New York Life Investment Management LLC and New York Life Investment Management Holdings LLC; Member of the Board of Managers (since 2017) and Senior Managing Director (since 2018), NYLIFE Distributors LLC; Chairman of the Board and Senior Managing Director, NYLIM Service Company LLC (since 2017); Trustee, President and Principal Executive Officer of IndexIQ Trust, IndexIQ ETF Trust and IndexIQ Active ETF Trust (since January 2018); President, MainStay CBRE Global Infrastructure Megatrends Fund (since 2021), MainStay MacKay DefinedTerm Municipal Opportunities Fund and MainStay VP Funds Trust (since 2017); Senior Managing Director, Global Product Development (From 2015-2016); Managing Director, Product Development (2010 to 2015), New York Life Investment Management LLC | |
| | Jack R. Benintende
1964 | Treasurer and Principal Financial and Accounting Officer, MainStay Funds (since 2007), MainStay Funds Trust (since 2009) | Managing Director, New York Life Investment Management LLC (since 2007); Treasurer and Principal Financial and Accounting Officer, MainStay CBRE Global Infrastructure Megatrends Fund (since 2021), MainStay MacKay DefinedTerm Municipal Opportunities Fund (since 2011) and MainStay VP Funds Trust (since 2007)** and Assistant Treasurer, New York Life Investment Management Holdings LLC (2008 to 2012) | |
| | J. Kevin Gao
1967 | Secretary and Chief Legal Officer, MainStay Funds and MainStay Funds Trust (since 2010) | Managing Director and Associate General Counsel, New York Life Investment Management LLC (since 2010); Secretary and Chief Legal Officer and MainStay CBRE Global Infrastructure Megatrends Fund (since 2021), MainStay MacKay DefinedTerm Municipal Opportunities Fund (since 2011) and MainStay VP Funds Trust (since 2010)** | |
| | Scott T. Harrington
1959 | Vice President— Administration, MainStay Funds (since 2009), MainStay Funds Trust (since 2009) | Managing Director, New York Life Investment Management LLC (including predecessor advisory organizations) (since 2000); Member of the Board of Directors, New York Life Trust Company (since 2009); Vice President—Administration, MainStay CBRE Global Infrastructure Megatrends Fund (since 2021), MainStay MacKay DefinedTerm Municipal Opportunities Fund (since 2011) and MainStay VP Funds Trust (since 2005)** | |
| | Kevin M. Gleason
1967 | Vice President and Chief Compliance Officer, MainStay Funds and MainStay Funds Trust (since June 2022) | Vice President and Chief Compliance Officer, IndexIQ, IndexIQ ETF Trust and Index IQ Active ETF Trust (since June 2022); Vice President and Chief Compliance Officer, MainStay CBRE Global Infrastructure Megatrends Fund, MainStay VP Funds Trust and MainStay MacKay DefinedTerm Municipal Opportunities Fund (since June 2022); Senior Vice President, Voya Investment Management and Chief Compliance Officer, Voya Family of Funds (2012-2022) | |
| * | The officers listed above are considered to be “interested persons” of the MainStay Group of Funds, MainStay VP Funds Trust, MainStay CBRE Global Infrastructure Megatrends Fund and MainStay MacKay DefinedTerm Municipal Opportunities Fund within the meaning of the 1940 Act because of their affiliation with the MainStay Group of Funds, New York Life Insurance Company and/or its affiliates, including New York Life Investment Management LLC, NYLIM Service Company LLC, NYLIFE Securities LLC and/or NYLIFE Distributors LLC, as described in detail in the column captioned “Principal Occupation(s) During Past Five Years.” Officers are elected annually by the Board. |
| ** | Includes prior service as an Officer of MainStay VP Series Fund, Inc., the predecessor to MainStay VP Funds Trust. |
Officers of the Trust (Who are not Trustees)*
This page intentionally left blank.
Equity
U.S. Equity
MainStay Epoch U.S. Equity Yield Fund
MainStay S&P 500 Index Fund1
MainStay Winslow Large Cap Growth Fund
MainStay WMC Enduring Capital Fund
MainStay WMC Growth Fund
MainStay WMC Small Companies Fund
MainStay WMC Value Fund
International Equity
MainStay Epoch International Choice Fund
MainStay MacKay International Equity Fund
MainStay WMC International Research Equity Fund
Emerging Markets Equity
MainStay Candriam Emerging Markets Equity Fund
Global Equity
MainStay Epoch Capital Growth Fund
MainStay Epoch Global Equity Yield Fund
Fixed Income
Taxable Income
MainStay Candriam Emerging Markets Debt Fund
MainStay Floating Rate Fund
MainStay MacKay High Yield Corporate Bond Fund
MainStay MacKay Short Duration High Yield Fund
MainStay MacKay Strategic Bond Fund
MainStay MacKay Total Return Bond Fund
MainStay MacKay U.S. Infrastructure Bond Fund
MainStay Short Term Bond Fund
Tax-Exempt Income
MainStay MacKay California Tax Free Opportunities Fund2
MainStay MacKay High Yield Municipal Bond Fund
MainStay MacKay New York Tax Free Opportunities Fund3
MainStay MacKay Short Term Municipal Fund
MainStay MacKay Strategic Municipal Allocation Fund
MainStay MacKay Tax Free Bond Fund
Money Market
MainStay Money Market Fund
Mixed Asset
MainStay Balanced Fund
MainStay Income Builder Fund
MainStay MacKay Convertible Fund
Speciality
MainStay CBRE Global Infrastructure Fund
MainStay CBRE Real Estate Fund
MainStay Cushing MLP Premier Fund
Asset Allocation
MainStay Conservative Allocation Fund
MainStay Conservative ETF Allocation Fund
MainStay Defensive ETF Allocation Fund
MainStay Equity Allocation Fund
MainStay Equity ETF Allocation Fund
MainStay ESG Multi-Asset Allocation Fund
MainStay Growth Allocation Fund
MainStay Growth ETF Allocation Fund
MainStay Moderate Allocation Fund
MainStay Moderate ETF Allocation Fund
Manager
New York Life Investment Management LLC
New York, New York
Subadvisors
Candriam4
Strassen, Luxembourg
CBRE Investment Management Listed Real Assets LLC
Radnor, Pennsylvania
Cushing Asset Management, LP
Dallas, Texas
Epoch Investment Partners, Inc.
New York, New York
MacKay Shields LLC4
New York, New York
NYL Investors LLC4
New York, New York
Wellington Management Company LLP
Boston, Massachusetts
Winslow Capital Management, LLC
Minneapolis, Minnesota
Legal Counsel
Dechert LLP
Washington, District of Columbia
Independent Registered Public Accounting Firm
KPMG LLP
Philadelphia, Pennsylvania
Distributor
NYLIFE Distributors LLC4
Jersey City, New Jersey
Custodian
JPMorgan Chase Bank, N.A.
New York, New York
1.
Prior to February 28, 2022, the Fund's name was MainStay MacKay S&P 500 Index Fund.
| 2. | This Fund is registered for sale in AZ, CA, NV, OR, TX, UT, WA and MI (Class A and Class I shares only), and CO, FL, GA, HI, ID, MA, MD, NH, NJ and NY (Class I shares only). |
| 3. | This Fund is registered for sale in CA, CT, DE, FL, MA, NJ, NY and VT. |
| 4. | An affiliate of New York Life Investment Management LLC. |
Not part of the Annual Report
For more information
800-624-6782
newyorklifeinvestments.com
“New York Life Investments” is both a service mark, and the common trade name, of certain investment advisors affiliated with New York Life Insurance Company. The MainStay Funds® are managed by New York Life Investment Management LLC and distributed by NYLIFE Distributors LLC, 30 Hudson Street, Jersey City, NJ 07302, a wholly owned subsidiary of New York Life Insurance Company. NYLIFE Distributors LLC is a Member FINRA/SIPC.
©2022 NYLIFE Distributors LLC. All rights reserved.
| 5013932.2MS229-22 | MSMM11-12/22 |
(NYLIM) NL214
MainStay Winslow Large Cap Growth Fund
Message from the President and Annual Report
October 31, 2022
Sign up for e-delivery of your shareholder reports. For full details on e-delivery, including who can participate and what you can receive via e-delivery,
please log in to newyorklifeinvestments.com/accounts.
| Not FDIC/NCUA Insured | Not a Deposit | May Lose Value | No Bank Guarantee | Not Insured by Any Government Agency |
This page intentionally left blank
Message from the President
A series of economic and geopolitical challenges undermined equity and fixed-income markets during the 12-month reporting period ended October 31, 2022. Stocks and bonds alike trended lower in the face of sharply rising interest rates, increasing inflationary pressures, slowing economic growth and Russia’s invasion of Ukraine.
The reporting period began on a mixed note, with concerns about the spreading Omicron variant of the COVID-19 virus and increasingly hawkish statements from the U.S. Federal Reserve (the “Fed”) regarding mounting inflation, countered by bullish sentiment stemming from U.S. economic growth and strong corporate earnings. In January 2022, markets turned decisively negative as comments from the Fed raised the likelihood of rate hikes as early as March, and Russia issued increasingly aggressive threats toward Ukraine. The onset of Russia’s invasion in February exacerbated global inflationary pressures while increasing investor uncertainty. Domestic supply shortages, international trade imbalances and rising inflation caused GDP (gross domestic product) to contract in the first and second quarters of the year, although employment and consumer spending proved resilient. Prices for petroleum surged to multi-year highs, while many key agricultural chemicals and industrial metals climbed as well. Accelerating inflationary forces prompted the Fed to implement its most aggressive interest rate increases since the 1980s with a series of five sharp rate hikes, raising the federal funds rate from a range of 0.00% to 0.25% in March to 3.00% to 3.25% in September, with additional rate hikes expected before the end of the year. International central banks generally followed suit, raising rates by varying degrees in efforts to curb local inflation, although most increases remained significantly more modest than those in the United States. Relatively high U.S. interest rates and risk-averse international sentiment pushed U.S. dollar values higher compared to most other currencies, with the ensuing negative impact on global prices for food, fuel and other key, U.S.-dollar-denominated products.
The effects of these interrelated challenges were felt throughout U.S. and international financial markets. The S&P 500® Index, a widely regarded benchmark of U.S. market performance, declined by more than 14% during the reporting period. Although the energy sector generated strong gains, bolstered by elevated oil and gas prices, most other industry areas recorded losses. The more cyclical and growth-oriented sectors of consumer discretionary, real estate and information technology delivered the
weakest returns, while the traditionally defensive and value-oriented consumer staples, utilities and health care sectors outperformed. International stocks lagged compared to their U.S. counterparts, with some emerging markets, such as China, suffering particularly steep losses. A few markets, however, including Brazil, Mexico and the United Arab Emirates, ended the reporting period with little change. Fixed-income markets saw bond prices broadly decline as yields rose along with interest rates. Short-term yields rose faster than long-term yields, producing a yield curve inversion from July through the end of the reporting period, with long-term rates remaining below short-term rates. While floating-rate instruments, which feature variable interest rates that allow investors to benefit from a rising rate environment, provided a degree of insulation from inflation-driven trends, they were not immune to the market’s widespread declines.
While the Fed acknowledges the costs of rising rates in terms of weaker GDP growth and unsettled financial markets over the short term, its primary focus continues to be the longer-term economic impact of inflation. With the latest figures as of the date of this report showing that inflation remains above 8%, versus a target rate of just 2%, the Fed clearly has a distance yet to go, making further rate increases and market volatility more likely in the coming months. The question remains as to whether the Fed and other central banks will manage a so-called “soft landing,” curbing inflation while avoiding a persistent economic slowdown. If they prove successful, we expect that favorable inflation trends and increasingly attractive valuations in both equity and bond markets should eventually translate into sustainable improvements in the investment environment.
Whatever actions the Fed takes and however financial markets react, as a MainStay investor, you can depend on us to continue providing the insight, expertise and service that have long defined New York Life Investments. Thank you for trusting us to help you meet your investment needs.
Sincerely,
Kirk C. Lehneis
President
The opinions expressed are as of the date of this report and are subject to change. There is no guarantee that any forecast made will come to pass. This material does not constitute investment advice and is not intended as an endorsement of any specific investment. Past performance is no guarantee of future results.
Not part of the Annual Report
Investors should refer to the Fund’s Summary Prospectus and/or Prospectus and consider the Fund’s investment objectives, strategies, risks, charges and expenses carefully before investing. The Summary Prospectus and/or Prospectus contain this and other information about the Fund. You may obtain copies of the Fund’s Summary Prospectus, Prospectus and Statement of Additional Information, which includes information about The MainStay Funds' Trustees, free of charge, upon request, by calling toll-free 800-624-6782, by writing to NYLIFE Distributors LLC, Attn: MainStay Marketing Department, 30 Hudson Street, Jersey City, NJ 07302 or by sending an e-mail to MainStayShareholderServices@nylim.com. These documents are also available via the MainStay Funds’ website at newyorklifeinvestments.com. Please read the Fund’s Summary Prospectus and/or Prospectus carefully before investing.
Investment and Performance Comparison (Unaudited)
Performance data quoted represents past performance. Past performance is no guarantee of future results. Because of market volatility and other factors, current performance may be lower or higher than the figures shown. Investment return and principal value will fluctuate, and as a result, when shares are redeemed, they may be worth more or less than their original cost. The graph below depicts the historical performance of Class I shares of the Fund. Performance will vary from class to class based on differences in class-specific expenses and sales charges. For performance information current to the most recent month-end, please call 800-624-6782 or visit newyorklifeinvestments.com.
The performance table and graph do not reflect the deduction of taxes that a shareholder would pay on distributions or Fund share redemptions. Total returns reflect maximum applicable sales charges as indicated in the table below, if any, changes in share price, and reinvestment of dividend and capital gain distributions. The graph assumes the initial investment amount shown below and reflects the deduction of all sales charges that would have applied for the period of investment. Performance figures may reflect certain fee waivers and/or expense limitations, without which total returns may have been lower. For more information on share classes and current fee waivers and/or expense limitations (if any), please refer to the Notes to Financial Statements.
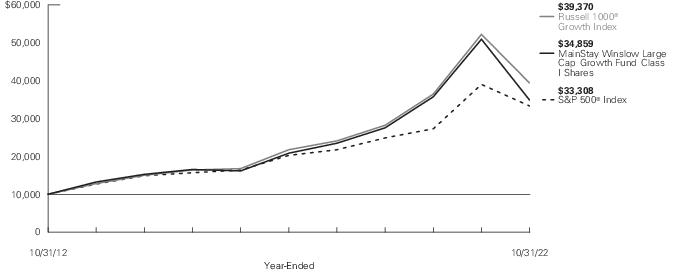
| Average Annual Total Returns for the Year-Ended October 31, 2022 |
| Class | Sales Charge | | Inception
Date | One
Year | Five
Years | Ten Years
or Since
Inception | Gross
Expense
Ratio1 |
| Class A Shares | Maximum 5.5% Initial Sales Charge | With sales charges | 7/1/1995 | -35.46% | 9.33% | 12.39% | 0.94% |
| | | Excluding sales charges | | -31.71 | 10.57 | 13.02 | 0.94 |
| Investor Class Shares2 | Maximum 5% Initial Sales Charge | With sales charges | 2/28/2008 | -35.16 | 9.19 | 12.29 | 1.09 |
| | | Excluding sales charges | | -31.75 | 10.44 | 12.93 | 1.09 |
| Class B Shares3 | Maximum 5% CDSC | With sales charges | 4/1/2005 | -34.70 | 9.43 | 12.08 | 1.84 |
| | if Redeemed Within the First Six Years of Purchase | Excluding sales charges | | -32.29 | 9.60 | 12.08 | 1.84 |
| Class C Shares | Maximum 1% CDSC | With sales charges | 4/1/2005 | -32.77 | 9.61 | 12.08 | 1.84 |
| | if Redeemed Within One Year of Purchase | Excluding sales charges | | -32.29 | 9.61 | 12.08 | 1.84 |
| Class I Shares | No Sales Charge | | 4/1/2005 | -31.55 | 10.83 | 13.30 | 0.69 |
| Class R1 Shares | No Sales Charge | | 4/1/2005 | -31.62 | 10.71 | 13.19 | 0.79 |
| Class R2 Shares | No Sales Charge | | 4/1/2005 | -31.74 | 10.47 | 12.91 | 1.04 |
| Class R3 Shares | No Sales Charge | | 4/28/2006 | -31.98 | 10.17 | 12.62 | 1.29 |
| Class R6 Shares | No Sales Charge | | 6/17/2013 | -31.50 | 10.93 | 12.57 | 0.63 |
| SIMPLE Class Shares | No Sales Charge | | 8/31/2020 | -32.02 | N/A | -5.67 | 1.34 |
| 1. | The gross expense ratios presented reflect the Fund’s “Total Annual Fund Operating Expenses” from the most recent Prospectus, as supplemented, and may differ from other expense ratios disclosed in this report. |
| 2. | Prior to June 30, 2020, the maximum initial sales charge was 5.5%, which is reflected in the applicable average annual total return figures shown. |
| 3. | Class B shares are closed to all new purchases as well as additional investments by existing Class B shareholders. |
The footnotes on the next page are an integral part of the table and graph and should be carefully read in conjunction with them.
| Benchmark Performance* | One
Year | Five
Years | Ten
Years |
| Russell 1000® Growth Index1 | -24.60% | 12.59% | 14.69% |
| S&P 500® Index2 | -14.61 | 10.44 | 12.79 |
| Morningstar Large Growth Category Average3 | -28.57 | 9.11 | 11.95 |
| * | Returns for indices reflect no deductions for fees, expenses or taxes, except for foreign withholding taxes where applicable. Results assume reinvestment of all dividends and capital gains. An investment cannot be made directly in an index. |
| 1. | The Russell 1000® Growth Index is the Fund's primary benchmark. The Russell 1000® Growth Index is a broad-based benchmark that measures the performance of the large-cap growth segment of the U.S. equity universe. It includes those Russell 1000® Index companies with higher price-to-book ratios and higher forecasted growth values. |
| 2. | The S&P 500® Index is the Fund's secondary benchmark. “S&P 500®" is a trademark of The McGraw-Hill Companies, Inc. The S&P 500® Index is widely regarded as the standard index for measuring large-cap U.S. stock market performance. |
| 3. | The Morningstar Large Growth Category Average is representative of funds that invest primarily in big U.S. companies that are projected to grow faster than other large-cap stocks. Stocks in the top 70% of the capitalization of the U.S. equity market are defined as large cap. Growth is defined based on fast growth and high valuations. Most of these funds focus on companies in rapidly expanding industries. Results are based on average total returns of similar funds with all dividends and capital gain distributions reinvested. |
The footnotes on the preceding page are an integral part of the table and graph and should be carefully read in conjunction with them.
| 6 | MainStay Winslow Large Cap Growth Fund |
Cost in Dollars of a $1,000 Investment in MainStay Winslow Large Cap Growth Fund (Unaudited)
The example below is intended to describe the fees and expenses borne by shareholders during the six-month period from May 1, 2022 to October 31, 2022, and the impact of those costs on your investment.
Example
As a shareholder of the Fund you incur two types of costs: (1) transaction costs, including exchange fees and sales charges (loads) on purchases (as applicable), and (2) ongoing costs, including management fees, distribution and/or service (12b-1) fees and other Fund expenses (as applicable). This example is intended to help you understand your ongoing costs (in dollars) of investing in the Fund and to compare these costs with the ongoing costs of investing in other mutual funds. The example is based on an investment of $1,000 made at the beginning of the six-month period and held for the entire period from May 1, 2022 to October 31, 2022.
This example illustrates your Fund’s ongoing costs in two ways:
Actual Expenses
The second and third data columns in the table below provide information about actual account values and actual expenses. You may use the information in these columns, together with the amount you invested, to estimate the expenses that you paid during the six months ended October 31, 2022. Simply divide your account value by $1,000 (for example, an
$8,600 account value divided by $1,000 = 8.6), then multiply the result by the number under the heading entitled “Expenses Paid During Period” to estimate the expenses you paid on your account during this period.
Hypothetical Example for Comparison Purposes
The fourth and fifth data columns in the table below provide information about hypothetical account values and hypothetical expenses based on the Fund’s actual expense ratio and an assumed rate of return of 5% per year before expenses, which is not the Fund’s actual return. The hypothetical account values and expenses may not be used to estimate the actual ending account balances or expenses you paid for the six-month period shown. You may use this information to compare the ongoing costs of investing in the Fund with the ongoing costs of investing in other mutual funds. To do so, compare this 5% hypothetical example with the 5% hypothetical examples that appear in the shareholder reports of the other mutual funds.
Please note that the expenses shown in the table are meant to highlight your ongoing costs only and do not reflect any transactional costs, such as exchange fees or sales charges (loads). Therefore, the fourth and fifth data columns of the table are useful in comparing ongoing costs only and will not help you determine the relative total costs of owning different funds. In addition, if these transactional costs were included, your costs would have been higher.
| Share Class | Beginning
Account
Value
5/1/22 | Ending Account
Value (Based
on Actual
Returns and
Expenses)
10/31/22 | Expenses
Paid
During
Period1 | Ending Account
Value (Based
on Hypothetical
5% Annualized
Return and
Actual Expenses)
10/31/22 | Expenses
Paid
During
Period1 | Net Expense
Ratio
During
Period2 |
| Class A Shares | $1,000.00 | $902.20 | $4.70 | $1,020.26 | $4.99 | 0.98% |
| Investor Class Shares | $1,000.00 | $901.50 | $5.46 | $1,019.46 | $5.80 | 1.14% |
| Class B Shares | $1,000.00 | $898.00 | $9.04 | $1,015.68 | $9.60 | 1.89% |
| Class C Shares | $1,000.00 | $897.60 | $9.04 | $1,015.68 | $9.60 | 1.89% |
| Class I Shares | $1,000.00 | $902.30 | $3.50 | $1,021.53 | $3.72 | 0.73% |
| Class R1 Shares | $1,000.00 | $901.60 | $3.98 | $1,021.02 | $4.23 | 0.83% |
| Class R2 Shares | $1,000.00 | $902.20 | $5.18 | $1,019.76 | $5.50 | 1.08% |
| Class R3 Shares | $1,000.00 | $899.90 | $6.37 | $1,018.50 | $6.77 | 1.33% |
| Class R6 Shares | $1,000.00 | $903.60 | $3.07 | $1,021.98 | $3.26 | 0.64% |
| SIMPLE Class Shares | $1,000.00 | $899.80 | $6.70 | $1,018.15 | $7.12 | 1.40% |
| 1. | Expenses are equal to the Fund’s annualized expense ratio of each class multiplied by the average account value over the period, divided by 365 and multiplied by 184 (to reflect the six-month period). The table above represents the actual expenses incurred during the six-month period. In addition to the fees and expenses which the Fund bears directly, it also indirectly bears a pro rata share of the fees and expenses of the underlying funds in which it invests. Such indirect expenses are not included in the above-reported expense figures. |
| 2. | Expenses are equal to the Fund's annualized expense ratio to reflect the six-month period. |
Industry Composition as of October 31, 2022 (Unaudited)
| Software | 14.3% |
| IT Services | 12.0 |
| Hotels, Restaurants & Leisure | 8.7 |
| Life Sciences Tools & Services | 6.2 |
| Semiconductors & Semiconductor Equipment | 6.1 |
| Health Care Equipment & Supplies | 5.5 |
| Road & Rail | 4.4 |
| Health Care Providers & Services | 4.0 |
| Pharmaceuticals | 4.0 |
| Technology Hardware, Storage & Peripherals | 3.8 |
| Interactive Media & Services | 3.5 |
| Multiline Retail | 3.3 |
| Energy Equipment & Services | 3.2 |
| Food & Staples Retailing | 2.9 |
| Capital Markets | 2.7% |
| Machinery | 2.5 |
| Chemicals | 2.2 |
| Automobiles | 2.1 |
| Textiles, Apparel & Luxury Goods | 2.0 |
| Internet & Direct Marketing Retail | 1.9 |
| Health Care Technology | 1.6 |
| Personal Products | 1.0 |
| Professional Services | 0.9 |
| Short–Term Investment | 1.9 |
| Other Assets, Less Liabilities | –0.7 |
| | 100.0% |
See Portfolio of Investments beginning on page 11 for specific holdings within these categories. The Fund's holdings are subject to change.
Top Ten Holdings and/or Issuers Held as of October 31, 2022 (excluding short-term investments) (Unaudited)
| 1. | Microsoft Corp. |
| 2. | Visa, Inc., Class A |
| 3. | UnitedHealth Group, Inc. |
| 4. | Apple, Inc. |
| 5. | Mastercard, Inc., Class A |
| 6. | Alphabet, Inc. |
| 7. | Chipotle Mexican Grill, Inc. |
| 8. | Dollar Tree, Inc. |
| 9. | Schlumberger NV |
| 10. | Costco Wholesale Corp. |
| 8 | MainStay Winslow Large Cap Growth Fund |
Portfolio Management Discussion and Analysis (Unaudited)
Questions answered by portfolio managers Justin H. Kelly, CFA, Patrick M. Burton, CFA, and Peter A. Dlugosch of Winslow Capital Management, LLC, the Fund’s Subadvisor.
How did MainStay Winslow Large Cap Growth Fund perform relative to its benchmarks and peer group during the 12 months ended October 31, 2022?
For the 12 months ended October 31, 2022, Class I shares of MainStay Winslow Large Cap Growth Fund returned −31.55%, underperforming the −24.60% return of the Fund’s primary benchmark, the Russell 1000® Growth Index. Over the same period, Class I shares also underperformed the −14.61% return of the S&P 500® Index, which is the Fund’s secondary benchmark, and the −28.57% return of the Morningstar Large Growth Category Average.1
Were there any changes to the Fund during the reporting period?
Effective February 28, 2022, Peter A. Dlugosch was added as a portfolio manager of the Fund.
What factors affected the Fund’s relative performance during the reporting period?
Equity market volatility, which manifested in the fourth quarter of 2021 for the highest growth companies, continued and broadened in 2022 as the markets grappled with inflation levels near 40-year highs and an increasingly hawkish U.S. Federal Reserve. Russia’s war in Ukraine exacerbated inflation trends, most notably in food and energy, while simultaneously increasing the risk of a recession in Europe. COVID-19 infection rates receded around much of the globe but rolling outbreaks in China further disrupted supply chains. Stagflation, last experienced 40 years ago, became a mounting global risk, sharpening the need for efficacious global monetary policy.
During the reporting period, were there any market events that materially impacted the Fund’s performance or liquidity?
All major global equity indices declined in the risk-off environment that prevailed during the reporting period. Large-cap growth equities, which had handily led the markets for more than five years, were the worst performers. Outperformance by the energy, consumer staples, utilities and industrial sectors helped drive stronger relative returns for value stocks.
Rapidly evolving market inputs proved challenging for active equity management in the short-term; the majority of active large-cap managers failed to outperform the Russell 1000® Growth Index during the reporting period.
During the reporting period, which sectors were the strongest positive contributors to the Fund’s relative performance and which sectors made the weakest contributions?
Relative to the Russell 1000® Growth Index, the consumer discretionary and materials sectors made the strongest positive contributions to the Fund’s performance during the reporting period despite delivering negative absolute returns. (Contributions take weightings and total returns into account.) The information technology and health care sectors detracted the most.
During the reporting period, which individual stocks made the strongest positive contributions to the Fund’s absolute performance and which stocks detracted the most?
The stocks that made the strongest positive contributions to the Fund’s absolute performance during the reporting period included energy services and technology company Schlumberger, health care plan provider UnitedHealth Group and multinational technology company Apple.
Schlumberger shares benefited from soaring oil and gas prices during the reporting period, with several trends fostering comfort in elevated crude oil price forecasts for at least several years. These trends included restraint on the part of U.S. exploration & production companies, pricing discipline from the OPEC+ oil-producing nations and rising geopolitical tensions. The Fund initiated its position in Schlumberger during the reporting period.
UnitedHealth Group is both the largest health insurer and the largest provider of healthcare services (from information technology to outpatient medical treatment) in the United States. This combination yields a consistent model of high-single-digit revenue growth and low double-digit earnings-per-share growth with little macroeconomic sensitivity, a defensive profile that markets favored during the reporting period. The Fund added to its position in this long-time holding during the reporting period.
Apple generates high returns on invested capital, benefiting from strong operational execution and a significant competitive advantage in the smartphone business, which represents more than 50% of total revenue. During the reporting period, the Fund sold its position in Apple, but later repurchased it.
The three most significant detractors from the Fund’s absolute performance during the reporting period were software company Microsoft Corp., e-commerce company Amazon.com and electric vehicle maker Tesla.
Microsoft, one of the Fund’s core holdings in software, generated sustainable double-digit growth driven by continued adoption of Azure, Microsoft’s cloud computing platform, by enterprise customers as they moved their workloads to clouds and migrated to Office 365. Shares were undermined by the prevailing, market-wide underperformance of large-cap growth stocks, and by a disappointing earnings report during a recent quarter, which increased valuation compression.
Shares in Amazon were negatively impacted by inflationary cost pressures, as well as the company’s overbuilt fulfillment center capacity, as consumer demand waned post-pandemic. We believe, however, that Amazon will show better operating leverage as they slow capital expenditures in the near term.
As the leading global manufacturer of electric vehicles, we believe Tesla is well positioned to benefit from the acceleration in electric vehicle adoption that’s expected over the coming years. The company also stands to benefit from provisions in the Inflation Reduction Act relating to domestic battery pack and cell production, as well as tax credits for U.S. consumers who purchase electric vehicles. Shares declined during the reporting
| 1. | See page 5 for other share class returns, which may be higher or lower than Class I share returns. See page 6 for more information on benchmark and peer group returns. |
period due to concerns regarding the company’s ability to meet delivery forecasts and CEO Elon Musk’s pricey acquisition of social media company Twitter.
The Fund’s position sizes in Microsoft, Amazon and Tesla declined during the reporting period, although all three holdings remained in the Fund.
What were some of the Fund’s largest purchases and sales during the reporting period?
During the reporting period, the Fund’s largest purchases included Schlumberger, described above, and discount retailer Costco Wholesale. Costco continues to show strong traffic and market share gains even as the pandemic wanes. In our opinion, the company’s strong value proposition resonates with consumers. Both Schlumberger and Costco were new purchases during the reporting period and were still held as of the end of the period.
The Fund’s largest sales during the reporting period included Amazon and Microsoft, both described above. While we reduced the Fund’s position in Amazon due to the negative impact of inflationary cost pressures and overbuilt fulfillment center capacity, we believe the company will show better operating leverage as they slow capital expenditures in the near term. We reduced the Fund’s Microsoft exposure to a slightly underweight position relative to the Russell 1000® Growth Index in light of the company’s foreign currency exposure, as well as its vulnerability to slowing PC demand and potential weakness in its Office commercial unit. However, the Fund still holds a sizeable position in the company, reflecting our belief that Microsoft’s Azure division will benefit disproportionately as enterprise customers continue to move to the cloud. We reduced the size of the Fund’s positions in Amazon and Microsoft, however, both remain holdings of the Fund as of the end of the period.
How did the Fund’s sector weightings change during the reporting period?
During the reporting period, several material changes occurred to the Fund’s positioning at the sector level. The largest decrease in exposure was in the communication services sector, followed by information technology. Conversely, the largest sector increase was in health care, followed by energy. All other sector exposures remained relatively unchanged.
How was the Fund positioned at the end of the reporting period?
The portfolio structure changed materially, reflecting the dramatic shifts in both the economic and geopolitical landscape that occurred during the reporting period. As of October 31, 2022, consistent growth represented the largest percentage of holdings, a significantly overweight allocation relative to the Russell 1000® Growth Index. This reflects the heightened level of macro/geopolitical uncertainty implicit in the current environment, and our view that these highly profitable, high free-cash-flow-generating companies are not as susceptible to higher interest rates as other large-cap growth stocks.
The Fund’s cyclical growth holdings, the Fund’s second-largest allocation, increased modestly during the reporting period. However, as of the end of the reporting period, it remained a significantly underweight allocation relative to the Index, underscoring our preference for secular growth stocks in a slowing growth environment.
As of the end of the reporting period, dynamic growth represented the Fund’s smallest allocation. While the size of this allocation declined during the reporting period, the Fund continues to hold modestly overweight exposure relative to the Index to these types of companies. The reduction in the Fund’s dynamic growth holdings came largely in the “high growth cohort,” as we believe this segment is unlikely to regain the valuation multiples they enjoyed during the work-from-home/zero-interest-rate/government-stimulus-driven days of the past several years.
The opinions expressed are those of the portfolio managers as of the date of this report and are subject to change. There is no guarantee that any forecasts will come to pass. This material does not constitute investment advice and is not intended as an endorsement of any specific investment.
| 10 | MainStay Winslow Large Cap Growth Fund |
Portfolio of Investments October 31, 2022†
| | Shares | Value |
| Common Stocks 98.8% |
| Automobiles 2.1% |
| Tesla, Inc. (a) | 1,042,100 | $ 237,119,434 |
| Capital Markets 2.7% |
| Moody's Corp. | 588,250 | 155,809,777 |
| MSCI, Inc. | 320,700 | 150,363,402 |
| | | 306,173,179 |
| Chemicals 2.2% |
| Linde plc | 838,830 | 249,426,101 |
| Energy Equipment & Services 3.2% |
| Schlumberger NV | 6,891,080 | 358,542,892 |
| Food & Staples Retailing 2.9% |
| Costco Wholesale Corp. | 658,200 | 330,087,300 |
| Health Care Equipment & Supplies 5.5% |
| ABIOMED, Inc. (a) | 759,400 | 191,429,552 |
| IDEXX Laboratories, Inc. (a) | 403,700 | 145,202,816 |
| Intuitive Surgical, Inc. (a) | 1,152,400 | 284,032,028 |
| | | 620,664,396 |
| Health Care Providers & Services 4.0% |
| UnitedHealth Group, Inc. | 821,800 | 456,222,270 |
| Health Care Technology 1.6% |
| Veeva Systems, Inc., Class A (a) | 1,075,350 | 180,594,279 |
| Hotels, Restaurants & Leisure 8.7% |
| Chipotle Mexican Grill, Inc. (a) | 247,470 | 370,791,725 |
| Hilton Worldwide Holdings, Inc. | 1,718,900 | 232,498,414 |
| McDonald's Corp. | 639,100 | 174,257,006 |
| Starbucks Corp. | 2,384,000 | 206,430,560 |
| | | 983,977,705 |
| Interactive Media & Services 3.5% |
| Alphabet, Inc. (a) | | |
| Class A | 2,260,720 | 213,660,647 |
| Class C | 2,008,520 | 190,126,503 |
| | | 403,787,150 |
| Internet & Direct Marketing Retail 1.9% |
| Amazon.com, Inc. (a) | 2,127,400 | 217,930,856 |
| | Shares | Value |
| |
| IT Services 12.0% |
| Accenture plc, Class A | 794,900 | $ 225,672,110 |
| Gartner, Inc. (a) | 760,740 | 229,682,621 |
| Mastercard, Inc., Class A | 1,266,000 | 415,475,880 |
| Visa, Inc., Class A | 2,398,300 | 496,831,828 |
| | | 1,367,662,439 |
| Life Sciences Tools & Services 6.2% |
| Agilent Technologies, Inc. | 1,697,400 | 234,835,290 |
| Bio-Techne Corp. | 469,400 | 139,064,444 |
| Danaher Corp. | 513,900 | 129,333,213 |
| IQVIA Holdings, Inc. (a) | 972,900 | 203,987,943 |
| | | 707,220,890 |
| Machinery 2.5% |
| Deere & Co. | 723,900 | 286,534,098 |
| Multiline Retail 3.3% |
| Dollar Tree, Inc. (a) | 2,337,000 | 370,414,500 |
| Personal Products 1.0% |
| Estee Lauder Cos., Inc. (The), Class A | 582,820 | 116,849,582 |
| Pharmaceuticals 4.0% |
| AstraZeneca plc, Sponsored ADR | 3,044,900 | 179,070,569 |
| Zoetis, Inc. | 1,809,640 | 272,857,519 |
| | | 451,928,088 |
| Professional Services 0.9% |
| CoStar Group, Inc. (a) | 1,249,200 | 103,333,824 |
| Road & Rail 4.4% |
| CSX Corp. | 5,985,310 | 173,933,109 |
| Union Pacific Corp. | 1,649,600 | 325,202,144 |
| | | 499,135,253 |
| Semiconductors & Semiconductor Equipment 6.1% |
| Analog Devices, Inc. | 1,638,240 | 233,645,789 |
| ASML Holding NV (Registered) | 545,370 | 257,643,695 |
| NVIDIA Corp. | 1,503,550 | 202,934,144 |
| | | 694,223,628 |
| Software 14.3% |
| Adobe, Inc. (a) | 281,110 | 89,533,535 |
| Atlassian Corp., Class A (a) | 360,750 | 73,134,848 |
| Intuit, Inc. | 673,210 | 287,797,275 |
| Microsoft Corp. | 3,250,230 | 754,475,890 |
| Palo Alto Networks, Inc. (a) | 1,151,800 | 197,637,362 |
The notes to the financial statements are an integral part of, and should be read in conjunction with, the financial statements.
11
Portfolio of Investments October 31, 2022† (continued)
| | Shares | | Value |
| Common Stocks (continued) |
| Software (continued) |
| ServiceNow, Inc. (a) | 525,110 | | $ 220,934,781 |
| | | | 1,623,513,691 |
| Technology Hardware, Storage & Peripherals 3.8% |
| Apple, Inc. | 2,840,800 | | 435,608,272 |
| Textiles, Apparel & Luxury Goods 2.0% |
| Lululemon Athletica, Inc. (a) | 676,500 | | 222,595,560 |
Total Common Stocks
(Cost $8,719,170,708) | | | 11,223,545,387 |
| Short-Term Investment 1.9% |
| Affiliated Investment Company 1.9% |
| MainStay U.S. Government Liquidity Fund, 2.905% (b)(c) | 209,898,796 | | 209,898,796 |
Total Short-Term Investment
(Cost $209,898,796) | | | 209,898,796 |
Total Investments
(Cost $8,929,069,504) | 100.7% | | 11,433,444,183 |
| Other Assets, Less Liabilities | (0.7) | | (78,896,448) |
| Net Assets | 100.0% | | $ 11,354,547,735 |
| † | Percentages indicated are based on Fund net assets. |
| (a) | Non-income producing security. |
| (b) | As of October 31, 2022, the Fund's ownership exceeds 5% of the outstanding shares of the Underlying Fund's share class. |
| (c) | Current yield as of October 31, 2022. |
Investments in Affiliates (in 000's)
Investments in issuers considered to be affiliate(s) of the Fund during the year ended October 31, 2022 for purposes of Section 2(a)(3) of the Investment Company Act of 1940, as amended, were as follows:
| Affiliated Investment Companies | Value,
Beginning
of Year | Purchases
at Cost | Proceeds
from
Sales | Net
Realized
Gain/(Loss)
on Sales | Change in
Unrealized
Appreciation/
(Depreciation) | Value,
End of
Year | Dividend
Income | Other
Distributions | Shares
End of
Year |
| MainStay U.S. Government Liquidity Fund | $ 238,863 | $ 3,367,405 | $ (3,396,369) | $ — | $ — | $ 209,899 | $ 564 | $ — | 209,899 |
| Abbreviation(s): |
| ADR—American Depositary Receipt |
The notes to the financial statements are an integral part of, and should be read in conjunction with, the financial statements.
| 12 | MainStay Winslow Large Cap Growth Fund |
The following is a summary of the fair valuations according to the inputs used as of October 31, 2022, for valuing the Fund’s assets:
| Description | Quoted
Prices in
Active
Markets for
Identical
Assets
(Level 1) | | Significant
Other
Observable
Inputs
(Level 2) | | Significant
Unobservable
Inputs
(Level 3) | | Total |
| Asset Valuation Inputs | | | | | | | |
| Investments in Securities (a) | | | | | | | |
| Common Stocks | $ 11,223,545,387 | | $ — | | $ — | | $ 11,223,545,387 |
| Short-Term Investment | | | | | | | |
| Affiliated Investment Company | 209,898,796 | | — | | — | | 209,898,796 |
| Total Investments in Securities | $ 11,433,444,183 | | $ — | | $ — | | $ 11,433,444,183 |
| (a) | For a complete listing of investments and their industries, see the Portfolio of Investments. |
The notes to the financial statements are an integral part of, and should be read in conjunction with, the financial statements.
13
Statement of Assets and Liabilities as of October 31, 2022
| Assets |
Investment in unaffiliated securities, at value
(identified cost $8,719,170,708) | $11,223,545,387 |
Investment in affiliated investment companies, at value
(identified cost $209,898,796) | 209,898,796 |
| Cash | 30,997 |
| Receivables: | |
| Investment securities sold | 33,598,571 |
| Fund shares sold | 12,495,250 |
| Dividends | 3,710,193 |
| Securities lending | 182 |
| Other assets | 22,233 |
| Total assets | 11,483,301,609 |
| Liabilities |
| Payables: | |
| Investment securities purchased | 112,738,827 |
| Fund shares redeemed | 7,949,026 |
| Manager (See Note 3) | 5,766,608 |
| Transfer agent (See Note 3) | 1,346,959 |
| NYLIFE Distributors (See Note 3) | 386,798 |
| Shareholder communication | 325,532 |
| Professional fees | 186,732 |
| Custodian | 36,640 |
| Accrued expenses | 16,752 |
| Total liabilities | 128,753,874 |
| Net assets | $11,354,547,735 |
| Composition of Net Assets |
| Shares of beneficial interest outstanding (par value of $.01 per share) unlimited number of shares authorized | $ 12,539,397 |
| Additional paid-in-capital | 7,595,358,135 |
| | 7,607,897,532 |
| Total distributable earnings (loss) | 3,746,650,203 |
| Net assets | $11,354,547,735 |
| Class A | |
| Net assets applicable to outstanding shares | $1,065,870,285 |
| Shares of beneficial interest outstanding | 132,740,280 |
| Net asset value per share outstanding | $ 8.03 |
| Maximum sales charge (5.50% of offering price) | 0.47 |
| Maximum offering price per share outstanding | $ 8.50 |
| Investor Class | |
| Net assets applicable to outstanding shares | $ 64,065,330 |
| Shares of beneficial interest outstanding | 8,238,431 |
| Net asset value per share outstanding | $ 7.78 |
| Maximum sales charge (5.00% of offering price) | 0.41 |
| Maximum offering price per share outstanding | $ 8.19 |
| Class B | |
| Net assets applicable to outstanding shares | $ 9,408,351 |
| Shares of beneficial interest outstanding | 1,783,487 |
| Net asset value and offering price per share outstanding | $ 5.28 |
| Class C | |
| Net assets applicable to outstanding shares | $ 46,832,502 |
| Shares of beneficial interest outstanding | 8,905,932 |
| Net asset value and offering price per share outstanding | $ 5.26 |
| Class I | |
| Net assets applicable to outstanding shares | $6,016,574,490 |
| Shares of beneficial interest outstanding | 650,914,170 |
| Net asset value and offering price per share outstanding | $ 9.24 |
| Class R1 | |
| Net assets applicable to outstanding shares | $ 721,142,464 |
| Shares of beneficial interest outstanding | 81,912,228 |
| Net asset value and offering price per share outstanding | $ 8.80 |
| Class R2 | |
| Net assets applicable to outstanding shares | $ 106,414,228 |
| Shares of beneficial interest outstanding | 13,426,537 |
| Net asset value and offering price per share outstanding | $ 7.93 |
| Class R3 | |
| Net assets applicable to outstanding shares | $ 38,026,639 |
| Shares of beneficial interest outstanding | 5,352,883 |
| Net asset value and offering price per share outstanding | $ 7.10 |
| Class R6 | |
| Net assets applicable to outstanding shares | $3,285,993,133 |
| Shares of beneficial interest outstanding | 350,637,242 |
| Net asset value and offering price per share outstanding | $ 9.37 |
The notes to the financial statements are an integral part of, and should be read in conjunction with, the financial statements.
| 14 | MainStay Winslow Large Cap Growth Fund |
| SIMPLE Class | |
| Net assets applicable to outstanding shares | $220,313 |
| Shares of beneficial interest outstanding | 28,527 |
| Net asset value and offering price per share outstanding | $ 7.72 |
The notes to the financial statements are an integral part of, and should be read in conjunction with, the financial statements.
15
Statement of Operations for the year ended October 31, 2022
| Investment Income (Loss) |
| Income | |
| Dividends-unaffiliated (net of foreign tax withholding of $530,560) | $ 78,444,504 |
| Dividends-affiliated | 563,987 |
| Securities lending, net | 20,607 |
| Total income | 79,029,098 |
| Expenses | |
| Manager (See Note 3) | 81,803,817 |
| Transfer agent (See Note 3) | 7,986,790 |
| Distribution/Service—Class A (See Note 3) | 3,338,616 |
| Distribution/Service—Investor Class (See Note 3) | 202,136 |
| Distribution/Service—Class B (See Note 3) | 139,893 |
| Distribution/Service—Class C (See Note 3) | 638,585 |
| Distribution/Service—Class R2 (See Note 3) | 336,387 |
| Distribution/Service—Class R3 (See Note 3) | 243,282 |
| Distribution/Service—SIMPLE Class (See Note 3) | 757 |
| Shareholder service (See Note 3) | 1,078,836 |
| Professional fees | 873,388 |
| Shareholder communication | 393,625 |
| Trustees | 271,250 |
| Registration | 253,820 |
| Custodian | 155,206 |
| Miscellaneous | 502,037 |
| Total expenses before waiver/reimbursement | 98,218,425 |
| Expense waiver/reimbursement from Manager (See Note 3) | (807,597) |
| Net expenses | 97,410,828 |
| Net investment income (loss) | (18,381,730) |
| Realized and Unrealized Gain (Loss) |
| Net realized gain (loss) on unaffiliated investments | 1,364,007,827 |
| Net change in unrealized appreciation (depreciation) on unaffiliated investments | (6,575,829,012) |
| Net realized and unrealized gain (loss) | (5,211,821,185) |
| Net increase (decrease) in net assets resulting from operations | $(5,230,202,915) |
The notes to the financial statements are an integral part of, and should be read in conjunction with, the financial statements.
| 16 | MainStay Winslow Large Cap Growth Fund |
Statements of Changes in Net Assets
for the years ended October 31, 2022 and October 31, 2021
| | 2022 | 2021 |
| Increase (Decrease) in Net Assets |
| Operations: | | |
| Net investment income (loss) | $ (18,381,730) | $ (48,715,947) |
| Net realized gain (loss) | 1,364,007,827 | 3,677,702,280 |
| Net change in unrealized appreciation (depreciation) | (6,575,829,012) | 1,807,847,917 |
| Net increase (decrease) in net assets resulting from operations | (5,230,202,915) | 5,436,834,250 |
| Distributions to shareholders: | | |
| Class A | (364,397,755) | (77,969,502) |
| Investor Class | (22,722,175) | (6,618,988) |
| Class B | (5,810,514) | (1,541,249) |
| Class C | (25,393,609) | (7,351,321) |
| Class I | (1,557,071,002) | (355,187,292) |
| Class R1 | (230,113,135) | (49,620,776) |
| Class R2 | (37,915,929) | (8,981,664) |
| Class R3 | (14,198,963) | (3,495,754) |
| Class R6 | (894,224,087) | (207,330,897) |
| SIMPLE Class | (16,490) | (1,359) |
| Total distributions to shareholders | (3,151,863,659) | (718,098,802) |
| Capital share transactions: | | |
| Net proceeds from sales of shares | 3,411,138,066 | 2,324,245,742 |
| Net asset value of shares issued to shareholders in reinvestment of distributions | 2,914,756,292 | 659,913,063 |
| Cost of shares redeemed | (3,229,423,183) | (4,567,266,116) |
| Increase (decrease) in net assets derived from capital share transactions | 3,096,471,175 | (1,583,107,311) |
| Net increase (decrease) in net assets | (5,285,595,399) | 3,135,628,137 |
| Net Assets |
| Beginning of year | 16,640,143,134 | 13,504,514,997 |
| End of year | $11,354,547,735 | $16,640,143,134 |
The notes to the financial statements are an integral part of, and should be read in conjunction with, the financial statements.
17
Financial Highlights selected per share data and ratios
| | Year Ended October 31, |
| Class A | 2022 | | 2021 | | 2020 | | 2019 | | 2018 |
| Net asset value at beginning of year | $ 14.92 | | $ 11.08 | | $ 9.59 | | $ 9.95 | | $ 10.41 |
| Net investment income (loss) (a) | (0.04) | | (0.07) | | (0.03) | | (0.02) | | (0.02) |
| Net realized and unrealized gain (loss) | (3.74) | | 4.55 | | 2.58 | | 1.48 | | 1.12 |
| Total from investment operations | (3.78) | | 4.48 | | 2.55 | | 1.46 | | 1.10 |
| Less distributions: | | | | | | | | | |
| From net investment income | — | | — | | — | | — | | (0.00)‡ |
| From net realized gain on investments | (3.11) | | (0.64) | | (1.06) | | (1.82) | | (1.56) |
| Total distributions | (3.11) | | (0.64) | | (1.06) | | (1.82) | | (1.56) |
| Net asset value at end of year | $ 8.03 | | $ 14.92 | | $ 11.08 | | $ 9.59 | | $ 9.95 |
| Total investment return (b) | (31.71)% | | 42.16% | | 29.44% | | 17.05% | | 12.36% |
| Ratios (to average net assets)/Supplemental Data: | | | | | | | | | |
| Net investment income (loss) | (0.37)% | | (0.53)% | | (0.31)% | | (0.20)% | | (0.21)% |
| Net expenses (c) | 0.96% | | 0.93% | | 0.97% | | 0.99% | | 0.97% |
| Expenses (before waiver/reimbursement) (c) | 0.96%(d) | | 0.94% | | 0.97% | | 0.99% | | 0.98% |
| Portfolio turnover rate | 77% | | 66% | | 44% | | 54% | | 52% |
| Net assets at end of year (in 000’s) | $ 1,065,870 | | $ 1,745,833 | | $ 1,341,381 | | $ 1,008,608 | | $ 1,092,962 |
| ‡ | Less than one cent per share. |
| (a) | Per share data based on average shares outstanding during the year. |
| (b) | Total investment return is calculated exclusive of sales charges and assumes the reinvestment of dividends and distributions. For periods of less than one year, total return is not annualized. |
| (c) | In addition to the fees and expenses which the Fund bears directly, it also indirectly bears a pro-rata share of the fees and expenses of the underlying funds in which it invests. Such indirect expenses are not included in the above expense ratios. |
| (d) | Expense waiver/reimbursement less than 0.01%. |
| | Year Ended October 31, |
| Investor Class | 2022 | | 2021 | | 2020 | | 2019 | | 2018 |
| Net asset value at beginning of year | $ 14.56 | | $ 10.84 | | $ 9.42 | | $ 9.81 | | $ 10.30 |
| Net investment income (loss) (a) | (0.05) | | (0.08) | | (0.04) | | (0.03) | | (0.03) |
| Net realized and unrealized gain (loss) | (3.62) | | 4.44 | | 2.52 | | 1.46 | | 1.10 |
| Total from investment operations | (3.67) | | 4.36 | | 2.48 | | 1.43 | | 1.07 |
| Less distributions: | | | | | | | | | |
| From net realized gain on investments | (3.11) | | (0.64) | | (1.06) | | (1.82) | | (1.56) |
| Net asset value at end of year | $ 7.78 | | $ 14.56 | | $ 10.84 | | $ 9.42 | | $ 9.81 |
| Total investment return (b) | (31.75)% | | 41.98% | | 29.19% | | 16.96% | | 12.19% |
| Ratios (to average net assets)/Supplemental Data: | | | | | | | | | |
| Net investment income (loss) | (0.52)% | | (0.67)% | | (0.43)% | | (0.31)% | | (0.30)% |
| Net expenses (c) | 1.11% | | 1.08% | | 1.10% | | 1.09% | | 1.06% |
| Expenses (before waiver/reimbursement) (c) | 1.11%(d) | | 1.09% | | 1.10% | | 1.10% | | 1.07% |
| Portfolio turnover rate | 77% | | 66% | | 44% | | 54% | | 52% |
| Net assets at end of year (in 000's) | $ 64,065 | | $ 106,354 | | $ 110,831 | | $ 109,236 | | $ 103,987 |
| (a) | Per share data based on average shares outstanding during the year. |
| (b) | Total investment return is calculated exclusive of sales charges and assumes the reinvestment of dividends and distributions. For periods of less than one year, total return is not annualized. |
| (c) | In addition to the fees and expenses which the Fund bears directly, it also indirectly bears a pro-rata share of the fees and expenses of the underlying funds in which it invests. Such indirect expenses are not included in the above expense ratios. |
| (d) | Expense waiver/reimbursement less than 0.01%. |
The notes to the financial statements are an integral part of, and should be read in conjunction with, the financial statements.
| 18 | MainStay Winslow Large Cap Growth Fund |
Financial Highlights selected per share data and ratios
| | Year Ended October 31, |
| Class B | 2022 | | 2021 | | 2020 | | 2019 | | 2018 |
| Net asset value at beginning of year | $ 10.96 | | $ 8.37 | | $ 7.55 | | $ 8.26 | | $ 8.98 |
| Net investment income (loss) (a) | (0.08) | | (0.13) | | (0.09) | | (0.08) | | (0.09) |
| Net realized and unrealized gain (loss) | (2.49) | | 3.36 | | 1.97 | | 1.19 | | 0.93 |
| Total from investment operations | (2.57) | | 3.23 | | 1.88 | | 1.11 | | 0.84 |
| Less distributions: | | | | | | | | | |
| From net realized gain on investments | (3.11) | | (0.64) | | (1.06) | | (1.82) | | (1.56) |
| Net asset value at end of year | $ 5.28 | | $ 10.96 | | $ 8.37 | | $ 7.55 | | $ 8.26 |
| Total investment return (b) | (32.29)% | | 40.80% | | 28.37% | | 15.96% | | 11.28%(c) |
| Ratios (to average net assets)/Supplemental Data: | | | | | | | | | |
| Net investment income (loss) | (1.27)% | | (1.42)% | | (1.17)% | | (1.05)% | | (1.04)% |
| Net expenses (d) | 1.86% | | 1.83% | | 1.85% | | 1.84% | | 1.81% |
| Expenses (before waiver/reimbursement) (d) | 1.86%(e) | | 1.84% | | 1.85% | | 1.85% | | 1.82% |
| Portfolio turnover rate | 77% | | 66% | | 44% | | 54% | | 52% |
| Net assets at end of year (in 000’s) | $ 9,408 | | $ 20,533 | | $ 20,172 | | $ 21,015 | | $ 25,685 |
| (a) | Per share data based on average shares outstanding during the year. |
| (b) | Total investment return is calculated exclusive of sales charges and assumes the reinvestment of dividends and distributions. For periods of less than one year, total return is not annualized. |
| (c) | Total investment return may reflect adjustments to conform to generally accepted accounting principles. |
| (d) | In addition to the fees and expenses which the Fund bears directly, it also indirectly bears a pro-rata share of the fees and expenses of the underlying funds in which it invests. Such indirect expenses are not included in the above expense ratios. |
| (e) | Expense waiver/reimbursement less than 0.01%. |
| | Year Ended October 31, |
| Class C | 2022 | | 2021 | | 2020 | | 2019 | | 2018 |
| Net asset value at beginning of year | $ 10.93 | | $ 8.35 | | $ 7.53 | | $ 8.25 | | $ 8.96 |
| Net investment income (loss) (a) | (0.08) | | (0.13) | | (0.09) | | (0.07) | | (0.09) |
| Net realized and unrealized gain (loss) | (2.48) | | 3.35 | | 1.97 | | 1.17 | | 0.94 |
| Total from investment operations | (2.56) | | 3.22 | | 1.88 | | 1.10 | | 0.85 |
| Less distributions: | | | | | | | | | |
| From net realized gain on investments | (3.11) | | (0.64) | | (1.06) | | (1.82) | | (1.56) |
| Net asset value at end of year | $ 5.26 | | $ 10.93 | | $ 8.35 | | $ 7.53 | | $ 8.25 |
| Total investment return (b) | (32.29)% | | 40.77% | | 28.46% | | 15.97% | | 11.42% |
| Ratios (to average net assets)/Supplemental Data: | | | | | | | | | |
| Net investment income (loss) | (1.27)% | | (1.42)% | | (1.17)% | | (1.04)% | | (1.05)% |
| Net expenses (c) | 1.86% | | 1.83% | | 1.85% | | 1.84% | | 1.81% |
| Expenses (before waiver/reimbursement) (c) | 1.86%(d) | | 1.84% | | 1.85% | | 1.85% | | 1.82% |
| Portfolio turnover rate | 77% | | 66% | | 44% | | 54% | | 52% |
| Net assets at end of year (in 000’s) | $ 46,833 | | $ 90,377 | | $ 95,761 | | $ 131,945 | | $ 197,231 |
| (a) | Per share data based on average shares outstanding during the year. |
| (b) | Total investment return is calculated exclusive of sales charges and assumes the reinvestment of dividends and distributions. For periods of less than one year, total return is not annualized. |
| (c) | In addition to the fees and expenses which the Fund bears directly, it also indirectly bears a pro-rata share of the fees and expenses of the underlying funds in which it invests. Such indirect expenses are not included in the above expense ratios. |
| (d) | Expense waiver/reimbursement less than 0.01%. |
The notes to the financial statements are an integral part of, and should be read in conjunction with, the financial statements.
19
Financial Highlights selected per share data and ratios
| | Year Ended October 31, |
| Class I | 2022 | | 2021 | | 2020 | | 2019 | | 2018 |
| Net asset value at beginning of year | $ 16.66 | | $ 12.28 | | $ 10.49 | | $ 10.69 | | $ 11.06 |
| Net investment income (loss) (a) | (0.01) | | (0.04) | | (0.01) | | 0.00‡ | | 0.00‡ |
| Net realized and unrealized gain (loss) | (4.30) | | 5.06 | | 2.86 | | 1.62 | | 1.20 |
| Total from investment operations | (4.31) | | 5.02 | | 2.85 | | 1.62 | | 1.20 |
| Less distributions: | | | | | | | | | |
| From net investment income | — | | — | | — | | — | | (0.01) |
| From net realized gain on investments | (3.11) | | (0.64) | | (1.06) | | (1.82) | | (1.56) |
| Total distributions | (3.11) | | (0.64) | | (1.06) | | (1.82) | | (1.57) |
| Net asset value at end of year | $ 9.24 | | $ 16.66 | | $ 12.28 | | $ 10.49 | | $ 10.69 |
| Total investment return (b) | (31.55)% | | 42.46% | | 29.80% | | 17.29% | | 12.54%(c) |
| Ratios (to average net assets)/Supplemental Data: | | | | | | | | | |
| Net investment income (loss) | (0.11)% | | (0.28)% | | (0.06)% | | 0.05% | | 0.04% |
| Net expenses (d) | 0.71% | | 0.68% | | 0.72% | | 0.74% | | 0.72% |
| Expenses (before waiver/reimbursement) (d) | 0.71%(e) | | 0.69% | | 0.72% | | 0.74% | | 0.73% |
| Portfolio turnover rate | 77% | | 66% | | 44% | | 54% | | 52% |
| Net assets at end of year (in 000’s) | $ 6,016,574 | | $ 8,434,291 | | $ 6,824,224 | | $ 6,080,320 | | $ 6,275,780 |
| ‡ | Less than one cent per share. |
| (a) | Per share data based on average shares outstanding during the year. |
| (b) | Total investment return is calculated exclusive of sales charges and assumes the reinvestment of dividends and distributions. Class I shares are not subject to sales charges. For periods of less than one year, total return is not annualized. |
| (c) | Total investment return may reflect adjustments to conform to generally accepted accounting principles. |
| (d) | In addition to the fees and expenses which the Fund bears directly, it also indirectly bears a pro-rata share of the fees and expenses of the underlying funds in which it invests. Such indirect expenses are not included in the above expense ratios. |
| (e) | Expense waiver/reimbursement less than 0.01%. |
| | Year Ended October 31, |
| Class R1 | 2022 | | 2021 | | 2020 | | 2019 | | 2018 |
| Net asset value at beginning of year | $ 16.03 | | $ 11.85 | | $ 10.17 | | $ 10.43 | | $ 10.83 |
| Net investment income (loss) (a) | (0.02) | | (0.05) | | (0.02) | | (0.00)‡ | | (0.01) |
| Net realized and unrealized gain (loss) | (4.10) | | 4.87 | | 2.76 | | 1.56 | | 1.17 |
| Total from investment operations | (4.12) | | 4.82 | | 2.74 | | 1.56 | | 1.16 |
| Less distributions: | | | | | | | | | |
| From net realized gain on investments | (3.11) | | (0.64) | | (1.06) | | (1.82) | | (1.56) |
| Net asset value at end of year | $ 8.80 | | $ 16.03 | | $ 11.85 | | $ 10.17 | | $ 10.43 |
| Total investment return (b) | (31.62)% | | 42.30% | | 29.64% | | 17.25% | | 12.46% |
| Ratios (to average net assets)/Supplemental Data: | | | | | | | | | |
| Net investment income (loss) | (0.22)% | | (0.38)% | | (0.15)% | | (0.04)% | | (0.06)% |
| Net expenses (c) | 0.81% | | 0.78% | | 0.82% | | 0.84% | | 0.82% |
| Expenses (before waiver/reimbursement) (c) | 0.81%(d) | | 0.79% | | 0.82% | | 0.84% | | 0.83% |
| Portfolio turnover rate | 77% | | 66% | | 44% | | 54% | | 52% |
| Net assets at end of year (in 000’s) | $ 721,142 | | $ 1,207,903 | | $ 914,359 | | $ 919,236 | | $ 1,102,423 |
| ‡ | Less than one cent per share. |
| (a) | Per share data based on average shares outstanding during the year. |
| (b) | Total investment return is calculated exclusive of sales charges and assumes the reinvestment of dividends and distributions. Class R1 shares are not subject to sales charges. For periods of less than one year, total return is not annualized. |
| (c) | In addition to the fees and expenses which the Fund bears directly, it also indirectly bears a pro-rata share of the fees and expenses of the underlying funds in which it invests. Such indirect expenses are not included in the above expense ratios. |
| (d) | Expense waiver/reimbursement less than 0.01%. |
The notes to the financial statements are an integral part of, and should be read in conjunction with, the financial statements.
| 20 | MainStay Winslow Large Cap Growth Fund |
Financial Highlights selected per share data and ratios
| | Year Ended October 31, |
| Class R2 | 2022 | | 2021 | | 2020 | | 2019 | | 2018 |
| Net asset value at beginning of year | $ 14.78 | | $ 10.99 | | $ 9.53 | | $ 9.90 | | $ 10.38 |
| Net investment income (loss) (a) | (0.04) | | (0.08) | | (0.04) | | (0.03) | | (0.03) |
| Net realized and unrealized gain (loss) | (3.70) | | 4.51 | | 2.56 | | 1.48 | | 1.11 |
| Total from investment operations | (3.74) | | 4.43 | | 2.52 | | 1.45 | | 1.08 |
| Less distributions: | | | | | | | | | |
| From net realized gain on investments | (3.11) | | (0.64) | | (1.06) | | (1.82) | | (1.56) |
| Net asset value at end of year | $ 7.93 | | $ 14.78 | | $ 10.99 | | $ 9.53 | | $ 9.90 |
| Total investment return (b) | (31.74)% | | 42.04% | | 29.29% | | 16.89% | | 12.17%(c) |
| Ratios (to average net assets)/Supplemental Data: | | | | | | | | | |
| Net investment income (loss) | (0.47)% | | (0.63)% | | (0.40)% | | (0.29)% | | (0.31)% |
| Net expenses (d) | 1.06% | | 1.03% | | 1.07% | | 1.09% | | 1.07% |
| Expenses (before waiver/reimbursement) (d) | 1.06%(e) | | 1.04% | | 1.07% | | 1.09% | | 1.08% |
| Portfolio turnover rate | 77% | | 66% | | 44% | | 54% | | 52% |
| Net assets at end of year (in 000’s) | $ 106,414 | | $ 188,790 | | $ 159,297 | | $ 163,288 | | $ 227,298 |
| (a) | Per share data based on average shares outstanding during the year. |
| (b) | Total investment return is calculated exclusive of sales charges and assumes the reinvestment of dividends and distributions. Class R2 shares are not subject to sales charges. For periods of less than one year, total return is not annualized. |
| (c) | Total investment return may reflect adjustments to conform to generally accepted accounting principles. |
| (d) | In addition to the fees and expenses which the Fund bears directly, it also indirectly bears a pro-rata share of the fees and expenses of the underlying funds in which it invests. Such indirect expenses are not included in the above expense ratios. |
| (e) | Expense waiver/reimbursement less than 0.01%. |
| | Year Ended October 31, |
| Class R3 | 2022 | | 2021 | | 2020 | | 2019 | | 2018 |
| Net asset value at beginning of year | $ 13.60 | | $ 10.19 | | $ 8.93 | | $ 9.41 | | $ 9.96 |
| Net investment income (loss) (a) | (0.06) | | (0.10) | | (0.06) | | (0.05) | | (0.05) |
| Net realized and unrealized gain (loss) | (3.33) | | 4.15 | | 2.38 | | 1.39 | | 1.06 |
| Total from investment operations | (3.39) | | 4.05 | | 2.32 | | 1.34 | | 1.01 |
| Less distributions: | | | | | | | | | |
| From net realized gain on investments | (3.11) | | (0.64) | | (1.06) | | (1.82) | | (1.56) |
| Net asset value at end of year | $ 7.10 | | $ 13.60 | | $ 10.19 | | $ 8.93 | | $ 9.41 |
| Total investment return (b) | (31.98)% | | 41.60% | | 28.99% | | 16.69% | | 11.97% |
| Ratios (to average net assets)/Supplemental Data: | | | | | | | | | |
| Net investment income (loss) | (0.72)% | | (0.88)% | | (0.65)% | | (0.55)% | | (0.55)% |
| Net expenses (c) | 1.31% | | 1.28% | | 1.32% | | 1.34% | | 1.32% |
| Expenses (before waiver/reimbursement) (c) | 1.31%(d) | | 1.29% | | 1.32% | | 1.34% | | 1.33% |
| Portfolio turnover rate | 77% | | 66% | | 44% | | 54% | | 52% |
| Net assets at end of year (in 000’s) | $ 38,027 | | $ 63,195 | | $ 56,657 | | $ 57,283 | | $ 61,850 |
| (a) | Per share data based on average shares outstanding during the year. |
| (b) | Total investment return is calculated exclusive of sales charges and assumes the reinvestment of dividends and distributions. Class R3 shares are not subject to sales charges. For periods of less than one year, total return is not annualized. |
| (c) | In addition to the fees and expenses which the Fund bears directly, it also indirectly bears a pro-rata share of the fees and expenses of the underlying funds in which it invests. Such indirect expenses are not included in the above expense ratios. |
| (d) | Expense waiver/reimbursement less than 0.01%. |
The notes to the financial statements are an integral part of, and should be read in conjunction with, the financial statements.
21
Financial Highlights selected per share data and ratios
| | Year Ended October 31, |
| Class R6 | 2022 | | 2021 | | 2020 | | 2019 | | 2018 |
| Net asset value at beginning of year | $ 16.84 | | $ 12.39 | | $ 10.58 | | $ 10.76 | | $ 11.12 |
| Net investment income (loss) (a) | (0.00)‡ | | (0.03) | | 0.00‡ | | 0.01 | | 0.01 |
| Net realized and unrealized gain (loss) | (4.36) | | 5.12 | | 2.88 | | 1.63 | | 1.21 |
| Total from investment operations | (4.36) | | 5.09 | | 2.88 | | 1.64 | | 1.22 |
| Less distributions: | | | | | | | | | |
| From net investment income | — | | — | | (0.01) | | — | | (0.02) |
| From net realized gain on investments | (3.11) | | (0.64) | | (1.06) | | (1.82) | | (1.56) |
| Total distributions | (3.11) | | (0.64) | | (1.07) | | (1.82) | | (1.58) |
| Net asset value at end of year | $ 9.37 | | $ 16.84 | | $ 12.39 | | $ 10.58 | | $ 10.76 |
| Total investment return (b) | (31.50)% | | 42.65% | | 29.83% | | 17.49% | | 12.72% |
| Ratios (to average net assets)/Supplemental Data: | | | | | | | | | |
| Net investment income (loss) | (0.04)% | | (0.22)% | | 0.02% | | 0.13% | | 0.13% |
| Net expenses (c) | 0.63% | | 0.62% | | 0.64% | | 0.64% | | 0.63% |
| Expenses (before waiver/reimbursement) (c) | 0.64% | | 0.63% | | 0.64% | | 0.64% | | 0.64% |
| Portfolio turnover rate | 77% | | 66% | | 44% | | 54% | | 52% |
| Net assets at end of year (in 000’s) | $ 3,285,993 | | $ 4,782,798 | | $ 3,981,812 | | $ 3,148,459 | | $ 2,463,405 |
| ‡ | Less than one cent per share. |
| (a) | Per share data based on average shares outstanding during the year. |
| (b) | Total investment return is calculated exclusive of sales charges and assumes the reinvestment of dividends and distributions. Class R6 shares are not subject to sales charges. For periods of less than one year, total return is not annualized. |
| (c) | In addition to the fees and expenses which the Fund bears directly, it also indirectly bears a pro-rata share of the fees and expenses of the underlying funds in which it invests. Such indirect expenses are not included in the above expense ratios. |
| | Year Ended October 31, | | August 31, 2020^ through
October 31, |
| SIMPLE Class | 2022 | | 2021 | | 2020 |
| Net asset value at beginning of period | $ 14.52 | | $ 10.84 | | $ 11.84* |
| Net investment income (loss) (a) | (0.07) | | (0.12) | | (0.02) |
| Net realized and unrealized gain (loss) | (3.62) | | 4.44 | | (0.98) |
| Total from investment operations | (3.69) | | 4.32 | | (1.00) |
| Less distributions: | | | | | |
| From net realized gain on investments | (3.11) | | (0.64) | | — |
| Net asset value at end of period | $ 7.72 | | $ 14.52 | | $ 10.84 |
| Total investment return (b) | (32.02)% | | 41.59% | | (8.45)% |
| Ratios (to average net assets)/Supplemental Data: | | | | | |
| Net investment income (loss) | (0.77)% | | (0.96)% | | (1.00)%†† |
| Net expenses (c) | 1.37% | | 1.33% | | 1.32%†† |
| Expenses (before waiver/reimbursement) (c) | 1.38% | | 1.34% | | 1.33%†† |
| Portfolio turnover rate | 77% | | 66% | | 44% |
| Net assets at end of period (in 000’s) | $ 220 | | $ 71 | | $ 23 |
| ^ | Inception date. |
| * | Based on the net asset value of Investor Class as of August 31, 2020. |
| †† | Annualized. |
| (a) | Per share data based on average shares outstanding during the period. |
| (b) | Total investment return is calculated exclusive of sales charges and assumes the reinvestment of dividends and distributions. SIMPLE Class shares are not subject to sales charges. For periods of less than one year, total return is not annualized. |
| (c) | In addition to the fees and expenses which the Fund bears directly, it also indirectly bears a pro-rata share of the fees and expenses of the underlying funds in which it invests. Such indirect expenses are not included in the above expense ratios. |
The notes to the financial statements are an integral part of, and should be read in conjunction with, the financial statements.
| 22 | MainStay Winslow Large Cap Growth Fund |
Notes to Financial Statements
Note 1-Organization and Business
The MainStay Funds (the “Trust”) was organized on January 9, 1986, as a Massachusetts business trust. The Trust is registered under the Investment Company Act of 1940, as amended (the “1940 Act”), as an open-end management investment company, and is comprised of twelve funds (collectively referred to as the "Funds"). These financial statements and notes relate to the MainStay Winslow Large Cap Growth Fund (the "Fund"), a “diversified” fund, as that term is defined in the 1940 Act, as interpreted or modified by regulatory authorities having jurisdiction, from time to time.
The following table lists the Fund's share classes that have been registered and commenced operations:
| Class | Commenced Operations |
| Class A | July 1, 1995 |
| Investor Class | February 28, 2008 |
| Class B | April 1, 2005 |
| Class C | April 1, 2005 |
| Class I | April 1, 2005 |
| Class R1 | April 1, 2005 |
| Class R2 | April 1, 2005 |
| Class R3 | April 28, 2006 |
| Class R6 | June 17, 2013 |
| SIMPLE Class | August 31, 2020 |
Class B shares of the MainStay Group of Funds are closed to all new purchases as well as additional investments by existing Class B shareholders. Existing Class B shareholders may continue to reinvest dividends and capital gains distributions, as well as exchange their Class B shares for Class B shares of other funds in the MainStay Group of Funds as permitted by the current exchange privileges. Class B shareholders continue to be subject to any applicable contingent deferred sales charge ("CDSC") at the time of redemption. All other features of the Class B shares, including but not limited to the fees and expenses applicable to Class B shares, remain unchanged. Unless redeemed, Class B shareholders will remain in Class B shares of their respective fund until the Class B shares are converted to Class A or Investor Class shares pursuant to the applicable conversion schedule.
Class A and Investor Class shares are offered at net asset value (“NAV”) per share plus an initial sales charge. No initial sales charge applies to investments of $1 million or more (and certain other qualified purchases) in Class A and Investor Class shares. However, a CDSC of 1.00% may be imposed on certain redemptions made within 18 months of the date of purchase on shares that were purchased without an initial sales charge. Class C shares are offered at NAV without an initial sales charge, although a 1.00% CDSC may be imposed on certain redemptions of such shares made within one year of the date of purchase of Class C shares. When Class B shares were offered, they were offered at NAV without an initial sales charge, although a CDSC that declines depending on the number of years a shareholder held its Class B shares may be imposed on certain redemptions of such shares made within six years of the date
of purchase of such shares. Class I, Class R1, Class R2, Class R3, Class R6 and SIMPLE Class shares are offered at NAV without a sales charge. Depending upon eligibility, Class B shares convert to either Class A or Investor Class shares at the end of the calendar quarter eight years after the date they were purchased. In addition, depending upon eligibility, Class C shares convert to either Class A or Investor Class shares at the end of the calendar quarter eight years after the date they were purchased. Additionally, Investor Class shares may convert automatically to Class A shares. SIMPLE Class shares convert to Class A shares, or Investor Class shares if you are not eligible to hold Class A shares, at the end of the calendar quarter, ten years after the date they were purchased. Share class conversions are based on the relevant NAVs of the two classes at the time of the conversion, and no sales load or other charge is imposed. Under certain circumstances and as may be permitted by the Trust’s multiple class plan pursuant to Rule 18f-3 under the 1940 Act, specified share classes of the Fund may be converted to one or more other share classes of the Fund as disclosed in the capital share trans-actions within these Notes. The classes of shares have the same voting (except for issues that relate solely to one class), dividend, liquidation and other rights, and the same terms and conditions, except that under distribution plans pursuant to Rule 12b-1 under the 1940 Act, Class B and Class C shares are subject to higher distribution and/or service fees than Class A, Investor Class, Class R2, Class R3 and SIMPLE Class shares. Class I, Class R1 and Class R6 shares are not subject to a distribution and/or service fee. Class R1, Class R2 and Class R3 shares are subject to a shareholder service fee, which is in addition to fees paid under the distribution plans for Class R2 and Class R3 shares.
The Fund's investment objective is to seek long-term growth of capital.
Note 2–Significant Accounting Policies
The Fund is an investment company and accordingly follows the investment company accounting and reporting guidance of the Financial Accounting Standards Board (“FASB”) Accounting Standards Codification Topic 946 Financial Services—Investment Companies. The Fund prepares its financial statements in accordance with generally accepted accounting principles (“GAAP”) in the United States of America and follows the significant accounting policies described below.
(A) Securities Valuation. Investments are usually valued as of the close of regular trading on the New York Stock Exchange (the "Exchange") (usually 4:00 p.m. Eastern time) on each day the Fund is open for business ("valuation date").
Effective September 8, 2022, and pursuant to Rule 2a-5 under the 1940 Act, the Board of Trustees of the Trust (the "Board") designated New York Life Investment Management LLC (“New York Life Investments” or the "Manager") as its Valuation Designee (the "Valuation Designee"). The Valuation Designee is responsible for performing fair valuations relating to all investments in the Fund’s portfolio for which market quotations are not readily available; periodically assessing and managing material valuation risks; establishing and applying fair value methodologies; testing fair valuation methodologies; evaluating and overseeing pricing services;
Notes to Financial Statements (continued)
segregation of valuation and portfolio management functions; providing quarterly, annual and prompt reporting to the Board, as appropriate; identifying potential conflicts of interest; and maintaining appropriate records. The Valuation Designee has established a valuation committee ("Valuation Committee") to assist in carrying out the Valuation Designee’s responsibilities and establish prices of securities for which market quotations are not readily available. The Fund’s and the Valuation Designee's policies and procedures ("Valuation Procedures") govern the Valuation Designee’s selection and application of methodologies for determining and calculating the fair value of Fund investments. The Valuation Designee may value Fund portfolio securities for which market quotations are not readily available and other Fund assets utilizing inputs from pricing services and other third-party sources (together, “Pricing Sources”). The Valuation Committee meets (in person, via electronic mail or via teleconference) on an ad-hoc basis to determine fair valuations and on a quarterly basis to review fair value events (excluding fair valuations from pricing services), including valuation risks and back-testing results, and preview reports to the Board.
The Valuation Committee establishes prices of securities for which market quotations are not readily available based on such methodologies and measurements on a regular basis after considering information that is reasonably available and deemed relevant by the Valuation Committee. The Board shall oversee the Valuation Designee and review fair valuation materials on a prompt, quarterly and annual basis and approve proposed revisions to the Valuation Procedures.
Investments for which market quotations are not readily available are valued at fair value as determined in good faith pursuant to the Valuation Procedures. A market quotation is readily available only when that quotation is a quoted price (unadjusted) in active markets for identical investments that the Fund can access at the measurement date, provided that a quotation will not be readily available if it is not reliable. Fair value measurements are determined within a framework that establishes a three-tier hierarchy that maximizes the use of observable market data and minimizes the use of unobservable inputs to establish a classification of fair value measurements for disclosure purposes. "Inputs" refer broadly to the assumptions that market participants would use in pricing the asset or liability, including assumptions about risk, such as the risk inherent in a particular valuation technique used to measure fair value using a pricing model and/or the risk inherent in the inputs for the valuation technique. Inputs may be observable or unobservable. Observable inputs reflect the assumptions market participants would use in pricing the asset or liability based on market data obtained from sources independent of the Fund. Unobservable inputs reflect the Fund’s own assumptions about the assumptions market participants would use in pricing the asset or liability based on the information available. The inputs or methodology used for valuing assets or liabilities may not be an indication of the risks associated with investing in those assets or liabilities. The three-tier hierarchy of inputs is summarized below.
| • | Level 1—quoted prices (unadjusted) in active markets for an identical asset or liability |
| • | Level 2—other significant observable inputs (including quoted prices for a similar asset or liability in active markets, interest rates and yield curves, prepayment speeds, credit risk, etc.) |
| • | Level 3—significant unobservable inputs (including the Fund's own assumptions about the assumptions that market participants would use in measuring fair value of an asset or liability) |
The level of an asset or liability within the fair value hierarchy is based on the lowest level of an input, both individually and in the aggregate, that is significant to the fair value measurement. The aggregate value by input level of the Fund’s assets and liabilities as of October 31, 2022, is included at the end of the Portfolio of Investments.
The Fund may use third-party vendor evaluations, whose prices may be derived from one or more of the following standard inputs, among others:
| • Broker/dealer quotes | • Benchmark securities |
| • Two-sided markets | • Reference data (corporate actions or material event notices) |
| • Bids/offers | • Monthly payment information |
| • Industry and economic events | • Reported trades |
An asset or liability for which a market quotation is not readily available is valued by methods deemed reasonable in good faith by the Valuation Committee, following the Valuation Procedures to represent fair value. Under these procedures, the Valuation Designee generally uses a market-based approach which may use related or comparable assets or liabilities, recent transactions, market multiples, book values and other relevant information. The Valuation Designee may also use an income-based valuation approach in which the anticipated future cash flows of the asset or liability are discounted to calculate fair value. Discounts may also be applied due to the nature and/or duration of any restrictions on the disposition of the asset or liability. Fair value represents a good faith approximation of the value of a security. Fair value determinations involve the consideration of a number of subjective factors, an analysis of applicable facts and circumstances and the exercise of judgment. As a result, it is possible that the fair value for a security determined in good faith in accordance with the Valuation Procedures may differ from valuations for the same security determined for other funds using their own valuation procedures. Although the Valuation Procedures are designed to value a security at the price the Fund may reasonably expect to receive upon the security's sale in an orderly transaction, there can be no assurance that any fair value determination thereunder would, in fact, approximate the amount that the Fund would actually realize upon the sale of the security or the price at which the security would trade if a reliable market price were readily available. During the year ended October 31, 2022, there were no material changes to the fair value methodologies.
Securities which may be valued in this manner include, but are not limited to: (i) a security for which trading has been halted or suspended or otherwise does not have a readily available market quotation on a given day; (ii) a debt security that has recently gone into default and for which there is not a current market quotation; (iii) a security of an issuer that
| 24 | MainStay Winslow Large Cap Growth Fund |
has entered into a restructuring; (iv) a security that has been delisted from a national exchange; (v) a security subject to trading collars for which no or limited trading takes place; and (vi) a security whose principal market has been temporarily closed at a time when, under normal conditions, it would be open. Securities valued in this manner are generally categorized as Level 2 or 3 in the hierarchy.
Certain securities held by the Fund may principally trade in foreign markets. Events may occur between the time the foreign markets close and the time at which the Fund's NAVs are calculated. These events may include, but are not limited to, situations relating to a single issuer in a market sector, significant fluctuations in U.S. or foreign markets, natural disasters, armed conflicts, governmental actions or other developments not tied directly to the securities markets. Should the Valuation Designee conclude that such events may have affected the accuracy of the last price of such securities reported on the local foreign market, the Valuation Designee may, pursuant to the Valuation Procedures, adjust the value of the local price to reflect the estimated impact on the price of such securities as a result of such events. In this instance, securities are generally categorized as Level 3 in the hierarchy. Additionally, certain foreign equity securities are also fair valued whenever the movement of a particular index exceeds certain thresholds. In such cases, the securities are fair valued by applying factors provided by a third-party vendor in accordance with the Valuation Procedures and are generally categorized as Level 2 in the hierarchy. No foreign equity securities held by the Fund as of October 31, 2022 were fair valued in such a manner.
Equity securities are valued at the last quoted sales prices as of the close of regular trading on the relevant exchange on each valuation date. Securities that are not traded on the valuation date are valued at the mean of the last quoted bid and ask prices. Prices are normally taken from the principal market in which each security trades. These securities are generally categorized as Level 1 in the hierarchy.
Investments in mutual funds, including money market funds, are valued at their respective NAVs at the close of business each day on the valuation date. These securities are generally categorized as Level 1 in the hierarchy.
Temporary cash investments acquired in excess of 60 days to maturity at the time of purchase are valued using the latest bid prices or using valuations based on a matrix system (which considers such factors as security prices, yields, maturities and ratings), both as furnished by independent pricing services. Temporary cash investments that mature in 60 days or less at the time of purchase ("Short-Term Investments") are valued using the amortized cost method of valuation, unless the use of such method would be inappropriate. The amortized cost method involves valuing a security at its cost on the date of purchase and thereafter assuming a constant amortization to maturity of the difference between such cost and the value on maturity date. Amortized cost approximates the current fair value of a security. Securities valued using the amortized cost method are not valued using quoted prices in an active market and are generally categorized as Level 2 in the hierarchy.
The information above is not intended to reflect an exhaustive list of the methodologies that may be used to value portfolio investments. The Valuation Procedures permit the use of a variety of valuation methodologies in connection with valuing portfolio investments. The methodology used for a specific type of investment may vary based on the market data available or other considerations. The methodologies summarized above may not represent the specific means by which portfolio investments are valued on any particular business day.
(B) Income Taxes. The Fund's policy is to comply with the requirements of the Internal Revenue Code of 1986, as amended (the “Internal Revenue Code”), applicable to regulated investment companies and to distribute all of its taxable income to the shareholders of the Fund within the allowable time limits.
The Manager evaluates the Fund’s tax positions to determine if the tax positions taken meet the minimum recognition threshold in connection with accounting for uncertainties in income tax positions taken or expected to be taken for the purposes of measuring and recognizing tax liabilities in the financial statements. Recognition of tax benefits of an uncertain tax position is permitted only to the extent the position is “more likely than not” to be sustained assuming examination by taxing authorities. The Manager analyzed the Fund's tax positions taken on federal, state and local income tax returns for all open tax years (for up to three tax years) and has concluded that no provisions for federal, state and local income tax are required in the Fund's financial statements. The Fund's federal, state and local income tax and federal excise tax returns for tax years for which the applicable statutes of limitations have not expired are subject to examination by the Internal Revenue Service and state and local departments of revenue.
(C) Dividends and Distributions to Shareholders. Dividends and distributions are recorded on the ex-dividend date. The Fund intends to declare and pay dividends from net investment income and distributions from net realized capital and currency gains, if any, at least annually. Unless a shareholder elects otherwise, all dividends and distributions are reinvested at NAV in the same class of shares of the Fund. Dividends and distributions to shareholders are determined in accordance with federal income tax regulations and may differ from determinations using GAAP.
(D) Security Transactions and Investment Income. The Fund records security transactions on the trade date. Realized gains and losses on security transactions are determined using the identified cost method. Dividend income is recognized on the ex-dividend date, net of any foreign tax withheld at the source, and interest income is accrued as earned using the effective interest rate method. Distributions received from real estate investment trusts may be classified as dividends, capital gains and/or return of capital.
Investment income and realized and unrealized gains and losses on investments of the Fund are allocated pro rata to the separate classes of shares based upon their relative net assets on the date the income is earned or realized and unrealized gains and losses are incurred.
Notes to Financial Statements (continued)
(E) Expenses. Expenses of the Trust are allocated to the individual Funds in proportion to the net assets of the respective Funds when the expenses are incurred, except where direct allocations of expenses can be made. Expenses (other than transfer agent expenses and fees incurred under the shareholder services plans and/or the distribution plans further discussed in Note 3(B)) are allocated to separate classes of shares pro rata based upon their relative net assets on the date the expenses are incurred. The expenses borne by the Fund, including those of related parties to the Fund, are shown in the Statement of Operations.
Additionally, the Fund may invest in mutual funds, which are subject to management fees and other fees that may cause the costs of investing in mutual funds to be greater than the costs of owning the underlying securities directly. These indirect expenses of mutual funds are not included in the amounts shown as expenses in the Statement of Operations or in the expense ratios included in the Financial Highlights.
(F) Use of Estimates. In preparing financial statements in conformity with GAAP, the Manager makes estimates and assumptions that affect the reported amounts and disclosures in the financial statements. Actual results could differ from those estimates and assumptions.
(G) Securities Lending. In order to realize additional income, the Fund may engage in securities lending, subject to the limitations set forth in the 1940 Act and relevant guidance by the staff of the Securities and Exchange Commission (“SEC”). If the Fund engages in securities lending, the Fund will lend through its custodian, JPMorgan Chase Bank, N.A., ("JPMorgan"), acting as securities lending agent on behalf of the Fund. Under the current arrangement, JPMorgan will manage the Fund's collateral in accordance with the securities lending agency agreement between the Fund and JPMorgan, and indemnify the Fund against counterparty risk. The loans will be collateralized by cash (which may be invested in a money market fund) and/or non-cash collateral (which may include U.S. Treasury securities and/or U.S. government agency securities issued or guaranteed by the United States government or its agencies or instrumentalities) at least equal at all times to the market value of the securities loaned. Non-cash collateral held at year end is segregated and cannot be transferred by the Fund. The Fund bears the risk of delay in recovery of, or loss of rights in, the securities loaned. The Fund may also record a realized gain or loss on securities deemed sold due to a borrower’s inability to return securities on loan. The Fund bears the risk of any loss on investment of cash collateral. The Fund will receive compensation for lending its securities in the form of fees or it will retain a portion of interest earned on the investment of any cash collateral. The Fund will also continue to receive interest and dividends on the securities loaned and any gain or loss in the market price of the securities loaned that may occur during the term of the loan will be for the account of the Fund. Income earned from securities lending activities, if any, is reflected in the Statement of Operations. As of October 31, 2022, the Fund did not have any portfolio securities on loan.
(H) Indemnifications. Under the Trust’s organizational documents, its officers and trustees are indemnified against certain liabilities that may arise out of performance of their duties to the Trust. Additionally, in the
normal course of business, the Fund enters into contracts with third-party service providers that contain a variety of representations and warranties and that may provide general indemnifications. The Fund's maximum exposure under these arrangements is unknown, as this would involve future claims that may be made against the Fund that have not yet occurred. The Manager believes that the risk of loss in connection with these potential indemnification obligations is remote. However, there can be no assurance that material liabilities related to such obligations will not arise in the future, which could adversely impact the Fund.
Note 3–Fees and Related Party Transactions
(A) Manager and Subadvisor. New York Life Investments, a registered investment adviser and an indirect, wholly-owned subsidiary of New York Life Insurance Company ("New York Life"), serves as the Fund’s Manager, pursuant to an Amended and Restated Management Agreement (“Management Agreement”). The Manager provides offices, conducts clerical, recordkeeping and bookkeeping services and keeps most of the financial and accounting records required to be maintained by the Fund. Except for the portion of salaries and expenses that are the responsibility of the Fund, the Manager pays the salaries and expenses of all personnel affiliated with the Fund and certain operational expenses of the Fund. During a portion of the year ended October 31, 2022, the Fund reimbursed New York Life Investments in an amount equal to the portion of the compensation of the Chief Compliance Officer attributable to the Fund. Winslow Capital Management, LLC. (“Winslow” or the “Subadvisor”), a registered investment adviser, serves as the Subadvisor to the Fund and is responsible for the day-to-day portfolio management of the Fund. Pursuant to the terms of a Subadvisory Agreement (“Subadvisory Agreement”) between New York Life Investments and Winslow, New York Life Investments pays for the services of the Subadvisor.
Pursuant to the Management Agreement, the Fund pays the Manager a monthly fee for the services performed and the facilities furnished at an annual rate of the Fund’s average daily net assets as follows: 0.75% up to $500 million; 0.725% from $500 million to $750 million; 0.71% from $750 million to $1 billion; 0.70% from $1 billion to $2 billion; 0.66% from $2 billion to $3 billion; 0.61% from $3 billion to $7 billion; 0.585% from $7 billion to $9 billion; and 0.575% on assets over $9 billion. During the year ended October 31, 2022, the effective management fee rate was 0.61% of the Fund’s average daily net assets, exclusive of any applicable waivers/reimbursements.
New York Life Investments has contractually agreed to waive a portion of its management fee so that the management fee does not exceed 0.55% of the Fund’s average daily net assets from $11 billion to $13 billion; and 0.525% of the Fund’s average daily net assets over $13 billion. This agreement will remain in effect until February 28, 2023, and shall renew automatically for one-year terms unless New York Life Investments provides written notice of termination prior to the start of the next term or upon approval of the Board.
| 26 | MainStay Winslow Large Cap Growth Fund |
New York Life Investments has also contractually agreed to waive fees and/or reimburse expenses so that Total Annual Fund Operating Expenses (excluding taxes, interest, litigation, extraordinary expenses, brokerage and other transaction expenses relating to the purchase and sale of portfolio investments, and acquired (underlying) fund fees and expenses) of Class I shares do not exceed 0.88% of the Fund’s average daily net assets. New York Life Investments has also contractually agreed to waive fees and/or reimburse expenses so that Total Annual Fund Operating Expenses (excluding taxes, interest, litigation, extraordinary expenses, brokerage and other transaction expenses relating to the purchase or sale of portfolio investments, and acquired (underlying) fund fees and expenses) of Class R6 do not exceed those of Class I. These agreements will remain in effect until February 28, 2023, and shall renew automatically for one-year terms unless New York Life Investments provides written notice of termination prior to the start of the next term or upon approval of the Board.
Additionally, New York Life Investments has agreed to further voluntarily waive fees and/or reimburse expenses of the appropriate class of the Fund so that Total Annual Fund Operating Expenses (excluding taxes, interest, litigation, extraordinary expenses, brokerage and other transaction expenses relating to the purchase and sale of portfolio investments, and acquired (underlying) fund fees and expenses) of Class R1 shares do not exceed 0.95%. This voluntary waiver or reimbursement may be discontinued at any time without notice.
During the year ended October 31, 2022, New York Life Investments earned fees from the Fund in the amount of $81,803,817 and waived fees and/or reimbursed expenses in the amount of $807,597 and paid the Subadvisor fees in the amount of $32,029,177.
JPMorgan provides sub-administration and sub-accounting services to the Fund pursuant to an agreement with New York Life Investments. These services include calculating the daily NAVs of the Fund, maintaining the general ledger and sub-ledger accounts for the calculation of the Fund's NAVs, and assisting New York Life Investments in conducting various aspects of the Fund's administrative operations. For providing these services to the Fund, JPMorgan is compensated by New York Life Investments.
Pursuant to an agreement between the Trust and New York Life Investments, New York Life Investments is responsible for providing or procuring certain regulatory reporting services for the Fund. The Fund will reimburse New York Life Investments for the actual costs incurred by New York Life Investments in connection with providing or procuring these services for the Fund.
(B) Distribution and Service Fees. The Trust, on behalf of the Fund, has entered into a distribution agreement with NYLIFE Distributors LLC (the “Distributor”), an affiliate of New York Life Investments. The Fund has adopted distribution plans (the “Plans”) in accordance with the provisions of Rule 12b-1 under the 1940 Act.
Pursuant to the Class A, Investor Class and Class R2 Plans, the Distributor receives a monthly fee from the Class A, Investor Class and
Class R2 shares at an annual rate of 0.25% of the average daily net assets of the Class A, Investor Class and Class R2 shares for distribution and/or service activities as designated by the Distributor. Pursuant to the Class B and Class C Plans, Class B and Class C shares pay the Distributor a monthly distribution fee at an annual rate of 0.75% of the average daily net assets of the Class B and Class C shares, along with a service fee at an annual rate of 0.25% of the average daily net assets of the Class B and Class C shares, for a total 12b-1 fee of 1.00%. Pursuant to the Class R3 and SIMPLE Class Plans, Class R3 and SIMPLE Class shares pay the Distributor a monthly distribution fee at an annual rate of 0.25% of the average daily net assets of the Class R3 and SIMPLE Class shares, along with a service fee at an annual rate of 0.25% of the average daily net assets of the Class R3 and SIMPLE Class shares, for a total 12b-1 fee of 0.50%. Class I, Class R1 and Class R6 shares are not subject to a distribution and/or service fee.
The Plans provide that the distribution and service fees are payable to the Distributor regardless of the amounts actually expended by the Distributor for distribution of the Fund's shares and service activities.
In accordance with the Shareholder Services Plans for the Class R1, Class R2 and Class R3 shares, the Manager has agreed to provide, through its affiliates or independent third parties, various shareholder and administrative support services to shareholders of the Class R1, Class R2 and Class R3 shares. For its services, the Manager, its affiliates or independent third-party service providers are entitled to a shareholder service fee accrued daily and paid monthly at an annual rate of 0.10% of the average daily net assets of the Class R1, Class R2 and Class R3 shares. This is in addition to any fees paid under the Class R2 and Class R3 Plans.
During the year ended October 31, 2022, shareholder service fees incurred by the Fund were as follows:
| |
| Class R1 | $895,625 |
| Class R2 | 134,555 |
| Class R3 | 48,656 |
(C) Sales Charges. The Fund was advised by the Distributor that the amount of initial sales charges retained on sales of Class A and Investor Class shares during the year ended October 31, 2022, were $214,083 and $26,790, respectively.
The Fund was also advised that the Distributor retained CDSCs on redemptions of Class A, Class B and Class C shares during the year ended October 31, 2022, of $18,173, $1,310 and $4,191, respectively.
(D) Transfer, Dividend Disbursing and Shareholder Servicing Agent. NYLIM Service Company LLC, an affiliate of New York Life Investments, is the Fund's transfer, dividend disbursing and shareholder servicing agent pursuant to an agreement between NYLIM Service Company LLC and the Trust. NYLIM Service Company LLC has entered into an agreement with DST Asset Manager Solutions, Inc. ("DST"), pursuant to which DST performs certain transfer agent services on behalf
Notes to Financial Statements (continued)
of NYLIM Service Company LLC. New York Life Investments has contractually agreed to limit the transfer agency expenses charged to the Fund’s share classes to a maximum of 0.35% of that share class’s average daily net assets on an annual basis after deducting any applicable Fund or class-level expense reimbursement or small account fees. This agreement will remain in effect until February 28, 2023, and shall renew automatically for one-year terms unless New York Life Investments provides written notice of termination prior to the start of the next term or upon approval of the Board. During the year ended October 31, 2022, transfer agent expenses incurred by the Fund and any reimbursements, pursuant to the aforementioned Transfer Agency expense limitation agreement, were as follows:
| Class | Expense | Waived |
| Class A | $1,055,498 | $— |
| Investor Class | 187,602 | — |
| Class B | 32,233 | — |
| Class C | 147,716 | — |
| Class I | 5,558,634 | — |
| Class R1 | 707,587 | — |
| Class R2 | 106,303 | — |
| Class R3 | 38,518 | — |
| Class R6 | 152,334 | — |
| SIMPLE Class | 365 | — |
(E) Small Account Fee. Shareholders with small accounts adversely impact the cost of providing transfer agency services. In an effort to reduce total transfer agency expenses, the Fund has implemented a small account fee on certain types of accounts. As described in the Fund's prospectus, certain shareholders with an account balance of less than $1,000 ($5,000 for Class A share accounts) are charged an annual per account fee of $20 (assessed semi-annually), the proceeds from which offset transfer agent fees as reflected in the Statement of Operations. This small account fee will not apply to certain types of accounts as described further in the Fund’s prospectus.
(F) Capital. As of October 31, 2022, New York Life and its affiliates beneficially held shares of the Fund with the values and percentages of net assets as follows:
Note 4-Federal Income Tax
As of October 31, 2022, the cost and unrealized appreciation (depreciation) of the Fund’s investment portfolio, including applicable derivative contracts and other financial instruments, as determined on a federal income tax basis, were as follows:
| | Federal Tax
Cost | Gross
Unrealized
Appreciation | Gross
Unrealized
(Depreciation) | Net
Unrealized
Appreciation/
(Depreciation) |
| Investments in Securities | $8,992,882,031 | $2,807,901,644 | $(367,339,492) | $2,440,562,152 |
As of October 31, 2022, the components of accumulated gain (loss) on a tax basis were as follows:
Ordinary
income | Accumulated
Capital
and Other
Gain (Loss) | Other
Temporary
Differences | Unrealized
Appreciation
(Depreciation) | Total
Accumulated
Gain (Loss) |
| $16,207,666 | $1,289,880,385 | $— | $2,440,562,152 | $3,746,650,203 |
The difference between book-basis and tax-basis unrealized appreciation (depreciation) is primarily due to to wash sale adjustments.
The following table discloses the current year reclassifications between total distributable earnings (loss) and additional paid-in capital arising from permanent differences; net assets as of October 31, 2022 were not affected.
| | Total
Distributable
Earnings (Loss) | Additional
Paid-In
Capital |
| | $(96,079,478) | $96,079,478 |
The reclassifications for the Fund are primarily due to equalization.
During the years ended October 31, 2022 and October 31, 2021, the tax character of distributions paid as reflected in the Statements of Changes in Net Assets was as follows:
| | 2022 | 2021 |
| Distributions paid from: | | |
| Ordinary Income | $ 549,987,364 | $ 6,461 |
| Long-Term Capital Gains | 2,601,876,295 | 718,092,341 |
| Total | $3,151,863,659 | $718,098,802 |
Note 5–Custodian
JPMorgan is the custodian of cash and securities held by the Fund. Custodial fees are charged to the Fund based on the Fund's net assets and/or the market value of securities held by the Fund and the number of certain transactions incurred by the Fund.
| 28 | MainStay Winslow Large Cap Growth Fund |
Note 6–Line of Credit
The Fund and certain other funds managed by New York Life Investments maintain a line of credit with a syndicate of banks in order to secure a source of funds for temporary purposes to meet unanticipated or excessive redemption requests.
Effective July 26, 2022, under the credit agreement (the “Credit Agreement”), the aggregate commitment amount is $600,000,000 with an additional uncommitted amount of $100,000,000. The commitment fee is an annual rate of 0.15% of the average commitment amount payable quarterly, regardless of usage, to JPMorgan, who serves as the agent to the syndicate. The commitment fee is allocated among the Fund and certain other funds managed by New York Life Investments based upon their respective net assets and other factors. Interest on any revolving credit loan is charged based upon the Federal Funds Rate, Daily Simple Secured Overnight Financing Rate ("SOFR") + 0.10%, or the Overnight Bank Funding Rate, whichever is higher. The Credit Agreement expires on July 25, 2023, although the Fund, certain other funds managed by New York Life Investments and the syndicate of banks may renew the Credit Agreement for an additional year on the same or different terms or enter into a credit agreement with a different syndicate of banks. Prior to July 26, 2022, the aggregate commitment amount and the commitment fee were the same as those under the current Credit Agreement. During the year ended October 31, 2022, there were no borrowings made or outstanding with respect to the Fund under the Credit Agreement.
Note 7–Interfund Lending Program
Pursuant to an exemptive order issued by the SEC, the Fund, along with certain other funds managed by New York Life Investments, may participate in an interfund lending program. The interfund lending program provides an alternative credit facility that permits the Fund and certain other funds managed by New York Life Investments to lend or borrow money for temporary purposes directly to or from one another, subject to the conditions of the exemptive order. During the year ended October 31, 2022, there were no interfund loans made or outstanding with respect to the Fund.
Note 8–Purchases and Sales of Securities (in 000’s)
During the year ended October 31, 2022, purchases and sales of securities, other than short-term securities, were $10,381,626 and $10,270,303, respectively.
Note 9–Capital Share Transactions
Transactions in capital shares for the years ended October 31, 2022 and October 31, 2021, were as follows:
| Class A | Shares | Amount |
| Year ended October 31, 2022: | | |
| Shares sold | 16,625,935 | $ 171,252,843 |
| Shares issued to shareholders in reinvestment of distributions | 28,541,804 | 330,514,092 |
| Shares redeemed | (30,234,090) | (288,975,973) |
| Net increase (decrease) in shares outstanding before conversion | 14,933,649 | 212,790,962 |
| Shares converted into Class A (See Note 1) | 906,871 | 9,104,942 |
| Shares converted from Class A (See Note 1) | (118,111) | (1,203,240) |
| Net increase (decrease) | 15,722,409 | $ 220,692,664 |
| Year ended October 31, 2021: | | |
| Shares sold | 22,033,022 | $ 277,150,403 |
| Shares issued to shareholders in reinvestment of distributions | 5,387,054 | 62,220,376 |
| Shares redeemed | (21,566,819) | (275,933,108) |
| Net increase (decrease) in shares outstanding before conversion | 5,853,257 | 63,437,671 |
| Shares converted into Class A (See Note 1) | 3,416,327 | 43,736,806 |
| Shares converted from Class A (See Note 1) | (13,324,070) | (192,191,173) |
| Net increase (decrease) | (4,054,486) | $ (85,016,696) |
| |
| Investor Class | Shares | Amount |
| Year ended October 31, 2022: | | |
| Shares sold | 766,345 | $ 7,074,265 |
| Shares issued to shareholders in reinvestment of distributions | 2,020,849 | 22,694,134 |
| Shares redeemed | (1,515,150) | (12,951,150) |
| Net increase (decrease) in shares outstanding before conversion | 1,272,044 | 16,817,249 |
| Shares converted into Investor Class (See Note 1) | 122,735 | 1,084,686 |
| Shares converted from Investor Class (See Note 1) | (458,718) | (4,837,943) |
| Net increase (decrease) | 936,061 | $ 13,063,992 |
| Year ended October 31, 2021: | | |
| Shares sold | 1,128,446 | $ 13,734,676 |
| Shares issued to shareholders in reinvestment of distributions | 586,179 | 6,612,105 |
| Shares redeemed | (1,798,752) | (21,424,583) |
| Net increase (decrease) in shares outstanding before conversion | (84,127) | (1,077,802) |
| Shares converted into Investor Class (See Note 1) | 117,807 | 1,439,267 |
| Shares converted from Investor Class (See Note 1) | (2,952,718) | (37,155,883) |
| Net increase (decrease) | (2,919,038) | $ (36,794,418) |
| |
Notes to Financial Statements (continued)
| Class B | Shares | Amount |
| Year ended October 31, 2022: | | |
| Shares sold | 32,973 | $ 228,304 |
| Shares issued to shareholders in reinvestment of distributions | 739,284 | 5,677,697 |
| Shares redeemed | (322,522) | (2,010,001) |
| Net increase (decrease) in shares outstanding before conversion | 449,735 | 3,896,000 |
| Shares converted from Class B (See Note 1) | (539,254) | (3,347,320) |
| Net increase (decrease) | (89,519) | $ 548,680 |
| Year ended October 31, 2021: | | |
| Shares sold | 68,840 | $ 639,418 |
| Shares issued to shareholders in reinvestment of distributions | 175,009 | 1,496,329 |
| Shares redeemed | (361,090) | (3,390,436) |
| Net increase (decrease) in shares outstanding before conversion | (117,241) | (1,254,689) |
| Shares converted from Class B (See Note 1) | (420,928) | (3,906,383) |
| Net increase (decrease) | (538,169) | $ (5,161,072) |
| |
| Class C | Shares | Amount |
| Year ended October 31, 2022: | | |
| Shares sold | 1,531,291 | $ 10,262,438 |
| Shares issued to shareholders in reinvestment of distributions | 2,934,389 | 22,448,071 |
| Shares redeemed | (3,524,833) | (22,771,338) |
| Net increase (decrease) in shares outstanding before conversion | 940,847 | 9,939,171 |
| Shares converted from Class C (See Note 1) | (300,459) | (1,784,533) |
| Net increase (decrease) | 640,388 | $ 8,154,638 |
| Year ended October 31, 2021: | | |
| Shares sold | 1,104,348 | $ 10,258,434 |
| Shares issued to shareholders in reinvestment of distributions | 768,446 | 6,554,845 |
| Shares redeemed | (4,655,683) | (42,505,085) |
| Net increase (decrease) in shares outstanding before conversion | (2,782,889) | (25,691,806) |
| Shares converted from Class C (See Note 1) | (425,646) | (3,803,804) |
| Net increase (decrease) | (3,208,535) | $ (29,495,610) |
| |
| Class I | Shares | Amount |
| Year ended October 31, 2022: | | |
| Shares sold | 206,773,027 | $ 2,304,009,295 |
| Shares issued to shareholders in reinvestment of distributions | 104,600,432 | 1,391,185,741 |
| Shares redeemed | (166,738,192) | (1,848,655,608) |
| Net increase (decrease) in shares outstanding before conversion | 144,635,267 | 1,846,539,428 |
| Shares converted into Class I (See Note 1) | 101,332 | 1,181,298 |
| Shares converted from Class I (See Note 1) | (21,339) | (189,065) |
| Net increase (decrease) | 144,715,260 | $ 1,847,531,661 |
| Year ended October 31, 2021: | | |
| Shares sold | 75,666,444 | $ 1,069,786,583 |
| Shares issued to shareholders in reinvestment of distributions | 24,932,557 | 320,632,678 |
| Shares redeemed | (162,239,448) | (2,363,597,119) |
| Net increase (decrease) in shares outstanding before conversion | (61,640,447) | (973,177,858) |
| Shares converted into Class I (See Note 1) | 11,934,333 | 192,159,317 |
| Net increase (decrease) | (49,706,114) | $ (781,018,541) |
| |
| Class R1 | Shares | Amount |
| Year ended October 31, 2022: | | |
| Shares sold | 12,545,711 | $ 128,752,543 |
| Shares issued to shareholders in reinvestment of distributions | 18,146,768 | 230,101,018 |
| Shares redeemed | (24,117,145) | (264,354,356) |
| Net increase (decrease) in shares outstanding before conversion | 6,575,334 | 94,499,205 |
| Shares converted from Class R1 (See Note 1) | (856) | (8,825) |
| Net increase (decrease) | 6,574,478 | $ 94,490,380 |
| Year ended October 31, 2021: | | |
| Shares sold | 11,175,211 | $ 154,183,022 |
| Shares issued to shareholders in reinvestment of distributions | 4,004,675 | 49,617,929 |
| Shares redeemed | (17,022,741) | (234,903,685) |
| Net increase (decrease) in shares outstanding before conversion | (1,842,855) | (31,102,734) |
| Shares converted from Class R1 (See Note 1) | (7,903) | (117,121) |
| Net increase (decrease) | (1,850,758) | $ (31,219,855) |
| |
| 30 | MainStay Winslow Large Cap Growth Fund |
| Class R2 | Shares | Amount |
| Year ended October 31, 2022: | | |
| Shares sold | 2,804,293 | $ 27,795,594 |
| Shares issued to shareholders in reinvestment of distributions | 2,370,271 | 27,115,902 |
| Shares redeemed | (4,522,072) | (46,339,701) |
| Net increase (decrease) | 652,492 | $ 8,571,795 |
| Year ended October 31, 2021: | | |
| Shares sold | 2,449,422 | $ 30,606,721 |
| Shares issued to shareholders in reinvestment of distributions | 534,450 | 6,119,453 |
| Shares redeemed | (4,703,242) | (59,789,772) |
| Net increase (decrease) | (1,719,370) | $ (23,063,598) |
| |
| Class R3 | Shares | Amount |
| Year ended October 31, 2022: | | |
| Shares sold | 904,543 | $ 7,708,409 |
| Shares issued to shareholders in reinvestment of distributions | 1,354,080 | 13,919,943 |
| Shares redeemed | (1,551,868) | (13,129,182) |
| Net increase (decrease) | 706,755 | $ 8,499,170 |
| Year ended October 31, 2021: | | |
| Shares sold | 750,705 | $ 8,643,290 |
| Shares issued to shareholders in reinvestment of distributions | 317,889 | 3,356,909 |
| Shares redeemed | (1,971,759) | (22,966,019) |
| Net increase (decrease) in shares outstanding before conversion | (903,165) | (10,965,820) |
| Shares converted from Class R3 (See Note 1) | (13,150) | (161,745) |
| Net increase (decrease) | (916,315) | $ (11,127,565) |
| |
| Class R6 | Shares | Amount |
| Year ended October 31, 2022: | | |
| Shares sold | 68,050,104 | $ 753,843,263 |
| Shares issued to shareholders in reinvestment of distributions | 64,620,416 | 871,083,204 |
| Shares redeemed | (66,095,061) | (730,228,554) |
| Net increase (decrease) | 66,575,459 | $ 894,697,913 |
| Year ended October 31, 2021: | | |
| Shares sold | 52,726,279 | $ 759,200,686 |
| Shares issued to shareholders in reinvestment of distributions | 15,650,584 | 203,301,080 |
| Shares redeemed | (105,667,940) | (1,542,745,590) |
| Net increase (decrease) | (37,291,077) | $ (580,243,824) |
| |
| SIMPLE Class | Shares | Amount |
| Year ended October 31, 2022: | | |
| Shares sold | 22,996 | $ 211,112 |
| Shares issued to shareholders in reinvestment of distributions | 1,475 | 16,490 |
| Shares redeemed | (826) | (7,320) |
| Net increase (decrease) | 23,645 | $ 220,282 |
| Year ended October 31, 2021: | | |
| Shares sold | 3,503 | $ 42,509 |
| Shares issued to shareholders in reinvestment of distributions | 121 | 1,359 |
| Shares redeemed | (916) | (10,719) |
| Net increase (decrease) in shares outstanding before conversion | 2,708 | 33,149 |
| Shares converted into SIMPLE Class (See Note 1) | 63 | 719 |
| Net increase (decrease) | 2,771 | $ 33,868 |
Note 10–Other Matters
As of the date of this report, interest rates in the United States and many parts of the world, including certain European countries, are ascending from historically low levels. Thus, the Fund currently faces a heightened level of risk associated with rising interest rates. This could be driven by a variety of factors, including but not limited to central bank monetary policies, changing inflation or real growth rates, general economic conditions, increasing bond issuances or reduced market demand for low yielding investments.
An outbreak of COVID-19, first detected in December 2019, has developed into a global pandemic and has resulted in travel restrictions, closure of international borders, certain businesses and securities markets, restrictions on securities trading activities, prolonged quarantines, supply chain disruptions, and lower consumer demand, as well as general concern and uncertainty. In 2022, many countries lifted some or all restrictions related to COVID-19. However, the continued impact of COVID-19 and related variants is uncertain and could further adversely affect the global economy, national economies, individual issuers and capital markets in unforeseeable ways and result in a substantial and extended economic downturn. Developments that disrupt global economies and financial markets, such as COVID-19, may magnify factors that affect the Fund's performance.
Note 11–Subsequent Events
In connection with the preparation of the financial statements of the Fund as of and for the year ended October 31, 2022, events and transactions subsequent to October 31, 2022, through the date the financial statements were issued have been evaluated by the Manager for possible adjustment and/or disclosure. No subsequent events requiring financial statement adjustment or disclosure have been identified.
Report of Independent Registered Public Accounting Firm
To the Shareholders of the Fund and Board of Trustees
The MainStay Funds:
Opinion on the Financial Statements
We have audited the accompanying statement of assets and liabilities of MainStay Winslow Large Cap Growth Fund (the Fund), one of the funds constituting The MainStay Funds, including the portfolio of investments, as of October 31, 2022, the related statement of operations for the year then ended, the statements of changes in net assets for each of the years in the two-year period then ended, and the related notes (collectively, the financial statements) and the financial highlights for each of the years or periods in the five-year period then ended. In our opinion, the financial statements and financial highlights present fairly, in all material respects, the financial position of the Fund as of October 31, 2022, the results of its operations for the year then ended, the changes in its net assets for each of the years in the two-year period then ended, and the financial highlights for each of the years or periods in the five-year period then ended, in conformity with U.S. generally accepted accounting principles.
Basis for Opinion
These financial statements and financial highlights are the responsibility of the Fund's management. Our responsibility is to express an opinion on these financial statements and financial highlights based on our audits. We are a public accounting firm registered with the Public Company Accounting Oversight Board (United States) (PCAOB) and are required to be independent with respect to the Fund in accordance with the U.S. federal securities laws and the applicable rules and regulations of the Securities and Exchange Commission and the PCAOB.
We conducted our audits in accordance with the standards of the PCAOB. Those standards require that we plan and perform the audit to obtain reasonable assurance about whether the financial statements and financial highlights are free of material misstatement, whether due to error or fraud. Our audits included performing procedures to assess the risks of material misstatement of the financial statements and financial highlights, whether due to error or fraud, and performing procedures that respond to those risks. Such procedures included examining, on a test basis, evidence regarding the amounts and disclosures in the financial statements and financial highlights. Such procedures also included confirmation of securities owned as of October 31, 2022, by correspondence with the custodian, the transfer agent and brokers; when replies were not received from brokers, we performed other auditing procedures. Our audits also included evaluating the accounting principles used and significant estimates made by management, as well as evaluating the overall presentation of the financial statements and financial highlights. We believe that our audits provide a reasonable basis for our opinion.

We have served as the auditor of one or more New York Life Investment Management investment companies since 2003.
Philadelphia, Pennsylvania
December 23, 2022
| 32 | MainStay Winslow Large Cap Growth Fund |
Federal Income Tax Information
(Unaudited)
The Fund is required under the Internal Revenue Code to advise shareholders in a written statement as to the federal tax status of dividends paid by the Fund during such fiscal years. Accordingly, the Fund paid $2,601,905,925 as long term capital gain distributions.
For the fiscal year ended October 31, 2022, the Fund designated approximately $61,402,348 under the Internal Revenue Code as qualified dividend income eligible for reduced tax rates.
The dividends paid by the Fund during the fiscal year ended October 31, 2022 should be multiplied by 9.50% to arrive at the amount eligible for the corporate dividend-received deduction.
In February 2023, shareholders will receive an IRS Form 1099-DIV or substitute Form 1099, which will show the federal tax status of the distributions received by shareholders in calendar year 2022. The amounts that will be reported on such 1099-DIV or substitute Form 1099 will be the amounts you are to use on your federal income tax return and will differ from the amounts which we must report for the Fund's fiscal year ended October 31, 2022.
Proxy Voting Policies and Procedures and Proxy Voting Record
The Fund is required to file with the SEC its proxy voting record for the 12-month period ending June 30 on Form N-PX. A description of the policies and procedures that are used to vote proxies relating to portfolio securities of the Fund is available free of charge upon request by calling 800-624-6782 or visiting the SEC’s website at www.sec.gov. The most recent Form N-PX or proxy voting record is available free of charge upon request by calling 800-624-6782; visiting newyorklifeinvestments.com; or visiting the SEC’s website at www.sec.gov.
Shareholder Reports and Quarterly Portfolio Disclosure
The Fund is required to file its complete schedule of portfolio holdings with the SEC 60 days after its first and third fiscal quarter on Form N-PORT. The Fund's holdings report is available free of charge upon request by calling New York Life Investments at 800-624-6782.
Board of Trustees and Officers (Unaudited)
The Trustees and officers of the Fund are listed below. The Board oversees the MainStay Group of Funds (which consists of MainStay Funds and MainStay Funds Trust), MainStay VP Funds Trust, MainStay MacKay DefinedTerm Municipal Opportunities Fund, MainStay CBRE Global Infrastructure Megatrends Fund, the Manager and the Subadvisors, and elects the officers of the Funds who are responsible for the day-to-day operations of the Fund. Information pertaining to the Trustees and officers is set forth below. Each Trustee serves until his or her successor is
elected and qualified or until his or her resignation, death or removal. Under the Board’s retirement policy, unless an exception is made, a Trustee must tender his or her resignation by the end of the calendar year during which he or she reaches the age of 75. The business address of each Trustee and officer listed below is 51 Madison Avenue, New York, New York 10010. None of the Trustees are “interested persons” (as defined by the 1940 Act and rules adopted by the SEC thereunder) of the Fund (“Independent Trustees”).
| | Name and
Year of Birth | Term of Office,
Position(s) Held and
Length of Service | Principal Occupation(s)
During Past Five Years | Number of
Portfolios in
Fund Complex
Overseen by
Trustee | Other Directorships
Held by Trustee |
| | | | | | |
| | David H. Chow
1957 | MainStay Funds: Trustee since 2016, Advisory Board Member (June 2015 to December 2015);MainStay Funds Trust:
Trustee since January 2016, Advisory Board Member (June 2015 to December 2015) | Founder and CEO, DanCourt Management, LLC since 1999 | 78 | MainStay VP Funds Trust: Trustee since January 2016, Advisory Board Member (June 2015 to December 2015) (31 portfolios);
MainStay MacKay DefinedTerm Municipal Opportunities Fund: Trustee since January 2016, Advisory Board Member (June 2015 to December 2015);
MainStay CBRE Global Infrastructure Megatrends Fund: Trustee since June 2021; VanEck Vectors Group of Exchange-Traded Funds: Independent Chairman of the Board of Trustees since 2008 and Trustee since 2006 (56 portfolios); and Berea College of Kentucky: Trustee since 2009, Chair of the Investment Committee since 2018 |
| | Susan B. Kerley
1951 | MainStay Funds: Chairman since 2017 and Trustee since 2007;MainStay Funds Trust:
Chairman since 2017 and Trustee since 1990** | President, Strategic Management Advisors LLC since 1990 | 78 | MainStay VP Funds Trust: Chairman since January 2017 and Trustee since 2007 (31 portfolios)**;
MainStay MacKay DefinedTerm Municipal Opportunities Fund: Chairman since 2017 and Trustee since 2011;
MainStay CBRE Global Infrastructure Megatrends Fund: Trustee since June 2021; and Legg Mason Partners Funds: Trustee since 1991 (45 portfolios) |
| | Alan R. Latshaw
1951 | MainStay Funds: Trustee since 2006;MainStay Funds Trust:
Trustee since 2007*** | Retired; Partner, Ernst & Young LLP (2002 to 2003); Partner, Arthur Andersen LLP (1989 to 2002); Consultant to the MainStay Funds Audit and Compliance Committee (2004 to 2006) | 78 | MainStay VP Funds Trust: Trustee since 2007 (31 portfolios)**;
MainStay MacKay DefinedTerm Municipal Opportunities Fund: Trustee since 2011; and
MainStay CBRE Global Infrastructure Megatrends Fund: Trustee since June 2021 |
| 34 | MainStay Winslow Large Cap Growth Fund |
| | Name and
Year of Birth | Term of Office,
Position(s) Held and
Length of Service | Principal Occupation(s)
During Past Five Years | Number of
Portfolios in
Fund Complex
Overseen by
Trustee | Other Directorships
Held by Trustee |
| | | | | | |
| | Karen Hammond
1956 | MainStay Funds: Trustee since December 2021, Advisory Board Member (June 2021 to December 2021);MainStay Funds Trust:
Trustee since December 2021, Advisory Board Member (June 2021 to December 2021)
| Retired, Managing Director, Devonshire Investors (2007 to 2013); Senior Vice President, Fidelity Management & Research Co. (2005 to 2007); Senior Vice President and Corporate Treasurer, FMR Corp. (2003 to 2005); Chief Operating Officer, Fidelity Investments Japan (2001 to 2003) | 78 | MainStay VP Funds Trust: Trustee since December 2021, Advisory Board Member (June 2021 to December 2021) (31 Portfolios);
MainStay MacKay DefinedTerm Municipal Opportunities Fund: Trustee since December 2021, Advisory Board Member (June 2021 to December 2021);
MainStay CBRE Global Infrastructure Megatrends Fund: Trustee since December 2021, Advisory Board Member (June 2021 to December 2021);
Two Harbors Investment Corp.: Director since 2018;
Rhode Island State Investment Commission: Member since 2017; and
Blue Cross Blue Shield of Rhode Island: Director since 2019 |
| | Jacques P. Perold
1958 | MainStay Funds: Trustee since 2016, Advisory Board Member (June 2015 toDecember 2015);MainStay Funds Trust:
Trustee since January 2016, Advisory Board Member (June 2015 to December 2015) | Founder and Chief Executive Officer, CapShift Advisors LLC (since 2018); President, Fidelity Management & Research Company (2009 to 2014); President and Chief Investment Officer, Geode Capital Management, LLC (2001 to 2009) | 78 | MainStay VP Funds Trust: Trustee since January 2016, Advisory Board Member (June 2015 to December 2015) (31 portfolios);
MainStay MacKay DefinedTerm Municipal Opportunities Fund: Trustee since January 2016, Advisory Board Member (June 2015 to December 2015);
MainStay CBRE Global Infrastructure Megatrends Fund: Trustee since June 2021; Partners in Health: Trustee since 2019; Allstate Corporation: Director since 2015; and MSCI Inc.: Director since 2017 |
| | Richard S. Trutanic
1952 | MainStay Funds: Trustee since 1994;MainStay Funds Trust:
Trustee since 2007*** | Chairman and Chief Executive Officer, Somerset & Company (financial advisory firm) since 2004; Managing Director, The Carlyle Group (private investment firm) (2002 to 2004); Senior Managing Director, Partner and Board Member, Groupe Arnault S.A. (private investment firm) (1999 to 2002) | 78 | MainStay VP Funds Trust: Trustee since 2007 (31 portfolios)**;
MainStay MacKay DefinedTerm Municipal Opportunities Fund: Trustee since 2011; and MainStay CBRE Global Infrastructure Megatrends Fund: Trustee since June 2021 |
| ** | Includes prior service as a Director of MainStay VP Series Fund, Inc., the predecessor to MainStay VP Funds Trust. |
| *** | Includes prior service as a Director/Trustee of certain predecessor entities to MainStay Funds Trust. |
Board of Trustees and Officers (Unaudited) (continued)
| | Name and
Year of Birth | Position(s) Held and
Length of Service | Principal Occupation(s)
During Past Five Years | |
| | | | | |
| | Kirk C. Lehneis
1974 | President, MainStay Funds, MainStay Funds Trust since 2017 | Chief Operating Officer and Senior Managing Director (since 2016), New York Life Investment Management LLC and New York Life Investment Management Holdings LLC; Member of the Board of Managers (since 2017) and Senior Managing Director (since 2018), NYLIFE Distributors LLC; Chairman of the Board and Senior Managing Director, NYLIM Service Company LLC (since 2017); Trustee, President and Principal Executive Officer of IndexIQ Trust, IndexIQ ETF Trust and IndexIQ Active ETF Trust (since January 2018); President, MainStay CBRE Global Infrastructure Megatrends Fund (since 2021), MainStay MacKay DefinedTerm Municipal Opportunities Fund and MainStay VP Funds Trust (since 2017); Senior Managing Director, Global Product Development (From 2015-2016); Managing Director, Product Development (2010 to 2015), New York Life Investment Management LLC | |
| | Jack R. Benintende
1964 | Treasurer and Principal Financial and Accounting Officer, MainStay Funds (since 2007), MainStay Funds Trust (since 2009) | Managing Director, New York Life Investment Management LLC (since 2007); Treasurer and Principal Financial and Accounting Officer, MainStay CBRE Global Infrastructure Megatrends Fund (since 2021), MainStay MacKay DefinedTerm Municipal Opportunities Fund (since 2011) and MainStay VP Funds Trust (since 2007)** and Assistant Treasurer, New York Life Investment Management Holdings LLC (2008 to 2012) | |
| | J. Kevin Gao
1967 | Secretary and Chief Legal Officer, MainStay Funds and MainStay Funds Trust (since 2010) | Managing Director and Associate General Counsel, New York Life Investment Management LLC (since 2010); Secretary and Chief Legal Officer and MainStay CBRE Global Infrastructure Megatrends Fund (since 2021), MainStay MacKay DefinedTerm Municipal Opportunities Fund (since 2011) and MainStay VP Funds Trust (since 2010)** | |
| | Scott T. Harrington
1959 | Vice President— Administration, MainStay Funds (since 2009), MainStay Funds Trust (since 2009) | Managing Director, New York Life Investment Management LLC (including predecessor advisory organizations) (since 2000); Member of the Board of Directors, New York Life Trust Company (since 2009); Vice President—Administration, MainStay CBRE Global Infrastructure Megatrends Fund (since 2021), MainStay MacKay DefinedTerm Municipal Opportunities Fund (since 2011) and MainStay VP Funds Trust (since 2005)** | |
| | Kevin M. Gleason
1967 | Vice President and Chief Compliance Officer, MainStay Funds and MainStay Funds Trust (since June 2022) | Vice President and Chief Compliance Officer, IndexIQ, IndexIQ ETF Trust and Index IQ Active ETF Trust (since June 2022); Vice President and Chief Compliance Officer, MainStay CBRE Global Infrastructure Megatrends Fund, MainStay VP Funds Trust and MainStay MacKay DefinedTerm Municipal Opportunities Fund (since June 2022); Senior Vice President, Voya Investment Management and Chief Compliance Officer, Voya Family of Funds (2012-2022) | |
| * | The officers listed above are considered to be “interested persons” of the MainStay Group of Funds, MainStay VP Funds Trust, MainStay CBRE Global Infrastructure Megatrends Fund and MainStay MacKay DefinedTerm Municipal Opportunities Fund within the meaning of the 1940 Act because of their affiliation with the MainStay Group of Funds, New York Life Insurance Company and/or its affiliates, including New York Life Investment Management LLC, NYLIM Service Company LLC, NYLIFE Securities LLC and/or NYLIFE Distributors LLC, as described in detail in the column captioned “Principal Occupation(s) During Past Five Years.” Officers are elected annually by the Board. |
| ** | Includes prior service as an Officer of MainStay VP Series Fund, Inc., the predecessor to MainStay VP Funds Trust. |
Officers of the Trust (Who are not Trustees)*
| 36 | MainStay Winslow Large Cap Growth Fund |
This page intentionally left blank.
This page intentionally left blank.
Equity
U.S. Equity
MainStay Epoch U.S. Equity Yield Fund
MainStay S&P 500 Index Fund1
MainStay Winslow Large Cap Growth Fund
MainStay WMC Enduring Capital Fund
MainStay WMC Growth Fund
MainStay WMC Small Companies Fund
MainStay WMC Value Fund
International Equity
MainStay Epoch International Choice Fund
MainStay MacKay International Equity Fund
MainStay WMC International Research Equity Fund
Emerging Markets Equity
MainStay Candriam Emerging Markets Equity Fund
Global Equity
MainStay Epoch Capital Growth Fund
MainStay Epoch Global Equity Yield Fund
Fixed Income
Taxable Income
MainStay Candriam Emerging Markets Debt Fund
MainStay Floating Rate Fund
MainStay MacKay High Yield Corporate Bond Fund
MainStay MacKay Short Duration High Yield Fund
MainStay MacKay Strategic Bond Fund
MainStay MacKay Total Return Bond Fund
MainStay MacKay U.S. Infrastructure Bond Fund
MainStay Short Term Bond Fund
Tax-Exempt Income
MainStay MacKay California Tax Free Opportunities Fund2
MainStay MacKay High Yield Municipal Bond Fund
MainStay MacKay New York Tax Free Opportunities Fund3
MainStay MacKay Short Term Municipal Fund
MainStay MacKay Strategic Municipal Allocation Fund
MainStay MacKay Tax Free Bond Fund
Money Market
MainStay Money Market Fund
Mixed Asset
MainStay Balanced Fund
MainStay Income Builder Fund
MainStay MacKay Convertible Fund
Speciality
MainStay CBRE Global Infrastructure Fund
MainStay CBRE Real Estate Fund
MainStay Cushing MLP Premier Fund
Asset Allocation
MainStay Conservative Allocation Fund
MainStay Conservative ETF Allocation Fund
MainStay Defensive ETF Allocation Fund
MainStay Equity Allocation Fund
MainStay Equity ETF Allocation Fund
MainStay ESG Multi-Asset Allocation Fund
MainStay Growth Allocation Fund
MainStay Growth ETF Allocation Fund
MainStay Moderate Allocation Fund
MainStay Moderate ETF Allocation Fund
Manager
New York Life Investment Management LLC
New York, New York
Subadvisors
Candriam4
Strassen, Luxembourg
CBRE Investment Management Listed Real Assets LLC
Radnor, Pennsylvania
Cushing Asset Management, LP
Dallas, Texas
Epoch Investment Partners, Inc.
New York, New York
MacKay Shields LLC4
New York, New York
NYL Investors LLC4
New York, New York
Wellington Management Company LLP
Boston, Massachusetts
Winslow Capital Management, LLC
Minneapolis, Minnesota
Legal Counsel
Dechert LLP
Washington, District of Columbia
Independent Registered Public Accounting Firm
KPMG LLP
Philadelphia, Pennsylvania
Distributor
NYLIFE Distributors LLC4
Jersey City, New Jersey
Custodian
JPMorgan Chase Bank, N.A.
New York, New York
1.
Prior to February 28, 2022, the Fund's name was MainStay MacKay S&P 500 Index Fund.
| 2. | This Fund is registered for sale in AZ, CA, NV, OR, TX, UT, WA and MI (Class A and Class I shares only), and CO, FL, GA, HI, ID, MA, MD, NH, NJ and NY (Class I shares only). |
| 3. | This Fund is registered for sale in CA, CT, DE, FL, MA, NJ, NY and VT. |
| 4. | An affiliate of New York Life Investment Management LLC. |
Not part of the Annual Report
For more information
800-624-6782
newyorklifeinvestments.com
“New York Life Investments” is both a service mark, and the common trade name, of certain investment advisors affiliated with New York Life Insurance Company. The MainStay Funds® are managed by New York Life Investment Management LLC and distributed by NYLIFE Distributors LLC, 30 Hudson Street, Jersey City, NJ 07302, a wholly owned subsidiary of New York Life Insurance Company. NYLIFE Distributors LLC is a Member FINRA/SIPC.
©2022 NYLIFE Distributors LLC. All rights reserved.
| 5013907.2MS229-22 | MSLG11-12/22 |
(NYLIM) NL221
MainStay WMC Enduring Capital Fund
Message from the President and Annual Report
October 31, 2022
Sign up for e-delivery of your shareholder reports. For full details on e-delivery, including who can participate and what you can receive via e-delivery,
please log in to newyorklifeinvestments.com/accounts.
| Not FDIC/NCUA Insured | Not a Deposit | May Lose Value | No Bank Guarantee | Not Insured by Any Government Agency |
This page intentionally left blank
Message from the President
A series of economic and geopolitical challenges undermined equity and fixed-income markets during the 12-month reporting period ended October 31, 2022. Stocks and bonds alike trended lower in the face of sharply rising interest rates, increasing inflationary pressures, slowing economic growth and Russia’s invasion of Ukraine.
The reporting period began on a mixed note, with concerns about the spreading Omicron variant of the COVID-19 virus and increasingly hawkish statements from the U.S. Federal Reserve (the “Fed”) regarding mounting inflation, countered by bullish sentiment stemming from U.S. economic growth and strong corporate earnings. In January 2022, markets turned decisively negative as comments from the Fed raised the likelihood of rate hikes as early as March, and Russia issued increasingly aggressive threats toward Ukraine. The onset of Russia’s invasion in February exacerbated global inflationary pressures while increasing investor uncertainty. Domestic supply shortages, international trade imbalances and rising inflation caused GDP (gross domestic product) to contract in the first and second quarters of the year, although employment and consumer spending proved resilient. Prices for petroleum surged to multi-year highs, while many key agricultural chemicals and industrial metals climbed as well. Accelerating inflationary forces prompted the Fed to implement its most aggressive interest rate increases since the 1980s with a series of five sharp rate hikes, raising the federal funds rate from a range of 0.00% to 0.25% in March to 3.00% to 3.25% in September, with additional rate hikes expected before the end of the year. International central banks generally followed suit, raising rates by varying degrees in efforts to curb local inflation, although most increases remained significantly more modest than those in the United States. Relatively high U.S. interest rates and risk-averse international sentiment pushed U.S. dollar values higher compared to most other currencies, with the ensuing negative impact on global prices for food, fuel and other key, U.S.-dollar-denominated products.
The effects of these interrelated challenges were felt throughout U.S. and international financial markets. The S&P 500® Index, a widely regarded benchmark of U.S. market performance, declined by more than 14% during the reporting period. Although the energy sector generated strong gains, bolstered by elevated oil and gas prices, most other industry areas recorded losses. The more cyclical and growth-oriented sectors of consumer discretionary, real estate and information technology delivered the
weakest returns, while the traditionally defensive and value-oriented consumer staples, utilities and health care sectors outperformed. International stocks lagged compared to their U.S. counterparts, with some emerging markets, such as China, suffering particularly steep losses. A few markets, however, including Brazil, Mexico and the United Arab Emirates, ended the reporting period with little change. Fixed-income markets saw bond prices broadly decline as yields rose along with interest rates. Short-term yields rose faster than long-term yields, producing a yield curve inversion from July through the end of the reporting period, with long-term rates remaining below short-term rates. While floating-rate instruments, which feature variable interest rates that allow investors to benefit from a rising rate environment, provided a degree of insulation from inflation-driven trends, they were not immune to the market’s widespread declines.
While the Fed acknowledges the costs of rising rates in terms of weaker GDP growth and unsettled financial markets over the short term, its primary focus continues to be the longer-term economic impact of inflation. With the latest figures as of the date of this report showing that inflation remains above 8%, versus a target rate of just 2%, the Fed clearly has a distance yet to go, making further rate increases and market volatility more likely in the coming months. The question remains as to whether the Fed and other central banks will manage a so-called “soft landing,” curbing inflation while avoiding a persistent economic slowdown. If they prove successful, we expect that favorable inflation trends and increasingly attractive valuations in both equity and bond markets should eventually translate into sustainable improvements in the investment environment.
Whatever actions the Fed takes and however financial markets react, as a MainStay investor, you can depend on us to continue providing the insight, expertise and service that have long defined New York Life Investments. Thank you for trusting us to help you meet your investment needs.
Sincerely,
Kirk C. Lehneis
President
The opinions expressed are as of the date of this report and are subject to change. There is no guarantee that any forecast made will come to pass. This material does not constitute investment advice and is not intended as an endorsement of any specific investment. Past performance is no guarantee of future results.
Not part of the Annual Report
Investors should refer to the Fund’s Summary Prospectus and/or Prospectus and consider the Fund’s investment objectives, strategies, risks, charges and expenses carefully before investing. The Summary Prospectus and/or Prospectus contain this and other information about the Fund. You may obtain copies of the Fund’s Summary Prospectus, Prospectus and Statement of Additional Information, which includes information about The MainStay Funds' Trustees, free of charge, upon request, by calling toll-free 800-624-6782, by writing to NYLIFE Distributors LLC, Attn: MainStay Marketing Department, 30 Hudson Street, Jersey City, NJ 07302 or by sending an e-mail to MainStayShareholderServices@nylim.com. These documents are also available via the MainStay Funds’ website at newyorklifeinvestments.com. Please read the Fund’s Summary Prospectus and/or Prospectus carefully before investing.
Investment and Performance Comparison (Unaudited)
Performance data quoted represents past performance. Past performance is no guarantee of future results. Because of market volatility and other factors, current performance may be lower or higher than the figures shown. Investment return and principal value will fluctuate, and as a result, when shares are redeemed, they may be worth more or less than their original cost. The graph below depicts the historical performance of Class I shares of the Fund. Performance will vary from class to class based on differences in class-specific expenses and sales charges. For performance information current to the most recent month-end, please call 800-624-6782 or visit newyorklifeinvestments.com.
The performance table and graph do not reflect the deduction of taxes that a shareholder would pay on distributions or Fund share redemptions. Total returns reflect maximum applicable sales charges as indicated in the table below, if any, changes in share price, and reinvestment of dividend and capital gain distributions. The graph assumes the initial investment amount shown below and reflects the deduction of all sales charges that would have applied for the period of investment. Performance figures may reflect certain fee waivers and/or expense limitations, without which total returns may have been lower. For more information on share classes and current fee waivers and/or expense limitations (if any), please refer to the Notes to Financial Statements.
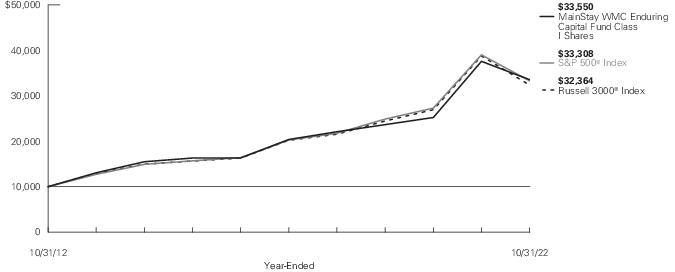
| Average Annual Total Returns for the Year-Ended October 31, 2022 |
| Class | Sales Charge | | Inception
Date1 | One
Year | Five
Years | Ten Years
or Since
Inception | Gross
Expense
Ratio2 |
| Class A Shares | Maximum 5.5% Initial Sales Charge | With sales charges | 6/1/1998 | -15.86% | 8.95% | 11.95% | 0.91% |
| | | Excluding sales charges | | -10.96 | 10.19 | 12.58 | 0.91 |
| Investor Class Shares3 | Maximum 5% Initial Sales Charge | With sales charges | 2/28/2008 | -15.57 | 8.68 | 11.64 | 1.17 |
| | | Excluding sales charges | | -11.13 | 9.91 | 12.28 | 1.17 |
| Class B Shares4 | Maximum 5% CDSC | With sales charges | 6/1/1998 | -15.80 | 8.81 | 11.45 | 1.92 |
| | if Redeemed Within the First Six Years of Purchase | Excluding sales charges | | -11.79 | 9.10 | 11.45 | 1.92 |
| Class C Shares | Maximum 1% CDSC | With sales charges | 9/1/1998 | -12.60 | 9.09 | 11.44 | 1.92 |
| | if Redeemed Within One Year of Purchase | Excluding sales charges | | -11.80 | 9.09 | 11.44 | 1.92 |
| Class I Shares | No Sales Charge | | 12/28/2004 | -10.72 | 10.48 | 12.87 | 0.66 |
| Class R3 Shares | No Sales Charge | | 2/29/2016 | -11.29 | 9.79 | 12.06 | 1.26 |
| Class R6 Shares | No Sales Charge | | 4/26/2021 | -10.69 | N/A | -0.05 | 0.61 |
| 1. | Effective March 5, 2021, the Fund replaced its subadvisor and modified its principal investment strategies. The past performance in the graph and table prior to that date reflects the Fund's prior subadvisor and principal investment strategies. |
| 2. | The gross expense ratios presented reflect the Fund’s “Total Annual Fund Operating Expenses” from the most recent Prospectus, as supplemented, and may differ from other expense ratios disclosed in this report. |
| 3. | Prior to June 30, 2020, the maximum initial sales charge was 5.5%, which is reflected in the applicable average annual total return figures shown. |
| 4. | Class B shares are closed to all new purchases as well as additional investments by existing Class B shareholders. |
The footnotes on the next page are an integral part of the table and graph and should be carefully read in conjunction with them.
| Benchmark Performance* | One
Year | Five
Years | Ten
Years |
| S&P 500® Index1 | -14.61% | 10.44% | 12.79% |
| Russell 3000® Index2 | -16.52 | 9.87 | 12.46 |
| Morningstar Large Blend Category Average3 | -14.69 | 8.51 | 10.81 |
| * | Returns for indices reflect no deductions for fees, expenses or taxes, except for foreign withholding taxes where applicable. Results assume reinvestment of all dividends and capital gains. An investment cannot be made directly in an index. |
| 1. | The S&P 500® Index is the Fund's primary benchmark. S&P 500® is a trademark of The McGraw-Hill Companies, Inc. The S&P 500® Index is widely regarded as the standard index for measuring large-cap U.S. stock market performance. |
| 2. | The Russell 3000® Index is the Fund's secondary benchmark. The Russell 3000® Index measures the performance of the largest 3,000 U.S. companies representing approximately 98% of the investable U.S. equity market. |
| 3. | The Morningstar Large Blend Category Average is representative of funds that represent the overall U.S. stock market in size, growth rates and price. Stocks in the top 70% of the capitalization of the U.S. equity market are defined as large cap. The blend style is assigned to portfolios where neither growth nor value characteristics predominate. These portfolios tend to invest across the spectrum of U.S. industries, and owing to their broad exposure, the portfolios' returns are often similar to those of the S&P 500® Index. Results are based on average total returns of similar funds with all dividends and capital gain distributions reinvested. |
The footnotes on the preceding page are an integral part of the table and graph and should be carefully read in conjunction with them.
| 6 | MainStay WMC Enduring Capital Fund |
Cost in Dollars of a $1,000 Investment in MainStay WMC Enduring Capital Fund (Unaudited)
The example below is intended to describe the fees and expenses borne by shareholders during the six-month period from May 1, 2022 to October 31, 2022, and the impact of those costs on your investment.
Example
As a shareholder of the Fund you incur two types of costs: (1) transaction costs, including exchange fees and sales charges (loads) on purchases (as applicable), and (2) ongoing costs, including management fees, distribution and/or service (12b-1) fees and other Fund expenses (as applicable). This example is intended to help you understand your ongoing costs (in dollars) of investing in the Fund and to compare these costs with the ongoing costs of investing in other mutual funds. The example is based on an investment of $1,000 made at the beginning of the six-month period and held for the entire period from May 1, 2022 to October 31, 2022.
This example illustrates your Fund’s ongoing costs in two ways:
Actual Expenses
The second and third data columns in the table below provide information about actual account values and actual expenses. You may use the information in these columns, together with the amount you invested, to estimate the expenses that you paid during the six months ended October 31, 2022. Simply divide your account value by $1,000 (for example, an
$8,600 account value divided by $1,000 = 8.6), then multiply the result by the number under the heading entitled “Expenses Paid During Period” to estimate the expenses you paid on your account during this period.
Hypothetical Example for Comparison Purposes
The fourth and fifth data columns in the table below provide information about hypothetical account values and hypothetical expenses based on the Fund’s actual expense ratio and an assumed rate of return of 5% per year before expenses, which is not the Fund’s actual return. The hypothetical account values and expenses may not be used to estimate the actual ending account balances or expenses you paid for the six-month period shown. You may use this information to compare the ongoing costs of investing in the Fund with the ongoing costs of investing in other mutual funds. To do so, compare this 5% hypothetical example with the 5% hypothetical examples that appear in the shareholder reports of the other mutual funds.
Please note that the expenses shown in the table are meant to highlight your ongoing costs only and do not reflect any transactional costs, such as exchange fees or sales charges (loads). Therefore, the fourth and fifth data columns of the table are useful in comparing ongoing costs only and will not help you determine the relative total costs of owning different funds. In addition, if these transactional costs were included, your costs would have been higher.
| Share Class | Beginning
Account
Value
5/1/22 | Ending Account
Value (Based
on Actual
Returns and
Expenses)
10/31/22 | Expenses
Paid
During
Period1 | Ending Account
Value (Based
on Hypothetical
5% Annualized
Return and
Actual Expenses)
10/31/22 | Expenses
Paid
During
Period1 | Net Expense
Ratio
During
Period2 |
| Class A Shares | $1,000.00 | $973.10 | $4.77 | $1,020.37 | $4.89 | 0.96% |
| Investor Class Shares | $1,000.00 | $972.10 | $5.52 | $1,019.61 | $5.65 | 1.11% |
| Class B Shares | $1,000.00 | $968.50 | $9.23 | $1,015.83 | $9.45 | 1.86% |
| Class C Shares | $1,000.00 | $968.40 | $9.23 | $1,015.83 | $9.45 | 1.86% |
| Class I Shares | $1,000.00 | $974.20 | $3.53 | $1,021.63 | $3.62 | 0.71% |
| Class R3 Shares | $1,000.00 | $971.20 | $6.51 | $1,018.60 | $6.67 | 1.31% |
| Class R6 Shares | $1,000.00 | $974.50 | $3.23 | $1,021.93 | $3.31 | 0.65% |
| 1. | Expenses are equal to the Fund’s annualized expense ratio of each class multiplied by the average account value over the period, divided by 365 and multiplied by 184 (to reflect the six-month period). The table above represents the actual expenses incurred during the six-month period. In addition to the fees and expenses which the Fund bears directly, it also indirectly bears a pro rata share of the fees and expenses of the underlying funds in which it invests. Such indirect expenses are not included in the above-reported expense figures. |
| 2. | Expenses are equal to the Fund's annualized expense ratio to reflect the six-month period. |
Industry Composition as of October 31, 2022 (Unaudited)
| Machinery | 13.8% |
| Commercial Services & Supplies | 10.4 |
| Insurance | 8.4 |
| Road & Rail | 6.9 |
| Capital Markets | 6.8 |
| Chemicals | 6.5 |
| Banks | 6.0 |
| Equity Real Estate Investment Trusts | 5.6 |
| Software | 4.3 |
| Diversified Financial Services | 3.7 |
| Food & Staples Retailing | 3.6 |
| Air Freight & Logistics | 3.4 |
| Health Care Providers & Services | 3.4% |
| Life Sciences Tools & Services | 3.3 |
| Household Durables | 3.3 |
| Electric Utilities | 3.0 |
| Trading Companies & Distributors | 3.0 |
| Media | 2.5 |
| Containers & Packaging | 2.0 |
| Short–Term Investment | 0.0‡ |
| Other Assets, Less Liabilities | 0.1 |
| | 100.0% |
| ‡ | Less than one–tenth of a percent. |
See Portfolio of Investments beginning on page 11 for specific holdings within these categories. The Fund's holdings are subject to change.
Top Ten Holdings and/or Issuers Held as of October 31, 2022 (excluding short-term investments) (Unaudited)
| 1. | Progressive Corp. (The) |
| 2. | Constellation Software, Inc. |
| 3. | PACCAR, Inc. |
| 4. | Charles Schwab Corp. (The) |
| 5. | Waste Connections, Inc. |
| 6. | Markel Corp. |
| 7. | M&T Bank Corp. |
| 8. | Berkshire Hathaway, Inc., Class B |
| 9. | Costco Wholesale Corp. |
| 10. | Linde plc |
| 8 | MainStay WMC Enduring Capital Fund |
Portfolio Management Discussion and Analysis (Unaudited)
Questions answered by portfolio manager Mark A. Whitaker, CFA, of Wellington Management Company LLP, the Fund’s Subadvisor.
How did MainStay WMC Enduring Capital Fund perform relative to its benchmarks and peer group during the 12 months ended October 31, 2022?
For the 12 months ended October 31, 2022, Class I shares of MainStay WMC Enduring Capital Fund returned −10.72%, outperforming the −14.61% return of the Fund’s primary benchmark, the S&P 500® Index (the "Index"), and the −16.52% return of the Fund’s secondary benchmark, the Russell 3000® Index. Over the same period, Class I shares also outperformed the −14.69% return of the Morningstar Large Blend Category Average.1
What factors affected the Fund’s relative performance during the reporting period?
Although the Fund delivered negative returns for the reporting period, it outperformed the S&P 500® Index, largely due to rising interest rates, increased inflation and geopolitical conflict, all of which led to an increase in market volatility. The Fund's underweight position in the more cyclical areas of the market was beneficial to relative returns.
From an attribution perspective, sector allocation, a result of our bottom-up stock selection process, was the primary driver of relative outperformance. Allocation effect was driven by the Fund’s underweight position in communication services and overweight exposure to industrials. These positive positions were partially offset by the Fund’s lack of exposure to energy and the Fund’s underweight allocation to health care. Overall, security selection also made a positive contribution to relative results. (Contributions take weightings and total returns into account.) However, strong selection in financials and consumer discretionary was partially offset by weaker selection in materials and communication services.
During the reporting period, which sectors were the strongest positive contributors to the Fund’s relative performance, and which sectors were particularly weak?
During the reporting period, the industrials, financials and consumer discretionary sectors provided the strongest positive contributions to the Fund’s performance relative to the S&P 500® Index. Over the same period, the energy, materials and health care sectors detracted the most from the Fund’s relative performance.
During the reporting period, which individual stocks made the strongest positive contributions to the Fund’s absolute performance and which stocks detracted the most?
The individual stocks that made the strongest contributions to the Fund’s absolute performance included Progressive and UnitedHealth Group. Shares of insurer Progressive rose during the reporting period on particularly strong performance in February 2022, as the company reported that net premiums increased 20% from the prior year. In May, the board renewed the company’s authorization to repurchase up to 25 million of its common shares. Shares of UnitedHealth Group, the largest managed-care company in the United States, rose following the company's announcement of third quarter 2022 results slightly ahead of consensus, as well as better-than-expected guidance. The company also provided investors with a constructive outlook for a recovery in commercial enrollments in 2022 and highlighted expectations for an accelerated shift to value-based care.
The holdings that detracted most significantly from absolute performance were Cable One and First Republic Bank. Shares of Cable One, a U.S.-based cable and broadband communications provider, declined after the company reported second quarter 2022 results that fell short of Wall Street expectations. Shares of First Republic Bank declined over the period amid several CEO changes.
What were some of the Fund’s largest purchases and sales during the reporting period?
The Fund did not initiate or eliminate any positions during the reporting period. The Fund’s largest position increase was in Cable One. We continue to favor the company as we believe management has demonstrated a flexible and opportunistic approach to capital allocation as the business environment changes, specifically shifting toward share repurchase and away from acquisitions. We trimmed the Fund’s position in Costco, a large wholesale retailer, due to valuation.
How did the Fund’s sector and/or country weightings change during the reporting period?
The largest increases in the Fund’s weightings during the reporting period were in the communication services, information technology and financials sectors, while the largest decreases were in the health care, energy and consumer staples sectors.
| 1. | See page 5 for other share class returns, which may be higher or lower than Class I share returns. See page 6 for more information on benchmark and peer group returns. |
How was the Fund positioned at the end of the reporting period?
As of October 31, 2022, the Fund held its largest overweight exposures relative to the S&P 500® Index in the industrials, financials and materials sectors. As of the same date, the Fund’s most significantly underweight exposures were to information technology, health care and consumer discretionary.
The opinions expressed are those of the portfolio manager as of the date of this report and are subject to change. There is no guarantee that any forecasts will come to pass. This material does not constitute investment advice and is not intended as an endorsement of any specific investment.
| 10 | MainStay WMC Enduring Capital Fund |
Portfolio of Investments October 31, 2022†
| | Shares | Value |
| Common Stocks 99.9% |
| Air Freight & Logistics 3.4% |
| Expeditors International of Washington, Inc. | 179,300 | $ 17,544,505 |
| Banks 6.0% |
| First Republic Bank | 96,010 | 11,530,801 |
| M&T Bank Corp. | 116,740 | 19,655,514 |
| | | 31,186,315 |
| Capital Markets 6.8% |
| Brookfield Asset Management, Inc., Class A | 353,908 | 14,018,296 |
| Charles Schwab Corp. (The) | 263,270 | 20,974,721 |
| | | 34,993,017 |
| Chemicals 6.5% |
| Linde plc | 62,360 | 18,542,746 |
| Sherwin-Williams Co. (The) | 66,244 | 14,906,887 |
| | | 33,449,633 |
| Commercial Services & Supplies 10.4% |
| Cintas Corp. | 39,254 | 16,783,048 |
| Copart, Inc. (a) | 145,462 | 16,731,039 |
| Waste Connections, Inc. | 153,216 | 20,210,722 |
| | | 53,724,809 |
| Containers & Packaging 2.0% |
| Ball Corp. | 210,273 | 10,385,383 |
| Diversified Financial Services 3.7% |
| Berkshire Hathaway, Inc., Class B (a) | 65,131 | 19,219,507 |
| Electric Utilities 3.0% |
| NextEra Energy, Inc. | 202,767 | 15,714,442 |
| Equity Real Estate Investment Trusts 5.6% |
| American Tower Corp. | 69,983 | 14,499,778 |
| Public Storage | 45,928 | 14,226,198 |
| | | 28,725,976 |
| Food & Staples Retailing 3.6% |
| Costco Wholesale Corp. | 36,992 | 18,551,488 |
| Health Care Providers & Services 3.4% |
| UnitedHealth Group, Inc. | 31,588 | 17,536,078 |
| Household Durables 3.3% |
| NVR, Inc. (a) | 3,973 | 16,836,581 |
| | Shares | | Value |
| |
| Insurance 8.4% |
| Brookfield Asset Management Reinsurance Partners Ltd., Class A (a) | 3,730 | | $ 147,689 |
| Markel Corp. (a) | 16,538 | | 19,946,482 |
| Progressive Corp. (The) | 180,670 | | 23,198,028 |
| | | | 43,292,199 |
| Life Sciences Tools & Services 3.3% |
| Danaher Corp. | 68,024 | | 17,119,600 |
| Machinery 13.8% |
| Deere & Co. | 41,003 | | 16,229,808 |
| Fortive Corp. | 224,736 | | 14,360,630 |
| IDEX Corp. | 83,203 | | 18,496,859 |
| PACCAR, Inc. | 230,042 | | 22,274,967 |
| | | | 71,362,264 |
| Media 2.5% |
| Cable One, Inc. | 15,191 | | 13,055,601 |
| Road & Rail 6.9% |
| Canadian National Railway Co. | 153,905 | | 18,233,396 |
| Old Dominion Freight Line, Inc. | 63,937 | | 17,557,100 |
| | | | 35,790,496 |
| Software 4.3% |
| Constellation Software, Inc. | 15,432 | | 22,313,901 |
| Trading Companies & Distributors 3.0% |
| Watsco, Inc. | 56,660 | | 15,352,594 |
Total Common Stocks
(Cost $484,450,530) | | | 516,154,389 |
| Short-Term Investment 0.0% ‡ |
| Affiliated Investment Company 0.0% ‡ |
| MainStay U.S. Government Liquidity Fund, 2.905% (b) | 147,921 | | 147,921 |
Total Short-Term Investment
(Cost $147,921) | | | 147,921 |
Total Investments
(Cost $484,598,451) | 99.9% | | 516,302,310 |
| Other Assets, Less Liabilities | 0.1 | | 571,817 |
| Net Assets | 100.0% | | $ 516,874,127 |
| † | Percentages indicated are based on Fund net assets. |
| ‡ | Less than one-tenth of a percent. |
| (a) | Non-income producing security. |
The notes to the financial statements are an integral part of, and should be read in conjunction with, the financial statements.
11
Portfolio of Investments October 31, 2022† (continued)
| (b) | Current yield as of October 31, 2022. |
Investments in Affiliates (in 000's)
Investments in issuers considered to be affiliate(s) of the Fund during the year ended October 31, 2022 for purposes of Section 2(a)(3) of the Investment Company Act of 1940, as amended, were as follows:
| Affiliated Investment Companies | Value,
Beginning
of Year | Purchases
at Cost | Proceeds
from
Sales | Net
Realized
Gain/(Loss)
on Sales | Change in
Unrealized
Appreciation/
(Depreciation) | Value,
End of
Year | Dividend
Income | Other
Distributions | Shares
End of
Year |
| MainStay U.S. Government Liquidity Fund | $ 2,386 | $ 54,961 | $ (57,199) | $ — | $ — | $ 148 | $ 12 | $ — | 148 |
The following is a summary of the fair valuations according to the inputs used as of October 31, 2022, for valuing the Fund’s assets:
| Description | Quoted
Prices in
Active
Markets for
Identical
Assets
(Level 1) | | Significant
Other
Observable
Inputs
(Level 2) | | Significant
Unobservable
Inputs
(Level 3) | | Total |
| Asset Valuation Inputs | | | | | | | |
| Investments in Securities (a) | | | | | | | |
| Common Stocks | $ 516,154,389 | | $ — | | $ — | | $ 516,154,389 |
| Short-Term Investment | | | | | | | |
| Affiliated Investment Company | 147,921 | | — | | — | | 147,921 |
| Total Investments in Securities | $ 516,302,310 | | $ — | | $ — | | $ 516,302,310 |
| (a) | For a complete listing of investments and their industries, see the Portfolio of Investments. |
The notes to the financial statements are an integral part of, and should be read in conjunction with, the financial statements.
| 12 | MainStay WMC Enduring Capital Fund |
Statement of Assets and Liabilities as of October 31, 2022
| Assets |
Investment in unaffiliated securities, at value
(identified cost $484,450,530) | $516,154,389 |
Investment in affiliated investment companies, at value
(identified cost $147,921) | 147,921 |
| Cash | 89,737 |
| Receivables: | |
| Investment securities sold | 759,360 |
| Fund shares sold | 343,142 |
| Dividends | 107,135 |
| Other assets | 43,785 |
| Total assets | 517,645,469 |
| Liabilities |
| Payables: | |
| Fund shares redeemed | 237,308 |
| Manager (See Note 3) | 232,085 |
| Shareholder communication | 123,791 |
| NYLIFE Distributors (See Note 3) | 66,894 |
| Transfer agent (See Note 3) | 53,525 |
| Professional fees | 29,965 |
| Custodian | 6,962 |
| Trustees | 650 |
| Securities lending | 26 |
| Accrued expenses | 20,136 |
| Total liabilities | 771,342 |
| Net assets | $516,874,127 |
| Composition of Net Assets |
| Shares of beneficial interest outstanding (par value of $.01 per share) unlimited number of shares authorized | $ 172,765 |
| Additional paid-in-capital | 464,244,297 |
| | 464,417,062 |
| Total distributable earnings (loss) | 52,457,065 |
| Net assets | $516,874,127 |
| Class A | |
| Net assets applicable to outstanding shares | $196,217,533 |
| Shares of beneficial interest outstanding | 6,538,400 |
| Net asset value per share outstanding | $ 30.01 |
| Maximum sales charge (5.50% of offering price) | 1.75 |
| Maximum offering price per share outstanding | $ 31.76 |
| Investor Class | |
| Net assets applicable to outstanding shares | $ 22,977,067 |
| Shares of beneficial interest outstanding | 766,751 |
| Net asset value per share outstanding | $ 29.97 |
| Maximum sales charge (5.00% of offering price) | 1.58 |
| Maximum offering price per share outstanding | $ 31.55 |
| Class B | |
| Net assets applicable to outstanding shares | $ 2,823,996 |
| Shares of beneficial interest outstanding | 106,928 |
| Net asset value and offering price per share outstanding | $ 26.41 |
| Class C | |
| Net assets applicable to outstanding shares | $ 23,500,347 |
| Shares of beneficial interest outstanding | 890,650 |
| Net asset value and offering price per share outstanding | $ 26.39 |
| Class I | |
| Net assets applicable to outstanding shares | $ 73,934,506 |
| Shares of beneficial interest outstanding | 2,444,901 |
| Net asset value and offering price per share outstanding | $ 30.24 |
| Class R3 | |
| Net assets applicable to outstanding shares | $ 560,523 |
| Shares of beneficial interest outstanding | 18,865 |
| Net asset value and offering price per share outstanding | $ 29.71 |
| Class R6 | |
| Net assets applicable to outstanding shares | $196,860,155 |
| Shares of beneficial interest outstanding | 6,510,006 |
| Net asset value and offering price per share outstanding | $ 30.24 |
The notes to the financial statements are an integral part of, and should be read in conjunction with, the financial statements.
13
Statement of Operations for the year ended October 31, 2022
| Investment Income (Loss) |
| Income | |
| Dividends-unaffiliated (net of foreign tax withholding of $116,606) | $ 6,628,083 |
| Dividends-affiliated | 11,772 |
| Securities lending, net | 1,928 |
| Total income | 6,641,783 |
| Expenses | |
| Manager (See Note 3) | 3,209,022 |
| Distribution/Service—Class A (See Note 3) | 525,825 |
| Distribution/Service—Investor Class (See Note 3) | 63,250 |
| Distribution/Service—Class B (See Note 3) | 38,883 |
| Distribution/Service—Class C (See Note 3) | 294,766 |
| Distribution/Service—Class R3 (See Note 3) | 2,280 |
| Transfer agent (See Note 3) | 344,547 |
| Shareholder communication | 156,485 |
| Professional fees | 140,028 |
| Registration | 132,081 |
| Custodian | 22,481 |
| Trustees | 3,110 |
| Shareholder service (See Note 3) | 456 |
| Miscellaneous | 16,289 |
| Total expenses | 4,949,503 |
| Net investment income (loss) | 1,692,280 |
| Realized and Unrealized Gain (Loss) |
| Net realized gain (loss) on: | |
| Unaffiliated investment transactions | 19,234,018 |
| Foreign currency transactions | (7,355) |
| Net realized gain (loss) | 19,226,663 |
| Net change in unrealized appreciation (depreciation) on unaffiliated investments | (87,315,486) |
| Net realized and unrealized gain (loss) | (68,088,823) |
| Net increase (decrease) in net assets resulting from operations | $(66,396,543) |
The notes to the financial statements are an integral part of, and should be read in conjunction with, the financial statements.
| 14 | MainStay WMC Enduring Capital Fund |
Statements of Changes in Net Assets
for the years ended October 31, 2022 and October 31, 2021
| | 2022 | 2021 |
| Increase (Decrease) in Net Assets |
| Operations: | | |
| Net investment income (loss) | $ 1,692,280 | $ 1,208,594 |
| Net realized gain (loss) | 19,226,663 | 73,433,638 |
| Net change in unrealized appreciation (depreciation) | (87,315,486) | 47,720,538 |
| Net increase (decrease) in net assets resulting from operations | (66,396,543) | 122,362,770 |
| Distributions to shareholders: | | |
| Class A | (19,185,374) | (592,297) |
| Investor Class | (2,404,448) | (96,995) |
| Class B | (453,565) | — |
| Class C | (3,325,977) | — |
| Class I | (10,230,592) | (399,948) |
| Class R3 | (40,016) | (1,131) |
| Class R6 | (22,407,486) | — |
| Total distributions to shareholders | (58,047,458) | (1,090,371) |
| Capital share transactions: | | |
| Net proceeds from sales of shares | 86,455,226 | 70,930,228 |
| Net asset value of shares issued in connection with the acquisition of MainStay Epoch U.S. All Cap Fund | — | 485,242,709 |
| Net asset value of shares issued in connection with the acquisition of MainStay MacKay U.S. Equity Opportunities Fund | — | 147,554,277 |
| Net asset value of shares issued to shareholders in reinvestment of distributions | 57,355,353 | 1,063,805 |
| Cost of shares redeemed | (201,267,040) | (253,450,057) |
| Increase (decrease) in net assets derived from capital share transactions | (57,456,461) | 451,340,962 |
| Net increase (decrease) in net assets | (181,900,462) | 572,613,361 |
| Net Assets |
| Beginning of year | 698,774,589 | 126,161,228 |
| End of year | $ 516,874,127 | $ 698,774,589 |
The notes to the financial statements are an integral part of, and should be read in conjunction with, the financial statements.
15
Financial Highlights selected per share data and ratios
| | Year Ended October 31, |
| Class A | 2022 | | 2021 | | 2020 | | 2019 | | 2018 |
| Net asset value at beginning of year | $ 36.76 | | $ 24.95 | | $ 24.92 | | $ 26.31 | | $ 24.56 |
| Net investment income (loss) (a) | 0.06 | | 0.06 | | 0.16 | | 0.26 | | 0.24 |
| Net realized and unrealized gain (loss) | (3.74) | | 11.99 | | 1.36 | | 1.28 | | 1.74 |
| Total from investment operations | (3.68) | | 12.05 | | 1.52 | | 1.54 | | 1.98 |
| Less distributions: | | | | | | | | | |
| From net investment income | (0.04) | | (0.24) | | (0.27) | | (0.22) | | (0.23) |
| From net realized gain on investments | (3.03) | | — | | (1.22) | | (2.71) | | — |
| Total distributions | (3.07) | | (0.24) | | (1.49) | | (2.93) | | (0.23) |
| Net asset value at end of year | $ 30.01 | | $ 36.76 | | $ 24.95 | | $ 24.92 | | $ 26.31 |
| Total investment return (b) | (10.96)% | | 48.53% | | 6.42% | | 6.80% | | 8.07% |
| Ratios (to average net assets)/Supplemental Data: | | | | | | | | | |
| Net investment income (loss) | 0.18% | | 0.19% | | 0.64% | | 1.08% | | 0.90% |
| Net expenses (c) | 0.94% | | 0.91% | | 0.99% | | 0.97% | | 0.97% |
| Portfolio turnover rate | 2% | | 24% | | 166% | | 164% | | 137% |
| Net assets at end of year (in 000’s) | $ 196,218 | | $ 228,700 | | $ 62,611 | | $ 63,814 | | $ 63,956 |
| (a) | Per share data based on average shares outstanding during the year. |
| (b) | Total investment return is calculated exclusive of sales charges and assumes the reinvestment of dividends and distributions. For periods of less than one year, total return is not annualized. |
| (c) | In addition to the fees and expenses which the Fund bears directly, it also indirectly bears a pro-rata share of the fees and expenses of the underlying funds in which it invests. Such indirect expenses are not included in the above expense ratios. |
| | Year Ended October 31, |
| Investor Class | 2022 | | 2021 | | 2020 | | 2019 | | 2018 |
| Net asset value at beginning of year | $ 36.73 | | $ 24.92 | | $ 24.90 | | $ 26.29 | | $ 24.53 |
| Net investment income (loss) (a) | 0.01 | | (0.01) | | 0.08 | | 0.20 | | 0.18 |
| Net realized and unrealized gain (loss) | (3.74) | | 11.98 | | 1.37 | | 1.27 | | 1.74 |
| Total from investment operations | (3.73) | | 11.97 | | 1.45 | | 1.47 | | 1.92 |
| Less distributions: | | | | | | | | | |
| From net investment income | — | | (0.16) | | (0.21) | | (0.15) | | (0.16) |
| From net realized gain on investments | (3.03) | | — | | (1.22) | | (2.71) | | — |
| Total distributions | (3.03) | | (0.16) | | (1.43) | | (2.86) | | (0.16) |
| Net asset value at end of year | $ 29.97 | | $ 36.73 | | $ 24.92 | | $ 24.90 | | $ 26.29 |
| Total investment return (b) | (11.13)% | | 48.22% | | 6.05% | | 6.51% | | 7.82% |
| Ratios (to average net assets)/Supplemental Data: | | | | | | | | | |
| Net investment income (loss) | 0.03% | | (0.02)% | | 0.35% | | 0.82% | | 0.68% |
| Net expenses (c) | 1.11% | | 1.19% | | 1.30% | | 1.23% | | 1.21% |
| Expenses (before waiver/reimbursement) (c) | 1.11% | | 1.19% | | 1.31% | | 1.27% | | 1.23% |
| Portfolio turnover rate | 2% | | 24% | | 166% | | 164% | | 137% |
| Net assets at end of year (in 000's) | $ 22,977 | | $ 29,293 | | $ 15,544 | | $ 17,203 | | $ 16,580 |
| (a) | Per share data based on average shares outstanding during the year. |
| (b) | Total investment return is calculated exclusive of sales charges and assumes the reinvestment of dividends and distributions. For periods of less than one year, total return is not annualized. |
| (c) | In addition to the fees and expenses which the Fund bears directly, it also indirectly bears a pro-rata share of the fees and expenses of the underlying funds in which it invests. Such indirect expenses are not included in the above expense ratios. |
The notes to the financial statements are an integral part of, and should be read in conjunction with, the financial statements.
| 16 | MainStay WMC Enduring Capital Fund |
Financial Highlights selected per share data and ratios
| | Year Ended October 31, |
| Class B | 2022 | | 2021 | | 2020 | | 2019 | | 2018 |
| Net asset value at beginning of year | $ 32.96 | | $ 22.40 | | $ 22.50 | | $ 24.04 | | $ 22.46 |
| Net investment income (loss) (a) | (0.21) | | (0.22) | | (0.08) | | 0.02 | | (0.02) |
| Net realized and unrealized gain (loss) | (3.31) | | 10.78 | | 1.22 | | 1.15 | | 1.60 |
| Total from investment operations | (3.52) | | 10.56 | | 1.14 | | 1.17 | | 1.58 |
| Less distributions: | | | | | | | | | |
| From net investment income | — | | — | | (0.02) | | — | | — |
| From net realized gain on investments | (3.03) | | — | | (1.22) | | (2.71) | | — |
| Total distributions | (3.03) | | — | | (1.24) | | (2.71) | | — |
| Net asset value at end of year | $ 26.41 | | $ 32.96 | | $ 22.40 | | $ 22.50 | | $ 24.04 |
| Total investment return (b) | (11.79)% | | 47.14%(c) | | 5.28% | | 5.71% | | 7.03% |
| Ratios (to average net assets)/Supplemental Data: | | | | | | | | | |
| Net investment income (loss) | (0.72)% | | (0.77)% | | (0.39)% | | 0.10% | | (0.07)% |
| Net expenses (d) | 1.86% | | 1.95% | | 2.05% | | 1.98% | | 1.96% |
| Expenses (before waiver/reimbursement) (d) | 1.86% | | 1.95% | | 2.06% | | 2.02% | | 1.98% |
| Portfolio turnover rate | 2% | | 24% | | 166% | | 164% | | 137% |
| Net assets at end of year (in 000’s) | $ 2,824 | | $ 5,007 | | $ 3,666 | | $ 4,718 | | $ 5,855 |
| (a) | Per share data based on average shares outstanding during the year. |
| (b) | Total investment return is calculated exclusive of sales charges and assumes the reinvestment of dividends and distributions. For periods of less than one year, total return is not annualized. |
| (c) | Total investment return may reflect adjustments to conform to generally accepted accounting principles. |
| (d) | In addition to the fees and expenses which the Fund bears directly, it also indirectly bears a pro-rata share of the fees and expenses of the underlying funds in which it invests. Such indirect expenses are not included in the above expense ratios. |
| | Year Ended October 31, |
| Class C | 2022 | | 2021 | | 2020 | | 2019 | | 2018 |
| Net asset value at beginning of year | $ 32.93 | | $ 22.38 | | $ 22.48 | | $ 24.02 | | $ 22.45 |
| Net investment income (loss) (a) | (0.21) | | (0.24) | | (0.08) | | 0.02 | | (0.02) |
| Net realized and unrealized gain (loss) | (3.30) | | 10.79 | | 1.22 | | 1.15 | | 1.59 |
| Total from investment operations | (3.51) | | 10.55 | | 1.14 | | 1.17 | | 1.57 |
| Less distributions: | | | | | | | | | |
| From net investment income | — | | — | | (0.02) | | — | | — |
| From net realized gain on investments | (3.03) | | — | | (1.22) | | (2.71) | | — |
| Total distributions | (3.03) | | — | | (1.24) | | (2.71) | | — |
| Net asset value at end of year | $ 26.39 | | $ 32.93 | | $ 22.38 | | $ 22.48 | | $ 24.02 |
| Total investment return (b) | (11.80)% | | 47.14%(c) | | 5.29% | | 5.72% | | 6.99% |
| Ratios (to average net assets)/Supplemental Data: | | | | | | | | | |
| Net investment income (loss) | (0.72)% | | (0.80)% | | (0.38)% | | 0.10% | | (0.08)% |
| Net expenses (d) | 1.86% | | 1.89% | | 2.05% | | 1.98% | | 1.96% |
| Expenses (before waiver/reimbursement) (d) | 1.86% | | 1.89% | | 2.06% | | 2.02% | | 1.98% |
| Portfolio turnover rate | 2% | | 24% | | 166% | | 164% | | 137% |
| Net assets at end of year (in 000’s) | $ 23,500 | | $ 37,234 | | $ 6,641 | | $ 10,946 | | $ 14,964 |
| (a) | Per share data based on average shares outstanding during the year. |
| (b) | Total investment return is calculated exclusive of sales charges and assumes the reinvestment of dividends and distributions. For periods of less than one year, total return is not annualized. |
| (c) | Total investment return may reflect adjustments to conform to generally accepted accounting principles. |
| (d) | In addition to the fees and expenses which the Fund bears directly, it also indirectly bears a pro-rata share of the fees and expenses of the underlying funds in which it invests. Such indirect expenses are not included in the above expense ratios. |
The notes to the financial statements are an integral part of, and should be read in conjunction with, the financial statements.
17
Financial Highlights selected per share data and ratios
| | Year Ended October 31, |
| Class I | 2022 | | 2021 | | 2020 | | 2019 | | 2018 |
| Net asset value at beginning of year | $ 36.99 | | $ 25.09 | | $ 25.05 | | $ 26.44 | | $ 24.67 |
| Net investment income (loss) (a) | 0.15 | | 0.16 | | 0.23 | | 0.32 | | 0.31 |
| Net realized and unrealized gain (loss) | (3.77) | | 12.03 | | 1.37 | | 1.28 | | 1.74 |
| Total from investment operations | (3.62) | | 12.19 | | 1.60 | | 1.60 | | 2.05 |
| Less distributions: | | | | | | | | | |
| From net investment income | (0.10) | | (0.29) | | (0.34) | | (0.28) | | (0.28) |
| From net realized gain on investments | (3.03) | | — | | (1.22) | | (2.71) | | — |
| Total distributions | (3.13) | | (0.29) | | (1.56) | | (2.99) | | (0.28) |
| Net asset value at end of year | $ 30.24 | | $ 36.99 | | $ 25.09 | | $ 25.05 | | $ 26.44 |
| Total investment return (b) | (10.72)% | | 48.97% | | 6.66% | | 7.06% | | 8.36% |
| Ratios (to average net assets)/Supplemental Data: | | | | | | | | | |
| Net investment income (loss) | 0.45% | | 0.48% | | 0.96% | | 1.34% | | 1.16% |
| Net expenses (c) | 0.69% | | 0.66% | | 0.74% | | 0.72% | | 0.71% |
| Portfolio turnover rate | 2% | | 24% | | 166% | | 164% | | 137% |
| Net assets at end of year (in 000’s) | $ 73,935 | | $ 135,219 | | $ 37,491 | | $ 97,903 | | $ 98,395 |
| (a) | Per share data based on average shares outstanding during the year. |
| (b) | Total investment return is calculated exclusive of sales charges and assumes the reinvestment of dividends and distributions. Class I shares are not subject to sales charges. For periods of less than one year, total return is not annualized. |
| (c) | In addition to the fees and expenses which the Fund bears directly, it also indirectly bears a pro-rata share of the fees and expenses of the underlying funds in which it invests. Such indirect expenses are not included in the above expense ratios. |
| | Year Ended October 31, |
| Class R3 | 2022 | | 2021 | | 2020 | | 2019 | | 2018 |
| Net asset value at beginning of year | $ 36.51 | | $ 24.78 | | $ 24.77 | | $ 26.17 | | $ 24.48 |
| Net investment income (loss) (a) | (0.05) | | (0.04) | | 0.07 | | 0.17 | | 0.14 |
| Net realized and unrealized gain (loss) | (3.72) | | 11.91 | | 1.36 | | 1.28 | | 1.73 |
| Total from investment operations | (3.77) | | 11.87 | | 1.43 | | 1.45 | | 1.87 |
| Less distributions: | | | | | | | | | |
| From net investment income | — | | (0.14) | | (0.20) | | (0.14) | | (0.18) |
| From net realized gain on investments | (3.03) | | — | | (1.22) | | (2.71) | | — |
| Total distributions | (3.03) | | (0.14) | | (1.42) | | (2.85) | | (0.18) |
| Net asset value at end of year | $ 29.71 | | $ 36.51 | | $ 24.78 | | $ 24.77 | | $ 26.17 |
| Total investment return (b) | (11.29)% | | 48.07% | | 6.02% | | 6.42% | | 7.66% |
| Ratios (to average net assets)/Supplemental Data: | | | | | | | | | |
| Net investment income (loss) | (0.17)% | | (0.13)% | | 0.30% | | 0.70% | | 0.52% |
| Net expenses (c) | 1.30% | | 1.28% | | 1.34% | | 1.32% | | 1.32% |
| Portfolio turnover rate | 2% | | 24% | | 166% | | 164% | | 137% |
| Net assets at end of year (in 000’s) | $ 561 | | $ 479 | | $ 207 | | $ 227 | | $ 137 |
| (a) | Per share data based on average shares outstanding during the year. |
| (b) | Total investment return is calculated exclusive of sales charges and assumes the reinvestment of dividends and distributions. Class R3 shares are not subject to sales charges. For periods of less than one year, total return is not annualized. |
| (c) | In addition to the fees and expenses which the Fund bears directly, it also indirectly bears a pro-rata share of the fees and expenses of the underlying funds in which it invests. Such indirect expenses are not included in the above expense ratios. |
The notes to the financial statements are an integral part of, and should be read in conjunction with, the financial statements.
| 18 | MainStay WMC Enduring Capital Fund |
Financial Highlights selected per share data and ratios
| | Year Ended October 31, | | April 26, 2021^ through
October 31, |
| Class R6 | 2022 | | 2021 |
| Net asset value at beginning of period | $ 37.00 | | $ 33.07 |
| Net investment income (loss) (a) | 0.16 | | 0.14 |
| Net realized and unrealized gain (loss) | (3.77) | | 3.79 |
| Total from investment operations | (3.61) | | 3.93 |
| Less distributions: | | | |
| From net investment income | (0.12) | | — |
| From net realized gain on investments | (3.03) | | — |
| Total distributions | (3.15) | | — |
| Net asset value at end of period | $ 30.24 | | $ 37.00 |
| Total investment return (b) | (10.69)% | | 11.88% |
| Ratios (to average net assets)/Supplemental Data: | | | |
| Net investment income (loss) | 0.50% | | 0.44%†† |
| Net expenses (c) | 0.63% | | 0.60%†† |
| Portfolio turnover rate | 2% | | 24% |
| Net assets at end of period (in 000’s) | $ 196,860 | | $ 262,843 |
| ^ | Inception date. |
| †† | Annualized. |
| (a) | Per share data based on average shares outstanding during the period. |
| (b) | Total investment return is calculated exclusive of sales charges and assumes the reinvestment of dividends and distributions. Class R6 shares are not subject to sales charges. For periods of less than one year, total return is not annualized. |
| (c) | In addition to the fees and expenses which the Fund bears directly, it also indirectly bears a pro-rata share of the fees and expenses of the underlying funds in which it invests. Such indirect expenses are not included in the above expense ratios. |
The notes to the financial statements are an integral part of, and should be read in conjunction with, the financial statements.
19
Notes to Financial Statements
Note 1-Organization and Business
The MainStay Funds (the “Trust”) was organized on January 9, 1986, as a Massachusetts business trust. The Trust is registered under the Investment Company Act of 1940, as amended (the “1940 Act”), as an open-end management investment company, and is comprised of twelve funds (collectively referred to as the "Funds"). These financial statements and notes relate to the MainStay WMC Enduring Capital Fund (the "Fund"), a “diversified” fund, as that term is defined in the 1940 Act, as interpreted or modified by regulatory authorities having jurisdiction, from time to time.
The following table lists the Fund's share classes that have been registered and commenced operations:
| Class | Commenced Operations |
| Class A | June 1, 1998 |
| Investor Class | February 28, 2008 |
| Class B | June 1, 1998 |
| Class C | September 1, 1998 |
| Class I | December 28, 2004 |
| Class R3 | February 29, 2016 |
| Class R6 | April 26, 2021 |
| Class R2 | N/A* |
| SIMPLE Class | N/A* |
| * | Class R2 and SIMPLE Class shares were registered for sale effective as of December 14, 2007 and August 31, 2020, respectively, but have not yet commenced operations. |
Class B shares of the MainStay Group of Funds are closed to all new purchases as well as additional investments by existing Class B shareholders. Existing Class B shareholders may continue to reinvest dividends and capital gains distributions, as well as exchange their Class B shares for Class B shares of other funds in the MainStay Group of Funds as permitted by the current exchange privileges. Class B shareholders continue to be subject to any applicable contingent deferred sales charge ("CDSC") at the time of redemption. All other features of the Class B shares, including but not limited to the fees and expenses applicable to Class B shares, remain unchanged. Unless redeemed, Class B shareholders will remain in Class B shares of their respective fund until the Class B shares are converted to Class A or Investor Class shares pursuant to the applicable conversion schedule.
Class A and Investor Class shares are offered at net asset value (“NAV”) per share plus an initial sales charge. No initial sales charge applies to investments of $1 million or more (and certain other qualified purchases) in Class A and Investor Class shares. However, a CDSC of 1.00% may be imposed on certain redemptions made within 18 months of the date of purchase on shares that were purchased without an initial sales charge. Class C shares are offered at NAV without an initial sales charge, although a 1.00% CDSC may be imposed on certain redemptions of such shares made within one year of the date of purchase of Class C shares. When Class B shares were offered, they were offered at NAV without an initial sales charge, although a CDSC that declines depending on the
number of years a shareholder held its Class B shares may be imposed on certain redemptions of such shares made within six years of the date of purchase of such shares. Class I, Class R1, Class R2, Class R3 and Class R6 shares are offered at NAV without a sales charge. Class R2 and SIMPLE Class shares are expected to be offered at NAV without a sales charge if such shares are offered in the future. Depending upon eligibility, Class B shares convert to either Class A or Investor Class shares at the end of the calendar quarter eight years after the date they were purchased. In addition, depending upon eligibility, Class C shares convert to either Class A or Investor Class shares at the end of the calendar quarter eight years after the date they were purchased. Additionally, Investor Class shares may convert automatically to Class A shares. Under certain circumstances and as may be permitted by the Trust’s multiple class plan pursuant to Rule 18f-3 under the 1940 Act, specified share classes of the Fund may be converted to one or more other share classes of the Fund as disclosed in the capital share transactions within these Notes. The classes of shares have the same voting (except for issues that relate solely to one class), dividend, liquidation and other rights, and the same terms and conditions, except that under distribution plans pursuant to Rule 12b-1 under the 1940 Act, Class B and Class C shares are subject to higher distribution and/or service fees than Class A, Investor Class, Class R2, Class R3 and SIMPLE Class shares. Class I, Class R1 and Class R6 shares are not subject to a distribution and/or service fee. Class R1, Class R2 and Class R3 shares are subject to a shareholder service fee, which is in addition to fees paid under the distribution plans for Class R2 and Class R3 shares.
The Fund's investment objective is to seek long-term growth of capital.
Note 2–Significant Accounting Policies
The Fund is an investment company and accordingly follows the investment company accounting and reporting guidance of the Financial Accounting Standards Board (“FASB”) Accounting Standards Codification Topic 946 Financial Services—Investment Companies. The Fund prepares its financial statements in accordance with generally accepted accounting principles (“GAAP”) in the United States of America and follows the significant accounting policies described below.
(A) Securities Valuation. Investments are usually valued as of the close of regular trading on the New York Stock Exchange (the "Exchange") (usually 4:00 p.m. Eastern time) on each day the Fund is open for business ("valuation date").
Effective September 8, 2022, and pursuant to Rule 2a-5 under the 1940 Act, the Board of Trustees of the Trust (the "Board") designated New York Life Investment Management LLC (“New York Life Investments” or the "Manager") as its Valuation Designee (the "Valuation Designee"). The Valuation Designee is responsible for performing fair valuations relating to all investments in the Fund’s portfolio for which market quotations are not readily available; periodically assessing and managing material valuation risks; establishing and applying fair value methodologies; testing fair valuation methodologies; evaluating and overseeing pricing services; segregation of valuation and portfolio management functions; providing
| 20 | MainStay WMC Enduring Capital Fund |
quarterly, annual and prompt reporting to the Board, as appropriate; identifying potential conflicts of interest; and maintaining appropriate records. The Valuation Designee has established a valuation committee ("Valuation Committee") to assist in carrying out the Valuation Designee’s responsibilities and establish prices of securities for which market quotations are not readily available. The Fund’s and the Valuation Designee's policies and procedures ("Valuation Procedures") govern the Valuation Designee’s selection and application of methodologies for determining and calculating the fair value of Fund investments. The Valuation Designee may value Fund portfolio securities for which market quotations are not readily available and other Fund assets utilizing inputs from pricing services and other third-party sources (together, “Pricing Sources”). The Valuation Committee meets (in person, via electronic mail or via teleconference) on an ad-hoc basis to determine fair valuations and on a quarterly basis to review fair value events (excluding fair valuations from pricing services), including valuation risks and back-testing results, and preview reports to the Board.
The Valuation Committee establishes prices of securities for which market quotations are not readily available based on such methodologies and measurements on a regular basis after considering information that is reasonably available and deemed relevant by the Valuation Committee. The Board shall oversee the Valuation Designee and review fair valuation materials on a prompt, quarterly and annual basis and approve proposed revisions to the Valuation Procedures.
Investments for which market quotations are not readily available are valued at fair value as determined in good faith pursuant to the Valuation Procedures. A market quotation is readily available only when that quotation is a quoted price (unadjusted) in active markets for identical investments that the Fund can access at the measurement date, provided that a quotation will not be readily available if it is not reliable. Fair value measurements are determined within a framework that establishes a three-tier hierarchy that maximizes the use of observable market data and minimizes the use of unobservable inputs to establish a classification of fair value measurements for disclosure purposes. "Inputs" refer broadly to the assumptions that market participants would use in pricing the asset or liability, including assumptions about risk, such as the risk inherent in a particular valuation technique used to measure fair value using a pricing model and/or the risk inherent in the inputs for the valuation technique. Inputs may be observable or unobservable. Observable inputs reflect the assumptions market participants would use in pricing the asset or liability based on market data obtained from sources independent of the Fund. Unobservable inputs reflect the Fund’s own assumptions about the assumptions market participants would use in pricing the asset or liability based on the information available. The inputs or methodology used for valuing assets or liabilities may not be an indication of the risks associated with investing in those assets or liabilities. The three-tier hierarchy of inputs is summarized below.
| • | Level 1—quoted prices (unadjusted) in active markets for an identical asset or liability |
| • | Level 2—other significant observable inputs (including quoted prices for a similar asset or liability in active markets, interest rates and yield curves, prepayment speeds, credit risk, etc.) |
| • | Level 3—significant unobservable inputs (including the Fund's own assumptions about the assumptions that market participants would use in measuring fair value of an asset or liability) |
The level of an asset or liability within the fair value hierarchy is based on the lowest level of an input, both individually and in the aggregate, that is significant to the fair value measurement. The aggregate value by input level of the Fund’s assets and liabilities as of October 31, 2022, is included at the end of the Portfolio of Investments.
The Fund may use third-party vendor evaluations, whose prices may be derived from one or more of the following standard inputs, among others:
| • Broker/dealer quotes | • Benchmark securities |
| • Two-sided markets | • Reference data (corporate actions or material event notices) |
| • Bids/offers | • Monthly payment information |
| • Industry and economic events | • Reported trades |
An asset or liability for which a market quotation is not readily available is valued by methods deemed reasonable in good faith by the Valuation Committee, following the Valuation Procedures to represent fair value. Under these procedures, the Valuation Designee generally uses a market-based approach which may use related or comparable assets or liabilities, recent transactions, market multiples, book values and other relevant information. The Valuation Designee may also use an income-based valuation approach in which the anticipated future cash flows of the asset or liability are discounted to calculate fair value. Discounts may also be applied due to the nature and/or duration of any restrictions on the disposition of the asset or liability. Fair value represents a good faith approximation of the value of a security. Fair value determinations involve the consideration of a number of subjective factors, an analysis of applicable facts and circumstances and the exercise of judgment. As a result, it is possible that the fair value for a security determined in good faith in accordance with the Valuation Procedures may differ from valuations for the same security determined for other funds using their own valuation procedures. Although the Valuation Procedures are designed to value a security at the price the Fund may reasonably expect to receive upon the security's sale in an orderly transaction, there can be no assurance that any fair value determination thereunder would, in fact, approximate the amount that the Fund would actually realize upon the sale of the security or the price at which the security would trade if a reliable market price were readily available. During the year ended October 31, 2022, there were no material changes to the fair value methodologies.
Securities which may be valued in this manner include, but are not limited to: (i) a security for which trading has been halted or suspended or otherwise does not have a readily available market quotation on a given day; (ii) a debt security that has recently gone into default and for which there is not a current market quotation; (iii) a security of an issuer that
Notes to Financial Statements (continued)
has entered into a restructuring; (iv) a security that has been delisted from a national exchange; (v) a security subject to trading collars for which no or limited trading takes place; and (vi) a security whose principal market has been temporarily closed at a time when, under normal conditions, it would be open. Securities valued in this manner are generally categorized as Level 2 or 3 in the hierarchy.
Certain securities held by the Fund may principally trade in foreign markets. Events may occur between the time the foreign markets close and the time at which the Fund's NAVs are calculated. These events may include, but are not limited to, situations relating to a single issuer in a market sector, significant fluctuations in U.S. or foreign markets, natural disasters, armed conflicts, governmental actions or other developments not tied directly to the securities markets. Should the Valuation Designee conclude that such events may have affected the accuracy of the last price of such securities reported on the local foreign market, the Valuation Designee may, pursuant to the Valuation Procedures, adjust the value of the local price to reflect the estimated impact on the price of such securities as a result of such events. In this instance, securities are generally categorized as Level 3 in the hierarchy. Additionally, certain foreign equity securities are also fair valued whenever the movement of a particular index exceeds certain thresholds. In such cases, the securities are fair valued by applying factors provided by a third-party vendor in accordance with the Valuation Procedures and are generally categorized as Level 2 in the hierarchy. No foreign equity securities held by the Fund as of October 31, 2022 were fair valued in such a manner.
Equity securities are valued at the last quoted sales prices as of the close of regular trading on the relevant exchange on each valuation date. Securities that are not traded on the valuation date are valued at the mean of the last quoted bid and ask prices. Prices are normally taken from the principal market in which each security trades. These securities are generally categorized as Level 1 in the hierarchy.
Investments in mutual funds, including money market funds, are valued at their respective NAVs at the close of business each day on the valuation date. These securities are generally categorized as Level 1 in the hierarchy.
Temporary cash investments acquired in excess of 60 days to maturity at the time of purchase are valued using the latest bid prices or using valuations based on a matrix system (which considers such factors as security prices, yields, maturities and ratings), both as furnished by independent pricing services. Temporary cash investments that mature in 60 days or less at the time of purchase ("Short-Term Investments") are valued using the amortized cost method of valuation, unless the use of such method would be inappropriate. The amortized cost method involves valuing a security at its cost on the date of purchase and thereafter assuming a constant amortization to maturity of the difference between such cost and the value on maturity date. Amortized cost approximates the current fair value of a security. Securities valued using the amortized cost method are not valued using quoted prices in an active market and are generally categorized as Level 2 in the hierarchy.
The information above is not intended to reflect an exhaustive list of the methodologies that may be used to value portfolio investments. The Valuation Procedures permit the use of a variety of valuation methodologies in connection with valuing portfolio investments. The methodology used for a specific type of investment may vary based on the market data available or other considerations. The methodologies summarized above may not represent the specific means by which portfolio investments are valued on any particular business day.
(B) Income Taxes. The Fund's policy is to comply with the requirements of the Internal Revenue Code of 1986, as amended (the “Internal Revenue Code”), applicable to regulated investment companies and to distribute all of its taxable income to the shareholders of the Fund within the allowable time limits.
The Manager evaluates the Fund’s tax positions to determine if the tax positions taken meet the minimum recognition threshold in connection with accounting for uncertainties in income tax positions taken or expected to be taken for the purposes of measuring and recognizing tax liabilities in the financial statements. Recognition of tax benefits of an uncertain tax position is permitted only to the extent the position is “more likely than not” to be sustained assuming examination by taxing authorities. The Manager analyzed the Fund's tax positions taken on federal, state and local income tax returns for all open tax years (for up to three tax years) and has concluded that no provisions for federal, state and local income tax are required in the Fund's financial statements. The Fund's federal, state and local income tax and federal excise tax returns for tax years for which the applicable statutes of limitations have not expired are subject to examination by the Internal Revenue Service and state and local departments of revenue.
(C) Foreign Taxes. The Fund may be subject to foreign taxes on income and other transaction-based taxes imposed by certain countries in which it invests. A portion of the taxes on gains on investments or currency purchases/repatriation may be reclaimable. The Fund will accrue such taxes and reclaims as applicable, based upon its current interpretation of tax rules and regulations that exist in the markets in which it invests.
The Fund may be subject to taxation on realized capital gains, repatriation proceeds and other transaction-based taxes imposed by certain countries in which it invests. The Fund will accrue such taxes as applicable based upon its current interpretation of tax rules and regulations that exist in the market in which it invests. Capital gains taxes relating to positions still held are reflected as a liability in the Statement of Assets and Liabilities, as well as an adjustment to the Fund's net unrealized appreciation (depreciation). Taxes related to capital gains realized, if any, are reflected as part of net realized gain (loss) in the Statement of Operations. Changes in tax liabilities related to capital gains taxes on unrealized investment gains, if any, are reflected as part of the change in net unrealized appreciation (depreciation) on investments in the Statement of Operations. Transaction-based charges are generally assessed as a percentage of the transaction amount.
| 22 | MainStay WMC Enduring Capital Fund |
(D) Dividends and Distributions to Shareholders. Dividends and distributions are recorded on the ex-dividend date. The Fund intends to declare and pay dividends from net investment income and distributions from net realized capital and currency gains, if any, at least annually. Unless a shareholder elects otherwise, all dividends and distributions are reinvested at NAV in the same class of shares of the Fund. Dividends and distributions to shareholders are determined in accordance with federal income tax regulations and may differ from determinations using GAAP.
(E) Security Transactions and Investment Income. The Fund records security transactions on the trade date. Realized gains and losses on security transactions are determined using the identified cost method. Dividend income is recognized on the ex-dividend date, net of any foreign tax withheld at the source, and interest income is accrued as earned using the effective interest rate method. Distributions received from real estate investment trusts may be classified as dividends, capital gains and/or return of capital.
Investment income and realized and unrealized gains and losses on investments of the Fund are allocated pro rata to the separate classes of shares based upon their relative net assets on the date the income is earned or realized and unrealized gains and losses are incurred.
(F) Expenses. Expenses of the Trust are allocated to the individual Funds in proportion to the net assets of the respective Funds when the expenses are incurred, except where direct allocations of expenses can be made. Expenses (other than transfer agent expenses and fees incurred under the shareholder services plans and/or the distribution plans further discussed in Note 3(B)) are allocated to separate classes of shares pro rata based upon their relative net assets on the date the expenses are incurred. The expenses borne by the Fund, including those of related parties to the Fund, are shown in the Statement of Operations.
Additionally, the Fund may invest in mutual funds, which are subject to management fees and other fees that may cause the costs of investing in mutual funds to be greater than the costs of owning the underlying securities directly. These indirect expenses of mutual funds are not included in the amounts shown as expenses in the Statement of Operations or in the expense ratios included in the Financial Highlights.
(G) Use of Estimates. In preparing financial statements in conformity with GAAP, the Manager makes estimates and assumptions that affect the reported amounts and disclosures in the financial statements. Actual results could differ from those estimates and assumptions.
(H) Foreign Currency Transactions. The Fund's books and records are maintained in U.S. dollars. Prices of securities denominated in foreign currency amounts are translated into U.S. dollars at the mean between the buying and selling rates last quoted by any major U.S. bank at the following dates:
(i) market value of investment securities, other assets and liabilities— at the valuation date; and
(ii) purchases and sales of investment securities, income and expenses—at the date of such transactions.
The assets and liabilities that are denominated in foreign currency amounts are presented at the exchange rates and market values at the close of the period. The realized and unrealized changes in net assets arising from fluctuations in exchange rates and market prices of securities are not separately presented.
Net realized gain (loss) on foreign currency transactions represents net currency gains or losses realized as a result of differences between the amounts of securities sale proceeds or purchase cost, dividends, interest and withholding taxes as recorded on the Fund's books, and the U.S. dollar equivalent amount actually received or paid. Net currency gains or losses from valuing such foreign currency denominated assets and liabilities, other than investments at valuation date exchange rates, are reflected in unrealized foreign exchange gains or losses.
(I) Securities Lending. In order to realize additional income, the Fund may engage in securities lending, subject to the limitations set forth in the 1940 Act and relevant guidance by the staff of the Securities and Exchange Commission (“SEC”). If the Fund engages in securities lending, the Fund will lend through its custodian, JPMorgan Chase Bank, N.A., ("JPMorgan"), acting as securities lending agent on behalf of the Fund. Under the current arrangement, JPMorgan will manage the Fund's collateral in accordance with the securities lending agency agreement between the Fund and JPMorgan, and indemnify the Fund against counterparty risk. The loans will be collateralized by cash (which may be invested in a money market fund) and/or non-cash collateral (which may include U.S. Treasury securities and/or U.S. government agency securities issued or guaranteed by the United States government or its agencies or instrumentalities) at least equal at all times to the market value of the securities loaned. Non-cash collateral held at year end is segregated and cannot be transferred by the Fund. The Fund bears the risk of delay in recovery of, or loss of rights in, the securities loaned. The Fund may also record a realized gain or loss on securities deemed sold due to a borrower’s inability to return securities on loan. The Fund bears the risk of any loss on investment of cash collateral. The Fund will receive compensation for lending its securities in the form of fees or it will retain a portion of interest earned on the investment of any cash collateral. The Fund will also continue to receive interest and dividends on the securities loaned and any gain or loss in the market price of the securities loaned that may occur during the term of the loan will be for the account of the Fund. Income earned from securities lending activities, if any, is reflected in the Statement of Operations. As of October 31, 2022, the Fund did not have any portfolio securities on loan.
(J) Indemnifications. Under the Trust’s organizational documents, its officers and trustees are indemnified against certain liabilities that may arise out of performance of their duties to the Trust. Additionally, in the normal course of business, the Fund enters into contracts with third-party service providers that contain a variety of representations and warranties and that may provide general indemnifications. The Fund's maximum exposure under these arrangements is unknown, as this would involve future claims that may be made against the Fund that have not yet occurred. The Manager believes that the risk of loss in connection with
Notes to Financial Statements (continued)
these potential indemnification obligations is remote. However, there can be no assurance that material liabilities related to such obligations will not arise in the future, which could adversely impact the Fund.
Note 3–Fees and Related Party Transactions
(A) Manager and Subadvisor. New York Life Investments, a registered investment adviser and an indirect, wholly-owned subsidiary of New York Life Insurance Company ("New York Life"), serves as the Fund's Manager, pursuant to an Amended and Restated Management Agreement ("Management Agreement"). The Manager provides offices, conducts clerical, recordkeeping and bookkeeping services and keeps most of the financial and accounting records required to be maintained by the Fund. Except for the portion of salaries and expenses that are the responsibility of the Fund, the Manager pays the salaries and expenses of all personnel affiliated with the Fund and certain operational expenses of the Fund. During a portion of the year ended October 31, 2022, the Fund reimbursed New York Life Investments in an amount equal to the portion of the compensation of the Chief Compliance Officer attributable to the Fund. Wellington Management Company LLP ("Wellington" or the "Subadvisor"), a registered investment adviser, serves as the Subadvisor to the Fund and is responsible for the day-to-day portfolio management of the Fund. Pursuant to the terms of a Subadvisory Agreement ("Subadvisory Agreement") between New York Life Investments and Wellington, New York Life Investments pays for the services of the Subadvisor.
Pursuant to the Management Agreement, the Fund pays the Manager a monthly fee for the services performed and the facilities furnished at an annual rate of the Fund’s average daily net assets as follows: 0.55% up to $500 million; 0.525% from $500 million to $1 billion; and 0.50% on assets in excess of $1 billion. During the year ended October 31, 2022, the effective management fee rate was 0.55%.
New York Life Investments has contractually agreed to waive fees and/or reimburse expenses so that Class R6 fees and expenses do not exceed those of Class I. This agreement will remain in effect until February 28, 2023, and shall renew automatically for one-year terms unless New York Life Investments provides written notice of termination prior to the start of the next term or upon approval of the Board.
New York Life Investments has agreed to voluntarily waive fees and/or reimburse expenses of the appropriate class of the Fund so that Total Annual Fund Operating Expenses (excluding taxes, interest, litigation, extraordinary expenses, brokerage and other transaction expenses relating to the purchase and sale of portfolio investments, and acquired (underlying) fund fees and expenses) of a class do not exceed the following percentages of average daily net assets: Investor Class, 1.85%; Class B, 2.60%; and Class C, 2.60%. These voluntary waivers or reimbursements may be discontinued at any time without notice.
During the year ended October 31, 2022, New York Life Investments earned fees from the Fund in the amount of $3,209,022 and paid the Subadvisor fees of $1,384,307.
JPMorgan provides sub-administration and sub-accounting services to the Fund pursuant to an agreement with New York Life Investments. These services include calculating the daily NAVs of the Fund, maintaining the general ledger and sub-ledger accounts for the calculation of the Fund's NAVs, and assisting New York Life Investments in conducting various aspects of the Fund's administrative operations. For providing these services to the Fund, JPMorgan is compensated by New York Life Investments.
Pursuant to an agreement between the Trust and New York Life Investments, New York Life Investments is responsible for providing or procuring certain regulatory reporting services for the Fund. The Fund will reimburse New York Life Investments for the actual costs incurred by New York Life Investments in connection with providing or procuring these services for the Fund.
(B) Distribution and Service Fees. The Trust, on behalf of the Fund, has entered into a distribution agreement with NYLIFE Distributors LLC (the “Distributor”), an affiliate of New York Life Investments. The Fund has adopted distribution plans (the “Plans”) in accordance with the provisions of Rule 12b-1 under the 1940 Act.
Pursuant to the Class A and Investor Class Plans, the Distributor receives a monthly fee from the Class A and Investor Class shares at an annual rate of 0.25% of the average daily net assets of the Class A and Investor Class shares for distribution and/or service activities as designated by the Distributor. Pursuant to the Class B and Class C Plans, Class B and Class C shares pay the Distributor a monthly distribution fee at an annual rate of 0.75% of the average daily net assets of the Class B and Class C shares, along with a service fee at an annual rate of 0.25% of the average daily net assets of the Class B and Class C shares, for a total 12b-1 fee of 1.00%. Pursuant to the Class R3 Plan, Class R3 shares pay the Distributor a monthly distribution fee at an annual rate of 0.25% of the average daily net assets of the Class R3 shares, along with a service fee at an annual rate of 0.25% of the average daily net assets of the Class R3 shares, for a total 12b-1 fee of 0.50%. Class I and Class R6 shares are not subject to a distribution and/or service fee.
The Plans provide that the distribution and service fees are payable to the Distributor regardless of the amounts actually expended by the Distributor for distribution of the Fund's shares and service activities.
In accordance with the Shareholder Services Plans for the Class R3 shares, the Manager has agreed to provide, through its affiliates or independent third parties, various shareholder and administrative support services to shareholders of the Class R3 shares. For its services, the Manager, its affiliates or independent third-party service providers are entitled to a shareholder service fee accrued daily and paid monthly at an annual rate of 0.10% of the average daily net assets of the Class R3 shares. This is in addition to any fees paid under the Class R3 Plan.
| 24 | MainStay WMC Enduring Capital Fund |
During the year ended October 31, 2022, shareholder service fees incurred by the Fund were as follows:
(C) Sales Charges. The Fund was advised by the Distributor that the amount of initial sales charges retained on sales of Class A and Investor Class shares during the year ended October 31, 2022, were $35,712 and $5,824, respectively.
The Fund was also advised that the Distributor retained CDSCs on redemptions of Class A, Class B and Class C shares during the year ended October 31, 2022, of $1,240, $284 and $1,654, respectively.
(D) Transfer, Dividend Disbursing and Shareholder Servicing Agent. NYLIM Service Company LLC, an affiliate of New York Life Investments, is the Fund's transfer, dividend disbursing and shareholder servicing agent pursuant to an agreement between NYLIM Service Company LLC and the Trust. NYLIM Service Company LLC has entered into an agreement with DST Asset Manager Solutions, Inc. ("DST"), pursuant to which DST performs certain transfer agent services on behalf of NYLIM Service Company LLC. New York Life Investments has contractually agreed to limit the transfer agency expenses charged to the Fund’s share classes to a maximum of 0.35% of that share class’s average daily net assets on an annual basis after deducting any applicable Fund or class-level expense reimbursement or small account fees. This agreement will remain in effect until February 28, 2023, and shall renew automatically for one-year terms unless New York Life Investments provides written notice of termination prior to the start of the next term or upon approval of the Board. During the year ended October 31, 2022, transfer agent expenses incurred by the Fund and any reimbursements, pursuant to the aforementioned Transfer Agency expense limitation agreement, were as follows:
| Class | Expense | Waived |
| Class A | $140,232 | $— |
| Investor Class | 58,738 | — |
| Class B | 9,078 | — |
| Class C | 68,659 | — |
| Class I | 58,291 | — |
| Class R3 | 302 | — |
| Class R6 | 9,247 | — |
(E) Small Account Fee. Shareholders with small accounts adversely impact the cost of providing transfer agency services. In an effort to reduce total transfer agency expenses, the Fund has implemented a small account fee on certain types of accounts. As described in the Fund's prospectus, certain shareholders with an account balance of less than $1,000 ($5,000 for Class A share accounts) are charged an annual per account fee of $20 (assessed semi-annually), the proceeds from which offset transfer agent fees as reflected in the Statement of Operations. This small account fee will not apply to certain types of accounts as described further in the Fund’s prospectus.
(F) Capital. As of October 31, 2022, New York Life and its affiliates beneficially held shares of the Fund with the values and percentages of net assets as follows:
| Class R3 | $53,445 | 9.5% |
| Class R6 | 37,889 | 0.0‡ |
| ‡ | Less than one-tenth of a percent. |
Note 4-Federal Income Tax
As of October 31, 2022, the cost and unrealized appreciation (depreciation) of the Fund’s investment portfolio, including applicable derivative contracts and other financial instruments, as determined on a federal income tax basis, were as follows:
| | Federal Tax
Cost | Gross
Unrealized
Appreciation | Gross
Unrealized
(Depreciation) | Net
Unrealized
Appreciation/
(Depreciation) |
| Investments in Securities | $484,973,880 | $63,463,767 | $(32,135,337) | $31,328,430 |
As of October 31, 2022, the components of accumulated gain (loss) on a tax basis were as follows:
Ordinary
income | Accumulated
Capital
and Other
Gain (Loss) | Other
Temporary
Differences | Unrealized
Appreciation
(Depreciation) | Total
Accumulated
Gain (Loss) |
| $12,684,864 | $8,443,771 | $— | $31,328,430 | $52,457,065 |
The difference between book-basis and tax-basis unrealized appreciation (depreciation) is primarily due to wash sale adjustments.
During the years ended October 31, 2022 and October 31, 2021, the tax character of distributions paid as reflected in the Statements of Changes in Net Assets was as follows:
| | 2022 | 2021 |
| Distributions paid from: | | |
| Ordinary Income | $24,964,525 | $1,090,371 |
| Long-Term Capital Gains | 33,082,933 | — |
| Total | $58,047,458 | $1,090,371 |
Note 5–Custodian
JPMorgan is the custodian of cash and securities held by the Fund. Custodial fees are charged to the Fund based on the Fund's net assets and/or the market value of securities held by the Fund and the number of certain transactions incurred by the Fund.
Notes to Financial Statements (continued)
Note 6–Line of Credit
The Fund and certain other funds managed by New York Life Investments maintain a line of credit with a syndicate of banks in order to secure a source of funds for temporary purposes to meet unanticipated or excessive redemption requests.
Effective July 26, 2022, under the credit agreement (the “Credit Agreement”), the aggregate commitment amount is $600,000,000 with an additional uncommitted amount of $100,000,000. The commitment fee is an annual rate of 0.15% of the average commitment amount payable quarterly, regardless of usage, to JPMorgan, who serves as the agent to the syndicate. The commitment fee is allocated among the Fund and certain other funds managed by New York Life Investments based upon their respective net assets and other factors. Interest on any revolving credit loan is charged based upon the Federal Funds Rate, Daily Simple Secured Overnight Financing Rate ("SOFR") + 0.10%, or the Overnight Bank Funding Rate, whichever is higher. The Credit Agreement expires on July 25, 2023, although the Fund, certain other funds managed by New York Life Investments and the syndicate of banks may renew the Credit Agreement for an additional year on the same or different terms or enter into a credit agreement with a different syndicate of banks. Prior to July 26, 2022, the aggregate commitment amount and the commitment fee were the same as those under the current Credit Agreement. During the year ended October 31, 2022, there were no borrowings made or outstanding with respect to the Fund under the Credit Agreement.
Note 7–Interfund Lending Program
Pursuant to an exemptive order issued by the SEC, the Fund, along with certain other funds managed by New York Life Investments, may participate in an interfund lending program. The interfund lending program provides an alternative credit facility that permits the Fund and certain other funds managed by New York Life Investments to lend or borrow money for temporary purposes directly to or from one another, subject to the conditions of the exemptive order. During the year ended October 31, 2022, there were no interfund loans made or outstanding with respect to the Fund.
Note 8–Purchases and Sales of Securities (in 000’s)
During the year ended October 31, 2022, purchases and sales of securities, other than short-term securities, were $13,494 and $125,697, respectively.
Note 9–Capital Share Transactions
Transactions in capital shares for the years ended October 31, 2022 and October 31, 2021, were as follows:
| Class A | Shares | Amount |
| Year ended October 31, 2022: | | |
| Shares sold | 964,328 | $ 31,211,920 |
| Shares issued to shareholders in reinvestment of distributions | 549,149 | 18,594,184 |
| Shares redeemed | (1,313,198) | (41,861,145) |
| Net increase (decrease) in shares outstanding before conversion | 200,279 | 7,944,959 |
| Shares converted into Class A (See Note 1) | 118,908 | 3,952,416 |
| Shares converted from Class A (See Note 1) | (2,122) | (64,560) |
| Net increase (decrease) | 317,065 | $ 11,832,815 |
| Year ended October 31, 2021: | | |
| Shares sold | 629,407 | $ 20,661,799 |
| issued in connection with the acquisition of MainStay Epoch U.S. All Cap Fund | 1,545,799 | 50,867,461 |
| issued in connection with the acquisition of MainStay MacKay U.S. Equity Opportunities Fund | 1,903,874 | 62,650,579 |
| Shares issued to shareholders in reinvestment of distributions | 20,437 | 567,749 |
| Shares redeemed | (718,791) | (23,585,068) |
| Net increase (decrease) in shares outstanding before conversion | 3,380,726 | 111,162,520 |
| Shares converted into Class A (See Note 1) | 331,330 | 10,668,239 |
| Shares converted from Class A (See Note 1) | (98) | (2,684) |
| Net increase (decrease) | 3,711,958 | $ 121,828,075 |
| |
| 26 | MainStay WMC Enduring Capital Fund |
| Investor Class | Shares | Amount |
| Year ended October 31, 2022: | | |
| Shares sold | 35,401 | $ 1,145,205 |
| Shares issued to shareholders in reinvestment of distributions | 70,920 | 2,401,347 |
| Shares redeemed | (70,871) | (2,264,176) |
| Net increase (decrease) in shares outstanding before conversion | 35,450 | 1,282,376 |
| Shares converted into Investor Class (See Note 1) | 21,377 | 677,516 |
| Shares converted from Investor Class (See Note 1) | (87,635) | (2,969,099) |
| Net increase (decrease) | (30,808) | $ (1,009,207) |
| Year ended October 31, 2021: | | |
| Shares sold | 42,505 | $ 1,372,487 |
| issued in connection with the acquisition of MainStay Epoch U.S. All Cap Fund | 319,550 | 10,519,323 |
| issued in connection with the acquisition of MainStay MacKay U.S. Equity Opportunities Fund | 145,980 | 4,805,532 |
| Shares issued to shareholders in reinvestment of distributions | 3,475 | 96,668 |
| Shares redeemed | (62,442) | (1,996,602) |
| Net increase (decrease) in shares outstanding before conversion | 449,068 | 14,797,408 |
| Shares converted into Investor Class (See Note 1) | 18,310 | 582,017 |
| Shares converted from Investor Class (See Note 1) | (293,620) | (9,430,654) |
| Net increase (decrease) | 173,758 | $ 5,948,771 |
| |
| Class B | Shares | Amount |
| Year ended October 31, 2022: | | |
| Shares sold | 1,841 | $ 53,478 |
| Shares issued to shareholders in reinvestment of distributions | 14,748 | 443,192 |
| Shares redeemed | (23,125) | (653,846) |
| Net increase (decrease) in shares outstanding before conversion | (6,536) | (157,176) |
| Shares converted from Class B (See Note 1) | (38,436) | (1,074,180) |
| Net increase (decrease) | (44,972) | $ (1,231,356) |
| Year ended October 31, 2021: | | |
| Shares sold | 2,818 | $ 77,793 |
| issued in connection with the acquisition of MainStay Epoch U.S. All Cap Fund | 56,787 | 1,683,892 |
| Shares redeemed | (34,885) | (1,022,198) |
| Net increase (decrease) in shares outstanding before conversion | 24,720 | 739,487 |
| Shares converted from Class B (See Note 1) | (36,451) | (1,053,903) |
| Net increase (decrease) | (11,731) | $ (314,416) |
| |
| Class C | Shares | Amount |
| Year ended October 31, 2022: | | |
| Shares sold | 24,436 | $ 690,062 |
| Shares issued to shareholders in reinvestment of distributions | 108,949 | 3,270,638 |
| Shares redeemed | (352,310) | (10,083,915) |
| Net increase (decrease) in shares outstanding before conversion | (218,925) | (6,123,215) |
| Shares converted from Class C (See Note 1) | (21,155) | (586,653) |
| Net increase (decrease) | (240,080) | $ (6,709,868) |
| Year ended October 31, 2021: | | |
| Shares sold | 16,835 | $ 458,023 |
| issued in connection with the acquisition of MainStay Epoch U.S. All Cap Fund | 69,442 | 2,057,308 |
| issued in connection with the acquisition of MainStay MacKay U.S. Equity Opportunities Fund | 1,092,350 | 32,362,061 |
| Shares redeemed | (318,984) | (9,452,874) |
| Net increase (decrease) in shares outstanding before conversion | 859,643 | 25,424,518 |
| Shares converted from Class C (See Note 1) | (25,621) | (763,015) |
| Net increase (decrease) | 834,022 | $ 24,661,503 |
| |
| Class I | Shares | Amount |
| Year ended October 31, 2022: | | |
| Shares sold | 981,052 | $ 32,552,040 |
| Shares issued to shareholders in reinvestment of distributions | 299,886 | 10,205,117 |
| Shares redeemed | (2,493,569) | (85,095,425) |
| Net increase (decrease) in shares outstanding before conversion | (1,212,631) | (42,338,268) |
| Shares converted into Class I (See Note 1) | 2,107 | 64,560 |
| Net increase (decrease) | (1,210,524) | $ (42,273,708) |
| Year ended October 31, 2021: | | |
| Shares sold | 1,135,325 | $ 35,962,374 |
| issued in connection with the acquisition of MainStay Epoch U.S. All Cap Fund | 3,846,331 | 127,191,639 |
| issued in connection with the acquisition of MainStay MacKay U.S. Equity Opportunities Fund | 1,443,561 | 47,736,105 |
| Shares issued to shareholders in reinvestment of distributions | 14,290 | 398,556 |
| Shares redeemed | (3,390,505) | (113,090,422) |
| Net increase (decrease) in shares outstanding before conversion | 3,049,002 | 98,198,252 |
| Shares converted from Class I (See Note 1) | (887,869) | (29,360,331) |
| Net increase (decrease) | 2,161,133 | $ 68,837,921 |
| |
Notes to Financial Statements (continued)
| Class R3 | Shares | Amount |
| Year ended October 31, 2022: | | |
| Shares sold | 8,459 | $ 246,328 |
| Shares issued to shareholders in reinvestment of distributions | 993 | 33,389 |
| Shares redeemed | (3,717) | (113,830) |
| Net increase (decrease) | 5,735 | $ 165,887 |
| Year ended October 31, 2021: | | |
| Shares sold | 6,288 | $ 208,023 |
| Shares issued to shareholders in reinvestment of distributions | 30 | 832 |
| Shares redeemed | (1,534) | (48,435) |
| Net increase (decrease) | 4,784 | $ 160,420 |
| |
| Class R6 | Shares | Amount |
| Year ended October 31, 2022: | | |
| Shares sold | 628,462 | $ 20,556,193 |
| Shares issued to shareholders in reinvestment of distributions | 658,656 | 22,407,486 |
| Shares redeemed | (1,881,346) | (61,194,703) |
| Net increase (decrease) | (594,228) | $ (18,231,024) |
| Year ended October 31, 2021:(a) | | |
| Shares sold | 332,147 | $ 12,189,729 |
| issued in connection with the acquisition of MainStay Epoch U.S. All Cap Fund | 8,858,124 | 292,923,086 |
| Shares redeemed | (2,973,906) | (104,254,458) |
| Net increase (decrease) in shares outstanding before conversion | 6,216,365 | 200,858,357 |
| Shares converted into Class R6 (See Note 1) | 887,869 | 29,360,331 |
| Net increase (decrease) | 7,104,234 | $ 230,218,688 |
| (a) | The inception of the class was April 26, 2021. |
Note 10–Other Matters
As of the date of this report, interest rates in the United States and many parts of the world, including certain European countries, are ascending from historically low levels. Thus, the Fund currently faces a heightened level of risk associated with rising interest rates. This could be driven by a variety of factors, including but not limited to central bank monetary policies, changing inflation or real growth rates, general economic conditions, increasing bond issuances or reduced market demand for low yielding investments.
An outbreak of COVID-19, first detected in December 2019, has developed into a global pandemic and has resulted in travel restrictions, closure of international borders, certain businesses and securities markets, restrictions on securities trading activities, prolonged quarantines, supply chain disruptions, and lower consumer demand, as well as general concern and uncertainty. In 2022, many countries lifted some or all restrictions related to COVID-19. However, the continued impact of COVID-19 and related variants is uncertain and could further adversely affect the global economy, national economies, individual issuers and capital markets in unforeseeable ways and result in a
substantial and extended economic downturn. Developments that disrupt global economies and financial markets, such as COVID-19, may magnify factors that affect the Fund's performance.
Note 11–Subsequent Events
In connection with the preparation of the financial statements of the Fund as of and for the year ended October 31, 2022, events and transactions subsequent to October 31, 2022, through the date the financial statements were issued have been evaluated by the Manager for possible adjustment and/or disclosure. No subsequent events requiring financial statement adjustment or disclosure have been identified.
| 28 | MainStay WMC Enduring Capital Fund |
Report of Independent Registered Public Accounting Firm
To the Shareholders of the Fund and Board of Trustees
The MainStay Funds:
Opinion on the Financial Statements
We have audited the accompanying statement of assets and liabilities of MainStay WMC Enduring Capital Fund (the Fund), one of the funds constituting The MainStay Funds, including the portfolio of investments, as of October 31, 2022, the related statement of operations for the year then ended, the statements of changes in net assets for each of the years in the two-year period then ended, and the related notes (collectively, the financial statements) and the financial highlights for each of the years or periods in the five-year period then ended. In our opinion, the financial statements and financial highlights present fairly, in all material respects, the financial position of the Fund as of October 31, 2022, the results of its operations for the year then ended, the changes in its net assets for each of the years in the two-year period then ended, and the financial highlights for each of the years or periods in the five-year period then ended, in conformity with U.S. generally accepted accounting principles.
Basis for Opinion
These financial statements and financial highlights are the responsibility of the Fund's management. Our responsibility is to express an opinion on these financial statements and financial highlights based on our audits. We are a public accounting firm registered with the Public Company Accounting Oversight Board (United States) (PCAOB) and are required to be independent with respect to the Fund in accordance with the U.S. federal securities laws and the applicable rules and regulations of the Securities and Exchange Commission and the PCAOB.
We conducted our audits in accordance with the standards of the PCAOB. Those standards require that we plan and perform the audit to obtain reasonable assurance about whether the financial statements and financial highlights are free of material misstatement, whether due to error or fraud. Our audits included performing procedures to assess the risks of material misstatement of the financial statements and financial highlights, whether due to error or fraud, and performing procedures that respond to those risks. Such procedures included examining, on a test basis, evidence regarding the amounts and disclosures in the financial statements and financial highlights. Such procedures also included confirmation of securities owned as of October 31, 2022, by correspondence with the custodian and the transfer agent. Our audits also included evaluating the accounting principles used and significant estimates made by management, as well as evaluating the overall presentation of the financial statements and financial highlights. We believe that our audits provide a reasonable basis for our opinion.

We have served as the auditor of one or more New York Life Investment Management investment companies since 2003.
Philadelphia, Pennsylvania
December 23, 2022
Federal Income Tax Information
(Unaudited)
The Fund is required under the Internal Revenue Code to advise shareholders in a written statement as to the federal tax status of dividends paid by the Fund during such fiscal years.
Accordingly, the Fund paid $33,082,933 as long term capital gain distributions.
For the fiscal year ended October 31, 2022, the Fund designated approximately $3,608,886 under the Internal Revenue Code as qualified dividend income eligible for reduced tax rates.
The dividends paid by the Fund during the fiscal year ended October 31, 2022 should be multiplied by 10.77% to arrive at the amount eligible for the corporate dividend-received deduction.
In February 2023, shareholders will receive an IRS Form 1099-DIV or substitute Form 1099, which will show the federal tax status of the distributions received by shareholders in calendar year 2022. The amounts that will be reported on such 1099-DIV or substitute Form 1099 will be the amounts you are to use on your federal income tax return and will differ from the amounts which we must report for the Fund's fiscal year ended October 31, 2022.
Proxy Voting Policies and Procedures and Proxy Voting Record
The Fund is required to file with the SEC its proxy voting record for the 12-month period ending June 30 on Form N-PX. A description of the policies and procedures that are used to vote proxies relating to portfolio securities of the Fund is available free of charge upon request by calling 800-624-6782 or visiting the SEC’s website at www.sec.gov. The most recent Form N-PX or proxy voting record is available free of charge upon request by calling 800-624-6782; visiting newyorklifeinvestments.com; or visiting the SEC’s website at www.sec.gov.
Shareholder Reports and Quarterly Portfolio Disclosure
The Fund is required to file its complete schedule of portfolio holdings with the SEC 60 days after its first and third fiscal quarter on Form N-PORT. The Fund's holdings report is available free of charge upon request by calling New York Life Investments at 800-624-6782.
| 30 | MainStay WMC Enduring Capital Fund |
Board of Trustees and Officers (Unaudited)
The Trustees and officers of the Fund are listed below. The Board oversees the MainStay Group of Funds (which consists of MainStay Funds and MainStay Funds Trust), MainStay VP Funds Trust, MainStay MacKay DefinedTerm Municipal Opportunities Fund, MainStay CBRE Global Infrastructure Megatrends Fund, the Manager and the Subadvisors, and elects the officers of the Funds who are responsible for the day-to-day operations of the Fund. Information pertaining to the Trustees and officers is set forth below. Each Trustee serves until his or her successor is
elected and qualified or until his or her resignation, death or removal. Under the Board’s retirement policy, unless an exception is made, a Trustee must tender his or her resignation by the end of the calendar year during which he or she reaches the age of 75. The business address of each Trustee and officer listed below is 51 Madison Avenue, New York, New York 10010. None of the Trustees are “interested persons” (as defined by the 1940 Act and rules adopted by the SEC thereunder) of the Fund (“Independent Trustees”).
| | Name and
Year of Birth | Term of Office,
Position(s) Held and
Length of Service | Principal Occupation(s)
During Past Five Years | Number of
Portfolios in
Fund Complex
Overseen by
Trustee | Other Directorships
Held by Trustee |
| | | | | | |
| | David H. Chow
1957 | MainStay Funds: Trustee since 2016, Advisory Board Member (June 2015 to December 2015);MainStay Funds Trust:
Trustee since January 2016, Advisory Board Member (June 2015 to December 2015) | Founder and CEO, DanCourt Management, LLC since 1999 | 78 | MainStay VP Funds Trust: Trustee since January 2016, Advisory Board Member (June 2015 to December 2015) (31 portfolios);
MainStay MacKay DefinedTerm Municipal Opportunities Fund: Trustee since January 2016, Advisory Board Member (June 2015 to December 2015);
MainStay CBRE Global Infrastructure Megatrends Fund: Trustee since June 2021; VanEck Vectors Group of Exchange-Traded Funds: Independent Chairman of the Board of Trustees since 2008 and Trustee since 2006 (56 portfolios); and Berea College of Kentucky: Trustee since 2009, Chair of the Investment Committee since 2018 |
| | Susan B. Kerley
1951 | MainStay Funds: Chairman since 2017 and Trustee since 2007;MainStay Funds Trust:
Chairman since 2017 and Trustee since 1990** | President, Strategic Management Advisors LLC since 1990 | 78 | MainStay VP Funds Trust: Chairman since January 2017 and Trustee since 2007 (31 portfolios)**;
MainStay MacKay DefinedTerm Municipal Opportunities Fund: Chairman since 2017 and Trustee since 2011;
MainStay CBRE Global Infrastructure Megatrends Fund: Trustee since June 2021; and Legg Mason Partners Funds: Trustee since 1991 (45 portfolios) |
| | Alan R. Latshaw
1951 | MainStay Funds: Trustee since 2006;MainStay Funds Trust:
Trustee since 2007*** | Retired; Partner, Ernst & Young LLP (2002 to 2003); Partner, Arthur Andersen LLP (1989 to 2002); Consultant to the MainStay Funds Audit and Compliance Committee (2004 to 2006) | 78 | MainStay VP Funds Trust: Trustee since 2007 (31 portfolios)**;
MainStay MacKay DefinedTerm Municipal Opportunities Fund: Trustee since 2011; and
MainStay CBRE Global Infrastructure Megatrends Fund: Trustee since June 2021 |
Board of Trustees and Officers (Unaudited) (continued)
| | Name and
Year of Birth | Term of Office,
Position(s) Held and
Length of Service | Principal Occupation(s)
During Past Five Years | Number of
Portfolios in
Fund Complex
Overseen by
Trustee | Other Directorships
Held by Trustee |
| | | | | | |
| | Karen Hammond
1956 | MainStay Funds: Trustee since December 2021, Advisory Board Member (June 2021 to December 2021);MainStay Funds Trust:
Trustee since December 2021, Advisory Board Member (June 2021 to December 2021)
| Retired, Managing Director, Devonshire Investors (2007 to 2013); Senior Vice President, Fidelity Management & Research Co. (2005 to 2007); Senior Vice President and Corporate Treasurer, FMR Corp. (2003 to 2005); Chief Operating Officer, Fidelity Investments Japan (2001 to 2003) | 78 | MainStay VP Funds Trust: Trustee since December 2021, Advisory Board Member (June 2021 to December 2021) (31 Portfolios);
MainStay MacKay DefinedTerm Municipal Opportunities Fund: Trustee since December 2021, Advisory Board Member (June 2021 to December 2021);
MainStay CBRE Global Infrastructure Megatrends Fund: Trustee since December 2021, Advisory Board Member (June 2021 to December 2021);
Two Harbors Investment Corp.: Director since 2018;
Rhode Island State Investment Commission: Member since 2017; and
Blue Cross Blue Shield of Rhode Island: Director since 2019 |
| | Jacques P. Perold
1958 | MainStay Funds: Trustee since 2016, Advisory Board Member (June 2015 toDecember 2015);MainStay Funds Trust:
Trustee since January 2016, Advisory Board Member (June 2015 to December 2015) | Founder and Chief Executive Officer, CapShift Advisors LLC (since 2018); President, Fidelity Management & Research Company (2009 to 2014); President and Chief Investment Officer, Geode Capital Management, LLC (2001 to 2009) | 78 | MainStay VP Funds Trust: Trustee since January 2016, Advisory Board Member (June 2015 to December 2015) (31 portfolios);
MainStay MacKay DefinedTerm Municipal Opportunities Fund: Trustee since January 2016, Advisory Board Member (June 2015 to December 2015);
MainStay CBRE Global Infrastructure Megatrends Fund: Trustee since June 2021; Partners in Health: Trustee since 2019; Allstate Corporation: Director since 2015; and MSCI Inc.: Director since 2017 |
| | Richard S. Trutanic
1952 | MainStay Funds: Trustee since 1994;MainStay Funds Trust:
Trustee since 2007*** | Chairman and Chief Executive Officer, Somerset & Company (financial advisory firm) since 2004; Managing Director, The Carlyle Group (private investment firm) (2002 to 2004); Senior Managing Director, Partner and Board Member, Groupe Arnault S.A. (private investment firm) (1999 to 2002) | 78 | MainStay VP Funds Trust: Trustee since 2007 (31 portfolios)**;
MainStay MacKay DefinedTerm Municipal Opportunities Fund: Trustee since 2011; and MainStay CBRE Global Infrastructure Megatrends Fund: Trustee since June 2021 |
| ** | Includes prior service as a Director of MainStay VP Series Fund, Inc., the predecessor to MainStay VP Funds Trust. |
| *** | Includes prior service as a Director/Trustee of certain predecessor entities to MainStay Funds Trust. |
| 32 | MainStay WMC Enduring Capital Fund |
| | Name and
Year of Birth | Position(s) Held and
Length of Service | Principal Occupation(s)
During Past Five Years | |
| | | | | |
| | Kirk C. Lehneis
1974 | President, MainStay Funds, MainStay Funds Trust since 2017 | Chief Operating Officer and Senior Managing Director (since 2016), New York Life Investment Management LLC and New York Life Investment Management Holdings LLC; Member of the Board of Managers (since 2017) and Senior Managing Director (since 2018), NYLIFE Distributors LLC; Chairman of the Board and Senior Managing Director, NYLIM Service Company LLC (since 2017); Trustee, President and Principal Executive Officer of IndexIQ Trust, IndexIQ ETF Trust and IndexIQ Active ETF Trust (since January 2018); President, MainStay CBRE Global Infrastructure Megatrends Fund (since 2021), MainStay MacKay DefinedTerm Municipal Opportunities Fund and MainStay VP Funds Trust (since 2017); Senior Managing Director, Global Product Development (From 2015-2016); Managing Director, Product Development (2010 to 2015), New York Life Investment Management LLC | |
| | Jack R. Benintende
1964 | Treasurer and Principal Financial and Accounting Officer, MainStay Funds (since 2007), MainStay Funds Trust (since 2009) | Managing Director, New York Life Investment Management LLC (since 2007); Treasurer and Principal Financial and Accounting Officer, MainStay CBRE Global Infrastructure Megatrends Fund (since 2021), MainStay MacKay DefinedTerm Municipal Opportunities Fund (since 2011) and MainStay VP Funds Trust (since 2007)** and Assistant Treasurer, New York Life Investment Management Holdings LLC (2008 to 2012) | |
| | J. Kevin Gao
1967 | Secretary and Chief Legal Officer, MainStay Funds and MainStay Funds Trust (since 2010) | Managing Director and Associate General Counsel, New York Life Investment Management LLC (since 2010); Secretary and Chief Legal Officer and MainStay CBRE Global Infrastructure Megatrends Fund (since 2021), MainStay MacKay DefinedTerm Municipal Opportunities Fund (since 2011) and MainStay VP Funds Trust (since 2010)** | |
| | Scott T. Harrington
1959 | Vice President— Administration, MainStay Funds (since 2009), MainStay Funds Trust (since 2009) | Managing Director, New York Life Investment Management LLC (including predecessor advisory organizations) (since 2000); Member of the Board of Directors, New York Life Trust Company (since 2009); Vice President—Administration, MainStay CBRE Global Infrastructure Megatrends Fund (since 2021), MainStay MacKay DefinedTerm Municipal Opportunities Fund (since 2011) and MainStay VP Funds Trust (since 2005)** | |
| | Kevin M. Gleason
1967 | Vice President and Chief Compliance Officer, MainStay Funds and MainStay Funds Trust (since June 2022) | Vice President and Chief Compliance Officer, IndexIQ, IndexIQ ETF Trust and Index IQ Active ETF Trust (since June 2022); Vice President and Chief Compliance Officer, MainStay CBRE Global Infrastructure Megatrends Fund, MainStay VP Funds Trust and MainStay MacKay DefinedTerm Municipal Opportunities Fund (since June 2022); Senior Vice President, Voya Investment Management and Chief Compliance Officer, Voya Family of Funds (2012-2022) | |
| * | The officers listed above are considered to be “interested persons” of the MainStay Group of Funds, MainStay VP Funds Trust, MainStay CBRE Global Infrastructure Megatrends Fund and MainStay MacKay DefinedTerm Municipal Opportunities Fund within the meaning of the 1940 Act because of their affiliation with the MainStay Group of Funds, New York Life Insurance Company and/or its affiliates, including New York Life Investment Management LLC, NYLIM Service Company LLC, NYLIFE Securities LLC and/or NYLIFE Distributors LLC, as described in detail in the column captioned “Principal Occupation(s) During Past Five Years.” Officers are elected annually by the Board. |
| ** | Includes prior service as an Officer of MainStay VP Series Fund, Inc., the predecessor to MainStay VP Funds Trust. |
Officers of the Trust (Who are not Trustees)*
This page intentionally left blank.
Equity
U.S. Equity
MainStay Epoch U.S. Equity Yield Fund
MainStay S&P 500 Index Fund1
MainStay Winslow Large Cap Growth Fund
MainStay WMC Enduring Capital Fund
MainStay WMC Growth Fund
MainStay WMC Small Companies Fund
MainStay WMC Value Fund
International Equity
MainStay Epoch International Choice Fund
MainStay MacKay International Equity Fund
MainStay WMC International Research Equity Fund
Emerging Markets Equity
MainStay Candriam Emerging Markets Equity Fund
Global Equity
MainStay Epoch Capital Growth Fund
MainStay Epoch Global Equity Yield Fund
Fixed Income
Taxable Income
MainStay Candriam Emerging Markets Debt Fund
MainStay Floating Rate Fund
MainStay MacKay High Yield Corporate Bond Fund
MainStay MacKay Short Duration High Yield Fund
MainStay MacKay Strategic Bond Fund
MainStay MacKay Total Return Bond Fund
MainStay MacKay U.S. Infrastructure Bond Fund
MainStay Short Term Bond Fund
Tax-Exempt Income
MainStay MacKay California Tax Free Opportunities Fund2
MainStay MacKay High Yield Municipal Bond Fund
MainStay MacKay New York Tax Free Opportunities Fund3
MainStay MacKay Short Term Municipal Fund
MainStay MacKay Strategic Municipal Allocation Fund
MainStay MacKay Tax Free Bond Fund
Money Market
MainStay Money Market Fund
Mixed Asset
MainStay Balanced Fund
MainStay Income Builder Fund
MainStay MacKay Convertible Fund
Speciality
MainStay CBRE Global Infrastructure Fund
MainStay CBRE Real Estate Fund
MainStay Cushing MLP Premier Fund
Asset Allocation
MainStay Conservative Allocation Fund
MainStay Conservative ETF Allocation Fund
MainStay Defensive ETF Allocation Fund
MainStay Equity Allocation Fund
MainStay Equity ETF Allocation Fund
MainStay ESG Multi-Asset Allocation Fund
MainStay Growth Allocation Fund
MainStay Growth ETF Allocation Fund
MainStay Moderate Allocation Fund
MainStay Moderate ETF Allocation Fund
Manager
New York Life Investment Management LLC
New York, New York
Subadvisors
Candriam4
Strassen, Luxembourg
CBRE Investment Management Listed Real Assets LLC
Radnor, Pennsylvania
Cushing Asset Management, LP
Dallas, Texas
Epoch Investment Partners, Inc.
New York, New York
MacKay Shields LLC4
New York, New York
NYL Investors LLC4
New York, New York
Wellington Management Company LLP
Boston, Massachusetts
Winslow Capital Management, LLC
Minneapolis, Minnesota
Legal Counsel
Dechert LLP
Washington, District of Columbia
Independent Registered Public Accounting Firm
KPMG LLP
Philadelphia, Pennsylvania
Distributor
NYLIFE Distributors LLC4
Jersey City, New Jersey
Custodian
JPMorgan Chase Bank, N.A.
New York, New York
1.
Prior to February 28, 2022, the Fund's name was MainStay MacKay S&P 500 Index Fund.
| 2. | This Fund is registered for sale in AZ, CA, NV, OR, TX, UT, WA and MI (Class A and Class I shares only), and CO, FL, GA, HI, ID, MA, MD, NH, NJ and NY (Class I shares only). |
| 3. | This Fund is registered for sale in CA, CT, DE, FL, MA, NJ, NY and VT. |
| 4. | An affiliate of New York Life Investment Management LLC. |
Not part of the Annual Report
For more information
800-624-6782
newyorklifeinvestments.com
“New York Life Investments” is both a service mark, and the common trade name, of certain investment advisors affiliated with New York Life Insurance Company. The MainStay Funds® are managed by New York Life Investment Management LLC and distributed by NYLIFE Distributors LLC, 30 Hudson Street, Jersey City, NJ 07302, a wholly owned subsidiary of New York Life Insurance Company. NYLIFE Distributors LLC is a Member FINRA/SIPC.
©2022 NYLIFE Distributors LLC. All rights reserved.
| 5013911.2MS229-22 | MSWEC11-12/22 |
(NYLIM) NL528
MainStay WMC Value Fund
Message from the President and Annual Report
October 31, 2022
Sign up for e-delivery of your shareholder reports. For full details on e-delivery, including who can participate and what you can receive via e-delivery,
please log in to newyorklifeinvestments.com/accounts.
| Not FDIC/NCUA Insured | Not a Deposit | May Lose Value | No Bank Guarantee | Not Insured by Any Government Agency |
This page intentionally left blank
Message from the President
A series of economic and geopolitical challenges undermined equity and fixed-income markets during the 12-month reporting period ended October 31, 2022. Stocks and bonds alike trended lower in the face of sharply rising interest rates, increasing inflationary pressures, slowing economic growth and Russia’s invasion of Ukraine.
The reporting period began on a mixed note, with concerns about the spreading Omicron variant of the COVID-19 virus and increasingly hawkish statements from the U.S. Federal Reserve (the “Fed”) regarding mounting inflation, countered by bullish sentiment stemming from U.S. economic growth and strong corporate earnings. In January 2022, markets turned decisively negative as comments from the Fed raised the likelihood of rate hikes as early as March, and Russia issued increasingly aggressive threats toward Ukraine. The onset of Russia’s invasion in February exacerbated global inflationary pressures while increasing investor uncertainty. Domestic supply shortages, international trade imbalances and rising inflation caused GDP (gross domestic product) to contract in the first and second quarters of the year, although employment and consumer spending proved resilient. Prices for petroleum surged to multi-year highs, while many key agricultural chemicals and industrial metals climbed as well. Accelerating inflationary forces prompted the Fed to implement its most aggressive interest rate increases since the 1980s with a series of five sharp rate hikes, raising the federal funds rate from a range of 0.00% to 0.25% in March to 3.00% to 3.25% in September, with additional rate hikes expected before the end of the year. International central banks generally followed suit, raising rates by varying degrees in efforts to curb local inflation, although most increases remained significantly more modest than those in the United States. Relatively high U.S. interest rates and risk-averse international sentiment pushed U.S. dollar values higher compared to most other currencies, with the ensuing negative impact on global prices for food, fuel and other key, U.S.-dollar-denominated products.
The effects of these interrelated challenges were felt throughout U.S. and international financial markets. The S&P 500® Index, a widely regarded benchmark of U.S. market performance, declined by more than 14% during the reporting period. Although the energy sector generated strong gains, bolstered by elevated oil and gas prices, most other industry areas recorded losses. The more cyclical and growth-oriented sectors of consumer discretionary, real estate and information technology delivered the
weakest returns, while the traditionally defensive and value-oriented consumer staples, utilities and health care sectors outperformed. International stocks lagged compared to their U.S. counterparts, with some emerging markets, such as China, suffering particularly steep losses. A few markets, however, including Brazil, Mexico and the United Arab Emirates, ended the reporting period with little change. Fixed-income markets saw bond prices broadly decline as yields rose along with interest rates. Short-term yields rose faster than long-term yields, producing a yield curve inversion from July through the end of the reporting period, with long-term rates remaining below short-term rates. While floating-rate instruments, which feature variable interest rates that allow investors to benefit from a rising rate environment, provided a degree of insulation from inflation-driven trends, they were not immune to the market’s widespread declines.
While the Fed acknowledges the costs of rising rates in terms of weaker GDP growth and unsettled financial markets over the short term, its primary focus continues to be the longer-term economic impact of inflation. With the latest figures as of the date of this report showing that inflation remains above 8%, versus a target rate of just 2%, the Fed clearly has a distance yet to go, making further rate increases and market volatility more likely in the coming months. The question remains as to whether the Fed and other central banks will manage a so-called “soft landing,” curbing inflation while avoiding a persistent economic slowdown. If they prove successful, we expect that favorable inflation trends and increasingly attractive valuations in both equity and bond markets should eventually translate into sustainable improvements in the investment environment.
Whatever actions the Fed takes and however financial markets react, as a MainStay investor, you can depend on us to continue providing the insight, expertise and service that have long defined New York Life Investments. Thank you for trusting us to help you meet your investment needs.
Sincerely,
Kirk C. Lehneis
President
The opinions expressed are as of the date of this report and are subject to change. There is no guarantee that any forecast made will come to pass. This material does not constitute investment advice and is not intended as an endorsement of any specific investment. Past performance is no guarantee of future results.
Not part of the Annual Report
Investors should refer to the Fund’s Summary Prospectus and/or Prospectus and consider the Fund’s investment objectives, strategies, risks, charges and expenses carefully before investing. The Summary Prospectus and/or Prospectus contain this and other information about the Fund. You may obtain copies of the Fund’s Summary Prospectus, Prospectus and Statement of Additional Information, which includes information about The MainStay Funds' Trustees, free of charge, upon request, by calling toll-free 800-624-6782, by writing to NYLIFE Distributors LLC, Attn: MainStay Marketing Department, 30 Hudson Street, Jersey City, NJ 07302 or by sending an e-mail to MainStayShareholderServices@nylim.com. These documents are also available via the MainStay Funds’ website at newyorklifeinvestments.com. Please read the Fund’s Summary Prospectus and/or Prospectus carefully before investing.
Investment and Performance Comparison (Unaudited)
Performance data quoted represents past performance. Past performance is no guarantee of future results. Because of market volatility and other factors, current performance may be lower or higher than the figures shown. Investment return and principal value will fluctuate, and as a result, when shares are redeemed, they may be worth more or less than their original cost. The graph below depicts the historical performance of Class I shares of the Fund. Performance will vary from class to class based on differences in class-specific expenses and sales charges. For performance information current to the most recent month-end, please call 800-624-6782 or visit newyorklifeinvestments.com.
The performance table and graph do not reflect the deduction of taxes that a shareholder would pay on distributions or Fund share redemptions. Total returns reflect maximum applicable sales charges as indicated in the table below, if any, changes in share price, and reinvestment of dividend and capital gain distributions. The graph assumes the initial investment amount shown below and reflects the deduction of all sales charges that would have applied for the period of investment. Performance figures may reflect certain fee waivers and/or expense limitations, without which total returns may have been lower. For more information on share classes and current fee waivers and/or expense limitations (if any), please refer to the Notes to Financial Statements.

| Average Annual Total Returns for the Year-Ended October 31, 2022 |
| Class | Sales Charge | | Inception
Date1 | One
Year | Five
Years | Ten Years
or Since
Inception | Gross
Expense
Ratio2 |
| Class A Shares | Maximum 5.5% Initial Sales Charge | With sales charges | 6/9/1999 | -8.03% | 10.07% | 11.32% | 1.02% |
| | | Excluding sales charges | | -2.68 | 11.33 | 11.96 | 1.02 |
| Investor Class Shares3 | Maximum 5% Initial Sales Charge | With sales charges | 2/28/2008 | -7.77 | 9.80 | 11.09 | 1.32 |
| | | Excluding sales charges | | -2.91 | 11.05 | 11.72 | 1.32 |
| Class B Shares4 | Maximum 5% CDSC | With sales charges | 6/9/1999 | -5.82 | 10.08 | 10.88 | 2.07 |
| | if Redeemed Within the First Six Years of Purchase | Excluding sales charges | | -3.66 | 10.22 | 10.88 | 2.07 |
| Class C Shares | Maximum 1% CDSC | With sales charges | 6/9/1999 | -4.09 | 10.22 | 10.88 | 2.07 |
| | if Redeemed Within One Year of Purchase | Excluding sales charges | | -3.66 | 10.22 | 10.88 | 2.07 |
| Class I Shares | No Sales Charge | | 1/21/1971 | -2.37 | 11.63 | 12.25 | 0.77 |
| Class R1 Shares | No Sales Charge | | 1/2/2004 | -2.54 | 11.50 | 12.12 | 0.87 |
| Class R2 Shares | No Sales Charge | | 1/2/2004 | -2.79 | 11.21 | 11.84 | 1.12 |
| Class R3 Shares | No Sales Charge | | 4/28/2006 | -3.03 | 10.93 | 11.57 | 1.37 |
| Class R6 Shares | No Sales Charge | | 4/26/2021 | -2.37 | N/A | 2.72 | 0.72 |
| 1. | Effective April 26, 2021, the Fund replaced its subadvisor, changed its investment objective and modified its principal investment strategies. Therefore, the performance information shown in this report prior to April 26, 2021 reflects that of the Fund’s prior subadvisor, investment objective and principal investment strategies. |
| 2. | The gross expense ratios presented reflect the Fund’s “Total Annual Fund Operating Expenses” from the most recent Prospectus, as supplemented, and may differ from other expense ratios disclosed in this report. |
| 3. | Prior to June 30, 2020, the maximum initial sales charge was 5.5%, which is reflected in the applicable average annual total return figures shown. |
| 4. | Class B shares are closed to all new purchases as well as additional investments by existing Class B shareholders. |
The footnotes on the next page are an integral part of the table and graph and should be carefully read in conjunction with them.
| Benchmark Performance* | One
Year | Five
Years | Ten
Years |
| Russell 1000® Value Index1 | -7.00% | 7.21% | 10.30% |
| Russell 3000® Index2 | -16.52 | 9.87 | 12.46 |
| Morningstar Large Value Category Average3 | -4.60 | 7.43 | 9.85 |
| * | Returns for indices reflect no deductions for fees, expenses or taxes, except for foreign withholding taxes where applicable. Results assume reinvestment of all dividends and capital gains. An investment cannot be made directly in an index. |
| 1. | The Fund has selected the Russell 1000® Value Index as its primary benchmark as a replacement for the Russell 3000® Index because it believes that the Russell 1000® Value Index is more reflective of its principal investment strategies. The Russell 1000® Value Index measures the performance of the large-cap value segment of the U.S. equity universe. It includes those Russell 1000® Index companies with lower price-to-book ratios and lower expected growth values. |
| 2. | Prior to April 26, 2021, the Russell 3000® Index was the Fund's primary broad-based securities market index for comparison purposes. The Russell 3000® Index measures the performance of the largest 3,000 U.S. companies representing approximately 98% of the investable U.S. equity market. |
| 3. | The Morningstar Large Value Category Average is representative of funds that invest primarily in big U.S. companies that are less expensive or growing more slowly than other large-cap stocks. Results are based on average total returns of similar funds with all dividends and capital gain distributions reinvested. |
The footnotes on the preceding page are an integral part of the table and graph and should be carefully read in conjunction with them.
Cost in Dollars of a $1,000 Investment in MainStay WMC Value Fund (Unaudited)
The example below is intended to describe the fees and expenses borne by shareholders during the six-month period from May 1, 2022 to October 31, 2022, and the impact of those costs on your investment.
Example
As a shareholder of the Fund you incur two types of costs: (1) transaction costs, including exchange fees and sales charges (loads) on purchases (as applicable), and (2) ongoing costs, including management fees, distribution and/or service (12b-1) fees and other Fund expenses (as applicable). This example is intended to help you understand your ongoing costs (in dollars) of investing in the Fund and to compare these costs with the ongoing costs of investing in other mutual funds. The example is based on an investment of $1,000 made at the beginning of the six-month period and held for the entire period from May 1, 2022 to October 31, 2022.
This example illustrates your Fund’s ongoing costs in two ways:
Actual Expenses
The second and third data columns in the table below provide information about actual account values and actual expenses. You may use the information in these columns, together with the amount you invested, to estimate the expenses that you paid during the six months ended October 31, 2022. Simply divide your account value by $1,000 (for example, an
$8,600 account value divided by $1,000 = 8.6), then multiply the result by the number under the heading entitled “Expenses Paid During Period” to estimate the expenses you paid on your account during this period.
Hypothetical Example for Comparison Purposes
The fourth and fifth data columns in the table below provide information about hypothetical account values and hypothetical expenses based on the Fund’s actual expense ratio and an assumed rate of return of 5% per year before expenses, which is not the Fund’s actual return. The hypothetical account values and expenses may not be used to estimate the actual ending account balances or expenses you paid for the six-month period shown. You may use this information to compare the ongoing costs of investing in the Fund with the ongoing costs of investing in other mutual funds. To do so, compare this 5% hypothetical example with the 5% hypothetical examples that appear in the shareholder reports of the other mutual funds.
Please note that the expenses shown in the table are meant to highlight your ongoing costs only and do not reflect any transactional costs, such as exchange fees or sales charges (loads). Therefore, the fourth and fifth data columns of the table are useful in comparing ongoing costs only and will not help you determine the relative total costs of owning different funds. In addition, if these transactional costs were included, your costs would have been higher.
| Share Class | Beginning
Account
Value
5/1/22 | Ending Account
Value (Based
on Actual
Returns and
Expenses)
10/31/22 | Expenses
Paid
During
Period1 | Ending Account
Value (Based
on Hypothetical
5% Annualized
Return and
Actual Expenses)
10/31/22 | Expenses
Paid
During
Period1 | Net Expense
Ratio
During
Period2 |
| Class A Shares | $1,000.00 | $995.40 | $5.13 | $1,020.06 | $ 5.19 | 1.02% |
| Investor Class Shares | $1,000.00 | $994.30 | $6.18 | $1,019.00 | $ 6.26 | 1.23% |
| Class B Shares | $1,000.00 | $990.70 | $9.93 | $1,015.22 | $10.06 | 1.98% |
| Class C Shares | $1,000.00 | $990.70 | $9.93 | $1,015.22 | $10.06 | 1.98% |
| Class I Shares | $1,000.00 | $997.00 | $3.52 | $1,021.68 | $ 3.57 | 0.70% |
| Class R1 Shares | $1,000.00 | $996.20 | $4.43 | $1,020.77 | $ 4.48 | 0.88% |
| Class R2 Shares | $1,000.00 | $994.80 | $5.63 | $1,019.56 | $ 5.70 | 1.12% |
| Class R3 Shares | $1,000.00 | $993.60 | $6.88 | $1,018.30 | $ 6.97 | 1.37% |
| Class R6 Shares | $1,000.00 | $997.00 | $3.52 | $1,021.68 | $ 3.57 | 0.70% |
| 1. | Expenses are equal to the Fund’s annualized expense ratio of each class multiplied by the average account value over the period, divided by 365 and multiplied by 184 (to reflect the six-month period). The table above represents the actual expenses incurred during the six-month period. In addition to the fees and expenses which the Fund bears directly, it also indirectly bears a pro rata share of the fees and expenses of the underlying funds in which it invests. Such indirect expenses are not included in the above-reported expense figures. |
| 2. | Expenses are equal to the Fund's annualized expense ratio to reflect the six-month period. |
Industry Composition as of October 31, 2022 (Unaudited)
| Pharmaceuticals | 8.9% |
| Oil, Gas & Consumable Fuels | 7.5 |
| Banks | 7.0 |
| Capital Markets | 6.8 |
| Health Care Providers & Services | 5.3 |
| Insurance | 4.7 |
| Aerospace & Defense | 4.7 |
| Health Care Equipment & Supplies | 4.4 |
| Semiconductors & Semiconductor Equipment | 4.3 |
| Specialty Retail | 4.1 |
| Equity Real Estate Investment Trusts | 3.8 |
| Communications Equipment | 3.7 |
| Food Products | 3.0 |
| Building Products | 2.6 |
| Electric Utilities | 2.5 |
| IT Services | 2.4 |
| Interactive Media & Services | 2.0 |
| Entertainment | 1.6 |
| Electronic Equipment, Instruments & Components | 1.6 |
| Multi–Utilities | 1.4% |
| Machinery | 1.3 |
| Beverages | 1.2 |
| Electrical Equipment | 1.2 |
| Personal Products | 1.2 |
| Auto Components | 1.2 |
| Gas Utilities | 1.2 |
| Real Estate Management & Development | 1.1 |
| Diversified Consumer Services | 1.0 |
| Road & Rail | 1.0 |
| Household Durables | 1.0 |
| Containers & Packaging | 1.0 |
| Media | 1.0 |
| Chemicals | 1.0 |
| Short–Term Investment | 4.0 |
| Other Assets, Less Liabilities | –0.7 |
| | 100.0% |
See Portfolio of Investments beginning on page 11 for specific holdings within these categories. The Fund's holdings are subject to change.
Top Ten Holdings and/or Issuers Held as of October 31, 2022 (excluding short-term investments) (Unaudited)
| 1. | JPMorgan Chase & Co. |
| 2. | Pfizer, Inc. |
| 3. | ConocoPhillips |
| 4. | Cisco Systems, Inc. |
| 5. | Elevance Health, Inc. |
| 6. | Morgan Stanley |
| 7. | Alphabet, Inc., Class C |
| 8. | Merck & Co., Inc. |
| 9. | MetLife, Inc. |
| 10. | Eli Lilly and Co. |
Portfolio Management Discussion and Analysis (Unaudited)
Questions answered by portfolio manager Adam H. Illfelder, CFA, of Wellington Management Company LLP, the Fund’s Subadvisor.
How did Mainstay WMC Value Fund perform relative to its benchmarks and peer group during the 12 months ended October 31, 2022?
For the 12 months ended October 31, 2022, Class I shares of MainStay WMC Value Fund returned −2.37%, outperforming the −7.00% return of the Fund’s benchmark, the Russell 1000® Value Index (the “Index”), and the −16.52% return of the Russell 3000 Index®, the Fund’s former benchmark. Over the same period, Class I shares also outperformed the −4.60% return of the Morningstar Large Growth Category Average.1
What factors affected the Fund’s relative performance during the reporting period?
The Fund outperformed the Index over the reporting period primarily due to security selection. Strong selection in financials and health care was partially offset by weaker selection in materials. Sector allocation, a result of our bottom-up stock selection process, weighed on relative results. The negative allocation effect was driven by the Fund’s underweight position in energy and an overweight position in information technology, although this was partially offset by the positive impact of an underweight allocation to communication services.
During the reporting period, which sectors were the strongest positive contributors to the Fund’s relative performance and which sectors were particularly weak?
During the reporting period, the financials, health care and industrials sectors provided the strongest positive contributions to relative performance. (Contributions take weightings and total returns into account.) Over the same period, the energy sector detracted most notably from the Fund’s relative performance.
During the reporting period, which individual stocks made the strongest positive contributions to the Fund’s absolute performance and which stocks detracted the most?
The individual stocks that made the strongest contribution to the Fund’s absolute performance included oil and natural gas company ConocoPhillips and pharmaceutical company Eli Lilly. Shares of ConocoPhillips rose significantly as the oil and gas sector benefited from higher oil prices driven by a supply/demand imbalance. In addition, ConocoPhillips management announced a $5 billion increase in planned 2022 return of capital, now totaling $15 billion. Shares of Eli Lilly rose as the company reported notable pipeline achievements including FDA approval for Tirzepatide, a type II diabetes treatment. Competitors of Eli Lilly reported breakthrough trial results for their Alzheimer’s drugs, fueling optimism over Donanemab, Eli Lilly Alzheimer’s drug. Both
positions were still held in the Fund as of the end of the reporting period.
The holdings that detracted most significantly from absolute performance were Meta Platforms, a U.S.-based social technology company, and Google’s parent company Alphabet. Meta Platforms shares fell during the reporting period after management released disappointing quarterly results, with slowing growth in the e-commerce market weighing on Meta Platforms' advertising revenues. Investor concern grew as Meta Platforms discussed continued high capital commitments planned for its investments in the Metaverse. Shares of Alphabet declined as the broader technology sector sold off on recession fears and concerns over lower advertising spending. Toward the end of the same period, Alphabet reported weaker-than-expected third-quarter revenue, reinforcing these concerns. The Fund continued to own Alphabet as of the end of the reporting period, but exited its position in Meta Platforms.
What were some of the Fund’s largest purchases and sales during the reporting period?
During the reporting period, the Fund initiated positions in Qualcomm, a semiconductor company, and Coterra Energy, a U.S.-based diversified energy company created by the strategic merger between Cabot Oil & Gas and Cimarex Energy. The Fund purchased a position in Qualcomm after the stock traded down on concerns over industry-wide supply chain issues and a broader re-evaluation of the technology sector. However, we believe Qualcomm is well positioned to benefit from a slower-than-expected shakeout of Apple’s attempt to in-source chip production, significant modem share gain in the latest Samsung phones, and rapid growth through diversification into the automobile space. The Fund purchased shares of Coterra Energy as we favored the 50/50 balance of its oil and gas businesses given the defensive profile it provides, even in challenged markets. We believe both of the merging entities have good cost structures, strong balance sheets and attractive reserves life. In terms of valuation, the new company’s stock traded cheaper than its peers, and the stated dividend policy makes the capital return profile attractive.
During the same period, the Fund eliminated its holding of Bank of America, a U.S.-based financial services company, and trimmed its position in UnitedHealth Group, a U.S.-based insurance company; we believe there are more compelling risk-reward profiles elsewhere.
How did the Fund’s sector weightings change during the reporting period?
The Fund’s largest increases in sector exposure relative to the Index were in the consumer staples, real estate and consumer
| 1. | See page 5 for other share class returns, which may be higher or lower than Class I share returns. See page 6 for more information on benchmark and peer group returns. |
discretionary sectors, while the most significant decreases were in financials, materials and information technology.
How was the Fund positioned at the end of the reporting period?
As of October 31, 2022, the Fund held its largest overweight exposures relative to the Index in the information technology, health care and consumer discretionary sectors. As of the same date, the Fund’s most significant underweight exposures were in communication services, materials and financials.
The opinions expressed are those of the portfolio manager as of the date of this report and are subject to change. There is no guarantee that any forecasts will come to pass. This material does not constitute investment advice and is not intended as an endorsement of any specific investment.
| 10 | MainStay WMC Value Fund |
Portfolio of Investments October 31, 2022†
| | Shares | Value |
| Common Stocks 96.7% |
| Aerospace & Defense 4.7% |
| General Dynamics Corp. | 53,732 | $ 13,422,253 |
| L3Harris Technologies, Inc. | 67,170 | 16,555,390 |
| Raytheon Technologies Corp. | 181,135 | 17,175,221 |
| | | 47,152,864 |
| Auto Components 1.2% |
| Gentex Corp. | 455,028 | 12,053,692 |
| Banks 7.0% |
| JPMorgan Chase & Co. | 250,594 | 31,544,773 |
| M&T Bank Corp. | 93,561 | 15,752,865 |
| PNC Financial Services Group, Inc. (The) | 75,702 | 12,250,855 |
| Truist Financial Corp. | 247,629 | 11,091,303 |
| | | 70,639,796 |
| Beverages 1.2% |
| Keurig Dr Pepper, Inc. | 324,605 | 12,607,658 |
| Building Products 2.6% |
| Fortune Brands Home & Security, Inc. | 163,601 | 9,868,413 |
| Johnson Controls International plc | 288,842 | 16,706,621 |
| | | 26,575,034 |
| Capital Markets 6.8% |
| Ares Management Corp. | 198,365 | 15,042,018 |
| Blackstone, Inc. | 115,985 | 10,570,873 |
| LPL Financial Holdings, Inc. | 39,212 | 10,024,548 |
| Morgan Stanley | 250,770 | 20,605,771 |
| Raymond James Financial, Inc. | 105,026 | 12,407,771 |
| | | 68,650,981 |
| Chemicals 1.0% |
| Axalta Coating Systems Ltd. (a) | 429,804 | 10,023,029 |
| Communications Equipment 3.7% |
| Cisco Systems, Inc. | 532,490 | 24,191,021 |
| F5, Inc. (a) | 92,134 | 13,166,870 |
| | | 37,357,891 |
| Containers & Packaging 1.0% |
| Sealed Air Corp. | 215,508 | 10,262,491 |
| Diversified Consumer Services 1.0% |
| H&R Block, Inc. | 256,753 | 10,565,386 |
| | Shares | Value |
| |
| Electric Utilities 2.5% |
| Duke Energy Corp. | 139,698 | $ 13,017,060 |
| Exelon Corp. | 329,938 | 12,732,307 |
| | | 25,749,367 |
| Electrical Equipment 1.2% |
| Emerson Electric Co. | 142,909 | 12,375,919 |
| Electronic Equipment, Instruments & Components 1.6% |
| Corning, Inc. | 487,866 | 15,694,649 |
| Entertainment 1.6% |
| Electronic Arts, Inc. | 126,096 | 15,883,052 |
| Equity Real Estate Investment Trusts 3.8% |
| Gaming and Leisure Properties, Inc. | 296,671 | 14,869,150 |
| Host Hotels & Resorts, Inc. | 621,578 | 11,735,393 |
| Welltower, Inc. | 191,942 | 11,716,140 |
| | | 38,320,683 |
| Food Products 3.0% |
| Archer-Daniels-Midland Co. | 162,737 | 15,782,234 |
| Mondelez International, Inc., Class A | 241,746 | 14,862,544 |
| | | 30,644,778 |
| Gas Utilities 1.2% |
| Atmos Energy Corp. | 112,880 | 12,027,364 |
| Health Care Equipment & Supplies 4.4% |
| Becton Dickinson and Co. | 58,521 | 13,809,200 |
| Boston Scientific Corp. (a) | 339,640 | 14,641,881 |
| Medtronic plc | 184,205 | 16,088,465 |
| | | 44,539,546 |
| Health Care Providers & Services 5.3% |
| Centene Corp. (a) | 183,780 | 15,645,191 |
| Elevance Health, Inc. | 38,520 | 21,061,581 |
| UnitedHealth Group, Inc. | 29,706 | 16,491,286 |
| | | 53,198,058 |
| Household Durables 1.0% |
| Lennar Corp., Class A | 127,953 | 10,325,807 |
| Insurance 4.7% |
| Chubb Ltd. | 83,046 | 17,845,755 |
| MetLife, Inc. | 266,530 | 19,512,661 |
| Progressive Corp. (The) | 79,105 | 10,157,082 |
| | | 47,515,498 |
The notes to the financial statements are an integral part of, and should be read in conjunction with, the financial statements.
11
Portfolio of Investments October 31, 2022† (continued)
| | Shares | Value |
| Common Stocks (continued) |
| Interactive Media & Services 2.0% |
| Alphabet, Inc., Class C (a) | 216,980 | $ 20,539,327 |
| IT Services 2.4% |
| Amdocs Ltd. | 140,575 | 12,133,028 |
| Global Payments, Inc. | 102,696 | 11,734,045 |
| | | 23,867,073 |
| Machinery 1.3% |
| Middleby Corp. (The) (a) | 96,776 | 13,535,091 |
| Media 1.0% |
| Omnicom Group, Inc. | 138,327 | 10,063,289 |
| Multi-Utilities 1.4% |
| Sempra Energy | 94,821 | 14,312,282 |
| Oil, Gas & Consumable Fuels 7.5% |
| ConocoPhillips | 207,069 | 26,109,330 |
| Coterra Energy, Inc. | 535,481 | 16,669,524 |
| EOG Resources, Inc. | 130,625 | 17,832,925 |
| Phillips 66 | 149,915 | 15,634,635 |
| | | 76,246,414 |
| Personal Products 1.2% |
| Unilever plc, Sponsored ADR | 269,472 | 12,263,671 |
| Pharmaceuticals 8.9% |
| AstraZeneca plc, Sponsored ADR | 204,647 | 12,035,290 |
| Eli Lilly and Co. | 52,837 | 19,131,749 |
| Merck & Co., Inc. | 198,483 | 20,086,480 |
| Pfizer, Inc. | 619,538 | 28,839,494 |
| Roche Holding AG | 31,298 | 10,394,118 |
| | | 90,487,131 |
| Real Estate Management & Development 1.1% |
| CBRE Group, Inc., Class A (a) | 158,059 | 11,212,706 |
| | Shares | | Value |
| |
| Road & Rail 1.0% |
| Knight-Swift Transportation Holdings, Inc. | 218,043 | | $ 10,472,605 |
| Semiconductors & Semiconductor Equipment 4.3% |
| Analog Devices, Inc. | 128,552 | | 18,334,086 |
| Micron Technology, Inc. | 201,983 | | 10,927,280 |
| QUALCOMM, Inc. | 120,815 | | 14,215,093 |
| | | | 43,476,459 |
| Specialty Retail 4.1% |
| Home Depot, Inc. (The) | 61,891 | | 18,327,782 |
| TJX Cos., Inc. (The) | 181,403 | | 13,079,156 |
| Victoria's Secret & Co. (a) | 265,176 | | 9,970,618 |
| | | | 41,377,556 |
Total Common Stocks
(Cost $905,590,002) | | | 980,017,147 |
| Short-Term Investment 4.0% |
| Affiliated Investment Company 4.0% |
| MainStay U.S. Government Liquidity Fund, 2.905% (b) | 41,010,357 | | 41,010,357 |
Total Short-Term Investment
(Cost $41,010,357) | | | 41,010,357 |
Total Investments
(Cost $946,600,359) | 100.7% | | 1,021,027,504 |
| Other Assets, Less Liabilities | (0.7) | | (7,352,615) |
| Net Assets | 100.0% | | $ 1,013,674,889 |
| † | Percentages indicated are based on Fund net assets. |
| (a) | Non-income producing security. |
| (b) | Current yield as of October 31, 2022. |
Investments in Affiliates (in 000's)
Investments in issuers considered to be affiliate(s) of the Fund during the year ended October 31, 2022 for purposes of Section 2(a)(3) of the Investment Company Act of 1940, as amended, were as follows:
| Affiliated Investment Companies | Value,
Beginning
of Year | Purchases
at Cost | Proceeds
from
Sales | Net
Realized
Gain/(Loss)
on Sales | Change in
Unrealized
Appreciation/
(Depreciation) | Value,
End of
Year | Dividend
Income | Other
Distributions | Shares
End of
Year |
| MainStay U.S. Government Liquidity Fund | $ 10,778 | $ 239,146 | $ (208,914) | $ — | $ — | $ 41,010 | $ 160 | $ — | 41,010 |
The notes to the financial statements are an integral part of, and should be read in conjunction with, the financial statements.
| 12 | MainStay WMC Value Fund |
| Abbreviation(s): |
| ADR—American Depositary Receipt |
The following is a summary of the fair valuations according to the inputs used as of October 31, 2022, for valuing the Fund’s assets:
| Description | Quoted
Prices in
Active
Markets for
Identical
Assets
(Level 1) | | Significant
Other
Observable
Inputs
(Level 2) | | Significant
Unobservable
Inputs
(Level 3) | | Total |
| Asset Valuation Inputs | | | | | | | |
| Investments in Securities (a) | | | | | | | |
| Common Stocks | $ 980,017,147 | | $ — | | $ — | | $ 980,017,147 |
| Short-Term Investment | | | | | | | |
| Affiliated Investment Company | 41,010,357 | | — | | — | | 41,010,357 |
| Total Investments in Securities | $ 1,021,027,504 | | $ — | | $ — | | $ 1,021,027,504 |
| (a) | For a complete listing of investments and their industries, see the Portfolio of Investments. |
The notes to the financial statements are an integral part of, and should be read in conjunction with, the financial statements.
13
Statement of Assets and Liabilities as of October 31, 2022
| Assets |
Investment in unaffiliated securities, at value
(identified cost $905,590,002) | $ 980,017,147 |
Investment in affiliated investment companies, at value
(identified cost $41,010,357) | 41,010,357 |
| Cash | 70,482 |
| Receivables: | |
| Fund shares sold | 1,214,494 |
| Dividends | 597,913 |
| Securities lending | 117 |
| Other assets | 77,885 |
| Total assets | 1,022,988,395 |
| Liabilities |
| Payables: | |
| Investment securities purchased | 8,096,714 |
| Manager (See Note 3) | 510,655 |
| Fund shares redeemed | 329,237 |
| NYLIFE Distributors (See Note 3) | 136,357 |
| Transfer agent (See Note 3) | 125,439 |
| Shareholder communication | 82,165 |
| Professional fees | 19,752 |
| Custodian | 5,574 |
| Accrued expenses | 7,613 |
| Total liabilities | 9,313,506 |
| Net assets | $1,013,674,889 |
| Composition of Net Assets |
| Shares of beneficial interest outstanding (par value of $.01 per share) unlimited number of shares authorized | $ 353,599 |
| Additional paid-in-capital | 888,267,551 |
| | 888,621,150 |
| Total distributable earnings (loss) | 125,053,739 |
| Net assets | $1,013,674,889 |
| Class A | |
| Net assets applicable to outstanding shares | $522,936,813 |
| Shares of beneficial interest outstanding | 18,603,922 |
| Net asset value per share outstanding | $ 28.11 |
| Maximum sales charge (5.50% of offering price) | 1.64 |
| Maximum offering price per share outstanding | $ 29.75 |
| Investor Class | |
| Net assets applicable to outstanding shares | $ 56,060,953 |
| Shares of beneficial interest outstanding | 1,995,785 |
| Net asset value per share outstanding | $ 28.09 |
| Maximum sales charge (5.00% of offering price) | 1.48 |
| Maximum offering price per share outstanding | $ 29.57 |
| Class B | |
| Net assets applicable to outstanding shares | $ 8,044,551 |
| Shares of beneficial interest outstanding | 396,478 |
| Net asset value and offering price per share outstanding | $ 20.29 |
| Class C | |
| Net assets applicable to outstanding shares | $ 14,563,534 |
| Shares of beneficial interest outstanding | 717,337 |
| Net asset value and offering price per share outstanding | $ 20.30 |
| Class I | |
| Net assets applicable to outstanding shares | $137,117,361 |
| Shares of beneficial interest outstanding | 4,534,866 |
| Net asset value and offering price per share outstanding | $ 30.24 |
| Class R1 | |
| Net assets applicable to outstanding shares | $ 172,325 |
| Shares of beneficial interest outstanding | 6,011 |
| Net asset value and offering price per share outstanding | $ 28.67 |
| Class R2 | |
| Net assets applicable to outstanding shares | $ 1,034,263 |
| Shares of beneficial interest outstanding | 36,328 |
| Net asset value and offering price per share outstanding | $ 28.47 |
| Class R3 | |
| Net assets applicable to outstanding shares | $ 1,471,022 |
| Shares of beneficial interest outstanding | 52,278 |
| Net asset value and offering price per share outstanding | $ 28.14 |
| Class R6 | |
| Net assets applicable to outstanding shares | $272,274,067 |
| Shares of beneficial interest outstanding | 9,016,919 |
| Net asset value and offering price per share outstanding | $ 30.20 |
The notes to the financial statements are an integral part of, and should be read in conjunction with, the financial statements.
| 14 | MainStay WMC Value Fund |
Statement of Operations for the year ended October 31, 2022
| Investment Income (Loss) |
| Income | |
| Dividends-unaffiliated (net of foreign tax withholding of $46,209) | $ 22,776,088 |
| Dividends-affiliated | 159,639 |
| Securities lending, net | 6,024 |
| Other | 73 |
| Total income | 22,941,824 |
| Expenses | |
| Manager (See Note 3) | 6,802,967 |
| Distribution/Service—Class A (See Note 3) | 1,315,088 |
| Distribution/Service—Investor Class (See Note 3) | 149,127 |
| Distribution/Service—Class B (See Note 3) | 103,696 |
| Distribution/Service—Class C (See Note 3) | 133,636 |
| Distribution/Service—Class R2 (See Note 3) | 2,600 |
| Distribution/Service—Class R3 (See Note 3) | 6,121 |
| Transfer agent (See Note 3) | 708,908 |
| Registration | 148,334 |
| Professional fees | 124,680 |
| Shareholder communication | 95,704 |
| Trustees | 21,010 |
| Custodian | 16,643 |
| Shareholder service (See Note 3) | 2,314 |
| Miscellaneous | 34,221 |
| Total expenses before waiver/reimbursement | 9,665,049 |
| Expense waiver/reimbursement from Manager (See Note 3) | (107,460) |
| Net expenses | 9,557,589 |
| Net investment income (loss) | 13,384,235 |
| Realized and Unrealized Gain (Loss) |
| Net realized gain (loss) on: | |
| Unaffiliated investment transactions | 43,069,233 |
| Foreign currency transactions | 1,549 |
| Net realized gain (loss) | 43,070,782 |
| Net change in unrealized appreciation (depreciation) on: | |
| Unaffiliated investments | (83,055,351) |
| Translation of other assets and liabilities in foreign currencies | (4,196) |
| Net change in unrealized appreciation (depreciation) | (83,059,547) |
| Net realized and unrealized gain (loss) | (39,988,765) |
| Net increase (decrease) in net assets resulting from operations | $(26,604,530) |
The notes to the financial statements are an integral part of, and should be read in conjunction with, the financial statements.
15
Statements of Changes in Net Assets
for the years ended October 31, 2022 and October 31, 2021
| | 2022 | 2021 |
| Increase (Decrease) in Net Assets |
| Operations: | | |
| Net investment income (loss) | $ 13,384,235 | $ 6,951,234 |
| Net realized gain (loss) | 43,070,782 | 620,768,124 |
| Net change in unrealized appreciation (depreciation) | (83,059,547) | (247,726,816) |
| Net increase (decrease) in net assets resulting from operations | (26,604,530) | 379,992,542 |
| Distributions to shareholders: | | |
| Class A | (254,684,263) | (16,313,673) |
| Investor Class | (30,552,543) | (2,713,691) |
| Class B | (7,017,069) | (590,306) |
| Class C | (6,589,112) | (589,734) |
| Class I | (44,509,475) | (17,065,424) |
| Class R1 | (21,242) | (1,674) |
| Class R2 | (492,154) | (28,927) |
| Class R3 | (528,702) | (95,950) |
| Class R6 | (161,084,996) | — |
| Total distributions to shareholders | (505,479,556) | (37,399,379) |
| Capital share transactions: | | |
| Net proceeds from sales of shares | 167,876,878 | 36,516,229 |
| Net asset value of shares issued to shareholders in reinvestment of distributions | 492,255,863 | 36,436,026 |
| Cost of shares redeemed | (213,638,603) | (224,285,447) |
| Increase (decrease) in net assets derived from capital share transactions | 446,494,138 | (151,333,192) |
| Net increase (decrease) in net assets | (85,589,948) | 191,259,971 |
| Net Assets |
| Beginning of year | 1,099,264,837 | 908,004,866 |
| End of year | $1,013,674,889 | $1,099,264,837 |
The notes to the financial statements are an integral part of, and should be read in conjunction with, the financial statements.
| 16 | MainStay WMC Value Fund |
Financial Highlights selected per share data and ratios
| | Year Ended October 31, |
| Class A | 2022 | | 2021 | | 2020 | | 2019 | | 2018 |
| Net asset value at beginning of year | $ 55.21 | | $ 39.49 | | $ 42.24 | | $ 41.20 | | $ 43.76 |
| Net investment income (loss) (a) | 0.36 | | 0.30 | | 0.21 | | 0.26 | | 0.23 |
| Net realized and unrealized gain (loss) | (1.68) | | 17.09 | | 0.55 | | 4.88 | | 1.79 |
| Total from investment operations | (1.32) | | 17.39 | | 0.76 | | 5.14 | | 2.02 |
| Less distributions: | | | | | | | | | |
| From net investment income | (0.38) | | (0.25) | | (0.31) | | (0.28) | | (0.21) |
| From net realized gain on investments | (25.40) | | (1.42) | | (3.20) | | (3.82) | | (4.37) |
| Total distributions | (25.78) | | (1.67) | | (3.51) | | (4.10) | | (4.58) |
| Net asset value at end of year | $ 28.11 | | $ 55.21 | | $ 39.49 | | $ 42.24 | | $ 41.20 |
| Total investment return (b) | (2.68)% | | 45.14% | | 1.66% | | 13.54% | | 4.88% |
| Ratios (to average net assets)/Supplemental Data: | | | | | | | | | |
| Net investment income (loss) | 1.21% | | 0.60% | | 0.55% | | 0.67% | | 0.57% |
| Net expenses (c) | 1.02%(d) | | 1.06% | | 1.10%(e) | | 1.11% | | 1.10% |
| Portfolio turnover rate | 37% | | 23% | | 16% | | 20% | | 15% |
| Net assets at end of year (in 000’s) | $ 522,937 | | $ 547,299 | | $ 389,530 | | $ 427,040 | | $ 384,637 |
| (a) | Per share data based on average shares outstanding during the year. |
| (b) | Total investment return is calculated exclusive of sales charges and assumes the reinvestment of dividends and distributions. For periods of less than one year, total return is not annualized. |
| (c) | In addition to the fees and expenses which the Fund bears directly, it also indirectly bears a pro-rata share of the fees and expenses of the underlying funds in which it invests. Such indirect expenses are not included in the above expense ratios. |
| (d) | Expense waiver/reimbursement less than 0.01%. |
| (e) | Net of interest expense which is less than one-tenth of a percent. |
| | Year Ended October 31, |
| Investor Class | 2022 | | 2021 | | 2020 | | 2019 | | 2018 |
| Net asset value at beginning of year | $ 55.08 | | $ 39.40 | | $ 42.17 | | $ 41.15 | | $ 43.68 |
| Net investment income (loss) (a) | 0.29 | | 0.14 | | 0.10 | | 0.18 | | 0.17 |
| Net realized and unrealized gain (loss) | (1.69) | | 17.09 | | 0.53 | | 4.86 | | 1.78 |
| Total from investment operations | (1.40) | | 17.23 | | 0.63 | | 5.04 | | 1.95 |
| Less distributions: | | | | | | | | | |
| From net investment income | (0.19) | | (0.13) | | (0.20) | | (0.20) | | (0.11) |
| From net realized gain on investments | (25.40) | | (1.42) | | (3.20) | | (3.82) | | (4.37) |
| Total distributions | (25.59) | | (1.55) | | (3.40) | | (4.02) | | (4.48) |
| Net asset value at end of year | $ 28.09 | | $ 55.08 | | $ 39.40 | | $ 42.17 | | $ 41.15 |
| Total investment return (b) | (2.91)% | | 44.73% | | 1.35% | | 13.27% | | 4.69% |
| Ratios (to average net assets)/Supplemental Data: | | | | | | | | | |
| Net investment income (loss) | 0.97% | | 0.28% | | 0.25% | | 0.46% | | 0.39% |
| Net expenses (c) | 1.26% | | 1.36% | | 1.40%(d) | | 1.33% | | 1.29% |
| Expenses (before waiver/reimbursement) (c) | 1.26%(e) | | 1.36% | | 1.41% | | 1.38% | | 1.31% |
| Portfolio turnover rate | 37% | | 23% | | 16% | | 20% | | 15% |
| Net assets at end of year (in 000's) | $ 56,061 | | $ 66,193 | | $ 69,423 | | $ 80,733 | | $ 76,844 |
| (a) | Per share data based on average shares outstanding during the year. |
| (b) | Total investment return is calculated exclusive of sales charges and assumes the reinvestment of dividends and distributions. For periods of less than one year, total return is not annualized. |
| (c) | In addition to the fees and expenses which the Fund bears directly, it also indirectly bears a pro-rata share of the fees and expenses of the underlying funds in which it invests. Such indirect expenses are not included in the above expense ratios. |
| (d) | Net of interest expense which is less than one-tenth of a percent. |
| (e) | Expense waiver/reimbursement less than 0.01%. |
The notes to the financial statements are an integral part of, and should be read in conjunction with, the financial statements.
17
Financial Highlights selected per share data and ratios
| | Year Ended October 31, |
| Class B | 2022 | | 2021 | | 2020 | | 2019 | | 2018 |
| Net asset value at beginning of year | $ 47.03 | | $ 33.97 | | $ 36.88 | | $ 36.53 | | $ 39.43 |
| Net investment income (loss) (a) | 0.05 | | (0.20) | | (0.16) | | (0.09) | | (0.13) |
| Net realized and unrealized gain (loss) | (1.39) | | 14.68 | | 0.45 | | 4.26 | | 1.60 |
| Total from investment operations | (1.34) | | 14.48 | | 0.29 | | 4.17 | | 1.47 |
| Less distributions: | | | | | | | | | |
| From net realized gain on investments | (25.40) | | (1.42) | | (3.20) | | (3.82) | | (4.37) |
| Net asset value at end of year | $ 20.29 | | $ 47.03 | | $ 33.97 | | $ 36.88 | | $ 36.53 |
| Total investment return (b) | (3.66)% | | 43.67% | | 0.57% | | 12.45% | | 3.91% |
| Ratios (to average net assets)/Supplemental Data: | | | | | | | | | |
| Net investment income (loss) | 0.23% | | (0.47)% | | (0.48)% | | (0.27)% | | (0.35)% |
| Net expenses (c) | 2.01% | | 2.11% | | 2.15%(d) | | 2.08% | | 2.04% |
| Expenses (before waiver/reimbursement) (c) | 2.01%(e) | | 2.11% | | 2.16% | | 2.13% | | 2.06% |
| Portfolio turnover rate | 37% | | 23% | | 16% | | 20% | | 15% |
| Net assets at end of year (in 000’s) | $ 8,045 | | $ 13,100 | | $ 14,212 | | $ 21,088 | | $ 26,571 |
| (a) | Per share data based on average shares outstanding during the year. |
| (b) | Total investment return is calculated exclusive of sales charges and assumes the reinvestment of dividends and distributions. For periods of less than one year, total return is not annualized. |
| (c) | In addition to the fees and expenses which the Fund bears directly, it also indirectly bears a pro-rata share of the fees and expenses of the underlying funds in which it invests. Such indirect expenses are not included in the above expense ratios. |
| (d) | Net of interest expense which is less than one-tenth of a percent. |
| (e) | Expense waiver/reimbursement less than 0.01%. |
| | Year Ended October 31, |
| Class C | 2022 | | 2021 | | 2020 | | 2019 | | 2018 |
| Net asset value at beginning of year | $ 47.04 | | $ 33.98 | | $ 36.88 | | $ 36.53 | | $ 39.43 |
| Net investment income (loss) (a) | 0.05 | | (0.21) | | (0.16) | | (0.07) | | (0.14) |
| Net realized and unrealized gain (loss) | (1.39) | | 14.69 | | 0.46 | | 4.24 | | 1.61 |
| Total from investment operations | (1.34) | | 14.48 | | 0.30 | | 4.17 | | 1.47 |
| Less distributions: | | | | | | | | | |
| From net realized gain on investments | (25.40) | | (1.42) | | (3.20) | | (3.82) | | (4.37) |
| Net asset value at end of year | $ 20.30 | | $ 47.04 | | $ 33.98 | | $ 36.88 | | $ 36.53 |
| Total investment return (b) | (3.66)% | | 43.65% | | 0.60% | | 12.45% | | 3.91% |
| Ratios (to average net assets)/Supplemental Data: | | | | | | | | | |
| Net investment income (loss) | 0.22% | | (0.50)% | | (0.48)% | | (0.22)% | | (0.36)% |
| Net expenses (c) | 2.00% | | 2.11% | | 2.15%(d) | | 2.07% | | 2.04% |
| Expenses (before waiver/reimbursement) (c) | 2.01% | | 2.11% | | 2.16% | | 2.12% | | 2.06% |
| Portfolio turnover rate | 37% | | 23% | | 16% | | 20% | | 15% |
| Net assets at end of year (in 000’s) | $ 14,564 | | $ 11,119 | | $ 14,315 | | $ 22,933 | | $ 65,288 |
| (a) | Per share data based on average shares outstanding during the year. |
| (b) | Total investment return is calculated exclusive of sales charges and assumes the reinvestment of dividends and distributions. For periods of less than one year, total return is not annualized. |
| (c) | In addition to the fees and expenses which the Fund bears directly, it also indirectly bears a pro-rata share of the fees and expenses of the underlying funds in which it invests. Such indirect expenses are not included in the above expense ratios. |
| (d) | Net of interest expense which is less than one-tenth of a percent. |
The notes to the financial statements are an integral part of, and should be read in conjunction with, the financial statements.
| 18 | MainStay WMC Value Fund |
Financial Highlights selected per share data and ratios
| | Year Ended October 31, |
| Class I | 2022 | | 2021 | | 2020 | | 2019 | | 2018 |
| Net asset value at beginning of year | $ 57.43 | | $ 40.99 | | $ 43.71 | | $ 42.51 | | $ 45.00 |
| Net investment income (loss) (a) | 0.48 | | 0.30 | | 0.32 | | 0.38 | | 0.36 |
| Net realized and unrealized gain (loss) | (1.76) | | 17.91 | | 0.57 | | 5.02 | | 1.84 |
| Total from investment operations | (1.28) | | 18.21 | | 0.89 | | 5.40 | | 2.20 |
| Less distributions: | | | | | | | | | |
| From net investment income | (0.51) | | (0.35) | | (0.41) | | (0.38) | | (0.32) |
| From net realized gain on investments | (25.40) | | (1.42) | | (3.20) | | (3.82) | | (4.37) |
| Total distributions | (25.91) | | (1.77) | | (3.61) | | (4.20) | | (4.69) |
| Net asset value at end of year | $ 30.24 | | $ 57.43 | | $ 40.99 | | $ 43.71 | | $ 42.51 |
| Total investment return (b) | (2.37)% | | 45.57% | | 1.92% | | 13.80% | | 5.17% |
| Ratios (to average net assets)/Supplemental Data: | | | | | | | | | |
| Net investment income (loss) | 1.51% | | 0.61% | | 0.81% | | 0.93% | | 0.83% |
| Net expenses (c) | 0.70% | | 0.82% | | 0.85%(d) | | 0.86% | | 0.85% |
| Expenses (before waiver/reimbursement) (c) | 0.77% | | 0.83% | | 0.85% | | 0.86% | | 0.85% |
| Portfolio turnover rate | 37% | | 23% | | 16% | | 20% | | 15% |
| Net assets at end of year (in 000’s) | $ 137,117 | | $ 102,714 | | $ 417,329 | | $ 488,730 | | $ 484,839 |
| (a) | Per share data based on average shares outstanding during the year. |
| (b) | Total investment return is calculated exclusive of sales charges and assumes the reinvestment of dividends and distributions. Class I shares are not subject to sales charges. For periods of less than one year, total return is not annualized. |
| (c) | In addition to the fees and expenses which the Fund bears directly, it also indirectly bears a pro-rata share of the fees and expenses of the underlying funds in which it invests. Such indirect expenses are not included in the above expense ratios. |
| (d) | Net of interest expense which is less than one-tenth of a percent. |
| | Year Ended October 31, |
| Class R1 | 2022 | | 2021 | | 2020 | | 2019 | | 2018 |
| Net asset value at beginning of year | $ 55.81 | | $ 39.90 | | $ 42.64 | | $ 41.53 | | $ 44.07 |
| Net investment income (loss) (a) | 0.37 | | 0.38 | | 0.27 | | 0.33 | | 0.37 |
| Net realized and unrealized gain (loss) | (1.67) | | 17.27 | | 0.56 | | 4.91 | | 1.73 |
| Total from investment operations | (1.30) | | 17.65 | | 0.83 | | 5.24 | | 2.10 |
| Less distributions: | | | | | | | | | |
| From net investment income | (0.44) | | (0.32) | | (0.37) | | (0.31) | | (0.27) |
| From net realized gain on investments | (25.40) | | (1.42) | | (3.20) | | (3.82) | | (4.37) |
| Total distributions | (25.84) | | (1.74) | | (3.57) | | (4.13) | | (4.64) |
| Net asset value at end of year | $ 28.67 | | $ 55.81 | | $ 39.90 | | $ 42.64 | | $ 41.53 |
| Total investment return (b) | (2.54)% | | 45.37% | | 1.82% | | 13.71% | | 5.05% |
| Ratios (to average net assets)/Supplemental Data: | | | | | | | | | |
| Net investment income (loss) | 1.24% | | 0.75% | | 0.69% | | 0.83% | | 0.88% |
| Net expenses (c) | 0.87%(d) | | 0.91% | | 0.95%(e) | | 0.96% | | 0.95% |
| Portfolio turnover rate | 37% | | 23% | | 16% | | 20% | | 15% |
| Net assets at end of year (in 000’s) | $ 172 | | $ 57 | | $ 38 | | $ 35 | | $ 30 |
| (a) | Per share data based on average shares outstanding during the year. |
| (b) | Total investment return is calculated exclusive of sales charges and assumes the reinvestment of dividends and distributions. Class R1 shares are not subject to sales charges. For periods of less than one year, total return is not annualized. |
| (c) | In addition to the fees and expenses which the Fund bears directly, it also indirectly bears a pro-rata share of the fees and expenses of the underlying funds in which it invests. Such indirect expenses are not included in the above expense ratios. |
| (d) | Expense waiver/reimbursement less than 0.01%. |
| (e) | Net of interest expense which is less than one-tenth of a percent. |
The notes to the financial statements are an integral part of, and should be read in conjunction with, the financial statements.
19
Financial Highlights selected per share data and ratios
| | Year Ended October 31, |
| Class R2 | 2022 | | 2021 | | 2020 | | 2019 | | 2018 |
| Net asset value at beginning of year | $ 55.57 | | $ 39.74 | | $ 42.48 | | $ 41.38 | | $ 43.93 |
| Net investment income (loss) (a) | 0.33 | | 0.25 | | 0.18 | | 0.23 | | 0.21 |
| Net realized and unrealized gain (loss) | (1.70) | | 17.21 | | 0.55 | | 4.89 | | 1.78 |
| Total from investment operations | (1.37) | | 17.46 | | 0.73 | | 5.12 | | 1.99 |
| Less distributions: | | | | | | | | | |
| From net investment income | (0.33) | | (0.21) | | (0.27) | | (0.20) | | (0.17) |
| From net realized gain on investments | (25.40) | | (1.42) | | (3.20) | | (3.82) | | (4.37) |
| Total distributions | (25.73) | | (1.63) | | (3.47) | | (4.02) | | (4.54) |
| Net asset value at end of year | $ 28.47 | | $ 55.57 | | $ 39.74 | | $ 42.48 | | $ 41.38 |
| Total investment return (b) | (2.79)% | | 45.01% | | 1.57% | | 13.42% | | 4.77% |
| Ratios (to average net assets)/Supplemental Data: | | | | | | | | | |
| Net investment income (loss) | 1.10% | | 0.50% | | 0.45% | | 0.59% | | 0.50% |
| Net expenses (c) | 1.12%(d) | | 1.16% | | 1.20%(e) | | 1.21% | | 1.20% |
| Portfolio turnover rate | 37% | | 23% | | 16% | | 20% | | 15% |
| Net assets at end of year (in 000’s) | $ 1,034 | | $ 1,066 | | $ 716 | | $ 780 | | $ 881 |
| (a) | Per share data based on average shares outstanding during the year. |
| (b) | Total investment return is calculated exclusive of sales charges and assumes the reinvestment of dividends and distributions. Class R2 shares are not subject to sales charges. For periods of less than one year, total return is not annualized. |
| (c) | In addition to the fees and expenses which the Fund bears directly, it also indirectly bears a pro-rata share of the fees and expenses of the underlying funds in which it invests. Such indirect expenses are not included in the above expense ratios. |
| (d) | Expense waiver/reimbursement less than 0.01%. |
| (e) | Net of interest expense which is less than one-tenth of a percent. |
| | Year Ended October 31, |
| Class R3 | 2022 | | 2021 | | 2020 | | 2019 | | 2018 |
| Net asset value at beginning of year | $ 55.17 | | $ 39.48 | | $ 42.24 | | $ 41.15 | | $ 43.71 |
| Net investment income (loss) (a) | 0.25 | | 0.12 | | 0.07 | | 0.13 | | 0.08 |
| Net realized and unrealized gain (loss) | (1.69) | | 17.12 | | 0.54 | | 4.87 | | 1.79 |
| Total from investment operations | (1.44) | | 17.24 | | 0.61 | | 5.00 | | 1.87 |
| Less distributions: | | | | | | | | | |
| From net investment income | (0.19) | | (0.13) | | (0.17) | | (0.09) | | (0.06) |
| From net realized gain on investments | (25.40) | | (1.42) | | (3.20) | | (3.82) | | (4.37) |
| Total distributions | (25.59) | | (1.55) | | (3.37) | | (3.91) | | (4.43) |
| Net asset value at end of year | $ 28.14 | | $ 55.17 | | $ 39.48 | | $ 42.24 | | $ 41.15 |
| Total investment return (b) | (3.03)% | | 44.66% | | 1.29% | | 13.14% | | 4.51% |
| Ratios (to average net assets)/Supplemental Data: | | | | | | | | | |
| Net investment income (loss) | 0.85% | | 0.25% | | 0.19% | | 0.32% | | 0.20% |
| Net expenses (c) | 1.37%(d) | | 1.42% | | 1.45%(e) | | 1.46% | | 1.45% |
| Portfolio turnover rate | 37% | | 23% | | 16% | | 20% | | 15% |
| Net assets at end of year (in 000’s) | $ 1,471 | | $ 1,137 | | $ 2,442 | | $ 2,314 | | $ 1,931 |
| (a) | Per share data based on average shares outstanding during the year. |
| (b) | Total investment return is calculated exclusive of sales charges and assumes the reinvestment of dividends and distributions. Class R3 shares are not subject to sales charges. For periods of less than one year, total return is not annualized. |
| (c) | In addition to the fees and expenses which the Fund bears directly, it also indirectly bears a pro-rata share of the fees and expenses of the underlying funds in which it invests. Such indirect expenses are not included in the above expense ratios. |
| (d) | Expense waiver/reimbursement less than 0.01%. |
| (e) | Net of interest expense which is less than one-tenth of a percent. |
The notes to the financial statements are an integral part of, and should be read in conjunction with, the financial statements.
| 20 | MainStay WMC Value Fund |
Financial Highlights selected per share data and ratios
| | Year Ended October 31, | | April 26, 2021^ through
October 31, |
| Class R6 | 2022 | | 2021 |
| Net asset value at beginning of period | $ 57.42 | | $ 53.83* |
| Net investment income (loss) (a) | 0.49 | | 0.65 |
| Net realized and unrealized gain (loss) | (1.77) | | 2.94 |
| Total from investment operations | (1.28) | | 3.59 |
| Less distributions: | | | |
| From net investment income | (0.54) | | — |
| From net realized gain on investments | (25.40) | | — |
| Total distributions | (25.94) | | — |
| Net asset value at end of period | $ 30.20 | | $ 57.42 |
| Total investment return (b) | (2.37)% | | 6.67% |
| Ratios (to average net assets)/Supplemental Data: | | | |
| Net investment income (loss) | 1.52% | | 1.25% |
| Net expenses (c) | 0.70% | | 0.72% |
| Expenses (before waiver/reimbursement) (c) | 0.71% | | 0.72% |
| Portfolio turnover rate | 37% | | 23% |
| Net assets at end of period (in 000’s) | $ 272,274 | | $ 356,580 |
| * | Based on the net asset value of Class I as of April 26, 2021. |
| ^ | Inception date. |
| (a) | Per share data based on average shares outstanding during the period. |
| (b) | Total investment return is calculated exclusive of sales charges and assumes the reinvestment of dividends and distributions. Class R6 shares are not subject to sales charges. For periods of less than one year, total return is not annualized. |
| (c) | In addition to the fees and expenses which the Fund bears directly, it also indirectly bears a pro-rata share of the fees and expenses of the underlying funds in which it invests. Such indirect expenses are not included in the above expense ratios. |
The notes to the financial statements are an integral part of, and should be read in conjunction with, the financial statements.
21
Notes to Financial Statements
Note 1-Organization and Business
The MainStay Funds (the “Trust”) was organized on January 9, 1986, as a Massachusetts business trust. The Trust is registered under the Investment Company Act of 1940, as amended (the “1940 Act”), as an open-end management investment company, and is comprised of twelve funds (collectively referred to as the "Funds"). These financial statements and notes relate to the MainStay WMC Value Fund (the "Fund"), a “diversified” fund, as that term is defined in the 1940 Act, as interpreted or modified by regulatory authorities having jurisdiction, from time to time.
The following table lists the Fund's share classes that have been registered and commenced operations:
| Class | Commenced Operations |
| Class A | June 9, 1999 |
| Investor Class | February 28, 2008 |
| Class B | June 9, 1999 |
| Class C | June 9, 1999 |
| Class I | January 21, 1971 |
| Class R1 | January 2, 2004 |
| Class R2 | January 2, 2004 |
| Class R3 | April 28, 2006 |
| Class R6 | April 26, 2021 |
| SIMPLE Class | N/A* |
| * | SIMPLE Class shares were registered for sale effective as of August 31, 2020 but have not yet commenced operations. |
Class B shares of the MainStay Group of Funds are closed to all new purchases as well as additional investments by existing Class B shareholders. Existing Class B shareholders may continue to reinvest dividends and capital gains distributions, as well as exchange their Class B shares for Class B shares of other funds in the MainStay Group of Funds as permitted by the current exchange privileges. Class B shareholders continue to be subject to any applicable contingent deferred sales charge ("CDSC") at the time of redemption. All other features of the Class B shares, including but not limited to the fees and expenses applicable to Class B shares, remain unchanged. Unless redeemed, Class B shareholders will remain in Class B shares of their respective fund until the Class B shares are converted to Class A or Investor Class shares pursuant to the applicable conversion schedule.
Class A and Investor Class shares are offered at net asset value (“NAV”) per share plus an initial sales charge. No initial sales charge applies to investments of $1 million or more (and certain other qualified purchases) in Class A and Investor Class shares. A CDSC of 1.00% may be imposed on certain redemptions of Class A and Investor Class shares made within 18 months of the date of purchase on shares that were purchased without an initial sales charge. Class C shares are offered at NAV without an initial sales charge, although a 1.00% CDSC may be imposed on certain redemptions of such shares made within one year of the date of purchase of Class C shares. Class I and Class R6 shares are offered at NAV without a sales charge. SIMPLE Class shares are expected to be offered at NAV without a sales charge if such shares are offered in the
future. Depending upon eligibility, Class C shares convert to either Class A or Investor Class shares at the end of the calendar quarter eight years after the date they were purchased. Additionally, Investor Class shares may convert automatically to Class A shares. Under certain circumstances and as may be permitted by the Trust’s multiple class plan pursuant to Rule 18f-3 under the 1940 Act, specified share classes of the Fund may be converted to one or more other share classes of the Fund as disclosed in the capital share transactions within these Notes. The classes of shares have the same voting (except for issues that relate solely to one class), dividend, liquidation and other rights, and the same terms and conditions, except that under distribution plans pursuant to Rule 12b-1 under the 1940 Act, Class C shares are subject to higher distribution and/or service fees than Class A, Investor Class and SIMPLE Class shares. Class I, Class R1 and Class R6 shares are not subject to a distribution and/or service fee. Class R1, Class R2 and Class R3 shares are subject to a shareholder service fee, which is in addition to fees paid under the distribution plans for Class R2 and Class R3 shares.
The Fund's investment objective is to seek long-term appreciation of capital.
Note 2–Significant Accounting Policies
The Fund is an investment company and accordingly follows the investment company accounting and reporting guidance of the Financial Accounting Standards Board (“FASB”) Accounting Standards Codification Topic 946 Financial Services—Investment Companies. The Fund prepares its financial statements in accordance with generally accepted accounting principles (“GAAP”) in the United States of America and follows the significant accounting policies described below.
(A) Securities Valuation. Investments are usually valued as of the close of regular trading on the New York Stock Exchange (the "Exchange") (usually 4:00 p.m. Eastern time) on each day the Fund is open for business ("valuation date").
Effective September 8, 2022, and pursuant to Rule 2a-5 under the 1940 Act, the Board of Trustees of the Trust (the "Board") designated New York Life Investment Management LLC (“New York Life Investments” or the "Manager") as its Valuation Designee (the "Valuation Designee"). The Valuation Designee is responsible for performing fair valuations relating to all investments in the Fund’s portfolio for which market quotations are not readily available; periodically assessing and managing material valuation risks; establishing and applying fair value methodologies; testing fair valuation methodologies; evaluating and overseeing pricing services; segregation of valuation and portfolio management functions; providing quarterly, annual and prompt reporting to the Board, as appropriate; identifying potential conflicts of interest; and maintaining appropriate records. The Valuation Designee has established a valuation committee ("Valuation Committee") to assist in carrying out the Valuation Designee’s responsibilities and establish prices of securities for which market quotations are not readily available. The Fund’s and the Valuation Designee's policies and procedures ("Valuation Procedures") govern the Valuation Designee’s selection and application of methodologies for
| 22 | MainStay WMC Value Fund |
determining and calculating the fair value of Fund investments. The Valuation Designee may value Fund portfolio securities for which market quotations are not readily available and other Fund assets utilizing inputs from pricing services and other third-party sources (together, “Pricing Sources”). The Valuation Committee meets (in person, via electronic mail or via teleconference) on an ad-hoc basis to determine fair valuations and on a quarterly basis to review fair value events (excluding fair valuations from pricing services), including valuation risks and back-testing results, and preview reports to the Board.
The Valuation Committee establishes prices of securities for which market quotations are not readily available based on such methodologies and measurements on a regular basis after considering information that is reasonably available and deemed relevant by the Valuation Committee. The Board shall oversee the Valuation Designee and review fair valuation materials on a prompt, quarterly and annual basis and approve proposed revisions to the Valuation Procedures.
Investments for which market quotations are not readily available are valued at fair value as determined in good faith pursuant to the Valuation Procedures. A market quotation is readily available only when that quotation is a quoted price (unadjusted) in active markets for identical investments that the Fund can access at the measurement date, provided that a quotation will not be readily available if it is not reliable. Fair value measurements are determined within a framework that establishes a three-tier hierarchy that maximizes the use of observable market data and minimizes the use of unobservable inputs to establish a classification of fair value measurements for disclosure purposes. "Inputs" refer broadly to the assumptions that market participants would use in pricing the asset or liability, including assumptions about risk, such as the risk inherent in a particular valuation technique used to measure fair value using a pricing model and/or the risk inherent in the inputs for the valuation technique. Inputs may be observable or unobservable. Observable inputs reflect the assumptions market participants would use in pricing the asset or liability based on market data obtained from sources independent of the Fund. Unobservable inputs reflect the Fund’s own assumptions about the assumptions market participants would use in pricing the asset or liability based on the information available. The inputs or methodology used for valuing assets or liabilities may not be an indication of the risks associated with investing in those assets or liabilities. The three-tier hierarchy of inputs is summarized below.
| • | Level 1—quoted prices (unadjusted) in active markets for an identical asset or liability |
| • | Level 2—other significant observable inputs (including quoted prices for a similar asset or liability in active markets, interest rates and yield curves, prepayment speeds, credit risk, etc.) |
| • | Level 3—significant unobservable inputs (including the Fund's own assumptions about the assumptions that market participants would use in measuring fair value of an asset or liability) |
The level of an asset or liability within the fair value hierarchy is based on the lowest level of an input, both individually and in the aggregate, that is
significant to the fair value measurement. The aggregate value by input level of the Fund’s assets and liabilities as of October 31, 2022, is included at the end of the Portfolio of Investments.
The Fund may use third-party vendor evaluations, whose prices may be derived from one or more of the following standard inputs, among others:
| • Broker/dealer quotes | • Benchmark securities |
| • Two-sided markets | • Reference data (corporate actions or material event notices) |
| • Bids/offers | • Monthly payment information |
| • Industry and economic events | • Reported trades |
An asset or liability for which a market quotation is not readily available is valued by methods deemed reasonable in good faith by the Valuation Committee, following the Valuation Procedures to represent fair value. Under these procedures, the Valuation Designee generally uses a market-based approach which may use related or comparable assets or liabilities, recent transactions, market multiples, book values and other relevant information. The Valuation Designee may also use an income-based valuation approach in which the anticipated future cash flows of the asset or liability are discounted to calculate fair value. Discounts may also be applied due to the nature and/or duration of any restrictions on the disposition of the asset or liability. Fair value represents a good faith approximation of the value of a security. Fair value determinations involve the consideration of a number of subjective factors, an analysis of applicable facts and circumstances and the exercise of judgment. As a result, it is possible that the fair value for a security determined in good faith in accordance with the Valuation Procedures may differ from valuations for the same security determined for other funds using their own valuation procedures. Although the Valuation Procedures are designed to value a security at the price the Fund may reasonably expect to receive upon the security's sale in an orderly transaction, there can be no assurance that any fair value determination thereunder would, in fact, approximate the amount that the Fund would actually realize upon the sale of the security or the price at which the security would trade if a reliable market price were readily available. During the year ended October 31, 2022, there were no material changes to the fair value methodologies.
Securities which may be valued in this manner include, but are not limited to: (i) a security for which trading has been halted or suspended or otherwise does not have a readily available market quotation on a given day; (ii) a debt security that has recently gone into default and for which there is not a current market quotation; (iii) a security of an issuer that has entered into a restructuring; (iv) a security that has been delisted from a national exchange; (v) a security subject to trading collars for which no or limited trading takes place; and (vi) a security whose principal market has been temporarily closed at a time when, under normal conditions, it would be open. Securities valued in this manner are generally categorized as Level 2 or 3 in the hierarchy.
Equity securities are valued at the last quoted sales prices as of the close of regular trading on the relevant exchange on each valuation date.
Notes to Financial Statements (continued)
Securities that are not traded on the valuation date are valued at the mean of the last quoted bid and ask prices. Prices are normally taken from the principal market in which each security trades. These securities are generally categorized as Level 1 in the hierarchy.
Investments in mutual funds, including money market funds, are valued at their respective NAVs at the close of business each day on the valuation date. These securities are generally categorized as Level 1 in the hierarchy.
Temporary cash investments acquired in excess of 60 days to maturity at the time of purchase are valued using the latest bid prices or using valuations based on a matrix system (which considers such factors as security prices, yields, maturities and ratings), both as furnished by independent pricing services. Temporary cash investments that mature in 60 days or less at the time of purchase ("Short-Term Investments") are valued using the amortized cost method of valuation, unless the use of such method would be inappropriate. The amortized cost method involves valuing a security at its cost on the date of purchase and thereafter assuming a constant amortization to maturity of the difference between such cost and the value on maturity date. Amortized cost approximates the current fair value of a security. Securities valued using the amortized cost method are not valued using quoted prices in an active market and are generally categorized as Level 2 in the hierarchy.
The information above is not intended to reflect an exhaustive list of the methodologies that may be used to value portfolio investments. The Valuation Procedures permit the use of a variety of valuation methodologies in connection with valuing portfolio investments. The methodology used for a specific type of investment may vary based on the market data available or other considerations. The methodologies summarized above may not represent the specific means by which portfolio investments are valued on any particular business day.
(B) Income Taxes. The Fund's policy is to comply with the requirements of the Internal Revenue Code of 1986, as amended (the “Internal Revenue Code”), applicable to regulated investment companies and to distribute all of its taxable income to the shareholders of the Fund within the allowable time limits.
The Manager evaluates the Fund’s tax positions to determine if the tax positions taken meet the minimum recognition threshold in connection with accounting for uncertainties in income tax positions taken or expected to be taken for the purposes of measuring and recognizing tax liabilities in the financial statements. Recognition of tax benefits of an uncertain tax position is permitted only to the extent the position is “more likely than not” to be sustained assuming examination by taxing authorities. The Manager analyzed the Fund's tax positions taken on federal, state and local income tax returns for all open tax years (for up to three tax years) and has concluded that no provisions for federal, state and local income tax are required in the Fund's financial statements. The Fund's federal, state and local income tax and federal excise tax returns for tax years for which the applicable statutes of limitations have not
expired are subject to examination by the Internal Revenue Service and state and local departments of revenue.
(C) Dividends and Distributions to Shareholders. Dividends and distributions are recorded on the ex-dividend date. The Fund intends to declare and pay dividends from net investment income and distributions from net realized capital and currency gains, if any, at least annually. Unless a shareholder elects otherwise, all dividends and distributions are reinvested at NAV in the same class of shares of the Fund. Dividends and distributions to shareholders are determined in accordance with federal income tax regulations and may differ from determinations using GAAP.
(D) Security Transactions and Investment Income. The Fund records security transactions on the trade date. Realized gains and losses on security transactions are determined using the identified cost method. Dividend income is recognized on the ex-dividend date, net of any foreign tax withheld at the source, and interest income is accrued as earned using the effective interest rate method. Distributions received from real estate investment trusts may be classified as dividends, capital gains and/or return of capital.
Investment income and realized and unrealized gains and losses on investments of the Fund are allocated pro rata to the separate classes of shares based upon their relative net assets on the date the income is earned or realized and unrealized gains and losses are incurred.
(E) Expenses. Expenses of the Trust are allocated to the individual Funds in proportion to the net assets of the respective Funds when the expenses are incurred, except where direct allocations of expenses can be made. Expenses (other than transfer agent expenses and fees incurred under the shareholder services plans and/or the distribution plans further discussed in Note 3(B)) are allocated to separate classes of shares pro rata based upon their relative net assets on the date the expenses are incurred. The expenses borne by the Fund, including those of related parties to the Fund, are shown in the Statement of Operations.
Additionally, the Fund may invest in mutual funds, which are subject to management fees and other fees that may cause the costs of investing in mutual funds to be greater than the costs of owning the underlying securities directly. These indirect expenses of mutual funds are not included in the amounts shown as expenses in the Statement of Operations or in the expense ratios included in the Financial Highlights.
(F) Use of Estimates. In preparing financial statements in conformity with GAAP, the Manager makes estimates and assumptions that affect the reported amounts and disclosures in the financial statements. Actual results could differ from those estimates and assumptions.
(G) Foreign Currency Transactions. The Fund's books and records are maintained in U.S. dollars. Prices of securities denominated in foreign currency amounts are translated into U.S. dollars at the mean between the buying and selling rates last quoted by any major U.S. bank at the following dates:
(i) market value of investment securities, other assets and liabilities— at the valuation date; and
| 24 | MainStay WMC Value Fund |
(ii) purchases and sales of investment securities, income and expenses—at the date of such transactions.
The assets and liabilities that are denominated in foreign currency amounts are presented at the exchange rates and market values at the close of the period. The realized and unrealized changes in net assets arising from fluctuations in exchange rates and market prices of securities are not separately presented.
Net realized gain (loss) on foreign currency transactions represents net currency gains or losses realized as a result of differences between the amounts of securities sale proceeds or purchase cost, dividends, interest and withholding taxes as recorded on the Fund's books, and the U.S. dollar equivalent amount actually received or paid. Net currency gains or losses from valuing such foreign currency denominated assets and liabilities, other than investments at valuation date exchange rates, are reflected in unrealized foreign exchange gains or losses.
(H) Securities Lending. In order to realize additional income, the Fund may engage in securities lending, subject to the limitations set forth in the 1940 Act and relevant guidance by the staff of the Securities and Exchange Commission (“SEC”). If the Fund engages in securities lending, the Fund will lend through its custodian, JPMorgan Chase Bank, N.A., ("JPMorgan"), acting as securities lending agent on behalf of the Fund. Under the current arrangement, JPMorgan will manage the Fund's collateral in accordance with the securities lending agency agreement between the Fund and JPMorgan, and indemnify the Fund against counterparty risk. The loans will be collateralized by cash (which may be invested in a money market fund) and/or non-cash collateral (which may include U.S. Treasury securities and/or U.S. government agency securities issued or guaranteed by the United States government or its agencies or instrumentalities) at least equal at all times to the market value of the securities loaned. Non-cash collateral held at year end is segregated and cannot be transferred by the Fund. The Fund bears the risk of delay in recovery of, or loss of rights in, the securities loaned. The Fund may also record a realized gain or loss on securities deemed sold due to a borrower’s inability to return securities on loan. The Fund bears the risk of any loss on investment of cash collateral. The Fund will receive compensation for lending its securities in the form of fees or it will retain a portion of interest earned on the investment of any cash collateral. The Fund will also continue to receive interest and dividends on the securities loaned and any gain or loss in the market price of the securities loaned that may occur during the term of the loan will be for the account of the Fund. Income earned from securities lending activities, if any, is reflected in the Statement of Operations. As of October 31, 2022, the Fund did not have any portfolio securities on loan.
(I) Foreign Securities Risk. The ability of issuers of debt securities held by the Fund to meet their obligations may be affected by, among other things, economic or political developments in a specific country, industry or region. Debt securities are also subject to the risks associated with changes in interest rates. The Fund may invest in foreign securities, which carry certain risks that are in addition to the usual risks inherent in domestic securities. These risks include those resulting from currency
fluctuations, future adverse political or economic developments and possible imposition of currency exchange blockages or other foreign governmental laws or restrictions. These risks are likely to be greater in emerging markets than in developed markets. The ability of issuers of debt securities held by the Fund to meet their obligations may be affected by, among other things, economic or political developments in a specific country, industry or region.
(J) Indemnifications. Under the Trust’s organizational documents, its officers and trustees are indemnified against certain liabilities that may arise out of performance of their duties to the Trust. Additionally, in the normal course of business, the Fund enters into contracts with third-party service providers that contain a variety of representations and warranties and that may provide general indemnifications. The Fund's maximum exposure under these arrangements is unknown, as this would involve future claims that may be made against the Fund that have not yet occurred. The Manager believes that the risk of loss in connection with these potential indemnification obligations is remote. However, there can be no assurance that material liabilities related to such obligations will not arise in the future, which could adversely impact the Fund.
Note 3–Fees and Related Party Transactions
(A) Manager and Subadvisor. New York Life Investments, a registered investment adviser and an indirect, wholly-owned subsidiary of New York Life Insurance Company ("New York Life"), serves as the Fund's Manager, pursuant to an Amended and Restated Management Agreement ("Management Agreement"). The Manager provides offices, conducts clerical, recordkeeping and bookkeeping services and keeps most of the financial and accounting records required to be maintained by the Fund. Except for the portion of salaries and expenses that are the responsibility of the Fund, the Manager pays the salaries and expenses of all personnel affiliated with the Fund and certain operational expenses of the Fund. During a portion of the year ended October 31, 2022, the Fund reimbursed New York Life Investments in an amount equal to the portion of the compensation of the Chief Compliance Officer attributable to the Fund. Wellington Management Company LLP ("Wellington" or the "Subadvisor"), a registered investment adviser, serves as the Subadvisor to the Fund and is responsible for the day-to-day portfolio management of the Fund. Pursuant to the terms of a Subadvisory Agreement ("Subadvisory Agreement") between New York Life Investments and Wellington, New York Life Investments pays for the services of the Subadvisor.
Under the Management Agreement, the Fund pays the Manager a monthly fee for the services performed and the facilities furnished at an annual rate of the Fund’s average daily net assets as follows: 0.66% on assets up to $1 billion; 0.64% on assets from $1 billion to $3 billion; and 0.62% on assets over $3 billion. During the year ended October 31, 2022, the effective management fee rate was 0.66% of the Fund’s average daily net assets, exclusive of any applicable waivers/reimbursements.
Notes to Financial Statements (continued)
New York Life Investments has contractually agreed to waive fees and/or reimburse expenses so that Total Annual Fund Operating Expenses (excluding taxes, interest, litigation, extraordinary expenses, brokerage and other transaction expenses relating to the purchase or sale of portfolio investments, and acquired (underlying) fund fees and expenses) for Class I shares do not exceed 0.70% of its average daily net assets. In addition, New York Life Investments will waive fees and/or reimburse expenses so that Total Annual Fund Operating Expenses (excluding taxes, interest, litigation, extraordinary expenses, brokerage and other transaction expenses relating to the purchase or sale of portfolio investments, and acquired (underlying) fund fees and expenses) for Class R6 do not exceed those of Class I. This agreement will remain in effect until February 28, 2023, and shall renew automatically for one-year terms unless New York Life Investments provides written notice of termination prior to the start of the next term or upon approval of the Board.
During the year ended October 31, 2022, New York Life Investments earned fees from the Fund in the amount of $6,802,967 and waived fees and/or reimbursed expenses in the amount of $107,460 and paid the Subadvisor fees in the amount of $2,786,762.
JPMorgan provides sub-administration and sub-accounting services to the Fund pursuant to an agreement with New York Life Investments. These services include calculating the daily NAVs of the Fund, maintaining the general ledger and sub-ledger accounts for the calculation of the Fund's NAVs, and assisting New York Life Investments in conducting various aspects of the Fund's administrative operations. For providing these services to the Fund, JPMorgan is compensated by New York Life Investments.
Pursuant to an agreement between the Trust and New York Life Investments, New York Life Investments is responsible for providing or procuring certain regulatory reporting services for the Fund. The Fund will reimburse New York Life Investments for the actual costs incurred by New York Life Investments in connection with providing or procuring these services for the Fund.
(B) Distribution and Service Fees. The Trust, on behalf of the Fund, has entered into a distribution agreement with NYLIFE Distributors LLC (the “Distributor”), an affiliate of New York Life Investments. The Fund has adopted distribution plans (the “Plans”) in accordance with the provisions of Rule 12b-1 under the 1940 Act.
Pursuant to the Class A, Investor Class and Class R2 Plans, the Distributor receives a monthly fee from the Class A, Investor Class and Class R2 shares at an annual rate of 0.25% of the average daily net assets of the Class A, Investor Class and Class R2 shares for distribution and/or service activities as designated by the Distributor. Pursuant to the Class B and Class C Plans, Class B and Class C shares pay the Distributor a monthly distribution fee at an annual rate of 0.75% of the average daily net assets of the Class B and Class C shares, along with a service fee at an annual rate of 0.25% of the average daily net assets of the Class B and Class C shares, for a total 12b-1 fee of 1.00%. Pursuant
to the Class R3 Plan, Class R3 shares pay the Distributor a monthly distribution fee at an annual rate of 0.25% of the average daily net assets of the Class R3 shares, along with a service fee at an annual rate of 0.25% of the average daily net assets of the Class R3 shares, for a total 12b-1 fee of 0.50%. Class I, Class R1 and Class R6 shares are not subject to a distribution and/or service fee.
The Plans provide that the distribution and service fees are payable to the Distributor regardless of the amounts actually expended by the Distributor for distribution of the Fund's shares and service activities.
In accordance with the Shareholder Services Plans for the Class R1, Class R2 and Class R3 shares, the Manager has agreed to provide, through its affiliates or independent third parties, various shareholder and administrative support services to shareholders of the Class R1, Class R2 and Class R3 shares. For its services, the Manager, its affiliates or independent third-party service providers are entitled to a shareholder service fee accrued daily and paid monthly at an annual rate of 0.10% of the average daily net assets of the Class R1, Class R2 and Class R3 shares. This is in addition to any fees paid under the Class R2 and Class R3 Plans.
During the year ended October 31, 2022, shareholder service fees incurred by the Fund were as follows:
| |
| Class R1 | $ 50 |
| Class R2 | 1,040 |
| Class R3 | 1,224 |
(C) Sales Charges. The Fund was advised by the Distributor that the amount of initial sales charges retained on sales of Class A and Investor Class shares during the year ended October 31, 2022, were $80,814 and $7,575, respectively.
The Fund was also advised that the Distributor retained CDSCs on redemptions of Class A, Class B and Class C shares during the year ended October 31, 2022, of $485, $5 and $5,200, respectively.
(D) Transfer, Dividend Disbursing and Shareholder Servicing Agent. NYLIM Service Company LLC, an affiliate of New York Life Investments, is the Fund's transfer, dividend disbursing and shareholder servicing agent pursuant to an agreement between NYLIM Service Company LLC and the Trust. NYLIM Service Company LLC has entered into an agreement with DST Asset Manager Solutions, Inc. ("DST"), pursuant to which DST performs certain transfer agent services on behalf of NYLIM Service Company LLC. New York Life Investments has contractually agreed to limit the transfer agency expenses charged to the Fund’s share classes to a maximum of 0.35% of that share class’s average daily net assets on an annual basis after deducting any applicable Fund or class-level expense reimbursement or small account fees. This agreement will remain in effect until February 28, 2023, and shall renew automatically for one-year terms unless New York Life Investments provides written notice of termination prior to the start of the next term or upon approval of the Board. During the year ended October
| 26 | MainStay WMC Value Fund |
31, 2022, transfer agent expenses incurred by the Fund and any reimbursements, pursuant to the aforementioned Transfer Agency expense limitation agreement, were as follows:
| Class | Expense | Waived |
| Class A | $364,234 | $— |
| Investor Class | 184,642 | — |
| Class B | 32,461 | — |
| Class C | 40,666 | — |
| Class I | 72,638 | — |
| Class R1 | 35 | — |
| Class R2 | 720 | — |
| Class R3 | 853 | — |
| Class R6 | 12,659 | — |
(E) Small Account Fee. Shareholders with small accounts adversely impact the cost of providing transfer agency services. In an effort to reduce total transfer agency expenses, the Fund has implemented a small account fee on certain types of accounts. As described in the Fund's prospectus, certain shareholders with an account balance of less than $1,000 ($5,000 for Class A share accounts) are charged an annual per account fee of $20 (assessed semi-annually), the proceeds from which offset transfer agent fees as reflected in the Statement of Operations. This small account fee will not apply to certain types of accounts as described further in the Fund’s prospectus.
(F) Capital. As of October 31, 2022, New York Life and its affiliates beneficially held shares of the Fund with the values and percentages of net assets as follows:
| ‡ | Less than one-tenth of a percent. |
Note 4-Federal Income Tax
As of October 31, 2022, the cost and unrealized appreciation (depreciation) of the Fund’s investment portfolio, including applicable derivative contracts and other financial instruments, as determined on a federal income tax basis, were as follows:
| | Federal Tax
Cost | Gross
Unrealized
Appreciation | Gross
Unrealized
(Depreciation) | Net
Unrealized
Appreciation/
(Depreciation) |
| Investments in Securities | $949,611,592 | $138,150,116 | $(66,734,204) | $71,415,912 |
As of October 31, 2022, the components of accumulated gain (loss) on a tax basis were as follows:
Ordinary
income | Accumulated
Capital
and Other
Gain (Loss) | Other
Temporary
Differences | Unrealized
Appreciation
(Depreciation) | Total
Accumulated
Gain (Loss) |
| $14,477,186 | $39,164,837 | $— | $71,411,716 | $125,053,739 |
The difference between book-basis and tax-basis unrealized appreciation (depreciation) is primarily due to wash sale adjustments.
The following table discloses the current year reclassifications between total distributable earnings (loss) and additional paid-in capital arising from permanent differences; net assets as of October 31, 2022 were not affected.
| | Total
Distributable
Earnings (Loss) | Additional
Paid-In
Capital |
| | $(4,024,551) | $4,024,551 |
The reclassifications for the Fund are primarily due to equalization.
During the years ended October 31, 2022 and October 31, 2021, the tax character of distributions paid as reflected in the Statements of Changes in Net Assets was as follows:
| | 2022 | 2021 |
| Distributions paid from: | | |
| Ordinary Income | $ 44,602,455 | $ 6,062,614 |
| Long-Term Capital Gains | 460,877,101 | 31,336,765 |
| Total | $505,479,556 | $37,399,379 |
Note 5–Custodian
JPMorgan is the custodian of cash and securities held by the Fund. Custodial fees are charged to the Fund based on the Fund's net assets and/or the market value of securities held by the Fund and the number of certain transactions incurred by the Fund.
Note 6–Line of Credit
The Fund and certain other funds managed by New York Life Investments maintain a line of credit with a syndicate of banks in order to secure a source of funds for temporary purposes to meet unanticipated or excessive redemption requests.
Effective July 26, 2022, under the credit agreement (the “Credit Agreement”), the aggregate commitment amount is $600,000,000 with an additional uncommitted amount of $100,000,000. The commitment fee is an annual rate of 0.15% of the average commitment amount payable quarterly, regardless of usage, to JPMorgan, who serves as the agent to the syndicate. The commitment fee is allocated among the Fund and certain other funds managed by New York Life Investments based upon their respective net assets and other factors. Interest on any revolving credit loan is charged based upon the Federal Funds Rate, Daily Simple Secured Overnight Financing Rate ("SOFR") + 0.10%, or the
Notes to Financial Statements (continued)
Overnight Bank Funding Rate, whichever is higher. The Credit Agreement expires on July 25, 2023, although the Fund, certain other funds managed by New York Life Investments and the syndicate of banks may renew the Credit Agreement for an additional year on the same or different terms or enter into a credit agreement with a different syndicate of banks. Prior to July 26, 2022, the aggregate commitment amount and the commitment fee were the same as those under the current Credit Agreement. During the year ended October 31, 2022, there were no borrowings made or outstanding with respect to the Fund under the Credit Agreement.
Note 7–Interfund Lending Program
Pursuant to an exemptive order issued by the SEC, the Fund, along with certain other funds managed by New York Life Investments, may participate in an interfund lending program. The interfund lending program provides an alternative credit facility that permits the Fund and certain other funds managed by New York Life Investments to lend or borrow money for temporary purposes directly to or from one another, subject to the conditions of the exemptive order. During the year ended October 31, 2022, there were no interfund loans made or outstanding with respect to the Fund.
Note 8–Purchases and Sales of Securities (in 000’s)
During the year ended October 31, 2022, purchases and sales of securities, other than short-term securities, were $376,774 and $443,638, respectively.
The Fund may purchase securities from or sell securities to other portfolios managed by the Subadvisor. These interportfolio transactions are primarily used for cash management purposes and are made pursuant to Rule 17a-7 under the 1940 Act. During the year ended October 31, 2022, such purchases were $698.
Note 9–Capital Share Transactions
Transactions in capital shares for the years ended October 31, 2022 and October 31, 2021, were as follows:
| Class A | Shares | Amount |
| Year ended October 31, 2022: | | |
| Shares sold | 2,574,874 | $ 75,162,709 |
| Shares issued to shareholders in reinvestment of distributions | 8,653,260 | 244,714,188 |
| Shares redeemed | (2,898,457) | (85,207,197) |
| Net increase (decrease) in shares outstanding before conversion | 8,329,677 | 234,669,700 |
| Shares converted into Class A (See Note 1) | 365,434 | 10,680,993 |
| Shares converted from Class A (See Note 1) | (3,901) | (117,088) |
| Net increase (decrease) | 8,691,210 | $ 245,233,605 |
| Year ended October 31, 2021: | | |
| Shares sold | 393,231 | $ 19,413,350 |
| Shares issued to shareholders in reinvestment of distributions | 356,091 | 15,628,837 |
| Shares redeemed | (1,351,833) | (66,693,648) |
| Net increase (decrease) in shares outstanding before conversion | (602,511) | (31,651,461) |
| Shares converted into Class A (See Note 1) | 655,743 | 31,612,039 |
| Shares converted from Class A (See Note 1) | (4,741) | (236,242) |
| Net increase (decrease) | 48,491 | $ (275,664) |
| |
| Investor Class | Shares | Amount |
| Year ended October 31, 2022: | | |
| Shares sold | 99,246 | $ 2,910,829 |
| Shares issued to shareholders in reinvestment of distributions | 1,076,017 | 30,472,806 |
| Shares redeemed | (160,132) | (4,790,100) |
| Net increase (decrease) in shares outstanding before conversion | 1,015,131 | 28,593,535 |
| Shares converted into Investor Class (See Note 1) | 38,738 | 1,108,283 |
| Shares converted from Investor Class (See Note 1) | (259,839) | (7,693,164) |
| Net increase (decrease) | 794,030 | $ 22,008,654 |
| Year ended October 31, 2021: | | |
| Shares sold | 45,764 | $ 2,257,681 |
| Shares issued to shareholders in reinvestment of distributions | 61,674 | 2,707,491 |
| Shares redeemed | (131,621) | (6,457,578) |
| Net increase (decrease) in shares outstanding before conversion | (24,183) | (1,492,406) |
| Shares converted into Investor Class (See Note 1) | 35,932 | 1,790,628 |
| Shares converted from Investor Class (See Note 1) | (571,930) | (27,460,423) |
| Net increase (decrease) | (560,181) | $ (27,162,201) |
| |
| 28 | MainStay WMC Value Fund |
| Class B | Shares | Amount |
| Year ended October 31, 2022: | | |
| Shares sold | 13,232 | $ 270,904 |
| Shares issued to shareholders in reinvestment of distributions | 340,527 | 7,014,860 |
| Shares redeemed | (71,258) | (1,533,977) |
| Net increase (decrease) in shares outstanding before conversion | 282,501 | 5,751,787 |
| Shares converted from Class B (See Note 1) | (164,591) | (3,396,152) |
| Net increase (decrease) | 117,910 | $ 2,355,635 |
| Year ended October 31, 2021: | | |
| Shares sold | 5,188 | $ 211,148 |
| Shares issued to shareholders in reinvestment of distributions | 15,616 | 589,371 |
| Shares redeemed | (65,590) | (2,769,386) |
| Net increase (decrease) in shares outstanding before conversion | (44,786) | (1,968,867) |
| Shares converted from Class B (See Note 1) | (94,994) | (4,041,041) |
| Net increase (decrease) | (139,780) | $ (6,009,908) |
| |
| Class C | Shares | Amount |
| Year ended October 31, 2022: | | |
| Shares sold | 430,915 | $ 9,751,926 |
| Shares issued to shareholders in reinvestment of distributions | 317,250 | 6,538,534 |
| Shares redeemed | (233,253) | (4,957,547) |
| Net increase (decrease) in shares outstanding before conversion | 514,912 | 11,332,913 |
| Shares converted from Class C (See Note 1) | (33,962) | (698,007) |
| Net increase (decrease) | 480,950 | $ 10,634,906 |
| Year ended October 31, 2021: | | |
| Shares sold | 25,036 | $ 1,120,984 |
| Shares issued to shareholders in reinvestment of distributions | 15,311 | 577,993 |
| Shares redeemed | (180,583) | (7,613,414) |
| Net increase (decrease) in shares outstanding before conversion | (140,236) | (5,914,437) |
| Shares converted from Class C (See Note 1) | (44,661) | (1,880,706) |
| Net increase (decrease) | (184,897) | $ (7,795,143) |
| |
| Class I | Shares | Amount |
| Year ended October 31, 2022: | | |
| Shares sold | 2,456,778 | $ 75,283,479 |
| Shares issued to shareholders in reinvestment of distributions | 1,366,048 | 41,432,227 |
| Shares redeemed | (1,080,081) | (35,831,216) |
| Net increase (decrease) in shares outstanding before conversion | 2,742,745 | 80,884,490 |
| Shares converted into Class I (See Note 1) | 3,574 | 115,135 |
| Net increase (decrease) | 2,746,319 | $ 80,999,625 |
| Year ended October 31, 2021: | | |
| Shares sold | 211,823 | $ 10,991,191 |
| Shares issued to shareholders in reinvestment of distributions | 369,174 | 16,808,484 |
| Shares redeemed | (2,559,831) | (124,640,457) |
| Net increase (decrease) in shares outstanding before conversion | (1,978,834) | (96,840,782) |
| Shares converted into Class I (See Note 1) | 4,165 | 215,745 |
| Shares converted from Class I (See Note 1) | (6,419,247) | (345,548,082) |
| Net increase (decrease) | (8,393,916) | $(442,173,119) |
| |
| Class R1 | Shares | Amount |
| Year ended October 31, 2022: | | |
| Shares sold | 4,530 | $ 124,674 |
| Shares issued to shareholders in reinvestment of distributions | 738 | 21,242 |
| Shares redeemed | (272) | (13,072) |
| Net increase (decrease) | 4,996 | $ 132,844 |
| Year ended October 31, 2021: | | |
| Shares sold | 18 | $ 880 |
| Shares issued to shareholders in reinvestment of distributions | 38 | 1,674 |
| Net increase (decrease) | 56 | $ 2,554 |
| |
| Class R2 | Shares | Amount |
| Year ended October 31, 2022: | | |
| Shares sold | 3,099 | $ 92,709 |
| Shares issued to shareholders in reinvestment of distributions | 15,637 | 448,308 |
| Shares redeemed | (1,597) | (49,958) |
| Net increase (decrease) | 17,139 | $ 491,059 |
| Year ended October 31, 2021: | | |
| Shares sold | 1,159 | $ 56,954 |
| Shares issued to shareholders in reinvestment of distributions | 593 | 26,226 |
| Shares redeemed | (579) | (26,342) |
| Net increase (decrease) | 1,173 | $ 56,838 |
| |
Notes to Financial Statements (continued)
| Class R3 | Shares | Amount |
| Year ended October 31, 2022: | | |
| Shares sold | 14,878 | $ 418,071 |
| Shares issued to shareholders in reinvestment of distributions | 18,616 | 528,702 |
| Shares redeemed | (1,823) | (50,952) |
| Net increase (decrease) | 31,671 | $ 895,821 |
| Year ended October 31, 2021: | | |
| Shares sold | 1,591 | $ 79,036 |
| Shares issued to shareholders in reinvestment of distributions | 2,181 | 95,950 |
| Shares redeemed | (45,015) | (2,004,078) |
| Net increase (decrease) | (41,243) | $ (1,829,092) |
| |
| Class R6 | Shares | Amount |
| Year ended October 31, 2022: | | |
| Shares sold | 125,655 | $ 3,861,577 |
| Shares issued to shareholders in reinvestment of distributions | 5,318,092 | 161,084,996 |
| Shares redeemed | (2,637,087) | (81,204,584) |
| Net increase (decrease) | 2,806,660 | $ 83,741,989 |
| Year ended October 31, 2021:(a) | | |
| Shares sold | 41,870 | $ 2,385,005 |
| Shares redeemed | (250,858) | (14,080,544) |
| Net increase (decrease) in shares outstanding before conversion | (208,988) | (11,695,539) |
| Shares converted into Class R6 (See Note 1) | 6,419,247 | 345,548,082 |
| Net increase (decrease) | 6,210,259 | $ 333,852,543 |
| (a) | The inception of the class was April 26, 2021. |
Note 10–Other Matters
As of the date of this report, interest rates in the United States and many parts of the world, including certain European countries, are ascending from historically low levels. Thus, the Fund currently faces a heightened level of risk associated with rising interest rates. This could be driven by a variety of factors, including but not limited to central bank monetary policies, changing inflation or real growth rates, general economic conditions, increasing bond issuances or reduced market demand for low yielding investments.
An outbreak of COVID-19, first detected in December 2019, has developed into a global pandemic and has resulted in travel restrictions, closure of international borders, certain businesses and securities markets, restrictions on securities trading activities, prolonged quarantines, supply chain disruptions, and lower consumer demand, as well as general concern and uncertainty. In 2022, many countries lifted some or all restrictions related to COVID-19. However, the continued impact of COVID-19 and related variants is uncertain and could further adversely affect the global economy, national economies, individual issuers and capital markets in unforeseeable ways and result in a substantial and extended economic downturn. Developments that disrupt
global economies and financial markets, such as COVID-19, may magnify factors that affect the Fund's performance.
Note 11–Subsequent Events
In connection with the preparation of the financial statements of the Fund as of and for the year ended October 31, 2022, events and transactions subsequent to October 31, 2022, through the date the financial statements were issued have been evaluated by the Manager for possible adjustment and/or disclosure. No subsequent events requiring financial statement adjustment or disclosure have been identified.
| 30 | MainStay WMC Value Fund |
Report of Independent Registered Public Accounting Firm
To the Shareholders of the Fund and Board of Trustees
The MainStay Funds:
Opinion on the Financial Statements
We have audited the accompanying statement of assets and liabilities of MainStay WMC Value Fund (the Fund), one of the funds constituting The MainStay Funds, including the portfolio of investments, as of October 31, 2022, the related statement of operations for the year then ended, the statements of changes in net assets for each of the years in the two-year period then ended, and the related notes (collectively, the financial statements) and the financial highlights for each of the years or periods in the five-year period then ended. In our opinion, the financial statements and financial highlights present fairly, in all material respects, the financial position of the Fund as of October 31, 2022, the results of its operations for the year then ended, the changes in its net assets for each of the years in the two-year period then ended, and the financial highlights for each of the years or periods in the five-year period then ended, in conformity with U.S. generally accepted accounting principles.
Basis for Opinion
These financial statements and financial highlights are the responsibility of the Fund's management. Our responsibility is to express an opinion on these financial statements and financial highlights based on our audits. We are a public accounting firm registered with the Public Company Accounting Oversight Board (United States) (PCAOB) and are required to be independent with respect to the Fund in accordance with the U.S. federal securities laws and the applicable rules and regulations of the Securities and Exchange Commission and the PCAOB.
We conducted our audits in accordance with the standards of the PCAOB. Those standards require that we plan and perform the audit to obtain reasonable assurance about whether the financial statements and financial highlights are free of material misstatement, whether due to error or fraud. Our audits included performing procedures to assess the risks of material misstatement of the financial statements and financial highlights, whether due to error or fraud, and performing procedures that respond to those risks. Such procedures included examining, on a test basis, evidence regarding the amounts and disclosures in the financial statements and financial highlights. Such procedures also included confirmation of securities owned as of October 31, 2022, by correspondence with the custodian, the transfer agent and brokers; when replies were not received from brokers, we performed other auditing procedures. Our audits also included evaluating the accounting principles used and significant estimates made by management, as well as evaluating the overall presentation of the financial statements and financial highlights. We believe that our audits provide a reasonable basis for our opinion.

We have served as the auditor of one or more New York Life Investment Management investment companies since 2003.
Philadelphia, Pennsylvania
December 23, 2022
Federal Income Tax Information
(Unaudited)
The Fund is required under the Internal Revenue Code to advise shareholders in a written statement as to the federal tax status of dividends paid by the Fund during such fiscal years. Accordingly, the Fund paid $460,877,101 as long term capital gain distributions.
For the fiscal year ended October 31, 2022, the Fund designated approximately $17,716,726 under the Internal Revenue Code as qualified dividend income eligible for reduced tax rates.
The dividends paid by the Fund during the fiscal year ended October 31, 2022 should be multiplied by 35.47% to arrive at the amount eligible for the corporate dividend-received deduction.
In February 2023, shareholders will receive an IRS Form 1099-DIV or substitute Form 1099, which will show the federal tax status of the distributions received by shareholders in calendar year 2022. The amounts that will be reported on such 1099-DIV or substitute Form 1099 will be the amounts you are to use on your federal income tax return and will differ from the amounts which we must report for the Fund's fiscal year ended October 31, 2022.
Proxy Voting Policies and Procedures and Proxy Voting Record
The Fund is required to file with the SEC its proxy voting record for the 12-month period ending June 30 on Form N-PX. A description of the policies and procedures that are used to vote proxies relating to portfolio securities of the Fund is available free of charge upon request by calling 800-624-6782 or visiting the SEC’s website at www.sec.gov. The most recent Form N-PX or proxy voting record is available free of charge upon request by calling 800-624-6782; visiting newyorklifeinvestments.com; or visiting the SEC’s website at www.sec.gov.
Shareholder Reports and Quarterly Portfolio Disclosure
The Fund is required to file its complete schedule of portfolio holdings with the SEC 60 days after its first and third fiscal quarter on Form N-PORT. The Fund's holdings report is available free of charge upon request by calling New York Life Investments at 800-624-6782.
| 32 | MainStay WMC Value Fund |
Board of Trustees and Officers (Unaudited)
The Trustees and officers of the Fund are listed below. The Board oversees the MainStay Group of Funds (which consists of MainStay Funds and MainStay Funds Trust), MainStay VP Funds Trust, MainStay MacKay DefinedTerm Municipal Opportunities Fund, MainStay CBRE Global Infrastructure Megatrends Fund, the Manager and the Subadvisors, and elects the officers of the Funds who are responsible for the day-to-day operations of the Fund. Information pertaining to the Trustees and officers is set forth below. Each Trustee serves until his or her successor is
elected and qualified or until his or her resignation, death or removal. Under the Board’s retirement policy, unless an exception is made, a Trustee must tender his or her resignation by the end of the calendar year during which he or she reaches the age of 75. The business address of each Trustee and officer listed below is 51 Madison Avenue, New York, New York 10010. None of the Trustees are “interested persons” (as defined by the 1940 Act and rules adopted by the SEC thereunder) of the Fund (“Independent Trustees”).
| | Name and
Year of Birth | Term of Office,
Position(s) Held and
Length of Service | Principal Occupation(s)
During Past Five Years | Number of
Portfolios in
Fund Complex
Overseen by
Trustee | Other Directorships
Held by Trustee |
| | | | | | |
| | David H. Chow
1957 | MainStay Funds: Trustee since 2016, Advisory Board Member (June 2015 to December 2015);MainStay Funds Trust:
Trustee since January 2016, Advisory Board Member (June 2015 to December 2015) | Founder and CEO, DanCourt Management, LLC since 1999 | 78 | MainStay VP Funds Trust: Trustee since January 2016, Advisory Board Member (June 2015 to December 2015) (31 portfolios);
MainStay MacKay DefinedTerm Municipal Opportunities Fund: Trustee since January 2016, Advisory Board Member (June 2015 to December 2015);
MainStay CBRE Global Infrastructure Megatrends Fund: Trustee since June 2021; VanEck Vectors Group of Exchange-Traded Funds: Independent Chairman of the Board of Trustees since 2008 and Trustee since 2006 (56 portfolios); and Berea College of Kentucky: Trustee since 2009, Chair of the Investment Committee since 2018 |
| | Susan B. Kerley
1951 | MainStay Funds: Chairman since 2017 and Trustee since 2007;MainStay Funds Trust:
Chairman since 2017 and Trustee since 1990** | President, Strategic Management Advisors LLC since 1990 | 78 | MainStay VP Funds Trust: Chairman since January 2017 and Trustee since 2007 (31 portfolios)**;
MainStay MacKay DefinedTerm Municipal Opportunities Fund: Chairman since 2017 and Trustee since 2011;
MainStay CBRE Global Infrastructure Megatrends Fund: Trustee since June 2021; and Legg Mason Partners Funds: Trustee since 1991 (45 portfolios) |
| | Alan R. Latshaw
1951 | MainStay Funds: Trustee since 2006;MainStay Funds Trust:
Trustee since 2007*** | Retired; Partner, Ernst & Young LLP (2002 to 2003); Partner, Arthur Andersen LLP (1989 to 2002); Consultant to the MainStay Funds Audit and Compliance Committee (2004 to 2006) | 78 | MainStay VP Funds Trust: Trustee since 2007 (31 portfolios)**;
MainStay MacKay DefinedTerm Municipal Opportunities Fund: Trustee since 2011; and
MainStay CBRE Global Infrastructure Megatrends Fund: Trustee since June 2021 |
Board of Trustees and Officers (Unaudited) (continued)
| | Name and
Year of Birth | Term of Office,
Position(s) Held and
Length of Service | Principal Occupation(s)
During Past Five Years | Number of
Portfolios in
Fund Complex
Overseen by
Trustee | Other Directorships
Held by Trustee |
| | | | | | |
| | Karen Hammond
1956 | MainStay Funds: Trustee since December 2021, Advisory Board Member (June 2021 to December 2021);MainStay Funds Trust:
Trustee since December 2021, Advisory Board Member (June 2021 to December 2021)
| Retired, Managing Director, Devonshire Investors (2007 to 2013); Senior Vice President, Fidelity Management & Research Co. (2005 to 2007); Senior Vice President and Corporate Treasurer, FMR Corp. (2003 to 2005); Chief Operating Officer, Fidelity Investments Japan (2001 to 2003) | 78 | MainStay VP Funds Trust: Trustee since December 2021, Advisory Board Member (June 2021 to December 2021) (31 Portfolios);
MainStay MacKay DefinedTerm Municipal Opportunities Fund: Trustee since December 2021, Advisory Board Member (June 2021 to December 2021);
MainStay CBRE Global Infrastructure Megatrends Fund: Trustee since December 2021, Advisory Board Member (June 2021 to December 2021);
Two Harbors Investment Corp.: Director since 2018;
Rhode Island State Investment Commission: Member since 2017; and
Blue Cross Blue Shield of Rhode Island: Director since 2019 |
| | Jacques P. Perold
1958 | MainStay Funds: Trustee since 2016, Advisory Board Member (June 2015 toDecember 2015);MainStay Funds Trust:
Trustee since January 2016, Advisory Board Member (June 2015 to December 2015) | Founder and Chief Executive Officer, CapShift Advisors LLC (since 2018); President, Fidelity Management & Research Company (2009 to 2014); President and Chief Investment Officer, Geode Capital Management, LLC (2001 to 2009) | 78 | MainStay VP Funds Trust: Trustee since January 2016, Advisory Board Member (June 2015 to December 2015) (31 portfolios);
MainStay MacKay DefinedTerm Municipal Opportunities Fund: Trustee since January 2016, Advisory Board Member (June 2015 to December 2015);
MainStay CBRE Global Infrastructure Megatrends Fund: Trustee since June 2021; Partners in Health: Trustee since 2019; Allstate Corporation: Director since 2015; and MSCI Inc.: Director since 2017 |
| | Richard S. Trutanic
1952 | MainStay Funds: Trustee since 1994;MainStay Funds Trust:
Trustee since 2007*** | Chairman and Chief Executive Officer, Somerset & Company (financial advisory firm) since 2004; Managing Director, The Carlyle Group (private investment firm) (2002 to 2004); Senior Managing Director, Partner and Board Member, Groupe Arnault S.A. (private investment firm) (1999 to 2002) | 78 | MainStay VP Funds Trust: Trustee since 2007 (31 portfolios)**;
MainStay MacKay DefinedTerm Municipal Opportunities Fund: Trustee since 2011; and MainStay CBRE Global Infrastructure Megatrends Fund: Trustee since June 2021 |
| ** | Includes prior service as a Director of MainStay VP Series Fund, Inc., the predecessor to MainStay VP Funds Trust. |
| *** | Includes prior service as a Director/Trustee of certain predecessor entities to MainStay Funds Trust. |
| 34 | MainStay WMC Value Fund |
| | Name and
Year of Birth | Position(s) Held and
Length of Service | Principal Occupation(s)
During Past Five Years | |
| | | | | |
| | Kirk C. Lehneis
1974 | President, MainStay Funds, MainStay Funds Trust since 2017 | Chief Operating Officer and Senior Managing Director (since 2016), New York Life Investment Management LLC and New York Life Investment Management Holdings LLC; Member of the Board of Managers (since 2017) and Senior Managing Director (since 2018), NYLIFE Distributors LLC; Chairman of the Board and Senior Managing Director, NYLIM Service Company LLC (since 2017); Trustee, President and Principal Executive Officer of IndexIQ Trust, IndexIQ ETF Trust and IndexIQ Active ETF Trust (since January 2018); President, MainStay CBRE Global Infrastructure Megatrends Fund (since 2021), MainStay MacKay DefinedTerm Municipal Opportunities Fund and MainStay VP Funds Trust (since 2017); Senior Managing Director, Global Product Development (From 2015-2016); Managing Director, Product Development (2010 to 2015), New York Life Investment Management LLC | |
| | Jack R. Benintende
1964 | Treasurer and Principal Financial and Accounting Officer, MainStay Funds (since 2007), MainStay Funds Trust (since 2009) | Managing Director, New York Life Investment Management LLC (since 2007); Treasurer and Principal Financial and Accounting Officer, MainStay CBRE Global Infrastructure Megatrends Fund (since 2021), MainStay MacKay DefinedTerm Municipal Opportunities Fund (since 2011) and MainStay VP Funds Trust (since 2007)** and Assistant Treasurer, New York Life Investment Management Holdings LLC (2008 to 2012) | |
| | J. Kevin Gao
1967 | Secretary and Chief Legal Officer, MainStay Funds and MainStay Funds Trust (since 2010) | Managing Director and Associate General Counsel, New York Life Investment Management LLC (since 2010); Secretary and Chief Legal Officer and MainStay CBRE Global Infrastructure Megatrends Fund (since 2021), MainStay MacKay DefinedTerm Municipal Opportunities Fund (since 2011) and MainStay VP Funds Trust (since 2010)** | |
| | Scott T. Harrington
1959 | Vice President— Administration, MainStay Funds (since 2009), MainStay Funds Trust (since 2009) | Managing Director, New York Life Investment Management LLC (including predecessor advisory organizations) (since 2000); Member of the Board of Directors, New York Life Trust Company (since 2009); Vice President—Administration, MainStay CBRE Global Infrastructure Megatrends Fund (since 2021), MainStay MacKay DefinedTerm Municipal Opportunities Fund (since 2011) and MainStay VP Funds Trust (since 2005)** | |
| | Kevin M. Gleason
1967 | Vice President and Chief Compliance Officer, MainStay Funds and MainStay Funds Trust (since June 2022) | Vice President and Chief Compliance Officer, IndexIQ, IndexIQ ETF Trust and Index IQ Active ETF Trust (since June 2022); Vice President and Chief Compliance Officer, MainStay CBRE Global Infrastructure Megatrends Fund, MainStay VP Funds Trust and MainStay MacKay DefinedTerm Municipal Opportunities Fund (since June 2022); Senior Vice President, Voya Investment Management and Chief Compliance Officer, Voya Family of Funds (2012-2022) | |
| * | The officers listed above are considered to be “interested persons” of the MainStay Group of Funds, MainStay VP Funds Trust, MainStay CBRE Global Infrastructure Megatrends Fund and MainStay MacKay DefinedTerm Municipal Opportunities Fund within the meaning of the 1940 Act because of their affiliation with the MainStay Group of Funds, New York Life Insurance Company and/or its affiliates, including New York Life Investment Management LLC, NYLIM Service Company LLC, NYLIFE Securities LLC and/or NYLIFE Distributors LLC, as described in detail in the column captioned “Principal Occupation(s) During Past Five Years.” Officers are elected annually by the Board. |
| ** | Includes prior service as an Officer of MainStay VP Series Fund, Inc., the predecessor to MainStay VP Funds Trust. |
Officers of the Trust (Who are not Trustees)*
This page intentionally left blank.
This page intentionally left blank.
This page intentionally left blank.
Equity
U.S. Equity
MainStay Epoch U.S. Equity Yield Fund
MainStay S&P 500 Index Fund1
MainStay Winslow Large Cap Growth Fund
MainStay WMC Enduring Capital Fund
MainStay WMC Growth Fund
MainStay WMC Small Companies Fund
MainStay WMC Value Fund
International Equity
MainStay Epoch International Choice Fund
MainStay MacKay International Equity Fund
MainStay WMC International Research Equity Fund
Emerging Markets Equity
MainStay Candriam Emerging Markets Equity Fund
Global Equity
MainStay Epoch Capital Growth Fund
MainStay Epoch Global Equity Yield Fund
Fixed Income
Taxable Income
MainStay Candriam Emerging Markets Debt Fund
MainStay Floating Rate Fund
MainStay MacKay High Yield Corporate Bond Fund
MainStay MacKay Short Duration High Yield Fund
MainStay MacKay Strategic Bond Fund
MainStay MacKay Total Return Bond Fund
MainStay MacKay U.S. Infrastructure Bond Fund
MainStay Short Term Bond Fund
Tax-Exempt Income
MainStay MacKay California Tax Free Opportunities Fund2
MainStay MacKay High Yield Municipal Bond Fund
MainStay MacKay New York Tax Free Opportunities Fund3
MainStay MacKay Short Term Municipal Fund
MainStay MacKay Strategic Municipal Allocation Fund
MainStay MacKay Tax Free Bond Fund
Money Market
MainStay Money Market Fund
Mixed Asset
MainStay Balanced Fund
MainStay Income Builder Fund
MainStay MacKay Convertible Fund
Speciality
MainStay CBRE Global Infrastructure Fund
MainStay CBRE Real Estate Fund
MainStay Cushing MLP Premier Fund
Asset Allocation
MainStay Conservative Allocation Fund
MainStay Conservative ETF Allocation Fund
MainStay Defensive ETF Allocation Fund
MainStay Equity Allocation Fund
MainStay Equity ETF Allocation Fund
MainStay ESG Multi-Asset Allocation Fund
MainStay Growth Allocation Fund
MainStay Growth ETF Allocation Fund
MainStay Moderate Allocation Fund
MainStay Moderate ETF Allocation Fund
Manager
New York Life Investment Management LLC
New York, New York
Subadvisors
Candriam4
Strassen, Luxembourg
CBRE Investment Management Listed Real Assets LLC
Radnor, Pennsylvania
Cushing Asset Management, LP
Dallas, Texas
Epoch Investment Partners, Inc.
New York, New York
MacKay Shields LLC4
New York, New York
NYL Investors LLC4
New York, New York
Wellington Management Company LLP
Boston, Massachusetts
Winslow Capital Management, LLC
Minneapolis, Minnesota
Legal Counsel
Dechert LLP
Washington, District of Columbia
Independent Registered Public Accounting Firm
KPMG LLP
Philadelphia, Pennsylvania
Distributor
NYLIFE Distributors LLC4
Jersey City, New Jersey
Custodian
JPMorgan Chase Bank, N.A.
New York, New York
1.
Prior to February 28, 2022, the Fund's name was MainStay MacKay S&P 500 Index Fund.
| 2. | This Fund is registered for sale in AZ, CA, NV, OR, TX, UT, WA and MI (Class A and Class I shares only), and CO, FL, GA, HI, ID, MA, MD, NH, NJ and NY (Class I shares only). |
| 3. | This Fund is registered for sale in CA, CT, DE, FL, MA, NJ, NY and VT. |
| 4. | An affiliate of New York Life Investment Management LLC. |
Not part of the Annual Report
For more information
800-624-6782
newyorklifeinvestments.com
“New York Life Investments” is both a service mark, and the common trade name, of certain investment advisors affiliated with New York Life Insurance Company. The MainStay Funds® are managed by New York Life Investment Management LLC and distributed by NYLIFE Distributors LLC, 30 Hudson Street, Jersey City, NJ 07302, a wholly owned subsidiary of New York Life Insurance Company. NYLIFE Distributors LLC is a Member FINRA/SIPC.
©2022 NYLIFE Distributors LLC. All rights reserved.
| 5013939.2MS229-22 | MSWV11-12/22 |
(NYLIM) NL532
As of the end of the period covered by this report, the Registrant has adopted a code of ethics (the “Code”) that applies to the Registrant’s principal executive officer (“PEO”) and principal financial officer (“PFO”). During the period covered by this report, no amendments were made to the provisions of the Code. The Registrant did not grant any waivers, including implicit waivers, from any provisions of the Code to the PEO or PFO during the period covered by this report. A copy of the Code is filed herewith.
| Item 3. | Audit Committee Financial Expert. |
The Board of Trustees has determined that the Registrant has three “audit committee financial experts” serving on its Audit Committee. The Audit Committee financial experts are Alan R. Latshaw, Karen Hammond and Susan B. Kerley. Mr. Latshaw, Ms. Hammond and Ms. Kerley are “independent” as defined by Item 3 of Form N-CSR.
| Item 4. | Principal Accountant Fees and Services. |
(a) Audit Fees
The aggregate fees billed for the fiscal year ended October 31, 2022 for professional services rendered by KPMG LLP (“KPMG”) for the audit of the Registrant’s annual financial statements or services that are normally provided by KPMG in connection with statutory and regulatory filings or engagements for that fiscal year were $874,450.
The aggregate fees billed for the fiscal year ended October 31, 2021 for professional services rendered by KPMG for the audit of the Registrant’s annual financial statements or services that are normally provided by KPMG in connection with statutory and regulatory filings or engagements for that fiscal year were $861,000.
(b) Audit-Related Fees
The aggregate fees billed for assurance and related services by KPMG that are reasonably related to the performance of the audit of the Registrant’s financial statements and are not reported under paragraph (a) of this Item were: (i) $0 for the fiscal year ended October 31, 2022, and (ii) $0 for the fiscal year ended October 31, 2021.
(c) Tax Fees
The aggregate fees billed for professional services rendered by KPMG for tax compliance, tax advice, and tax planning were: (i) $0 during the fiscal year ended October 31, 2022, and (ii) $0 during the fiscal year ended October 31, 2021. These services primarily included preparation of federal, state and local income tax returns and excise tax returns, as well as services relating to excise tax distribution requirements.
(d) All Other Fees
The aggregate fees billed for products and services provided by KPMG, other than the services reported in paragraphs (a) through (c) of this Item were: (i) $0 during the fiscal year ended October 31, 2022, and (ii) $0 during the fiscal year ended October 31, 2021.
(e) Pre-Approval Policies and Procedures
| | (1) | The Registrant’s Audit Committee has adopted pre-approval policies and procedures (the “Procedures”) to govern the Committee’s pre-approval of (i) all audit services and permissible non-audit services to be provided to the Registrant by its independent accountant, and (ii) all permissible non-audit services to be provided by such independent accountant to the Registrant’s investment adviser and to any entity controlling, controlled by or under common control with the investment adviser that provides ongoing services to the Registrant (collectively, the “Service Affiliates”) if the services directly relate to the Registrant’s operations and financial reporting. In accordance with the Procedures, the Audit Committee is responsible for the engagement of the independent accountant to certify the Registrant’s financial statements for each fiscal year. With respect to the pre-approval of non-audit services provided to the Registrant and its Service Affiliates, the Procedures provide that the Audit Committee may annually pre-approve a list of the types of services that may be provided to the Registrant or its Service Affiliates, or the Audit Committee may pre-approve such services on a project-by-project basis as they arise. Unless a type of service has received general pre-approval, it will require specific pre-approval by the Audit Committee if it is to be provided by the independent accountant. The Procedures also permit the Audit Committee to delegate authority to one or more of its members to pre-approve any proposed non-audit services that have not been previously pre-approved by the Audit Committee, subject to the ratification by the full Audit Committee no later than its next scheduled meeting. To date, the Audit Committee has not delegated such authority. |
| | (2) | With respect to the services described in paragraphs (b) through (d) of this Item 4, no amount was approved by the Audit Committee pursuant to paragraph (c)(7)(i)(C) of Rule 2-01 of Regulation S-X. |
(f) There were no hours expended on KPMG’s engagement to audit the Registrant’s financial statements for the most recent fiscal year was attributable to work performed by persons other than KPMG’s full-time, permanent employees.
(g) All non-audit fees billed by KPMG for services rendered to the Registrant for the fiscal years ended October 31, 2022 and October 31, 2021 are disclosed in 4(b)-(d) above.
The aggregate non-audit fees billed by KPMG for services rendered to the Registrant’s investment adviser (not including any sub-adviser whose role is primarily portfolio management and is subcontracted with or overseen by another investment adviser), and any entity controlling, controlled by, or under common control with the adviser that provides ongoing services to the Registrant were approximately: (i) $193,405 for the fiscal year ended October 31, 2022, and (ii) $78,500 for the fiscal year ended October 31, 2021.
(h) The Registrant’s Audit Committee has determined that the non-audit services rendered by KPMG for the fiscal year ended October 31, 2022 to the Registrant’s investment adviser and any entity controlling, controlled by, or under common control with the Registrant’s investment adviser that provides ongoing services to the Registrant that were not required to be pre-approved by the Audit Committee because they
did not relate directly to the operations and financial reporting of the registrant were compatible with maintaining the respective independence of KPMG during the relevant time period.
| Item 5. | Audit Committee of Listed Registrants. |
Not applicable.
The Schedule of Investments is included as part of Item 1 of this report.
| Item 7. | Disclosure of Proxy Voting Policies and Procedures for Closed-End Management Investment Companies. |
Not applicable.
| Item 8. | Portfolio Managers of Closed-End Management Investment Companies. |
Not applicable.
| Item 9. | Purchases of Equity Securities by Closed-End Management Investment Company and Affiliated Purchasers. |
Not applicable.
| Item 10. | Submission of Matters to a Vote of Security Holders. |
Since the Registrant’s last response to this Item, there have been no material changes to the procedures by which shareholders may recommend nominees to the Registrant’s Board of Trustees.
| Item 11. | Controls and Procedures. |
(a) Based on an evaluation of the Registrant’s Disclosure Controls and Procedures (as defined in Rule 30a-3(c) under the Investment Company Act of 1940) (the “Disclosure Controls”), as of a date within 90 days prior to the filing date (the “Filing Date”) of this Form N-CSR (the “Report”), the Registrant’s principal executive officer and principal financial officer have concluded that the Disclosure Controls are reasonably designed to ensure that information required to be disclosed by the Registrant in the Report is recorded, processed, summarized and reported by the Filing Date, including ensuring that information required to be disclosed in the Report is accumulated and communicated to the Registrant’s management, including the Registrant’s principal executive officer and principal financial officer, as appropriate to allow timely decisions regarding required disclosure.
(b) There were no changes in the Registrant’s internal control over financial reporting (as defined in Rule 30a-3(d)) under the Investment Company Act of 1940 that occurred during the period covered by this report that has materially affected, or is reasonably likely to materially affect, the Registrant’s internal control over financial reporting.
| Item 12. | Disclosure of Securities Lending Activities for Closed End Management Investment Companies. |
Not applicable.
SIGNATURES
Pursuant to the requirements of the Securities Exchange Act of 1934 and the Investment Company Act of 1940, the Registrant has duly caused this Report to be signed on its behalf by the undersigned, thereunto duly authorized.
THE MAINSTAY FUNDS
| | |
| |
| By: | | /s/ Kirk C. Lehneis |
| | Kirk C. Lehneis |
| | President and Principal Executive Officer |
|
Date: January 6, 2023 |
Pursuant to the requirements of the Securities Exchange Act of 1934 and the Investment Company Act of 1940, this Report has been signed below by the following persons on behalf of the Registrant and in the capacities and on the dates indicated.
| | |
| |
| By: | | /s/ Kirk C. Lehneis |
| | Kirk C. Lehneis |
| | President and Principal Executive Officer |
|
Date: January 6, 2023 |
| |
| By: | | /s/ Jack R. Benintende |
| | Jack R. Benintende |
| | Treasurer and Principal Financial and Accounting Officer |
|
Date: January 6, 2023 |