UNITED STATES
SECURITIES AND EXCHANGE COMMISSION
Washington, D.C. 20549
FormN-CSR
CERTIFIED SHAREHOLDER REPORT OF REGISTERED MANAGEMENT
INVESTMENT COMPANIES
Investment Company Act File Number811-04550
THE MAINSTAY FUNDS
(Exact name of Registrant as specified in charter)
51 Madison Avenue, New York, NY 10010
(Address of principal executive offices) (Zip code)
J. Kevin Gao, Esq.
30 Hudson Street
Jersey City, New Jersey 07302
(Name and address of agent for service)
Registrant’s telephone number, including area code: (212)576-7000
Date of fiscal year end: October 31
Date of reporting period: October 31, 2019
FORMN-CSR
Item 1. Reports to Stockholders.
MainStay MacKay Unconstrained Bond Fund
Message from the President and Annual Report
October 31, 2019

Beginning on January 1, 2021, paper copies of each MainStay Fund’s annual and semiannual shareholder reports will no longer be sent by mail, unless you specifically request paper copies of the reports from MainStay Funds or from your financial intermediary. Instead, the reports will be made available on the MainStay Funds’ website. You will be notified by mail and provided with a website address to access the report each time a new report is posted to the website.
If you already elected to receive shareholder reports electronically, you will not be affected by this change and you need not take any action. At any time, you may elect to receive reports and other communications from MainStay Funds electronically by calling toll-free 800-624-6782, by sending an e-mail to MainStayShareholderServices@nylim.com, or by contacting your financial intermediary.
You may elect to receive all future shareholder reports in paper form free of charge. If you hold shares of a MainStay Fund directly, you can inform MainStay Funds that you wish to receive paper copies of reports by calling toll-free 800-624-6782 or by sending an e-mail to MainStayShareholderServices@nylim.com. If you hold shares of a MainStay Fund through a financial intermediary, please contact the financial intermediary to make this election. Your election to receive reports in paper form will apply to all MainStay Funds in which you are invested and may apply to all funds held with your financial intermediary.
| | | | | | | | |
| | | | | |
| Not FDIC/NCUA Insured | | Not a Deposit | | May Lose Value | | No Bank Guarantee | | Not Insured by Any Government Agency |

This page intentionally left blank
Message from the President
Stock and bond markets generally gained ground during the12-month reporting period ended October 31, 2019, despite concerns regarding slowing U.S. and global economic growth and international trade conflicts.
After trending higher in November 2018, U.S. stocks and bonds dipped sharply in December 2018, over concerns regarding the pace of economic growth, a U.S. government shutdown and the potential impact of trade disputes between the United States and other nations, particularly China. U.S. markets recovered quickly in 2019 as trade tensions eased, the government reopened and the U.S. Federal Reserve Board (“Fed”) adopted a more accommodative tone regarding the future direction of interest rates. A wide spectrum of equity and fixed-income sectors gained ground through April 2019. Mixed macroeconomic signals and the inability of China and the United States to reach a trade agreement caused the market’s recovery to suffer during the spring and summer months of 2019. However, accommodative monetary policies from several central banks, including a series of interest rate cuts by the Fed, along with better-than-expected corporate earnings reassured investors and enabled markets to resume their advance.
Persistent, albeit slow, U.S. economic growth underpinned the U.S. stock market’s advance during the reporting period, positioning major U.S. equity indices to reach record territory by late October 2019. Sector strength shifted as investor sentiment alternated betweenrisk-on andrisk-off positions. In general, for the reporting period, cyclical, growth-oriented stocks outperformed their value-oriented counterparts by a small margin, with the information technology sector leading thelarge-cap S&P 500® Index. However, the traditionally more defensive areas of real estate and utilities generated above-average performance as well. Communication services, consumer discretionary, industrials and consumer staples performed in the middle of the pack, while materials, financials and health care lagged. Only the energy sector suffered declines, undermined by weak oil prices and concerns about future energy demand.
In the fixed-income markets, slowing economic growth, modest inflation and the Fed’s interest rate cuts created an environment of falling yields and rising prices for most bonds, with many areas of the market offering historically low yields by the end of the reporting period. Higher-credit-quality, longer-duration securities generally produced strong returns, with investment-
grade corporates and long-term Treasury bonds delivering particularly strong performance. A similar dynamic characterized the performance of the municipal bond market, with longer-term, higher-grade issues performing relatively well. On average, municipal bonds roughly matched the gains of corporate issues while providingtax-advantaged returns for eligible investors.
International stock and bond markets tended to underperform their U.S. counterparts, constrained by lackluster economic growth in the Eurozone and dramatically slowing growth in China and related parts of Asia amid persistent trade tensions with the United States. Uncertainties surrounding the unending Brexit drama took a further toll on investor confidence, with Britain seemingly unable to resolve its internal conflicts over how, or whether, to exit from the European Union. Nevertheless, on average, international securities delivered modestly positive returns, bolstered by the accommodative monetary policies implemented by European and Asian central banks. Bonds from both emerging and developed markets generally produced stronger returns than equities while repeating the pattern of outperformance by higher-quality, longer-term instruments seen in the United States.
As the economic growth cycle lengthens, investors are left to ponder how best to position their portfolios for an uncertain future. When the yield curve inverted earlier this year prompting concerns of a potential recession, we were reminded that the direction of the economy is continually subject to change, and perceptions of the economy can shift even more rapidly. As a MainStay investor, you can rely on us to manage our Funds with unflagging energy and dedication so that you can remain focused on your long-term objectives in the face of uncertainty and change. Our goal remains to provide you with the consistently reliable financial tools you need to achieve your long-term objectives.
Sincerely,

Kirk C. Lehneis
President
The opinions expressed are as of the date of this report and are subject to change. There is no guarantee that any forecast made will come to pass. This material does not constitute investment advice and is not intended as an endorsement of any specific investment. Past performance is no guarantee of future results.
Not part of the Annual Report
Table of Contents
Investors should refer to the Fund’s Summary Prospectus and/or Prospectus and consider the Fund’s investment objectives, strategies, risks, charges and expenses carefully before investing. The Summary Prospectus and/or Prospectus contain this and other information about the Fund. You may obtain copies of the Fund’s Summary Prospectus, Prospectus and Statement of Additional Information free of charge, upon request, by calling toll-free 800-624-6782, by writing to NYLIFE Distributors LLC, Attn: MainStay Marketing Department, 30 Hudson Street, Jersey City, NJ 07302 or by sending ane-mail to MainStayShareholderServices@nylim.com. These documents are also available via the MainStay Funds’ website at nylinvestments.com/funds. Please read the Summary Prospectus and/or Prospectus carefully before investing.
Investment and Performance Comparison1(Unaudited)
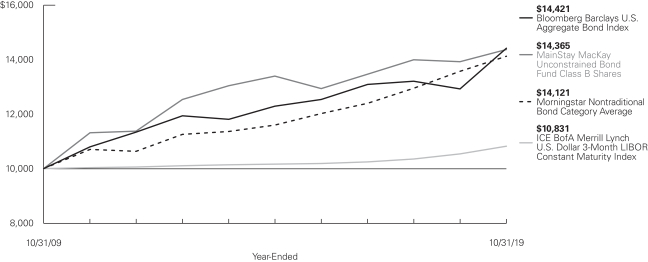
Performance data quoted represents past performance. Past performance is no guarantee of future results. Because of market volatility and other factors, current performance may be lower or higher than the figures shown. Investment return and principal value will fluctuate, and as a result, when shares are redeemed, they may be worth more or less than their original cost. The graph below depicts the historical performance of Class B shares2 of the Fund. Performance will vary from class to class based on differences in class-specific expenses and sales charges. For performance information current to the most recent month-end, please call 800-624-6782 or visit nylinvestments.com/funds.
Average Annual Total Returns for the Year-Ended October 31, 2019
| | | | | | | | | | | | | | | | | | | | | | | | |
| Class | | Sales Charge | | | | Inception
Date | | | One
Year | | | Five Years
or Since
Inception | | | Ten Years
or Since
Inception | | | Gross
Expense
Ratio3 | |
| | | | | | | |
| Class A Shares | | Maximum 4.5% Initial Sales Charge | | With sales charges Excluding sales charges | | | 2/28/1997 | | |
| –0.69
3.99 | %
| |
| 1.24
2.18 | %
| |
| 4.07
4.55 | %
| |
| 1.25
1.25 | %
|
| Investor Class Shares | | Maximum 4.5% Initial Sales Charge | | With sales charges Excluding sales charges | | | 2/28/2008 | | |
| –0.75
3.93 |
| |
| 1.23
2.17 |
| |
| 3.97
4.45 |
| |
| 1.27
1.27 |
|
| Class B Shares2 | | Maximum 5% CDSC
if Redeemed Within the First Six Years of Purchase | | With sales charges Excluding sales charges | |
| 2/28/1997
|
| |
| –1.80
3.20 |
| |
| 1.05
1.41 |
| |
| 3.69
3.69 |
| |
| 2.02
2.02 |
|
| Class C Shares | | Maximum 1% CDSC if Redeemed Within
One Year of Purchase | | With sales charges Excluding sales charges | |
| 9/1/1998
|
| |
| 2.21
3.21 |
| |
| 1.41
1.41 |
| |
| 3.68
3.68 |
| |
| 2.02
2.02 |
|
| Class I Shares | | No Sales Charge | | | | | 1/2/2004 | | | | 4.24 | | | | 2.44 | | | | 4.82 | | | | 1.00 | |
| Class R2 Shares | | No Sales Charge | | | | | 2/28/2014 | | | | 3.89 | | | | 2.08 | | | | 2.01 | | | | 1.35 | |
| Class R3 Shares | | No Sales Charge | | | | | 2/29/2016 | | | | 3.63 | | | | 4.74 | | | | N/A | | | | 1.60 | |
| Class R6 Shares | | No Sales Charge | | | | | 2/28/2018 | | | | 4.43 | | | | 2.96 | | | | N/A | | | | 0.83 | |
| 1. | The performance table and graph do not reflect the deduction of taxes that a shareholder would pay on distributions or Fund share redemptions. Total returns reflect maximum applicable sales charges as indicated in the table above, if any, changes in share price, and reinvestment of dividend and capital gain distributions. The graph assumes the initial investment amount shown above and reflects the deduction of all sales charges that would have applied for the period of investment. Performance figures may reflect certain fee waivers and/or expense limitations, without which total returns may have |
| | been lower. For more information on share classes and current fee waivers and/or expense limitations (if any), please refer to the Notes to Financial Statements. |
| 2. | Class B shares are closed to all new purchases as well as additional investments by existing Class B shareholders. |
| 3. | The gross expense ratios presented reflect the Fund’s “Total Annual Fund Operating Expenses” from the most recent Prospectus and may differ from other expense ratios disclosed in this report. |
The footnotes on the next page are an integral part of the table and graph and should be carefully read in conjunction with them.
| | | | | | | | | | | | |
| Benchmark Performance | | One
Year | | | Five
Years | | | Ten
Years | |
| | | |
Bloomberg Barclays U.S. Aggregate Bond Index4 | | | 11.51 | % | | | 3.24 | % | | | 3.73 | % |
ICE BofAML U.S. Dollar 3-Month Deposit Offered Rate Constant Maturity Index5 | | | 2.68 | | | | 1.27 | | | | 0.80 | |
Morningstar Nontraditional Bond Category Average6 | | | 4.03 | | | | 2.31 | | | | 3.51 | |
| 4. | The Bloomberg Barclays U.S. Aggregate Bond Index is the Fund’s primary broad-based securities market index for comparison purposes. The Bloomberg Barclays U.S. Aggregate Bond Index is a broad-based benchmark that measures the investment grade, U.S. dollar-denominated, fixed-rate taxable bond market, including Treasuries, government-related and corporate securities, mortgage-backed securities (agency fixed-rate and hybrid adjustable rate mortgage pass-throughs), asset-backed securities, and commercial mortgage-backed securities. Results assume reinvestment of all dividends and capital gains. An investment cannot be made directly in an index. |
| 5. | The Fund has selected the ICE BofAML U.S. Dollar 3-Month Deposit Offered Rate Constant Maturity Index as a secondary benchmark. The ICE BofAML U.S. Dollar 3-Month Deposit Offered Rate Constant Maturity Index is unmanaged and tracks the performance of a synthetic asset paying London Interbank Offered Rate to a stated maturity. The index is based on the |
| | assumed purchase at par of a synthetic instrument having exactly its stated maturity and with a coupon equal to that day’s fixing rate. That issue is assumed to be sold the following business day (priced at a yield equal to the current day fixing rate) and rolled into a new instrument. Results assume reinvestment of all dividends and capital gains. An investment cannot be made directly in an index. |
| 6. | The Fund has selected the Morningstar Nontraditional Bond Category Average as an additional benchmark. The Morningstar Nontraditional Bond Category Average contains funds that pursue strategies divergent in one or more ways from conventional practice in the broader bond-fund universe. Morningstar category averages are equal-weighted returns based on constituents of the category at the end of the period. Results assume reinvestment of all dividends and capital gains. An investment cannot be made directly in an index. |
The footnotes on the preceding page are an integral part of the table and graph and should be carefully read in conjunction with them.
| | |
| 6 | | MainStay MacKay Unconstrained Bond Fund |
Cost in Dollars of a $1,000 Investment in MainStay MacKay Unconstrained Bond Fund (Unaudited)
The example below is intended to describe the fees and expenses borne by shareholders during the six-month period from May 1, 2019, to October 31, 2019, and the impact of those costs on your investment.
Example
As a shareholder of the Fund you incur two types of costs: (1) transaction costs, including exchange fees and sales charges (loads) on purchases (as applicable), and (2) ongoing costs, including management fees, distribution and/or service (12b-1) fees, and other Fund expenses (as applicable). This example is intended to help you understand your ongoing costs (in dollars) of investing in the Fund and to compare these costs with the ongoing costs of investing in other mutual funds. The example is based on an investment of $1,000 made at the beginning of the six-month period and held for the entire period from May 1, 2019, to October 31, 2019.
This example illustrates your Fund’s ongoing costs in two ways:
Actual Expenses
The second and third data columns in the table below provide information about actual account values and actual expenses. You may use the information in these columns, together with the amount you invested, to estimate the expenses that you paid during the six months ended October 31, 2019. Simply divide your account value by $1,000 (for example, an $8,600 account value divided by $1,000 = 8.6), then
multiply the result by the number under the heading entitled “Expenses Paid During Period” to estimate the expenses you paid on your account during this period.
Hypothetical Example for Comparison Purposes
The fourth and fifth data columns in the table below provide information about hypothetical account values and hypothetical expenses based on the Fund’s actual expense ratio and an assumed rate of return of 5% per year before expenses, which is not the Fund’s actual return. The hypothetical account values and expenses may not be used to estimate the actual ending account balances or expenses you paid for the six-month period shown. You may use this information to compare the ongoing costs of investing in the Fund with the ongoing costs of investing in other mutual funds. To do so, compare this 5% hypothetical example with the 5% hypothetical examples that appear in the shareholder reports of the other mutual funds.
Please note that the expenses shown in the table are meant to highlight your ongoing costs only and do not reflect any transactional costs, such as exchange fees or sales charges (loads). Therefore, the fourth and fifth data columns of the table are useful in comparing ongoing costs only and will not help you determine the relative total costs of owning different funds. In addition, if these transactional costs were included, your costs would have been higher.
| | | | | | | | | | | | | | | | | | | | | | |
| | | | | | | | | | | | | | | | | | |
| Share Class | | Beginning
Account
Value
5/1/19 | | | Ending Account
Value (Based
on Actual
Returns and
Expenses)
10/31/19 | | | Expenses
Paid
During
Period1 | | | Ending Account
Value (Based on Hypothetical
5% Annualized
Return and
Actual Expenses)
10/31/19 | | | Expenses
Paid
During
Period1 | | | Net Expense
Ratio
During
Period2,3 |
| | | | | | |
| Class A Shares | | $ | 1,000.00 | | | $ | 1,019.40 | | | $ | 6.46 | | | $ | 1,018.80 | | | $ | 6.46 | | | 1.27% |
| | | | | | |
| Investor Class Shares | | $ | 1,000.00 | | | $ | 1,019.10 | | | $ | 6.57 | | | $ | 1,018.70 | | | $ | 6.56 | | | 1.29% |
| | | | | | |
| Class B Shares | | $ | 1,000.00 | | | $ | 1,016.70 | | | $ | 10.37 | | | $ | 1,014.92 | | | $ | 10.36 | | | 2.04% |
| | | | | | |
| Class C Shares | | $ | 1,000.00 | | | $ | 1,015.50 | | | $ | 10.36 | | | $ | 1,014.92 | | | $ | 10.36 | | | 2.04% |
| | | | | | |
| Class I Shares | | $ | 1,000.00 | | | $ | 1,020.70 | | | $ | 5.20 | | | $ | 1,020.06 | | | $ | 5.19 | | | 1.02% |
| | | | | | |
| Class R2 Shares | | $ | 1,000.00 | | | $ | 1,020.10 | | | $ | 6.98 | | | $ | 1,018.30 | | | $ | 6.97 | | | 1.37% |
| | | | | | |
| Class R3 Shares | | $ | 1,000.00 | | | $ | 1,017.60 | | | $ | 8.24 | | | $ | 1,017.04 | | | $ | 8.24 | | | 1.62% |
| | | | | | |
| Class R6 Shares | | $ | 1,000.00 | | | $ | 1,021.60 | | | $ | 4.28 | | | $ | 1,020.97 | | | $ | 4.28 | | | 0.84% |
| 1. | Expenses are equal to the Fund’s annualized expense ratio of each class multiplied by the average account value over the period, divided by 365 and multiplied by 184 (to reflect the six-month period). The table above represents the actual expenses incurred during the six-month period. In addition to the fees and expenses which the Fund bears directly, it also indirectly bears a pro rata share of the fees and expenses of the underlying funds in which it invests. Such indirect expenses are not included in the above-reported expense figures. |
| 2. | Expenses are equal to the Fund’s annualized expense ratio to reflect the six-month period. |
| 3. | Expenses are inclusive of dividends and interest on investments sold short. |
Portfolio Composition as of October 31, 2019(Unaudited)
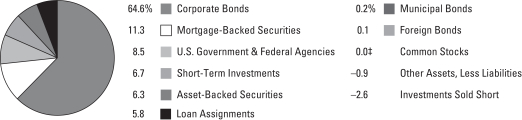
See Portfolio of Investments beginning on page 11 for specific holdings within these categories. The Fund’s holdings are subject to change.
| ‡ | Less than one-tenth of a percent. |
Top Ten Holdings or Issuers Held as of October 31, 2019(excludingshort-term investments) (Unaudited)
| 1. | United States Treasury Inflation—Indexed Notes, 0.75%–0.875%, due 7/15/28–1/15/29 |
| 2. | Federal National Mortgage Association (Mortgage Pass-Through Securities), 3.50%–4.50%, due 8/1/48–2/1/49 |
| 3. | Goldman Sachs Group, Inc., 2.35%–5.25%, due 7/27/21–5/15/26 |
| 4. | Morgan Stanley, 3.125%–5.611%, due 1/15/20–1/20/27 |
| 5. | Citigroup, Inc., 2.35%–6.30%, due 8/2/21–7/1/26 |
| 6. | Bank of America Corp., 3.004%–8.57%, due 5/17/22–3/10/26 |
| 7. | Federal Home Loan Mortgage Corporation, 3.00%–3.50%, due 5/25/29–10/25/49 |
| 8. | FREMF Mortgage Trust, 3.499%–4.331%, due 12/25/44–12/25/46 |
| 9. | Federal National Mortgage Association, 3.00%, 5/25/48–10/25/49 |
| 10. | Government National Mortgage Association, 3.00%, due 1/16/40–6/20/49 |
| | |
| 8 | | MainStay MacKay Unconstrained Bond Fund |
Portfolio Management Discussion and Analysis(Unaudited)
Questions answered by portfolio managers Dan Roberts, PhD,1 Joseph Cantwell, Stephen R. Cianci, CFA, Matt Jacob, Neil Moriarty III, andShu-Yang Tan, CFA, of MacKay Shields LLC, the Fund’s Subadvisor.
How did MainStay MacKay Unconstrained Bond Fund perform relative to its benchmarks and peer group during the 12 months ended October 31, 2019?
For the 12 months ended October 31, 2019, Class I shares of MainStay MacKay Unconstrained Bond Fund returned 4.24%, underperforming the 11.51% return of the Fund’s primary benchmark, the Bloomberg Barclays U.S. Aggregate Bond Index, and outperforming the 2.68% return of the Fund’s secondary benchmark, the ICE BofAML U.S. Dollar3-Month Deposit Offered Rate Constant Maturity Index. Over the same period, Class I shares outperformed the 4.03% return of the Morningstar Nontraditional Bond Category Average.2
Were there any changes to the Fund during the reporting period?
Effective December 31, 2018, Louis Cohen no longer served as a portfolio manager of the Fund. Dan Roberts,1 Joseph Cantwell, Stephen R. Cianci, Matt Jacob, Neil Moriarty andShu-Yang Tan continue to manage the Fund. For more information about this change refer to the supplement dated October 18, 2018.
What factors affected the Fund’s relative performance during the reporting period?
The reporting period got off to a tumultuous start in large part due to a variety of political and economic developments affecting the market, including, but not limited to, fears of weaker growth in China, Japan and the European Union; restrictive U.S. Federal Reserve (Fed) policy; the U.S. administration’s public criticism of the Fed; trade wars with China; and the uncertainty surrounding the United Kingdom’s Brexit negotiations to separate from the European Union.
At the beginning of 2019, the Fed reversed course on their rate policy and announced that the Fed funds benchmark rate had risen to a level consistent with its policy objectives. The market focused on the fact that not only was the Fed no longer tightening monetary policy, but that it might reverse course and begin to cut rates. Indeed, over the ensuing months, the Fed cut rates three times. In an unusual set of circumstances, both Treasury securities and stocks rallied on the Fed’s pause and eventual loosening stance, reflecting cautious optimism regarding the durability of the current business cycle. Swayed
by similar effects, corporate bond spreads3 tightened during the reporting period, as did spreads of credit-related securitized4 product (asset-backed and commercial mortgage-backed securities).
During the reporting period, the Fund underperformed its primary benchmark, the Bloomberg Barclays U.S. Aggregate Bond Index, largely due to underweight exposure to long-maturity Treasuries, which detracted from performance as Treasury yields fell. The Fund outperformed its secondary benchmark, the ICE BofAML U.S. Dollar3-Month Deposit Offered Rate Constant Maturity Index, largely due to the Fund’s overweight exposure to spread product, including high-yield credit, bank loans, investment-grade credit and emerging-market credit.
During the reporting period, how was the Fund’s performance materially affected by investments in derivatives?
Throughout the course of the reporting period, we used futures to manage the Fund’s duration5 profile. Though we extended the Fund’s duration during the reporting period, it remained below that of the Bloomberg Barclays U.S. Aggregate Bond Index, thereby detracting from performance relative to the benchmark.
What was the Fund’s duration strategy during the reporting period?
We gradually extended the Fund’s duration from 1.0 year at the beginning of the reporting period to approximately 1.6 years at the end of the reporting period. Throughout the reporting period, the Fund’s duration remained below that of the Bloomberg Barclays U.S. Aggregate Bond Index. As of October 31, 2019, the benchmark duration was approximately 5.8 years.
During the reporting period, which sectors were the strongest positive contributors to the Fund’s relative performance and which sectors were particularly weak?
Spread product—specifically investment-grade credit, high-yield credit, bank loans and emerging-market debt—performed well during the reporting period and made positive contributions to the Fund’s performance relative to the Bloomberg Barclays U.S. Aggregate Bond Index. (Contributions take weightings and total returns into account.) Emerging markets benefited from
| 1. | Dan Roberts will serve as a portfolio manager of the Fund until January 1, 2020. |
| 2. | See page 5 for other share class returns, which may be higher or lower than Class I share returns. See page 6 for more information on benchmark and peer group returns. |
| 3. | The terms “spread” and “yield spread” may refer to the difference in yield between a security or type of security and comparable U.S. Treasury issues. The terms may also refer to the difference in yield between two specific securities or types of securities at a given time. |
| 4. | A securitization is a financial instrument created by an issuer by combining a pool of financial assets (such as mortgages). The financial instrument is then marketed to investors, sometimes in tiers. |
| 5. | Duration is a measure of the price sensitivity of a fixed-income investment to changes in interest rates. Duration is expressed as a number of years and is considered a more accurate sensitivity gauge than average maturity. |
renewed risk appetites sparked by dovish central banks. Securitized assets, including residential mortgage-backed securities (RMBS) and consumer-related asset-backed securities (ABS), though positive for the reporting period, lagged the overall return of the benchmark. These securities are generally higher rated and shorter duration in nature.
What were some of the Fund’s largest purchases and sales during the reporting period?
In general terms, as credit spreads narrowed during the reporting period and the compensation for risk compressed, we reduced the Fund’s exposure to credit in the form of high-yield bonds and bank loans. At the same time, we methodically added securitized assets—such as ABS, RMBS and commercial mortgage-backed securities (CMBS)—into the Fund, both to reduce volatility and for diversification purposes.
How did the Fund’s sector weightings change during the reporting period?
We significantly increased the Fund’s exposure to securitized assets, such as RMBS, CMBS and ABS, while reducing the Fund’s exposure to high-yield bonds and bank loans. These transactions improved the liquidity and overall credit quality of the Fund as spreads tightened during the reporting period.
How was the Fund positioned at the end of the reporting period?
Relative to the Bloomberg Barclays U.S. Aggregate Bond Index, the Fund ended the reporting period with overweight exposure to investment-grade corporate bonds, high-yield bonds and bank loans. Conversely, as of October 31, 2019, the Fund held underweight exposure to U.S. Treasury bonds and agency mortgage-backed securities.
The opinions expressed are those of the portfolio managers as of the date of this report and are subject to change. There is no guarantee that any forecasts will come to pass. This material does not constitute investment advice and is not intended as an endorsement of any specific investment.
| | |
| 10 | | MainStay MacKay Unconstrained Bond Fund |
Portfolio of InvestmentsOctober 31, 2019
| | | | | | | | |
| | | Principal
Amount | | | Value | |
Long-Term Bonds 96.8%† Asset-Backed Securities 6.3% | |
Auto Floor Plan Asset-Backed Securities 0.9% | |
Ford Credit Floorplan Master Owner Trust
Series 2018-4, Class A
4.06%, due 11/15/30 | | $ | 4,390,000 | | | $ | 4,873,904 | |
Navistar Financial Dealer Note Master Owner Trust II
Series 2018-1, Class A
2.648% (1 Month LIBOR + 0.63%), due 9/25/23 (a)(b) | | | 3,980,000 | | | | 3,983,697 | |
| | | | | | | | |
| | | | | | | 8,857,601 | |
| | | | | | | | |
Automobile Asset-Backed Securities 0.8% | |
Santander Retail Auto Lease Trust
Series 2019-B, Class A3
2.30%, due 1/20/23 (a) | | | 2,195,000 | | | | 2,210,220 | |
Toyota Auto Loan Extended Note Trust
Series 2019-1A, Class A
2.56%, due 11/25/31 (a) | | | 3,185,000 | | | | 3,260,770 | |
World Omni Auto Receivables Trust
Series 2019-A, Class A3
3.04%, due 5/15/24 | | | 2,355,000 | | | | 2,404,330 | |
| | | | | | | | |
| | | | | | | 7,875,320 | |
| | | | | | | | |
Credit Cards 2.0% | |
American Express Credit Account Master Trust | | | | | | | | |
Series 2018-9, Class A
2.408% (1 Month LIBOR + 0.38%), due 4/15/26 (b) | | | 2,105,000 | | | | 2,103,532 | |
Series 2019-1, Class A
2.87%, due 10/15/24 | | | 2,060,000 | | | | 2,111,126 | |
Capital One Multi-Asset Execution Trust | | | | | | | | |
Series 2019-A3, Class A3
2.06%, due 8/15/28 | | | 3,960,000 | | | | 3,942,184 | |
Series 2019-A1, Class A1
2.84%, due 12/15/24 | | | 3,765,000 | | | | 3,848,938 | |
Citibank Credit Card Issuance Trust
Series 2018-A2, Class A2
2.374% (1 Month LIBOR + 0.33%), due 1/20/25 (b) | | | 4,785,000 | | | | 4,780,695 | |
Discover Card Execution Note Trust
Series 2019-A1, Class A1
3.04%, due 7/15/24 | | | 2,425,000 | | | | 2,487,381 | |
| | | | | | | | |
| | | | | | | 19,273,856 | |
| | | | | | | | |
Home Equity 0.1% | |
First NLC Trust
Series 2007-1, Class A1
2.088% (1 Month LIBOR + 0.07%), due 8/25/37 (a)(b) | | | 311,459 | | | | 195,897 | |
| | | | | | | | |
| | | Principal
Amount | | | Value | |
Home Equity (continued) | |
JPMorgan Mortgage Acquisition Trust
Series 2007-HE1, Class AF1
2.118% (1 Month LIBOR + 0.10%), due 3/25/47 (b) | | $ | 110,099 | | | $ | 76,597 | |
MASTR Asset-Backed Securities Trust
Series 2006-HE4, Class A1
2.068% (1 Month LIBOR + 0.05%), due 11/25/36 (b) | | | 82,944 | | | | 38,011 | |
Morgan Stanley ABS Capital I Trust
Series 2007-HE4, Class A2A
2.128% (1 Month LIBOR + 0.11%), due 2/25/37 (b) | | | 83,907 | | | | 37,671 | |
| | | | | | | | |
| | | | | | | 348,176 | |
| | | | | | | | |
Other Asset-Backed Securities 2.5% | |
CNH Equipment Trust
Series 2019-B, Class A4
2.64%, due 5/15/26 | | | 4,360,000 | | | | 4,453,455 | |
Dell Equipment Finance Trust
Series 2018-2, Class A3
3.37%, due 10/22/23 (a) | | | 4,040,000 | | | | 4,104,629 | |
DLL Securitization Trust
Series 2019-MT3, Class A3
2.08%, due 2/21/23 (a) | | | 3,265,000 | | | | 3,264,022 | |
Hilton Grand Vacations Trust
Series 2019-AA, Class A
2.34%, due 7/25/33 (a) | | | 2,895,082 | | | | 2,902,318 | |
John Deere Owner Trust
Series 2019-B, Class A3
2.21%, due 12/15/23 | | | 4,160,000 | | | | 4,186,480 | |
MVW Owner Trust
Series 2019-2A, Class A
2.22%, due 10/20/38 (a) | | | 2,630,000 | | | | 2,627,948 | |
Sierra Receivables Funding Co.
Series 2019-3A, Class A
2.34%, due 8/15/36 (a) | | | 1,635,000 | | | | 1,634,972 | |
| | | | | | | | |
| | | | | | | 23,173,824 | |
| | | | | | | | |
Student Loans 0.0%‡ | |
KeyCorp Student Loan Trust
Series 2000-A, Class A2
2.841% (3 Month LIBOR + 0.32%), due 5/25/29 (b) | | | 218,618 | | | | 217,684 | |
| | | | | | | | |
Total Asset-Backed Securities
(Cost $58,948,454) | | | | | | | 59,746,461 | |
| | | | | | | | |
|
| Corporate Bonds 64.6% | |
Advertising 0.3% | |
Lamar Media Corp.
5.375%, due 1/15/24 | | | 2,695,000 | | | | 2,761,863 | |
| | | | | | | | |
| | | | | | |
The notes to the financial statements are an integral part of,
and should be read in conjunction with, the financial statements. | | | | | 11 | |
Portfolio of InvestmentsOctober 31, 2019 (continued)
| | | | | | | | |
| | | Principal
Amount | | | Value | |
| Corporate Bonds (continued) | |
Aerospace & Defense 1.0% | |
Moog, Inc.
5.25%, due 12/1/22 (a) | | $ | 5,505,000 | | | $ | 5,580,694 | |
Rockwell Collins, Inc.
3.50%, due 3/15/27 | | | 3,350,000 | | | | 3,583,472 | |
| | | | | | | | |
| | | | | | | 9,164,166 | |
| | | | | | | | |
Agriculture 0.6% | |
Altria Group, Inc.
3.80%, due 2/14/24 | | | 3,660,000 | | | | 3,839,862 | |
JBS Investments II GmbH
7.00%, due 1/15/26 (a) | | | 1,915,000 | | | | 2,075,860 | |
| | | | | | | | |
| | | | | | | 5,915,722 | |
| | | | | | | | |
Airlines 1.8% | |
Continental Airlines, Inc. | | | | | | | | |
Series 2007-1, Class A
5.983%, due 10/19/23 | | | 2,517,645 | | | | 2,668,099 | |
Series 2005-ERJ1
9.798%, due 10/1/22 | | | 93,248 | | | | 96,662 | |
Delta Air Lines, Inc. | | | | | | | | |
Series 2019-1, Class AA
3.204%, due 10/25/25 | | | 3,360,000 | | | | 3,514,573 | |
Series 2007-1, Class A
6.821%, due 2/10/24 | | | 1,215,524 | | | | 1,331,533 | |
U.S. Airways Group, Inc.
Series 2010-1, Class A
6.25%, due 10/22/24 | | | 4,625,284 | | | | 5,061,694 | |
United Airlines, Inc.
Series 2014-2, Class B
4.625%, due 3/3/24 | | | 3,875,686 | | | | 3,992,452 | |
| | | | | | | | |
| | | | | | | 16,665,013 | |
| | | | | | | | |
Auto Manufacturers 1.6% | |
Ford Motor Credit Co. LLC | | | | | | | | |
2.681%, due 1/9/20 | | | 3,345,000 | | | | 3,346,260 | |
3.35%, due 11/1/22 | | | 1,115,000 | | | | 1,118,323 | |
4.063%, due 11/1/24 | | | 2,280,000 | | | | 2,287,797 | |
4.25%, due 9/20/22 (c) | | | 860,000 | | | | 884,483 | |
General Motors Financial Co., Inc.
3.45%, due 4/10/22 (c) | | | 4,480,000 | | | | 4,566,563 | |
Volkswagen Group of America Finance LLC
3.875%, due 11/13/20 (a) | | | 2,925,000 | | | | 2,978,131 | |
| | | | | | | | |
| | | | | | | 15,181,557 | |
| | | | | | | | |
Banks 15.3% | |
Bank of America Corp. | | | | | | | | |
3.004%, due 12/20/23 (d) | | | 7,718,000 | | | | 7,894,963 | |
3.30%, due 1/11/23 | | | 510,000 | | | | 528,758 | |
3.499%, due 5/17/22 (c)(d) | | | 5,150,000 | | | | 5,258,394 | |
6.30%, due 3/10/26 (d)(e) | | | 3,570,000 | | | | 4,059,233 | |
8.57%, due 11/15/24 | | | 1,645,000 | | | | 2,076,000 | |
| | | | | | | | |
| | | Principal
Amount | | | Value | |
Banks (continued) | | | | | | | | |
Bank of New York Mellon Corp.
2.661%, due 5/16/23 (d) | | $ | 4,660,000 | | | $ | 4,727,380 | |
Barclays Bank PLC
5.14%, due 10/14/20 | | | 8,037,000 | | | | 8,245,480 | |
Branch Banking & Trust Co.
2.636% (5 Year Treasury Constant Maturity Rate + 1.15%), due 9/17/29 (b) | | | 2,500,000 | | | | 2,493,441 | |
Capital One Financial Corp.
5.55%, due 6/1/20 (d)(e) | | | 1,535,000 | | | | 1,563,121 | |
Citigroup, Inc. | | | | | | | | |
2.35%, due 8/2/21 (c) | | | 5,000,000 | | | | 5,030,380 | |
3.349% (3 Month LIBOR + 1.25%), due 7/1/26 (b) | | | 4,000,000 | | | | 4,062,794 | |
3.352%, due 4/24/25 (d) | | | 1,880,000 | | | | 1,955,876 | |
6.30%, due 5/15/24 (d)(e) | | | 10,800,000 | | | | 11,615,400 | |
Citizens Bank N.A.
3.25%, due 2/14/22 | | | 1,330,000 | | | | 1,364,445 | |
Citizens Financial Group, Inc.
4.15%, due 9/28/22 (a) | | | 2,270,000 | | | | 2,364,973 | |
Goldman Sachs Group, Inc. | | | | | | | | |
2.35%, due 11/15/21 | | | 9,335,000 | | | | 9,368,996 | |
2.908%, due 6/5/23 (d) | | | 4,285,000 | | | | 4,356,051 | |
3.00%, due 4/26/22 | | | 7,000,000 | | | | 7,092,826 | |
3.328% (3 Month LIBOR + 1.17%), due 5/15/26 (b) | | | 3,220,000 | | | | 3,258,737 | |
3.625%, due 1/22/23 | | | 3,227,000 | | | | 3,373,180 | |
5.25%, due 7/27/21 (c) | | | 6,047,000 | | | | 6,374,375 | |
Huntington National Bank
3.125%, due 4/1/22 | | | 4,580,000 | | | | 4,698,049 | |
Lloyds Banking Group PLC | | | | | | | | |
4.582%, due 12/10/25 | | | 1,365,000 | | | | 1,466,140 | |
4.65%, due 3/24/26 | | | 1,985,000 | | | | 2,145,180 | |
Morgan Stanley | | | | | | | | |
3.125%, due 1/23/23 | | | 6,380,000 | | | | 6,564,558 | |
3.625%, due 1/20/27 | | | 6,055,000 | | | | 6,456,912 | |
4.00%, due 7/23/25 | | | 1,920,000 | | | | 2,082,246 | |
4.875%, due 11/1/22 | | | 4,287,000 | | | | 4,598,477 | |
5.00%, due 11/24/25 | | | 2,465,000 | | | | 2,770,996 | |
5.611% (3 Month LIBOR + 3.61%), due 1/15/20 (b)(e) | | | 9,333,000 | | | | 9,388,998 | |
Santander Holdings USA, Inc. | | | | | | | | |
3.40%, due 1/18/23 | | | 1,500,000 | | | | 1,542,014 | |
3.70%, due 3/28/22 | | | 2,000,000 | | | | 2,055,995 | |
Wells Fargo & Co. (d) | | | | | | | | |
3.584%, due 5/22/28 (c) | | | 380,000 | | | | 402,784 | |
5.90%, due 6/15/24 (e) | | | 3,690,000 | | | | 3,985,200 | |
| | | | | | | | |
| | | | | | | 145,222,352 | |
| | | | | | | | |
Beverages 0.3% | |
Anheuser-Busch InBev Worldwide, Inc. | | | | | | | | |
4.15%, due 1/23/25 | | | 885,000 | | | | 967,538 | |
4.75%, due 1/23/29 | | | 1,770,000 | | | | 2,057,105 | |
| | | | | | | | |
| | | | | | | 3,024,643 | |
| | | | | | | | |
| | | | |
| 12 | | MainStay MacKay Unconstrained Bond Fund | | The notes to the financial statements are an integral part of,
and should be read in conjunction with, the financial statements. |
| | | | | | | | |
| | | Principal
Amount | | | Value | |
| Corporate Bonds (continued) | |
Building Materials 0.4% | |
Masco Corp.
7.125%, due 3/15/20 | | $ | 290,000 | | | $ | 295,229 | |
Standard Industries, Inc.
5.375%, due 11/15/24 (a) | | | 3,580,000 | | | | 3,683,104 | |
| | | | | | | | |
| | | | | | | 3,978,333 | |
| | | | | | | | |
Chemicals 1.8% | |
Air Liquide Finance S.A.
1.75%, due 9/27/21 (a) | | | 2,785,000 | | | | 2,774,170 | |
Ashland LLC
4.75%, due 8/15/22 | | | 2,970,000 | | | | 3,111,075 | |
Braskem Netherlands Finance B.V. (a) | | | | | | | | |
3.50%, due 1/10/23 | | | 935,000 | | | | 949,034 | |
4.50%, due 1/10/28 | | | 1,250,000 | | | | 1,254,375 | |
Orbia Advance Corp. S.A.B. de C.V.
4.00%, due 10/4/27 (a) | | | 2,600,000 | | | | 2,639,000 | |
W.R. Grace & Co.
5.125%, due 10/1/21 (a) | | | 6,410,000 | | | | 6,650,375 | |
| | | | | | | | |
| | | | | | | 17,378,029 | |
| | | | | | | | |
Commercial Services 1.9% | |
Ashtead Capital, Inc.
4.25%, due 11/1/29 (a) | | | 2,060,000 | | | | 2,080,600 | |
Herc Holdings, Inc.
5.50%, due 7/15/27 (a) | | | 2,320,000 | | | | 2,404,100 | |
IHS Markit, Ltd. | | | | | | | | |
3.625%, due 5/1/24 | | | 3,710,000 | | | | 3,878,768 | |
4.125%, due 8/1/23 (c) | | | 1,075,000 | | | | 1,135,555 | |
PayPal Holdings, Inc.
2.40%, due 10/1/24 | | | 3,335,000 | | | | 3,357,529 | |
Service Corp. International
5.375%, due 5/15/24 | | | 2,200,000 | | | | 2,268,750 | |
University of Pennsylvania
3.61%, due 12/31/99 | | | 2,315,000 | | | | 2,515,155 | |
| | | | | | | | |
| | | | | | | 17,640,457 | |
| | | | | �� | | | |
Computers 0.7% | |
Dell International LLC / EMC Corp.
4.90%, due 10/1/26 (a)(c) | | | 4,000,000 | | | | 4,339,963 | |
Hewlett Packard Enterprise Co.
4.40%, due 10/15/22 | | | 2,520,000 | | | | 2,671,650 | |
| | | | | | | | |
| | | | | | | 7,011,613 | |
| | | | | | | | |
Cosmetics & Personal Care 0.4% | |
First Quality Finance Co., Inc.
5.00%, due 7/1/25 (a) | | | 3,760,000 | | | | 3,892,352 | |
| | | | | | | | |
|
Distribution & Wholesale 0.1% | |
Performance Food Group, Inc.
5.50%, due 10/15/27 (a) | | | 895,000 | | | | 946,463 | |
| | | | | | | | |
| | | | | | | | |
| | | Principal
Amount | | | Value | |
Diversified Financial Services 3.0% | |
AerCap Ireland Capital DAC / AerCap Global Aviation Trust | | | | | | | | |
3.50%, due 5/26/22 | | $ | 4,430,000 | | | $ | 4,556,177 | |
4.50%, due 5/15/21 | | | 480,000 | | | | 496,524 | |
Air Lease Corp. | | | | | | | | |
2.125%, due 1/15/20 | | | 3,275,000 | | | | 3,274,476 | |
2.625%, due 7/1/22 | | | 2,040,000 | | | | 2,059,005 | |
3.25%, due 3/1/25 (c) | | | 4,000,000 | | | | 4,110,705 | |
Allied Universal Holdco LLC / Allied Universal Finance Corp.
6.625%, due 7/15/26 (a) | | | 2,130,000 | | | | 2,273,775 | |
Ally Financial, Inc. | | | | | | | | |
5.75%, due 11/20/25 | | | 3,820,000 | | | | 4,254,525 | |
8.00%, due 11/1/31 | | | 3,280,000 | | | | 4,563,300 | |
Capital One Bank USA N.A.
3.375%, due 2/15/23 (c) | | | 3,000,000 | | | | 3,090,906 | |
| | | | | | | | |
| | | | | | | 28,679,393 | |
| | | | | | | | |
Electric 3.5% | |
Appalachian Power Co.
3.30%, due 6/1/27 | | | 1,800,000 | | | | 1,892,777 | |
Baltimore Gas & Electric Co.
2.40%, due 8/15/26 (c) | | | 4,150,000 | | | | 4,155,176 | |
CMS Energy Corp.
3.875%, due 3/1/24 | | | 3,818,000 | | | | 4,025,966 | |
Duke Energy Corp.
4.875% (5 Year Treasury Constant Maturity Rate + 3.388%), due 9/16/24 (b)(e) | | | 2,415,000 | | | | 2,547,825 | |
Entergy Arkansas LLC
3.50%, due 4/1/26 | | | 1,235,000 | | | | 1,313,941 | |
Evergy, Inc.
5.292%, due 6/15/22 (f) | | | 663,000 | | | | 708,908 | |
Florida Power & Light Co.
2.75%, due 6/1/23 | | | 2,680,000 | | | | 2,759,352 | |
Potomac Electric Power Co.
4.15%, due 3/15/43 | | | 1,305,000 | | | | 1,473,067 | |
Public Service Electric & Gas Co.
3.00%, due 5/15/27 | | | 3,405,000 | | | | 3,553,762 | |
Public Service Enterprise Group, Inc.
2.65%, due 11/15/22 (c) | | | 3,500,000 | | | | 3,558,831 | |
WEC Energy Group, Inc. | | | | | | | | |
3.10%, due 3/8/22 | | | 2,345,000 | | | | 2,404,046 | |
4.271% (3 Month LIBOR + 2.113%), due 5/15/67 (b) | | | 5,495,000 | | | | 4,763,246 | |
| | | | | | | | |
| | | | | | | 33,156,897 | |
| | | | | | | | |
Entertainment 0.7% | |
Eldorado Resorts, Inc.
7.00%, due 8/1/23 (c) | | | 4,515,000 | | | | 4,712,531 | |
International Game Technology PLC
6.25%, due 2/15/22 (a) | | | 2,300,000 | | | | 2,420,750 | |
| | | | | | | | |
| | | | | | | 7,133,281 | |
| | | | | | | | |
| | | | | | |
The notes to the financial statements are an integral part of,
and should be read in conjunction with, the financial statements. | | | | | 13 | |
Portfolio of InvestmentsOctober 31, 2019 (continued)
| | | | | | | | |
| | | Principal
Amount | | | Value | |
| Corporate Bonds (continued) | |
Environmental Controls 0.4% | |
Waste Management, Inc.
2.40%, due 5/15/23 | | $ | 3,880,000 | | | $ | 3,930,848 | |
| | | | | | | | |
|
Food 2.0% | |
JBS USA LUX S.A. / JBS Food Co. / JBS USA Finance, Inc.
5.50%, due 1/15/30 (a) | | | 1,035,000 | | | | 1,113,919 | |
Kerry Group Financial Services Unlimited Co.
3.20%, due 4/9/23 (a) | | | 4,595,000 | | | | 4,674,691 | |
Mondelez International Holdings Netherlands B.V.
2.125%, due 9/19/22 (a) | | | 3,225,000 | | | | 3,229,179 | |
Smithfield Foods, Inc. (a) | | | | | | | | |
2.70%, due 1/31/20 | | | 4,005,000 | | | | 4,005,362 | |
3.35%, due 2/1/22 | | | 2,490,000 | | | | 2,503,123 | |
Tyson Foods, Inc.
3.95%, due 8/15/24 | | | 2,892,000 | | | | 3,103,737 | |
| | | | | | | | |
| | | | | | | 18,630,011 | |
| | | | | | | | |
Forest Products & Paper 0.4% | |
Georgia-Pacific LLC
8.00%, due 1/15/24 | | | 2,945,000 | | | | 3,611,690 | |
| | | | | | | | |
|
Health Care—Products 1.0% | |
Abbott Laboratories
3.40%, due 11/30/23 | | | 3,520,000 | | | | 3,713,279 | |
Becton Dickinson & Co. | | | | | | | | |
2.675%, due 12/15/19 | | | 1,059,000 | | | | 1,059,328 | |
3.363%, due 6/6/24 | | | 2,860,000 | | | | 2,995,712 | |
Stryker Corp.
2.625%, due 3/15/21 | | | 2,179,000 | | | | 2,199,495 | |
| | | | | | | | |
| | | | | | | 9,967,814 | |
| | | | | | | | |
Holding Company—Diversified 0.4% | |
CK Hutchison International (17) II, Ltd.
3.25%, due 9/29/27 (a) | | | 3,855,000 | | | | 3,962,498 | |
| | | | | | | | |
|
Home Builders 3.0% | |
D.R. Horton, Inc.
5.75%, due 8/15/23 (c) | | | 4,250,000 | | | | 4,717,535 | |
KB Home
8.00%, due 3/15/20 | | | 2,250,000 | | | | 2,295,675 | |
Lennar Corp. | | | | | | | | |
4.50%, due 11/15/19 | | | 4,740,000 | | | | 4,742,370 | |
6.25%, due 12/15/21 | | | 2,875,000 | | | | 3,033,125 | |
8.375%, due 1/15/21 | | | 2,540,000 | | | | 2,705,100 | |
MDC Holdings, Inc.
5.625%, due 2/1/20 | | | 1,608,000 | | | | 1,616,040 | |
Meritage Homes Corp.
7.00%, due 4/1/22 | | | 4,720,000 | | | | 5,156,600 | |
| | | | | | | | |
| | | Principal
Amount | | | Value | |
Home Builders (continued) | | | | | | | | |
Toll Brothers Finance Corp.
5.875%, due 2/15/22 | | $ | 3,735,000 | | | $ | 3,973,106 | |
| | | | | | | | |
| | | | | | | 28,239,551 | |
| | | | | | | | |
Home Furnishing 0.4% | |
Panasonic Corp.
2.536%, due 7/19/22 (a) | | | 3,305,000 | | | | 3,332,515 | |
| | | | | | | | |
|
Insurance 2.7% | |
Lincoln National Corp.
4.481% (3 Month LIBOR + 2.358%), due 5/17/66 (b) | | | 3,537,000 | | | | 2,976,178 | |
MassMutual Global Funding II
2.50%, due 4/13/22 (a) | | | 3,600,000 | | | | 3,647,722 | |
Pricoa Global Funding I
2.55%, due 11/24/20 (a) | | | 2,725,000 | | | | 2,746,786 | |
Protective Life Corp.
8.45%, due 10/15/39 | | | 2,476,000 | | | | 3,899,873 | |
Reliance Standard Life Global Funding II
2.50%, due 10/30/24 (a) | | | 2,900,000 | | | | 2,906,029 | |
Scottish Widows, Ltd.
Series Reg S
5.50%, due 6/16/23 | | | GBP 6,500,000 | | | | 9,379,513 | |
| | | | | | | | |
| | | | | | | 25,556,101 | |
| | | | | | | | |
Internet 1.8% | |
Baidu, Inc.
4.375%, due 5/14/24 | | $ | 2,380,000 | | | | 2,530,314 | |
Booking Holdings, Inc.
3.60%, due 6/1/26 | | | 2,790,000 | | | | 3,020,614 | |
Expedia Group, Inc.
3.25%, due 2/15/30 (a) | | | 3,920,000 | | | | 3,922,671 | |
GrubHub Holdings, Inc.
5.50%, due 7/1/27 (a) | | | 1,895,000 | | | | 1,776,562 | |
Tencent Holdings, Ltd.
3.28%, due 4/11/24 (a) | | | 3,820,000 | | | | 3,933,640 | |
Weibo Corp.
3.50%, due 7/5/24 (c) | | | 1,515,000 | | | | 1,543,695 | |
| | | | | | | | |
| | | | | | | 16,727,496 | |
| | | | | | | | |
Iron & Steel 0.9% | |
ArcelorMittal
4.55%, due 3/11/26 | | | 3,470,000 | | | | 3,669,310 | |
Vale Overseas, Ltd.
6.25%, due 8/10/26 | | | 4,330,000 | | | | 5,045,316 | |
| | | | | | | | |
| | | | | | | 8,714,626 | |
| | | | | | | | |
Lodging 0.7% | |
Marriott International, Inc.
3.75%, due 10/1/25 | | | 5,888,000 | | | | 6,296,002 | |
| | | | | | | | |
| | | | |
| 14 | | MainStay MacKay Unconstrained Bond Fund | | The notes to the financial statements are an integral part of,
and should be read in conjunction with, the financial statements. |
| | | | | | | | |
| | | Principal
Amount | | | Value | |
| Corporate Bonds (continued) | |
Media 0.8% | |
Diamond Sports Group LLC / Diamond Sports Finance Co.
6.625%, due 8/15/27 (a)(g) | | $ | 3,228,000 | | | $ | 3,324,840 | |
Grupo Televisa S.A.B.
5.25%, due 5/24/49 (c) | | | 1,695,000 | | | | 1,854,723 | |
Sky, Ltd.
3.75%, due 9/16/24 (a) | | | 1,480,000 | | | | 1,594,095 | |
Time Warner Entertainment Co., L.P.
8.375%, due 3/15/23 | | | 1,087,000 | | | | 1,294,494 | |
| | | | | | | | |
| | | | | | | 8,068,152 | |
| | | | | | | | |
Mining 0.5% | |
Anglo American Capital PLC
4.875%, due 5/14/25 (a) | | | 3,000,000 | | | | 3,258,213 | |
Corp. Nacional del Cobre de Chile
3.00%, due 9/30/29 (a) | | | 1,890,000 | | | | 1,885,407 | |
| | | | | | | | |
| | | | | | | 5,143,620 | |
| | | | | | | | |
Miscellaneous—Manufacturing 0.7% | |
Siemens Financieringsmaatschappij N.V.
2.70%, due 3/16/22 (a) | | | 3,320,000 | | | | 3,380,523 | |
Textron Financial Corp.
3.893% (3 Month LIBOR + 1.735%), due 2/15/67 (a)(b) | | | 4,350,000 | | | | 3,273,375 | |
| | | | | | | | |
| | | | | | | 6,653,898 | |
| | | | | | | | |
Oil & Gas 3.3% | |
Concho Resources, Inc.
4.30%, due 8/15/28 | | | 2,995,000 | | | | 3,231,933 | |
Gazprom Via Gaz Capital S.A.
7.288%, due 8/16/37 (a) | | | 2,520,000 | | | | 3,402,262 | |
Marathon Petroleum Corp.
5.125%, due 4/1/24 (c) | | | 8,050,000 | | | | 8,288,224 | |
Occidental Petroleum Corp.
(zero coupon), due 10/10/36 | | | 19,735,000 | | | | 9,920,917 | |
Petrobras Global Finance B.V.
7.375%, due 1/17/27 | | | 1,559,000 | | | | 1,887,949 | |
Petroleos Mexicanos
6.75%, due 9/21/47 | | | 4,835,000 | | | | 4,810,825 | |
| | | | | | | | |
| | | | | | | 31,542,110 | |
| | | | | | | | |
Packaging & Containers 1.2% | |
Crown European Holdings S.A.
4.00%, due 7/15/22 (a) | | EUR | 3,540,000 | | | | 4,284,544 | |
Reynolds Group Issuer, Inc. / Reynolds Group Issuer LLC
5.125%, due 7/15/23 (a) | | $ | 4,555,000 | | | | 4,673,202 | |
WRKCo, Inc.
3.00%, due 9/15/24 | | | 2,735,000 | | | | 2,799,882 | |
| | | | | | | | |
| | | | | | | 11,757,628 | |
| | | | | | | | |
| | | | | | | | |
| | | Principal
Amount | | | Value | |
Pharmaceuticals 1.4% | |
Bausch Health Cos., Inc. (a) | | | | | | | | |
5.50%, due 11/1/25 | | $ | 3,735,000 | | | $ | 3,903,112 | |
5.75%, due 8/15/27 | | | 2,835,000 | | | | 3,078,633 | |
Bristol-Myers Squibb Co.
3.40%, due 7/26/29 (a) | | | 3,115,000 | | | | 3,350,453 | |
Eli Lilly & Co.
2.35%, due 5/15/22 | | | 2,200,000 | | | | 2,230,860 | |
Zoetis, Inc.
3.25%, due 8/20/21 | | | 770,000 | | | | 786,174 | |
| | | | | | | | |
| | | | | | | 13,349,232 | |
| | | | | | | | |
Pipelines 1.3% | |
Enterprise Products Operating LLC | | | | | | | | |
3.125%, due 7/31/29 | | | 2,150,000 | | | | 2,207,362 | |
4.20%, due 1/31/50 | | | 520,000 | | | | 549,907 | |
Kinder Morgan, Inc. | | | | | | | | |
5.625%, due 11/15/23 (a) | | | 2,449,000 | | | | 2,721,877 | |
7.75%, due 1/15/32 | | | 2,035,000 | | | | 2,802,163 | |
MPLX, L.P.
4.00%, due 3/15/28 | | | 560,000 | | | | 582,155 | |
Targa Resources Partners, L.P. / Targa Resources Partners Finance Corp.
5.25%, due 5/1/23 (c) | | | 3,725,000 | | | | 3,738,969 | |
| | | | | | | | |
| | | | | | | 12,602,433 | |
| | | | | | | | |
Private Equity 0.2% | |
Icahn Enterprises L.P. / Icahn Enterprises Finance Corp.
6.25%, due 2/1/22 | | | 1,390,000 | | | | 1,423,013 | |
| | | | | | | | |
|
Real Estate Investment Trusts 1.2% | |
American Tower Corp.
3.00%, due 6/15/23 (c) | | | 5,500,000 | | | | 5,649,441 | |
Digital Realty Trust, L.P.
3.70%, due 8/15/27 | | | 3,605,000 | | | | 3,805,505 | |
GLP Capital, L.P. / GLP Financing II, Inc.
3.35%, due 9/1/24 | | | 1,535,000 | | | | 1,552,652 | |
Host Hotels & Resorts, L.P.
3.75%, due 10/15/23 (c) | | | 472,000 | | | | 492,302 | |
| | | | | | | | |
| | | | | | | 11,499,900 | |
| | | | | | | | |
Retail 1.3% | |
Alimentation Couche-Tard, Inc. (a) | | | | | | | | |
2.35%, due 12/13/19 | | | 3,415,000 | | | | 3,416,263 | |
2.70%, due 7/26/22 | | | 1,500,000 | | | | 1,517,574 | |
CVS Pass-Through Trust
5.789%, due 1/10/26 (a) | | | 44,559 | | | | 48,017 | |
Darden Restaurants, Inc.
3.85%, due 5/1/27 | | | 4,847,000 | | | | 5,106,128 | |
Starbucks Corp.
4.45%, due 8/15/49 | | | 1,970,000 | | | | 2,277,513 | |
| | | | | | | | |
| | | | | | | 12,365,495 | |
| | | | | | | | |
| | | | | | |
The notes to the financial statements are an integral part of,
and should be read in conjunction with, the financial statements. | | | | | 15 | |
Portfolio of InvestmentsOctober 31, 2019 (continued)
| | | | | | | | |
| | | Principal
Amount | | | Value | |
| Corporate Bonds (continued) | |
Savings & Loans 0.1% | |
Nationwide Building Society
3.96%, due 7/18/30 (a)(d) | | $ | 1,325,000 | | | $ | 1,422,399 | |
| | | | | | | | |
|
Semiconductors 1.2% | |
Broadcom, Inc.
3.625%, due 10/15/24 (a) | | | 2,040,000 | | | | 2,095,908 | |
NXP B.V. / NXP Funding LLC (a) | | | | | | | | |
4.125%, due 6/1/21 | | | 6,300,000 | | | | 6,473,479 | |
4.625%, due 6/15/22 | | | 2,960,000 | | | | 3,108,911 | |
| | | | | | | | |
| | | | | | | 11,678,298 | |
| | | | | | | | |
Software 0.2% | |
Fiserv, Inc. | | | | | | | | |
2.75%, due 7/1/24 | | | 1,080,000 | | | | 1,104,166 | |
3.20%, due 7/1/26 | | | 685,000 | | | | 715,702 | |
| | | | | | | | |
| | | | | | | 1,819,868 | |
| | | | | | | | |
Telecommunications 4.1% | |
AT&T, Inc. | | | | | | | | |
3.20%, due 3/1/22 | | | 5,840,000 | | | | 5,993,415 | |
3.312% (3 Month LIBOR + 1.18%), due 6/12/24 (b) | | | 2,880,000 | | | | 2,930,046 | |
Crown Castle Towers LLC
4.241%, due 7/15/48 (a) | | | 3,825,000 | | | | 4,212,078 | |
Rogers Communications, Inc.
3.625%, due 12/15/25 | | | 5,635,000 | | | | 6,006,023 | |
Sprint Corp.
7.875%, due 9/15/23 | | | 3,620,000 | | | | 3,995,575 | |
Sprint Spectrum Co. LLC / Sprint Spectrum Co. II LLC / Sprint Spectrum Co. III LLC
4.738%, due 9/20/29 (a) | | | 4,480,000 | | | | 4,776,845 | |
T-Mobile USA, Inc.
6.00%, due 3/1/23 | | | 3,000,000 | | | | 3,060,000 | |
Telefonica Emisiones SAU
5.462%, due 2/16/21 | | | 1,000 | | | | 1,043 | |
VEON Holdings B.V.
4.95%, due 6/16/24 (a) | | | 3,345,000 | | | | 3,560,050 | |
Verizon Communications, Inc. | | | | | | | | |
4.125%, due 3/16/27 | | | 685,000 | | | | 763,883 | |
5.15%, due 9/15/23 | | | 3,573,000 | | | | 3,990,613 | |
| | | | | | | | |
| | | | | | | 39,289,571 | |
| | | | | | | | |
Total Corporate Bonds
(Cost $597,477,962) | | | | | | | 615,336,903 | |
| | | | | | | | |
|
| Foreign Bonds 0.1% | |
Banks 0.1% | |
Barclays Bank PLC
Series Reg S
10.00%, due 5/21/21 | | | GBP 449,000 | | | | 653,530 | |
| | | | | | | | |
Total Foreign Bonds
(Cost $720,496) | | | | | | | 653,530 | |
| | | | | | | | |
| | | | | | | | |
| | | Principal
Amount | | | Value | |
| Loan Assignments 5.8% (b) | |
Advertising 0.5% | |
Outfront Media Capital LLC
2017 Term Loan B
3.94% (3 Month LIBOR + 2.00%), due 3/18/24 | | $ | 4,746,007 | | | $ | 4,762,818 | |
| | | | | | | | |
|
Commercial Services 0.2% | |
KAR Auction Services, Inc.
2019 Term Loan B6
4.125% (1 Month LIBOR + 2.25%), due 9/19/26 | | | 1,481,776 | | | | 1,486,098 | |
| | | | | | | | |
|
Environmental Controls 0.6% | |
Advanced Disposal Services, Inc. Term Loan B3
4.086% (1 Week LIBOR + 2.25%), due 11/10/23 | | | 5,505,000 | | | | 5,511,804 | |
| | | | | | | | |
|
Food Services 0.1% | |
Aramark Services, Inc.
2018 Term Loan B2
3.536% (1 Month LIBOR + 1.75%), due 3/28/24 | | | 1,102,946 | | | | 1,103,980 | |
| | | | | | | | |
|
Hand & Machine Tools 0.4% | |
Milacron LLC
Amended Term Loan B
4.286% (1 Month LIBOR + 2.50%), due 9/28/23 | | | 4,005,618 | | | | 4,000,611 | |
| | | | | | | | |
|
Health Care—Services 0.4% | |
Syneos Health, Inc.
2018 Term Loan B
3.786% (1 Month LIBOR + 2.00%), due 8/1/24 | | | 3,436,779 | | | | 3,434,631 | |
| | | | | | | | |
|
Household Products & Wares 0.4% | |
Prestige Brands, Inc. Term Loan B4
3.786% (1 Month LIBOR + 2.00%), due 1/26/24 | | | 3,898,047 | | | | 3,898,827 | |
| | | | | | | | |
|
Lodging 0.6% | |
Boyd Gaming Corp. Term Loan B3
3.96% (1 Week LIBOR + 2.25%), due 9/15/23 | | | 305,783 | | | | 305,892 | |
Hilton Worldwide Finance LLC
2019 Term Loan B2
3.573% (1 Month LIBOR + 1.75%), due 6/22/26 | | | 5,324,239 | | | | 5,344,205 | |
| | | | | | | | |
| | | | | | | 5,650,097 | |
| | | | | | | | |
| | | | |
| 16 | | MainStay MacKay Unconstrained Bond Fund | | The notes to the financial statements are an integral part of,
and should be read in conjunction with, the financial statements. |
| | | | | | | | |
| | | Principal
Amount | | | Value | |
| Loan Assignments (continued) | |
Media 0.4% | |
Nielsen Finance LLC Term Loan B4
3.94% (1 Month LIBOR + 2.00%), due 10/4/23 | | $ | 3,865,875 | | | $ | 3,850,172 | |
| | | | | | | | |
|
Pharmaceuticals 0.4% | |
Change Healthcare Holdings, Inc.
2017 Term Loan B
4.286% (1 Month LIBOR + 2.50%), due 3/1/24 | | | 4,273,191 | | | | 4,245,817 | |
| | | | | | | | |
|
Retail 0.2% | |
1011778 B.C. Unlimited Liability Co. Term Loan B3
4.036% (1 Month LIBOR + 2.25%), due 2/16/24 | | | 1,480,559 | | | | 1,481,484 | |
| | | | | | | | |
|
Telecommunications 1.3% | |
Level 3 Financing, Inc.
2017 Term Loan B
4.036% (1 Month LIBOR + 2.25%), due 2/22/24 | | | 4,000,000 | | | | 4,001,000 | |
SBA Senior Finance II LLC
2018 Term Loan B
3.79% (1 Month LIBOR + 2.00%), due 4/11/25 | | | 8,589,723 | | | | 8,607,615 | |
| | | | | | | | |
| | | | | | | 12,608,615 | |
| | | | | | | | |
Transportation 0.3% | |
XPO Logistics, Inc.
2018 Term Loan B
3.786% (1 Month LIBOR + 2.00%), due 2/24/25 | | | 3,285,000 | | | | 3,287,736 | |
| | | | | | | | |
Total Loan Assignments
(Cost $55,272,732) | | | | | | | 55,322,690 | |
| | | | | | | | |
|
| Mortgage-Backed Securities 11.3% | |
Agency (Collateralized Mortgage Obligations) 4.1% | |
Federal Home Loan Mortgage Corporation | | | | | | | | |
REMIC, Series 4908, Class BD
3.00%, due 4/25/49 | | | 2,480,000 | | | | 2,556,502 | |
REMIC, Series 4911, Class MB
3.00%, due 9/25/49 | | | 4,685,000 | | | | 4,798,057 | |
REMIC, Series 4926, Class BP
3.00%, due 10/25/49 (h) | | | 5,000,000 | | | | 5,160,000 | |
Series 2019-1, Class A1
3.50%, due 5/25/29 | | | 2,203,416 | | | | 2,291,090 | |
REMIC Series 4888, Class BA
3.50%, due 9/15/48 | | | 2,047,034 | | | | 2,129,622 | |
| | | | | | | | |
| | | Principal
Amount | | | Value | |
Agency (Collateralized Mortgage Obligations) (continued) | |
Federal National Mortgage Association | | | | | | | | |
Series 2019-25, Class PA
3.00%, due 5/25/48 | | $ | 2,535,738 | | | $ | 2,601,586 | |
REMIC,Series 2019-39, Class LA
3.00%, due 2/25/49 | | | 3,107,973 | | | | 3,186,306 | |
REMIC,Series 2019-58, Class LP
3.00%, due 10/25/49 | | | 5,275,000 | | | | 5,417,311 | |
Government National Mortgage Association | | | | | | | | |
Series 2014-91, Class MA
3.00%, due 1/16/40 | | | 2,683,572 | | | | 2,769,788 | |
Series 2019-29, Class CB
3.00%, due 10/20/48 | | | 2,307,551 | | | | 2,354,557 | |
Series 2019-43, Class PL
3.00%, due 4/20/49 | | | 2,449,698 | | | | 2,529,618 | |
Series 2019-74, Class AT
3.00%, due 6/20/49 | | | 3,262,512 | | | | 3,346,584 | |
| | | | | | | | |
| | | | | | | 39,141,021 | |
| | | | | | | | |
Commercial Mortgage Loans
(Collateralized Mortgage Obligations) 6.3% | |
Bank | | | | | | | | |
Series 2019-BN21, Class A5
2.851%, due 10/17/52 | | | 5,310,000 | | | | 5,475,428 | |
Series 2019-BN19, Class A2
2.926%, due 8/15/61 | | | 3,520,000 | | | | 3,657,627 | |
Bayview Commercial Asset Trust
Series 2006-4A, Class A1
2.248% (1 Month LIBOR + 0.23%), due 12/25/36 (a)(b) | | | 17,515 | | | | 16,915 | |
Benchmark Mortgage Trust
Series 2019-B12, Class A5
3.116%, due 8/15/52 | | | 3,531,000 | | | | 3,729,715 | |
FREMF Mortgage Trust (a)(i) | | | | | | | | |
Series 2013-K33, Class B
3.499%, due 8/25/46 | | | 2,965,000 | | | | 3,096,799 | |
Series 2013-K30, Class B
3.557%, due 6/25/45 | | | 3,975,000 | | | | 4,156,240 | |
Series 2013-K35, Class B
3.939%, due 12/25/46 | | | 2,230,000 | | | | 2,354,373 | |
Series 2012-K17, Class B
4.331%, due 12/25/44 | | | 2,305,000 | | | | 2,397,133 | |
GS Mortgage Securities Trust | | | | | | | | |
Series 2019-GC42, Class A4
3.001%, due 9/1/52 | | | 1,365,000 | | | | 1,426,904 | |
Series 2019-GC40, Class A4
3.16%, due 7/10/52 | | | 2,560,000 | | | | 2,709,774 | |
Series 2019-BOCA, Class A
3.228% (1 Month LIBOR + 1.20%), due 6/15/38 (a)(b) | | | 4,430,000 | | | | 4,435,531 | |
Hawaii Hotel Trust
Series 2019-MAUI, Class A
3.178% (1 Month LIBOR + 1.15%), due 5/15/38 (a)(b) | | | 2,160,000 | | | | 2,162,037 | |
| | | | | | |
The notes to the financial statements are an integral part of,
and should be read in conjunction with, the financial statements. | | | | | 17 | |
Portfolio of InvestmentsOctober 31, 2019 (continued)
| | | | | | | | |
| | | Principal
Amount | | | Value | |
| Mortgage-Backed Securities (continued) | |
Commercial Mortgage Loans
(Collateralized Mortgage Obligations) (continued) | |
Hudson Yards Mortgage Trust
Series 2019-30HY, Class A
3.228%, due 7/10/39 (a) | | $ | 2,490,000 | | | $ | 2,649,012 | |
JP Morgan Chase Commercial Mortgage Securities Trust | | | | | | | | |
Series 2018-AON, Class A
4.128%, due 7/5/31 (a) | | | 3,435,000 | | | | 3,672,236 | |
Series 2013-C16, Class A4
4.166%, due 12/15/46 | | | 2,280,000 | | | | 2,453,022 | |
JPMBB Commercial Mortgage Securities Trust
Series 2015-C28, Class A4
3.227%, due 10/15/48 | | | 3,235,000 | | | | 3,392,716 | |
One Bryant Park Trust
Series 2019-OBP, Class A
2.516%, due 9/15/54 (a) | | | 4,825,000 | | | | 4,818,052 | |
Wells Fargo Commercial Mortgage Trust (a)(i) | | | | | | | | |
Series 2018-1745, Class A
3.749%, due 6/15/36 | | | 2,900,000 | | | | 3,180,310 | |
Series 2018-AUS, Class A
4.058%, due 8/17/36 | | | 4,200,000 | | | | 4,669,970 | |
| | | | | | | | |
| | | | | | | 60,453,794 | |
| | | | | | | | |
Residential Mortgage (Collateralized Mortgage Obligation) 0.2% | |
JP Morgan Mortgage Trust
Series 2019-1, Class A3
4.00%, due 5/25/49 (a)(j) | | | 1,461,907 | | | | 1,482,922 | |
| | | | | | | | |
|
Whole Loan (Collateralized Mortgage Obligations) 0.7% | |
Chase Home Lending Mortgage Trust (a)(j) | | | | | | | | |
Series 2019-ATR2, Class A3
3.50%, due 7/25/49 | | | 1,926,714 | | | | 1,955,991 | |
Series 2019-ATR1, Class A4
4.00%, due 4/25/49 | | | 2,600,569 | | | | 2,609,513 | |
Fannie Mae Connecticut Avenue Securities
Series 2016-C06, Class 1M2
6.268% (1 Month LIBOR + 4.25%), due 4/25/29 (b) | | | 1,681,452 | | | | 1,787,040 | |
| | | | | | | | |
| | | | | | | 6,352,544 | |
| | | | | | | | |
Total Mortgage-Backed Securities
(Cost $105,484,535) | | | | | | | 107,430,281 | |
| | | | | | | | |
|
| Municipal Bonds 0.2% | |
New York 0.2% | |
New York State Thruway Authority, Revenue Bonds
Series M
2.90%, due 1/1/35 | | | 1,495,000 | | | | 1,513,329 | |
| | | | | | | | |
Total Municipal Bonds
(Cost $1,495,000) | | | | | | | 1,513,329 | |
| | | | | | | | |
| | | | | | | | |
| | | Principal
Amount | | | Value | |
| U.S. Government & Federal Agencies 8.5% | |
Federal Home Loan Mortgage Corporation
(Mortgage Pass-Through Securities) 0.2% | |
4.00%, due 2/1/49 | | $ | 2,340,705 | | | $ | 2,436,049 | |
Federal National Mortgage Association
(Mortgage Pass-Through Securities) 4.0% | |
3.50%, due 9/1/48 TBA (k) | | | 8,782,000 | | | | 9,016,644 | |
4.00%, due 8/1/48 | | | 13,299,085 | | | | 13,833,976 | |
4.00%, due 2/1/49 | | | 5,000,661 | | | | 5,198,064 | |
4.50%, due 1/1/49 | | | 9,210,151 | | | | 9,721,777 | |
| | | | | | | | |
| | | | | | | 37,770,461 | |
| | | | | | | | |
United States Treasury Notes 0.1% | | | | | | | | |
1.625%, due 8/15/29 | | | 720,000 | | | | 715,697 | |
| | | | | | | | |
|
United States Treasury Inflation—Indexed Notes 4.2% (l) | |
0.75%, due 7/15/28 | | | 11,345,088 | | | | 11,940,381 | |
0.875%, due 1/15/29 | | | 26,620,772 | | | | 28,312,468 | |
| | | | | | | | |
| | | | | | | 40,252,849 | |
| | | | | | | | |
Total U.S. Government & Federal Agencies
(Cost $78,327,210) | | | | | | | 81,175,056 | |
| | | | | | | | |
TotalLong-Term Bonds
(Cost $897,726,389) | | | | | | | 921,178,250 | |
| | | | | | | | |
| | |
| | | | | | | | |
| | | Shares | | | | |
| Common Stocks 0.0%‡ | |
Commercial Services & Supplies 0.0%‡ | |
Quad/Graphics, Inc. | | | 14 | | | | 64 | |
| | | | | | | | |
|
Media 0.0%‡ | |
ION Media Networks, Inc. (h)(m)(n)(o)(p) | | | 22 | | | | 8,726 | |
| | | | | | | | |
|
Tobacco 0.0%‡ | |
Turning Point Brands, Inc. (g) | | | 6,802 | | | | 141,958 | |
| | | | | | | | |
Total Common Stocks
(Cost $0) | | | | | | | 150,748 | |
| | | | | | | | |
|
| Short-Term Investments 6.7% | |
Affiliated Investment Company 5.4% | |
MainStay U.S. Government Liquidity Fund, 1.76% (q) | | | 51,821,778 | | | | 51,821,778 | |
| | | | | | | | |
Total Affiliated Investment Company
(Cost $51,821,778) | | | | | | | 51,821,778 | |
| | | | | | | | |
|
Unaffiliated Investment Company 0.4% | |
State Street Navigator Securities Lending Government Money Market Portfolio, 1.75% (q)(r) | | | 3,432,629 | | | | 3,432,629 | |
| | | | | | | | |
Total Unaffiliated Investment Company
(Cost $3,432,629) | | | | | | | 3,432,629 | |
| | | | | | | | |
| | |
| | | | | | | | |
| | | | |
| 18 | | MainStay MacKay Unconstrained Bond Fund | | The notes to the financial statements are an integral part of,
and should be read in conjunction with, the financial statements. |
| | | | | | | | |
| | | Principal
Amount | | | Value | |
| U.S. Government & Federal Agencies 0.9% | |
United States Treasury Bills
1.706%, due 11/26/19 (s) | | $ | 8,550,000 | | | $ | 8,540,025 | |
| | | | | | | | |
Total U.S. Government & Federal Agencies
(Cost $8,540,025) | | | | | | | 8,540,025 | |
| | | | | | | | |
TotalShort-Term Investments
(Cost $63,794,432) | | | | | | | 63,794,432 | |
| | | | | | | | |
Total Investments, Before Investments Sold Short
(Cost $961,520,821) | | | 103.5 | % | | | 985,123,430 | |
| | | | | | | | |
|
Investments Sold Short (2.6%) Corporate Bonds Sold Short (2.6%) | |
Health Care—Services (0.3%) | |
Davita, Inc.
5.00%, due 5/1/25 | | | (2,940,000 | ) | | | (2,969,988 | ) |
| | | | | | | | |
|
Internet (1.1%) | |
Netflix, Inc.
4.375%, due 11/15/26 | | | (10,400,000 | ) | | | (10,585,120 | ) |
| | | | | | | | |
|
Mining (0.6%) | |
FMG Resources (August 2006) Pty, Ltd.
5.125%, due 5/15/24 (a) | | | (5,000,000 | ) | | | (5,250,000 | ) |
| | | | | | | | |
|
Semiconductors (0.6%) | |
Amkor Technology, Inc.
6.625%, due 9/15/27 (a) | | | (5,000,000 | ) | | | (5,475,000 | ) |
| | | | | | | | |
Total Investments Sold Short (Proceeds $23,339,794) | | | | | | | (24,280,108 | ) |
| | | | | | | | |
Total Investments, Net of Investments Sold Short
(Cost $938,181,027) | | | 100.9 | % | | | 960,843,322 | |
Other Assets, Less Liabilities | | | (0.9 | ) | | | (8,777,993 | ) |
Net Assets | | | 100.0 | % | | $ | 952,065,329 | |
| † | Percentages indicated are based on Fund net assets. |
| ‡ | Less than one-tenth of a percent. |
| (a) | May be sold to institutional investors only under Rule 144A or securities offered pursuant to Section 4(a)(2) of the Securities Act of 1933, as amended. |
| (b) | Floating rate—Rate shown was the rate in effect as of October 31, 2019. |
| (c) | Security, or a portion thereof, was maintained in a segregated account at the Fund’s custodian as collateral for securities sold short (See Note 2(N)). |
| (d) | Fixed to floating rate—Rate shown was the rate in effect as of October 31, 2019. |
| (e) | Securities are perpetual and, thus, do not have a predetermined maturity date. The date shown, if applicable, reflects the next call date. |
| (f) | Step coupon—Rate shown was the rate in effect as of October 31, 2019. |
| (g) | All or a portion of this security was held on loan. As of October 31, 2019, the aggregate market value of securities on loan was $3,463,764; the total market value of collateral held by the Fund was $3,554,377. The market value of the collateral held included non-cash collateral in the form of U.S. Treasury securities with a value of $121,748 (See Note 2(O)). |
| (h) | Fair valued security—Represents fair value as measured in good faith under procedures approved by the Board of Trustees. As of October 31, 2019, the total market value of fair valued securities was $5,168,726, which represented 0.5% of the Fund’s net assets. |
| (i) | Collateral strip rate—A bond whose interest was based on the weighted net interest rate of the collateral. The coupon rate adjusts periodically based on a predetermined schedule. Rate shown was the rate in effect as of October 31, 2019. |
| (j) | Coupon rate may change based on changes of the underlying collateral or prepayments of principal. The coupon rate shown represents the rate at period end. |
| (k) | TBA—Securities purchased on a forward commitment basis with an approximate principal amount and maturity date. The actual principal amount and maturity date will be determined upon settlement. As of October 31, 2019, the total net market value of these securities was $9,016,644, which represented 0.9% of the Fund’s net assets. All or a portion of these securities are a part of a mortgage dollar roll agreement. |
| (l) | Treasury Inflation Protected Security—Pays a fixed rate of interest on a principal amount that is continuously adjusted for inflation based on the Consumer Price Index-Urban Consumers. |
| (m) | Security in which significant unobservable inputs (Level 3) were used in determining fair value. |
| (n) | Restricted security. (See Note 5) |
| (o) | Illiquid investment—As of October 31, 2019, the total market value of these illiquid investments was $8,726, which represented less than one-tenth of a percent of the Fund’s net assets. (Unaudited) |
| (p) | Non-income producing security. |
| (q) | Current yield as of October 31, 2019. |
| (r) | Represents security purchased with cash collateral received for securities on loan. |
| (s) | Interest rate shown represents yield to maturity. |
| | | | | | |
The notes to the financial statements are an integral part of,
and should be read in conjunction with, the financial statements. | | | | | 19 | |
Portfolio of InvestmentsOctober 31, 2019 (continued)
Foreign Currency Forward Contracts
As of October 31, 2019, the Fund held the following foreign currency forward contracts1:
| | | | | | | | | | | | | | | | | | |
Currency Purchased | | | Currency Sold | | | Counterparty | | Settlement
Date | | Unrealized
Appreciation
(Depreciation) | |
| | | | | | |
USD | | | 4,496,568 | | | EUR | | | 3,979,000 | | | JPMorgan Chase Bank N.A. | | 11/1/19 | | $ | 58,791 | |
USD | | | 199,871 | | | EUR | | | 179,000 | | | JPMorgan Chase Bank N.A. | | 11/1/19 | | | 232 | |
EUR | | | 3,908,000 | | | USD | | | 4,337,786 | | | JPMorgan Chase Bank N.A. | | 11/1/19 | | | 20,805 | |
GBP | | | 8,545,000 | | | USD | | | 10,987,315 | | | JPMorgan Chase Bank N.A. | | 11/1/19 | | | 81,453 | |
Total unrealized appreciation | | | | | | | | 161,281 | |
USD | | | 10,356,306 | | | GBP | | | 8,266,000 | | | JPMorgan Chase Bank N.A. | | 11/1/19 | | $ | (351,059 | ) |
EUR | | | 250,000 | | | USD | | | 280,736 | | | JPMorgan Chase Bank N.A. | | 11/1/19 | | | (1,911 | ) |
USD | | | 348,692 | | | GBP | | | 279,000 | | | JPMorgan Chase Bank N.A. | | 11/1/19 | | | (12,711 | ) |
USD | | | 4,343,276 | | | EUR | | | 3,887,000 | | | JPMorgan Chase Bank N.A. | | 2/3/20 | | | (19,261 | ) |
USD | | | 11,067,514 | | | GBP | | | 8,580,000 | | | JPMorgan Chase Bank N.A. | | 2/3/20 | | | (79,426 | ) |
Total unrealized depreciation | | | | | | | | (464,368 | ) |
Net unrealized depreciation | | | | | | | $ | (303,087 | ) |
| 1. | Foreign Currency Forward Contracts are subject to limitations such that they cannot be “sold or repurchased,” although the Fund would be able to exit the transaction through other means, such as through the execution of an offsetting transaction. |
Futures Contracts
As of October 31, 2019, the Portfolio held the following futures contracts1:
| | | | | | | | | | | | | | | | | | | | |
Type | | Number of
Contracts | | | Expiration
Date | | | Value at
Trade Date | | | Current
Notional
Amount | | | Unrealized
Appreciation
(Depreciation)2 | |
Long Contracts | | | | | | | | | | | | | | | | | | | | |
| 2-Year United States Treasury Note | | | 195 | | | | December 2019 | | | $ | 42,047,252 | | | $ | 42,042,305 | | | $ | (4,947 | ) |
| Euro Bund | | | 20 | | | | December 2019 | | | | 3,934,809 | | | | 3,831,278 | | | | (103,531 | ) |
| United States Treasury Long Bond | | | 16 | | | | December 2019 | | | | 2,611,287 | | | | 2,582,000 | | | | (29,287 | ) |
| | | | | | | | | | | | | | | | | | | | |
| Total Long Contracts | | | | | | | | | | | | | | | | | | | (137,765 | ) |
| | | | | | | | | | | | | | | | | | | | |
Short Contracts | | | | | | | | | | | | | |
| 5-Year United States Treasury Note | | | (725 | ) | | | December 2019 | | | | (86,829,739 | ) | | | (86,422,266 | ) | | | 407,473 | |
| 10-Year United States Treasury Note | | | (265 | ) | | | December 2019 | | | | (34,871,500 | ) | | | (34,528,672 | ) | | | 342,828 | |
| 10-Year United States Treasury Ultra Note | | | (643 | ) | | | December 2019 | | | | (92,494,197 | ) | | | (91,376,328 | ) | | | 1,117,869 | |
| Euro-BTP | | | (24 | ) | | | December 2019 | | | | (3,883,614 | ) | | | (3,867,056 | ) | | | 16,558 | |
| United States Treasury Ultra Bond | | | (11 | ) | | | December 2019 | | | | (2,154,943 | ) | | | (2,087,250 | ) | | | 67,693 | |
| | | | | | | | | | | | | | | | | | | | |
| Total Short Contracts | | | | | | | | | | | | | | | | | | | 1,952,421 | |
| | | | | | | | | | | | | | | | | | | | |
| Net Unrealized Appreciation | | | | | | | | | | | | | | | | | | $ | 1,814,656 | |
| | | | | | | | | | | | | | | | | | | | |
| 1. | As of October 31, 2019, cash in the amount of $2,355,420 was on deposit with a broker or futures commission merchant for futures transactions. |
| 2. | Represents the difference between the value of the contracts at the time they were opened and the value as of October 31, 2019. |
Swap Contracts
As of October 31, 2019, the Fund held the following centrally cleared interest rate swap agreements1:
| | | | | | | | | | | | | | | | | | | | | | | | | | | | | | |
Notional
Amount | | | Currency | | | Expiration
Date | | | Payments
made by Fund | | Payments
Received by Fund | | Payment
Frequency Paid/ Received | | | Upfront
Premiums
Received/
(Paid) | | | Value | | | Unrealized
Appreciation/
(Depreciation) | |
| | | | | | | | |
| | $150,000,000 | | | | USD | | | | 11/9/2019 | | | Fixed 1.83% | | 3-Month USD-LIBOR | | | Quarterly | | | $ | (151 | ) | | $ | 25,631 | | | $ | 25,480 | |
| | 40,000,000 | | | | USD | | | | 3/16/2023 | | | Fixed 2.793% | | 3-Month USD-LIBOR | | | Quarterly | | | | — | | | | (1,697,155 | ) | | | (1,697,155 | ) |
| | 41,000,000 | | | | USD | | | | 3/29/2023 | | | Fixed 2.762% | | 3-Month USD-LIBOR | | | Quarterly | | | | — | | | | (1,717,842 | ) | | | (1,717,842 | ) |
| | | | | | | | | | | | | | | | | | | | | $ | (151 | ) | | $ | (3,389,366 | ) | | $ | (3,389,517 | ) |
| 1. | As of October 31, 2019, cash in the amount of $1,301,277 was on deposit with a broker for centrally cleared swap agreements. |
| | | | |
| 20 | | MainStay MacKay Unconstrained Bond Fund | | The notes to the financial statements are an integral part of,
and should be read in conjunction with, the financial statements. |
The following abbreviations are used in the preceding pages:
BTP—Buoni del Tesoro Poliennali (Eurex Exchange index)
EUR—Euro
GBP—British Pound Sterling
LIBOR—London Interbank Offered Rate
USD—United States Dollar
The following is a summary of the fair valuations according to the inputs used as of October 31, 2019, for valuing the Fund’s assets and liabilities:
| | | | | | | | | | | | | | | | |
Description | | Quoted
Prices in
Active
Markets for
Identical
Assets
(Level 1) | | | Significant
Other
Observable
Inputs
(Level 2) | | | Significant
Unobservable
Inputs
(Level 3) | | | Total | |
| | | | |
Asset Valuation Inputs | | | | | | | | | | | | | | | | |
| Investments in Securities (a) | | | | | | | | | | | | | | | | |
| Long-Term Bonds | | | | | | | | | | | | | | | | |
Asset-Backed Securities | | $ | — | | | $ | 59,746,461 | | | $ | — | | | $ | 59,746,461 | |
Corporate Bonds | | | — | | | | 615,336,903 | | | | — | | | | 615,336,903 | |
Foreign Bonds | | | — | | | | 653,530 | | | | — | | | | 653,530 | |
Loan Assignments | | | — | | | | 55,322,690 | | | | — | | | | 55,322,690 | |
Mortgage-Backed Securities | | | — | | | | 107,430,281 | | | | — | | | | 107,430,281 | |
Municipal Bonds | | | — | | | | 1,513,329 | | | | — | | | | 1,513,329 | |
U.S. Government & Federal Agencies | | | — | | | | 81,175,056 | | | | — | | | | 81,175,056 | |
| | | | | | | | | | | | | | | | |
| TotalLong-Term Bonds | | | — | | | | 921,178,250 | | | | — | | | | 921,178,250 | |
| | | | | | | | | | | | | | | | |
| Common Stocks (b) | | | 142,022 | | | | — | | | | 8,726 | | | | 150,748 | |
| Short-Term Investments | | | | | | | | | | | | | | | | |
Affiliated Investment Company | | | 51,821,778 | | | | — | | | | — | | | | 51,821,778 | |
Unaffiliated Investment Company | | | 3,432,629 | | | | — | | | | — | | | | 3,432,629 | |
U.S. Government & Federal Agencies | | | — | | | | 8,540,025 | | | | — | | | | 8,540,025 | |
| | | | | | | | | | | | | | | | |
| TotalShort-Term Investments | | | 55,254,407 | | | | 8,540,025 | | | | — | | | | 63,794,432 | |
| | | | | | | | | | | | | | | | |
| Total Investments in Securities | | | 55,396,429 | | | | 929,718,275 | | | | 8,726 | | | | 985,123,430 | |
| | | | | | | | | | | | | | | | |
| Other Financial Instruments | | | | | | | | | | | | | | | | |
Foreign Currency Forward Contracts (c) | | | — | | | | 161,281 | | | | — | | | | 161,281 | |
Futures Contracts (c) | | | 1,952,421 | | | | — | | | | — | | | | 1,952,421 | |
Interest Rate Swap Contracts (c) | | | — | | | | 25,480 | | | | — | | | | 25,480 | |
| | | | | | | | | | | | | | | | |
| Total Other Financial Instruments | | | 1,952,421 | | | | 186,761 | | | | — | | | | 2,139,182 | |
| | | | | | | | | | | | | | | | |
| Total Investments in Securities and Other Financial Instruments | | $ | 57,348,850 | | | $ | 929,905,036 | | | $ | 8,726 | | | $ | 987,262,612 | |
| | | | | | | | | | | | | | | | |
| | | | |
Liability Valuation Inputs | | | | | | | | | | | | | | | | |
| Long-Term Bonds Sold Short | | | | | | | | | | | | | | | | |
Corporate Bonds Sold Short | | $ | — | | | $ | (24,280,108 | ) | | $ | — | | | $ | (24,280,108 | ) |
| | | | | | | | | | | | | | | | |
| TotalLong-Term Bonds Sold Short | | | — | | | | (24,280,108 | ) | | | — | | | | (24,280,108 | ) |
| | | | | | | | | | | | | | | | |
| Other Financial Instruments | | | | | | | | | | | | | | | | |
Foreign Currency Forward Contracts (c) | | | — | | | | (464,368 | ) | | | — | | | | (464,368 | ) |
Futures Contracts (c) | | | (137,765 | ) | | | — | | | | — | | | | (137,765 | ) |
Interest Rate Swap Contracts (c) | | | — | | | | (3,414,997 | ) | | | — | | | | (3,414,997 | ) |
| | | | | | | | | | | | | | | | |
| Total Other Financial Instruments | | | (137,765 | ) | | | (3,879,365 | ) | | | — | | | | (4,017,130 | ) |
| | | | | | | | | | | | | | | | |
| Total Investments in Securities Sold Short and Other Financial Instruments | | $ | (137,765 | ) | | $ | (28,159,473 | ) | | $ | — | | | $ | (28,297,238 | ) |
| | | | | | | | | | | | | | | | |
| (a) | For a complete listing of investments and their industries, see the Portfolio of Investments. |
| (b) | The Level 3 security valued at $8,726 is held in Media within the Common Stocks section of the Portfolio of Investments. |
| (c) | The value listed for these securities reflects unrealized appreciation (depreciation) as shown on the Portfolio of Investments. |
| | | | | | |
The notes to the financial statements are an integral part of,
and should be read in conjunction with, the financial statements. | | | | | 21 | |
Portfolio of InvestmentsOctober 31, 2019 (continued)
The following is a reconciliation of investments in which significant unobservable inputs (Level 3) were used in determining value:
| | | | | | | | | | | | | | | | | | | | | | | | | | | | | | | | | | | | | | | | |
Investments in
Securities | | Balance
as of
October 31,
2018 | | | Accrued Discounts
(Premiums) | | | Realized
Gain
(Loss) | | | Change in
Unrealized
Appreciation
(Depreciation) | | | Purchases | | | Sales | | | Transfers
in to
Level 3 | | | Transfers
out of
Level 3 | | | Balance
as of October 31,
2019 | | | Change in
Unrealized
Appreciation
(Depreciation)
from
Investments
Still Held at
October 31,
2019 (a) | |
| Common Stocks | | $ | 13,625 | | | $ | — | | | $ | — | | | $ | (4,899 | ) | | $ | — | | | $ | — | | | $ | — | | | $ | — | | | $ | 8,726 | | | $ | (4,899 | ) |
| | | | | | | | | | | | | | | | | | | | | | | | | | | | | | | | | | | | | | | | |
| Total | | $ | 13,625 | | | $ | — | | | $ | — | | | $ | (4,899 | ) | | $ | — | | | $ | — | | | $ | — | | | $ | — | | | $ | 8,726 | | | $ | (4,899 | ) |
| | | | | | | | | | | | | | | | | | | | | | | | | | | | | | | | | | | | | | | | |
| (a) | Included in "Net change in unrealized appreciation (depreciation) on investments" in the Statement of Operations. |
| | | | |
| 22 | | MainStay MacKay Unconstrained Bond Fund | | The notes to the financial statements are an integral part of,
and should be read in conjunction with, the financial statements. |
Statement of Assets and Liabilitiesas of October 31, 2019
| | | | |
| Assets | | | | |
Investment in unaffiliated securities before investments sold short, at value (identified cost $909,699,043) including securities on loan of $3,463,764 | | $ | 933,301,652 | |
Investment in affiliated investment company, at value (identified cost $51,821,778) | | | 51,821,778 | |
Cash collateral on deposit at broker for futures contracts | | | 2,355,420 | |
Cash collateral on deposit at broker for swap contracts | | | 1,301,277 | |
Cash denominated in foreign currencies
(identified cost $852,120) | | | 883,807 | |
Cash | | | 28,732 | |
Receivables: | | | | |
Dividends and interest | | | 7,131,706 | |
Fund shares sold | | | 1,393,211 | |
Investment securities sold | | | 21,510 | |
Securities lending | | | 715 | |
Unrealized appreciation on foreign currency forward contracts | | | 161,281 | |
Other assets | | | 47,505 | |
| | | | |
Total assets | | | 998,448,594 | |
| | | | |
| |
| Liabilities | | | | |
Investments sold short (proceeds $23,339,794) | | | 24,280,108 | |
Cash collateral received for securities on loan | | | 3,432,629 | |
Payables: | | | | |
Investment securities purchased | | | 13,359,731 | |
Fund shares redeemed | | | 1,456,321 | |
Variation margin on futures contracts | | | 1,354,399 | |
Manager (See Note 3) | | | 481,876 | |
Interest on investments sold short | | | 443,792 | |
Transfer agent (See Note 3) | | | 307,462 | |
Variation margin on centrally cleared swap contracts | | | 284,052 | |
NYLIFE Distributors (See Note 3) | | | 133,558 | |
Broker fees and charges on short sales | | | 113,449 | |
Shareholder communication | | | 58,520 | |
Professional fees | | | 27,618 | |
Custodian | | | 20,201 | |
Trustees | | | 1,832 | |
Accrued expenses | | | 14,973 | |
Unrealized depreciation on foreign currency forward contracts | | | 464,368 | |
Dividend payable | | | 148,376 | |
| | | | |
Total liabilities | | | 46,383,265 | |
| | | | |
Net assets | | $ | 952,065,329 | |
| | | | |
| |
| Composition of Net Assets | | | | |
Shares of beneficial interest outstanding (par value of $.01 per share) unlimited number of shares authorized | | $ | 1,089,052 | |
Additional paid-in capital | | | 1,137,037,918 | |
| | | | |
| | | 1,138,126,970 | |
Total distributable earnings (loss) | | | (186,061,641 | ) |
| | | | |
Net assets | | $ | 952,065,329 | |
| | | | |
| | | | |
Class A | | | | |
Net assets applicable to outstanding shares | | $ | 197,686,369 | |
| | | | |
Shares of beneficial interest outstanding | | | 22,616,276 | |
| | | | |
Net asset value per share outstanding | | $ | 8.74 | |
Maximum sales charge (4.50% of offering price) | | | 0.41 | |
| | | | |
Maximum offering price per share outstanding | | $ | 9.15 | |
| | | | |
Investor Class | | | | |
Net assets applicable to outstanding shares | | $ | 19,747,635 | |
| | | | |
Shares of beneficial interest outstanding | | | 2,240,440 | |
| | | | |
Net asset value per share outstanding | | $ | 8.81 | |
Maximum sales charge (4.50% of offering price) | | | 0.42 | |
| | | | |
Maximum offering price per share outstanding | | $ | 9.23 | |
| | | | |
Class B | | | | |
Net assets applicable to outstanding shares | | $ | 7,970,335 | |
| | | | |
Shares of beneficial interest outstanding | | | 916,581 | |
| | | | |
Net asset value and offering price per share outstanding | | $ | 8.70 | |
| | | | |
Class C | | | | |
Net assets applicable to outstanding shares | | $ | 91,598,309 | |
| | | | |
Shares of beneficial interest outstanding | | | 10,542,156 | |
| | | | |
Net asset value and offering price per share outstanding | | $ | 8.69 | |
| | | | |
Class I | | | | |
Net assets applicable to outstanding shares | | $ | 604,980,806 | |
| | | | |
Shares of beneficial interest outstanding | | | 69,149,825 | |
| | | | |
Net asset value and offering price per share outstanding | | $ | 8.75 | |
| | | | |
Class R2 | | | | |
Net assets applicable to outstanding shares | | $ | 7,232,170 | |
| | | | |
Shares of beneficial interest outstanding | | | 827,839 | |
| | | | |
Net asset value and offering price per share outstanding | | $ | 8.74 | |
| | | | |
Class R3 | | | | |
Net assets applicable to outstanding shares | | $ | 217,699 | |
| | | | |
Shares of beneficial interest outstanding | | | 24,902 | |
| | | | |
Net asset value and offering price per share outstanding | | $ | 8.74 | |
| | | | |
Class R6 | | | | |
Net assets applicable to outstanding shares | | $ | 22,632,006 | |
| | | | |
Shares of beneficial interest outstanding | | | 2,587,190 | |
| | | | |
Net asset value and offering price per share outstanding | | $ | 8.75 | |
| | | | |
| | | | | | |
The notes to the financial statements are an integral part of,
and should be read in conjunction with, the financial statements. | | | | | 23 | |
Statement of Operationsfor the year ended October 31, 2019
| | | | |
| Investment Income (Loss) | | | | |
Income | | | | |
Interest | | $ | 40,297,647 | |
Dividends-affiliated | | | 829,354 | |
Securities lending | | | 12,442 | |
Dividends-unaffiliated | | | 10,748 | |
Other | | | 9,321 | |
| | | | |
Total income | | | 41,159,512 | |
| | | | |
Expenses | | | | |
Manager (See Note 3) | | | 6,115,196 | |
Transfer agent (See Note 3) | | | 1,875,663 | |
Distribution/Service—Class A (See Note 3) | | | 515,084 | |
Distribution/Service—Investor Class (See Note 3) | | | 50,187 | |
Distribution/Service—Class B (See Note 3) | | | 91,901 | |
Distribution/Service—Class C (See Note 3) | | | 1,089,724 | |
Distribution/Service—Class R2 (See Note 3) | | | 17,137 | |
Distribution/Service—Class R3 (See Note 3) | | | 992 | |
Interest on investments sold short | | | 1,335,281 | |
Broker fees and charges on short sales | | | 726,550 | |
Registration | | | 165,399 | |
Professional fees | | | 132,218 | |
Shareholder communication | | | 116,353 | |
Custodian | | | 58,741 | |
Interest expense | | | 33,492 | |
Trustees | | | 26,127 | |
Shareholder service (See Note 3) | | | 7,052 | |
Miscellaneous | | | 48,148 | |
| | | | |
Total expenses | | | 12,405,245 | |
| | | | |
Net investment income (loss) | | | 28,754,267 | |
| | | | |
| | | | |
| Realized and Unrealized Gain (Loss) on Investments, Futures Contracts, Swap Contracts and Foreign Currency Transactions | |
Net realized gain (loss) on: | | | | |
Unaffiliated investment transactions | | $ | (5,266,285 | ) |
Investments sold short | | | (1,733,344 | ) |
Futures transactions | | | (25,109,995 | ) |
Swap transactions | | | 2,766,397 | |
Foreign currency forward transactions | | | 1,388,457 | |
Foreign currency transactions | | | (232,115 | ) |
| | | | |
Net realized gain (loss) on investments, investments sold short, futures transactions, swap transactions and foreign currency transactions | | | (28,186,885 | ) |
| | | | |
Net change in unrealized appreciation (depreciation) on: | | | | |
Unaffiliated investments | | | 48,954,854 | |
Investments sold short | | | (742,079 | ) |
Futures contracts | | | 1,350,658 | |
Swap contracts | | | (8,476,581 | ) |
Foreign currency forward contracts | | | (1,154,798 | ) |
Translation of other assets and liabilities in foreign currencies | | | 49,154 | |
| | | | |
Net change in unrealized appreciation (depreciation) on investments, investments sold short, futures contracts, swap contracts and foreign currencies | | | 39,981,208 | |
| | | | |
Net realized and unrealized gain (loss) on investments, investments sold short, futures transactions, swap transactions and foreign currency transactions | | | 11,794,323 | |
| | | | |
Net increase (decrease) in net assets resulting from operations | | $ | 40,548,590 | |
| | | | |
| | | | |
| 24 | | MainStay MacKay Unconstrained Bond Fund | | The notes to the financial statements are an integral part of,
and should be read in conjunction with, the financial statements. |
Statements of Changes in Net Assets
for the years ended October 31, 2019 and October 31, 2018
| | | | | | | | |
| | | 2019 | | | 2018 | |
| Increase (Decrease) in Net Assets | |
Operations: | | | | | | | | |
Net investment income (loss) | | $ | 28,754,267 | | | $ | 34,902,238 | |
Net realized gain (loss) on investments, investments sold short, futures transactions, swap contracts and foreign currency transactions | | | (28,186,885 | ) | | | 12,030,856 | |
Net change in unrealized appreciation (depreciation) on investments, investments sold short, futures contracts, swap contracts and foreign currencies | | | 39,981,208 | | | | (42,770,282 | ) |
| | | | |
Net increase (decrease) in net assets resulting from operations | | | 40,548,590 | | | | 4,162,812 | |
| | | | |
Distributions to shareholders: | | | | | | | | |
Class A | | | (5,918,444 | ) | | | (7,841,617 | ) |
Investor Class | | | (567,935 | ) | | | (629,840 | ) |
Class B | | | (194,065 | ) | | | (297,747 | ) |
Class C | | | (2,298,974 | ) | | | (3,365,854 | ) |
Class I | | | (20,315,490 | ) | | | (25,600,022 | ) |
Class R2 | | | (190,167 | ) | | | (77,254 | ) |
Class R3 | | | (4,980 | ) | | | (3,444 | ) |
Class R6 | | | (1,364,064 | ) | | | (1,320,203 | ) |
| | | | |
| | | (30,854,119 | ) | | | (39,135,981 | ) |
| | | | |
Distributions to shareholders from return of capital: | | | | | | | | |
Class A | | | — | | | | (119,065 | ) |
Investor Class | | | — | | | | (9,563 | ) |
Class B | | | — | | | | (4,521 | ) |
Class C | | | — | | | | (51,106 | ) |
Class I | | | — | | | | (388,702 | ) |
Class R2 | | | — | | | | (1,173 | ) |
Class R3 | | | — | | | | (52 | ) |
Class R6 | | | — | | | | (20,046 | ) |
| | | | |
| | | — | | | | (594,228 | ) |
| | | | |
Total distributions to shareholders | | | (30,854,119 | ) | | | (39,730,209 | ) |
| | | | |
Capital share transactions: | | | | | | | | |
Net proceeds from sale of shares | | | 243,248,062 | | | | 317,200,945 | |
Net asset value of shares issued to shareholders in reinvestment of distributions | | | 28,366,577 | | | | 36,078,388 | |
Cost of shares redeemed | | | (486,086,847 | ) | | | (506,161,638 | ) |
| | | | |
Increase (decrease) in net assets derived from capital share transactions | | | (214,472,208 | ) | | | (152,882,305 | ) |
| | | | |
Net increase (decrease) in net assets | | | (204,777,737 | ) | | | (188,449,702 | ) |
| | |
| Net Assets | | | | | | | | |
Beginning of year | | | 1,156,843,066 | | | | 1,345,292,768 | |
| | | | |
End of year | | $ | 952,065,329 | | | $ | 1,156,843,066 | |
| | | | |
| | | | | | |
The notes to the financial statements are an integral part of,
and should be read in conjunction with, the financial statements. | | | | | 25 | |
Financial Highlightsselected per share data and ratios
| | | | | | | | | | | | | | | | | | | | |
| |
| | | Year ended October 31, | |
| | | | | |
| Class A | | 2019 | | | 2018 | | | 2017 | | | 2016 | | | 2015 | |
| | | | | |
Net asset value at beginning of year | | $ | 8.65 | | | $ | 8.90 | | | $ | 8.81 | | | $ | 8.72 | | | $ | 9.27 | |
| | | | | | | | | | | | | | | | | | | | |
| | | | | |
Net investment income (loss) (a) | | | 0.23 | | | | 0.24 | | | | 0.25 | | | | 0.35 | | | | 0.36 | |
| | | | | |
Net realized and unrealized gain (loss) on investments | | | 0.11 | | | | (0.23 | ) | | | 0.15 | | | | 0.08 | | | | (0.63 | ) |
| | | | | |
Net realized and unrealized gain (loss) on foreign currency transactions | | | 0.00 | ‡ | | | 0.01 | | | | (0.00 | )‡ | | | (0.02 | ) | | | 0.02 | |
| | | | | | | | | | | | | | | | | | | | |
| | | | | |
Total from investment operations | | | 0.34 | | | | 0.02 | | | | 0.40 | | | | 0.41 | | | | (0.25 | ) |
| | | | | | | | | | | | | | | | | | | | |
| | | | | |
| Less dividends and distributions: | | | | | | | | | | | | | | | | | | | | |
| | | | | |
From net investment income | | | (0.25 | ) | | | (0.27 | ) | | | (0.31 | ) | | | (0.32 | ) | | | (0.30 | ) |
| | | | | |
Return of capital | | | — | | | | (0.00 | )‡ | | | (0.00 | )‡ | | | — | | | | — | |
| | | | | | | | | | | | | | | | | | | | |
| | | | | |
Total dividends and distributions | | | (0.25 | ) | | | (0.27 | ) | | | (0.31 | ) | | | (0.32 | ) | | | (0.30 | ) |
| | | | | | | | | | | | | | | | | | | | |
| | | | | |
Net asset value at end of year | | $ | 8.74 | | | $ | 8.65 | | | $ | 8.90 | | | $ | 8.81 | | | $ | 8.72 | |
| | | | | | | | | | | | | | | | | | | | |
| | | | | |
Total investment return (b) | | | 3.99 | % | | | 0.25 | % | | | 4.65 | % | | | 4.94 | % | | | (2.70 | %) |
| | | | | |
| Ratios (to average net assets)/Supplemental Data: | | | | | | | | | | | | | | | | | | | | |
| | | | | |
Net investment income (loss) | | | 2.66 | % | | | 2.69 | % | | | 2.79 | % | | | 4.04 | % | | | 4.01 | % |
| | | | | |
Net expenses (c)(d) | | | 1.27 | % | | | 1.25 | % | | | 1.13 | % | | | 1.16 | % | | | 1.01 | % |
| | | | | |
Portfolio turnover rate | | | 50 | %(e) | | | 22 | % | | | 41 | % | | | 15 | % | | | 22 | % |
| | | | | |
Net assets at end of year (in 000’s) | | $ | 197,686 | | | $ | 220,618 | | | $ | 302,192 | | | $ | 412,834 | | | $ | 584,184 | |
| ‡ | Less than one cent per share. |
| (a) | Per share data based on average shares outstanding during the year. |
| (b) | Total investment return is calculated exclusive of sales charges and assumes the reinvestment of dividends and distributions. For periods of less than one year, total return is not annualized. |
| (c) | In addition to the fees and expenses which the Fund bears directly, it also indirectly bears a pro-rata share of the fees and expenses of the underlying funds in which it invests. Such indirect expenses are not included in the above expense ratios. |
| (d) | The expense ratios presented below exclude short sales expense: |
| | | | | | | | | | |
Year Ended | | Net Expenses
(excluding short
sale expenses) | | Short Sale
Expenses |
| October 31, 2019 | | | | 1.07 | % | | | | 0.20 | % |
| October 31, 2018 | | | | 1.03 | % | | | | 0.22 | % |
| October 31, 2017 | | | | 1.01 | % | | | | 0.12 | % |
| October 31, 2016 | | | | 1.00 | % | | | | 0.16 | % |
| October 31, 2015 | | | | 0.96 | % | | | | 0.05 | % |
| (e) | The portfolio turnover rate not including mortgage dollar rolls was 44% for the year ended October 31, 2019. |
| | | | |
| 26 | | MainStay MacKay Unconstrained Bond Fund | | The notes to the financial statements are an integral part of,
and should be read in conjunction with, the financial statements. |
Financial Highlightsselected per share data and ratios
| | | | | | | | | | | | | | | | | | | | |
| |
| | | Year ended October 31, | |
| | | | | |
| Investor Class | | 2019 | | | 2018 | | | 2017 | | | 2016 | | | 2015 | |
| | | | | |
Net asset value at beginning of year | | $ | 8.72 | | | $ | 8.97 | | | $ | 8.88 | | | $ | 8.78 | | | $ | 9.33 | |
| | | | | | | | | | | | | | | | | | | | |
| | | | | |
Net investment income (loss) (a) | | | 0.23 | | | | 0.24 | | | | 0.24 | | | | 0.35 | | | | 0.36 | |
| | | | | |
Net realized and unrealized gain (loss) on investments | | | 0.11 | | | | (0.23 | ) | | | 0.16 | | | | 0.10 | | | | (0.63 | ) |
| | | | | |
Net realized and unrealized gain (loss) on foreign currency transactions | | | 0.00 | ‡ | | | 0.01 | | | | (0.00 | )‡ | | | (0.03 | ) | | | 0.02 | |
| | | | | | | | | | | | | | | | | | | | |
| | | | | |
Total from investment operations | | | 0.34 | | | | 0.02 | | | | 0.40 | | | | 0.42 | | | | (0.25 | ) |
| | | | | | | | | | | | | | | | | | | | |
| | | | | |
| Less dividends and distributions: | | | | | | | | | | | | | | | | | | | | |
| | | | | |
From net investment income | | | (0.25 | ) | | | (0.27 | ) | | | (0.31 | ) | | | (0.32 | ) | | | (0.30 | ) |
| | | | | |
Return of capital | | | — | | | | (0.00 | )‡ | | | (0.00 | )‡ | | | — | | | | — | |
| | | | | | | | | | | | | | | | | | | | |
| | | | | |
Total dividends and distributions | | | (0.25 | ) | | | (0.27 | ) | | | (0.31 | ) | | | (0.32 | ) | | | (0.30 | ) |
| | | | | | | | | | | | | | | | | | | | |
| | | | | |
Net asset value at end of year | | $ | 8.81 | | | $ | 8.72 | | | $ | 8.97 | | | $ | 8.88 | | | $ | 8.78 | |
| | | | | | | | | | | | | | | | | | | | |
| | | | | |
Total investment return (b) | | | 3.93 | % | | | 0.23 | % | | | 4.59 | % | | | 5.00 | % | | | (2.70 | %) |
| | | | | |
| Ratios (to average net assets)/Supplemental Data: | | | | | | | | | | | | | | | | | | | | |
| | | | | |
Net investment income (loss) | | | 2.63 | % | | | 2.68 | % | | | 2.74 | % | | | 4.01 | % | | | 3.99 | % |
| | | | | |
Net expenses (c)(d) | | | 1.29 | % | | | 1.27 | % | | | 1.15 | % | | | 1.18 | % | | | 1.03 | % |
| | | | | |
Portfolio turnover rate | | | 50 | %(e) | | | 22 | % | | | 41 | % | | | 15 | % | | | 22 | % |
| | | | | |
Net assets at end of year (in 000’s) | | $ | 19,748 | | | $ | 20,451 | | | $ | 22,033 | | | $ | 31,851 | | | $ | 32,498 | |
| ‡ | Less than one cent per share. |
| (a) | Per share data based on average shares outstanding during the year. |
| (b) | Total investment return is calculated exclusive of sales charges and assumes the reinvestment of dividends and distributions. For periods of less than one year, total return is not annualized. |
| (c) | In addition to the fees and expenses which the Fund bears directly, it also indirectly bears a pro-rata share of the fees and expenses of the underlying funds in which it invests. Such indirect expenses are not included in the above expense ratios. |
| (d) | The expense ratios presented below exclude short sales expense: |
| | | | | | | | | | |
Year Ended | | Net Expenses
(excluding short
sale expenses) | | Short Sale
Expenses |
| October 31, 2019 | | | | 1.09 | % | | | | 0.20 | % |
| October 31, 2018 | | | | 1.05 | % | | | | 0.22 | % |
| October 31, 2017 | | | | 1.03 | % | | | | 0.12 | % |
| October 31, 2016 | | | | 1.02 | % | | | | 0.16 | % |
| October 31, 2015 | | | | 0.98 | % | | | | 0.05 | % |
| (e) | The portfolio turnover rate not including mortgage dollar rolls was 44% for the year ended October 31, 2019. |
| | | | | | |
The notes to the financial statements are an integral part of,
and should be read in conjunction with, the financial statements. | | | | | 27 | |
Financial Highlightsselected per share data and ratios
| | | | | | | | | | | | | | | | | | | | |
| |
| | | Year ended October 31, | |
| | | | | |
| Class B | | 2019 | | | 2018 | | | 2017 | | | 2016 | | | 2015 | |
| | | | | |
Net asset value at beginning of year | | $ | 8.61 | | | $ | 8.86 | | | $ | 8.77 | | | $ | 8.68 | | | $ | 9.23 | |
| | | | | | | | | | | | | | | | | | | | |
| | | | | |
Net investment income (loss) (a) | | | 0.16 | | | | 0.17 | | | | 0.18 | | | | 0.28 | | | | 0.29 | |
| | | | | |
Net realized and unrealized gain (loss) on investments | | | 0.11 | | | | (0.23 | ) | | | 0.15 | | | | 0.10 | | | | (0.62 | ) |
| | | | | |
Net realized and unrealized gain (loss) on foreign currency transactions | | | 0.00 | ‡ | | | 0.01 | | | | (0.00 | )‡ | | | (0.03 | ) | | | 0.02 | |
| | | | | | | | | | | | | | | | | | | | |
| | | | | |
Total from investment operations | | | 0.27 | | | | (0.05 | ) | | | 0.33 | | | | 0.35 | | | | (0.31 | ) |
| | | | | | | | | | | | | | | | | | | | |
| | | | | |
| Less dividends and distributions: | | | | | | | | | | | | | | | | | | | | |
| | | | | |
From net investment income | | | (0.18 | ) | | | (0.20 | ) | | | (0.24 | ) | | | (0.26 | ) | | | (0.24 | ) |
| | | | | |
Return of capital | | | — | | | | (0.00 | )‡ | | | (0.00 | )‡ | | | — | | | | — | |
| | | | | | | | | | | | | | | | | | | | |
| | | | | |
Total dividends and distributions | | | (0.18 | ) | | | (0.20 | ) | | | (0.24 | ) | | | (0.26 | ) | | | (0.24 | ) |
| | | | | | | | | | | | | | | | | | | | |
| | | | | |
Net asset value at end of year | | $ | 8.70 | | | $ | 8.61 | | | $ | 8.86 | | | $ | 8.77 | | | $ | 8.68 | |
| | | | | | | | | | | | | | | | | | | | |
| | | | | |
Total investment return (b) | | | 3.20 | % | | | (0.52 | %) | | | 3.86 | % | | | 4.16 | % | | | (3.45 | %) |
| | | | | |
| Ratios (to average net assets)/Supplemental Data: | | | | | | | | | | | | | | | | | | | | |
| | | | | |
Net investment income (loss) | | | 1.90 | % | | | 1.92 | % | | | 2.00 | % | | | 3.26 | % | | | 3.24 | % |
| | | | | |
Net expenses (c)(d) | | | 2.04 | % | | | 2.02 | % | | | 1.90 | % | | | 1.93 | % | | | 1.78 | % |
| | | | | |
Portfolio turnover rate | | | 50 | %(e) | | | 22 | % | | | 41 | % | | | 15 | % | | | 22 | % |
| | | | | |
Net assets at end of year (in 000’s) | | $ | 7,970 | | | $ | 11,015 | | | $ | 15,223 | | | $ | 18,313 | | | $ | 19,833 | |
| ‡ | Less than one cent per share. |
| (a) | Per share data based on average shares outstanding during the year. |
| (b) | Total investment return is calculated exclusive of sales charges and assumes the reinvestment of dividends and distributions. For periods of less than one year, total return is not annualized. |
| (c) | In addition to the fees and expenses which the Fund bears directly, it also indirectly bears a pro-rata share of the fees and expenses of the underlying funds in which it invests. Such indirect expenses are not included in the above expense ratios. |
| (d) | The expense ratios presented below exclude short sales expense: |
| | | | | | | | | | |
Year Ended | | Net Expenses
(excluding short
sale expenses) | | Short Sale
Expenses |
| October 31, 2019 | | | | 1.84 | % | | | | 0.20 | % |
| October 31, 2018 | | | | 1.80 | % | | | | 0.22 | % |
| October 31, 2017 | | | | 1.78 | % | | | | 0.12 | % |
| October 31, 2016 | | | | 1.77 | % | | | | 0.16 | % |
| October 31, 2015 | | | | 1.73 | % | | | | 0.05 | % |
| (e) | The portfolio turnover rate not including mortgage dollar rolls was 44% for the year ended October 31, 2019. |
| | | | |
| 28 | | MainStay MacKay Unconstrained Bond Fund | | The notes to the financial statements are an integral part of,
and should be read in conjunction with, the financial statements. |
Financial Highlightsselected per share data and ratios
| | | | | | | | | | | | | | | | | | | | |
| |
| | | Year ended October 31, | |
| | | | | |
| Class C | | 2019 | | | 2018 | | | 2017 | | | 2016 | | | 2015 | |
| | | | | |
Net asset value at beginning of year | | $ | 8.60 | | | $ | 8.85 | | | $ | 8.76 | | | $ | 8.67 | | | $ | 9.22 | |
| | | | | | | | | | | | | | | | | | | | |
| | | | | |
Net investment income (loss) (a) | | | 0.16 | | | | 0.17 | | | | 0.18 | | | | 0.28 | | | | 0.29 | |
| | | | | |
Net realized and unrealized gain (loss) on investments | | | 0.11 | | | | (0.23 | ) | | | 0.15 | | | | 0.10 | | | | (0.62 | ) |
| | | | | |
Net realized and unrealized gain (loss) on foreign currency transactions | | | 0.00 | ‡ | | | 0.01 | | | | (0.00 | )‡ | | | (0.03 | ) | | | 0.02 | |
| | | | | | | | | | | | | | | | | | | | |
| | | | | |
Total from investment operations | | | 0.27 | | | | (0.05 | ) | | | 0.33 | | | | 0.35 | | | | (0.31 | ) |
| | | | | | | | | | | | | | | | | | | | |
| | | | | |
| Less dividends and distributions: | | | | | | | | | | | | | | | | | | | | |
| | | | | |
From net investment income | | | (0.18 | ) | | | (0.20 | ) | | | (0.24 | ) | | | (0.26 | ) | | | (0.24 | ) |
| | | | | |
Return of capital | | | — | | | | (0.00 | )‡ | | | (0.00 | )‡ | | | — | | | | — | |
| | | | | | | | | | | | | | | | | | | | |
| | | | | |
Total dividends and distributions | | | (0.18 | ) | | | (0.20 | ) | | | (0.24 | ) | | | (0.26 | ) | | | (0.24 | ) |
| | | | | | | | | | | | | | | | | | | | |
| | | | | |
Net asset value at end of year | | $ | 8.69 | | | $ | 8.60 | | | $ | 8.85 | | | $ | 8.76 | | | $ | 8.67 | |
| | | | | | | | | | | | | | | | | | | | |
| | | | | |
Total investment return (b) | | | 3.21 | % | | | (0.52 | %) | | | 3.86 | % | | | 4.16 | % | | | (3.46 | %) |
| | | | | |
| Ratios (to average net assets)/Supplemental Data: | | | | | | | | | | | | | | | | | | | | |
| | | | | |
Net investment income (loss) | | | 1.90 | % | | | 1.92 | % | | | 2.00 | % | | | 3.27 | % | | | 3.24 | % |
| | | | | |
Net expenses (c)(d) | | | 2.04 | % | | | 2.02 | % | | | 1.90 | % | | | 1.93 | % | | | 1.78 | % |
| | | | | |
Portfolio turnover rate | | | 50 | %(e) | | | 22 | % | | | 41 | % | | | 15 | % | | | 22 | % |
| | | | | |
Net assets at end of year (in 000’s) | | $ | 91,598 | | | $ | 128,279 | | | $ | 167,595 | | | $ | 220,513 | | | $ | 315,183 | |
| ‡ | Less than one cent per share. |
| (a) | Per share data based on average shares outstanding during the year. |
| (b) | Total investment return is calculated exclusive of sales charges and assumes the reinvestment of dividends and distributions. For periods of less than one year, total return is not annualized. |
| (c) | In addition to the fees and expenses which the Fund bears directly, it also indirectly bears a pro-rata share of the fees and expenses of the underlying funds in which it invests. Such indirect expenses are not included in the above expense ratios. |
| (d) | The expense ratios presented below exclude short sales expense: |
| | | | | | | | | | |
Year Ended | | Net Expenses
(excluding short
sale expenses) | | Short Sale
Expenses |
| October 31, 2019 | | | | 1.84 | % | | | | 0.20 | % |
| October 31, 2018 | | | | 1.80 | % | | | | 0.22 | % |
| October 31, 2017 | | | | 1.78 | % | | | | 0.12 | % |
| October 31, 2016 | | | | 1.77 | % | | | | 0.16 | % |
| October 31, 2015 | | | | 1.73 | % | | | | 0.05 | % |
| (e) | The portfolio turnover rate not including mortgage dollar rolls was 44% for the year ended October 31, 2019. |
| | | | | | |
The notes to the financial statements are an integral part of,
and should be read in conjunction with, the financial statements. | | | | | 29 | |
Financial Highlightsselected per share data and ratios
| | | | | | | | | | | | | | | | | | | | |
| |
| | | Year ended October 31, | |
| | | | | |
| Class I | | 2019 | | | 2018 | | | 2017 | | | 2016 | | | 2015 | |
| | | | | |
Net asset value at beginning of year | | $ | 8.66 | | | $ | 8.91 | | | $ | 8.82 | | | $ | 8.72 | | | $ | 9.28 | |
| | | | | | | | | | | | | | | | | | | | |
| | | | | |
Net investment income (loss) (a) | | | 0.25 | | | | 0.26 | | | | 0.26 | | | | 0.37 | | | | 0.38 | |
| | | | | |
Net realized and unrealized gain (loss) on investments | | | 0.11 | | | | (0.23 | ) | | | 0.16 | | | | 0.11 | | | | (0.63 | ) |
| | | | | |
Net realized and unrealized gain (loss) on foreign currency transactions | | | 0.00 | ‡ | | | 0.01 | | | | (0.00 | )‡ | | | (0.03 | ) | | | 0.02 | |
| | | | | | | | | | | | | | | | | | | | |
| | | | | |
Total from investment operations | | | 0.36 | | | | 0.04 | | | | 0.42 | | | | 0.45 | | | | (0.23 | ) |
| | | | | | | | | | | | | | | | | | | | |
| | | | | |
| Less dividends and distributions: | | | | | | | | | | | | | | | | | | | | |
| | | | | |
From net investment income | | | (0.27 | ) | | | (0.29 | ) | | | (0.33 | ) | | | (0.35 | ) | | | (0.33 | ) |
| | | | | |
Return of capital | | | — | | | | (0.00 | )‡ | | | (0.00 | )‡ | | | — | | | | — | |
| | | | | | | | | | | | | | | | | | | | |
| | | | | |
Total dividends and distributions | | | (0.27 | ) | | | (0.29 | ) | | | (0.33 | ) | | | (0.35 | ) | | | (0.33 | ) |
| | | | | | | | | | | | | | | | | | | | |
| | | | | |
Net asset value at end of year | | $ | 8.75 | | | $ | 8.66 | | | $ | 8.91 | | | $ | 8.82 | | | $ | 8.72 | |
| | | | | | | | | | | | | | | | | | | | |
| | | | | |
Total investment return (b) | | | 4.24 | % | | | 0.51 | % | | | 4.90 | % | | | 5.32 | % | | | (2.56 | %) |
| | | | | |
| Ratios (to average net assets)/Supplemental Data: | | | | | | | | | | | | | | | | | | | | |
| | | | | |
Net investment income (loss) | | | 2.91 | % | | | 2.94 | % | | | 2.99 | % | | | 4.30 | % | | | 4.25 | % |
| | | | | |
Net expenses (c)(d) | | | 1.02 | % | | | 1.00 | % | | | 0.88 | % | | | 0.91 | % | | | 0.76 | % |
| | | | | |
Portfolio turnover rate | | | 50 | %(e) | | | 22 | % | | | 41 | % | | | 15 | % | | | 22 | % |
| | | | | |
Net assets at end of year (in 000’s) | | $ | 604,981 | | | $ | 717,129 | | | $ | 837,363 | | �� | $ | 735,359 | | | $ | 1,263,695 | |
| ‡ | Less than one cent per share. |
| (a) | Per share data based on average shares outstanding during the year. |
| (b) | Total investment return is calculated exclusive of sales charges and assumes the reinvestment of dividends and distributions. Class I shares are not subject to sales charges. For periods of less than one year, total return is not annualized. |
| (c) | In addition to the fees and expenses which the Fund bears directly, it also indirectly bears a pro-rata share of the fees and expenses of the underlying funds in which it invests. Such indirect expenses are not included in the above expense ratios. |
| (d) | The expense ratios presented below exclude short sales expense: |
| | | | | | | | | | |
Year Ended | | Net Expenses
(excluding short
sale expenses) | | Short Sale
Expenses |
| October 31, 2019 | | | | 0.82 | % | | | | 0.20 | % |
| October 31, 2018 | | | | 0.78 | % | | | | 0.22 | % |
| October 31, 2017 | | | | 0.76 | % | | | | 0.12 | % |
| October 31, 2016 | | | | 0.75 | % | | | | 0.16 | % |
| October 31, 2015 | | | | 0.71 | % | | | | 0.05 | % |
| (e) | The portfolio turnover rate not including mortgage dollar rolls was 44% for the year ended October 31, 2019. |
| | | | |
| 30 | | MainStay MacKay Unconstrained Bond Fund | | The notes to the financial statements are an integral part of,
and should be read in conjunction with, the financial statements. |
Financial Highlightsselected per share data and ratios
| | | | | | | | | | | | | | | | | | | | |
| |
| | | Year ended October 31, | |
| | | | | |
| Class R2 | | 2019 | | | 2018 | | | 2017 | | | 2016 | | | 2015 | |
| | | | | |
Net asset value at beginning of year | | $ | 8.65 | | | $ | 8.90 | | | $ | 8.81 | | | $ | 8.72 | | | $ | 9.27 | |
| | | | | | | | | | | | | | | | | | | | |
| | | | | |
Net investment income (loss) (a) | | | 0.22 | | | | 0.23 | | | | 0.23 | | | | 0.34 | | | | 0.35 | |
| | | | | |
Net realized and unrealized gain (loss) on investments | | | 0.11 | | | | (0.23 | ) | | | 0.16 | | | | 0.10 | | | | (0.63 | ) |
| | | | | |
Net realized and unrealized gain (loss) on foreign currency transactions | | | 0.00 | ‡ | | | 0.01 | | | | (0.00 | )‡ | | | (0.03 | ) | | | 0.02 | |
| | | | | | | | | | | | | | | | | | | | |
| | | | | |
Total from investment operations | | | 0.33 | | | | 0.01 | | | | 0.39 | | | | 0.41 | | | | (0.26 | ) |
| | | | | | | | | | | | | | | | | | | | |
| | | | | |
| Less dividends and distributions: | | | | | | | | | | | | | | | | | | | | |
| | | | | |
From net investment income | | | (0.24 | ) | | | (0.26 | ) | | | (0.30 | ) | | | (0.32 | ) | | | (0.29 | ) |
| | | | | |
Return of capital | | | — | | | | (0.00 | )‡ | | | (0.00 | )‡ | | | — | | | | — | |
| | | | | | | | | | | | | | | | | | | | |
| | | | | |
Total dividends and distributions | | | (0.24 | ) | | | (0.26 | ) | | | (0.30 | ) | | | (0.32 | ) | | | (0.29 | ) |
| | | | | | | | | | | | | | | | | | | | |
| | | | | |
Net asset value at end of year | | $ | 8.74 | | | $ | 8.65 | | | $ | 8.90 | | | $ | 8.81 | | | $ | 8.72 | |
| | | | | | | | | | | | | | | | | | | | |
| | | | | |
Total investment return (b) | | | 3.89 | % | | | 0.16 | % | | | 4.54 | % | | | 4.84 | % | | | (2.81 | %) |
| | | | | |
| Ratios (to average net assets)/Supplemental Data: | | | | | | | | | | | | | | | | | | | | |
| | | | | |
Net investment income (loss) | | | 2.54 | % | | | 2.67 | % | | | 2.63 | % | | | 3.97 | % | | | 3.87 | % |
| | | | | |
Net expenses (c)(d) | | | 1.37 | % | | | 1.34 | % | | | 1.23 | % | | | 1.28 | % | | | 1.11 | % |
| | | | | |
Portfolio turnover rate | | | 50 | %(e) | | | 22 | % | | | 41 | % | | | 15 | % | | | 22 | % |
| | | | | |
Net assets at end of year (in 000’s) | | $ | 7,232 | | | $ | 6,657 | | | $ | 773 | | | $ | 662 | | | $ | 112 | |
| ‡ | Less than one cent per share. |
| (a) | Per share data based on average shares outstanding during the period. |
| (b) | Total investment return is calculated exclusive of sales charges and assumes the reinvestment of dividends and distributions. Class R2 shares are not subject to sales charges. For periods of less than one year, total return is not annualized. |
| (c) | In addition to the fees and expenses which the Fund bears directly, it also indirectly bears a pro-rata share of the fees and expenses of the underlying funds in which it invests. Such indirect expenses are not included in the above expense ratios. |
| (d) | The expense ratios presented below exclude short sales expense: |
| | | | | | | | | | |
Year Ended | | Net Expenses
(excluding short
sale expenses) | | Short Sale
Expenses |
| October 31, 2019 | | | | 1.17 | % | | | | 0.20 | % |
| October 31, 2018 | | | | 1.14 | % | | | | 0.20 | % |
| October 31, 2017 | | | | 1.11 | % | | | | 0.12 | % |
| October 31, 2016 | | | | 1.12 | % | | | | 0.16 | % |
| October 31, 2015 | | | | 1.06 | % | | | | 0.05 | % |
| (e) | The portfolio turnover rate not including mortgage dollar rolls was 44% for the year ended October 31, 2019. |
| | | | | | |
The notes to the financial statements are an integral part of,
and should be read in conjunction with, the financial statements. | | | | | 31 | |
Financial Highlightsselected per share data and ratios
| | | | | | | | | | | | | | | | |
| | |
| | | Year ended October 31, | | | February 29,
2016^ through
October 31,
2016 | |
| Class R3 | | 2019 | | | 2018 | | | 2017 | |
| | | | |
Net asset value at beginning of period | | $ | 8.65 | | | $ | 8.90 | | | $ | 8.81 | | | $ | 8.20 | |
| | | | | | | | | | | | | | | | |
| | | | |
Net investment income (loss) (a) | | | 0.20 | | | | 0.21 | | | | 0.21 | | | | 0.21 | |
| | | | |
Net realized and unrealized gain (loss) on investments | | | 0.11 | | | | (0.23 | ) | | | 0.16 | | | | 0.86 | |
| | | | |
Net realized and unrealized gain (loss) on foreign currency transactions | | | 0.00 | ‡ | | | 0.01 | | | | (0.00 | )‡ | | | (0.27 | ) |
| | | | | | | | | | | | | | | | |
| | | | |
Total from investment operations | | | 0.31 | | | | (0.01 | ) | | | 0.37 | | | | 0.80 | |
| | | | | | | | | | | | | | | | |
| | | | |
| Less dividends and distributions: | | | | | | | | | | | | | | | | |
| | | | |
From net investment income | | | (0.22 | ) | | | (0.24 | ) | | | (0.28 | ) | | | (0.19 | ) |
| | | | |
Return of capital | | | — | | | | (0.00 | )‡ | | | (0.00 | )‡ | | | — | |
| | | | | | | | | | | | | | | | |
| | | | |
Total dividends and distributions | | | (0.22 | ) | | | (0.24 | ) | | | (0.28 | ) | | | (0.19 | ) |
| | | | | | | | | | | | | | | | |
| | | | |
Net asset value at end of period | | $ | 8.74 | | | $ | 8.65 | | | $ | 8.90 | | | $ | 8.81 | |
| | | | | | | | | | | | | | | | |
| | | | |
Total investment return (b) | | | 3.63 | % | | | (0.09 | %) | | | 4.28 | % | | | 9.77 | % |
| | | | |
| Ratios (to average net assets)/Supplemental Data: | | | | | | | | | | | | | | | | |
| | | | |
Net investment income (loss) | | | 2.29 | % | | | 2.36 | % | | | 2.34 | % | | | 3.32 | %†† |
| | | | |
Net expenses (c)(d) | | | 1.62 | % | | | 1.60 | % | | | 1.48 | % | | | 1.50 | %†† |
| | | | |
Portfolio turnover rate | | | 50 | %(e) | | | 22 | % | | | 41 | % | | | 15 | % |
| | | | |
Net assets at end of period (in 000’s) | | $ | 218 | | | $ | 190 | | | $ | 114 | | | $ | 32 | |
| ‡ | Less than one cent per share. |
| (a) | Per share data based on average shares outstanding during the period. |
| (b) | Total investment return is calculated exclusive of sales charges and assumes the reinvestment of dividends and distributions. Class R3 shares are not subject to sales charges. For periods of less than one year, total return is not annualized. |
| (c) | In addition to the fees and expenses which the Fund bears directly, it also indirectly bears a pro-rata share of the fees and expenses of the underlying funds in which it invests. Such indirect expenses are not included in the above expense ratios. |
| (d) | The expense ratios presented below exclude short sales expense: |
| | | | | | | | | | |
Year Ended | | Net Expenses
(excluding short
sale expenses) | | Short Sale
Expenses |
| October 31, 2019 | | | | 1.42 | % | | | | 0.20 | % |
| October 31, 2018 | | | | 1.38 | % | | | | 0.22 | % |
| October 31, 2017 | | | | 1.36 | % | | | | 0.12 | % |
| October 31, 2016†† | | | | 1.34 | % | | | | 0.16 | % |
| (e) | The portfolio turnover rate not including mortgage dollar rolls was 44% for the year ended October 31, 2019. |
| | | | |
| 32 | | MainStay MacKay Unconstrained Bond Fund | | The notes to the financial statements are an integral part of,
and should be read in conjunction with, the financial statements. |
Financial Highlightsselected per share data and ratios
| | | | | | | | |
| | |
| Class R6 | | Year ended
October 31,
2019 | | | February 28,
2018^ through
October 31,
2018 | |
| | |
Net asset value at beginning of period | | $ | 8.66 | | | $ | 8.83 | |
| | | | | | | | |
| | |
Net investment income (loss) (a) | | | 0.27 | | | | 0.19 | |
| | |
Net realized and unrealized gain (loss) on investments | | | 0.11 | | | | (0.15 | ) |
| | |
Net realized and unrealized gain (loss) on foreign currency transactions | | | 0.00 | ‡ | | | 0.01 | |
| | | | | | | | |
| | |
Total from investment operations | | | 0.38 | | | | 0.05 | |
| | | | | | | | |
| | |
| Less dividends and distributions: | | | | | | | | |
| | |
From net investment income | | | (0.29 | ) | | | (0.22 | ) |
| | |
Return of capital | | | — | | | | (0.00 | )‡ |
| | | | | | | | |
| | |
Total dividends and distributions | | | (0.29 | ) | | | (0.22 | ) |
| | | | | | | | |
| | |
Net asset value at end of period | | $ | 8.75 | | | $ | 8.66 | |
| | | | | | | | |
| | |
Total investment return (b) | | | 4.43 | % | | | 0.54 | % |
| | |
| Ratios (to average net assets)/Supplemental Data: | | | | | | | | |
| | |
Net investment income (loss) | | | 3.13 | % | | | 3.18 | %†† |
| | |
Net expenses (c)(d) | | | 0.84 | % | | | 0.85 | %†† |
| | |
Portfolio turnover rate | | | 50 | %(e) | | | 22 | % |
| | |
Net assets at end of period (in 000’s) | | $ | 22,632 | | | $ | 52,504 | |
| ‡ | Less than one cent per share. |
| (a) | Per share data based on average shares outstanding during the period. |
| (b) | Total investment return is calculated exclusive of sales charges and assumes the reinvestment of dividends and distributions. Class R6 shares are not subject to sales charges. For periods of less than one year, total return is not annualized. |
| (c) | In addition to the fees and expenses which the Fund bears directly, it also indirectly bears a pro-rata share of the fees and expenses of the underlying funds in which it invests. Such indirect expenses are not included in the above expense ratios. |
| (d) | The expense ratios presented below exclude short sales expense: |
| | | | | | | | | | |
Year Ended | | Net Expenses
(excluding short
sale expenses) | | Short Sale
Expenses |
| October 31, 2019 | | | | 0.64 | % | | | | 0.20 | % |
| October 31, 2018†† | | | | 0.62 | % | | | | 0.23 | % |
| (e) | The portfolio turnover rate not including mortgage dollar rolls was 44% for the year ended October 31, 2019. |
| | | | | | |
The notes to the financial statements are an integral part of,
and should be read in conjunction with, the financial statements. | | | | | 33 | |
Notes to Financial Statements
Note 1–Organization and Business
The MainStay Funds (the “Trust”) was organized on January 9, 1986, as a Massachusetts business trust and is governed by a Declaration of Trust. The Trust is registered under the Investment Company Act of 1940, as amended (the “1940 Act”), as an open-end management investment company, and is comprised of twelve funds (collectively referred to as the “Funds”). These financial statements and notes relate to the MainStay MacKay Unconstrained Bond Fund (the “Fund”), a “diversified” fund, as that term is defined in the 1940 Act, as interpreted or modified by regulatory authorities having jurisdiction, from time to time.
The Fund currently offers eight classes of shares. Class A and Class B shares commenced operations on February 28, 1997. Class C shares commenced operations on September 1, 1998. Class I shares commenced operations on January 2, 2004. Investor Class shares commenced operations on February 28, 2008. Class R2 shares commenced operations on February 28, 2014. Class R3 shares commenced operations on February 29, 2016. Class R6 shares were registered for sale effective February 28, 2017. Class R6 shares commenced operations on February 28, 2018.
Class B shares of the MainStay Group of Funds are closed to all new purchases as well as additional investments by existing Class B shareholders. Existing Class B shareholders may continue to reinvest dividends and capital gains distributions, as well as exchange their Class B shares for Class B shares of other funds in the MainStay Group of Funds as permitted by the current exchange privileges. Class B shareholders continue to be subject to any applicable contingent deferred sales charge (“CDSC”) at the time of redemption. All other features of the Class B shares, including but not limited to the fees and expenses applicable to Class B shares, remain unchanged. Unless redeemed, Class B shareholders will remain in Class B shares of their respective fund until the Class B shares are converted to Class A or Investor Class shares pursuant to the applicable conversion schedule.
Class A and Investor Class shares are offered at net asset value (“NAV”) per share plus an initial sales charge. No initial sales charge applies to investments of $1 million or more (and certain other qualified purchases) in Class A and Investor Class shares. However, a CDSC of 1.00% may be imposed on certain redemptions made within 18 months of the date of purchase on shares that were purchased without an initial sales charge. Class C shares are offered at NAV without an initial sales charge, although a 1.00% CDSC may be imposed on certain redemptions of such shares made within one year of the date of purchase of Class C shares. When Class B shares were offered, they were offered at NAV without an initial sales charge, although a CDSC that declines depending on the number of years a shareholder has held its Class B shares may be imposed on certain redemptions of such shares made within six years of the date of purchase of such shares. Class I, Class R2, Class R3 and Class R6 shares are offered at NAV without a sales charge. Depending upon eligibility, Class B shares convert to either Class A or Investor Class shares at the end of the calendar quarter eight years after the date they were purchased. In addition, depending upon eligibility, Class C shares convert to either Class A or Investor Class shares at the end of the calendar quarter ten years after the date they were purchased. Additionally, as disclosed in the Fund’s prospectus, Class A shares may convert automatically to Investor Class shares and Investor Class shares may convert automatically to Class A
shares. Under certain circumstances and as may be permitted by the Trust’s multiple class plan pursuant to Rule 18f-3 under the 1940 Act, specified share classes of the Fund may be converted to one or more other share classes of the Fund as disclosed in the capital share transactions within these Notes. The classes of shares have the same voting (except for issues that relate solely to one class), dividend, liquidation and other rights, and the same terms and conditions, except that under distribution plans pursuant to Rule 12b-1 under the 1940 Act, Class B and Class C shares are subject to higher distribution and/or service fees than Class A, Investor Class and Class R2 shares. Class I and Class R6 shares are not subject to a distribution and/or service fee. Class R2 and Class R3 shares are subject to a shareholder service fee. This is in addition to any fees paid under a distribution plan, where applicable.
The Fund’s investment objective is to seek total return by investing primarily in domestic and foreign debt securities.
Note 2–Significant Accounting Policies
The Fund is an investment company and accordingly follows the investment company accounting and reporting guidance of the Financial Accounting Standards Board (“FASB”) Accounting Standard CodificationTopic 946 Financial Services—Investment Companies. The Fund prepares its financial statements in accordance with generally accepted accounting principles (“GAAP”) in the United States of America and follows the significant accounting policies described below.
(A) Securities Valuation. Investments are usually valued as of the close of regular trading on the New York Stock Exchange (the “Exchange”) (usually 4:00 p.m. Eastern time) on each day the Fund is open for business (“valuation date”).
The Board of Trustees of the Trust (the “Board”) adopted procedures establishing methodologies for the valuation of the Fund’s securities and other assets and delegated the responsibility for valuation determinations under those procedures to the Valuation Committee of the Trust (the “Valuation Committee”). The Board authorized the Valuation Committee to appoint a Valuation Subcommittee (the “Subcommittee”) to deal in the first instance with establishing the prices of securities for which market quotations are not readily available or the prices of which are not otherwise readily determinable under these procedures. The Subcommittee meets (in person, via electronic mail or via teleconference) on an as-needed basis. Subsequently, the Valuation Committee meets to ensure that actions taken by the Subcommittee were appropriate. The procedures state that, subject to the oversight of the Board and unless otherwise noted, the responsibility for theday-to-day valuation of portfolio assets (including fair value measurements for the Fund’s assets and liabilities) rests with New York Life Investment Management LLC (“New York Life Investments” or the “Manager”), aided to whatever extent necessary by the Subadvisor (as defined in Note 3(A)).
To assess the appropriateness of security valuations, the Manager, the Subadvisor or the Fund’s third-party service provider, who is subject to oversight by the Manager, regularly compares prior day prices, prices on comparable securities and the sale prices to the prior and current day prices and challenges prices with changes exceeding certain tolerance levels with third-party pricing services or broker sources. For those securities valued through either a standardized fair valuation methodology or a fair valuation measurement, the Subcommittee deals in the
| | |
| 34 | | MainStay MacKay Unconstrained Bond Fund |
first instance with such valuation and the Valuation Committee reviews and affirms, if appropriate, the reasonableness of the valuation based on such methodologies and measurements on a regular basis after considering information that is reasonably available and deemed relevant by the Valuation Committee. Any action taken by the Subcommittee with respect to the valuation of a portfolio security or other asset is submitted for review and ratification (if appropriate) to the Valuation Committee and the Board at the next regularly scheduled meeting.
“Fair value” is defined as the price the Fund would reasonably expect to receive upon selling an asset or liability in an orderly transaction to an independent buyer in the principal or most advantageous market for the asset or liability. Fair value measurements are determined within a framework that establishes a three-tier hierarchy which maximizes the use of observable market data and minimizes the use of unobservable inputs to establish a classification of fair value measurements for disclosure purposes. “Inputs” refer broadly to the assumptions that market participants would use in pricing the asset or liability, including assumptions about risk, such as the risk inherent in a particular valuation technique used to measure fair value using a pricing model and/or the risk inherent in the inputs for the valuation technique. Inputs may be observable or unobservable. Observable inputs reflect the assumptions market participants would use in pricing the asset or liability based on market data obtained from sources independent of the Fund. Unobservable inputs reflect the Fund’s own assumptions about the assumptions market participants would use in pricing the asset or liability based on the information available. The inputs or methodology used for valuing assets or liabilities may not be an indication of the risks associated with investing in those assets or liabilities. The three-tier hierarchy of inputs is summarized below.
| • | | Level 1—quoted prices in active markets for an identical asset or liability |
| • | | Level 2—other significant observable inputs (including quoted prices for a similar asset or liability in active markets, interest rates and yield curves, prepayment speeds, credit risk, etc.) |
| • | | Level 3—significant unobservable inputs (including the Fund’s own assumptions about the assumptions that market participants would use in measuring fair value of an asset or liability) |
The level of an asset or liability within the fair value hierarchy is based on the lowest level of an input, both individually and in the aggregate, that is significant to the fair value measurement. As of October 31, 2019, the aggregate value by input level of the Fund’s assets and liabilities is included at the end of the Fund’s Portfolio of Investments.
The Fund may use third-party vendor evaluations, whose prices may be derived from one or more of the following standard inputs, among others:
| | |
• Benchmark yields | | • Reported trades |
• Broker/dealer quotes | | • Issuer spreads |
• Two-sided markets | | • Benchmark securities |
• Bids/offers | | • Reference data (corporate actions or material event notices) |
• Industry and economic events | | • Comparable bonds |
• Monthly payment information | | |
An asset or liability for which market values cannot be measured using the methodologies described above is valued by methods deemed reasonable in good faith by the Valuation Committee, following the procedures established by the Board, to represent fair value. Under these procedures, the Fund generally uses a market-based approach which may use related or comparable assets or liabilities, recent transactions, market multiples, book values and other relevant information. The Fund may also use an income-based valuation approach in which the anticipated future cash flows of the asset or liability are discounted to calculate fair value. Discounts may also be applied due to the nature and/or duration of any restrictions on the disposition of the asset or liability. Fair value represents a good faith approximation of the value of a security. Fair value determinations involve the consideration of a number of subjective factors, an analysis of applicable facts and circumstances and the exercise of judgment. As a result, it is possible that the fair value for a security determined in good faith in accordance with the Fund’s valuation procedures may differ from valuations for the same security determined by other funds using their own valuation procedures. Although the Fund’s valuation procedures are designed to value a security at the price the Fund may reasonably expect to receive upon the security’s sale in an orderly transaction, there can be no assurance that any fair value determination thereunder would, in fact, approximate the amount that the Fund would actually realize upon the sale of the security or the price at which the security would trade if a reliable market price were readily available. During the year ended October 31, 2019, there were no material changes to the fair value methodologies.
Securities which may be valued in this manner include, but are not limited to: (i) a security for which trading has been halted or suspended; (ii) a debt security that has recently gone into default and for which there is not a current market quotation; (iii) a security of an issuer that has entered into a restructuring; (iv) a security that has been delisted from a national exchange; (v) a security for which the market price is not readily available from a third-party pricing source or, if so provided, does not, in the opinion of the Manager or the Subadvisor, reflect the security’s market value; (vi) a security subject to trading collars for which no or limited trading takes place; and (vii) a security whose principal market has been temporarily closed at a time when, under normal conditions, it would be open. Securities valued in this manner are generally categorized as Level 3 in the hierarchy. As of October 31, 2019, securities that were fair valued in such a manner are shown in the Portfolio of Investments.
Equity securities are valued at the last quoted sales prices as of the close of regular trading on the relevant exchange on each valuation date. Securities that are not traded on the valuation date are valued at the mean of the last quoted bid and ask prices. Prices are normally taken from the principal market in which each security trades. These securities are generally categorized as Level 1 in the hierarchy.
Futures contracts are valued at the last posted settlement price on the market where such futures are primarily traded. Investments in mutual funds, including money market funds, are valued at their respective NAVs as of the close of the Exchange on the valuation date. These securities are generally categorized as Level 1 in the hierarchy.
Debt securities (other than convertible and municipal bonds) are valued at the evaluated bid prices (evaluated mean prices in the case of con-
Notes to Financial Statements(continued)
vertible and municipal bonds) supplied by a pricing agent or brokers selected by the Manager, in consultation with the Subadvisor. The evaluations are market-based measurements processed through a pricing application and represents the pricing agent’s good faith determination as to what a holder may receive in an orderly transaction under market conditions. The rules based logic utilizes valuation techniques that reflect participants’ assumptions and vary by asset class and per methodology, maximizing the use of relevant observable data including quoted prices for similar assets, benchmark yield curves and market corroborated inputs. The evaluated bid or mean prices are deemed by the Manager, in consultation with the Subadvisor, to be representative of market values at the regular close of trading of the Exchange on each valuation date. Debt securities purchased on a delayed delivery basis are marked to market daily until settlement at the forward settlement date. Debt securities, including corporate bonds, U.S. government and federal agency bonds, municipal bonds, foreign bonds, convertible bonds, asset-backed securities and mortgage-backed securities are generally categorized as Level 2 in the hierarchy.
Certain securities held by the Fund may principally trade in foreign markets. Events may occur between the time the foreign markets close and the time at which the Fund’s NAVs are calculated. These events may include, but are not limited to, situations relating to a single issuer in a market sector, significant fluctuations in U.S. or foreign markets, natural disasters, armed conflicts, governmental actions or other developments not tied directly to the securities markets. Should the Manager or the Subadvisor conclude that such events may have affected the accuracy of the last price of such securities reported on the local foreign market, the Subcommittee may, pursuant to procedures adopted by the Board, adjust the value of the local price to reflect the estimated impact on the price of such securities as a result of such events. In this instance, securities are generally categorized as Level 3 in the hierarchy. Additionally, certain foreign equity securities are also fair valued whenever the movement of a particular index exceeds certain thresholds. In such cases, the securities are fair valued by applying factors provided by a third-party vendor in accordance with valuation procedures adopted by the Board and are generally categorized as Level 2 in the hierarchy. As of October 31, 2019, no foreign equity securities held by the Fund were fair valued in such a manner.
Foreign currency forward contracts are valued at their fair market values measured on the basis of the mean between the last current bid and ask prices based on dealer or exchange quotations and are generally categorized as Level 2 in the hierarchy.
Loan assignments, participations and commitments are valued at the average of bid quotations obtained from the engaged independent pricing service and are generally categorized as Level 2 in the hierarchy. Certain loan assignments, participations and commitments may be valued by utilizing significant unobservable inputs obtained from the pricing service and are generally categorized as Level 3 in the hierarchy. As of October 31, 2019, securities that were fair valued in such a manner are shown in the Portfolio of Investments.
Temporary cash investments acquired in excess of 60 days to maturity at the time of purchase are valued using the latest bid prices or using valuations based on a matrix system (which considers such factors as security prices, yields, maturities and ratings), both as furnished by independent pricing services. Other temporary cash investments which
mature in 60 days or less at the time of purchase (“Short-Term Investments”) are valued using the amortized cost method of valuation, unless the use of such method would be inappropriate. The amortized cost method involves valuing a security at its cost on the date of purchase and thereafter assuming a constant amortization to maturity of the difference between such cost and the value on maturity date. Amortized cost approximates the current fair value of a security. Securities valued using the amortized cost method are not valued using quoted prices in an active market and are generally categorized as Level 2 in the hierarchy.
Swaps are marked to market daily based upon quotations from pricing agents, brokers or market makers. These securities are generally categorized as Level 2 in the hierarchy.
The information above is not intended to reflect an exhaustive list of the methodologies that may be used to value portfolio investments. The valuation procedures permit the use of a variety of valuation methodologies in connection with valuing portfolio investments. The methodology used for a specific type of investment may vary based on the market data available or other considerations. The methodologies summarized above may not represent the specific means by which portfolio investments are valued on any particular business day.
A portfolio investment may be classified as an illiquid investment under the Trust’s written liquidity risk management program and related procedures (“Liquidity Program”). Illiquidity of an investment might prevent the sale of such investment at a time when the Manager or the Subadvisor might wish to sell, and these investments could have the effect of decreasing the overall level of the Fund’s liquidity. Further, the lack of an established secondary market may make it more difficult to value illiquid investments, requiring the Fund to rely on judgments that may be somewhat subjective in measuring value, which could vary materially from the amount that the Fund could realize upon disposition. Difficulty in selling illiquid investments may result in a loss or may be costly to the Fund. An illiquid investment is any investment that the Manager or Subadvisor reasonably expects cannot be sold or disposed of in current market conditions in seven calendar days or less without the sale or disposition significantly changing the market value of the investment. The liquidity classification of each investment will be made using information obtained after reasonable inquiry and taking into account, among other things, relevant market, trading and investment-specific considerations in accordance with the Liquidity Program. Illiquid investments are often valued in accordance with methods deemed by the Board in good faith to be reasonable and appropriate to accurately reflect their fair value. The liquidity of the Fund’s investments, as shown in the Portfolio of Investments, was determined as of October 31, 2019, and can change at any time. Illiquid investments as of October 31, 2019, are shown in the Portfolio of Investments.
(B) Income Taxes. The Fund’s policy is to comply with the requirements of the Internal Revenue Code of 1986, as amended (the “Internal Revenue Code”), applicable to regulated investment companies and to distribute all of its taxable income to the shareholders of the Fund within the allowable time limits. Therefore, no federal, state and local income tax provisions are required.
Management evaluates the Fund’s tax positions to determine if the tax positions taken meet the minimum recognition threshold in connection
| | |
| 36 | | MainStay MacKay Unconstrained Bond Fund |
with accounting for uncertainties in income tax positions taken or expected to be taken for the purposes of measuring and recognizing tax liabilities in the financial statements. Recognition of tax benefits of an uncertain tax position is permitted only to the extent the position is “more likely than not” to be sustained assuming examination by taxing authorities. Management has analyzed the Fund’s tax positions taken on federal, state and local income tax returns for all open tax years (for up to three tax years) and has concluded that no provisions for federal, state and local income tax are required in the Fund’s financial statements. The Fund’s federal, state and local income tax and federal excise tax returns for tax years for which the applicable statutes of limitations have not expired are subject to examination by the Internal Revenue Service and state and local departments of revenue.
(C) Foreign Taxes. The Fund may be subject to foreign taxes on income and other transaction-based taxes imposed by certain countries in which it invests. A portion of the taxes on gains on investments or currency purchases/repatriation may be reclaimable. The Fund will accrue such taxes and reclaims as applicable, based upon its current interpretation of tax rules and regulations that exist in the markets in which it invests.
The Fund may be subject to taxation on realized capital gains, repatriation proceeds and other transaction-based taxes imposed by certain countries in which it invests. The Fund will accrue such taxes as applicable based upon its current interpretation of tax rules and regulations that exist in the market in which it invests. Capital gains taxes relating to positions still held are reflected as a liability on the Statement of Assets and Liabilities, as well as an adjustment to the Fund’s net unrealized appreciation (depreciation). Taxes related to capital gains realized, if any, are reflected as part of net realized gain (loss) in the Statement of Operations. Changes in tax liabilities related to capital gains taxes on unrealized investment gains, if any, are reflected as part of the change in net unrealized appreciation (depreciation) on investments in the Statement of Operations. Transaction-based charges are generally assessed as a percentage of the transaction amount.
(D) Dividends and Distributions to Shareholders. Dividends and distributions are recorded on the ex-dividend date. The Fund intends to declare and pay dividends from net investment income, if any, at least monthly and distributions from net realized capital and currency gains, if any, at least annually. Unless the shareholder elects otherwise, all dividends and distributions are reinvested in the same class of shares of the Fund, at NAV. Dividends and distributions to shareholders are determined in accordance with federal income tax regulations and may differ from determinations using GAAP.
(E) Security Transactions and Investment Income. The Fund records security transactions on the trade date. Realized gains and losses on security transactions are determined using the identified cost method. Dividend income is recognized on the ex-dividend date; net of any foreign tax withheld at the source, and interest income is accrued as earned using the effective interest rate method and includes any realized gains and losses from repayments of principal on mortgage-backed securities. Discounts and premiums on securities purchased for the Fund are accreted and amortized, respectively, on the effective interest rate method over the life of the respective securities.
Investment income and realized and unrealized gains and losses on investments of the Fund are allocated pro rata to the separate classes of
shares based upon their relative net assets on the date the income is earned or realized and unrealized gains and losses are incurred.
The Fund may place a debt security on non-accrual status and reduce related interest income by ceasing current accruals and writing off all or a portion of any interest receivables when the collection of all or a portion of such interest has become doubtful. A debt security is removed from non-accrual status when the issuer resumes interest payments or when collectability of interest is reasonably assured.
(F) Expenses. Expenses of the Trust are allocated to the individual Funds in proportion to the net assets of the respective Funds when the expenses are incurred, except where direct allocations of expenses can be made. Expenses (other than transfer agent expenses and fees incurred under the shareholder services plans and/or the distribution plans further discussed in Note 3(B)) are allocated to separate classes of shares pro rata based upon their relative net assets on the date the expenses are incurred. The expenses borne by the Fund, including those of related parties to the Fund, are shown in the Statement of Operations.
Additionally, the Fund may invest in mutual funds, which are subject to management fees and other fees that may cause the costs of investing in mutual funds to be greater than the costs of owning the underlying securities directly. These indirect expenses of mutual funds are not included in the amounts shown as expenses in the Fund’s Statement of Operations or in the expense ratios included in the Financial Highlights.
(G) Use of Estimates. In preparing financial statements in conformity with GAAP, management makes estimates and assumptions that affect the reported amounts and disclosures in the financial statements. Actual results could differ from those estimates.
(H) Repurchase Agreements. The Fund may enter into repurchase agreements (i.e., buy a security from another party with the agreement that it will be sold back in the future) to earn income. The Fund may enter into repurchase agreements only with counterparties, usually financial institutions, that are deemed by the Manager or the Subadvisor to be creditworthy, pursuant to guidelines established by the Board. During the term of any repurchase agreement, the Manager or the Subadvisor will continue to monitor the creditworthiness of the counterparty. Under the 1940 Act, repurchase agreements are considered to be collateralized loans by the Fund to the counterparty secured by the securities transferred to the Fund.
Repurchase agreements are subject to counterparty risk, meaning the Fund could lose money by the counterparty’s failure to perform under the terms of the agreement. The Fund mitigates this risk by ensuring the repurchase agreement is collateralized by cash, U.S. government securities, fixed income securities and/or other securities. The collateral is held by the Fund’s custodian and valued daily on a mark to market basis to determine if the value, including accrued interest, exceeds the repurchase price. In the event of the counterparty’s default on the obligation to repurchase, the Fund has the right to liquidate the collateral and apply the proceeds in satisfaction of the obligation. Under certain circumstances, such as in the event of default or bankruptcy by the counterparty, realization and/or retention of the collateral may be limited or subject to delay, to legal proceedings and possible realized loss to the Fund. As of October 31, 2019, the Fund did not hold any repurchase agreements.
Notes to Financial Statements(continued)
(I) Futures Contracts. A futures contract is an agreement to purchase or sell a specified quantity of an underlying instrument at a specified future date and price, or to make or receive a cash payment based on the value of a financial instrument (e.g., foreign currency, interest rate, security or securities index). The Fund is subject to risks such as market price risk and/or interest rate risk in the normal course of investing in these transactions. Upon entering into a futures contract, the Fund is required to pledge to the broker or futures commission merchant an amount of cash and/or U.S. government securities equal to a certain percentage of the collateral amount, known as the “initial margin.” During the period the futures contract is open, changes in the value of the contract are recognized as unrealized appreciation or depreciation by marking to market such contract on a daily basis to reflect the market value of the contract at the end of each day’s trading. The Fund agrees to receive from or pay to the broker or futures commission merchant an amount of cash equal to the daily fluctuation in the value of the contract. Such receipts or payments are known as “variation margin.” When the futures contract is closed, the Fund records a realized gain or loss equal to the difference between the proceeds from (or cost of) the closing transaction and the Fund’s basis in the contract.
The use of futures contracts involves, to varying degrees, elements of market risk in excess of the amount recognized in the Statement of Assets and Liabilities. The contract or notional amounts and variation margin reflect the extent of the Fund’s involvement in open futures positions. There are several risks associated with the use of futures contracts as hedging techniques. There can be no assurance that a liquid market will exist at the time when the Fund seeks to close out a futures contract. If no liquid market exists, the Fund would remain obligated to meet margin requirements until the position is closed. Futures may involve a small initial investment relative to the risk assumed, which could result in losses greater than if they had not been used. Futures may be more volatile than direct investments in the instrument underlying the futures and may not correlate to the underlying instrument, causing a given hedge not to achieve its objectives. The Fund’s activities in futures contracts have minimal counterparty risk as they are conducted through regulated exchanges that guarantee the futures against default by the counterparty. In the event of a bankruptcy or insolvency of a futures commission merchant that holds margin on behalf of the Fund, the Fund may not be entitled to the return of the entire margin owed to the Fund, potentially resulting in a loss. The Fund may invest in futures contracts to help manage the duration and yield curve of the portfolio while minimizing the exposure to wider bid/ask spreads in traditional bonds. The Fund’s investment in futures contracts and other derivatives may increase the volatility of the Fund’s NAVs and may result in a loss to the Fund. As of October 31, 2019, open futures contracts are shown in the Portfolio of Investments.
(J) Loan Assignments, Participations and Commitments. The Fund may invest in loan assignments and participations (“loans”). Commitments are agreements to make money available to a borrower in a specified amount, at a specified rate and within a specified time. The Fund records an investment when the borrower withdraws money on a commitment or when a funded loan is purchased (trade date) and records interest as earned. These loans pay interest at rates that are periodically reset by reference to a base lending rate plus a spread. These base lending rates are generally the prime rate offered
by a designated U.S. bank or the London Interbank Offered Rate (“LIBOR”).
The loans in which the Fund may invest are generally readily marketable, but may be subject to some restrictions on resale. For example, the Fund may be contractually obligated to receive approval from the agent bank and/or borrower prior to the sale of these investments. If the Fund purchases an assignment from a lender, the Fund will generally have direct contractual rights against the borrower in favor of the lender. If the Fund purchases a participation interest either from a lender or a participant, the Fund typically will have established a direct contractual relationship with the seller of the participation interest, but not with the borrower. Consequently, the Fund is subject to the credit risk of the lender or participant who sold the participation interest to the Fund, in addition to the usual credit risk of the borrower. In the event that the borrower, selling participant or intermediate participants become insolvent or enter into bankruptcy, the Fund may incur certain costs and delays in realizing payment, or may suffer a loss of principal and/or interest.
Unfunded commitments represent the remaining obligation of the Fund to the borrower. At any point in time, up to the maturity date of the issue, the borrower may demand the unfunded portion. Unfunded amounts, if any, are marked to market and any unrealized gains or losses are recorded in the Statement of Assets and Liabilities. As of October 31, 2019, the Fund did not hold any unfunded commitments.
(K) Swap Contracts. The Fund may enter into credit default, interest rate, equity, index and currency exchange rate swap contracts (“swaps”). In a typical swap transaction, two parties agree to exchange the future returns (or differentials in rates of future returns) earned or realized at periodic intervals on a particular investment or instrument based on a notional principal amount. Generally, the Fund will enter into a swap on a net basis, which means that the two payment streams under the swap are netted, with the Fund receiving or paying (as the case may be) only the net amount of the two payment streams. Therefore, the Fund’s current obligation under a swap generally will be equal to the net amount to be paid or received under the swap, based on the relative value of notional positions attributable to each counterparty to the swap. The payments may be adjusted for transaction costs, interest payments, the amount of interest paid on the investment or instrument or other factors. Collateral, in the form of cash or securities, may be required to be held in segregated accounts with the custodian bank or broker in accordance with the terms of the swap. Swap agreements are privately negotiated in the over the counter (“OTC”) market and may be executed in a multilateral or other trade facilities platform, such as a registered commodities exchange (“centrally cleared swaps”).
Certain standardized swaps, including certain credit default and interest rate swaps, are subject to mandatory clearing and exchange-trading, and more types of standardized swaps are expected to be subject to mandatory clearing and exchange-trading in the future. The counterparty risk for exchange-traded and cleared derivatives is expected to be generally lower than for uncleared derivatives, but cleared contracts are not risk-free. In a cleared derivative transaction, the Fund typically enters into the transaction with a financial institution counterparty, and performance of the transaction is effectively guaranteed by a central clearinghouse, thereby reducing or eliminating the Fund’s exposure to the credit risk of its original counterparty. The Fund will be required to
| | |
| 38 | | MainStay MacKay Unconstrained Bond Fund |
post specified levels of margin with the clearinghouse or at the instruction of the clearinghouse; the margin required by a clearinghouse may be greater than the margin the Fund would be required to post in an uncleared transaction. As of October 31, 2019, all swap positions are shown in the Portfolio of Investments.
Swaps are marked to market daily based upon quotations from pricing agents, brokers or market makers and the change in value, if any, is recorded as unrealized appreciation or depreciation. Any payments made or received upon entering into a swap would be amortized or accreted over the life of the swap and recorded as a realized gain or loss. Early termination of a swap is recorded as a realized gain or loss. Daily changes in valuation of centrally cleared swaps, if any, are recorded as a receivable or payable for the change in value as appropriate (“variation margin”) on the Statement of Assets and Liabilities.
The Fund bears the risk of loss of the amount expected to be received under a swap in the event of the default or bankruptcy of the swap counterparty. The Fund may be able to eliminate its exposure under a swap either by assignment or other disposition, or by entering into an offsetting swap with the same party or a similar credit-worthy party. Swaps are not actively traded on financial markets. Entering into swaps involves elements of credit, market and documentation risk in excess of the amounts recognized on the Statement of Assets and Liabilities. Such risks involve the possibilities that there will be no liquid market for these swaps, that the counterparty to the swaps may default on its obligation to perform or disagree as to the meaning of the contractual terms in the swaps and that there may be unfavorable changes in interest rates, the price of the index or the security underlying these transactions.
Interest Rate Swaps: An interest rate swap is an agreement between two parties where one stream of future interest payments is exchanged for another based on a specified principal amount. Interest rate swaps often exchange a fixed payment for a floating payment that is linked to an interest rate (most often LIBOR). The Fund will typically use interest rate swaps to limit, or manage, its exposure to fluctuations in interest rates, or to obtain a marginally lower interest rate than it would have been able to get without the swap.
Credit Default Swaps: The Fund may enter into credit default swaps to simulate long and short bond positions or to take an active long or short position with respect to the likelihood of a default or credit event by the issuer of the underlying reference obligation. The types of reference obligations underlying the swaps that may be entered into by the Fund include debt obligations of a single issuer of corporate or sovereign debt, a basket of obligations of different issuers or a credit index. A credit index is an equally-weighted credit default swap index that is designed to track a representative segment of the credit default swap market (e.g., investment grade, high volatility, below investment grade or emerging markets) and provides an investor with exposure to specific “baskets” of issuers of certain debt instruments. Index credit default swaps have standardized terms including a fixed spread and standard maturity dates. The composition of the obligations within a particular index changes periodically. Credit default swaps involve one party, the protection buyer, making a stream of payments to another party, the protection seller, in exchange for the right to receive a contingent payment if there is a credit event related to the underlying reference obligation. In the event that the reference obligation matures prior to the termination date of the contract, a similar security will be substituted for the duration of the contract term.
Credit events are defined under individual swap agreements and generally include bankruptcy, failure to pay, restructuring, repudiation/moratorium, obligation acceleration and obligation default. Selling protection effectively adds leverage to a portfolio up to the notional amount of the swap agreement. Potential liabilities under these contracts may be reduced by: the auction rates of the underlying reference obligations; upfront payments received at the inception of a swap; and net amounts received from credit default swaps purchased with the identical reference obligation. As of October 31, 2019, open swap agreements are shown in the Portfolio of Investments.
(L) Foreign Currency Forward Contracts. The Fund may enter into foreign currency forward contracts, which are agreements to buy or sell foreign currencies on a specified future date at a specified rate. The Fund is subject to foreign currency exchange rate risk in the normal course of investing in these transactions. During the period the forward contract is open, changes in the value of the contract are recognized as unrealized appreciation or depreciation by marking to market such contract on a daily basis to reflect the market value of the contract at the end of each day’s trading. Cash movement occurs on settlement date. When the forward contract is closed, the Fund records a realized gain or loss equal to the difference between the proceeds from (or cost of) the closing transaction and the Fund’s basis in the contract. The Fund may purchase and sell foreign currency forward contracts for purposes of seeking to enhance portfolio returns and manage portfolio risk more efficiently. Foreign currency forward contracts may also be used to gain exposure to a particular currency or to hedge against the risk of loss due to changing currency exchange rates. Foreign currency forward contracts to purchase or sell a foreign currency may also be used in anticipation of future purchases or sales of securities denominated in foreign currency, even if the specific investments have not yet been selected.
The use of foreign currency forward contracts involves, to varying degrees, elements of risk in excess of the amount recognized in the Statement of Assets and Liabilities, including counterparty risk, market risk and illiquidity risk. Counterparty risk is heightened for these instruments because foreign currency forward contracts are not exchange-traded and therefore no clearinghouse or exchange stands ready to meet the obligations under such contracts. Thus, the Fund faces the risk that its counterparties under such contracts may not perform their obligations. Market risk is the risk that the value of a foreign currency forward contract will depreciate due to unfavorable changes in exchange rates. Illiquidity risk arises because the secondary market for foreign currency forward contracts may have less liquidity relative to markets for other securities and financial instruments. Risks also arise from the possible movements in the foreign exchange rates underlying these instruments. While the Fund may enter into forward contracts to reduce currency exchange risks, changes in currency exchange rates may result in poorer overall performance for the Fund than if it had not engaged in such transactions. Exchange rate movements can be large, depending on the currency, and can last for extended periods of time, affecting the value of the Fund’s assets. Moreover, there may be an imperfect correlation between the Fund’s holdings of securities denominated in a particular currency and forward contracts entered into by the Fund. Such imperfect correlation may prevent the Fund from achieving the intended hedge or expose the Fund to the risk of currency exchange loss. The unrealized appreciation (depreciation) on forward contracts also reflects the Fund’s exposure at the valuation date to credit loss in
Notes to Financial Statements(continued)
the event of a counterparty’s failure to perform its obligations. As of October 31, 2019, open foreign currency forward contracts are shown in the Portfolio of Investments.
(M) Foreign Currency Transactions. The Fund’s books and records are maintained in U.S. dollars. Prices of securities denominated in foreign currency amounts are translated into U.S. dollars at the mean between the buying and selling rates last quoted by any major U.S. bank at the following dates:
| (i) | market value of investment securities, other assets and liabilities— at the valuation date; and |
| (ii) | purchases and sales of investment securities, income and expenses—at the date of such transactions. |
The assets and liabilities that are denominated in foreign currency amounts are presented at the exchange rates and market values at the close of the period. The realized and unrealized changes in net assets arising from fluctuations in exchange rates and market prices of securities are not separately presented.
Net realized gain (loss) on foreign currency transactions represents net gains and losses on foreign currency forward contracts, net currency gains or losses realized as a result of differences between the amounts of securities sale proceeds or purchase cost, dividends, interest and withholding taxes as recorded on the Fund’s books, and the U.S. dollar equivalent amount actually received or paid. Net currency gains or losses from valuing such foreign currency denominated assets and liabilities, other than investments at valuation date exchange rates, are reflected in unrealized foreign exchange gains or losses.
(N) Securities Sold Short. During the year ended October 31, 2019, the Fund engaged in sales of securities it did not own (“short sales”) as part of its investment strategies. When the Fund enters into a short sale, it must segregate or maintain with a broker the cash proceeds from the security sold short or other securities as collateral for its obligation to deliver the security upon conclusion of the sale. During the period a short position is open, depending on the nature and type of security, a short position is reflected as a liability and is marked to market in accordance with the valuation methodologies previously detailed (See Note 2(A)). Liabilities for securities sold short are closed out by purchasing the applicable securities for delivery to the counterparty broker. A gain, limited to the price at which the Fund sold the security short, or a loss, unlimited as to dollar amount, will be recognized upon termination of a short sale if the market price on the date the short position is closed out is less or greater, respectively, than the proceeds originally received. Any such gain or loss may be offset, completely or in part, by the change in the value of the hedged investments. Interest on short positions held is accrued daily, while dividends declared on short positions existing on the record date are recorded on the ex-dividend date as a dividend expense in the Statement of Operations. Broker fees and other expenses related to securities sold short are disclosed in the Statement of Operations. Short sales involve risk of loss in excess of the related amounts reflected in the Statement of Assets and Liabilities. As of October 31, 2019, securities sold short are shown in the Portfolio of Investments.
(O) Securities Lending. In order to realize additional income, the Fund may engage in securities lending, subject to the limitations set
forth in the 1940 Act and relevant guidance by the staff of the Securities and Exchange Commission (“SEC”). In the event the Fund does engage in securities lending, the Fund will lend through its custodian, State Street Bank and Trust Company (“State Street”), acting as securities lending agent on behalf of the Fund. State Street will manage the Fund’s collateral in accordance with the securities lending agency agreement between the Fund and State Street, and indemnify the Fund against counterparty risk. The loans will be collateralized by cash (which may be invested in a money market fund) and/ornon-cash collateral (which may include U.S. Treasury securities and/or U.S. Government Agency securities issued or guaranteed by the United States government or its agencies or instrumentalities) at least equal at all times to the market value of the securities loaned. The Fund may bear the risk of delay in recovery of, or loss of rights in, the securities loaned should the borrower of the securities experience financial difficulty. The Fund may also record a realized gain or loss on securities deemed sold due to a borrower’s inability to return securities on loan. The Fund bears the risk of any loss on investment of cash collateral. The Fund will receive compensation for lending its securities in the form of fees or it will retain a portion of interest earned on the investment of any cash collateral. The Fund will also continue to receive interest and dividends on the securities loaned and any gain or loss in the market price of the securities loaned that may occur during the term of the loan will be for the account of the Fund. Income earned from securities lending activities, if any, is reflected in the Statement of Operations. As of October 31, 2019, the Fund had securities on loan with an aggregate market value of $3,463,764; the total market value of collateral held by the Fund was $3,554,377. The market value of the collateral held includednon-cash collateral in the form of U.S. Treasury securities with a value of $121,748 and cash collateral, which was invested into the State Street Navigator Securities Lending Government Money Market Portfolio, with a value of $3,432,629.
(P) Debt and Foreign Securities Risk. The Fund primarily invests in high yield debt securities (commonly referred to as “junk bonds”), which are considered speculative because they present a greater risk of loss, including default, than higher rated debt securities. These securities pay investors a premium—a higher interest rate or yield than investment grade debt securities—because of the increased risk of loss. These securities can also be subject to greater price volatility. In times of unusual or adverse market, economic or political conditions, these securities may experience higher than normal default rates.
The Fund may invest in loans which are usually rated below investment grade and are generally considered speculative because they present a greater risk of loss, including default, than higher rated debt securities. These investments pay investors a higher interest rate than investment grade debt securities because of the increased risk of loss. Although certain loans are collateralized, there is no guarantee that the value of the collateral will be sufficient to repay the loan. In a recession or serious credit event, the value of these investments could decline significantly. As a result of these and other events, the Fund’s NAVs could go down and you could lose money.
In addition, loans generally are subject to the extended settlement periods that may be longer than seven days. As a result, the Fund may be adversely affected by selling other investments at an unfavorable time and/or under unfavorable conditions or engaging in borrowing
| | |
| 40 | | MainStay MacKay Unconstrained Bond Fund |
transactions, such as borrowing against its credit facility, to raise cash to meet redemption obligations or pursue other investment opportunities.
In certain circumstances, loans may not be deemed to be securities. As a result, the Fund may not have the protection of anti-fraud provisions of the federal securities laws. In such cases, the Fund generally must rely on the contractual provisions in the loan agreement and common-law fraud protections under applicable state law.
The Fund may invest in foreign securities, which carry certain risks that are in addition to the usual risks inherent in domestic securities. These risks include those resulting from currency fluctuations, future adverse political or economic developments and possible imposition of currency exchange blockages or other foreign governmental laws or restrictions. These risks are likely to be greater in emerging markets than in developed markets. The ability of issuers of debt securities held by the Fund to meet their obligations may be affected by, among other things, economic or political developments in a specific country, industry or region.
(Q) Counterparty Credit Risk. In order to better define its contractual rights and to secure rights that will help the Fund mitigate its counterparty risk, the Fund may enter into an International Swaps and Derivatives Association, Inc. Master Agreement (“ISDA Master Agreement”) or similar agreement with its counterparties. An ISDA Master Agreement is a bilateral agreement between the Fund and a counterparty that governs certain OTC derivatives and typically contains collateral posting terms and netting provisions. Under an ISDA Master Agreement, the Fund may, under certain circumstances, offset with the counterparty certain derivative financial instruments’ payables and/or receivables with collateral held and/or posted and create one single net payment. The provisions of the ISDA Master Agreement typically permit a single net payment in the event of default including the bankruptcy or insolvency of the counterparty. Bankruptcy or insolvency laws of a particular jurisdiction may restrict or prohibit the right of offset in bankruptcy, insolvency or other events. In addition, certain ISDA Master Agreements may contain provisions for early termination of OTC derivative transactions in the event the net assets of the Fund decline
below specific levels or if the Fund fails to meet the terms of its ISDA Master Agreements. The result would cause the Fund to accelerate payment of any net liability owed to the counterparty.
For financial reporting purposes, the Fund does not offset derivative assets and derivative liabilities that are subject to netting arrangements, if any, in the Statement of Assets and Liabilities.
(R) Indemnifications. Under the Trust’s organizational documents, its officers and trustees are indemnified against certain liabilities that may arise out of performance of their duties to the Trust. Additionally, in the normal course of business, the Fund enters into contracts with third-party service providers that contain a variety of representations and warranties and which may provide general indemnifications. The Fund’s maximum exposure under these arrangements is unknown, as this would involve future claims that may be made against the Fund that have not yet occurred. Based on experience, management is of the view that the risk of loss in connection with these potential indemnification obligations is remote. However, there can be no assurance that material liabilities related to such obligations will not arise in the future, which could adversely impact the Fund.
(S) Quantitative Disclosure of Derivative Holdings. The following tables show additional disclosures related to the Fund’s derivative and hedging activities, including how such activities are accounted for and their effect on the Fund’s financial positions, performance and cash flows. The Fund entered into futures contracts to help manage the duration and yield curve positioning of the portfolio while minimizing the exposure to wider bid/ask spreads in traditional bonds. The Fund entered into interest rate and credit default swap contracts in order to obtain a desired return at a lower cost to the Fund, rather than directly investing in an instrument yielding that desired return or to hedge against credit and interest rate risk. The Fund also entered into foreign currency forward contracts to gain exposure to a particular currency or to hedge against the risk of loss due to changing currency exchange rates. These derivatives are not accounted for as hedging instruments.
Fair value of derivative instruments as of October 31, 2019:
Asset Derivatives
| | | | | | | | | | | | | | | | | | |
| | | Statement of
Assets and Liabilities
Location | | Foreign
Exchange
Contracts
Risk | | | Credit
Contracts
Risk | | | Interest
Rate
Contracts
Risk | | | Total | |
| | | | | |
Futures Contracts | | Net Assets—Net unrealized appreciation on investments, swap contracts and futures contracts (a) | | $ | — | | | $ | — | | | $ | 1,952,421 | | | $ | 1,952,421 | |
Centrally Cleared Swap Contracts | | Net Assets—Net unrealized appreciation on investments, swap contracts and futures contracts (b) | | | — | | | | — | | | | 25,480 | | | | 25,480 | |
Forward Contracts | | Unrealized appreciation on foreign currency forward contracts | | | 161,281 | | | | — | | | | — | | | | 161,281 | |
| | | | | | |
Total Fair Value | | | | $ | 161,281 | | | $ | — | | | $ | 1,977,901 | | | $ | 2,139,182 | |
| | | | | | |
Notes to Financial Statements(continued)
Liability Derivatives
| | | | | | | | | | | | | | | | | | |
| | | Statement of
Assets and Liabilities
Location | | Foreign
Exchange
Contracts
Risk | | | Credit
Contracts
Risk | | | Interest
Rate
Contracts
Risk | | | Total | |
| | | | | |
Futures Contracts | | Net Assets—Net unrealized depreciation on investments, swap contracts and futures contracts (a) | | $ | — | | | $ | — | | | $ | (137,765 | ) | | $ | (137,765 | ) |
Centrally Cleared Swap Contracts | | Net Assets—Net unrealized depreciation on investments, swap contracts and futures contracts (b) | | | — | | | | — | | | | (3,414,997 | ) | | | (3,414,997 | ) |
Forward Contracts | | Unrealized depreciation on foreign currency forward contracts | | | (464,368 | ) | | | — | | | | — | | | | (464,368 | ) |
| | | | | | |
Total Fair Value | | | | $ | (464,368 | ) | | $ | — | | | $ | (3,552,762 | ) | | $ | (4,017,130 | ) |
| | | | | | |
| (a) | Includes cumulative appreciation (depreciation) of futures contracts as reported in the Portfolio of Investments. Only current day’s variation margin is reported within the Statement of Assets and Liabilities. |
| (b) | Includes cumulative appreciation (depreciation) of centrally cleared swap agreements as reported in the Portfolio of Investments. Only the current day’s variation margin is reported within the Statement of Assets and Liabilities. |
The effect of derivative instruments on the Statement of Operations for the year ended October 31, 2019:
Realized Gain (Loss)
| | | | | | | | | | | | | | | | | | |
| | | Statement of
Operations
Location | | Foreign
Exchange
Contracts
Risk | | | Credit
Contracts
Risk | | | Interest
Rate
Contracts
Risk | | | Total | |
| | | | | |
Futures Contracts | | Net realized gain (loss) on futures transactions | | $ | — | | | $ | — | | | $ | (25,109,995 | ) | | $ | (25,109,995 | ) |
Swap Contracts | | Net realized gain (loss) on swap transactions | | | — | | | | (115,097 | ) | | | 2,881,494 | | | | 2,766,397 | |
Forward Contracts | | Net realized gain (loss) on foreign currency forward transactions | | | 1,388,457 | | | | — | | | | — | | | | 1,388,457 | |
| | | | | | |
Total Realized Gain (Loss) | | | | $ | 1,388,457 | | | $ | (115,097 | ) | | $ | (22,228,501 | ) | | $ | (20,955,141 | ) |
| | | | | | |
Change in Unrealized Appreciation (Depreciation)
| | | | | | | | | | | | | | | | | | |
| | | Statement of
Operations
Location | | Foreign
Exchange
Contracts
Risk | | | Credit
Contracts
Risk | | | Interest
Rate
Contracts
Risk | | | Total | |
| | | | | |
Futures Contracts | | Net change in unrealized appreciation (depreciation) on futures contracts | | $ | — | | | $ | — | | | $ | 1,350,658 | | | $ | 1,350,658 | |
Swap Contracts | | Net change in unrealized appreciation (depreciation) on swap contracts | | | — | | | | 88,088 | | | | (8,564,669 | ) | | | (8,476,581 | ) |
Forward Contracts | | Net change in unrealized appreciation (depreciation) on foreign currency forward contracts | | | (1,154,798 | ) | | | — | | | | — | | | | (1,154,798 | ) |
| | | | | | |
Total Change in Unrealized Appreciation (Depreciation) | | | | $ | (1,154,798 | ) | | $ | 88,088 | | | $ | (7,214,011 | ) | | $ | (8,280,721 | ) |
| | | | | | |
Average Notional Amount
| | | | | | | | | | | | | | | | |
| | | Foreign
Exchange
Contracts
Risk | | | Credit
Contracts
Risk | | | Interest Rate
Contracts
Risk | | | Total | |
| | | | |
Futures Contracts Long | | $ | — | | | $ | — | | | $ | 18,680,408 | | | $ | 18,680,408 | |
Futures Contracts Short | | $ | — | | | $ | — | | | $ | (260,161,056 | ) | | $ | (260,161,056 | ) |
Swap Contracts Long | | $ | — | | | $ | 7,000,000 | (a) | | $ | 418,500,000 | | | $ | 425,500,000 | |
Forward Contracts Long (b) | | $ | 11,908,242 | | | $ | — | | | $ | — | | | $ | 11,908,242 | |
Forward Contracts Short | | $ | (25,026,116 | ) | | $ | — | | | $ | — | | | $ | (25,026,116 | ) |
| | | | | | | | |
| (a) | Positions were open seven months during the reporting period. |
| (b) | Positions were open eight months during the reporting period. |
| | |
| 42 | | MainStay MacKay Unconstrained Bond Fund |
Note 3–Fees and Related Party Transactions
(A) Manager and Subadvisor. New York Life Investments, a registered investment adviser and an indirect,wholly-owned subsidiary of New York Life Insurance Company (“New York Life”), serves as the Fund’s Manager, pursuant to an Amended and Restated Management Agreement (“Management Agreement”). The Manager provides offices, conducts clerical, recordkeeping and bookkeeping services and keeps most of the financial and accounting records required to be maintained by the Fund. Except for the portion of salaries and expenses that are the responsibility of the Fund, the Manager pays the salaries and expenses of all personnel affiliated with the Fund and certain operational expenses of the Fund. The Fund reimburses New York Life Investments in an amount equal to a portion of the compensation of the Chief Compliance Officer attributable to the Fund. MacKay Shields LLC (“MacKay Shields” or the “Subadvisor”), a registered investment adviser and an indirect,wholly-owned subsidiary of New York Life, serves as Subadvisor to the Fund and is responsible for theday-to-day portfolio management of the Fund. Pursuant to the terms of an Amended and Restated Subadvisory Agreement (“Subadvisory Agreement”) between New York Life Investments and MacKay Shields, New York Life Investments pays for the services of the Subadvisor.
Under the Management Agreement, the Fund pays the Manager a monthly fee for the services performed and the facilities furnished at an annual rate of the Fund’s average daily net assets as follows: 0.60% up to $500 million; 0.55% from $500 million to $1 billion; 0.50% from $1 billion to $5 billion; and 0.475% in excess of $5 billion, plus a fee for fund accounting services previously provided by New York Life Investments under a separate fund accounting agreement furnished at an annual rate of the Fund’s average daily net assets as follows: 0.05% up to $20 million; 0.0333% from $20 million to $100 million; and 0.01% in excess of $100 million. During the year ended October 31, 2019, the effective management fee rate was 0.58%, inclusive of a fee for fund accounting services of 0.01% of the Fund’s average daily net assets.
New York Life Investments has contractually agreed to waive fees and/ or reimburse expenses so that Total Annual Fund Operating Expenses (excluding taxes, interest, litigation, extraordinary expenses, brokerage and other transaction expenses relating to the purchase or sale of portfolio investments, and acquired (underlying) fund fees and expenses) of Class R6 do not exceed those of Class I. This agreement will remain in effect until February 28, 2020 and shall renew automatically for one-year terms unless New York Life Investments provides written notice of termination prior to the start of the next term or upon approval of the Board.
During the year ended October 31, 2019, New York Life Investments earned fees from the Fund in the amount of $6,115,196 and paid the Subadvisor in the amount of $2,991,902.
State Street providessub-administration andsub-accounting services to the Fund pursuant to an agreement with New York Life Investments. These services include calculating the daily NAVs of the Fund, maintaining the general ledger andsub-ledger accounts for the calculation of the Fund’s NAVs and assisting New York Life Investments in conducting various aspects of the Fund’s administrative operations. For providing these services to the Fund, State Street is compensated by New York Life Investments.
Pursuant to an agreement between the Trust and New York Life Investments, New York Life Investments is responsible for providing or procuring certain regulatory reporting services for the Fund. The Fund will reimburse New York Life Investments for the actual costs incurred by New York Life Investments in connection with providing or procuring these services for the Fund.
(B) Distribution and Service Fees. The Trust, on behalf of the Fund, has entered into a distribution agreement with NYLIFE Distributors LLC (the “Distributor”), an indirect,wholly-owned subsidiary of New York Life. The Fund has adopted distribution plans (the “Plans”) in accordance with the provisions of Rule 12b-1 under the 1940 Act.
Pursuant to the Class A, Investor Class and Class R2 Plans, the Distributor receives a monthly distribution fee from the Class A, Investor Class and Class R2 shares at an annual rate of 0.25% of the average daily net assets of the Class A, Investor Class and Class R2 shares for distribution and/or service activities as designated by the Distributor. Pursuant to the Class B and Class C Plans, Class B and Class C shares pay the Distributor a monthly distribution fee at an annual rate of 0.75% of the average daily net assets of the Class B and Class C shares, along with a service fee at an annual rate of 0.25% of the average daily net assets of the Class B and Class C shares, for a total 12b-1 fee of 1.00%. Pursuant to the Class R3 Plan, the Distributor receives a monthly distribution and/or service fee from the Class R3 shares at an annual rate of 0.50% of the average daily net assets of the Class R3 shares. Class I and Class R6 shares are not subject to a distribution and/or service fee.
The Plans provide that the distribution and service fees are payable to the Distributor regardless of the amounts actually expended by the Distributor for distribution of the Fund’s shares and service activities.
In accordance with the Shareholder Services Plan for the Class R2 and Class R3 shares, the Manager has agreed to provide, through its affiliates or independent third parties, various shareholder and administrative support services to shareholders of the Class R2 and Class R3 shares. For its services, the Manager, its affiliates or independent third-party service providers are entitled to a shareholder service fee accrued daily and paid monthly at an annual rate of 0.10% of the average daily net assets of the Class R2 and Class R3 shares. This is in addition to any fees paid under the Class R2 and Class R3 Plans.
During the year ended October 31, 2019, shareholder service fees incurred by the Fund were as follows:
| | | | |
Class R2 | | $ | 6,854 | |
Class R3 | | | 198 | |
(C) Sales Charges. During the year ended October 31, 2019, the Fund was advised by the Distributor that the amount of initial sales charges retained on sales of Class A and Investor Class shares were $25,388 and $5,592, respectively.
During the year ended October 31, 2019, the Fund was also advised that the Distributor retained CDSCs on redemptions of Class A, Class B and Class C shares of $2,388, $13,237 and $2,086, respectively.
(D) Transfer, Dividend Disbursing and Shareholder Servicing Agent. NYLIM Service Company LLC, an affiliate of New York Life Investments, is the Fund’s transfer, dividend disbursing and
Notes to Financial Statements(continued)
shareholder servicing agent pursuant to an agreement between NYLIM Service Company LLC and the Trust. NYLIM Service Company LLC has entered into an agreement with DST Asset Manager Solutions, Inc. (“DST”), pursuant to which DST performs certain transfer agent services on behalf of NYLIM Service Company LLC. During the year ended October 31, 2019, transfer agent expenses incurred by the Fund were as follows:
| | | | |
Class A | | $ | 378,479 | |
Investor Class | | | 41,000 | |
Class B | | | 18,781 | |
Class C | | | 222,709 | |
Class I | | | 1,201,747 | |
Class R2 | | | 12,583 | |
Class R3 | | | 364 | |
(E) Small Account Fee. Shareholders with small accounts adversely impact the cost of providing transfer agency services. In an effort to reduce total transfer agency expenses, the Fund has implemented a small account fee on certain types of accounts. Certain shareholders with an account balance of less than $1,000 are charged an annual per account fee of $20 (assessed semi-annually), the proceeds from which offset transfer agent fees as reflected in the Statement of Operations.
(F) Investments in Affiliates (in 000’s). During the year ended October 31, 2019, purchases and sales transactions, income earned from investments and shares held of investment companies managed by New York Life Investments or its affiliates were as follows:
| | | | | | | | | | | | | | | | | | | | | | | | | | | | | | | | | | | | |
Affiliated Investment
Company | | Value,
Beginning
of Year | | | Purchases
at Cost | | | Proceeds
from Sales | | | Net Realized
Gain/(Loss)
on Sales | | | Change in
Unrealized
Appreciation/
(Depreciation) | | | Value, End
of Year | | | Dividend
Income | | | Other
Distributions | | | Shares
End of
Year | |
| | | | | | | | | |
MainStay U.S. Government Liquidity Fund | | $ | 15,391 | | | $ | 652,889 | | | $ | (616,458 | ) | | $ | — | | | $ | — | | | $ | 51,822 | | | $ | 829 | | | $ | — | | | | 51,822 | |
(G) Capital. As of October 31, 2019, New York Life and its affiliates beneficially held shares of the Fund with the values and percentages of net assets as follows:
| | | | | | | | |
Class R3 | | $ | 29,583 | | | | 13.6 | % |
Class R6 | | | 26,191 | | | | 0.1 | |
Note 4–Federal Income Tax
As of October 31, 2019, the cost and unrealized appreciation (depreciation) of the Fund’s investment portfolio, including applicable derivative contracts and other financial instruments, as determined on a federal income tax basis, were as follows:
| | | | | | | | | | | | | | | | |
| | | Federal Tax
Cost | | | Gross
Unrealized
Appreciation | | | Gross
Unrealized
(Depreciation) | | | Net
Unrealized
Appreciation/
(Depreciation) | |
| | | | |
Investments in Securities | | $ | 938,188,153 | | | $ | 32,296,880 | | | $ | (13,031,229 | ) | | $ | 19,265,651 | |
As of October 31, 2019, the components of accumulated gain (loss) on a tax basis were as follows:
| | | | | | | | | | | | | | |
Ordinary
Income | | Accumulated
Capital and
Other Gain
(Loss) | | Other
Temporary
Differences | | | Unrealized
Appreciation
(Depreciation) | | | Total
Accumulated
Gain (Loss) | |
| | | | |
| $1,014,374 | | $(206,240,494) | | $ | (148,376 | ) | | $ | 19,312,855 | | | $ | (186,061,641 | ) |
The difference between book-basis and tax-basis unrealized appreciation (depreciation) is primarily due to mark to market of futures contracts. The other temporary differences are primarily due to dividends payable.
As of October 31, 2019, for federal income tax purposes, capital loss carryforwards of $206,233,668 were available as shown in the table below, to the extent provided by the regulations to offset future realized gains of the Fund through the years indicated. To the extent that these capital loss carryforwards are used to offset future capital gains, it is probable that the capital gains so offset will not be distributed to shareholders. No capital gain distributions shall be made until any capital loss carryforwards have been fully utilized or expired.
| | | | |
Capital Loss
Available Through | | Short-Term
Capital Loss
Amounts (000’s) | | Long-Term
Capital Loss
Amounts (000’s) |
| | |
| Unlimited | | $32,091 | | $174,142 |
During the years ended October 31, 2019 and October 31, 2018, the tax character of distributions paid as reflected in the Statements of Changes in Net Assets were as follows:
| | | | | | | | |
| | | 2019 | | | 2018 | |
Distributions paid from: | | | | | | | | |
Ordinary Income | | $ | 30,854,119 | | | $ | 39,135,981 | |
Return of Capital | | | — | | | | 594,228 | |
Total | | $ | 30,854,119 | | | $ | 39,730,209 | |
Note 5–Restricted Securities
Restricted securities are subject to legal or contractual restrictions on resale. Private placement securities are generally considered to be restricted except for those securities traded between qualified institutional investors under the provisions of Rule 144A of the Securities Act of 1933, as amended. Disposal of restricted securities may involve time consuming negotiations and expenses, and prompt sale at an acceptable price may be difficult to achieve.
| | |
| 44 | | MainStay MacKay Unconstrained Bond Fund |
As of October 31, 2019, the Fund held the following restricted securities:
| | | | | | | | | | | | | | | | | | | | |
Security | | Date of
Acquisition | | | Shares | | | Cost | | | 10/31/19 Value | | | Percent of
Net Assets | |
ION Media Networks, Inc.
Common Stock | | | 3/11/14 | | | | 22 | | | $ | — | | | $ | 8,726 | | | | 0.0 | %‡ |
Total | | | | | | | 22 | | | $ | — | | | $ | 8,726 | | | | | |
| ‡ | Less thanone-tenth of a percent. |
Note 6–Custodian
State Street is the custodian of cash and securities held by the Fund. Custodial fees are charged to the Fund based on the Fund’s net assets and/or the market value of securities held by the Fund and the number of certain transactions incurred by the Fund.
Note 7–Line of Credit
The Fund and certain other funds managed by New York Life Investments maintain a line of credit with a syndicate of banks in order to secure a source of funds for temporary purposes to meet unanticipated or excessive redemption requests.
Effective July 30, 2019, under the credit agreement (the “Credit Agreement”), the aggregate commitment amount is $600,000,000 with an additional uncommitted amount of $100,000,000. The commitment fee is an annual rate of 0.15% of the average commitment amount payable quarterly, regardless of usage, to State Street, who serves as the agent to the syndicate. The commitment fee is allocated among the Fund and certain other funds managed by New York Life Investments based upon their respective net assets and other factors. Interest on any revolving credit loan is charged based upon the Federal Funds Rate or LIBOR, whichever is higher. The Credit Agreement expires on July 28, 2020, although the Fund, certain other funds managed by New York Life Investments and the syndicate of banks may renew the Credit Agreement for an additional year on the same or different terms. Prior to July 30, 2019, the aggregate commitment amount and the commitment fee were the same as those under the current Credit Agreement. During the year ended October 31, 2019, there were no borrowings made or outstanding with respect to the Fund under the Credit Agreement.
Note 8–Interfund Lending Program
Pursuant to an exemptive order issued by the SEC, the Fund, along with certain other funds managed by New York Life Investments, may participate in an interfund lending program. The interfund lending program provides an alternative credit facility that permits the Fund and certain other funds managed by New York Life Investments to lend or borrow money for temporary purposes directly to or from one another subject to the conditions of the exemptive order. During the year ended October 31, 2019, there were no interfund loans made or outstanding with respect to the Fund.
Note 9–Purchases and Sales of Securities (in 000’s)
During the year ended October 31, 2019, purchases and sales of U.S. government securities were $227,369 and $100,088, respectively. Purchases and sales of securities, other than U.S. government secu-
rities andshort-term securities, were $274,494 and $669,618, respectively.
Note 10–Capital Share Transactions
Transactions in capital shares for the years ended October 31, 2019 and October 31, 2018, were as follows:
| | | | | | | | |
Class A | | Shares | | | Amount | |
| | |
Year ended October 31, 2019: | | | | | | | | |
Shares sold | | | 3,923,370 | | | $ | 34,022,695 | |
Shares issued to shareholders in reinvestment of dividends and distributions | | | 648,525 | | | | 5,604,208 | |
Shares redeemed | | | (7,651,832 | ) | | | (66,214,975 | ) |
| | | | |
Net increase (decrease) in shares outstanding before conversion | | | (3,079,937 | ) | | | (26,588,072 | ) |
Shares converted into Class A (See Note 1) | | | 322,178 | | | | 2,786,179 | |
Shares converted from Class A (See Note 1) | | | (128,869 | ) | | | (1,117,966 | ) |
| | | | |
Net increase (decrease) | | | (2,886,628 | ) | | $ | (24,919,859 | ) |
| | | | |
Year ended October 31, 2018: | | | | | | | | |
Shares sold | | | 5,509,621 | | | $ | 48,680,334 | |
Shares issued to shareholders in reinvestment of dividends and distributions | | | 858,927 | | | | 7,531,280 | |
Shares redeemed | | | (14,910,548 | ) | | | (131,326,039 | ) |
| | | | |
Net increase (decrease) in shares outstanding before conversion | | | (8,542,000 | ) | | | (75,114,425 | ) |
Shares converted into Class A (See Note 1) | | | 195,861 | | | | 1,723,819 | |
Shares converted from Class A (See Note 1) | | | (105,230 | ) | | | (923,908 | ) |
| | | | |
Net increase (decrease) | | | (8,451,369 | ) | | $ | (74,314,514 | ) |
| | | | |
|
| |
Notes to Financial Statements(continued)
| | | | | | | | |
Investor Class | | Shares | | | Amount | |
| | |
Year ended October 31, 2019: | | | | | | | | |
Shares sold | | | 415,571 | | | $ | 3,647,957 | |
Shares issued to shareholders in reinvestment of dividends and distributions | | | 63,631 | | | | 554,684 | |
Shares redeemed | | | (546,532 | ) | | | (4,791,206 | ) |
| | | | |
Net increase (decrease) in shares outstanding before conversion | | | (67,330 | ) | | | (588,565 | ) |
Shares converted into Investor Class (See Note 1) | | | 178,617 | | | | 1,558,761 | |
Shares converted from Investor Class (See Note 1) | | | (215,720 | ) | | | (1,882,993 | ) |
| | | | |
Net increase (decrease) | | | (104,433 | ) | | $ | (912,797 | ) |
| | | | |
Year ended October 31, 2018: | | | | | | | | |
Shares sold | | | 219,598 | | | $ | 1,946,265 | |
Shares issued to shareholders in reinvestment of dividends and distributions | | | 70,481 | | | | 622,644 | |
Shares redeemed | | | (385,811 | ) | | | (3,420,155 | ) |
| | | | |
Net increase (decrease) in shares outstanding before conversion | | | (95,732 | ) | | | (851,246 | ) |
Shares converted into Investor Class (See Note 1) | | | 151,447 | | | | 1,339,805 | |
Shares converted from Investor Class (See Note 1) | | | (166,900 | ) | | | (1,481,104 | ) |
| | | | |
Net increase (decrease) | | | (111,185 | ) | | $ | (992,545 | ) |
| | | | |
|
| |
Class B | | Shares | | | Amount | |
| | |
Year ended October 31, 2019: | | | | | | | | |
Shares sold | | | 104,200 | | | $ | 905,650 | |
Shares issued to shareholders in reinvestment of dividends and distributions | | | 18,886 | | | | 162,262 | |
Shares redeemed | | | (416,600 | ) | | | (3,591,602 | ) |
| | | | |
Net increase (decrease) in shares outstanding before conversion | | | (293,514 | ) | | | (2,523,690 | ) |
Shares converted from Class B (See Note 1) | | | (69,649 | ) | | | (598,047 | ) |
| | | | |
Net increase (decrease) | | | (363,163 | ) | | $ | (3,121,737 | ) |
| | | | |
Year ended October 31, 2018: | | | | | | | | |
Shares sold | | | 23,856 | | | $ | 209,256 | |
Shares issued to shareholders in reinvestment of dividends and distributions | | | 29,552 | | | | 257,829 | |
Shares redeemed | | | (406,416 | ) | | | (3,552,951 | ) |
| | | | |
Net increase (decrease) in shares outstanding before conversion | | | (353,008 | ) | | | (3,085,866 | ) |
Shares converted from Class B (See Note 1) | | | (86,222 | ) | | | (752,724 | ) |
| | | | |
Net increase (decrease) | | | (439,230 | ) | | $ | (3,838,590 | ) |
| | | | |
|
| |
| | | | | | | | |
Class C | | Shares | | | Amount | |
| | |
Year ended October 31, 2019: | | | | | | | | |
Shares sold | | | 594,342 | | | $ | 5,094,058 | |
Shares issued to shareholders in reinvestment of dividends and distributions | | | 236,574 | | | | 2,030,445 | |
Shares redeemed | | | (5,070,579 | ) | | | (43,589,224 | ) |
| | | | |
Net increase (decrease) in shares outstanding before conversion | | | (4,239,663 | ) | | | (36,464,721 | ) |
Shares converted from Class C (See Note 1) | | | (134,378 | ) | | | (1,153,207 | ) |
| | | | |
Net increase (decrease) | | | (4,374,041 | ) | | $ | (37,617,928 | ) |
| | | | |
Year ended October 31, 2018: | | | | | | | | |
Shares sold | | | 928,440 | | | $ | 8,151,489 | |
Shares issued to shareholders in reinvestment of dividends and distributions | | | 340,824 | | | | 2,969,821 | |
Shares redeemed | | | (5,286,485 | ) | | | (46,214,058 | ) |
| | | | |
Net increase (decrease) in shares outstanding before conversion | | | (4,017,221 | ) | | | (35,092,748 | ) |
Shares converted from Class C (See Note 1) | | | (6,738 | ) | | | (59,487 | ) |
| | | | |
Net increase (decrease) | | | (4,023,959 | ) | | $ | (35,152,235 | ) |
| | | | |
|
| |
Class I | | Shares | | | Amount | |
| | |
Year ended October 31, 2019: | | | | | | | | |
Shares sold | | | 22,646,970 | | | $ | 196,115,570 | |
Shares issued to shareholders in reinvestment of dividends and distributions | | | 2,133,464 | | | | 18,457,022 | |
Shares redeemed | | | (38,501,534 | ) | | | (333,217,757 | ) |
| | | | |
Net increase (decrease) in shares outstanding before conversion | | | (13,721,100 | ) | | | (118,645,165 | ) |
Shares converted into Class I (See Note 1) | | | 46,998 | | | | 407,273 | |
| | | | |
Net increase (decrease) | | | (13,674,102 | ) | | $ | (118,237,892 | ) |
| | | | |
Year ended October 31, 2018: | | | | | | | | |
Shares sold | | | 28,233,057 | | | $ | 248,668,294 | |
Shares issued to shareholders in reinvestment of dividends and distributions | | | 2,652,195 | | | | 23,274,868 | |
Shares redeemed | | | (36,010,371 | ) | | | (316,679,041 | ) |
| | | | |
Net increase (decrease) in shares outstanding before conversion | | | (5,125,119 | ) | | | (44,735,879 | ) |
Shares converted into Class I (See Note 1) | | | 17,412 | | | | 153,599 | |
Shares converted from Class I (See Note 1) | | | (6,069,494 | ) | | | (53,593,632 | ) |
| | | | |
Net increase (decrease) | | | (11,177,201 | ) | | $ | (98,175,912 | ) |
| | | | |
| | |
| 46 | | MainStay MacKay Unconstrained Bond Fund |
| | | | | | | | |
Class R2 | | Shares | | | Amount | |
| | |
Year ended October 31, 2019: | | | | | | | | |
Shares sold | | | 132,894 | | | $ | 1,151,880 | |
Shares issued to shareholders in reinvestment of dividends and distributions | | | 22,001 | | | | 190,167 | |
Shares redeemed | | | (97,010 | ) | | | (839,676 | ) |
| | | | |
Net increase (decrease) | | | 57,885 | | | $ | 502,371 | |
| | | | |
Year ended October 31, 2018: | | | | | | | | |
Shares sold | | | 707,801 | | | $ | 6,174,706 | |
Shares issued to shareholders in reinvestment of dividends and distributions | | | 8,998 | | | | 78,427 | |
Shares redeemed | | | (33,711 | ) | | | (294,004 | ) |
| | | | |
Net increase (decrease) | | | 683,088 | | | $ | 5,959,129 | |
| | | | |
|
| |
Class R3 | | Shares | | | Amount | |
| | |
Year ended October 31, 2019: | | | | | | | | |
Shares sold | | | 3,394 | | | $ | 29,402 | |
Shares issued to shareholders in reinvestment of dividends and distributions | | | 431 | | | | 3,725 | |
Shares redeemed | | | (931 | ) | | | (8,016 | ) |
| | | | |
Net increase (decrease) | | | 2,894 | | | $ | 25,111 | |
| | | | |
Year ended October 31, 2018: | | | | | | | | |
Shares sold | | | 12,227 | | | $ | 106,756 | |
Shares issued to shareholders in reinvestment of dividends and distributions | | | 373 | | | | 3,270 | |
Shares redeemed | | | (3,427 | ) | | | (29,943 | ) |
| | | | |
Net increase (decrease) | | | 9,173 | | | $ | 80,083 | |
| | | | |
|
| |
Class R6 | | Shares | | | Amount | |
| | |
Year ended October 31, 2019: | | | | | | | | |
Shares sold | | | 262,885 | | | $ | 2,280,850 | |
Shares issued to shareholders in reinvestment of dividends and distributions | | | 157,868 | | | | 1,364,064 | |
Shares redeemed | | | (3,896,936 | ) | | | (33,834,391 | ) |
| | | | |
Net increase (decrease) | | | (3,476,183 | ) | | $ | (30,189,477 | ) |
| | | | |
Period ended October 31, 2018 (a): | | | | | | | | |
Shares sold | | | 372,589 | | | $ | 3,263,845 | |
Shares issued to shareholders in reinvestment of dividends and distributions | | | 153,553 | | | | 1,340,249 | |
Shares redeemed | | | (532,263 | ) | | | (4,645,447 | ) |
| | | | |
Net increase (decrease) in shares outstanding before conversion | | | (6,121 | ) | | | (41,353 | ) |
Shares converted into Class R6 (See Note 1) | | | 6,069,494 | | | | 53,593,632 | |
| | | | |
Net increase (decrease) | | | 6,063,373 | | | $ | 53,552,279 | |
| | | | |
| (a) | The inception date of the class was February 28, 2018. |
Note 11–Recent Accounting Pronouncement
In March 2017, the Financial Accounting Standards Board issued an Accounting Standards Update, ASU2017-08, which amends the amortization period for certain callable debt securities that are held at a premium. The amendment requires the premium to be amortized to the earliest call date. This amendment does not require an accounting change for securities held at a discount. This guidance is effective for fiscal years beginning after December 15, 2018. At this time, management is evaluating the implications of the ASU and any impact on the financial statements has not yet been determined.
To improve the effectiveness of fair value disclosure requirements, the Financial Accounting Standards Board recently issued Accounting Standards Update (ASU)2018-13, Fair Value Measurement Disclosure Framework—Changes to the Disclosure Requirements for Fair Value Measurement (ASU2018-13), which adds, removes, and modifies certain aspects relating to fair value disclosure. ASU2018-13 is effective for interim and annual reporting periods beginning after December 15, 2019; early adoptions of the entire ASU 2018-13, or portions thereof, is permitted. Management has evaluated the implications of certain other provisions of the ASU and has determined to early adopt aspects related to the removal and modifications of certain fair value measurement disclosures under the ASU effective immediately. At this time, management is evaluating the implications of certain other provisions of the ASU related to new disclosure requirements and any impact on the financial statement disclosures has not yet been determined.
Note 12–Subsequent Events
In connection with the preparation of the financial statements of the Fund as of and for the year ended October 31, 2019, events and transactions subsequent to October 31, 2019, through the date the financial statements were issued have been evaluated by the Fund’s management for possible adjustment and/or disclosure. No subsequent events requiring financial statement adjustment or disclosure have been identified.
Report of Independent Registered Public Accounting Firm
To the Shareholders and Board of Trustees
The MainStay Funds:
Opinion on the Financial Statements
We have audited the accompanying statement of assets and liabilities of MainStay MacKay Unconstrained Bond Fund (the Fund), one of the funds constituting The MainStay Funds, including the portfolio of investments, as of October 31, 2019, the related statement of operations for the year then ended, the statements of changes in net assets for each of the years in thetwo-year period then ended, and the related notes (collectively, the financial statements) and the financial highlights for each of the years or periods in the five-year period then ended. In our opinion, the financial statements and financial highlights present fairly, in all material respects, the financial position of the Fund as of October 31, 2019, the results of its operations for the year then ended, the changes in its net assets for each of the years in thetwo-year period then ended, and the financial highlights for each of the years or periods in the five-year period then ended, in conformity with U.S. generally accepted accounting principles.
Basis for Opinion
These financial statements and financial highlights are the responsibility of the Fund’s management. Our responsibility is to express an opinion on these financial statements and financial highlights based on our audits. We are a public accounting firm registered with the Public Company Accounting Oversight Board (United States) (PCAOB) and are required to be independent with respect to the Fund in accordance with the U.S. federal securities laws and the applicable rules and regulations of the Securities and Exchange Commission and the PCAOB.
We conducted our audits in accordance with the standards of the PCAOB. Those standards require that we plan and perform the audit to obtain reasonable assurance about whether the financial statements and financial highlights are free of material misstatement, whether due to error or fraud. Our audits included performing procedures to assess the risks of material misstatement of the financial statements and financial highlights, whether due to error or fraud, and performing procedures that respond to those risks. Such procedures included examining, on a test basis, evidence regarding the amounts and disclosures in the financial statements and financial highlights. Such procedures also included confirmation of securities owned as of October 31, 2019, by correspondence with custodians, the transfer agent, and brokers or by other appropriate auditing procedures when replies from brokers were not received. Our audits also included evaluating the accounting principles used and significant estimates made by management, as well as evaluating the overall presentation of the financial statements and financial highlights. We believe that our audits provide a reasonable basis for our opinion.

We have served as the auditor of one or more New York Life Investment Management investment companies since 2003.
Philadelphia, Pennsylvania
December 23, 2019
| | |
| 48 | | MainStay MacKay Unconstrained Bond Fund |
Federal Income Tax Information
(Unaudited)
For the fiscal year ended October 31, 2019, the Fund designated approximately $122,166 under the Internal Revenue Code as qualified dividend income eligible for reduced tax rates.
The dividends paid by the Fund during the fiscal year ended October 31, 2019 should be multiplied by 0.03% to arrive at the amount eligible for the corporate dividend-received deduction.
In February 2020, shareholders will receive an IRS Form1099-DIV or substitute Form 1099, which will show the federal tax status of the distributions received by shareholders in calendar year 2019. The amounts that will be reported on such1099-DIV or substitute Form 1099 will be the amounts you are to use on your federal income tax return and will differ from the amounts which we must report for the Fund’s fiscal year end October 31, 2019.
Proxy Voting Policies and Procedures and Proxy Voting Record
A description of the policies and procedures that New York Life Investments uses to vote proxies related to the Fund’s securities is available without charge, upon request, by visiting the MainStay Funds’ website atnylinvestments.com/fundsor visiting the SEC’s website atwww.sec.gov.
The Fund is required to file with the SEC its proxy voting records for the12-month period ending June 30 on Form N-PX. The most recent Form N-PX or proxy voting record is available free of charge upon request by calling800-624-6782; visiting the MainStay Funds’ website atnylinvestments.com/funds; or visiting the SEC’s website atwww.sec.gov.
Shareholder Reports and Quarterly Portfolio Disclosure
The Fund is required to file its complete schedule of portfolio holdings with the SEC 60 days after its first and third fiscal quarter onForm N-PORT. The Fund’s holdings report is available free of charge by visiting the SEC’s website atwww.sec.govor upon request by calling New York Life Investments at800-624-6782.
Board of Trustees and Officers (Unaudited)
The Trustees and officers of the Funds are listed below. The Board oversees the MainStay Group of Funds (which consists of MainStay Funds and MainStay Funds Trust), MainStay VP Funds Trust, MainStay MacKay DefinedTerm Municipal Opportunities Fund, the Manager and the Subadvisors, and elects the officers of the Funds who are responsible for theday-to-day operations of the Funds. Information pertaining to the Trustees and officers is set forth below. Each Trustee serves until his or her successor is elected and qualified or until his or her
resignation, death or removal. Under the Board’s retirement policy, unless an exception is made, a Trustee must tender his or her resignation by the end of the calendar year during which he or she reaches the age of 75. Officers are elected annually by the Board. The business address of each Trustee and officer listed below is 51 Madison Avenue, New York, New York 10010. A majority of the Trustees are not “interested persons” (as defined by the 1940 Act and rules adopted by the SEC thereunder) of the Fund (“Independent Trustees”).
| | | | | | | | | | | | |
| | | | | Name and
Year of Birth | | Term of Office,
Position(s) Held and
Length of Service | | Principal Occupation(s)
During Past Five Years | | Number of
Portfolios in
Fund Complex
Overseen by
Trustee | | Other Directorships
Held by Trustee |
Interested Trustee | | | | Yie-Hsin Hung* 1962 | | MainStay Funds: Trustee since 2017; MainStay Funds Trust:Trustee since 2017. | | Senior Vice President of New York Life since joining in 2010, Member of the Executive Management Committee since 2017, Chief Executive Officer, New York Life Investment Management Holdings LLC & New York Life Investment Management LLC since 2015. Senior Managing Director andCo-President of New York Life Investment Management LLC from January 2014 to May 2015. Previously held positions of increasing responsibility, including head of NYLIM International, Alternative Growth Businesses, and Institutional investments since joining New York Life in 2010. | | 74 | | MainStay VP Funds Trust:
Trustee since 2017 (31 portfolios); and
MainStay MacKay DefinedTerm Municipal Opportunities Fund: Trustee since 2017. |
| | * | This Trustee is considered to be an “interested person” of the MainStay Group of Funds, MainStay VP Funds Trust and MainStay MacKay DefinedTerm Municipal Opportunities Fund, within the meaning of the 1940 Act because of her affiliation with New York Life Insurance Company, New York Life Investment Management LLC, Candriam Belgium S.A., Candriam Luxembourg S.C.A., IndexIQ Advisors LLC, MacKay Shields LLC, NYL Investors LLC, NYLIFE Securities LLC and/or NYLIFE Distributors LLC, as described in detail above in the column entitled “Principal Occupation(s) During Past Five Years.” |
| | |
| 50 | | MainStay MacKay Unconstrained Bond Fund |
| | | | | | | | | | | | |
| | | | | Name and
Year of Birth | | Term of Office,
Position(s) Held and
Length of Service | | Principal Occupation(s)
During Past Five Years | | Number of
Portfolios in
Fund Complex
Overseen by
Trustee | | Other Directorships
Held by Trustee |
Independent Trustees | | | | David H. Chow 1957 | | MainStay Funds: Trustee since 2016, Advisory Board Member (June 2015 to December 2015); MainStay Funds Trust:Trustee since 2016, Advisory Board Member (June 2015 to December 2015). | | Founder and CEO, DanCourt Management, LLC (since 1999) | | 74 | | MainStay VP Funds Trust: Trustee since 2016, Advisory Board Member (June 2015 to December 2015) (31 portfolios);
MainStay MacKay DefinedTerm Municipal Opportunities Fund: Trustee since 2016, Advisory Board Member (June 2015 to December 2015);
Market Vectors Group of Exchange-Traded Funds: Independent Chairman of the Board of Trustees since 2008 and Trustee since 2006 (56 portfolios); and
Berea College of Kentucky: Trustee since 2009. |
| | | | Susan B. Kerley 1951 | | MainStay Funds: Chairman since 2017 and Trustee since 2007; MainStay Funds Trust:Chairman since 2017 and Trustee since 1990.** | | President, Strategic Management Advisors LLC (since 1990) | | 74 | | MainStay VP Funds Trust: Chairman since January 2017 and Trustee since 2007 (31 portfolios)***;
MainStay MacKay DefinedTerm Municipal Opportunities Fund: Chairman since 2017 and Trustee since 2011; and
Legg Mason Partners Funds: Trustee since 1991 (45 portfolios). |
| | | | Alan R. Latshaw 1951 | | MainStay Funds: Trustee; MainStay Funds Trust: Trustee and Audit Committee Financial Expert since 2007.** | | Retired; Partner, Ernst & Young LLP (2002 to 2003); Partner, Arthur Andersen LLP (1989 to 2002); Consultant to the MainStay Funds Audit and Compliance Committee (2004 to 2006) | | 74 | | MainStay VP Funds Trust: Trustee and Audit Committee Financial Expert since 2007 (31 portfolios)***;
MainStay MacKay DefinedTerm Municipal Opportunities Fund: Trustee and Audit Committee Financial Expert since 2011;
State Farm Associates Funds Trusts: Trustee since 2005 (4 portfolios);
and State Farm Variable Product Trust: Trustee since 2005 (9 portfolios). |
| | | | Richard H. Nolan, Jr. 1946 | | MainStay Funds: Trustee since 2007; MainStay Funds Trust:Trustee since 2007.** | | Managing Director, ICC Capital Management (since 2004); President—Shields/Alliance, Alliance Capital Management (1994 to 2004) | | 74 | | MainStay VP Funds Trust: Trustee since 2006 (31 portfolios)***; and
MainStay MacKay DefinedTerm Municipal Opportunities Fund: Trustee since 2011. |
| | | | Jacques P. Perold 1958 | | MainStay Funds: Trustee since 2016, Advisory Board Member (June 2015 to December 2015); MainStay Funds Trust:Trustee since 2016, Advisory Board Member (June 2015 to December 2015). | | Retired; President, Fidelity Management & Research Company (2009 to 2014); Founder, President and Chief Executive Officer, Geode Capital Management, LLC (2001 to 2009) | | 74 | | MainStay VP Funds Trust: Trustee since 2016, Advisory Board Member (June 2015 to December 2015) (31 portfolios);
MainStay MacKay DefinedTerm Municipal Opportunities Fund: Trustee since 2016, Advisory Board Member (June 2015 to December 2015);
Allstate Corporation: Director since 2015;MSCI, Inc.: Director since 2017 and
Boston University: Trustee since 2014. |
| | | | | | | | | | | | |
| | | | | Name and
Year of Birth | | Term of Office,
Position(s) Held and
Length of Service | | Principal Occupation(s)
During Past Five Years | | Number of
Portfolios in
Fund Complex
Overseen by
Trustee | | Other Directorships
Held by Trustee |
Independent Trustees | | | | Richard S. Trutanic 1952 | | MainStay Funds: Trustee since 1994; MainStay Funds Trust: Trustee since 2007.** | | Chairman and Chief Executive Officer, Somerset & Company (financial advisory firm) (since 2004); Managing Director, The Carlyle Group (private investment firm) (2002 to 2004); Senior Managing Director, Partner and Board Member, Groupe Arnault S.A. (private investment firm) (1999 to 2002) | | 74 | | MainStay VP Funds Trust: Trustee since 2007 (31 portfolios)***; and
MainStay MacKay DefinedTerm Municipal Opportunities Fund: Trustee since 2011. |
| | ** | Includes prior service as a Director/Trustee of certain predecessor entities to MainStay Funds Trust. |
| | *** | Includes prior service as a Director of MainStay VP Series Fund, Inc., the predecessor to MainStay VP Funds Trust. |
| | |
| 52 | | MainStay MacKay Unconstrained Bond Fund |
| | | | | | | | |
| | | | | Name and
Year of Birth | | Position(s) Held and
Length of Service | | Principal Occupation(s)
During Past Five Years |
Officers
of the
Trust
(Who are
not
Trustees)* | | | | Kirk C. Lehneis 1974 | | President, MainStay Funds, MainStay Funds Trust (since 2017) | | Chief Operating Officer and Senior Managing Director (since 2016), New York Life Investment Management LLC; Chairman of the Board (since 2017), NYLIFE Distributors LLC; Chairman of the Board, NYLIM Service Company LLC (since 2017); Trustee, President and Principal Executive Officer of IndexIQ Trust, IndexIQ ETF Trust and IndexIQ Active ETF Trust (since January 2018); President, MainStay MacKay DefinedTerm Municipal Opportunities Fund and MainStay VP Funds Trust
(since 2017)**; Senior Managing Director, Global Product Development (2015 to 2016); Managing Director, Product Development (2010 to 2015), New York Life Investment Management LLC |
| | | | Jack R. Benintende 1964 | | Treasurer and Principal Financial and Accounting Officer, MainStay Funds (since 2007), MainStay Funds Trust (since 2009) | | Managing Director, New York Life Investment Management LLC (since 2007); Treasurer and Principal Financial and Accounting Officer, MainStay MacKay DefinedTerm Municipal Opportunities Fund (since 2011) and MainStay VP Funds Trust (since 2007)**; and Assistant Treasurer, New York Life Investment Management Holdings LLC (2008 to 2012) |
| | | | Kevin M. Bopp 1969 | | Vice President and Chief Compliance Officer, MainStay Funds and MainStay Funds Trust (since 2014) | | Chief Compliance Officer, New York Life Investment Management LLC, IndexIQ Trust, IndexIQ ETF Trust and IndexIQ Active ETF Trust (since 2016), Director and Associate General Counsel (2011 to 2014) and Vice President and Assistant General Counsel (2010 to 2011), New York Life Investment Management LLC; Vice President and Chief Compliance Officer, MainStay VP Funds Trust, MainStay MacKay DefinedTerm Municipal Opportunities Fund (since 2014); Assistant Secretary, MainStay Funds, MainStay Funds Trust and MainStay VP Funds Trust (2010 to 2014)**, MainStay MacKay DefinedTerm Municipal Opportunities Fund (2011 to 2014) |
| | | | J. Kevin Gao 1967 | | Secretary and Chief Legal Officer, MainStay Funds and MainStay Funds Trust (since 2010) | | Managing Director and Associate General Counsel, New York Life Investment Management LLC (since 2010); Secretary and Chief Legal Officer, MainStay MacKay DefinedTerm Municipal Opportunities Fund (since 2011) and MainStay VP Funds Trust (since 2010)** |
| | | | Scott T. Harrington 1959 | | Vice President—Administration, MainStay Funds (since 2005), MainStay Funds Trust (since 2009) | | Managing Director, New York Life Investment Management LLC (including predecessor advisory organizations) (since 2000); Member of the Board of Directors, New York Life Trust Company (since 2009); Vice President—Administration, MainStay MacKay DefinedTerm Municipal Opportunities Fund (since 2011) and MainStay VP Funds Trust (since 2005)** |
| | * | The officers listed above are considered to be “interested persons” of the MainStay Group of Funds, MainStay VP Funds Trust and MainStay MacKay Defined Term Municipal Opportunities Fund within the meaning of the 1940 Act because of their affiliation with the MainStay Group of Funds, New York Life Insurance Company and/or its affiliates, including New York Life Investment Management LLC, NYLIM Service Company LLC, NYLIFE Securities LLC and/or NYLIFE Distributors LLC, as described in detail in the column captioned “Principal Occupation(s) During Past Five Years.” Officers are elected annually by the Board. |
| | ** | Includes prior service as an Officer of MainStay VP Series Fund, Inc., the predecessor to MainStay VP Funds Trust. |
MainStay Funds
Equity
U.S. Equity
MainStay Epoch U.S. All Cap Fund
MainStay Epoch U.S. Equity Yield Fund
MainStay Large Cap Growth Fund
MainStay MacKay Common Stock Fund
MainStay MacKay Growth Fund
MainStay MacKay S&P 500 Index Fund
MainStay MacKay Small Cap Core Fund1
MainStay MacKay U.S. Equity Opportunities Fund
MainStay MAP Equity Fund
International Equity
MainStay Epoch International Choice Fund
MainStay MacKay International Equity Fund
MainStay MacKay International Opportunities Fund
Emerging Markets Equity
MainStay Candriam Emerging Markets Equity Fund
MainStay MacKay Emerging Markets Equity Fund
Global Equity
MainStay Epoch Capital Growth Fund
MainStay Epoch Global Equity Yield Fund
Fixed Income
Taxable Income
MainStay Candriam Emerging Markets Debt Fund2
MainStay Floating Rate Fund
MainStay Indexed Bond Fund3
MainStay MacKay High Yield Corporate Bond Fund
MainStay MacKay Infrastructure Bond Fund
MainStay MacKay Short Duration High Yield Fund
MainStay MacKay Total Return Bond Fund
MainStay MacKay Unconstrained Bond Fund
Tax-Exempt Income
MainStay MacKay California Tax Free Opportunities Fund4
MainStay MacKay High Yield Municipal Bond Fund
MainStay MacKay Intermediate Tax Free Bond Fund
MainStay MacKay New York Tax Free Opportunities Fund5
MainStay MacKay Short Term Municipal Fund
MainStay MacKay Tax Free Bond Fund
Money Market
MainStay Money Market Fund
Mixed Asset
MainStay Balanced Fund
MainStay Income Builder Fund
MainStay MacKay Convertible Fund
Speciality
MainStay Cushing Energy Income Fund
MainStay Cushing MLP Premier Fund
MainStay Cushing Renaissance Advantage Fund
Asset Allocation
MainStay Conservative Allocation Fund
MainStay Growth Allocation Fund
MainStay Moderate Allocation Fund
MainStay Moderate Growth Allocation Fund
Manager
New York Life Investment Management LLC
New York, New York
Subadvisors
Candriam Belgium S.A.6
Brussels, Belgium
Candriam Luxembourg S.C.A.6
Strassen, Luxembourg
Cushing Asset Management, LP
Dallas, Texas
Epoch Investment Partners, Inc.
New York, New York
MacKay Shields LLC6
New York, New York
Markston International LLC
White Plains, New York
NYL Investors LLC6
New York, New York
Winslow Capital Management, LLC
Minneapolis, Minnesota
Legal Counsel
Dechert LLP
Washington, District of Columbia
Independent Registered Public Accounting Firm
KPMG LLP
Philadelphia, Pennsylvania
| 1. | Formerly known as MainStay Epoch U.S. Small Cap Fund. |
| 2. | Formerly known as MainStay MacKay Emerging Markets Debt Fund. |
| 3. | Effective December 5, 2019, MainStay Indexed Bond Fund was renamed MainStay Short Term Bond Fund. |
| 4. | Class A and Class I shares of this Fund are registered for sale in AZ, CA, MI, NV, OR, TX, UT and WA. Class I shares are registered for sale in CO, FL, GA, HI, ID, MA, MD, NH, NJ and NY. |
| 5. | This Fund is registered for sale in CA, CT, DE, FL, MA, NJ, NY and VT. |
| 6. | An affiliate of New York Life Investment Management LLC. |
Not part of the Annual Report
For more information
800-624-6782
nylinvestments.com/funds
“New York Life Investments” is both a service mark, and the common trade name, of the investment advisors affiliated with New York Life Insurance Company. The MainStay Funds® are managed by New York Life Investment Management LLC and distributed by NYLIFE Distributors LLC, 30 Hudson Street, Jersey City, NJ 07302, a wholly owned subsidiary of New York Life Insurance Company. NYLIFE Distributors LLC is a Member FINRA/SIPC.
©2019 NYLIFE Distributors LLC. All rights reserved.
| | |
| 1717044 MS159-19 | | MSUB11-12/19 (NYLIM) NL217 |
MainStay MacKay Infrastructure Bond Fund (Formerly known as MainStay MacKay Government Fund)
Message from the President and Annual Report
October 31, 2019

Beginning on January 1, 2021, paper copies of each MainStay Fund’s annual and semiannual shareholder reports will no longer be sent by mail, unless you specifically request paper copies of the reports from MainStay Funds or from your financial intermediary. Instead, the reports will be made available on the MainStay Funds’ website. You will be notified by mail and provided with a website address to access the report each time a new report is posted to the website.
If you already elected to receive shareholder reports electronically, you will not be affected by this change and you need not take any action. At any time, you may elect to receive reports and other communications from MainStay Funds electronically by calling toll-free 800-624-6782, by sending an e-mail to MainStayShareholderServices@nylim.com, or by contacting your financial intermediary.
You may elect to receive all future shareholder reports in paper form free of charge. If you hold shares of a MainStay Fund directly, you can inform MainStay Funds that you wish to receive paper copies of reports by calling toll-free 800-624-6782 or by sending an e-mail to MainStayShareholderServices@nylim.com. If you hold shares of a MainStay Fund through a financial intermediary, please contact the financial intermediary to make this election. Your election to receive reports in paper form will apply to all MainStay Funds in which you are invested and may apply to all funds held with your financial intermediary.
| | | | | | | | |
| | | | | |
| Not FDIC/NCUA Insured | | Not a Deposit | | May Lose Value | | No Bank Guarantee | | Not Insured by Any Government Agency |

This page intentionally left blank
Message from the President
Stock and bond markets generally gained ground during the12-month reporting period ended October 31, 2019, despite concerns regarding slowing U.S. and global economic growth and international trade conflicts.
After trending higher in November 2018, U.S. stocks and bonds dipped sharply in December 2018, over concerns regarding the pace of economic growth, a U.S. government shutdown and the potential impact of trade disputes between the United States and other nations, particularly China. U.S. markets recovered quickly in 2019 as trade tensions eased, the government reopened and the U.S. Federal Reserve Board (“Fed”) adopted a more accommodative tone regarding the future direction of interest rates. A wide spectrum of equity and fixed-income sectors gained ground through April 2019. Mixed macroeconomic signals and the inability of China and the United States to reach a trade agreement caused the market’s recovery to suffer during the spring and summer months of 2019. However, accommodative monetary policies from several central banks, including a series of interest rate cuts by the Fed, along with better-than-expected corporate earnings reassured investors and enabled markets to resume their advance.
Persistent, albeit slow, U.S. economic growth underpinned the U.S. stock market’s advance during the reporting period, positioning major U.S. equity indices to reach record territory by late October 2019. Sector strength shifted as investor sentiment alternated betweenrisk-on andrisk-off positions. In general, for the reporting period, cyclical, growth-oriented stocks outperformed their value-oriented counterparts by a small margin, with the information technology sector leading thelarge-cap S&P 500® Index. However, the traditionally more defensive areas of real estate and utilities generated above-average performance as well. Communication services, consumer discretionary, industrials and consumer staples performed in the middle of the pack, while materials, financials and health care lagged. Only the energy sector suffered declines, undermined by weak oil prices and concerns about future energy demand.
In the fixed-income markets, slowing economic growth, modest inflation and the Fed’s interest rate cuts created an environment of falling yields and rising prices for most bonds, with many areas of the market offering historically low yields by the end of the reporting period. Higher-credit-quality, longer-duration securities generally produced strong returns, with investment-
grade corporates and long-term Treasury bonds delivering particularly strong performance. A similar dynamic characterized the performance of the municipal bond market, with longer-term, higher-grade issues performing relatively well. On average, municipal bonds roughly matched the gains of corporate issues while providingtax-advantaged returns for eligible investors.
International stock and bond markets tended to underperform their U.S. counterparts, constrained by lackluster economic growth in the Eurozone and dramatically slowing growth in China and related parts of Asia amid persistent trade tensions with the United States. Uncertainties surrounding the unending Brexit drama took a further toll on investor confidence, with Britain seemingly unable to resolve its internal conflicts over how, or whether, to exit from the European Union. Nevertheless, on average, international securities delivered modestly positive returns, bolstered by the accommodative monetary policies implemented by European and Asian central banks. Bonds from both emerging and developed markets generally produced stronger returns than equities while repeating the pattern of outperformance by higher-quality, longer-term instruments seen in the United States.
As the economic growth cycle lengthens, investors are left to ponder how best to position their portfolios for an uncertain future. When the yield curve inverted earlier this year prompting concerns of a potential recession, we were reminded that the direction of the economy is continually subject to change, and perceptions of the economy can shift even more rapidly. As a MainStay investor, you can rely on us to manage our Funds with unflagging energy and dedication so that you can remain focused on your long-term objectives in the face of uncertainty and change. Our goal remains to provide you with the consistently reliable financial tools you need to achieve your long-term objectives.
Sincerely,

Kirk C. Lehneis
President
The opinions expressed are as of the date of this report and are subject to change. There is no guarantee that any forecast made will come to pass. This material does not constitute investment advice and is not intended as an endorsement of any specific investment. Past performance is no guarantee of future results.
Not part of the Annual Report
Table of Contents
Investors should refer to the Fund’s Summary Prospectus and/or Prospectus and consider the Fund’s investment objectives, strategies, risks, charges and expenses carefully before investing. The Summary Prospectus and/or Prospectus contain this and other information about the Fund. You may obtain copies of the Fund’s Summary Prospectus, Prospectus and Statement of Additional Information free of charge, upon request, by calling toll-free 800-624-6782, by writing to NYLIFE Distributors LLC, Attn: MainStay Marketing Department, 30 Hudson Street, Jersey City, NJ 07302 or by sending ane-mail to MainStayShareholderServices@nylim.com. These documents are also available via the MainStay Funds’ website at nylinvestments.com/funds. Please read the Summary Prospectus and/or Prospectus carefully before investing.
Investment and Performance Comparison1(Unaudited)
Performance data quoted represents past performance. Past performance is no guarantee of future results. Because of market volatility and other factors, current performance may be lower or higher than the figures shown. Investment return and principal value will fluctuate, and as a result, when shares are redeemed, they may be worth more or less than their original cost. The graph below depicts the historical performance of Class B shares2 of the Fund. Performance will vary from class to class based on differences in class-specific expenses and sales charges. For performance information current to the most recent month-end, please call 800-624-6782 or visit nylinvestments.com/funds.
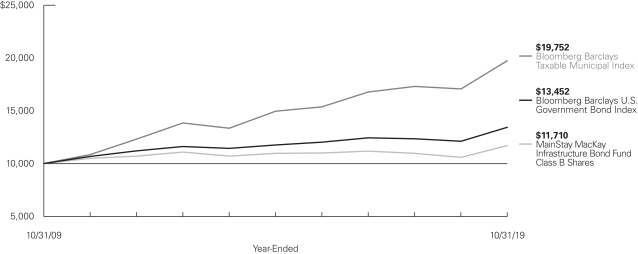
Average Annual Total Returns for the Year-Ended October 31, 2019
| | | | | | | | | | | | | | | | | | | | | | | | |
| Class | | Sales Charge | | | | Inception
Date | | | One
Year | | | Five Years | | | Ten Years | | | Gross
Expense
Ratio3 | |
| | | | | | | |
| Class A Shares | | Maximum 4.5% Initial Sales Charge | | With sales charges Excluding sales charges | |
| 1/3/1995
|
| |
| 6.73
11.76 | %
| |
| 1.43
2.36 | %
| |
| 2.11
2.58 | %
| |
| 1.04
1.04 | %
|
| Investor Class Shares | | Maximum 4.5% Initial Sales Charge | | With sales charges Excluding sales charges | |
| 2/28/2008
|
| |
| 6.35
11.36 |
| |
| 1.14
2.08 |
| |
| 1.88
2.35 |
| |
| 1.44
1.44 |
|
| Class B Shares2 | | Maximum 5% CDSC if Redeemed Within the First
Six Years of Purchase | | With sales charges Excluding sales charges | |
| 5/1/1986
|
| |
| 5.46
10.46 |
| |
| 0.92
1.30 |
| |
| 1.59
1.59 |
| |
| 2.19
2.19 |
|
| Class C Shares | | Maximum 1% CDSC if Redeemed Within One Year of Purchase | | With sales charges Excluding sales charges | |
| 9/1/1998
|
| |
| 9.59
10.59 |
| |
| 1.32
1.32 |
| |
| 1.59
1.59 |
| |
| 2.19
2.19 |
|
| Class I Shares | | No Sales Charge | | | | | 1/2/2004 | | | | 11.95 | | | | 2.62 | | | | 2.84 | | | | 0.79 | |
| 1. | The performance table and graph do not reflect the deduction of taxes that a shareholder would pay on distributions or Fund share redemptions. Total returns reflect maximum applicable sales charges as indicated in the table above, if any, changes in share price, and reinvestment of dividend and capital gain distributions. The graph assumes the initial investment amount shown above and reflects the deduction of all sales charges that would have applied for the period of investment. Performance figures may reflect certain fee waivers and/or expense limitations, without which total returns may have |
| | been lower. For more information on share classes and current fee waivers and/or expense limitations (if any), please refer to the Notes to Financial Statements. |
| 2. | Class B shares are closed to all new purchases as well as additional investments by existing Class B shareholders. |
| 3. | The gross expense ratios presented reflect the Fund’s “Total Annual Fund Operating Expenses” from the most recent Prospectus and may differ from other expense ratios disclosed in this report. |
The footnotes on the next page are an integral part of the table and graph and should be carefully read in conjunction with them.
| | | | | | | | | | | | |
| Benchmark Performance | | One Year | | | Five
Years | | | Ten
Years | |
| | | |
Bloomberg Barclays Taxable Municipal Index4 | | | 15.63 | % | | | 5.71 | % | | | 7.04 | % |
| | | |
Bloomberg Barclays U.S. Government Bond Index5 | | | 10.99 | | | | 2.72 | | | | 3.01 | |
Morningstar Intermediate Core Bond Category Average6 | | | 10.47 | | | | 2.85 | | | | 3.56 | |
| 4. | The Bloomberg Barclays Taxable Municipal Index is the Fund’s primary broad-based securities market index for comparison purposes. The Bloomberg Barclays Taxable Municipal Index is a rules-based, market-value-weighted index engineered for the long-term taxable bond market. Results assume reinvestment of all income and capital gains. An investment cannot be made directly in an index. |
| 5. | Prior to February 28, 2019, the Bloomberg Barclays U.S. Government Bond Index was the Fund’s primary benchmark. The Bloomberg Barclays U.S. Government Bond Index consists of publicly issued debt of the U.S. Treasury and government agencies. Results assume reinvestment of all income and capital gains. An investment cannot be made directly in an index. |
| 6. | The Morningstar Intermediate Core Bond Category Average is representative of funds that invest primarily in investment-grade U.S. fixed-income issues including government, corporate, and securitized debt, and hold less than 5% in below-investment-grade exposures. Their durations (a measure of interest-rate sensitivity) typically range between 75% and 125% of the three-year average of the effective duration of the Morningstar Core Bond Index. Results are based on average total returns of similar funds with all dividends and capital gain distributions reinvested. |
The footnotes on the preceding page are an integral part of the table and graph and should be carefully read in conjunction with them.
| | |
| 6 | | MainStay MacKay Infrastructure Bond Fund |
Cost in Dollars of a $1,000 Investment in MainStay MacKay Infrastructure Bond Fund (Unaudited)
The example below is intended to describe the fees and expenses borne by shareholders during the six-month period from May 1, 2019, to October 31, 2019, and the impact of those costs on your investment.
Example
As a shareholder of the Fund you incur two types of costs: (1) transaction costs, including exchange fees and sales charges (loads) on purchases (as applicable), and (2) ongoing costs, including management fees, distribution and/or service (12b-1) fees, and other Fund expenses (as applicable). This example is intended to help you understand your ongoing costs (in dollars) of investing in the Fund and to compare these costs with the ongoing costs of investing in other mutual funds. The example is based on an investment of $1,000 made at the beginning of the six-month period and held for the entire period from May 1, 2019, to October 31, 2019.
This example illustrates your Fund’s ongoing costs in two ways:
Actual Expenses
The second and third data columns in the table below provide information about actual account values and actual expenses. You may use the information in these columns, together with the amount you invested, to estimate the expenses that you paid during the six months ended October 31, 2019. Simply divide your account value by $1,000 (for example, an $8,600 account value divided by $1,000 = 8.6), then
multiply the result by the number under the heading entitled “Expenses Paid During Period” to estimate the expenses you paid on your account during this period.
Hypothetical Example for Comparison Purposes
The fourth and fifth data columns in the table below provide information about hypothetical account values and hypothetical expenses based on the Fund’s actual expense ratio and an assumed rate of return of 5% per year before expenses, which is not the Fund’s actual return. The hypothetical account values and expenses may not be used to estimate the actual ending account balances or expenses you paid for the six
-month period shown. You may use this information to compare the ongoing costs of investing in the Fund with the ongoing costs of investing in other mutual funds. To do so, compare this 5% hypothetical example with the 5% hypothetical examples that appear in the shareholder reports of the other mutual funds.
Please note that the expenses shown in the table are meant to highlight your ongoing costs only and do not reflect any transactional costs, such as exchange fees or sales charges (loads). Therefore, the fourth and fifth data columns of the table are useful in comparing ongoing costs only and will not help you determine the relative total costs of owning different funds. In addition, if these transactional costs were included, your costs would have been higher.
| | | | | | | | | | | | | | | | | | | | | | |
| | | | | | | | | | | | | | | | | | |
| Share Class | | Beginning
Account
Value
5/1/19 | | | Ending Account
Value (Based
on Actual
Returns and
Expenses)
10/31/19 | | | Expenses
Paid
During
Period1 | | | Ending Account
Value (Based on Hypothetical
5% Annualized
Return and
Actual Expenses)
10/31/19 | | | Expenses
Paid
During
Period1 | | | Net Expense
Ratio
During
Period2 |
| | | | | | |
| Class A Shares | | $ | 1,000.00 | | | $ | 1,070.20 | | | $ | 4.44 | | | $ | 1,020.92 | | | $ | 4.33 | | | 0.85% |
| | | | | | |
| Investor Class Shares | | $ | 1,000.00 | | | $ | 1,068.20 | | | $ | 6.05 | | | $ | 1,019.36 | | | $ | 5.90 | | | 1.16% |
| | | | | | |
| Class B Shares | | $ | 1,000.00 | | | $ | 1,063.20 | | | $ | 9.93 | | | $ | 1,015.63 | | | $ | 9.70 | | | 1.91% |
| | | | | | |
| Class C Shares | | $ | 1,000.00 | | | $ | 1,064.40 | | | $ | 9.94 | | | $ | 1,015.58 | | | $ | 9.70 | | | 1.91% |
| | | | | | |
| Class I Shares | | $ | 1,000.00 | | | $ | 1,069.80 | | | $ | 3.08 | | | $ | 1,022.23 | | | $ | 3.01 | | | 0.59% |
| 1. | Expenses are equal to the Fund’s annualized expense ratio of each class multiplied by the average account value over the period, divided by 365 and multiplied by 184 (to reflect the six-month period). The table above represents the actual expenses incurred during the six-month period. In addition to the fees and expenses which the Fund bears directly, it also indirectly bears a pro rata share of the fees and expenses of the underlying funds in which it invests. Such indirect expenses are not included in the above-reported expense figures. |
| 2. | Expenses are equal to the Fund’s annualized expense ratio to reflect the six-month period. |
Portfolio Composition as of October 31, 2019(Unaudited)

See Portfolio of Investments beginning on page 12 for specific holdings within these categories. The Fund’s holdings are subject to change.
Top Ten Issuers Held as of October 31, 2019(excluding short-term investment)(Unaudited)
| 1. | Montefiore Obligated Group, 5.246%, due 11/1/48 |
| 2. | County of Cook IL, Build America Bonds, Unlimited General Obligation, 6.229%–6.36%, due 11/15/33–11/15/34 |
| 3. | City of Chicago IL, Unlimited General Obligation, 5.432%–7.781%, due 1/1/35–1/1/44 |
| 4. | County of Miami-Dade FL Aviation, Revenue Bonds, 3.275%–4.28, due 10//29–10/1/41 |
| 5. | Oneida County NY Local Development Corp., Mohawk Valley Health System Project, Revenue Bonds, 2.499%–2.549%, due 12/1/23–12/1/24 |
| 6. | New Jersey Economic Development Authority, 7.398%, due 2/15/29 |
| 7. | Kaukauna Electric Systems, Revenue Bonds, 2.70%–2.80%, due 12/15/31–12/15/33 |
| 8. | Rogers Memorial Hospital, Inc. 2.631%–3.792%, due 7/1/26–7/1/39 |
| 9. | Kenton County Airport Board, Senior Customer Facility Charge, Revenue Bonds, 4.489%–4.689%, due 1/1/39–1/1/49 |
| 10. | Municipal Electric Authority of Georgia, Build America Bonds, Plant Vogtle Project, Revenue Bonds, 6.637%–6.655%, due 4/1/57 |
| | |
| 8 | | MainStay MacKay Infrastructure Bond Fund |
Portfolio Management Discussion and Analysis(Unaudited)
Questions answered by portfolio managers Dan Roberts, PhD, Louis N. Cohen, CFA, Steven H. Rich, PhD, Stephen R. Cianci, CFA, and Neil Moriarty, III (“Government Fund Team”) and John Loffredo, CFA, Robert DiMella, CFA, Michael Petty, David Dowden, Scott Sprauer, Frances Lewis, Robert Burke and John Lawlor (“Infrastructure Bond Fund Team”) of MacKay Shields LLC, the Fund’s Subadvisor.
How did MainStay MacKay Infrastructure Bond Fund perform relative to its benchmarks and peer group during the 12 months ended October 31, 2019?
For the 12 months ended October 31, 2019, Class I shares of MainStay MacKay Infrastructure Bond Fund returned 11.95%, underperforming the 15.63% return of the Fund’s primary benchmark, the Bloomberg Barclays Taxable Municipal Index. Over the same period, Class I shares outperformed the 10.99% return of the Bloomberg Barclays U.S. Government Bond Index, which is the Fund’s former primary benchmark, and the 10.47% return of the Morningstar Intermediate Core Bond Category Average.1
Were there any changes to the Fund during the reporting period?
Effective February 28, 2019, the Fund was renamed MainStay MacKay Infrastructure Bond Fund and the Fund’s principal investment strategies, primary benchmark and contractual expense limitation agreement were modified, among other changes. Also effective that date, John Loffredo, Robert DiMella, Michael Petty, David Dowden, Scott Sprauer, Frances Lewis, Robert Burke and John Lawlor were added as portfolio managers of the Fund. Dan Roberts, Steven Rich, Stephen Cianci and Neil Moriarty were removed as portfolio managers of the Fund that same day. For more information about these and other changes, refer to the supplement dated December 14, 2018. Effective December 31, 2018, Louis Cohen no longer served as a portfolio manager of the Fund. For more information about that change, refer to the supplement dated October 18, 2018.
What factors affected the Fund’s relative performance during the reporting period?
Government Fund Team
The Government Fund Team managed the Fund from November 1, 2018, through February 27, 2019. During this portion of the reporting period, the Fund’s shorter duration2 detracted from performance, relative to the Bloomberg Barclays U.S. Government Bond Index, which was the Fund’s primary benchmark at that time.
During the final months of 2018, investors speculated that tighter monetary policy might push the economy into a recession. In response, Treasury bond yields fell sharply across much of the yield curve.3 The Federal Reserve (“Fed”) validated this view in early 2019 when it concluded that the Fed funds benchmark rate had risen to a level consistent with its policy objectives. More modest declines on the long end of the yield curve reflected restrained inflation, trade policy in flux and aggregate demand failing to pressure resource capacity.
The positive momentum of the stock market in early 2019 reflected cautious optimism regarding the durability of the current business cycle. Swayed by similar effects, corporate bond spreads4 tightened during this portion of the reporting period, as did spreads of credit-related securitized product (asset-backed and commercial mortgage-backed securities). The wider spreads of agency residential mortgage-backed securities were outliers during this portion of the reporting period, as the sector was roiled by volatile interest rates.
Infrastructure Bond Fund Team
The Infrastructure Bond Fund Team managed the Fund from February 28, 2019, through October 31, 2019. During this portion of the reporting period, the most significant detractor from performance—relative to the Fund’s new primary benchmark, the Bloomberg Barclays Taxable Municipal Index—was the Fund’s underweight allocation to the state general obligation sector. Underweight exposure to bonds maturing 10 years and longer further detracted from relative performance. These underperforming areas were offset to a degree by security selection in the industrial revenue sector and the strong performance of the Fund’sA-rated holdings.5
What was the Fund’s duration strategy during the reporting period?
Government Fund Team
During the portion of the reporting period in which the Government Fund Team managed the Fund, the Fund maintained a shorter duration than the Bloomberg Barclays U.S. Government Bond Index to buffer against higher Treasury yields. The Fund’s duration was lowered by swapping mortgage-backed securities into Treasury notes of shorter duration.
| 1. | See page 5 for other share class returns, which may be higher or lower than Class I share returns. See page 6 for more information on benchmark and peer group returns. |
| 2. | Duration is a measure of the price sensitivity of a fixed-income investment to changes in interest rates. Duration is expressed as a number of years and is considered a more accurate sensitivity gauge than average maturity. |
| 3. | The yield curve is a line that plots the yields of various securities of similar quality—typically U.S. Treasury issues—across a range of maturities. The U.S. Treasury yield curve serves as a benchmark for other debt and is used in economic forecasting. |
| 4. | The terms “spread” and “yield spread” may refer to the difference in yield between a security or type of security and comparable U.S. Treasury issues. The terms may also refer to the difference in yield between two specific securities or types of securities at a given time. |
| 5. | An obligation rated ‘A’ by Standard & Poor’s (“S&P”) is deemed by S&P to be somewhat more susceptible to the adverse effects of changes in circumstances and economic conditions than obligations in higher-rated categories. In the opinion of S&P, however, the obligor’s capacity to meet its financial commitment on the obligation is still strong. When applied to Fund holdings, ratings are based solely on the creditworthiness of the bonds in the portfolio and are not meant to represent the security or safety of the Fund. |
Infrastructure Bond Fund Team
The Fund continued to maintain a shorter-duration bias from February 28, 2019, through October 31, 2019. As of the end of the reporting period, the Fund’s modified duration to worst6 was 6.45 years compared with 8.85 years for the Bloomberg Barclays Taxable Municipal Index.
During the reporting period, which sectors were the strongest positive contributors to the Fund’s relative performance and which sectors were particularly weak?
Government Fund Team
During the portion of the reporting period in which the Government Fund Team managed the Fund, the Fund’s Treasury positions contributed positively to performance relative to the Bloomberg Barclays U.S. Government Bond Index. (Contributions take weightings and total returns into account.) Over the same portion of the reporting period, the Fund’s shorter-duration, mortgage-related positions detracted from relative performance.
Infrastructure Bond Fund Team
During the portion of the reporting period in which the Infrastructure Bond Fund Team managed the Fund, security selection in the local general obligation and industrial revenue sectors, along with leasing sector holdings, provided the strongest positive contributions to the Fund’s performance relative to the Bloomberg Barclays Taxable Municipal Index. Conversely, underweight allocation to the state general obligation sector proved the most significant detractor from relative performance, and holdings in the water/sewer and transportation sectors undermined relative performance as well. From a state perspective, the Fund’s overweight allocation to Illinois bonds enhanced relative performance, while underweight exposure and a shorter duration profile to California, Texas and New York hurt relative performance. Other detractors from relative performance included the Fund’sAAA- andAA-rated bonds, as well as bonds maturing in 10 years and longer, which suffered as interest rates fell precipitously.7
What were some of the Fund’s largest purchases and sales during the reporting period?
Government Fund Team
As short- and intermediate-duration Treasury yields rose at the beginning of the reporting period, the Fund rotated assets from mortgage-backed securities to Treasury bonds.
Infrastructure Bond Fund Team
Early in the portion of the reporting period in which the Infrastructure Bond Fund Team managed the Fund, we sold the Fund’s mortgage-backed securities and Treasury bonds and began buying infrastructure-related debt securities, transitioning toward the Fund’s target of holding at least 60% of assets in taxable municipal debt securities. As we achieved that goal, we focused on diversification of Fund holdings while maintaining an overall allocation of 80% of Fund assets in infrastructure-related securities.
How did the Fund’s sector weightings change during the reporting period?
Government Fund Team
During the portion of the reporting period in which the Government Fund Team managed the Fund, the Fund increased its exposure to Treasury notes by decreasing its allocation to mortgage-backed securities. Weightings in the other bond sectors remained stable. However, the Fund’s cash position increased in preparation for the change in the Fund’s principal investment strategies.
Infrastructure Bond Fund Team
During the portion of the reporting period in which the Infrastructure Bond Fund Team managed the Fund, the Fund transitioned to its new strategy emphasizing actively managed, infrastructure-related debt securities. Most notably, the Fund decreased itsout-of-benchmark positions in areas such as Treasury bonds and mortgage-backed securities. Among municipal sectors, the Fund increased its allocation to education and hospital holdings, and decreased its exposure to industrial revenue and special tax.
| 6. | Modified duration is inversely related to the approximate percentage change in price for a given change in yield. Duration to worst is the duration of a bond computed using the bond’s nearest call date or maturity, whichever comes first. This measure ignores future cash flow fluctuations due to embedded optionality. |
| 7. | An obligation rated ‘AAA’ has the highest rating assigned by S&P, and in the opinion of S&P, the obligor’s capacity to meet its financial commitment on the obligation is extremely strong. An obligation rated ‘AA’ by S&P is deemed by S&P to differ from the highest-rated obligations only to a small degree. In the opinion of S&P, the obligor’s capacity to meet its financial commitment on the obligation is very strong. When applied to Fund holdings, ratings are based solely on the creditworthiness of the bonds in the portfolio and are not meant to represent the security or safety of the Fund. |
| | |
| 10 | | MainStay MacKay Infrastructure Bond Fund |
How was the Fund positioned at the end of the reporting period?
As of October 31, 2019, the Fund held its largest overweight positions relative to the Bloomberg Barclays Taxable Municipal Index in the hospital sector, and its most significant underweight exposure to the state general obligation and special tax sectors. Among states, the Fund held overweight exposure to Illinois bonds, and underweight exposure to securities from California and New York. Regarding credit quality, the Fund held a relatively large position inA-rated securities, and underweight positions inAAA- andAA-rated bonds.
The opinions expressed are those of the portfolio managers as of the date of this report and are subject to change. There is no guarantee that any forecasts will come to pass. This material does not constitute investment advice and is not intended as an endorsement of any specific investment.
Portfolio of InvestmentsOctober 31, 2019
| | | | | | | | |
| | | Principal
Amount | | | Value | |
Long-Term Bonds 92.2%† Asset-Backed Securities 0.2% | |
Utilities 0.2% | |
Atlantic City Electric Transition Funding LLC
Series 2002-1, Class A4
5.55%, due 10/20/23 | | $ | 692,573 | | | $ | 717,708 | |
| | | | | | | | |
Total Asset-Backed Securities
(Cost $700,738) | | | | | | | 717,708 | |
| | | | | | | | |
|
| Corporate Bonds 12.1% | |
Commercial Services 1.6% | |
Oberlin College
3.685%, due 8/1/49 | | | 2,000,000 | | | | 2,139,734 | |
YMCA of Greater New York
5.021%, due 8/1/38 | | | 2,440,000 | | | | 2,762,066 | |
| | | | | | | | |
| | | | | | | 4,901,800 | |
| | | | | | | | |
Electric 0.4% | |
Duke Energy Florida Project Finance LLC
2.538%, due 9/1/31 | | | 1,100,000 | | | | 1,116,649 | |
| | | | | | | | |
|
Health Care—Services 10.1% | |
Adventist Health System
3.378%, due 3/1/23 | | | 1,600,000 | | | | 1,652,834 | |
CommonSpirit Health | | | | | | | | |
3.817%, due 10/1/49 | | | 2,000,000 | | | | 2,000,928 | |
4.187%, due 10/1/49 | | | 2,000,000 | | | | 2,048,904 | |
Jackson Laboratory
4.234%, due 7/1/38 | | | 1,000,000 | | | | 1,086,590 | |
Montefiore Obligated Group | | | | | | | | |
Insured: AGM
5.246%, due 11/1/48 | | | 2,900,000 | | | | 3,529,892 | |
5.246%, due 11/1/48 | | | 3,550,000 | | | | 4,081,128 | |
Providence St. Joseph Health Obligated Group
2.532%, due 10/1/29 | | | 4,000,000 | | | | 3,980,217 | |
Rogers Memorial Hospital, Inc. | | | | | | | | |
2.631%, due 7/1/26 | | | 1,080,000 | | | | 1,074,070 | |
2.988%, due 7/1/29 | | | 505,000 | | | | 499,443 | |
3.188%, due 7/1/31 | | | 640,000 | | | | 631,837 | |
3.792%, due 7/1/39 | | | 2,480,000 | | | | 2,430,208 | |
Sun Health Services
2.98%, due 11/15/27 | | | 2,000,000 | | | | 2,005,676 | |
Toledo Hospital | | | | | | | | |
5.325%, due 11/15/28 | | | 2,000,000 | | | | 2,190,004 | |
Insured: AGM
5.75%, due 11/15/38 | | | 1,000,000 | | | | 1,167,124 | |
Virginia Mason Medical Center
5.136%, due 8/15/44 | | | 1,500,000 | | | | 1,756,539 | |
| | | | | | | | |
| | | | | | | 30,135,394 | |
| | | | | | | | |
Total Corporate Bonds
(Cost $36,131,388) | | | | | | | 36,153,843 | |
| | | | | | | | |
| | | | | | | | |
| | | Principal
Amount | | | Value | |
| Loan Assignments 0.8% (a) | |
Utilities 0.8% | |
PG&E Corp.
DIP Term Loan
4.24% (1 Month LIBOR + 2.25%), due 12/31/20 | | $ | 2,250,000 | | | $ | 2,247,187 | |
| | | | | | | | |
Total Loan Assignments
(Cost $2,262,999) | | | | | | | 2,247,187 | |
| | | | | | | | |
|
Municipal Bonds 78.3% | |
Arizona 0.2% | |
Arizona Industrial Development Authority, NCCU Properties LLC, Revenue Bonds
Series B, Insured: BAM
3.10%, due 6/1/25 | | | 600,000 | | | | 609,084 | |
| | | | | | | | |
|
Arkansas 1.6% | |
Benton Washington Regional Public Water Authority, Revenue Bonds
Series B, Insured: BAM
2.75%, due 10/1/33 | | | 3,000,000 | | | | 3,007,590 | |
City of Rogers, Sales & Use Tax, Revenue Bonds
Series A
3.828%, due 11/1/25 | | | 1,675,000 | | | | 1,833,288 | |
| | | | | | | | |
| | | | | | | 4,840,878 | |
| | | | | | | | |
California 13.4% | |
Bay Area Toll Authority
Series F-1
2.574%, due 4/1/31 | | | 1,500,000 | | | | 1,491,705 | |
California Educational Facilities Authority, Chapman University, Revenue Bonds
Series A
3.661%, due 4/1/33 | | | 3,300,000 | | | | 3,468,894 | |
California State Educational Facilities Authority, Chapman University, Revenue Bonds
Series A
3.281%, due 4/1/28 | | | 1,000,000 | | | | 1,049,270 | |
California State Educational Facilities Authority, Loyola Marymount University, Revenue Bonds
Series A
4.842%, due 10/1/48 | | | 1,400,000 | | | | 1,569,596 | |
California State Educational Facilities Authority, Santa Clara University, Revenue Bonds
Series A
3.836%, due 4/1/47 | | | 2,500,000 | | | | 2,598,100 | |
| | | | |
| 12 | | MainStay MacKay Infrastructure Bond Fund | | The notes to the financial statements are an integral part of,
and should be read in conjunction with, the financial statements. |
| | | | | | | | |
| | | Principal
Amount | | | Value | |
| Municipal Bonds (continued) | |
California (continued) | | | | | | | | |
City of Oakland CA, Pension Obligation, Revenue Bonds
4.00%, due 12/15/22 | | $ | 2,000,000 | | | $ | 2,099,040 | |
Coachella Valley Unified School District, Unlimited General Obligation
Insured: BAM
3.24%, due 8/1/37 | | | 1,380,000 | | | | 1,399,486 | |
County of Sacramento CA, Pension Funding, Revenue Bonds
Insured: AGM
3.389% (1 Month LIBOR + 1.45 %), due 7/10/30 (a) | | | 2,500,000 | | | | 2,491,925 | |
Covina-Valley Unified School District, Unlimited General Obligation Insured: AGM
3.261%, due 8/1/49 | | | 3,500,000 | | | | 3,439,765 | |
East Bay Municipal Utility District Water System, Build America Bonds, Revenue Bonds
5.874%, due 6/1/40 | | | 1,665,000 | | | | 2,327,570 | |
El Cajon Redevelopment Agency, Tax Allocation
Insured: AGM
7.70%, due 10/1/30 | | | 2,000,000 | | | | 2,638,900 | |
Imperial County Pension Funding, Revenue Bonds
Series A, Insured: AMBAC
6.82%, due 8/15/20 | | | 1,390,000 | | | | 1,432,006 | |
Inglewood Joint Powers Authority, Revenue Bonds
Insured: BAM
3.469%, due 8/1/29 | | | 1,000,000 | | | | 1,075,180 | |
Inland Empire Tobacco Securitization Corp., Revenue Bonds
3.678%, due 6/1/38 | | | 1,500,000 | | | | 1,556,055 | |
Los Angeles Community College District, Election 2008, Unlimited General Obligation
Series B
7.53%, due 8/1/29 | | | 2,250,000 | | | | 3,131,977 | |
Lynwood Housing Authority, Revenue Bonds
4.00%, due 9/1/29 | | | 2,370,000 | | | | 2,445,769 | |
Pasadena Unified School District, Unlimited General Obligation
Insured: AGM
2.881%, due 5/1/37 | | | 2,500,000 | | | | 2,452,750 | |
San Bernardino City Unified School District, Qualified School Construction Bonds, Certificates of Participation
Insured: AGM
7.703%, due 2/1/21 | | | 765,000 | | | | 794,644 | |
| | | | | | | | |
| | | Principal
Amount | | | Value | |
California (continued) | | | | | | | | |
University of California, Revenue Bonds
Series BD
3.349%, due 7/1/29 | | $ | 1,500,000 | | | $ | 1,624,935 | |
Ventura County Community College District, Unlimited General Obligation
2.417%, due 8/1/30 | | | 1,000,000 | | | | 996,480 | |
| | | | | | | | |
| | | | | | | 40,084,047 | |
| | | | | | | | |
Colorado 1.1% | |
Colorado State Housing & Finance Authority, Revenue Bonds
Series G-1, Insured: GNMA
3.65%, due 11/1/46 | | | 1,080,000 | | | | 1,124,744 | |
Denver City & County Housing Authority, Intergovernmental Agreement, Revenue Bonds
3.237%, due 12/1/38 | | | 1,175,000 | | | | 1,182,802 | |
University of Colorado, Revenue Bonds
Series A-2
2.615%, due 6/1/37 | | | 1,000,000 | | | | 982,270 | |
| | | | | | | | |
| | | | | | | 3,289,816 | |
| | | | | | | | |
Connecticut 3.1% | |
City of Bridgeport CT, Unlimited General Obligation | | | | | | | | |
Series D, Insured: BAM
2.913%, due 9/15/28 | | | 1,650,000 | | | | 1,655,593 | |
Series D, Insured: BAM
3.163%, due 9/15/31 | | | 2,500,000 | | | | 2,508,750 | |
Connecticut Airport Authority, Ground Transportation Center Project, Revenue Bonds | | | | | | | | |
Series B
3.024%, due 7/1/25 | | | 2,045,000 | | | | 2,130,420 | |
Series B
4.282%, due 7/1/45 | | | 1,500,000 | | | | 1,616,835 | |
State of Connecticut, Unlimited General Obligation
Series A
5.85%, due 3/15/32 | | | 1,000,000 | | | | 1,325,030 | |
| | | | | | | | |
| | | | | | | 9,236,628 | |
| | | | | | | | |
Delaware 0.2% | |
Delaware Municipal Electric Corp., Middletown & Seaford Projects, Revenue Bonds
Series B, Insured: BAM
4.35%, due 10/1/34 | | | 500,000 | | | | 536,835 | |
| | | | | | | | |
|
Florida 2.5% | |
City of Miami FL, Street & Sidewalk Improvement Program, Revenue Bonds
Series B, Insured: AGM
4.592%, due 1/1/33 (b) | | | 1,115,000 | | | | 1,247,506 | |
| | | | | | |
The notes to the financial statements are an integral part of,
and should be read in conjunction with, the financial statements. | | | | | 13 | |
Portfolio of InvestmentsOctober 31, 2019 (continued)
| | | | | | | | |
| | | Principal
Amount | | | Value | |
| Municipal Bonds (continued) | |
Florida (continued) | | | | | | | | |
County of Miami-Dade FL Aviation, Revenue Bonds | | | | | | | | |
Series B
3.275%, due 10/1/29 | | $ | 2,715,000 | | | $ | 2,875,484 | |
Series C
4.28%, due 10/1/41 | | | 3,000,000 | | | | 3,269,310 | |
| | | | | | | | |
| | | | | | | 7,392,300 | |
| | | | | | | | |
Georgia 1.7% | |
Municipal Electric Authority of Georgia, Build America Bonds, Plant Vogtle Project, Revenue Bonds | | | | | | | | |
6.637%, due 4/1/57 | | | 2,201,000 | | | | 3,088,487 | |
Insured: AGM
6.655%, due 4/1/57 | | | 750,000 | | | | 1,104,848 | |
Valdosta & Lowndes County Hospital Authority, Revenue Bonds
Series B
3.441%, due 10/1/41 | | | 1,000,000 | | | | 1,023,060 | |
| | | | | | | | |
| | | | | | | 5,216,395 | |
| | | | | | | | |
Hawaii 0.5% | |
Hawaii Airports Systems, Revenue Bonds
Series A
3.14%, due 7/1/47 | | | 1,500,000 | | | | 1,457,100 | |
| | | | | | | | |
|
Illinois 10.6% | |
City of Chicago IL, Unlimited General Obligation | | | | | | | | |
Series B, Insured: BAM
5.432%, due 1/1/42 | | | 675,000 | | | | 786,571 | |
Series B, Insured: BAM
6.034%, due 1/1/42 | | | 745,000 | | | | 974,289 | |
Series B, Insured: BAM
6.314%, due 1/1/44 | | | 1,000,000 | | | | 1,340,510 | |
Series C1, Insured: BAM
7.781%, due 1/1/35 | | | 2,195,000 | | | | 3,211,109 | |
Cook County High School District No. 201, Qualified School Construction Bonds, Limited General Obligation
Insured: BAM
4.845%, due 12/1/41 | | | 950,000 | | | | 1,173,364 | |
Cook County School District No. 89 Maywood, Unlimited General Obligation
Series C, Insured: AGM
6.50%, due 12/15/20 | | | 400,000 | | | | 409,896 | |
County of Cook IL, Build America Bonds, Unlimited General Obligation | | | | | | | | |
Series B, Insured: AGM
6.229%, due 11/15/34 | | | 1,725,000 | | | | 2,345,586 | |
Series D
6.229%, due 11/15/34 | | | 1,611,000 | | | | 2,168,712 | |
| | | | | | | | |
| | | Principal
Amount | | | Value | |
Illinois (continued) | | | | | | | | |
County of Cook IL, Build America Bonds, Unlimited General Obligation (continued) | | | | | | | | |
Series B
6.36%, due 11/15/33 | | $ | 1,500,000 | | | $ | 2,039,295 | |
Lake County Community Unit School District No. 187, Unlimited General Obligation | | | | | | | | |
Series A, Insured: BAM
4.25%, due 1/1/25 | | | 750,000 | | | | 800,603 | |
Series A, Insured: BAM
4.25%, due 1/1/26 | | | 500,000 | | | | 535,260 | |
Series A, Insured: BAM
4.25%, due 1/1/29 | | | 750,000 | | | | 805,635 | |
Series A, Insured: BAM
4.25%, due 1/1/30 | | | 750,000 | | | | 804,442 | |
Sales Tax Securitization Corp., Revenue Bonds | | | | | | | | |
Series A
4.637%, due 1/1/40 | | | 2,000,000 | | | | 2,291,900 | |
Series B
3.82%, due 1/1/48 | | | 680,000 | | | | 704,303 | |
Sangamon County Water Reclamation District, Alternative Revenue Source, Unlimited General Obligation
Series B
2.907%, due 1/1/34 | | | 1,885,000 | | | | 1,862,927 | |
State of Illinois, Build America Bonds, Unlimited General Obligation | | | | | | | | |
5.95%, due 3/1/23 | | | 450,000 | | | | 486,095 | |
Series 3, Insured: AGM
6.725%, due 4/1/35 | | | 1,510,000 | | | | 1,903,400 | |
State of Illinois, Sales Tax, Revenue Bonds
3.00%, due 6/15/25 | | | 3,750,000 | | | | 3,782,437 | |
State of Illinois, Unlimited General Obligation
Series B
4.31%, due 4/1/23 | | | 500,000 | | | | 514,410 | |
Village of Rosemont IL, Corporate Purpose Bond, Unlimited General Obligation
Series B, Insured: AGM
5.00%, due 12/1/46 | | | 2,610,000 | | | | 2,819,870 | |
| | | | | | | | |
| | | | | | | 31,760,614 | |
| | | | | | | | |
Iowa 1.0% | |
PEFA, Inc., Revenue Bonds
5.00%, due 9/1/49 (a) | | | 2,500,000 | | | | 2,941,300 | |
| | | | | | | | |
| | |
Kentucky 2.2% | | | | | | | | |
Kenton County Airport Board, Senior Customer Facility Charge, Revenue Bonds | | | | | | | | |
4.489%, due 1/1/39 | | | 2,500,000 | | | | 2,743,700 | |
4.689%, due 1/1/49 | | | 1,400,000 | | | | 1,554,910 | |
| | | | |
| 14 | | MainStay MacKay Infrastructure Bond Fund | | The notes to the financial statements are an integral part of,
and should be read in conjunction with, the financial statements. |
| | | | | | | | |
| | | Principal
Amount | | | Value | |
| Municipal Bonds (continued) | |
Kentucky (continued) | | | | | | | | |
Kentucky Economic Development Finance Authority, Louisville Arena Project, Revenue Bonds
Series B, Insured: AGM
4.435%, due 12/1/38 | | $ | 2,000,000 | | | $ | 2,170,460 | |
| | | | | | | | |
| | | | | | | 6,469,070 | |
| | | | | | | | |
Maryland 2.1% | |
County of Baltimore MD, Build America Bonds, Unlimited General Obligation
4.90%, due 11/1/32 | | | 1,000,000 | | | | 1,203,090 | |
Maryland Community Development Administration, Department of Housing & Community Development, Revenue Bonds
Series D
2.644%, due 3/1/50 | | | 1,500,000 | | | | 1,490,100 | |
Maryland Economic Development Corp., Seagirt Marine Terminal Project, Revenue Bonds | | | | | | | | |
Series B
4.125%, due 6/1/29 | | | 580,000 | | | | 613,623 | |
Series B
4.125%, due 6/1/30 | | | 500,000 | | | | 528,440 | |
Maryland Stadium Authority, Warehouse Issue, Revenue Bonds
Series B
3.709%, due 3/1/39 | | | 2,250,000 | | | | 2,428,942 | |
| | | | | | | | |
| | | | | | | 6,264,195 | |
| | | | | | | | |
Massachusetts 2.8% | |
City of Worcester, Ballpark Project, Limited General Obligation
4.75%, due 11/15/48 | | | 1,975,000 | | | | 2,195,943 | |
Commonwealth of Massachusetts, Limited General Obligation
Series D
2.813%, due 9/1/43 | | | 1,500,000 | | | | 1,459,740 | |
Massachusetts Development Finance Agency, Lesley University, Revenue Bonds
Series B
3.165%, due 7/1/32 | | | 1,705,000 | | | | 1,734,105 | |
Massachusetts Development Finance Agency, Wellforce Obligated Group, Revenue Bonds
Series B, Insured: AGM
4.496%, due 7/1/33 | | | 2,545,000 | | | | 2,862,056 | |
| | | | | | | | |
| | | | | | | 8,251,844 | |
| | | | | | | | |
Michigan 1.5% | |
Michigan Finance Authority, Local Government Loan Program, Revenue Bonds | | | | | | | | |
Series D
4.92%, due 11/1/39 | | | 1,830,000 | | | | 2,251,449 | |
| | | | | | | | |
| | | Principal
Amount | | | Value | |
Michigan (continued) | | | | | | | | |
Michigan Finance Authority, Local Government Loan Program, Revenue Bonds (continued) | | | | | | | | |
Series E
8.369%, due 11/1/35 | | $ | 715,000 | | | $ | 1,054,675 | |
Michigan Finance Authority, Revenue Bonds
Series C-1
3.585%, due 11/1/35 | | | 1,000,000 | | | | 1,075,690 | |
| | | | | | | | |
| | | | | | | 4,381,814 | |
| | | | | | | | |
Missouri 0.3% | |
Missouri Health & Educational Facilities Authority, A.T. Still University of Health Sciences, Revenue Bonds
Series B
3.985%, due 10/1/40 | | | 1,000,000 | | | | 1,008,300 | |
| | | | | | | | |
|
Nebraska 0.4% | |
Nebraska Public Power District, Revenue Bonds
Series B1
2.593%, due 1/1/29 | | | 1,350,000 | | | | 1,356,170 | |
| | | | | | | | |
|
New Jersey 5.2% | |
Casino Reinvestment Development Authority, Inc., Revenue Bonds
Series B, Insured: NATL-RE
5.46%, due 6/1/25 | | | 2,250,000 | | | | 2,433,262 | |
City of Vineland NJ, Unlimited General Obligation
3.193%, due 4/15/29 | | | 1,175,000 | | | | 1,248,884 | |
New Jersey Economic Development Authority
Insured: AGM
7.398%, due 2/15/29 | | | 4,000,000 | | | | 5,420,560 | |
New Jersey Economic Development Authority, Revenue Bonds
Series A, Insured: NATL-RE
7.425%, due 2/15/29 | | | 1,144,000 | | | | 1,457,948 | |
New Jersey Educational Facilities Authority, Kean University, Revenue Bonds
Series C
3.236%, due 9/1/25 | | | 1,445,000 | | | | 1,506,167 | |
South Jersey Transportation Authority, Revenue Bonds | | | | | | | | |
Series B
3.02%, due 11/1/25 | | | 500,000 | | | | 500,295 | |
Series B
3.12%, due 11/1/26 | | | 500,000 | | | | 500,410 | |
Series B
3.26%, due 11/1/27 | | | 500,000 | | | | 500,550 | |
Series B
3.36%, due 11/1/28 | | | 2,000,000 | | | | 2,002,720 | |
| | | | | | | | |
| | | | | | | 15,570,796 | |
| | | | | | | | |
| | | | | | |
The notes to the financial statements are an integral part of,
and should be read in conjunction with, the financial statements. | | | | | 15 | |
Portfolio of InvestmentsOctober 31, 2019 (continued)
| | | | | | | | |
| | | Principal
Amount | | | Value | |
| Municipal Bonds (continued) | |
New York 7.9% | |
Brooklyn Arena Local Development Corp., Barclays Center Project, Revenue Bonds
Series B, Insured: AGM
4.391%, due 7/15/41 | | $ | 1,500,000 | | | $ | 1,711,185 | |
New York City Transitional Finance Authority, Future Tax Secured, Revenue Bonds Subseries B-3
3.95%, due 8/1/32 | | | 2,570,000 | | | | 2,834,941 | |
New York State Dormitory Authority, Montefiore Obligated Group, Revenue Bonds
Series B, Insured: AGM
4.946%, due 8/1/48 | | | 1,000,000 | | | | 1,096,250 | |
New York State Dormitory Authority, New York University, Revenue Bonds
Series B
4.85%, due 7/1/48 | | | 3,100,000 | | | | 3,524,917 | |
New York State Energy Research & Development Authority, Green, Revenue Bonds | | | | | | | | |
Series A
3.62%, due 4/1/25 | | | 750,000 | | | | 776,452 | |
Series A
3.77%, due 4/1/26 | | | 1,045,000 | | | | 1,082,923 | |
Series A
3.927%, due 4/1/27 | | | 995,000 | | | | 1,033,895 | |
New York State Thruway Authority, Revenue Bonds
Series M
2.90%, due 1/1/35 | | | 2,000,000 | | | | 2,024,520 | |
Oneida County NY Local Development Corp., Mohawk Valley Health System Project, Revenue Bonds | | | | | | | | |
Series B, Insured: AGM
2.499%, due 12/1/23 | | | 3,680,000 | | | | 3,680,000 | |
Series B, Insured: AGM
2.549%, due 12/1/24 | | | 2,455,000 | | | | 2,455,000 | |
Port Authority of New York & New Jersey, Consolidated 159th, Revenue Bonds
Series B
6.04%, due 12/1/29 | | | 620,000 | | | | 815,145 | |
Triborough Bridge & Tunnel Authority, Build America Bonds, Revenue Bonds
Series B
5.42%, due 11/15/36 | | | 2,000,000 | | | | 2,678,360 | |
| | | | | | | | |
| | | | | | | 23,713,588 | |
| | | | | | | | |
North Carolina 0.7% | |
University of North Carolina at Chapel Hill, Revenue Bonds
Series C
3.327%, due 12/1/36 | | | 2,000,000 | | | | 2,178,120 | |
| | | | | | | | |
| | | | | | | | |
| | | Principal
Amount | | | Value | |
Ohio 2.5% | |
American Municipal Power, Inc., Build America Bonds, Revenue Bonds
Series E
6.27%, due 2/15/50 | | $ | 1,920,000 | | | $ | 2,625,542 | |
City of Cleveland OH, Airport System, Revenue Bonds
Series A, Insured: BAM
2.882%, due 1/1/31 | | | 1,400,000 | | | | 1,430,590 | |
JobsOhio Beverage System, Revenue Bonds
Series B
4.532%, due 1/1/35 | | | 225,000 | | | | 269,354 | |
Summit County Development Finance Authority, Franciscan University of Steubenville Project, Revenue Bonds | | | | | | | | |
Series B
5.125%, due 11/1/48 | | | 1,000,000 | | | | 1,094,880 | |
Series A
6.00%, due 11/1/48 (b) | | | 1,750,000 | | | | 2,045,908 | |
| | | | | | | | |
| | | | | | | 7,466,274 | |
| | | | | | | | |
Oregon 0.4% | |
Port of Portland Airport, Portland International Airport, Revenue Bonds
4.067%, due 7/1/39 | | | 1,000,000 | | | | 1,061,110 | |
| | | | | | | | |
|
Pennsylvania 3.3% | |
Authority Improvement Municipalities, Carlow University, Revenue Bonds
Series B
5.00%, due 11/1/53 | | | 1,000,000 | | | | 1,027,210 | |
City of Erie, Unlimited General Obligation
Series A, Insured: AGM
4.04%, due 11/15/36 | | | 500,000 | | | | 533,710 | |
Commonwealth Financing Authority, Revenue Bonds
Series A
3.807%, due 6/1/41 | | | 1,000,000 | | | | 1,094,310 | |
Erie City Water Authority, Revenue Bonds
Series C, Insured: BAM
2.194%, due 12/1/19 | | | 1,220,000 | | | | 1,220,354 | |
Pennsylvania Economic Development Financing Authority, Build America Bonds, Revenue Bonds
Series B
6.532%, due 6/15/39 | | | 1,495,000 | | | | 2,099,682 | |
State Public School Building Authority, School District of Philadelphia Project, Revenue Bonds
Series A
3.196%, due 4/1/31 | | | 4,000,000 | | | | 4,040,200 | |
| | | | | | | | |
| | | | | | | 10,015,466 | |
| | | | | | | | |
| | | | |
| 16 | | MainStay MacKay Infrastructure Bond Fund | | The notes to the financial statements are an integral part of,
and should be read in conjunction with, the financial statements. |
| | | | | | | | |
| | | Principal
Amount | | | Value | |
| Municipal Bonds (continued) | |
Rhode Island 0.4% | |
Rhode Island Commerce Corp., Historic Structures Tax Credit Financing Program, Revenue Bonds
Series A
3.297%, due 5/1/28 | | $ | 1,000,000 | | | $ | 1,057,570 | |
| | | | | | | | |
|
South Carolina 2.1% | |
South Carolina Ports Authority
Series B
4.00%, due 7/1/59 | | | 2,250,000 | | | | 2,416,028 | |
South Carolina Public Service Authority, Revenue Bonds | | | | | | | | |
Series D
2.388%, due 12/1/23 | | | 2,280,000 | | | | 2,297,168 | |
Series E
3.922%, due 12/1/24 | | | 813,000 | | | | 868,918 | |
Series C
6.454%, due 1/1/50 | | | 500,000 | | | | 761,625 | |
| | | | | | | | |
| | | | | | | 6,343,739 | |
| | | | | | | | |
Tennessee 0.5% | |
Metropolitan Government Nashville & Davidson County Health & Educational Facilities Board, Lipscomb University Project, Revenue Bonds
Series B
4.409%, due 10/1/34 | | | 1,280,000 | | | | 1,413,683 | |
| | | | | | | | |
|
Texas 4.0% | |
City of Houston TX, Utility System, Revenue Bonds
Series C
2.255%, due 11/15/29 | | | 1,000,000 | | | | 985,600 | |
City of Houston, Limited General Obligation
Series B
2.366%, due 3/1/28 | | | 2,855,000 | | | | 2,870,389 | |
Gainesville Hospital District, Limited General Obligation
Series A
4.753%, due 8/15/23 | | | 1,520,000 | | | | 1,620,107 | |
North Texas Tollway Authority, Build America Bonds, Revenue Bonds
Series B-2
8.91%, due 2/1/30 | | | 4,000,000 | | | | 4,070,000 | |
Port of Corpus Christi Authority of Nueces County, Revenue Bonds
Series B
4.875%, due 12/1/38 | | | 2,000,000 | | | | 2,296,420 | |
| | | | | | | | |
| | | | | | | 11,842,516 | |
| | | | | | | | |
| | | | | | | | |
| | | Principal
Amount | | | Value | |
Virginia 1.6% | |
Fredericksburg Economic Development Authority, Fredericksburg Stadium Project, Revenue Bonds
Series A
4.00%, due 9/1/29 (b) | | $ | 2,315,000 | | | $ | 2,370,259 | |
Virginia Resources Authority, Infrastructure Revenue, Revenue Bonds
Series C, Insured: Moral Obligation
2.55%, due 11/1/28 | | | 2,550,000 | | | | 2,569,865 | |
| | | | | | | | |
| | | | | | | 4,940,124 | |
| | | | | | | | |
Washington 1.8% | |
Energy Northwest Electric Revenue, Build America Bonds, Bonneville Power Administration, Revenue Bonds
Series B
5.71%, due 7/1/24 | | | 1,000,000 | | | | 1,160,310 | |
Energy Northwest Electric Revenue, Columbia Generating Station, Revenue Bonds
Series B
3.457%, due 7/1/35 | | | 2,000,000 | | | | 2,183,380 | |
Klickitat County WA Public Utility District No. 1, Revenue Bonds | | | | | | | | |
Series B, Insured: AGM
2.803%, due 12/1/29 | | | 700,000 | | | | 699,671 | |
Series B, Insured: AGM
3.688%, due 12/1/38 | | | 1,300,000 | | | | 1,300,078 | |
| | | | | | | | |
| | | | | | | 5,343,439 | |
| | | | | | | | |
West Virginia 1.1% | |
County of Ohio WV, Special District Excise Tax Revenue, The Highlands Project, Revenue Bonds
Series A
4.00%, due 3/1/40 | | | 3,500,000 | | | | 3,431,960 | |
| | | | | | | | |
|
Wisconsin 1.6% | |
Kaukauna Electric Systems, Revenue Bonds | | | | | | | | |
Insured: AGM
2.70%, due 12/15/31 | | | 1,285,000 | | | | 1,281,415 | |
Insured: AGM
2.75%, due 12/15/32 | | | 1,800,000 | | | | 1,774,296 | |
Insured: AGM
2.80%, due 12/15/33 | | | 1,700,000 | | | | 1,673,497 | |
| | | | | | | | |
| | | | | | | 4,729,208 | |
| | | | | | | | |
Total Municipal Bonds
(Cost $226,930,340) | | | | | | | 234,203,983 | |
| | | | | | | | |
| | | | | | |
The notes to the financial statements are an integral part of,
and should be read in conjunction with, the financial statements. | | | | | 17 | |
Portfolio of InvestmentsOctober 31, 2019 (continued)
| | | | | | | | |
| | | Principal
Amount | | | Value | |
| U.S. Government & Federal Agencies 0.8% | |
Federal Home Loan Mortgage Corporation
(Mortgage Pass-Through Securities) 0.1% | |
4.00%, due 10/1/48 | | $ | 334,862 | | | $ | 358,722 | |
6.50%, due 4/1/37 | | | 40,624 | | | | 45,688 | |
| | | | | | | | |
| | | | | | | 404,410 | |
| | | | | | | | |
Government National Mortgage Association
(Mortgage Pass-Through Securities) 0.1% | |
6.50%, due 4/15/31 | | | 180,361 | | | | 206,804 | |
| | | | | | | | |
| | |
United States Treasury Notes 0.6% | | | | | | | | |
1.75%, due 9/30/22 | | | 1,880,000 | | | | 1,892,558 | |
| | | | | | | | |
Total U.S. Government & Federal Agencies
(Cost $2,381,669) | | | | | | | 2,503,772 | |
| | | | | | | | |
TotalLong-Term Bonds
(Cost $267,407,134) | | | | | | | 275,826,493 | |
| | | | | | | | |
|
| Short-Term Investments 12.2% | |
Short-Term Municipal Note 0.8% | | | | | | | | |
New York State Housing Finance Agency, 222 East 44th Street, Revenue Bonds
Series B
2.05%, due 5/1/50 (c) | | | 2,515,000 | | | | 2,515,000 | |
| | | | | | | | |
TotalShort-Term Municipal Note
(Cost $2,515,000) | | | | | | | 2,515,000 | |
| | | | | | | | |
| | | | | | | | |
| | | Principal
Amount | | | Value | |
U.S. Government & Federal Agencies 11.4% | |
Federal Home Loan Bank Discount Notes
(zero coupon), due 11/1/19 | | $ | 34,000,000 | | | $ | 34,000,000 | |
| | | | | | | | |
Total U.S. Government & Federal Agencies
(Cost $33,998,678) | | | | | | | 34,000,000 | |
| | | | | | | | |
TotalShort-Term Investments
(Cost $36,513,678) | | | | | | | 36,515,000 | |
| | | | | | | | |
Total Investments
(Cost $304,920,812) | | | 104.4 | % | | | 312,341,493 | |
Other Assets, Less Liabilities | | | (4.4 | ) | | | (13,230,968 | ) |
Net Assets | | | 100.0 | % | | $ | 299,110,525 | |
| † | Percentages indicated are based on Fund net assets. |
| (a) | Floating rate—Rate shown was the rate in effect as of October 31, 2019. |
| (b) | May be sold to institutional investors only under Rule 144A or securities offered pursuant to Section 4(a)(2) of the Securities Act of 1933, as amended. |
| (c) | Variable-rate demand notes (VRDNs)—Provide the right to sell the security at face value on either that day or within the rate-reset period. VRDNs will normally trade as if the maturity is the earlier put date, even though stated maturity is longer. The interest rate is reset on the put date at a stipulated daily, weekly, monthly, quarterly, or other specified time interval to reflect current market conditions. These securities do not indicate a reference rate and spread in their description. The maturity date shown is the final maturity. |
The following abbreviation is used in the preceding pages:
AGM—Assured Guaranty Municipal Corp.
BAM—Build America Mutual Assurance Co.
GNMA—Government National Mortgage Association
LIBOR—London Interbank Offered Rate
NATL-RE—National Public Finance Guarantee Corp.
Futures Contracts
As of October 31, 2019, the Portfolio held the following futures contracts1:
| | | | | | | | | | | | | | | | | | | | |
Type | | Number of
Contracts | | | Expiration
Date | | | Value at
Trade Date | | | Current
Notional
Amount | | | Unrealized
Appreciation
(Depreciation)2 | |
Short Contracts | | | | | | | | | | | | | | | | | | | | |
| 10-Year United States Treasury Note | | | (200 | ) | | | December 2019 | | | $ | (26,328,641 | ) | | $ | (26,059,374 | ) | | $ | 269,267 | |
| United States Treasury Long Bond | | | (160 | ) | | | December 2019 | | | | (25,889,936 | ) | | | (25,820,000 | ) | | | 69,936 | |
| | | | | | | | | | | | | | | | | | | | |
| Total Short Contracts | | | | | | | | | | | | | | | | | | | 339,203 | |
| | | | | | | | | | | | | | | | | | | | |
| Net Unrealized Appreciation | | | | | | | | | | | | | | | | | | $ | 339,203 | |
| | | | | | | | | | | | | | | | | | | | |
| 1. | As of October 31, 2019, cash in the amount of $740,000 was on deposit with a broker or futures commission merchant for futures transactions. |
| 2. | Represents the difference between the value of the contracts at the time they were opened and the value as of October 31, 2019. |
| | | | |
| 18 | | MainStay MacKay Infrastructure Bond Fund | | The notes to the financial statements are an integral part of,
and should be read in conjunction with, the financial statements. |
The following is a summary of the fair valuations according to the inputs used as of October 31, 2019, for valuing the Fund’s assets and liabilities:
| | | | | | | | | | | | | | | | |
Description | | Quoted
Prices in
Active
Markets for
Identical
Assets
(Level 1) | | | Significant
Other
Observable
Inputs
(Level 2) | | | Significant
Unobservable
Inputs
(Level 3) | | | Total | |
| | | | |
Asset Valuation Inputs | | | | | | | | | | | | | | | | |
| Investments in Securities (a) | | | | | | | | | | | | | | | | |
| Long-Term Bonds | | | | | | | | | | | | | | | | |
Asset-Backed Securities | | $ | — | | | $ | 717,708 | | | $ | — | | | $ | 717,708 | |
Corporate Bonds | | | — | | | | 36,153,843 | | | | — | | | | 36,153,843 | |
Loan Assignments | | | — | | | | 2,247,187 | | | | — | | | | 2,247,187 | |
Municipal Bonds | | | — | | | | 234,203,983 | | | | — | | | | 234,203,983 | |
U.S. Government & Federal Agencies | | | — | | | | 2,503,772 | | | | — | | | | 2,503,772 | |
| | | | | | | | | | | | | | | | |
| TotalLong-Term Bonds | | | — | | | | 275,826,493 | | | | — | | | | 275,826,493 | |
| | | | | | | | | | | | | | | | |
| Short-Term Investments | | | | | | | | | | | | | | | | |
Short-Term Municipal Note | | | — | | | | 2,515,000 | | | | — | | | | 2,515,000 | |
U.S. Government & Federal Agencies | | | — | | | | 34,000,000 | | | | — | | | | 34,000,000 | |
| | | | | | | | | | | | | | | | |
| Total Short-Term Investments | | | — | | | | 36,515,000 | | | | — | | | | 36,515,000 | |
| | | | | | | | | | | | | | | | |
| Total Investments in Securities | | $ | — | | | $ | 312,341,493 | | | $ | — | | | $ | 312,341,493 | |
| | | | | | | | | | | | | | | | |
| Other Financial Instruments | | | | | | | | | | | | | | | | |
Futures Contracts (b) | | | 339,203 | | | | — | | | | — | | | | 339,203 | |
| | | | | | | | | | | | | | | | |
| Total Investments in Securities and Other Financial Instruments | | $ | 339,203 | | | $ | 312,341,493 | | | $ | — | | | $ | 312,680,696 | |
| | | | | | | | | | | | | | | | |
| (a) | For a complete listing of investments and their industries, see the Portfolio of Investments. |
| (b) | The value listed for these securities reflects unrealized appreciation (depreciation) as shown on the Portfolio of Investments. |
The following is a reconciliation of investments in which significant unobservable inputs (Level 3) were used in determining value:
| | | | | | | | | | | | | | | | | | | | | | | | | | | | | | | | | | | | | | | | |
Investments in Securities | | Balance
as of
October 31,
2018 | | | Accrued
Discounts
(Premiums) | | | Realized
Gain
(Loss) | | | Change in Unrealized
Appreciation
(Depreciation) | | | Purchases | | | Sales (a) | | | Transfers
into
Level 3 | | | Transfers
out of
Level 3 | | | Balance
as of October 31,
2019 | | | Change in
Unrealized
Appreciation
(Depreciation)
from
Investments
Still Held at
October 31,
2019 (b) | |
| Long-Term Bonds | | | | | | | | | | | | | | | | | | | | | | | | | | | | | | | | | | | | | | | | |
Mortgage-Backed Securities | | $ | 816,243 | | | $ | 235 | | | $ | (72,720 | ) | | $ | 32,697 | | | $ | — | | | $ | (776,455 | ) | | $ | — | | | $ | — | | | $ | — | | | $ | — | |
| | | | | | | | | | | | | | | | | | | | | | | | | | | | | | | | | | | | | | | | |
| Total | | $ | 816,243 | | | $ | 235 | | | $ | (72,720 | ) | | $ | 32,697 | | | $ | — | | | $ | (776,455 | ) | | $ | — | | | $ | — | | | $ | — | | | $ | — | |
| | | | | | | | | | | | | | | | | | | | | | | | | | | | | | | | | | | | | | | | |
| (a) | Sales include principal reductions. |
| (b) | Included in “Net change in unrealized appreciation (depreciation) on investments” in the Statement of Operations. |
| | | | | | |
The notes to the financial statements are an integral part of,
and should be read in conjunction with, the financial statements. | | | | | 19 | |
Statement of Assets and Liabilitiesas of October 31, 2019
| | | | |
| Assets | | | | |
Investment in securities, at value
(identified cost $304,920,812) | | $ | 312,341,493 | |
Cash | | | 1,722,285 | |
Cash collateral on deposit at broker for futures contracts | | | 740,000 | |
Receivables: | | | | |
Fund shares sold | | | 3,276,987 | |
Interest | | | 2,676,626 | |
Investment securities sold | | | 552,042 | |
Other assets | | | 47,376 | |
| | | | |
Total assets | | | 321,356,809 | |
| | | | |
| |
| Liabilities | | | | |
Unrealized depreciation on unfunded commitments (See Note 5) | | | 938 | |
Payables: | | | | |
Investment securities purchased | | | 21,395,428 | |
Variation margin on futures contracts | | | 447,499 | |
Fund shares redeemed | | | 161,927 | |
Manager (See Note 3) | | | 97,451 | |
Transfer agent (See Note 3) | | | 47,471 | |
NYLIFE Distributors (See Note 3) | | | 35,356 | |
Professional fees | | | 16,640 | |
Custodian | | | 12,753 | |
Shareholder communication | | | 12,574 | |
Trustees | | | 439 | |
Accrued expenses | | | 5,251 | |
Dividend payable | | | 12,557 | |
| | | | |
Total liabilities | | | 22,246,284 | |
| | | | |
Net assets | | $ | 299,110,525 | |
| | | | |
| |
| Composition of Net Assets | | | | |
Shares of beneficial interest outstanding (par value of $.01 per share) unlimited number of shares authorized | | $ | 343,897 | |
Additional paid-in capital | | | 292,318,215 | |
| | | | |
| | | 292,662,112 | |
Total distributable earnings (loss) | | | 6,448,413 | |
| | | | |
Net assets | | $ | 299,110,525 | |
| | | | |
| | | | |
Class A | | | | |
Net assets applicable to outstanding shares | | $ | 84,512,773 | |
| | | | |
Shares of beneficial interest outstanding | | | 9,781,225 | |
| | | | |
Net asset value per share outstanding | | $ | 8.64 | |
Maximum sales charge (4.50% of offering price) | | | 0.41 | |
| | | | |
Maximum offering price per share outstanding | | $ | 9.05 | |
| | | | |
Investor Class | | | | |
Net assets applicable to outstanding shares | | $ | 20,520,128 | |
| | | | |
Shares of beneficial interest outstanding | | | 2,364,288 | |
| | | | |
Net asset value per share outstanding | | $ | 8.68 | |
Maximum sales charge (4.50% of offering price) | | | 0.41 | |
| | | | |
Maximum offering price per share outstanding | | $ | 9.09 | |
| | | | |
Class B | | | | |
Net assets applicable to outstanding shares | | $ | 2,620,895 | |
| | | | |
Shares of beneficial interest outstanding | | | 303,274 | |
| | | | |
Net asset value and offering price per share outstanding | | $ | 8.64 | |
| | | | |
Class C | | | | |
Net assets applicable to outstanding shares | | $ | 14,151,794 | |
| | | | |
Shares of beneficial interest outstanding | | | 1,638,362 | |
| | | | |
Net asset value and offering price per share outstanding | | $ | 8.64 | |
| | | | |
Class I | | | | |
Net assets applicable to outstanding shares | | $ | 177,304,935 | |
| | | | |
Shares of beneficial interest outstanding | | | 20,302,539 | |
| | | | |
Net asset value and offering price per share outstanding | | $ | 8.73 | |
| | | | |
| | | | |
| 20 | | MainStay MacKay Infrastructure Bond Fund | | The notes to the financial statements are an integral part of,
and should be read in conjunction with, the financial statements. |
Statement of Operationsfor the year ended October 31, 2019
| | | | |
| Investment Income (Loss) | | | | |
Income | | | | |
Interest | | $ | 4,914,007 | |
Dividends-affiliated | | | 32,820 | |
| | | | |
Total income | | | 4,946,827 | |
| | | | |
Expenses | | | | |
Manager (See Note 3) | | | 734,582 | |
Distribution/Service—Class A (See Note 3) | | | 176,220 | |
Distribution/Service—Investor Class (See Note 3) | | | 52,140 | |
Distribution/Service—Class B (See Note 3) | | | 28,546 | |
Distribution/Service—Class C (See Note 3) | | | 132,094 | |
Transfer agent (See Note 3) | | | 258,284 | |
Registration | | | 86,642 | |
Professional fees | | | 72,497 | |
Shareholder communication | | | 38,616 | |
Custodian | | | 35,308 | |
Trustees | | | 3,795 | |
Miscellaneous | | | 13,481 | |
| | | | |
Total expenses before waiver/reimbursement | | | 1,632,205 | |
Expense waiver/reimbursement from Manager (See Note 3) | | | (199,102 | ) |
| | | | |
Net expenses | | | 1,433,103 | |
| | | | |
Net investment income (loss) | | | 3,513,724 | |
| | | | |
|
| Realized and Unrealized Gain (Loss) on Investments, Unfunded Commitments and Futures Contracts | |
Net realized gain (loss) on: | | | | |
Unaffiliated investment transactions | | | 2,551,832 | |
Futures transactions | | | (1,166,144 | ) |
| | | | |
Net realized gain (loss) on investments, unfunded commitments and futures transactions | | | 1,385,688 | |
| | | | |
Net change in unrealized appreciation (depreciation) on: | | | | |
Unaffiliated investments | | | 7,936,207 | |
Futures contracts | | | 339,203 | |
Unfunded commitments | | | (938 | ) |
| | | | |
Net change in unrealized appreciation (depreciation) on investments, unfunded commitments and futures contracts | | | 8,274,472 | |
| | | | |
Net realized and unrealized gain (loss) on investments, unfunded commitments and futures transactions | | | 9,660,160 | |
| | | | |
Net increase (decrease) in net assets resulting from operations | | $ | 13,173,884 | |
| | | | |
| | | | | | |
The notes to the financial statements are an integral part of,
and should be read in conjunction with, the financial statements. | | | | | 21 | |
Statements of Changes in Net Assets
for the years ended October 31, 2019 and October 31, 2018
| | | | | | | | |
| | | 2019 | | | 2018 | |
| Increase (Decrease) in Net Assets | |
Operations: | | | | | | | | |
Net investment income (loss) | | $ | 3,513,724 | | | $ | 2,472,097 | |
Net realized gain (loss) on investments, unfunded commitments and futures transactions | | | 1,385,688 | | | | (1,466,663 | ) |
Net change in unrealized appreciation (depreciation) on investments, unfunded commitments and futures contracts | | | 8,274,472 | | | | (4,072,054 | ) |
| | | | |
Net increase (decrease) in net assets resulting from operations | | | 13,173,884 | | | | (3,066,620 | ) |
| | | | |
Distributions to shareholders: | | | | | | | | |
Class A | | | (1,786,354 | ) | | | (1,745,008 | ) |
Investor Class | | | (463,383 | ) | | | (451,882 | ) |
Class B | | | (42,411 | ) | | | (49,618 | ) |
Class C | | | (199,615 | ) | | | (101,506 | ) |
Class I | | | (1,044,927 | ) | | | (152,092 | ) |
| | | | |
| | | (3,536,690 | ) | | | (2,500,106 | ) |
| | | | |
Distributions to shareholders from return of capital: | | | | | | | | |
Class A | | | (11,271 | ) | | | — | |
Investor Class | | | (2,924 | ) | | | — | |
Class B | | | (268 | ) | | | — | |
Class C | | | (1,260 | ) | | | — | |
Class I | | | (6,594 | ) | | | — | |
| | | | |
| | | (22,317 | ) | | | — | |
| | | | |
Total distributions to shareholders | | | (3,559,007 | ) | | | (2,500,106 | ) |
| | | | |
Capital share transactions: | | | | | | | | |
Net proceeds from sale of shares | | | 226,660,069 | | | | 5,392,265 | |
Net asset value of shares issued to shareholders in reinvestment of distributions | | | 3,378,523 | | | | 2,316,879 | |
Cost of shares redeemed | | | (45,662,835 | ) | | | (25,167,407 | ) |
| | | | |
Increase (decrease) in net assets derived from capital share transactions | | | 184,375,757 | | | | (17,458,263 | ) |
| | | | |
Net increase (decrease) in net assets | | | 193,990,634 | | | | (23,024,989 | ) |
| | |
| Net Assets | | | | | | | | |
Beginning of year | | | 105,119,891 | | | | 128,144,880 | |
| | | | |
End of year | | $ | 299,110,525 | | | $ | 105,119,891 | |
| | | | |
| | | | |
| 22 | | MainStay MacKay Infrastructure Bond Fund | | The notes to the financial statements are an integral part of,
and should be read in conjunction with, the financial statements. |
Financial Highlightsselected per share data and ratios
| | | | | | | | | | | | | | | | | | | | |
| |
| | | Year ended October 31, | |
| | | | | |
| Class A | | 2019 | | | 2018 | | | 2017 | | | 2016 | | | 2015 | |
| | | | | |
Net asset value at beginning of year | | $ | 7.93 | | | $ | 8.33 | | | $ | 8.56 | | | $ | 8.51 | | | $ | 8.63 | |
| | | | | | | | | | | | | | | | | | | | |
| | | | | |
Net investment income (loss) (a) | | | 0.21 | | | | 0.19 | | | | 0.17 | | | | 0.17 | | | | 0.20 | |
| | | | | |
Net realized and unrealized gain (loss) on investments | | | 0.71 | | | | (0.40 | ) | | | (0.22 | ) | | | 0.05 | | | | (0.10 | )�� |
| | | | | | | | | | | | | | | | | | | | |
| | | | | |
Total from investment operations | | | 0.92 | | | | (0.21 | ) | | | (0.05 | ) | | | 0.22 | | | | 0.10 | |
| | | | | | | | | | | | | | | | | | | | |
| | | | | |
| Less dividends and distributions: | | | | | | | | | | | | | | | | | | | | |
| | | | | |
From net investment income | | | (0.21 | ) | | | (0.19 | ) | | | (0.18 | ) | | | (0.17 | ) | | | (0.20 | ) |
| | | | | |
From net realized gain on investments | | | — | | | | — | | | | — | | | | — | | | | (0.02 | ) |
| | | | | |
Return of capital | | | (0.00 | )‡ | | | — | | | | — | | | | — | | | | — | |
| | | | | | | | | | | | | | | | | | | | |
| | | | | |
Total dividends and distributions | | | (0.21 | ) | | | (0.19 | ) | | | (0.18 | ) | | | (0.17 | ) | | | (0.22 | ) |
| | | | | | | | | | | | | | | | | | | | |
| | | | | |
Net asset value at end of year | | $ | 8.64 | | | $ | 7.93 | | | $ | 8.33 | | | $ | 8.56 | | | $ | 8.51 | |
| | | | | | | | | | | | | | | | | | | | |
| | | | | |
Total investment return (b) | | | 11.76 | % | | | (2.54 | %) | | | (0.60 | %) | | | 2.60 | % | | | 1.17 | % |
| | | | | |
| Ratios (to average net assets)/Supplemental Data: | | | | | | | | | | | | | | | | | | | | |
| | | | | |
Net investment income (loss) | | | 2.52 | % | | | 2.31 | % | | | 2.07 | % | | | 1.99 | %(c) | | | 2.38 | % |
| | | | | |
Net expenses (d) | | | 0.89 | % | | | 1.00 | % | | | 1.00 | % | | | 0.98 | %(e) | | | 1.00 | % |
| | | | | |
Expenses (before waiver/reimbursement) (d) | | | 1.02 | % | | | 1.04 | % | | | 1.00 | % | | | 0.99 | % | | | 1.00 | % |
| | | | | |
Portfolio turnover rate | | | 124 | %(f) | | | 58 | % (g) | | | 20 | % (g) | | | 41 | %(g) | | | 13 | % |
| | | | | |
Net assets at end of year (in 000’s) | | $ | 84,513 | | | $ | 68,269 | | | $ | 82,828 | | | $ | 93,242 | | | $ | 90,119 | |
| ‡ | Less than one cent per share. |
| (a) | Per share data based on average shares outstanding during the year. |
| (b) | Total investment return is calculated exclusive of sales charges and assumes the reinvestment of dividends and distributions. For periods of less than one year, total return is not annualized. |
| (c) | Without the custody fee reimbursement, net investment income (loss) would have been 1.98%. |
| (d) | In addition to the fees and expenses which the Fund bears directly, it also indirectly bears a pro-rata share of the fees and expenses of the underlying funds in which it invests. Such indirect expenses are not included in the above expense ratios. |
| (e) | Without the custody fee reimbursement, net expenses would have been 0.99%. |
| (f) | The portfolio turnover rate includes variable rate demand notes. |
| (g) | The portfolio turnover rates not including mortgage dollar rolls were 52%, 6% and 16% for the years ended October 31, 2018, 2017 and 2016, respectively. |
| | | | | | | | | | | | | | | | | | | | |
| |
| | | Year ended October 31, | |
| | | | | |
| Investor Class | | 2019 | | | 2018 | | | 2017 | | | 2016 | | | 2015 | |
| | | | | |
Net asset value at beginning of year | | $ | 7.97 | | | $ | 8.36 | | | $ | 8.59 | | | $ | 8.54 | | | $ | 8.66 | |
| | | | | | | | | | | | | | | | | | | | |
| | | | | |
Net investment income (loss) (a) | | | 0.19 | | | | 0.16 | | | | 0.15 | | | | 0.15 | | | | 0.18 | |
| | | | | |
Net realized and unrealized gain (loss) on investments | | | 0.71 | | | | (0.39 | ) | | | (0.23 | ) | | | 0.05 | | | | (0.10 | ) |
| | | | | | | | | | | | | | | | | | | | |
| | | | | |
Total from investment operations | | | 0.90 | | | | (0.23 | ) | | | (0.08 | ) | | | 0.20 | | | | 0.08 | |
| | | | | | | | | | | | | | | | | | | | |
| | | | | |
| Less dividends and distributions: | | | | | | | | | | | | | | | | | | | | |
| | | | | |
From net investment income | | | (0.19 | ) | | | (0.16 | ) | | | (0.15 | ) | | | (0.15 | ) | | | (0.18 | ) |
| | | | | |
From net realized gain on investments | | | — | | | | — | | | | — | | | | — | | | | (0.02 | ) |
| | | | | |
Return of capital | | | (0.00 | )‡ | | | — | | | | — | | | | — | | | | — | |
| | | | | | | | | | | | | | | | | | | | |
| | | | | |
Total dividends and distributions | | | (0.19 | ) | | | (0.16 | ) | | | (0.15 | ) | | | (0.15 | ) | | | (0.20 | ) |
| | | | | | | | | | | | | | | | | | | | |
| | | | | |
Net asset value at end of year | | $ | 8.68 | | | $ | 7.97 | | | $ | 8.36 | | | $ | 8.59 | | | $ | 8.54 | |
| | | | | | | | | | | | | | | | | | | | |
| | | | | |
Total investment return (b) | | | 11.36 | % | | | (2.72 | %) | | | (0.91 | %) | | | 2.34 | % | | | 0.88 | % |
| | | | | |
| Ratios (to average net assets)/Supplemental Data: | | | | | | | | | | | | | | | | | | | | |
| | | | | |
Net investment income (loss) | | | 2.21 | % | | | 1.98 | % | | | 1.77 | % | | | 1.74 | %(c) | | | 2.11 | % |
| | | | | |
Net expenses (d) | | | 1.21 | % | | | 1.33 | % | | | 1.30 | % | | | 1.23 | %(e) | | | 1.28 | % |
| | | | | |
Expenses (before waiver/reimbursement) (d) | | | 1.35 | % | | | 1.44 | % | | | 1.30 | % | | | 1.24 | % | | | 1.28 | % |
| | | | | |
Portfolio turnover rate | | | 124 | %(f) | | | 58 | % (g) | | | 20 | % (g) | | | 41 | %(g) | | | 13 | % |
| | | | | |
Net assets at end of year (in 000’s) | | $ | 20,520 | | | $ | 21,012 | | | $ | 24,187 | | | $ | 40,094 | | | $ | 42,444 | |
| ‡ | Less than one cent per share. |
| (a) | Per share data based on average shares outstanding during the year. |
| (b) | Total investment return is calculated exclusive of sales charges and assumes the reinvestment of dividends and distributions. For periods of less than one year, total return is not annualized. |
| (c) | Without the custody fee reimbursement, net investment income (loss) would have been 1.73%. |
| (d) | In addition to the fees and expenses which the Fund bears directly, it also indirectly bears a pro-rata share of the fees and expenses of the underlying funds in which it invests. Such indirect expenses are not included in the above expense ratios. |
| (e) | Without the custody fee reimbursement, net expenses would have been 1.24%. |
| (f) | The portfolio turnover rate includes variable rate demand notes. |
| (g) | The portfolio turnover rates not including mortgage dollar rolls were 52%, 6% and 16% for the years ended October 31, 2018, 2017 and 2016, respectively. |
| | | | | | |
The notes to the financial statements are an integral part of,
and should be read in conjunction with, the financial statements. | | | | | 23 | |
Financial Highlightsselected per share data and ratios
| | | | | | | | | | | | | | | | | | | | |
| |
| | | Year ended October 31, | |
| | | | | |
| Class B | | 2019 | | | 2018 | | | 2017 | | | 2016 | | | 2015 | |
| | | | | |
Net asset value at beginning of year | | $ | 7.94 | | | $ | 8.33 | | | $ | 8.56 | | | $ | 8.51 | | | $ | 8.63 | |
| | | | | | | | | | | | | | | | | | | | |
| | | | | |
Net investment income (loss) (a) | | | 0.12 | | | | 0.10 | | | | 0.08 | | | | 0.08 | | | | 0.12 | |
| | | | | |
Net realized and unrealized gain (loss) on investments | | | 0.70 | | | | (0.39 | ) | | | (0.22 | ) | | | 0.05 | | | | (0.10 | ) |
| | | | | | | | | | | | | | | | | | | | |
| | | | | |
Total from investment operations | | | 0.82 | | | | (0.29 | ) | | | (0.14 | ) | | | 0.13 | | | | 0.02 | |
| | | | | | | | | | | | | | | | | | | | |
| | | | | |
| Less dividends and distributions: | | | | | | | | | | | | | | | | | | | | |
| | | | | |
From net investment income | | | (0.12 | ) | | | (0.10 | ) | | | (0.09 | ) | | | (0.08 | ) | | | (0.12 | ) |
| | | | | |
From net realized gain on investments | | | — | | | | — | | | | — | | | | — | | | | (0.02 | ) |
| | | | | |
Return of capital | | | (0.00 | )‡ | | | — | | | | — | | | | — | | | | — | |
| | | | | | | | | | | | | | | | | | | | |
| | | | | |
Total dividends and distributions | | | (0.12 | ) | | | (0.10 | ) | | | (0.09 | ) | | | (0.08 | ) | | | (0.14 | ) |
| | | | | | | | | | | | | | | | | | | | |
| | | | | |
Net asset value at end of year | | $ | 8.64 | | | $ | 7.94 | | | $ | 8.33 | | | $ | 8.56 | | | $ | 8.51 | |
| | | | | | | | | | | | | | | | | | | | |
| | | | | |
Total investment return (b) | | | 10.46 | % | | | (3.46 | %) | | | (1.66 | %) | | | 1.59 | % | | | 0.14 | % |
| | | | | |
| Ratios (to average net assets)/Supplemental Data: | | | | | | | | | | | | | | | | | | | | |
| | | | | |
Net investment income (loss) | | | 1.46 | % | | | 1.23 | % | | | 1.01 | % | | | 0.99 | %(c) | | | 1.35 | % |
| | | | | |
Net expenses (d) | | | 1.96 | % | | | 2.08 | % | | | 2.05 | % | | | 1.98 | %(e) | | | 2.03 | % |
| | | | | |
Expenses (before waiver/reimbursement) (d) | | | 2.10 | % | | | 2.19 | % | | | 2.05 | % | | | 1.99 | % | | | 2.03 | % |
| | | | | |
Portfolio turnover rate | | | 124 | %(f) | | | 58 | % (g) | | | 20 | % (g) | | | 41 | %(g) | | | 13 | % |
| | | | | |
Net assets at end of year (in 000’s) | | $ | 2,621 | | | $ | 3,224 | | | $ | 4,730 | | | $ | 7,154 | | | $ | 8,363 | |
| ‡ | Less than one cent per share. |
| (a) | Per share data based on average shares outstanding during the year. |
| (b) | Total investment return is calculated exclusive of sales charges and assumes the reinvestment of dividends and distributions. For periods of less than one year, total return is not annualized. |
| (c) | Without the custody fee reimbursement, net investment income (loss) would have been 0.98%. |
| (d) | In addition to the fees and expenses which the Fund bears directly, it also indirectly bears a pro-rata share of the fees and expenses of the underlying funds in which it invests. Such indirect expenses are not included in the above expense ratios. |
| (e) | Without the custody fee reimbursement, net expenses would have been 1.99%. |
| (f) | The portfolio turnover rate includes variable rate demand notes. |
| (g) | The portfolio turnover rates not including mortgage dollar rolls were 52%, 6% and 16% for the years ended October 31, 2018, 2017 and 2016, respectively. |
| | | | | | | | | | | | | | | | | | | | |
| |
| | | Year ended October 31, | |
| | | | | |
| Class C | | 2019 | | | 2018 | | | 2017 | | | 2016 | | | 2015 | |
| | | | | |
Net asset value at beginning of year | | $ | 7.93 | | | $ | 8.32 | | | $ | 8.55 | | | $ | 8.50 | | | $ | 8.62 | |
| | | | | | | | | | | | | | | | | | | | |
| | | | | |
Net investment income (loss) (a) | | | 0.12 | | | | 0.10 | | | | 0.08 | | | | 0.08 | | | | 0.12 | |
| | | | | |
Net realized and unrealized gain (loss) on investments | | | 0.71 | | | | (0.39 | ) | | | (0.22 | ) | | | 0.05 | | | | (0.10 | ) |
| | | | | | | | | | | | | | | | | | | | |
| | | | | |
Total from investment operations | | | 0.83 | | | | (0.29 | ) | | | (0.14 | ) | | | 0.13 | | | | 0.02 | |
| | | | | | | | | | | | | | | | | | | | |
| | | | | |
| Less dividends and distributions: | | | | | | | | | | | | | | | | | | | | |
| | | | | |
From net investment income | | | (0.12 | ) | | | (0.10 | ) | | | (0.09 | ) | | | (0.08 | ) | | | (0.12 | ) |
| | | | | |
From net realized gain on investments | | | — | | | | — | | | | — | | | | — | | | | (0.02 | ) |
| | | | | |
Return of capital | | | (0.00 | )‡ | | | — | | | | — | | | | — | | | | — | |
| | | | | | | | | | | | | | | | | | | | |
| | | | | |
Total dividends and distributions | | | (0.12 | ) | | | (0.10 | ) | | | (0.09 | ) | | | (0.08 | ) | | | (0.14 | ) |
| | | | | | | | | | | | | | | | | | | | |
| | | | | |
Net asset value at end of year | | $ | 8.64 | | | $ | 7.93 | | | $ | 8.32 | | | $ | 8.55 | | | $ | 8.50 | |
| | | | | | | | | | | | | | | | | | | | |
| | | | | |
Total investment return (b) | | | 10.59 | % | | | (3.46 | %) | | | (1.66 | %) | | | 1.59 | % | | | 0.14 | % |
| | | | | |
| Ratios (to average net assets)/Supplemental Data: | | | | | | | | | | | | | | | | | | | | |
| | | | | |
Net investment income (loss) | | | 1.47 | % | | | 1.23 | % | | | 1.00 | % | | | 0.99 | %(c) | | | 1.34 | % |
| | | | | |
Net expenses (d) | | | 1.96 | % | | | 2.08 | % | | | 2.05 | % | | | 1.98 | %(e) | | | 2.03 | % |
| | | | | |
Expenses (before waiver/reimbursement) (d) | | | 2.10 | % | | | 2.19 | % | | | 2.05 | % | | | 1.99 | % | | | 2.03 | % |
| | | | | |
Portfolio turnover rate | | | 124 | %(f) | | | 58 | % (g) | | | 20 | % (g) | | | 41 | %(g) | | | 13 | % |
| | | | | |
Net assets at end of year (in 000’s) | | $ | 14,152 | | | $ | 7,612 | | | $ | 9,472 | | | $ | 19,338 | | | $ | 17,073 | |
| ‡ | Less than one cent per share. |
| (a) | Per share data based on average shares outstanding during the year. |
| (b) | Total investment return is calculated exclusive of sales charges and assumes the reinvestment of dividends and distributions. For periods of less than one year, total return is not annualized. |
| (c) | Without the custody fee reimbursement, net investment income (loss) would have been 0.98%. |
| (d) | In addition to the fees and expenses which the Fund bears directly, it also indirectly bears a pro-rata share of the fees and expenses of the underlying funds in which it invests. Such indirect expenses are not included in the above expense ratios. |
| (e) | Without the custody fee reimbursement, net expenses would have been 1.99%. |
| (f) | The portfolio turnover rate includes variable rate demand notes. |
| (g) | The portfolio turnover rates not including mortgage dollar rolls were 52%, 6% and 16% for the years ended October 31, 2018, 2017 and 2016, respectively. |
| | | | |
| 24 | | MainStay MacKay Infrastructure Bond Fund | | The notes to the financial statements are an integral part of,
and should be read in conjunction with, the financial statements. |
Financial Highlightsselected per share data and ratios
| | | | | | | | | | | | | | | | | | | | |
| |
| | | Year ended October 31, | |
| | | | | |
| Class I | | 2019 | | | 2018 | | | 2017 | | | 2016 | | | 2015 | |
| | | | | |
Net asset value at beginning of year | | $ | 8.02 | | | $ | 8.42 | | | $ | 8.64 | | | $ | 8.59 | | | $ | 8.71 | |
| | | | | | | | | | | | | | | | | | | | |
| | | | | |
Net investment income (loss) (a) | | | 0.24 | | | | 0.21 | | | | 0.20 | | | | 0.19 | | | | 0.22 | |
| | | | | |
Net realized and unrealized gain (loss) on investments | | | 0.71 | | | | (0.40 | ) | | | (0.22 | ) | | | 0.05 | | | | (0.09 | ) |
| | | | | | | | | | | | | | | | | | | | |
| | | | | |
Total from investment operations | | | 0.95 | | | | (0.19 | ) | | | (0.02 | ) | | | 0.24 | | | | 0.13 | |
| | | | | | | | | | | | | | | | | | | | |
| | | | | |
| Less dividends and distributions: | | | | | | | | | | | | | | | | | | | | |
| | | | | |
From net investment income | | | (0.24 | ) | | | (0.21 | ) | | | (0.20 | ) | | | (0.19 | ) | | | (0.23 | ) |
| | | | | |
From net realized gain on investments | | | — | | | | — | | | | — | | | | — | | | | (0.02 | ) |
| | | | | |
Return of capital | | | (0.00 | )‡ | | | — | | | | — | | | | — | | | | — | |
| | | | | | | | | | | | | | | | | | | | |
| | | | | |
Total dividends and distributions | | | (0.24 | ) | | | (0.21 | ) | | | (0.20 | ) | | | (0.19 | ) | | | (0.25 | ) |
| | | | | | | | | | | | | | | | | | | | |
| | | | | |
Net asset value at end of year | | $ | 8.73 | | | $ | 8.02 | | | $ | 8.42 | | | $ | 8.64 | | | $ | 8.59 | |
| | | | | | | | | | | | | | | | | | | | |
| | | | | |
Total investment return (b) | | | 11.95 | % | | | (2.26 | %) | | | (0.23 | %) | | | 2.83 | % | | | 1.41 | % |
| | | | | |
| Ratios (to average net assets)/Supplemental Data: | | | | | | | | | | | | | | | | | | | | |
| | | | | |
Net investment income (loss) | | | 2.64 | % | | | 2.56 | % | | | 2.33 | % | | | 2.16 | %(c) | | | 2.57 | % |
| | | | | |
Net expenses (d) | | | 0.60 | % | | | 0.75 | % | | | 0.75 | % | | | 0.73 | %(e) | | | 0.75 | % |
| | | | | |
Expenses (before waiver/reimbursement) (d) | | | 0.74 | % | | | 0.79 | % | | | 0.75 | % | | | 0.74 | % | | | 0.75 | % |
| | | | | |
Portfolio turnover rate | | | 124 | %(f) | | | 58 | % (g) | | | 20 | % (g) | | | 41 | %(g) | | | 13 | % |
| | | | | |
Net assets at end of year (in 000’s) | | $ | 177,305 | | | $ | 5,003 | | | $ | 6,926 | | | $ | 14,061 | | | $ | 4,492 | |
| ‡ | Less than one cent per share. |
| (a) | Per share data based on average shares outstanding during the year. |
| (b) | Total investment return is calculated exclusive of sales charges and assumes the reinvestment of dividends and distributions. Class I shares are not subject to sales charges. For periods of less than one year, total return is not annualized. |
| (c) | Without the custody fee reimbursement, net investment income (loss) would have been 2.15%. |
| (d) | In addition to the fees and expenses which the Fund bears directly, it also indirectly bears a pro-rata share of the fees and expenses of the underlying funds in which it invests. Such indirect expenses are not included in the above expense ratios. |
| (e) | Without the custody fee reimbursement, net expenses would have been 0.74%. |
| (f) | The portfolio turnover rate includes variable rate demand notes. |
| (g) | The portfolio turnover rates not including mortgage dollar rolls were 52%, 6% and 16% for the years ended October 31, 2018, 2017 and 2016, respectively. |
| | | | | | |
The notes to the financial statements are an integral part of,
and should be read in conjunction with, the financial statements. | | | | | 25 | |
Notes to Financial Statements
Note 1–Organization and Business
The MainStay Funds (the “Trust”) was organized on January 9, 1986, as a Massachusetts business trust and is governed by a Declaration of Trust. The Trust is registered under the Investment Company Act of 1940, as amended (the “1940 Act”), as an open-end management investment company, and is comprised of twelve funds (collectively referred to as the “Funds”). These financial statements and notes relate to the MainStay MacKay Infrastructure Bond Fund (formerly known as MainStay MacKay Government Fund) (the “Fund”), a “diversified” fund, as that term is defined in the 1940 Act, as interpreted or modified by regulatory authorities having jurisdiction, from time to time.
The Fund currently has six classes of shares registered for sale. Class A shares commenced operations on January 3, 1995. Class B shares commenced operations on May 1, 1986. Class C shares commenced operations on September 1, 1998. Class I shares commenced operations on January 2, 2004. Investor Class shares commenced operations on February 28, 2008. Class R6 shares were registered for sale effective as of February 28, 2017. As of October 31, 2019, Class R6 shares were not yet offered for sale.
Class B shares of the MainStay Group of Funds are closed to all new purchases as well as additional investments by existing Class B shareholders. Existing Class B shareholders may continue to reinvest dividends and capital gains distributions, as well as exchange their Class B shares for Class B shares of other funds in the MainStay Group of Funds as permitted by the current exchange privileges. Class B shareholders continue to be subject to any applicable contingent deferred sales charge (“CDSC”) at the time of redemption. All other features of the Class B shares, including but not limited to the fees and expenses applicable to Class B shares, remain unchanged. Unless redeemed, Class B shareholders will remain in Class B shares of their respective fund until the Class B shares are converted to Class A or Investor Class shares pursuant to the applicable conversion schedule.
Class A and Investor Class shares are offered at net asset value (“NAV”) per share plus an initial sales charge. No initial sales charge applies to investments of $250,000 or more (and certain other qualified purchases) in Class A and Investor Class shares. Effective April 15, 2019, a CDSC of 1.00% may be imposed on certain redemptions of Class A and Investor Class shares made within 18 months of the date of purchase on shares that were purchased without an initial sales charge. For purchases of Class A and Investor Class shares made from August 1, 2017 through April 14, 2019, a CDSC of 1.00% may be imposed on certain redemptions (for investments of $500,000 which paid no initial sales charge) of such shares within 18 months of the date of purchase on shares that were purchased without an initial sales charge. Class C shares are offered at NAV without an initial sales charge, although a 1.00% CDSC may be imposed on certain redemptions of such shares made within one year of the date of purchase of Class C shares. Investments in Class C shares are subject to a purchase maximum of $250,000. When Class B shares were offered, they were offered at NAV without an initial sales charge, although a CDSC that declines depending on the number of years a shareholder has held its Class B shares may be imposed on certain redemptions of such shares made within six years of the date of purchase of such shares. Class I shares are offered at NAV without a sales charge. Class R6 shares are currently expected to be offered at NAV without a sales charge. Depending upon
eligibility, Class B shares convert to either Class A or Investor Class shares at the end of the calendar quarter eight years after the date they were purchased. In addition, depending upon eligibility, Class C shares convert to either Class A or Investor Class shares at the end of the calendar quarter ten years after the date they were purchased. Additionally, as disclosed in the Fund’s prospectus, Class A shares may convert automatically to Investor Class shares and Investor Class shares may convert automatically to Class A shares. Under certain circumstances and as may be permitted by the Trust’s multiple class plan pursuant to Rule 18f-3 under the 1940 Act, specified share classes of the Fund may be converted to one or more other share classes of the Fund as disclosed in the capital share transactions within these notes. The classes of shares have the same voting (except for issues that relate solely to one class), dividend, liquidation and other rights, and the same terms and conditions, except that under distribution plans pursuant to Rule 12b-1 under the 1940 Act, Class B and Class C shares are subject to higher distribution and/or service fees than Class A and Investor Class shares. Class I and Class R6 shares are not subject to a distribution and/or service fee.
The Fund’s investment objective is to seek current income.
Note 2–Significant Accounting Policies
The Fund is an investment company and accordingly follows the investment company accounting and reporting guidance of the Financial Accounting Standards Board (“FASB”) Accounting Standard CodificationTopic 946 Financial Services—Investment Companies. The Fund prepares its financial statements in accordance with generally accepted accounting principles (“GAAP”) in the United States of America and follows the significant accounting policies described below.
(A) Securities Valuation. Investments are usually valued as of the close of regular trading on the New York Stock Exchange (the “Exchange”) (usually 4:00 p.m. Eastern time) on each day the Fund is open for business (“valuation date”).
The Board of Trustees of the Trust (the “Board”) adopted procedures establishing methodologies for the valuation of the Fund’s securities and other assets and delegated the responsibility for valuation determinations under those procedures to the Valuation Committee of the Trust (the “Valuation Committee”). The Board authorized the Valuation Committee to appoint a Valuation Subcommittee (the “Subcommittee”) to deal in the first instance with establishing the prices of securities for which market quotations are not readily available or the prices of which are not otherwise readily determinable under these procedures. The Subcommittee meets (in person, via electronic mail or via teleconference) on an as-needed basis. Subsequently, the Valuation Committee meets to ensure that actions taken by the Subcommittee were appropriate. The procedures state that, subject to the oversight of the Board and unless otherwise noted, the responsibility for theday-to-day valuation of portfolio assets (including fair value measurements for the Fund’s assets and liabilities) rests with New York Life Investment Management LLC (“New York Life Investments” or the “Manager”), aided to whatever extent necessary by the Subadvisor (as defined in Note 3(A)).
To assess the appropriateness of security valuations, the Manager, the Subadvisor or the Fund’s third-party service provider, who is subject to
| | |
| 26 | | MainStay MacKay Infrastructure Bond Fund |
oversight by the Manager, regularly compares prior day prices, prices on comparable securities and the sale prices to the prior and current day prices and challenges prices with changes exceeding certain tolerance levels with third-party pricing services or broker sources. For those securities valued through either a standardized fair valuation methodology or a fair valuation measurement, the Subcommittee deals in the first instance with such valuation and the Valuation Committee reviews and affirms, if appropriate, the reasonableness of the valuation based on such methodologies and measurements on a regular basis after considering information that is reasonably available and deemed relevant by the Valuation Committee. Any action taken by the Subcommittee with respect to the valuation of a portfolio security or other asset is submitted for review and ratification (if appropriate) to the Valuation Committee and the Board at the next regularly scheduled meeting.
“Fair value” is defined as the price the Fund would reasonably expect to receive upon selling an asset or liability in an orderly transaction to an independent buyer in the principal or most advantageous market for the asset or liability. Fair value measurements are determined within a framework that establishes a three-tier hierarchy which maximizes the use of observable market data and minimizes the use of unobservable inputs to establish a classification of fair value measurements for disclosure purposes. “Inputs” refer broadly to the assumptions that market participants would use in pricing the asset or liability, including assumptions about risk, such as the risk inherent in a particular valuation technique used to measure fair value using a pricing model and/or the risk inherent in the inputs for the valuation technique. Inputs may be observable or unobservable. Observable inputs reflect the assumptions market participants would use in pricing the asset or liability based on market data obtained from sources independent of the Fund. Unobservable inputs reflect the Fund’s own assumptions about the assumptions market participants would use in pricing the asset or liability based on the information available. The inputs or methodology used for valuing assets or liabilities may not be an indication of the risks associated with investing in those assets or liabilities. The three-tier hierarchy of inputs is summarized below.
| • | | Level 1—quoted prices in active markets for an identical asset or liability |
| • | | Level 2—other significant observable inputs (including quoted prices for a similar asset or liability in active markets, interest rates and yield curves, prepayment speeds, credit risk, etc.) |
| • | | Level 3—significant unobservable inputs (including the Fund’s own assumptions about the assumptions that market participants would use in measuring fair value of an asset or liability) |
The level of an asset or liability within the fair value hierarchy is based on the lowest level of an input, both individually and in the aggregate, that is significant to the fair value measurement. As of October 31, 2019, the aggregate value by input level of the Fund’s assets and liabilities is included at the end of the Fund’s Portfolio of Investments.
The Fund may use third-party vendor evaluations, whose prices may be derived from one or more of the following standard inputs, among others:
| | |
• Benchmark yields | | • Reported trades |
• Broker/dealer quotes | | • Issuer spreads |
• Two-sided markets | | • Benchmark securities |
• Bids/offers | | • Reference data (corporate actions or material event notices) |
• Industry and economic events | | • Comparable bonds |
• Monthly payment information | | |
An asset or liability for which market values cannot be measured using the methodologies described above is valued by methods deemed reasonable in good faith by the Valuation Committee, following the procedures established by the Board, to represent fair value. Under these procedures, the Fund generally uses a market-based approach which may use related or comparable assets or liabilities, recent transactions, market multiples, book values and other relevant information. The Fund may also use an income-based valuation approach in which the anticipated future cash flows of the asset or liability are discounted to calculate fair value. Discounts may also be applied due to the nature and/or duration of any restrictions on the disposition of the asset or liability. Fair value represents a good faith approximation of the value of a security. Fair value determinations involve the consideration of a number of subjective factors, an analysis of applicable facts and circumstances and the exercise of judgment. As a result, it is possible that the fair value for a security determined in good faith in accordance with the Fund’s valuation procedures may differ from valuations for the same security determined by other funds using their own valuation procedures. Although the Fund’s valuation procedures are designed to value a security at the price the Fund may reasonably expect to receive upon the security’s sale in an orderly transaction, there can be no assurance that any fair value determination thereunder would, in fact, approximate the amount that the Fund would actually realize upon the sale of the security or the price at which the security would trade if a reliable market price were readily available. During the year ended October 31, 2019, there were no material changes to the fair value methodologies.
Securities which may be valued in this manner include, but are not limited to: (i) a security for which trading has been halted or suspended; (ii) a debt security that has recently gone into default and for which there is not a current market quotation; (iii) a security of an issuer that has entered into a restructuring; (iv) a security that has been delisted from a national exchange; (v) a security for which the market price is not readily available from a third-party pricing source or, if so provided, does not, in the opinion of the Manager or the Subadvisor, reflect the security’s market value; (vi) a security subject to trading collars for which no or limited trading takes place; and (vii) a security whose principal market has been temporarily closed at a time when, under normal conditions, it would be open. Securities valued in this manner are generally categorized as Level 3 in the hierarchy. As of October 31, 2019, there were no securities held by the Fund that were fair valued in such a manner.
Debt securities (other than convertible and municipal bonds) are valued at the evaluated bid prices (evaluated mean prices in the case of convertible and municipal bonds) supplied by a pricing agent or brokers
Notes to Financial Statements(continued)
selected by the Manager, in consultation with the Subadvisor. The evaluations are market-based measurements processed through a pricing application and represents the pricing agent’s good faith determination as to what a holder may receive in an orderly transaction under market conditions. The rules based logic utilizes valuation techniques that reflect participants’ assumptions and vary by asset class and per methodology, maximizing the use of relevant observable data including quoted prices for similar assets, benchmark yield curves and market corroborated inputs. The evaluated bid or mean prices are deemed by the Manager, in consultation with the Subadvisor, to be representative of market values at the regular close of trading of the Exchange on each valuation date. Debt securities purchased on a delayed delivery basis are marked to market daily until settlement at the forward settlement date. Debt securities, including corporate bonds, U.S. government and federal agency bonds, municipal bonds, foreign bonds, convertible bonds, asset-backed securities and mortgage-backed securities are generally categorized as Level 2 in the hierarchy.
Futures contracts are valued at the last posted settlement price on the market where such futures are primarily traded. Investments in mutual funds, including money market funds, are valued at their respective NAVs as of the close of the Exchange on the valuation date. These securities are generally categorized as Level 1 in the hierarchy.
Temporary cash investments acquired in excess of 60 days to maturity at the time of purchase are valued using the latest bid prices or using valuations based on a matrix system (which considers such factors as security prices, yields, maturities and ratings), both as furnished by independent pricing services. Other temporary cash investments which mature in 60 days or less at the time of purchase (“Short-Term Investments”) are valued using the amortized cost method of valuation, unless the use of such method would be inappropriate. The amortized cost method involves valuing a security at its cost on the date of purchase and thereafter assuming a constant amortization to maturity of the difference between such cost and the value on maturity date. Amortized cost approximates the current fair value of a security. Securities valued using the amortized cost method are not valued using quoted prices in an active market and are generally categorized as Level 2 in the hierarchy.
The information above is not intended to reflect an exhaustive list of the methodologies that may be used to value portfolio investments. The valuation procedures permit the use of a variety of valuation methodologies in connection with valuing portfolio investments. The methodology used for a specific type of investment may vary based on the market data available or other considerations. The methodologies summarized above may not represent the specific means by which portfolio investments are valued on any particular business day.
(B) Income Taxes. The Fund’s policy is to comply with the requirements of the Internal Revenue Code of 1986, as amended (the “Internal Revenue Code”), applicable to regulated investment companies and to distribute all of its taxable income to the shareholders of the Fund within the allowable time limits. Therefore, no federal, state and local income tax provisions are required.
Management evaluates the Fund’s tax positions to determine if the tax positions taken meet the minimum recognition threshold in connection with accounting for uncertainties in income tax positions taken or
expected to be taken for the purposes of measuring and recognizing tax liabilities in the financial statements. Recognition of tax benefits of an uncertain tax position is permitted only to the extent the position is “more likely than not” to be sustained assuming examination by taxing authorities. Management has analyzed the Fund’s tax positions taken on federal, state and local income tax returns for all open tax years (for up to three tax years) and has concluded that no provisions for federal, state and local income tax are required in the Fund’s financial statements. The Fund’s federal, state and local income tax and federal excise tax returns for tax years for which the applicable statutes of limitations have not expired are subject to examination by the Internal Revenue Service and state and local departments of revenue.
(C) Dividends and Distributions to Shareholders. Dividends and distributions are recorded on the ex-dividend date. The Fund intends to declare dividends from net investment income, if any, daily and intends to pay them at least monthly and pays distributions from net realized capital and currency gains, if any, at least annually. Unless the shareholder elects otherwise, all dividends and distributions are reinvested in the same class of shares of the Fund, at NAV. Dividends and distributions to shareholders are determined in accordance with federal income tax regulations and may differ from determinations using GAAP.
(D) Security Transactions and Investment Income. The Fund records security transactions on the trade date. Realized gains and losses on security transactions are determined using the identified cost method. Interest income is accrued as earned using the effective interest rate method and includes any realized gains and losses from repayments of principal on mortgage-backed securities. Discounts and premiums on securities purchased for the Fund are accreted and amortized, respectively, on the effective interest rate method over the life of the respective securities.
Investment income and realized and unrealized gains and losses on investments of the Fund are allocated pro rata to the separate classes of shares based upon their relative net assets on the date the income is earned or realized and unrealized gains and losses are incurred.
The Fund may place a debt security on non-accrual status and reduce related interest income by ceasing current accruals and writing off all or a portion of any interest receivables when the collection of all or a portion of such interest has become doubtful. A debt security is removed from non-accrual status when the issuer resumes interest payments or when collectability of interest is reasonably assured.
(E) Expenses. Expenses of the Trust are allocated to the individual Funds in proportion to the net assets of the respective Funds when the expenses are incurred, except where direct allocations of expenses can be made. Expenses (other than transfer agent expenses and fees incurred under the shareholder services plans and/or the distribution plans further discussed in Note 3(B)) are allocated to separate classes of shares pro rata based upon their relative net assets on the date the expenses are incurred. The expenses borne by the Fund, including those of related parties to the Fund, are shown in the Statement of Operations.
Additionally, the Fund may invest in mutual funds, which are subject to management fees and other fees that may cause the costs of investing in mutual funds to be greater than the costs of owning the underlying
| | |
| 28 | | MainStay MacKay Infrastructure Bond Fund |
securities directly. These indirect expenses of mutual funds are not included in the amounts shown as expenses in the Fund’s Statement of Operations or in the expense ratios included in the Financial Highlights.
(F) Use of Estimates. In preparing financial statements in conformity with GAAP, management makes estimates and assumptions that affect the reported amounts and disclosures in the financial statements. Actual results could differ from those estimates.
(G) Repurchase Agreements. The Fund may enter into repurchase agreements (i.e., buy a security from another party with the agreement that it will be sold back in the future) to earn income. The Fund may enter into repurchase agreements only with counterparties, usually financial institutions, that are deemed by the Manager or the Subadvisor to be creditworthy, pursuant to guidelines established by the Board. During the term of any repurchase agreement, the Manager or the Subadvisor will continue to monitor the creditworthiness of the counterparty. Under the 1940 Act, repurchase agreements are considered to be collateralized loans by the Fund to the counterparty secured by the securities transferred to the Fund.
Repurchase agreements are subject to counterparty risk, meaning the Fund could lose money by the counterparty’s failure to perform under the terms of the agreement. The Fund mitigates this risk by ensuring the repurchase agreement is collateralized by cash, U.S. government securities, fixed income securities and/or other securities. The collateral is held by the Fund’s custodian and valued daily on a mark to market basis to determine if the value, including accrued interest, exceeds the repurchase price. In the event of the counterparty’s default on the obligation to repurchase, the Fund has the right to liquidate the collateral and apply the proceeds in satisfaction of the obligation. Under certain circumstances, such as in the event of default or bankruptcy by the counterparty, realization and/or retention of the collateral may be limited or subject to delay, to legal proceedings and possible realized loss to the Fund. As of October 31, 2019, the Fund did not hold any repurchase agreements.
(H) Dollar Rolls. The Fund may enter into dollar roll transactions in which it sells mortgage-backed securities (“MBS”) from its portfolio to a counterparty from whom it simultaneously agrees to buy a similar security on a delayed delivery basis. The Fund generally transfers MBS where the MBS are “to be announced,” therefore, the Fund accounts for these transactions as purchases and sales.
When accounted for as purchase and sales, the securities sold in connection with the dollar rolls are removed from the portfolio and a realized gain or loss is recognized. The securities the Fund has agreed to acquire are included at market value in the Portfolio of Investments and liabilities for such purchase commitments are included as payables for investments purchased. During the roll period, the Fund foregoes principal and interest paid on the securities. The Fund is compensated by the difference between the current sales price and the forward price for the future as well as by the earnings on the cash proceeds of the initial sale. Dollar rolls may be renewed without physical delivery of the securities subject to the contract. The Fund maintains liquid assets from its portfolio having a value not less than the repurchase price, including accrued interest. Dollar roll transactions involve certain risks, including the risk that the securities returned to the Fund at the end of the roll period, while substantially similar, could be inferior to what was initially sold to the counterparty.
(I) Futures Contracts. A futures contract is an agreement to purchase or sell a specified quantity of an underlying instrument at a specified future date and price, or to make or receive a cash payment based on the value of a financial instrument (e.g., foreign currency, interest rate, security or securities index). The Fund is subject to risks such as market price risk and/or interest rate risk in the normal course of investing in these transactions. Upon entering into a futures contract, the Fund is required to pledge to the broker or futures commission merchant an amount of cash and/or U.S. government securities equal to a certain percentage of the collateral amount, known as the “initial margin.” During the period the futures contract is open, changes in the value of the contract are recognized as unrealized appreciation or depreciation by marking to market such contract on a daily basis to reflect the market value of the contract at the end of each day’s trading. The Fund agrees to receive from or pay to the broker or futures commission merchant an amount of cash equal to the daily fluctuation in the value of the contract. Such receipts or payments are known as “variation margin.” When the futures contract is closed, the Fund records a realized gain or loss equal to the difference between the proceeds from (or cost of) the closing transaction and the Fund’s basis in the contract.
The use of futures contracts involves, to varying degrees, elements of market risk in excess of the amount recognized in the Statement of Assets and Liabilities. The contract or notional amounts and variation margin reflect the extent of the Fund’s involvement in open futures positions. There are several risks associated with the use of futures contracts as hedging techniques. There can be no assurance that a liquid market will exist at the time when the Fund seeks to close out a futures contract. If no liquid market exists, the Fund would remain obligated to meet margin requirements until the position is closed. Futures may involve a small initial investment relative to the risk assumed, which could result in losses greater than if they had not been used. Futures may be more volatile than direct investments in the instrument underlying the futures and may not correlate to the underlying instrument, causing a given hedge not to achieve its objectives. The Fund’s activities in futures contracts have minimal counterparty risk as they are conducted through regulated exchanges that guarantee the futures against default by the counterparty. In the event of a bankruptcy or insolvency of a futures commission merchant that holds margin on behalf of the Fund, the Fund may not be entitled to the return of the entire margin owed to the Fund, potentially resulting in a loss. The Fund’s investment in futures contracts and other derivatives may increase the volatility of the Fund’s NAVs and may result in a loss to the Fund. As of October 31, 2019, open futures contracts are shown in the Portfolio of Investments.
(J) Loan Assignments, Participations and Commitments. The Fund primarily invests in loan assignments and participations (“loans”). Commitments are agreements to make money available to a borrower in a specified amount, at a specified rate and within a specified time. The Fund records an investment when the borrower withdraws money on a commitment or when a funded loan is purchased (trade date) and records interest as earned. These loans pay interest at rates that are periodically reset by reference to a base lending rate plus a spread. These base lending rates are generally the prime rate offered by a designated U.S. bank or the London Interbank Offered Rate (“LIBOR”).
Notes to Financial Statements(continued)
The loans in which the Fund invests are generally readily marketable, but may be subject to some restrictions on resale. For example, the Fund may be contractually obligated to receive approval from the agent bank and/or borrower prior to the sale of these investments. If the Fund purchases an assignment from a lender, the Fund will generally have direct contractual rights against the borrower in favor of the lender. If the Fund purchases a participation interest either from a lender or a participant, the Fund typically will have established a direct contractual relationship with the seller of the participation interest, but not with the borrower. Consequently, the Fund is subject to the credit risk of the lender or participant who sold the participation interest to the Fund, in addition to the usual credit risk of the borrower. In the event that the borrower, selling participant or intermediate participants become insolvent or enter into bankruptcy, the Fund may incur certain costs and delays in realizing payment, or may suffer a loss of principal and/or interest.
Unfunded commitments represent the remaining obligation of the Fund to the borrower. At any point in time, up to the maturity date of the issue, the borrower may demand the unfunded portion. Unfunded amounts, if any, are marked to market and any unrealized gains or losses are recorded in the Statement of Assets and Liabilities. As of October 31, 2019, the Fund held unfunded commitments. (See Note 5)
(K) Securities Lending. In order to realize additional income, the Fund may engage in securities lending, subject to the limitations set forth in the 1940 Act and relevant guidance by the staff of the Securities and Exchange Commission (“SEC”). In the event the Fund does engage in securities lending, the Fund will lend through its custodian, State Street Bank and Trust Company (“State Street”), acting as securities lending agent on behalf of the Fund. State Street will manage the Fund’s collateral in accordance with the securities lending agency agreement between the Fund and State Street, and indemnify the Fund against counterparty risk. The loans will be collateralized by cash (which may be invested in a money market fund) and/ornon-cash collateral (which may include U.S. Treasury securities and/or U.S. Government Agency securities issued or guaranteed by the United States government or its agencies or instrumentalities) at least equal at all times to the market value of the securities loaned. The Fund may bear the risk of delay in recovery of, or loss of rights in, the securities loaned should the borrower of the securities experience financial difficulty. The Fund may also record a realized gain or loss on securities deemed sold due to a borrower’s inability to return securities on loan. The Fund bears the risk of any loss on investment of cash collateral. The Fund will receive compensation for lending its securities in the form of fees or it will retain a portion of interest earned on the investment of any cash collateral. The Fund will also continue to receive interest and dividends on the securities loaned and any gain or loss in the market price of the securities loaned that may occur during the term of the loan will be for the account of the Fund. Income earned from securities lending activities, if any, is reflected in the Statement of Operations. As of October 31, 2019, the Fund did not have any portfolio securities on loan.
(L) Government, Infrastructure Investment and Municipal Bond Risk. Investments in the Fund are not guaranteed, even though some of the Fund’s underlying investments are guaranteed by the U.S. government or its agencies or instrumentalities. The principal risk of mortgage-related and asset-backed securities is that the underlying
debt may be prepaid ahead of schedule, if interest rates fall, thereby reducing the value of the Fund’s investment. If interest rates rise, less of the debt may be prepaid and the Fund may lose money because the Fund may be unable to invest in higher yielding assets. The Fund is subject to interest-rate risk and can lose principal value when interest rates rise. Bonds are also subject to credit risk, in which the bond issuer may fail to pay interest and principal in a timely manner.
The Fund’s investments in infrastructure-related securities will expose the Fund to potential adverse economic, regulatory, political, legal and other changes affecting such investments. Issuers of securities in infrastructure-related businesses are subject to a variety of factors that may adversely affect their business or operations, including high interest costs in connection with capital construction programs, high leverage, costs associated with environmental or other regulations and the effects of economic slowdowns. Rising interest rates could lead to higher financing costs and reduced earnings for infrastructure companies.
Municipal bond risks include the inability of the issuer to repay the obligation, the relative lack of information about certain issuers, and the possibility of future tax and legislative changes, which could affect the market for and value of municipal securities.
Municipalities continue to experience political, economic and financial difficulties in the current economic environment. The ability of a municipal issuer to make payments and the value of municipal bonds can be affected by uncertainties in the municipal securities market. Such uncertainties could cause increased volatility in the municipal securities market and could negatively impact the Fund’s net asset value, and/or the distributions paid by the Fund.
(M) Indemnifications. Under the Trust’s organizational documents, its officers and trustees are indemnified against certain liabilities that may arise out of performance of their duties to the Trust. Additionally, in the normal course of business, the Fund enters into contracts with third-party service providers that contain a variety of representations and warranties and which may provide general indemnifications. The Fund’s maximum exposure under these arrangements is unknown, as this would involve future claims that may be made against the Fund that have not yet occurred. Based on experience, management is of the view that the risk of loss in connection with these potential indemnification obligations is remote. However, there can be no assurance that material liabilities related to such obligations will not arise in the future, which could adversely impact the Fund.
(N) Quantitative Disclosure of Derivative Holdings. The following tables show additional disclosures related to the Fund’s derivative and hedging activities, including how such activities are accounted for and their effect on the Fund’s financial positions, performance and cash flows. The Fund entered into futures contracts to help manage the duration and yield curve positioning of the portfolio. These derivatives are not accounted for as hedging instruments.
| | |
| 30 | | MainStay MacKay Infrastructure Bond Fund |
Fair value of derivative instruments as of October 31, 2019:
Asset Derivatives
| | | | | | | | | | |
| | | Statement of
Assets and
Liabilities
Location | | Interest
Rate
Contracts
Risk | | | Total | |
| | | |
Futures Contracts | | Net Assets—Net unrealized appreciation on investments and futures contracts (a) | | $ | 339,203 | | | $ | 339,203 | |
| | | | | | |
Total Fair Value | | | | $ | 339,203 | | | $ | 339,203 | |
| | | | | | |
| (a) | Includes cumulative appreciation (depreciation) of futures contracts as reported in the Portfolio of Investments. Only current day’s variation margin is reported within the Statement of Assets and Liabilities. |
The effect of derivative instruments on the Statement of Operations for the year ended October 31, 2019:
Realized Gain (Loss)
| | | | | | | | | | |
| | | Statement of
Operations
Location | | Interest
Rate
Contracts
Risk | | | Total | |
| | | |
Futures Contracts | | Net realized gain (loss) on futures transactions | | $ | (1,166,144 | ) | | $ | (1,166,144 | ) |
| | | | | | |
Total Realized Gain (Loss) | | | | $ | (1,166,144 | ) | | $ | (1,166,144 | ) |
| | | | | | |
Change in Unrealized Appreciation (Depreciation)
| | | | | | | | | | |
| | | Statement of
Operations
Location | | Interest
Rate
Contracts
Risk | | | Total | |
| | | |
Futures Contracts | | Net change in unrealized appreciation (depreciation) on futures contracts | | $ | 339,203 | | | $ | 339,203 | |
| | | | | | |
Total Change in Unrealized Appreciation (Depreciation) | | | | $ | 339,203 | | | $ | 339,203 | |
| | | | | | |
Average Notional Amount
| | | | | | |
| | | Interest
Rate
Contracts
Risk | | Total | |
| | |
Futures Contracts Short (a) | | $(24,287,648) | | $ | (24,287,648 | ) |
| | | |
| (a) | Positions were open seven months during the reporting period. |
Note 3–Fees and Related Party Transactions
(A) Manager and Subadvisor. New York Life Investments, a registered investment adviser and an indirect,wholly-owned subsidiary of New York Life Insurance Company (“New York Life”), serves as the Fund’s Manager, pursuant to an Amended and Restated Management Agreement (“Management Agreement”). The Manager provides offices, conducts clerical, recordkeeping and bookkeeping services and keeps most of the financial and accounting records required to be maintained by the Fund. Except for the portion of salaries and expenses that are the responsibility of the Fund, the Manager pays the salaries and expenses of all personnel affiliated with the Fund and certain operational expenses of the Fund. The Fund reimburses New York Life Investments in an amount equal to a portion of the compensation of the Chief Compliance Officer attributable to the Fund. MacKay Shields LLC (“MacKay Shields” or the “Subadvisor”), a registered investment adviser and an indirect,wholly-owned subsidiary of New York Life, serves as Subadvisor to the Fund and is responsible for theday-to-day portfolio management of the Fund. Pursuant to the terms of an Amended and Restated Subadvisory Agreement (“Subadvisory Agreement”) between New York Life Investments and MacKay Shields, New York Life Investments pays for the services of the Subadvisor.
Under the Management Agreement, the Fund pays the Manager a monthly fee for the services performed and the facilities furnished at an annual rate of the Fund’s average daily net assets as follows: 0.50% up to $500 million; 0.475% from $500 million to $1 billion; and 0.45% in excess of $1 billion. During the year ended October 31, 2019, the effective management fee rate (exclusive of any applicable waivers/reimbursements) was 0.50%.
Effective February 28, 2019, New York Life Investments has contractually agreed to waive fees and/or reimburse expenses so that Total Annual Fund Operating Expenses (excluding taxes, interest, litigation, extraordinary expenses, brokerage and other transaction expenses relating to the purchase or sale of portfolio investments and acquired (underlying) fund fees and expenses) for Class A shares do not exceed 0.85% of its average daily net assets. New York Life Investments will apply an equivalent waiver or reimbursement, in an equal number of basis points, to the other share classes of the Fund, except for Class R6. New York Life Investments has also contractually agreed to waive fees and/or reimburse expenses so that Total Annual Fund Operating Expenses (excluding taxes, interest, litigation, extraordinary expenses, brokerage and other transaction expenses relating to the purchase or sale of portfolio investments, and acquired (underlying) fund fees and expenses) of Class R6 do not exceed those of Class I. These agreements will remain in effect until February 28, 2021, and shall renew automatically for one-year terms unless New York Life Investments provides written notice of termination prior to the start of the next term or upon approval of the Board.
Prior to February 28, 2019, New York Life Investments had contractually agreed to waive fees and/or reimburse expenses so that Total Annual Fund Operating Expenses (excluding taxes, interest, litigation, extraordinary expenses, brokerage and other transaction expenses relating to the purchase or sale of portfolio investments and acquired (underlying) fund fees and expenses) for Class A shares did not exceed 1.00% of its average daily net assets. New York Life Investments would apply an equivalent waiver or reimbursement, in an equal number of basis points,
Notes to Financial Statements(continued)
to the other share classes of the Fund, except for Class R6. New York Life Investments had also contractually agreed to waive fees and/or reimburse expenses so that Total Annual Fund Operating Expenses (excluding taxes, interest, litigation, extraordinary expenses, brokerage and other transaction expenses relating to the purchase or sale of portfolio investments, and acquired (underlying) fund fees and expenses) of Class R6 did not exceed those of Class I.
During the year ended October 31, 2019, New York Life Investments earned fees from the Fund in the amount of $734,582 and waived fees/reimbursed expenses in the amount of $199,102 and paid the Subadvisor in the amount of $271,824.
State Street providessub-administration andsub-accounting services to the Fund pursuant to an agreement with New York Life Investments. These services include calculating the daily NAVs of the Fund, maintaining the general ledger andsub-ledger accounts for the calculation of the Fund’s NAVs and assisting New York Life Investments in conducting various aspects of the Fund’s administrative operations. For providing these services to the Fund, State Street is compensated by New York Life Investments.
Pursuant to an agreement between the Trust and New York Life Investments, New York Life Investments is responsible for providing or procuring certain regulatory reporting services for the Fund. The Fund will reimburse New York Life Investments for the actual costs incurred by New York Life Investments in connection with providing or procuring these services for the Fund.
(B) Distribution and Service Fees. The Trust, on behalf of the Fund, has entered into a distribution agreement with NYLIFE Distributors LLC (the “Distributor”), an indirect,wholly-owned subsidiary of New York Life. The Fund has adopted distribution plans (the “Plans”) in accordance with the provisions of Rule 12b-1 under the 1940 Act.
Pursuant to the Class A and Investor Class Plans, the Distributor receives a monthly distribution fee from the Class A and Investor Class shares at an annual rate of 0.25% of the average daily net assets of the Class A and Investor Class shares for distribution and/or service activities as designated by the Distributor. Pursuant to the Class B and Class C Plans, Class B and Class C shares pay the Distributor a monthly distribution fee at an annual rate of 0.75% of the average daily net assets of the Class B and Class C shares along with a service fee at an annual rate of 0.25% of the average daily net assets of the Class B and
Class C shares, for a total 12b-1 fee of 1.00%. Class I and Class R6 shares are not subject to a distribution and/or service fee.
The Plans provide that the distribution and service fees are payable to the Distributor regardless of the amounts actually expended by the Distributor for distribution of the Fund’s shares and service activities.
(C) Sales Charges. During the year ended October 31, 2019, the Fund was advised by the Distributor that the amount of initial sales charges retained on sales of Class A and Investor Class shares were $7,109 and $1,950, respectively.
During the year ended October 31, 2019, the Fund was also advised that the Distributor retained CDSCs on redemptions of Class A, Investor Class, Class B and Class C shares of $46, $56, $2,444 and $230, respectively.
(D) Transfer, Dividend Disbursing and Shareholder Servicing Agent. NYLIM Service Company LLC, an affiliate of New York Life Investments, is the Fund’s transfer, dividend disbursing and shareholder servicing agent pursuant to an agreement between NYLIM Service Company LLC and the Trust. NYLIM Service Company LLC has entered into an agreement with DST Asset Manager Solutions, Inc. (“DST”), pursuant to which DST performs certain transfer agent services on behalf of NYLIM Service Company LLC. During the year ended October 31, 2019, transfer agent expenses incurred by the Fund were as follows:
| | | | |
Class A | | $ | 67,331 | |
Investor Class | | | 88,987 | |
Class B | | | 12,234 | |
Class C | | | 55,720 | |
Class I | | | 34,012 | |
(E) Small Account Fee. Shareholders with small accounts adversely impact the cost of providing transfer agency services. In an effort to reduce total transfer agency expenses, the Fund has implemented a small account fee on certain types of accounts. Certain shareholders with an account balance of less than $1,000 are charged an annual per account fee of $20 (assessed semi-annually), the proceeds from which offset transfer agent fees as reflected in the Statement of Operations.
(F) Investments in Affiliates (in 000’s). During the year ended October 31, 2019, purchases and sales transactions, income earned from investments and shares held of investment companies managed by New York Life Investments or its affiliates were as follows:
| | | | | | | | | | | | | | | | | | | | | | | | | | | | | | | | | | | | |
Affiliated Investment
Company | | Value,
Beginning of
Year | | | Purchases at Cost | | | Proceeds
from
Sales | | | Net
Realized
Gain/ (Loss)
on Sales | | | Change in
Unrealized
Appreciation/
(Depreciation) | | | Value,
End
of
Year | | | Dividend
Income | | | Other
Distributions | | | Shares
End of
Year | |
MainStay U.S. Government Liquidity Fund | | $ | 1,801 | | | $ | 62,888 | | | $ | (64,689 | ) | | $ | — | | | $ | — | | | $ | — | | | $ | 33 | | | $ | — | | | | — | |
| | |
| 32 | | MainStay MacKay Infrastructure Bond Fund |
Note 4–Federal Income Tax
As of October 31, 2019, the cost and unrealized appreciation (depreciation) of the Fund’s investment portfolio, including applicable derivative contracts and other financial instruments, as determined on a federal income tax basis, were as follows:
| | | | | | | | | | | | | | | | |
| | | Federal Tax
Cost | | | Gross
Unrealized
Appreciation | | | Gross
Unrealized
(Depreciation) | | | Net
Unrealized
Appreciation/
(Depreciation) | |
| | | | |
Investments in Securities | | $ | 304,992,900 | | | $ | 8,532,211 | | | $ | (1,183,618 | ) | | $ | 7,348,593 | |
As of October 31, 2019, the components of accumulated gain (loss) on a tax basis were as follows:
| | | | | | | | |
Ordinary
Income | | Accumulated
Capital and
Other Gain
(Loss) | | Other
Temporary
Differences | | Unrealized
Appreciation
(Depreciation) | | Total
Accumulated
Gain (Loss) |
| | | | |
| $— | | $(958,773) | | $(12,557) | | $7,419,743 | | $6,448,413 |
The difference between book-basis and tax-basis unrealized appreciation (depreciation) is primarily due to mark to market of futures contracts. The other temporary differences are primarily due to dividends payable.
As of October 31, 2019, for federal income tax purposes, capital loss carryforwards of $886,685 were available as shown in the table below, to the extent provided by the regulations to offset future realized gains of the Fund through the years indicated. To the extent that these capital loss carryforwards are used to offset future capital gains, it is probable that the capital gains so offset will not be distributed to shareholders. No capital gain distributions shall be made until any capital loss carryforwards have been fully utilized or expired.
| | | | |
Capital Loss
Available Through | | Short-Term
Capital Loss
Amounts (000’s) | | Long-Term
Capital Loss
Amounts (000’s) |
| | |
| Unlimited | | $— | | $887 |
The Fund utilized $1,796,979 of capital loss carryforwards during the year ended October 31, 2019.
During the years ended October 31, 2019 and October 31, 2018, the tax character of distributions paid as reflected in the Statements of Changes in Net Assets were as follows:
| | | | | | | | |
| | | 2019 | | | 2018 | |
| | |
Distributions paid from: | | | | | | | | |
Ordinary Income | | $ | 3,536,690 | | | $ | 2,500,106 | |
Return of Capital | | | 22,317 | | | | — | |
Total | | $ | 3,559,007 | | | $ | 2,500,106 | |
Note 5–Commitments and Contingencies
As of October 31, 2019, the Fund had unfunded commitments pursuant to the following loan agreements:
| | | | | | | | |
Borrower | | Unfunded
Commitments | | | Unrealized
Appreciation/
(Depreciation) | |
| | |
PG&E Corp.
DIP Term Loan
4.24%, due 12/31/20 | | $ | 750,000 | | | $ | (938 | ) |
| | | | | | | | |
Total | | $ | 750,000 | | | $ | (938 | ) |
| | | | | | | | |
Commitments are available until maturity date.
Note 6–Custodian
State Street is the custodian of cash and securities held by the Fund. Custodial fees are charged to the Fund based on the Fund’s net assets and/or the market value of securities held by the Fund and the number of certain transactions incurred by the Fund.
Note 7–Line of Credit
The Fund and certain other funds managed by New York Life Investments maintain a line of credit with a syndicate of banks in order to secure a source of funds for temporary purposes to meet unanticipated or excessive redemption requests.
Effective July 30, 2019, under the credit agreement (the “Credit Agreement”), the aggregate commitment amount is $600,000,000 with an additional uncommitted amount of $100,000,000. The commitment fee is an annual rate of 0.15% of the average commitment amount payable quarterly, regardless of usage, to State Street, who serves as the agent to the syndicate. The commitment fee is allocated among the Fund and certain other funds managed by New York Life Investments based upon their respective net assets and other factors. Interest on any revolving credit loan is charged based upon the Federal Funds Rate or the one-month London Interbank Offered Rate (“LIBOR”), whichever is higher. The Credit Agreement expires on July 28, 2020, although the Fund, certain other funds managed by New York Life Investments and the syndicate of banks may renew the Credit Agreement for an additional year on the same or different terms. Prior to July 30, 2019, the aggregate commitment amount and the commitment fee were the same as those under the current Credit Agreement. During the year ended October 31, 2019, there were no borrowings made or outstanding with respect to the Fund under the Credit Agreement.
Note 8–Interfund Lending Program
Pursuant to an exemptive order issued by the SEC, the Fund, along with certain other funds managed by New York Life Investments, may participate in an interfund lending program. The interfund lending program provides an alternative credit facility that permits the Fund and certain other funds managed by New York Life Investments to lend or borrow money for temporary purposes directly to or from one another subject to the conditions of the exemptive order. During the year ended October 31, 2019, there were no interfund loans made or outstanding with respect to the Fund.
Notes to Financial Statements(continued)
Note 9–Purchases and Sales of Securities (in 000’s)
During the year ended October 31, 2019, purchases and sales of U.S. government securities were $34,918 and $129,484, respectively. Purchases and sales of securities, other than U.S. government securities andshort-term securities, were $307,695 and $46,732, respectively.
Note 10–Capital Share Transactions
Transactions in capital shares for the years ended October 31, 2019 and October 31, 2018, were as follows:
| | | | | | | | |
Class A | | Shares | | | Amount | |
| | |
Year ended October 31, 2019: | | | | | | | | |
Shares sold | | | 2,483,034 | | | $ | 21,267,086 | |
Shares issued to shareholders in reinvestment of dividends and distributions | | | 198,336 | | | | 1,655,770 | |
Shares redeemed | | | (1,723,515 | ) | | | (14,417,422 | ) |
| | | | |
Net increase (decrease) in shares outstanding before conversion | | | 957,855 | | | | 8,505,434 | |
Shares converted into Class A (See Note 1) | | | 264,044 | | | | 2,211,330 | |
Shares converted from Class A (See Note 1) | | | (44,428 | ) | | | (372,608 | ) |
| | | | |
Net increase (decrease) | | | 1,177,471 | | | $ | 10,344,156 | |
| | | | |
Year ended October 31, 2018: | | | | | | | | |
Shares sold | | | 207,443 | | | $ | 1,680,510 | |
Shares issued to shareholders in reinvestment of dividends and distributions | | | 198,448 | | | | 1,609,156 | |
Shares redeemed | | | (1,828,879 | ) | | | (14,888,704 | ) |
| | | | |
Net increase (decrease) in shares outstanding before conversion | | | (1,422,988 | ) | | | (11,599,038 | ) |
Shares converted into Class A (See Note 1) | | | 138,473 | | | | 1,123,106 | |
Shares converted from Class A (See Note 1) | | | (58,839 | ) | | | (475,124 | ) |
| | | | |
Net increase (decrease) | | | (1,343,354 | ) | | $ | (10,951,056 | ) |
| | | | |
| | |
| | | | | | | | |
Investor Class | | Shares | | | Amount | |
| | |
Year ended October 31, 2019: | | | | | | | | |
Shares sold | | | 330,191 | | | $ | 2,828,870 | |
Shares issued to shareholders in reinvestment of dividends and distributions | | | 53,195 | | | | 445,473 | |
Shares redeemed | | | (541,415 | ) | | | (4,576,168 | ) |
| | | | |
Net increase (decrease) in shares outstanding before conversion | | | (158,029 | ) | | | (1,301,825 | ) |
Shares converted into Investor Class (See Note 1) | | | 106,250 | | | | 884,152 | |
Shares converted from Investor Class (See Note 1) | | | (220,504 | ) | | | (1,863,200 | ) |
| | | | |
Net increase (decrease) | | | (272,283 | ) | | $ | (2,280,873 | ) |
| | | | |
Year ended October 31, 2018: | | | | | | | | |
Shares sold | | | 82,740 | | | $ | 675,433 | |
Shares issued to shareholders in reinvestment of dividends and distributions | | | 53,673 | | | | 437,016 | |
Shares redeemed | | | (377,584 | ) | | | (3,081,823 | ) |
| | | | |
Net increase (decrease) in shares outstanding before conversion | | | (241,171 | ) | | | (1,969,374 | ) |
Shares converted into Investor Class (See Note 1) | | | 96,421 | | | | 783,567 | |
Shares converted from Investor Class (See Note 1) | | | (111,225 | ) | | | (906,001 | ) |
| | | | |
Net increase (decrease) | | | (255,975 | ) | | $ | (2,091,808 | ) |
| | | | |
| | | | | | | | |
Class B | | Shares | | | Amount | |
| | |
Year ended October 31, 2019: | | | | | | | | |
Shares sold | | | 131,792 | | | $ | 1,127,557 | |
Shares issued to shareholders in reinvestment of dividends and distributions | | | 4,588 | | | | 38,174 | |
Shares redeemed | | | (186,750 | ) | | | (1,576,294 | ) |
| | | | |
Net increase (decrease) in shares outstanding before conversion | | | (50,370 | ) | | | (410,563 | ) |
Shares converted from Class B (See Note 1) | | | (52,599 | ) | | | (436,179 | ) |
| | | | |
Net increase (decrease) | | | (102,969 | ) | | $ | (846,742 | ) |
| | | | |
Year ended October 31, 2018: | | | | | | | | |
Shares sold | | | 13,090 | | | $ | 106,303 | |
Shares issued to shareholders in reinvestment of dividends and distributions | | | 5,700 | | | | 46,265 | |
Shares redeemed | | | (115,760 | ) | | | (941,872 | ) |
| | | | |
Net increase (decrease) in shares outstanding before conversion | | | (96,970 | ) | | | (789,304 | ) |
Shares converted from Class B (See Note 1) | | | (64,751 | ) | | | (525,548 | ) |
| | | | |
Net increase (decrease) | | | (161,721 | ) | | $ | (1,314,852 | ) |
| | | | |
| | |
| | | | | | | | |
Class C | | Shares | | | Amount | |
| | |
Year ended October 31, 2019: | | | | | | | | |
Shares sold | | | 1,317,967 | | | $ | 10,719,427 | |
Shares issued to shareholders in reinvestment of dividends and distributions | | | 22,738 | | | | 189,819 | |
Shares redeemed | | | (609,489 | ) | | | (5,041,814 | ) |
| | | | |
Net increase (decrease) in shares outstanding before conversion | | | 731,216 | | | | 5,867,432 | |
Shares converted from Class C (See Note 1) | | | (52,338 | ) | | | (423,495 | ) |
| | | | |
Net increase (decrease) | | | 678,878 | | | $ | 5,443,937 | |
| | | | |
Year ended October 31, 2018: | | | | | | | | |
Shares sold | | | 216,696 | | | $ | 1,741,803 | |
Shares issued to shareholders in reinvestment of dividends and distributions | | | 10,834 | | | | 87,818 | |
Shares redeemed | | | (405,938 | ) | | | (3,300,912 | ) |
| | | | |
Net increase (decrease) | | | (178,408 | ) | | $ | (1,471,291 | ) |
| | | | |
| | |
| | | | | | | | |
Class I | | Shares | | | Amount | |
| | |
Year ended October 31, 2019: | | | | | | | | |
Shares sold | | | 21,884,723 | | | $ | 190,717,129 | |
Shares issued to shareholders in reinvestment of dividends and distributions | | | 120,425 | | | | 1,049,287 | |
Shares redeemed | | | (2,326,238 | ) | | | (20,051,137 | ) |
| | | | |
Net increase (decrease) | | | 19,678,910 | | | $ | 171,715,279 | |
| | | | |
Year ended October 31, 2018: | | | | | | | | |
Shares sold | | | 143,403 | | | $ | 1,188,216 | |
Shares issued to shareholders in reinvestment of dividends and distributions | | | 16,667 | | | | 136,624 | |
Shares redeemed | | | (359,405 | ) | | | (2,954,096 | ) |
| | | | |
Net increase (decrease) | | | (199,335 | ) | | $ | (1,629,256 | ) |
| | | | |
| | |
| 34 | | MainStay MacKay Infrastructure Bond Fund |
Note 11–Recent Accounting Pronouncement
In March 2017, the Financial Accounting Standards Board issued an Accounting Standards Update, ASU2017-08, which amends the amortization period for certain callable debt securities that are held at a premium. The amendment requires the premium to be amortized to the earliest call date. This amendment does not require an accounting change for securities held at a discount. This guidance is effective for fiscal years beginning after December 15, 2018. At this time, management is evaluating the implications of the ASU and any impact on the financial statements has not yet been determined.
To improve the effectiveness of fair value disclosure requirements, the Financial Accounting Standards Board recently issued Accounting Standards Update (ASU)2018-13, Fair Value Measurement Disclosure Framework—Changes to the Disclosure Requirements for Fair Value Measurement (ASU2018-13), which adds, removes, and modifies certain aspects relating to fair value disclosure. ASU2018-13 is effective for interim and annual reporting periods beginning after December 15, 2019; early adoptions of the entire ASU 2018-13, or portions thereof, is permitted. Management has evaluated the
implications of certain other provisions of the ASU and has determined to early adopt aspects related to the removal and modifications of certain fair value measurement disclosures under the ASU effective immediately. At this time, management is evaluating the implications of certain other provisions of the ASU related to new disclosure requirements and any impact on the financial statement disclosures has not yet been determined.
Note 12–Subsequent Events
In connection with the preparation of the financial statements of the Fund as of and for the year ended October 31, 2019, events and transactions subsequent to October 31, 2019, through the date the financial statements were issued have been evaluated by the Fund’s management for possible adjustment and/or disclosure. No subsequent events requiring financial statement adjustment or disclosure have been identified, other than the following:
Effective November 1, 2019, Class R6 shares of the Fund have now been made available for purchase.
Report of Independent Registered Public Accounting Firm
To the Shareholders and Board of Trustees
The MainStay Funds:
Opinion on the Financial Statements
We have audited the accompanying statement of assets and liabilities of MainStay MacKay Infrastructure Bond Fund (formerly MainStay MacKay Government Fund) (the Fund), one of the funds constituting The MainStay Funds, including the portfolio of investments, as of October 31, 2019, the related statement of operations for the year then ended, the statements of changes in net assets for each of the years in the two-year period then ended, and the related notes (collectively, the financial statements) and the financial highlights for each of the years in the five-year period then ended. In our opinion, the financial statements and financial highlights present fairly, in all material respects, the financial position of the Fund as of October 31, 2019, the results of its operations for the year then ended, the changes in its net assets for each of the years in the two-year period then ended, and the financial highlights for each of the years in the five-year period then ended, in conformity with U.S. generally accepted accounting principles.
Basis for Opinion
These financial statements and financial highlights are the responsibility of the Fund’s management. Our responsibility is to express an opinion on these financial statements and financial highlights based on our audits. We are a public accounting firm registered with the Public Company Accounting Oversight Board (United States) (PCAOB) and are required to be independent with respect to the Fund in accordance with the U.S. federal securities laws and the applicable rules and regulations of the Securities and Exchange Commission and the PCAOB.
We conducted our audits in accordance with the standards of the PCAOB. Those standards require that we plan and perform the audit to obtain reasonable assurance about whether the financial statements and financial highlights are free of material misstatement, whether due to error or fraud. Our audits included performing procedures to assess the risks of material misstatement of the financial statements and financial highlights, whether due to error or fraud, and performing procedures that respond to those risks. Such procedures included examining, on a test basis, evidence regarding the amounts and disclosures in the financial statements and financial highlights. Such procedures also included confirmation of securities owned as of October 31, 2019, by correspondence with the custodian and brokers or by other appropriate auditing procedures when replies from brokers were not received. Our audits also included evaluating the accounting principles used and significant estimates made by management, as well as evaluating the overall presentation of the financial statements and financial highlights. We believe that our audits provide a reasonable basis for our opinion.

We have served as the auditor of one or more New York Life Investment Management investment companies since 2003.
Philadelphia, Pennsylvania
December 23, 2019
| | |
| 36 | | MainStay MacKay Infrastructure Bond Fund |
Federal Income Tax Information
(Unaudited)
The Fund is required under the Internal Revenue Code to advise shareholders in a written statement as to the federal tax status of dividends paid by the Fund during such fiscal years.
In February 2020, shareholders will receive an IRS Form1099-DIV or substitute Form 1099, which will show the federal tax status of the distributions received by shareholders in calendar year 2019. The amounts that will be reported on such1099-DIV or substitute Form 1099 will be the amounts you are to use on your federal income tax return and will differ from the amounts which we must report for the Fund’s fiscal year end October 31, 2019.
Proxy Voting Policies and Procedures and Proxy Voting Record
A description of the policies and procedures that New York Life Investments uses to vote proxies related to the Fund’s securities is available without charge, upon request, by visiting the MainStay Funds’ website atnylinvestments.com/fundsor visiting the SEC’s website atwww.sec.gov.
The Fund is required to file with the SEC its proxy voting records for the12-month period ending June 30 on Form N-PX. The most recent Form N-PX or proxy voting record is available free of charge upon request by calling800-624-6782; visiting the MainStay Funds’ website atnylinvestments.com/funds; or visiting the SEC’s website atwww.sec.gov.
Shareholder Reports and Quarterly Portfolio Disclosure
The Fund is required to file its complete schedule of portfolio holdings with the SEC 60 days after its first and third fiscal quarter onForm N-PORT. The Fund’s holdings report is available free of charge by visiting the SEC’s website atwww.sec.govor upon request by calling New York Life Investments at800-624-6782.
Board of Trustees and Officers(Unaudited)
The Trustees and officers of the Funds are listed below. The Board oversees the MainStay Group of Funds (which consists of MainStay Funds and MainStay Funds Trust), MainStay VP Funds Trust, MainStay MacKay DefinedTerm Municipal Opportunities Fund, the Manager and the Subadvisors, and elects the officers of the Funds who are responsible for theday-to-day operations of the Funds. Information pertaining to the Trustees and officers is set forth below. Each Trustee serves until his or her successor is elected and qualified or until his or her
resignation, death or removal. Under the Board’s retirement policy, unless an exception is made, a Trustee must tender his or her resignation by the end of the calendar year during which he or she reaches the age of 75. Officers are elected annually by the Board. The business address of each Trustee and officer listed below is 51 Madison Avenue, New York, New York 10010. A majority of the Trustees are not “interested persons” (as defined by the 1940 Act and rules adopted by the SEC thereunder) of the Fund (“Independent Trustees”).
| | | | | | | | | | | | |
| | | | | Name and
Year of Birth | | Term of Office,
Position(s) Held and
Length of Service | | Principal Occupation(s)
During Past Five Years | | Number of
Portfolios in
Fund Complex
Overseen by
Trustee | | Other Directorships
Held by Trustee |
Interested Trustee | | | | Yie-Hsin Hung* 1962 | | MainStay Funds: Trustee since 2017; MainStay Funds Trust:Trustee since 2017. | | Senior Vice President of New York Life since joining in 2010, Member of the Executive Management Committee since 2017, Chief Executive Officer, New York Life Investment Management Holdings LLC & New York Life Investment Management LLC since 2015. Senior Managing Director andCo-President of New York Life Investment Management LLC from January 2014 to May 2015. Previously held positions of increasing responsibility, including head of NYLIM International, Alternative Growth Businesses, and Institutional investments since joining New York Life in 2010. | | 74 | | MainStay VP Funds Trust:
Trustee since 2017 (31 portfolios); and
MainStay MacKay DefinedTerm Municipal Opportunities Fund: Trustee since 2017. |
| | * | This Trustee is considered to be an “interested person” of the MainStay Group of Funds, MainStay VP Funds Trust and MainStay MacKay DefinedTerm Municipal Opportunities Fund, within the meaning of the 1940 Act because of her affiliation with New York Life Insurance Company, New York Life Investment Management LLC, Candriam Belgium S.A., Candriam Luxembourg S.C.A., IndexIQ Advisors LLC, MacKay Shields LLC, NYL Investors LLC, NYLIFE Securities LLC and/or NYLIFE Distributors LLC, as described in detail above in the column entitled “Principal Occupation(s) During Past Five Years.” |
| | |
| 38 | | MainStay MacKay Infrastructure Bond Fund |
| | | | | | | | | | | | |
| | | | | Name and
Year of Birth | | Term of Office,
Position(s) Held and
Length of Service | | Principal Occupation(s)
During Past Five Years | | Number of
Portfolios in
Fund Complex
Overseen by
Trustee | | Other Directorships
Held by Trustee |
Independent Trustees | | | | David H. Chow 1957 | | MainStay Funds: Trustee since 2016, Advisory Board Member (June 2015 to December 2015); MainStay Funds Trust:Trustee since 2016, Advisory Board Member (June 2015 to December 2015). | | Founder and CEO, DanCourt Management, LLC (since 1999) | | 74 | | MainStay VP Funds Trust: Trustee since 2016, Advisory Board Member (June 2015 to December 2015) (31 portfolios);
MainStay MacKay DefinedTerm Municipal Opportunities Fund: Trustee since 2016, Advisory Board Member (June 2015 to December 2015);
Market Vectors Group of Exchange-Traded Funds: Independent Chairman of the Board of Trustees since 2008 and Trustee since 2006 (56 portfolios); and
Berea College of Kentucky: Trustee since 2009. |
| | | | Susan B. Kerley 1951 | | MainStay Funds: Chairman since 2017 and Trustee since 2007; MainStay Funds Trust:Chairman since 2017 and Trustee since 1990.** | | President, Strategic Management Advisors LLC (since 1990) | | 74 | | MainStay VP Funds Trust: Chairman since January 2017 and Trustee since 2007 (31 portfolios)***;
MainStay MacKay DefinedTerm Municipal Opportunities Fund: Chairman since 2017 and Trustee since 2011; and
Legg Mason Partners Funds: Trustee since 1991 (45 portfolios). |
| | | | Alan R. Latshaw 1951 | | MainStay Funds: Trustee; MainStay Funds Trust: Trustee and Audit Committee Financial Expert since 2007.** | | Retired; Partner, Ernst & Young LLP (2002 to 2003); Partner, Arthur Andersen LLP (1989 to 2002); Consultant to the MainStay Funds Audit and Compliance Committee (2004 to 2006) | | 74 | | MainStay VP Funds Trust: Trustee and Audit Committee Financial Expert since 2007 (31 portfolios)***;
MainStay MacKay DefinedTerm Municipal Opportunities Fund: Trustee and Audit Committee Financial Expert since 2011;
State Farm Associates Funds Trusts: Trustee since 2005 (4 portfolios);
and State Farm Variable Product Trust: Trustee since 2005 (9 portfolios). |
| | | | Richard H. Nolan, Jr. 1946 | | MainStay Funds: Trustee since 2007; MainStay Funds Trust:Trustee since 2007.** | | Managing Director, ICC Capital Management (since 2004); President—Shields/Alliance, Alliance Capital Management (1994 to 2004) | | 74 | | MainStay VP Funds Trust: Trustee since 2006 (31 portfolios)***; and
MainStay MacKay DefinedTerm Municipal Opportunities Fund: Trustee since 2011. |
| | | | Jacques P. Perold 1958 | | MainStay Funds: Trustee since 2016, Advisory Board Member (June 2015 to December 2015); MainStay Funds Trust:Trustee since 2016, Advisory Board Member (June 2015 to December 2015). | | Retired; President, Fidelity Management & Research Company (2009 to 2014); Founder, President and Chief Executive Officer, Geode Capital Management, LLC (2001 to 2009) | | 74 | | MainStay VP Funds Trust: Trustee since 2016, Advisory Board Member (June 2015 to December 2015) (31 portfolios);
MainStay MacKay DefinedTerm Municipal Opportunities Fund: Trustee since 2016, Advisory Board Member (June 2015 to December 2015);
Allstate Corporation: Director since 2015;MSCI, Inc.: Director since 2017 and
Boston University: Trustee since 2014. |
| | | | | | | | | | | | |
| | | | | Name and
Year of Birth | | Term of Office,
Position(s) Held and
Length of Service | | Principal Occupation(s)
During Past Five Years | | Number of
Portfolios in
Fund Complex
Overseen by
Trustee | | Other Directorships
Held by Trustee |
Independent Trustees | | | | Richard S. Trutanic 1952 | | MainStay Funds: Trustee since 1994; MainStay Funds Trust: Trustee since 2007.** | | Chairman and Chief Executive Officer, Somerset & Company (financial advisory firm) (since 2004); Managing Director, The Carlyle Group (private investment firm) (2002 to 2004); Senior Managing Director, Partner and Board Member, Groupe Arnault S.A. (private investment firm) (1999 to 2002) | | 74 | | MainStay VP Funds Trust: Trustee since 2007 (31 portfolios)***; and
MainStay MacKay DefinedTerm Municipal Opportunities Fund: Trustee since 2011. |
| | ** | Includes prior service as a Director/Trustee of certain predecessor entities to MainStay Funds Trust. |
| | *** | Includes prior service as a Director of MainStay VP Series Fund, Inc., the predecessor to MainStay VP Funds Trust. |
| | |
| 40 | | MainStay MacKay Infrastructure Bond Fund |
| | | | | | | | |
| | | | | Name and
Year of Birth | | Position(s) Held and
Length of Service | | Principal Occupation(s)
During Past Five Years |
Officers
of the
Trust
(Who are
not
Trustees)* | | | | Kirk C. Lehneis 1974 | | President, MainStay Funds, MainStay Funds Trust (since 2017) | | Chief Operating Officer and Senior Managing Director (since 2016), New York Life Investment Management LLC; Chairman of the Board (since 2017), NYLIFE Distributors LLC; Chairman of the Board, NYLIM Service Company LLC (since 2017); Trustee, President and Principal Executive Officer of IndexIQ Trust, IndexIQ ETF Trust and IndexIQ Active ETF Trust (since January 2018); President, MainStay MacKay DefinedTerm Municipal Opportunities Fund and MainStay VP Funds Trust
(since 2017)**; Senior Managing Director, Global Product Development (2015 to 2016); Managing Director, Product Development (2010 to 2015), New York Life Investment Management LLC |
| | | | Jack R. Benintende 1964 | | Treasurer and Principal Financial and Accounting Officer, MainStay Funds (since 2007), MainStay Funds Trust (since 2009) | | Managing Director, New York Life Investment Management LLC (since 2007); Treasurer and Principal Financial and Accounting Officer, MainStay MacKay DefinedTerm Municipal Opportunities Fund (since 2011) and MainStay VP Funds Trust (since 2007)**; and Assistant Treasurer, New York Life Investment Management Holdings LLC (2008 to 2012) |
| | | | Kevin M. Bopp 1969 | | Vice President and Chief Compliance Officer, MainStay Funds and MainStay Funds Trust (since 2014) | | Chief Compliance Officer, New York Life Investment Management LLC, IndexIQ Trust, IndexIQ ETF Trust and IndexIQ Active ETF Trust (since 2016), Director and Associate General Counsel (2011 to 2014) and Vice President and Assistant General Counsel (2010 to 2011), New York Life Investment Management LLC; Vice President and Chief Compliance Officer, MainStay VP Funds Trust, MainStay MacKay DefinedTerm Municipal Opportunities Fund (since 2014); Assistant Secretary, MainStay Funds, MainStay Funds Trust and MainStay VP Funds Trust (2010 to 2014)**, MainStay MacKay DefinedTerm Municipal Opportunities Fund (2011 to 2014) |
| | | | J. Kevin Gao 1967 | | Secretary and Chief Legal Officer, MainStay Funds and MainStay Funds Trust (since 2010) | | Managing Director and Associate General Counsel, New York Life Investment Management LLC (since 2010); Secretary and Chief Legal Officer, MainStay MacKay DefinedTerm Municipal Opportunities Fund (since 2011) and MainStay VP Funds Trust (since 2010)** |
| | | | Scott T. Harrington 1959 | | Vice President—Administration, MainStay Funds (since 2005), MainStay Funds Trust (since 2009) | | Managing Director, New York Life Investment Management LLC (including predecessor advisory organizations) (since 2000); Member of the Board of Directors, New York Life Trust Company (since 2009); Vice President—Administration, MainStay MacKay DefinedTerm Municipal Opportunities Fund (since 2011) and MainStay VP Funds Trust (since 2005)** |
| | * | The officers listed above are considered to be “interested persons” of the MainStay Group of Funds, MainStay VP Funds Trust and MainStay MacKay Defined Term Municipal Opportunities Fund within the meaning of the 1940 Act because of their affiliation with the MainStay Group of Funds, New York Life Insurance Company and/or its affiliates, including New York Life Investment Management LLC, NYLIM Service Company LLC, NYLIFE Securities LLC and/or NYLIFE Distributors LLC, as described in detail in the column captioned “Principal Occupation(s) During Past Five Years.” Officers are elected annually by the Board. |
| | ** | Includes prior service as an Officer of MainStay VP Series Fund, Inc., the predecessor to MainStay VP Funds Trust. |
MainStay Funds
Equity
U.S. Equity
MainStay Epoch U.S. All Cap Fund
MainStay Epoch U.S. Equity Yield Fund
MainStay Large Cap Growth Fund
MainStay MacKay Common Stock Fund
MainStay MacKay Growth Fund
MainStay MacKay S&P 500 Index Fund
MainStay MacKay Small Cap Core Fund1
MainStay MacKay U.S. Equity Opportunities Fund
MainStay MAP Equity Fund
International Equity
MainStay Epoch International Choice Fund
MainStay MacKay International Equity Fund
MainStay MacKay International Opportunities Fund
Emerging Markets Equity
MainStay Candriam Emerging Markets Equity Fund
MainStay MacKay Emerging Markets Equity Fund
Global Equity
MainStay Epoch Capital Growth Fund
MainStay Epoch Global Equity Yield Fund
Fixed Income
Taxable Income
MainStay Candriam Emerging Markets Debt Fund2
MainStay Floating Rate Fund
MainStay Indexed Bond Fund3
MainStay MacKay High Yield Corporate Bond Fund
MainStay MacKay Infrastructure Bond Fund
MainStay MacKay Short Duration High Yield Fund
MainStay MacKay Total Return Bond Fund
MainStay MacKay Unconstrained Bond Fund
Tax-Exempt Income
MainStay MacKay California Tax Free Opportunities Fund4
MainStay MacKay High Yield Municipal Bond Fund
MainStay MacKay Intermediate Tax Free Bond Fund
MainStay MacKay New York Tax Free Opportunities Fund5
MainStay MacKay Short Term Municipal Fund
MainStay MacKay Tax Free Bond Fund
Money Market
MainStay Money Market Fund
Mixed Asset
MainStay Balanced Fund
MainStay Income Builder Fund
MainStay MacKay Convertible Fund
Speciality
MainStay Cushing Energy Income Fund
MainStay Cushing MLP Premier Fund
MainStay Cushing Renaissance Advantage Fund
Asset Allocation
MainStay Conservative Allocation Fund
MainStay Growth Allocation Fund
MainStay Moderate Allocation Fund
MainStay Moderate Growth Allocation Fund
Manager
New York Life Investment Management LLC
New York, New York
Subadvisors
Candriam Belgium S.A.6
Brussels, Belgium
Candriam Luxembourg S.C.A.6
Strassen, Luxembourg
Cushing Asset Management, LP
Dallas, Texas
Epoch Investment Partners, Inc.
New York, New York
MacKay Shields LLC6
New York, New York
Markston International LLC
White Plains, New York
NYL Investors LLC6
New York, New York
Winslow Capital Management, LLC
Minneapolis, Minnesota
Legal Counsel
Dechert LLP
Washington, District of Columbia
Independent Registered Public Accounting Firm
KPMG LLP
Philadelphia, Pennsylvania
| 1. | Formerly known as MainStay Epoch U.S. Small Cap Fund. |
| 2. | Formerly known as MainStay MacKay Emerging Markets Debt Fund. |
| 3. | Effective December 5, 2019, MainStay Indexed Bond Fund was renamed MainStay Short Term Bond Fund. |
| 4. | Class A and Class I shares of this Fund are registered for sale in AZ, CA, MI, NV, OR, TX, UT and WA. Class I shares are registered for sale in CO, FL, GA, HI, ID, MA, MD, NH, NJ and NY. |
| 5. | This Fund is registered for sale in CA, CT, DE, FL, MA, NJ, NY and VT. |
| 6. | An affiliate of New York Life Investment Management LLC. |
Not part of the Annual Report
For more information
800-624-6782
nylinvestments.com/funds
“New York Life Investments” is both a service mark, and the common trade name, of the investment advisors affiliated with New York Life Insurance Company. The MainStay Funds® are managed by New York Life Investment Management LLC and distributed by NYLIFE Distributors LLC, 30 Hudson Street, Jersey City, NJ 07302, a wholly owned subsidiary of New York Life Insurance Company. NYLIFE Distributors LLC is a Member FINRA/SIPC.
©2019 NYLIFE Distributors LLC. All rights reserved.
| | |
| 1716016 MS159-19 | | MSINF11-12/19 (NYLIM) NL211 |
MainStay MacKay High Yield Corporate Bond Fund
Message from the President and Annual Report
October 31, 2019

Beginning on January 1, 2021, paper copies of each MainStay Fund’s annual and semiannual shareholder reports will no longer be sent by mail, unless you specifically request paper copies of the reports from MainStay Funds or from your financial intermediary. Instead, the reports will be made available on the MainStay Funds’ website. You will be notified by mail and provided with a website address to access the report each time a new report is posted to the website.
If you already elected to receive shareholder reports electronically, you will not be affected by this change and you need not take any action. At any time, you may elect to receive reports and other communications from MainStay Funds electronically by calling toll-free 800-624-6782, by sending an e-mail to MainStayShareholderServices@nylim.com, or by contacting your financial intermediary.
You may elect to receive all future shareholder reports in paper form free of charge. If you hold shares of a MainStay Fund directly, you can inform MainStay Funds that you wish to receive paper copies of reports by calling toll-free 800-624-6782 or by sending an e-mail to MainStayShareholderServices@nylim.com. If you hold shares of a MainStay Fund through a financial intermediary, please contact the financial intermediary to make this election. Your election to receive reports in paper form will apply to all MainStay Funds in which you are invested and may apply to all funds held with your financial intermediary.
| | | | | | | | |
| | | | | |
| Not FDIC/NCUA Insured | | Not a Deposit | | May Lose Value | | No Bank Guarantee | | Not Insured by Any Government Agency |

This page intentionally left blank
Message from the President
Stock and bond markets generally gained ground during the12-month reporting period ended October 31, 2019, despite concerns regarding slowing U.S. and global economic growth and international trade conflicts.
After trending higher in November 2018, U.S. stocks and bonds dipped sharply in December 2018, over concerns regarding the pace of economic growth, a U.S. government shutdown and the potential impact of trade disputes between the United States and other nations, particularly China. U.S. markets recovered quickly in 2019 as trade tensions eased, the government reopened and the U.S. Federal Reserve Board (“Fed”) adopted a more accommodative tone regarding the future direction of interest rates. A wide spectrum of equity and fixed-income sectors gained ground through April 2019. Mixed macroeconomic signals and the inability of China and the United States to reach a trade agreement caused the market’s recovery to suffer during the spring and summer months of 2019. However, accommodative monetary policies from several central banks, including a series of interest rate cuts by the Fed, along with better-than-expected corporate earnings reassured investors and enabled markets to resume their advance.
Persistent, albeit slow, U.S. economic growth underpinned the U.S. stock market’s advance during the reporting period, positioning major U.S. equity indices to reach record territory by late October 2019. Sector strength shifted as investor sentiment alternated betweenrisk-on andrisk-off positions. In general, for the reporting period, cyclical, growth-oriented stocks outperformed their value-oriented counterparts by a small margin, with the information technology sector leading thelarge-cap S&P 500® Index. However, the traditionally more defensive areas of real estate and utilities generated above-average performance as well. Communication services, consumer discretionary, industrials and consumer staples performed in the middle of the pack, while materials, financials and health care lagged. Only the energy sector suffered declines, undermined by weak oil prices and concerns about future energy demand.
In the fixed-income markets, slowing economic growth, modest inflation and the Fed’s interest rate cuts created an environment of falling yields and rising prices for most bonds, with many areas of the market offering historically low yields by the end of the reporting period. Higher-credit-quality, longer-duration securities generally produced strong returns, with investment-
grade corporates and long-term Treasury bonds delivering particularly strong performance. A similar dynamic characterized the performance of the municipal bond market, with longer-term, higher-grade issues performing relatively well. On average, municipal bonds roughly matched the gains of corporate issues while providingtax-advantaged returns for eligible investors.
International stock and bond markets tended to underperform their U.S. counterparts, constrained by lackluster economic growth in the Eurozone and dramatically slowing growth in China and related parts of Asia amid persistent trade tensions with the United States. Uncertainties surrounding the unending Brexit drama took a further toll on investor confidence, with Britain seemingly unable to resolve its internal conflicts over how, or whether, to exit from the European Union. Nevertheless, on average, international securities delivered modestly positive returns, bolstered by the accommodative monetary policies implemented by European and Asian central banks. Bonds from both emerging and developed markets generally produced stronger returns than equities while repeating the pattern of outperformance by higher-quality, longer-term instruments seen in the United States.
As the economic growth cycle lengthens, investors are left to ponder how best to position their portfolios for an uncertain future. When the yield curve inverted earlier this year prompting concerns of a potential recession, we were reminded that the direction of the economy is continually subject to change, and perceptions of the economy can shift even more rapidly. As a MainStay investor, you can rely on us to manage our Funds with unflagging energy and dedication so that you can remain focused on your long-term objectives in the face of uncertainty and change. Our goal remains to provide you with the consistently reliable financial tools you need to achieve your long-term objectives.
Sincerely,

Kirk C. Lehneis
President
The opinions expressed are as of the date of this report and are subject to change. There is no guarantee that any forecast made will come to pass. This material does not constitute investment advice and is not intended as an endorsement of any specific investment. Past performance is no guarantee of future results.
Not part of the Annual Report
Table of Contents
Investors should refer to the Fund’s Summary Prospectus and/or Prospectus and consider the Fund’s investment objectives, strategies, risks, charges and expenses carefully before investing. The Summary Prospectus and/or Prospectus contain this and other information about the Fund. You may obtain copies of the Fund’s Summary Prospectus, Prospectus and Statement of Additional Information free of charge, upon request, by calling toll-free 800-624-6782, by writing to NYLIFE Distributors LLC, Attn: MainStay Marketing Department, 30 Hudson Street, Jersey City, NJ 07302 or by sending ane-mail to MainStayShareholderServices@nylim.com. These documents are also available via the MainStay Funds’ website at nylinvestments.com/funds. Please read the Summary Prospectus and/or Prospectus carefully before investing.
Investment and Performance Comparison1(Unaudited)
Performance data quoted represents past performance. Past performance is no guarantee of future results. Because of market volatility and other factors, current performance may be lower or higher than the figures shown. Investment return and principal value will fluctuate, and as a result, when shares are redeemed, they may be worth more or less than their original cost. The graph below depicts the historical performance of Class B shares2 of the Fund. Performance will vary from class to class based on differences in class-specific expenses and sales charges. For performance information current to the most recent month-end, please call 800-624-6782 or visit nylinvestments.com/funds.
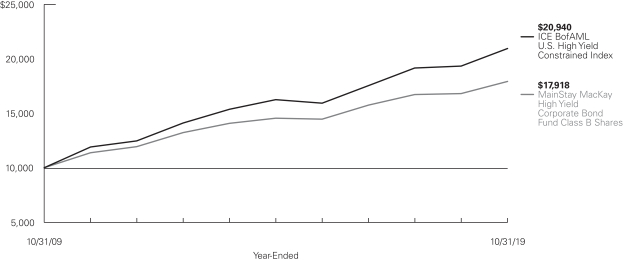
Average Annual Total Returns for the Year-Ended October 31, 2019
| | | | | | | | | | | | | | | | | | | | | | | | |
| Class | | Sales Charge | | | | Inception
Date | | | One
Year | | | Five Years
or Since
Inception | | | Ten Years
or Since
Inception | | | Gross
Expense
Ratio3 | |
| | | | | | | |
| Class A Shares | | Maximum 4.5% Initial Sales Charge | | With sales charges Excluding sales charges | | | 1/3/1995 | | |
| 2.74
7.58 | %
| |
| 4.13
5.09 | %
| |
| 6.37
6.86 | %
| |
| 0.99
0.99 | %
|
| Investor Class Shares | | Maximum 4.5% Initial Sales Charge | | With sales charges Excluding sales charges | | | 2/28/2008 | | |
| 2.50
7.33 |
| |
| 4.04
5.00 |
| |
| 6.32
6.81 |
| |
| 1.03
1.03 |
|
| Class B Shares2 | | Maximum 5% CDSC
if Redeemed Within the First Six Years of Purchase | | With sales charges Excluding sales charges | | | 5/1/1986 | | |
| 1.52
6.52 |
| |
| 3.91
4.23 |
| |
| 6.01
6.01 |
| |
| 1.78
1.78 |
|
| Class C Shares | | Maximum 1% CDSC
if Redeemed Within One Year of Purchase | | With sales charges Excluding sales charges | | | 9/1/1998 | | |
| 5.71
6.71 |
| |
| 4.27
4.27 |
| |
| 6.02
6.02 |
| |
| 1.78
1.78 |
|
| Class I Shares | | No Sales Charge | | | | | 1/2/2004 | | | | 7.68 | | | | 5.33 | | | | 7.13 | | | | 0.74 | |
| Class R1 Shares | | No Sales Charge | | | | | 6/29/2012 | | | | 7.58 | | | | 5.22 | | | | 5.85 | | | | 0.84 | |
| Class R2 Shares | | No Sales Charge | | | | | 5/1/2008 | | | | 7.49 | | | | 4.99 | | | | 6.76 | | | | 1.09 | |
| Class R3 Shares | | No Sales Charge | | | | | 2/29/2016 | | | | 7.03 | | | | 8.10 | | | | 8.10 | | | | 1.34 | |
| Class R6 Shares | | No Sales Charge | | | | | 6/17/2013 | | | | 7.84 | | | | 5.46 | | | | 5.45 | | | | 0.58 | |
| 1. | The performance table and graph do not reflect the deduction of taxes that a shareholder would pay on distributions or Fund share redemptions. Total returns reflect maximum applicable sales charges as indicated in the table above, if any, changes in share price, and reinvestment of dividend and capital gain distributions. The graph assumes the initial investment amount shown above and reflects the deduction of all sales charges that would have applied for the period of investment. Performance figures may reflect certain fee waivers and/or expense limitations, without which total returns may have been |
| | lower. For more information on share classes and current fee waivers and/or expense limitations (if any), please refer to the Notes to Financial Statements. |
| 2. | Class B shares are closed to all new purchases as well as additional investments by existing Class B shareholders. |
| 3. | The gross expense ratios presented reflect the Fund’s “Total Annual Fund Operating Expenses” from the most recent Prospectus and may differ from other expense ratios disclosed in this report. |
The footnotes on the next page are an integral part of the table and graph and should be carefully read in conjunction with them.
| | | | | | | | | | | | |
| Benchmark Performance | | One Year | | | Five Years | | | Ten Years | |
| | | |
ICE BofAML U.S. High Yield Constrained Index4 | | | 8.32 | % | | | 5.18 | % | | | 7.67 | % |
Morningstar High Yield Bond Category Average5 | | | 7.14 | | | | 3.97 | | | | 6.60 | |
| 4. | The ICE BofAML U.S. High Yield Constrained Index is the Fund’s primary broad-based securities market index for comparison purposes. The ICE BofAML U.S. High Yield Constrained Index is a market value-weighted index of all domestic and Yankee high-yield bonds, including deferred interest bonds andpayment-in-kind securities. Issuers included in the Index have maturities of one year or more and have a credit rating lower thanBBB-/Baa3, but are not in default. No single issuer may constitute greater than 2% of the Index. Results assume reinvestment of all dividends and capital gains. An investment cannot be made directly in an index. |
| 5. | The Morningstar High Yield Bond Category Average is representative of funds that concentrate on lower-quality bonds, which are riskier than those of higher-quality companies. These portfolios primarily invest in U.S. high-income debt securities where at least 65% or more of bond assets are not rated or are rated by a major agency such as Standard & Poor’s or Moody’s at the level of BB and below. Results are based on average total returns of similar funds with all dividends and capital gain distributions reinvested. |
The footnotes on the preceding page are an integral part of the table and graph and should be carefully read in conjunction with them.
| | |
| 6 | | MainStay MacKay High Yield Corporate Bond Fund |
|
Cost in Dollars of a $1,000 Investment in MainStay MacKay High Yield Corporate Bond Fund (Unaudited) |
The example below is intended to describe the fees and expenses borne by shareholders during thesix-month period from May 1, 2019, to October 31, 2019, and the impact of those costs on your investment.
Example
As a shareholder of the Fund you incur two types of costs: (1) transaction costs, including exchange fees and sales charges (loads) on purchases (as applicable), and (2) ongoing costs, including management fees, distribution and/or service(12b-1) fees, and other Fund expenses (as applicable). This example is intended to help you understand your ongoing costs (in dollars) of investing in the Fund and to compare these costs with the ongoing costs of investing in other mutual funds. The example is based on an investment of $1,000 made at the beginning of thesix-month period and held for the entire period from May 1, 2019, to October 31, 2019.
This example illustrates your Fund’s ongoing costs in two ways:
Actual Expenses
The second and third data columns in the table below provide information about actual account values and actual expenses. You may use the information in these columns, together with the amount you invested, to estimate the expenses that you paid during the six months ended October 31, 2019. Simply divide your account value by $1,000 (for example, an $8,600 account value divided by $1,000 = 8.6), then
multiply the result by the number under the heading entitled “Expenses Paid During Period” to estimate the expenses you paid on your account during this period.
Hypothetical Example for Comparison Purposes
The fourth and fifth data columns in the table below provide information about hypothetical account values and hypothetical expenses based on the Fund’s actual expense ratio and an assumed rate of return of 5% per year before expenses, which is not the Fund’s actual return. The hypothetical account values and expenses may not be used to estimate the actual ending account balances or expenses you paid for thesix-month period shown. You may use this information to compare the ongoing costs of investing in the Fund with the ongoing costs of investing in other mutual funds. To do so, compare this 5% hypothetical example with the 5% hypothetical examples that appear in the shareholder reports of the other mutual funds.
Please note that the expenses shown in the table are meant to highlight your ongoing costs only and do not reflect any transactional costs, such as exchange fees or sales charges (loads). Therefore, the fourth and fifth data columns of the table are useful in comparing ongoing costs only and will not help you determine the relative total costs of owning different funds. In addition, if these transactional costs were included, your costs would have been higher.
| | | | | | | | | | | | | | | | | | | | | | |
| | | | | | | | | | | | | | | | | | |
| Share Class | | Beginning
Account
Value
5/1/19 | | | Ending Account
Value (Based
on Actual
Returns and
Expenses)
10/31/19 | | | Expenses
Paid
During
Period1 | | | Ending Account
Value (Based
on Hypothetical
5% Annualized
Return and
Actual Expenses)
10/31/19 | | | Expenses
Paid
During
Period1 | | | Net Expense
Ratio
During
Period2 |
| | | | | | |
| Class A Shares | | $ | 1,000.00 | | | $ | 1,028.60 | | | $ | 5.11 | | | $ | 1,020.16 | | | $ | 5.09 | | | 1.00% |
| | | | | | |
| Investor Class Shares | | $ | 1,000.00 | | | $ | 1,026.60 | | | $ | 5.36 | | | $ | 1,019.91 | | | $ | 5.35 | | | 1.05% |
| | | | | | |
| Class B Shares | | $ | 1,000.00 | | | $ | 1,022.60 | | | $ | 9.18 | | | $ | 1,016.13 | | | $ | 9.15 | | | 1.80% |
| | | | | | |
| Class C Shares | | $ | 1,000.00 | | | $ | 1,024.40 | | | $ | 9.18 | | | $ | 1,016.13 | | | $ | 9.15 | | | 1.80% |
| | | | | | |
| Class I Shares | | $ | 1,000.00 | | | $ | 1,028.20 | | | $ | 3.83 | | | $ | 1,021.42 | | | $ | 3.82 | | | 0.75% |
| | | | | | |
| Class R1 Shares | | $ | 1,000.00 | | | $ | 1,027.70 | | | $ | 4.40 | | | $ | 1,020.87 | | | $ | 4.38 | | | 0.86% |
| | | | | | |
| Class R2 Shares | | $ | 1,000.00 | | | $ | 1,028.20 | | | $ | 5.62 | | | $ | 1,019.66 | | | $ | 5.60 | | | 1.10% |
| | | | | | |
| Class R3 Shares | | $ | 1,000.00 | | | $ | 1,025.00 | | | $ | 6.89 | | | $ | 1,018.40 | | | $ | 6.87 | | | 1.35% |
| | | | | | |
| Class R6 Shares | | $ | 1,000.00 | | | $ | 1,030.70 | | | $ | 2.97 | | | $ | 1,022.28 | | | $ | 2.96 | | | 0.58% |
| 1. | Expenses are equal to the Fund’s annualized expense ratio of each class multiplied by the average account value over the period, divided by 365 and multiplied by 184 (to reflect thesix-month period). The table above represents the actual expenses incurred during thesix-month period. In addition to the fees and expenses which the Fund bears directly, it also indirectly bears a pro rata share of the fees and expenses of the underlying funds in which it invests. Such indirect expenses are not included in the above-reported expense figures. |
| 2. | Expenses are equal to the Fund’s annualized expense ratio to reflect thesix-month period. |
Portfolio Composition as of October 31, 2019(Unaudited)
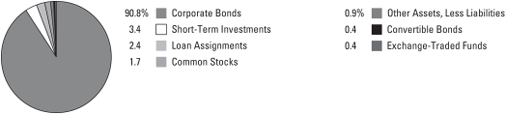
See Portfolio of Investments beginning on page 11 for specific holdings within these categories. The Fund’s holdings are subject to change.
Top Ten Holdings or Issuers Held as of October 31, 2019(excluding short-term investments) (Unaudited)
| 1. | T-Mobile USA, Inc., 4.00%–6.50%, due 4/15/22–2/1/28 |
| 2. | HCA, Inc., 5.25%–8.36%, due 2/15/22–11/6/33 |
| 3. | CCO Holdings LLC / CCO Holdings Capital Corp., 4.75%–5.875%, due 2/15/23–3/1/30 |
| 4. | Equinix, Inc., 5.375%–5.875%, due 1/1/22–5/15/27 |
| 6. | Sprint Capital Corp., 6.875%–8.75%, due 11/15/28–3/15/32 |
| 7. | TransDigm, Inc., 6.00%–6.50%, due 7/15/22–3/15/26 |
| 8. | Netflix, Inc., 4.875%–5.875%, due 2/15/22–6/15/30 |
| 9. | Carlson Travel, Inc., 6.75%–9.50%, due 12/15/23–12/15/24 |
| 10. | MSCI, Inc., 4.75%–5.75%, due 11/15/24–5/15/27 |
| | |
| 8 | | MainStay MacKay High Yield Corporate Bond Fund |
Portfolio Management Discussion and Analysis(Unaudited)
Questions answered by portfolio manager Andrew Susser of MacKay Shields LLC, the Fund’s Subadvisor.
How did MainStay MacKay High Yield Corporate Bond Fund perform relative to its benchmark and peer group during the 12 months ended October 31, 2019?
For the 12 months ended October 31, 2019, Class I shares of MainStay MacKay High Yield Corporate Bond Fund returned 7.68%, underperforming the 8.32% return of the Fund’s primary benchmark, the ICE BofAML U.S. High Yield Constrained Index. Over the same period, Class I shares outperformed the 7.14% return of the Morningstar High Yield Bond Category Average.1
What factors affected the Fund’s relative performance during the reporting period?
As U.S. equities sold off in late 2018, high-yield bond spreads2 widened due to increased interest rate volatility, global recessionary fears, international trade conflicts and outflows from U.S. high-yield mutual funds and exchange-traded funds (“ETFs”). Equity and high-yield markets rebounded in early 2019 on improved trade talks and the Federal Reserve Board’s reversal of its interest rate policy. The positive turn in flow activity in funds and ETFs, coupled with muted new issuance aided returns in the U.S. high-yield market throughout the remainder of the reporting period.
During the reporting period, the Fund produced strong absolute returns but trailed the performance of the ICE BofAML U.S. High Yield Constrained Index. The leading detractor from the Fund’s relative performance was its relatively short duration3 profile as compared to the benchmark, as long duration securities rallied. Additionally, investments in the capital goods sector detracted from relative performance, while security selection in the energy sector bolstered relative performance.
What was the Fund’s duration strategy during the reporting period?
The Fund is not managed to a duration strategy. Instead, the Fund’sbottom-up investment process drives its duration positioning. As of October 31, 2019, the Fund’s modified duration to worst4 stood at 2.7 years compared with 3.2 years for the benchmark.
During the reporting period, which sectors were the strongest positive contributors to the Fund’s relative performance and which sectors were particularly weak?
During the reporting period, investments in the energy sector provided the strongest positive contributions to the Fund’s relative performance due to an underweight allocation to the oil field equipment industry, as well as security selection in the exploration & production sector. (Contributions take weightings and total returns into account.) Security selection in the utilities and metal/mining sectors further enhanced the Fund’s relative performance. The most prominent detractor from relative performance was the Fund’s holdings in Exide Technologies, a manufacturer of automotive and industrial batteries.
What were some of the Fund’s largest purchases and sales during the reporting period?
During the reporting period, the Fund bought a new issue of aerospace component manufacturer TransDigm, a company with a $23 billion equity market capitalization and a diverse product portfolio. The Fund also purchased additional bonds issued by Mattel, one of the largest toy manufacturers in the world with iconic brands such as Barbie, Hot Wheels and Fisher Price. We believe that these bonds will provide sufficient asset coverage. Over the same period, the Fund sold positions in Tenet Healthcare and Avis Budget Group after both companies’ bonds increased in price in the first quarter of 2019 on positive financial results.
How did the Fund’s sector weightings change during the reporting period?
There were no material changes to the Fund’s sector weightings during the reporting period. However, the Fund moderately increased its exposure to the leisure, technology and telecommunications sectors and decreased its exposure to the health care and financial services sectors.
| 1. | See page 5 for other share class returns, which may be higher or lower than Class I share returns. See page 6 for more information on benchmark and peer group returns. |
| 2. | The terms “spread” and “yield spread” may refer to the difference in yield between a security or type of security and comparable U.S. Treasury issues. The terms may also refer to the difference in yield between two specific securities or types of securities at a given time. |
| 3. | Duration is a measure of the price sensitivity of a fixed-income investment to changes in interest rates. Duration is expressed as a number of years and is considered a more accurate sensitivity gauge than average maturity. |
| 4. | Modified duration is inversely related to the approximate percentage change in price for a given change in yield. Duration to worst is the duration of a bond computed using the bond’s nearest call date or maturity, whichever comes first. This measure ignores future cash flow fluctuations due to embedded optionality. |
How was the Fund positioned at the end of the reporting period?
As of October 31, 2019, the Fund remained defensively positioned relative to the ICE BofAML U.S. High Yield Constrained Index, with underweight exposure toCCC-rated bonds and overweight exposure toBBB-rated issuers.5 At the end of the reporting period, the Fund held overweight positions in the basic industry and automotive sectors and underweight positions in the health care, banking and technology sectors.
| 5. | An obligation rated ‘BBB’ by Standard & Poor’s (“S&P”) is deemed by S&P to exhibit adequate protection parameters. In the opinion of S&P, however, adverse economic conditions or changing circumstances are more likely to lead to a weakened capacity of the obligor to meet its financial commitment on the obligation. An obligation rated ‘CCC’ by S&P is deemed by S&P to be currently vulnerable to nonpayment and is dependent upon favorable business, financial and economic conditions for the obligor to meet its financial commitment on the obligation. It is the opinion of S&P that in the event of adverse business, financial or economic conditions, the obligor is not likely to have the capacity to meet its financial commitment on the obligation. When applied to Fund holdings, ratings are based solely on the creditworthiness of the bonds in the portfolio and are not meant to represent the security or safety of the Fund. |
The opinions expressed are those of the portfolio managers as of the date of this report and are subject to change. There is no guarantee that any forecasts will come to pass. This material does not constitute investment advice and is not intended as an endorsement of any specific investment.
| | |
| 10 | | MainStay MacKay High Yield Corporate Bond Fund |
Portfolio of InvestmentsOctober 31, 2019
| | | | | | | | |
| | | Principal
Amount | | | Value | |
Long-Term Bonds 93.6%† Convertible Bonds 0.4% | |
Auto Parts & Equipment 0.3% | |
Exide Technologies
7.25% (7.25% PIK), due 4/30/27 (a)(b)(c)(d)(e) | | $ | 71,097,820 | | | $ | 27,728,150 | |
| | | | | | | | |
|
Media 0.1% | |
Dish Network Corp.
2.375%, due 3/15/24 | | | 14,850,000 | | | | 13,367,268 | |
| | | | | | | | |
|
Mining 0.0%‡ | |
Aleris International, Inc.
6.00%, due 6/1/20 (b)(d)(e)(f) | | | 11,797 | | | | 11,559 | |
| | | | | | | | |
Total Convertible Bonds
(Cost $43,552,646) | | | | | | | 41,106,977 | |
| | | | | | | | |
|
| Corporate Bonds 90.8% | |
Advertising 1.2% | |
Lamar Media Corp. | | | | | | | | |
5.375%, due 1/15/24 | | | 5,515,000 | | | | 5,651,827 | |
5.75%, due 2/1/26 | | | 46,042,000 | | | | 48,862,072 | |
National CineMedia LLC
5.875%, due 4/15/28 (c) | | | 9,000,000 | | | | 9,459,900 | |
Outfront Media Capital LLC / Outfront Media Capital Corp. | | | | | | | | |
5.00%, due 8/15/27 (c) | | | 26,000,000 | | | | 27,235,780 | |
5.625%, due 2/15/24 | | | 23,906,000 | | | | 24,533,533 | |
| | | | | | | | |
| | | | | | | 115,743,112 | |
| | | | | | | | |
Aerospace & Defense 1.8% | |
F-Brasile S.p.A. / F-Brasile U.S. LLC
7.375%, due 8/15/26 (c) | | | 18,115,000 | | | | 18,930,175 | |
TransDigm UK Holdings PLC
6.875%, due 5/15/26 | | | 18,100,000 | | | | 19,276,500 | |
TransDigm, Inc. | | | | | | | | |
6.00%, due 7/15/22 | | | 4,580,000 | | | | 4,657,860 | |
6.25%, due 3/15/26 (c) | | | 70,875,000 | | | | 75,924,844 | |
6.50%, due 7/15/24 | | | 31,441,000 | | | | 32,462,832 | |
6.50%, due 5/15/25 | | | 5,000,000 | | | | 5,167,250 | |
Triumph Group, Inc.
7.75%, due 8/15/25 | | | 16,195,000 | | | | 16,195,000 | |
| | | | | | | | |
| | | | | | | 172,614,461 | |
| | | | | | | | |
Auto Manufacturers 1.4% | |
BCD Acquisition, Inc.
9.625%, due 9/15/23 (c) | | | 20,955,000 | | | | 21,557,875 | |
Ford Holdings LLC | | | | | | | | |
9.30%, due 3/1/30 | | | 18,195,000 | | | | 22,699,440 | |
9.375%, due 3/1/20 | | | 1,695,000 | | | | 1,724,965 | |
Ford Motor Co.
9.98%, due 2/15/47 | | | 980,000 | | | | 1,371,661 | |
| | | | | | | | |
| | | Principal
Amount | | | Value | |
Auto Manufacturers (continued) | | | | | | | | |
J.B. Poindexter & Company, Inc.
7.125%, due 4/15/26 (c) | | $ | 25,480,000 | | | $ | 26,562,900 | |
McLaren Finance PLC
5.75%, due 8/1/22 (c) | | | 26,535,000 | | | | 25,234,785 | |
Navistar International Corp.
6.625%, due 11/1/25 (c) | | | 11,000,000 | | | | 11,220,000 | |
Wabash National Corp.
5.50%, due 10/1/25 (c) | | | 20,824,000 | | | | 20,303,400 | |
| | | | | | | | |
| | | | | | | 130,675,026 | |
| | | | | | | | |
Auto Parts & Equipment 3.5% | |
Adient Global Holdings, Ltd.
4.875%, due 8/15/26 (c) | | | 19,005,000 | | | | 14,966,438 | |
Adient U.S. LLC
7.00%, due 5/15/26 (c) | | | 17,795,000 | | | | 18,729,238 | |
American Axle & Manufacturing, Inc. | | | | | | | | |
6.25%, due 4/1/25 | | | 17,571,000 | | | | 16,934,051 | |
6.25%, due 3/15/26 | | | 5,950,000 | | | | 5,652,500 | |
6.50%, due 4/1/27 (g) | | | 7,000,000 | | | | 6,632,500 | |
Dana Financing Luxembourg S.A.R.L.
5.75%, due 4/15/25 (c) | | | 9,090,000 | | | | 9,339,975 | |
Exide International Holdings, L.P.
10.75% (6.25% Cash and 4.50% PIK), due 10/31/21 (a)(b)(c)(d)(e) | | | 32,924,935 | | | | 32,200,586 | |
Exide Technologies (a)(b)(c)(d)(e) | | | | | | | | |
11.00% (3.00% Cash and 8.00% PIK), due 10/31/24 | | | 33,633,262 | | | | 26,065,778 | |
11.00% (3.00% Cash and 8.00% PIK), due 10/31/24 | | | 80,956,323 | | | | 69,703,394 | |
IHO Verwaltungs GmbH (a)(c) | | | | | | | | |
4.75% (4.75% Cash or 5.59% PIK), due 9/15/26 | | | 33,725,000 | | | | 33,387,750 | |
6.00% (6.00% Cash or 6.75% PIK), due 5/15/27 | | | 18,934,000 | | | | 19,549,355 | |
6.375% (6.375% Cash or 7.125% PIK), due 5/15/29 | | | 28,870,000 | | | | 29,591,750 | |
Meritor, Inc.
6.25%, due 2/15/24 | | | 5,000,000 | | | | 5,125,000 | |
Nexteer Automotive Group, Ltd.
5.875%, due 11/15/21 (c) | | | 24,020,000 | | | | 24,428,340 | |
Tenneco, Inc. | | | | | | | | |
5.00%, due 7/15/26 | | | 21,053,000 | | | | 16,631,870 | |
5.375%, due 12/15/24 | | | 6,800,000 | | | | 5,984,000 | |
| | | | | | | | |
| | | | | | | 334,922,525 | |
| | | | | | | | |
Banks 0.1% | |
Freedom Mortgage Corp.
8.125%, due 11/15/24 (c) | | | 8,000,000 | | | | 7,500,000 | |
| | | | | | | | |
|
Building Materials 1.3% | |
James Hardie International Finance DAC (c) | | | | | | | | |
4.75%, due 1/15/25 | | | 13,000,000 | | | | 13,485,420 | |
| | | | | | |
The notes to the financial statements are an integral part of,
and should be read in conjunction with, the financial statements. | | | | | 11 | |
Portfolio of InvestmentsOctober 31, 2019 (continued)
| | | | | | | | |
| | | Principal
Amount | | | Value | |
| Corporate Bonds (continued) | |
Building Materials (continued) | | | | | | | | |
James Hardie International Finance DAC (continued) | | | | | | | | |
5.00%, due 1/15/28 | | $ | 25,760,000 | | | $ | 26,983,600 | |
Patrick Industries, Inc.
7.50%, due 10/15/27 (c) | | | 19,320,000 | | | | 20,044,500 | |
Summit Materials LLC / Summit Materials Finance Corp. | | | | | | | | |
5.125%, due 6/1/25 (c) | | | 5,730,000 | | | | 5,880,413 | |
6.125%, due 7/15/23 | | | 38,660,000 | | | | 39,399,372 | |
6.50%, due 3/15/27 (c) | | | 18,500,000 | | | | 19,980,000 | |
| | | | | | | | |
| | | | | | | 125,773,305 | |
| | | | | | | | |
Chemicals 2.4% | |
Blue Cube Spinco LLC | | | | | | | | |
9.75%, due 10/15/23 | | | 29,031,000 | | | | 31,643,790 | |
10.00%, due 10/15/25 | | | 24,425,000 | | | | 27,294,938 | |
Kissner Holdings, L.P. / Kissner Milling Co., Ltd. / BSC Holding, Inc. / Kissner USA
8.375%, due 12/1/22 (c) | | | 21,525,000 | | | | 22,399,453 | |
Neon Holdings, Inc.
10.125%, due 4/1/26 (c) | | | 17,927,000 | | | | 17,725,321 | |
NOVA Chemicals Corp.
4.875%, due 6/1/24 (c) | | | 8,810,000 | | | | 8,942,150 | |
Olin Corp. | | | | | | | | |
5.50%, due 8/15/22 | | | 19,094,000 | | | | 20,358,978 | |
5.625%, due 8/1/29 | | | 26,790,000 | | | | 27,815,253 | |
PolyOne Corp.
5.25%, due 3/15/23 | | | 26,754,000 | | | | 28,860,877 | |
TPC Group, Inc.
10.50%, due 8/1/24 (c) | | | 44,372,000 | | | | 47,034,320 | |
| | | | | | | | |
| | | | | | | 232,075,080 | |
| | | | | | | | |
Coal 0.1% | |
Natural Resource Partners LP / NRP Finance Corp.
9.125%, due 6/30/25 (c) | | | 10,000,000 | | | | 9,375,000 | |
| | | | | | | | |
|
Commercial Services 4.8% | |
AMN Healthcare, Inc.
4.625%, due 10/1/27 (c) | | | 11,347,000 | | | | 11,558,394 | |
Ashtead Capital, Inc. (c) | | | | | | | | |
4.00%, due 5/1/28 | | | 1,420,000 | | | | 1,425,325 | |
4.25%, due 11/1/29 | | | 5,000,000 | | | | 5,050,000 | |
4.375%, due 8/15/27 | | | 4,590,000 | | | | 4,727,700 | |
5.25%, due 8/1/26 | | | 6,000,000 | | | | 6,397,500 | |
5.625%, due 10/1/24 | | | 18,785,000 | | | | 19,348,550 | |
Cimpress N.V.
7.00%, due 6/15/26 (c) | | | 24,085,000 | | | | 25,409,675 | |
Flexi-Van Leasing, Inc.
10.00%, due 2/15/23 (c) | | | 28,010,000 | | | | 26,609,500 | |
| | | | | | | | |
| | | Principal
Amount | | | Value | |
Commercial Services (continued) | | | | | | | | |
Gartner, Inc.
5.125%, due 4/1/25 (c) | | $ | 48,267,000 | | | $ | 50,617,603 | |
Graham Holdings Co.
5.75%, due 6/1/26 (c) | | | 34,970,000 | | | | 37,330,475 | |
Harsco Corp.
5.75%, due 7/31/27 (c) | | | 17,630,000 | | | | 18,313,515 | |
IHS Markit, Ltd. (c) | | | | | | | | |
4.75%, due 2/15/25 | | | 6,000,000 | | | | 6,602,220 | |
5.00%, due 11/1/22 | | | 54,945,000 | | | | 58,734,535 | |
Jaguar Holding Co. II / Pharmaceutical Product Development LLC
6.375%, due 8/1/23 (c) | | | 14,976,000 | | | | 15,500,160 | |
Matthews International Corp.
5.25%, due 12/1/25 (c) | | | 10,000,000 | | | | 9,350,000 | |
Nielsen Co. Luxembourg S.A.R.L. (c) | | | | | | | | |
5.00%, due 2/1/25 | | | 25,687,000 | | | | 25,558,565 | |
5.50%, due 10/1/21 | | | 6,850,000 | | | | 6,867,125 | |
Nielsen Finance LLC / Nielsen Finance Co.
5.00%, due 4/15/22 (c) | | | 57,935,000 | | | | 58,225,834 | |
Ritchie Bros. Auctioneers, Inc.
5.375%, due 1/15/25 (c) | | | 11,270,000 | | | | 11,748,975 | |
United Rentals North America, Inc. | | | | | | | | |
3.875%, due 11/15/27 | | | 14,735,000 | | | | 14,886,034 | |
4.625%, due 7/15/23 | | | 3,000,000 | | | | 3,064,500 | |
4.875%, due 1/15/28 | | | 13,300,000 | | | | 13,732,250 | |
5.25%, due 1/15/30 | | | 14,900,000 | | | | 15,663,625 | |
5.50%, due 7/15/25 | | | 5,000,000 | | | | 5,193,500 | |
6.50%, due 12/15/26 | | | 12,270,000 | | | | 13,282,275 | |
| | | | | | | | |
| | | | | | | 465,197,835 | |
| | | | | | | | |
Computers 0.2% | |
MTS Systems Corp.
5.75%, due 8/15/27 (c) | | | 5,000,000 | | | | 5,237,500 | |
NCR Corp.
6.375%, due 12/15/23 | | | 14,795,000 | | | | 15,155,628 | |
| | | | | | | | |
| | | | | | | 20,393,128 | |
| | | | | | | | |
Cosmetics & Personal Care 0.4% | |
Edgewell Personal Care Co. | | | | | | | | |
4.70%, due 5/19/21 | | | 22,000,000 | | | | 22,522,500 | |
4.70%, due 5/24/22 | | | 18,258,000 | | | | 18,851,385 | |
| | | | | | | | |
| | | | | | | 41,373,885 | |
| | | | | | | | |
Distribution & Wholesale 0.2% | |
American Builders & Contractors Supply Co., Inc.
4.00%, due 1/15/28 (c) | | | 9,755,000 | | | | 9,730,613 | |
Performance Food Group, Inc.
5.50%, due 10/15/27 (c) | | | 9,375,000 | | | | 9,914,062 | |
| | | | | | | | |
| | | | | | | 19,644,675 | |
| | | | | | | | |
| | | | |
| 12 | | MainStay MacKay High Yield Corporate Bond Fund | | The notes to the financial statements are an integral part of,
and should be read in conjunction with, the financial statements. |
| | | | | | | | |
| | | Principal
Amount | | | Value | |
| Corporate Bonds (continued) | |
Diversified Financial Services 2.2% | |
AerCap Ireland Capital DAC / AerCap Global Aviation Trust
5.00%, due 10/1/21 | | $ | 2,000,000 | | | $ | 2,100,220 | |
Allied Universal Holdco LLC / Allied Universal Finance Corp.
9.75%, due 7/15/27 (c) | | | 16,380,000 | | | | 17,117,100 | |
Credit Acceptance Corp. | | | | | | | | |
6.125%, due 2/15/21 | | | 8,362,000 | | | | 8,382,905 | |
6.625%, due 3/15/26 (c) | | | 23,820,000 | | | | 25,308,750 | |
7.375%, due 3/15/23 | | | 25,095,000 | | | | 25,941,956 | |
Jefferies Finance LLC / JFINCo-Issuer Corp. (c) | | | | | | | | |
6.25%, due 6/3/26 | | | 11,500,000 | | | | 11,816,250 | |
7.25%, due 8/15/24 | | | 12,850,000 | | | | 12,946,375 | |
Ladder Capital Finance Holdings LLLP / Ladder Capital Finance Corp. (c) | | | | | | | | |
5.25%, due 3/15/22 | | | 10,830,000 | | | | 11,222,588 | |
5.25%, due 10/1/25 | | | 4,400,000 | | | | 4,466,000 | |
5.875%, due 8/1/21 | | | 25,700,000 | | | | 26,085,500 | |
LPL Holdings, Inc.
5.75%, due 9/15/25 (c) | | | 29,030,000 | | | | 30,118,625 | |
Ocwen Loan Servicing LLC
8.375%, due 11/15/22 (c) | | | 10,000,000 | | | | 8,525,000 | |
Oxford Finance LLC / Oxford FinanceCo-Issuer II, Inc.
6.375%, due 12/15/22 (c) | | | 16,500,000 | | | | 16,995,000 | |
Werner FinCo, L.P. / Werner FinCo, Inc.
8.75%, due 7/15/25 (c) | | | 14,030,000 | | | | 12,188,563 | |
| | | | | | | | |
| | | | | | | 213,214,832 | |
| | | | | | | | |
Electric 0.9% | |
Calpine Corp. (c) | | | | | | | | |
5.875%, due 1/15/24 | | | 21,121,000 | | | | 21,585,662 | |
6.00%, due 1/15/22 | | | 24,773,000 | | | | 24,807,682 | |
Keystone Power Pass-Through Holders LLC / Conemaugh Power Pass-Through Holders
13.00% (13.00% PIK), due 6/1/24 (a)(c)(e) | | | 9,280,157 | | | | 9,419,360 | |
NextEra Energy Operating Partners, L.P.
3.875%, due 10/15/26 (c) | | | 12,740,000 | | | | 12,708,150 | |
NRG Energy, Inc.
6.625%, due 1/15/27 | | | 7,000,000 | | | | 7,586,250 | |
Talen Energy Supply LLC
6.625%, due 1/15/28 (c) | | | 4,500,000 | | | | 4,342,500 | |
Vistra Operations Co. LLC
5.00%, due 7/31/27 (c) | | | 11,000,000 | | | | 11,357,500 | |
| | | | | | | | |
| | | | | | | 91,807,104 | |
| | | | | | | | |
| | | | | | | | |
| | | Principal
Amount | | | Value | |
Electrical Components & Equipment 0.3% | |
Energizer Holdings, Inc. (c) | | | | | | | | |
5.50%, due 6/15/25 | | $ | 4,400,000 | | | $ | 4,565,000 | |
7.75%, due 1/15/27 | | | 10,760,000 | | | | 11,916,700 | |
WESCO Distribution, Inc.
5.375%, due 12/15/21 | | | 11,549,000 | | | | 11,607,207 | |
| | | | | | | | |
| | | | | | | 28,088,907 | |
| | | | | | | | |
Electrical Equipment 0.2% | |
Resideo Funding, Inc.
6.125%, due 11/1/26 (c) | | | 18,045,000 | | | | 18,180,338 | |
| | | | | | | | |
|
Electronics 0.2% | |
Itron, Inc.
5.00%, due 1/15/26 (c) | | | 18,066,000 | | | | 18,698,310 | |
| | | | | | | | |
|
Energy—Alternate Sources 0.1% | |
Terraform Power Operating LLC
4.75%, due 1/15/30 (c) | | | 7,000,000 | | | | 7,236,250 | |
| | | | | | | | |
|
Engineering & Construction 0.4% | |
Weekley Homes LLC / Weekley Finance Corp. | | | | | | | | |
6.00%, due 2/1/23 | | | 26,379,000 | | | | 26,444,948 | |
6.625%, due 8/15/25 | | | 12,465,000 | | | | 12,651,975 | |
| | | | | | | | |
| | | | | | | 39,096,923 | |
| | | | | | | | |
Entertainment 1.9% | |
Boyne USA, Inc.
7.25%, due 5/1/25 (c) | | | 12,975,000 | | | | 14,175,187 | |
Churchill Downs, Inc. (c) | | | | | | | | |
4.75%, due 1/15/28 | | | 15,830,000 | | | | 16,384,050 | |
5.50%, due 4/1/27 | | | 32,350,000 | | | | 34,291,000 | |
Eldorado Resorts, Inc.
6.00%, due 4/1/25 | | | 5,000,000 | | | | 5,256,250 | |
International Game Technology PLC
6.25%, due 1/15/27 (c) | | | 22,700,000 | | | | 25,367,250 | |
Jacobs Entertainment, Inc.
7.875%, due 2/1/24 (c) | | | 10,359,000 | | | | 11,006,437 | |
Live Nation Entertainment, Inc.
4.75%, due 10/15/27 (c) | | | 9,000,000 | | | | 9,383,400 | |
Merlin Entertainments PLC
5.75%, due 6/15/26 (c) | | | 32,900,000 | | | | 35,038,500 | |
Motion Bondco DAC
6.625%, due 11/15/27 (c) | | | 5,775,000 | | | | 5,876,063 | |
Twin River Worldwide Holdings, Inc.
6.75%, due 6/1/27 (c) | | | 27,465,000 | | | | 28,915,152 | |
| | | | | | | | |
| | | | | | | 185,693,289 | |
| | | | | | | | |
Environmental Controls 0.0%‡ | |
Clean Harbors, Inc.
4.875%, due 7/15/27 (c) | | | 2,000,000 | | | | 2,084,880 | |
| | | | | | | | |
| | | | | | |
The notes to the financial statements are an integral part of,
and should be read in conjunction with, the financial statements. | | | | | 13 | |
Portfolio of InvestmentsOctober 31, 2019 (continued)
| | | | | | | | |
| | | Principal
Amount | | | Value | |
| Corporate Bonds (continued) | |
Food 1.6% | |
B&G Foods, Inc.
5.25%, due 4/1/25 | | $ | 23,375,000 | | | $ | 23,871,719 | |
C&S Group Enterprises LLC
5.375%, due 7/15/22 (c) | | | 55,020,000 | | | | 55,157,550 | |
Ingles Markets, Inc.
5.75%, due 6/15/23 | | | 4,117,000 | | | | 4,199,340 | |
Land O’Lakes Capital Trust I
7.45%, due 3/15/28 (c) | | | 16,324,000 | | | | 18,364,500 | |
Land O’Lakes, Inc.
6.00%, due 11/15/22 (c) | | | 23,000,000 | | | | 24,466,250 | |
Nathan’s Famous, Inc.
6.625%, due 11/1/25 (c) | | | 4,000,000 | | | | 4,040,000 | |
Post Holdings, Inc.
5.50%, due 12/15/29 (c) | | | 3,000,000 | | | | 3,162,600 | |
Simmons Foods, Inc.
7.75%, due 1/15/24 (c) | | | 7,000,000 | | | | 7,568,750 | |
TreeHouse Foods, Inc.
6.00%, due 2/15/24 (c) | | | 14,115,000 | | | | 14,644,312 | |
| | | | | | | | |
| | | | | | | 155,475,021 | |
| | | | | | | | |
Forest Products & Paper 1.3% | |
Mercer International, Inc. | | | | | | | | |
5.50%, due 1/15/26 | | | 4,000,000 | | | | 3,877,320 | |
6.50%, due 2/1/24 | | | 15,958,000 | | | | 16,436,740 | |
7.375%, due 1/15/25 | | | 14,000,000 | | | | 14,525,000 | |
7.375%, due 1/15/25 (c) | | | 7,000,000 | | | | 7,262,500 | |
Schweitzer-Mauduit International, Inc.
6.875%, due 10/1/26 (c) | | | 16,380,000 | | | | 17,485,650 | |
Smurfit Kappa Treasury Funding DAC
7.50%, due 11/20/25 | | | 52,580,000 | | | | 63,753,250 | |
| | | | | | | | |
| | | | | | | 123,340,460 | |
| | | | | | | | |
Gas 1.1% | |
AmeriGas Partners, L.P. / AmeriGas Finance Corp. | | | | | | | | |
5.50%, due 5/20/25 | | | 7,375,000 | | | | 7,910,425 | |
5.625%, due 5/20/24 | | | 26,531,000 | | | | 28,587,153 | |
5.75%, due 5/20/27 | | | 19,505,000 | | | | 21,357,975 | |
5.875%, due 8/20/26 | | | 27,175,000 | | | | 30,096,312 | |
Rockpoint Gas Storage Canada, Ltd.
7.00%, due 3/31/23 (c) | | | 17,000,000 | | | | 16,957,500 | |
| | | | | | | | |
| | | | | | | 104,909,365 | |
| | | | | | | | |
Health Care—Products 0.3% | |
Avanos Medical, Inc.
6.25%, due 10/15/22 | | | 16,331,000 | | | | 16,567,799 | |
Hologic, Inc.
4.375%, due 10/15/25 (c) | | | 8,150,000 | | | | 8,349,920 | |
Teleflex, Inc.
4.875%, due 6/1/26 | | | 5,000,000 | | | | 5,242,188 | |
| | | | | | | | |
| | | | | | | 30,159,907 | |
| | | | | | | | |
| | | | | | | | |
| | | Principal
Amount | | | Value | |
Health Care—Services 4.3% | |
Acadia Healthcare Co., Inc. | | | | | | | | |
5.625%, due 2/15/23 | | $ | 14,940,000 | | | $ | 15,164,100 | |
6.50%, due 3/1/24 | | | 11,195,000 | | | | 11,586,825 | |
AHP Health Partners, Inc.
9.75%, due 7/15/26 (c) | | | 18,400,000 | | | | 19,826,000 | |
Catalent Pharma Solutions, Inc. (c) | | | | | | | | |
4.875%, due 1/15/26 | | | 10,264,000 | | | | 10,597,580 | |
5.00%, due 7/15/27 | | | 5,000,000 | | | | 5,225,000 | |
Centene Corp. | | | | | | | | |
5.375%, due 6/1/26 (c) | | | 3,045,000 | | | | 3,223,133 | |
6.125%, due 2/15/24 | | | 23,817,000 | | | | 24,762,297 | |
Charles River Laboratories International, Inc.
5.50%, due 4/1/26 (c) | | | 8,920,000 | | | | 9,499,800 | |
Encompass Health Corp. | | | | | | | | |
4.50%, due 2/1/28 | | | 2,075,000 | | | | 2,121,688 | |
4.75%, due 2/1/30 | | | 13,290,000 | | | | 13,705,312 | |
5.75%, due 11/1/24 | | | 25,076,000 | | | | 25,358,105 | |
HCA, Inc. | | | | | | | | |
5.25%, due 4/15/25 | | | 15,000,000 | | | | 16,689,351 | |
5.25%, due 6/15/26 | | | 8,330,000 | | | | 9,321,509 | |
5.375%, due 2/1/25 | | | 26,525,000 | | | | 29,144,344 | |
5.375%, due 9/1/26 | | | 4,170,000 | | | | 4,545,300 | |
5.625%, due 9/1/28 | | | 11,000,000 | | | | 12,361,250 | |
5.875%, due 5/1/23 | | | 7,240,000 | | | | 7,943,728 | |
5.875%, due 2/15/26 | | | 26,000,000 | | | | 29,250,000 | |
5.875%, due 2/1/29 | | | 3,915,000 | | | | 4,438,631 | |
7.50%, due 2/15/22 | | | 9,417,000 | | | | 10,448,161 | |
7.50%, due 12/15/23 | | | 1,500,000 | | | | 1,702,500 | |
7.50%, due 11/6/33 | | | 18,975,000 | | | | 23,102,062 | |
7.58%, due 9/15/25 | | | 8,020,000 | | | | 9,563,850 | |
7.69%, due 6/15/25 | | | 31,650,000 | | | | 38,217,375 | |
8.36%, due 4/15/24 | | | 4,524,000 | | | | 5,474,040 | |
Molina Healthcare, Inc.
5.375%, due 11/15/22 | | | 8,180,000 | | | | 8,629,900 | |
RegionalCare Hospital Partners Holdings, Inc. / LifePoint Health, Inc.
9.75%, due 12/1/26 (c) | | | 35,490,000 | | | | 38,950,275 | |
Tenet Healthcare Corp.
8.125%, due 4/1/22 | | | 5,000,000 | | | | 5,406,500 | |
WellCare Health Plans, Inc. | | | | | | | | |
5.25%, due 4/1/25 | | | 15,310,000 | | | | 16,022,872 | |
5.375%, due 8/15/26 (c) | | | 7,255,000 | | | | 7,717,506 | |
| | | | | | | | |
| | | | | | | 419,998,994 | |
| | | | | | | | |
Home Builders 2.3% | |
Ashton Woods USA LLC / Ashton Woods Finance Co. (c) | | | | | | | | |
6.75%, due 8/1/25 | | | 5,496,000 | | | | 5,523,480 | |
9.875%, due 4/1/27 | | | 10,540,000 | | | | 11,752,100 | |
| | | | |
| 14 | | MainStay MacKay High Yield Corporate Bond Fund | | The notes to the financial statements are an integral part of,
and should be read in conjunction with, the financial statements. |
| | | | | | | | |
| | | Principal
Amount | | | Value | |
| Corporate Bonds (continued) | |
Home Builders (continued) | | | | | | | | |
Brookfield Residential Properties, Inc.
6.375%, due 5/15/25 (c) | | $ | 6,665,000 | | | $ | 6,898,275 | |
Brookfield Residential Properties, Inc. / Brookfield Residential U.S. Corp. (c) | | | | | | | | |
6.125%, due 7/1/22 | | | 37,996,000 | | | | 38,613,435 | |
6.25%, due 9/15/27 | | | 16,740,000 | | | | 17,074,800 | |
Century Communities, Inc. | | | | | | | | |
5.875%, due 7/15/25 | | | 4,630,000 | | | | 4,815,200 | |
6.75%, due 6/1/27 (c) | | | 22,370,000 | | | | 23,935,900 | |
Installed Building Products, Inc.
5.75%, due 2/1/28 (c) | | | 17,080,000 | | | | 17,942,319 | |
M/I Homes, Inc.
5.625%, due 8/1/25 | | | 6,000,000 | | | | 6,240,000 | |
Mattamy Group Corp.
6.50%, due 10/1/25 (c) | | | 10,915,000 | | | | 11,542,612 | |
New Home Co., Inc.
7.25%, due 4/1/22 | | | 20,030,000 | | | | 18,965,906 | |
Shea Homes, L.P. / Shea Homes Funding Corp. (c) | | | | | | | | |
5.875%, due 4/1/23 | | | 11,137,000 | | | | 11,387,583 | |
6.125%, due 4/1/25 | | | 25,500,000 | | | | 26,392,500 | |
Taylor Morrison Communities, Inc. (c) | | | | | | | | |
5.75%, due 1/15/28 | | | 6,620,000 | | | | 7,331,650 | |
5.875%, due 6/15/27 | | | 4,820,000 | | | | 5,382,494 | |
Williams Scotsman International, Inc.
6.875%, due 8/15/23 (c) | | | 12,300,000 | | | | 12,915,000 | |
| | | | | | | | |
| | | | | | | 226,713,254 | |
| | | | | | | | |
Household Products & Wares 0.7% | |
Prestige Brands, Inc.
6.375%, due 3/1/24 (c)(g) | | | 44,988,000 | | | | 46,956,225 | |
Spectrum Brands, Inc. | | | | | | | | |
5.75%, due 7/15/25 | | | 11,687,000 | | | | 12,183,697 | |
6.125%, due 12/15/24 | | | 5,000,000 | | | | 5,168,750 | |
| | | | | | | | |
| | | | | | | 64,308,672 | |
| | | | | | | | |
Insurance 1.3% | |
American Equity Investment Life Holding Co.
5.00%, due 6/15/27 | | | 27,640,000 | | | | 29,290,861 | |
Fairfax Financial Holdings, Ltd.
8.30%, due 4/15/26 | | | 5,435,000 | | | | 6,662,014 | |
Fidelity & Guaranty Life Holdings, Inc.
5.50%, due 5/1/25 (c) | | | 17,875,000 | | | | 19,081,563 | |
HUB International, Ltd.
7.00%, due 5/1/26 (c) | | | 7,350,000 | | | | 7,561,313 | |
MGIC Investment Corp.
5.75%, due 8/15/23 | | | 28,580,000 | | | | 31,402,275 | |
Radian Group, Inc.
4.875%, due 3/15/27 | | | 5,000,000 | | | | 5,187,500 | |
| | | | | | | | |
| | | Principal
Amount | | | Value | |
Insurance (continued) | | | | | | | | |
USI, Inc.
6.875%, due 5/1/25 (c) | | $ | 25,170,000 | | | $ | 25,610,475 | |
| | | | | | | | |
| | | | | | | 124,796,001 | |
| | | | | | | | |
Internet 2.6% | |
Cogent Communications Group, Inc. (c) | | | | | | | | |
5.375%, due 3/1/22 | | | 12,046,000 | | | | 12,527,840 | |
5.625%, due 4/15/21 | | | 35,015,000 | | | | 35,408,919 | |
GrubHub Holdings, Inc.
5.50%, due 7/1/27 (c) | | | 14,030,000 | | | | 13,153,125 | |
Netflix, Inc. | | | | | | | | |
4.875%, due 4/15/28 | | | 2,000,000 | | | | 2,066,580 | |
4.875%, due 6/15/30 (c) | | | 10,000,000 | | | | 10,110,000 | |
5.375%, due 11/15/29 (c) | | | 9,205,000 | | | | 9,688,262 | |
5.50%, due 2/15/22 | | | 22,265,000 | | | | 23,600,900 | |
5.75%, due 3/1/24 | | | 24,961,000 | | | | 27,476,757 | |
5.875%, due 2/15/25 | | | 7,996,000 | | | | 8,795,600 | |
5.875%, due 11/15/28 | | | 32,450,000 | | | | 35,735,562 | |
Symantec Corp.
5.00%, due 4/15/25 (c) | | | 2,500,000 | | | | 2,563,698 | |
Uber Technologies, Inc.
7.50%, due 9/15/27 (c) | | | 16,810,000 | | | | 16,557,850 | |
VeriSign, Inc. | | | | | | | | |
4.625%, due 5/1/23 | | | 6,615,000 | | | | 6,730,763 | |
4.75%, due 7/15/27 | | | 12,480,000 | | | | 13,182,000 | |
5.25%, due 4/1/25 | | | 26,661,000 | | | | 29,193,795 | |
| | | | | | | | |
| | | | | | | 246,791,651 | |
| | | | | | | | |
Investment Companies 1.1% | |
Compass Group Diversified Holdings LLC
8.00%, due 5/1/26 (c) | | | 14,250,000 | | | | 15,318,750 | |
FS Energy & Power Fund
7.50%, due 8/15/23 (c) | | | 58,700,000 | | | | 59,515,930 | |
Icahn Enterprises, L.P. / Icahn Enterprises Finance Corp.
6.25%, due 5/15/26 | | | 29,425,000 | | | | 31,190,500 | |
| | | | | | | | |
| | | | | | | 106,025,180 | |
| | | | | | | | |
Iron & Steel 1.3% | |
Allegheny Ludlum LLC
6.95%, due 12/15/25 | | | 22,688,000 | | | | 23,538,800 | |
Allegheny Technologies, Inc.
7.875%, due 8/15/23 | | | 4,610,000 | | | | 5,020,521 | |
Big River Steel LLC / BRS Finance Corp.
7.25%, due 9/1/25 (c) | | | 62,509,000 | | | | 64,227,997 | |
Mineral Resources, Ltd.
8.125%, due 5/1/27 (c) | | | 30,195,000 | | | | 31,780,237 | |
| | | | | | | | |
| | | | | | | 124,567,555 | |
| | | | | | | | |
Leisure Time 1.5% | |
Carlson Travel, Inc. (c) | | | | | | | | |
6.75%, due 12/15/23 (g) | | | 67,516,000 | | | | 69,224,999 | |
9.50%, due 12/15/24 | | | 47,475,000 | | | | 47,831,062 | |
| | | | | | |
The notes to the financial statements are an integral part of,
and should be read in conjunction with, the financial statements. | | | | | 15 | |
Portfolio of InvestmentsOctober 31, 2019 (continued)
| | | | | | | | |
| | | Principal
Amount | | | Value | |
| Corporate Bonds (continued) | |
Leisure Time (continued) | | | | | | | | |
Vista Outdoor, Inc.
5.875%, due 10/1/23 | | $ | 27,402,000 | | | $ | 25,072,830 | |
| | | | | | | | |
| | | | | | | 142,128,891 | |
| | | | | | | | |
Lodging 2.3% | |
Boyd Gaming Corp. | | | | | | | | |
6.00%, due 8/15/26 | | | 29,915,000 | | | | 31,635,112 | |
6.375%, due 4/1/26 | | | 8,300,000 | | | | 8,818,750 | |
Choice Hotels International, Inc.
5.75%, due 7/1/22 | | | 25,470,000 | | | | 27,634,950 | |
Hilton Domestic Operating Co., Inc. | | | | | | | | |
4.875%, due 1/15/30 (c) | | | 23,325,000 | | | | 24,782,813 | |
5.125%, due 5/1/26 | | | 40,515,000 | | | | 42,540,750 | |
Jack Ohio Finance LLC / Jack Ohio Finance 1 Corp.
6.75%, due 11/15/21 (c) | | | 21,479,000 | | | | 21,935,429 | |
Marriott Ownership Resorts, Inc. / ILG LLC
6.50%, due 9/15/26 | | | 20,875,000 | | | | 22,570,676 | |
MGM Resorts International | | | | | | | | |
5.50%, due 4/15/27 | | | 23,550,000 | | | | 25,905,000 | |
5.75%, due 6/15/25 | | | 11,615,000 | | | | 12,878,131 | |
| | | | | | | | |
| | | | | | | 218,701,611 | |
| | | | | | | | |
Machinery—Diversified 0.9% | |
Briggs & Stratton Corp.
6.875%, due 12/15/20 | | | 9,000,000 | | | | 8,910,000 | |
Colfax Corp. (c) | | | | | | | | |
6.00%, due 2/15/24 | | | 13,970,000 | | | | 14,808,200 | |
6.375%, due 2/15/26 | | | 20,090,000 | | | | 21,747,425 | |
Stevens Holding Co., Inc.
6.125%, due 10/1/26 (c) | | | 14,965,000 | | | | 16,087,375 | |
Tennant Co.
5.625%, due 5/1/25 | | | 21,840,000 | | | | 22,659,000 | |
| | | | | | | | |
| | | | | | | 84,212,000 | |
| | | | | | | | |
Media 6.3% | |
Altice Financing S.A.
7.50%, due 5/15/26 (c) | | | 15,335,000 | | | | 16,293,438 | |
Altice France S.A.
7.375%, due 5/1/26 (c) | | | 23,300,000 | | | | 24,950,688 | |
Block Communications, Inc.
6.875%, due 2/15/25 (c) | | | 46,497,000 | | | | 48,473,122 | |
CCO Holdings LLC / CCO Holdings Capital Corp. | | | | | | | | |
4.75%, due 3/1/30 (c) | | | 19,755,000 | | | | 20,144,173 | |
5.00%, due 2/1/28 (c) | | | 27,440,000 | | | | 28,699,496 | |
5.125%, due 2/15/23 | | | 24,030,000 | | | | 24,540,637 | |
5.125%, due 5/1/27 (c) | | | 37,725,000 | | | | 39,752,719 | |
5.375%, due 5/1/25 (c) | | | 3,025,000 | | | | 3,138,438 | |
5.375%, due 6/1/29 (c) | | | 10,015,000 | | | | 10,691,013 | |
| | | | | | | | |
| | | Principal
Amount | | | Value | |
Media (continued) | | | | | | | | |
CCO Holdings LLC / CCO Holdings Capital Corp. (continued) | | | | | | | | |
5.75%, due 2/15/26 (c) | | $ | 32,995,000 | | | $ | 34,842,720 | |
5.875%, due 4/1/24 (c) | | | 25,215,000 | | | | 26,286,637 | |
5.875%, due 5/1/27 (c) | | | 5,000,000 | | | | 5,300,000 | |
CSC Holdings LLC (c) | | | | | | | | |
5.75%, due 1/15/30 | | | 29,935,000 | | | | 31,469,169 | |
6.50%, due 2/1/29 | | | 11,075,000 | | | | 12,369,391 | |
Diamond Sports Group LLC / Diamond Sports Finance Co. (c) | | | | | | | | |
5.375%, due 8/15/26 | | | 6,500,000 | | | | 6,792,500 | |
6.625%, due 8/15/27 | | | 10,300,000 | | | | 10,609,000 | |
DISH DBS Corp. | | | | | | | | |
5.875%, due 7/15/22 | | | 24,537,000 | | | | 25,661,040 | |
6.75%, due 6/1/21 | | | 11,000,000 | | | | 11,550,000 | |
7.75%, due 7/1/26 | | | 35,175,000 | | | | 35,486,299 | |
LCPR Senior Secured Financing DAC
6.75%, due 10/15/27 (c) | | | 31,824,000 | | | | 32,659,380 | |
Meredith Corp.
6.875%, due 2/1/26 | | | 47,420,000 | | | | 48,877,217 | |
Quebecor Media, Inc.
5.75%, due 1/15/23 | | | 31,005,000 | | | | 33,553,611 | |
Sirius XM Radio, Inc. (c) | | | | | | | | |
4.625%, due 7/15/24 | | | 5,000,000 | | | | 5,225,000 | |
5.50%, due 7/1/29 | | | 7,590,000 | | | | 8,204,411 | |
Sterling Entertainment Enterprises LLC
10.25%, due 1/15/25 (b)(d)(e)(f) | | | 20,000,000 | | | | 21,050,000 | |
Videotron, Ltd. | | | | | | | | |
5.00%, due 7/15/22 | | | 18,449,000 | | | | 19,417,572 | |
5.375%, due 6/15/24 (c) | | | 21,850,000 | | | | 23,734,562 | |
| | | | | | | | |
| | | | | | | 609,772,233 | |
| | | | | | | | |
Metal Fabricate & Hardware 2.0% | |
Advanced Drainage Systems, Inc.
5.00%, due 9/30/27 (c) | | | 5,640,000 | | | | 5,766,900 | |
Grinding Media, Inc. / Moly-Cop AltaSteel, Ltd.
7.375%, due 12/15/23 (c) | | | 66,220,000 | | | | 63,902,300 | |
Novelis Corp. (c) | | | | | | | | |
5.875%, due 9/30/26 | | | 63,380,000 | | | | 66,555,338 | |
6.25%, due 8/15/24 | | | 33,306,000 | | | | 34,888,035 | |
Optimas OE Solutions Holding LLC / Optimas OE Solutions, Inc.
8.625%, due 6/1/21 (c) | | | 16,445,000 | | | | 10,689,250 | |
Park-Ohio Industries, Inc.
6.625%, due 4/15/27 | | | 16,190,000 | | | | 15,542,400 | |
| | | | | | | | |
| | | | | | | 197,344,223 | |
| | | | | | | | |
Mining 1.1% | |
Alcoa Nederland Holding B.V. (c) | | | | | | | | |
6.75%, due 9/30/24 | | | 7,910,000 | | | | 8,335,163 | |
7.00%, due 9/30/26 | | | 20,510,000 | | | | 22,278,987 | |
| | | | |
| 16 | | MainStay MacKay High Yield Corporate Bond Fund | | The notes to the financial statements are an integral part of,
and should be read in conjunction with, the financial statements. |
| | | | | | | | |
| | | Principal
Amount | | | Value | |
| Corporate Bonds (continued) | |
Mining (continued) | | | | | | | | |
Constellium S.E.
5.875%, due 2/15/26 (c) | | $ | 13,000,000 | | | $ | 13,552,500 | |
First Quantum Minerals, Ltd.
7.25%, due 4/1/23 (c) | | | 22,827,000 | | | | 22,898,334 | |
Hecla Mining Co.
6.875%, due 5/1/21 | | | 26,435,000 | | | | 26,038,475 | |
Joseph T. Ryerson & Son, Inc.
11.00%, due 5/15/22 (c) | | | 9,500,000 | | | | 10,058,125 | |
| | | | | | | | |
| | | | | | | 103,161,584 | |
| | | | | | | | |
Miscellaneous—Manufacturing 1.1% | |
Amsted Industries, Inc.
5.625%, due 7/1/27 (c) | | | 23,395,000 | | | | 24,740,212 | |
EnPro Industries, Inc.
5.75%, due 10/15/26 | | | 12,370,000 | | | | 13,081,275 | |
Foxtrot Escrow Issuer LLC / Foxtrot Escrow Corp.
12.25%, due 11/15/26 (c) | | | 19,885,000 | | | | 19,986,414 | |
Gates Global LLC / Gates Global Co.
6.00%, due 7/15/22 (c) | | | 18,876,000 | | | | 18,852,405 | |
Koppers, Inc.
6.00%, due 2/15/25 (c) | | | 27,535,000 | | | | 27,451,294 | |
| | | | | | | | |
| | | | | | | 104,111,600 | |
| | | | | | | | |
Oil & Gas 6.1% | |
Ascent Resources Utica Holdings LLC / ARU Finance Corp. (c) | | | | | | | | |
7.00%, due 11/1/26 | | | 11,790,000 | | | | 9,019,350 | |
10.00%, due 4/1/22 | | | 13,335,000 | | | | 12,618,910 | |
California Resources Corp. | | | | | | | | |
5.00%, due 1/15/20 | | | 16,470,000 | | | | 11,529,000 | |
8.00%, due 12/15/22 (c) | | | 67,570,000 | | | | 20,946,700 | |
Callon Petroleum Co. | | | | | | | | |
6.125%, due 10/1/24 | | | 23,000,000 | | | | 21,850,000 | |
6.375%, due 7/1/26 | | | 2,000,000 | | | | 1,865,000 | |
CNX Resources Corp.
5.875%, due 4/15/22 | | | 4,784,000 | | | | 4,676,360 | |
Comstock Resources, Inc.
9.75%, due 8/15/26 | | | 64,495,000 | | | | 50,951,050 | |
Energy Ventures Gom LLC / EnVen Finance Corp.
11.00%, due 2/15/23 (c) | | | 13,000,000 | | | | 12,805,000 | |
Gulfport Energy Corp. | | | | | | | | |
6.00%, due 10/15/24 | | | 43,999,000 | | | | 28,269,357 | |
6.375%, due 5/15/25 | | | 22,725,000 | | | | 13,748,625 | |
6.375%, due 1/15/26 | | | 5,750,000 | | | | 3,450,000 | |
6.625%, due 5/1/23 | | | 7,192,000 | | | | 5,376,020 | |
Hess Infrastructure Partners L.P. / Hess Infrastructure Partners Finance Corp.
5.625%, due 2/15/26 (c) | | | 2,000,000 | | | | 2,092,500 | |
| | | | | | | | |
| | | Principal
Amount | | | Value | |
Oil & Gas (continued) | | | | | | | | |
Indigo Natural Resources LLC
6.875%, due 2/15/26 (c) | | $ | 18,620,000 | | | $ | 16,944,200 | |
Matador Resources Co.
5.875%, due 9/15/26 | | | 17,855,000 | | | | 17,118,481 | |
Moss Creek Resources Holdings, Inc.
7.50%, due 1/15/26 (c) | | | 12,465,000 | | | | 8,413,875 | |
Murphy Oil Corp.
6.875%, due 8/15/24 | | | 10,590,000 | | | | 11,170,756 | |
Murphy Oil USA, Inc. | | | | | | | | |
4.75%, due 9/15/29 | | | 5,000,000 | | | | 5,218,750 | |
5.625%, due 5/1/27 | | | 10,417,000 | | | | 11,179,700 | |
Oasis Petroleum, Inc.
6.875%, due 3/15/22 | | | 3,509,000 | | | | 3,079,148 | |
Parkland Fuel Corp.
5.875%, due 7/15/27 (c) | | | 11,025,000 | | | | 11,667,978 | |
Parsley Energy LLC / Parsley Finance Corp. (c) | | | | | | | | |
5.25%, due 8/15/25 | | | 10,525,000 | | | | 10,788,335 | |
5.625%, due 10/15/27 | | | 7,475,000 | | | | 7,717,937 | |
6.25%, due 6/1/24 | | | 7,250,000 | | | | 7,549,062 | |
PBF Holding Co. LLC / PBF Finance Corp. | | | | | | | | |
7.00%, due 11/15/23 | | | 3,000,000 | | | | 3,090,000 | |
7.25%, due 6/15/25 | | | 15,825,000 | | | | 16,537,125 | |
PDC Energy, Inc.
6.125%, due 9/15/24 | | | 22,880,000 | | | | 22,207,900 | |
PetroQuest Energy, Inc.
10.00% (10.00% PIK),
due 2/15/24 (a)(b)(d)(e) | | | 20,924,323 | | | | 7,742,000 | |
QEP Resources, Inc. | | | | | | | | |
5.25%, due 5/1/23 | | | 4,500,000 | | | | 4,275,000 | |
5.625%, due 3/1/26 | | | 18,865,000 | | | | 16,884,175 | |
6.875%, due 3/1/21 | | | 6,000,000 | | | | 6,007,500 | |
Range Resources Corp. | | | | | | | | |
5.75%, due 6/1/21 | | | 22,525,000 | | | | 22,384,219 | |
5.875%, due 7/1/22 | | | 25,543,000 | | | | 24,265,850 | |
Rex Energy Corp. (Escrow Claim)
8.00%, due 10/1/20 (e)(f)(h) | | | 124,195,000 | | | | 310,488 | |
Southwestern Energy Co. | | | | | | | | |
6.20%, due 1/23/25 | | | 15,963,000 | | | | 14,047,440 | |
7.50%, due 4/1/26 | | | 24,845,000 | | | | 21,803,724 | |
7.75%, due 10/1/27 | | | 2,500,000 | | | | 2,150,000 | |
SRC Energy, Inc.
6.25%, due 12/1/25 | | | 24,660,000 | | | | 23,052,168 | |
Sunoco, L.P. / Sunoco Finance Corp.
6.00%, due 4/15/27 | | | 19,965,000 | | | | 20,963,250 | |
Talos Production LLC / Talos Production Finance, Inc.
11.00%, due 4/3/22 | | | 31,162,822 | | | | 31,708,171 | |
Transocean Guardian, Ltd.
5.875%, due 1/15/24 (c) | | | 6,497,000 | | | | 6,497,000 | |
| | | | | | |
The notes to the financial statements are an integral part of,
and should be read in conjunction with, the financial statements. | | | | | 17 | |
Portfolio of InvestmentsOctober 31, 2019 (continued)
| | | | | | | | |
| | | Principal
Amount | | | Value | |
| Corporate Bonds (continued) | |
Oil & Gas (continued) | | | | | | | | |
Transocean Poseidon, Ltd.
6.875%, due 2/1/27 (c) | | $ | 8,000,000 | | | $ | 8,066,160 | |
Transocean Sentry, Ltd.
5.375%, due 5/15/23 (c) | | | 10,000,000 | | | | 9,900,000 | |
Ultra Resources, Inc.
6.875%, due 4/15/22 (c) | | | 28,880,000 | | | | 2,888,000 | |
Viper Energy Partners, L.P.
5.375%, due 11/1/27 (c) | | | 6,350,000 | | | | 6,413,500 | |
Whiting Petroleum Corp.
6.625%, due 1/15/26 (g) | | | 14,001,000 | | | | 8,680,620 | |
| | | | | | | | |
| | | | | | | 589,920,384 | |
| | | | | | | | |
Oil & Gas Services 0.5% | |
Forum Energy Technologies, Inc.
6.25%, due 10/1/21 | | | 44,275,000 | | | | 35,862,750 | |
Nine Energy Service, Inc.
8.75%, due 11/1/23 (c) | | | 13,290,000 | | | | 9,967,500 | |
| | | | | | | | |
| | | | | | | 45,830,250 | |
| | | | | | | | |
Pharmaceuticals 0.8% | |
Bausch Health Americas, Inc. (c) | | | | | | | | |
8.50%, due 1/31/27 | | | 6,715,000 | | | | 7,535,573 | |
9.25%, due 4/1/26 | | | 14,000,000 | | | | 15,837,780 | |
Bausch Health Co., Inc.
6.125%, due 4/15/25 (c) | | | 5,000,000 | | | | 5,190,625 | |
Bausch Health Cos., Inc. (c) | | | | | | | | |
7.00%, due 1/15/28 | | | 5,000,000 | | | | 5,393,750 | |
7.25%, due 5/30/29 | | | 5,000,000 | | | | 5,506,250 | |
Endo Dac / Endo Finance LLC / Endo Finco, Inc. (c) | | | | | | | | |
6.00%, due 7/15/23 | | | 12,521,000 | | | | 8,279,511 | |
6.00%, due 2/1/25 | | | 5,000,000 | | | | 3,187,500 | |
Par Pharmaceutical, Inc.
7.50%, due 4/1/27 (c) | | | 20,790,000 | | | | 19,750,500 | |
Vizient, Inc.
6.25%, due 5/15/27 (c) | | | 10,000,000 | | | | 10,784,300 | |
| | | | | | | | |
| | | | | | | 81,465,789 | |
| | | | | | | | |
Pipelines 4.5% | |
ANR Pipeline Co. | | | | | | | | |
7.375%, due 2/15/24 | | | 2,555,000 | | | | 2,951,844 | |
9.625%, due 11/1/21 | | | 10,349,000 | | | | 11,773,970 | |
Antero Midstream Partners, L.P. / Antero Midstream Finance Corp. | | | | | | | | |
5.375%, due 9/15/24 | | | 10,720,000 | | | | 8,870,800 | |
5.75%, due 3/1/27 (c) | | | 3,000,000 | | | | 2,231,250 | |
5.75%, due 1/15/28 (c) | | | 14,110,000 | | | | 10,653,050 | |
Cheniere Corpus Christi Holdings LLC
5.875%, due 3/31/25 | | | 14,380,000 | | | | 15,945,119 | |
Cheniere Energy Partners, L.P. | | | | | | | | |
5.25%, due 10/1/25 | | | 14,515,000 | | | | 15,023,025 | |
5.625%, due 10/1/26 | | | 15,530,000 | | | | 16,403,562 | |
| | | | | | | | |
| | | Principal
Amount | | | Value | |
Pipelines (continued) | | | | | | | | |
CNX Midstream Partners, L.P. / CNX Midstream Finance Corp.
6.50%, due 3/15/26 (c) | | $ | 21,066,000 | | | $ | 19,644,045 | |
DCP Midstream Operating, L.P.
5.375%, due 7/15/25 | | | 5,000,000 | | | | 5,257,750 | |
Delek Logistics Partners, L.P. / Delek Logistics Finance Corp.
6.75%, due 5/15/25 | | | 6,593,000 | | | | 6,576,518 | |
Genesis Energy, L.P. / Genesis Energy Finance Corp.
6.75%, due 8/1/22 | | | 37,080,000 | | | | 37,265,400 | |
Holly Energy Partners, L.P. / Holly Energy Finance Corp.
6.00%, due 8/1/24 (c) | | | 18,000,000 | | | | 18,742,500 | |
MPLX, L.P. | | | | | | | | |
4.875%, due 12/1/24 | | | 27,495,000 | | | | 29,947,393 | |
4.875%, due 6/1/25 | | | 28,790,000 | | | | 31,619,141 | |
NGPL PipeCo LLC
4.875%, due 8/15/27 (c) | | | 16,630,000 | | | | 17,887,357 | |
NuStar Logistics, L.P. | | | | | | | | |
6.00%, due 6/1/26 | | | 16,120,000 | | | | 17,227,444 | |
6.75%, due 2/1/21 | | | 12,715,000 | | | | 13,175,029 | |
Plains All American Pipeline, L.P.
6.125%, due 12/31/99 (i)(j) | | | 44,328,000 | | | | 41,335,860 | |
Ruby Pipeline LLC
6.50%, due 4/1/22 (c) | | | 4,035,788 | | | | 4,175,600 | |
Sabine Pass Liquefaction LLC
5.875%, due 6/30/26 | | | 12,050,000 | | | | 13,836,432 | |
SemGroup Corp.
6.375%, due 3/15/25 | | | 7,997,000 | | | | 8,286,891 | |
SemGroup Corp. / Rose Rock Finance Corp.
5.625%, due 11/15/23 | | | 7,681,000 | | | | 7,853,823 | |
Tallgrass Energy Partners, L.P. / Tallgrass Energy Finance Corp.
5.50%, due 9/15/24 (c) | | | 26,235,000 | | | | 25,513,537 | |
Targa Resources Partners, L.P. / Targa Resources Partners Finance Corp. | | | | | | | | |
5.00%, due 1/15/28 | | | 7,000,000 | | | | 6,930,000 | |
5.875%, due 4/15/26 | | | 10,090,000 | | | | 10,532,447 | |
6.50%, due 7/15/27 (c) | | | 18,950,000 | | | | 20,276,879 | |
TransMontaigne Partners, L.P. / TLP Finance Corp.
6.125%, due 2/15/26 | | | 16,973,000 | | | | 16,257,249 | |
| | | | | | | | |
| | | | | | | 436,193,915 | |
| | | | | | | | |
Real Estate 1.2% | |
CBRE Services, Inc.
5.25%, due 3/15/25 | | | 4,405,000 | | | | 4,955,621 | |
Howard Hughes Corp.
5.375%, due 3/15/25 (c) | | | 23,000,000 | | | | 23,891,250 | |
| | | | |
| 18 | | MainStay MacKay High Yield Corporate Bond Fund | | The notes to the financial statements are an integral part of,
and should be read in conjunction with, the financial statements. |
| | | | | | | | |
| | | Principal
Amount | | | Value | |
| Corporate Bonds (continued) | |
Real Estate (continued) | | | | | | | | |
Kennedy-Wilson, Inc.
5.875%, due 4/1/24 | | $ | 23,805,000 | | | $ | 24,638,175 | |
Newmark Group, Inc.
6.125%, due 11/15/23 | | | 31,644,000 | | | | 34,512,074 | |
Realogy Group LLC / Realogy Co-Issuer Corp.
9.375%, due 4/1/27 (c) | | | 25,898,000 | | | | 25,444,785 | |
| | | | | | | | |
| | | | | | | 113,441,905 | |
| | | | | | | | |
Real Estate Investment Trusts 4.1% | |
Crown Castle International Corp. | | | | | | | | |
4.875%, due 4/15/22 | | | 2,000,000 | | | | 2,127,260 | |
5.25%, due 1/15/23 | | | 49,363,000 | | | | 53,918,413 | |
CTR Partnership, L.P. / CareTrust Capital Corp.
5.25%, due 6/1/25 | | | 6,575,000 | | | | 6,838,000 | |
Equinix, Inc. | | | | | | | | |
5.375%, due 1/1/22 | | | 20,391,000 | | | | 20,792,703 | |
5.375%, due 4/1/23 | | | 14,525,000 | | | | 14,836,561 | |
5.375%, due 5/15/27 | | | 57,435,000 | | | | 62,316,975 | |
5.75%, due 1/1/25 | | | 40,837,000 | | | | 42,216,474 | |
5.875%, due 1/15/26 | | | 47,725,000 | | | | 50,693,495 | |
MGM Growth Properties Operating Partnership, L.P. / MGP Finance Co-Issuer, Inc. | | | | | | | | |
5.625%, due 5/1/24 | | | 63,960,000 | | | | 70,435,950 | |
5.75%, due 2/1/27 (c) | | | 25,800,000 | | | | 29,154,000 | |
MPT Operating Partnership, L.P. / MPT Finance Corp.
5.00%, due 10/15/27 | | | 22,025,000 | | | | 23,181,312 | |
Ryman Hospitality Properties, Inc.
4.75%, due 10/15/27 (c) | | | 21,795,000 | | | | 22,532,761 | |
| | | | | | | | |
| | | | | | | 399,043,904 | |
| | | | | | | | |
Retail 3.5% | |
Asbury Automotive Group, Inc.
6.00%, due 12/15/24 | | | 53,326,000 | | | | 55,059,095 | |
Beacon Roofing Supply, Inc.
4.875%, due 11/1/25 (c) | | | 32,930,000 | | | | 32,355,371 | |
Cumberland Farms, Inc.
6.75%, due 5/1/25 (c) | | | 23,097,000 | | | | 24,755,365 | |
DriveTime Automotive Group, Inc. / Bridgecrest Acceptance Corp.
8.00%, due 6/1/21 (c) | | | 22,289,000 | | | | 22,651,196 | |
Group 1 Automotive, Inc. | | | | | | | | |
5.00%, due 6/1/22 | | | 10,040,000 | | | | 10,155,962 | |
5.25%, due 12/15/23 (c) | | | 9,305,000 | | | | 9,537,625 | |
KFC Holding Co. / Pizza Hut Holdings
LLC / Taco Bell of America LLC (c) | | | | | | | | |
4.75%, due 6/1/27 | | | 12,287,000 | | | | 12,820,870 | |
5.00%, due 6/1/24 | | | 27,355,000 | | | | 28,380,812 | |
| | | | | | | | |
| | | Principal
Amount | | | Value | |
Retail (continued) | | | | | | | | |
KFC Holding Co. / Pizza Hut Holdings LLC / Taco Bell of America LLC (continued) | | | | | | | | |
5.25%, due 6/1/26 | | $ | 34,750,000 | | | $ | 36,748,125 | |
KGA Escrow, LLC
7.50%, due 8/15/23 (c) | | | 17,755,000 | | | | 18,909,075 | |
L Brands, Inc. | | | | | | | | |
5.625%, due 2/15/22 | | | 3,358,000 | | | | 3,534,295 | |
6.694%, due 1/15/27 | | | 10,587,000 | | | | 10,428,195 | |
Penske Automotive Group, Inc. | | | | | | | | |
5.375%, due 12/1/24 | | | 7,000,000 | | | | 7,192,500 | |
5.50%, due 5/15/26 | | | 11,300,000 | | | | 11,808,500 | |
5.75%, due 10/1/22 | | | 27,491,000 | | | | 27,834,638 | |
TPro Acquisition Corp.
11.00%, due 10/15/24 (c) | | | 10,000,000 | | | | 9,650,000 | |
Yum! Brands, Inc.
4.75%, due 1/15/30 (c) | | | 14,650,000 | | | | 15,364,188 | |
| | | | | | | | |
| | | | | | | 337,185,812 | |
| | | | | | | | |
Semiconductors 0.3% | |
Micron Technology, Inc.
5.50%, due 2/1/25 | | | 26,142,000 | | | | 26,890,332 | |
| | | | | | | | |
|
Software 4.2% | |
ACI Worldwide, Inc.
5.75%, due 8/15/26 (c) | | | 7,500,000 | | | | 7,950,000 | |
Ascend Learning LLC
6.875%, due 8/1/25 (c) | | | 27,000,000 | | | | 28,248,750 | |
Camelot Finance S.A.
4.50%, due 11/1/26 (c) | | | 9,840,000 | | | | 9,942,336 | |
CDK Global, Inc. | | | | | | | | |
4.875%, due 6/1/27 | | | 6,000,000 | | | | 6,322,500 | |
5.25%, due 5/15/29 (c) | | | 14,500,000 | | | | 15,397,187 | |
5.875%, due 6/15/26 | | | 32,727,000 | | | | 35,017,890 | |
Donnelley Financial Solutions, Inc.
8.25%, due 10/15/24 | | | 18,120,000 | | | | 18,844,800 | |
Fair Isaac Corp.
5.25%, due 5/15/26 (c) | | | 14,750,000 | | | | 16,003,750 | |
IQVIA, Inc. (c) | | | | | | | | |
5.00%, due 10/15/26 | | | 30,113,000 | | | | 31,769,215 | |
5.00%, due 5/15/27 | | | 10,000,000 | | | | 10,600,000 | |
MSCI, Inc. (c) | | | | | | | | |
4.75%, due 8/1/26 | | | 13,290,000 | | | | 13,920,611 | |
5.25%, due 11/15/24 | | | 32,022,000 | | | | 32,902,605 | |
5.375%, due 5/15/27 | | | 22,685,000 | | | | 24,216,237 | |
5.75%, due 8/15/25 | | | 41,284,000 | | | | 43,296,595 | |
Open Text Corp.
5.875%, due 6/1/26 (c) | | | 8,990,000 | | | | 9,585,588 | |
PTC, Inc.
6.00%, due 5/15/24 | | | 48,968,000 | | | | 52,028,500 | |
RP Crown Parent LLC
7.375%, due 10/15/24 (c) | | | 26,090,000 | | | | 27,063,418 | |
| | | | | | |
The notes to the financial statements are an integral part of,
and should be read in conjunction with, the financial statements. | | | | | 19 | |
Portfolio of InvestmentsOctober 31, 2019 (continued)
| | | | | | | | |
| | | Principal
Amount | | | Value | |
| Corporate Bonds (continued) | |
Software (continued) | | | | | | | | |
SS&C Technologies, Inc.
5.50%, due 9/30/27 (c) | | $ | 24,595,000 | | | $ | 26,316,650 | |
| | | | | | | | |
| | | | | | | 409,426,632 | |
| | | | | | | | |
Telecommunications 7.7% | |
CenturyLink, Inc. | | | | | | | | |
5.80%, due 3/15/22 | | | 30,940,000 | | | | 32,680,375 | |
6.45%, due 6/15/21 | | | 10,000,000 | | | | 10,525,000 | |
CommScope Technologies LLC
6.00%, due 6/15/25 (c) | | | 5,514,000 | | | | 4,905,806 | |
CommScope, Inc. (c) | | | | | | | | |
6.00%, due 3/1/26 | | | 3,645,000 | | | | 3,745,238 | |
8.25%, due 3/1/27 | | | 29,010,000 | | | | 27,479,142 | |
Connect Finco SARL / Connect U.S. Finco LLC
6.75%, due 10/1/26 (c) | | | 37,575,000 | | | | 39,031,031 | |
Frontier Communications Corp. | | | | | | | | |
6.25%, due 9/15/21 | | | 16,315,000 | | | | 7,668,050 | |
10.50%, due 9/15/22 | | | 30,854,000 | | | | 14,539,948 | |
11.00%, due 9/15/25 | | | 25,926,000 | | | | 12,152,813 | |
Hughes Satellite Systems Corp. | | | | | | | | |
5.25%, due 8/1/26 | | | 21,850,000 | | | | 23,406,812 | |
6.625%, due 8/1/26 | | | 19,275,000 | | | | 20,865,187 | |
7.625%, due 6/15/21 | | | 26,000,000 | | | | 28,015,000 | |
Inmarsat Finance PLC (c) | | | | | | | | |
4.875%, due 5/15/22 | | | 23,320,000 | | | | 23,553,200 | |
6.50%, due 10/1/24 | | | 13,000,000 | | | | 13,669,500 | |
Level 3 Financing, Inc. | | | | | | | | |
5.375%, due 5/1/25 | | | 21,200,000 | | | | 21,915,500 | |
5.625%, due 2/1/23 | | | 11,000,000 | | | | 11,110,000 | |
QualityTech, L.P. / QTS Finance Corp.
4.75%, due 11/15/25 (c) | | | 23,451,000 | | | | 24,506,295 | |
Sprint Capital Corp. | | | | | | | | |
6.875%, due 11/15/28 | | | 98,785,000 | | | | 107,644,039 | |
8.75%, due 3/15/32 | | | 12,780,000 | | | | 15,583,676 | |
Sprint Communications, Inc. | | | | | | | | |
7.00%, due 3/1/20 (c) | | | 25,490,000 | | | | 25,862,154 | |
9.25%, due 4/15/22 | | | 6,024,000 | | | | 6,912,540 | |
Sprint Corp.
7.875%, due 9/15/23 | | | 43,100,000 | | | | 47,571,625 | |
T-Mobile USA, Inc. | | | | | | | | |
4.00%, due 4/15/22 (g) | | | 3,000,000 | | | | 3,096,630 | |
4.75%, due 2/1/28 | | | 31,435,000 | | | | 33,124,631 | |
5.125%, due 4/15/25 | | | 26,615,000 | | | | 27,654,316 | |
5.375%, due 4/15/27 | | | 33,000,000 | | | | 35,475,000 | |
6.00%, due 4/15/24 | | | 15,315,000 | | | | 15,889,313 | |
6.375%, due 3/1/25 | | | 37,982,000 | | | | 39,414,301 | |
6.50%, due 1/15/24 | | | 14,485,000 | | | | 15,046,294 | |
6.50%, due 1/15/26 | | | 45,400,000 | | | | 48,582,540 | |
| | | | | | | | |
| | | | | | | 741,625,956 | |
| | | | | | | | |
| | | | | | | | |
| | | Principal
Amount | | | Value | |
Textiles 0.3% | |
Eagle Intermediate Global Holding B.V. / Ruyi U.S. Finance LLC
7.50%, due 5/1/25 (c) | | $ | 37,879,000 | | | $ | 33,002,079 | |
| | | | | | | | |
|
Toys, Games & Hobbies 0.6% | |
Mattel, Inc.
6.75%, due 12/31/25 (c) | | | 56,645,000 | | | | 59,123,219 | |
| | | | | | | | |
|
Transportation 0.1% | |
Teekay Corp.
9.25%, due 11/15/22 (c) | | | 6,000,000 | | | | 6,210,000 | |
| | | | | | | | |
|
Trucking & Leasing 0.2% | |
Fortress Transportation & Infrastructure Investors LLC
6.75%, due 3/15/22 (c) | | | 18,100,000 | | | | 18,846,625 | |
| | | | | | | | |
Total Corporate Bonds
(Cost $8,662,648,575) | | | | | | | 8,764,113,869 | |
| | | | | | | | |
|
| Loan Assignments 2.4% | |
Auto Parts & Equipment 0.2% | |
Adient U.S. LLC
Term Loan B
6.459% (3 Month LIBOR + 4.25%), due 5/6/24 (k) | | | 7,481,250 | | | | 7,291,099 | |
Dealer Tire LLC
2018 Term Loan B
7.286% (1 Month LIBOR + 5.50%), due 12/12/25 (k) | | | 9,950,000 | | | | 9,937,563 | |
| | | | | | | | |
| | | | | | | 17,228,662 | |
| | | | | | | | |
Banks 0.3% | |
Jane Street Group LLC
2018 Term Loan B
4.786% (1 Month LIBOR + 3.00%), due 8/25/22 (k) | | | 34,490,001 | | | | 34,274,438 | |
| | | | | | | | |
|
Diversified Financial Services 0.1% | |
Jefferies Finance LLC
2019 Term Loan
5.75% (1 Month LIBOR + 3.75%), due 6/3/26 (k) | | | 9,975,000 | | | | 9,787,969 | |
| | | | | | | | |
|
Healthcare, Education & Childcare 0.1% | |
Jaguar Holding Co. II
2018 Term Loan
4.286% (1 Month LIBOR + 2.50%), due 8/18/22 (k) | | | 14,893,729 | | | | 14,853,396 | |
| | | | | | | | |
| | | | |
| 20 | | MainStay MacKay High Yield Corporate Bond Fund | | The notes to the financial statements are an integral part of,
and should be read in conjunction with, the financial statements. |
| | | | | | | | |
| | | Principal
Amount | | | Value | |
| Loan Assignments (continued) | |
Insurance 0.1% | |
USI, Inc.
2017 Repriced Term Loan
5.104% (3 Month LIBOR + 3.00%), due 5/16/24 (k) | | $ | 12,908,822 | | | $ | 12,517,530 | |
| | | | | | | | |
|
Internet 0.1% | |
NASCAR Holdings, Inc.
Term Loan B
4.628% (1 Month LIBOR + 2.75%), due 10/19/26 (k) | | | 6,000,000 | | | | 6,026,664 | |
| | | | | | | | |
|
Metal Fabricate & Hardware 0.1% | |
Neenah Foundry Co. (k)
2017 Term Loan
8.363% (2 Month LIBOR + 6.50%), due 12/13/22 | | | 5,105,259 | | | | 4,952,101 | |
8.587% (2 Month LIBOR + 6.50%), due 12/13/22 | | | 4,284,018 | | | | 4,155,498 | |
| | | | | | | | |
| | | | | | | 9,107,599 | |
| | | | | | | | |
Mining 0.1% | |
Aleris International, Inc.
2018 Term Loan
6.536% (1 Month LIBOR + 4.75%), due 2/27/23 (k) | | | 4,900,189 | | | | 4,897,126 | |
| | | | | | | | |
|
Oil & Gas 0.2% | |
PetroQuest Energy, Inc.
Term Loan Note
10.013%, due 3/2/20 (b)(d)(e) | | | 16,636,467 | | | | 16,636,467 | |
| | | | | | | | |
|
Retail 0.0%‡ | |
1011778 B.C. Unlimited Liability Co. Term Loan B3
4.036% (1 Month LIBOR + 2.25%), due 2/16/24 (k) | | | 4,789,154 | | | | 4,792,148 | |
| | | | | | | | |
|
Retail Stores 0.7% | |
Bass Pro Group LLC
Term Loan B
6.786% (1 Month LIBOR + 5.00%), due 9/25/24 (k) | | | 70,901,430 | | | | 67,852,668 | |
| | | | | | | | |
|
Software 0.3% | |
Ascend Learning LLC
2017 Term Loan B
4.786% (1 Month LIBOR + 3.00%), due 7/12/24 (k) | | | 5,972,075 | | | | 5,924,794 | |
| | | | | | | | |
| | | Principal
Amount | | | Value | |
Software (continued) | | | | | | | | |
RP Crown Parent LLC
2016 Term Loan B
4.536% (1 Month LIBOR + 2.75%), due 10/12/23 (k) | | $ | 19,862,167 | | | $ | 19,812,511 | |
| | | | | | | | |
| | | | | | | 25,737,305 | |
| | | | | | | | |
Transportation 0.1% | |
Commercial Barge Line Co. (k)
2015 1st Lien Term Loan
10.613% (2 Month LIBOR + 8.75%), due 11/12/20 | | | 331,701 | | | | 167,509 | |
10.677% (3 Month LIBOR + 8.75%), due 11/12/20 | | | 21,560,549 | | | | 10,888,077 | |
| | | | | | | | |
| | | | | | | 11,055,586 | |
| | | | | | | | |
Total Loan Assignments
(Cost $244,868,255) | | | | | | | 234,767,558 | |
| | | | | | | | |
TotalLong-Term Bonds
(Cost $8,951,069,476) | | | | | | | 9,039,988,404 | |
| | | | | | | | |
| | |
| | | | | | | | |
| | |
| | | Shares | | | | |
| Common Stocks 1.7% | |
Auto Parts & Equipment 0.1% | |
American Tire Distributors,
Inc. (b)(d)(e)(l) | | | 142,545 | | | | 3,991,260 | |
Exide Technologies (b)(d)(e)(f)(l) | | | 7,338,430 | | | | 6,898,124 | |
| | | | | | | | |
| | | | | | | 10,889,384 | |
| | | | | | | | |
Electric Utilities 0.1% | |
Keycon Power Holdings LLC (e)(l) | | | 38,680 | | | | 11,604,000 | |
| | | | | | | | |
|
Independent Power & Renewable Electricity Producers 0.9% | |
GenOn Energy, Inc. (f)(l) | | | 386,241 | | | | 85,938,622 | |
PetroQuest Energy, Inc. (b)(d)(e) | | | 2,314,883 | | | | 0 | |
| | | | | | | | |
| | | | | | | 85,938,622 | |
| | | | | | | | |
Media 0.0%‡ | |
ION Media Networks,
Inc. (b)(d)(e)(f)(l) | | | 2,287 | | | | 907,138 | |
| | | | | | | | |
|
Metals & Mining 0.1% | |
Neenah Enterprises, Inc. (b)(d)(e)(l) | | | 720,961 | | | | 9,898,795 | |
| | | | | | | | |
|
Oil, Gas & Consumable Fuels 0.5% | |
Talos Energy, Inc. (l) | | | 2,074,193 | | | | 44,657,375 | |
Titan Energy LLC (l) | | | 91,174 | | | | 3,374 | |
| | | | | | | | |
| | | | | | | 44,660,749 | |
| | | | | | | | |
Software 0.0%‡ | |
ASG Corp. (b)(d)(e)(l) | | | 12,502 | | | | 0 | |
| | | | | | | | |
Total Common Stocks
(Cost $206,145,111) | | | | | | | 163,898,688 | |
| | | | | | | | |
| | | | | | |
The notes to the financial statements are an integral part of,
and should be read in conjunction with, the financial statements. | | | | | 21 | |
Portfolio of InvestmentsOctober 31, 2019 (continued)
| | | | | | | | |
| | |
| | | Shares | | | Value | |
| Exchange-Traded Funds 0.4% (l) | |
iShares Gold Trust | | | 618,700 | | | $ | 8,946,402 | |
SPDR Gold Shares | | | 189,000 | | | | 26,919,270 | |
| | | | | | | | |
Total Exchange-Traded Funds
(Cost $28,668,073) | | | | | | | 35,865,672 | |
| | | | | | | | |
|
| Short-Term Investments 3.4% | |
Unaffiliated Investment Companies 3.4% | |
State Street Institutional U.S. Government Money Market Fund, Premier Class, 1.75% (m) | | | 304,364,357 | | | | 304,364,357 | |
State Street Navigator Securities Lending Government Money Market Portfolio, 1.75% (m)(n) | | | 24,350,755 | | | | 24,350,755 | |
| | | | | | | | |
TotalShort-Term Investments
(Cost $328,715,112) | | | | | | | 328,715,112 | |
| | | | | | | | |
Total Investments
(Cost $9,514,597,772) | | | 99.1 | % | | | 9,568,467,876 | |
Other Assets, Less Liabilities | | | 0.9 | | | | 84,319,239 | |
Net Assets | | | 100.0 | % | | $ | 9,652,787,115 | |
| † | Percentages indicated are based on Fund net assets. |
| ‡ | Less than one-tenth of a percent. |
| (a) | PIK ("Payment-in-Kind")—issuer may pay interest or dividends with additional securities and/or in cash. |
| (b) | Security in which significant unobservable inputs (Level 3) were used in determining fair value. |
| (c) | May be sold to institutional investors only under Rule 144A or securities offered pursuant to Section 4(a)(2) of the Securities Act of 1933, as amended. |
| (d) | Fair valued security—Represents fair value as measured in good faith under procedures approved by the Board of Trustees. As of October 31, 2019, the total market value of fair valued securities was $222,833,251, which represented 2.3% of the Fund’s net assets. |
| (e) | Illiquid investment—As of October 31, 2019, the total market value of these illiquid investments was $244,167,099, which represented 2.5% of the Fund’s net assets. (Unaudited) |
| (f) | Restricted security. (See Note 5) |
| (g) | All or a portion of this security was held on loan. As of October 31, 2019, the aggregate market value of securities on loan was $23,794,919. The Fund received cash collateral with a value of $24,350,755 (See Note 2(H)). |
| (h) | Issue in non-accrual status. |
| (i) | Fixed to floating rate—Rate shown was the rate in effect as of October 31, 2019. |
| (j) | Securities are perpetual and, thus, do not have a predetermined maturity date. The date shown, if applicable, reflects the next call date. |
| (k) | Floating rate—Rate shown was the rate in effect as of October 31, 2019. |
| (l) | Non-income producing security. |
| (m) | Current yield as of October 31, 2019. |
| (n) | Represents a security purchased with cash collateral received for securities on loan. |
The following abbreviations are used in the preceding pages:
LIBOR—London Interbank Offered Rate
SPDR—Standard & Poor’s Depositary Receipt
The following is a summary of the fair valuations according to the inputs used as of October 31, 2019, for valuing the Fund’s assets:
| | | | | | | | | | | | | | | | |
Description | | Quoted
Prices in Active
Markets for
Identical Assets (Level 1) | | | Significant Other Observable Inputs (Level 2) | | | Significant
Unobservable Inputs (Level 3) | | | Total | |
| | | | |
Asset Valuation Inputs | | | | | | | | | | | | | | | | |
| Investments in Securities (a) | | | | | | | | | | | | | | | | |
| Long-Term Bonds | | | | | | | | | | | | | | | | |
Convertible Bonds (b) | | $ | — | | | $ | 13,367,268 | | | $ | 27,739,709 | | | $ | 41,106,977 | |
Corporate Bonds (c) | | | — | | | | 8,607,352,111 | | | | 156,761,758 | | | | 8,764,113,869 | |
Loan Assignments (d) | | | — | | | | 218,131,091 | | | | 16,636,467 | | | | 234,767,558 | |
| | | | | | | | | | | | | | | | |
| TotalLong-Term Bonds | | | — | | | | 8,838,850,470 | | | | 201,137,934 | | | | 9,039,988,404 | |
| | | | | | | | | | | | | | | | |
| Common Stocks (e) | | | 56,264,749 | | | | 85,938,622 | | | | 21,695,317 | | | | 163,898,688 | |
| Exchange-Traded Funds | | | 35,865,672 | | | | — | | | | — | | | | 35,865,672 | |
| Short-Term Investments | | | | | | | | | | | | | | | | |
Unaffiliated Investment Companies | | | 328,715,112 | | | | — | | | | — | | | | 328,715,112 | |
| | | | | | | | | | | | | | | | |
| Total Investments in Securities | | $ | 420,845,533 | | | $ | 8,924,789,092 | | | $ | 222,833,251 | | | $ | 9,568,467,876 | |
| | | | | | | | | | | | | | | | |
| (a) | For a complete listing of investments and their industries, see the Portfolio of Investments. |
| | | | |
| 22 | | MainStay MacKay High Yield Corporate Bond Fund | | The notes to the financial statements are an integral part of,
and should be read in conjunction with, the financial statements. |
| (b) | The Level 3 securities valued at $27,728,150 and $11,559 are held in Auto Parts & Equipment and Mining, respectively, within the Convertible Bonds section of the Portfolio of Investments. |
| (c) | The Level 3 securities valued at $127,969,758, $21,050,000 and $7,742,000 are held in Auto Parts & Equipment, Media and Oil & Gas, respectively, within the Corporate Bonds section of the Portfolio of Investments. |
| (d) | The level 3 security valued at $16,636,467 is held in Oil and Gas within the Loan Assignments section of the Portfolio Investments. |
| (e) | The Level 3 securities valued at $10,889,384, $0, $907,138, $9,898,795 and $0 are held in Auto Parts & Equipment, Independent Power & Renewable Electricity Producers, Media, Metals & Mining and Software, respectively, within the Common Stocks section of the Portfolio of Investments. |
The following is a reconciliation of investments in which significant unobservable inputs (Level 3) were used in determining value:
| | | | | | | | | | | | | | | | | | | | | | | | | | | | | | | | | | | | | | | | |
Investments in
Securities | | Balance
as of
October 31,
2018 | | | Accrued
Discounts
(Premiums) | | | Realized Gain (Loss) | | | Change in
Unrealized
Appreciation
(Depreciation) | | | Purchases | | | Sales | | | Transfers
in to
Level 3 | | | Transfers
out of
Level 3 | | | Balance
as of
October 31,
2019 | | | Change in
Unrealized
Appreciation
(Depreciation)
from
Investments
Still Held as
of October 31,
2019 (b) | |
| Long-Term Bonds | | | | | | | | | | | | | | | | | | | | | | | | | | | | | | | | | | | | | | | | |
Convertible Bonds | | $ | 64,572,095 | | | $ | 1,424,658 | | | $ | (69,318,629) | | | $ | 29,614,054 | | | $ | 37,288,090 | (a) | | $ | (35,840,559) | | | $ | — | | | $ | — | | | $ | 27,739,709 | | | $ | (2,627,653 | ) |
Corporate Bonds | | | 117,209,602 | | | | (1,437,892 | ) | | | (12,109,787 | ) | | | (29,055,966 | ) | | | 177,088,031 | (a) | | | (94,932,230 | ) | | | — | | | | — | | | | 156,761,758 | | | | (31,039,425 | ) |
Loan Assignments | | | 10,481,625 | | | | — | | | | — | | | | — | | | | 16,636,467 | | | | — | | | | — | | | | (10,481,625 | ) | | | 16,636,467 | | | | — | |
Common Stocks | | | 17,799,374 | | | | — | | | | — | | | | (17,204,185 | ) | | | 21,100,128 | | | | — | | | | — | | | | — | | | | 21,695,317 | | | | (17,204,185 | ) |
| | | | | | | | | | | | | | | | | | | | | | | | | | | | | | | | | | | | | | | | |
| Total | | $ | 210,062,696 | | | $ | (13,234) | | | $ | (81,428,416) | | | $ | (16,646,097) | | | $ | 252,112,716 | | | $ | (130,772,789) | | | $ | — | | | $ | (10,481,625) | | | $ | 222,833,251 | | | $ | (50,871,263) | |
| | | | | | | | | | | | | | | | | | | | | | | | | | | | | | | | | | | | | | | | |
| (a) | Purchases include PIK securities. |
| (b) | Included in “Net change in unrealized appreciation (depreciation) on investments” in the Statement of Operations. |
As of October 31, 2019, a loan assignment with a market value of $10,481,625 transferred from Level 3 to Level 2 as the the fair value obtained from an independent pricing service, utilized significant other observable inputs. As of October 31, 2018, the fair value obtained for this loan assignment, as determined by an independent pricing service, utilized significant unobservable inputs.
| | | | | | |
The notes to the financial statements are an integral part of,
and should be read in conjunction with, the financial statements. | | | | | 23 | |
Statement of Assets and Liabilitiesas of October 31, 2019
| | | | |
| Assets | |
Investment in securities, at value
(identified cost $9,514,597,772) including securities on loan of $23,794,919 | | $ | 9,568,467,876 | |
Receivables: | | | | |
Interest | | | 152,688,721 | |
Fund shares sold | | | 27,513,083 | |
Investment securities sold | | | 14,791,646 | |
Securities lending | | | 17,632 | |
Other assets | | | 151,915 | |
| | | | |
Total assets | | | 9,763,630,873 | |
| | | | |
|
| Liabilities | |
Due to custodian | | | 542,407 | |
Cash collateral received for securities on loan | | | 24,350,755 | |
Payables: | | | | |
Investment securities purchased | | | 57,369,241 | |
Fund shares redeemed | | | 16,002,230 | |
Manager (See Note 3) | | | 4,456,290 | |
Transfer agent (See Note 3) | | | 2,041,215 | |
NYLIFE Distributors (See Note 3) | | | 1,136,045 | |
Shareholder communication | | | 612,256 | |
Professional fees | | | 147,009 | |
Custodian | | | 35,594 | |
Trustees | | | 17,675 | |
Accrued expenses | | | 104,061 | |
Dividend payable | | | 4,028,980 | |
| | | | |
Total liabilities | | | 110,843,758 | |
| | | | |
Net assets | | $ | 9,652,787,115 | |
| | | | |
|
| Composition of Net Assets | |
Shares of beneficial interest outstanding (par value of $.01 per share) unlimited number of shares authorized | | $ | 17,211,907 | |
Additional paid-in capital | | | 9,863,988,651 | |
| | | | |
| | | 9,881,200,558 | |
Total distributable earnings (loss) | | | (228,413,443 | ) |
| | | | |
Net assets | | $ | 9,652,787,115 | |
| | | | |
| | | | |
Class A | | | | |
Net assets applicable to outstanding shares | | $ | 3,405,586,633 | |
| | | | |
Shares of beneficial interest outstanding | | | 607,160,000 | |
| | | | |
Net asset value per share outstanding | | $ | 5.61 | |
Maximum sales charge (4.50% of offering price) | | | 0.26 | |
| | | | |
Maximum offering price per share outstanding | | $ | 5.87 | |
| | | | |
Investor Class | | | | |
Net assets applicable to outstanding shares | | $ | 162,260,377 | |
| | | | |
Shares of beneficial interest outstanding | | | 28,701,187 | |
| | | | |
Net asset value per share outstanding | | $ | 5.65 | |
Maximum sales charge (4.50% of offering price) | | | 0.27 | |
| | | | |
Maximum offering price per share outstanding | | $ | 5.92 | |
| | | | |
Class B | | | | |
Net assets applicable to outstanding shares | | $ | 63,517,160 | |
| | | | |
Shares of beneficial interest outstanding | | | 11,375,603 | |
| | | | |
Net asset value and offering price per share outstanding | | $ | 5.58 | |
| | | | |
Class C | | | | |
Net assets applicable to outstanding shares | | $ | 373,759,760 | |
| | | | |
Shares of beneficial interest outstanding | | | 66,906,558 | |
| | | | |
Net asset value and offering price per share outstanding | | $ | 5.59 | |
| | | | |
Class I | | | | |
Net assets applicable to outstanding shares | | $ | 3,451,487,275 | |
| | | | |
Shares of beneficial interest outstanding | | | 614,942,874 | |
| | | | |
Net asset value and offering price per share outstanding | | $ | 5.61 | |
| | | | |
Class R1 | | | | |
Net assets applicable to outstanding shares | | $ | 52,873 | |
| | | | |
Shares of beneficial interest outstanding | | | 9,438 | |
| | | | |
Net asset value and offering price per share outstanding | | $ | 5.60 | |
| | | | |
Class R2 | | | | |
Net assets applicable to outstanding shares | | $ | 13,865,558 | |
| | | | |
Shares of beneficial interest outstanding | | | 2,471,433 | |
| | | | |
Net asset value and offering price per share outstanding | | $ | 5.61 | |
| | | | |
Class R3 | | | | |
Net assets applicable to outstanding shares | | $ | 1,280,627 | |
| | | | |
Shares of beneficial interest outstanding | | | 228,547 | |
| | | | |
Net asset value and offering price per share outstanding | | $ | 5.60 | |
| | | | |
Class R6 | | | | |
Net assets applicable to outstanding shares | | $ | 2,180,976,852 | |
| | | | |
Shares of beneficial interest outstanding | | | 389,395,047 | |
| | | | |
Net asset value and offering price per share outstanding | | $ | 5.60 | |
| | | | |
| | | | |
| 24 | | MainStay MacKay High Yield Corporate Bond Fund | | The notes to the financial statements are an integral part of,
and should be read in conjunction with, the financial statements. |
Statement of Operationsfor the year ended October 31, 2019
| | | | |
| Investment Income (Loss) | |
Income | | | | |
Interest | | $ | 565,209,716 | |
Dividends | | | 1,207,604 | |
Securities lending | | | 372,735 | |
Other | | | 1,455,699 | |
| | | | |
Total income | | | 568,245,754 | |
| | | | |
Expenses | | | | |
Manager (See Note 3) | | | 50,073,114 | |
Distribution/Service—Class A (See Note 3) | | | 8,310,941 | |
Distribution/Service—Investor Class (See Note 3) | | | 402,404 | |
Distribution/Service—Class B (See Note 3) | | | 714,360 | |
Distribution/Service—Class C (See Note 3) | | | 4,518,995 | |
Distribution/Service—Class R2 (See Note 3) | | | 30,669 | |
Distribution/Service—Class R3 (See Note 3) | | | 4,276 | |
Transfer agent (See Note 3) | | | 11,998,098 | |
Shareholder communication | | | 1,752,271 | |
Professional fees | | | 636,367 | |
Registration | | | 329,266 | |
Trustees | | | 227,518 | |
Custodian | | | 83,167 | |
Shareholder service (See Note 3) | | | 13,171 | |
Miscellaneous | | | 352,606 | |
| | | | |
Total expenses | | | 79,447,223 | |
| | | | |
Net investment income (loss) | | | 488,798,531 | |
| | | | |
|
| Realized and Unrealized Gain (Loss) on Investments | |
Net realized gain (loss) on investments | | | (93,603,555 | ) |
Net change in unrealized appreciation (depreciation) on investments | | | 274,010,854 | |
| | | | |
Net realized and unrealized gain (loss) on investments | | | 180,407,299 | |
| | | | |
Net increase (decrease) in net assets resulting from operations | | $ | 669,205,830 | |
| | | | |
| | | | | | |
The notes to the financial statements are an integral part of,
and should be read in conjunction with, the financial statements. | | | | | 25 | |
Statements of Changes in Net Assets
for the years ended October 31, 2019 and October 31, 2018
| | | | | | | | |
| | | 2019 | | | 2018 | |
| Increase (Decrease) in Net Assets | |
Operations: | | | | | | | | |
Net investment income (loss) | | $ | 488,798,531 | | | $ | 488,564,779 | |
Net realized gain (loss) on investments | | | (93,603,555 | ) | | | 111,820,287 | |
Net change in unrealized appreciation (depreciation) on investments | | | 274,010,854 | | | | (468,251,250 | ) |
| | | | |
Net increase (decrease) in net assets resulting from operations | | | 669,205,830 | | | | 132,133,816 | |
| | | | |
Distributions to shareholders: | | | | | | | | |
Class A | | | (174,086,103 | ) | | | (183,893,283 | ) |
Investor Class | | | (8,349,190 | ) | | | (8,500,000 | ) |
Class B | | | (3,177,793 | ) | | | (4,233,276 | ) |
Class C | | | (19,959,506 | ) | | | (27,573,908 | ) |
Class I | | | (180,095,815 | ) | | | (215,711,694 | ) |
Class R1 | | | (2,575 | ) | | | (2,823 | ) |
Class R2 | | | (634,929 | ) | | | (434,175 | ) |
Class R3 | | | (42,832 | ) | | | (24,035 | ) |
Class R6 | | | (106,629,614 | ) | | | (54,203,430 | ) |
| | | | |
| | | (492,978,357 | ) | | | (494,576,624 | ) |
| | | | |
Distributions to shareholders from return of capital: | | | | | | | | |
Class A | | | (14,976,081 | ) | | | (15,921,400 | ) |
Investor Class | | | (718,255 | ) | | | (735,926 | ) |
Class B | | | (273,376 | ) | | | (366,515 | ) |
Class C | | | (1,717,054 | ) | | | (2,387,337 | ) |
Class I | | | (15,493,078 | ) | | | (18,676,225 | ) |
Class R1 | | | (221 | ) | | | (244 | ) |
Class R2 | | | (54,621 | ) | | | (37,591 | ) |
Class R3 | | | (3,685 | ) | | | (2,081 | ) |
Class R6 | | | (9,173,011 | ) | | | (4,692,909 | ) |
| | | | |
| | | (42,409,382 | ) | | | (42,820,228 | ) |
| | | | |
Total distributions to shareholders | | | (535,387,739 | ) | | | (537,396,852 | ) |
| | | | |
Capital share transactions: | | | | | | | | |
Net proceeds from sale of shares | | | 4,156,205,964 | | | | 2,389,951,877 | |
Net asset value of shares issued to shareholders in reinvestment of distributions | | | 485,322,513 | | | | 488,685,533 | |
Cost of shares redeemed | | | (3,830,355,865 | ) | | | (4,146,270,831 | ) |
| | | | |
Increase (decrease) in net assets derived from capital share transactions | | | 811,172,612 | | | | (1,267,633,421 | ) |
| | | | |
Net increase (decrease) in net assets | | | 944,990,703 | | | | (1,672,896,457 | ) |
|
| Net Assets | |
Beginning of year | | | 8,707,796,412 | | | | 10,380,692,869 | |
| | | | |
End of year | | $ | 9,652,787,115 | | | $ | 8,707,796,412 | |
| | | | |
| | | | |
| 26 | | MainStay MacKay High Yield Corporate Bond Fund | | The notes to the financial statements are an integral part of,
and should be read in conjunction with, the financial statements. |
Financial Highlightsselected per share data and ratios
| | | | | | | | | | | | | | | | | | | | |
| |
| | | Year ended October 31, | |
| | | | | |
| Class A | | 2019 | | | 2018 | | | 2017 | | | 2016 | | | 2015 | |
| | | | | |
Net asset value at beginning of year | | $ | 5.52 | | | $ | 5.77 | | | $ | 5.74 | | | $ | 5.57 | | | $ | 5.93 | |
| | | | | | | | | | | | | | | | | | | | |
| | | | | |
Net investment income (loss) (a) | | | 0.29 | | | | 0.29 | | | | 0.30 | | | | 0.33 | | | | 0.31 | |
| | | | | |
Net realized and unrealized gain (loss) on investments | | | 0.12 | | | | (0.22 | ) | | | 0.09 | | | | 0.20 | | | | (0.31 | ) |
| | | | | |
Net realized and unrealized gain (loss) on foreign currency transactions | | | — | | | | — | | | | — | | | | 0.00 | ‡ | | | — | |
| | | | | | | | | | | | | | | | | | | | |
| | | | | |
Total from investment operations | | | 0.41 | | | | 0.07 | | | | 0.39 | | | | 0.53 | | | | 0.00 | ‡ |
| | | | | | | | | | | | | | | | | | | | |
| | | | | |
| Less dividends and distributions: | | | | | | | | | | | | | | | | | | | | |
| | | | | |
From net investment income | | | (0.29 | ) | | | (0.29 | ) | | | (0.31 | ) | | | (0.34 | ) | | | (0.31 | ) |
| | | | | |
Return of capital | | | (0.03 | ) | | | (0.03 | ) | | | (0.05 | ) | | | (0.02 | ) | | | (0.05 | ) |
| | | | | | | | | | | | | | | | | | | | |
| | | | | |
Total dividends and distributions | | | (0.32 | ) | | | (0.32 | ) | | | (0.36 | ) | | | (0.36 | ) | | | (0.36 | ) |
| | | | | | | | | | | | | | | | | | | | |
| | | | | |
Net asset value at end of year | | $ | 5.61 | | | $ | 5.52 | | | $ | 5.77 | | | $ | 5.74 | | | $ | 5.57 | |
| | | | | | | | | | | | | | | | | | | | |
| | | | | |
Total investment return (b) | | | 7.58 | % | | | 1.29 | % | | | 6.91 | % | | | 9.96 | % | | | 0.06 | % |
| | | | | |
| Ratios (to average net assets)/Supplemental Data: | | | | | | | | | | | | | | | | | | | | |
| | | | | |
Net investment income (loss) | | | 5.21 | % | | | 5.15 | % | | | 5.25 | % | | | 5.98 | % | | | 5.45 | % |
| | | | | |
Net expenses (c) | | | 0.99 | % | | | 0.99 | % | | | 0.97 | % | | | 0.95 | % | | | 0.96 | % |
| | | | | |
Portfolio turnover rate | | | 30 | % | | | 30 | % | | | 43 | % | | | 41 | % | | | 38 | % |
| | | | | |
Net assets at end of year (in 000’s) | | $ | 3,405,587 | | | $ | 3,290,659 | | | $ | 3,683,113 | | | $ | 3,551,864 | | | $ | 3,364,517 | |
| ‡ | Less than one cent per share. |
| (a) | Per share data based on average shares outstanding during the year. |
| (b) | Total investment return is calculated exclusive of sales charges and assumes the reinvestment of dividends and distributions. For periods of less than one year, total return is not annualized. |
| (c) | In addition to the fees and expenses which the Fund bears directly, it also indirectly bears a pro-rata share of the fees and expenses of the underlying funds in which it invests. Such indirect expenses are not included in the above expense ratios. |
| | | | | | | | | | | | | | | | | | | | |
| |
| | | Year ended October 31, | |
| | | | | |
| Investor Class | | 2019 | | | 2018 | | | 2017 | | | 2016 | | | 2015 | |
| | | | | |
Net asset value at beginning of year | | $ | 5.57 | | | $ | 5.82 | | | $ | 5.79 | | | $ | 5.62 | | | $ | 5.99 | |
| | | | | | | | | | | | | | | | | | | | |
| | | | | |
Net investment income (loss) (a) | | | 0.29 | | | | 0.29 | | | | 0.30 | | | | 0.33 | | | | 0.31 | |
| | | | | |
Net realized and unrealized gain (loss) on investments | | | 0.11 | | | | (0.22 | ) | | | 0.09 | | | | 0.20 | | | | (0.31 | ) |
| | | | | |
Net realized and unrealized gain (loss) on foreign currency transactions | | | — | | | | — | | | | — | | | | 0.00 | ‡ | | | — | |
| | | | | | | | | | | | | | | | | | | | |
| | | | | |
Total from investment operations | | | 0.40 | | | | 0.07 | | | | 0.39 | | | | 0.53 | | | | (0.00 | )‡ |
| | | | | | | | | | | | | | | | | | | | |
| | | | | |
| Less dividends and distributions: | | | | | | | | | | | | | | | | | | | | |
| | | | | |
From net investment income | | | (0.29 | ) | | | (0.29 | ) | | | (0.31 | ) | | | (0.34 | ) | | | (0.32 | ) |
| | | | | |
Return of capital | | | (0.03 | ) | | | (0.03 | ) | | | (0.05 | ) | | | (0.02 | ) | | | (0.05 | ) |
| | | | | | | | | | | | | | | | | | | | |
| | | | | |
Total dividends and distributions | | | (0.32 | ) | | | (0.32 | ) | | | (0.36 | ) | | | (0.36 | ) | | | (0.37 | ) |
| | | | | | | | | | | | | | | | | | | | |
| | | | | |
Net asset value at end of year | | $ | 5.65 | | | $ | 5.57 | | | $ | 5.82 | | | $ | 5.79 | | | $ | 5.62 | |
| | | | | | | | | | | | | | | | | | | | |
| | | | | |
Total investment return (b) | | | 7.33 | % | | | 1.29 | % | | | 6.90 | % | | | 9.91 | % | | | (0.07 | %) |
| | | | | |
| Ratios (to average net assets)/Supplemental Data: | | | | | | | | | | | | | | | | | | | | |
| | | | | |
Net investment income (loss) | | | 5.15 | % | | | 5.12 | % | | | 5.21 | % | | | 5.90 | % | | | 5.39 | % |
| | | | | |
Net expenses (c) | | | 1.05 | % | | | 1.03 | % | | | 1.02 | % | | | 1.03 | % | | | 1.02 | % |
| | | | | |
Portfolio turnover rate | | | 30 | % | | | 30 | % | | | 43 | % | | | 41 | % | | | 38 | % |
| | | | | |
Net assets at end of year (in 000’s) | | $ | 162,260 | | | $ | 159,970 | | | $ | 167,139 | | | $ | 287,493 | | | $ | 282,451 | |
| ‡ | Less than one cent per share. |
| (a) | Per share data based on average shares outstanding during the year. |
| (b) | Total investment return is calculated exclusive of sales charges and assumes the reinvestment of dividends and distributions. For periods of less than one year, total return is not annualized. |
| (c) | In addition to the fees and expenses which the Fund bears directly, it also indirectly bears a pro-rata share of the fees and expenses of the underlying funds in which it invests. Such indirect expenses are not included in the above expense ratios. |
| | | | | | |
The notes to the financial statements are an integral part of,
and should be read in conjunction with, the financial statements. | | | | | 27 | |
Financial Highlightsselected per share data and ratios
| | | | | | | | | | | | | | | | | | | | |
| |
| | | Year ended October 31, | |
| | | | | |
| Class B | | 2019 | | | 2018 | | | 2017 | | | 2016 | | | 2015 | |
| | | | | |
Net asset value at beginning of year | | $ | 5.50 | | | $ | 5.74 | | | $ | 5.71 | | | $ | 5.54 | | | $ | 5.90 | |
| | | | | | | | | | | | | | | | | | | | |
| | | | | |
Net investment income (loss) (a) | | | 0.24 | | | | 0.25 | | | | 0.26 | | | | 0.28 | | | | 0.27 | |
| | | | | |
Net realized and unrealized gain (loss) on investments | | | 0.11 | | | | (0.21 | ) | | | 0.08 | | | | 0.20 | | | | (0.32 | ) |
| | | | | |
Net realized and unrealized gain (loss) on foreign currency transactions | | | — | | | | — | | | | — | | | | 0.00 | ‡ | | | — | |
| | | | | | | | | | | | | | | | | | | | |
| | | | | |
Total from investment operations | | | 0.35 | | | | 0.04 | | | | 0.34 | | | | 0.48 | | | | (0.05 | ) |
| | | | | | | | | | | | | | | | | | | | |
| | | | | |
| Less dividends and distributions: | | | | | | | | | | | | | | | | | | | | |
| | | | | |
From net investment income | | | (0.25 | ) | | | (0.26 | ) | | | (0.27 | ) | | | (0.29 | ) | | | (0.26 | ) |
| | | | | |
Return of capital | | | (0.02 | ) | | | (0.02 | ) | | | (0.04 | ) | | | (0.02 | ) | | | (0.05 | ) |
| | | | | | | | | | | | | | | | | | | | |
| | | | | |
Total dividends and distributions | | | (0.27 | ) | | | (0.28 | ) | | | (0.31 | ) | | | (0.31 | ) | | | (0.31 | ) |
| | | | | | | | | | | | | | | | | | | | |
| | | | | |
Net asset value at end of year | | $ | 5.58 | | | $ | 5.50 | | | $ | 5.74 | | | $ | 5.71 | | | $ | 5.54 | |
| | | | | | | | | | | | | | | | | | | | |
| | | | | |
Total investment return (b) | | | 6.52 | % | | | 0.64 | % | | | 6.06 | % | | | 8.85 | % | | | (0.60 | %) |
| | | | | |
| Ratios (to average net assets)/Supplemental Data: | | | | | | | | | | | | | | | | | | | | |
| | | | | |
Net investment income (loss) | | | 4.41 | % | | | 4.37 | % | | | 4.47 | % | | | 5.16 | % | | | 4.64 | % |
| | | | | |
Net expenses (c) | | | 1.80 | % | | | 1.78 | % | | | 1.77 | % | | | 1.78 | % | | | 1.77 | % |
| | | | | |
Portfolio turnover rate | | | 30 | % | | | 30 | % | | | 43 | % | | | 41 | % | | | 38 | % |
| | | | | |
Net assets at end of year (in 000’s) | | $ | 63,517 | | | $ | 81,221 | | | $ | 108,263 | | | $ | 132,509 | | | $ | 139,683 | |
| ‡ | Less than one cent per share. |
| (a) | Per share data based on average shares outstanding during the year. |
| (b) | Total investment return is calculated exclusive of sales charges and assumes the reinvestment of dividends and distributions. For periods of less than one year, total return is not annualized. |
| (c) | In addition to the fees and expenses which the Fund bears directly, it also indirectly bears a pro-rata share of the fees and expenses of the underlying funds in which it invests. Such indirect expenses are not included in the above expense ratios. |
| | | | | | | | | | | | | | | | | | | | |
| |
| | | Year ended October 31, | |
| | | | | |
| Class C | | 2019 | | | 2018 | | | 2017 | | | 2016 | | | 2015 | |
| | | | | |
Net asset value at beginning of year | | $ | 5.50 | | | $ | 5.74 | | | $ | 5.72 | | | $ | 5.55 | | | $ | 5.90 | |
| | | | | | | | | | | | | | | | | | | | |
| | | | | |
Net investment income (loss) (a) | | | 0.24 | | | | 0.25 | | | | 0.26 | | | | 0.28 | | | | 0.27 | |
| | | | | |
Net realized and unrealized gain (loss) on investments | | | 0.12 | | | | (0.21 | ) | | | 0.07 | | | | 0.20 | | | | (0.31 | ) |
| | | | | |
Net realized and unrealized gain (loss) on foreign currency transactions | | | — | | | | — | | | | — | | | | 0.00 | ‡ | | | — | |
| | | | | | | | | | | | | | | | | | | | |
| | | | | |
Total from investment operations | | | 0.36 | | | | 0.04 | | | | 0.33 | | | | 0.48 | | | | (0.04 | ) |
| | | | | | | | | | | | | | | | | | | | |
| | | | | |
| Less dividends and distributions: | | | | | | | | | | | | | | | | | | | | |
| | | | | |
From net investment income | | | (0.25 | ) | | | (0.26 | ) | | | (0.27 | ) | | | (0.29 | ) | | | (0.26 | ) |
| | | | | |
Return of capital | | | (0.02 | ) | | | (0.02 | ) | | | (0.04 | ) | | | (0.02 | ) | | | (0.05 | ) |
| | | | | | | | | | | | | | | | | | | | |
| | | | | |
Total dividends and distributions | | | (0.27 | ) | | | (0.28 | ) | | | (0.31 | ) | | | (0.31 | ) | | | (0.31 | ) |
| | | | | | | | | | | | | | | | | | | | |
| | | | | |
Net asset value at end of year | | $ | 5.59 | | | $ | 5.50 | | | $ | 5.74 | | | $ | 5.72 | | | $ | 5.55 | |
| | | | | | | | | | | | | | | | | | | | |
| | | | | |
Total investment return (b) | | | 6.71 | % | | | 0.64 | % | | | 5.87 | % | | | 9.04 | % | | | (0.60 | %) |
| | | | | |
| Ratios (to average net assets)/Supplemental Data: | | | | | | | | | | | | | | | | | | | | |
| | | | | |
Net investment income (loss) | | | 4.41 | % | | | 4.36 | % | | | 4.45 | % | | | 5.15 | % | | | 4.64 | % |
| | | | | |
Net expenses (c) | | | 1.80 | % | | | 1.78 | % | | | 1.77 | % | | | 1.78 | % | | | 1.77 | % |
| | | | | |
Portfolio turnover rate | | | 30 | % | | | 30 | % | | | 43 | % | | | 41 | % | | | 38 | % |
| | | | | |
Net assets at end of year (in 000’s) | | $ | 373,760 | | | $ | 550,819 | | | $ | 676,463 | | | $ | 678,364 | | | $ | 679,392 | |
| ‡ | Less than one cent per share. |
| (a) | Per share data based on average shares outstanding during the year. |
| (b) | Total investment return is calculated exclusive of sales charges and assumes the reinvestment of dividends and distributions. For periods of less than one year, total return is not annualized. |
| (c) | In addition to the fees and expenses which the Fund bears directly, it also indirectly bears a pro-rata share of the fees and expenses of the underlying funds in which it invests. Such indirect expenses are not included in the above expense ratios. |
| | | | |
| 28 | | MainStay MacKay High Yield Corporate Bond Fund | | The notes to the financial statements are an integral part of,
and should be read in conjunction with, the financial statements. |
Financial Highlightsselected per share data and ratios
| | | | | | | | | | | | | | | | | | | | |
| |
| | | Year ended October 31, | |
| | | | | |
| Class I | | 2019 | | | 2018 | | | 2017 | | | 2016 | | | 2015 | |
| | | | | |
Net asset value at beginning of year | | $ | 5.53 | | | $ | 5.78 | | | $ | 5.75 | | | $ | 5.58 | | | $ | 5.94 | |
| | | | | | | | | | | | | | | | | | | | |
| | | | | |
Net investment income (loss) (a) | | | 0.30 | | | | 0.31 | | | | 0.32 | | | | 0.34 | | | | 0.33 | |
| | | | | |
Net realized and unrealized gain (loss) on investments | | | 0.11 | | | | (0.22 | ) | | | 0.08 | | | | 0.20 | | | | (0.31 | ) |
| | | | | |
Net realized and unrealized gain (loss) on foreign currency transactions | | | — | | | | — | | | | — | | | | 0.00 | ‡ | | | — | |
| | | | | | | | | | | | | | | | | | | | |
| | | | | |
Total from investment operations | | | 0.41 | | | | 0.09 | | | | 0.40 | | | | 0.54 | | | | 0.02 | |
| | | | | | | | | | | | | | | | | | | | |
| | | | | |
| Less dividends and distributions: | | | | | | | | | | | | | | | | | | | | |
| | | | | |
From net investment income | | | (0.30 | ) | | | (0.31 | ) | | | (0.32 | ) | | | (0.35 | ) | | | (0.33 | ) |
| | | | | |
Return of capital | | | (0.03 | ) | | | (0.03 | ) | | | (0.05 | ) | | | (0.02 | ) | | | (0.05 | ) |
| | | | | | | | | | | | | | | | | | | | |
| | | | | |
Total dividends and distributions | | | (0.33 | ) | | | (0.34 | ) | | | (0.37 | ) | | | (0.37 | ) | | | (0.38 | ) |
| | | | | | | | | | | | | | | | | | | | |
| | | | | |
Net asset value at end of year | | $ | 5.61 | | | $ | 5.53 | | | $ | 5.78 | | | $ | 5.75 | | | $ | 5.58 | |
| | | | | | | | | | | | | | | | | | | | |
| | | | | |
Total investment return (b) | | | 7.68 | % | | | 1.57 | % | | | 7.17 | % | | | 10.23 | % | | | 0.32 | % |
| | | | | |
| Ratios (to average net assets)/Supplemental Data: | | | | | | | | | | | | | | | | | | | | |
| | | | | |
Net investment income (loss) | | | 5.45 | % | | | 5.40 | % | | | 5.51 | % | | | 6.23 | % | | | 5.70 | % |
| | | | | |
Net expenses (c) | | | 0.74 | % | | | 0.74 | % | | | 0.72 | % | | | 0.70 | % | | | 0.71 | % |
| | | | | |
Portfolio turnover rate | | | 30 | % | | | 30 | % | | | 43 | % | | | 41 | % | | | 38 | % |
| | | | | |
Net assets at end of year (in 000’s) | | $ | 3,451,487 | | | $ | 3,709,306 | | | $ | 4,067,560 | | | $ | 5,313,266 | | | $ | 4,844,891 | |
| ‡ | Less than one cent per share. |
| (a) | Per share data based on average shares outstanding during the year. |
| (b) | Total investment return is calculated exclusive of sales charges and assumes the reinvestment of dividends and distributions. Class I shares are not subject to sales charges. For periods of less than one year, total return is not annualized. |
| (c) | In addition to the fees and expenses which the Fund bears directly, it also indirectly bears a pro-rata share of the fees and expenses of the underlying funds in which it invests. Such indirect expenses are not included in the above expense ratios. |
| | | | | | | | | | | | | | | | | | | | |
| |
| | | Year ended October 31, | |
| | | | | |
| Class R1 | | 2019 | | | 2018 | | | 2017 | | | 2016 | | | 2015 | |
| | | | | |
Net asset value at beginning of year | | $ | 5.52 | | | $ | 5.77 | | | $ | 5.74 | | | $ | 5.57 | | | $ | 5.93 | |
| | | | | | | | | | | | | | | | | | | | |
| | | | | |
Net investment income (loss) (a) | | | 0.30 | | | | 0.30 | | | | 0.32 | | | | 0.34 | | | | 0.32 | |
| | | | | |
Net realized and unrealized gain (loss) on investments | | | 0.11 | | | | (0.22 | ) | | | 0.07 | | | | 0.19 | | | | (0.31 | )�� |
| | | | | |
Net realized and unrealized gain (loss) on foreign currency transactions | | | — | | | | — | | | | — | | | | 0.00 | ‡ | | | — | |
| | | | | | | | | | | | | | | | | | | | |
| | | | | |
Total from investment operations | | | 0.41 | | | | 0.08 | | | | 0.39 | | | | 0.53 | | | | 0.01 | |
| | | | | | | | | | | | | | | | | | | | |
| | | | | |
| Less dividends and distributions: | | | | | | | | | | | | | | | | | | | | |
| | | | | |
From net investment income | | | (0.30 | ) | | | (0.30 | ) | | | (0.31 | ) | | | (0.34 | ) | | | (0.32 | ) |
| | | | | |
Return of capital | | | (0.03 | ) | | | (0.03 | ) | | | (0.05 | ) | | | (0.02 | ) | | | (0.05 | ) |
| | | | | | | | | | | | | | | | | | | | |
| | | | | |
Total dividends and distributions | | | (0.33 | ) | | | (0.33 | ) | | | (0.36 | ) | | | (0.36 | ) | | | (0.37 | ) |
| | | | | | | | | | | | | | | | | | | | |
| | | | | |
Net asset value at end of year | | $ | 5.60 | | | $ | 5.52 | | | $ | 5.77 | | | $ | 5.74 | | | $ | 5.57 | |
| | | | | | | | | | | | | | | | | | | | |
| | | | | |
Total investment return (b) | | | 7.58 | % | | | 1.46 | % | | | 7.07 | % | | | 10.13 | % | | | 0.21 | % |
| | | | | |
| Ratios (to average net assets)/Supplemental Data: | | | | | | | | | | | | | | | | | | | | |
| | | | | |
Net investment income (loss) | | | 5.36 | % | | | 5.25 | % | | | 5.48 | % | | | 6.11 | % | | | 5.60 | % |
| | | | | |
Net expenses (c) | | | 0.84 | % | | | 0.84 | % | | | 0.82 | % | | | 0.80 | % | | | 0.81 | % |
| | | | | |
Portfolio turnover rate | | | 30 | % | | | 30 | % | | | 43 | % | | | 41 | % | | | 38 | % |
| | | | | |
Net assets at end of year (in 000’s) | | $ | 53 | | | $ | 72 | | | $ | 37 | | | $ | 59 | | | $ | 39 | |
| ‡ | Less than one cent per share. |
| (a) | Per share data based on average shares outstanding during the year. |
| (b) | Total investment return is calculated exclusive of sales charges and assumes the reinvestment of dividends and distributions. Class R1 shares are not subject to sales charges. For periods of less than one year, total return is not annualized. |
| (c) | In addition to the fees and expenses which the Fund bears directly, it also indirectly bears a pro-rata share of the fees and expenses of the underlying funds in which it invests. Such indirect expenses are not included in the above expense ratios. |
| | | | | | |
The notes to the financial statements are an integral part of,
and should be read in conjunction with, the financial statements. | | | | | 29 | |
Financial Highlightsselected per share data and ratios
| | | | | | | | | | | | | | | | | | | | |
| |
| | | Year ended October 31, | |
| | | | | |
| Class R2 | | 2019 | | | 2018 | | | 2017 | | | 2016 | | | 2015 | |
| | | | | |
Net asset value at beginning of year | | $ | 5.52 | | | $ | 5.77 | | | $ | 5.74 | | | $ | 5.57 | | | $ | 5.93 | |
| | | | | | | | | | | | | | | | | | | | |
| | | | | |
Net investment income (loss) (a) | | | 0.28 | | | | 0.29 | | | | 0.30 | | | | 0.32 | | | | 0.31 | |
| | | | | |
Net realized and unrealized gain (loss) on investments | | | 0.12 | | | | (0.22 | ) | | | 0.08 | | | | 0.20 | | | | (0.31 | ) |
| | | | | |
Net realized and unrealized gain (loss) on foreign currency transactions | | | — | | | | — | | | | — | | | | 0.00 | ‡ | | | — | |
| | | | | | | | | | | | | | | | | | | | |
| | | | | |
Total from investment operations | | | 0.40 | | | | 0.07 | | | | 0.38 | | | | 0.52 | | | | (0.00 | )‡ |
| | | | | | | | | | | | | | | | | | | | |
| | | | | |
| Less dividends and distributions: | | | | | | | | | | | | | | | | | | | | |
| | | | | |
From net investment income | | | (0.29 | ) | | | (0.29 | ) | | | (0.30 | ) | | | (0.33 | ) | | | (0.31 | ) |
| | | | | |
Return of capital | | | (0.02 | ) | | | (0.03 | ) | | | (0.05 | ) | | | (0.02 | ) | | | (0.05 | ) |
| | | | | | | | | | | | | | | | | | | | |
| | | | | |
Total dividends and distributions | | | (0.31 | ) | | | (0.32 | ) | | | (0.35 | ) | | | (0.35 | ) | | | (0.36 | ) |
| | | | | | | | | | | | | | | | | | | | |
| | | | | |
Net asset value at end of year | | $ | 5.61 | | | $ | 5.52 | | | $ | 5.77 | | | $ | 5.74 | | | $ | 5.57 | |
| | | | | | | | | | | | | | | | | | | | |
| | | | | |
Total investment return (b) | | | 7.49 | % | | | 1.20 | % | | | 6.80 | % | | | 9.83 | % | | | (0.04 | %) |
| | | | | |
| Ratios (to average net assets)/Supplemental Data: | | | | | | | | | | | | | | | | | | | | |
| | | | | |
Net investment income (loss) | | | 5.10 | % | | | 5.06 | % | | | 5.16 | % | | | 5.89 | % | | | 5.35 | % |
| | | | | |
Net expenses (c) | | | 1.09 | % | | | 1.09 | % | | | 1.07 | % | | | 1.05 | % | | | 1.06 | % |
| | | | | |
Portfolio turnover rate | | | 30 | % | | | 30 | % | | | 43 | % | | | 41 | % | | | 38 | % |
| | | | | |
Net assets at end of year (in 000’s) | | $ | 13,866 | | | $ | 11,116 | | | $ | 9,562 | | | $ | 10,917 | | | $ | 10,084 | |
| ‡ | Less than one cent per share. |
| (a) | Per share data based on average shares outstanding during the year. |
| (b) | Total investment return is calculated exclusive of sales charges and assumes the reinvestment of dividends and distributions. Class R2 shares are not subject to sales charges. For periods of less than one year, total return is not annualized. |
| (c) | In addition to the fees and expenses which the Fund bears directly, it also indirectly bears a pro-rata share of the fees and expenses of the underlying funds in which it invests. Such indirect expenses are not included in the above expense ratios. |
| | | | | | | | | | | | | | | | |
| | |
| | | Year ended October 31, | | | February 29,
2016^
through
October 31, | |
| | | | |
| Class R3 | | 2019 | | | 2018 | | | 2017 | | | 2016 | |
| | | | |
Net asset value at beginning of period | | $ | 5.52 | | | $ | 5.77 | | | $ | 5.74 | | | $ | 5.17 | |
| | | | | | | | | | | | | | | | |
| | | | |
Net investment income (loss) (a) | | | 0.27 | | | | 0.27 | | | | 0.28 | | | | 0.20 | |
| | | | |
Net realized and unrealized gain (loss) on investments | | | 0.11 | | | | (0.22 | ) | | | 0.09 | | | | 0.60 | |
| | | | | | | | | | | | | | | | |
| | | | |
Total from investment operations | | | 0.38 | | | | 0.05 | | | | 0.37 | | | | 0.80 | |
| | | | | | | | | | | | | | | | |
| | | | |
| Less dividends and distributions: | | | | | | | | | | | | | | | | |
| | | | |
From net investment income | | | (0.28 | ) | | | (0.28 | ) | | | (0.29 | ) | | | (0.21 | ) |
| | | | |
Return of capital | | | (0.02 | ) | | | (0.02 | ) | | | (0.05 | ) | | | (0.02 | ) |
| | | | | | | | | | | | | | | | |
| | | | |
Total dividends and distributions | | | (0.30 | ) | | | (0.30 | ) | | | (0.34 | ) | | | (0.23 | ) |
| | | | | | | | | | | | | | | | |
| | | | |
Net asset value at end of period | | $ | 5.60 | | | $ | 5.52 | | | $ | 5.77 | | | $ | 5.74 | |
| | | | | | | | | | | | | | | | |
| | | | |
Total investment return (b) | | | 7.03 | % | | | 0.96 | % | | | 6.58 | % | | | 15.59 | % |
| | | | |
| Ratios (to average net assets)/Supplemental Data: | | | | | | | | | | | | | | | | |
| | | | |
Net investment income (loss) | | | 4.84 | % | | | 4.77 | % | | | 4.81 | % | | | 5.40 | %†† |
| | | | |
Net expenses (c) | | | 1.34 | % | | | 1.34 | % | | | 1.32 | % | | | 1.30 | %†† |
| | | | |
Portfolio turnover rate | | | 30 | % | | | 30 | % | | | 43 | % | | | 41 | % |
| | | | |
Net assets at end of period (in 000’s) | | $ | 1,281 | | | $ | 606 | | | $ | 392 | | | $ | 130 | |
| (a) | Per share data based on average shares outstanding during the period. |
| (b) | Total investment return is calculated exclusive of sales charges and assumes the reinvestment of dividends and distributions. Class R3 shares are not subject to sales charges. For periods of less than one year, total return is not annualized. |
| (c) | In addition to the fees and expenses which the Fund bears directly, it also indirectly bears a pro-rata share of the fees and expenses of the underlying funds in which it invests. Such indirect expenses are not included in the above expense ratios. |
| | | | |
| 30 | | MainStay MacKay High Yield Corporate Bond Fund | | The notes to the financial statements are an integral part of,
and should be read in conjunction with, the financial statements. |
Financial Highlightsselected per share data and ratios
| | | | | | | | | | | | | | | | | | | | |
| |
| | | Year ended October 31, | |
| | | | | |
| Class R6 | | 2019 | | | 2018 | | | 2017 | | | 2016 | | | 2015 | |
| | | | | |
Net asset value at beginning of year | | $ | 5.52 | | | $ | 5.77 | | | $ | 5.74 | | | $ | 5.58 | | | $ | 5.94 | |
| | | | | | | | | | | | | | | | | | | | |
| | | | | |
Net investment income (loss) (a) | | | 0.31 | | | | 0.31 | | | | 0.32 | | | | 0.35 | | | | 0.34 | |
| | | | | |
Net realized and unrealized gain (loss) on investments | | | 0.11 | | | | (0.21 | ) | | | 0.09 | | | | 0.19 | | | | (0.31 | ) |
| | | | | | | | | | | | | | | | | | | | |
| | | | | |
Total from investment operations | | | 0.42 | | | | 0.10 | | | | 0.41 | | | | 0.54 | | | | 0.03 | |
| | | | | | | | | | | | | | | | | | | | |
| | | | | |
| Less dividends and distributions: | | | | | | | | | | | | | | | | | | | | |
| | | | | |
From net investment income | | | (0.31 | ) | | | (0.32 | ) | | | (0.33 | ) | | | (0.36 | ) | | | (0.34 | ) |
| | | | | |
Return of capital | | | (0.03 | ) | | | (0.03 | ) | | | (0.05 | ) | | | (0.02 | ) | | | (0.05 | ) |
| | | | | | | | | | | | | | | | | | | | |
| | | | | |
Total dividends and distributions | | | (0.34 | ) | | | (0.35 | ) | | | (0.38 | ) | | | (0.38 | ) | | | (0.39 | ) |
| | | | | | | | | | | | | | | | | | | | |
| | | | | |
Net asset value at end of year | | $ | 5.60 | | | $ | 5.52 | | | $ | 5.77 | | | $ | 5.74 | | | $ | 5.58 | |
| | | | | | | | | | | | | | | | | | | | |
| | | | | |
Total investment return (b) | | | 7.84 | % | | | 1.71 | % | | | 7.36 | % | | | 10.24 | % | | | 0.50 | % |
| | | | | |
| Ratios (to average net assets)/Supplemental Data: | | | | | | | | | | | | | | | | | | | | |
| | | | | |
Net investment income (loss) | | | 5.60 | % | | | 5.54 | % | | | 5.45 | % | | | 6.23 | % | | | 5.84 | % |
| | | | | |
Net expenses (c) | | | 0.58 | % | | | 0.58 | % | | | 0.58 | % | | | 0.58 | % | | | 0.58 | % |
| | | | | |
Portfolio turnover rate | | | 30 | % | | | 30 | % | | | 43 | % | | | 41 | % | | | 38 | % |
| | | | | |
Net assets at end of year (in 000’s) | | $ | 2,180,977 | | | $ | 904,028 | | | $ | 1,668,163 | | | $ | 53,712 | | | $ | 15,017 | |
| (a) | Per share data based on average shares outstanding during the year. |
| (b) | Total investment return is calculated exclusive of sales charges and assumes the reinvestment of dividends and distributions. Class R6 shares are not subject to sales charges. For periods of less than one year, total return is not annualized. |
| (c) | In addition to the fees and expenses which the Fund bears directly, it also indirectly bears a pro-rata share of the fees and expenses of the underlying funds in which it invests. Such indirect expenses are not included in the above expense ratios. |
| | | | | | |
The notes to the financial statements are an integral part of,
and should be read in conjunction with, the financial statements. | | | | | 31 | |
Notes to Financial Statements
Note 1–Organization and Business
The MainStay Funds (the “Trust”) was organized on January 9, 1986, as a Massachusetts business trust and is governed by a Declaration of Trust. The Trust is registered under the Investment Company Act of 1940, as amended (the “1940 Act”), as an open-end management investment company, and is comprised of twelve funds (collectively referred to as the “Funds”). These financial statements and notes relate to the MainStay MacKay High Yield Corporate Bond Fund (the “Fund”), a “diversified” fund, as that term is defined in the 1940 Act, as interpreted or modified by regulatory authorities having jurisdiction, from time to time.
The Fund currently has nine classes of shares registered for sale. Class A shares commenced operations on January 3, 1995. Class B shares commenced operations on May 1, 1986. Class C shares commenced operations on September 1, 1998. Class I shares commenced operations on January 2, 2004. Class R2 shares were first offered to the public on December 14, 2007, but did not commence operations until May 1, 2008. Investor Class shares commenced operations on February 28, 2008. Class R1 shares commenced operations on June 29, 2012. Class R6 shares commenced operations on June 17, 2013. Class R3 shares commenced operations on February 29, 2016.
Class B shares of the MainStay Group of Funds are closed to all new purchases as well as additional investments by existing Class B shareholders. Existing Class B shareholders may continue to reinvest dividends and capital gains distributions, as well as exchange their Class B shares for Class B shares of other funds in the MainStay Group of Funds as permitted by the current exchange privileges. Class B shareholders continue to be subject to any applicable contingent deferred sales charge (“CDSC”) at the time of redemption. All other features of the Class B shares, including but not limited to the fees and expenses applicable to Class B shares, remain unchanged. Unless redeemed, Class B shareholders will remain in Class B shares of their respective fund until the Class B shares are converted to Class A or Investor Class shares pursuant to the applicable conversion schedule.
Class A and Investor Class shares are offered at net asset value (“NAV”) per share plus an initial sales charge. No initial sales charge applies to investments of $1 million or more (and certain other qualified purchases) in Class A and Investor Class shares. However, a CDSC of 1.00% may be imposed on certain redemptions made within 18 months of the date of purchase on shares that were purchased without an initial sales charge. Class C shares are offered at NAV without an initial sales charge, although a 1.00% CDSC may be imposed on certain redemptions of such shares made within one year of the date of purchase of Class C shares. When Class B shares were offered, they were offered at NAV without an initial sales charge, although a CDSC that declines depending on the number of years a shareholder has held its Class B shares may be imposed on certain redemptions of such shares made within six years of the date of purchase of such shares. Class I, Class R1, Class R2, Class R3 and Class R6 shares are offered at NAV without a sales charge. Depending upon eligibility, Class B shares convert to either Class A or Investor Class shares at the end of the calendar quarter eight years after the date they were purchased. In addition, depending upon eligibility, Class C shares convert to either Class A or Investor Class shares at the end of the calendar quarter ten years after the date they were purchased.
Additionally, as disclosed in the Fund’s prospectus, Class A shares may convert automatically to Investor Class shares and Investor Class shares may convert automatically to Class A shares. Under certain circumstances and as may be permitted by the Trust’s multiple class plan pursuant to Rule 18f-3 under the 1940 Act, specified share classes of the Fund may be converted to one or more other share classes of the Fund as disclosed in the capital share transactions within these Notes. The classes of shares have the same voting (except for issues that relate solely to one class), dividend, liquidation and other rights, and the same terms and conditions, except that under distribution plans pursuant to Rule 12b-1 under the 1940 Act, Class B and Class C shares are subject to higher distribution and/or service fees than Class A, Investor Class, Class R2 and Class R3 shares. Class I, Class R1 and Class R6 shares are not subject to a distribution and/or service fee. Class R1, Class R2 and Class R3 shares are subject to a shareholder service fee, which is in addition to fees paid under the distribution plans for Class R2 and Class R3 shares.
The Fund’s investment objective is to seek maximum current income through investment in a diversified portfolio of high-yield debt securities. Capital appreciation is a secondary objective.
Note 2–Significant Accounting Policies
The Fund is an investment company and accordingly follows the investment company accounting and reporting guidance of the Financial Accounting Standards Board (“FASB”) Accounting Standard CodificationTopic 946 Financial Services—Investment Companies. The Fund prepares its financial statements in accordance with generally accepted accounting principles (“GAAP”) in the United States of America and follows the significant accounting policies described below.
(A) Securities Valuation. Investments are usually valued as of the close of regular trading on the New York Stock Exchange (the “Exchange”) (usually 4:00 p.m. Eastern time) on each day the Fund is open for business (“valuation date”).
The Board of Trustees of the Trust (the “Board”) adopted procedures establishing methodologies for the valuation of the Fund’s securities and other assets and delegated the responsibility for valuation determinations under those procedures to the Valuation Committee of the Trust (the “Valuation Committee”). The Board authorized the Valuation Committee to appoint a Valuation Subcommittee (the “Subcommittee”) to deal in the first instance with establishing the prices of securities for which market quotations are not readily available or the prices of which are not otherwise readily determinable under these procedures. The Subcommittee meets (in person, via electronic mail or via teleconference) on an as-needed basis. Subsequently, the Valuation Committee meets to ensure that actions taken by the Subcommittee were appropriate. The procedures state that, subject to the oversight of the Board and unless otherwise noted, the responsibility for theday-to-day valuation of portfolio assets (including fair value measurements for the Fund’s assets and liabilities) rests with New York Life Investment Management LLC (“New York Life Investments” or the “Manager”), aided to whatever extent necessary by the Subadvisor (as defined in Note 3(A)).
To assess the appropriateness of security valuations, the Manager, the Subadvisor or the Fund’s third-party service provider, who is subject to
| | |
| 32 | | MainStay MacKay High Yield Corporate Bond Fund |
oversight by the Manager, regularly compares prior day prices, prices on comparable securities and the sale prices to the prior and current day prices and challenges prices with changes exceeding certain tolerance levels with third-party pricing services or broker sources. For those securities valued through either a standardized fair valuation methodology or a fair valuation measurement, the Subcommittee deals in the first instance with such valuation and the Valuation Committee reviews and affirms, if appropriate, the reasonableness of the valuation based on such methodologies and measurements on a regular basis after considering information that is reasonably available and deemed relevant by the Valuation Committee. Any action taken by the Subcommittee with respect to the valuation of a portfolio security or other asset is submitted for review and ratification (if appropriate) to the Valuation Committee and the Board at the next regularly scheduled meeting.
“Fair value” is defined as the price the Fund would reasonably expect to receive upon selling an asset or liability in an orderly transaction to an independent buyer in the principal or most advantageous market for the asset or liability. Fair value measurements are determined within a framework that establishes a three-tier hierarchy which maximizes the use of observable market data and minimizes the use of unobservable inputs to establish a classification of fair value measurements for disclosure purposes. “Inputs” refer broadly to the assumptions that market participants would use in pricing the asset or liability, including assumptions about risk, such as the risk inherent in a particular valuation technique used to measure fair value using a pricing model and/or the risk inherent in the inputs for the valuation technique. Inputs may be observable or unobservable. Observable inputs reflect the assumptions market participants would use in pricing the asset or liability based on market data obtained from sources independent of the Fund. Unobservable inputs reflect the Fund’s own assumptions about the assumptions market participants would use in pricing the asset or liability based on the information available. The inputs or methodology used for valuing assets or liabilities may not be an indication of the risks associated with investing in those assets or liabilities. The three-tier hierarchy of inputs is summarized below.
| • | | Level 1—quoted prices in active markets for an identical asset or liability |
| • | | Level 2—other significant observable inputs (including quoted prices for a similar asset or liability in active markets, interest rates and yield curves, prepayment speeds, credit risk, etc.) |
| • | | Level 3—significant unobservable inputs (including the Fund’s own assumptions about the assumptions that market participants would use in measuring fair value of an asset or liability) |
The level of an asset or liability within the fair value hierarchy is based on the lowest level of an input, both individually and in the aggregate, that is significant to the fair value measurement. As of October 31, 2019, the aggregate value by input level of the Fund’s assets and liabilities is included at the end of the Fund’s Portfolio of Investments.
The Fund may use third-party vendor evaluations, whose prices may be derived from one or more of the following standard inputs, among others:
| | |
• Benchmark yields | | • Reported trades |
• Broker/dealer quotes | | • Issuer spreads |
• Two-sided markets | | • Benchmark securities |
• Bids/offers | | • Reference data (corporate actions or material event notices) |
• Industry and economic events | | • Comparable bonds |
• Monthly payment information | | |
An asset or liability for which market values cannot be measured using the methodologies described above is valued by methods deemed reasonable in good faith by the Valuation Committee, following the procedures established by the Board, to represent fair value. Under these procedures, the Fund generally uses a market-based approach which may use related or comparable assets or liabilities, recent transactions, market multiples, book values and other relevant information. The Fund may also use an income-based valuation approach in which the anticipated future cash flows of the asset or liability are discounted to calculate fair value. Discounts may also be applied due to the nature and/or duration of any restrictions on the disposition of the asset or liability. Fair value represents a good faith approximation of the value of a security. Fair value determinations involve the consideration of a number of subjective factors, an analysis of applicable facts and circumstances and the exercise of judgment. As a result, it is possible that the fair value for a security determined in good faith in accordance with the Fund’s valuation procedures may differ from valuations for the same security determined by other funds using their own valuation procedures. Although the Fund’s valuation procedures are designed to value a security at the price the Fund may reasonably expect to receive upon the security’s sale in an orderly transaction, there can be no assurance that any fair value determination thereunder would, in fact, approximate the amount that the Fund would actually realize upon the sale of the security or the price at which the security would trade if a reliable market price were readily available. During the year ended October 31, 2019, there were no material changes to the fair value methodologies.
Securities which may be valued in this manner include, but are not limited to: (i) a security for which trading has been halted or suspended; (ii) a debt security that has recently gone into default and for which there is not a current market quotation; (iii) a security of an issuer that has entered into a restructuring; (iv) a security that has been delisted from a national exchange; (v) a security for which the market price is not readily available from a third-party pricing source or, if so provided, does not, in the opinion of the Manager or the Subadvisor, reflect the security’s market value; (vi) a security subject to trading collars for which no or limited trading takes place; and (vii) a security whose principal market has been temporarily closed at a time when, under normal conditions, it would be open. Securities valued in this manner are generally categorized as Level 3 in the hierarchy. As of October 31, 2019, securities that were fair valued in such a manner are shown in the Portfolio of Investments.
Equity securities, including exchange-traded funds (“ETFs”), are valued at the last quoted sales prices as of the close of regular trading on the
Notes to Financial Statements(continued)
relevant exchange on each valuation date. Securities that are not traded on the valuation date are valued at the mean of the last quoted bid and ask prices. Prices are normally taken from the principal market in which each security trades. These securities are generally categorized as Level 1 in the hierarchy.
Investments in mutual funds, including money market funds, are valued at their respective NAVs as of the close of the Exchange on the valuation date. These securities are generally categorized as Level 1 in the hierarchy.
Debt securities (other than convertible and municipal bonds) are valued at the evaluated bid prices (evaluated mean prices in the case of convertible and municipal bonds) supplied by a pricing agent or brokers selected by the Manager, in consultation with the Subadvisor. The evaluations are market-based measurements processed through a pricing application and represents the pricing agent’s good faith determination as to what a holder may receive in an orderly transaction under market conditions. The rules based logic utilizes valuation techniques that reflect participants’ assumptions and vary by asset class and per methodology, maximizing the use of relevant observable data including quoted prices for similar assets, benchmark yield curves and market corroborated inputs. The evaluated bid or mean prices are deemed by the Manager, in consultation with the Subadvisor, to be representative of market values at the regular close of trading of the Exchange on each valuation date. Debt securities purchased on a delayed delivery basis are marked to market daily until settlement at the forward settlement date. Debt securities, including corporate bonds, U.S. government and federal agency bonds, municipal bonds, foreign bonds, convertible bonds, asset-backed securities and mortgage-backed securities are generally categorized as Level 2 in the hierarchy.
Loan assignments, participations and commitments are valued at the average of bid quotations obtained from the engaged independent pricing service and are generally categorized as Level 2 in the hierarchy. Certain loan assignments, participations and commitments may be valued by utilizing significant unobservable inputs obtained from the pricing service and are generally categorized as Level 3 in the hierarchy. As of October 31, 2019, there were no securities held that were fair valued in such manner.
Temporary cash investments acquired in excess of 60 days to maturity at the time of purchase are valued using the latest bid prices or using valuations based on a matrix system (which considers such factors as security prices, yields, maturities and ratings), both as furnished by independent pricing services. Other temporary cash investments which mature in 60 days or less at the time of purchase (“Short-Term Investments”) are valued using the amortized cost method of valuation, unless the use of such method would be inappropriate. The amortized cost method involves valuing a security at its cost on the date of purchase and thereafter assuming a constant amortization to maturity of the difference between such cost and the value on maturity date. Amortized cost approximates the current fair value of a security. Securities valued using the amortized cost method are not valued using quoted prices in an active market and are generally categorized as Level 2 in the hierarchy.
The information above is not intended to reflect an exhaustive list of the methodologies that may be used to value portfolio investments. The
valuation procedures permit the use of a variety of valuation methodologies in connection with valuing portfolio investments. The methodology used for a specific type of investment may vary based on the market data available or other considerations. The methodologies summarized above may not represent the specific means by which portfolio investments are valued on any particular business day.
The valuation techniques and significant unobservable inputs used in the fair valuation measurement of the Fund’s Level 3 securities are outlined in the table below. A significant increase or decrease in any of those inputs in isolation would result in a significantly higher or lower fair value measurement.
| | | | | | | | | | | | |
Asset Class | | Fair Value at 10/31/19* | | | Valuation Technique | | Unobservable Inputs | | Inputs/ Range | |
| | | | |
Convertible
Bonds | | $ | 27,728,150 | | | Income
Approach | | Spread
Adjustment | | | 12.75 | % |
| | | | |
| | | 11,559 | | | Income
Approach | | Liquidity
Discount | | | 100bps | |
| | | | |
| | | | | | | | Subordination
Discount | | | 150bps | |
| | | | |
Corporate
Bonds | | | 127,969,758 | | | Income
Approach | | Spread
Adjustment | |
| 1.18%–
6.03% |
|
| | | | |
| | | 7,742,000 | | | Market
Approach | | Implied
natural
gas price | | | $2.25 | |
| | | | |
| | | | | | | | Enterprise
Value | | | $81.00 | |
| | | | |
Loan
Assignment | | | 16,636,467 | | | Market
Approach | | Implied
natural
gas price | | | $2.25 | |
| | | | |
| | | | | | | | Enterprise
Value | | | $81.00 | |
| | | | |
Common
Stocks | | | 6,898,124 | | | Market
Approach | | Estimated
Enterprise
Value | |
| $848.1m–
$974.0m |
|
| | | | |
| | | | | | | | Estimated Volatility | | | 25.00 | % |
| | | | |
| | | 0 | | | Market
Approach | | Implied
natural gas price | | | $2.25 | |
| | | | |
| | | | | | | | Enterprise Value | | | $81.00 | |
| | | | |
| | | 907,138 | | | Market
Approach | | EBITDA Multiple | | | 6.00x | |
| | | | |
| | | 9,898,795 | | | Market
Approach | | EBITDA Multiple | | | 5.75x | |
| | | | |
| | | | | | | | Discount
Rate | | | 10.00 | % |
| | | | |
| | | 0 | | | Qualitative
Assessment | | | | | $0.00 | |
| | | | | | | | | | | | |
| | $ | 197,791,991 | | | | | | | | | |
| | | | | | | | | | | | |
| * | The table above does not include Level 3 investments that were valued by a broker without adjustment. As of October 31, 2019, the value of these investments was $25,041,260. The inputs for these investments were not readily available or cannot be reasonably estimated. |
A portfolio investment may be classified as an illiquid investment under the Trust’s written liquidity risk management program and related procedures (“Liquidity Program”). Illiquidity of an investment might
| | |
| 34 | | MainStay MacKay High Yield Corporate Bond Fund |
prevent the sale of such investment at a time when the Manager or the Subadvisor might wish to sell, and these investments could have the effect of decreasing the overall level of the Fund’s liquidity. Further, the lack of an established secondary market may make it more difficult to value illiquid investments, requiring the Fund to rely on judgments that may be somewhat subjective in measuring value, which could vary materially from the amount that the Fund could realize upon disposition. Difficulty in selling illiquid investments may result in a loss or may be costly to the Fund. An illiquid investment is any investment that the Manager or Subadvisor reasonably expects cannot be sold or disposed of in current market conditions in seven calendar days or less without the sale or disposition significantly changing the market value of the investment. The liquidity classification of each investment will be made using information obtained after reasonable inquiry and taking into account, among other things, relevant market, trading and investment-specific considerations in accordance with the Liquidity Program. Illiquid investments are often valued in accordance with methods deemed by the Board in good faith to be reasonable and appropriate to accurately reflect their fair value. The liquidity of the Fund’s investments, as shown in the Portfolio of Investments, was determined as of October 31, 2019, and can change at any time. Illiquid investments as of October 31, 2019, are shown in the Portfolio of Investments.
(B) Income Taxes. The Fund’s policy is to comply with the requirements of the Internal Revenue Code of 1986, as amended (the “Internal Revenue Code”), applicable to regulated investment companies and to distribute all of its taxable income to the shareholders of the Fund within the allowable time limits. Therefore, no federal, state and local income tax provisions are required.
Management evaluates the Fund’s tax positions to determine if the tax positions taken meet the minimum recognition threshold in connection with accounting for uncertainties in income tax positions taken or expected to be taken for the purposes of measuring and recognizing tax liabilities in the financial statements. Recognition of tax benefits of an uncertain tax position is permitted only to the extent the position is “more likely than not” to be sustained assuming examination by taxing authorities. Management has analyzed the Fund’s tax positions taken on federal, state and local income tax returns for all open tax years (for up to three tax years) and has concluded that no provisions for federal, state and local income tax are required in the Fund’s financial statements. The Fund’s federal, state and local income tax and federal excise tax returns for tax years for which the applicable statutes of limitations have not expired are subject to examination by the Internal Revenue Service and state and local departments of revenue.
(C) Dividends and Distributions to Shareholders. Dividends and distributions are recorded on the ex-dividend date. The Fund intends to declare and pay dividends from net investment income, if any, at least monthly and distributions from net realized capital and currency gains, if any, at least annually. Unless the shareholder elects otherwise, all dividends and distributions are reinvested in the same class of shares of the Fund, at NAV. Dividends and distributions to shareholders are determined in accordance with federal income tax regulations and may differ from determinations using GAAP.
(D) Security Transactions and Investment Income. The Fund records security transactions on the trade date. Realized gains and losses on security transactions are determined using the identified cost
method. Dividend income is recognized on the ex-dividend date; net of any foreign tax withheld at the source, and interest income is accrued as earned using the effective interest rate method. Discounts and premiums on securities purchased for the Fund are accreted and amortized, respectively, on the effective interest rate method over the life of the respective securities. Income frompayment-in-kind securities is accreted daily based on the effective interest method.
Investment income and realized and unrealized gains and losses on investments of the Fund are allocated pro rata to the separate classes of shares based upon their relative net assets on the date the income is earned or realized and unrealized gains and losses are incurred.
The Fund may place a debt security on non-accrual status and reduce related interest income by ceasing current accruals and writing off all or a portion of any interest receivables when the collection of all or a portion of such interest has become doubtful. A debt security is removed from non-accrual status when the issuer resumes interest payments or when collectability of interest is reasonably assured.
(E) Expenses. Expenses of the Trust are allocated to the individual Funds in proportion to the net assets of the respective Funds when the expenses are incurred, except where direct allocations of expenses can be made. Expenses (other than transfer agent expenses and fees incurred under the shareholder services plans and/or the distribution plans further discussed in Note 3(B)) are allocated to separate classes of shares pro rata based upon their relative net assets on the date the expenses are incurred. The expenses borne by the Fund, including those of related parties to the Fund, are shown in the Statement of Operations.
Additionally, the Fund may invest in ETFs and mutual funds, which are subject to management fees and other fees that may cause the costs of investing in ETFs and mutual funds to be greater than the costs of owning the underlying securities directly. These indirect expenses of ETFs and mutual funds are not included in the amounts shown as expenses in the Fund’s Statement of Operations or in the expense ratios included in the Financial Highlights.
(F) Use of Estimates. In preparing financial statements in conformity with GAAP, management makes estimates and assumptions that affect the reported amounts and disclosures in the financial statements. Actual results could differ from those estimates.
(G) Loan Assignments, Participations and Commitments. The Fund may invest in loan assignments and participations (“loans”). Commitments are agreements to make money available to a borrower in a specified amount, at a specified rate and within a specified time. The Fund records an investment when the borrower withdraws money on a commitment or when a funded loan is purchased (trade date) and records interest as earned. These loans pay interest at rates that are periodically reset by reference to a base lending rate plus a spread. These base lending rates are generally the prime rate offered by a designated U.S. bank or the London Interbank Offered Rate (“LIBOR”).
The loans in which the Fund may invest are generally readily marketable, but may be subject to some restrictions on resale. For example, the Fund may be contractually obligated to receive approval from the agent bank and/or borrower prior to the sale of these investments. If the Fund purchases an assignment from a lender, the Fund will generally
Notes to Financial Statements(continued)
have direct contractual rights against the borrower in favor of the lender. If the Fund purchases a participation interest either from a lender or a participant, the Fund typically will have established a direct contractual relationship with the seller of the participation interest, but not with the borrower. Consequently, the Fund is subject to the credit risk of the lender or participant who sold the participation interest to the Fund, in addition to the usual credit risk of the borrower. In the event that the borrower, selling participant or intermediate participants become insolvent or enter into bankruptcy, the Fund may incur certain costs and delays in realizing payment, or may suffer a loss of principal and/or interest.
Unfunded commitments represent the remaining obligation of the Fund to the borrower. At any point in time, up to the maturity date of the issue, the borrower may demand the unfunded portion. Unfunded amounts, if any, are marked to market and any unrealized gains or losses are recorded in the Statement of Assets and Liabilities. As of October 31, 2019, the Fund did not hold any unfunded commitments.
(H) Securities Lending. In order to realize additional income, the Fund may engage in securities lending, subject to the limitations set forth in the 1940 Act and relevant guidance by the staff of the Securities and Exchange Commission (“SEC”). In the event the Fund does engage in securities lending, the Fund will lend through its custodian, State Street Bank and Trust Company (“State Street”), acting as securities lending agent on behalf of the Fund. State Street will manage the Fund’s collateral in accordance with the securities lending agency agreement between the Fund and State Street, and indemnify the Fund against counterparty risk. The loans will be collateralized by cash (which may be invested in a money market fund) and/ornon-cash collateral (which may include U.S. Treasury securities and/or U.S. Government Agency securities issued or guaranteed by the United States government or its agencies or instrumentalities) at least equal at all times to the market value of the securities loaned. The Fund may bear the risk of delay in recovery of, or loss of rights in, the securities loaned should the borrower of the securities experience financial difficulty. The Fund may also record a realized gain or loss on securities deemed sold due to a borrower’s inability to return securities on loan. The Fund bears the risk of any loss on investment of cash collateral. The Fund will receive compensation for lending its securities in the form of fees or it will retain a portion of interest earned on the investment of any cash collateral. The Fund will also continue to receive interest and dividends on the securities loaned and any gain or loss in the market price of the securities loaned that may occur during the term of the loan will be for the account of the Fund. Income earned from securities lending activities, if any, is reflected in the Statement of Operations. As of October 31, 2019, the Fund had securities on loan with an aggregate market value of $23,794,919 and received cash collateral, which was invested into the State Street Navigator Securities Lending Government Money Market Portfolio, with a value of $24,350,755.
(I) Debt Securities and Loan Risk. The Fund primarily invests in high-yield debt securities (commonly referred to as “junk bonds”), which are considered speculative because they present a greater risk of loss, including default, than higher rated debt securities. These securities pay investors a premium—a higher interest rate or yield than investment grade debt securities—because of the increased risk of loss. These securities can also be subject to greater price volatility. In times of
unusual or adverse market, economic or political conditions, these securities may experience higher than normal default rates.
The loans in which the Fund invests are usually rated below investment grade, or if unrated, determined by the Subadvisor to be of comparable quality (commonly referred to as “junk bonds”) and are generally considered speculative because they present a greater risk of loss, including default, than higher quality debt securities. Moreover, such securities may, under certain circumstances, be particularly susceptible to liquidity and valuation risks. Although certain loans are collateralized, there is no guarantee that the value of the collateral will be sufficient or available to satisfy the borrower’s obligation. In times of unusual or adverse market, economic or political conditions, loans may experience higher than normal default rates. In the event of a recession or serious credit event, among other eventualities, the value of the Fund’s investments in loans are more likely to decline. The secondary market for loans is limited and, thus, the Fund’s ability to sell or realize the full value of its investment in these loans to reinvest sale proceeds or to meet redemption obligations may be impaired. In addition, loans generally are subject to extended settlement periods that may be longer than seven days. As a result, the Fund may be adversely affected by selling other investments at an unfavorable time and/or under unfavorable conditions or engaging in borrowing transactions, such as borrowing against its credit facility, to raise cash to meet redemption obligations or pursue other investment opportunities.
In certain circumstances, loans may not be deemed to be securities. As a result, the Fund may not have the protection of the anti-fraud provisions of the federal securities laws. In such cases, the Fund generally must rely on the contractual provisions in the loan agreement and common-law fraud protections under applicable state law.
(J) Indemnifications. Under the Trust’s organizational documents, its officers and trustees are indemnified against certain liabilities that may arise out of performance of their duties to the Trust. Additionally, in the normal course of business, the Fund enters into contracts with third-party service providers that contain a variety of representations and warranties and which may provide general indemnifications. The Fund’s maximum exposure under these arrangements is unknown, as this would involve future claims that may be made against the Fund that have not yet occurred. Based on experience, management is of the view that the risk of loss in connection with these potential indemnification obligations is remote. However, there can be no assurance that material liabilities related to such obligations will not arise in the future, which could adversely impact the Fund.
Note 3–Fees and Related Party Transactions
(A) Manager and Subadvisor. New York Life Investments, a registered investment adviser and an indirect,wholly-owned subsidiary of New York Life Insurance Company (“New York Life”), serves as the Fund’s Manager, pursuant to an Amended and Restated Management Agreement (“Management Agreement”). The Manager provides offices, conducts clerical, recordkeeping and bookkeeping services and keeps most of the financial and accounting records required to be maintained by the Fund. Except for the portion of salaries and expenses that are the responsibility of the Fund, the Manager pays the salaries and expenses of all personnel affiliated with the Fund and certain operational expenses of the Fund. The Fund reimburses New York Life Investments in an
| | |
| 36 | | MainStay MacKay High Yield Corporate Bond Fund |
amount equal to a portion of the compensation of the Chief Compliance Officer attributable to the Fund. MacKay Shields LLC (“MacKay Shields” or the “Subadvisor”), a registered investment adviser and an indirect,wholly-owned subsidiary of New York Life, serves as Subadvisor to the Fund and is responsible for theday-to-day portfolio management of the Fund. Pursuant to the terms of an Amended and Restated Subadvisory Agreement (“Subadvisory Agreement”) between New York Life Investments and MacKay Shields, New York Life Investments pays for the services of the Subadvisor.
Under the Management Agreement, the Fund pays the Manager a monthly fee for the services performed and the facilities furnished at an annual rate of the Fund’s average daily net assets as follows: 0.60% up to $500 million; 0.55% from $500 million up to $5 billion; 0.525% from $5 billion up to $7 billion; 0.50% from $7 billion up to $10 billion; 0.49% from $10 billion to $15 billion; and 0.48% in excess of $15 billion, plus a fee for fund accounting services previously provided by New York Life Investments under a separate fund accounting agreement furnished at an annual rate of the Fund’s average daily net assets as follows: 0.05% up to $20 million; 0.0333% from $20 million to $100 million; and 0.01% in excess of $100 million.
During the year ended October 31, 2019, the effective management fee rate (exclusive of any applicable waivers/reimbursements) was 0.55% inclusive of a fee for fund accounting services of 0.01% of the Fund’s average daily net assets.
New York Life Investments has contractually agreed to waive fees and/ or reimburse expenses so that Total Annual Fund Operating Expenses (excluding taxes, interest, litigation, extraordinary expenses, brokerage and other transaction expenses relating to the purchase or sale of portfolio investments, and acquired (underlying) fund fees and expenses) of Class R6 do not exceed those of Class I. This agreement will remain in effect until February 28, 2020, and shall renew automatically for one-year terms unless New York Life Investments provides written notice of termination prior to the start of the next term or upon approval of the Board.
During the year ended October 31, 2019, New York Life Investments earned fees from the Fund in the amount of $50,073,114 and paid the Subadvisor in the amount of $24,564,436.
State Street providessub-administration andsub-accounting services to the Fund pursuant to an agreement with New York Life Investments. These services include calculating the daily NAVs of the Fund, maintaining the general ledger andsub-ledger accounts for the calculation of the Fund’s NAVs and assisting New York Life Investments in conducting various aspects of the Fund’s administrative operations. For providing these services to the Fund, State Street is compensated by New York Life Investments.
Pursuant to an agreement between the Trust and New York Life Investments, New York Life Investments is responsible for providing or procuring certain regulatory reporting services for the Fund. The Fund will reimburse New York Life Investments for the actual costs incurred by New York Life Investments in connection with providing or procuring these services for the Fund.
(B) Distribution, Service and Shareholder Service Fees. The Trust, on behalf of the Fund, has entered into a distribution agreement with NYLIFE Distributors LLC (the “Distributor”), an indirect,
wholly-owned subsidiary of New York Life. The Fund has adopted distribution plans (the “Plans”) in accordance with the provisions of Rule 12b-1 under the 1940 Act.
Pursuant to the Class A, Investor Class and Class R2 Plans, the Distributor receives a monthly distribution fee from the Class A, Investor Class and Class R2 shares at an annual rate of 0.25% of the average daily net assets of the Class A, Investor Class and Class R2 shares for distribution and/or service activities as designated by the Distributor. Pursuant to the Class B and Class C Plans, Class B and Class C shares pay the Distributor a monthly distribution fee at an annual rate of 0.75% of the average daily net assets of the Class B and Class C shares, along with a service fee at an annual rate of 0.25% of the average daily net assets of the Class B and Class C shares, for a total 12b-1 fee of 1.00%. Pursuant to the Class R3 Plan, the Distributor receives a monthly distribution and/or service fee from the Class R3 shares at an annual rate of 0.50% of the average daily net assets of the Class R3 shares. Class I, Class R1 and Class R6 shares are not subject to a distribution and/or service fee.
The Plans provide that the distribution and service fees are payable to the Distributor regardless of the amounts actually expended by the Distributor for distribution of the Fund’s shares and service activities.
In accordance with the Shareholder Services Plans for the Class R1, Class R2 and Class R3 shares, the Manager has agreed to provide, through its affiliates or independent third parties, various shareholder and administrative support services to shareholders of the Class R1, Class R2 and Class R3 shares. For its services, the Manager, its affiliates or independent third-party service providers are entitled to a shareholder service fee accrued daily and paid monthly at an annual rate of 0.10% of the average daily net assets of the Class R1, Class R2 and Class R3 shares. This is in addition to any fees paid under the Class R2 and Class R3 Plans.
During the year ended October 31, 2019, shareholder service fees incurred by the Fund were as follows:
| | | | |
| |
Class R1 | | $ | 48 | |
Class R2 | | | 12,268 | |
Class R3 | | | 855 | |
(C) Sales Charges. During the year ended October 31, 2019, the Fund was advised by the Distributor that the amount of initial sales charges retained on sales of Class A and Investor Class shares were $639,279 and $75,165, respectively.
During the year ended October 31, 2019, the Fund was also advised that the Distributor retained CDSCs on redemptions of Class A, Investor Class, Class B and Class C shares of $46,211, $2, $85,411 and $14,183, respectively.
(D) Transfer, Dividend Disbursing and Shareholder Servicing Agent. NYLIM Service Company LLC, an affiliate of New York Life Investments, is the Fund’s transfer, dividend disbursing and shareholder servicing agent pursuant to an agreement between NYLIM Service Company LLC and the Trust. NYLIM Service Company LLC has entered into an agreement with DST Asset Manager Solutions, Inc. (“DST”), pursuant to which DST performs certain transfer agent services on behalf of NYLIM Service Company LLC. During the year
Notes to Financial Statements(continued)
ended October 31, 2019, transfer agent expenses incurred by the Fund were as follows:
| | | | |
| |
Class A | | $ | 5,266,605 | |
Investor Class | | | 348,764 | |
Class B | | | 154,662 | |
Class C | | | 977,235 | |
Class I | | | 5,229,808 | |
Class R1 | | | 76 | |
Class R2 | | | 19,579 | |
Class R3 | | | 1,369 | |
(E) Small Account Fee. Shareholders with small accounts adversely impact the cost of providing transfer agency services. In an effort to reduce total transfer agency expenses, the Fund has implemented a small account fee on certain types of accounts. Certain shareholders with an account balance of less than $1,000 are charged an annual per account fee of $20 (assessed semi-annually), the proceeds from which offset transfer agent fees as reflected in the Statement of Operations.
(F) Capital. As of October 31, 2019, New York Life and its affiliates beneficially held shares of the Fund with the values and percentages of net assets as follows:
| | | | | | | | |
| | |
Class I | | $ | 509,246 | | | | 0.0 | %‡ |
Class R1 | | | 37,777 | | | | 71.4 | |
| ‡ | Less than one-tenth of a percent. |
Note 4–Federal Income Tax
As of October 31, 2019, the cost and unrealized appreciation (depreciation) of the Fund’s investment portfolio, including applicable derivative contracts and other financial instruments, as determined on a federal income tax basis, were as follows:
| | | | | | | | | | | | | | | | |
| | | Federal Tax
Cost | | | Gross
Unrealized
Appreciation | | | Gross
Unrealized
(Depreciation) | | | Net
Unrealized
Appreciation/
(Depreciation) | |
| | | | |
Investments in Securities | | $ | 9,516,576,876 | | | $ | 393,604,788 | | | $ | (341,713,788 | ) | | $ | 51,891,000 | |
As of October 31, 2019, the components of accumulated gain (loss) on a tax basis were as follows:
| | | | | | | | | | | | | | | | |
Ordinary
Income | | Accumulated
Capital and
Other Gain
(Loss) | | | Other
Temporary Differences | | | Unrealized
Appreciation
(Depreciation) | | | Total
Accumulated
Gain (Loss) | |
| | | | |
| $— | | $ | (269,666,525 | ) | | $ | (10,637,918 | ) | | $ | 51,891,000 | | | $ | (228,413,443 | ) |
The difference between book basis and tax basis unrealized gain/loss is primarily due to wash sales.
The other temporary differences are primarily due to interest accruals on defaulted securities.
The following table discloses the current year reclassifications between total distributable earnings (loss) and additional paid-in capital arising from permanent differences; net assets as of October 31, 2019 were not affected.
| | | | | | |
Total
Distributable
Earnings (Loss) | | | Additional
Paid-In
Capital | |
| |
| $ | 3,643 | | | $ | (3,643 | ) |
The reclassifications for the Fund are primarily due to prior year post financial statement adjustments.
As of October 31, 2019, for federal income tax purposes, capital loss carryforwards of $269,666,525 were available as shown in the table below, to the extent provided by the regulations to offset future realized gains of the Fund through the years indicated. To the extent that these capital loss carryforwards are used to offset future capital gains, it is probable that the capital gains so offset will not be distributed to shareholders. No capital gain distributions shall be made until any capital loss carryforwards have been fully utilized.
| | | | |
Capital Loss
Available Through | | Short-Term
Capital Loss
Amounts (000’s) | | Long-Term
Capital Loss
Amounts (000’s) |
| | |
| Unlimited | | $19,612 | | $250,054 |
During the years ended October 31, 2019 and October 31, 2018, the tax character of distributions paid as reflected in the Statements of Changes in Net Assets were as follows:
| | | | | | | | |
| | | 2019 | | | 2018 | |
| | |
Distributions paid from: | | | | | | | | |
Ordinary Income | | $ | 492,978,357 | | | $ | 494,576,624 | |
Return of Capital | | | 42,409,382 | | | | 42,820,228 | |
Total | | $ | 535,387,739 | | | $ | 537,396,852 | |
| | |
| 38 | | MainStay MacKay High Yield Corporate Bond Fund |
Note 5–Restricted Securities
Restricted securities are subject to legal or contractual restrictions on resale. Private placement securities are generally considered to be restricted except for those securities traded between qualified institutional investors under the provisions of Rule 144A of the Securities Act of 1933, as amended. Disposal of restricted securities may involve time consuming negotiations and expenses, and prompt sale at an acceptable price may be difficult to achieve.
As of October 31, 2019, the Fund held the following restricted securities.
| | | | | | | | | | | | | | | | | | | | |
Security | | Date(s) of
Acquisition | | | Principal
Amount/
Shares | | | Cost | | | 10/31/19
Value | | | Percent of
Net Assets | |
| | | | | |
Aleris International, Inc.
Convertible Bond
6.00%, due 6/1/20 | | | 7/6/10 | | | $ | 11,797 | | | $ | 11,169 | | | $ | 11,559 | | | | 0.0 | %‡ |
| | | | | |
Exide Technologies
Common Stock | | | 4/30/15-6/26/19 | | | | 7,338,430 | | | | 60,030,658 | | | | 6,898,124 | | | | 0.1 | |
| | | | | |
GenOn Energy, Inc.
Common Stock | | | 12/14/2018 | | | | 386,241 | | | | 43,250,890 | | | | 85,938,622 | | | | 0.9 | |
| | | | | |
ION Media Networks, Inc.
Common Stock | | | 3/12/10-9/29/17 | | | | 2,287 | | | | 13,572 | | | | 907,138 | | | | 0.0 | ‡ |
| | | | | |
Rex Energy Corp. (Escrow Claim)
Corporate Bond
8.00%, due 10/1/20 | | | 10/03/2018 | | | $ | 124,195,000 | | | | — | | | | 310,488 | | | | 0.0 | ‡ |
| | | | | |
Sterling Entertainment Enterprises LLC
Corporate Bond
10.25%, due 1/15/25 | | | 12/28/17 | | | $ | 20,000,000 | | | | 19,759,012 | | | | 21,050,000 | | | | 0.2 | |
Total | | | — | | | | — | | | $ | 123,065,301 | | | $ | 115,115,931 | | | | 1.2 | % |
| ‡ | Less than one-tenth of a percent. |
Note 6–Custodian
State Street is the custodian of cash and securities held by the Fund. Custodial fees are charged to the Fund based on the Fund’s net assets and/or the market value of securities held by the Fund and the number of certain transactions incurred by the Fund.
Note 7–Line of Credit
The Fund and certain other funds managed by New York Life Investments maintain a line of credit with a syndicate of banks in order to secure a source of funds for temporary purposes to meet unanticipated or excessive redemption requests.
Effective July 30, 2019, under the credit agreement (the “Credit Agreement”), the aggregate commitment amount is $600,000,000 with an additional uncommitted amount of $100,000,000. The commitment fee is an annual rate of 0.15% of the average commitment amount payable quarterly, regardless of usage, to State Street, who serves as the agent to the syndicate. The commitment fee is allocated among the Fund and certain other funds managed by New York Life Investments based upon their respective net assets and other factors. Interest on any revolving credit loan is charged based upon the Federal Funds Rate or the one-month London Interbank Offered Rate (“LIBOR”), whichever is higher. The Credit Agreement expires on July 28, 2020, although the Fund, certain other funds managed by New York Life Investments and
the syndicate of banks may renew the Credit Agreement for an additional year on the same or different terms. Prior to July 30, 2019, the aggregate commitment amount and the commitment fee were the same as those under the current Credit Agreement. During the year ended October 31, 2019, there were no borrowings made or outstanding with respect to the Fund under the Credit Agreement.
Note 8–Interfund Lending Program
Pursuant to an exemptive order issued by the SEC, the Fund, along with certain other funds managed by New York Life Investments, may participate in an interfund lending program. The interfund lending program provides an alternative credit facility that permits the Fund and certain other funds managed by New York Life Investments to lend or borrow money for temporary purposes directly to or from one another subject to the conditions of the exemptive order. During the year ended October 31, 2019, there were no interfund loans made or outstanding with respect to the Fund.
Note 9–Purchases and Sales of Securities (in 000’s)
During the year ended October 31, 2019, purchases and sales of securities, other thanshort-term securities, were $3,445,451 and $2,620,334, respectively.
Notes to Financial Statements(continued)
Note 10–Capital Share Transactions
Transactions in capital shares for the years ended October 31, 2019 and October 31, 2018, were as follows:
| | | | | | | | |
Class A | | Shares | | | Amount | |
| | |
Year ended October 31, 2019: | | | | | | | | |
Shares sold | | | 109,026,669 | | | $ | 609,230,133 | |
Shares issued to shareholders in reinvestment of dividends and distributions | | | 29,125,162 | | | | 161,795,187 | |
Shares redeemed | | | (135,631,071 | ) | | | (754,132,210 | ) |
| | | | |
Net increase (decrease) in shares outstanding before conversion | | | 2,520,760 | | | | 16,893,110 | |
Shares converted into Class A (See Note 1) | | | 11,659,035 | | | | 64,979,916 | |
Shares converted from Class A (See Note 1) | | | (2,901,647 | ) | | | (16,231,977 | ) |
| | | | |
Net increase (decrease) | | | 11,278,148 | | | $ | 65,641,049 | |
| | | | |
Year ended October 31, 2018: | | | | | | | | |
Shares sold | | | 81,948,283 | | | $ | 465,649,820 | |
Shares issued to shareholders in reinvestment of dividends and distributions | | | 30,329,032 | | | | 171,300,889 | |
Shares redeemed | | | (158,819,289 | ) | | | (900,311,177 | ) |
| | | | |
Net increase (decrease) in shares outstanding before conversion | | | (46,541,974 | ) | | | (263,360,468 | ) |
Shares converted into Class A (See Note 1) | | | 5,744,195 | | | | 32,610,430 | |
Shares converted from Class A (See Note 1) | | | (1,592,187 | ) | | | (8,989,832 | ) |
| | | | |
Net increase (decrease) | | | (42,389,966 | ) | | $ | (239,739,870 | ) |
| | | | |
| | |
| | | | | | | | |
Investor Class | | Shares | | | Amount | |
| | |
Year ended October 31, 2019: | | | | | | | | |
Shares sold | | | 5,791,537 | | | $ | 32,673,618 | |
Shares issued to shareholders in reinvestment of dividends and distributions | | | 1,538,599 | | | | 8,616,122 | |
Shares redeemed | | | (5,534,938 | ) | | | (31,190,804 | ) |
| | | | |
Net increase (decrease) in shares outstanding before conversion | | | 1,795,198 | | | | 10,098,936 | |
Shares converted into Investor Class (See Note 1) | | | 2,396,950 | | | | 13,491,296 | |
Shares converted from Investor Class (See Note 1) | | | (4,225,489 | ) | | | (23,777,106 | ) |
| | | | |
Net increase (decrease) | | | (33,341 | ) | | $ | (186,874 | ) |
| | | | |
Year ended October 31, 2018: | | | | | | | | |
Shares sold | | | 3,462,654 | | | $ | 19,807,574 | |
Shares issued to shareholders in reinvestment of dividends and distributions | | | 1,534,158 | | | | 8,733,134 | |
Shares redeemed | | | 329,300 | | | | 1,761,792 | |
| | | | |
Net increase (decrease) in shares outstanding before conversion | | | 5,326,112 | | | | 30,302,500 | |
Shares converted into Investor Class (See Note 1) | | | 1,908,695 | | | | 10,887,820 | |
Shares converted from Investor Class (See Note 1) | | | (7,232,626 | ) | | | (41,236,187 | ) |
| | | | |
Net increase (decrease) | | | 2,181 | | | $ | (45,867 | ) |
| | | | |
| | | | | | | | |
Class B | | Shares | | | Amount | |
| | |
Year ended October 31, 2019: | | | | | | | | |
Shares sold | | | 1,087,084 | | | $ | 6,091,354 | |
Shares issued to shareholders in reinvestment of dividends and distributions | | | 566,778 | | | | 3,131,419 | |
Shares redeemed | | | (3,842,049 | ) | | | (21,308,958 | ) |
| | | | |
Net increase (decrease) in shares outstanding before conversion | | | (2,188,187 | ) | | | (12,086,185 | ) |
Shares converted from Class B (See Note 1) | | | (1,211,970 | ) | | | (6,700,688 | ) |
| | | | |
Net increase (decrease) | | | (3,400,157 | ) | | $ | (18,786,873 | ) |
| | | | |
Year ended October 31, 2018: | | | | | | | | |
Shares sold | | | 241,451 | | | $ | 1,359,738 | |
Shares issued to shareholders in reinvestment of dividends and distributions | | | 726,768 | | | | 4,087,799 | |
Shares redeemed | | | (3,336,932 | ) | | | (18,825,570 | ) |
| | | | |
Net increase (decrease) in shares outstanding before conversion | | | (2,368,713 | ) | | | (13,378,033 | ) |
Shares converted from Class B (See Note 1) | | | (1,708,658 | ) | | | (9,645,332 | ) |
| | | | |
Net increase (decrease) | | | (4,077,371 | ) | | $ | (23,023,365 | ) |
| | | | |
| | |
| | | | | | | | |
Class C | | Shares | | | Amount | |
| | |
Year ended October 31, 2019: | | | | | | | | |
Shares sold | | | 4,723,186 | | | $ | 26,187,539 | |
Shares issued to shareholders in reinvestment of dividends and distributions | | | 3,506,055 | | | | 19,364,942 | |
Shares redeemed | | | (35,272,423 | ) | | | (195,600,323 | ) |
| | | | |
Net increase (decrease) in shares outstanding before conversion | | | (27,043,182 | ) | | | (150,047,842 | ) |
Shares converted from Class C (See Note 1) | | | (6,213,278 | ) | | | (34,434,490 | ) |
| | | | |
Net increase (decrease) | | | (33,256,460 | ) | | $ | (184,482,332 | ) |
| | | | |
Year ended October 31, 2018: | | | | | | | | |
Shares sold | | | 6,368,864 | | | $ | 36,031,045 | |
Shares issued to shareholders in reinvestment of dividends and distributions | | | 4,736,234 | | | | 26,644,143 | |
Shares redeemed | | | (28,673,897 | ) | | | (161,805,598 | ) |
| | | | |
Net increase (decrease) in shares outstanding before conversion | | | (17,568,799 | ) | | | (99,130,410 | ) |
Shares converted from Class C (See Note 1) | | | (19,545 | ) | | | (111,523 | ) |
| | | | |
Net increase (decrease) | | | (17,588,344 | ) | | $ | (99,241,933 | ) |
| | | | |
| | |
| 40 | | MainStay MacKay High Yield Corporate Bond Fund |
| | | | | | | | |
Class I | | Shares | | | Amount | |
| | |
Year ended October 31, 2019: | | | | | | | | |
Shares sold | | | 369,778,310 | | | $ | 2,055,115,359 | |
Shares issued to shareholders in reinvestment of dividends and distributions | | | 31,677,016 | | | | 176,272,793 | |
Shares redeemed | | | (349,772,567 | ) | | | (1,938,607,921 | ) |
| | | | |
Net increase (decrease) in shares outstanding before conversion | | | 51,682,759 | | | | 292,780,231 | |
Shares converted into Class I (See Note 1) | | | 1,803,168 | | | | 10,045,070 | |
Shares converted from Class I (See Note 1) | | | (109,697,991 | ) | | | (600,048,104 | ) |
| | | | |
Net increase (decrease) | | | (56,212,064 | ) | | $ | (297,222,803 | ) |
| | | | |
Year ended October 31, 2018: | | | | | | | | |
Shares sold | | | 245,498,090 | | | $ | 1,396,789,903 | |
Shares issued to shareholders in reinvestment of dividends and distributions | | | 38,706,098 | | | | 218,802,565 | |
Shares redeemed | | | (314,348,256 | ) | | | (1,783,949,641 | ) |
| | | | |
Net increase (decrease) in shares outstanding before conversion | | | (30,144,068 | ) | | | (168,357,173 | ) |
Shares converted into Class I (See Note 1) | | | 391,168 | | | | 2,200,247 | |
Shares converted from Class I (See Note 1) | | | (3,296,534 | ) | | | (18,850,230 | ) |
| | | | |
Net increase (decrease) | | | (33,049,434 | ) | | $ | (185,007,156 | ) |
| | | | |
| | |
| | | | | | | | |
Class R1 | | Shares | | | Amount | |
| | |
Year ended October 31, 2019: | | | | | | | | |
Shares sold | | | 1,657 | | | $ | 9,192 | |
Shares issued to shareholders in reinvestment of dividends and distributions | | | 504 | | | | 2,796 | |
Shares redeemed | | | (5,695 | ) | | | (31,491 | ) |
| | | | |
Net increase (decrease) | | | (3,534 | ) | | $ | (19,503 | ) |
| | | | |
Year ended October 31, 2018: | | | | | | | | |
Shares sold | | | 10,062 | | | $ | 56,569 | |
Shares issued to shareholders in reinvestment of dividends and distributions | | | 545 | | | | 3,067 | |
Shares redeemed | | | (4,085 | ) | | | (23,088 | ) |
| | | | |
Net increase (decrease) | | | 6,522 | | | $ | 36,548 | |
| | | | |
| | |
| | | | | | | | |
| | | | | | | | |
Class R2 | | Shares | | | Amount | |
| | |
Year ended October 31, 2019: | | | | | | | | |
Shares sold | | | 829,133 | | | $ | 4,598,857 | |
Shares issued to shareholders in reinvestment of dividends and distributions | | | 106,098 | | | | 590,024 | |
Shares redeemed | | | (476,028 | ) | | | (2,623,840 | ) |
| | | | |
Net increase (decrease) | | | 459,203 | | | $ | 2,565,041 | |
| | | | |
Year ended October 31, 2018: | | | | | | | | |
Shares sold | | | 1,044,931 | | | $ | 5,911,911 | |
Shares issued to shareholders in reinvestment of dividends and distributions | | | 67,315 | | | | 379,990 | |
Shares redeemed | | | (752,554 | ) | | | (4,287,056 | ) |
| | | | |
Net increase (decrease) in shares outstanding before conversion | | | 359,692 | | | | 2,004,845 | |
Shares converted from Class R2 (See Note 1) | | | (3,959 | ) | | | (22,765 | ) |
| | | | |
Net increase (decrease) | | | 355,733 | | | $ | 1,982,080 | |
| | | | |
| | |
| | | | | | | | |
Class R3 | | Shares | | | Amount | |
| | |
Year ended October 31, 2019: | | | | | | | | |
Shares sold | | | 121,247 | | | $ | 675,686 | |
Shares issued to shareholders in reinvestment of dividends and distributions | | | 7,957 | | | | 44,264 | |
Shares redeemed | | | (9,822 | ) | | | (55,038 | ) |
| | | | |
Net increase (decrease) in shares outstanding before conversion | | | 119,382 | | | | 664,912 | |
Shares converted from Class R3 (See Note 1) | | | (607 | ) | | | (3,230 | ) |
| | | | |
Net increase (decrease) | | | 118,775 | | | $ | 661,682 | |
| | | | |
Year ended October 31, 2018: | | | | | | | | |
Shares sold | | | 72,058 | | | $ | 405,797 | |
Shares issued to shareholders in reinvestment of dividends and distributions | | | 4,011 | | | | 22,580 | |
Shares redeemed | | | (34,326 | ) | | | (194,435 | ) |
| | | | |
Net increase (decrease) | | | 41,743 | | | $ | 233,942 | |
| | | | |
| | |
| | | | | | | | |
Notes to Financial Statements(continued)
| | | | | | | | |
Class R6 | | Shares | | | Amount | |
| | |
Year ended October 31, 2019: | | | | | | | | |
Shares sold | | | 255,911,222 | | | $ | 1,421,624,226 | |
Shares issued to shareholders in reinvestment of dividends and distributions | | | 20,797,362 | | | | 115,504,966 | |
Shares redeemed | | | (159,723,301 | ) | | | (886,805,280 | ) |
| | | | |
Net increase (decrease) in shares outstanding before conversion | | | 116,985,283 | | | | 650,323,912 | |
Shares converted into Class R6 (See Note 1) | | | 109,898,841 | | | | 600,047,709 | |
Shares converted from Class R6 (See Note 1) | | | (1,330,027 | ) | | | (7,368,396 | ) |
| | | | |
Net increase (decrease) | | | 225,554,097 | | | $ | 1,243,003,225 | |
| | | | |
Year ended October 31, 2018: | | | | | | | | |
Shares sold | | | 82,006,063 | | | $ | 463,939,520 | |
Shares issued to shareholders in reinvestment of dividends and distributions | | | 10,375,321 | | | | 58,711,366 | |
Shares redeemed | | | (223,634,790 | ) | | | (1,278,636,058 | ) |
| | | | |
Net increase (decrease) in shares outstanding before conversion | | | (131,253,406 | ) | | | (755,985,172 | ) |
Shares converted into Class R6 (See Note 1) | | | 7,245,330 | | | | 41,236,187 | |
Shares converted from Class R6 (See Note 1) | | | (1,420,510 | ) | | | (8,078,815 | ) |
| | | | |
Net increase (decrease) | | | (125,428,586 | ) | | $ | (722,827,800 | ) |
| | | | |
Note 11–Recent Accounting Pronouncement
In March 2017, the Financial Accounting Standards Board issued an Accounting Standards Update, ASU2017-08, which amends the amortization period for certain callable debt securities that are held at a premium. The amendment requires the premium to be amortized to the
earliest call date. This amendment does not require an accounting change for securities held at a discount. This guidance is effective for fiscal years beginning after December 15, 2018. At this time, management is evaluating the implications of the ASU and any impact on the financial statements has not yet been determined.
To improve the effectiveness of fair value disclosure requirements, the Financial Accounting Standards Board recently issued Accounting Standards Update (ASU)2018-13, Fair Value Measurement Disclosure Framework—Changes to the Disclosure Requirements for Fair Value Measurement (ASU2018-13), which adds, removes, and modifies certain aspects relating to fair value disclosure. ASU2018-13 is effective for interim and annual reporting periods beginning after December 15, 2019; early adoptions of the entire ASU 2018-13, or portions thereof, is permitted. Management has evaluated the implications of certain other provisions of the ASU and has determined to early adopt aspects related to the removal and modifications of certain fair value measurement disclosures under the ASU effective immediately. At this time, management is evaluating the implications of certain other provisions of the ASU related to new disclosure requirements and any impact on the financial statement disclosures has not yet been determined.
Note 12–Subsequent Events
In connection with the preparation of the financial statements of the Fund as of and for the year ended October 31, 2019, events and transactions subsequent to October 31, 2019, through the date the financial statements were issued have been evaluated by the Fund’s management for possible adjustment and/or disclosure. No subsequent events requiring financial statement adjustment or disclosure have been identified.
| | |
| 42 | | MainStay MacKay High Yield Corporate Bond Fund |
Report of Independent Registered Public Accounting Firm
To the Shareholders and Board of Trustees
The MainStay Funds:
Opinion on the Financial Statements
We have audited the accompanying statement of assets and liabilities of MainStay MacKay High Yield Corporate Bond Fund (the Fund), one of the funds constituting The MainStay Funds, including the portfolio of investments, as of October 31, 2019, the related statement of operations for the year then ended, the statements of changes in net assets for each of the years in thetwo-year period then ended, and the related notes (collectively, the financial statements) and the financial highlights for each of the years or periods in thefive-year period then ended. In our opinion, the financial statements and financial highlights present fairly, in all material respects, the financial position of the Fund as of October 31, 2019, the results of its operations for the year then ended, the changes in its net assets for each of the years in thetwo-year period then ended, and the financial highlights for each of the years or periods in thefive-year period then ended, in conformity with U.S. generally accepted accounting principles.
Basis for Opinion
These financial statements and financial highlights are the responsibility of the Fund’s management. Our responsibility is to express an opinion on these financial statements and financial highlights based on our audits. We are a public accounting firm registered with the Public Company Accounting Oversight Board (United States) (PCAOB) and are required to be independent with respect to the Fund in accordance with the U.S. federal securities laws and the applicable rules and regulations of the Securities and Exchange Commission and the PCAOB.
We conducted our audits in accordance with the standards of the PCAOB. Those standards require that we plan and perform the audit to obtain reasonable assurance about whether the financial statements and financial highlights are free of material misstatement, whether due to error or fraud. Our audits included performing procedures to assess the risks of material misstatement of the financial statements and financial highlights, whether due to error or fraud, and performing procedures that respond to those risks. Such procedures included examining, on a test basis, evidence regarding the amounts and disclosures in the financial statements and financial highlights. Such procedures also included confirmation of securities owned as of October 31, 2019, by correspondence with custodians and brokers or by other appropriate auditing procedures when replies from brokers were not received. Our audits also included evaluating the accounting principles used and significant estimates made by management, as well as evaluating the overall presentation of the financial statements and financial highlights. We believe that our audits provide a reasonable basis for our opinion.

We have served as the auditor of one or more New York Life Investment Management investment companies since 2003.
Philadelphia, Pennsylvania
December 23, 2019
Federal Income Tax Information
(Unaudited)
The Fund is required under the Internal Revenue Code to advise shareholders in a written statement as to the federal tax status of dividends paid by the Fund during such fiscal years.
For the fiscal year ended October 31, 2019, the Fund designated approximately $1,207,889 under the Internal Revenue Code as qualified dividend income eligible for reduced tax rates.
The dividends paid by the Fund during the fiscal year ended October 31, 2019 should be multiplied by 0.25% to arrive at the amount eligible for the corporate dividend-received deduction.
In February 2020, shareholders will receive an IRS Form1099-DIV or substitute Form 1099, which will show the federal tax status of the distributions received by shareholders in calendar year 2019. The amounts that will be reported on such1099-DIV or substitute Form 1099 will be the amounts you are to use on your federal income tax return and will differ from the amounts which we must report for the Fund’s fiscal year end October 31, 2019.
Proxy Voting Policies and Procedures and Proxy Voting Record
A description of the policies and procedures that New York Life Investments uses to vote proxies related to the Fund’s securities is available without charge, upon request, by visiting the MainStay Funds’ website atnylinvestments.com/fundsor visiting the SEC’s website atwww.sec.gov.
The Fund is required to file with the SEC its proxy voting records for the12-month period ending June 30 on Form N-PX. The most recent Form N-PX or proxy voting record is available free of charge upon request by calling800-624-6782; visiting the MainStay Funds’ website atnylinvestments.com/funds; or visiting the SEC’s website atwww.sec.gov.
Shareholder Reports and Quarterly Portfolio Disclosure
The Fund is required to file its complete schedule of portfolio holdings with the SEC 60 days after its first and third fiscal quarter onForm N-PORT. The Fund’s holdings report is available free of charge by visiting the SEC’s website atwww.sec.govor upon request by calling New York Life Investments at800-624-6782.
| | |
| 44 | | MainStay MacKay High Yield Corporate Bond Fund |
Board of Trustees and Officers (Unaudited)
The Trustees and officers of the Funds are listed below. The Board oversees the MainStay Group of Funds (which consists of MainStay Funds and MainStay Funds Trust), MainStay VP Funds Trust, MainStay MacKay DefinedTerm Municipal Opportunities Fund, the Manager and the Subadvisors, and elects the officers of the Funds who are responsible for theday-to-day operations of the Funds. Information pertaining to the Trustees and officers is set forth below. Each Trustee serves until his or her successor is elected and qualified or until his or her
resignation, death or removal. Under the Board’s retirement policy, unless an exception is made, a Trustee must tender his or her resignation by the end of the calendar year during which he or she reaches the age of 75. Officers are elected annually by the Board. The business address of each Trustee and officer listed below is 51 Madison Avenue, New York, New York 10010. A majority of the Trustees are not “interested persons” (as defined by the 1940 Act and rules adopted by the SEC thereunder) of the Fund (“Independent Trustees”).
| | | | | | | | | | | | |
| | | | | Name and
Year of Birth | | Term of Office,
Position(s) Held and
Length of Service | | Principal Occupation(s)
During Past Five Years | | Number of
Portfolios in
Fund Complex
Overseen by
Trustee | | Other Directorships
Held by Trustee |
Interested Trustee | | | | Yie-Hsin Hung* 1962 | | MainStay Funds: Trustee since 2017; MainStay Funds Trust:Trustee since 2017. | | Senior Vice President of New York Life since joining in 2010, Member of the Executive Management Committee since 2017, Chief Executive Officer, New York Life Investment Management Holdings LLC & New York Life Investment Management LLC since 2015. Senior Managing Director andCo-President of New York Life Investment Management LLC from January 2014 to May 2015. Previously held positions of increasing responsibility, including head of NYLIM International, Alternative Growth Businesses, and Institutional investments since joining New York Life in 2010. | | 74 | | MainStay VP Funds Trust:
Trustee since 2017 (31 portfolios); and
MainStay MacKay DefinedTerm Municipal Opportunities Fund: Trustee since 2017. |
| | * | This Trustee is considered to be an “interested person” of the MainStay Group of Funds, MainStay VP Funds Trust and MainStay MacKay DefinedTerm Municipal Opportunities Fund, within the meaning of the 1940 Act because of her affiliation with New York Life Insurance Company, New York Life Investment Management LLC, Candriam Belgium S.A., Candriam Luxembourg S.C.A., IndexIQ Advisors LLC, MacKay Shields LLC, NYL Investors LLC, NYLIFE Securities LLC and/or NYLIFE Distributors LLC, as described in detail above in the column entitled “Principal Occupation(s) During Past Five Years.” |
| | | | | | | | | | | | |
| | | | | Name and
Year of Birth | | Term of Office,
Position(s) Held and
Length of Service | | Principal Occupation(s)
During Past Five Years | | Number of
Portfolios in
Fund Complex
Overseen by
Trustee | | Other Directorships
Held by Trustee |
Independent Trustees | | | | David H. Chow 1957 | | MainStay Funds: Trustee since 2016, Advisory Board Member (June 2015 to December 2015); MainStay Funds Trust:Trustee since 2016, Advisory Board Member (June 2015 to December 2015). | | Founder and CEO, DanCourt Management, LLC (since 1999) | | 74 | | MainStay VP Funds Trust: Trustee since 2016, Advisory Board Member (June 2015 to December 2015) (31 portfolios);
MainStay MacKay DefinedTerm Municipal Opportunities Fund: Trustee since 2016, Advisory Board Member (June 2015 to December 2015);
Market Vectors Group of Exchange-Traded Funds: Independent Chairman of the Board of Trustees since 2008 and Trustee since 2006 (56 portfolios); and
Berea College of Kentucky: Trustee since 2009. |
| | | | Susan B. Kerley 1951 | | MainStay Funds: Chairman since 2017 and Trustee since 2007; MainStay Funds Trust:Chairman since 2017 and Trustee since 1990.** | | President, Strategic Management Advisors LLC (since 1990) | | 74 | | MainStay VP Funds Trust: Chairman since January 2017 and Trustee since 2007 (31 portfolios)***;
MainStay MacKay DefinedTerm Municipal Opportunities Fund: Chairman since 2017 and Trustee since 2011; and
Legg Mason Partners Funds: Trustee since 1991 (45 portfolios). |
| | | | Alan R. Latshaw 1951 | | MainStay Funds: Trustee; MainStay Funds Trust: Trustee and Audit Committee Financial Expert since 2007.** | | Retired; Partner, Ernst & Young LLP (2002 to 2003); Partner, Arthur Andersen LLP (1989 to 2002); Consultant to the MainStay Funds Audit and Compliance Committee (2004 to 2006) | | 74 | | MainStay VP Funds Trust: Trustee and Audit Committee Financial Expert since 2007 (31 portfolios)***;
MainStay MacKay DefinedTerm Municipal Opportunities Fund: Trustee and Audit Committee Financial Expert since 2011;
State Farm Associates Funds Trusts: Trustee since 2005 (4 portfolios);
and State Farm Variable Product Trust: Trustee since 2005 (9 portfolios). |
| | | | Richard H. Nolan, Jr. 1946 | | MainStay Funds: Trustee since 2007; MainStay Funds Trust:Trustee since 2007.** | | Managing Director, ICC Capital Management (since 2004); President—Shields/Alliance, Alliance Capital Management (1994 to 2004) | | 74 | | MainStay VP Funds Trust: Trustee since 2006 (31 portfolios)***; and
MainStay MacKay DefinedTerm Municipal Opportunities Fund: Trustee since 2011. |
| | | | Jacques P. Perold 1958 | | MainStay Funds: Trustee since 2016, Advisory Board Member (June 2015 to December 2015); MainStay Funds Trust:Trustee since 2016, Advisory Board Member (June 2015 to December 2015). | | Retired; President, Fidelity Management & Research Company (2009 to 2014); Founder, President and Chief Executive Officer, Geode Capital Management, LLC (2001 to 2009) | | 74 | | MainStay VP Funds Trust: Trustee since 2016, Advisory Board Member (June 2015 to December 2015) (31 portfolios);
MainStay MacKay DefinedTerm Municipal Opportunities Fund: Trustee since 2016, Advisory Board Member (June 2015 to December 2015);
Allstate Corporation: Director since 2015;MSCI, Inc.: Director since 2017 and
Boston University: Trustee since 2014. |
| | |
| 46 | | MainStay MacKay High Yield Corporate Bond Fund |
| | | | | | | | | | | | |
| | | | | Name and
Year of Birth | | Term of Office,
Position(s) Held and
Length of Service | | Principal Occupation(s)
During Past Five Years | | Number of
Portfolios in
Fund Complex
Overseen by
Trustee | | Other Directorships
Held by Trustee |
Independent Trustees | | | | Richard S. Trutanic 1952 | | MainStay Funds: Trustee since 1994; MainStay Funds Trust: Trustee since 2007.** | | Chairman and Chief Executive Officer, Somerset & Company (financial advisory firm) (since 2004); Managing Director, The Carlyle Group (private investment firm) (2002 to 2004); Senior Managing Director, Partner and Board Member, Groupe Arnault S.A. (private investment firm) (1999 to 2002) | | 74 | | MainStay VP Funds Trust: Trustee since 2007 (31 portfolios)***; and
MainStay MacKay DefinedTerm Municipal Opportunities Fund: Trustee since 2011. |
| | ** | Includes prior service as a Director/Trustee of certain predecessor entities to MainStay Funds Trust. |
| | *** | Includes prior service as a Director of MainStay VP Series Fund, Inc., the predecessor to MainStay VP Funds Trust. |
| | | | | | | | |
| | | | | Name and
Year of Birth | | Position(s) Held and
Length of Service | | Principal Occupation(s)
During Past Five Years |
Officers
of the
Trust
(Who are
not
Trustees)* | | | | Kirk C. Lehneis 1974 | | President, MainStay Funds, MainStay Funds Trust (since 2017) | | Chief Operating Officer and Senior Managing Director (since 2016), New York Life Investment Management LLC; Chairman of the Board (since 2017), NYLIFE Distributors LLC; Chairman of the Board, NYLIM Service Company LLC (since 2017); Trustee, President and Principal Executive Officer of IndexIQ Trust, IndexIQ ETF Trust and IndexIQ Active ETF Trust (since January 2018); President, MainStay MacKay DefinedTerm Municipal Opportunities Fund and MainStay VP Funds Trust
(since 2017)**; Senior Managing Director, Global Product Development (2015 to 2016); Managing Director, Product Development (2010 to 2015), New York Life Investment Management LLC |
| | | | Jack R. Benintende 1964 | | Treasurer and Principal Financial and Accounting Officer, MainStay Funds (since 2007), MainStay Funds Trust (since 2009) | | Managing Director, New York Life Investment Management LLC (since 2007); Treasurer and Principal Financial and Accounting Officer, MainStay MacKay DefinedTerm Municipal Opportunities Fund (since 2011) and MainStay VP Funds Trust (since 2007)**; and Assistant Treasurer, New York Life Investment Management Holdings LLC (2008 to 2012) |
| | | | Kevin M. Bopp 1969 | | Vice President and Chief Compliance Officer, MainStay Funds and MainStay Funds Trust (since 2014) | | Chief Compliance Officer, New York Life Investment Management LLC, IndexIQ Trust, IndexIQ ETF Trust and IndexIQ Active ETF Trust (since 2016), Director and Associate General Counsel (2011 to 2014) and Vice President and Assistant General Counsel (2010 to 2011), New York Life Investment Management LLC; Vice President and Chief Compliance Officer, MainStay VP Funds Trust, MainStay MacKay DefinedTerm Municipal Opportunities Fund (since 2014); Assistant Secretary, MainStay Funds, MainStay Funds Trust and MainStay VP Funds Trust (2010 to 2014)**, MainStay MacKay DefinedTerm Municipal Opportunities Fund (2011 to 2014) |
| | | | J. Kevin Gao 1967 | | Secretary and Chief Legal Officer, MainStay Funds and MainStay Funds Trust (since 2010) | | Managing Director and Associate General Counsel, New York Life Investment Management LLC (since 2010); Secretary and Chief Legal Officer, MainStay MacKay DefinedTerm Municipal Opportunities Fund (since 2011) and MainStay VP Funds Trust (since 2010)** |
| | | | Scott T. Harrington 1959 | | Vice President—Administration, MainStay Funds (since 2005), MainStay Funds Trust (since 2009) | | Managing Director, New York Life Investment Management LLC (including predecessor advisory organizations) (since 2000); Member of the Board of Directors, New York Life Trust Company (since 2009); Vice President—Administration, MainStay MacKay DefinedTerm Municipal Opportunities Fund (since 2011) and MainStay VP Funds Trust (since 2005)** |
| | * | The officers listed above are considered to be “interested persons” of the MainStay Group of Funds, MainStay VP Funds Trust and MainStay MacKay Defined Term Municipal Opportunities Fund within the meaning of the 1940 Act because of their affiliation with the MainStay Group of Funds, New York Life Insurance Company and/or its affiliates, including New York Life Investment Management LLC, NYLIM Service Company LLC, NYLIFE Securities LLC and/or NYLIFE Distributors LLC, as described in detail in the column captioned “Principal Occupation(s) During Past Five Years.” Officers are elected annually by the Board. |
| | ** | Includes prior service as an Officer of MainStay VP Series Fund, Inc., the predecessor to MainStay VP Funds Trust. |
| | |
| 48 | | MainStay MacKay High Yield Corporate Bond Fund |
MainStay Funds
Equity
U.S. Equity
MainStay Epoch U.S. All Cap Fund
MainStay Epoch U.S. Equity Yield Fund
MainStay Large Cap Growth Fund
MainStay MacKay Common Stock Fund
MainStay MacKay Growth Fund
MainStay MacKay S&P 500 Index Fund
MainStay MacKay Small Cap Core Fund1
MainStay MacKay U.S. Equity Opportunities Fund
MainStay MAP Equity Fund
International Equity
MainStay Epoch International Choice Fund
MainStay MacKay International Equity Fund
MainStay MacKay International Opportunities Fund
Emerging Markets Equity
MainStay Candriam Emerging Markets Equity Fund
MainStay MacKay Emerging Markets Equity Fund
Global Equity
MainStay Epoch Capital Growth Fund
MainStay Epoch Global Equity Yield Fund
Fixed Income
Taxable Income
MainStay Candriam Emerging Markets Debt Fund2
MainStay Floating Rate Fund
MainStay Indexed Bond Fund3
MainStay MacKay High Yield Corporate Bond Fund
MainStay MacKay Infrastructure Bond Fund
MainStay MacKay Short Duration High Yield Fund
MainStay MacKay Total Return Bond Fund
MainStay MacKay Unconstrained Bond Fund
Tax-Exempt Income
MainStay MacKay California Tax Free Opportunities Fund4
MainStay MacKay High Yield Municipal Bond Fund
MainStay MacKay Intermediate Tax Free Bond Fund
MainStay MacKay New York Tax Free Opportunities Fund5
MainStay MacKay Short Term Municipal Fund
MainStay MacKay Tax Free Bond Fund
Money Market
MainStay Money Market Fund
Mixed Asset
MainStay Balanced Fund
MainStay Income Builder Fund
MainStay MacKay Convertible Fund
Speciality
MainStay Cushing Energy Income Fund
MainStay Cushing MLP Premier Fund
MainStay Cushing Renaissance Advantage Fund
Asset Allocation
MainStay Conservative Allocation Fund
MainStay Growth Allocation Fund
MainStay Moderate Allocation Fund
MainStay Moderate Growth Allocation Fund
Manager
New York Life Investment Management LLC
New York, New York
Subadvisors
Candriam Belgium S.A.6
Brussels, Belgium
Candriam Luxembourg S.C.A.6
Strassen, Luxembourg
Cushing Asset Management, LP
Dallas, Texas
Epoch Investment Partners, Inc.
New York, New York
MacKay Shields LLC6
New York, New York
Markston International LLC
White Plains, New York
NYL Investors LLC6
New York, New York
Winslow Capital Management, LLC
Minneapolis, Minnesota
Legal Counsel
Dechert LLP
Washington, District of Columbia
Independent Registered Public Accounting Firm
KPMG LLP
Philadelphia, Pennsylvania
| 1. | Formerly known as MainStay Epoch U.S. Small Cap Fund. |
| 2. | Formerly known as MainStay MacKay Emerging Markets Debt Fund. |
| 3. | Effective December 5, 2019, MainStay Indexed Bond Fund was renamed MainStay Short Term Bond Fund. |
| 4. | Class A and Class I shares of this Fund are registered for sale in AZ, CA, MI, NV, OR, TX, UT and WA. Class I shares are registered for sale in CO, FL, GA, HI, ID, MA, MD, NH, NJ and NY. |
| 5. | This Fund is registered for sale in CA, CT, DE, FL, MA, NJ, NY and VT. |
| 6. | An affiliate of New York Life Investment Management LLC. |
Not part of the Annual Report
For more information
800-624-6782
nylinvestments.com/funds
“New York Life Investments” is both a service mark, and the common trade name, of the investment advisors affiliated with New York Life Insurance Company. The MainStay Funds® are managed by New York Life Investment Management LLC and distributed by NYLIFE Distributors LLC, 30 Hudson Street, Jersey City, NJ 07302, a wholly owned subsidiary of New York Life Insurance Company. NYLIFE Distributors LLC is a Member FINRA/SIPC.
©2019 NYLIFE Distributors LLC. All rights reserved.
| | |
| 1717584 MS159-19 | | MSHY11-12/19 (NYLIM) NL212 |
MainStay Money Market Fund
Message from the President and Annual Report
October 31, 2019

Beginning on January 1, 2021, paper copies of each MainStay Fund’s annual and semiannual shareholder reports will no longer be sent by mail, unless you specifically request paper copies of the reports from MainStay Funds or from your financial intermediary. Instead, the reports will be made available on the MainStay Funds’ website. You will be notified by mail and provided with a website address to access the report each time a new report is posted to the website.
If you already elected to receive shareholder reports electronically, you will not be affected by this change and you need not take any action. At any time, you may elect to receive reports and other communications from MainStay Funds electronically by calling toll-free 800-624-6782, by sending an e-mail to MainStayShareholderServices@nylim.com, or by contacting your financial intermediary.
You may elect to receive all future shareholder reports in paper form free of charge. If you hold shares of a MainStay Fund directly, you can inform MainStay Funds that you wish to receive paper copies of reports by calling toll-free 800-624-6782 or by sending an e-mail to MainStayShareholderServices@nylim.com. If you hold shares of a MainStay Fund through a financial intermediary, please contact the financial intermediary to make this election. Your election to receive reports in paper form will apply to all MainStay Funds in which you are invested and may apply to all funds held with your financial intermediary.
| | | | | | | | |
| | | | | |
| Not FDIC/NCUA Insured | | Not a Deposit | | May Lose Value | | No Bank Guarantee | | Not Insured by Any Government Agency |

This page intentionally left blank
Message from the President
Stock and bond markets generally gained ground during the12-month reporting period ended October 31, 2019, despite concerns regarding slowing U.S. and global economic growth and international trade conflicts.
After trending higher in November 2018, U.S. stocks and bonds dipped sharply in December 2018, over concerns regarding the pace of economic growth, a U.S. government shutdown and the potential impact of trade disputes between the United States and other nations, particularly China. U.S. markets recovered quickly in 2019 as trade tensions eased, the government reopened and the U.S. Federal Reserve Board (“Fed”) adopted a more accommodative tone regarding the future direction of interest rates. A wide spectrum of equity and fixed-income sectors gained ground through April 2019. Mixed macroeconomic signals and the inability of China and the United States to reach a trade agreement caused the market’s recovery to suffer during the spring and summer months of 2019. However, accommodative monetary policies from several central banks, including a series of interest rate cuts by the Fed, along with better-than-expected corporate earnings reassured investors and enabled markets to resume their advance.
Persistent, albeit slow, U.S. economic growth underpinned the U.S. stock market’s advance during the reporting period, positioning major U.S. equity indices to reach record territory by late October 2019. Sector strength shifted as investor sentiment alternated betweenrisk-on andrisk-off positions. In general, for the reporting period, cyclical, growth-oriented stocks outperformed their value-oriented counterparts by a small margin, with the information technology sector leading thelarge-cap S&P 500® Index. However, the traditionally more defensive areas of real estate and utilities generated above-average performance as well. Communication services, consumer discretionary, industrials and consumer staples performed in the middle of the pack, while materials, financials and health care lagged. Only the energy sector suffered declines, undermined by weak oil prices and concerns about future energy demand.
In the fixed-income markets, slowing economic growth, modest inflation and the Fed’s interest rate cuts created an environment of falling yields and rising prices for most bonds, with many areas of the market offering historically low yields by the end of the reporting period. Higher-credit-quality, longer-duration securities generally produced strong returns, with investment-
grade corporates and long-term Treasury bonds delivering particularly strong performance. A similar dynamic characterized the performance of the municipal bond market, with longer-term, higher-grade issues performing relatively well. On average, municipal bonds roughly matched the gains of corporate issues while providingtax-advantaged returns for eligible investors.
International stock and bond markets tended to underperform their U.S. counterparts, constrained by lackluster economic growth in the Eurozone and dramatically slowing growth in China and related parts of Asia amid persistent trade tensions with the United States. Uncertainties surrounding the unending Brexit drama took a further toll on investor confidence, with Britain seemingly unable to resolve its internal conflicts over how, or whether, to exit from the European Union. Nevertheless, on average, international securities delivered modestly positive returns, bolstered by the accommodative monetary policies implemented by European and Asian central banks. Bonds from both emerging and developed markets generally produced stronger returns than equities while repeating the pattern of outperformance by higher-quality, longer-term instruments seen in the United States.
As the economic growth cycle lengthens, investors are left to ponder how best to position their portfolios for an uncertain future. When the yield curve inverted earlier this year prompting concerns of a potential recession, we were reminded that the direction of the economy is continually subject to change, and perceptions of the economy can shift even more rapidly. As a MainStay investor, you can rely on us to manage our Funds with unflagging energy and dedication so that you can remain focused on your long-term objectives in the face of uncertainty and change. Our goal remains to provide you with the consistently reliable financial tools you need to achieve your long-term objectives.
Sincerely,

Kirk C. Lehneis
President
The opinions expressed are as of the date of this report and are subject to change. There is no guarantee that any forecast made will come to pass. This material does not constitute investment advice and is not intended as an endorsement of any specific investment. Past performance is no guarantee of future results.
Not part of the Annual Report
Table of Contents
An investment in the Fund is not insured or guaranteed by the Federal Deposit Insurance Corporation or any other government agency. Although the Fund seeks to preserve the value of your investment at $1.00 per share, it is possible to lose money by investing in the Fund. The Fund’s sponsor has no legal obligation to provide financial support to the Fund, and you should not expect that the sponsor will provide financial support at any time. The Fund may impose a fee upon the sale of your shares or may temporarily suspend your ability to sell shares if the Fund’s liquidity falls below required minimums because of market conditions or other factors.
Investors should refer to the Fund’s Summary Prospectus and/or Prospectus and consider the Fund’s investment objectives, strategies, risks, charges and expenses carefully before investing. The Summary Prospectus and/or Prospectus contain this and other information about the Fund. You may obtain copies of the Fund’s Summary Prospectus, Prospectus and Statement of Additional Information free of charge, upon request, by calling toll-free 800-624-6782, by writing to NYLIFE Distributors LLC, Attn: MainStay Marketing Department, 30 Hudson Street, Jersey City, NJ 07302 or by sending ane-mail to MainStayShareholderServices@nylim.com. These documents are also available via the MainStay Funds’ website at nylinvestments.com/funds. Please read the Summary Prospectus and/or Prospectus carefully before investing.
Investment and Performance Comparison1(Unaudited)
Performance data quoted represents past performance. Past performance is no guarantee of future results. Because of market volatility and other factors, current performance may be lower or higher than the figures shown. Investment return and principal value will fluctuate, and as a result, when shares are redeemed, they may be worth more or less than their original cost. The graph below depicts the historical performance of Class B2 shares of the Fund. Performance will vary from class to class based on differences in class-specific expenses. For performance information current to the most recent month-end, please call 800-624-6782 or visit nylinvestments.com/funds.
An investment in the Fund is not insured or guaranteed by the Federal Deposit Insurance Corporation or any other government agency. Although the Fund seeks to preserve the value of your investment at $1.00 per share, it is possible to lose money by investing in the Fund.
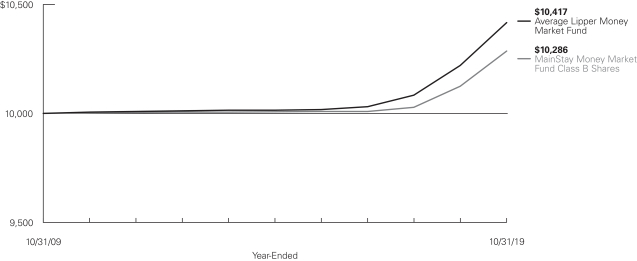
Average Annual Total Returns for the Year-Ended October 31, 2019
| | | | | | | | | | | | | | | | | | | | |
| Class | | Sales Charge | | Inception
Date | | One Year | | | Five Years | | | Ten Years | | | Gross Expense Ratio3 | |
| | | | | | |
| Class A Shares4 | | No Sales Charge | | 1/3/1995 | | | 1.84 | % | | | 0.68 | % | | | 0.35 | % | | | 0.57 | % |
| Investor Class Shares4 | | No Sales Charge | | 2/28/2008 | | | 1.59 | | | | 0.56 | | | | 0.28 | | | | 0.84 | |
| Class B Shares2,4 | | No Sales Charge | | 5/1/1986 | | | 1.59 | | | | 0.56 | | | | 0.28 | | | | 0.84 | |
| Class C Shares4 | | No Sales Charge | | 9/1/1998 | | | 1.60 | | | | 0.56 | | | | 0.28 | | | | 0.84 | |
| | | | | |
| | | | | | | | | | | | | | | | | | |
| 1. | The performance table and graph do not reflect the deduction of taxes that a shareholder would pay on distributions or Fund share redemptions. Total returns reflect changes in share price, and reinvestment of dividend and capital gain distributions. The graph assumes the initial investment amount shown above. Performance figures may reflect certain fee waivers and/or expense limitations, without which total returns would have been lower. For more information on share classes and current fee waivers and/or expense limitations (if any), please refer to the Notes to Financial Statements. |
| 2. | Class B shares are closed to all new purchases as well as additional investments by existing Class B shareholders. |
| 3. | The gross expense ratios presented reflect the Fund’s “Total Annual Fund Operating Expenses” from the most recent Prospectus and may differ from other expense ratios disclosed in this report. |
| 4. | As of October 31, 2019, MainStay Money Market Fund had an effective7-day yield of 1.38% for Class A, 1.19% for Investor Class, 1.15% for Class B, and 1.19% for Class C shares. The 7-day current yield was 1.37% for Class A, 1.18% for Investor Class, 1.14% for Class B, and 1.18% for Class C shares. These yields reflect certain expense limitations. Had these expense limitations not been in effect, the effective7-day yield would have been 1.38%, 1.11%, 0.99% and 1.11%, for Class A, Investor Class, Class B and C shares, respectively, and the7-day current yield would have been 1.37%, 1.11%, 0.99% and 1.11%, for Class A, Investor Class, Class B and C shares, respectively. The current yield reflects the Fund’s earnings better than the Fund’s total return. |
The footnotes on the next page are an integral part of the table and graph and should be carefully read in conjunction with them.
| | | | | | | | | | | | |
| Benchmark Performance | | One
Year | | | Five Years | | | Ten
Years | |
| | | |
Average Lipper Money Market Fund5 | | | 1.93 | % | | | 0.78 | % | | | 0.41 | % |
Morningstar Prime Money Market Category Average6 | | | 1.99 | | | | 0.80 | | | | 0.42 | |
| 5. | The Average Lipper Money Market Fund is an equally weighted performance average adjusted for capital gains distributions and income dividends of all of the money market funds in the Lipper Universe. Lipper Inc., a wholly-owned subsidiary of Thomson Reuters, is an independent monitor of mutual fund performance. Results do not reflect any deduction of sales charges. Lipper averages are not class specific. Lipper returns are unaudited. Results are based on average total returns of similar funds with all dividend and capital gain distributions reinvested. |
| 6. | The Morningstar Prime Money Market Category Average is representative of funds that invest in short-term money market securities in order to provide a level of current income that is consistent with the preservation of capital. Results are based on average total returns of similar funds with all dividends and capital gain distributions reinvested. |
The footnotes on the preceding page are an integral part of the table and graph and should be carefully read in conjunction with them.
| | |
| 6 | | MainStay Money Market Fund |
Cost in Dollars of a $1,000 Investment in MainStay Money Market Fund (Unaudited)
The example below is intended to describe the fees and expenses borne by shareholders during the six-month period from May 1, 2019, to October 31, 2019, and the impact of those costs on your investment.
Example
As a shareholder of the Fund you incur two types of costs: (1) transaction costs, including exchange fees and sales charges (loads) on purchases (as applicable), and (2) ongoing costs, including management fees, distribution and/or service (12b-1) fees, and other Fund expenses (as applicable). This example is intended to help you understand your ongoing costs (in dollars) of investing in the Fund and to compare these costs with the ongoing costs of investing in other mutual funds. The example is based on an investment of $1,000 made at the beginning of the six-month period and held for the entire period from May 1, 2019, to October 31, 2019.
This example illustrates your Fund’s ongoing costs in two ways:
Actual Expenses
The second and third data columns in the table below provide information about actual account values and actual expenses. You may use the information in these columns, together with the amount you invested, to estimate the expenses that you paid during the six months ended October 31, 2019. Simply divide your account value by $1,000 (for example, an $8,600 account value divided by $1,000 = 8.6), then
multiply the result by the number under the heading entitled “Expenses Paid During Period” to estimate the expenses you paid on your account during this period.
Hypothetical Example for Comparison Purposes
The fourth and fifth data columns in the table below provide information about hypothetical account values and hypothetical expenses based on the Fund’s actual expense ratio and an assumed rate of return of 5% per year before expenses, which is not the Fund’s actual return. The hypothetical account values and expenses may not be used to estimate the actual ending account balances or expenses you paid for thesix-month period shown. You may use this information to compare the ongoing costs of investing in the Fund with the ongoing costs of investing in other mutual funds. To do so, compare this 5% hypothetical example with the 5% hypothetical examples that appear in the shareholder reports of the other mutual funds.
Please note that the expenses shown in the table are meant to highlight your ongoing costs only and do not reflect any transactional costs, such as exchange fees or sales charges (loads). Therefore, the fourth and fifth data columns of the table are useful in comparing ongoing costs only and will not help you determine the relative total costs of owning different funds. In addition, if these transactional costs were included, your costs would have been higher.
| | | | | | | | | | | | | | | | | | | | | | |
| | | | | | | | | | | | | | | | | | |
| Share Class | | Beginning
Account
Value
5/1/19 | | | Ending Account
Value (Based
on Actual
Returns and
Expenses)
10/31/19 | | | Expenses
Paid
During
Period1 | | | Ending Account
Value (Based
on Hypothetical
5% Annualized
Return and
Actual Expenses)
10/31/19 | | | Expenses
Paid
During
Period1 | | | Net Expense
Ratio
During
Period2 |
| | | | | | |
| Class A Shares | | $ | 1,000.00 | | | $ | 1,008.80 | | | $ | 2.84 | | | $ | 1,022.38 | | | $ | 2.85 | | | 0.56% |
| | | | | | |
| Investor Class Shares | | $ | 1,000.00 | | | $ | 1,007.60 | | | $ | 4.05 | | | $ | 1,021.17 | | | $ | 4.08 | | | 0.80% |
| | | | | | |
| Class B Shares | | $ | 1,000.00 | | | $ | 1,007.60 | | | $ | 4.05 | | | $ | 1,021.17 | | | $ | 4.08 | | | 0.80% |
| | | | | | |
| Class C Shares | | $ | 1,000.00 | | | $ | 1,007.60 | | | $ | 4.05 | | | $ | 1,021.17 | | | $ | 4.08 | | | 0.80% |
| 1. | Expenses are equal to the Fund’s annualized expense ratio of each class multiplied by the average account value over the period, divided by 365 and multiplied by 184 (to reflect the six-month period). The table above represents the actual expenses incurred during the six-month period. |
| 2. | Expenses are equal to the Fund’s annualized expense ratio to reflect the six-month period. |
Portfolio Composition as of October 31, 2019(Unaudited)

See Portfolio of Investments beginning on page 10 for specific holdings within these categories. The Fund’s holdings are subject to change.
| ‡ | Less than one-tenth of a percent. |
| | |
| 8 | | MainStay Money Market Fund |
Portfolio Management Discussion and Analysis(Unaudited)
Questions answered by NYL Investors LLC, the Fund’s Subadvisor.
How did MainStay Money Market Fund perform relative to its benchmark and peer group during the 12 months ended October 31, 2019?
As of October 31, 2019, Class A shares of MainStay Money Market Fund provided a7-day effective yield of 1.38% and a7-day current yield of 1.37%. For the 12 months ended October 31, 2019, Class A shares returned 1.84%, underperforming the 1.93% return of the Average Lipper Money Market Fund. Over the same period, Class A shares also underperformed the 1.99% return of the Morningstar Prime Money Market Category Average.1
What factors affected the Fund’s relative performance during the reporting period?
Amid a negative shift in investor sentiment and a growing uncertainty about future economic growth, the U.S. Federal Reserve (“Fed”) implemented the first in a series of cautionary interest rate cuts in July 2019. Two further cuts were made in September and October 2019. Additionally, there was a somewhat significant but short-lived dislocation in the repurchase agreement (repo) funding market in September 2019. This “repocalypse”, as it has been called, was credited to heavy Treasury settlements on top of an outflow of money fund cash for the purpose of corporate tax payments. In effect, a lack of liquidity caused a spike in overnight lending rates. Ultimately, the Fed was able to quell this instability by injecting liquidity into the markets using Open Market Operations. Aside from this temporary phenomenon, the lower yields and spreads2 theme that began during the last reporting period continued through October 2019. The Fund’s relative returns followed suit.
What was the Fund’s duration3 strategy during the reporting period?
The Fund’s duration strategy was to get modestly longer compared to the Average Lipper Money Market Fund. However, the
regulatory liquidity requirements of a money market fund made it difficult to extend duration meaningfully in practice. The final duration was unchanged from the prior reporting period at 15 days.
During the reporting period, which sectors were the strongest positive contributors to the Fund’s relative performance and which sectors were particularly weak?
The floating rate debt and repurchase agreement sectors were the strongest positive contributors to the Fund’s relative performance. (Contributions take weightings and total returns into account.) Over the same reporting period, U.S. Treasury bills were the Fund’s weakest relative performers.
What were some of the Fund’s largest purchases and sales during the reporting period?
The Fund sold Toyota Motor Credit Corp fixed-rate commercial paper in favor ofone-year Toyota Motor Credit Corp floating-rate corporate debt, indexed to the Secured Overnight Financing Rate (SOFR). This resulted in a significant yield enhancement while reducing the weighted average maturity of the Fund. The Fund also purchased SOFR-indexed Federal Home Loan Bank floating rate debt, which reduced the portfolio’s weighted average maturity as well.
How did the Fund’s sector weightings change during the reporting period?
During the reporting period, the Fund decreased its commercial paper holdings in favor of the higher yielding bank CD sector and the floating-rate corporate bond sector.
| 1. | See page 5 for other share class returns, which may be higher or lower than Class A share returns. See page 6 for more information on benchmark and peer group returns. |
| 2. | The terms “spread” and “yield spread” may refer to the difference in yield between a security or type of security and comparable U.S. Treasury issues. The terms may also refer to the difference in yield between two specific securities or types of securities at a given time. |
| 3. | Duration is a measure of the price sensitivity of a fixed-income investment to changes in interest rates. Duration is expressed as a number of years and is considered a more accurate sensitivity gauge than average maturity. |
The opinions expressed are those of the Subadvisor as of the date of this report and are subject to change. There is no guarantee that any forecasts will come to pass. This material does not constitute investment advice and is not intended as an endorsement of any specific investment.
Portfolio of InvestmentsOctober 31, 2019
| | | | | | | | |
| | | Principal
Amount | | | Value | |
| Short-Term Investments 100.0%† | |
Certificates of Deposit 8.0% | |
Bank of Montreal (a) | | | | | | | | |
2.02% (SOFR + 0.20%), due 6/5/20 | | $ | 10,000,000 | | | $ | 10,000,000 | |
2.084% (1 Month LIBOR + 0.17%), due 5/14/20 | | | 5,000,000 | | | | 5,000,043 | |
Canadian Imperial Bank of Commerce
2.084% (1 Month LIBOR + 0.17%), due 5/14/20 (a) | | | 5,000,000 | | | | 5,000,015 | |
Commonwealth Bank of Australia
2.10% (1 Month LIBOR + 0.16%), due 7/9/20 (a) | | | 10,000,000 | | | | 10,000,000 | |
| | | | | | | | |
Total Certificates of Deposit
(Cost $30,000,058) | | | | | | | 30,000,058 | |
| | | | | | | | |
|
Corporate Bonds 1.3% | |
Toyota Motor Credit Corp.
2.22% (SOFR + 0.40%), due 10/23/20 (a) | | | 5,000,000 | | | | 5,000,000 | |
| | | | | | | | |
Total Corporate Bonds
(Cost $5,000,000) | | | | | | | 5,000,000 | |
| | | | | | | | |
|
Financial Company Commercial Paper 14.8% | |
Commonwealth Bank of Australia
2.093% (3 Month LIBOR + 0.05%), due 4/6/20 (a)(b) | | | 5,000,000 | | | | 5,000,000 | |
JP Morgan Securities LLC
2.078% (1 Month LIBOR + 0.10%), due 11/8/19 (a) | | | 5,000,000 | | | | 5,000,000 | |
Massachusetts Mutual Life Insurance Co.
1.578%, due 11/6/19 (b)(c) | | | 5,000,000 | | | | 4,998,646 | |
National Bank of Canada
2.078% (1 Month LIBOR + 0.10%), due 1/8/20 (a)(b) | | | 5,000,000 | | | | 5,000,000 | |
Nationwide Life Insurance Co. (b)(c) | | | | | | | | |
1.585%, due 11/1/19 | | | 5,000,000 | | | | 5,000,000 | |
1.618%, due 11/14/19 | | | 5,000,000 | | | | 4,996,588 | |
1.657%, due 12/2/19 | | | 5,000,000 | | | | 4,992,767 | |
PSP Capital, Inc.
1.551%, due 12/2/19 (b)(c) | | | 5,000,000 | | | | 4,992,551 | |
Royal Bank of Canada (a)(b) | | | | | | | | |
2.044% (1 Month LIBOR + 0.24%), due 8/26/20 | | | 5,000,000 | | | | 5,000,000 | |
2.16% (1 Month LIBOR + 0.17%), due 4/6/20 | | | 5,000,000 | | | | 5,000,000 | |
Toronto-Dominion Bank
1.775%, due 11/20/19 (b)(c) | | | 5,000,000 | | | | 4,995,118 | |
| | | | | | | | |
Total Financial Company Commercial Paper
(Cost $54,975,670) | | | | | | | 54,975,670 | |
| | | | | | | | |
| | | | | | | | |
| | | Principal
Amount | | | Value | |
Other Commercial Paper 46.5% | |
American Honda Finance Corp.
2.515% (3 Month LIBOR + 0.34%), due 2/14/20 (a) | | $ | 5,000,000 | | | $ | 5,004,866 | |
Archer-Daniels-Midland Co.
1.62%, due 11/22/19 (b)(c) | | | 5,000,000 | | | | 4,994,663 | |
BASF SE (b)(c) | | | | | | | | |
1.601%, due 11/12/19 | | | 5,000,000 | | | | 4,997,128 | |
1.614%, due 11/14/19 | | | 5,000,000 | | | | 4,996,587 | |
Canadian National Railway Co. (b)(c) | | | | | | | | |
1.602%, due 11/8/19 | | | 5,000,000 | | | | 4,998,075 | |
1.67%, due 12/6/19 | | | 5,000,000 | | | | 4,990,618 | |
Cummins, Inc.
1.602%, due 11/8/19 (b)(c) | | | 5,000,000 | | | | 4,997,881 | |
Eli Lilly & Co.
1.60%, due 11/19/19 (b)(c) | | | 10,000,000 | | | | 9,990,750 | |
Engie S.A. (b)(c) | | | | | | | | |
1.62%, due 11/15/19 | | | 5,000,000 | | | | 4,996,053 | |
1.783%, due 12/20/19 | | | 5,000,000 | | | | 4,986,049 | |
Exxon Mobil Corp. (c) | | | | | | | | |
1.547%, due 11/13/19 | | | 5,000,000 | | | | 4,996,783 | |
1.551%, due 11/12/19 | | | 5,000,000 | | | | 4,997,143 | |
1.574%, due 11/6/19 | | | 5,000,000 | | | | 4,998,681 | |
General Dynamics Corp.
1.611%, due 11/26/19 (b)(c) | | | 10,000,000 | | | | 9,987,292 | |
GlaxoSmithKline LLC
1.65%, due 11/15/19 (b)(c) | | | 5,000,000 | | | | 4,996,383 | |
Hershey Co.
1.592%, due 11/4/19 (b)(c) | | | 5,000,000 | | | | 4,999,208 | |
John Deere Canada ULC (b)(c) | | | | | | | | |
1.593%, due 11/20/19 | | | 5,000,000 | | | | 4,995,250 | |
1.72%, due 1/22/20 | | | 5,000,000 | | | | 4,978,987 | |
Novartis Finance Corp.
1.605%, due 11/18/19 (b)(c) | | | 2,000,000 | | | | 1,998,328 | |
ONE Gas, Inc. (b)(c) | | | | | | | | |
1.618%, due 11/14/19 | | | 1,000,000 | | | | 999,314 | |
1.634%, due 11/22/19 | | | 10,000,000 | | | | 9,988,917 | |
1.644%, due 11/27/19 | | | 5,000,000 | | | | 4,993,825 | |
PACCAR Financial Corp. (c) | | | | | | | | |
1.598%, due 11/6/19 | | | 5,000,000 | | | | 4,998,653 | |
1.64%, due 11/25/19 | | | 5,000,000 | | | | 4,994,100 | |
1.778%, due 1/27/20 | | | 5,000,000 | | | | 4,978,733 | |
Praxair, Inc. (c) | | | | | | | | |
1.588%, due 11/13/19 | | | 5,000,000 | | | | 4,996,933 | |
1.59%, due 11/15/19 | | | 5,000,000 | | | | 4,996,403 | |
Schlumberger Investment S.A. (b)(c) | | | | | | | | |
1.525%, due 11/5/19 | | | 5,000,000 | | | | 4,998,950 | |
1.612%, due 11/21/19 | | | 5,000,000 | | | | 4,994,750 | |
1.669%, due 12/13/19 | | | 5,000,000 | | | | 4,989,150 | |
Siemens Capital Co. LLC
1.584%, due 11/4/19 (b)(c) | | | 5,000,000 | | | | 4,999,208 | |
| | | | |
| 10 | | MainStay Money Market Fund | | The notes to the financial statements are an integral part of,
and should be read in conjunction with, the financial statements. |
| | | | | | | | |
| | | Principal
Amount | | | Value | |
| Short-Term Investments (continued) | |
Other Commercial Paper (continued) | |
Stanley Black & Decker, Inc.
1.922%, due 11/1/19 (b)(c) | | $ | 5,000,000 | | | $ | 5,000,000 | |
Toyota Motor Credit Corp.
1.69%, due 11/7/19 (c) | | | 5,000,000 | | | | 4,998,300 | |
| | | | | | | | |
Total Other Commercial Paper
(Cost $172,827,961) | | | | | | | 172,827,961 | |
| | | | | | | | |
|
Treasury Debt 8.6% | |
United States Treasury Bills (c) | | | | | | | | |
1.54%, due 11/5/19 | | | 25,601,000 | | | | 25,596,177 | |
1.542%, due 11/12/19 | | | 6,378,000 | | | | 6,374,676 | |
| | | | | | | | |
Total Treasury Debt
(Cost $31,970,853) | | | | | | | 31,970,853 | |
| | | | | | | | |
|
Treasury Repurchase Agreements 15.5% | |
Bank of America N.A.
1.73%, dated 10/31/19
due 11/1/19
Proceeds at Maturity $15,000,721 (Collateralized by United States Treasury securities with rates between 1.88% and 2.13% and maturity dates between 1/31/22 and 7/31/24, with a Principal Amount of $14,986,800 and a Market Value of $15,300,038) | | | 15,000,000 | | | | 15,000,000 | |
RBC Capital Markets LLC
1.71%, dated 10/31/19
due 11/1/19
Proceeds at Maturity $27,539,308 (Collateralized by United States Treasury securities with rates between 0.50% and 1.63% and maturity dates between 2/15/26 and 1/15/28, with a Principal Amount of $27,549,800 and a Market Value of $28,090,157) | | | 27,538,000 | | | | 27,538,000 | |
TD Securities (U.S.A.) LLC
1.72%, dated 10/31/19
due 11/1/19
Proceeds at Maturity $15,000,717 (Collateralized by a United States Treasury securities with a rate of 2.88% and maturity date of 11/30/23, with a Principal Amount of $14,430,700 and a Market Value of $15,300,026) | | | 15,000,000 | | | | 15,000,000 | |
| | | | | | | | |
Total Treasury Repurchase Agreements
(Cost $57,538,000) | | | | | | | 57,538,000 | |
| | | | | | | | |
| | | | | | | | |
| | | Principal
Amount | | | Value | |
U.S. Government Agency Debt 5.3% | |
Federal Home Loan Banks | | | | | | | | |
1.697%, due 12/20/19 (c) | | $ | 3,700,000 | | | $ | 3,691,791 | |
1.705%, due 11/22/19 (c) | | | 7,000,000 | | | | 6,992,936 | |
1.85% (SOFR + 0.03%), due 3/27/20 (a) | | | 5,000,000 | | | | 5,000,000 | |
Tennessee Valley Authority
1.703%, due 11/6/19 (c) | | | 4,000,000 | | | | 3,999,039 | |
| | | | | | | | |
Total U.S. Government Agency Debt
(Cost $19,683,766) | | | | | | | 19,683,766 | |
| | | | | | | | |
TotalShort-Term Investments
(Cost $371,996,308) | | | 100.0 | % | | | 371,996,308 | |
| | | | | | | | |
Other Assets, Less Liabilities | | | (0.0 | )‡ | | | (153,927 | ) |
Net Assets | | | 100.0 | % | | $ | 371,842,381 | |
| † | Percentages indicated are based on Fund net assets. |
| ‡ | Less than one-tenth of a percent. |
| (a) | Floating rate—Rate shown was the rate in effect as of October 31, 2019. |
| (b) | May be sold to institutional investors only under Rule 144A or securities offered pursuant to Section 4(a)(2) of the Securities Act of 1933, as amended. |
| (c) | Interest rate shown represents yield to maturity. |
The following abbreviations are used in the preceding pages:
LIBOR—London Interbank Offered Rate
SOFR—Secured Overnight Financing Rate
| | | | | | |
The notes to the financial statements are an integral part of,
and should be read in conjunction with, the financial statements. | | | | | 11 | |
Portfolio of InvestmentsOctober 31, 2019 (continued)
The following is a summary of the fair valuations according to the inputs used as of October 31, 2019, for valuing the Fund’s assets:
| | | | | | | | | | | | | | | | |
Description | | Quoted
Prices in
Active
Markets for
Identical
Assets
(Level 1) | | | Significant
Other
Observable
Inputs
(Level 2) | | | Significant
Unobservable
Inputs
(Level 3) | | | Total | |
| | | | |
Asset Valuation Inputs | | | | | | | | | | | | | | | | |
| Investments in Securities (a) | | | | | | | | | | | | | | | | |
| Short-Term Investments | | | | | | | | | | | | | | | | |
Certificates of Deposit | | $ | — | | | $ | 30,000,058 | | | $ | — | | | $ | 30,000,058 | |
Corporate Bonds | | | — | | | | 5,000,000 | | | | — | | | | 5,000,000 | |
Financial Company Commercial Paper | | | — | | | | 54,975,670 | | | | — | | | | 54,975,670 | |
Other Commercial Paper | | | — | | | | 172,827,961 | | | | — | | | | 172,827,961 | |
Treasury Debt | | | — | | | | 31,970,853 | | | | — | | | | 31,970,853 | |
Treasury Repurchase Agreements | | | — | | | | 57,538,000 | | | | — | | | | 57,538,000 | |
U.S. Government Agency Debt | | | — | | | | 19,683,766 | | | | — | | | | 19,683,766 | |
| | | | | | | | | | | | | | | | |
| Total Investments in Securities | | $ | — | | | $ | 371,996,308 | | | $ | — | | | $ | 371,996,308 | |
| | | | | | | | | | | | | | | | |
| (a) | For a complete listing of investments and their industries, see the Portfolio of Investments. |
| | | | |
| 12 | | MainStay Money Market Fund | | The notes to the financial statements are an integral part of,
and should be read in conjunction with, the financial statements. |
Statement of Assets and Liabilitiesas of October 31, 2019
| | | | |
| Assets | | | | |
Investment in securities, at value
(amortized cost $314,458,308) | | $ | 314,458,308 | |
Repurchase agreements, at value
(amortized cost $57,538,000) | | | 57,538,000 | |
Cash | | | 720 | |
Receivables: | | | | |
Fund shares sold | | | 1,147,910 | |
Interest | | | 131,251 | |
Other assets | | | 41,849 | |
| | | | |
Total assets | | | 373,318,038 | |
| | | | |
| |
| Liabilities | | | | |
Payables: | | | | |
Fund shares redeemed | | | 1,203,184 | |
Manager (See Note 3) | | | 118,424 | |
Transfer agent (See Note 3) | | | 95,240 | |
Custodian | | | 18,042 | |
Shareholder communication | | | 17,159 | |
Professional fees | | | 14,829 | |
Trustees | | | 673 | |
Accrued expenses | | | 4,522 | |
Dividend payable | | | 3,584 | |
| | | | |
Total liabilities | | | 1,475,657 | |
| | | | |
Net assets | | $ | 371,842,381 | |
| | | | |
| |
| Composition of Net Assets | | | | |
Shares of beneficial interest outstanding (par value of $.01 per share) unlimited number of shares authorized | | $ | 3,718,923 | |
Additional paid-in capital | | | 368,122,456 | |
| | | | |
| | | 371,841,379 | |
Total distributable earnings (loss) | | | 1,002 | |
| | | | |
Net assets | | $ | 371,842,381 | |
| | | | |
| | | | |
Class A | | | | |
Net assets applicable to outstanding shares | | $ | 290,420,552 | |
| | | | |
Shares of beneficial interest outstanding | | | 290,449,965 | |
| | | | |
Net asset value and offering price per share outstanding | | $ | 1.00 | |
| | | | |
Investor Class | | | | |
Net assets applicable to outstanding shares | | $ | 28,133,150 | |
| | | | |
Shares of beneficial interest outstanding | | | 28,145,230 | |
| | | | |
Net asset value and offering price per share outstanding | | $ | 1.00 | |
| | | | |
Class B | | | | |
Net assets applicable to outstanding shares | | $ | 32,980,844 | |
| | | | |
Shares of beneficial interest outstanding | | | 32,986,557 | |
| | | | |
Net asset value and offering price per share outstanding | | $ | 1.00 | |
| | | | |
Class C | | | | |
Net assets applicable to outstanding shares | | $ | 20,307,835 | |
| | | | |
Shares of beneficial interest outstanding | | | 20,310,531 | |
| | | | |
Net asset value and offering price per share outstanding | | $ | 1.00 | |
| | | | |
| | | | | | |
The notes to the financial statements are an integral part of,
and should be read in conjunction with, the financial statements. | | | | | 13 | |
Statement of Operationsfor the year ended October 31, 2019
| | | | |
| Investment Income (Loss) | | | | |
Income | | | | |
Interest | | $ | 8,432,900 | |
| | | | |
Expenses | | | | |
Manager (See Note 3) | | | 1,416,356 | |
Transfer agent (See Note 3) | | | 548,598 | |
Registration | | | 107,595 | |
Professional fees | | | 75,139 | |
Custodian | | | 42,869 | |
Shareholder communication | | | 37,084 | |
Trustees | | | 8,834 | |
Miscellaneous | | | 11,807 | |
| | | | |
Total expenses before waiver/reimbursement | | | 2,248,282 | |
Expense waiver/reimbursement from Manager (See Note 3) | | | (64,382 | ) |
| | | | |
Net expenses | | | 2,183,900 | |
| | | | |
Net investment income (loss) | | | 6,249,000 | |
| | | | |
|
| Realized and Unrealized Gain (Loss) on Investments | |
Net realized gain (loss) on investments | | | 1,026 | |
| | | | |
Net increase (decrease) in net assets resulting from operations | | $ | 6,250,026 | |
| | | | |
| | | | |
| 14 | | MainStay Money Market Fund | | The notes to the financial statements are an integral part of,
and should be read in conjunction with, the financial statements. |
Statements of Changes in Net Assets
for the years ended October 31, 2019 and October 31, 2018
| | | | | | | | |
| | | 2019 | | | 2018 | |
| Increase (Decrease) in Net Assets | |
Operations: | | | | | | | | |
Net investment income (loss) | | $ | 6,249,000 | | | $ | 3,650,342 | |
Net realized gain (loss) on investments | | | 1,026 | | | | (8 | ) |
| | | | |
Net increase (decrease) in net assets resulting from operations | | | 6,250,026 | | | | 3,650,334 | |
| | | | |
Distributions to shareholders: | | | | | | | | |
Class A | | | (4,900,195 | ) | | | (2,760,996 | ) |
Investor Class | | | (426,770 | ) | | | (256,309 | ) |
Class B | | | (557,854 | ) | | | (385,826 | ) |
Class C | | | (363,990 | ) | | | (247,211 | ) |
| | | | |
Total distributions to shareholders | | | (6,248,809 | ) | | | (3,650,342 | ) |
| | | | |
Capital share transactions: | | | | | | | | |
Net proceeds from sale of shares | | | 454,831,292 | | | | 333,214,701 | |
Net asset value of shares issued to shareholders in reinvestment of distributions | | | 6,060,427 | | | | 3,557,971 | |
Cost of shares redeemed | | | (411,720,332 | ) | | | (342,943,592 | ) |
| | | | |
Increase (decrease) in net assets derived from capital share transactions | | | 49,171,387 | | | | (6,170,920 | ) |
| | | | |
Net increase (decrease) in net assets | | | 49,172,604 | | | | (6,170,928 | ) |
| | |
| Net Assets | | | | | | | | |
Beginning of year | | | 322,669,777 | | | | 328,840,705 | |
| | | | |
End of year | | $ | 371,842,381 | | | $ | 322,669,777 | |
| | | | |
| | | | | | |
The notes to the financial statements are an integral part of,
and should be read in conjunction with, the financial statements. | | | | | 15 | |
Financial Highlightsselected per share data and ratios
| | | | | | | | | | | | | | | | | | | | |
| |
| | | Year ended October 31, | |
| | | | | |
| Class A | | 2019 | | | 2018 | | | 2017 | | | 2016 | | | 2015 | |
| | | | | |
Net asset value at beginning of year | | $ | 1.00 | | | $ | 1.00 | | | $ | 1.00 | | | $ | 1.00 | | | $ | 1.00 | |
| | | | | | | | | | | | | | | | | | | | |
| | | | | |
Net investment income (loss) (a) | | | 0.02 | | | | 0.01 | | | | 0.00 | ‡ | | | 0.00 | ‡ | | | 0.00 | ‡ |
| | | | | |
Net realized and unrealized gain (loss) on investments | | | 0.00 | ‡ | | | (0.00 | )‡ | | | 0.00 | ‡ | | | 0.00 | ‡ | | | (0.00 | )‡ |
| | | | | | | | | | | | | | | | | | | | |
| | | | | |
Total from investment operations | | | 0.02 | | | | 0.01 | | | | 0.00 | ‡ | | | 0.00 | ‡ | | | 0.00 | ‡ |
| | | | | | | | | | | | | | | | | | | | |
| | | | | |
| Less dividends: | | | | | | | | | | | | | | | | | | | | |
| | | | | |
From net investment income | | | (0.02 | ) | | | (0.01 | ) | | | (0.00 | )‡ | | | (0.00 | )‡ | | | (0.00 | )‡ |
| | | | | | | | | | | | | | | | | | | | |
| | | | | |
Net asset value at end of year | | $ | 1.00 | | | $ | 1.00 | | | $ | 1.00 | | | $ | 1.00 | | | $ | 1.00 | |
| | | | | | | | | | | | | | | | | | | | |
| | | | | |
Total investment return (b) | | | 1.84 | % | | | 1.21 | % | | | 0.35 | % | | | 0.01 | % | | | 0.01 | % |
| | | | | |
| Ratios (to average net assets)/Supplemental Data: | | | | | | | | | | | | | | | | | | | | |
| | | | | |
Net investment income (loss) | | | 1.82 | % | | | 1.20 | % | | | 0.32 | % | | | 0.02 | % | | | 0.01 | % |
| | | | | |
Net expenses | | | 0.56 | % | | | 0.57 | % | | | 0.59 | % | | | 0.43 | % | | | 0.13 | % |
| | | | | |
Expenses (before waiver/reimbursement) | | | 0.56 | % | | | 0.57 | % | | | 0.60 | % | | | 0.64 | % | | | 0.64 | % |
| | | | | |
Net assets at end of year (in 000’s) | | $ | 290,421 | | | $ | 235,855 | | | $ | 227,572 | | | $ | 226,181 | | | $ | 243,517 | |
| ‡ | Less than one cent per share. |
| (a) | Per share data based on average shares outstanding during the year. |
| (b) | Total investment return is calculated exclusive of sales charges and assumes the reinvestment of dividends and distributions. For periods of less than one year, total return is not annualized. |
| | | | | | | | | | | | | | | | | | | | |
| |
| | | Year ended October 31, | |
| | | | | |
| Investor Class | | 2019 | | | 2018 | | | 2017 | | | 2016 | | | 2015 | |
| | | | | |
Net asset value at beginning of year | | $ | 1.00 | | | $ | 1.00 | | | $ | 1.00 | | | $ | 1.00 | | | $ | 1.00 | |
| | | | | | | | | | | | | | | | | | | | |
| | | | | |
Net investment income (loss) (a) | | | 0.02 | | | | 0.01 | | | | 0.00 | ‡ | | | 0.00 | ‡ | | | 0.00 | ‡ |
| | | | | |
Net realized and unrealized gain (loss) on investments | | | 0.00 | ‡ | | | (0.00 | )‡ | | | 0.00 | ‡ | | | 0.00 | ‡ | | | (0.00 | )‡ |
| | | | | | | | | | | | | | | | | | | | |
| | | | | |
Total from investment operations | | | 0.02 | | | | 0.01 | | | | 0.00 | ‡ | | | 0.00 | ‡ | | | 0.00 | ‡ |
| | | | | | | | | | | | | | | | | | | | |
| | | | | |
| Less dividends: | | | | | | | | | | | | | | | | | | | | |
| | | | | |
From net investment income | | | (0.02 | ) | | | (0.01 | ) | | | (0.00 | )‡ | | | (0.00 | )‡ | | | (0.00 | )‡ |
| | | | | | | | | | | | | | | | | | | | |
| | | | | |
Net asset value at end of year | | $ | 1.00 | | | $ | 1.00 | | | $ | 1.00 | | | $ | 1.00 | | | $ | 1.00 | |
| | | | | | | | | | | | | | | | | | | | |
| | | | | |
Total investment return (b) | | | 1.59 | % | | | 0.98 | % | | | 0.20 | % | | | 0.01 | % | | | 0.01 | % |
| | | | | |
| Ratios (to average net assets)/Supplemental Data: | | | | | | | | | | | | | | | | | | | | |
| | | | | |
Net investment income (loss) | | | 1.58 | % | | | 0.97 | % | | | 0.18 | % | | | 0.02 | % | | | 0.01 | % |
| | | | | |
Net expenses | | | 0.80 | % | | | 0.80 | % | | | 0.73 | % | | | 0.43 | % | | | 0.14 | % |
| | | | | |
Expenses (before waiver/reimbursement) | | | 0.88 | % | | | 0.84 | % | | | 0.79 | % | | | 0.83 | % | | | 0.87 | % |
| | | | | |
Net assets at end of year (in 000’s) | | $ | 28,133 | | | $ | 26,548 | | | $ | 27,087 | | | $ | 58,658 | | | $ | 56,512 | |
| ‡ | Less than one cent per share. |
| (a) | Per share data based on average shares outstanding during the year. |
| (b) | Total investment return is calculated exclusive of sales charges and assumes the reinvestment of dividends and distributions. For periods of less than one year, total return is not annualized. |
| | | | |
| 16 | | MainStay Money Market Fund | | The notes to the financial statements are an integral part of,
and should be read in conjunction with, the financial statements. |
Financial Highlightsselected per share data and ratios
| | | | | | | | | | | | | | | | | | | | |
| |
| | | Year ended October 31, | |
| | | | | |
| Class B | | 2019 | | | 2018 | | | 2017 | | | 2016 | | | 2015 | |
| | | | | |
Net asset value at beginning of year | | $ | 1.00 | | | $ | 1.00 | | | $ | 1.00 | | | $ | 1.00 | | | $ | 1.00 | |
| | | | | | | | | | | | | | | | | | | | |
| | | | | |
Net investment income (loss) (a) | | | 0.02 | | | | 0.01 | | | | 0.00 | ‡ | | | 0.00 | ‡ | | | 0.00 | ‡ |
| | | | | |
Net realized and unrealized gain (loss) on investments | | | 0.00 | ‡ | | | (0.00 | )‡ | | | 0.00 | ‡ | | | 0.00 | ‡ | | | (0.00 | )‡ |
| | | | | | | | | | | | | | | | | | | | |
| | | | | |
Total from investment operations | | | 0.02 | | | | 0.01 | | | | 0.00 | ‡ | | | 0.00 | ‡ | | | 0.00 | ‡ |
| | | | | | | | | | | | | | | | | | | | |
| | | | | |
| Less dividends: | | | | | | | | | | | | | | | | | | | | |
| | | | | |
From net investment income | | | (0.02 | ) | | | (0.01 | ) | | | (0.00 | )‡ | | | (0.00 | )‡ | | | (0.00 | )‡ |
| | | | | | | | | | | | | | | | | | | | |
| | | | | |
Net asset value at end of year | | $ | 1.00 | | | $ | 1.00 | | | $ | 1.00 | | | $ | 1.00 | | | $ | 1.00 | |
| | | | | | | | | | | | | | | | | | | | |
| | | | | |
Total investment return (b) | | | 1.59 | % | | | 0.98 | % | | | 0.20 | % | | | 0.01 | % | | | 0.01 | % |
| | | | | |
| Ratios (to average net assets)/Supplemental Data: | | | | | | | | | | | | | | | | | | | | |
| | | | | |
Net investment income (loss) | | | 1.59 | % | | | 0.96 | % | | | 0.17 | % | | | 0.02 | % | | | 0.01 | % |
| | | | | |
Net expenses | | | 0.80 | % | | | 0.80 | % | | | 0.73 | % | | | 0.43 | % | | | 0.14 | % |
| | | | | |
Expenses (before waiver/reimbursement) | | | 0.88 | % | | | 0.84 | % | | | 0.79 | % | | | 0.83 | % | | | 0.87 | % |
| | | | | |
Net assets at end of year (in 000’s) | | $ | 32,981 | | | $ | 37,284 | | | $ | 43,351 | | | $ | 53,341 | | | $ | 58,152 | |
| ‡ | Less than one cent per share. |
| (a) | Per share data based on average shares outstanding during the year. |
| (b) | Total investment return is calculated exclusive of sales charges and assumes the reinvestment of dividends and distributions. For periods of less than one year, total return is not annualized. |
| | | | | | | | | | | | | | | | | | | | |
| |
| | | Year ended October 31, | |
| | | | | |
| Class C | | 2019 | | | 2018 | | | 2017 | | | 2016 | | | 2015 | |
| | | | | |
Net asset value at beginning of year | | $ | 1.00 | | | $ | 1.00 | | | $ | 1.00 | | | $ | 1.00 | | | $ | 1.00 | |
| | | | | | | | | | | | | | | | | | | | |
| | | | | |
Net investment income (loss) (a) | | | 0.02 | | | | 0.01 | | | | 0.00 | ‡ | | | 0.00 | ‡ | | | 0.00 | ‡ |
| | | | | |
Net realized and unrealized gain (loss) on investments | | | 0.00 | ‡ | | | (0.00 | )‡ | | | 0.00 | ‡ | | | 0.00 | ‡ | | | (0.00 | )‡ |
| | | | | | | | | | | | | | | | | | | | |
| | | | | |
Total from investment operations | | | 0.02 | | | | 0.01 | | | | 0.00 | ‡ | | | 0.00 | ‡ | | | 0.00 | ‡ |
| | | | | | | | | | | | | | | | | | | | |
| | | | | |
| Less dividends: | | | | | | | | | | | | | | | | | | | | |
| | | | | |
From net investment income | | | (0.02 | ) | | | (0.01 | ) | | | (0.00 | )‡ | | | (0.00 | )‡ | | | (0.00 | )‡ |
| | | | | | | | | | | | | | | | | | | | |
| | | | | |
Net asset value at end of year | | $ | 1.00 | | | $ | 1.00 | | | $ | 1.00 | | | $ | 1.00 | | | $ | 1.00 | |
| | | | | | | | | | | | | | | | | | | | |
| | | | | |
Total investment return (b) | | | 1.60 | % | | | 0.98 | % | �� | | 0.20 | % | | | 0.01 | % | | | 0.01 | % |
| | | | | |
| Ratios (to average net assets)/Supplemental Data: | | | | | | | | | | | | | | | | | | | | |
| | | | | |
Net investment income (loss) | | | 1.59 | % | | | 0.94 | % | | | 0.17 | % | | | 0.02 | % | | | 0.01 | % |
| | | | | |
Net expenses | | | 0.80 | % | | | 0.80 | % | | | 0.73 | % | | | 0.43 | % | | | 0.13 | % |
| | | | | |
Expenses (before waiver/reimbursement) | | | 0.88 | % | | | 0.84 | % | | | 0.79 | % | | | 0.83 | % | | | 0.87 | % |
| | | | | |
Net assets at end of year (in 000’s) | | $ | 20,308 | | | $ | 22,983 | | | $ | 30,831 | | | $ | 41,311 | | | $ | 41,050 | |
| ‡ | Less than one cent per share. |
| (a) | Per share data based on average shares outstanding during the year. |
| (b) | Total investment return is calculated exclusive of sales charges and assumes the reinvestment of dividends and distributions. For periods of less than one year, total return is not annualized. |
| | | | | | |
The notes to the financial statements are an integral part of,
and should be read in conjunction with, the financial statements. | | | | | 17 | |
Notes to Financial Statements
Note 1–Organization and Business
The MainStay Funds (the “Trust”) was organized on January 9, 1986, as a Massachusetts business trust and is governed by a Declaration of Trust. The Trust is registered under the Investment Company Act of 1940, as amended (the “1940 Act”), as an open-end management investment company, and is comprised of twelve funds (collectively referred to as the “Funds”). These financial statements and notes relate to the MainStay Money Market Fund (the “Fund”), a “diversified” fund, as that term is defined in the 1940 Act, as interpreted or modified by regulatory authorities having jurisdiction, from time to time.
The Fund currently has four classes of shares registered for sale. Class A shares commenced operations on January 3, 1995. Class B shares commenced operations on May 1, 1986. Class C shares commenced operations on September 1, 1998. Investor Class shares commenced operations on February 28, 2008.
Class A, Class I and Investor Class shares are offered at net asset value (“NAV”) without an initial sales charge. Class B shares of the MainStay Group of Funds are closed to all new purchases as well as additional investments by existing Class B shareholders. Existing Class B shareholders may continue to reinvest dividends and capital gains distributions, as well as exchange their Class B shares for Class B shares of other funds in the MainStay Group of Funds as permitted by the current exchange privileges. Class B shareholders continue to be subject to any applicable contingent deferred sales charge (“CDSC”) at the time of redemption. All other features of the Class B shares, including but not limited to the fees and expenses applicable to Class B shares, remain unchanged. Unless redeemed, Class B shareholders will remain in Class B shares of their respective fund until the Class B shares are converted to Class A or Investor Class shares pursuant to the applicable conversion schedule. Depending upon eligibility, Class B shares convert to either Class A or Investor Class shares at the end of the calendar quarter eight years after the date they were purchased. Additionally, as disclosed in the Fund’s prospectus, Investor Class shares may convert automatically to Class A shares and Class A shares may convert automatically to Investor Class shares. Under certain circumstances and as may be permitted by the Trust’s multiple class plan pursuant to Rule 18f-3 under the 1940 Act, specified share classes of the Fund may be converted to one or more other share classes of the Fund as disclosed in the capital share transactions within these Notes. The classes of shares have the same voting (except for issues that relate solely to one class), dividend, liquidation and other rights, and the same terms and conditions.
The Fund’s investment objective is to seek a high level of current income while preserving capital and maintaining liquidity.
Note 2–Significant Accounting Policies
The Fund is an investment company and accordingly follows the investment company accounting and reporting guidance of the Financial Accounting Standards Board (“FASB”) Accounting Standard CodificationTopic 946 Financial Services—Investment Companies. The Fund prepares its financial statements in accordance with generally accepted accounting principles (“GAAP”) in the United States of America and follows the significant accounting policies described below.
(A) Valuation of Shares. You could lose money by investing in the Fund. Although the Fund seeks to preserve the value of your investment at $1.00 per share by using the amortized cost method of valuation, it cannot guarantee it will do so. The Fund may impose a fee upon the sale of your shares or may temporarily suspend your ability to sell shares if the Fund’s liquidity falls below required minimums because of market conditions or other factors. An investment in the Fund is not insured or guaranteed by the Federal Deposit Insurance Corporation or any other government agency. The Fund’s sponsor has no legal obligation to provide financial support to the Fund, and you should not expect that the sponsor will provide financial support to the Fund at any time.
(B) Securities Valuation. Securities are valued using the amortized cost method of valuation, unless the use of such method would be inappropriate per the requirements of Rule 2a-7 under the 1940 Act. The amortized cost method involves valuing a security at its cost on the date of purchase and thereafter assuming a constant amortization to maturity of the difference between such cost and the value on maturity date. Amortized cost approximates the current fair value of a security.
The Board of Trustees of the Trust (the “Board”) adopted procedures establishing methodologies for the valuation of the Fund’s securities and other assets and delegated the responsibility for valuation determinations under those procedures to the Valuation Committee of the Trust (the “Valuation Committee”). The Board authorized the Valuation Committee to appoint a Valuation Subcommittee (the “Subcommittee”) to deal in the first instance with establishing the prices of securities for which market quotations are not readily available or the prices of which are not otherwise readily determinable under these procedures. The Subcommittee meets (in person, via electronic mail or via teleconference) on an as-needed basis. Subsequently, the Valuation Committee meets to ensure that actions taken by the Subcommittee were appropriate. The procedures state that, subject to the oversight of the Board and unless otherwise noted, the responsibility for theday-to-day valuation of portfolio assets (including fair value measurements for the Fund’s assets and liabilities) rests with New York Life Investment Management LLC (“New York Life Investments” or the “Manager”), aided to whatever extent necessary by the Subadvisor (as defined in Note 3(A)).
To assess the appropriateness of security valuations, the Manager, the Subadvisor or the Fund’s third-party service provider, who is subject to oversight by the Manager, regularly compares prior day prices, prices on comparable securities and the sale prices to the prior and current day prices and challenges prices with changes exceeding certain tolerance levels with third-party pricing services or broker sources. For those securities valued through either a standardized fair valuation methodology or a fair valuation measurement, the Subcommittee deals in the first instance with such valuation and the Valuation Committee reviews and affirms, if appropriate, the reasonableness of the valuation based on such methodologies and measurements on a regular basis after considering information that is reasonably available and deemed relevant by the Valuation Committee. Any action taken by the Subcommittee with respect to the valuation of a portfolio security or other asset is submitted for review and ratification (if appropriate) to the Valuation Committee and the Board at the next regularly scheduled meeting.
“Fair value” is defined as the price the Fund would reasonably expect to receive upon selling an asset or liability in an orderly transaction to an
| | |
| 18 | | MainStay Money Market Fund |
independent buyer in the principal or most advantageous market for the asset or liability. Fair value measurements are determined within a framework that establishes a three-tier hierarchy which maximizes the use of observable market data and minimizes the use of unobservable inputs to establish a classification of fair value measurements for disclosure purposes. “Inputs” refer broadly to the assumptions that market participants would use in pricing the asset or liability, including assumptions about risk, such as the risk inherent in a particular valuation technique used to measure fair value using a pricing model and/or the risk inherent in the inputs for the valuation technique. Inputs may be observable or unobservable. Observable inputs reflect the assumptions market participants would use in pricing the asset or liability based on market data obtained from sources independent of the Fund. Unobservable inputs reflect the Fund’s own assumptions about the assumptions market participants would use in pricing the asset or liability based on the information available. The inputs or methodology used for valuing assets or liabilities may not be an indication of the risks associated with investing in those assets or liabilities. The three-tier hierarchy of inputs is summarized below.
| • | | Level 1—quoted prices in active markets for an identical asset or liability |
| • | | Level 2—other significant observable inputs (including quoted prices for a similar asset or liability in active markets, interest rates and yield curves, prepayment speeds, credit risk, etc.) |
| • | | Level 3—significant unobservable inputs (including the Fund’s own assumptions about the assumptions that market participants would use in measuring fair value of an asset or liability) |
Securities valued at amortized cost are not obtained from a quoted price in an active market and are generally categorized as Level 2 in the hierarchy. The level of an asset or liability within the fair value hierarchy is based on the lowest level of an input, both individually and in the aggregate, that is significant to the fair value measurement. As of October 31, 2019, the aggregate value by input level of the Fund’s assets and liabilities is included at the end of the Fund’s Portfolio of Investments.
The Fund may use third-party vendor evaluations, whose prices may be derived from one or more of the following standard inputs, among others:
| | |
• Benchmark yields | | • Reported trades |
• Broker/dealer quotes | | • Issuer spreads |
• Two-sided markets | | • Benchmark securities |
• Bids/offers | | • Reference data (corporate actions or material event notices) |
• Industry and economic events | | • Comparable bonds |
• Monthly payment information | | |
An asset or liability for which market values cannot be measured using the methodologies described above is valued by methods deemed reasonable in good faith by the Valuation Committee, following the procedures established by the Board, to represent fair value. Under these procedures, the Fund may utilize some of the following fair value techniques: multi-dimensional relational pricing models and option adjusted spread pricing. During the year ended October 31, 2019, there were no material changes to the fair value methodologies.
Securities valued in this manner are generally categorized as Level 3 in the hierarchy. As of October 31, 2019, there were no securities held by the Fund that were fair valued in such a manner.
(C) Income Taxes. The Fund’s policy is to comply with the requirements of the Internal Revenue Code of 1986, as amended (the “Internal Revenue Code”), applicable to regulated investment companies and to distribute all of its taxable income to the shareholders of the Fund within the allowable time limits. Therefore, no federal, state and local income tax provisions are required.
Management evaluates the Fund’s tax positions to determine if the tax positions taken meet the minimum recognition threshold in connection with accounting for uncertainties in income tax positions taken or expected to be taken for the purposes of measuring and recognizing tax liabilities in the financial statements. Recognition of tax benefits of an uncertain tax position is permitted only to the extent the position is “more likely than not” to be sustained assuming examination by taxing authorities. Management has analyzed the Fund’s tax positions taken on federal, state and local income tax returns for all open tax years (for up to three tax years) and has concluded that no provisions for federal, state and local income tax are required in the Fund’s financial statements. The Fund’s federal, state and local income tax and federal excise tax returns for tax years for which the applicable statutes of limitations have not expired are subject to examination by the Internal Revenue Service and state and local departments of revenue.
(D) Dividends and Distributions to Shareholders. Dividends and distributions are recorded on the ex-dividend date. The Fund intends to declare dividends from net investment income, if any, daily and intends to pay them at least monthly and declares and pays distributions from net realized capital and currency gains, if any, at least annually. Unless the shareholder elects otherwise, all dividends and distributions are reinvested in the same class of shares of the Fund, at NAV. Dividends and distributions to shareholders are determined in accordance with federal income tax regulations and may differ from determinations using GAAP.
(E) Security Transactions and Investment Income. The Fund records security transactions on the trade date. Realized gains and losses on security transactions are determined using the identified cost method. Interest income is accrued daily and discounts and premiums on securities purchased for the Fund are accreted and amortized, respectively, on the straight-line method. The straight-line method approximates the effective interest rate forshort-term investments. Income frompayment-in-kind securities, to the extent the Fund held any such securities during the year ended October 31, 2019, is recorded daily based on the effective interest method.
Investment income and realized and unrealized gains and losses on investments of the Fund are allocated pro rata to the separate classes of shares based upon their relative net assets on the date the income is earned or realized and unrealized gains and losses are incurred.
(F) Expenses. Expenses of the Trust are allocated to the individual Funds in proportion to the net assets of the respective Funds when the expenses are incurred, except where direct allocations of expenses can be made. Expenses (other than transfer agent expenses) are allocated to separate classes of shares pro rata based upon their relative net assets on the date the expenses are incurred. The expenses borne by
Notes to Financial Statements(continued)
the Fund, including those of related parties to the Fund, are shown in the Statement of Operations.
(G) Use of Estimates. In preparing financial statements in conformity with GAAP, management makes estimates and assumptions that affect the reported amounts and disclosures in the financial statements. Actual results could differ from those estimates.
(H) Repurchase Agreements. The Fund may enter into repurchase agreements (i.e., buy a security from another party with the agreement that it will be sold back in the future) to earn income. The Fund may enter into repurchase agreements only with counterparties, usually financial institutions, that are deemed by the Manager or the Subadvisor to be creditworthy, pursuant to guidelines established by the Board. During the term of any repurchase agreement, the Manager or the Subadvisor will continue to monitor the creditworthiness of the counterparty. Under the 1940 Act, repurchase agreements are considered to be collateralized loans by the Fund to the counterparty secured by the securities transferred to the Fund.
Repurchase agreements are subject to counterparty risk, meaning the Fund could lose money by the counterparty’s failure to perform under the terms of the agreement. The Fund mitigates this risk by ensuring the repurchase agreement is collateralized by cash, U.S. government securities, fixed income securities and/or other securities. The collateral is held by the Fund’s custodian and valued daily on a mark to market basis to determine if the value, including accrued interest, exceeds the repurchase price. In the event of the counterparty’s default on the obligation to repurchase, the Fund has the right to liquidate the collateral and apply the proceeds in satisfaction of the obligation. Under certain circumstances, such as in the event of default or bankruptcy by the counterparty, realization and/or retention of the collateral may be limited or subject to delay, to legal proceedings and possible realized loss to the Fund. As of October 31, 2019, the repurchase agreements are shown in the Portfolio of Investments.
(I) Debt Securities. The Fund’s investments may include securities such as variable rate notes, floaters and mortgage-related and asset-backed securities. If expectations about changes in interest rates, or assessments of an issuer’s credit worthiness or market conditions are incorrect, these types of investments could lose money.
The Fund may also invest in U.S. dollar-denominated securities of foreign issuers, which carry certain risks in addition to the usual risks inherent in domestic instruments. These risks include those resulting from future adverse political or economic developments and possible imposition of foreign governmental laws or restrictions. The ability of issuers of debt securities held by the Fund to meet their obligations may be affected by, among other things, economic or political developments in a specific country, industry or region.
(J) Indemnifications. Under the Trust’s organizational documents, its officers and trustees are indemnified against certain liabilities that may arise out of performance of their duties to the Trust. Additionally, in the normal course of business, the Fund enters into contracts with third-party service providers that contain a variety of representations and warranties and which may provide general indemnifications. The Fund’s maximum exposure under these arrangements is unknown, as this would involve future claims that may be made against the Fund that have not yet occurred. Based on experience, management is of the view
that the risk of loss in connection with these potential indemnification obligations is remote. However, there can be no assurance that material liabilities related to such obligations will not arise in the future, which could adversely impact the Fund.
Note 3–Fees and Related Party Transactions
(A) Manager and Subadvisor. New York Life Investments, a registered investment adviser and an indirect,wholly-owned subsidiary of New York Life Insurance Company (“New York Life”), serves as the Fund’s Manager, pursuant to an Amended and Restated Management Agreement (“Management Agreement”). The Manager provides offices, conducts clerical, recordkeeping and bookkeeping services and keeps most of the financial and accounting records required to be maintained by the Fund. Except for the portion of salaries and expenses that are the responsibility of the Fund, the Manager pays the salaries and expenses of all personnel affiliated with the Fund and certain operational expenses of the Fund. The Fund reimburses New York Life Investments in an amount equal to a portion of the compensation of the Chief Compliance Officer attributable to the Fund. NYL Investors LLC (“NYL Investors” or the “Subadvisor”), a registered investment adviser and a direct,wholly-owned subsidiary of New York Life, serves as Subadvisor to the Fund and is responsible for theday-to-day portfolio management of the Fund. Pursuant to the terms of a Subadvisory Agreement (“Subadvisory Agreement”) between New York Life Investments and NYL Investors, New York Life Investments pays for the services of the Subadvisor.
Under the Management Agreement, the Fund pays the Manager a monthly fee for the services performed and the facilities furnished at an annual rate of the Fund’s average daily net assets as follows: 0.40% up to $500 million; 0.35% from $500 million to $1 billion; and 0.30% in excess of $1 billion. During the year ended October 31, 2019, the effective management fee rate was 0.40% of the Fund’s average daily net assets, exclusive of any applicable waivers/reimbursements.
New York Life Investments has contractually agreed to waive fees and/or reimburse expenses so that Total Annual Fund Operating Expenses (excluding taxes, interest, litigation, extraordinary expenses, brokerage and other transaction expenses relating to the purchase or sale of portfolio investments, and acquired (underlying) fund fees and expenses) do not exceed the following percentages of the Fund’s average daily net assets: Class A, 0.70%; Investor Class, 0.80%; Class B, 0.80%; and Class C, 0.80%. This agreement will remain in effect until February 28, 2020, and shall renew automatically for one-year terms unless New York Life Investments provides written notice of termination prior to the start of the next term or upon approval of the Board.
New York Life Investments may voluntarily waive or reimburse expenses of the Fund to the extent it deems appropriate to enhance the yield of the Fund’s during periods when expenses have a significant impact on the yield of the Fund, as applicable, because of low interest rates. This expense limitation policy is voluntary and in addition to any contractual arrangements that may be in place with respect to the Fund and described in the Fund’s prospectus.
During the year ended October 31, 2019, New York Life Investments earned fees from the Fund in the amount of $1,416,356 and paid the Subadvisor in the amount of $699,853. Additionally, New York Life
| | |
| 20 | | MainStay Money Market Fund |
Investments reimbursed expenses in the amount of $64,382, without which the Fund’s total returns would have been lower.
State Street Bank and Trust Company (“State Street”) providessub-administration andsub-accounting services to the Fund pursuant to an agreement with New York Life Investments. These services include calculating the daily NAV of the Fund, maintaining the general ledger andsub-ledger accounts for the calculation of the Fund’s NAV, and assisting New York Life Investments in conducting various aspects of the Fund’s administrative operations. For providing these services to the Fund, State Street is compensated by New York Life Investments.
(B) Sales Charges. During the year ended October 31, 2019, the Fund was advised by the Distributor that the amount of initial sales charges retained on sales of Class A and Investor Class shares were $1,462 and $828, respectively.
Although the Fund does not assess a CDSC upon redemption of Class B or Class C shares of the Fund, the applicable CDSC will be assessed when shares are redeemed from the Fund if the shareholder previously exchanged his or her investment into the Fund from another fund within the MainStay Group of Funds. During the year ended October 31, 2019, the Fund was advised that NYLIFE Distributors LLC (the “Distributor”), an indirect wholly owned subsidiary of New York Life, received from shareholders the proceeds from CDSCs of Class A, Investor Class, Class B and Class C of $42,876, $1,153, $47,660 and $5,383, respectively.
(C) Transfer, Dividend Disbursing and Shareholder Servicing Agent. NYLIM Service Company LLC, an affiliate of New York Life Investments, is the Fund’s transfer, dividend disbursing and shareholder servicing agent pursuant to an agreement between NYLIM Service Company LLC and the Trust. NYLIM Service Company LLC has entered into an agreement with DST Asset Manager Solutions, Inc. (“DST”), pursuant to which DST performs certain transfer agent services on behalf of NYLIM Service Company LLC. During the year ended October 31, 2019, transfer agent expenses incurred by the Fund were as follows:
| | | | |
Class A | | $ | 212,562 | |
Investor Class | | | 106,729 | |
Class B | | | 138,947 | |
Class C | | | 90,360 | |
(D) Small Account Fee. Shareholders with small accounts adversely impact the cost of providing transfer agency services. In an effort to reduce total transfer agency expenses, the Fund has implemented a small account fee on certain types of accounts. Certain shareholders with an account balance of less than $1,000 are charged an annual per account fee of $20 (assessed semi-annually), the proceeds from which offset transfer agent fees as reflected in the Statement of Operations.
Note 4–Federal Income Tax
The amortized cost also represents the aggregate cost for federal income tax purposes.
As of October 31, 2019, the components of accumulated gain (loss) on a tax basis were as follows:
| | | | | | | | |
Ordinary
Income | | Accumulated
Capital and
Other Gain
(Loss) | | Other
Temporary
Differences | | Unrealized
Appreciation
(Depreciation) | | Total
Accumulated
Gain (Loss) |
| | | | |
| $4,586 | | $— | | $(3,584) | | $— | | $1,002 |
The other temporary differences are primarily due to dividends payable.
The Fund utilized $141 of capital loss carryforwards during the year ended October 31, 2019.
During the years ended October 31, 2019 and October 31, 2018, the tax character of distributions paid as reflected in the Statements of Changes in Net Assets were as follows:
| | | | | | | | |
| | | 2019 | | | 2018 | |
| | |
Distributions paid from: | | | | | | | | |
Ordinary Income | | $ | 6,248,809 | | | $ | 3,650,342 | |
Note 5–Custodian
State Street is the custodian of cash and securities held by the Fund. Custodial fees are charged to the Fund based on the Fund’s net assets and/or the market value of securities held by the Fund and the number of certain transactions incurred by the Fund.
Note 6–Interfund Lending Program
Pursuant to an exemptive order issued by the SEC, the Fund, along with certain other funds managed by New York Life Investments, may participate in an interfund lending program. The interfund lending program provides an alternative credit facility that permits the Fund and certain other funds managed by New York Life Investments to lend or borrow money for temporary purposes directly to or from one another subject to the conditions of the exemptive order. During the year ended October 31, 2019, there were no interfund loans made or outstanding with respect to the Fund.
Notes to Financial Statements(continued)
Note 7–Capital Share Transactions
Transactions in capital shares for the years ended October 31, 2019 and October 31, 2018, were as follows:
| | | | |
Class A (at $1 per share) | | Shares | |
| |
Year ended October 31, 2019: | | | | |
Shares sold | | | 394,765,732 | |
Shares issued to shareholders in reinvestment of dividends and distributions | | | 4,747,751 | |
Shares redeemed | | | (353,199,964 | ) |
| | | | |
Net increase (decrease) in shares outstanding before conversion | | | 46,313,519 | |
Shares converted into Class A (See Note 1) | | | 11,931,559 | |
Shares converted from Class A (See Note 1) | | | (3,680,285 | ) |
| | | | |
Net increase (decrease) | | | 54,564,793 | |
| | | | |
Year ended October 31, 2018: | | | | |
Shares sold | | | 284,906,430 | |
Shares issued to shareholders in reinvestment of dividends and distributions | | | 2,687,453 | |
Shares redeemed | | | (286,642,779 | ) |
| | | | |
Net increase (decrease) in shares outstanding before conversion | | | 951,104 | |
Shares converted into Class A (See Note 1) | | | 10,972,124 | |
Shares converted from Class A (See Note 1) | | | (3,641,126 | ) |
| | | | |
Net increase (decrease) | | | 8,282,102 | |
| | | | |
|
| |
Investor Class (at $1 per share) | | Shares | |
| |
Year ended October 31, 2019: | | | | |
Shares sold | | | 32,376,821 | |
Shares issued to shareholders in reinvestment of dividends and distributions | | | 410,863 | |
Shares redeemed | | | (23,653,343 | ) |
| | | | |
Net increase (decrease) in shares outstanding before conversion | | | 9,134,341 | |
Shares converted into Investor Class (See Note 1) | | | 4,004,631 | |
Shares converted from Investor Class (See Note 1) | | | (11,554,017 | ) |
| | | | |
Net increase (decrease) | | | 1,584,955 | |
| | | | |
Year ended October 31, 2018: | | | | |
Shares sold | | | 27,361,559 | |
Shares issued to shareholders in reinvestment of dividends and distributions | | | 247,655 | |
Shares redeemed | | | (20,939,279 | ) |
| | | | |
Net increase (decrease) in shares outstanding before conversion | | | 6,669,935 | |
Shares converted into Investor Class (See Note 1) | | | 3,717,379 | |
Shares converted from Investor Class (See Note 1) | | | (10,925,800 | ) |
| | | | |
Net increase (decrease) | | | (538,486 | ) |
| | | | |
| | | | |
Class B (at $1 per share) | | Shares | |
| |
Year ended October 31, 2019: | | | | |
Shares sold | | | 11,573,190 | |
Shares issued to shareholders in reinvestment of dividends and distributions | | | 544,149 | |
Shares redeemed | | | (16,351,512 | ) |
| | | | |
Net increase (decrease) in shares outstanding before conversion | | | (4,234,173 | ) |
Shares converted from Class B (See Note 1) | | | (69,054 | ) |
| | | | |
Net increase (decrease) | | | (4,303,227 | ) |
| | | | |
Year ended October 31, 2018: | | | | |
Shares sold | | | 3,017,330 | |
Shares issued to shareholders in reinvestment of dividends and distributions | | | 380,517 | |
Shares redeemed | | | (9,387,697 | ) |
| | | | |
Net increase (decrease) in shares outstanding before conversion | | | (5,989,850 | ) |
Shares converted into Class B (See Note 1) | | | 34 | |
Shares converted from Class B (See Note 1) | | | (77,057 | ) |
| | | | |
Net increase (decrease) | | | (6,066,873 | ) |
| | | | |
| |
| | | | |
Class C (at $1 per share) | | Shares | |
| |
Year ended October 31, 2019: | | | | |
Shares sold | | | 16,115,549 | |
Shares issued to shareholders in reinvestment of dividends and distributions | | | 357,664 | |
Shares redeemed | | | (18,515,513 | ) |
| | | | |
Net increase (decrease) in shares outstanding before conversion | | | (2,042,300 | ) |
Shares converted from Class C (See Note 1) | | | (632,834 | ) |
| | | | |
Net increase (decrease) | | | (2,675,134 | ) |
| | | | |
Year ended October 31, 2018: | | | | |
Shares sold | | | 17,929,357 | |
Shares issued to shareholders in reinvestment of dividends and distributions | | | 242,346 | |
Shares redeemed | | | (25,973,838 | ) |
| | | | |
Net increase (decrease) in shares outstanding before conversion | | | (7,802,135 | ) |
Shares converted from Class C (See Note 1) | | | (45,554 | ) |
| | | | |
Net increase (decrease) | | | (7,847,689 | ) |
| | | | |
Note 8–Subsequent Events
In connection with the preparation of the financial statements of the Fund as of and for the year ended October 31, 2019, events and transactions subsequent to October 31, 2019, through the date the financial statements were issued have been evaluated by the Fund’s management for possible adjustment and/or disclosure. No subsequent events requiring financial statement adjustment or disclosure have been identified.
| | |
| 22 | | MainStay Money Market Fund |
Report of Independent Registered Public Accounting Firm
To the Shareholders and Board of Trustees
The MainStay Funds:
Opinion on the Financial Statements
We have audited the accompanying statement of assets and liabilities of MainStay Money Market Fund (the Fund), one of the funds constituting The MainStay Funds, including the portfolio of investments, as of October 31, 2019, the related statement of operations for the year then ended, the statements of changes in net assets for each of the years in thetwo-year period then ended, and the related notes (collectively, the financial statements) and the financial highlights for each of the years in thefive-year period then ended. In our opinion, the financial statements and financial highlights present fairly, in all material respects, the financial position of the Fund as of October 31, 2019, the results of its operations for the year then ended, the changes in its net assets for each of the years in thetwo-year period then ended, and the financial highlights for each of the years in thefive-year period then ended, in conformity with U.S. generally accepted accounting principles.
Basis for Opinion
These financial statements and financial highlights are the responsibility of the Fund’s management. Our responsibility is to express an opinion on these financial statements and financial highlights based on our audits. We are a public accounting firm registered with the Public Company Accounting Oversight Board (United States) (PCAOB) and are required to be independent with respect to the Fund in accordance with the U.S. federal securities laws and the applicable rules and regulations of the Securities and Exchange Commission and the PCAOB.
We conducted our audits in accordance with the standards of the PCAOB. Those standards require that we plan and perform the audit to obtain reasonable assurance about whether the financial statements and financial highlights are free of material misstatement, whether due to error or fraud. Our audits included performing procedures to assess the risks of material misstatement of the financial statements and financial highlights, whether due to error or fraud, and performing procedures that respond to those risks. Such procedures included examining, on a test basis, evidence regarding the amounts and disclosures in the financial statements and financial highlights. Such procedures also included confirmation of securities owned as of October 31, 2019, by correspondence with the custodian and brokers or by other appropriate auditing procedures when replies from brokers were not received. Our audits also included evaluating the accounting principles used and significant estimates made by management, as well as evaluating the overall presentation of the financial statements and financial highlights. We believe that our audits provide a reasonable basis for our opinion.

We have served as the auditor of one or more New York Life Investment Management investment companies since 2003.
Philadelphia, Pennsylvania
December 23, 2019
Federal Income Tax Information
(Unaudited)
In February 2020, shareholders will receive an IRS Form1099-DIV or substitute Form 1099, which will show the federal tax status of the distributions received by shareholders in calendar year 2019. The amounts that will be reported on such1099-DIV or substitute Form 1099 will be the amounts you are to use on your federal income tax return and will differ from the amounts which we must report for the Fund’s fiscal year end October 31, 2019.
Proxy Voting Policies and Procedures and Proxy Voting Record
A description of the policies and procedures that New York Life Investments uses to vote proxies related to the Fund’s securities is available without charge, upon request, by visiting the MainStay Funds’ website atnylinvestments.com/fundsor visiting the Securities and Exchange Commission’s (“SEC”) website atwww.sec.gov.
The Fund is required to file with the SEC its proxy voting records for the12-month period ending June 30 on Form N-PX. The most recent Form N-PX or proxy voting record is available free of charge upon request by calling800-624-6782; visiting the MainStay Funds’ website atnylinvestments.com/funds; or visiting the SEC’s website atwww.sec.gov.
Shareholder Reports and Quarterly Portfolio Disclosure
The Fund is required to file a Form N-MFP every month disclosing its portfolio holdings. The Fund’s Form N-MFP is available free of charge by visiting the SEC’s website atwww.sec.govor upon request by calling New York Life Investments at800-624-6782.
| | |
| 24 | | MainStay Money Market Fund |
Board of Trustees and Officers (Unaudited)
The Trustees and officers of the Funds are listed below. The Board oversees the MainStay Group of Funds (which consists of MainStay Funds and MainStay Funds Trust), MainStay VP Funds Trust, MainStay MacKay DefinedTerm Municipal Opportunities Fund, the Manager and the Subadvisors, and elects the officers of the Funds who are responsible for theday-to-day operations of the Funds. Information pertaining to the Trustees and officers is set forth below. Each Trustee serves until his or her successor is elected and qualified or until his or her
resignation, death or removal. Under the Board’s retirement policy, unless an exception is made, a Trustee must tender his or her resignation by the end of the calendar year during which he or she reaches the age of 75. Officers are elected annually by the Board. The business address of each Trustee and officer listed below is 51 Madison Avenue, New York, New York 10010. A majority of the Trustees are not “interested persons” (as defined by the 1940 Act and rules adopted by the SEC thereunder) of the Fund (“Independent Trustees”).
| | | | | | | | | | | | |
| | | | | Name and
Year of Birth | | Term of Office,
Position(s) Held and
Length of Service | | Principal Occupation(s)
During Past Five Years | | Number of
Portfolios in
Fund Complex
Overseen by
Trustee | | Other Directorships
Held by Trustee |
Interested Trustee | | | | Yie-Hsin Hung* 1962 | | MainStay Funds: Trustee since 2017; MainStay Funds Trust:Trustee since 2017. | | Senior Vice President of New York Life since joining in 2010, Member of the Executive Management Committee since 2017, Chief Executive Officer, New York Life Investment Management Holdings LLC & New York Life Investment Management LLC since 2015. Senior Managing Director andCo-President of New York Life Investment Management LLC from January 2014 to May 2015. Previously held positions of increasing responsibility, including head of NYLIM International, Alternative Growth Businesses, and Institutional investments since joining New York Life in 2010. | | 74 | | MainStay VP Funds Trust:
Trustee since 2017 (31 portfolios); and
MainStay MacKay DefinedTerm Municipal Opportunities Fund: Trustee since 2017. |
| | * | This Trustee is considered to be an “interested person” of the MainStay Group of Funds, MainStay VP Funds Trust and MainStay MacKay DefinedTerm Municipal Opportunities Fund, within the meaning of the 1940 Act because of her affiliation with New York Life Insurance Company, New York Life Investment Management LLC, Candriam Belgium S.A., Candriam Luxembourg S.C.A., IndexIQ Advisors LLC, MacKay Shields LLC, NYL Investors LLC, NYLIFE Securities LLC and/or NYLIFE Distributors LLC, as described in detail above in the column entitled “Principal Occupation(s) During Past Five Years.” |
| | | | | | | | | | | | |
| | | | | Name and
Year of Birth | | Term of Office,
Position(s) Held and
Length of Service | | Principal Occupation(s)
During Past Five Years | | Number of
Portfolios in
Fund Complex
Overseen by
Trustee | | Other Directorships
Held by Trustee |
Independent Trustees | | | | David H. Chow 1957 | | MainStay Funds: Trustee since 2016, Advisory Board Member (June 2015 to December 2015); MainStay Funds Trust:Trustee since 2016, Advisory Board Member (June 2015 to December 2015). | | Founder and CEO, DanCourt Management, LLC (since 1999) | | 74 | | MainStay VP Funds Trust: Trustee since 2016, Advisory Board Member (June 2015 to December 2015) (31 portfolios);
MainStay MacKay DefinedTerm Municipal Opportunities Fund: Trustee since 2016, Advisory Board Member (June 2015 to December 2015);
Market Vectors Group of Exchange-Traded Funds: Independent Chairman of the Board of Trustees since 2008 and Trustee since 2006 (56 portfolios); and
Berea College of Kentucky: Trustee since 2009. |
| | | | Susan B. Kerley 1951 | | MainStay Funds: Chairman since 2017 and Trustee since 2007; MainStay Funds Trust:Chairman since 2017 and Trustee since 1990.** | | President, Strategic Management Advisors LLC (since 1990) | | 74 | | MainStay VP Funds Trust: Chairman since January 2017 and Trustee since 2007 (31 portfolios)***;
MainStay MacKay DefinedTerm Municipal Opportunities Fund: Chairman since 2017 and Trustee since 2011; and
Legg Mason Partners Funds: Trustee since 1991 (45 portfolios). |
| | | | Alan R. Latshaw 1951 | | MainStay Funds: Trustee; MainStay Funds Trust: Trustee and Audit Committee Financial Expert since 2007.** | | Retired; Partner, Ernst & Young LLP (2002 to 2003); Partner, Arthur Andersen LLP (1989 to 2002); Consultant to the MainStay Funds Audit and Compliance Committee (2004 to 2006) | | 74 | | MainStay VP Funds Trust: Trustee and Audit Committee Financial Expert since 2007 (31 portfolios)***;
MainStay MacKay DefinedTerm Municipal Opportunities Fund: Trustee and Audit Committee Financial Expert since 2011;
State Farm Associates Funds Trusts: Trustee since 2005 (4 portfolios);
and State Farm Variable Product Trust: Trustee since 2005 (9 portfolios). |
| | | | Richard H. Nolan, Jr. 1946 | | MainStay Funds: Trustee since 2007; MainStay Funds Trust:Trustee since 2007.** | | Managing Director, ICC Capital Management (since 2004); President—Shields/Alliance, Alliance Capital Management (1994 to 2004) | | 74 | | MainStay VP Funds Trust: Trustee since 2006 (31 portfolios)***; and
MainStay MacKay DefinedTerm Municipal Opportunities Fund: Trustee since 2011. |
| | | | Jacques P. Perold 1958 | | MainStay Funds: Trustee since 2016, Advisory Board Member (June 2015 to December 2015); MainStay Funds Trust:Trustee since 2016, Advisory Board Member (June 2015 to December 2015). | | Retired; President, Fidelity Management & Research Company (2009 to 2014); Founder, President and Chief Executive Officer, Geode Capital Management, LLC (2001 to 2009) | | 74 | | MainStay VP Funds Trust: Trustee since 2016, Advisory Board Member (June 2015 to December 2015) (31 portfolios);
MainStay MacKay DefinedTerm Municipal Opportunities Fund: Trustee since 2016, Advisory Board Member (June 2015 to December 2015);
Allstate Corporation: Director since 2015;MSCI, Inc.: Director since 2017 and
Boston University: Trustee since 2014. |
| | |
| 26 | | MainStay Money Market Fund |
| | | | | | | | | | | | |
| | | | | Name and
Year of Birth | | Term of Office,
Position(s) Held and
Length of Service | | Principal Occupation(s)
During Past Five Years | | Number of
Portfolios in
Fund Complex
Overseen by
Trustee | | Other Directorships
Held by Trustee |
Independent Trustees | | | | Richard S. Trutanic 1952 | | MainStay Funds: Trustee since 1994; MainStay Funds Trust: Trustee since 2007.** | | Chairman and Chief Executive Officer, Somerset & Company (financial advisory firm) (since 2004); Managing Director, The Carlyle Group (private investment firm) (2002 to 2004); Senior Managing Director, Partner and Board Member, Groupe Arnault S.A. (private investment firm) (1999 to 2002) | | 74 | | MainStay VP Funds Trust: Trustee since 2007 (31 portfolios)***; and
MainStay MacKay DefinedTerm Municipal Opportunities Fund: Trustee since 2011. |
| | ** | Includes prior service as a Director/Trustee of certain predecessor entities to MainStay Funds Trust. |
| | *** | Includes prior service as a Director of MainStay VP Series Fund, Inc., the predecessor to MainStay VP Funds Trust. |
| | | | | | | | |
| | | | | Name and
Year of Birth | | Position(s) Held and
Length of Service | | Principal Occupation(s)
During Past Five Years |
Officers
of the
Trust
(Who are
not
Trustees)* | | | | Kirk C. Lehneis 1974 | | President, MainStay Funds, MainStay Funds Trust (since 2017) | | Chief Operating Officer and Senior Managing Director (since 2016), New York Life Investment Management LLC; Chairman of the Board (since 2017), NYLIFE Distributors LLC; Chairman of the Board, NYLIM Service Company LLC (since 2017); Trustee, President and Principal Executive Officer of IndexIQ Trust, IndexIQ ETF Trust and IndexIQ Active ETF Trust (since January 2018); President, MainStay MacKay DefinedTerm Municipal Opportunities Fund and MainStay VP Funds Trust
(since 2017)**; Senior Managing Director, Global Product Development (2015 to 2016); Managing Director, Product Development (2010 to 2015), New York Life Investment Management LLC |
| | | | Jack R. Benintende 1964 | | Treasurer and Principal Financial and Accounting Officer, MainStay Funds (since 2007), MainStay Funds Trust (since 2009) | | Managing Director, New York Life Investment Management LLC (since 2007); Treasurer and Principal Financial and Accounting Officer, MainStay MacKay DefinedTerm Municipal Opportunities Fund (since 2011) and MainStay VP Funds Trust (since 2007)**; and Assistant Treasurer, New York Life Investment Management Holdings LLC (2008 to 2012) |
| | | | Kevin M. Bopp 1969 | | Vice President and Chief Compliance Officer, MainStay Funds and MainStay Funds Trust (since 2014) | | Chief Compliance Officer, New York Life Investment Management LLC, IndexIQ Trust, IndexIQ ETF Trust and IndexIQ Active ETF Trust (since 2016), Director and Associate General Counsel (2011 to 2014) and Vice President and Assistant General Counsel (2010 to 2011), New York Life Investment Management LLC; Vice President and Chief Compliance Officer, MainStay VP Funds Trust, MainStay MacKay DefinedTerm Municipal Opportunities Fund (since 2014); Assistant Secretary, MainStay Funds, MainStay Funds Trust and MainStay VP Funds Trust (2010 to 2014)**, MainStay MacKay DefinedTerm Municipal Opportunities Fund (2011 to 2014) |
| | | | J. Kevin Gao 1967 | | Secretary and Chief Legal Officer, MainStay Funds and MainStay Funds Trust (since 2010) | | Managing Director and Associate General Counsel, New York Life Investment Management LLC (since 2010); Secretary and Chief Legal Officer, MainStay MacKay DefinedTerm Municipal Opportunities Fund (since 2011) and MainStay VP Funds Trust (since 2010)** |
| | | | Scott T. Harrington 1959 | | Vice President—Administration, MainStay Funds (since 2005), MainStay Funds Trust (since 2009) | | Managing Director, New York Life Investment Management LLC (including predecessor advisory organizations) (since 2000); Member of the Board of Directors, New York Life Trust Company (since 2009); Vice President—Administration, MainStay MacKay DefinedTerm Municipal Opportunities Fund (since 2011) and MainStay VP Funds Trust (since 2005)** |
| | * | The officers listed above are considered to be “interested persons” of the MainStay Group of Funds, MainStay VP Funds Trust and MainStay MacKay Defined Term Municipal Opportunities Fund within the meaning of the 1940 Act because of their affiliation with the MainStay Group of Funds, New York Life Insurance Company and/or its affiliates, including New York Life Investment Management LLC, NYLIM Service Company LLC, NYLIFE Securities LLC and/or NYLIFE Distributors LLC, as described in detail in the column captioned “Principal Occupation(s) During Past Five Years.” Officers are elected annually by the Board. |
| | ** | Includes prior service as an Officer of MainStay VP Series Fund, Inc., the predecessor to MainStay VP Funds Trust. |
| | |
| 28 | | MainStay Money Market Fund |
MainStay Funds
Equity
U.S. Equity
MainStay Epoch U.S. All Cap Fund
MainStay Epoch U.S. Equity Yield Fund
MainStay Large Cap Growth Fund
MainStay MacKay Common Stock Fund
MainStay MacKay Growth Fund
MainStay MacKay S&P 500 Index Fund
MainStay MacKay Small Cap Core Fund1
MainStay MacKay U.S. Equity Opportunities Fund
MainStay MAP Equity Fund
International Equity
MainStay Epoch International Choice Fund
MainStay MacKay International Equity Fund
MainStay MacKay International Opportunities Fund
Emerging Markets Equity
MainStay Candriam Emerging Markets Equity Fund
MainStay MacKay Emerging Markets Equity Fund
Global Equity
MainStay Epoch Capital Growth Fund
MainStay Epoch Global Equity Yield Fund
Fixed Income
Taxable Income
MainStay Candriam Emerging Markets Debt Fund2
MainStay Floating Rate Fund
MainStay Indexed Bond Fund3
MainStay MacKay High Yield Corporate Bond Fund
MainStay MacKay Infrastructure Bond Fund
MainStay MacKay Short Duration High Yield Fund
MainStay MacKay Total Return Bond Fund
MainStay MacKay Unconstrained Bond Fund
Tax-Exempt Income
MainStay MacKay California Tax Free Opportunities Fund4
MainStay MacKay High Yield Municipal Bond Fund
MainStay MacKay Intermediate Tax Free Bond Fund
MainStay MacKay New York Tax Free Opportunities Fund5
MainStay MacKay Short Term Municipal Fund
MainStay MacKay Tax Free Bond Fund
Money Market
MainStay Money Market Fund
Mixed Asset
MainStay Balanced Fund
MainStay Income Builder Fund
MainStay MacKay Convertible Fund
Speciality
MainStay Cushing Energy Income Fund
MainStay Cushing MLP Premier Fund
MainStay Cushing Renaissance Advantage Fund
Asset Allocation
MainStay Conservative Allocation Fund
MainStay Growth Allocation Fund
MainStay Moderate Allocation Fund
MainStay Moderate Growth Allocation Fund
Manager
New York Life Investment Management LLC
New York, New York
Subadvisors
Candriam Belgium S.A.6
Brussels, Belgium
Candriam Luxembourg S.C.A.6
Strassen, Luxembourg
Cushing Asset Management, LP
Dallas, Texas
Epoch Investment Partners, Inc.
New York, New York
MacKay Shields LLC6
New York, New York
Markston International LLC
White Plains, New York
NYL Investors LLC6
New York, New York
Winslow Capital Management, LLC
Minneapolis, Minnesota
Legal Counsel
Dechert LLP
Washington, District of Columbia
Independent Registered Public Accounting Firm
KPMG LLP
Philadelphia, Pennsylvania
| 1. | Formerly known as MainStay Epoch U.S. Small Cap Fund. |
| 2. | Formerly known as MainStay MacKay Emerging Markets Debt Fund. |
| 3. | Effective December 5, 2019, MainStay Indexed Bond Fund was renamed MainStay Short Term Bond Fund. |
| 4. | Class A and Class I shares of this Fund are registered for sale in AZ, CA, MI, NV, OR, TX, UT and WA. Class I shares are registered for sale in CO, FL, GA, HI, ID, MA, MD, NH, NJ and NY. |
| 5. | This Fund is registered for sale in CA, CT, DE, FL, MA, NJ, NY and VT. |
| 6. | An affiliate of New York Life Investment Management LLC. |
Not part of the Annual Report
For more information
800-624-6782
nylinvestments.com/funds
“New York Life Investments” is both a service mark, and the common trade name, of the investment advisors affiliated with New York Life Insurance Company. The MainStay Funds® are managed by New York Life Investment Management LLC and distributed by NYLIFE Distributors LLC, 30 Hudson Street, Jersey City, NJ 07302, a wholly owned subsidiary of New York Life Insurance Company. NYLIFE Distributors LLC is a Member FINRA/SIPC.
©2019 NYLIFE Distributors LLC. All rights reserved.
| | |
| 1715987 MS159-19 | | MSMM11-12/19 (NYLIM) NL214 |
MainStay MacKay Tax Free Bond Fund
Message from the President and Annual Report
October 31, 2019

Beginning on January 1, 2021, paper copies of each MainStay Fund’s annual and semiannual shareholder reports will no longer be sent by mail, unless you specifically request paper copies of the reports from MainStay Funds or from your financial intermediary. Instead, the reports will be made available on the MainStay Funds’ website. You will be notified by mail and provided with a website address to access the report each time a new report is posted to the website.
If you already elected to receive shareholder reports electronically, you will not be affected by this change and you need not take any action. At any time, you may elect to receive reports and other communications from MainStay Funds electronically by calling toll-free 800-624-6782, by sending an e-mail to MainStayShareholderServices@nylim.com, or by contacting your financial intermediary.
You may elect to receive all future shareholder reports in paper form free of charge. If you hold shares of a MainStay Fund directly, you can inform MainStay Funds that you wish to receive paper copies of reports by calling toll-free 800-624-6782 or by sending an e-mail to MainStayShareholderServices@nylim.com. If you hold shares of a MainStay Fund through a financial intermediary, please contact the financial intermediary to make this election. Your election to receive reports in paper form will apply to all MainStay Funds in which you are invested and may apply to all funds held with your financial intermediary.
| | | | | | | | |
| | | | | |
| Not FDIC/NCUA Insured | | Not a Deposit | | May Lose Value | | No Bank Guarantee | | Not Insured by Any Government Agency |

This page intentionally left blank
Message from the President
Stock and bond markets generally gained ground during the12-month reporting period ended October 31, 2019, despite concerns regarding slowing U.S. and global economic growth and international trade conflicts.
After trending higher in November 2018, U.S. stocks and bonds dipped sharply in December 2018, over concerns regarding the pace of economic growth, a U.S. government shutdown and the potential impact of trade disputes between the United States and other nations, particularly China. U.S. markets recovered quickly in 2019 as trade tensions eased, the government reopened and the U.S. Federal Reserve Board (“Fed”) adopted a more accommodative tone regarding the future direction of interest rates. A wide spectrum of equity and fixed-income sectors gained ground through April 2019. Mixed macroeconomic signals and the inability of China and the United States to reach a trade agreement caused the market’s recovery to suffer during the spring and summer months of 2019. However, accommodative monetary policies from several central banks, including a series of interest rate cuts by the Fed, along with better-than-expected corporate earnings reassured investors and enabled markets to resume their advance.
Persistent, albeit slow, U.S. economic growth underpinned the U.S. stock market’s advance during the reporting period, positioning major U.S. equity indices to reach record territory by late October 2019. Sector strength shifted as investor sentiment alternated betweenrisk-on andrisk-off positions. In general, for the reporting period, cyclical, growth-oriented stocks outperformed their value-oriented counterparts by a small margin, with the information technology sector leading thelarge-cap S&P 500® Index. However, the traditionally more defensive areas of real estate and utilities generated above-average performance as well. Communication services, consumer discretionary, industrials and consumer staples performed in the middle of the pack, while materials, financials and health care lagged. Only the energy sector suffered declines, undermined by weak oil prices and concerns about future energy demand.
In the fixed-income markets, slowing economic growth, modest inflation and the Fed’s interest rate cuts created an environment of falling yields and rising prices for most bonds, with many areas of the market offering historically low yields by the end of the reporting period. Higher-credit-quality, longer-duration securities generally produced strong returns, with investment-
grade corporates and long-term Treasury bonds delivering particularly strong performance. A similar dynamic characterized the performance of the municipal bond market, with longer-term, higher-grade issues performing relatively well. On average, municipal bonds roughly matched the gains of corporate issues while providingtax-advantaged returns for eligible investors.
International stock and bond markets tended to underperform their U.S. counterparts, constrained by lackluster economic growth in the Eurozone and dramatically slowing growth in China and related parts of Asia amid persistent trade tensions with the United States. Uncertainties surrounding the unending Brexit drama took a further toll on investor confidence, with Britain seemingly unable to resolve its internal conflicts over how, or whether, to exit from the European Union. Nevertheless, on average, international securities delivered modestly positive returns, bolstered by the accommodative monetary policies implemented by European and Asian central banks. Bonds from both emerging and developed markets generally produced stronger returns than equities while repeating the pattern of outperformance by higher-quality, longer-term instruments seen in the United States.
As the economic growth cycle lengthens, investors are left to ponder how best to position their portfolios for an uncertain future. When the yield curve inverted earlier this year prompting concerns of a potential recession, we were reminded that the direction of the economy is continually subject to change, and perceptions of the economy can shift even more rapidly. As a MainStay investor, you can rely on us to manage our Funds with unflagging energy and dedication so that you can remain focused on your long-term objectives in the face of uncertainty and change. Our goal remains to provide you with the consistently reliable financial tools you need to achieve your long-term objectives.
Sincerely,

Kirk C. Lehneis
President
The opinions expressed are as of the date of this report and are subject to change. There is no guarantee that any forecast made will come to pass. This material does not constitute investment advice and is not intended as an endorsement of any specific investment. Past performance is no guarantee of future results.
Not part of the Annual Report
Table of Contents
Investors should refer to the Fund’s Summary Prospectus and/or Prospectus and consider the Fund’s investment objectives, strategies, risks, charges and expenses carefully before investing. The Summary Prospectus and/or Prospectus contain this and other information about the Fund. You may obtain copies of the Fund’s Summary Prospectus, Prospectus and Statement of Additional Information free of charge, upon request, by calling toll-free 800-624-6782, by writing to NYLIFE Distributors LLC, Attn: MainStay Marketing Department, 30 Hudson Street, Jersey City, NJ 07302 or by sending ane-mail to MainStayShareholderServices@nylim.com. These documents are also available via the MainStay Funds’ website at nylinvestments.com/funds. Please read the Summary Prospectus and/or Prospectus carefully before investing.
Investment and Performance Comparison1(Unaudited)
Performance data quoted represents past performance. Past performance is no guarantee of future results. Because of market volatility and other factors, current performance may be lower or higher than the figures shown. Investment return and principal value will fluctuate, and as a result, when shares are redeemed, they may be worth more or less than their original cost. The graph below depicts the historical performance of Class B shares2 of the Fund. Performance will vary from class to class based on differences in class-specific expenses and sales charges. For performance information current to the most recent month-end, please call 800-624-6782 or visit nylinvestments.com/funds.
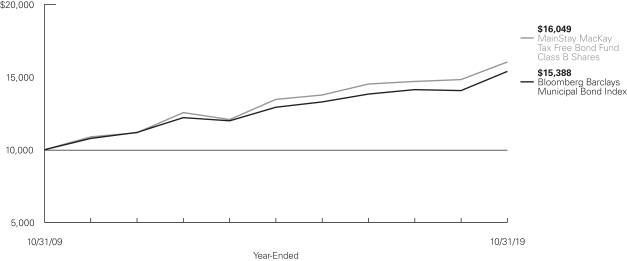
Average Annual Total Returns for the Year-Ended October 31, 2019
| | | | | | | | | | | | | | | | | | | | | | | | |
| Class | | Sales Charge | | | | Inception
Date | | | One
Year | | | Five
Years | | | Ten Years
or Since
Inception | | | Gross Expense Ratio3 | |
| | | | | | | |
| Class A Shares | | Maximum 4.5% Initial Sales Charge | | With sales charges Excluding sales charges | |
| 1/3/1995
|
| |
| 3.66
8.55 | %
| |
| 2.87
3.82 | %
| |
| 4.66
5.14 | %
| |
| 0.80
0.80 | %
|
| Investor Class Shares | | Maximum 4.5% Initial Sales Charge | | With sales charges Excluding sales charges | |
| 2/28/2008
|
| |
| 3.75
8.63 |
| |
| 2.87
3.83 |
| |
| 4.62
5.11 |
| |
| 0.78
0.78 |
|
| Class B Shares2 | | Maximum 5% CDSC
if Redeemed Within the First Six Years of Purchase | | With sales charges Excluding sales charges | |
| 5/1/1986
|
| |
| 3.28
8.28 |
| |
| 3.22
3.57 |
| |
| 4.85
4.85 |
| |
| 1.03
1.03 |
|
| Class C Shares | | Maximum 1% CDSC
if Redeemed Within One Year of Purchase | | With sales charges Excluding sales charges | |
| 9/1/1998
|
| |
| 7.39
8.39 |
| |
| 3.59
3.59 |
| |
| 4.85
4.85 |
| |
| 1.03
1.03 |
|
| Class I Shares | | No Sales Charge | | | | | 12/21/2009 | | | | 8.93 | | | | 4.10 | | | | 5.36 | | | | 0.55 | |
| 1. | The performance table and graph do not reflect the deduction of taxes that a shareholder would pay on distributions or Fund share redemptions. Total returns reflect maximum applicable sales charges as indicated in the table above, if any, changes in share price, and reinvestment of dividend and capital gain distributions. The graph assumes the initial investment amount shown above and reflects the deduction of all sales charges that would have applied for the period of investment. Performance figures may reflect certain fee waivers and/or expense limitations, without which total returns may have |
| | been lower. For more information on share classes and current fee waivers and/or expense limitations (if any), please refer to the Notes to Financial Statements. |
| 2. | Class B shares are closed to all new purchases as well as additional investments by existing Class B shareholders. |
| 3. | The gross expense ratios presented reflect the Fund’s “Total Annual Fund Operating Expenses” from the most recent Prospectus and may differ from other expense ratios disclosed in this report. |
The footnotes on the next page are an integral part of the table and graph and should be carefully read in conjunction with them.
| | | | | | | | | | | | |
| Benchmark Performance | | One
Year | | | Five
Years | | | Ten
Years | |
| | | |
Bloomberg Barclays Municipal Bond Index4 | | | 9.42 | % | | | 3.55 | % | | | 4.40 | % |
Morningstar Muni National Long Category Average5 | | | 10.04 | | | | 3.58 | | | | 4.46 | |
| 4. | The Bloomberg Barclays Municipal Bond Index is the Fund’s primary broad-based securities market index for comparison purposes. The Bloomberg Barclays Municipal Bond Index is considered representative of the broad-based market for investment-grade, tax-exempt bonds with a maturity of at least one year. Bonds subject to the alternative minimum tax or with floating or zero coupons are excluded. Results assume reinvestment of all dividends and capital gains. An investment cannot be made directly in an index. |
| 5. | The Morningstar Muni National Long Category Average is representative of funds that invest in bonds issued by various state and local governments to fund public projects. The income from these bonds is generally free from federal taxes. These portfolios have durations of more than 7.0 years. Results are based on average total returns of similar funds with all dividends and capital gain distributions reinvested. |
The footnotes on the preceding page are an integral part of the table and graph and should be carefully read in conjunction with them.
| | |
| 6 | | MainStay MacKay Tax Free Bond Fund |
Cost in Dollars of a $1,000 Investment in MainStay MacKay Tax Free Bond Fund (Unaudited)
The example below is intended to describe the fees and expenses borne by shareholders during the six-month period from May 1, 2019, to October 31, 2019, and the impact of those costs on your investment.
Example
As a shareholder of the Fund you incur two types of costs: (1) transaction costs, including exchange fees and sales charges (loads) on purchases (as applicable), and (2) ongoing costs, including management fees, distribution and/or service (12b-1) fees, and other Fund expenses (as applicable). This example is intended to help you understand your ongoing costs (in dollars) of investing in the Fund and to compare these costs with the ongoing costs of investing in other mutual funds. The example is based on an investment of $1,000 made at the beginning of the six-month period and held for the entire period from May 1, 2019, to October 31, 2019.
This example illustrates your Fund’s ongoing costs in two ways:
Actual Expenses
The second and third data columns in the table below provide information about actual account values and actual expenses. You may use the information in these columns, together with the amount you invested, to estimate the expenses that you paid during the six months ended October 31, 2019. Simply divide your account value by $1,000 (for example, an $8,600 account value divided by $1,000 = 8.6), then
multiply the result by the number under the heading entitled “Expenses Paid During Period” to estimate the expenses you paid on your account during this period.
Hypothetical Example for Comparison Purposes
The fourth and fifth data columns in the table below provide information about hypothetical account values and hypothetical expenses based on the Fund’s actual expense ratio and an assumed rate of return of 5% per year before expenses, which is not the Fund’s actual return. The hypothetical account values and expenses may not be used to estimate the actual ending account balances or expenses you paid for thesix-month period shown. You may use this information to compare the ongoing costs of investing in the Fund with the ongoing costs of investing in other mutual funds. To do so, compare this 5% hypothetical example with the 5% hypothetical examples that appear in the shareholder reports of the other mutual funds.
Please note that the expenses shown in the table are meant to highlight your ongoing costs only and do not reflect any transactional costs, such as exchange fees or sales charges (loads). Therefore, the fourth and fifth data columns of the table are useful in comparing ongoing costs only and will not help you determine the relative total costs of owning different funds. In addition, if these transactional costs were included, your costs would have been higher.
| | | | | | | | | | | | | | | | | | | | | | |
| | | | | | | | | | | | | | | | | | |
| Share Class | | Beginning
Account
Value
5/1/19 | | | Ending Account
Value (Based
on Actual
Returns and
Expenses)
10/31/19 | | | Expenses
Paid
During
Period1 | | | Ending Account
Value (Based
on Hypothetical
5% Annualized
Return and
Actual Expenses)
10/31/19 | | | Expenses
Paid
During
Period1 | | | Net Expense
Ratio
During
Period2 |
| | | | | | |
| Class A Shares | | $ | 1,000.00 | | | $ | 1,036.20 | | | $ | 3.95 | | | $ | 1,021.32 | | | $ | 3.92 | | | 0.77% |
| | | | | | |
| Investor Class Shares | | $ | 1,000.00 | | | $ | 1,037.10 | | | $ | 3.95 | | | $ | 1,021.32 | | | $ | 3.92 | | | 0.77% |
| | | | | | |
| Class B Shares | | $ | 1,000.00 | | | $ | 1,034.90 | | | $ | 5.23 | | | $ | 1,020.06 | | | $ | 5.19 | | | 1.02% |
| | | | | | |
| Class C Shares | | $ | 1,000.00 | | | $ | 1,035.90 | | | $ | 5.23 | | | $ | 1,020.06 | | | $ | 5.19 | | | 1.02% |
| | | | | | |
| Class I Shares | | $ | 1,000.00 | | | $ | 1,038.50 | | | $ | 2.67 | | | $ | 1,022.58 | | | $ | 2.65 | | | 0.52% |
| 1. | Expenses are equal to the Fund’s annualized expense ratio of each class multiplied by the average account value over the period, divided by 365 and multiplied by 184 (to reflect the six-month period). The table above represents the actual expenses incurred during the six-month period. |
| 2. | Expenses are equal to the Fund’s annualized expense ratio to reflect the six-month period. |
Portfolio Composition as of October 31, 2019(Unaudited)
| | | | |
| |
| New York | | | 14.8 | % |
| |
| California | | | 12.6 | |
| |
| Illinois | | | 10.1 | |
| |
| Texas | | | 7.8 | |
| |
| New Jersey | | | 3.8 | |
| |
| Puerto Rico | | | 3.6 | |
| |
| Florida | | | 3.0 | |
| |
| Connecticut | | | 2.7 | |
| |
| Georgia | | | 2.7 | |
| |
| Massachusetts | | | 2.6 | |
| |
| South Carolina | | | 2.6 | |
| |
| Michigan | | | 2.4 | |
| |
| Pennsylvania | | | 2.1 | |
| |
| Maryland | | | 2.0 | |
| |
| Iowa | | | 1.8 | |
| |
| Ohio | | | 1.8 | |
| |
| Colorado | | | 1.4 | |
| |
| Missouri | | | 1.4 | |
| |
| Nebraska | | | 1.4 | |
| |
| Utah | | | 1.2 | |
| |
| Virginia | | | 1.2 | |
| |
| Arizona | | | 1.1 | |
| |
| Wisconsin | | | 1.1 | |
| |
| Arkansas | | | 1.0 | |
| |
| Indiana | | | 1.0 | |
| |
| Oklahoma | | | 1.0 | |
| |
| U.S. Virgin Islands | | | 1.0 | |
| | | | |
| |
| Idaho | | | 0.9 | % |
| |
| Washington | | | 0.9 | |
| |
| Alabama | | | 0.8 | |
| |
| District of Columbia | | | 0.8 | |
| |
| Louisiana | | | 0.8 | |
| |
| Minnesota | | | 0.8 | |
| |
| Montana | | | 0.8 | |
| |
| North Dakota | | | 0.7 | |
| |
| Guam | | | 0.6 | |
| |
| Nevada | | | 0.6 | |
| |
| Tennessee | | | 0.6 | |
| |
| Rhode Island | | | 0.5 | |
| |
| Kansas | | | 0.3 | |
| |
| Oregon | | | 0.3 | |
| |
| South Dakota | | | 0.3 | |
| |
| Hawaii | | | 0.2 | |
| |
| Kentucky | | | 0.2 | |
| |
| New Mexico | | | 0.2 | |
| |
| Wyoming | | | 0.2 | |
| |
| Alaska | | | 0.1 | |
| |
| Mississippi | | | 0.1 | |
| |
| New Hampshire | | | 0.1 | |
| |
| North Carolina | | | 0.1 | |
| |
| West Virginia | | | 0.1 | |
| |
| Vermont | | | 0.0 | ‡ |
| |
| Other Assets, Less Liabilities | | | –0.2 | |
| | | | |
| | | 100.0 | % |
| | | | |
| ‡ | Less than one-tenth of a percent. |
See Portfolio of Investments beginning on page 11 for specific holdings within these categories. The Fund’s holdings are subject to change.
Top Ten Issuers Held as of October 31, 2019(excludingshort-term investment) (Unaudited)
| 1. | New York State Dormitory Authority, Sales Tax, Revenue Bonds, 5.00%, due 3/15/37–3/15/45 |
| 2. | Los Angeles Unified School District, Election 2008, Unlimited General Obligation, 5.25%, due 7/1/42 |
| 3. | New York City Transitional Finance Authority, Future Tax Secured, Revenue Bonds, 1.30%–5.25%, due 5/1/32–8/1/45 |
| 4. | State of Illinois, Unlimited General Obligation, 4.00%–5.00%, due 9/1/27–6/1/41 |
| 5. | City of New York NY, Unlimited General Obligation, 4.00%–5.25%, due 10/1/32–8/1/40 |
| 6. | South Carolina Public Service Authority, Revenue Bonds, 5.00%–5.25%, due 12/1/29–12/1/56 |
| 7. | Central Plains Energy, Project No. 3, Revenue Bonds, 5.00%–5.25%, due 9/1/32–9/1/42 |
| 8. | Commonwealth of Puerto Rico, Public Improvement, Unlimited General Obligation, 4.00%–6.00%, due 7/1/20–7/1/37 |
| 9. | PEFA, Inc., Revenue Bonds, 5.00%, due 9/1/49 |
| 10. | Burke County Development Authority, Georgia Power Co., Vogtle Project, Revenue Bonds, 1.40%–1.50%, due 7/1/49–11/1/52 |
| | |
| 8 | | MainStay MacKay Tax Free Bond Fund |
Portfolio Management Discussion and Analysis(Unaudited)
Questions answered by portfolio managers John Loffredo, CFA, Robert DiMella, CFA, Michael Petty, David Dowden, Scott Sprauer and Frances Lewis of MacKay Shields LLC, the Fund’s Subadvisor.
How did MainStay MacKay Tax Free Bond Fund perform relative to its benchmark and peer group during the 12 months ended October 31, 2019?
For the 12 months ended October 31, 2019, Class I shares of MainStay MacKay Tax Free Bond Fund returned 8.93%, underperforming the 9.42% return of the Fund’s primary benchmark, the Bloomberg Barclays Municipal Bond Index. Over the same period, Class I shares also underperformed the 10.04% return of the Morningstar Muni National Long Category Average.1
What factors affected the Fund’s relative performance during the reporting period?
During the reporting period, the high-yield segment of the municipal market outperformed the investment-grade segment. While demand for municipal income was strong across the yield curve,2 demand continued to be strongest among longer maturities leading to the outperformance of20- and30-year bonds. The demand for longer debt indicated that investors were willing to take on duration3 risk to acquire incremental yield. Performance inlong-end maturities outperformed theshort-end. While credit-specific performance in territory-issued bonds4 underperformed the overall municipal market, performance varied depending on the territory, with Illinois and Colorado bonds outperforming the overall municipal market and North Carolina and Wisconsin bonds underperforming.
The Fund’s overweight exposure to Illinois bonds contributed positively to relative performance due to optimism for a recovery in state fortunes, sparked by a positive court ruling, and the demand for the higher yields available on Illinois-related credits. (Contributions take weightings and total returns into account.) Bonds issued by New York and Puerto Rico also contributed positively to the Fund’s relative performance. Progress in the restructuring of Puerto Rico-issued debt continued, leading to strong outperformance of the various debt profiles from Puerto Rico issuers. In addition, the Fund’s allocation to longer maturity bonds, specifically 10 to 25 year, added to performance. Conversely, the Fund’s allocation to the state general obligation
sector detracted from relative performance, leading the Fund to underperform the Bloomberg Barclays Municipal Bond Index.
During the reporting period, how was the Fund’s performance materially affected by investments in derivatives?
During the reporting period, the Fund employed U.S. Treasury futures to maintain a neutral duration relative to the Bloomberg Barclays Municipal Bond Index. While these Treasury futures had a negative return, the hedge bolstered the Fund’s relative performance.
What was the Fund’s duration strategy during the reporting period?
During the reporting period, the Fund used Treasury futures to help remain within a tight band of the benchmark duration. As of October 31, 2019, the Fund’s modified duration to worst5 was 5.23 years, while the modified duration to worst of the Bloomberg Barclays Municipal Bond Index was 4.79 years.
During the reporting period, which sectors were the strongest positive contributors to the Fund’s relative performance and which sectors were particularly weak?
Relative to the Bloomberg Barclays Municipal Bond Index, the strongest positive sector contributors to the Fund’s performance included the special tax, leasing and local general obligation sectors. The weakest contributors were the state general obligation, hospital and transportation sectors. With regard to states and territories, bonds issued by Illinois, New York and Puerto Rico contributed positively to relative performance, while bonds issued by Texas, Massachusetts and Washington detracted. From a credit-rating perspective, bonds rated AA to BBB enhanced relative performance, whileAAA-rated securities detracted.6 Among maturities,10- to25-year maturities added to relative returns, while0- to10-year and25- to30-year maturities detracted.
| 1. | See page 5 for other share class returns, which may be higher or lower than Class I share returns. See page 6 for more information on benchmark and peer group returns. |
| 2. | The yield curve is a line that plots the yields of various securities of similar quality—typically U.S. Treasury issues—across a range of maturities. The U.S. Treasury yield curve serves as a benchmark for other debt and is used in economic forecasting. |
| 3. | Duration is a measure of the price sensitivity of a fixed-income investment to changes in interest rates. Duration is expressed as a number of years and is considered a more accurate sensitivity gauge than average maturity. |
| 4. | Territory-issued bonds are debt securities issued by a U.S. territory, such as Puerto Rice, which are exempt from federal income tax. |
| 5. | Modified duration is inversely related to the approximate percentage change in price for a given change in yield. Duration to worst is the duration of a bond computed using the bond’s nearest call date or maturity, whichever comes first. This measure ignores future cash flow fluctuations due to embedded optionality. |
| 6. | An obligation rated ‘AAA’ has the highest rating assigned by Standard & Poor’s (“S&P”), and in the opinion of S&P, the obligor’s capacity to meet its financial commitment on the obligation is extremely strong. When applied to Fund holdings, ratings are based solely on the creditworthiness of the bonds in the portfolio and are not meant to represent the security or safety of the Fund. An obligation rated ‘AA’ by S&P is deemed by S&P to differ from the highest-rated obligations only to a small degree. In the opinion of S&P, the obligor’s capacity to meet its financial commitment on the obligation is very strong. An obligation rated ‘BBB’ by S&P is deemed by S&P to exhibit adequate protection parameters. In the opinion of S&P, however, adverse economic conditions or changing circumstances are more likely to lead to a weakened capacity of the obligor to meet its financial commitment on the obligation. When applied to Fund holdings, ratings are based solely on the creditworthiness of the bonds in the portfolio and are not meant to represent the security or safety of the Fund. |
What were some of the Fund’s largest purchases and sales during the reporting period in terms of credit quality?
As credit spreads7 continued to narrow during the reporting period, we increased the Fund’s credit quality by adding toAAA-rated credits, while selling weaker A-rated8 toBBB-rated holdings. In addition, the Fund made purchases in the5- to15-year range and reduced its Treasury hedge.
How did the Fund’s sector weightings change during the reporting period?
The Fund’s largest increases in sector exposure during the reporting period were in the local general obligation, hospital and housing sectors. Over the same period, the Fund decreased its sector exposure to special tax and leasing. The Fund increased its exposure to Texas, Georgia and Florida, while
decreasing exposure to Puerto Rico, South Carolina and California. From a credit perspective, the Fund increased its exposure toAAA- andAA-rated credits. Among maturities, the Fund increased its exposure to20- to30-year maturities, while decreasing exposure to5- to15-year maturities.
How was the Fund positioned at the end of the reporting period?
As of October 31, 2019, the Fund held overweight positions relative to the Bloomberg Barclays Municipal Index in the special tax and housing sectors, and underweight positions in the state general obligations and transportation sectors. With regard to states and territories, the Fund held overweight positions in bonds from Illinois and Puerto Rico, and underweight positions in bonds from California and Texas.
| 7. | The terms “spread” and “yield spread” may refer to the difference in yield between a security or type of security and comparable U.S. Treasury issues. The terms may also refer to the difference in yield between two specific securities or types of securities at a given time. |
| 8. | An obligation rated ‘A’ by S&P is deemed by S&P to be somewhat more susceptible to the adverse effects of changes in circumstances and economic conditions than obligations in higher-rated categories. In the opinion of S&P, however, the obligor’s capacity to meet its financial commitment on the obligation is still strong. When applied to Fund holdings, ratings are based solely on the creditworthiness of the bonds in the portfolio and are not meant to represent the security or safety of the Fund. |
The opinions expressed are those of the portfolio managers as of the date of this report and are subject to change. There is no guarantee that any forecasts will come to pass. This material does not constitute investment advice and is not intended as an endorsement of any specific investment.
| | |
| 10 | | MainStay MacKay Tax Free Bond Fund |
Portfolio of InvestmentsOctober 31, 2019
| | | | | | | | |
| | | Principal
Amount | | | Value | |
Municipal Bonds 99.3%† Long-Term Municipal Bonds 92.6% | |
Alabama 0.8% | |
Black Belt Energy Gas District, Project No. 4, Revenue Bonds
Series A-1
4.00%, due 12/1/49 (a) | | $ | 15,000,000 | | | $ | 16,812,300 | |
City of Birmingham AL, Unlimited General Obligation
Series A
5.00%, due 3/1/43 | | | 4,150,000 | | | | 4,544,540 | |
City of Thomasville AL, Unlimited General Obligation | | | | | | | | |
Insured: BAM
5.00%, due 2/15/25 | | | 865,000 | | | | 1,002,639 | |
Insured: BAM
5.00%, due 2/15/26 | | | 915,000 | | | | 1,081,814 | |
Insured: BAM
5.00%, due 2/15/27 | | | 955,000 | | | | 1,148,693 | |
Insured: BAM
5.00%, due 2/15/28 | | | 250,000 | | | | 305,508 | |
Houston County Health Care Authority, Southeast Alabama Medical, Revenue Bonds
5.00%, due 10/1/25 | | | 1,000,000 | | | | 1,169,270 | |
University of South Alabama, Revenue Bonds | | | | | | | | |
Insured: AGM
4.00%, due 11/1/35 | | | 2,000,000 | | | | 2,217,540 | |
Insured: AGM
5.00%, due 11/1/29 | | | 1,110,000 | | | | 1,340,225 | |
Insured: AGM
5.00%, due 11/1/30 | | | 2,000,000 | | | | 2,404,040 | |
Water Works Board of the City of Birmingham, Revenue Bonds
Series B
5.00%, due 1/1/32 | | | 6,140,000 | | | | 7,409,629 | |
| | | | | | | | |
| | | | | | | 39,436,198 | |
| | | | | | | | |
Alaska 0.1% | |
Alaska Industrial Development & Export Authority, FairBanks Community Hospital, Revenue Bonds
5.00%, due 4/1/32 | | | 3,550,000 | | | | 3,868,613 | |
| | | | | | | | |
|
Arizona 1.1% | |
Arizona Health Facilities Authority, Phoenix Children’s Hospital, Revenue Bonds
Series A
5.00%, due 2/1/42 | | | 1,000,000 | | | | 1,063,570 | |
| | | | | | | | |
| | | Principal
Amount | | | Value | |
Arizona (continued) | | | | | | | | |
Arizona Industrial Development Authority, NCCU Properties LLC, Central University Project, Revenue Bonds
Series A, Insured: BAM
4.00%, due 6/1/44 | | $ | 940,000 | | | $ | 1,012,625 | |
Salt River Project Agricultural Improvement & Power District, Electric System, Revenue Bonds | | | | | | | | |
Series A
4.00%, due 1/1/40 | | | 10,310,000 | | | | 11,882,481 | |
Series A
4.00%, due 1/1/41 | | | 9,095,000 | | | | 10,444,698 | |
Salt River Project Agricultural Improvement & Power District, Revenue Bonds
Series A
5.00%, due 12/1/45 | | | 25,100,000 | | | | 29,112,737 | |
| | | | | | | | |
| | | | | | | 53,516,111 | |
| | | | | | | | |
Arkansas 1.0% | |
City of Fort Smith AR, Water & Sewer, Revenue Bonds | | | | | | | | |
Insured: BAM
5.00%, due 10/1/28 | | | 1,535,000 | | | | 1,884,059 | |
Insured: BAM
5.00%, due 10/1/29 | | | 1,075,000 | | | | 1,313,091 | |
Insured: BAM
5.00%, due 10/1/31 | | | 2,335,000 | | | | 2,827,405 | |
County of Pulaski AR, Arkansas Children’s Hospital, Revenue Bonds
5.00%, due 3/1/34 | | | 2,000,000 | | | | 2,363,460 | |
Pulaski County Special School District, Limited General Obligation
4.00%, due 2/1/48 | | | 15,500,000 | | | | 16,055,210 | |
Springdale Public Facilities Board, Arkansas Children’s Northwest, Revenue Bonds
5.00%, due 3/1/34 | | | 2,890,000 | | | | 3,431,355 | |
Springdale School District No. 50, Limited General Obligation | | | | | | | | |
4.00%, due 6/1/36 | | | 2,500,000 | | | | 2,623,100 | |
4.00%, due 6/1/40 | | | 11,000,000 | | | | 11,498,630 | |
University of Arkansas, UALR Campus, Revenue Bonds | | | | | | | | |
5.00%, due 10/1/29 | | | 1,315,000 | | | | 1,612,032 | |
5.00%, due 10/1/30 | | | 1,110,000 | | | | 1,353,889 | |
5.00%, due 10/1/31 | | | 1,205,000 | | | | 1,464,364 | |
| | | | | | | | |
| | | | | | | 46,426,595 | |
| | | | | | | | |
| | | | | | |
The notes to the financial statements are an integral part of,
and should be read in conjunction with, the financial statements. | | | | | 11 | |
Portfolio of InvestmentsOctober 31, 2019 (continued)
| | | | | | | | |
| | | Principal
Amount | | | Value | |
| Long-Term Municipal Bonds (continued) | |
California 12.6% | |
Alta Loma School District, Unlimited General Obligation
Series B
5.00%, due 8/1/44 | | $ | 4,000,000 | | | $ | 4,797,760 | |
Anaheim Union High School District, Unlimited General Obligation | | | | | | | | |
3.00%, due 8/1/33 | | | 3,725,000 | | | | 3,903,912 | |
3.00%, due 8/1/37 | | | 3,000,000 | | | | 3,084,870 | |
3.00%, due 8/1/38 | | | 3,000,000 | | | | 3,074,730 | |
3.00%, due 8/1/40 | | | 2,500,000 | | | | 2,547,500 | |
Antelope Valley Community College District, Election 2016, Unlimited General Obligation
Series A
4.50%, due 8/1/38 | | | 15,000,000 | | | | 17,296,650 | |
California Educational Facilities Authority, Prerefunded—University of San Francisco, Revenue Bonds
6.125%, due 10/1/30 | | | 745,000 | | | | 816,833 | |
California Educational Facilities Authority, Unrefunded—University of San Francisco, Revenue Bonds
6.125%, due 10/1/30 | | | 780,000 | | | | 855,995 | |
California Health Facilities Financing Authority, City of Hope Obligated Group, Revenue Bonds
5.00%, due 11/15/49 | | | 21,495,000 | | | | 25,483,182 | |
California Health Facilities Financing Authority, Providence St. Joseph Health, Revenue Bonds
Series A
4.00%, due 10/1/35 | | | 1,230,000 | | | | 1,369,224 | |
California Health Facilities Financing Authority, Sutter Health, Revenue Bonds
Series A
5.00%, due 11/15/41 | | | 5,000,000 | | | | 5,867,900 | |
California Municipal Finance Authority, Southern California Institute of Architecture Project, Revenue Bonds | | | | | | | | |
5.00%, due 12/1/22 | | | 390,000 | | | | 432,931 | |
5.00%, due 12/1/23 | | | 405,000 | | | | 462,713 | |
5.00%, due 12/1/24 | | | 425,000 | | | | 498,126 | |
5.00%, due 12/1/25 | | | 450,000 | | | | 539,073 | |
5.00%, due 12/1/26 | | | 470,000 | | | | 572,592 | |
5.00%, due 12/1/27 | | | 495,000 | | | | 614,483 | |
5.00%, due 12/1/28 | | | 520,000 | | | | 644,524 | |
California Municipal Finance Authority, West Village Student Housing Project, Revenue Bonds | | | | | | | | |
Insured: BAM
5.00%, due 5/15/32 | | | 5,900,000 | | | | 7,331,576 | |
| | | | | | | | |
| | | Principal
Amount | | | Value | |
California (continued) | | | | | | | | |
California Municipal Finance Authority, West Village Student Housing Project, Revenue Bonds (continued) | | | | | | | | |
5.00%, due 5/15/32 | | $ | 1,570,000 | | | $ | 1,930,598 | |
Insured: BAM
5.00%, due 5/15/39 | | | 9,815,000 | | | | 11,959,283 | |
Insured: BAM
5.00%, due 5/15/43 | | | 11,750,000 | | | | 14,183,072 | |
California School Facilities Financing Authority, Azusa Unified School District, Revenue Bonds
Insured: AGM
(zero coupon), due 8/1/49 | | | 16,000,000 | | | | 4,971,200 | |
California State Educational Facilities Authority, Sutter Health, Revenue Bonds
Series A
5.00%, due 11/15/34 | | | 5,000,000 | | | | 5,983,400 | |
California State, Unlimited General Obligation
3.00%, due 10/1/37 | | | 1,240,000 | | | | 1,297,226 | |
California Statewide Communities Development Authority, Cottage Health Obligation Group, Revenue Bonds
5.25%, due 11/1/30 | | | 1,475,000 | | | | 1,531,920 | |
Chula Vista Elementary School District, Unlimited General Obligation
(zero coupon), due 8/1/23 | | | 5,000,000 | | | | 4,789,250 | |
City of Escondido CA, Unlimited General Obligation
5.00%, due 9/1/36 | | | 5,000,000 | | | | 5,949,050 | |
City of Long Beach CA, Airport System, Revenue Bonds
Series A
5.00%, due 6/1/30 | | | 5,000,000 | | | | 5,109,400 | |
City of Los Angeles CA, Wastewater System Revenue, Revenue Bonds Subseries A
5.00%, due 6/1/43 | | | 10,000,000 | | | | 12,314,900 | |
City of Richmond CA, Wastewater Revenue, Revenue Bonds
Series A
5.25%, due 8/1/47 | | | 10,530,000 | | | | 12,820,380 | |
City of San Jose CA, Unlimited General Obligation
Series A-1
5.00%, due 9/1/41 | | | 3,000,000 | | | | 3,773,700 | |
Coachella Valley Unified School District, Election 2005, Unlimited General Obligation
Series F, Insured: BAM
5.00%, due 8/1/46 | | | 12,385,000 | | | | 14,561,416 | |
| | | | |
| 12 | | MainStay MacKay Tax Free Bond Fund | | The notes to the financial statements are an integral part of,
and should be read in conjunction with, the financial statements. |
| | | | | | | | |
| | | Principal
Amount | | | Value | |
| Long-Term Municipal Bonds (continued) | |
California (continued) | | | | | | | | |
Coast Community College District, Election 2012, Unlimited General Obligation
Series D
4.50%, due 8/1/39 | | $ | 20,000,000 | | | $ | 23,501,800 | |
Compton Unified School District, Certificates of Participation | | | | | | | | |
Series A, Insured: BAM
5.00%, due 6/1/31 | | | 250,000 | | | | 302,998 | |
Series A, Insured: BAM
5.00%, due 6/1/32 | | | 500,000 | | | | 603,160 | |
Compton Unified School District, Unlimited General Obligation | | | | | | | | |
Series B, Insured: BAM
(zero coupon), due 6/1/37 | | | 1,125,000 | | | | 662,715 | |
Series B, Insured: BAM
(zero coupon), due 6/1/38 | | | 1,250,000 | | | | 711,375 | |
Series B, Insured: BAM
(zero coupon), due 6/1/39 | | | 1,340,000 | | | | 734,722 | |
Series B, Insured: BAM
(zero coupon), due 6/1/40 | | | 1,500,000 | | | | 791,775 | |
Series B, Insured: BAM
(zero coupon), due 6/1/41 | | | 1,750,000 | | | | 888,580 | |
Cotati-Rohnert Park Unified School District, Unlimited General Obligation
Series C, Insured: AGM
5.00%, due 8/1/42 | | | 2,865,000 | | | | 3,378,150 | |
El Monte Union High School District, Unlimited General Obligation
Series A
5.00%, due 6/1/49 | | | 12,390,000 | | | | 14,839,999 | |
Etiwanda School District, Election 2016, Unlimited General Obligation
Series A
5.00%, due 8/1/46 | | | 5,725,000 | | | | 6,850,821 | |
Firebaugh-Las Deltas Unified School District, Election 2016, Unlimited General Obligation
Series A, Insured: AGM
5.25%, due 8/1/41 | | | 3,000,000 | | | | 3,682,140 | |
Fontana Public Finance Authority, Revenue Bonds
Series A, Insured: BAM
5.00%, due 9/1/32 | | | 2,640,000 | | | | 3,021,190 | |
Fontana Unified School District, Unlimited General Obligation | | | | | | | | |
Series C
(zero coupon), due 8/1/35 | | | 14,800,000 | | | | 7,056,936 | |
Series C
(zero coupon), due 8/1/36 | | | 15,500,000 | | | | 6,861,695 | |
| | | | | | | | |
| | | Principal
Amount | | | Value | |
California (continued) | | | | | | | | |
Fresno Unified School District, Election 2001, Unlimited General Obligation | | | | | | | | |
Series G
(zero coupon), due 8/1/32 | | $ | 6,000,000 | | | $ | 2,780,100 | |
Series G
(zero coupon), due 8/1/33 | | | 10,000,000 | | | | 4,305,000 | |
Series G
(zero coupon), due 8/1/41 | | | 23,485,000 | | | | 5,791,166 | |
Golden State Tobacco Securitization Corp., Asset-Backed, Revenue Bonds
Series A, Insured: AGM
5.00%, due 6/1/40 | | | 5,410,000 | | | | 6,240,651 | |
Golden State Tobacco Securitization Corp., Revenue Bonds
Series A-1
5.00%, due 6/1/33 | | | 12,545,000 | | | | 14,951,633 | |
Jurupa Unified School District, Unlimited General Obligation
Series C
5.25%, due 8/1/43 | | | 5,500,000 | | | | 6,965,585 | |
Live Oak Elementary School District, Certificates of Participation Insured: AGM
5.00%, due 8/1/39 | | | 3,205,000 | | | | 3,763,696 | |
Los Angeles County Metropolitan Transportation Authority, Sales Tax, Revenue Bonds
Series A
5.00%, due 7/1/44 | | | 18,530,000 | | | | 22,905,674 | |
Los Angeles County Public Works Financing Authority, Revenue Bonds | | | | | | | | |
Series E-1
5.00%, due 12/1/44 | | | 13,000,000 | | | | 16,271,970 | |
Series E-1
5.00%, due 12/1/49 | | | 4,605,000 | | | | 5,748,652 | |
Los Angeles Department of Water & Power, Revenue Bonds
Series A
5.00%, due 7/1/33 | | | 16,480,000 | | | | 19,367,131 | |
Los Angeles Unified School District, Election 2008, Unlimited General Obligation
Series B-1
5.25%, due 7/1/42 | | | 85,000,000 | | | | 105,473,100 | |
Napa Valley Unified School District, Unlimited General Obligation
Series C, Insured: AGM
4.00%, due 8/1/44 | | | 20,000,000 | | | | 22,058,000 | |
Oakland Unified School District, Alameda County, Unlimited General Obligation | | | | | | | | |
Insured: AGM
5.00%, due 8/1/27 | | | 1,160,000 | | | | 1,392,592 | |
| | | | | | |
The notes to the financial statements are an integral part of,
and should be read in conjunction with, the financial statements. | | | | | 13 | |
Portfolio of InvestmentsOctober 31, 2019 (continued)
| | | | | | | | |
| | | Principal
Amount | | | Value | |
| Long-Term Municipal Bonds (continued) | |
California (continued) | | | | | | | | |
Oakland Unified School District, Alameda County, Unlimited General Obligation (continued) | | | | | | | | |
Insured: AGM
5.00%, due 8/1/28 | | $ | 1,755,000 | | | $ | 2,098,331 | |
Insured: AGM
5.00%, due 8/1/29 | | | 2,535,000 | | | | 3,030,922 | |
Oceanside Unified School District, Unrefunded Election 2008, Unlimited General Obligation
Series B, Insured: AGM
(zero coupon), due 8/1/49 | | | 560,000 | | | | 75,124 | |
Paramount Unified School District, Unlimited General Obligation Insured: BAM
(zero coupon), due 8/1/43 | | | 25,000,000 | | | | 6,132,000 | |
Pomona Unified School District, Election 2008, Unlimited General Obligation
Series E, Insured: AGM
5.00%, due 8/1/30 | | | 3,285,000 | | | | 3,604,532 | |
Richmond Joint Powers Financing Authority, Civic Center Project, Revenue Bonds
Series A, Insured: AGM
5.00%, due 11/1/37 | | | 3,660,000 | | | | 4,662,803 | |
Riverside Community College District, Unlimited General Obligation
4.00%, due 8/1/34 | | | 3,700,000 | | | | 4,357,823 | |
Riverside County Redevelopment Successor Agency, Jurupa Valley Project, Tax Allocation | | | | | | | | |
Series B, Insured: BAM
5.00%, due 10/1/29 | | | 875,000 | | | | 1,055,093 | |
Series B, Insured: BAM
5.00%, due 10/1/30 | | | 2,645,000 | | | | 3,176,063 | |
San Bernardino City Unified School District, Election 2012, Unlimited General Obligation
Series A, Insured: AGM
5.00%, due 8/1/30 | | | 1,000,000 | | | | 1,130,990 | |
San Diego Association of Governments, South Bay Expressway, Senior Lien, Revenue Bonds | | | | | | | | |
Series A
5.00%, due 7/1/30 | | | 2,475,000 | | | | 3,078,009 | |
Series A
5.00%, due 7/1/32 | | | 1,800,000 | | | | 2,223,432 | |
Series A
5.00%, due 7/1/38 | | | 1,150,000 | | | | 1,395,824 | |
| | | | | | | | |
| | | Principal
Amount | | | Value | |
California (continued) | | | | | | | | |
San Diego Public Facilities Financing Authority, Capital Improvement Projects, Revenue Bonds
Series A
5.00%, due 10/15/44 | | $ | 3,000,000 | | | $ | 3,526,410 | |
San Diego Unified School District, Unlimited General Obligation | | | | | | | | |
Series C-2
4.00%, due 7/1/35 | | | 2,000,000 | | | | 2,350,940 | |
Series C-2
4.00%, due 7/1/36 | | | 1,250,000 | | | | 1,462,525 | |
Series C-2
4.00%, due 7/1/39 | | | 1,345,000 | | | | 1,555,842 | |
San Marcos School Financing Authority, Revenue Bonds | | | | | | | | |
Insured: AGM
5.00%, due 8/15/33 | | | 500,000 | | | | 615,765 | |
Insured: AGM
5.00%, due 8/15/34 | | | 1,000,000 | | | | 1,225,610 | |
Insured: AGM
5.00%, due 8/15/35 | | | 1,000,000 | | | | 1,222,540 | |
Insured: AGM
5.00%, due 8/15/36 | | | 1,100,000 | | | | 1,339,767 | |
Santa Clara Valley Transportation Authority, Revenue Bonds
Series A
5.00%, due 4/1/35 | | | 3,900,000 | | | | 4,587,921 | |
Santa Clara Valley Water District, Revenue Bonds
Series A
5.00%, due 6/1/49 | | | 2,865,000 | | | | 3,434,304 | |
Simi Valley Unified School District, Election 2016, Unlimited General Obligation | | | | | | | | |
Series A
5.00%, due 8/1/38 | | | 1,000,000 | | | | 1,226,150 | |
Series A
5.00%, due 8/1/39 | | | 1,000,000 | | | | 1,223,550 | |
Series A
5.00%, due 8/1/40 | | | 1,195,000 | | | | 1,455,223 | |
Solano County Community College District, Election 2012, Unlimited General Obligation
Series C
5.25%, due 8/1/42 | | | 16,460,000 | | | | 20,301,270 | |
Southern California Public Power Authority, Apex Power Project, Revenue Bonds
Series A
5.00%, due 7/1/33 | | | 4,500,000 | | | | 5,237,460 | |
State of California, Unlimited General Obligation | | | | | | | | |
5.25%, due 10/1/39 | | | 5,635,000 | | | | 6,807,305 | |
6.25%, due 11/1/34 | | | 4,000,000 | | | | 4,000,000 | |
| | | | |
| 14 | | MainStay MacKay Tax Free Bond Fund | | The notes to the financial statements are an integral part of,
and should be read in conjunction with, the financial statements. |
| | | | | | | | |
| | | Principal
Amount | | | Value | |
| Long-Term Municipal Bonds (continued) | |
California (continued) | | | | | | | | |
Susanville, Natural Gas Enterprise Refunding Project, Revenue Bonds Insured: AGM
4.00%, due 6/1/45 | | $ | 2,000,000 | | | $ | 2,250,880 | |
Tahoe-Truckee Unified School District, Unlimited General Obligation
Series B
5.00%, due 8/1/41 | | | 2,200,000 | | | | 2,622,312 | |
Twin Rivers Unified School District, Unrefunded Election 2006, Unlimited General Obligation
Insured: AGM
(zero coupon), due 8/1/32 | | | 5,120,000 | | | | 3,781,120 | |
University of California, Revenue Bonds | | | | | | | | |
Series AV
5.00%, due 5/15/42 | | | 1,725,000 | | | | 2,096,116 | |
Series AZ
5.00%, due 5/15/43 | | | 2,500,000 | | | | 3,078,425 | |
Westminster School District, Election 2008, Unlimited General Obligation
Series B, Insured: BAM
(zero coupon), due 8/1/48 | | | 13,900,000 | | | | 2,362,305 | |
Winters Joint Unified School District, Unlimited General Obligation
Series B, Insured: BAM
5.00%, due 8/1/46 | | | 1,400,000 | | | | 1,664,012 | |
| | | | | | | | |
| | | | | | | 608,721,073 | |
| | | | | | | | |
Colorado 1.4% | |
Adams State University, Revenue Bonds | | | | | | | | |
Series A
4.00%, due 5/15/37 | | | 750,000 | | | | 855,690 | |
Series A
4.00%, due 5/15/39 | | | 1,085,000 | | | | 1,230,509 | |
Series A
4.00%, due 5/15/42 | | | 1,500,000 | | | | 1,688,655 | |
City of Colorado Springs CO, Utilities System, Revenue Bonds | | | | | | | | |
Series A-2
4.00%, due 11/15/32 | | | 530,000 | | | | 614,530 | |
Series A-4
4.00%, due 11/15/32 | | | 855,000 | | | | 991,364 | |
Series A-2
4.00%, due 11/15/33 | | | 600,000 | | | | 694,122 | |
Series A-4
4.00%, due 11/15/33 | | | 700,000 | | | | 809,809 | |
Series A-2
4.00%, due 11/15/34 | | | 430,000 | | | | 496,160 | |
Series A-4
4.00%, due 11/15/34 | | | 900,000 | | | | 1,038,474 | |
| | | | | | | | |
| | | Principal
Amount | | | Value | |
Colorado (continued) | | | | | | | | |
City of Colorado Springs CO, Utilities System, Revenue Bonds (continued) | | | | | | | | |
Series A-2
4.00%, due 11/15/35 | | $ | 385,000 | | | $ | 441,206 | |
Series A-4
4.00%, due 11/15/35 | | | 740,000 | | | | 848,033 | |
Colorado Health Facilities Authority, CommonSpirit Health Obligated Group, Revenue Bonds | | | | | | | | |
Series A-1
4.00%, due 8/1/39 | | | 1,000,000 | | | | 1,087,170 | |
Series A-2
5.00%, due 8/1/37 | | | 2,000,000 | | | | 2,404,360 | |
Series A-2
5.00%, due 8/1/38 | | | 1,500,000 | | | | 1,797,855 | |
Series A-2
5.00%, due 8/1/39 | | | 1,000,000 | | | | 1,194,600 | |
Colorado State Housing & Finance Authority, Revenue Bonds
Series C, Insured: GNMA
4.25%, due 11/1/48 | | | 5,875,000 | | | | 6,433,595 | |
Denver City & County Airport Revenue
Series A
5.00%, due 12/1/25 (b) | | | 5,370,000 | | | | 6,412,371 | |
Denver Convention Center Hotel Authority, Revenue Bonds | | | | | | | | |
5.00%, due 12/1/30 | | | 1,305,000 | | | | 1,526,041 | |
5.00%, due 12/1/31 | | | 1,395,000 | | | | 1,624,449 | |
5.00%, due 12/1/32 | | | 2,500,000 | | | | 2,898,200 | |
5.00%, due 12/1/36 | | | 1,000,000 | | | | 1,149,500 | |
Rampart Range Metropolitan District No. 1, Revenue Bonds
Insured: AGM
5.00%, due 12/1/42 | | | 10,055,000 | | | | 12,011,703 | |
Regional Transportation District, Certificates of Participation
Series A
4.50%, due 6/1/44 | | | 15,500,000 | | | | 16,646,070 | |
South Suburban Park & Recreation District, Unlimited General Obligation | | | | | | | | |
4.00%, due 12/15/36 | | | 950,000 | | | | 1,095,986 | |
4.00%, due 12/15/38 | | | 1,140,000 | | | | 1,304,810 | |
Vista Ridge Metropolitan District, Unlimited General Obligation
Series A, Insured: BAM
5.00%, due 12/1/31 | | | 1,250,000 | | | | 1,469,800 | |
| | | | | | | | |
| | | | | | | 68,765,062 | |
| | | | | | | | |
Connecticut 2.7% | |
City of Bridgeport CT, Unlimited General Obligation | | | | | | | | |
Series D, Insured: AGM
5.00%, due 8/15/33 | | | 3,090,000 | | | | 3,656,119 | |
| | | | | | |
The notes to the financial statements are an integral part of,
and should be read in conjunction with, the financial statements. | | | | | 15 | |
Portfolio of InvestmentsOctober 31, 2019 (continued)
| | | | | | | | |
| | | Principal
Amount | | | Value | |
| Long-Term Municipal Bonds (continued) | |
Connecticut (continued) | | | | | | | | |
City of Bridgeport CT, Unlimited General Obligation (continued) | | | | | | | | |
Series D, Insured: AGM
5.00%, due 8/15/34 | | $ | 3,090,000 | | | $ | 3,644,871 | |
Series D, Insured: AGM
5.00%, due 8/15/35 | | | 3,090,000 | | | | 3,632,511 | |
Series D, Insured: AGM
5.00%, due 8/15/36 | | | 3,090,000 | | | | 3,620,491 | |
City of Hartford CT, Unlimited General Obligation | | | | | | | | |
Series A
5.00%, due 4/1/28 | | | 2,500,000 | | | | 2,689,250 | |
Series C, Insured: AGM
5.00%, due 7/15/32 | | | 7,470,000 | | | | 8,705,239 | |
Series C, Insured: AGM
5.00%, due 7/15/34 | | | 2,500,000 | | | | 2,903,700 | |
City of Hartford CT, Unrefunded, Unlimited General Obligation | | | | | | | | |
Series A
5.00%, due 4/1/29 | | | 895,000 | | | | 963,638 | |
Series A, Insured: AGM
5.00%, due 4/1/32 | | | 195,000 | | | | 209,600 | |
Connecticut Housing Finance Authority, Housing Mortgage Finance Program, Revenue Bonds
Series D-1
4.00%, due 11/15/49 | | | 10,000,000 | | | | 11,170,600 | |
Connecticut Housing Finance Authority, Revenue Bonds
Subseries B-1
3.55%, due 11/15/33 | | | 7,000,000 | | | | 7,444,640 | |
Connecticut State Health & Educational Facility Authority, Quinnipiac University, Revenue Bonds
Series L
5.00%, due 7/1/32 | | | 10,425,000 | | | | 12,096,440 | |
Connecticut State Housing Finance Authority, Revenue Bonds | | | | | | | | |
Subseries C-1
4.00%, due 11/15/45 | | | 5,710,000 | | | | 6,221,216 | |
Series B-1
4.00%, due 5/15/49 | | | 2,800,000 | | | | 3,117,072 | |
State of Connecticut Special Tax, Transportation Infrastructure, Revenue Bonds | | | | | | | | |
Series A
5.00%, due 9/1/30 | | | 5,000,000 | | | | 5,751,550 | |
Series A, Insured: BAM
5.00%, due 9/1/31 | | | 14,470,000 | | | | 17,469,342 | |
Series A
5.00%, due 9/1/33 | | | 13,000,000 | | | | 15,532,140 | |
| | | | | | | | |
| | | Principal
Amount | | | Value | |
Connecticut (continued) | | | | | | | | |
State of Connecticut, Unlimited General Obligation
Series F
5.00%, due 9/15/28 | | $ | 12,810,000 | | | $ | 16,133,042 | |
University of Connecticut, Revenue Bonds | | | | | | | | |
Series A
5.00%, due 11/1/33 | | | 2,000,000 | | | | 2,470,440 | |
Series A
5.00%, due 11/1/35 | | | 3,990,000 | | | | 4,898,204 | |
| | | | | | | | |
| | | | | | | 132,330,105 | |
| | | | | | | | |
District of Columbia 0.8% | |
District of Columbia, Bryant Street Project, Tax Allocation | | | | | | | | |
4.00%, due 6/1/39 | | | 2,370,000 | | | | 2,667,245 | |
4.00%, due 6/1/43 | | | 2,035,000 | | | | 2,269,025 | |
District of Columbia, Friendship Public Charter School, Inc., Revenue Bonds
5.00%, due 6/1/42 | | | 5,500,000 | | | | 5,855,850 | |
District of Columbia, Gallery Place Project, Tax Allocation
5.00%, due 6/1/27 | | | 525,000 | | | | 554,148 | |
District of Columbia, KIPP Charter School, Revenue Bonds
6.00%, due 7/1/48 | | | 1,575,000 | | | | 1,845,995 | |
Metropolitan Washington Airports Authority Dulles Toll Road, Revenue Bonds (c) | | | | | | | | |
Series C, Insured: AGC
6.50%, due 10/1/41 | | | 8,000,000 | | | | 10,364,160 | |
Series B
6.50%, due 10/1/44 | | | 7,140,000 | | | | 9,517,120 | |
Washington Metropolitan Area Transit Authority, Revenue Bonds
Series B
5.00%, due 7/1/35 | | | 4,910,000 | | | | 5,984,701 | |
| | | | | | | | |
| | | | | | | 39,058,244 | |
| | | | | | | | |
Florida 2.6% | |
City of Miami Beach FL Parking, Revenue Bonds
Insured: BAM
5.00%, due 9/1/40 | | | 2,500,000 | | | | 2,921,225 | |
City of Orlando FL, Unrefunded Third Lien, Tourist Development Tax, Revenue Bonds
Insured: AGC
5.50%, due 11/1/38 | | | 4,015,000 | | | | 4,027,005 | |
County of Miami-Dade FL Aviation, Revenue Bonds
5.00%, due 10/1/31 | | | 750,000 | | | | 904,373 | |
| | | | |
| 16 | | MainStay MacKay Tax Free Bond Fund | | The notes to the financial statements are an integral part of,
and should be read in conjunction with, the financial statements. |
| | | | | | | | |
| | | Principal
Amount | | | Value | |
| Long-Term Municipal Bonds (continued) | |
Florida (continued) | |
County of Miami-Dade Florida Water & Sewer System, Revenue Bonds | | | | | | | | |
Series A
4.00%, due 10/1/44 | | $ | 9,500,000 | | | $ | 10,554,120 | |
Series B
5.00%, due 10/1/31 | | | 10,000,000 | | | | 11,856,000 | |
5.00%, due 10/1/43 | | | 7,250,000 | | | | 8,876,537 | |
Florida Governmental Utility Authority, Revenue Bonds | | | | | | | | |
Insured: AGM
4.00%, due 10/1/37 | | | 1,375,000 | | | | 1,588,703 | |
Insured: AGM
4.00%, due 10/1/39 | | | 1,400,000 | | | | 1,608,684 | |
Florida Housing Finance Corp., Revenue Bonds
Insured: GNMA/FNMA/FHLMC
4.00%, due 7/1/49 | | | 2,750,000 | | | | 2,982,567 | |
Florida Keys Aqueduct Authority, Revenue Bonds | | | | | | | | |
Series A
5.00%, due 9/1/41 | | | 2,750,000 | | | | 3,198,140 | |
Series A
5.00%, due 9/1/49 | | | 9,000,000 | | | | 10,375,650 | |
JEA Electric System, Revenue Bonds
Series B
4.00%, due 10/1/36 | | | 4,500,000 | | | | 5,053,860 | |
Orange County Health Facilities Authority, Presbyterian Retirement Communities, Revenue Bonds
5.00%, due 8/1/31 | | | 1,500,000 | | | | 1,681,635 | |
Palm Beach County Health Facilities Authority, Baptist Health South Florida Obligated Group, Revenue Bonds
3.00%, due 8/15/44 | | | 2,475,000 | | | | 2,446,760 | |
Pasco County FL, Fire-Rescue Projects, Unlimited General Obligation
Series B-2
5.00%, due 10/1/48 | | | 1,880,000 | | | | 2,311,272 | |
Putnam County Development Authority, Revenue Bonds
Series A
5.00%, due 3/15/42 | | | 5,000,000 | | | | 5,945,050 | |
South Miami Health Facilities Authority, Baptist Health South Florida, Revenue Bonds
5.00%, due 8/15/42 | �� | | 20,000,000 | | | | 23,617,200 | |
West Palm Beach Community Redevelopment Agency, City Center Community Redevelopment Area, Tax Allocation | | | | | | | | |
5.00%, due 3/1/34 | | | 10,100,000 | | | | 12,621,869 | |
5.00%, due 3/1/35 | | | 10,620,000 | | | | 13,235,600 | |
| | | | | | | | |
| | | | | | | 125,806,250 | |
| | | | | | | | |
| | | | | | | | |
| | | Principal
Amount | | | Value | |
Georgia 1.3% | |
Brookhaven Development Authority, Children’s Healthcare of Atlanta, Revenue Bonds | | | | | | | | |
Series A
5.00%, due 7/1/32 | | $ | 1,550,000 | | | $ | 1,987,968 | |
Series A
5.00%, due 7/1/33 | | | 1,380,000 | | | | 1,755,263 | |
Series A
5.00%, due 7/1/35 | | | 1,900,000 | | | | 2,395,767 | |
Series A
5.00%, due 7/1/36 | | | 2,850,000 | | | | 3,577,406 | |
Series A
5.00%, due 7/1/37 | | | 2,800,000 | | | | 3,495,772 | |
Series A
5.00%, due 7/1/38 | | | 2,250,000 | | | | 2,800,305 | |
Series A
5.00%, due 7/1/39 | | | 1,300,000 | | | | 1,613,833 | |
Dalton GA, Board of Water Light & Sinking Fund Commissioners, Revenue Bonds
5.00%, due 3/1/30 | | | 2,055,000 | | | | 2,471,322 | |
DeKalb County Water & Sewer Revenue, Revenue Bonds
Series A
5.25%, due 10/1/41 | | | 7,500,000 | | | | 8,030,400 | |
Fulton County Development Authority, Piedmont Healthcare, Inc. Project, Revenue Bonds | | | | | | | | |
Series A
4.00%, due 7/1/37 | | | 2,200,000 | | | | 2,475,638 | |
Series A
4.00%, due 7/1/38 | | | 1,750,000 | | | | 1,959,773 | |
Series A
4.00%, due 7/1/39 | | | 2,500,000 | | | | 2,785,600 | |
Series A
5.00%, due 7/1/36 | | | 3,000,000 | | | | 3,711,840 | |
Gwinnett County School District, Unlimited General Obligation
5.00%, due 2/1/41 | | | 11,410,000 | | | | 14,371,465 | |
Main Street Natural Gas, Inc., Revenue Bonds | | | | | | | | |
Series A
5.00%, due 5/15/35 | | | 3,000,000 | | | | 3,893,460 | |
Series A
5.00%, due 5/15/36 | | | 3,700,000 | | | | 4,831,053 | |
Municipal Electric Authority of Georgia, Plant Vogtle Units 3 & 4 Project, Revenue Bonds | | | | | | | | |
Series A
5.00%, due 1/1/37 | | | 1,000,000 | | | | 1,189,970 | |
Series A
5.00%, due 1/1/38 | | | 1,000,000 | | | | 1,185,680 | |
| | | | | | | | |
| | | | | | | 64,532,515 | |
| | | | | | | | |
| | | | | | |
The notes to the financial statements are an integral part of,
and should be read in conjunction with, the financial statements. | | | | | 17 | |
Portfolio of InvestmentsOctober 31, 2019 (continued)
| | | | | | | | |
| | | Principal
Amount | | | Value | |
| Long-Term Municipal Bonds (continued) | |
Guam 0.6% | |
Antonio B Won Pat International Airport Authority, Revenue Bonds
Series C, Insured: AGM
6.125%, due 10/1/43 (b) | | $ | 5,000,000 | | | $ | 5,804,050 | |
Guam Government, Waterworks Authority, Revenue Bonds | | | | | | | | |
5.00%, due 7/1/36 | | | 1,750,000 | | | | 2,008,615 | |
5.00%, due 1/1/46 | | | 2,500,000 | | | | 2,823,750 | |
Guam Power Authority, Revenue Bonds | | | | | | | | |
Series A, Insured: AGM
5.00%, due 10/1/30 | | | 5,610,000 | | | | 6,139,023 | |
Series A, Insured: AGM
5.00%, due 10/1/44 | | | 655,000 | | | | 736,371 | |
Territory of Guam, Revenue Bonds | | | | | | | | |
Series A
5.125%, due 1/1/42 | | | 3,085,000 | | | | 3,225,553 | |
Series A
6.50%, due 11/1/40 | | | 2,700,000 | | | | 2,872,206 | |
Territory of Guam, Section 30, Revenue Bonds | | | | | | | | |
Series A
5.00%, due 12/1/27 | | | 2,265,000 | | | | 2,651,250 | |
Series A
5.00%, due 12/1/34 | | | 2,290,000 | | | | 2,615,913 | |
| | | | | | | | |
| | | | | | | 28,876,731 | |
| | | | | | | | |
Hawaii 0.2% | |
City & County of Honolulu HI, Unlimited General Obligation | | | | | | | | |
Series C
5.00%, due 8/1/42 | | | 1,500,000 | | | | 1,874,940 | |
Series C
5.00%, due 8/1/44 | | | 2,000,000 | | | | 2,489,500 | |
State of Hawaii Department of Budget & Finance, Hawaiian Electric Co., Inc, Revenue Bonds
3.50%, due 10/1/49 (b) | | | 7,000,000 | | | | 7,040,250 | |
| | | | | | | | |
| | | | | | | 11,404,690 | |
| | | | | | | | |
Idaho 0.9% | |
Idaho Housing & Finance Association, Federal Highway Trust Fund, Revenue Bonds | | | | | | | | |
Series A
5.00%, due 7/15/36 | | | 16,920,000 | | | | 21,234,938 | |
Series A
5.00%, due 7/15/37 | | | 10,000,000 | | | | 12,501,700 | |
Idaho Housing & Finance Association, Revenue Bonds | | | | | | | | |
Series B, Insured: GNMA
4.00%, due 4/21/49 | | | 4,957,554 | | | | 5,249,851 | |
Series A, Insured: GNMA
4.50%, due 1/21/49 | | | 5,247,097 | | | | 5,595,924 | |
| | | | | | | | |
| | | | | | | 44,582,413 | |
| | | | | | | | |
| | | | | | | | |
| | | Principal
Amount | | | Value | |
Illinois 10.1% | |
Carol Stream Park District, Unlimited General Obligation
Insured: BAM
5.00%, due 1/1/37 | | $ | 3,985,000 | | | $ | 4,653,882 | |
Chicago Board of Education, School Reform, Unlimited General Obligation
Series A, Insured: NATL-RE
(zero coupon), due 12/1/26 | | | 19,995,000 | | | | 16,480,679 | |
Chicago Board of Education, Special Tax
6.00%, due 4/1/46 | | | 19,485,000 | | | | 23,278,924 | |
Chicago Board of Education, Unlimited General Obligation | | | | | | | | |
Series A, Insured: AGM
5.00%, due 12/1/27 | | | 8,250,000 | | | | 9,911,302 | |
Series A, Insured: AGM
5.50%, due 12/1/39 | | | 11,455,000 | | | | 12,269,680 | |
Chicago Park District, Limited General Obligation | | | | | | | | |
Series A
5.00%, due 1/1/28 | | | 1,000,000 | | | | 1,158,260 | |
Series B, Insured: BAM
5.00%, due 1/1/29 | | | 2,500,000 | | | | 2,801,350 | |
Series A
5.00%, due 1/1/29 | | | 750,000 | | | | 865,140 | |
Series A
5.00%, due 1/1/31 | | | 1,000,000 | | | | 1,143,280 | |
Series A
5.00%, due 1/1/35 | | | 2,000,000 | | | | 2,260,360 | |
Chicago Transit Authority, Second Lien, Revenue Bonds
5.00%, due 12/1/46 | | | 10,000,000 | | | | 11,329,100 | |
Chicago, Unlimited General Obligation
Series A
6.00%, due 1/1/38 | | | 20,000,000 | | | | 23,748,000 | |
City of Chicago IL Motor Fuel Tax, Revenue Bonds
Insured: AGM
5.00%, due 1/1/33 | | | 4,725,000 | | | | 5,208,415 | |
City of Chicago IL, Unlimited General Obligation | | | | | | | | |
Series A, Insured: AGM
5.00%, due 1/1/26 | | | 10,000,000 | | | | 10,067,900 | |
Series A, Insured: BAM
6.00%, due 1/1/38 | | | 6,000,000 | | | | 7,389,780 | |
City of Chicago IL, Wastewater Transmission, Revenue Bonds | | | | | | | | |
5.00%, due 1/1/28 | | | 1,000,000 | | | | 1,116,060 | |
Series B, Insured: AGM
5.00%, due 1/1/30 | | | 7,585,000 | | | | 9,045,871 | |
5.00%, due 1/1/33 | | | 2,000,000 | | | | 2,202,940 | |
5.00%, due 1/1/39 | | | 8,420,000 | | | | 9,192,535 | |
| | | | |
| 18 | | MainStay MacKay Tax Free Bond Fund | | The notes to the financial statements are an integral part of,
and should be read in conjunction with, the financial statements. |
| | | | | | | | |
| | | Principal
Amount | | | Value | |
| Long-Term Municipal Bonds (continued) | |
Illinois (continued) | |
City of Chicago IL, Wastewater Transmission, Revenue Bonds (continued) | | | | | | | | |
5.00%, due 1/1/44 | | $ | 13,840,000 | | | $ | 15,091,690 | |
Series A, Insured: AGM
5.25%, due 1/1/42 | | | 4,000,000 | | | | 4,719,840 | |
City of Chicago IL, Wastewater, Revenue Bonds | | | | | | | | |
5.00%, due 11/1/27 | | | 1,000,000 | | | | 1,139,620 | |
Series 2017-2, Insured: AGM
5.00%, due 11/1/28 | | | 2,000,000 | | | | 2,435,480 | |
5.00%, due 11/1/29 | | | 1,700,000 | | | | 1,924,162 | |
Series 2017-2, Insured: AGM
5.00%, due 11/1/30 | | | 3,000,000 | | | | 3,617,250 | |
Series 2017-2, Insured: AGM
5.00%, due 11/1/32 | | | 5,000,000 | | | | 5,974,550 | |
Series 2017-2, Insured: AGM
5.00%, due 11/1/33 | | | 10,000,000 | | | | 11,917,500 | |
Series 2017-2, Insured: AGM
5.00%, due 11/1/38 | | | 3,500,000 | | | | 4,116,770 | |
Insured: AGM
5.25%, due 11/1/33 | | | 4,535,000 | | | | 5,508,846 | |
Insured: AGM
5.25%, due 11/1/34 | | | 1,785,000 | | | | 2,163,438 | |
Insured: AGM
5.25%, due 11/1/35 | | | 3,025,000 | | | | 3,656,741 | |
City of Country Club Hills IL, Unlimited General Obligation
Insured: BAM
4.50%, due 12/1/31 | | | 455,000 | | | | 492,556 | |
Cook County Community College District No. 508, City College of Chicago, Unlimited General Obligation Insured: BAM
5.50%, due 12/1/38 | | | 5,000,000 | | | | 5,656,050 | |
Cook County Community High School District No. 212 Leyden, Revenue Bonds | | | | | | | | |
Series C, Insured: BAM
5.00%, due 12/1/30 | | | 3,370,000 | | | | 3,849,618 | |
Series C, Insured: BAM
5.00%, due 12/1/31 | | | 2,610,000 | | | | 2,981,560 | |
Cook County School District No. 162, Unlimited General Obligation
Series C, Insured: BAM
4.00%, due 12/1/38 | | | 2,000,000 | | | | 2,193,200 | |
Illinois Finance Authority, Rehab Institute of Chicago, Revenue Bonds
Series A
6.00%, due 7/1/43 | | | 9,600,000 | | | | 10,815,648 | |
| | | | | | | | |
| | | Principal
Amount | | | Value | |
Illinois (continued) | | | | | | | | |
Illinois Sports Facilities Authority, Revenue Bonds
Insured: AGM
5.25%, due 6/15/31 | | $ | 5,000,000 | | | $ | 5,643,300 | |
Madison County Community Unit School, District No. 7 Edwardsville, Unlimited General Obligation
Insured: BAM
4.00%, due 12/1/20 | | | 2,085,000 | | | | 2,144,214 | |
Metropolitan Pier & Exposition Authority, Capital Appreciation, Revenue Bonds
Series A, Insured: AGM
(zero coupon), due 6/15/30 | | | 14,250,000 | | | | 10,683,082 | |
Metropolitan Pier & Exposition Authority, Capital Appreciation-McCormick, Revenue Bonds
Series A, Insured: NATL-RE
(zero coupon), due 6/15/36 | | | 58,750,000 | | | | 34,113,187 | |
Peoria County School District No. 150, Unlimited General Obligation | | | | | | | | |
Series A, Insured: AGM
4.00%, due 1/1/38 | | | 750,000 | | | | 808,920 | |
Series A, Insured: AGM
4.00%, due 1/1/39 | | | 1,175,000 | | | | 1,264,735 | |
Series A, Insured: AGM
5.00%, due 1/1/35 | | | 1,060,000 | | | | 1,232,377 | |
Public Building Commission of Chicago, Chicago Transit Authority, Revenue Bonds
Insured: AMBAC
5.25%, due 3/1/29 | | | 580,000 | | | | 699,683 | |
Rock Island County, Public Building Commission, Revenue Bonds | | | | | | | | |
Insured: AGM
5.00%, due 12/1/31 | | | 500,000 | | | | 588,995 | |
Insured: AGM
5.00%, due 12/1/36 | | | 2,645,000 | | | | 3,081,213 | |
Sales Tax Securitization Corp., Revenue Bonds
Series A
5.00%, due 1/1/40 | | | 2,665,000 | | | | 3,065,789 | |
Sangamon County Water Reclamation District, Alternative Revenue Source, Unlimited General Obligation
Series A
4.00%, due 1/1/44 | | | 5,000,000 | | | | 5,411,850 | |
Southern Illinois University, Housing & Auxiliary Facilities System, Revenue Bonds | | | | | | | | |
Series B, Insured: BAM
5.00%, due 4/1/26 | | | 1,175,000 | | | | 1,371,589 | |
Series B, Insured: BAM
5.00%, due 4/1/29 | | | 1,620,000 | | | | 1,857,703 | |
Series B, Insured: BAM
5.00%, due 4/1/30 | | | 1,000,000 | | | | 1,141,060 | |
| | | | | | |
The notes to the financial statements are an integral part of,
and should be read in conjunction with, the financial statements. | | | | | 19 | |
Portfolio of InvestmentsOctober 31, 2019 (continued)
| | | | | | | | |
| | | Principal
Amount | | | Value | |
| Long-Term Municipal Bonds (continued) | |
Illinois (continued) | | | | | | | | |
State of Illinois, Sales Tax, Revenue Bonds
4.50%, due 6/15/36 | | $ | 17,500,000 | | | $ | 17,882,200 | |
State of Illinois, Unlimited General Obligation | | | | | | | | |
Insured: BAM
4.00%, due 6/1/41 | | | 12,600,000 | | | | 13,477,086 | |
Series B
5.00%, due 9/1/27 | | | 23,750,000 | | | | 27,372,825 | |
Series C
5.00%, due 11/1/29 | | | 35,000,000 | | | | 39,711,000 | |
United City of Yorkville, Special Tax Insured: AGM
5.00%, due 3/1/32 | | | 3,780,000 | | | | 4,381,247 | |
University of Illinois, Auxiliary System Facilities, Revenue Bonds
Series A, Insured: AGM
4.00%, due 4/1/43 | | | 2,500,000 | | | | 2,719,600 | |
Village of Bellwood IL, Unlimited General Obligation
Insured: AGM
5.00%, due 12/1/29 | | | 1,500,000 | | | | 1,745,685 | |
Village of Crestwood IL, Alternative Revenue Source, Unlimited General Obligation | | | | | | | | |
Series B, Insured: BAM
5.00%, due 12/15/29 | | | 750,000 | | | | 838,237 | |
Series B, Insured: BAM
5.00%, due 12/15/30 | | | 850,000 | | | | 950,725 | |
Series B, Insured: BAM
5.00%, due 12/15/31 | | | 955,000 | | | | 1,067,384 | |
Village of Oswego IL, Unlimited General Obligation
5.00%, due 12/15/33 | | | 7,670,000 | | | | 9,056,583 | |
Village of Rosemont IL, Corporate Purpose Bond, Unlimited General Obligation | | | | | | | | |
Series A, Insured: AGM
5.00%, due 12/1/40 | | | 8,090,000 | | | | 9,493,777 | |
Series A, Insured: AGM
5.00%, due 12/1/46 | | | 3,335,000 | | | | 3,845,022 | |
Village of Schaumburg IL, Unlimited General Obligation
Series A
4.00%, due 12/1/41 | | | 39,295,000 | | | | 41,370,562 | |
| | | | | | | | |
| | | | | | | 489,397,607 | |
| | | | | | | | |
Indiana 1.0% | |
Indiana Finance Authority, Educational Facilities-Butler University, Revenue Bonds | | | | | | | | |
Series B
5.00%, due 2/1/24 | | | 2,100,000 | | | | 2,259,663 | |
| | | | | | | | |
| | | Principal
Amount | | | Value | |
Indiana (continued) | | | | | | | | |
Indiana Finance Authority, Educational Facilities-Butler University, Revenue Bonds (continued) | | | | | | | | |
Series A
5.00%, due 2/1/25 | | $ | 2,215,000 | | | $ | 2,380,948 | |
Series B
5.00%, due 2/1/25 | | | 2,210,000 | | | | 2,375,573 | |
Series B
5.00%, due 2/1/26 | | | 2,320,000 | | | | 2,491,216 | |
Indiana Finance Authority, Green Bond, CWA Authority Project, Revenue Bonds
Series A
5.00%, due 10/1/49 | | | 11,290,000 | | | | 13,807,331 | |
Indiana Finance Authority, King’s Daughters Hospital & Healthcare, Revenue Bonds
5.50%, due 8/15/40 | | | 7,425,000 | | | | 7,640,548 | |
Indiana Housing & Community Development Authority Single Family Mortgage, Revenue Bonds
Series A, Insured: GNMA
4.00%, due 7/1/48 | | | 2,980,000 | | | | 3,234,254 | |
Indianapolis Local Public Improvement Bond Bank, Revenue Bonds
Series E
5.00%, due 1/1/40 | | | 6,350,000 | | | | 7,837,360 | |
Tippecanoe County School Building Corp., Revenue Bonds | | | | | | | | |
4.00%, due 7/15/37 | | | 1,390,000 | | | | 1,574,064 | |
4.00%, due 7/15/38 | | | 1,215,000 | | | | 1,370,459 | |
Vanderburgh County Redevelopment District, Tax Allocation
Insured: AGM
5.00%, due 2/1/31 | | | 2,310,000 | | | | 2,725,038 | |
| | | | | | | | |
| | | | | | | 47,696,454 | |
| | | | | | | | |
Iowa 1.6% | |
City of Coralville IA, Certificates of Participation | | | | | | | | |
Series E
4.00%, due 6/1/21 | | | 545,000 | | | | 550,782 | |
Series E
4.00%, due 6/1/22 | | | 1,405,000 | | | | 1,421,720 | |
Series E
4.00%, due 6/1/23 | | | 1,320,000 | | | | 1,336,130 | |
Iowa Finance Authority, Mortgage-Backed Securities Program, Revenue Bonds
Series C, Insured: GNMA/FNMA/FHLMC
4.00%, due 7/1/48 | | | 1,960,000 | | | | 2,131,108 | |
Iowa Finance Authority, Revenue Bonds
Series A, Insured: GNMA/FNMA/FHLMC
4.00%, due 7/1/47 | | | 2,910,000 | | | | 3,243,428 | |
| | | | |
| 20 | | MainStay MacKay Tax Free Bond Fund | | The notes to the financial statements are an integral part of,
and should be read in conjunction with, the financial statements. |
| | | | | | | | |
| | | Principal
Amount | | | Value | |
| Long-Term Municipal Bonds (continued) | |
Iowa (continued) | | | | | | | | |
Iowa Higher Education Loan Authority, Private College Facility, Grinnell College Project, Revenue Bonds
5.00%, due 12/1/46 | | $ | 10,700,000 | | | $ | 12,762,853 | |
PEFA, Inc., Revenue Bonds
5.00%, due 9/1/49 (a) | | | 45,565,000 | | | | 53,608,134 | |
| | | | | | | | |
| | | | | | | 75,054,155 | |
| | | | | | | | |
Kansas 0.3% | |
City of Hutchinson KS, Hutchinson Regional Medical Center, Inc., Revenue Bonds | | | | | | | | |
5.00%, due 12/1/26 | | | 565,000 | | | | 659,620 | |
5.00%, due 12/1/28 | | | 410,000 | | | | 475,502 | |
5.00%, due 12/1/30 | | | 500,000 | | | | 574,860 | |
University of Kansas Hospital Authority, KU Health System, Revenue Bonds | | | | | | | | |
5.00%, due 9/1/33 | | | 2,500,000 | | | | 2,928,550 | |
5.00%, due 9/1/34 | | | 5,000,000 | | | | 5,847,250 | |
5.00%, due 9/1/35 | | | 2,800,000 | | | | 3,268,020 | |
| | | | | | | | |
| | | | | | | 13,753,802 | |
| | | | | | | | |
Kentucky 0.2% | |
City of Ashland KY, King’s Daughters Medical Center Project, Revenue Bonds | | | | | | | | |
Series A
4.00%, due 2/1/21 | | | 1,070,000 | | | | 1,094,803 | |
Series A
5.00%, due 2/1/23 | | | 1,525,000 | | | | 1,666,032 | |
Fayette County School District Finance Corp., Revenue Bonds
Series A
4.00%, due 5/1/38 | | | 2,995,000 | | | | 3,288,540 | |
Louisville / Jefferson County Metropolitan Government, Louisville Water Co., Revenue Bonds
3.00%, due 11/15/35 | | | 3,915,000 | | | | 4,088,434 | |
| | | | | | | | |
| | | | | | | 10,137,809 | |
| | | | | | | | |
Louisiana 0.8% | |
City of Shreveport LA, Unlimited General Obligation | | | | | | | | |
Insured: BAM
5.00%, due 8/1/28 | | | 2,285,000 | | | | 2,801,616 | |
Insured: BAM
5.00%, due 8/1/30 | | | 5,355,000 | | | | 6,522,229 | |
Louisiana Local Government Environmental Facilities & Community Development Authority, McNeese State University Student Parking Co., Revenue Bonds | | | | | | | | |
Insured: AGM
4.00%, due 3/1/22 | | | 335,000 | | | | 354,417 | |
| | | | | | | | |
| | | Principal
Amount | | | Value | |
Louisiana (continued) | |
Louisiana Local Government Environmental Facilities & Community Development Authority, McNeese State University Student Parking Co., Revenue Bonds (continued) | | | | | | | | |
Insured: AGM
4.00%, due 3/1/23 | | $ | 350,000 | | | $ | 370,097 | |
Louisiana Public Facilities Authority, Loyola University, Revenue Bonds
5.25%, due 10/1/30 | | | 2,930,000 | | | | 3,158,393 | |
Louisiana Public Facilities Authority, Unrefunded-Ochsner Clinic Foundation Project, Revenue Bonds
5.00%, due 5/15/34 | | | 2,010,000 | | | | 2,334,434 | |
Louisiana Stadium & Exposition District, Revenue Bonds
Series A
5.00%, due 7/1/30 | | | 1,485,000 | | | | 1,658,299 | |
State of Louisiana, Unlimited General Obligation | | | | | | | | |
Series A
4.00%, due 2/1/34 | | | 10,000,000 | | | | 10,829,500 | |
Series A
5.00%, due 3/1/37 | | | 6,995,000 | | | | 8,758,160 | |
| | | | | | | | |
| | | | | | | 36,787,145 | |
| | | | | | | | |
Maryland 2.0% | |
City of Baltimore MD, Water Projects, Revenue Bonds
Series A
4.00%, due 7/1/37 | | | 2,065,000 | | | | 2,360,068 | |
County of Anne Arundel MD, Unlimited General Obligation | | | | | | | | |
5.00%, due 10/1/42 | | | 7,200,000 | | | | 9,090,648 | |
5.00%, due 10/1/43 | | | 7,200,000 | | | | 9,065,304 | |
County of Baltimore, Unlimited General Obligation | | | | | | | | |
4.00%, due 3/1/36 | | | 4,835,000 | | | | 5,596,609 | |
4.00%, due 3/1/37 | | | 10,120,000 | | | | 11,675,241 | |
Maryland Community Development Administration, Department of Housing & Community Development, Revenue Bonds | | | | | | | | |
Series C
3.50%, due 3/1/50 | | | 3,700,000 | | | | 3,993,743 | |
Series A
4.25%, due 9/1/49 | | | 15,000,000 | | | | 16,550,400 | |
Maryland Stadium Authority, Construction & Revitalization, Revenue Bonds
Series A
5.00%, due 5/1/42 | | | 24,645,000 | | | | 29,715,216 | |
| | | | | | |
The notes to the financial statements are an integral part of,
and should be read in conjunction with, the financial statements. | | | | | 21 | |
Portfolio of InvestmentsOctober 31, 2019 (continued)
| | | | | | | | |
| | | Principal
Amount | | | Value | |
| Long-Term Municipal Bonds (continued) | |
Maryland (continued) | |
Montgomery County Housing Opportunities Commission Program, Revenue Bonds
Series A
4.00%, due 7/1/49 | | $ | 6,705,000 | | | $ | 7,373,824 | |
| | | | | | | | |
| | | | | | | 95,421,053 | |
| | | | | | | | |
Massachusetts 1.7% | |
Commonwealth of Massachusetts, Consolidated Loan, Limited General Obligation
Series C
5.00%, due 5/1/45 | | | 15,000,000 | | | | 18,568,350 | |
Commonwealth of Massachusetts, Limited General Obligation
Series A
5.25%, due 1/1/44 | | | 31,905,000 | | | | 40,128,833 | |
Massachusetts Development Finance Agency, UMass Boston Student Housing Project, Revenue Bonds | | | | | | | | |
5.00%, due 10/1/30 | | | 1,200,000 | | | | 1,401,288 | |
5.00%, due 10/1/31 | | | 1,200,000 | | | | 1,398,660 | |
5.00%, due 10/1/32 | | | 1,240,000 | | | | 1,440,595 | |
5.00%, due 10/1/33 | | | 1,500,000 | | | | 1,737,435 | |
5.00%, due 10/1/34 | | | 2,170,000 | | | | 2,508,542 | |
Massachusetts Development Finance Agency, WGBH Educational Foundation, Revenue Bonds
4.00%, due 1/1/33 | | | 1,000,000 | | | | 1,120,810 | |
Massachusetts Educational Financing Authority, Revenue Bonds | | | | | | | | |
Series B
5.70%, due 1/1/31 (b) | | | 715,000 | | | | 720,605 | |
Series I
6.00%, due 1/1/28 | | | 675,000 | | | | 678,888 | |
Massachusetts Housing Finance Agency, Single Family Housing, Revenue Bonds
Series 199
4.00%, due 12/1/48 | | | 3,640,000 | | | | 3,940,518 | |
Massachusetts School Building Authority, Sales Tax, Revenue Bonds
Series A
5.00%, due 2/15/49 | | | 3,700,000 | | | | 4,332,404 | |
Metropolitan Boston Transit Parking Corp., Revenue Bonds
5.25%, due 7/1/36 | | | 2,000,000 | | | | 2,128,780 | |
| | | | | | | | |
| | | | | | | 80,105,708 | |
| | | | | | | | |
| | | | | | | | |
| | | Principal
Amount | | | Value | |
Michigan 2.4% | |
Detroit City School District, Improvement School Building & Site, Unlimited General Obligation | | | | | | | | |
Series A, Insured: Q-SBLF
5.00%, due 5/1/26 | | $ | 750,000 | | | $ | 814,935 | |
Series A, Insured: Q-SBLF
5.00%, due 5/1/29 | | | 3,620,000 | | | | 3,916,659 | |
Series A, Insured: Q-SBLF
5.00%, due 5/1/33 | | | 4,535,000 | | | | 4,897,528 | |
Downriver Utility Wastewater Authority, Revenue Bonds
Insured: AGM
5.00%, due 4/1/31 | | | 1,600,000 | | | | 1,938,512 | |
Grand Rapids Public Schools, Unlimited General Obligation
Insured: AGM
5.00%, due 11/1/42 | | | 1,400,000 | | | | 1,711,486 | |
Great Lakes Water Authority, Sewage Disposal System, Revenue Bonds Senior Lien-Series A
5.25%, due 7/1/39 | | | 14,150,000 | | | | 15,357,419 | |
Great Lakes Water Authority, Water Supply System, Revenue Bonds | | | | | | | | |
Series C
5.25%, due 7/1/35 | | | 20,000,000 | | | | 24,138,800 | |
Senior Lien-Series A
5.25%, due 7/1/41 | | | 5,000,000 | | | | 5,283,450 | |
Senior Lien-Series A
5.75%, due 7/1/37 | | | 5,550,000 | | | | 5,929,231 | |
Lincoln Consolidated School District, Unlimited General Obligation | | | | | | | | |
Series A, Insured: AGM
5.00%, due 5/1/28 | | | 2,030,000 | | | | 2,454,128 | |
Series A, Insured: AGM
5.00%, due 5/1/30 | | | 1,455,000 | | | | 1,745,607 | |
Series A, Insured: AGM
5.00%, due 5/1/40 | | | 1,500,000 | | | | 1,750,125 | |
Livonia Public School District, Unlimited General Obligation
Insured: AGM
5.00%, due 5/1/40 | | | 4,365,000 | | | | 5,061,392 | |
Michigan Finance Authority, Great Lakes Water, Revenue Bonds | | | | | | | | |
Series C-7,
Insured: NATL-RE
5.00%, due 7/1/32 | | | 2,500,000 | | | | 2,851,125 | |
Series C-3,
Insured: AGM
5.00%, due 7/1/33 | | | 3,000,000 | | | | 3,430,800 | |
Series C-1
5.00%, due 7/1/44 | | | 2,500,000 | | | | 2,684,150 | |
| | | | |
| 22 | | MainStay MacKay Tax Free Bond Fund | | The notes to the financial statements are an integral part of,
and should be read in conjunction with, the financial statements. |
| | | | | | | | |
| | | Principal
Amount | | | Value | |
| Long-Term Municipal Bonds (continued) | |
Michigan (continued) | | | | | | | | |
Michigan Finance Authority, Local Government Loan Program, Revenue Bonds | | | | | | | | |
Series D2, Insured: AGM
5.00%, due 7/1/28 | | $ | 500,000 | | | $ | 580,960 | |
Series D-1
5.00%, due 7/1/33 | | | 500,000 | | | | 583,820 | |
Series D-1
5.00%, due 7/1/34 | | | 500,000 | | | | 582,590 | |
Series D1, Insured: AGM
5.00%, due 7/1/35 | | | 2,000,000 | | | | 2,280,520 | |
Series D6, Insured: NATL-RE
5.00%, due 7/1/36 | | | 7,400,000 | | | | 8,393,006 | |
Michigan Finance Authority, Wayne County Criminal Justice Center Project, Revenue Bonds | | | | | | | | |
5.00%, due 11/1/24 | | | 750,000 | | | | 879,863 | |
5.00%, due 11/1/25 | | | 1,000,000 | | | | 1,202,080 | |
5.00%, due 11/1/27 | | | 1,200,000 | | | | 1,500,492 | |
5.00%, due 11/1/30 | | | 500,000 | | | | 628,470 | |
5.00%, due 11/1/31 | | | 750,000 | | | | 937,170 | |
Saginaw City School District, Unlimited General Obligation | | | | | | | | |
Insured: Q-SBLF
5.00%, due 5/1/29 | | | 260,000 | | | | 306,046 | |
Insured: Q-SBLF
5.00%, due 5/1/30 | | | 350,000 | | | | 410,053 | |
Insured: Q-SBLF
5.00%, due 5/1/31 | | | 750,000 | | | | 875,408 | |
Insured: Q-SBLF
5.00%, due 5/1/34 | | | 250,000 | | | | 289,500 | |
Insured: Q-SBLF
5.00%, due 5/1/35 | | | 350,000 | | | | 404,471 | |
Insured: Q-SBLF
5.00%, due 5/1/36 | | | 425,000 | | | | 490,382 | |
Tri-County Area School District, Unlimited General Obligation | | | | | | | | |
Insured: AGM
4.00%, due 5/1/35 | | | 1,540,000 | | | | 1,734,533 | |
Insured: AGM
4.00%, due 5/1/39 | | | 1,825,000 | | | | 2,020,092 | |
Insured: AGM
4.00%, due 5/1/44 | | | 3,000,000 | | | | 3,282,180 | |
Wayne County Michigan, Capital Improvement, Limited General Obligation
Series A, Insured: AGM
5.00%, due 2/1/38 | | | 2,500,000 | | | | 2,506,525 | |
| | | | | | | | |
| | | | | | | 113,853,508 | |
| | | | | | | | |
| | | | | | | | |
| | | Principal
Amount | | | Value | |
Minnesota 0.4% | |
Housing & Redevelopment Authority of The City of St. Paul Minnesota, Fairview Health Services, Revenue Bonds
4.00%, due 11/15/37 | | $ | 1,000,000 | | | $ | 1,108,700 | |
Minnesota Housing Finance Agency, Residential Housing Finance, Revenue Bonds | | | | | | | | |
Series E, Insured: GNMA/FMNA/FHLMC
4.25%, due 1/1/49 | | | 4,885,000 | | | | 5,366,710 | |
Series B, Insured: GNMA/FNMA/FHLMC 4.25%, due 7/1/49 | | | 10,335,000 | | | | 11,411,804 | |
State of Minnesota, Unlimited General Obligation
Series A
5.00%, due 8/1/36 | | | 2,500,000 | | | | 3,155,100 | |
| | | | | | | | |
| | | | | | | 21,042,314 | |
| | | | | | | | |
Mississippi 0.1% | |
Mississippi Development Bank, Hinds County School District Project, Revenue Bonds
5.00%, due 3/1/43 | | | 1,510,000 | | | | 1,803,740 | |
Mississippi Home Corp., Mortgage Revenue, Revenue Bonds
Series A, Insured: GNMA/FNMA/FHLMC
4.00%, due 12/1/44 | | | 1,925,000 | | | | 2,097,557 | |
| | | | | | | | |
| | | | | | | 3,901,297 | |
| | | | | | | | |
Missouri 0.7% | |
City of Kansas MO, Improvement Downtown Arena Project, Revenue Bonds
Series E
5.00%, due 4/1/40 | | | 10,055,000 | | | | 11,469,638 | |
Health & Educational Facilities Authority of the State of Missouri, SSM Health Care, Revenue Bonds
Series A
5.00%, due 6/1/30 | | | 4,000,000 | | | | 4,563,480 | |
Joplin Industrial Development Authority, Freeman Health System, Revenue Bonds
5.00%, due 2/15/35 | | | 605,000 | | | | 676,215 | |
Missouri Housing Development Commission Mortgage Revenue, Homeownership Loan Program, Revenue Bonds | | | | | | | | |
Series A, Insured: GNMA/FNMA/FHLMC 4.25%, due 5/1/47 | | | 7,620,000 | | | | 8,422,538 | |
Series A, Insured: GNMA/FNMA/FHLMC
4.25%, due 5/1/49 | | | 4,405,000 | | | | 4,834,311 | |
Springfield School DistrictNo. R-12, Unlimited General Obligation
4.00%, due 3/1/35 | | | 3,140,000 | | | | 3,651,349 | |
| | | | | | | | |
| | | | | | | 33,617,531 | |
| | | | | | | | |
| | | | | | |
The notes to the financial statements are an integral part of,
and should be read in conjunction with, the financial statements. | | | | | 23 | |
Portfolio of InvestmentsOctober 31, 2019 (continued)
| | | | | | | | |
| | | Principal
Amount | | | Value | |
| Long-Term Municipal Bonds (continued) | |
Montana 0.8% | |
Missoula County Elementary School District No. 1 School Building, Unlimited General Obligation | | | | | | | | |
4.00%, due 7/1/30 | | $ | 145,000 | | | $ | 166,649 | |
4.00%, due 7/1/31 | | | 345,000 | | | | 393,859 | |
4.00%, due 7/1/32 | | | 590,000 | | | | 669,379 | |
4.00%, due 7/1/33 | | | 555,000 | | | | 628,221 | |
Missoula High School District No. 1 School Building, Unlimited General Obligation | | | | | | | | |
4.00%, due 7/1/30 | | | 500,000 | | | | 577,735 | |
4.00%, due 7/1/31 | | | 335,000 | | | | 383,722 | |
4.00%, due 7/1/33 | | | 350,000 | | | | 398,828 | |
4.00%, due 7/1/34 | | | 370,000 | | | | 419,314 | |
4.00%, due 7/1/35 | | | 515,000 | | | | 580,250 | |
Montana Board of Housing, Revenue Bonds | | | | | | | | |
Series B
3.40%, due 12/1/33 | | | 1,645,000 | | | | 1,748,092 | |
Series B
3.60%, due 6/1/37 | | | 2,125,000 | | | | 2,260,702 | |
Series B
4.00%, due 12/1/43 | | | 1,725,000 | | | | 1,855,755 | |
Montana Facilities Finance Authority, Revenue Bonds | | | | | | | | |
5.00%, due 2/15/30 | | | 1,790,000 | | | | 2,134,933 | |
5.00%, due 2/15/31 | | | 1,500,000 | | | | 1,778,640 | |
5.00%, due 2/15/32 | | | 775,000 | | | | 916,073 | |
5.00%, due 2/15/33 | | | 1,320,000 | | | | 1,556,346 | |
5.00%, due 2/15/34 | | | 1,200,000 | | | | 1,412,172 | |
Silver Bow County School District No. 1, Unlimited General Obligation | | | | | | | | |
4.00%, due 7/1/30 | | | 1,745,000 | | | | 2,059,170 | |
4.00%, due 7/1/32 | | | 1,945,000 | | | | 2,259,215 | |
4.00%, due 7/1/33 | | | 2,020,000 | | | | 2,339,726 | |
Yellowstone County K-12, School District No. 26 Lockwood, Unlimited General Obligation | | | | | | | | |
5.00%, due 7/1/29 | | | 2,260,000 | | | | 2,863,804 | |
5.00%, due 7/1/30 | | | 2,500,000 | | | | 3,151,025 | |
5.00%, due 7/1/31 | | | 3,015,000 | | | | 3,772,519 | |
5.00%, due 7/1/32 | | | 3,300,000 | | | | 4,101,339 | |
| | | | | | | | |
| | | | | | | 38,427,468 | |
| | | | | | | | |
Nebraska 1.4% | |
Central Plains Energy, Project No. 3, Revenue Bonds | | | | | | | | |
5.00%, due 9/1/32 | | | 5,190,000 | | | | 5,634,835 | |
5.00%, due 9/1/42 | | | 13,960,000 | | | | 15,160,560 | |
Series A
5.00%, due 9/1/42 | | | 15,500,000 | | | | 21,398,835 | |
5.25%, due 9/1/37 | | | 15,535,000 | | | | 16,972,919 | |
| | | | | | | | |
| | | Principal
Amount | | | Value | |
Nebraska (continued) | |
Colfax County School District No. 123, Unlimited General Obligation
4.00%, due 12/15/33 | | $ | 2,740,000 | | | $ | 2,987,422 | |
Nebraska Investment Finance Authority Single Family Housing, Revenue Bonds
Series C
4.00%, due 9/1/48 | | | 5,275,000 | | | | 5,718,997 | |
| | | | | | | | |
| | | | | | | 67,873,568 | |
| | | | | | | | |
Nevada 0.6% | |
Clark County School District, Limited General Obligation
Series B, Insured: AGM
4.00%, due 6/15/35 | | | 5,395,000 | | | | 6,136,111 | |
Clark County, Limited General Obligation | | | | | | | | |
Series C
4.00%, due 7/1/33 | | | 8,690,000 | | | | 10,114,813 | |
4.00%, due 6/1/35 | | | 2,400,000 | | | | 2,781,360 | |
4.00%, due 6/1/36 | | | 2,500,000 | | | | 2,883,275 | |
Washoe County School District, Limited General Obligation | | | | | | | | |
Series A, Insured: BAM
3.00%, due 6/1/33 | | | 3,875,000 | | | | 4,048,600 | |
Series A, Insured: BAM
3.00%, due 6/1/34 | | | 2,490,000 | | | | 2,583,923 | |
Series A, Insured: BAM
3.00%, due 6/1/35 | | | 2,355,000 | | | | 2,436,365 | |
| | | | | | | | |
| | | | | | | 30,984,447 | |
| | | | | | | | |
New Hampshire 0.1% | |
City of Manchester NH, General Airport, Revenue Bonds
Series A, Insured: AGM
5.00%, due 1/1/26 | | | 1,800,000 | | | | 1,927,674 | |
New Hampshire Health & Education Facilities Authority, Southern University, Revenue Bonds | | | | | | | | |
5.00%, due 1/1/31 | | | 905,000 | | | | 1,056,008 | |
5.00%, due 1/1/32 | | | 950,000 | | | | 1,106,152 | |
5.00%, due 1/1/33 | | | 1,000,000 | | | | 1,161,700 | |
5.00%, due 1/1/34 | | | 1,050,000 | | | | 1,217,811 | |
5.00%, due 1/1/35 | | | 600,000 | | | | 694,602 | |
| | | | | | | | |
| | | | | | | 7,163,947 | |
| | | | | | | | |
New Jersey 3.4% | |
Atlantic County Improvement Authority, Stockton University-Atlantic City, Revenue Bonds | | | | | | | | |
Series A, Insured: AGM
5.00%, due 7/1/31 | | | 2,670,000 | | | | 3,184,135 | |
Series A, Insured: AGM
5.00%, due 7/1/32 | | | 1,305,000 | | | | 1,550,627 | |
Series A, Insured: AGM
5.00%, due 7/1/33 | | | 1,395,000 | | | | 1,652,350 | |
| | | | |
| 24 | | MainStay MacKay Tax Free Bond Fund | | The notes to the financial statements are an integral part of,
and should be read in conjunction with, the financial statements. |
| | | | | | | | |
| | | Principal
Amount | | | Value | |
| Long-Term Municipal Bonds (continued) | |
New Jersey (continued) | | | | | | | | |
City of Atlantic City NJ, Unlimited General Obligation
Series B, Insured: AGM
5.00%, due 3/1/32 | | $ | 3,400,000 | | | $ | 4,052,256 | |
New Brunswick Parking Authority, Revenue Bonds | | | | | | | | |
Series A, Insured: BAM
5.00%, due 9/1/28 | | | 4,780,000 | | | | 5,859,420 | |
Series A, Insured: BAM
5.00%, due 9/1/29 | | | 2,370,000 | | | | 2,893,367 | |
Series A, Insured: BAM
5.00%, due 9/1/30 | | | 4,605,000 | | | | 5,597,331 | |
Series A, Insured: BAM
5.00%, due 9/1/31 | | | 6,780,000 | | | | 8,209,631 | |
New Jersey Building Authority, Unrefunded, Revenue Bonds | | | | | | | | |
Series A, Insured: BAM
5.00%, due 6/15/25 | | | 2,015,000 | | | | 2,359,646 | |
Series A, Insured: BAM
5.00%, due 6/15/28 | | | 1,805,000 | | | | 2,140,694 | |
New Jersey Economic Development Authority, New Jersey Natural Gas Co. Project, Revenue Bonds
Series C
3.00%, due 8/1/41 (b) | | | 5,000,000 | | | | 4,869,100 | |
New Jersey Economic Development Authority, Revenue Bonds | | | | | | | | |
5.00%, due 1/1/28 (b) | | | 1,000,000 | | | | 1,127,290 | |
Series A, Insured: BAM
5.00%, due 7/1/28 | | | 2,000,000 | | | | 2,422,880 | |
5.50%, due 1/1/26 (b) | | | 1,000,000 | | | | 1,151,580 | |
New Jersey Educational Facilities Authority, Stockton University, Revenue Bonds | | | | | | | | |
Series A, Insured: BAM
5.00%, due 7/1/29 | | | 4,775,000 | | | | 5,722,217 | |
Series A, Insured: BAM
5.00%, due 7/1/30 | | | 5,000,000 | | | | 5,966,400 | |
Series A, Insured: BAM
5.00%, due 7/1/31 | | | 3,000,000 | | | | 3,571,470 | |
New Jersey Health Care Facilities Financing Authority, Hackensack Meridian Health, Inc., Revenue Bonds
Series A
5.00%, due 7/1/38 | | | 10,000,000 | | | | 12,011,600 | |
New Jersey Higher Education Student Assistance Authority, Revenue Bonds
Series C
4.00%, due 12/1/48 (b) | | | 2,250,000 | | | | 2,405,115 | |
| | | | | | | | |
| | | Principal
Amount | | | Value | |
New Jersey (continued) | | | | | | | | |
New Jersey Housing & Mortgage Finance Agency, Revenue Bonds
Series C
4.75%, due 10/1/50 | | $ | 12,110,000 | | | $ | 13,620,722 | |
New Jersey Transportation Trust Fund Authority, Federal Highway Reimbursement, Revenue Bonds | | | | | | | | |
Series A
5.00%, due 6/15/28 | | | 4,800,000 | | | | 5,656,896 | |
Series A
5.00%, due 6/15/29 | | | 8,380,000 | | | | 9,834,014 | |
New Jersey Transportation Trust Fund Authority, Revenue Bonds
Series C, Insured: AGM
(zero coupon), due 12/15/34 | | | 30,000,000 | | | | 19,877,100 | |
New Jersey Transportation Trust Fund Authority, Transportation System, Revenue Bonds
Series A
5.00%, due 12/15/28 | | | 5,000,000 | | | | 6,016,150 | |
New Jersey Turnpike Authority, Revenue Bonds
Series E
5.00%, due 1/1/45 | | | 4,000,000 | | | | 4,567,920 | |
Newark Housing Authority, Revenue Bonds | | | | | | | | |
Insured: AGM
4.00%, due 12/1/27 | | | 500,000 | | | | 557,700 | |
Insured: AGM
4.00%, due 12/1/29 | | | 250,000 | | | | 277,038 | |
Insured: AGM
4.00%, due 12/1/30 | | | 250,000 | | | | 275,475 | |
Insured: AGM
4.00%, due 12/1/31 | | | 225,000 | | | | 246,863 | |
Insured: AGM
5.00%, due 12/1/28 | | | 750,000 | | | | 899,370 | |
Insured: AGM
5.00%, due 12/1/38 | | | 1,740,000 | | | | 2,032,546 | |
South Jersey Transportation Authority, Revenue Bonds | | | | | | | | |
Series A, Insured: AGM
5.00%, due 11/1/31 | | | 1,750,000 | | | | 2,221,642 | |
Series A, Insured: AGM
5.00%, due 11/1/32 | | | 1,500,000 | | | | 1,897,260 | |
Series A, Insured: AGM
5.00%, due 11/1/33 | | | 750,000 | | | | 946,365 | |
Tobacco Settlement Financing Corp., Revenue Bonds | | | | | | | | |
Series A
5.00%, due 6/1/31 | | | 3,000,000 | | | | 3,643,650 | |
Series A
5.00%, due 6/1/33 | | | 6,500,000 | | | | 7,828,730 | |
| | | | | | |
The notes to the financial statements are an integral part of,
and should be read in conjunction with, the financial statements. | | | | | 25 | |
Portfolio of InvestmentsOctober 31, 2019 (continued)
| | | | | | | | |
| | | Principal
Amount | | | Value | |
| Long-Term Municipal Bonds (continued) | |
New Jersey (continued) | | | | | | | | |
Tobacco Settlement Financing Corp., Revenue Bonds (continued) | | | | | | | | |
Series A
5.00%, due 6/1/34 | | $ | 1,500,000 | | | $ | 1,796,400 | |
Series A
5.00%, due 6/1/36 | | | 6,000,000 | | | | 7,137,300 | |
| | | | | | | | |
| | | | | | | 166,080,250 | |
| | | | | | | | |
New Mexico 0.2% | |
City of Albuquerque NM, Gross Receipts Lodgers Tax Revenue, Revenue Bonds
Series A
4.00%, due 7/1/36 | | | 2,490,000 | | | | 2,870,024 | |
City of Farmington NM, Revenue Bonds
Series C
5.90%, due 6/1/40 | | | 2,000,000 | | | | 2,050,520 | |
New Mexico Mortgage Finance Authority, Single Family Mortgage Program, Revenue Bonds
Series C, Class I,
Insured: GNMA/FNMA/FHLMC
4.00%, due 1/1/49 | | | 3,405,000 | | | | 3,708,317 | |
| | | | | | | | |
| | | | | | | 8,628,861 | |
| | | | | | | | |
New York 13.7% | |
Build NYC Resource Corp., Royal Charter Properties, Revenue Bonds | | | | | | | | |
Insured: AGM
5.00%, due 12/15/19 | | | 975,000 | | | | 979,007 | |
Insured: AGM
5.00%, due 12/15/20 | | | 1,025,000 | | | | 1,066,092 | |
Insured: AGM
5.00%, due 12/15/21 | | | 1,075,000 | | | | 1,155,313 | |
City of New York NY, Unlimited General Obligation | | | | | | | | |
Series B-1
4.00%, due 10/1/35 | | | 12,040,000 | | | | 13,956,046 | |
SubseriesA-1
4.00%, due 8/1/40 | | | 25,000,000 | | | | 28,490,750 | |
Series B-1
5.00%, due 10/1/38 | | | 5,000,000 | | | | 6,298,000 | |
5.25%, due 10/1/32 | | | 20,000,000 | | | | 25,147,200 | |
Long Island Power Authority, Electric System, Revenue Bonds
Insured: BAM
5.00%, due 9/1/44 | | | 10,000,000 | | | | 11,384,600 | |
Long Island Power Authority, Revenue Bonds | | | | | | | | |
Series A, Insured: BAM
5.00%, due 9/1/39 | | | 10,000,000 | | | | 11,484,500 | |
Series B
5.00%, due 9/1/45 | | | 8,970,000 | | | | 10,365,553 | |
| | | | | | | | |
| | | Principal
Amount | | | Value | |
New York (continued) | | | | | | | | |
Metropolitan Transportation Authority, Green Bond, Revenue Bonds | | | | | | | | |
Series C, Insured: AGM
4.00%, due 11/15/45 | | $ | 8,000,000 | | | $ | 8,984,880 | |
Series C, Insured: AGM
4.00%, due 11/15/48 | | | 5,875,000 | | | | 6,576,005 | |
Metropolitan Transportation Authority, Green, Revenue Bonds
Series B-1
5.00%, due 11/15/36 | | | 4,500,000 | | | | 5,435,505 | |
Metropolitan Transportation Authority, Revenue Bonds | | | | | | | | |
Series C, Insured: AGM
4.00%, due 11/15/49 | | | 4,900,000 | | | | 5,477,906 | |
Series D
5.00%, due 11/15/32 | | | 9,000,000 | | | | 11,032,020 | |
Series D-1, Insured: BAM
5.00%, due 11/15/33 | | | 13,650,000 | | | | 16,148,223 | |
New York City Housing Development Corp., Revenue Bonds
Series E-1-C
4.95%, due 11/1/46 | | | 4,625,000 | | | | 5,305,060 | |
New York City Transitional Finance Authority, Building Aid, Revenue Bonds | | | | | | | | |
Series S-1
5.00%, due 7/15/33 | | | 6,060,000 | | | | 7,058,688 | |
Series S-2
5.00%, due 7/15/34 | | | 3,000,000 | | | | 3,535,770 | |
Series S-1
5.00%, due 7/15/36 | | | 10,000,000 | | | | 11,585,000 | |
Series S-1
5.00%, due 7/15/43 | | | 11,880,000 | | | | 13,829,746 | |
New York City Transitional Finance Authority, Future Tax Secured, Revenue Bonds | | | | | | | | |
Series C-1
4.00%, due 11/1/38 | | | 4,380,000 | | | | 5,008,136 | |
Subseries F-1
5.00%, due 5/1/32 | | | 4,000,000 | | | | 4,895,880 | |
Series B-1
5.00%, due 8/1/32 | | | 10,000,000 | | | | 11,584,400 | |
SubseriesA-1
5.00%, due 5/1/33 | | | 10,000,000 | | | | 11,979,900 | |
Series A-2
5.00%, due 8/1/34 | | | 7,795,000 | | | | 9,533,753 | |
Series A1
5.00%, due 8/1/36 | | | 5,100,000 | | | | 5,997,447 | |
SubseriesE-1
5.00%, due 2/1/37 | | | 5,000,000 | | | | 5,893,300 | |
Series E-1
5.00%, due 2/1/41 | | | 2,500,000 | | | | 2,887,400 | |
| | | | |
| 26 | | MainStay MacKay Tax Free Bond Fund | | The notes to the financial statements are an integral part of,
and should be read in conjunction with, the financial statements. |
| | | | | | | | |
| | | Principal
Amount | | | Value | |
| Long-Term Municipal Bonds (continued) | |
New York (continued) | | | | | | | | |
New York City Transitional Finance Authority, Future Tax Secured, Revenue Bonds (continued) | | | | | | | | |
Subseries F-1
5.00%, due 5/1/42 | | $ | 11,500,000 | | | $ | 13,732,840 | |
Series B-1
5.00%, due 8/1/45 | | | 2,390,000 | | | | 2,861,523 | |
Subseries B-1
5.25%, due 8/1/37 | | | 5,570,000 | | | | 7,013,633 | |
New York City Water & Sewer System, Revenue Bonds
Series EE
5.25%, due 6/15/33 | | | 6,235,000 | | | | 7,863,831 | |
New York City Water & Sewer System, Second General Resolution, Revenue Bonds
Series AA
4.00%, due 6/15/40 | | | 5,030,000 | | | | 5,758,092 | |
New York Liberty Development Corp., Bank of America Tower at One Bryant Park Project, Revenue Bonds
Class 1
2.45%, due 9/15/69 | | | 10,000,000 | | | | 10,107,200 | |
New York Liberty Development Corp., Bank of America, Revenue Bonds Class 2
6.375%, due 7/15/49 | | | 5,000,000 | | | | 5,051,100 | |
New York Liberty Development Corp., Revenue Bonds
5.00%, due 12/15/41 | | | 12,315,000 | | | | 13,235,546 | |
New York Liberty Development Corp., World Trade Center, Revenue Bonds
5.75%, due 11/15/51 | | | 18,940,000 | | | | 20,606,341 | |
New York State Dormitory Authority, New York University, Revenue Bonds
Series A
5.00%, due 7/1/35 | | | 6,610,000 | | | | 7,831,462 | |
New York State Dormitory Authority, Revenue Bonds
Series E
5.00%, due 3/15/34 | | | 4,190,000 | | | | 4,944,074 | |
New York State Dormitory Authority, Sales Tax, Revenue Bonds | | | | | | | | |
Series E
5.00%, due 3/15/37 | | | 5,250,000 | | | | 6,512,520 | |
5.00%, due 3/15/40 | | | 8,280,000 | | | | 9,895,925 | |
Series B
5.00%, due 3/15/40 | | | 26,080,000 | | | | 31,779,784 | |
Series E
5.00%, due 3/15/40 | | | 5,000,000 | | | | 6,152,100 | |
| | | | | | | | |
| | | Principal
Amount | | | Value | |
New York (continued) | | | | | | | | |
New York State Dormitory Authority, Sales Tax, Revenue Bonds (continued) | | | | | | | | |
Series A
5.00%, due 3/15/42 | | $ | 10,000,000 | | | $ | 12,133,100 | |
Series E
5.00%, due 3/15/43 | | | 20,000,000 | | | | 24,454,600 | |
Series A
5.00%, due 3/15/43 | | | 10,000,000 | | | | 12,112,900 | |
5.00%, due 3/15/44 | | | 5,000,000 | | | | 5,935,900 | |
Series A
5.00%, due 3/15/45 | | | 3,000,000 | | | | 3,624,210 | |
New York State Dormitory Authority, State Personal Income Tax, Revenue Bonds
5.00%, due 2/15/38 | | | 13,490,000 | | | | 16,321,011 | |
New York State Dormitory Authority, University Facilities, Revenue Bonds | | | | | | | | |
Series A
5.00%, due 7/1/36 | | | 1,000,000 | | | | 1,219,920 | |
Series A
5.00%, due 7/1/38 | | | 1,000,000 | | | | 1,212,180 | |
New York State Environmental Facilities Corp., Green Bond, 2010 Master Finance Program, Revenue Bonds
Series A
5.00%, due 8/15/44 | | | 22,385,000 | | | | 28,016,171 | |
New York State Thruway Authority, General Revenue Junior Indebtedness Obligation, Revenue Bonds
Series B, Insured: AGM
4.00%, due 1/1/40 | | | 8,500,000 | | | | 9,656,765 | |
New York State Urban Development Corp., Personal Income Tax, Revenue Bonds | | | | | | | | |
Series A
5.00%, due 3/15/30 | | | 12,350,000 | | | | 14,918,800 | |
Series A
5.00%, due 3/15/43 | | | 10,360,000 | | | | 12,676,807 | |
New York Transportation Development Corp., LaGuardia Airport Terminal B Redevelopment Project, Revenue Bonds (b) | | | | | | | | |
Insured: AGM
4.00%, due 7/1/31 | | | 10,925,000 | | | | 11,802,824 | |
Series A, Insured: AGM
4.00%, due 7/1/36 | | | 24,800,000 | | | | 26,526,576 | |
Rensselaer City School District, Certificates of Participation | | | | | | | | |
Insured: AGM
5.00%, due 6/1/30 | | | 1,880,000 | | | | 2,255,342 | |
Insured: AGM
5.00%, due 6/1/32 | | | 2,000,000 | | | | 2,383,440 | |
| | | | | | |
The notes to the financial statements are an integral part of,
and should be read in conjunction with, the financial statements. | | | | | 27 | |
Portfolio of InvestmentsOctober 31, 2019 (continued)
| | | | | | | | |
| | | Principal
Amount | | | Value | |
| Long-Term Municipal Bonds (continued) | |
New York (continued) | | | | | | | | |
Suffolk County NY, Public Improvement, Limited General Obligation
Series B, Insured: AGM
5.00%, due 10/15/28 | | $ | 4,020,000 | | | $ | 4,961,203 | |
Triborough Bridge & Tunnel Authority, Revenue Bonds | | | | | | | | |
Series B
5.00%, due 11/15/35 | | | 8,560,000 | | | | 10,448,678 | |
Series B
5.00%, due 11/15/38 | | | 3,600,000 | | | | 4,351,464 | |
Series A
5.00%, due 11/15/43 | | | 6,000,000 | | | | 7,434,960 | |
Series A
5.00%, due 11/15/44 | | | 3,150,000 | | | | 3,824,383 | |
Series A
5.00%, due 11/15/45 | | | 12,540,000 | | | | 15,205,377 | |
Series A
5.00%, due 11/15/46 | | | 5,000,000 | | | | 6,054,250 | |
TSASC, Inc., Revenue Bonds | | | | | | | | |
Series A
5.00%, due 6/1/34 | | | 6,990,000 | | | | 8,259,454 | |
Series A
5.00%, due 6/1/35 | | | 2,865,000 | | | | 3,376,202 | |
| | | | | | | | |
| | | | | | | 665,588,568 | |
| | | | | | | | |
North Carolina 0.1% | |
North Carolina Medical Care Commission, North Carolina Baptist Hospital, Revenue Bonds
5.25%, due 6/1/25 | | | 1,000,000 | | | | 1,023,420 | |
North Carolina State Housing Finance Agency, Revenue Bonds
Series 42, Insured: GNMA/FNMA
4.00%, due 1/1/50 | | | 5,000,000 | | | | 5,507,550 | |
| | | | | | | | |
| | | | | | | 6,530,970 | |
| | | | | | | | |
North Dakota 0.7% | |
North Dakota Board of Higher Education, University of North Dakota Housing & Auxiliary Facilities, Revenue Bonds | | | | | | | | |
Series A, Insured: AGM
4.00%, due 4/1/44 | | | 5,500,000 | | | | 6,061,605 | |
Series A, Insured: AGM
4.00%, due 4/1/50 | | | 13,000,000 | | | | 14,218,230 | |
North Dakota Housing Finance Agency, Home Mortgage Finance Program, Revenue Bonds | | | | | | | | |
Series D
4.25%, due 1/1/49 | | | 8,980,000 | | | | 9,822,504 | |
Series A
4.25%, due 7/1/49 | | | 3,000,000 | | | | 3,305,070 | |
| | | | | | | | |
| | | | | | | 33,407,409 | |
| | | | | | | | |
| | | | | | | | |
| | | Principal
Amount | | | Value | |
Ohio 1.5% | |
City of Cleveland OH, Income Tax, Bridges & Roadways Improvements, Revenue Bonds
Series A-2
5.00%, due 10/1/37 | | $ | 380,000 | | | $ | 435,438 | |
Clermont County Port Authority, W. Clermont Local School District Project, Revenue Bonds | | | | | | | | |
Insured: BAM
5.00%, due 12/1/31 | | | 650,000 | | | | 766,188 | |
Insured: BAM
5.00%, due 12/1/32 | | | 2,200,000 | | | | 2,585,792 | |
Insured: BAM
5.00%, due 12/1/33 | | | 1,335,000 | | | | 1,565,795 | |
Cleveland-Cuyahoga County Port Authority, Revenue Bonds
6.00%, due 11/15/25 | | | 1,980,000 | | | | 2,073,713 | |
County of Hamilton OH, Christ Hospital Project, Revenue Bonds
5.50%, due 6/1/42 | | | 2,000,000 | | | | 2,169,460 | |
Ohio Housing Finance Agency, Residential Mortgage Revenue, Revenue Bonds
Series A, Insured: GNMA/FNMA/FHLMC 4.50%, due 9/1/48 | | | 5,820,000 | | | | 6,443,904 | |
Ohio State Water Development Authority, Revenue Bonds | | | | | | | | |
Series B
3.00%, due 12/1/33 | | | 2,120,000 | | | | 2,265,241 | |
Series B
3.00%, due 12/1/34 | | | 2,100,000 | | | | 2,237,235 | |
State of Ohio, Unlimited General Obligation | | | | | | | | |
Series A
5.00%, due 5/1/36 | | | 7,150,000 | | | | 8,710,773 | |
Series A
5.00%, due 2/1/38 | | | 5,690,000 | | | | 6,721,825 | |
Series A
5.00%, due 5/1/38 | | | 14,500,000 | | | | 17,554,570 | |
Series A
5.00%, due 6/15/39 | | | 5,000,000 | | | | 6,286,550 | |
University of Cincinnati, Revenue Bonds
Series A
5.00%, due 6/1/45 | | | 10,000,000 | | | | 11,944,000 | |
| | | | | | | | |
| | | | | | | 71,760,484 | |
| | | | | | | | |
Oklahoma 1.1% | |
Garfield County Educational Facilities Authority, Enid Public Schools Project, Revenue Bonds | | | | | | | | |
Series A
5.00%, due 9/1/26 | | | 1,800,000 | | | | 2,196,216 | |
| | | | |
| 28 | | MainStay MacKay Tax Free Bond Fund | | The notes to the financial statements are an integral part of,
and should be read in conjunction with, the financial statements. |
| | | | | | | | |
| | | Principal
Amount | | | Value | |
| Long-Term Municipal Bonds (continued) | |
Oklahoma (continued) | |
Garfield County Educational Facilities Authority, Enid Public Schools Project, Revenue Bonds (continued) | | | | | | | | |
Series A
5.00%, due 9/1/27 | | $ | 3,780,000 | | | $ | 4,576,748 | |
Series A
5.00%, due 9/1/28 | | | 5,000,000 | | | | 6,035,400 | |
Series A
5.00%, due 9/1/29 | | | 4,620,000 | | | | 5,554,072 | |
Lincoln County Educational Facilities Authority, Stroud Public Schools Project, Revenue Bonds | | | | | | | | |
5.00%, due 9/1/28 | | | 3,200,000 | | | | 3,839,872 | |
5.00%, due 9/1/29 | | | 2,370,000 | | | | 2,832,363 | |
Oklahoma Housing Finance Agency, Homeownership Loan Program, Revenue Bonds
Series A
4.75%, due 9/1/48 | | | 3,205,000 | | | | 3,589,408 | |
Oklahoma Housing Finance Agency, Single Family Mortgage Program, Revenue Bonds
Series A, Insured: GNMA/FNMA/FHLMC
4.00%, due 9/1/49 | | | 5,500,000 | | | | 6,052,640 | |
Oklahoma Municipal Power Authority, Revenue Bonds
Series A
4.00%, due 1/1/47 | | | 7,650,000 | | | | 7,977,726 | |
Oklahoma State Municipal Power Authority, Revenue Bonds | | | | | | | | |
Series A
5.00%, due 1/1/29 | | | 250,000 | | | | 299,067 | |
Series A
5.00%, due 1/1/30 | | | 900,000 | | | | 1,072,998 | |
Series A
5.00%, due 1/1/32 | | | 805,000 | | | | 952,613 | |
Tulsa Airports Improvement Trust, Revenue Bonds
Series D, Insured: BAM
5.00%, due 6/1/28 | | | 500,000 | | | | 510,265 | |
Weatherford Industrial Trust Educational Facilities, Weatherford Public Schools Project, Revenue Bonds | | | | | | | | |
5.00%, due 3/1/31 | | | 1,820,000 | | | | 2,252,050 | |
5.00%, due 3/1/33 | | | 2,500,000 | | | | 3,069,600 | |
| | | | | | | | |
| | | | | | | 50,811,038 | |
| | | | | | | | |
Oregon 0.3% | |
Marion & Polk Counties, Salem-Keizer School District No. 24J, Unlimited General Obligation Insured: School Bond Guaranty
5.00%, due 6/15/39 | | | 4,000,000 | | | | 4,970,560 | |
| | | | | | | | |
| | | Principal
Amount | | | Value | |
Oregon (continued) | | | | | | | | |
Oregon State Housing & Community Services Department, Single Family Mortgage Program, Revenue Bonds
Series C
4.50%, due 7/1/49 | | $ | 10,510,000 | | | $ | 11,600,307 | |
| | | | | | | | |
| | | | | | | 16,570,867 | |
| | | | | | | | |
Pennsylvania 2.1% | |
Commonwealth Financing Authority PA, Tobacco Master Settlement Payment, Revenue Bonds
Insured: AGM
4.00%, due 6/1/39 | | | 6,000,000 | | | | 6,638,160 | |
Commonwealth Financing Authority, Tobacco Master Settlement Payment, Revenue Bonds
Insured: BAM
5.00%, due 6/1/31 | | | 10,000,000 | | | | 12,376,900 | |
County of Lancaster PA, Unlimited General Obligation | | | | | | | | |
Series A, Insured: BAM
4.00%, due 5/1/30 | | | 500,000 | | | | 551,945 | |
Series A, Insured: BAM
4.00%, due 5/1/31 | | | 420,000 | | | | 462,445 | |
Cumberland County Municipal Authority, Penn State Health Obligated Group, Revenue Bonds | | | | | | | | |
4.00%, due 11/1/36 | | | 1,250,000 | | | | 1,409,750 | |
4.00%, due 11/1/37 | | | 2,100,000 | | | | 2,357,775 | |
Pennsylvania State Housing Finance Agency, Revenue Bonds | | | | | | | | |
Series 127B
3.55%, due 10/1/33 | | | 4,000,000 | | | | 4,284,800 | |
Series 130A
4.00%, due 10/1/49 | | | 4,000,000 | | | | 4,331,560 | |
Pennsylvania Turnpike Commission, Revenue Bonds
Series A, Insured: BAM
5.00%, due 12/1/44 | | | 7,500,000 | | | | 9,137,700 | |
Philadelphia Gas Works Co., 1998 General Ordinance, Revenue Bonds
Series 14T
5.00%, due 10/1/31 | | | 2,300,000 | | | | 2,751,950 | |
Pittsburgh Water & Sewer Authority, Revenue Bonds
Series A, Insured: AGM
5.00%, due 9/1/44 | | | 4,530,000 | | | | 5,543,452 | |
State Public School Building Authority, Philadelphia Community College, Revenue Bonds
Series A, Insured: BAM
5.00%, due 6/15/28 | | | 5,505,000 | | | | 6,408,205 | |
| | | | | | |
The notes to the financial statements are an integral part of,
and should be read in conjunction with, the financial statements. | | | | | 29 | |
Portfolio of InvestmentsOctober 31, 2019 (continued)
| | | | | | | | |
| | | Principal
Amount | | | Value | |
| Long-Term Municipal Bonds (continued) | |
Pennsylvania (continued) | | | | | | | | |
State Public School Building Authority, Philadelphia School District, Revenue Bonds
Series A, Insured: AGM
5.00%, due 6/1/31 | | $ | 30,000,000 | | | $ | 35,403,900 | |
West Chester Area School District, Limited General Obligation | | | | | | | | |
4.00%, due 5/15/36 | | | 4,150,000 | | | | 4,711,537 | |
4.00%, due 5/15/37 | | | 4,385,000 | | | | 4,962,548 | |
| | | | | | | | |
| | | | | | | 101,332,627 | |
| | | | | | | | |
Puerto Rico 3.6% | |
Commonwealth of Puerto Rico, Aqueduct & Sewer Authority, Revenue Bonds
Series A, Insured: AGC
5.125%, due 7/1/47 | | | 14,410,000 | | | | 14,818,235 | |
Commonwealth of Puerto Rico, Public Improvement, Unlimited General Obligation | | | | | | | | |
Series A, Insured: AGM
4.00%, due 7/1/22 | | | 715,000 | | | | 734,963 | |
Series A, Insured: AGC
5.00%, due 7/1/26 | | | 575,000 | | | | 589,685 | |
Series A, Insured: AGC
5.00%, due 7/1/27 | | | 525,000 | | | | 538,345 | |
Series A-4, Insured: AGM
5.00%, due 7/1/31 | | | 5,170,000 | | | | 5,235,556 | |
Series A, Insured: AGM
5.00%, due 7/1/35 | | | 32,580,000 | | | | 34,149,704 | |
Insured: AGM
5.25%, due 7/1/20 | | | 1,430,000 | | | | 1,457,356 | |
Series A, Insured: NATL-RE
5.25%, due 7/1/21 | | | 440,000 | | | | 446,864 | |
Series A, Insured: AGM
5.25%, due 7/1/24 | | | 1,955,000 | | | | 2,051,186 | |
Series C, Insured: AGM
5.375%, due 7/1/28 | | | 700,000 | | | | 722,183 | |
Series A, Insured: NATL-RE
5.50%, due 7/1/20 | | | 4,850,000 | | | | 4,933,032 | |
Series C, Insured: AGM
5.75%, due 7/1/37 | | | 1,150,000 | | | | 1,187,812 | |
Series C-7, Insured: NATL-RE
6.00%, due 7/1/27 | | | 2,240,000 | | | | 2,307,670 | |
Commonwealth of Puerto Rico, Unrefunded, Unlimited General Obligation | | | | | | | | |
Series A, Insured: AGC
5.00%, due 7/1/34 | | | 285,000 | | | | 291,119 | |
Insured: AGC
5.25%, due 7/1/32 | | | 500,000 | | | | 514,085 | |
| | | | | | | | |
| | | Principal
Amount | | | Value | |
Puerto Rico (continued) | | | | | | | | |
Puerto Rico Commonwealth, Aqueduct & Sewer Authority, Revenue Bonds | | | | | | | | |
Series A, Insured: AGC
5.00%, due 7/1/28 | | $ | 4,350,000 | | | $ | 4,460,142 | |
Series A, Insured: AGC
6.125%, due 7/1/24 | | | 660,000 | | | | 711,249 | |
Puerto Rico Convention Center District Authority, Revenue Bonds
Series A, Insured: AGC
4.50%, due 7/1/36 | | | 4,855,000 | | | | 4,868,060 | |
Puerto Rico Electric Power Authority, Revenue Bonds | | | | | | | | |
Series DDD, Insured: AGM
3.625%, due 7/1/23 | | | 3,115,000 | | | | 3,115,343 | |
Series UU, Insured: AGC
4.25%, due 7/1/27 | | | 2,345,000 | | | | 2,349,667 | |
Series NN, Insured: NATL-RE
4.75%, due 7/1/33 | | | 1,140,000 | | | | 1,141,482 | |
Series RR, Insured: NATL-RE
5.00%, due 7/1/21 | | | 1,200,000 | | | | 1,217,532 | |
Series RR, Insured: NATL-RE
5.00%, due 7/1/22 | | | 1,450,000 | | | | 1,474,563 | |
Series SS, Insured: NATL-RE
5.00%, due 7/1/23 | | | 825,000 | | | | 840,964 | |
Series PP, Insured: NATL-RE
5.00%, due 7/1/23 | | | 1,105,000 | | | | 1,126,382 | |
Series UU, Insured: AGM
5.00%, due 7/1/23 | | | 2,290,000 | | | | 2,346,334 | |
Series UU, Insured: AGM
5.00%, due 7/1/24 | | | 4,415,000 | | | | 4,527,627 | |
Series PP, Insured: NATL-RE
5.00%, due 7/1/24 | | | 2,915,000 | | | | 2,978,372 | |
Series TT, Insured: AGM
5.00%, due 7/1/27 | | | 500,000 | | | | 512,710 | |
Series SS, Insured: AGM
5.00%, due 7/1/30 | | | 550,000 | | | | 562,881 | |
Series VV, Insured: NATL-RE
5.25%, due 7/1/26 | | | 1,875,000 | | | | 2,005,256 | |
Series VV, Insured: NATL-RE
5.25%, due 7/1/29 | | | 1,470,000 | | | | 1,579,324 | |
Series VV, Insured: NATL-RE
5.25%, due 7/1/32 | | | 2,000,000 | | | | 2,138,860 | |
Series VV, Insured: NATL-RE
5.25%, due 7/1/34 | | | 550,000 | | | | 587,301 | |
Series VV, Insured: NATL-RE
5.25%, due 7/1/35 | | | 620,000 | | | | 661,850 | |
Puerto Rico Highway & Transportation Authority, Revenue Bonds | | | | | | | | |
Series L, Insured: NATL-RE
5.25%, due 7/1/24 | | | 2,195,000 | | | | 2,325,427 | |
Series N, Insured: NATL-RE
5.25%, due 7/1/32 | | | 5,525,000 | | | | 5,908,601 | |
| | | | |
| 30 | | MainStay MacKay Tax Free Bond Fund | | The notes to the financial statements are an integral part of,
and should be read in conjunction with, the financial statements. |
| | | | | | | | |
| | | Principal
Amount | | | Value | |
| Long-Term Municipal Bonds (continued) | |
Puerto Rico (continued) | | | | | | | | |
Puerto Rico Highway & Transportation Authority, Revenue Bonds (continued) | | | | | | | | |
Series CC, Insured: AGM
5.25%, due 7/1/33 | | $ | 2,165,000 | | | $ | 2,433,503 | |
Series N, Insured: NATL-RE
5.25%, due 7/1/33 | | | 5,030,000 | | | | 5,376,014 | |
Series N, Insured: AGC
5.25%, due 7/1/34 | | | 5,125,000 | | | | 5,763,985 | |
Series CC, Insured: AGM
5.25%, due 7/1/36 | | | 2,355,000 | | | | 2,642,899 | |
Series N, Insured: AGC, AGM
5.25%, due 7/1/36 | | | 1,425,000 | | | | 1,599,206 | |
Series N, Insured: AGC
5.25%, due 7/1/36 | | | 2,990,000 | | | | 3,355,468 | |
Series N, Insured: AGC
5.25%, due 7/1/39 | | | 135,000 | | | | 150,894 | |
Series L, Insured: AGC
5.25%, due 7/1/41 | | | 2,535,000 | | | | 2,829,947 | |
Series E, Insured: AGM
5.50%, due 7/1/21 | | | 670,000 | | | | 701,309 | |
Series N, Insured: AGC, AGM
5.50%, due 7/1/26 | | | 350,000 | | | | 391,430 | |
Series N, Insured: AGC, AGM
5.50%, due 7/1/29 | | | 10,325,000 | | | | 11,757,800 | |
Series CC, Insured: AGC
5.50%, due 7/1/31 | | | 1,780,000 | | | | 2,036,516 | |
Puerto Rico Highway & Transportation Authority, Unrefunded, Revenue Bonds | | | | | | | | |
Series D, Insured: AGM
5.00%, due 7/1/27 | | | 2,240,000 | | | | 2,296,941 | |
Series J, Insured: NATL-RE
5.00%, due 7/1/29 | | | 650,000 | | | | 666,451 | |
Puerto Rico Municipal Finance Agency, Revenue Bonds | | | | | | | | |
Series A, Insured: AGM
4.75%, due 8/1/22 | | | 820,000 | | | | 837,851 | |
Series A, Insured: AGM
5.00%, due 8/1/21 | | | 195,000 | | | | 198,520 | |
Series A, Insured: AGM
5.00%, due 8/1/27 | | | 290,000 | | | | 297,372 | |
Series A, Insured: AGM
5.00%, due 8/1/30 | | | 1,720,000 | | | | 1,760,282 | |
Series C, Insured: AGC
5.25%, due 8/1/20 | | | 210,000 | | | | 214,521 | |
Series C, Insured: AGC
5.25%, due 8/1/23 | | | 340,000 | | | | 365,622 | |
Puerto Rico Public Buildings Authority, Government Facilities, Revenue Bonds | | | | | | | | |
Series F, Insured: NATL-RE, XLCA
5.25%, due 7/1/23 | | | 265,000 | | | | 279,384 | |
Series K, Insured: AGM
5.25%, due 7/1/27 | | | 1,150,000 | | | | 1,167,871 | |
| | | | | | | | |
| | | Principal
Amount | | | Value | |
Puerto Rico (continued) | | | | | | | | |
Puerto Rico Public Buildings Authority, Government Facilities, Revenue Bonds (continued) | | | | | | | | |
Series M-3, Insured: NATL-RE
6.00%, due 7/1/26 | | $ | 300,000 | | | $ | 308,940 | |
Series M-3, Insured: NATL-RE
6.00%, due 7/1/27 | | | 7,465,000 | | | | 7,690,518 | |
Puerto Rico Sales Tax Financing Corp Sales Tax Revenue, COFINA Senior Bonds, 2042 National Custodial Trust, Revenue Bonds
Series 2007-A
(zero coupon), due 8/1/42 | | | 7,862,713 | | | | 563,565 | |
Puerto Rico Sales Tax Financing Corp Sales Tax, Revenue Bonds | | | | | | | | |
Series 2007-A
(zero coupon), due 8/1/45 | | | 15,955,041 | | | | 1,143,584 | |
Insured: BHAC
(zero coupon), due 8/1/54 | | | 236,816 | | | | 46,357 | |
| | | | | | | | |
| | | | | | | 174,294,472 | |
| | | | | | | | |
Rhode Island 0.5% | |
City of Cranston RI, Unlimited General Obligation
Series A, Insured: BAM
5.00%, due 8/1/37 | | | 1,335,000 | | | | 1,650,180 | |
Providence Public Buildings Authority, Revenue Bonds
Series A, Insured: AGM
5.875%, due 6/15/26 | | | 1,565,000 | | | | 1,668,822 | |
Rhode Island Health & Educational Building Corp., Hospital Financing-Lifespan Obligated Group, Revenue Bonds
5.00%, due 5/15/26 | | | 5,000,000 | | | | 5,970,300 | |
Rhode Island Health & Educational Building Corp., Public Schools Financing Program, Revenue Bonds | | | | | | | | |
Series B
5.00%, due 5/15/33 | | | 1,045,000 | | | | 1,315,770 | |
Series B
5.00%, due 5/15/34 | | | 1,095,000 | | | | 1,373,152 | |
Series B
5.00%, due 5/15/35 | | | 1,150,000 | | | | 1,432,360 | |
Series B
5.00%, due 5/15/36 | | | 1,205,000 | | | | 1,491,802 | |
Series B
5.00%, due 5/15/37 | | | 1,265,000 | | | | 1,560,491 | |
Rhode Island Health & Educational Building Corp., Rhode Island School of Design, Revenue Bonds | | | | | | | | |
5.00%, due 8/15/29 | | | 500,000 | | | | 633,050 | |
5.00%, due 8/15/31 | | | 400,000 | | | | 500,528 | |
5.00%, due 8/15/33 | | | 450,000 | | | | 558,302 | |
| | | | | | |
The notes to the financial statements are an integral part of,
and should be read in conjunction with, the financial statements. | | | | | 31 | |
Portfolio of InvestmentsOctober 31, 2019 (continued)
| | | | | | | | |
| | | Principal
Amount | | | Value | |
| Long-Term Municipal Bonds (continued) | |
Rhode Island (continued) | | | | | | | | |
Rhode Island Housing & Mortgage Finance Corp., Homeownership Opportunity, Revenue Bonds
Series 69-B, Insured: GNMA/FNMA/FHLMC
4.00%, due 10/1/48 | | $ | 5,400,000 | | | $ | 5,869,638 | |
| | | | | | | | |
| | | | | | | 24,024,395 | |
| | | | | | | | |
South Carolina 2.6% | |
Patriots Energy Group Financing Agency, Gas Supply, Revenue Bonds
Series A
4.00%, due 10/1/48 (a) | | | 4,300,000 | | | | 4,682,313 | |
Piedmont Municipal Power Agency, Revenue Bonds
Series C, Insured: AGC
5.75%, due 1/1/34 | | | 10,345,000 | | | | 11,057,046 | |
South Carolina Public Service Authority, Revenue Bonds | | | | | | | | |
Series C
5.00%, due 12/1/29 | | | 5,000,000 | | | | 5,798,250 | |
Series A
5.00%, due 12/1/32 | | | 10,000,000 | | | | 11,861,900 | |
Series B
5.00%, due 12/1/41 | | | 3,500,000 | | | | 4,106,900 | |
Series B
5.00%, due 12/1/46 | | | 3,125,000 | | | | 3,644,625 | |
Series B
5.00%, due 12/1/56 | | | 2,500,000 | | | | 2,888,325 | |
Series E
5.25%, due 12/1/55 | | | 27,430,000 | | | | 31,667,661 | |
South Carolina Public Service Authority, Santee Cooper Project, Revenue Bonds | | | | | | | | |
Series A
5.00%, due 12/1/25 | | | 6,445,000 | | | | 6,923,219 | |
Series D
5.00%, due 12/1/26 | | | 2,595,000 | | | | 2,818,663 | |
Series C
5.00%, due 12/1/36 | | | 3,860,000 | | | | 4,106,577 | |
Series D
5.00%, due 12/1/43 | | | 5,150,000 | | | | 5,494,998 | |
South Carolina State Housing Finance & Development Authority, Revenue Bonds
Series A
4.50%, due 7/1/48 | | | 3,865,000 | | | | 4,254,592 | |
South Carolina Transportation Infrastructure Bank, Revenue Bonds | | | | | | | | |
Insured: AGM
5.00%, due 10/1/35 | | | 5,210,000 | | | | 6,393,608 | |
5.00%, due 10/1/36 | | | 15,000,000 | | | | 18,276,900 | |
| | | | | | | | |
| | | Principal
Amount | | | Value | |
South Carolina (continued) | | | | | | | | |
Sumter Two School Facilities Inc., Sumter School District Project, Revenue Bonds Insured: BAM
5.00%, due 12/1/27 | | $ | 1,100,000 | | | $ | 1,291,466 | |
| | | | | | | | |
| | | | | | | 125,267,043 | |
| | | | | | | | |
South Dakota 0.3% | |
South Dakota Conservancy District, Revenue Bonds | | | | | | | | |
5.00%, due 8/1/37 | | | 1,750,000 | | | | 2,184,543 | |
5.00%, due 8/1/38 | | | 3,000,000 | | | | 3,731,850 | |
South Dakota Housing Development Authority, Revenue Bonds | | | | | | | | |
Series A
4.00%, due 5/1/49 | | | 4,960,000 | | | | 5,414,584 | |
Series B
4.00%, due 11/1/49 | | | 5,000,000 | | | | 5,509,600 | |
| | | | | | | | |
| | | | | | | 16,840,577 | |
| | | | | | | | |
Tennessee 0.6% | |
Chattanooga Health Educational & Housing Facility Board, CommonSpirit Health Obligated Group, Revenue Bonds | | | | | | | | |
Series A-1
4.00%, due 8/1/36 | | | 1,000,000 | | | | 1,101,350 | |
Series A-1
4.00%, due 8/1/38 | | | 1,000,000 | | | | 1,091,790 | |
Johnson City Health & Educational Facilities Board, Mountain States Health Alliance, Revenue Bonds
Series A
6.00%, due 7/1/38 | | | 3,605,000 | | | | 3,718,305 | |
Tennessee Housing & Development Agency, Residential Finance Program, Revenue Bonds | | | | | | | | |
Issue 3
4.25%, due 7/1/49 | | | 3,870,000 | | | | 4,233,819 | |
4.25%, due 1/1/50 | | | 9,950,000 | | | | 10,983,407 | |
4.50%, due 7/1/49 | | | 7,905,000 | | | | 8,750,835 | |
| | | | | | | | |
| | | | | | | 29,879,506 | |
| | | | | | | | |
Texas 7.1% | |
Bexar County Hospital District, Limited General Obligation | | | | | | | | |
4.00%, due 2/15/37 | | | 4,200,000 | | | | 4,703,412 | |
5.00%, due 2/15/48 | | | 2,300,000 | | | | 2,712,919 | |
Brazoria County Municipal Utility District No. 34, Unlimited General Obligation Insured: NATL-RE
3.00%, due 9/1/29 | | | 600,000 | | | | 613,416 | |
| | | | |
| 32 | | MainStay MacKay Tax Free Bond Fund | | The notes to the financial statements are an integral part of,
and should be read in conjunction with, the financial statements. |
| | | | | | | | |
| | | Principal
Amount | | | Value | |
| Long-Term Municipal Bonds (continued) | |
Texas (continued) | | | | | | | | |
Central Texas Turnpike System, Revenue Bonds | | | | | | | | |
Series C
5.00%, due 8/15/34 | | $ | 5,000,000 | | | $ | 5,660,900 | |
Series C
5.00%, due 8/15/37 | | | 2,135,000 | | | | 2,403,241 | |
City of Austin TX, Airport System, Revenue Bonds (b) | | | | | | | | |
5.00%, due 11/15/24 | | | 4,000,000 | | | | 4,674,240 | |
5.00%, due 11/15/25 | | | 4,000,000 | | | | 4,784,480 | |
Series B
5.00%, due 11/15/44 | | | 9,675,000 | | | | 11,799,437 | |
City of Donna TX, Tax & Toll Bridge, Limited General Obligation Insured: BAM
5.00%, due 2/15/30 | | | 1,035,000 | | | | 1,175,563 | |
City of Houston TX, Utility System, Revenue Bonds | | | | | | | | |
Series B
5.00%, due 11/15/33 | | | 2,000,000 | | | | 2,418,640 | |
Series B
5.00%, due 11/15/34 | | | 1,500,000 | | | | 1,921,425 | |
Series B
5.00%, due 11/15/35 | | | 1,555,000 | | | | 1,985,517 | |
City of Houston, Limited General Obligation
Series A
5.00%, due 3/1/29 | | | 5,000,000 | | | | 6,155,650 | |
Dallas Area Rapid Transit Sales Tax Revenue, Revenue Bonds | | | | | | | | |
Series B
4.00%, due 12/1/36 | | | 7,500,000 | | | | 8,439,075 | |
Series B
4.00%, due 12/1/37 | | | 6,155,000 | | | | 6,881,844 | |
Dallas County Hospital District, Limited General Obligation
5.00%, due 8/15/30 | | | 12,170,000 | | | | 15,246,454 | |
Dallas-Fort Worth International Airport, Revenue Bonds
Series C
5.125%, due 11/1/43 (b) | | | 5,000,000 | | | | 5,467,950 | |
Fort Bend Independent School District, Unlimited General Obligation | | | | | | | | |
Series B, Insured: PSF
5.00%, due 2/15/30 | | | 1,765,000 | | | | 2,225,753 | |
Series B, Insured: PSF
5.00%, due 2/15/31 | | | 3,250,000 | | | | 4,080,213 | |
Grand Parkway Transportation Corp., Revenue Bonds
Series A
5.00%, due 10/1/43 | | | 13,450,000 | | | | 16,233,074 | |
| | | | | | | | |
| | | Principal
Amount | | | Value | |
Texas (continued) | | | | | | | | |
Harris County Cultural Education Facilities Finance Corp., Memorial Hermann Health System, Revenue Bonds
5.00%, due 7/1/38 | | $ | 4,280,000 | | | $ | 4,955,769 | |
La Joya Independent School District, Limited General Obligation | | | | | | | | |
Insured: AGM
4.00%, due 2/15/35 | | | 930,000 | | | | 1,024,981 | |
Insured: AGM
5.00%, due 2/15/27 | | | 1,490,000 | | | | 1,818,158 | |
Insured: AGM
5.00%, due 2/15/28 | | | 1,565,000 | | | | 1,900,693 | |
Insured: AGM
5.00%, due 2/15/34 | | | 525,000 | | | | 625,958 | |
Little Elm Independent School District, Unlimited General Obligation Insured: PSF
5.00%, due 8/15/46 | | | 30,000,000 | | | | 36,242,700 | |
North Harris County Regional Water Authority, Senior Lien, Revenue Bonds Insured: BAM
5.00%, due 12/15/32 | | | 3,215,000 | | | | 3,562,445 | |
North Texas Tollway Authority, Revenue Bonds | | | | | | | | |
Series A
5.00%, due 1/1/34 | | | 1,400,000 | | | | 1,618,260 | |
Series A
5.00%, due 1/1/35 | | | 2,950,000 | | | | 3,404,507 | |
Series A, Insured: BAM
5.00%, due 1/1/38 | | | 9,500,000 | | | | 10,884,150 | |
Series B
5.00%, due 1/1/40 | | | 22,140,000 | | | | 24,350,900 | |
San Antonio Independent School District, Unlimited General Obligation Insured: PSF
4.00%, due 8/15/37 | | | 3,955,000 | | | | 4,528,989 | |
San Antonio Water System, Revenue Bonds | | | | | | | | |
Series C
5.00%, due 5/15/34 | | | 4,500,000 | | | | 5,748,705 | |
Series C
5.00%, due 5/15/37 | | | 2,230,000 | | | | 2,821,017 | |
Series C
5.00%, due 5/15/38 | | | 2,350,000 | | | | 2,962,551 | |
Tarrant County Cultural Education Facilities Finance Corp., Buckner Retirement Services, Revenue Bonds | | | | | | | | |
Series A
5.00%, due 11/15/23 | | | 1,245,000 | | | | 1,389,980 | |
Series A
5.00%, due 11/15/24 | | | 1,305,000 | | | | 1,488,261 | |
| | | | | | |
The notes to the financial statements are an integral part of,
and should be read in conjunction with, the financial statements. | | | | | 33 | |
Portfolio of InvestmentsOctober 31, 2019 (continued)
| | | | | | | | |
| | | Principal
Amount | | | Value | |
| Long-Term Municipal Bonds (continued) | |
Texas (continued) | | | | | | | | |
Tarrant County Cultural Education Facilities Finance Corp., Buckner Retirement Services, Revenue Bonds (continued) | | | | | | | | |
Series A
5.00%, due 11/15/25 | | $ | 1,370,000 | | | $ | 1,593,283 | |
Series A
5.00%, due 11/15/26 | | | 1,440,000 | | | | 1,700,424 | |
Series B
5.00%, due 11/15/46 | | | 3,590,000 | | | | 4,025,718 | |
Texas Department of Housing & Community Affairs, Revenue Bonds | | | | | | | | |
Series A, Insured: GNMA
4.00%, due 3/1/50 | | | 6,600,000 | | | | 7,370,616 | |
Series A, Insured: GNMA/FNMA
4.75%, due 1/1/49 | | | 6,965,000 | | | | 7,823,993 | |
Series A, Insured: GNMA
4.75%, due 3/1/49 | | | 4,875,000 | | | | 5,432,846 | |
Texas Municipal Gas Acquisition & Supply Corp. III, Revenue Bonds | | | | | | | | |
5.00%, due 12/15/30 | | | 17,100,000 | | | | 18,589,410 | |
5.00%, due 12/15/31 | | | 4,575,000 | | | | 4,967,764 | |
Texas Private Activity Bond Surface Transportation Corp., Senior Lien, LBJ Infrastructure, Revenue Bonds | | | | | | | | |
7.00%, due 6/30/40 | | | 5,020,000 | | | | 5,207,999 | |
7.50%, due 6/30/32 | | | 4,095,000 | | | | 4,271,740 | |
7.50%, due 6/30/33 | | | 5,500,000 | | | | 5,735,510 | |
Texas Public Finance Authority, Financing System-Texas Southern University, Revenue Bonds | | | | | | | | |
Insured: BAM
4.00%, due 5/1/31 | | | 1,000,000 | | | | 1,091,880 | |
Insured: BAM
4.00%, due 5/1/32 | | | 1,295,000 | | | | 1,408,144 | |
Texas State Municipal Power Agency, Revenue Bonds | | | | | | | | |
5.00%, due 9/1/42 | | | 1,900,000 | | | | 1,953,086 | |
5.00%, due 9/1/47 | | | 2,750,000 | | | | 2,824,635 | |
Texas State University System, Revenue Bonds | | | | | | | | |
Series A
3.00%, due 3/15/37 | | | 1,000,000 | | | | 1,027,470 | |
Series A
4.00%, due 3/15/35 | | | 2,000,000 | | | | 2,301,060 | |
Texas Water Development Board, Revenue Bonds | | | | | | | | |
Series A
4.00%, due 10/15/36 | | | 2,000,000 | | | | 2,323,740 | |
Series A
4.00%, due 10/15/37 | | | 3,000,000 | | | | 3,464,400 | |
Series A
4.00%, due 10/15/44 | | | 4,500,000 | | | | 5,100,255 | |
| | | | | | | | |
| | | Principal
Amount | | | Value | |
Texas (continued) | | | | | | | | |
Texas Water Development Board, Water Implementation Fund, Revenue Bonds | | | | | | | | |
4.00%, due 10/15/41 | | $ | 7,500,000 | | | $ | 8,317,275 | |
Series B
5.00%, due 4/15/30 | | | 5,000,000 | | | | 6,382,900 | |
Town of Prosper TX, Unlimited General Obligation
4.00%, due 2/15/31 | | | 1,235,000 | | | | 1,424,437 | |
University of Houston, Revenue Bonds
Series A
5.00%, due 2/15/33 | | | 5,000,000 | | | | 5,945,000 | |
University of Texas, Revenue Bonds
Series A
4.00%, due 8/15/37 | | | 11,185,000 | | | | 13,027,953 | |
Viridian Municipal Management District, Unlimited General Obligation Insured: BAM
6.00%, due 12/1/32 | | | 500,000 | | | | 608,210 | |
West Harris County Regional Water Authority, Revenue Bonds
5.00%, due 12/15/39 | | | 1,200,000 | | | | 1,505,040 | |
| | | | | | | | |
| | | | | | | 344,336,015 | |
| | | | | | | | |
U.S. Virgin Islands 1.0% | |
Virgin Islands Public Finance Authority, Matching Fund Loan, Revenue Bonds | | | | | | | | |
Series A
5.00%, due 10/1/32 | | | 5,100,000 | | | | 5,119,125 | |
Series A
6.625%, due 10/1/29 | | | 6,960,000 | | | | 6,977,678 | |
Series A
6.75%, due 10/1/37 | | | 5,000,000 | | | | 5,009,600 | |
Virgin Islands Public Finance Authority, Revenue Bonds | | | | | | | | |
5.00%, due 9/1/30 (d) | | | 5,000,000 | | | | 5,556,500 | |
Series A, Insured: AGM
5.00%, due 10/1/32 | | | 15,655,000 | | | | 16,988,806 | |
Series C, Insured: AGM
5.00%, due 10/1/39 | | | 5,920,000 | | | | 6,611,634 | |
| | | | | | | | |
| | | | | | | 46,263,343 | |
| | | | | | | | |
Utah 0.9% | |
City of Herriman UT, Special Assessment, Towne Centre Assessment Area
5.00%, due 11/1/29 | | | 55,000 | | | | 56,054 | |
Utah Housing Corp., Revenue Bonds | | | | | | | | |
Series I-G2, Insured: GNMA
4.00%, due 9/21/49 | | | 3,944,621 | | | | 4,177,196 | |
Series H, Insured: GNMA
4.50%, due 10/21/48 | | | 3,818,323 | | | | 4,072,165 | |
Series J, Insured: GNMA
4.50%, due 12/21/48 | | | 4,847,272 | | | | 5,169,519 | |
| | | | |
| 34 | | MainStay MacKay Tax Free Bond Fund | | The notes to the financial statements are an integral part of,
and should be read in conjunction with, the financial statements. |
| | | | | | | | |
| | | Principal
Amount | | | Value | |
| Long-Term Municipal Bonds (continued) | |
Utah (continued) | | | | | | | | |
Utah Housing Corp., Revenue Bonds (continued) | | | | | | | | |
Series A, Insured: GNMA
4.50%, due 1/21/49 | | $ | 9,620,719 | | | $ | 10,260,305 | |
Series B, Insured: GNMA
4.50%, due 2/21/49 | | | 5,856,492 | | | | 6,245,831 | |
Insured: GNMA
4.50%, due 8/21/49 | | | 5,982,958 | | | | 6,380,705 | |
Utah Infrastructure Agency, Revenue Bonds | | | | | | | | |
5.00%, due 10/15/31 | | | 350,000 | | | | 435,379 | |
5.00%, due 10/15/38 | | | 1,990,000 | | | | 2,426,288 | |
5.00%, due 10/15/41 | | | 2,175,000 | | | | 2,632,924 | |
| | | | | | | | |
| | | | | | | 41,856,366 | |
| | | | | | | | |
Vermont 0.0%‡ | |
Vermont Educational & Health Buildings Financing Agency, Middlebury College Project, Revenue Bonds
4.00%, due 11/1/36 | | | 1,750,000 | | | | 2,042,705 | |
| | | | | | | | |
|
Virginia 1.0% | |
Chesapeake Bay Bridge & Tunnel District, Revenue Bonds
Insured: AGM
5.00%, due 7/1/41 | | | 11,575,000 | | | | 13,702,022 | |
Hampton Roads Sanitation District, Revenue Bonds | | | | | | | | |
Series A
5.00%, due 10/1/31 | | | 1,420,000 | | | | 1,781,362 | |
Series A
5.00%, due 10/1/32 | | | 2,500,000 | | | | 3,122,550 | |
Virginia Commonwealth Transportation Board, Revenue Bonds
Series A
5.00%, due 5/15/29 | | | 3,750,000 | | | | 4,741,687 | |
Virginia Public School Authority, Special Obligation, Revenue Bonds | | | | | | | | |
Series A
3.00%, due 10/1/36 | | | 3,000,000 | | | | 3,144,510 | |
Series A
3.00%, due 10/1/37 | | | 3,000,000 | | | | 3,130,410 | |
Virginia Resources Authority, Infrastructure Revenue, Revenue Bonds
Series A
5.00%, due 11/1/30 | | | 2,315,000 | | | | 2,564,626 | |
Virginia Small Business Financing Authority, Express Lanes LLC Project, Revenue Bonds (b) | | | | | | | | |
5.00%, due 1/1/44 | | | 3,650,000 | | | | 3,884,805 | |
5.00%, due 7/1/49 | | | 10,000,000 | | | | 10,639,100 | |
| | | | | | | | |
| | | | | | | 46,711,072 | |
| | | | | | | | |
| | | | | | | | |
| | | Principal
Amount | | | Value | |
Washington 0.9% | |
Seattle Municipal Light & Power Revenue, Revenue Bonds | | | | | | | | |
5.00%, due 4/1/37 | | $ | 5,030,000 | | | $ | 6,335,486 | |
5.00%, due 4/1/40 | | | 3,000,000 | | | | 3,746,670 | |
Thurston & Pierce Counties Community Schools, Unlimited General Obligation
4.00%, due 12/1/35 | | | 3,900,000 | | | | 4,488,627 | |
Washington State Housing Finance Commission, Single Family Program, Revenue Bonds | | | | | | | | |
Series 1N
4.00%, due 12/1/48 | | | 5,985,000 | | | | 6,511,022 | |
Series 1N
4.00%, due 6/1/49 | | | 7,500,000 | | | | 8,191,725 | |
Washington State, Unlimited General Obligation
Series C
5.00%, due 2/1/43 | | | 11,335,000 | | | | 13,738,813 | |
| | | | | | | | |
| | | | | | | 43,012,343 | |
| | | | | | | | |
West Virginia 0.1% | |
State of West Virginia State Road Bonds, Unlimited General Obligation
Series B
5.00%, due 12/1/40 | | | 5,770,000 | | | | 7,068,827 | |
| | | | | | | | |
|
Wisconsin 0.4% | |
Wisconsin Center District, Junior Dedicated, Revenue Bonds | | | | | | | | |
Series A
5.00%, due 12/15/31 | | | 3,665,000 | | | | 4,027,322 | |
Series A
5.00%, due 12/15/32 | | | 2,850,000 | | | | 3,125,082 | |
Wisconsin Health & Educational Facilities Authority, Marshfield Clinic Health System, Revenue Bonds
Series C
5.00%, due 2/15/23 | | | 2,110,000 | | | | 2,344,273 | |
Wisconsin Housing & Economic Development Authority, Revenue Bonds
Series D
4.00%, due 3/1/47 | | | 7,965,000 | | | | 8,638,122 | |
| | | | | | | | |
| | | | | | | 18,134,799 | |
| | | | | | | | |
Wyoming 0.2% | |
West Park Hospital District, Revenue Bonds | | | | | | | | |
Series A
5.50%, due 6/1/21 | | | 250,000 | | | | 260,750 | |
Series A
6.375%, due 6/1/26 | | | 1,000,000 | | | | 1,061,270 | |
| | | | | | |
The notes to the financial statements are an integral part of,
and should be read in conjunction with, the financial statements. | | | | | 35 | |
Portfolio of InvestmentsOctober 31, 2019 (continued)
| | | | | | | | |
| | | Principal
Amount | | | Value | |
| Long-Term Municipal Bonds (continued) | |
Wyoming (continued) | | | | | | | | |
Wyoming Community Development Authority, Revenue Bonds | | | | | | | | |
Series 3
4.00%, due 6/1/43 | | $ | 4,375,000 | | | $ | 4,725,963 | |
Series 1
4.00%, due 12/1/48 | | | 3,965,000 | | | | 4,313,206 | |
| | | | | | | | |
| | | | | | | 10,361,189 | |
| | | | | | | | |
TotalLong-Term Municipal Bonds
(Cost $4,327,007,921) | | | | | | | 4,483,346,139 | |
| | | | | | | | |
|
| Short-Term Municipal Notes 6.7% | |
Florida 0.4% | |
Orange County Health Facilities Authority, Orlando Health Obligated Group, Revenue Bonds
Series E
1.10%, due 10/1/26 (e) | | | 20,000,000 | | | | 20,000,000 | |
| | | | | | | | |
|
Georgia 1.4% | |
Heard County Development Authority, Georgia Power Co. Plant Wansley, Revenue Bonds
1.39%, due 9/1/29 (e) | | | 3,300,000 | | | | 3,300,000 | |
Monroe County Development Authority, Georgia Power Co., Scherer Project, Revenue Bonds
1.44%, due 11/1/48 (e) | | | 10,650,000 | | | | 10,650,000 | |
Burke County Development Authority, Georgia Power Co., Vogtle Project, Revenue Bonds (e) | | | | | | | | |
1st Series
1.40%, due 7/1/49 | | | 33,100,000 | | | | 33,100,000 | |
1.50%, due 11/1/52 | | | 15,580,000 | | | | 15,580,000 | |
Coweta County Development Authority, Plant Yates Project, Revenue Bonds
1.44%, due 6/1/32 (e) | | | 2,275,000 | | | | 2,275,000 | |
Heard County Development Authority, Georgia Power Co. Plant Wansley, Revenue Bonds
1.46%, due 9/1/26 (e) | | | 800,000 | | | | 800,000 | |
| | | | | | | | |
| | | | | | | 65,705,000 | |
| | | | | | | | |
Iowa 0.2% | |
Iowa Finance Authority, Health System Obligation, Revenue Bonds
Series B-2
1.22%, due 2/15/39 (e) | | | 11,490,000 | | | | 11,490,000 | |
| | | | | | | | |
| | | | | | | | |
| | | Principal
Amount | | | Value | |
Kansas 0.0%‡ | |
University of Kansas Hospital Authority, KU Health System, Revenue Bonds
1.20%, due 9/1/34 (e) | | $ | 475,000 | | | $ | 475,000 | |
| | | | | | | | |
|
Minnesota 0.4% | |
City of Minneapolis MN/St. Paul Housing & Redevelopment Authority, Children’s Health Care, Revenue Bonds
Series A-II, Insured: AGM
1.25%, due 8/15/37 (e) | | | 18,130,000 | | | | 18,130,000 | |
| | | | | | | | |
|
Missouri 0.7% | |
Missouri Health & Educational Facilities Authority, SSM Health Care Corp., Revenue Bonds
Series F
1.14%, due 6/1/44 (e) | | | 22,400,000 | | | | 22,400,000 | |
RIB Floater Trust, Revenue Bonds
Series 2019-016
1.16%, due 6/1/45 (d)(e) | | | 11,000,000 | | | | 11,000,000 | |
| | | | | | | | |
| | | | | | | 33,400,000 | |
| | | | | | | | |
New Jersey 0.4% | |
New Jersey Turnpike Authority, Revenue Bonds
Series D-1
2.122%, due 1/1/24 (e) | | | 20,000,000 | | | | 20,138,600 | |
| | | | | | | | |
|
New York 1.0% | |
Metropolitan Transportation Authority, Revenue Bonds
Subseries 2012A-2
1.24%, due 11/15/41 (e) | | | 13,000,000 | | | | 13,000,000 | |
New York State Housing Finance Agency, 29 Flatbush Ave, Revenue Bonds
1.09%, due 11/1/44 (e) | | | 30,200,000 | | | | 30,200,000 | |
New York City NY, Housing Development Corp., Multifamily, Sustainable Neighborhood, Revenue Bonds
Series E-3
1.07%, due 5/1/59 (e) | | | 2,300,000 | | | | 2,300,000 | |
New York City Transitional Finance Authority, Future Tax Secured, Revenue Bonds
Subseries C-4
1.30%, due 11/1/44 (e) | | | 5,000,000 | | | | 5,000,000 | |
| | | | | | | | |
| | | | | | | 50,500,000 | |
| | | | | | | | |
Ohio 0.3% | |
Ohio Higher Educational Facility Commission, Cleveland Clinic, Revenue Bonds
Series B-4
1.25%, due 1/1/43 (e) | | | 8,605,000 | | | | 8,605,000 | |
| | | | |
| 36 | | MainStay MacKay Tax Free Bond Fund | | The notes to the financial statements are an integral part of,
and should be read in conjunction with, the financial statements. |
| | | | | | | | |
| | | Principal
Amount | | | Value | |
| Short-Term Municipal Notes (continued) | |
Ohio (continued) | |
County of Montgomery OH, Premier Health Partners Obligated Group, Revenue Bonds
Series C
1.30%, due 11/15/45 (e) | | $ | 5,000,000 | | | $ | 5,000,000 | |
| | | | | | | | |
| | | | | | | 13,605,000 | |
| | | | | | | | |
Texas 0.7% | |
Permanent University Fund—University of Texas System, Revenue Bonds
Series A
1.10%, due 7/1/37 (e) | | | 21,165,000 | | | | 21,165,000 | |
Harris County Cultural Education Facilities Finance Corp., Texas Medical Center, Revenue Bonds
Subseries B-1
1.38%, due 9/1/31 (e) | | | 2,705,000 | | | | 2,705,000 | |
Harris County Health Facilities Development Corp., Methodist Hospital System, Revenue Bonds
Series A-1
1.35%, due 12/1/41 (e) | | | 7,700,000 | | | | 7,700,000 | |
Harris County Cultural Education Facilities Finance Corp., Houston Methodist Hospital, Revenue Bonds
Subseries C-2
1.35%, due 12/1/27 (e) | | | 1,700,000 | | | | 1,700,000 | |
| | | | | | | | |
| | | | | | | 33,270,000 | |
| | | | | | | | |
Utah 0.3% | |
City of Murray UT, Murray City Hospital, IHC Health Services, Inc., Revenue Bonds
Series D
1.35%, due 5/15/36 (e) | | | 12,000,000 | | | | 12,000,000 | |
| | | | | | | | |
|
Virginia 0.2% | |
Albemarle County Economic Development Authority, Sentara Martha Jefferson Hospital, Revenue Bonds
Series B
1.28%, due 10/1/48 (e) | | | 11,585,000 | | | | 11,585,000 | |
| | | | | | | | |
|
Wisconsin 0.7% | |
University Hospitals & Clinics Authority, Revenue Bonds
Series C
1.27%, due 4/1/48 (e) | | | 12,375,000 | | | | 12,375,000 | |
| | | | | | | | |
| | | Principal
Amount | | | Value | |
Wisconsin (continued) | | | | | | | | |
Wisconsin Health & Educational Facilities Authority, Marshfield Clinic Health System, Revenue Bonds
Series A
1.30%, due 2/15/50 (e) | | $ | 20,685,000 | | | $ | 20,685,000 | |
| | | | | | | | |
| | | | | | | 33,060,000 | |
| | | | | | | | |
TotalShort-Term Municipal Notes
(Cost $323,373,008) | | | | | | | 323,358,600 | |
| | | | | | | | |
Total Municipal Bonds
(Cost $4,650,380,929) | | | | | | | 4,806,704,739 | |
| | | | | | | | |
|
| Closed-End Fund 0.9% | |
Massachusetts 0.9% | |
Invesco National AMT—Free Municipal Bond ETF | | | 1,700,663 | | | | 44,999,543 | |
| | | | | | | | |
Total Closed-End Fund
(Cost $43,606,530) | | | | | | | 44,999,543 | |
| | | | | | | | |
Total Investments
(Cost $4,693,987,459) | | | 100.2 | % | | | 4,851,704,282 | |
Other Assets, Less Liabilities | | | (0.2 | ) | | | (8,227,195 | ) |
Net Assets | | | 100.0 | % | | $ | 4,843,477,087 | |
| † | Percentages indicated are based on Fund net assets. |
| ‡ | Less than one-tenth of a percent. |
| (a) | Floating rate—Rate shown was the rate in effect as of October 31, 2019. |
| (b) | Interest on these securities was subject to alternative minimum tax. |
| (c) | Step coupon—Rate shown was the rate in effect as of October 31, 2019. |
| (d) | May be sold to institutional investors only under Rule 144A or securities offered pursuant to Section 4(a)(2) of the Securities Act of 1933, as amended. |
| (e) | Variable-rate demand notes (VRDNs)—Provide the right to sell the security at face value on either that day or within the rate-reset period. VRDNs will normally trade as if the maturity is the earlier put date, even though stated maturity is longer. The interest rate is reset on the put date at a stipulated daily, weekly, monthly, quarterly, or other specified time interval to reflect current market conditions. These securities do not indicate a reference rate and spread in their description. The maturity date shown is the final maturity. |
| | | | | | |
The notes to the financial statements are an integral part of,
and should be read in conjunction with, the financial statements. | | | | | 37 | |
Portfolio of InvestmentsOctober 31, 2019 (continued)
Futures Contracts
As of October 31, 2019, the Portfolio held the following futures contracts1:
| | | | | | | | | | | | | | | | | | | | |
Type | | Number of
Contracts | | | Expiration
Date | | | Value at
Trade Date | | | Current
Notional
Amount | | | Unrealized
Appreciation
(Depreciation)2 | |
Short Contracts | | | | | | | | | | | | | | | | | | | | |
| 10-Year United States Treasury Note | | | (2,000 | ) | | | December 2019 | | | $ | (263,386,024 | ) | | $ | (260,593,750 | ) | | $ | 2,792,274 | |
| | | | | | | | | | | | | | | | | | | | |
| 1. | As of October 31, 2019, cash in the amount of $2,600,000 was on deposit with a broker or futures commission merchant for futures transactions. |
| 2. | Represents the difference between the value of the contracts at the time they were opened and the value as of October 31, 2019. |
The following abbreviations are used in the preceding pages:
AGC—Assured Guaranty Corp.
AGM—Assured Guaranty Municipal Corp.
AMBAC—Ambac Assurance Corp.
BAM—Build America Mutual Assurance Co.
BHAC—Berkshire Hathaway Assurance Corp.
ETF—Exchange-Traded Fund
FHLMC—Federal Home Loan Mortgage Corp.
FNMA—Federal National Mortgage Association
GNMA—Government National Mortgage Association
NATL-RE—National Public Finance Guarantee Corp.
PSF—Permanent School Fund
Q-SBLF—Qualified School Board Loan Fund
XLCA—XL Capital Assurance, Inc.
The following is a summary of the fair valuations according to the inputs used as of October 31, 2019, for valuing the Fund’s assets and liabilities:
| | | | | | | | | | | | | | | | |
Description | | Quoted
Prices in Active
Markets for
Identical Assets
(Level 1) | | | Significant Other
Observable Inputs
(Level 2) | | | Significant
Unobservable Inputs
(Level 3) | | | Total | |
| | | | |
Asset Valuation Inputs | | | | | | | | | | | | | | | | |
| Investments in Securities (a) | | | | | | | | | | | | | | | | |
| Municipal Bonds | | | | | | | | | | | | | | | | |
Long-Term Municipal Bonds | | $ | — | | | $ | 4,483,346,139 | | | $ | — | | | $ | 4,483,346,139 | |
Short-Term Municipal Notes | | | — | | | | 323,358,600 | | | | — | | | | 323,358,600 | |
| | | | | | | | | | | | | | | | |
| Total Municipal Bonds | | | — | | | | 4,806,704,739 | | | | — | | | | 4,806,704,739 | |
| | | | | | | | | | | | | | | | |
| Closed-End Fund | | | 44,999,543 | | | | — | | | | — | | | | 44,999,543 | |
| | | | | | | | | | | | | | | | |
| Total Investments in Securities | | $ | 44,999,543 | | | $ | 4,806,704,739 | | | $ | — | | | $ | 4,851,704,282 | |
| | | | | | | | | | | | | | | | |
| Other Financial Instruments | | | | | | | | | | | | | | | | |
Futures Contracts (b) | | | 2,792,274 | | | | — | | | | — | | | | 2,792,274 | |
| | | | | | | | | | | | | | | | |
| Total Investments in Securities and Other Financial Instruments | | $ | 47,791,817 | | | $ | 4,806,704,739 | | | $ | — | | | $ | 4,854,496,556 | |
| | | | | | | | | | | | | | | | |
| (a) | For a complete listing of investments and their industries, see the Portfolio of Investments. |
| (b) | The value listed for these securities reflects unrealized appreciation (depreciation) as shown on the Portfolio of Investments. |
| | | | |
| 38 | | MainStay MacKay Tax Free Bond Fund | | The notes to the financial statements are an integral part of,
and should be read in conjunction with, the financial statements. |
Statement of Assets and Liabilitiesas of October 31, 2019
| | | | |
| Assets | | | | |
Investment in securities, at value (identified cost $4,693,987,459) | | $ | 4,851,704,282 | |
Cash | | | 39,851,062 | |
Cash collateral on deposit at broker for futures contracts | | | 2,600,000 | |
Receivables: | | | | |
Interest | | | 51,106,059 | |
Fund shares sold | | | 20,918,824 | |
Investment securities sold | | | 9,116,765 | |
Other assets | | | 167,281 | |
| | | | |
Total assets | | | 4,975,464,273 | |
| | | | |
| |
| Liabilities | | | | |
Payables: | | | | |
Investment securities purchased | | | 117,833,923 | |
Fund shares redeemed | | | 6,319,475 | |
Manager (See Note 3) | | | 1,691,739 | |
Variation margin on futures contracts | | | 1,624,995 | |
Transfer agent (See Note 3) | | | 517,530 | |
NYLIFE Distributors (See Note 3) | | | 459,188 | |
Professional fees | | | 82,271 | |
Shareholder communication | | | 66,568 | |
Custodian | | | 19,774 | |
Trustees | | | 8,450 | |
Accrued expenses | | | 32,361 | |
Dividend payable | | | 3,330,912 | |
| | | | |
Total liabilities | | | 131,987,186 | |
| | | | |
Net assets | | $ | 4,843,477,087 | |
| | | | |
| |
| Composition of Net Assets | | | | |
Shares of beneficial interest outstanding (par value of $.01 per share) unlimited number of shares authorized | | $ | 4,686,471 | |
Additional paid-in capital | | | 4,705,999,487 | |
| | | | |
| | | 4,710,685,958 | |
Total distributable earnings (loss) | | | 132,791,129 | |
| | | | |
Net assets | | $ | 4,843,477,087 | |
| | | | |
| | | | |
Class A | | | | |
Net assets applicable to outstanding shares | | $ | 1,728,642,568 | |
| | | | |
Shares of beneficial interest outstanding | | | 167,289,502 | |
| | | | |
Net asset value per share outstanding | | $ | 10.33 | |
Maximum sales charge (4.50% of offering price) | | | 0.49 | |
| | | | |
Maximum offering price per share outstanding | | $ | 10.82 | |
| | | | |
Investor Class | | | | |
Net assets applicable to outstanding shares | | $ | 9,814,956 | |
| | | | |
Shares of beneficial interest outstanding | | | 945,873 | |
| | | | |
Net asset value per share outstanding | | $ | 10.38 | |
Maximum sales charge (4.50% of offering price) | | | 0.49 | |
| | | | |
Maximum offering price per share outstanding | | $ | 10.87 | |
| | | | |
Class B | | | | |
Net assets applicable to outstanding shares | | $ | 12,354,268 | |
| | | | |
Shares of beneficial interest outstanding | | | 1,195,858 | |
| | | | |
Net asset value and offering price per share outstanding | | $ | 10.33 | |
| | | | |
Class C | | | | |
Net assets applicable to outstanding shares | | $ | 225,761,924 | |
| | | | |
Shares of beneficial interest outstanding | | | 21,841,913 | |
| | | | |
Net asset value and offering price per share outstanding | | $ | 10.34 | |
| | | | |
Class I | | | | |
Net assets applicable to outstanding shares | | $ | 2,866,903,371 | |
| | | | |
Shares of beneficial interest outstanding | | | 277,373,905 | |
| | | | |
Net asset value and offering price per share outstanding | | $ | 10.34 | |
| | | | |
| | | | | | |
The notes to the financial statements are an integral part of,
and should be read in conjunction with, the financial statements. | | | | | 39 | |
Statement of Operationsfor the year ended October 31, 2019
| | | | |
| Investment Income (Loss) | | | | |
Income | | | | |
Interest | | $ | 139,206,155 | |
Dividends | | | 644,612 | |
| | | | |
Total income | | | 139,850,767 | |
| | | | |
Expenses | | | | |
Manager (See Note 3) | | | 15,965,602 | |
Distribution/Service—Class A (See Note 3) | | | 3,672,083 | |
Distribution/Service—Investor Class (See Note 3) | | | 24,198 | |
Distribution/Service—Class B (See Note 3) | | | 67,605 | |
Distribution/Service—Class C (See Note 3) | | | 1,114,277 | |
Transfer agent (See Note 3) | | | 2,933,427 | |
Professional fees | | | 285,505 | |
Registration | | | 223,348 | |
Shareholder communication | | | 155,846 | |
Trustees | | | 96,268 | |
Custodian | | | 52,558 | |
Miscellaneous | | | 150,099 | |
| | | | |
Total expenses | | | 24,740,816 | |
| | | | |
Net investment income (loss) | | | 115,109,951 | |
| | | | |
|
| Realized and Unrealized Gain (Loss) on Investments and Futures Contracts | |
Net realized gain (loss) on: | | | | |
Investment transactions | | | 11,663,431 | |
Futures transactions | | | (22,134,980 | ) |
| | | | |
Net realized gain (loss) on investments and futures transactions | | | (10,471,549 | ) |
| | | | |
Net change in unrealized appreciation (depreciation) on: | | | | |
Investments | | | 211,029,443 | |
Futures contracts | | | (9,549,802 | ) |
| | | | |
Net change in unrealized appreciation (depreciation) on investments and futures contracts | | | 201,479,641 | |
| | | | |
Net realized and unrealized gain (loss) on investments and futures transactions | | | 191,008,092 | |
| | | | |
Net increase (decrease) in net assets resulting from operations | | $ | 306,118,043 | |
| | | | |
| | | | |
| 40 | | MainStay MacKay Tax Free Bond Fund | | The notes to the financial statements are an integral part of,
and should be read in conjunction with, the financial statements. |
Statements of Changes in Net Assets
for the years ended October 31, 2019 and October 31, 2018
| | | | | | | | |
| | | 2019 | | | 2018 | |
| Increase (Decrease) in Net Assets | | | | | |
Operations: | | | | | | | | |
Net investment income (loss) | | $ | 115,109,951 | | | $ | 96,130,666 | |
Net realized gain (loss) on investments and futures transactions | | | (10,471,549 | ) | | | 10,132,105 | |
Net change in unrealized appreciation (depreciation) on investments and futures contracts | | | 201,479,641 | | | | (77,398,554 | ) |
| | | | |
Net increase (decrease) in net assets resulting from operations | | | 306,118,043 | | | | 28,864,217 | |
| | | | |
Distributions to shareholders: | | | | | | | | |
Class A | | | (43,092,131 | ) | | | (48,970,403 | ) |
Investor Class | | | (285,978 | ) | | | (314,661 | ) |
Class B | | | (365,433 | ) | | | (468,606 | ) |
Class C | | | (5,995,944 | ) | | | (6,678,082 | ) |
Class I | | | (65,371,209 | ) | | | (39,698,956 | ) |
| | | | |
Total distributions to shareholders | | | (115,110,695 | ) | | | (96,130,708 | ) |
| | | | |
Capital share transactions: | | | | | | | | |
Net proceeds from sale of shares | | | 2,425,735,828 | | | | 908,337,837 | |
Net asset value of shares issued to shareholders in reinvestment of distributions | | | 81,410,601 | | | | 70,847,755 | |
Cost of shares redeemed | | | (819,347,697 | ) | | | (800,275,249 | ) |
| | | | |
Increase (decrease) in net assets derived from capital share transactions | | | 1,687,798,732 | | | | 178,910,343 | |
| | | | |
Net increase (decrease) in net assets | | | 1,878,806,080 | | | | 111,643,852 | |
| | |
| Net Assets | | | | | | | | |
Beginning of year | | | 2,964,671,007 | | | | 2,853,027,155 | |
| | | | |
End of year | | $ | 4,843,477,087 | | | $ | 2,964,671,007 | |
| | | | |
| | | | | | |
The notes to the financial statements are an integral part of,
and should be read in conjunction with, the financial statements. | | | | | 41 | |
Financial Highlightsselected per share data and ratios
| | | | | | | | | | | | | | | | | | | | |
| |
| | | Year ended October 31, | |
| | | | | |
| Class A | | 2019 | | | 2018 | | | 2017 | | | 2016 | | | 2015 | |
| | | | | |
Net asset value at beginning of year | | $ | 9.80 | | | $ | 10.02 | | | $ | 10.18 | | | $ | 9.93 | | | $ | 10.03 | |
| | | | | | | | | | | | | | | | | | | | |
| | | | | |
Net investment income (loss) | | | 0.30 | | | | 0.31 | | | | 0.31 | | | | 0.32 | | | | 0.35 | |
| | | | | |
Net realized and unrealized gain (loss) on investments | | | 0.53 | | | | (0.22 | ) | | | (0.16 | ) | | | 0.25 | | | | (0.10 | ) |
| | | | | | | | | | | | | | | | | | | | |
| | | | | |
Total from investment operations | | | 0.83 | | | | 0.09 | | | | 0.15 | | | | 0.57 | | | | 0.25 | |
| | | | | | | | | | | | | | | | | | | | |
| | | | | |
| Less dividends and distributions: | | | | | | | | | | | | | | | | | | | | |
| | | | | |
From net investment income | | | (0.30 | ) | | | (0.31 | ) | | | (0.31 | ) | | | (0.32 | ) | | | (0.35 | ) |
| | | | | | | | | | | | | | | | | | | | |
| | | | | |
Net asset value at end of year | | $ | 10.33 | | | $ | 9.80 | | | $ | 10.02 | | | $ | 10.18 | | | $ | 9.93 | |
| | | | | | | | | | | | | | | | | | | | |
| | | | | |
Total investment return (a) | | | 8.55 | % | | | 0.94 | % | | | 1.50 | % | | | 5.73 | % | | | 2.58 | % |
| | | | | |
| Ratios (to average net assets)/Supplemental Data: | | | | | | | | | | | | | | | | | | | | |
| | | | | |
Net investment income (loss) | | | 2.93 | % | | | 3.15 | % | | | 3.05 | % | | | 3.04 | % | | | 3.51 | % |
| | | | | |
Net expenses | | | 0.78 | % | | | 0.80 | % | | | 0.81 | % | | | 0.80 | % | | | 0.81 | % |
| | | | | |
Expenses (before waiver/reimbursement) | | | 0.78 | % | | | 0.80 | % | | | 0.81 | % | | | 0.80 | % | | | 0.82 | % |
| | | | | |
Portfolio turnover rate | | | 38 | %(b) | | | 40 | % | | | 62 | % | | | 47 | % | | | 46 | % |
| | | | | |
Net assets at end of year (in 000’s) | | $ | 1,728,643 | | | $ | 1,405,803 | | | $ | 1,564,955 | | | $ | 1,248,065 | | | $ | 761,278 | |
| (a) | Total investment return is calculated exclusive of sales charges and assumes the reinvestment of dividends and distributions. For periods of less than one year, total return is not annualized. |
| (b) | The portfolio turnover rate includes variable rate demand notes. |
| | | | | | | | | | | | | | | | | | | | |
| |
| | | Year ended October 31, | |
| | | | | |
| Investor Class | | 2019 | | | 2018 | | | 2017 | | | 2016 | | | 2015 | |
| | | | | |
Net asset value at beginning of year | | $ | 9.84 | | | $ | 10.06 | | | $ | 10.23 | | | $ | 9.97 | | | $ | 10.08 | |
| | | | | | | | | | | | | | | | | | | | |
| | | | | |
Net investment income (loss) | | | 0.30 | | | | 0.32 | | | | 0.31 | | | | 0.32 | | | | 0.35 | |
| | | | | |
Net realized and unrealized gain (loss) on investments | | | 0.54 | | | | (0.22 | ) | | | (0.17 | ) | | | 0.26 | | | | (0.11 | ) |
| | | | | | | | | | | | | | | | | | | | |
| | | | | |
Total from investment operations | | | 0.84 | | | | 0.10 | | | | 0.14 | | | | 0.58 | | | | 0.24 | |
| | | | | | | | | | | | | | | | | | | | |
| | | | | |
| Less dividends and distributions: | | | | | | | | | | | | | | | | | | | | |
| | | | | |
From net investment income | | | (0.30 | ) | | | (0.32 | ) | | | (0.31 | ) | | | (0.32 | ) | | | (0.35 | ) |
| | | | | | | | | | | | | | | | | | | | |
| | | | | |
Net asset value at end of year | | $ | 10.38 | | | $ | 9.84 | | | $ | 10.06 | | | $ | 10.23 | | | $ | 9.97 | |
| | | | | | | | | | | | | | | | | | | | |
| | | | | |
Total investment return (a) | | | 8.63 | % | | | 0.97 | % | | | 1.43 | % | | | 5.83 | % | | | 2.47 | % |
| | | | | |
| Ratios (to average net assets)/Supplemental Data: | | | | | | | | | | | | | | | | | | | | |
| | | | | |
Net investment income (loss) | | | 2.95 | % | | | 3.17 | % | | | 3.10 | % | | | 3.11 | % | | | 3.54 | % |
| | | | | |
Net expenses | | | 0.77 | % | | | 0.78 | % | | | 0.79 | % | | | 0.79 | % | | | 0.82 | % |
| | | | | |
Expenses (before waiver/reimbursement) | | | 0.77 | % | | | 0.78 | % | | | 0.79 | % | | | 0.79 | % | | | 0.83 | % |
| | | | | |
Portfolio turnover rate | | | 38 | %(b) | | | 40 | % | | | 62 | % | | | 47 | % | | | 46 | % |
| | | | | |
Net assets at end of year (in 000’s) | | $ | 9,815 | | | $ | 9,690 | | | $ | 10,216 | | | $ | 16,344 | | | $ | 17,259 | |
| (a) | Total investment return is calculated exclusive of sales charges and assumes the reinvestment of dividends and distributions. For periods of less than one year, total return is not annualized. |
| (b) | The portfolio turnover rate includes variable rate demand notes. |
| | | | |
| 42 | | MainStay MacKay Tax Free Bond Fund | | The notes to the financial statements are an integral part of,
and should be read in conjunction with, the financial statements. |
Financial Highlightsselected per share data and ratios
| | | | | | | | | | | | | | | | | | | | |
| |
| | | Year ended October 31, | |
| | | | | |
| Class B | | 2019 | | | 2018 | | | 2017 | | | 2016 | | | 2015 | |
| | | | | |
Net asset value at beginning of year | | $ | 9.80 | | | $ | 10.01 | | | $ | 10.18 | | | $ | 9.92 | | | $ | 10.03 | |
| | | | | | | | | | | | | | | | | | | | |
| | | | | |
Net investment income (loss) | | | 0.27 | | | | 0.29 | | | | 0.28 | | | | 0.29 | | | | 0.33 | |
| | | | | |
Net realized and unrealized gain (loss) on investments | | | 0.53 | | | | (0.21 | ) | | | (0.17 | ) | | | 0.26 | | | | (0.11 | ) |
| | | | | | | | | | | | | | | | | | | | |
| | | | | |
Total from investment operations | | | 0.80 | | | | 0.08 | | | | 0.11 | | | | 0.55 | | | | 0.22 | |
| | | | | | | | | | | | | | | | | | | | |
| | | | | |
| Less dividends and distributions: | | | | | | | | | | | | | | | | | | | | |
| | | | | |
From net investment income | | | (0.27 | ) | | | (0.29 | ) | | | (0.28 | ) | | | (0.29 | ) | | | (0.33 | ) |
| | | | | | | | | | | | | | | | | | | | |
| | | | | |
Net asset value at end of year | | $ | 10.33 | | | $ | 9.80 | | | $ | 10.01 | | | $ | 10.18 | | | $ | 9.92 | |
| | | | | | | | | | | | | | | | | | | | |
| | | | | |
Total investment return (a) | | | 8.28 | % | | | 0.81 | % | | | 1.17 | % | | | 5.58 | % | | | 2.21 | % |
| | | | | |
| Ratios (to average net assets)/Supplemental Data: | | | | | | | | | | | | | | | | | | | | |
| | | | | |
Net investment income (loss) | | | 2.71 | % | | | 2.92 | % | | | 2.85 | % | | | 2.84 | % | | | 3.28 | % |
| | | | | |
Net expenses | | | 1.02 | % | | | 1.03 | % | | | 1.04 | % | | | 1.04 | % | | | 1.07 | % |
| | | | | |
Expenses (before waiver/reimbursement) | | | 1.02 | % | | | 1.03 | % | | | 1.04 | % | | | 1.04 | % | | | 1.08 | % |
| | | | | |
Portfolio turnover rate | | | 38 | %(b) | | | 40 | % | | | 62 | % | | | 47 | % | | | 46 | % |
| | | | | |
Net assets at end of year (in 000’s) | | $ | 12,354 | | | $ | 14,704 | | | $ | 17,068 | | | $ | 19,318 | | | $ | 16,806 | |
| (a) | Total investment return is calculated exclusive of sales charges and assumes the reinvestment of dividends and distributions. For periods of less than one year, total return is not annualized. |
| (b) | The portfolio turnover rate includes variable rate demand notes. |
| | | | | | | | | | | | | | | | | | | | |
| |
| | | Year ended October 31, | |
| | | | | |
| Class C | | 2019 | | | 2018 | | | 2017 | | | 2016 | | | 2015 | |
| | | | | |
Net asset value at beginning of year | | $ | 9.80 | | | $ | 10.02 | | | $ | 10.18 | | | $ | 9.93 | | | $ | 10.03 | |
| | | | | | | | | | | | | | | | | | | | |
| | | | | |
Net investment income (loss) | | | 0.27 | | | | 0.29 | | | | 0.28 | | | | 0.29 | | | | 0.33 | |
| | | | | |
Net realized and unrealized gain (loss) on investments | | | 0.54 | | | | (0.22 | ) | | | (0.16 | ) | | | 0.25 | | | | (0.10 | ) |
| | | | | | | | | | | | | | | | | | | | |
| | | | | |
Total from investment operations | | | 0.81 | | | | 0.07 | | | | 0.12 | | | | 0.54 | | | | 0.23 | |
| | | | | | | | | | | | | | | | | | | | |
| | | | | |
| Less dividends and distributions: | | | | | | | | | | | | | | | | | | | | |
| | | | | |
From net investment income | | | (0.27 | ) | | | (0.29 | ) | | | (0.28 | ) | | | (0.29 | ) | | | (0.33 | ) |
| | | | | | | | | | | | | | | | | | | | |
| | | | | |
Net asset value at end of year | | $ | 10.34 | | | $ | 9.80 | | | $ | 10.02 | | | $ | 10.18 | | | $ | 9.93 | |
| | | | | | | | | | | | | | | | | | | | |
| | | | | |
Total investment return (a) | | | 8.39 | % | | | 0.71 | % | | | 1.27 | % | | | 5.48 | % | | | 2.31 | % |
| | | | | |
| Ratios (to average net assets)/Supplemental Data: | | | | | | | | | | | | | | | | | | | | |
| | | | | |
Net investment income (loss) | | | 2.69 | % | | | 2.92 | % | | | 2.85 | % | | | 2.81 | % | | | 3.28 | % |
| | | | | |
Net expenses | | | 1.02 | % | | | 1.03 | % | | | 1.04 | % | | | 1.04 | % | | | 1.07 | % |
| | | | | |
Expenses (before waiver/reimbursement) | | | 1.02 | % | | | 1.03 | % | | | 1.04 | % | | | 1.04 | % | | | 1.08 | % |
| | | | | |
Portfolio turnover rate | | | 38 | %(b) | | | 40 | % | | | 62 | % | | | 47 | % | | | 46 | % |
| | | | | |
Net assets at end of year (in 000’s) | | $ | 225,762 | | | $ | 213,883 | | | $ | 241,526 | | | $ | 273,386 | | | $ | 183,509 | |
| (a) | Total investment return is calculated exclusive of sales charges and assumes the reinvestment of dividends and distributions. For periods of less than one year, total return is not annualized. |
| (b) | The portfolio turnover rate includes variable rate demand notes. |
| | | | | | |
The notes to the financial statements are an integral part of,
and should be read in conjunction with, the financial statements. | | | | | 43 | |
Financial Highlightsselected per share data and ratios
| | | | | | | | | | | | | | | | | | | | |
| |
| | | Year ended October 31, | |
| | | | | |
| Class I | | 2019 | | | 2018 | | | 2017 | | | 2016 | | | 2015 | |
| | | | | |
Net asset value at beginning of year | | $ | 9.80 | | | $ | 10.02 | | | $ | 10.18 | | | $ | 9.93 | | | $ | 10.03 | |
| | | | | | | | | | | | | | | | | | | | |
| | | | | |
Net investment income (loss) | | | 0.32 | | | | 0.34 | | | | 0.33 | | | | 0.34 | | | | 0.38 | |
| | | | | |
Net realized and unrealized gain (loss) on investments | | | 0.54 | | | | (0.22 | ) | | | (0.16 | ) | | | 0.25 | | | | (0.10 | ) |
| | | | | | | | | | | | | | | | | | | | |
| | | | | |
Total from investment operations | | | 0.86 | | | | 0.12 | | | | 0.17 | | | | 0.59 | | | | 0.28 | |
| | | | | | | | | | | | | | | | | | | | |
| | | | | |
| Less dividends and distributions: | | | | | | | | | | | | | | | | | | | | |
| | | | | |
From net investment income | | | (0.32 | ) | | | (0.34 | ) | | | (0.33 | ) | | | (0.34 | ) | | | (0.38 | ) |
| | | | | | | | | | | | | | | | | | | | |
| | | | | |
Net asset value at end of year | | $ | 10.34 | | | $ | 9.80 | | | $ | 10.02 | | | $ | 10.18 | | | $ | 9.93 | |
| | | | | | | | | | | | | | | | | | | | |
| | | | | |
Total investment return (a) | | | 8.93 | % | | | 1.19 | % | | | 1.75 | % | | | 5.99 | % | | | 2.83 | % |
| | | | | |
| Ratios (to average net assets)/Supplemental Data: | | | | | | | | | | | | | | | | | | | | |
| | | | | |
Net investment income (loss) | | | 3.14 | % | | | 3.40 | % | | | 3.31 | % | | | 3.29 | % | | | 3.78 | % |
| | | | | |
Net expenses | | | 0.52 | % | | | 0.55 | % | | | 0.56 | % | | | 0.55 | % | | | 0.56 | % |
| | | | | |
Expenses (before waiver/reimbursement) | | | 0.52 | % | | | 0.55 | % | | | 0.56 | % | | | 0.55 | % | | | 0.57 | % |
| | | | | |
Portfolio turnover rate | | | 38 | %(b) | | | 40 | % | | | 62 | % | | | 47 | % | | | 46 | % |
| | | | | |
Net assets at end of year (in 000’s) | | $ | 2,866,903 | | | $ | 1,320,591 | | | $ | 1,019,263 | | | $ | 899,128 | | | $ | 513,893 | |
| (a) | Total investment return is calculated exclusive of sales charges and assumes the reinvestment of dividends and distributions. Class I shares are not subject to sales charges. For periods of less than one year, total return is not annualized. |
| (b) | The portfolio turnover rate includes variable rate demand notes. |
| | | | |
| 44 | | MainStay MacKay Tax Free Bond Fund | | The notes to the financial statements are an integral part of,
and should be read in conjunction with, the financial statements. |
Notes to Financial Statements
Note 1–Organization and Business
The MainStay Funds (the “Trust”) was organized on January 9, 1986, as a Massachusetts business trust and is governed by a Declaration of Trust. The Trust is registered under the Investment Company Act of 1940, as amended (the “1940 Act”), as an open-end management investment company, and is comprised of twelve funds (collectively referred to as the “Funds”). These financial statements and notes relate to the MainStay MacKay Tax Free Bond Fund (the “Fund”), a “diversified” fund, as that term is defined in the 1940 Act, as interpreted or modified by regulatory authorities having jurisdiction, from time to time.
The Fund currently has six classes of shares registered for sale. Class A shares commenced operations on January 3, 1995. Class B shares commenced operations on May 1, 1986. Class C shares commenced operations on September 1, 1998. Investor Class shares commenced operations on February 28, 2008. Class I shares commenced operations on December 21, 2009. Class R6 shares were registered for sale effective as of February 28, 2017. As of October 31, 2019, Class R6 shares were not yet offered for sale. Class B shares of the MainStay Group of Funds are closed to all new purchases as well as additional investments by existing Class B shareholders. Existing Class B shareholders may continue to reinvest dividends and capital gains distributions, as well as exchange their Class B shares for Class B shares of other funds in the MainStay Group of Funds as permitted by the current exchange privileges. Class B shareholders continue to be subject to any applicable contingent deferred sales charge (“CDSC”) at the time of redemption. All other features of the Class B shares, including but not limited to the fees and expenses applicable to Class B shares, remain unchanged. Unless redeemed, Class B shareholders will remain in Class B shares of their respective fund until the Class B shares are converted to Class A or Investor Class shares pursuant to the applicable conversion schedule.
Class A and Investor Class shares are offered at net asset value (“NAV”) per share plus an initial sales charge. No initial sales charge applies to investments of $250,000 or more (and certain other qualified purchases) in Class A and Investor Class shares. However, a CDSC of 1.00% may be imposed on certain redemptions made within 18 months of the date of purchase on shares that were purchased without an initial sales charge. Class C shares are offered at NAV without an initial sales charge, although a 1.00% CDSC may be imposed on certain redemptions of such shares made within one year of the date of purchase of Class C shares. When Class B shares were offered, they were offered at NAV without an initial sales charge, although a CDSC that declines depending on the number of years a shareholder has held its Class B shares may be imposed on certain redemptions of such shares made within six years of the date of purchase of such shares. Class I shares are offered at NAV without a sales charge. Class R6 shares are currently expected to be offered at NAV without a sales charge. Depending upon eligibility, Class B shares convert to either Class A or Investor Class shares at the end of the calendar quarter eight years after the date they were purchased. In addition, depending upon eligibility, Class C shares convert to either Class A or Investor Class shares at the end of the calendar quarter ten years after the date they were purchased. Additionally, as disclosed in the Fund’s prospectus, Class A shares may convert automatically to Investor Class shares and Investor Class shares may convert automatically to Class A shares. Under certain
circumstances and as may be permitted by the Trust’s multiple class plan pursuant to Rule 18f-3 under the 1940 Act, specified share classes of the Fund may be converted to one or more other share classes of the Fund as disclosed in the capital share transactions within these Notes. The classes of shares have the same voting (except for issues that relate solely to one class), dividend, liquidation and other rights, and the same terms and conditions, except that under distribution plans pursuant to Rule 12b-1 under the 1940 Act, Class B and Class C shares are subject to higher distribution and/or service fees than Class A and Investor Class shares. Class I and Class R6 shares are not subject to a distribution and/or service fee.
The Fund’s investment objective is to seek current income exempt from regular federal income tax.
Note 2–Significant Accounting Policies
The Fund is an investment company and accordingly follows the investment company accounting and reporting guidance of the Financial Accounting Standards Board (“FASB”) Accounting Standard CodificationTopic 946 Financial Services—Investment Companies. The Fund prepares its financial statements in accordance with generally accepted accounting principles (“GAAP”) in the United States of America and follows the significant accounting policies described below.
(A) Securities Valuation. Investments are usually valued as of the close of regular trading on the New York Stock Exchange (the “Exchange”) (usually 4:00 p.m. Eastern time) on each day the Fund is open for business (“valuation date”).
The Board of Trustees of the Trust (the “Board”) adopted procedures establishing methodologies for the valuation of the Fund’s securities and other assets and delegated the responsibility for valuation determinations under those procedures to the Valuation Committee of the Trust (the “Valuation Committee”). The Board authorized the Valuation Committee to appoint a Valuation Subcommittee (the “Subcommittee”) to deal in the first instance with establishing the prices of securities for which market quotations are not readily available or the prices of which are not otherwise readily determinable under these procedures. The Subcommittee meets (in person, via electronic mail or via teleconference) on an as-needed basis. Subsequently, the Valuation Committee meets to ensure that actions taken by the Subcommittee were appropriate. The procedures state that, subject to the oversight of the Board and unless otherwise noted, the responsibility for theday-to-day valuation of portfolio assets (including fair value measurements for the Fund’s assets and liabilities) rests with New York Life Investment Management LLC (“New York Life Investments” or the “Manager”), aided to whatever extent necessary by the Subadvisor (as defined in Note 3(A)).
To assess the appropriateness of security valuations, the Manager, the Subadvisor or the Fund’s third-party service provider, who is subject to oversight by the Manager, regularly compares prior day prices, prices on comparable securities and the sale prices to the prior and current day prices and challenges prices with changes exceeding certain tolerance levels with third-party pricing services or broker sources. For those securities valued through either a standardized fair valuation methodology or a fair valuation measurement, the Subcommittee deals in the first instance with such valuation and the Valuation Committee reviews and affirms, if appropriate, the reasonableness of the valuation based
Notes to Financial Statements(continued)
on such methodologies and measurements on a regular basis after considering information that is reasonably available and deemed relevant by the Valuation Committee. Any action taken by the Subcommittee with respect to the valuation of a portfolio security or other asset is submitted for review and ratification (if appropriate) to the Valuation Committee and the Board at the next regularly scheduled meeting.
“Fair value” is defined as the price the Fund would reasonably expect to receive upon selling an asset or liability in an orderly transaction to an independent buyer in the principal or most advantageous market for the asset or liability. Fair value measurements are determined within a framework that establishes a three-tier hierarchy which maximizes the use of observable market data and minimizes the use of unobservable inputs to establish a classification of fair value measurements for disclosure purposes. “Inputs” refer broadly to the assumptions that market participants would use in pricing the asset or liability, including assumptions about risk, such as the risk inherent in a particular valuation technique used to measure fair value using a pricing model and/or the risk inherent in the inputs for the valuation technique. Inputs may be observable or unobservable. Observable inputs reflect the assumptions market participants would use in pricing the asset or liability based on market data obtained from sources independent of the Fund. Unobservable inputs reflect the Fund’s own assumptions about the assumptions market participants would use in pricing the asset or liability based on the information available. The inputs or methodology used for valuing assets or liabilities may not be an indication of the risks associated with investing in those assets or liabilities. The three-tier hierarchy of inputs is summarized below.
| • | | Level 1—quoted prices in active markets for an identical asset or liability |
| • | | Level 2—other significant observable inputs (including quoted prices for a similar asset or liability in active markets, interest rates and yield curves, prepayment speeds, credit risk, etc.) |
| • | | Level 3—significant unobservable inputs (including the Fund’s own assumptions about the assumptions that market participants would use in measuring fair value of an asset or liability) |
The level of an asset or liability within the fair value hierarchy is based on the lowest level of an input, both individually and in the aggregate, that is significant to the fair value measurement. As of October 31, 2019, the aggregate value by input level of the Fund’s assets and liabilities is included at the end of the Fund’s Portfolio of Investments.
The Fund may use third-party vendor evaluations, whose prices may be derived from one or more of the following standard inputs, among others:
| | |
• Benchmark yields | | • Reported trades |
• Broker/dealer quotes | | • Issuer spreads |
• Two-sided markets | | • Benchmark securities |
• Bids/offers | | • Reference data (corporate actions or material event notices) |
• Industry and economic events | | • Comparable bonds |
• Monthly payment information | | |
An asset or liability for which market values cannot be measured using the methodologies described above is valued by methods deemed
reasonable in good faith by the Valuation Committee, following the procedures established by the Board, to represent fair value. Under these procedures, the Fund generally uses a market-based approach which may use related or comparable assets or liabilities, recent transactions, market multiples, book values and other relevant information. The Fund may also use an income-based valuation approach in which the anticipated future cash flows of the asset or liability are discounted to calculate fair value. Discounts may also be applied due to the nature and/or duration of any restrictions on the disposition of the asset or liability. Fair value represents a good faith approximation of the value of a security. Fair value determinations involve the consideration of a number of subjective factors, an analysis of applicable facts and circumstances and the exercise of judgment. As a result, it is possible that the fair value for a security determined in good faith in accordance with the Fund’s valuation procedures may differ from valuations for the same security determined by other funds using their own valuation procedures. Although the Fund’s valuation procedures are designed to value a security at the price the Fund may reasonably expect to receive upon the security’s sale in an orderly transaction, there can be no assurance that any fair value determination thereunder would, in fact, approximate the amount that the Fund would actually realize upon the sale of the security or the price at which the security would trade if a reliable market price were readily available. During the year ended October 31, 2019, there were no material changes to the fair value methodologies.
Securities which may be valued in this manner include, but are not limited to: (i) a security for which trading has been halted or suspended; (ii) a debt security that has recently gone into default and for which there is not a current market quotation; (iii) a security of an issuer that has entered into a restructuring; (iv) a security that has been delisted from a national exchange; (v) a security for which the market price is not readily available from a third-party pricing source or, if so provided, does not, in the opinion of the Manager or the Subadvisor, reflect the security’s market value; (vi) a security subject to trading collars for which no or limited trading takes place; and (vii) a security whose principal market has been temporarily closed at a time when, under normal conditions, it would be open. Securities valued in this manner are generally categorized as Level 3 in the hierarchy. As of October 31, 2019, there were no securities held by the Fund that were fair valued in such a manner.
Futures contracts are valued at the last posted settlement price on the market where such futures are primarily traded. Investments in mutual funds, including money market funds, are valued at their respective NAVs as of the close of the Exchange on the valuation date. These securities are generally categorized as Level 1 in the hierarchy.
Municipal debt securities are valued at the evaluated mean prices supplied by a pricing agent or broker selected by the Manager, in consultation with the Subadvisor. The evaluations are market-based measurements processed through a pricing application and represents the pricing agent’s good faith determination as to what a holder may receive in an orderly transaction under market conditions. The rules based logic utilizes valuation techniques that reflect participants’ assumptions and vary by asset class and per methodology, maximizing the use of relevant observable data including quoted prices for similar assets, benchmark yield curves and market corroborated inputs. The
| | |
| 46 | | MainStay MacKay Tax Free Bond Fund |
evaluated bid or mean prices are deemed by the Manager, in consultation with the Subadvisor, to be representative of market values, at the regular close of trading of the Exchange on each valuation date. Debt securities purchased on a delayed delivery basis are marked to market daily until settlement at the forward settlement date. Municipal debt securities are generally categorized as Level 2 in the hierarchy.
In calculating NAV, each closed end fund is valued at market value, which will generally be determined using the last reported official closing or last trading price on the exchange or market on which the security is primarily traded at the time of valuation. Price information on closed end funds is taken from the exchange where the security is primarily traded. In addition, because closed-end funds and ETFs trade on a secondary market, their shares may trade at a premium or discount to the actual net asset value of their portfolio securities and their shares may have greater volatility because of the potential lack of liquidity.
Temporary cash investments acquired in excess of 60 days to maturity at the time of purchase are valued using the latest bid prices or using valuations based on a matrix system (which considers such factors as security prices, yields, maturities and ratings), both as furnished by independent pricing services. Other temporary cash investments which mature in 60 days or less at the time of purchase (“Short-Term Investments”) are valued using the amortized cost method of valuation, unless the use of such method would be inappropriate. The amortized cost method involves valuing a security at its cost on the date of purchase and thereafter assuming a constant amortization to maturity of the difference between such cost and the value on maturity date. Amortized cost approximates the current fair value of a security. Securities valued using the amortized cost method are not valued using quoted prices in an active market and are generally categorized as Level 2 in the hierarchy.
The information above is not intended to reflect an exhaustive list of the methodologies that may be used to value portfolio investments. The valuation procedures permit the use of a variety of valuation methodologies in connection with valuing portfolio investments. The methodology used for a specific type of investment may vary based on the market data available or other considerations. The methodologies summarized above may not represent the specific means by which portfolio investments are valued on any particular business day.
(B) Income Taxes. The Fund’s policy is to comply with the requirements of the Internal Revenue Code of 1986, as amended (the “Internal Revenue Code”), applicable to regulated investment companies and to distribute all of its taxable income to the shareholders of the Fund within the allowable time limits. Therefore, no federal, state and local income tax provisions are required.
Management evaluates the Fund’s tax positions to determine if the tax positions taken meet the minimum recognition threshold in connection with accounting for uncertainties in income tax positions taken or expected to be taken for the purposes of measuring and recognizing tax liabilities in the financial statements. Recognition of tax benefits of an uncertain tax position is permitted only to the extent the position is “more likely than not” to be sustained assuming examination by taxing authorities. Management has analyzed the Fund’s tax positions taken on federal, state and local income tax returns for all open tax years (for up
to three tax years) and has concluded that no provisions for federal, state and local income tax are required in the Fund’s financial statements. The Fund’s federal, state and local income tax and federal excise tax returns for tax years for which the applicable statutes of limitations have not expired are subject to examination by the Internal Revenue Service and state and local departments of revenue.
(C) Dividends and Distributions to Shareholders. Dividends and distributions are recorded on the ex-dividend date. The Fund intends to declare dividends from net investment income, if any, daily and intends to pay them at least monthly and declares and pays distributions from net realized capital gains, if any, at least annually. Unless the shareholder elects otherwise, all dividends and distributions are reinvested in the same class of shares of the Fund, at NAV. Dividends and distributions to shareholders are determined in accordance with federal income tax regulations and may differ from determinations using GAAP.
(D) Security Transactions and Investment Income. The Fund records security transactions on the trade date. Realized gains and losses on security transactions are determined using the identified cost method. Interest income is accrued as earned using the effective interest rate method. Discounts and premiums on securities purchased for the Fund are accreted and amortized, respectively, on the effective interest rate method over the life of the respective securities.
Investment income and realized and unrealized gains and losses on investments of the Fund are allocated pro rata to the separate classes of shares based upon their relative net assets on the date the income is earned or realized and unrealized gains and losses are incurred.
The Fund may place a debt security on non-accrual status and reduce related interest income by ceasing current accruals and writing off all or a portion of any interest receivables when the collection of all or a portion of such interest has become doubtful. A debt security is removed from non-accrual status when the issuer resumes interest payments or when collectability of interest is reasonably assured.
(E) Expenses. Expenses of the Trust are allocated to the individual Funds in proportion to the net assets of the respective Funds when the expenses are incurred, except where direct allocations of expenses can be made. Expenses (other than transfer agent expenses and fees incurred under the shareholder services plans and/or the distribution plans further discussed in Note 3(B)) are allocated to separate classes of shares pro rata based upon their relative net assets on the date the expenses are incurred. The expenses borne by the Fund, including those of related parties to the Fund, are shown in the Statement of Operations.
(F) Use of Estimates. In preparing financial statements in conformity with GAAP, management makes estimates and assumptions that affect the reported amounts and disclosures in the financial statements. Actual results could differ from those estimates.
(G) Futures Contracts. A futures contract is an agreement to purchase or sell a specified quantity of an underlying instrument at a specified future date and price, or to make or receive a cash payment based on the value of a financial instrument (e.g., interest rate, security or securities index). The Fund is subject to risks such as market price risk and/or interest rate risk in the normal course of investing in these
Notes to Financial Statements(continued)
transactions. Upon entering into a futures contract, the Fund is required to pledge to the broker or futures commission merchant an amount of cash and/or U.S. government securities equal to a certain percentage of the collateral amount, known as the “initial margin.” During the period the futures contract is open, changes in the value of the contract are recognized as unrealized appreciation or depreciation by marking to market such contract on a daily basis to reflect the market value of the contract at the end of each day’s trading. The Fund agrees to receive from or pay to the broker or futures commission merchant an amount of cash equal to the daily fluctuation in the value of the contract. Such receipts or payments are known as “variation margin.” When the futures contract is closed, the Fund records a realized gain or loss equal to the difference between the proceeds from (or cost of) the closing transaction and the Fund’s basis in the contract.
The use of futures contracts involves, to varying degrees, elements of market risk in excess of the amount recognized in the Statement of Assets and Liabilities. The contract or notional amounts and variation margin reflect the extent of the Fund’s involvement in open futures positions. There are several risks associated with the use of futures contracts as hedging techniques. There can be no assurance that a liquid market will exist at the time when the Fund seeks to close out a futures contract. If no liquid market exists, the Fund would remain obligated to meet margin requirements until the position is closed. Futures may involve a small initial investment relative to the risk assumed, which could result in losses greater than if they had not been used. Futures may be more volatile than direct investments in the instrument underlying the futures and may not correlate to the underlying instrument, causing a given hedge not to achieve its objectives. The Fund’s activities in futures contracts have minimal counterparty risk as they are conducted through regulated exchanges that guarantee the futures against default by the counterparty. In the event of a bankruptcy or insolvency of a futures commission merchant that holds margin on behalf of the Fund, the Fund may not be entitled to the return of the entire margin owed to the Fund, potentially resulting in a loss. The Fund’s investment in futures contracts and other derivatives may increase the volatility of the Fund’s NAVs and may result in a loss to the Fund. As of October 31, 2019, open futures contracts are shown in the Portfolio of Investments.
(H) Municipal Bond Risk. The Fund may invest more heavily in municipal bonds from certain cities, states or regions than others, which may increase the Fund’s exposure to losses resulting from economic, political, or regulatory occurrences impacting these particular cities, states or regions. In addition, many state and municipal governments that issue securities are under significant economic and financial stress and may not be able to satisfy their obligations. The Fund may invest a substantial amount of its assets in municipal bonds whose interest is paid solely from revenues of similar projects, such as tobacco settlement bonds. If the Fund concentrates its investments in this manner, it assumes the legal and economic risks relating to such projects and this may have a significant impact on the Fund’s investment performance.
Certain of the issuers in which the Fund may invest have recently experienced, or may experience, significant financial difficulties and repeated credit rating downgrades. On May 3, 2017, the Commonwealth of Puerto Rico began proceedings to seek bankruptcy-type protections from approximately $74 billion in debt and approximately $48 billion in
unfunded pension obligations. Puerto Rico’s debt restructuring of $122 billion is significantly larger than the previous largest U.S. public bankruptcy, which covered approximately $18 billion of debt for the city of Detroit. Puerto Rico has reached agreements with certain bondholders to restructure outstanding debt issued by certain of Puerto Rico’s instrumentalities and is negotiating the restructuring of its debt with certain other bondholders. Any agreement to restructure such outstanding debt must be approved by the judge overseeing the debt restructuring. Puerto Rico’s debt restructuring process and other economic factors or developments could occur rapidly and may significantly affect the value of municipal securities of Puerto Rico. The Fund’s vulnerability to potential losses associated with such developments may be reduced through investing in municipal securities that feature credit enhancements (such as bond insurance). The bond insurance provider pays both principal and interest when due to the bond holder. The magnitude of Puerto Rico’s debt restructuring or other adverse economic developments could pose significant strains on the ability of municipal securities insurers to meet all future claims. As of October 31, 2019, 94.0% of the Puerto Rico municipal securities held by the Fund were insured.
On February 12, 2019, the Puerto Rico Sales Tax Financing Corporation (“COFINA”) restructured $17.5 billion of its debt into $12 billion of new securities. On May 3, 2019, the Financial Oversight and Management Board for Puerto Rico (the “Oversight Board”), the Commonwealth of Puerto Rico and a majority of creditors committed to a restructuring support agreement (“RSA”) to restructure the outstanding debt of the Puerto Rico Electric Power Authority. The RSA still requires approval from Judge Laura Taylor Swain and the Puerto Rican legislature and there is no assurance that either will approve of the agreement. On September 27, 2019, the Oversight Board released its draft of Puerto Rico’s Bankruptcy Plan of Adjustment. There is no assurance that the plan will be approved by creditors or Judge Swain.
On August 7, 2019, the U.S. Court of Appeals for the First Circuit entered an order denying the Oversight Board’s motion to dismiss as equitably moot the appeal of Judge Swain’s rulings related to confirmation of the COFINA third amended plan of adjustment. The appeal of the COFINA debt restructuring stems from a group of legacy COFINA subordinate bondholders. There is no assurance the First Circuit will uphold the COFINA plan of adjustment approved by Judge Swain. As of October 31, 2019, the Fund held less than 0.1% of its net assets in COFINA bonds that have not yet been restructured.
(I) Indemnifications. Under the Trust’s organizational documents, its officers and trustees are indemnified against certain liabilities that may arise out of performance of their duties to the Trust. Additionally, in the normal course of business, the Fund enters into contracts with third-party service providers that contain a variety of representations and warranties and which may provide general indemnifications. The Fund’s maximum exposure under these arrangements is unknown, as this would involve future claims that may be made against the Fund that have not yet occurred. Based on experience, management is of the view that the risk of loss in connection with these potential indemnification obligations is remote. However, there can be no assurance that material liabilities related to such obligations will not arise in the future, which could adversely impact the Fund.
| | |
| 48 | | MainStay MacKay Tax Free Bond Fund |
(J) Quantitative Disclosure of Derivative Holdings. The following tables show additional disclosures related to the Fund’s derivative and hedging activities, including how such activities are accounted for and their effect on the Fund’s financial positions, performance and cash flows. The Fund entered into futures contracts to help manage the duration and yield curve positioning of the portfolio. These derivatives are not accounted for as hedging instruments.
Fair value of derivative instruments as of October 31, 2019:
Asset Derivatives
| | | | | | | | | | |
| | | Statement of
Assets and
Liabilities
Location | | Interest
Rate
Contracts
Risk | | | Total | |
| | | |
Futures Contracts | | Net Assets— Net unrealized appreciation on investments and futures contracts (a) | | $ | 2,792,274 | | | $ | 2,792,274 | |
| | | | | | |
Total Fair Value | | | | $ | 2,792,274 | | | $ | 2,792,274 | |
| | | | | | |
| (a) | Includes cumulative appreciation (depreciation) of futures contracts as reported in the Portfolio of Investments. Only current day’s variation margin is reported within the Statement of Assets and Liabilities. |
The effect of derivative instruments on the Statement of Operations for the year ended October 31, 2019:
Realized Gain (Loss)
| | | | | | | | | | |
| | | Statement of
Operations
Location | | Interest
Rate
Contracts
Risk | | | Total | |
| | | |
Futures Contracts | | Net realized gain (loss) on futures transactions | | $ | (22,134,980 | ) | | $ | (22,134,980 | ) |
| | | | | | |
Total Realized Gain (Loss) | | | | $ | (22,134,980 | ) | | $ | (22,134,980 | ) |
| | | | | | |
Change in Unrealized Appreciation (Depreciation)
| | | | | | | | | | |
| | | Statement of
Operations
Location | | Interest
Rate
Contracts
Risk | | | Total | |
| | | |
Futures Contracts | | Net change in unrealized appreciation (depreciation) on futures contracts | | $ | (9,549,802 | ) | | $ | (9,549,802 | ) |
| | | | | | |
Total Change in Unrealized Appreciation (Depreciation) | | | | $ | (9,549,802 | ) | | $ | (9,549,802 | ) |
| | | | | | |
Average Notional Amount
| | | | | | | | |
| | | Interest Rate
Contracts
Risk | | | Total | |
| | |
Futures Contracts Short (a) | | $ | (359,714,983 | ) | | $ | (359,714,983 | ) |
| | | | |
| (a) | Positions were open eleven months during the reporting period. |
Note 3–Fees and Related Party Transactions
(A) Manager and Subadvisor. New York Life Investments, a registered investment adviser and an indirect,wholly-owned subsidiary of New York Life Insurance Company (“New York Life”), serves as the Fund’s Manager, pursuant to an Amended and Restated Management Agreement (“Management Agreement”). The Manager provides offices, conducts clerical, recordkeeping and bookkeeping services and keeps most of the financial and accounting records required to be maintained by the Fund. Except for the portion of salaries and expenses that are the responsibility of the Fund, the Manager pays the salaries and expenses of all personnel affiliated with the Fund and certain operational expenses of the Fund. The Fund reimburses New York Life Investments in an amount equal to a portion of the compensation of the Chief Compliance Officer attributable to the Fund. MacKay Shields LLC (“MacKay Shields” or the “Subadvisor”), a registered investment adviser and an indirect,wholly-owned subsidiary of New York Life, serves as Subadvisor to the Fund and is responsible for theday-to-day portfolio management of the Fund. Pursuant to the terms of an Amended and Restated Subadvisory Agreement (“Subadvisory Agreement”) between New York Life Investments and MacKay Shields, New York Life Investments pays for the services of the Subadvisor.
Under the Management Agreement, the Fund pays the Manager a monthly fee for the services performed and the facilities furnished at an annual rate of the Fund’s average daily net assets as follows: 0.45% up to $500 million; 0.425% from $500 million to $1 billion; 0.40% from $1 billion to $5 billion; and 0.39% in excess of $5 billion, plus a fee for fund accounting services, previously provided by New York Life Investments under a separate fund accounting agreement, furnished at an annual rate of the Fund’s average daily net assets as follows: 0.05% up to $20 million; 0.0333% from $20 million to $100 million; and 0.01% in excess of $100 million.
During the year ended October 31, 2019, the effective management fee rate (exclusive of any applicable waivers/reimbursements) was 0.42% inclusive of a fee for fund accounting services of 0.01% of the Fund’s average daily net assets.
New York Life Investments has contractually agreed to waive fees and/or reimburse expenses so that Total Annual Fund Operating Expenses (excluding taxes, interest, litigation, extraordinary expenses, brokerage and other transaction expenses relating to the purchase or sale of portfolio investments and acquired (underlying) fund fees and expenses) for Class A shares do not exceed 0.82% of its average daily net assets. New York Life Investments will apply an equivalent waiver or reimbursement, in an equal number of basis points, to the other share classes of the Fund, except for Class R6. New York Life Investments has also contractually agreed to waive fees and/or reimburse expenses so that Total Annual Fund Operating Expenses (excluding taxes, interest,
Notes to Financial Statements(continued)
litigation, extraordinary expenses, brokerage and other transaction expenses relating to the purchase or sale of portfolio investments, and acquired (underlying) fund fees and expenses) of Class R6 do not exceed those of Class I. These agreements will remain in effect until February 28, 2020, and shall renew automatically for one year terms unless New York Life Investments provides written notice of termination prior to the start of the next term or upon approval by the Board.
During the year ended October 31, 2019, New York Life Investments earned fees from the Fund in the amount of $15,965,602 and paid the Subadvisor in the amount of $7,779,665.
State Street providessub-administration andsub-accounting services to the Fund pursuant to an agreement with New York Life Investments. These services include calculating the daily NAVs of the Fund, maintaining the general ledger andsub-ledger accounts for the calculation of the Fund’s NAVs and assisting New York Life Investments in conducting various aspects of the Fund’s administrative operations. For providing these services to the Fund, State Street is compensated by New York Life Investments.
Pursuant to an agreement between the Trust and New York Life Investments, New York Life Investments is responsible for providing or procuring certain regulatory reporting services for the Fund. The Fund will reimburse New York Life Investments for the actual costs incurred by New York Life Investments in connection with providing or procuring these services for the Fund.
(B) Distribution and Service Fees. The Trust, on behalf of the Fund, has entered into a distribution agreement with NYLIFE Distributors LLC (the “Distributor”), an indirect,wholly-owned subsidiary of New York Life. The Fund has adopted distribution plans (the “Plans”) in accordance with the provisions of Rule 12b-1 under the 1940 Act.
Pursuant to the Class A and Investor Plans, the Distributor receives a monthly distribution fee from the Class A and Investor Class shares at an annual rate of 0.25% of the average daily net assets of the Class A and Investor Class shares for distribution and/or service activities as designated by the Distributor. Pursuant to the Class B and Class C Plans, Class B and Class C shares pay the Distributor a monthly distribution fee at an annual rate of 0.25% of the average daily net assets of the Class B and Class C shares along with a service fee at an annual rate of 0.25% of the average daily net assets of the Class B and Class C shares, for a total 12b-1 fee of 0.50%. Class I shares are not subject to a distribution and/or service fee.
The Plans provide that the distribution and service fees are payable to the Distributor regardless of the amounts actually expended by the Distributor for distribution of the Fund’s shares and service activities.
(C) Sales Charges. During the year ended October 31, 2019, the Fund was advised by the Distributor that the amount of initial sales charges retained on sales of Class A and Investor Class shares were $63,176 and $4,412, respectively.
During the year ended October 31, 2019, the Fund was also advised that the Distributor retained CDSCs on redemptions of Class A, Investor Class, Class B and Class C shares of $129,169, $144, $18,256 and $19,357, respectively.
(D) Transfer, Dividend Disbursing and Shareholder Servicing Agent. NYLIM Service Company LLC, an affiliate of New York Life Investments, is the Fund’s transfer, dividend disbursing and shareholder servicing agent pursuant to an agreement between NYLIM Service Company LLC and the Trust. NYLIM Service Company LLC has entered into an agreement with DST Asset Manager Solutions, Inc. (“DST”), pursuant to which DST performs certain transfer agent services on behalf of NYLIM Service Company LLC. During the year ended October 31, 2019, transfer agent expenses incurred by the Fund were as follows:
| | | | |
Class A | | $ | 1,159,775 | |
Investor Class | | | 7,391 | |
Class B | | | 10,348 | |
Class C | | | 169,803 | |
Class I | | | 1,586,110 | |
(E) Small Account Fee. Shareholders with small accounts adversely impact the cost of providing transfer agency services. In an effort to reduce total transfer agency expenses, the Fund has implemented a small account fee on certain types of accounts. Certain shareholders with an account balance of less than $1,000 are charged an annual per account fee of $20 (assessed semi-annually), the proceeds from which offset transfer agent fees as reflected in the Statement of Operations.
Note 4–Federal Income Tax
As of October 31, 2019, the cost and unrealized appreciation (depreciation) of the Fund’s investment portfolio, including applicable derivative contracts and other financial instruments, as determined on a federal income tax basis, were as follows:
| | | | | | | | | | | | | | | | |
| | | Federal Tax
Cost | | | Gross
Unrealized
Appreciation | | | Gross
Unrealized
(Depreciation) | | | Net
Unrealized
Appreciation/
(Depreciation) | |
| | | | |
Investments in Securities | | $ | 4,693,987,459 | | | $ | 167,452,347 | | | $ | (9,735,523 | ) | | $ | 157,716,824 | |
As of October 31, 2019, the components of accumulated gain (loss) on a tax basis were as follows:
| | | | | | | | | | |
Ordinary
Income | | Undistributed
Tax Exempt
Income | | Accumulated
Capital and
Other Gain
(Loss) | | Other
Temporary
Differences | | Unrealized
Appreciation
(Depreciation) | | Total
Accumulated
Gain (Loss) |
| | | | | |
| $— | | $2,741,911 | | $(24,336,694) | | $(3,330,912) | | $157,716,824 | | $132,791,129 |
The difference between book-basis and tax-basis unrealized appreciation (depreciation) is primarily due to the mark to market of futures contracts. The other temporary differences are primarily due to dividends payable.
| | |
| 50 | | MainStay MacKay Tax Free Bond Fund |
The following table discloses the current year reclassifications between total distributable earnings (loss) and additional paid-in capital arising from permanent differences; net assets as of October 31, 2019 were not affected.
| | |
Total Distributable Earnings (Loss) | | Additional Paid-In Capital |
| |
| $2,135,739 | | $(2,135,739) |
The reclassifications for the Fund are primarily due to expiration of capital loss carryforwards.
Under the Regulated Investment Company Modernization Act of 2010, the Fund is permitted to carry forward capital losses incurred in taxable years beginning after December 22, 2010, for an unlimited period. However, any losses incurred during those future years will be required to be utilized prior to the losses incurred in pre-enactment tax years. As a result of this ordering rule, pre-enactment capital loss carryforwards may be more likely to expire unused. Additionally, post-enactment capital losses that are carried forward will retain their character as eithershort-term orlong-term capital losses rather than being considered allshort-term as under previous law.
As of October 31, 2019, for federal income tax purposes, capital loss carryforwards of $24,336,694 were available as shown in the table below, to the extent provided by the regulations to offset future realized gains of the Fund through the years indicated. To the extent that these capital loss carryforwards are used to offset future capital gains, it is probable that the capital gains so offset will not be distributed to shareholders. No capital gain distributions shall be made until any capital loss carryforwards have been fully utilized or expired.
| | | | | | | | |
Capital Loss
Available Through | | Short-Term
Capital Loss
Amounts (000’s) | | | Long-Term
Capital Loss
Amounts (000’s) | |
| | |
| Unlimited | | $ | 12,670 | | | $ | 11,667 | |
The Fund had $2,135,739 of capital loss carryforward that expired during the year ended October 31, 2019.
During the years ended October 31, 2019 and October 31, 2018, the tax character of distributions paid as reflected in the Statements of Changes in Net Assets were as follows:
| | | | | | | | |
| | | 2019 | | | 2018 | |
| | |
Distributions paid from: | | | | | | | | |
Ordinary Income | | $ | 316,849 | | | $ | 408,463 | |
Exempt Interest Dividends | | | 114,793,846 | | | | 95,722,245 | |
Total | | $ | 115,110,695 | | | $ | 96,130,708 | |
Note 5–Custodian
State Street is the custodian of cash and securities held by the Fund. Custodial fees are charged to the Fund based on the Fund’s net assets and/or the market value of securities held by the Fund and the number of certain transactions incurred by the Fund.
Note 6–Line of Credit
The Fund and certain other funds managed by New York Life Investments maintain a line of credit with a syndicate of banks in order to secure a source of funds for temporary purposes to meet unanticipated or excessive redemption requests.
Effective July 30, 2019, under the credit agreement (the “Credit Agreement”), the aggregate commitment amount is $600,000,000 with an additional uncommitted amount of $100,000,000. The commitment fee is an annual rate of 0.15% of the average commitment amount payable quarterly, regardless of usage, to State Street, who serves as the agent to the syndicate. The commitment fee is allocated among the Fund and certain other funds managed by New York Life Investments based upon their respective net assets and other factors. Interest on any revolving credit loan is charged based upon the Federal Funds Rate or the one-month London Interbank Offered Rate (“LIBOR”), whichever is higher. The Credit Agreement expires on July 28, 2020, although the Fund, certain other funds managed by New York Life Investments and the syndicate of banks may renew the Credit Agreement for an additional year on the same or different terms. Prior to July 30, 2019, the aggregate commitment amount and the commitment fee were the same as those under the current Credit Agreement. During the year ended October 31, 2019, there were no borrowings made or outstanding with respect to the Fund under the Credit Agreement.
Note 7–Interfund Lending Program
Pursuant to an exemptive order issued by the SEC, the Fund, along with certain other funds managed by New York Life Investments, may participate in an interfund lending program. The interfund lending program provides an alternative credit facility that permits the Fund and certain other funds managed by New York Life Investments to lend or borrow money for temporary purposes directly to or from one another subject to the conditions of the exemptive order. During the year ended October 31, 2019, there were no interfund loans made or outstanding with respect to the Fund.
Note 8–Purchases and Sales of Securities (in 000’s)
During the year ended October 31, 2019, purchases and sales of securities, other thanshort-term securities, were $3,179,205 and $1,447,845, respectively.
The Fund may purchase securities from or sell securities to other portfolios managed by the Subadvisor. These interportfolio transactions are primarily used for cash management purposes and are made pursuant to Rule 17a-7 under the 1940 Act. The Fund engaged in Rule 17a-7 transactions during the year ended October 31, 2019, as follows:
| | |
Sales
(000’s) | | Realized Gain /
(Loss) (000’s) |
| |
| $15,960 | | $(1,475) |
Notes to Financial Statements(continued)
Note 9–Capital Share Transactions
Transactions in capital shares for the years ended October 31, 2019 and October 31, 2018, were as follows:
| | | | | | | | |
Class A | | Shares | | | Amount | |
| | |
Year ended October 31, 2019: | | | | | | | | |
Shares sold | | | 53,958,287 | | | $ | 549,133,349 | |
Shares issued to shareholders in reinvestment of dividends and distributions | | | 3,742,394 | | | | 37,953,702 | |
Shares redeemed | | | (34,141,572 | ) | | | (342,393,081 | ) |
| | | | |
Net increase (decrease) in shares outstanding before conversion | | | 23,559,109 | | | | 244,693,970 | |
Shares converted into Class A (See Note 1) | | | 340,145 | | | | 3,445,378 | |
Shares converted from Class A (See Note 1) | | | (91,670 | ) | | | (936,239 | ) |
| | | | |
Net increase (decrease) | | | 23,807,584 | | | $ | 247,203,109 | |
| | | | |
Year ended October 31, 2018: | | | | | | | | |
Shares sold | | | 27,829,562 | | | $ | 277,281,404 | |
Shares issued to shareholders in reinvestment of dividends and distributions | | | 4,415,082 | | | | 43,848,053 | |
Shares redeemed | | | (45,038,927 | ) | | | (446,306,716 | ) |
| | | | |
Net increase (decrease) in shares outstanding before conversion | | | (12,794,283 | ) | | | (125,177,259 | ) |
Shares converted into Class A (See Note 1) | | | 166,398 | | | | 1,653,064 | |
Shares converted from Class A (See Note 1) | | | (120,030 | ) | | | (1,185,433 | ) |
| | | | |
Net increase (decrease) | | | (12,747,915 | ) | | $ | (124,709,628 | ) |
| | | | |
| | |
| | | | | | | | |
Investor Class | | Shares | | | Amount | |
| | |
Year ended October 31, 2019: | | | | | | | | |
Shares sold | | | 165,195 | | | $ | 1,687,358 | |
Shares issued to shareholders in reinvestment of dividends and distributions | | | 26,056 | | | | 265,116 | |
Shares redeemed | | | (113,885 | ) | | | (1,158,170 | ) |
| | | | |
Net increase (decrease) in shares outstanding before conversion | | | 77,366 | | | | 794,304 | |
Shares converted into Investor Class (See Note 1) | | | 71,731 | | | | 734,316 | |
Shares converted from Investor Class (See Note 1) | | | (188,084 | ) | | | (1,918,730 | ) |
| | | | |
Net increase (decrease) | | | (38,987 | ) | | $ | (390,110 | ) |
| | | | |
Year ended October 31, 2018: | | | | | | | | |
Shares sold | | | 140,459 | | | $ | 1,403,995 | |
Shares issued to shareholders in reinvestment of dividends and distributions | | | 29,038 | | | | 289,625 | |
Shares redeemed | | | (128,010 | ) | | | (1,278,335 | ) |
| | | | |
Net increase (decrease) in shares outstanding before conversion | | | 41,487 | | | | 415,285 | |
Shares converted into Investor Class (See Note 1) | | | 55,754 | | | | 554,849 | |
Shares converted from Investor Class (See Note 1) | | | (127,835 | ) | | | (1,275,192 | ) |
| | | | |
Net increase (decrease) | | | (30,594 | ) | | $ | (305,058 | ) |
| | | | |
| | | | | | | | |
Class B | | Shares | | | Amount | |
| | |
Year ended October 31, 2019: | | | | | | | | |
Shares sold | | | 129,834 | | | $ | 1,308,467 | |
Shares issued to shareholders in reinvestment of dividends and distributions | | | 33,382 | | | | 337,837 | |
Shares redeemed | | | (438,612 | ) | | | (4,424,630 | ) |
| | | | |
Net increase (decrease) in shares outstanding before conversion | | | (275,396 | ) | | | (2,778,326 | ) |
Shares converted from Class B (See Note 1) | | | (29,908 | ) | | | (303,895 | ) |
| | | | |
Net increase (decrease) | | | (305,304 | ) | | $ | (3,082,221 | ) |
| | | | |
Year ended October 31, 2018: | | | | | | | | |
Shares sold | | | 34,039 | | | $ | 341,621 | |
Shares issued to shareholders in reinvestment of dividends and distributions | | | 43,176 | | | | 428,654 | |
Shares redeemed | | | (227,067 | ) | | | (2,257,077 | ) |
| | | | |
Net increase (decrease) in shares outstanding before conversion | | | (149,852 | ) | | | (1,486,802 | ) |
Shares converted from Class B (See Note 1) | | | (53,311 | ) | | | (529,520 | ) |
| | | | |
Net increase (decrease) | | | (203,163 | ) | | $ | (2,016,322 | ) |
| | | | |
|
| |
Class C | | Shares | | | Amount | |
| | |
Year ended October 31, 2019: | | | | | | | | |
Shares sold | | | 5,430,844 | | | $ | 54,932,748 | |
Shares issued to shareholders in reinvestment of dividends and distributions | | | 440,074 | | | | 4,460,962 | |
Shares redeemed | | | (5,711,197 | ) | | | (58,029,277 | ) |
| | | | |
Net increase (decrease) in shares outstanding before conversion | | | 159,721 | | | | 1,364,433 | |
Shares converted from Class C (See Note 1) | | | (141,573 | ) | | | (1,426,691 | ) |
| | | | |
Net increase (decrease) | | | 18,148 | | | $ | (62,258 | ) |
| | | | |
Year ended October 31, 2018: | | | | | | | | |
Shares sold | | | 2,787,815 | | | $ | 27,771,578 | |
Shares issued to shareholders in reinvestment of dividends and distributions | | | 503,206 | | | | 4,998,795 | |
Shares redeemed | | | (5,571,996 | ) | | | (55,431,369 | ) |
| | | | |
Net increase (decrease) | | | (2,280,975 | ) | | $ | (22,660,996 | ) |
| | | | |
| | |
| 52 | | MainStay MacKay Tax Free Bond Fund |
| | | | | | | | |
Class I | | Shares | | | Amount | |
| | |
Year ended October 31, 2019: | | | | | | | | |
Shares sold | | | 179,763,292 | | | $ | 1,818,673,906 | |
Shares issued to shareholders in reinvestment of dividends and distributions | | | 3,761,656 | | | | 38,392,984 | |
Shares redeemed | | | (40,947,185 | ) | | | (413,342,539 | ) |
| | | | |
Net increase (decrease) in shares outstanding before conversion | | | 142,577,763 | | | | 1,443,724,351 | |
Shares converted into Class I (See Note 1) | | | 39,940 | | | | 405,861 | |
| | | | |
Net increase (decrease) | | | 142,617,703 | | | $ | 1,444,130,212 | |
| | | | |
Year ended October 31, 2018: | | | | | | | | |
Shares sold | | | 60,501,972 | | | $ | 601,539,239 | |
Shares issued to shareholders in reinvestment of dividends and distributions | | | 2,142,891 | | | | 21,282,628 | |
Shares redeemed | | | (29,694,922 | ) | | | (295,001,752 | ) |
| | | | |
Net increase (decrease) in shares outstanding before conversion | | | 32,949,941 | | | | 327,820,115 | |
Shares converted into Class I (See Note 1) | | | 79,237 | | | | 782,232 | |
| | | | |
Net increase (decrease) | | | 33,029,178 | | | $ | 328,602,347 | |
| | | | |
Note 10–Recent Accounting Pronouncement
In March 2017, the Financial Accounting Standards Board issued an Accounting Standards Update, ASU2017-08, which amends the amortization period for certain callable debt securities that are held at a premium. The amendment requires the premium to be amortized to the earliest call date. This amendment does not require an accounting change for securities held at a discount. This guidance is effective for fiscal years beginning after December 15, 2018. At this time, management is evaluating the implications of the ASU and any impact on the financial statements has not yet been determined.
To improve the effectiveness of fair value disclosure requirements, the Financial Accounting Standards Board recently issued Accounting Standards Update (ASU)2018-13, Fair Value Measurement Disclosure Framework—Changes to the Disclosure Requirements for Fair Value Measurement (ASU2018-13), which adds, removes, and modifies certain aspects relating to fair value disclosure. ASU2018-13 is effective for interim and annual reporting periods beginning after December 15, 2019; early adoptions of the entire ASU 2018-13, or portions thereof, is permitted. Management has evaluated the implications of certain other provisions of the ASU and has determined to early adopt aspects related to the removal and modifications of certain fair value measurement disclosures under the ASU effective immediately. At this time, management is evaluating the implications of certain other provisions of the ASU related to new disclosure requirements and any impact on the financial statement disclosures has not yet been determined.
Note 11–Subsequent Events
In connection with the preparation of the financial statements of the Fund as of and for the year ended October 31, 2019, events and transactions subsequent to October 31, 2019, through the date the financial statements were issued have been evaluated by the Fund’s management for possible adjustment and/or disclosure. No subsequent events requiring financial statement adjustment or disclosure have been identified, other than the following:
Effective November 1, 2019, Class R6 shares of the Fund have now been made available for purchase.
Report of Independent Registered Public Accounting Firm
To the Shareholders and Board of Trustees
The MainStay Funds:
Opinion on the Financial Statements
We have audited the accompanying statement of assets and liabilities of MainStay MacKay Tax Free Bond Fund (the Fund), one of the funds constituting The MainStay Funds, including the portfolio of investments, as of October 31, 2019, the related statement of operations for the year then ended, the statements of changes in net assets for each of the years in thetwo-year period then ended, and the related notes (collectively, the financial statements) and the financial highlights for each of the years in thefive-year period then ended. In our opinion, the financial statements and financial highlights present fairly, in all material respects, the financial position of the Fund as of October 31, 2019, the results of its operations for the year then ended, the changes in its net assets for each of the years in thetwo-year period then ended, and the financial highlights for each of the years in thefive-year period then ended, in conformity with U.S. generally accepted accounting principles.
Basis for Opinion
These financial statements and financial highlights are the responsibility of the Fund’s management. Our responsibility is to express an opinion on these financial statements and financial highlights based on our audits. We are a public accounting firm registered with the Public Company Accounting Oversight Board (United States) (PCAOB) and are required to be independent with respect to the Fund in accordance with the U.S. federal securities laws and the applicable rules and regulations of the Securities and Exchange Commission and the PCAOB.
We conducted our audits in accordance with the standards of the PCAOB. Those standards require that we plan and perform the audit to obtain reasonable assurance about whether the financial statements and financial highlights are free of material misstatement, whether due to error or fraud. Our audits included performing procedures to assess the risks of material misstatement of the financial statements and financial highlights, whether due to error or fraud, and performing procedures that respond to those risks. Such procedures included examining, on a test basis, evidence regarding the amounts and disclosures in the financial statements and financial highlights. Such procedures also included confirmation of securities owned as of October 31, 2019, by correspondence with the custodian and brokers or by other appropriate auditing procedures when replies from brokers were not received. Our audits also included evaluating the accounting principles used and significant estimates made by management, as well as evaluating the overall presentation of the financial statements and financial highlights. We believe that our audits provide a reasonable basis for our opinion.

We have served as the auditor of one or more New York Life Investment Management investment companies since 2003.
Philadelphia, Pennsylvania
December 23, 2019
| | |
| 54 | | MainStay MacKay Tax Free Bond Fund |
Federal Income Tax Information
(Unaudited)
The Fund is required under the Internal Revenue Code to advise shareholders in a written statement as to the federal tax status of dividends paid by the Fund during such fiscal years.
For Federal individual income tax purposes, the Fund designated 99.7% of the ordinary income dividends paid during its fiscal year ended October 31, 2019 as attributable to interest income from Tax Exempt Municipal Bonds. Such dividends are currently exempt from Federal income taxes under Section 103(a) of the Internal Revenue Code.
In February 2020, shareholders will receive an IRS Form1099-DIV or substitute Form 1099, which will show the federal tax status of the distributions received by shareholders in calendar year 2019. The amounts that will be reported on such1099-DIV or substitute Form 1099 will be the amounts you are to use on your federal income tax return and will differ from the amounts which we must report for the Fund’s fiscal year end October 31, 2019.
Proxy Voting Policies and Procedures and Proxy Voting Record
A description of the policies and procedures that New York Life Investments uses to vote proxies related to the Fund’s securities is available without charge, upon request, by visiting the MainStay Funds’ website atnylinvestments.com/fundsor visiting the SEC’s website atwww.sec.gov.
The Fund is required to file with the SEC its proxy voting records for the12-month period ending June 30 on Form N-PX. The most recent Form N-PX or proxy voting record is available free of charge upon request by calling800-624-6782; visiting the MainStay Funds’ website atnylinvestments.com/funds; or visiting the SEC’s website atwww.sec.gov.
Shareholder Reports and Quarterly Portfolio Disclosure
The Fund is required to file its complete schedule of portfolio holdings with the SEC 60 days after its first and third fiscal quarter onForm N-PORT. The Fund’s holdings report is available free of charge by visiting the SEC’s website atwww.sec.govor upon request by calling New York Life Investments at800-624-6782.
Board of Trustees and Officers (Unaudited)
The Trustees and officers of the Funds are listed below. The Board oversees the MainStay Group of Funds (which consists of MainStay Funds and MainStay Funds Trust), MainStay VP Funds Trust, MainStay MacKay DefinedTerm Municipal Opportunities Fund, the Manager and the Subadvisors, and elects the officers of the Funds who are responsible for theday-to-day operations of the Funds. Information pertaining to the Trustees and officers is set forth below. Each Trustee serves until his or her successor is elected and qualified or until his or her
resignation, death or removal. Under the Board’s retirement policy, unless an exception is made, a Trustee must tender his or her resignation by the end of the calendar year during which he or she reaches the age of 75. Officers are elected annually by the Board. The business address of each Trustee and officer listed below is 51 Madison Avenue, New York, New York 10010. A majority of the Trustees are not “interested persons” (as defined by the 1940 Act and rules adopted by the SEC thereunder) of the Fund (“Independent Trustees”).
| | | | | | | | | | | | |
| | | | | Name and
Year of Birth | | Term of Office,
Position(s) Held and
Length of Service | | Principal Occupation(s)
During Past Five Years | | Number of
Portfolios in
Fund Complex
Overseen by
Trustee | | Other Directorships
Held by Trustee |
Interested Trustee | | | | Yie-Hsin Hung* 1962 | | MainStay Funds: Trustee since 2017; MainStay Funds Trust:Trustee since 2017. | | Senior Vice President of New York Life since joining in 2010, Member of the Executive Management Committee since 2017, Chief Executive Officer, New York Life Investment Management Holdings LLC & New York Life Investment Management LLC since 2015. Senior Managing Director andCo-President of New York Life Investment Management LLC from January 2014 to May 2015. Previously held positions of increasing responsibility, including head of NYLIM International, Alternative Growth Businesses, and Institutional investments since joining New York Life in 2010. | | 74 | | MainStay VP Funds Trust:
Trustee since 2017 (31 portfolios); and
MainStay MacKay DefinedTerm Municipal Opportunities Fund: Trustee since 2017. |
| | * | This Trustee is considered to be an “interested person” of the MainStay Group of Funds, MainStay VP Funds Trust and MainStay MacKay DefinedTerm Municipal Opportunities Fund, within the meaning of the 1940 Act because of her affiliation with New York Life Insurance Company, New York Life Investment Management LLC, Candriam Belgium S.A., Candriam Luxembourg S.C.A., IndexIQ Advisors LLC, MacKay Shields LLC, NYL Investors LLC, NYLIFE Securities LLC and/or NYLIFE Distributors LLC, as described in detail above in the column entitled “Principal Occupation(s) During Past Five Years.” |
| | |
| 56 | | MainStay MacKay Tax Free Bond Fund |
| | | | | | | | | | | | |
| | | | | Name and
Year of Birth | | Term of Office,
Position(s) Held and
Length of Service | | Principal Occupation(s)
During Past Five Years | | Number of
Portfolios in
Fund Complex
Overseen by
Trustee | | Other Directorships
Held by Trustee |
Independent Trustees | | | | David H. Chow 1957 | | MainStay Funds: Trustee since 2016, Advisory Board Member (June 2015 to December 2015); MainStay Funds Trust:Trustee since 2016, Advisory Board Member (June 2015 to December 2015). | | Founder and CEO, DanCourt Management, LLC (since 1999) | | 74 | | MainStay VP Funds Trust: Trustee since 2016, Advisory Board Member (June 2015 to December 2015) (31 portfolios);
MainStay MacKay DefinedTerm Municipal Opportunities Fund: Trustee since 2016, Advisory Board Member (June 2015 to December 2015);
Market Vectors Group of Exchange-Traded Funds: Independent Chairman of the Board of Trustees since 2008 and Trustee since 2006 (56 portfolios); and
Berea College of Kentucky: Trustee since 2009. |
| | | | Susan B. Kerley 1951 | | MainStay Funds: Chairman since 2017 and Trustee since 2007; MainStay Funds Trust:Chairman since 2017 and Trustee since 1990.** | | President, Strategic Management Advisors LLC (since 1990) | | 74 | | MainStay VP Funds Trust: Chairman since January 2017 and Trustee since 2007 (31 portfolios)***;
MainStay MacKay DefinedTerm Municipal Opportunities Fund: Chairman since 2017 and Trustee since 2011; and
Legg Mason Partners Funds: Trustee since 1991 (45 portfolios). |
| | | | Alan R. Latshaw 1951 | | MainStay Funds: Trustee; MainStay Funds Trust: Trustee and Audit Committee Financial Expert since 2007.** | | Retired; Partner, Ernst & Young LLP (2002 to 2003); Partner, Arthur Andersen LLP (1989 to 2002); Consultant to the MainStay Funds Audit and Compliance Committee (2004 to 2006) | | 74 | | MainStay VP Funds Trust: Trustee and Audit Committee Financial Expert since 2007 (31 portfolios)***;
MainStay MacKay DefinedTerm Municipal Opportunities Fund: Trustee and Audit Committee Financial Expert since 2011;
State Farm Associates Funds Trusts: Trustee since 2005 (4 portfolios);
and State Farm Variable Product Trust: Trustee since 2005 (9 portfolios). |
| | | | Richard H. Nolan, Jr. 1946 | | MainStay Funds: Trustee since 2007; MainStay Funds Trust:Trustee since 2007.** | | Managing Director, ICC Capital Management (since 2004); President—Shields/Alliance, Alliance Capital Management (1994 to 2004) | | 74 | | MainStay VP Funds Trust: Trustee since 2006 (31 portfolios)***; and
MainStay MacKay DefinedTerm Municipal Opportunities Fund: Trustee since 2011. |
| | | | Jacques P. Perold 1958 | | MainStay Funds: Trustee since 2016, Advisory Board Member (June 2015 to December 2015); MainStay Funds Trust:Trustee since 2016, Advisory Board Member (June 2015 to December 2015). | | Retired; President, Fidelity Management & Research Company (2009 to 2014); Founder, President and Chief Executive Officer, Geode Capital Management, LLC (2001 to 2009) | | 74 | | MainStay VP Funds Trust: Trustee since 2016, Advisory Board Member (June 2015 to December 2015) (31 portfolios);
MainStay MacKay DefinedTerm Municipal Opportunities Fund: Trustee since 2016, Advisory Board Member (June 2015 to December 2015);
Allstate Corporation: Director since 2015;MSCI, Inc.: Director since 2017 and
Boston University: Trustee since 2014. |
| | | | | | | | | | | | |
| | | | | Name and
Year of Birth | | Term of Office,
Position(s) Held and
Length of Service | | Principal Occupation(s)
During Past Five Years | | Number of
Portfolios in
Fund Complex
Overseen by
Trustee | | Other Directorships
Held by Trustee |
Independent Trustees | | | | Richard S. Trutanic 1952 | | MainStay Funds: Trustee since 1994; MainStay Funds Trust: Trustee since 2007.** | | Chairman and Chief Executive Officer, Somerset & Company (financial advisory firm) (since 2004); Managing Director, The Carlyle Group (private investment firm) (2002 to 2004); Senior Managing Director, Partner and Board Member, Groupe Arnault S.A. (private investment firm) (1999 to 2002) | | 74 | | MainStay VP Funds Trust: Trustee since 2007 (31 portfolios)***; and
MainStay MacKay DefinedTerm Municipal Opportunities Fund: Trustee since 2011. |
| | ** | Includes prior service as a Director/Trustee of certain predecessor entities to MainStay Funds Trust. |
| | *** | Includes prior service as a Director of MainStay VP Series Fund, Inc., the predecessor to MainStay VP Funds Trust. |
| | |
| 58 | | MainStay MacKay Tax Free Bond Fund |
| | | | | | | | |
| | | | | Name and
Year of Birth | | Position(s) Held and
Length of Service | | Principal Occupation(s)
During Past Five Years |
Officers
of the
Trust
(Who are
not
Trustees)* | | | | Kirk C. Lehneis 1974 | | President, MainStay Funds, MainStay Funds Trust (since 2017) | | Chief Operating Officer and Senior Managing Director (since 2016), New York Life Investment Management LLC; Chairman of the Board (since 2017), NYLIFE Distributors LLC; Chairman of the Board, NYLIM Service Company LLC (since 2017); Trustee, President and Principal Executive Officer of IndexIQ Trust, IndexIQ ETF Trust and IndexIQ Active ETF Trust (since January 2018); President, MainStay MacKay DefinedTerm Municipal Opportunities Fund and MainStay VP Funds Trust
(since 2017)**; Senior Managing Director, Global Product Development (2015 to 2016); Managing Director, Product Development (2010 to 2015), New York Life Investment Management LLC |
| | | | Jack R. Benintende 1964 | | Treasurer and Principal Financial and Accounting Officer, MainStay Funds (since 2007), MainStay Funds Trust (since 2009) | | Managing Director, New York Life Investment Management LLC (since 2007); Treasurer and Principal Financial and Accounting Officer, MainStay MacKay DefinedTerm Municipal Opportunities Fund (since 2011) and MainStay VP Funds Trust (since 2007)**; and Assistant Treasurer, New York Life Investment Management Holdings LLC (2008 to 2012) |
| | | | Kevin M. Bopp 1969 | | Vice President and Chief Compliance Officer, MainStay Funds and MainStay Funds Trust (since 2014) | | Chief Compliance Officer, New York Life Investment Management LLC, IndexIQ Trust, IndexIQ ETF Trust and IndexIQ Active ETF Trust (since 2016), Director and Associate General Counsel (2011 to 2014) and Vice President and Assistant General Counsel (2010 to 2011), New York Life Investment Management LLC; Vice President and Chief Compliance Officer, MainStay VP Funds Trust, MainStay MacKay DefinedTerm Municipal Opportunities Fund (since 2014); Assistant Secretary, MainStay Funds, MainStay Funds Trust and MainStay VP Funds Trust (2010 to 2014)**, MainStay MacKay DefinedTerm Municipal Opportunities Fund (2011 to 2014) |
| | | | J. Kevin Gao 1967 | | Secretary and Chief Legal Officer, MainStay Funds and MainStay Funds Trust (since 2010) | | Managing Director and Associate General Counsel, New York Life Investment Management LLC (since 2010); Secretary and Chief Legal Officer, MainStay MacKay DefinedTerm Municipal Opportunities Fund (since 2011) and MainStay VP Funds Trust (since 2010)** |
| | | | Scott T. Harrington 1959 | | Vice President—Administration, MainStay Funds (since 2005), MainStay Funds Trust (since 2009) | | Managing Director, New York Life Investment Management LLC (including predecessor advisory organizations) (since 2000); Member of the Board of Directors, New York Life Trust Company (since 2009); Vice President—Administration, MainStay MacKay DefinedTerm Municipal Opportunities Fund (since 2011) and MainStay VP Funds Trust (since 2005)** |
| | * | The officers listed above are considered to be “interested persons” of the MainStay Group of Funds, MainStay VP Funds Trust and MainStay MacKay Defined Term Municipal Opportunities Fund within the meaning of the 1940 Act because of their affiliation with the MainStay Group of Funds, New York Life Insurance Company and/or its affiliates, including New York Life Investment Management LLC, NYLIM Service Company LLC, NYLIFE Securities LLC and/or NYLIFE Distributors LLC, as described in detail in the column captioned “Principal Occupation(s) During Past Five Years.” Officers are elected annually by the Board. |
| | ** | Includes prior service as an Officer of MainStay VP Series Fund, Inc., the predecessor to MainStay VP Funds Trust. |
MainStay Funds
Equity
U.S. Equity
MainStay Epoch U.S. All Cap Fund
MainStay Epoch U.S. Equity Yield Fund
MainStay Large Cap Growth Fund
MainStay MacKay Common Stock Fund
MainStay MacKay Growth Fund
MainStay MacKay S&P 500 Index Fund
MainStay MacKay Small Cap Core Fund1
MainStay MacKay U.S. Equity Opportunities Fund
MainStay MAP Equity Fund
International Equity
MainStay Epoch International Choice Fund
MainStay MacKay International Equity Fund
MainStay MacKay International Opportunities Fund
Emerging Markets Equity
MainStay Candriam Emerging Markets Equity Fund
MainStay MacKay Emerging Markets Equity Fund
Global Equity
MainStay Epoch Capital Growth Fund
MainStay Epoch Global Equity Yield Fund
Fixed Income
Taxable Income
MainStay Candriam Emerging Markets Debt Fund2
MainStay Floating Rate Fund
MainStay Indexed Bond Fund3
MainStay MacKay High Yield Corporate Bond Fund
MainStay MacKay Infrastructure Bond Fund
MainStay MacKay Short Duration High Yield Fund
MainStay MacKay Total Return Bond Fund
MainStay MacKay Unconstrained Bond Fund
Tax-Exempt Income
MainStay MacKay California Tax Free Opportunities Fund4
MainStay MacKay High Yield Municipal Bond Fund
MainStay MacKay Intermediate Tax Free Bond Fund
MainStay MacKay New York Tax Free Opportunities Fund5
MainStay MacKay Short Term Municipal Fund
MainStay MacKay Tax Free Bond Fund
Money Market
MainStay Money Market Fund
Mixed Asset
MainStay Balanced Fund
MainStay Income Builder Fund
MainStay MacKay Convertible Fund
Speciality
MainStay Cushing Energy Income Fund
MainStay Cushing MLP Premier Fund
MainStay Cushing Renaissance Advantage Fund
Asset Allocation
MainStay Conservative Allocation Fund
MainStay Growth Allocation Fund
MainStay Moderate Allocation Fund
MainStay Moderate Growth Allocation Fund
Manager
New York Life Investment Management LLC
New York, New York
Subadvisors
Candriam Belgium S.A.6
Brussels, Belgium
Candriam Luxembourg S.C.A.6
Strassen, Luxembourg
Cushing Asset Management, LP
Dallas, Texas
Epoch Investment Partners, Inc.
New York, New York
MacKay Shields LLC6
New York, New York
Markston International LLC
White Plains, New York
NYL Investors LLC6
New York, New York
Winslow Capital Management, LLC
Minneapolis, Minnesota
Legal Counsel
Dechert LLP
Washington, District of Columbia
Independent Registered Public Accounting Firm
KPMG LLP
Philadelphia, Pennsylvania
| 1. | Formerly known as MainStay Epoch U.S. Small Cap Fund. |
| 2. | Formerly known as MainStay MacKay Emerging Markets Debt Fund. |
| 3. | Effective December 5, 2019, MainStay Indexed Bond Fund was renamed MainStay Short Term Bond Fund. |
| 4. | Class A and Class I shares of this Fund are registered for sale in AZ, CA, MI, NV, OR, TX, UT and WA. Class I shares are registered for sale in CO, FL, GA, HI, ID, MA, MD, NH, NJ and NY. |
| 5. | This Fund is registered for sale in CA, CT, DE, FL, MA, NJ, NY and VT. |
| 6. | An affiliate of New York Life Investment Management LLC. |
Not part of the Annual Report
For more information
800-624-6782
nylinvestments.com/funds
“New York Life Investments” is both a service mark, and the common trade name, of the investment advisors affiliated with New York Life Insurance Company. The MainStay Funds® are managed by New York Life Investment Management LLC and distributed by NYLIFE Distributors LLC, 30 Hudson Street, Jersey City, NJ 07302, a wholly owned subsidiary of New York Life Insurance Company. NYLIFE Distributors LLC is a Member FINRA/SIPC.
©2019 NYLIFE Distributors LLC. All rights reserved.
| | |
| 1716275 MS159-19 | | MST11-12/19 (NYLIM) NL215 |
MainStay MacKay Convertible Fund
Message from the President and Annual Report
October 31, 2019

Beginning on January 1, 2021, paper copies of each MainStay Fund’s annual and semiannual shareholder reports will no longer be sent by mail, unless you specifically request paper copies of the reports from MainStay Funds or from your financial intermediary. Instead, the reports will be made available on the MainStay Funds’ website. You will be notified by mail and provided with a website address to access the report each time a new report is posted to the website.
If you already elected to receive shareholder reports electronically, you will not be affected by this change and you need not take any action. At any time, you may elect to receive reports and other communications from MainStay Funds electronically by calling toll-free 800-624-6782, by sending an e-mail to MainStayShareholderServices@nylim.com, or by contacting your financial intermediary.
You may elect to receive all future shareholder reports in paper form free of charge. If you hold shares of a MainStay Fund directly, you can inform MainStay Funds that you wish to receive paper copies of reports by calling toll-free 800-624-6782 or by sending an e-mail to MainStayShareholderServices@nylim.com. If you hold shares of a MainStay Fund through a financial intermediary, please contact the financial intermediary to make this election. Your election to receive reports in paper form will apply to all MainStay Funds in which you are invested and may apply to all funds held with your financial intermediary.
| | | | | | | | |
| | | | | |
| Not FDIC/NCUA Insured | | Not a Deposit | | May Lose Value | | No Bank Guarantee | | Not Insured by Any Government Agency |

This page intentionally left blank
Message from the President
Stock and bond markets generally gained ground during the12-month reporting period ended October 31, 2019, despite concerns regarding slowing U.S. and global economic growth and international trade conflicts.
After trending higher in November 2018, U.S. stocks and bonds dipped sharply in December 2018, over concerns regarding the pace of economic growth, a U.S. government shutdown and the potential impact of trade disputes between the United States and other nations, particularly China. U.S. markets recovered quickly in 2019 as trade tensions eased, the government reopened and the U.S. Federal Reserve Board (“Fed”) adopted a more accommodative tone regarding the future direction of interest rates. A wide spectrum of equity and fixed-income sectors gained ground through April 2019. Mixed macroeconomic signals and the inability of China and the United States to reach a trade agreement caused the market’s recovery to suffer during the spring and summer months of 2019. However, accommodative monetary policies from several central banks, including a series of interest rate cuts by the Fed, along with better-than-expected corporate earnings reassured investors and enabled markets to resume their advance.
Persistent, albeit slow, U.S. economic growth underpinned the U.S. stock market’s advance during the reporting period, positioning major U.S. equity indices to reach record territory by late October 2019. Sector strength shifted as investor sentiment alternated betweenrisk-on andrisk-off positions. In general, for the reporting period, cyclical, growth-oriented stocks outperformed their value-oriented counterparts by a small margin, with the information technology sector leading thelarge-cap S&P 500® Index. However, the traditionally more defensive areas of real estate and utilities generated above-average performance as well. Communication services, consumer discretionary, industrials and consumer staples performed in the middle of the pack, while materials, financials and health care lagged. Only the energy sector suffered declines, undermined by weak oil prices and concerns about future energy demand.
In the fixed-income markets, slowing economic growth, modest inflation and the Fed’s interest rate cuts created an environment of falling yields and rising prices for most bonds, with many areas of the market offering historically low yields by the end of the reporting period. Higher-credit-quality, longer-duration securities generally produced strong returns, with investment-
grade corporates and long-term Treasury bonds delivering particularly strong performance. A similar dynamic characterized the performance of the municipal bond market, with longer-term, higher-grade issues performing relatively well. On average, municipal bonds roughly matched the gains of corporate issues while providingtax-advantaged returns for eligible investors.
International stock and bond markets tended to underperform their U.S. counterparts, constrained by lackluster economic growth in the Eurozone and dramatically slowing growth in China and related parts of Asia amid persistent trade tensions with the United States. Uncertainties surrounding the unending Brexit drama took a further toll on investor confidence, with Britain seemingly unable to resolve its internal conflicts over how, or whether, to exit from the European Union. Nevertheless, on average, international securities delivered modestly positive returns, bolstered by the accommodative monetary policies implemented by European and Asian central banks. Bonds from both emerging and developed markets generally produced stronger returns than equities while repeating the pattern of outperformance by higher-quality, longer-term instruments seen in the United States.
As the economic growth cycle lengthens, investors are left to ponder how best to position their portfolios for an uncertain future. When the yield curve inverted earlier this year prompting concerns of a potential recession, we were reminded that the direction of the economy is continually subject to change, and perceptions of the economy can shift even more rapidly. As a MainStay investor, you can rely on us to manage our Funds with unflagging energy and dedication so that you can remain focused on your long-term objectives in the face of uncertainty and change. Our goal remains to provide you with the consistently reliable financial tools you need to achieve your long-term objectives.
Sincerely,

Kirk C. Lehneis
President
The opinions expressed are as of the date of this report and are subject to change. There is no guarantee that any forecast made will come to pass. This material does not constitute investment advice and is not intended as an endorsement of any specific investment. Past performance is no guarantee of future results.
Not part of the Annual Report
Table of Contents
Investors should refer to the Fund’s Summary Prospectus and/or Prospectus and consider the Fund’s investment objectives, strategies, risks, charges and expenses carefully before investing. The Summary Prospectus and/or Prospectus contain this and other information about the Fund. You may obtain copies of the Fund’s Summary Prospectus, Prospectus and Statement of Additional Information free of charge, upon request, by calling toll-free 800-624-6782, by writing to NYLIFE Distributors LLC, Attn: MainStay Marketing Department, 30 Hudson Street, Jersey City, NJ 07302 or by sending ane-mail to MainStayShareholderServices@nylim.com. These documents are also available via the MainStay Funds’ website at nylinvestments.com/funds. Please read the Summary Prospectus and/or Prospectus carefully before investing.
Investment and Performance Comparison1(Unaudited)
Performance data quoted represents past performance. Past performance is no guarantee of future results. Because of market volatility and other factors, current performance may be lower or higher than the figures shown. Investment return and principal value will fluctuate, and as a result, when shares are redeemed, they may be worth more or less than their original cost. The graph below depicts the historical performance of Class B shares2 of the Fund. Performance will vary from class to class based on differences in class-specific expenses and sales charges. For performance information current to the most recent month-end, please call 800-624-6782 or visit nylinvestments.com/funds.
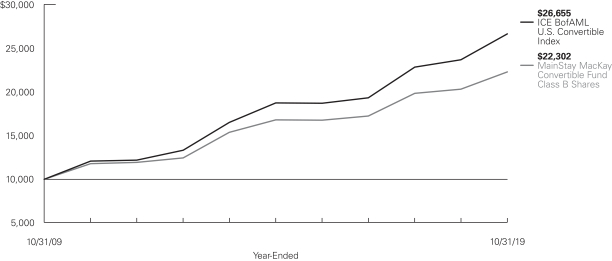
Average Annual Total Returns for the Year-Ended October 31, 2019
| | | | | | | | | | | | | | | | | | | | | | | | |
| Class | | Sales Charge | | | | Inception
Date | | | One
Year | | | Five
Years | | | Ten
Years | | | Gross
Expense
Ratio3 | |
| | | | | | | |
| Class A Shares | | Maximum 5.5% Initial Sales Charge | | With sales charges Excluding sales charges | | | 1/3/1995 | | |
| 4.66
10.75 | %
| |
| 5.57
6.77 | %
| |
| 8.75
9.36 | %
| |
| 0.98
0.98 | %
|
| Investor Class Shares | | Maximum 5.5% Initial Sales Charge | | With sales charges Excluding sales charges | | | 2/28/2008 | | |
| 4.42
10.50 |
| |
| 5.39
6.59 |
| |
| 8.54
9.16 |
| |
| 1.14
1.14 |
|
| Class B Shares2 | | Maximum 5% CDSC if Redeemed Within the First Six Years of Purchase | | With sales charges Excluding sales charges | | | 5/1/1986 | | |
| 4.76
9.76 |
| |
| 5.50
5.81 |
| |
| 8.35
8.35 |
| |
| 1.89
1.89 |
|
| Class C Shares | | Maximum 1% CDSC
if Redeemed Within One Year of Purchase | | With sales charges Excluding sales charges | | | 9/1/1998 | | |
| 8.71
9.71 |
| |
| 5.80
5.80 |
| |
| 8.35
8.35 |
| |
| 1.89
1.89 |
|
| Class I Shares | | No Sales Charge | | | | | 11/28/2008 | | | | 11.14 | | | | 7.10 | | | | 9.68 | | | | 0.73 | |
| 1. | The performance table and graph do not reflect the deduction of taxes that a shareholder would pay on distributions or Fund share redemptions. Total returns reflect maximum applicable sales charges as indicated in the table above, if any, changes in share price, and reinvestment of dividend and capital gain distributions. The graph assumes the initial investment amount shown above and reflects the deduction of all sales charges that would have applied for the period of investment. Performance figures may reflect certain fee waivers and/or expense limitations, without which total returns may have |
| | been lower. For more information on share classes and current fee waivers and/or expense limitations (if any), please refer to the Notes to Financial Statements. |
| 2. | Class B shares are closed to all new purchases as well as additional investments by existing Class B shareholders. |
| 3. | The gross expense ratios presented reflect the Fund’s “Total Annual Fund Operating Expenses” from the most recent Prospectus and may differ from other expense ratios disclosed in this report. |
The footnotes on the next page are an integral part of the table and graph and should be carefully read in conjunction with them.
| | | | | | | | | | | | |
| Benchmark Performance | | One
Year | | | Five
Years | | | Ten
Years | |
| | | |
ICE BofAML U.S. Convertible Index4 | | | 12.45 | % | | | 7.31 | % | | | 10.30 | % |
Morningstar Convertibles Category Average5 | | | 11.26 | | | | 6.29 | | | | 8.94 | |
| 4. | The ICE BofAML U.S. Convertible Index is the Fund’s primary broad-based securities market index for comparison purposes. The ICE BofAML U.S. Convertible Index is a market-capitalization weighted index of domestic corporate convertible securities. In order to be included in this Index, bonds and preferred stocks must be convertible only to common stock. Results assume reinvestment of all income and capital gains. An investment cannot be made directly in an index. |
| 5. | The Morningstar Convertibles Category Average is representative of funds that are designed to offer some of the capital-appreciation potential of stock portfolios while also supplying some of the safety and yield of bond portfolios. Results are based on average total returns of similar funds with all dividends and capital gain distributions reinvested. |
The footnotes on the preceding page are an integral part of the table and graph and should be carefully read in conjunction with them.
| | |
| 6 | | MainStay MacKay Convertible Fund |
Cost in Dollars of a $1,000 Investment in MainStay MacKay Convertible Fund (Unaudited)
The example below is intended to describe the fees and expenses borne by shareholders during the six-month period from May 1, 2019, to October 31, 2019, and the impact of those costs on your investment.
Example
As a shareholder of the Fund you incur two types of costs: (1) transaction costs, including exchange fees and sales charges (loads) on purchases (as applicable), and (2) ongoing costs, including management fees, distribution and/or service (12b-1) fees, and other Fund expenses (as applicable). This example is intended to help you understand your ongoing costs (in dollars) of investing in the Fund and to compare these costs with the ongoing costs of investing in other mutual funds. The example is based on an investment of $1,000 made at the beginning of the six-month period and held for the entire period from May 1, 2019, to October 31, 2019.
This example illustrates your Fund’s ongoing costs in two ways:
Actual Expenses
The second and third data columns in the table below provide information about actual account values and actual expenses. You may use the information in these columns, together with the amount you invested, to estimate the expenses that you paid during the six months ended October 31, 2019. Simply divide your account value by $1,000 (for example, an $8,600 account value divided by $1,000 = 8.6), then
multiply the result by the number under the heading entitled “Expenses Paid During Period” to estimate the expenses you paid on your account during this period.
Hypothetical Example for Comparison Purposes
The fourth and fifth data columns in the table below provide information about hypothetical account values and hypothetical expenses based on the Fund’s actual expense ratio and an assumed rate of return of 5% per year before expenses, which is not the Fund’s actual return. The hypothetical account values and expenses may not be used to estimate the actual ending account balances or expenses you paid for thesix-month period shown. You may use this information to compare the ongoing costs of investing in the Fund with the ongoing costs of investing in other mutual funds. To do so, compare this 5% hypothetical example with the 5% hypothetical examples that appear in the shareholder reports of the other mutual funds.
Please note that the expenses shown in the table are meant to highlight your ongoing costs only and do not reflect any transactional costs, such as exchange fees or sales charges (loads). Therefore, the fourth and fifth data columns of the table are useful in comparing ongoing costs only and will not help you determine the relative total costs of owning different funds. In addition, if these transactional costs were included, your costs would have been higher.
| | | | | | | | | | | | | | | | | | | | | | |
| | | | | | | | | | | | | | | | | | |
| Share Class | | Beginning
Account
Value
5/1/19 | | | Ending Account
Value (Based
on Actual
Returns and
Expenses)
10/31/19 | | | Expenses
Paid
During
Period1 | | | Ending Account
Value (Based
on Hypothetical
5% Annualized
Return and
Actual Expenses)
10/31/19 | | | Expenses
Paid
During
Period1 | | | Net Expense
Ratio
During
Period2 |
| | | | | | |
| Class A Shares | | $ | 1,000.00 | | | $ | 1,008.70 | | | $ | 4.96 | | | $ | 1,020.27 | | | $ | 4.99 | | | 0.98% |
| | | | | | |
| Investor Class Shares | | $ | 1,000.00 | | | $ | 1,007.30 | | | $ | 5.82 | | | $ | 1,019.41 | | | $ | 5.85 | | | 1.15% |
| | | | | | |
| Class B Shares | | $ | 1,000.00 | | | $ | 1,004.00 | | | $ | 9.60 | | | $ | 1,015.63 | | | $ | 9.65 | | | 1.90% |
| | | | | | |
| Class C Shares | | $ | 1,000.00 | | | $ | 1,003.50 | | | $ | 9.59 | | | $ | 1,015.63 | | | $ | 9.65 | | | 1.90% |
| | | | | | |
| Class I Shares | | $ | 1,000.00 | | | $ | 1,010.50 | | | $ | 3.09 | | | $ | 1,022.13 | | | $ | 3.11 | | | 0.61% |
| 1. | Expenses are equal to the Fund’s annualized expense ratio of each class multiplied by the average account value over the period, divided by 365 and multiplied by 184 (to reflect the six-month period). The table above represents the actual expenses incurred during the six-month period. In addition to the fees and expenses which the Fund bears directly, it also indirectly bears a pro rata share of the fees and expenses of the underlying funds in which it invests. Such indirect expenses are not included in the above-reported expense figures. |
| 2. | Expenses are equal to the Fund’s annualized expense ratio to reflect the six-month period. |
Portfolio Composition as of October 31, 2019(Unaudited)
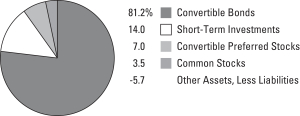
See Portfolio of Investments beginning on page 11 for specific holdings within these categories. The Fund’s holdings are subject to change.
Top Ten Holdings or Issuers Held as of October 31, 2019(excludingshort-term investment) (Unaudited)
| 1. | NICE Systems, Inc., 1.25%, due 1/15/24 |
| 2. | Danaher Corp., (zero coupon), due 1/22/21 |
| 3. | Anthem, Inc., 2.75%, due 10/15/42 |
| 4. | Microchip Technology, Inc., 1.625%, due 2/15/25–2/15/27 |
| 5. | Teladoc Health, Inc., 1.375%, due 5/15/25 |
| 7. | Lumentum Holdings, Inc., 0.25%, due 3/15/24 |
| 8. | DISH Network Corp., 3.375%, due 8/15/26 |
| 9. | Illumina, Inc., (zero coupon)–0.50%, due 6/15/21–8/15/23 |
| 10. | Liberty Media Corp., 1.00%–1.375%, due 1/30/23–10/15/23 |
| | |
| 8 | | MainStay MacKay Convertible Fund |
Portfolio Management Discussion and Analysis(Unaudited)
Questions answered by portfolio manager Edward Silverstein, CFA, of MacKay Shields LLC, the Fund’s Subadvisor.
How did MainStay MacKay Convertible Fund perform relative to its benchmark and peer group during the 12 months ended October 31, 2019?
For the 12 months ended October 31, 2019, Class I shares of MainStay MacKay Convertible Fund returned 11.14%, underperforming the 12.45% return of the Fund’s primary benchmark, the ICE BofAML U.S. Convertible Index. Over the same period, Class I shares also underperformed the 11.26% return of the Morningstar Convertibles Category Average.1
What factors affected the Fund’s relative performance during the reporting period?
The performance of the Fund and of the ICE BofAML U.S. Convertible Index was almost entirely due to an increase in equity markets during the reporting period, which generally determines the performance of equity-sensitive convertible bonds. The Fund’s underperformance relative to the Index was largely due to overweight exposure to the energy sector, as the Fund’s four worst-performing securities during the same period, Weatherford International, Oasis Petroleum, Ensco Jersey and Transocean, were all energy-related. In addition, the Fund’s underweight exposure to the utilities and real estate sectors detracted from relative performance. The Fund’s overweight positions in several health care and technology-related holdings offset some of its energy-related weakness.
What was the Fund’s duration2 strategy during the reporting period?
Convertible bond prices tend to vary with changes in the price of the underlying equity security rather than with changes in interest rates. For this reason, duration does not guide our investment decisions regarding the Fund’s convertible security holdings. At the end of the reporting period, the effective duration of the Fund was 3.99 years.
During the reporting period, which sectors were the strongest positive contributors to the Fund’s relative performance and which sectors were particularly weak?
The information technology sector provided the strongest contributions to the Fund’s relative performance. (Contributions take weightings and total returns into account.) Within technology, software holdings topped relative performance led by NICE Systems, RingCentral, Coupa Software and Okta, all of which reported better-than-expected quarterly earnings and raised guidance for the coming quarters. Semiconductor holdings also contributed positively to relative performance, with Microchip Technology and Inphi bolstered by improving industry fundamentals and rising expectations of a favorable environment for semiconductor demand and pricing.
The weakest sector contributor to the Fund’s relative performance was energy, followed by transportation. Oil service and equipment companies consistently lowered their earnings guidance due to a falling U.S rig count, while exploration and production companies suffered from depressed commodity prices. Investors fled the sector over concerns that demand growth for oil and natural gas could be in long-term decline and might eventually turn negative due to advances in technology, efficiency and less polluting alternatives, such as wind and solar generation as well as electric vehicles. As a result, the convertible bonds of nearly all of the Fund’s energy-related holdings declined far more than the price of crude oil. The Fund reduced its allocation to the sector through the sale of certain holdings and the maturity of Hess bonds, which had been the Fund’s largest energy holding. The transportation sector suffered as fears of a recession led investors to reduce their exposure to economically sensitive industries. The Fund’s holdings of the convertible bonds of Air Lease and Atlas Air Worldwide, along with holdings of the common shares of XPO Logistics, significantly underperformed during the reporting period. (XPO had been a strong performer until quite recently.) The convertible bonds of Air Lease matured in December of 2018 and are no longer held by the Fund.
During the reporting period, which individual stocks made the strongest positive contributions to the Fund’s absolute performance and which stocks detracted the most?
The individual holdings making the strongest positive contributions to the Fund’s absolute performance included the convertible bonds of NICE Systems, Danaher and Microchip Technology. Enterprise software company NICE Systems’ shares rose on strong growth of its cloud-related software products, with earnings and free cash flow growth that exceeded analysts’ estimates. Life sciences product maker Danaher exceeded quarterly earnings estimates and reported solid organic growth from its core lab, diagnostic and testing businesses. In addition, the company announced in February 2019 that it would acquire GE’s biosciences unit for $20.6 billion. We believe that this acquisition would be highly accretive to earnings. Diversified semiconductor manufacturer Microchip Technology advanced as investors grew increasingly confident that improving fundamentals and receding risks of an imminent recession were creating a better environment for the semiconductor industry.
The securities detracting most from the Fund’s absolute performance included the convertible bonds of Weatherford International, Oasis Petroleum and Ensco Jersey. Oil and natural gas service provider Weatherford declined as the company filed for bankruptcy, no longer able to support its large debt load in an
| 1. | See page 5 for other share class returns, which may be higher or lower than Class I share returns. See page 6 for more information on benchmark and peer group returns. |
| 2. | Duration is a measure of the price sensitivity of a fixed-income investment to changes in interest rates. Duration is expressed as a number of years and is considered a more accurate sensitivity gauge than average maturity. |
environment of lower oil prices and lower customer spending. Oil and gas exploration and production company Oasis lost ground as it struggled to generate free cash flow and maintain production in an environment of $50 per barrel crude oil prices. Valaris, previously named Ensco Jersey, owns and operates offshore drilling rigs that it leases to exploration and production companies. Valaris, and the drilling industry in general, suffered from an oversupply of rigs as well as low commodity prices that reduced the demand for rigs and undercut the prices that customers were willing to pay to lease them.
What were some of the Fund’s largest purchases and sales during the reporting period?
Notable purchases during the reporting period included a new offering of convertible bonds from medical device manufacturer CONMED. The Fund also added to its positions in the convertible bonds of Teladoc Health, a telemedicine firm that has seen increasing acceptance of remote medical diagnosis and treatment, and the convertible bonds of Aerojet Rocketdyne, a missile contractor benefiting from an upgrade cycle to faster, hypersonic missiles. Notable sales during the reporting period included several large Fund holdings that matured and were converted into common shares. These included securities of software developer Citrix Systems, packaged goods maker Post
Holdings, oil and gas exploration and production company Hess, and aircraft leasing company Air Lease. The Fund also reduced its energy-related exposure through the sale of the convertible bonds of Oasis Petroleum and the common shares of Halliburton and Baker Hughes.
How did the Fund’s sector weightings change during the reporting period?
During the reporting period, the Fund reduced its weighting to the energy sector by more than half. The Fund significantly increased its weightings to the health care and information technology sectors, partly due to price appreciation and partly due to numerous new purchases in both sectors. All other sector weightings remained relatively unchanged.
How was the Fund positioned at the end of the reporting period?
As of October 31, 2019, the Fund sectors most substantially overweight relative to the ICE BofAML U.S. Convertible Index included energy, health care, information technology and industrials. As of the same date, the Fund sectors most substantially underweight relative to the benchmark were financials, real estate and utilities.
The opinions expressed are those of the portfolio managers as of the date of this report and are subject to change. There is no guarantee that any forecasts will come to pass. This material does not constitute investment advice and is not intended as an endorsement of any specific investment.
| | |
| 10 | | MainStay MacKay Convertible Fund |
Portfolio of InvestmentsOctober 31, 2019
| | | | | | | | |
| | | Principal
Amount | | | Value | |
Convertible Securities 88.2%† Convertible Bonds 81.2% | |
Advertising 0.6% | |
Quotient Technology, Inc.
1.75%, due 12/1/22 | | $ | 8,787,000 | | | $ | 8,371,335 | |
| | | | | | | | |
|
Aerospace & Defense 1.3% | |
Aerojet Rocketdyne Holdings, Inc.
2.25%, due 12/15/23 | | | 11,001,000 | | | | 19,078,950 | |
| | | | | | | | |
|
Biotechnology 7.2% | |
BioMarin Pharmaceutical, Inc.
0.599%, due 8/1/24 (a) | | | 26,166,000 | | | | 26,236,026 | |
Exact Sciences Corp.
1.00%, due 1/15/25 | | | 11,792,000 | | | | 16,429,380 | |
Illumina, Inc. (a) | | | | | | | | |
(zero coupon), due 8/15/23 | | | 12,566,000 | | | | 13,646,085 | |
0.50%, due 6/15/21 | | | 9,998,000 | | | | 13,047,856 | |
Intercept Pharmaceuticals, Inc.
3.25%, due 7/1/23 | | | 6,683,000 | | | | 5,887,910 | |
Ionis Pharmaceuticals, Inc.
1.00%, due 11/15/21 | | | 14,497,000 | | | | 15,997,180 | |
Medicines Co.
2.75%, due 7/15/23 | | | 10,023,000 | | | | 12,572,603 | |
Radius Health, Inc.
3.00%, due 9/1/24 | | | 660,000 | | | | 627,341 | |
| | | | | | | | |
| | | | | | | 104,444,381 | |
| | | | | | | | |
Building Materials 0.9% | |
Patrick Industries, Inc.
1.00%, due 2/1/23 | | | 14,099,000 | | | | 13,313,851 | |
| | | | | | | | |
|
Commercial Services 2.1% | |
Chegg, Inc.
0.125%, due 3/15/25 (b) | | | 10,530,000 | | | | 9,880,299 | |
Euronet Worldwide, Inc.
0.75%, due 3/15/49 (a)(b) | | | 11,900,000 | | | | 13,562,873 | |
Square, Inc.
0.50%, due 5/15/23 | | | 6,031,000 | | | | 6,674,707 | |
| | | | | | | | |
| | | | | | | 30,117,879 | |
| | | | | | | | |
Computers 2.9% | |
Lumentum Holdings, Inc.
0.25%, due 3/15/24 | | | 22,901,000 | | | | 29,013,013 | |
Nutanix, Inc.
(zero coupon), due 1/15/23 | | | 2,727,000 | | | | 2,619,423 | |
Pure Storage, Inc.
0.125%, due 4/15/23 | | | 3,879,000 | | | | 4,087,726 | |
Western Digital Corp.
1.50%, due 2/1/24 | | | 6,616,000 | | | | 6,307,221 | |
| | | | | | | | |
| | | | | | | 42,027,383 | |
| | | | | | | | |
| | | | | | | | |
| | | Principal
Amount | | | Value | |
Diversified Financial Services 0.5% | |
LendingTree, Inc.
0.625%, due 6/1/22 | | $ | 4,144,000 | | | $ | 7,478,564 | |
| | | | | | | | |
|
Electric 1.2% | |
NRG Energy, Inc.
2.75%, due 6/1/48 | | | 15,207,000 | | | | 17,290,796 | |
| | | | | | | | |
|
Entertainment 0.6% | |
Live Nation Entertainment, Inc.
2.50%, due 3/15/23 | | | 6,833,000 | | | | 8,376,501 | |
| | | | | | | | |
|
Health Care—Products 5.8% | |
CONMED Corp.
2.625%, due 2/1/24 (b) | | | 13,908,000 | | | | 19,155,182 | |
Danaher Corp.
(zero coupon), due 1/22/21 | | | 8,558,000 | | | | 44,970,843 | |
NuVasive, Inc.
2.25%, due 3/15/21 | | | 7,139,000 | | | | 8,984,002 | |
Wright Medical Group, Inc.
1.625%, due 6/15/23 | | | 12,181,000 | | | | 11,665,604 | |
| | | | | | | | |
| | | | | | | 84,775,631 | |
| | | | | | | | |
Health Care—Services 5.2% | |
Anthem, Inc.
2.75%, due 10/15/42 | | | 11,746,000 | | | | 44,450,798 | |
Teladoc Health, Inc.
1.375%, due 5/15/25 | | | 19,177,000 | | | | 31,174,142 | |
| | | | | | | | |
| | | | | | | 75,624,940 | |
| | | | | | | | |
Internet 11.3% | |
Boingo Wireless, Inc.
1.00%, due 10/1/23 | | | 7,786,000 | | | | 6,654,042 | |
Booking Holdings, Inc.
0.90%, due 9/15/21 (a) | | | 19,156,000 | | | | 22,561,703 | |
Etsy, Inc. | | | | | | | | |
(zero coupon), due 3/1/23 | | | 9,369,000 | | | | 13,292,269 | |
0.125%, due 10/1/26 (b) | | | 8,040,000 | | | | 7,301,652 | |
FireEye, Inc.
0.875%, due 6/1/24 | | | 5,405,000 | | | | 5,359,293 | |
IAC FinanceCo 2, Inc.
0.875%, due 6/15/26 (b) | | | 12,450,000 | | | | 13,455,053 | |
IAC FinanceCo, Inc.
0.875%, due 10/1/22 (b) | | | 2,000 | | | | 3,187 | |
MercadoLibre, Inc.
2.00%, due 8/15/28 | | | 5,939,000 | | | | 8,422,595 | |
Okta, Inc. | | | | | | | | |
0.125%, due 9/1/25 (b) | | | 6,503,000 | | | | 6,186,331 | |
0.25%, due 2/15/23 | | | 6,056,000 | | | | 14,003,207 | |
Palo Alto Networks, Inc.
0.75%, due 7/1/23 | | | 13,659,000 | | | | 15,092,688 | |
| | | | | | |
The notes to the financial statements are an integral part of,
and should be read in conjunction with, the financial statements. | | | | | 11 | |
Portfolio of InvestmentsOctober 31, 2019 (continued)
| | | | | | | | |
| | | Principal
Amount | | | Value | |
| Convertible Bonds (continued) | | | | | |
Internet (continued) | | | | | | | | |
Q2 Holdings, Inc.
0.75%, due 6/1/26 (b) | | $ | 4,395,000 | | | $ | 4,662,088 | |
RingCentral, Inc.
(zero coupon), due 3/15/23 | | | 6,917,000 | | | | 14,015,571 | |
Snap, Inc.
0.75%, due 8/1/26 (b) | | | 10,150,000 | | | | 10,284,284 | |
Wix.com, Ltd.
(zero coupon), due 7/1/23 (a) | | | 17,146,000 | | | | 19,640,766 | |
Zendesk, Inc.
0.25%, due 3/15/23 | | | 2,074,000 | | | | 2,705,807 | |
| | | | | | | | |
| | | | | | | 163,640,536 | |
| | | | | | | | |
Iron & Steel 0.5% | |
Cleveland-Cliffs, Inc.
1.50%, due 1/15/25 | | | 6,057,000 | | | | 6,660,226 | |
| | | | | | | | |
|
Lodging 0.4% | |
Caesars Entertainment Corp.
5.00%, due 10/1/24 | | | 3,741,000 | | | | 6,631,864 | |
| | | | | | | | |
|
Machinery—Diversified 1.7% | |
Chart Industries, Inc.
1.00%, due 11/15/24 (a)(b) | | | 19,988,000 | | | | 24,107,874 | |
| | | | | | | | |
|
Media 3.7% | |
DISH Network Corp.
3.375%, due 8/15/26 | | | 28,598,000 | | | | 26,812,377 | |
Liberty Media Corp-Liberty Formula One
1.00%, due 1/30/23 | | | 9,441,000 | | | | 11,974,930 | |
Liberty Media Corp.
1.375%, due 10/15/23 | | | 11,345,000 | | | | 14,343,938 | |
| | | | | | | | |
| | | | | | | 53,131,245 | |
| | | | | | | | |
Oil & Gas 1.6% | |
Ensco Jersey Finance, Ltd.
3.00%, due 1/31/24 (a) | | | 20,143,000 | | | | 13,092,950 | |
Oasis Petroleum, Inc.
2.625%, due 9/15/23 | | | 4,106,000 | | | | 2,849,762 | |
Transocean, Inc.
0.50%, due 1/30/23 | | | 9,294,000 | | | | 7,657,477 | |
| | | | | | | | |
| | | | | | | 23,600,189 | |
| | | | | | | | |
Oil & Gas Services 3.0% | |
Helix Energy Solutions Group, Inc.
4.125%, due 9/15/23 | | | 8,139,000 | | | | 9,863,451 | |
Newpark Resources, Inc.
4.00%, due 12/1/21 | | | 7,687,000 | | | | 7,838,543 | |
Oil States International, Inc.
1.50%, due 2/15/23 | | | 19,999,000 | | | | 17,029,588 | |
| | | | | | | | |
| | | Principal
Amount | | | Value | |
Oil & Gas Services (continued) | | | | | | | | |
Weatherford International, Ltd.
5.875%, due 7/1/21 (c)(d) | | $ | 29,206,000 | | | $ | 8,962,591 | |
| | | | | | | | |
| | | | | | | 43,694,173 | |
| | | | | | | | |
Pharmaceuticals 3.2% | |
DexCom, Inc.
0.75%, due 12/1/23 (b) | | | 6,307,000 | | | | 7,552,890 | |
Herbalife Nutrition, Ltd.
2.625%, due 3/15/24 | | | 9,443,000 | | | | 9,535,844 | |
Neurocrine Biosciences, Inc.
2.25%, due 5/15/24 | | | 10,073,000 | | | | 14,725,960 | |
Pacira BioSciences, Inc.
2.375%, due 4/1/22 | | | 8,745,000 | | | | 8,859,123 | |
Supernus Pharmaceuticals, Inc.
0.625%, due 4/1/23 | | | 6,269,000 | | | | 5,802,505 | |
| | | | | | | | |
| | | | | | | 46,476,322 | |
| | | | | | | | |
Semiconductors 10.7% | |
Cypress Semiconductor Corp.
2.00%, due 2/1/23 | | | 6,094,000 | | | | 7,391,129 | |
Inphi Corp.
1.125%, due 12/1/20 | | | 14,512,000 | | | | 26,297,849 | |
Intel Corp.
3.25%, due 8/1/39 | | | 5,613,000 | | | | 15,647,079 | |
Microchip Technology, Inc. | | | | | | | | |
1.625%, due 2/15/25 | | | 17,553,000 | | | | 33,910,202 | |
1.625%, due 2/15/27 | | | 7,129,000 | | | | 9,350,280 | |
Micron Technology, Inc.
3.125%, due 5/1/32 | | | 2,308,000 | | | | 10,982,282 | |
Novellus Systems, Inc.
2.625%, due 5/15/41 | | | 1,076,000 | | | | 9,048,366 | |
ON Semiconductor Corp.
1.00%, due 12/1/20 | | | 12,331,000 | | | | 14,953,173 | |
Rambus, Inc.
1.375%, due 2/1/23 | | | 9,996,000 | | | | 10,204,646 | |
Silicon Laboratories, Inc.
1.375%, due 3/1/22 | | | 13,815,000 | | | | 17,509,350 | |
| | | | | | | | |
| | | | | | | 155,294,356 | |
| | | | | | | | |
Software 12.8% | |
Akamai Technologies, Inc.
0.375%, due 9/1/27 (b) | | | 11,420,000 | | | | 11,417,544 | |
Atlassian, Inc.
0.625%, due 5/1/23 | | | 7,719,000 | | | | 12,281,770 | |
Coupa Software, Inc.
0.125%, due 6/15/25 (b) | | | 5,508,000 | | | | 6,255,514 | |
Envestnet, Inc.
1.75%, due 6/1/23 | | | 9,673,000 | | | | 10,963,304 | |
NICE Systems, Inc.
1.25%, due 1/15/24 | | | 23,525,000 | | | | 45,859,047 | |
Nuance Communications, Inc.
1.25%, due 4/1/25 | | | 11,278,000 | | | | 11,912,387 | |
| | | | |
| 12 | | MainStay MacKay Convertible Fund | | The notes to the financial statements are an integral part of,
and should be read in conjunction with, the financial statements. |
| | | | | | | | |
| | | Principal
Amount | | | Value | |
| Convertible Bonds (continued) | | | | | |
Software (continued) | | | | | | | | |
ServiceNow, Inc.
(zero coupon), due 6/1/22 | | $ | 8,807,000 | | | $ | 16,519,957 | |
Splunk, Inc.
0.50%, due 9/15/23 | | | 12,775,000 | | | | 13,933,997 | |
Twilio, Inc.
0.25%, due 6/1/23 | | | 3,269,000 | | | | 4,976,150 | |
Verint Systems, Inc.
1.50%, due 6/1/21 | | | 17,084,000 | | | | 17,489,745 | |
Workday, Inc.
0.25%, due 10/1/22 | | | 15,957,000 | | | | 20,373,813 | |
Workiva, Inc.
1.125%, due 8/15/26 (b) | | | 3,165,000 | | | | 2,855,863 | |
Zynga, Inc.
0.25%, due 6/1/24 (b) | | | 10,627,000 | | | | 10,891,190 | |
| | | | | | | | |
| | | | | | | 185,730,281 | |
| | | | | | | | |
Telecommunications 2.2% | |
InterDigital, Inc.
2.00%, due 6/1/24 (b) | | | 4,500,000 | | | | 4,448,486 | |
Viavi Solutions Inc.
1.00%, due 3/1/24 | | | 14,679,000 | | | | 19,724,906 | |
Vonage Holdings Corp.
1.75%, due 6/1/24 (b) | | | 8,091,000 | | | | 7,864,735 | |
| | | | | | | | |
| | | | | | | 32,038,127 | |
| | | | | | | | |
Transportation 1.8% | |
Atlas Air Worldwide Holdings, Inc.
2.25%, due 6/1/22 | | | 17,091,000 | | | | 14,944,963 | |
Echo Global Logistics, Inc.
2.50%, due 5/1/20 | | | 11,612,000 | | | | 11,556,723 | |
| | | | | | | | |
| | | | | | | 26,501,686 | |
| | | | | | | | |
Total Convertible Bonds
(Cost $1,047,402,732) | | | | | | | 1,178,407,090 | |
| | | | | | | | |
| | |
| | | | | | | | |
| | |
| | | Shares | | | | |
| Convertible Preferred Stocks 7.0% | |
Banks 2.5% | |
Bank of America Corp. (e)
Series L
7.25% | | | 12,072 | | | | 18,308,274 | |
Wells Fargo & Co. (e)
Series L
7.50% | | | 11,552 | | | | 17,437,744 | |
| | | | | | | | |
| | | | | | | 35,746,018 | |
| | | | | | | | |
Chemicals 0.4% | |
A. Schulman, Inc. (a)(e)
6.00% | | | 5,832 | | | | 5,942,809 | |
| | | | | | | | |
| | | | | | | | |
| | |
| | | Shares | | | Value | |
Equity Real Estate Investment Trusts 0.8% | |
Crown Castle International Corp.
6.875% | | | 8,856 | | | $ | 11,031,831 | |
| | | | | | | | |
|
Health Care Equipment & Supplies 1.3% | |
Becton Dickinson & Co.
6.125% | | | 314,669 | | | | 19,408,784 | |
| | | | | | | | |
|
Machinery 1.3% | |
Rexnord Corp.
5.75% | | | 108,438 | | | | 6,051,925 | |
Stanley Black & Decker, Inc. (a)
5.375% | | | 131,861 | | | | 13,441,910 | |
| | | | | | | | |
| | | | | | | 19,493,835 | |
| | | | | | | | |
Semiconductors & Semiconductor Equipment 0.7% | |
Broadcom, Inc.
8.00% | | | 9,655 | | | | 10,456,558 | |
| | | | | | | | |
Total Convertible Preferred Stocks
(Cost $92,557,770) | | | | | | | 102,079,835 | |
| | | | | | | | |
Total Convertible Securities
(Cost $1,139,960,502) | | | | | | | 1,280,486,925 | |
| | | | | | | | |
|
| Common Stocks 3.5% | |
Aerospace & Defense 0.5% | |
United Technologies Corp. | | | 53,105 | | | | 7,624,816 | |
| | | | | | | | |
|
Air Freight & Logistics 0.4% | |
XPO Logistics, Inc. (f) | | | 78,310 | | | | 5,982,884 | |
| | | | | | | | |
|
Airlines 0.9% | |
Delta Air Lines, Inc. | | | 227,309 | | | | 12,520,180 | |
| | | | | | | | |
|
Banks 0.9% | |
Bank of America Corp. | | | 398,621 | | | | 12,464,879 | |
| | | | | | | | |
|
Health Care Equipment & Supplies 0.8% | |
Teleflex, Inc. | | | 33,226 | | | | 11,543,044 | |
| | | | | | | | |
Total Common Stocks
(Cost $29,546,758) | | | | | | | 50,135,803 | |
| | | | | | | | |
|
| Short-Term Investments 14.0% | |
Affiliated Investment Company 10.4% | |
MainStay U.S. Government Liquidity Fund, 1.76% (g)(h) | | | 151,033,796 | | | | 151,033,796 | |
| | | | | | | | |
| | | | | | |
The notes to the financial statements are an integral part of,
and should be read in conjunction with, the financial statements. | | | | | 13 | |
Portfolio of InvestmentsOctober 31, 2019 (continued)
| | | | | | | | |
| | |
| | | Shares | | | Value | |
| Short-Term Investments (continued) | |
Unaffiliated Investment Company 3.6% | |
State Street Navigator Securities Lending Government Money Market Portfolio, 1.75% (g)(i) | | | 52,784,913 | | | $ | 52,784,913 | |
| | | | | | | | |
TotalShort-Term Investments
(Cost $203,818,709) | | | | | | | 203,818,709 | |
| | | | | | | | |
Total Investments
(Cost $1,373,325,969) | | | 105.7 | % | | | 1,534,441,437 | |
Other Assets, Less Liabilities | | | (5.7 | ) | | | (83,051,693 | ) |
Net Assets | | | 100.0 | % | | $ | 1,451,389,744 | |
| † | Percentages indicated are based on Fund net assets. |
| (a) | All or a portion of this security was held on loan. As of October 31, 2019, the aggregate market value of securities on loan was $52,271,579; the total market value of collateral held by the Fund was $53,392,090. The market value of the collateral held included non-cash collateral in the form of U.S. Treasury securities with a value of $607,177 (See Note 2(H)). |
| (b) | May be sold to institutional investors only under Rule 144A or securities offered pursuant to Section 4(a)(2) of the Securities Act of 1933, as amended. |
| (c) | Issue in non-accrual status. |
| (e) | Securities are perpetual and, thus, do not have a predetermined maturity date. The date shown, if applicable, reflects the next call date. |
| (f) | Non-income producing security. |
| (g) | Current yield as of October 31, 2019. |
| (h) | As of October 31, 2019, the Fund’s ownership exceeds 5% of the outstanding shares of the Underlying Fund’s share class. |
| (i) | Represents a security purchased with cash collateral received for securities on loan. |
The following is a summary of the fair valuations according to the inputs used as of October 31, 2019, for valuing the Fund’s assets:
| | | | | | | | | | | | | | | | |
Description | | Quoted
Prices in Active
Markets for
Identical Assets (Level 1) | | | Significant Other
Observable Inputs (Level 2) | | | Significant
Unobservable Inputs (Level 3) | | | Total | |
| | | | |
Asset Valuation Inputs | | | | | | | | | | | | | | | | |
| Investments in Securities (a) | | | | | | | | | | | | | | | | |
| Convertible Securities | | | | | | | | | | | | | | | | |
Convertible Bonds | | $ | — | | | $ | 1,178,407,090 | | | $ | — | | | $ | 1,178,407,090 | |
Convertible Preferred Stocks | | | 102,079,835 | | | | — | | | | — | | | | 102,079,835 | |
| | | | | | | | | | | | | | | | |
| Total Convertible Securities | | | 102,079,835 | | | | 1,178,407,090 | | | | — | | | | 1,280,486,925 | |
| | | | | | | | | | | | | | | | |
| Common Stocks | | | 50,135,803 | | | | — | | | | — | | | | 50,135,803 | |
| Short-Term Investments | | | | | | | | | | | | | | | | |
Affiliated Investment Company | | | 151,033,796 | | | | — | | | | — | | | | 151,033,796 | |
Unaffiliated Investment Company | | | 52,784,913 | | | | — | | | | — | | | | 52,784,913 | |
| | | | | | | | | | | | | | | | |
| TotalShort-Term Investments | | | 203,818,709 | | | | — | | | | — | | | | 203,818,709 | |
| | | | | | | | | | | | | | | | |
| Total Investments in Securities | | $ | 356,034,347 | | | $ | 1,178,407,090 | | | $ | — | | | $ | 1,534,441,437 | |
| | | | | | | | | | | | | | | | |
| (a) | For a complete listing of investments and their industries, see the Portfolio of Investments. |
| | | | |
| 14 | | MainStay MacKay Convertible Fund | | The notes to the financial statements are an integral part of,
and should be read in conjunction with, the financial statements. |
Statement of Assets and Liabilitiesas of October 31, 2019
| | | | |
| Assets | | | | |
Investment in unaffiliated securities, at value (identified cost $1,222,292,173) including securities on loan of $52,271,579 | | $ | 1,383,407,641 | |
Investment in affiliated investment company, at value (identified cost $151,033,796) | | | 151,033,796 | |
Cash | | | 82,553 | |
Receivables: | | | | |
Dividends and interest | | | 4,442,346 | |
Fund shares sold | | | 1,851,360 | |
Securities lending | | | 51,598 | |
Other assets | | | 52,981 | |
| | | | |
Total assets | | | 1,540,922,275 | |
| | | | |
| |
| Liabilities | | | | |
Cash collateral received for securities on loan | | | 52,784,913 | |
Payables: | | | | |
Investment securities purchased | | | 34,384,400 | |
Fund shares redeemed | | | 1,117,603 | |
Manager (See Note 3) | | | 598,290 | |
Transfer agent (See Note 3) | | | 336,922 | |
NYLIFE Distributors (See Note 3) | | | 187,949 | |
Shareholder communication | | | 50,559 | |
Professional fees | | | 34,626 | |
Custodian | | | 13,120 | |
Trustees | | | 2,681 | |
Accrued expenses | | | 21,221 | |
Dividend payable | | | 247 | |
| | | | |
Total liabilities | | | 89,532,531 | |
| | | | |
Net assets | | $ | 1,451,389,744 | |
| | | | |
| |
| Composition of Net Assets | | | | |
Shares of beneficial interest outstanding (par value of $.01 per share) unlimited number of shares authorized | | $ | 814,456 | |
Additional paid-in capital | | | 1,272,672,269 | |
| | | | |
| | | 1,273,486,725 | |
Total distributable earnings (loss) | | | 177,903,019 | |
| | | | |
Net assets | | $ | 1,451,389,744 | |
| | | | |
| | | | |
Class A | | | | |
Net assets applicable to outstanding shares | | $ | 545,604,605 | |
| | | | |
Shares of beneficial interest outstanding | | | 30,640,176 | |
| | | | |
Net asset value per share outstanding | | $ | 17.81 | |
Maximum sales charge (5.50% of offering price) | | | 1.04 | |
| | | | |
Maximum offering price per share outstanding | | $ | 18.85 | |
| | | | |
Investor Class | | | | |
Net assets applicable to outstanding shares | | $ | 59,242,100 | |
| | | | |
Shares of beneficial interest outstanding | | | 3,327,742 | |
| | | | |
Net asset value per share outstanding | | $ | 17.80 | |
Maximum sales charge (5.50% of offering price) | | | 1.04 | |
| | | | |
Maximum offering price per share outstanding | | $ | 18.84 | |
| | | | |
Class B | | | | |
Net assets applicable to outstanding shares | | $ | 11,786,276 | |
| | | | |
Shares of beneficial interest outstanding | | | 666,810 | |
| | | | |
Net asset value and offering price per share outstanding | | $ | 17.68 | |
| | | | |
Class C | | | | |
Net assets applicable to outstanding shares | | $ | 60,891,343 | |
| | | | |
Shares of beneficial interest outstanding | | | 3,449,280 | |
| | | | |
Net asset value and offering price per share outstanding | | $ | 17.65 | |
| | | | |
Class I | | | | |
Net assets applicable to outstanding shares | | $ | 773,865,420 | |
| | | | |
Shares of beneficial interest outstanding | | | 43,361,578 | |
| | | | |
Net asset value and offering price per share outstanding | | $ | 17.85 | |
| | | | |
| | | | | | |
The notes to the financial statements are an integral part of,
and should be read in conjunction with, the financial statements. | | | | | 15 | |
Statement of Operationsfor the year ended October 31, 2019
| | | | |
| Investment Income (Loss) | | | | |
Income | | | | |
Interest | | $ | 13,832,167 | |
Dividends—unaffiliated | | | 6,163,380 | |
Dividends—affiliated | | | 1,821,961 | |
Securities lending | | | 623,195 | |
Other | | | 217,434 | |
| | | | |
Total income | | | 22,658,137 | |
| | | | |
Expenses | | | | |
Manager (See Note 3) | | | 7,771,639 | |
Distribution/Service—Class A (See Note 3) | | | 1,318,109 | |
Distribution/Service—Investor Class (See Note 3) | | | 142,246 | |
Distribution/Service—Class B (See Note 3) | | | 133,312 | |
Distribution/Service—Class C (See Note 3) | | | 691,409 | |
Transfer agent (See Note 3) | | | 1,970,996 | |
Professional fees | | | 152,860 | |
Shareholder communication | | | 137,508 | |
Registration | | | 130,633 | |
Custodian | | | 37,739 | |
Trustees | | | 34,528 | |
Miscellaneous | | | 56,058 | |
| | | | |
Total expenses before waiver/reimbursement | | | 12,577,037 | |
Expense waiver/reimbursement from Manager (See Note 3) | | | (884,647 | ) |
| | | | |
Net expenses | | | 11,692,390 | |
| | | | |
Net investment income (loss) | | | 10,965,747 | |
| | | | |
|
| Realized and Unrealized Gain (Loss) on Investments | |
Net realized gain (loss) on unaffiliated investments | | | 27,902,416 | |
Net change in unrealized appreciation (depreciation) on unaffiliated investments | | | 93,983,449 | |
| | | | |
Net realized and unrealized gain (loss) on investments | | | 121,885,865 | |
| | | | |
Net increase (decrease) in net assets resulting from operations | | $ | 132,851,612 | |
| | | | |
| | | | |
| 16 | | MainStay MacKay Convertible Fund | | The notes to the financial statements are an integral part of,
and should be read in conjunction with, the financial statements. |
Statements of Changes in Net Assets
for the years ended October 31, 2019 and October 31, 2018
| | | | | | | | |
| | | 2019 | | | 2018 | |
| Increase (Decrease) in Net Assets | |
Operations: | | | | | | | | |
Net investment income (loss) | | $ | 10,965,747 | | | $ | 11,856,657 | |
Net realized gain (loss) on investments | | | 27,902,416 | | | | 67,397,976 | |
Net change in unrealized appreciation (depreciation) on investments | | | 93,983,449 | | | | (52,678,146 | ) |
| | | | |
Net increase (decrease) in net assets resulting from operations | | | 132,851,612 | | | | 26,576,487 | |
| | | | |
Distributions to shareholders: | | | | | | | | |
Class A | | | (29,204,205 | ) | | | (33,491,767 | ) |
Investor Class | | | (2,974,246 | ) | | | (3,812,652 | ) |
Class B | | | (745,657 | ) | | | (1,145,593 | ) |
Class C | | | (3,987,604 | ) | | | (4,937,399 | ) |
Class I | | | (40,493,755 | ) | | | (37,074,520 | ) |
| | | | |
Total distributions to shareholders | | | (77,405,467 | ) | | | (80,461,931 | ) |
| | | | |
Capital share transactions: | | | | | | | | |
Net proceeds from sale of shares | | | 519,115,443 | | | | 527,717,872 | |
Net asset value of shares issued to shareholders in reinvestment of distributions | | | 67,531,715 | | | | 70,639,748 | |
Cost of shares redeemed | | | (541,282,880 | ) | | | (396,673,712 | ) |
| | | | |
Increase (decrease) in net assets derived from capital share transactions | | | 45,364,278 | | | | 201,683,908 | |
| | | | |
Net increase (decrease) in net assets | | | 100,810,423 | | | | 147,798,464 | |
| | |
| Net Assets | | | | | | | | |
Beginning of year | | | 1,350,579,321 | | | | 1,202,780,857 | |
| | | | |
End of year | | $ | 1,451,389,744 | | | $ | 1,350,579,321 | |
| | | | |
| | | | | | |
The notes to the financial statements are an integral part of,
and should be read in conjunction with, the financial statements. | | | | | 17 | |
Financial Highlightsselected per share data and ratios
| | | | | | | | | | | | | | | | | | | | |
| |
| | | Year ended October 31, | |
| | | | | |
| Class A | | 2019 | | | 2018 | | | 2017 | | | 2016 | | | 2015 | |
| | | | | |
Net asset value at beginning of year | | $ | 17.07 | | | $ | 17.75 | | | $ | 15.72 | | | $ | 16.51 | | | $ | 18.33 | |
| | | | | | | | | | | | | | | | | | | | |
| | | | | |
Net investment income (loss) (a) | | | 0.12 | | | | 0.15 | | | | 0.19 | | | | 0.20 | | | | 0.11 | |
| | | | | |
Net realized and unrealized gain (loss) on investments | | | 1.60 | | | | 0.40 | | | | 2.34 | | | | 0.35 | | | | (0.00 | )‡ |
| | | | | | | | | | | | | | | | | | | | |
| | | | | |
Total from investment operations | | | 1.72 | | | | 0.55 | | | | 2.53 | | | | 0.55 | | | | 0.11 | |
| | | | | | | | | | | | | | | | | | | | |
| | | | | |
| Less dividends and distributions: | | | | | | | | | | | | | | | | | | | | |
| | | | | |
From net investment income | | | (0.15 | ) | | | (0.22 | ) | | | (0.24 | ) | | | (0.64 | ) | | | (0.47 | ) |
| | | | | |
From net realized gain on investments | | | (0.83 | ) | | | (1.01 | ) | | | (0.26 | ) | | | (0.70 | ) | | | (1.46 | ) |
| | | | | | | | | | | | | | | | | | | | |
| | | | | |
Total dividends and distributions | | | (0.98 | ) | | | (1.23 | ) | | | (0.50 | ) | | | (1.34 | ) | | | (1.93 | ) |
| | | | | | | | | | | | | | | | | | | | |
| | | | | |
Net asset value at end of year | | $ | 17.81 | | | $ | 17.07 | | | $ | 17.75 | | | $ | 15.72 | | | $ | 16.51 | |
| | | | | | | | | | | | | | | | | | | | |
| | | | | |
Total investment return (b) | | | 10.75 | % | | | 3.28 | % | | | 16.30 | % | | | 3.71 | % | | | 0.58 | % |
| | | | | |
| Ratios (to average net assets)/Supplemental Data: | | | | | | | | | | | | | | | | | | | | |
| | | | | |
Net investment income (loss) | | | 0.67 | % | | | 0.87 | % | | | 1.12 | % | | | 1.31 | % | | | 0.62 | % |
| | | | | |
Net expenses (c) | | | 0.98 | % | | | 0.98 | % | | | 0.98 | % | | | 1.01 | % | | | 0.99 | % |
| | | | | |
Expenses (before waiver/reimbursement) (c) | | | 0.98 | % | | | 0.98 | % | | | 0.99 | % | | | 1.01 | % | | | 0.99 | % |
| | | | | |
Portfolio turnover rate | | | 23 | % | | | 43 | % | �� | | 38 | % | | | 24 | % | | | 60 | % |
| | | | | |
Net assets at end of year (in 000’s) | | $ | 545,605 | | | $ | 518,381 | | | $ | 482,341 | | | $ | 368,583 | | | $ | 408,067 | |
| ‡ | Less than one cent per share. |
| (a) | Per share data based on average shares outstanding during the year. |
| (b) | Total investment return is calculated exclusive of sales charges and assumes the reinvestment of dividends and distributions. For periods of less than one year, total return is not annualized. |
| (c) | In addition to the fees and expenses which the Fund bears directly, it also indirectly bears a pro-rata share of the fees and expenses of the underlying funds in which it invests. Such indirect expenses are not included in the above expense ratios. |
| | | | | | | | | | | | | | | | | | | | |
| |
| | | Year ended October 31, | |
| | | | | |
| Investor Class | | 2019 | | | 2018 | | | 2017 | | | 2016 | | | 2015 | |
| | | | | |
Net asset value at beginning of year | | $ | 17.07 | | | $ | 17.75 | | | $ | 15.72 | | | $ | 16.50 | | | $ | 18.33 | |
| | | | | | | | | | | | | | | | | | | | |
| | | | | |
Net investment income (loss) (a) | | | 0.09 | | | | 0.13 | | | | 0.16 | | | | 0.18 | | | | 0.08 | |
| | | | | |
Net realized and unrealized gain (loss) on investments | | | 1.59 | | | | 0.39 | | | | 2.34 | | | | 0.36 | | | | (0.01 | ) |
| | | | | | | | | | | | | | | | | | | | |
| | | | | |
Total from investment operations | | | 1.68 | | | | 0.52 | | | | 2.50 | | | | 0.54 | | | | 0.07 | |
| | | | | | | | | | | | | | | | | | | | |
| | | | | |
| Less dividends and distributions: | | | | | | | | | | | | | | | | | | | | |
| | | | | |
From net investment income | | | (0.12 | ) | | | (0.19 | ) | | | (0.21 | ) | | | (0.62 | ) | | | (0.44 | ) |
| | | | | |
From net realized gain on investments | | | (0.83 | ) | | | (1.01 | ) | | | (0.26 | ) | | | (0.70 | ) | | | (1.46 | ) |
| | | | | | | | | | | | | | | | | | | | |
| | | | | |
Total dividends and distributions | | | (0.95 | ) | | | (1.20 | ) | | | (0.47 | ) | | | (1.32 | ) | | | (1.90 | ) |
| | | | | | | | | | | | | | | | | | | | |
| | | | | |
Net asset value at end of year | | $ | 17.80 | | | $ | 17.07 | | | $ | 17.75 | | | $ | 15.72 | | | $ | 16.50 | |
| | | | | | | | | | | | | | | | | | | | |
| | | | | |
Total investment return (b) | | | 10.50 | % | | | 3.12 | % | | | 16.11 | % | | | 3.60 | % | | | 0.40 | % |
| | | | | |
| Ratios (to average net assets)/Supplemental Data: | | | | | | | | | | | | | | | | | | | | |
| | | | | |
Net investment income (loss) | | | 0.51 | % | | | 0.72 | % | | | 0.95 | % | | | 1.14 | % | | | 0.45 | % |
| | | | | |
Net expenses (c) | | | 1.15 | % | | | 1.13 | % | | | 1.14 | % | | | 1.18 | % | | | 1.15 | % |
| | | | | |
Expenses (before waiver/reimbursement) (c) | | | 1.17 | % | | | 1.14 | % | | | 1.15 | % | | | 1.18 | % | | | 1.15 | % |
| | | | | |
Portfolio turnover rate | | | 23 | % | | | 43 | % | | | 38 | % | | | 24 | % | | | 60 | % |
| | | | | |
Net assets at end of year (in 000’s) | | $ | 59,242 | | | $ | 52,723 | | | $ | 56,289 | | | $ | 79,430 | | | $ | 82,052 | |
| (a) | Per share data based on average shares outstanding during the year. |
| (b) | Total investment return is calculated exclusive of sales charges and assumes the reinvestment of dividends and distributions. For periods of less than one year, total return is not annualized. |
| (c) | In addition to the fees and expenses which the Fund bears directly, it also indirectly bears a pro-rata share of the fees and expenses of the underlying funds in which it invests. Such indirect expenses are not included in the above expense ratios. |
| | | | |
| 18 | | MainStay MacKay Convertible Fund | | The notes to the financial statements are an integral part of,
and should be read in conjunction with, the financial statements. |
Financial Highlightsselected per share data and ratios
| | | | | | | | | | | | | | | | | | | | |
| |
| | | Year ended October 31, | |
| | | | | |
| Class B | | 2019 | | | 2018 | | | 2017 | | | 2016 | | | 2015 | |
| | | | | |
Net asset value at beginning of year | | $ | 16.98 | | | $ | 17.67 | | | $ | 15.66 | | | $ | 16.45 | | | $ | 18.30 | |
| | | | | | | | | | | | | | | | | | | | |
| | | | | |
Net investment income (loss) (a) | | | (0.04 | ) | | | (0.01 | ) | | | 0.04 | | | | 0.06 | | | | (0.05 | ) |
| | | | | |
Net realized and unrealized gain (loss) on investments | | | 1.60 | | | | 0.39 | | | | 2.32 | | | | 0.35 | | | | 0.01 | |
| | | | | | | | | | | | | | | | | | | | |
| | | | | |
Total from investment operations | | | 1.56 | | | | 0.38 | | | | 2.36 | | | | 0.41 | | | | (0.04 | ) |
| | | | | | | | | | | | | | | | | | | | |
| | | | | |
| Less dividends and distributions: | | | | | | | | | | | | | | | | | | | | |
| | | | | |
From net investment income | | | (0.03 | ) | | | (0.06 | ) | | | (0.09 | ) | | | (0.50 | ) | | | (0.35 | ) |
| | | | | |
From net realized gain on investments | | | (0.83 | ) | | | (1.01 | ) | | | (0.26 | ) | | | (0.70 | ) | | | (1.46 | ) |
| | | | | | | | | | | | | | | | | | | | |
| | | | | |
Total dividends and distributions | | | (0.86 | ) | | | (1.07 | ) | | | (0.35 | ) | | | (1.20 | ) | | | (1.81 | ) |
| | | | | | | | | | | | | | | | | | | | |
| | | | | |
Net asset value at end of year | | $ | 17.68 | | | $ | 16.98 | | | $ | 17.67 | | | $ | 15.66 | | | $ | 16.45 | |
| | | | | | | | | | | | | | | | | | | | |
| | | | | |
Total investment return (b) | | | 9.76 | % | | | 2.35 | % | | | 15.21 | % | | | 2.83 | % | | | (0.36 | %) |
| | | | | |
| Ratios (to average net assets)/Supplemental Data: | | | | | | | | | | | | | | | | | | | | |
| | | | | |
Net investment income (loss) | | | (0.23 | %) | | | (0.03 | %) | | | 0.21 | % | | | 0.39 | % | | | (0.30 | %) |
| | | | | |
Net expenses (c) | | | 1.90 | % | | | 1.88 | % | | | 1.89 | % | | | 1.93 | % | | | 1.90 | % |
| | | | | |
Expenses (before waiver/reimbursement) (c) | | | 1.92 | % | | | 1.89 | % | | | 1.90 | % | | | 1.93 | % | | | 1.90 | % |
| | | | | |
Portfolio turnover rate | | | 23 | % | | | 43 | % | | | 38 | % | | | 24 | % | | | 60 | % |
| | | | | |
Net assets at end of year (in 000’s) | | $ | 11,786 | | | $ | 15,051 | | | $ | 19,290 | | | $ | 21,436 | | | $ | 26,537 | |
| (a) | Per share data based on average shares outstanding during the year. |
| (b) | Total investment return is calculated exclusive of sales charges and assumes the reinvestment of dividends and distributions. For periods of less than one year, total return is not annualized. |
| (c) | In addition to the fees and expenses which the Fund bears directly, it also indirectly bears a pro-rata share of the fees and expenses of the underlying funds in which it invests. Such indirect expenses are not included in the above expense ratios. |
| | | | | | | | | | | | | | | | | | | | |
| |
| | | Year ended October 31, | |
| | | | | |
| Class C | | 2019 | | | 2018 | | | 2017 | | | 2016 | | | 2015 | |
| | | | | |
Net asset value at beginning of year | | $ | 16.96 | | | $ | 17.65 | | | $ | 15.64 | | | $ | 16.43 | | | $ | 18.29 | |
| | | | | | | | | | | | | | | | | | | | |
| | | | | |
Net investment income (loss) (a) | | | (0.04 | ) | | | (0.00 | )‡ | | | 0.04 | | | | 0.06 | | | | (0.05 | ) |
| | | | | |
Net realized and unrealized gain (loss) on investments | | | 1.59 | | | | 0.38 | | | | 2.32 | | | | 0.35 | | | | (0.00 | )‡ |
| | | | | | | | | | | | | | | | | | | | |
| | | | | |
Total from investment operations | | | 1.55 | | | | 0.38 | | | | 2.36 | | | | 0.41 | | | | (0.05 | ) |
| | | | | | | | | | | | | | | | | | | | |
| | | | | |
| Less dividends and distributions: | | | | | | | | | | | | | | | | | | | | |
| | | | | |
From net investment income | | | (0.03 | ) | | | (0.06 | ) | | | (0.09 | ) | | | (0.50 | ) | | | (0.35 | ) |
| | | | | |
From net realized gain on investments | | | (0.83 | ) | | | (1.01 | ) | | | (0.26 | ) | | | (0.70 | ) | | | (1.46 | ) |
| | | | | | | | | | | | | | | | | | | | |
| | | | | |
Total dividends and distributions | | | (0.86 | ) | | | (1.07 | ) | | | (0.35 | ) | | | (1.20 | ) | | | (1.81 | ) |
| | | | | | | | | | | | | | | | | | | | |
| | | | | |
Net asset value at end of year | | $ | 17.65 | | | $ | 16.96 | | | $ | 17.65 | | | $ | 15.64 | | | $ | 16.43 | |
| | | | | | | | | | | | | | | | | | | | |
| | | | | |
Total investment return (b) | | | 9.71 | % | | | 2.35 | % | | | 15.23 | % | | | 2.77 | % | | | (0.30 | %) |
| | | | | |
| Ratios (to average net assets)/Supplemental Data: | | | | | | | | | | | | | | | | | | | | |
| | | | | |
Net investment income (loss) | | | (0.23 | %) | | | (0.03 | %) | | | 0.21 | % | | | 0.39 | % | | | (0.30 | %) |
| | | | | |
Net expenses (c) | | | 1.90 | % | | | 1.88 | % | | | 1.89 | % | | | 1.93 | % | | | 1.90 | % |
| | | | | |
Expenses (before waiver/reimbursement) (c) | | | 1.92 | % | | | 1.89 | % | | | 1.90 | % | | | 1.93 | % | | | 1.90 | % |
| | | | | |
Portfolio turnover rate | | | 23 | % | | | 43 | % | | | 38 | % | | | 24 | % | | | 60 | % |
| | | | | |
Net assets at end of year (in 000’s) | | $ | 60,891 | | | $ | 80,830 | | | $ | 82,335 | | | $ | 76,501 | | | $ | 91,833 | |
| ‡ | Less than one cent per share. |
| (a) | Per share data based on average shares outstanding during the year. |
| (b) | Total investment return is calculated exclusive of sales charges and assumes the reinvestment of dividends and distributions. For periods of less than one year, total return is not annualized. |
| (c) | In addition to the fees and expenses which the Fund bears directly, it also indirectly bears a pro-rata share of the fees and expenses of the underlying funds in which it invests. Such indirect expenses are not included in the above expense ratios. |
| | | | | | |
The notes to the financial statements are an integral part of,
and should be read in conjunction with, the financial statements. | | | | | 19 | |
Financial Highlightsselected per share data and ratios
| | | | | | | | | | | | | | | | | | | | |
| |
| | | Year ended October 31, | |
| | | | | |
| Class I | | 2019 | | | 2018 | | | 2017 | | | 2016 | | | 2015 | |
| | | | | |
Net asset value at beginning of year | | $ | 17.11 | | | $ | 17.79 | | | $ | 15.75 | | | $ | 16.54 | | | $ | 18.36 | |
| | | | | | | | | | | | | | | | | | | | |
| | | | | |
Net investment income (loss) (a) | | | 0.18 | | | | 0.22 | | | | 0.25 | | | | 0.24 | | | | 0.15 | |
| | | | | |
Net realized and unrealized gain (loss) on investments | | | 1.60 | | | | 0.39 | | | | 2.34 | | | | 0.35 | | | | (0.00 | )‡ |
| | | | | | | | | | | | | | | | | | | | |
| | | | | |
Total from investment operations | | | 1.78 | | | | 0.61 | | | | 2.59 | | | | 0.59 | | | | 0.15 | |
| | | | | | | | | | | | | | | | | | | | |
| | | | | |
| Less dividends and distributions: | | | | | | | | | | | | | | | | | | | | |
| | | | | |
From net investment income | | | (0.21 | ) | | | (0.28 | ) | | | (0.29 | ) | | | (0.68 | ) | | | (0.51 | ) |
| | | | | |
From net realized gain on investments | | | (0.83 | ) | | | (1.01 | ) | | | (0.26 | ) | | | (0.70 | ) | | | (1.46 | ) |
| | | | | | | | | | | | | | | | | | | | |
| | | | | |
Total dividends and distributions | | | (1.04 | ) | | | (1.29 | ) | | | (0.55 | ) | | | (1.38 | ) | | | (1.97 | ) |
| | | | | | | | | | | | | | | | | | | | |
| | | | | |
Net asset value at end of year | | $ | 17.85 | | | $ | 17.11 | | | $ | 17.79 | | | $ | 15.75 | | | $ | 16.54 | |
| | | | | | | | | | | | | | | | | | | | |
| | | | | |
Total investment return (b) | | | 11.14 | % | | | 3.65 | % | | | 16.69 | % | | | 3.96 | % | | | 0.84 | % |
| | | | | |
| Ratios (to average net assets)/Supplemental Data: | | | | | | | | | | | | | | | | | | | | |
| | | | | |
Net investment income (loss) | | | 1.04 | % | | | 1.25 | % | | | 1.45 | % | | | 1.56 | % | | | 0.87 | % |
| | | | | |
Net expenses (c) | | | 0.61 | % | | | 0.61 | % | | | 0.64 | % | | | 0.76 | % | | | 0.74 | % |
| | | | | |
Expenses (before waiver/reimbursement) (c) | | | 0.73 | % | | | 0.73 | % | | | 0.74 | % | | | 0.76 | % | | | 0.74 | % |
| | | | | |
Portfolio turnover rate | | | 23 | % | | | 43 | % | | | 38 | % | | | 24 | % | | | 60 | % |
| | | | | |
Net assets at end of year (in 000’s) | | $ | 773,865 | | | $ | 683,594 | | | $ | 562,526 | | | $ | 252,852 | | | $ | 298,015 | |
| ‡ | Less than one cent per share. |
| (a) | Per share data based on average shares outstanding during the year. |
| (b) | Total investment return is calculated exclusive of sales charges and assumes the reinvestment of dividends and distributions. Class I shares are not subject to sales charges. For periods of less than one year, total return is not annualized. |
| (c) | In addition to the fees and expenses which the Fund bears directly, it also indirectly bears a pro-rata share of the fees and expenses of the underlying funds in which it invests. Such indirect expenses are not included in the above expense ratios. |
| | | | |
| 20 | | MainStay MacKay Convertible Fund | | The notes to the financial statements are an integral part of,
and should be read in conjunction with, the financial statements. |
Notes to Financial Statements
Note 1–Organization and Business
The MainStay Funds (the “Trust”) was organized on January 9, 1986, as a Massachusetts business trust and is governed by a Declaration of Trust. The Trust is registered under the Investment Company Act of 1940, as amended (the “1940 Act”), as an open-end management investment company, and is comprised of twelve funds (collectively referred to as the “Funds”). These financial statements and notes relate to the MainStay MacKay Convertible Fund (the “Fund”), a “diversified” fund, as that term is defined in the 1940 Act, as interpreted or modified by regulatory authorities having jurisdiction, from time to time.
The Fund currently has six classes of shares registered for sale. Class A shares commenced operations on January 3, 1995. Class B shares commenced operations on May 1, 1986. Class C shares commenced operations on September 1, 1998. Investor Class shares commenced operations on February 28, 2008. Class I shares commenced operations on November 28, 2008. Class R6 shares were registered for sale effective as of February 28, 2017. As of October 31, 2019, Class R6 shares were not yet offered for sale.
Class B shares of the MainStay Group of Funds are closed to all new purchases as well as additional investments by existing Class B shareholders. Existing Class B shareholders may continue to reinvest dividends and capital gains distributions, as well as exchange their Class B shares for Class B shares of other funds in the MainStay Group of Funds as permitted by the current exchange privileges. Class B shareholders continue to be subject to any applicable contingent deferred sales charge (“CDSC”) at the time of redemption. All other features of the Class B shares, including but not limited to the fees and expenses applicable to Class B shares, remain unchanged. Unless redeemed, Class B shareholders will remain in Class B shares of their respective fund until the Class B shares are converted to Class A or Investor Class shares pursuant to the applicable conversion schedule.
Class A and Investor Class shares are offered at net asset value (“NAV”) per share plus an initial sales charge. No initial sales charge applies to investments of $1 million or more (and certain other qualified purchases) in Class A and Investor Class shares. However, a CDSC of 1.00% may be imposed on certain redemptions made within 18 months of the date of purchase on shares that were purchased without an initial sales charge. Class C shares are offered at NAV without an initial sales charge, although a 1.00% CDSC may be imposed on certain redemptions of such shares made within one year of the date of purchase of Class C shares. When Class B shares were offered, they were offered at NAV without an initial sales charge, although a CDSC that declines depending on the number of years a shareholder has held its Class B shares may be imposed on certain redemptions of such shares made within six years of the date of purchase of such shares. Class I shares are offered at NAV without a sales charge. Class R6 shares are currently expected to be offered at NAV without a sales charge. Depending upon eligibility, Class B shares convert to either Class A or Investor Class shares at the end of the calendar quarter eight years after the date they were purchased. In addition, depending upon eligibility, Class C shares convert to either Class A or Investor Class shares at the end of the calendar quarter ten years after the date they were purchased. Additionally, as disclosed in the Fund’s prospectus, Class A shares may convert automatically to Investor Class shares and Investor Class shares may convert automatically to Class A shares. Under certain
circumstances and as may be permitted by the Trust’s multiple class plan pursuant to Rule 18f-3 under the 1940 Act, specified share classes of the Fund may be converted to one or more other share classes of the Fund as disclosed in the capital share transactions within these Notes. The classes of shares have the same voting (except for issues that relate solely to one class), dividend, liquidation and other rights, and the same terms and conditions, except that under distribution plans pursuant to Rule 12b-1 under the 1940 Act, Class B and Class C shares are subject to higher distribution and/or service fees than Class A and Investor Class shares. Class I and Class R6 shares are not subject to a distribution and/or service fee.
The Fund’s investment objective is to seek capital appreciation together with current income.
Note 2–Significant Accounting Policies
The Fund is an investment company and accordingly follows the investment company accounting and reporting guidance of the Financial Accounting Standards Board (“FASB”) Accounting Standard CodificationTopic 946 Financial Services—Investment Companies. The Fund prepares its financial statements in accordance with generally accepted accounting principles (“GAAP”) in the United States of America and follows the significant accounting policies described below.
(A) Securities Valuation. Investments are usually valued as of the close of regular trading on the New York Stock Exchange (the “Exchange”) (usually 4:00 p.m. Eastern time) on each day the Fund is open for business (“valuation date”).
The Board of Trustees of the Trust (the “Board”) adopted procedures establishing methodologies for the valuation of the Fund’s securities and other assets and delegated the responsibility for valuation determinations under those procedures to the Valuation Committee of the Trust (the “Valuation Committee”). The Board authorized the Valuation Committee to appoint a Valuation Subcommittee (the “Subcommittee”) to deal in the first instance with establishing the prices of securities for which market quotations are not readily available or the prices of which are not otherwise readily determinable under these procedures. The Subcommittee meets (in person, via electronic mail or via teleconference) on an as-needed basis. Subsequently, the Valuation Committee meets to ensure that actions taken by the Subcommittee were appropriate. The procedures state that, subject to the oversight of the Board and unless otherwise noted, the responsibility for theday-to-day valuation of portfolio assets (including fair value measurements for the Fund’s assets and liabilities) rests with New York Life Investment Management LLC (“New York Life Investments” or the “Manager”), aided to whatever extent necessary by the Subadvisor (as defined in Note 3(A)).
To assess the appropriateness of security valuations, the Manager, the Subadvisor or the Fund’s third-party service provider, who is subject to oversight by the Manager, regularly compares prior day prices, prices on comparable securities and the sale prices to the prior and current day prices and challenges prices with changes exceeding certain tolerance levels with third-party pricing services or broker sources. For those securities valued through either a standardized fair valuation methodology or a fair valuation measurement, the Subcommittee deals in the first instance with such valuation and the Valuation Committee reviews
Notes to Financial Statements(continued)
and affirms, if appropriate, the reasonableness of the valuation based on such methodologies and measurements on a regular basis after considering information that is reasonably available and deemed relevant by the Valuation Committee. Any action taken by the Subcommittee with respect to the valuation of a portfolio security or other asset is submitted for review and ratification (if appropriate) to the Valuation Committee and the Board at the next regularly scheduled meeting.
“Fair value” is defined as the price the Fund would reasonably expect to receive upon selling an asset or liability in an orderly transaction to an independent buyer in the principal or most advantageous market for the asset or liability. Fair value measurements are determined within a framework that establishes a three-tier hierarchy which maximizes the use of observable market data and minimizes the use of unobservable inputs to establish a classification of fair value measurements for disclosure purposes. “Inputs” refer broadly to the assumptions that market participants would use in pricing the asset or liability, including assumptions about risk, such as the risk inherent in a particular valuation technique used to measure fair value using a pricing model and/or the risk inherent in the inputs for the valuation technique. Inputs may be observable or unobservable. Observable inputs reflect the assumptions market participants would use in pricing the asset or liability based on market data obtained from sources independent of the Fund. Unobservable inputs reflect the Fund’s own assumptions about the assumptions market participants would use in pricing the asset or liability based on the information available. The inputs or methodology used for valuing assets or liabilities may not be an indication of the risks associated with investing in those assets or liabilities. The three-tier hierarchy of inputs is summarized below.
| • | | Level 1—quoted prices in active markets for an identical asset or liability |
| • | | Level 2—other significant observable inputs (including quoted prices for a similar asset or liability in active markets, interest rates and yield curves, prepayment speeds, credit risk, etc.) |
| • | | Level 3—significant unobservable inputs (including the Fund’s own assumptions about the assumptions that market participants would use in measuring fair value of an asset or liability) |
The level of an asset or liability within the fair value hierarchy is based on the lowest level of an input, both individually and in the aggregate, that is significant to the fair value measurement. As of October 31, 2019, the aggregate value by input level of the Fund’s assets and liabilities is included at the end of the Fund’s Portfolio of Investments.
The Fund may use third-party vendor evaluations, whose prices may be derived from one or more of the following standard inputs, among others:
| | |
• Benchmark yields | | • Reported trades |
• Broker/dealer quotes | | • Issuer spreads |
• Two-sided markets | | • Benchmark securities |
• Bids/offers | | • Reference data (corporate actions or material event notices) |
• Industry and economic events | | • Comparable bonds |
• Monthly payment information | | |
An asset or liability for which market values cannot be measured using the methodologies described above is valued by methods deemed reasonable in good faith by the Valuation Committee, following the procedures established by the Board, to represent fair value. Under these procedures, the Fund generally uses a market-based approach which may use related or comparable assets or liabilities, recent transactions, market multiples, book values and other relevant information. The Fund may also use an income-based valuation approach in which the anticipated future cash flows of the asset or liability are discounted to calculate fair value. Discounts may also be applied due to the nature and/or duration of any restrictions on the disposition of the asset or liability. Fair value represents a good faith approximation of the value of a security. Fair value determinations involve the consideration of a number of subjective factors, an analysis of applicable facts and circumstances and the exercise of judgment. As a result, it is possible that the fair value for a security determined in good faith in accordance with the Fund’s valuation procedures may differ from valuations for the same security determined by other funds using their own valuation procedures. Although the Fund’s valuation procedures are designed to value a security at the price the Fund may reasonably expect to receive upon the security’s sale in an orderly transaction, there can be no assurance that any fair value determination thereunder would, in fact, approximate the amount that the Fund would actually realize upon the sale of the security or the price at which the security would trade if a reliable market price were readily available. During the year ended October 31, 2019, there were no material changes to the fair value methodologies.
Securities which may be valued in this manner include, but are not limited to: (i) a security for which trading has been halted or suspended; (ii) a debt security that has recently gone into default and for which there is not a current market quotation; (iii) a security of an issuer that has entered into a restructuring; (iv) a security that has been delisted from a national exchange; (v) a security for which the market price is not readily available from a third-party pricing source or, if so provided, does not, in the opinion of the Manager or the Subadvisor, reflect the security’s market value; (vi) a security subject to trading collars for which no or limited trading takes place; and (vii) a security whose principal market has been temporarily closed at a time when, under normal conditions, it would be open. Securities valued in this manner are generally categorized as Level 3 in the hierarchy. As of October 31, 2019, there were no securities held by the Fund that were fair valued in such a manner.
Equity securities are valued at the last quoted sales prices as of the close of regular trading on the relevant exchange on each valuation date. Securities that are not traded on the valuation date are valued at the mean of the last quoted bid and ask prices. Prices are normally taken from the principal market in which each security trades. These securities are generally categorized as Level 1 in the hierarchy.
Investments in mutual funds, including money market funds, are valued at their respective NAVs as of the close of the Exchange on the valuation date. These securities are generally categorized as Level 1 in the hierarchy.
Debt securities (other than convertible and municipal bonds) are valued at the evaluated bid prices (evaluated mean prices in the case of convertible and municipal bonds) supplied by a pricing agent or brokers
| | |
| 22 | | MainStay MacKay Convertible Fund |
selected by the Manager, in consultation with the Subadvisor. The evaluations are market-based measurements processed through a pricing application and represents the pricing agent’s good faith determination as to what a holder may receive in an orderly transaction under market conditions. The rules based logic utilizes valuation techniques that reflect participants’ assumptions and vary by asset class and per methodology, maximizing the use of relevant observable data including quoted prices for similar assets, benchmark yield curves and market corroborated inputs. The evaluated bid or mean prices are deemed by the Manager, in consultation with the Subadvisor, to be representative of market values at the regular close of trading of the Exchange on each valuation date. Debt securities purchased on a delayed delivery basis are marked to market daily until settlement at the forward settlement date. Debt securities, including corporate bonds, U.S. government and federal agency bonds, municipal bonds, foreign bonds, convertible bonds, asset-backed securities and mortgage-backed securities are generally categorized as Level 2 in the hierarchy.
Temporary cash investments acquired in excess of 60 days to maturity at the time of purchase are valued using the latest bid prices or using valuations based on a matrix system (which considers such factors as security prices, yields, maturities and ratings), both as furnished by independent pricing services. Other temporary cash investments which mature in 60 days or less at the time of purchase (“Short-Term Investments”) are valued using the amortized cost method of valuation, unless the use of such method would be inappropriate. The amortized cost method involves valuing a security at its cost on the date of purchase and thereafter assuming a constant amortization to maturity of the difference between such cost and the value on maturity date. Amortized cost approximates the current fair value of a security. Securities valued using the amortized cost method are not valued using quoted prices in an active market and are generally categorized as Level 2 in the hierarchy.
The information above is not intended to reflect an exhaustive list of the methodologies that may be used to value portfolio investments. The valuation procedures permit the use of a variety of valuation methodologies in connection with valuing portfolio investments. The methodology used for a specific type of investment may vary based on the market data available or other considerations. The methodologies summarized above may not represent the specific means by which portfolio investments are valued on any particular business day.
(B) Income Taxes. The Fund’s policy is to comply with the requirements of the Internal Revenue Code of 1986, as amended (the “Internal Revenue Code”), applicable to regulated investment companies and to distribute all of its taxable income to the shareholders of the Fund within the allowable time limits. Therefore, no federal, state and local income tax provisions are required.
Management evaluates the Fund’s tax positions to determine if the tax positions taken meet the minimum recognition threshold in connection with accounting for uncertainties in income tax positions taken or expected to be taken for the purposes of measuring and recognizing tax liabilities in the financial statements. Recognition of tax benefits of an uncertain tax position is permitted only to the extent the position is “more likely than not” to be sustained assuming examination by taxing authorities. Management has analyzed the Fund’s tax positions taken on federal, state and local income tax returns for all open tax years (for up
to three tax years) and has concluded that no provisions for federal, state and local income tax are required in the Fund’s financial statements. The Fund’s federal, state and local income tax and federal excise tax returns for tax years for which the applicable statutes of limitations have not expired are subject to examination by the Internal Revenue Service and state and local departments of revenue.
(C) Dividends and Distributions to Shareholders. Dividends and distributions are recorded on the ex-dividend date. The Fund intends to declare and pay dividends from net investment income, if any, at least quarterly and distributions from net realized capital and currency gains, if any, at least annually. Unless the shareholder elects otherwise, all dividends and distributions are reinvested in the same class of shares of the Fund, at NAV. Dividends and distributions to shareholders are determined in accordance with federal income tax regulations and may differ from determinations using GAAP.
(D) Security Transactions and Investment Income. The Fund records security transactions on the trade date. Realized gains and losses on security transactions are determined using the identified cost method. Dividend income is recognized on the ex-dividend date; net of any foreign tax withheld at the source, and interest income is accrued as earned using the effective interest rate method. Discounts and premiums on securities purchased for the Fund are accreted and amortized, respectively, on the effective interest rate method over the life of the respective securities.
Investment income and realized and unrealized gains and losses on investments of the Fund are allocated pro rata to the separate classes of shares based upon their relative net assets on the date the income is earned or realized and unrealized gains and losses are incurred.
The Fund may place a debt security on non-accrual status and reduce related interest income by ceasing current accruals and writing off all or a portion of any interest receivables when the collection of all or a portion of such interest has become doubtful. A debt security is removed from non-accrual status when the issuer resumes interest payments or when collectability of interest is reasonably assured.
(E) Expenses. Expenses of the Trust are allocated to the individual Funds in proportion to the net assets of the respective Funds when the expenses are incurred, except where direct allocations of expenses can be made. Expenses (other than transfer agent expenses and fees incurred under the shareholder services plans and/or the distribution plans further discussed in Note 3(B)) are allocated to separate classes of shares pro rata based upon their relative net assets on the date the expenses are incurred. The expenses borne by the Fund, including those of related parties to the Fund, are shown in the Statement of Operations.
Additionally, the Fund may invest in mutual funds, which are subject to management fees and other fees that may cause the costs of investing in mutual funds to be greater than the costs of owning the underlying securities directly. These indirect expenses of mutual funds are not included in the amounts shown as expenses in the Fund’s Statement of Operations or in the expense ratios included in the Financial Highlights.
(F) Use of Estimates. In preparing financial statements in conformity with GAAP, management makes estimates and assumptions that affect the reported amounts and disclosures in the financial statements. Actual results could differ from those estimates.
Notes to Financial Statements(continued)
(G) Repurchase Agreements. The Fund may enter into repurchase agreements (i.e., buy a security from another party with the agreement that it will be sold back in the future) to earn income. The Fund may enter into repurchase agreements only with counterparties, usually financial institutions, that are deemed by the Manager or the Subadvisor to be creditworthy, pursuant to guidelines established by the Board. During the term of any repurchase agreement, the Manager or the Subadvisor will continue to monitor the creditworthiness of the counterparty. Under the 1940 Act, repurchase agreements are considered to be collateralized loans by the Fund to the counterparty secured by the securities transferred to the Fund.
Repurchase agreements are subject to counterparty risk, meaning the Fund could lose money by the counterparty’s failure to perform under the terms of the agreement. The Fund mitigates this risk by ensuring the repurchase agreement is collateralized by cash, U.S. government securities, fixed income securities and/or other securities. The collateral is held by the Fund’s custodian and valued daily on a mark to market basis to determine if the value, including accrued interest, exceeds the repurchase price. In the event of the counterparty’s default on the obligation to repurchase, the Fund has the right to liquidate the collateral and apply the proceeds in satisfaction of the obligation. Under certain circumstances, such as in the event of default or bankruptcy by the counterparty, realization and/or retention of the collateral may be limited or subject to delay, to legal proceedings and possible realized loss to the Fund. As of October 31, 2019, the Fund did not hold any repurchase agreements.
(H) Securities Lending. In order to realize additional income, the Fund may engage in securities lending, subject to the limitations set forth in the 1940 Act and relevant guidance by the staff of the Securities and Exchange Commission (“SEC”). In the event the Fund does engage in securities lending, the Fund will lend through its custodian, State Street Bank and Trust Company (“State Street”), acting as securities lending agent on behalf of the Fund. State Street will manage the Fund’s collateral in accordance with the securities lending agency agreement between the Fund and State Street, and indemnify the Fund against counterparty risk. The loans will be collateralized by cash (which may be invested in a money market fund) and/ornon-cash collateral (which may include U.S. Treasury securities and/or U.S. Government Agency securities issued or guaranteed by the United States government or its agencies or instrumentalities) at least equal at all times to the market value of the securities loaned. The Fund may bear the risk of delay in recovery of, or loss of rights in, the securities loaned should the borrower of the securities experience financial difficulty. The Fund may also record a realized gain or loss on securities deemed sold due to a borrower’s inability to return securities on loan. The Fund bears the risk of any loss on investment of cash collateral. The Fund will receive compensation for lending its securities in the form of fees or it will retain a portion of interest earned on the investment of any cash collateral. The Fund will also continue to receive interest and dividends on the securities loaned and any gain or loss in the market price of the securities loaned that may occur during the term of the loan will be for the account of the Fund. Income earned from securities lending activities, if any, is reflected in the Statement of Operations. As of October 31, 2019, the Fund had securities on loan with an aggregate market value of $52,271,579; the total market value of collateral held by the Fund was $53,392,090. The market value of the collateral held included
non-cash collateral in the form of U.S. Treasury securities with a value of $607,177 and cash collateral, which was invested into the State Street Navigator Securities Lending Government Money Market Portfolio, with a value of $52,784,913.
(I) Convertible Securities Risk. Convertible securities may be subordinate to other securities. In part, the total return for a convertible security depends upon the performance of the underlying stock into which it can be converted. Also, issuers of convertible securities are often not as strong financially as those issuing securities with higher credit ratings, are more likely to encounter financial difficulties and typically are more vulnerable to changes in the economy, such as a recession or a sustained period of rising interest rates, which could affect their ability to make interest and principal payments.
(J) Indemnifications. Under the Trust’s organizational documents, its officers and trustees are indemnified against certain liabilities that may arise out of performance of their duties to the Trust. Additionally, in the normal course of business, the Fund enters into contracts with third-party service providers that contain a variety of representations and warranties and which may provide general indemnifications. The Fund’s maximum exposure under these arrangements is unknown, as this would involve future claims that may be made against the Fund that have not yet occurred. Based on experience, management is of the view that the risk of loss in connection with these potential indemnification obligations is remote. However, there can be no assurance that material liabilities related to such obligations will not arise in the future, which could adversely impact the Fund.
Note 3–Fees and Related Party Transactions
(A) Manager and Subadvisor. New York Life Investments, a registered investment adviser and an indirect,wholly-owned subsidiary of New York Life Insurance Company (“New York Life”), serves as the Fund’s Manager, pursuant to an Amended and Restated Management Agreement (“Management Agreement”). The Manager provides offices, conducts clerical, recordkeeping and bookkeeping services and keeps most of the financial and accounting records required to be maintained by the Fund. Except for the portion of salaries and expenses that are the responsibility of the Fund, the Manager pays the salaries and expenses of all personnel affiliated with the Fund and certain operational expenses of the Fund. The Fund reimburses New York Life Investments in an amount equal to a portion of the compensation of the Chief Compliance Officer attributable to the Fund. MacKay Shields LLC (“MacKay Shields” or the “Subadvisor”), a registered investment adviser and an indirect,wholly-owned subsidiary of New York Life, serves as Subadvisor to the Fund and is responsible for theday-to-day portfolio management of the Fund. Pursuant to the terms of an Amended and Restated Subadvisory Agreement (“Subadvisory Agreement”) between New York Life Investments and MacKay Shields, New York Life Investments pays for the services of the Subadvisor.
Effective February 28, 2019, under the Management Agreement, the Fund pays the Manager a monthly fee for the services performed and the facilities furnished at an annual rate of the Fund’s average daily net assets as follows: 0.60% up to $500 million; 0.55% from $500 million to $1 billion; 0.50% from $1 billion to $2 billion; and 0.49% in excess of $2 billion, plus a fee for fund accounting services, previously provided by New York Life Investments under a separate fund accounting agreement, furnished at an annual rate of the Fund’s average daily net assets
| | |
| 24 | | MainStay MacKay Convertible Fund |
as follows: 0.05% up to $20 million; 0.0333% from $20 million to $100 million; and 0.01% in excess of $100 million. During the year ended October 31, 2019, the effective management fee rate (exclusive of any applicable waivers/reimbursements) was 0.57%, inclusive of a fee for fund accounting services of 0.01% of the Fund’s average daily net assets.
Prior to February 28, 2019, under the Management Agreement, the Fund paid the Manager a monthly fee for the services performed and the facilities furnished at an annual rate of the Fund’s average daily net assets as follows: 0.60% up to $500 million; 0.55% from $500 million to $1 billion; and 0.50% in excess of $1 billion, plus a fee for fund accounting services, previously provided by New York Life Investments under a separate fund accounting agreement, furnished at an annual rate of the Fund’s average daily net assets as follows: 0.05% up to $20 million; 0.0333% from $20 million to $100 million; and 0.01% in excess of $100 million.
New York Life Investments has contractually agreed to waive fees and/or reimburse expenses (excluding taxes, interest, litigation, extraordinary expenses, brokerage and other transaction expenses relating to the purchase or sale of portfolio investments and acquired (underlying) fund fees and expenses) of Class I shares so that Total Annual Fund Operating Expenses of Class I shares do not exceed 0.61% of the Fund’s average daily net assets. New York Life Investments has also contractually agreed to waive fees and/or reimburse expenses so that Total Annual Fund Operating Expenses (excluding taxes, interest, litigation, extraordinary expenses, brokerage and other transaction expenses relating to the purchase or sale of portfolio investments, and acquired (underlying) fund fees and expenses) of Class R6 do not exceed those of Class I. These agreements will remain in effect until February 28, 2020, and shall renew automatically for one-year terms unless New York Life Investments provides written notice of termination prior to the start of the next term or upon approval of the Board.
During the year ended October 31, 2019, New York Life Investments earned fees from the Fund in the amount of $7,771,639 and waived fees/reimbursed expenses in the amount of $884,647 and paid the Subadvisor in the amount of $3,361,586.
State Street providessub-administration andsub-accounting services to the Fund pursuant to an agreement with New York Life Investments. These services include calculating the daily NAVs of the Fund, maintaining the general ledger andsub-ledger accounts for the calculation of the Fund’s NAVs and assisting New York Life Investments in conducting various aspects of the Fund’s administrative operations. For providing these services to the Fund, State Street is compensated by New York Life Investments.
Pursuant to an agreement between the Trust and New York Life Investments, New York Life Investments is responsible for providing or procuring certain regulatory reporting services for the Fund. The Fund will reimburse New York Life Investments for the actual costs incurred by New York Life Investments in connection with providing or procuring these services for the Fund.
(B) Distribution and Service Fees. The Trust, on behalf of the Fund, has entered into a distribution agreement with NYLIFE Distributors LLC (the “Distributor”), an indirect,wholly-owned subsidiary of New York
Life. The Fund has adopted distribution plans (the “Plans”) in accordance with the provisions of Rule 12b-1 under the 1940 Act.
Pursuant to the Class A and Investor Class Plans, the Distributor receives a monthly distribution fee from the Class A and Investor Class shares at an annual rate of 0.25% of the average daily net assets of the Class A and Investor Class shares for distribution and/or service activities as designated by the Distributor. Pursuant to the Class B and Class C Plans, Class B and Class C shares pay the Distributor a monthly distribution fee at an annual rate of 0.75% of the average daily net assets of the Class B and Class C shares along with a service fee at an annual rate of 0.25% of the average daily net assets of the Class B and Class C shares, for a total 12b-1 fee of 1.00%. Class I and Class R6 shares are not subject to a distribution and/or service fee.
The Plans provide that the distribution and service fees are payable to the Distributor regardless of the amounts actually expended by the Distributor for distribution of the Fund’s shares and service activities.
(C) Sales Charges. During the year ended October 31, 2019, the Fund was advised by the Distributor that the amount of initial sales charges retained on sales of Class A and Investor Class shares were $140,085 and $36,895, respectively.
During the year ended October 31, 2019, the Fund was also advised that the Distributor retained CDSCs on redemptions of Class A, Investor Class, Class B and Class C shares of $5,755, $3, $13,257 and $11,692, respectively.
(D) Transfer, Dividend Disbursing and Shareholder Servicing Agent. NYLIM Service Company LLC, an affiliate of New York Life Investments, is the Fund’s transfer, dividend disbursing and shareholder servicing agent pursuant to an agreement between NYLIM Service Company LLC and the Trust. NYLIM Service Company LLC has entered into an agreement with DST Asset Manager Solutions, Inc. (“DST”), pursuant to which DST performs certain transfer agent services on behalf of NYLIM Service Company LLC. During the year ended October 31, 2019, transfer agent expenses incurred by the Fund were as follows:
| | | | |
Class A | | $ | 657,843 | |
Investor Class | | | 176,785 | |
Class B | | | 41,370 | |
Class C | | | 214,487 | |
Class I | | | 880,511 | |
(E) Small Account Fee. Shareholders with small accounts adversely impact the cost of providing transfer agency services. In an effort to reduce total transfer agency expenses, the Fund has implemented a small account fee on certain types of accounts. Certain shareholders with an account balance of less than $1,000 are charged an annual per account fee of $20 (assessed semi-annually), the proceeds from which offset transfer agent fees as reflected in the Statement of Operations.
Notes to Financial Statements(continued)
(F) Investments in Affiliates (in 000’s). During the year ended October 31, 2019, purchases and sales transactions, income earned from investments and shares held of investment companies managed by New York Life Investments or its affiliates were as follows:
| | | | | | | | | | | | | | | | | | | | | | | | | | | | | | | | | | | | |
Affiliated Investment Company | | Value,
Beginning
of Year | | | Purchases
at Cost | | | Proceeds
from
Sales | | | Net
Realized
Gain/
(Loss)
on Sales | | | Change in
Unrealized
Appreciation/
(Depreciation) | | | Value,
End of
Year | | | Dividend
Income | | | Other
Distributions | | | Shares
End of
Year | |
MainStay U.S. Government Liquidity Fund | | $ | 126,303 | | | $ | 391,019 | | | $ | (366,288 | ) | | $ | — | | | $ | — | | | $ | 151,034 | | | $ | 1,822 | | | $ | — | | | | 151,034 | |
Note 4–Federal Income Tax
As of October 31, 2019, the cost and unrealized appreciation (depreciation) of the Fund’s investment portfolio, including applicable derivative contracts and other financial instruments, as determined on a federal income tax basis, were as follows:
| | | | | | | | | | | | | | | | |
| | | Federal Tax
Cost | | | Gross
Unrealized
Appreciation | | �� | Gross
Unrealized
(Depreciation) | | | Net
Unrealized
Appreciation/
(Depreciation) | |
Investments in Securities | | $ | 1,386,199,406 | | | $ | 213,115,270 | | | $ | (64,873,239 | ) | | $ | 148,242,031 | |
As of October 31, 2019, the components of accumulated gain (loss) on a tax basis were as follows:
| | | | | | | | |
Ordinary
Income | | Accumulated
Capital and
Other Gain
(Loss) | | Other
Temporary
Differences | | Unrealized
Appreciation
(Depreciation) | | Total
Accumulated
Gain (Loss) |
| | | | |
| $5,931,375 | | $25,158,170 | | $(1,428,557) | | $148,242,031 | | $177,903,019 |
The difference between book-basis and tax-basis unrealized appreciation (depreciation) is primarily due to Cumulative Convertible Bond Adjustment and Contingent Payment Debt Instruments. Other temporary differences are primarily due to defaulted bond income accruals.
During the years ended October 31, 2019 and October 31, 2018, the tax character of distributions paid as reflected in the Statements of Changes in Net Assets was as follows:
| | | | | | | | |
| | | 2019 | | | 2018 | |
| | |
Distributions paid from: | | | | | | | | |
Ordinary Income | | $ | 38,353,094 | | | $ | 19,372,404 | |
Long-Term Capital Gain | | | 39,052,373 | | | | 61,089,527 | |
Total | | $ | 77,405,467 | | | $ | 80,461,931 | |
Note 5–Custodian
State Street is the custodian of cash and securities held by the Fund. Custodial fees are charged to the Fund based on the Fund’s net assets and/or the market value of securities held by the Fund and the number of certain transactions incurred by the Fund.
Note 6–Line of Credit
The Fund and certain other funds managed by New York Life Investments maintain a line of credit with a syndicate of banks in order to
secure a source of funds for temporary purposes to meet unanticipated or excessive redemption requests.
Effective July 30, 2019, under the credit agreement (the “Credit Agreement”), the aggregate commitment amount is $600,000,000 with an additional uncommitted amount of $100,000,000. The commitment fee is an annual rate of 0.15% of the average commitment amount payable quarterly, regardless of usage, to State Street, who serves as the agent to the syndicate. The commitment fee is allocated among the Fund and certain other funds managed by New York Life Investments based upon their respective net assets and other factors. Interest on any revolving credit loan is charged based upon the Federal Funds Rate or the one-month London Interbank Offered Rate (“LIBOR”), whichever is higher. The Credit Agreement expires on July 28, 2020, although the Fund, certain other funds managed by New York Life Investments and the syndicate of banks may renew the Credit Agreement for an additional year on the same or different terms. Prior to July 30, 2019, the aggregate commitment amount and the commitment fee were the same as those under the current Credit Agreement. During the year ended October 31, 2019, there were no borrowings made or outstanding with respect to the Fund under the Credit Agreement.
Note 7–Interfund Lending Program
Pursuant to an exemptive order issued by the SEC, the Fund, along with certain other funds managed by New York Life Investments, may participate in an interfund lending program. The interfund lending program provides an alternative credit facility that permits the Fund and certain other funds managed by New York Life Investments to lend or borrow money for temporary purposes directly to or from one another subject to the conditions of the exemptive order. During the year ended October 31, 2019, there were no interfund loans made or outstanding with respect to the Fund.
Note 8–Purchases and Sales of Securities (in 000’s)
During the year ended October 31, 2019, purchases and sales of securities, other thanshort-term securities, were $292,329 and $295,405, respectively.
| | |
| 26 | | MainStay MacKay Convertible Fund |
Note 9–Capital Share Transactions
Transactions in capital shares for the years ended October 31, 2019 and October 31, 2018, were as follows:
| | | | | | | | |
Class A | | Shares | | | Amount | |
| | |
Year ended October 31, 2019: | | | | | | | | |
Shares sold | | | 6,440,230 | | | $ | 111,352,512 | |
Shares issued to shareholders in reinvestment of dividends and distributions | | | 1,782,190 | | | | 28,552,030 | |
Shares redeemed | | | (8,400,694 | ) | | | (142,983,194 | ) |
| | | | |
Net increase (decrease) in shares outstanding before conversion | | | (178,274 | ) | | | (3,078,652 | ) |
Shares converted into Class A (See Note 1) | | | 581,531 | | | | 10,062,755 | |
Shares converted from Class A (See Note 1) | | | (128,941 | ) | | | (2,245,389 | ) |
| | | | |
Net increase (decrease) | | | 274,316 | | | $ | 4,738,714 | |
| | | | |
Year ended October 31, 2018: | | | | | | | | |
Shares sold | | | 6,951,046 | | | $ | 123,130,438 | |
Shares issued to shareholders in reinvestment of dividends and distributions | | | 1,951,305 | | | | 32,664,323 | |
Shares redeemed | | | (6,160,505 | ) | | | (107,832,361 | ) |
| | | | |
Net increase (decrease) in shares outstanding before conversion | | | 2,741,846 | | | | 47,962,400 | |
Shares converted into Class A (See Note 1) | | | 677,884 | | | | 11,958,226 | |
Shares converted from Class A (See Note 1) | | | (224,823 | ) | | | (4,036,018 | ) |
| | | | |
Net increase (decrease) | | | 3,194,907 | | | $ | 55,884,608 | |
| | | | |
| | |
| | | | | | | | |
Investor Class | | Shares | | | Amount | |
| | |
Year ended October 31, 2019: | | | | | | | | |
Shares sold | | | 859,898 | | | $ | 14,934,377 | |
Shares issued to shareholders in reinvestment of dividends and distributions | | | 185,052 | | | | 2,959,367 | |
Shares redeemed | | | (653,130 | ) | | | (11,388,345 | ) |
| | | | |
Net increase (decrease) in shares outstanding before conversion | | | 391,820 | | | | 6,505,399 | |
Shares converted into Investor Class (See Note 1) | | | 206,666 | | | | 3,561,867 | |
Shares converted from Investor Class (See Note 1) | | | (360,146 | ) | | | (6,250,197 | ) |
| | | | |
Net increase (decrease) | | | 238,340 | | | $ | 3,817,069 | |
| | | | |
Year ended October 31, 2018: | | | | | | | | |
Shares sold | | | 477,345 | | | $ | 8,402,387 | |
Shares issued to shareholders in reinvestment of dividends and distributions | | | 227,114 | | | | 3,796,070 | |
Shares redeemed | | | (316,976 | ) | | | (5,549,168 | ) |
| | | | |
Net increase (decrease) in shares outstanding before conversion | | | 387,483 | | | | 6,649,289 | |
Shares converted into Investor Class (See Note 1) | | | 145,958 | | | | 2,599,355 | |
Shares converted from Investor Class (See Note 1) | | | (615,915 | ) | | | (10,852,240 | ) |
| | | | |
Net increase (decrease) | | | (82,474 | ) | | $ | (1,603,596 | ) |
| | | | |
| | |
| | | | | | | | |
| | | | | | | | |
Class B | | Shares | | | Amount | |
| | |
Year ended October 31, 2019: | | | | | | | | |
Shares sold | | | 178,224 | | | $ | 3,106,135 | |
Shares issued to shareholders in reinvestment of dividends and distributions | | | 43,221 | | | | 684,526 | |
Shares redeemed | | | (319,067 | ) | | | (5,486,747 | ) |
| | | | |
Net increase (decrease) in shares outstanding before conversion | | | (97,622 | ) | | | (1,696,086 | ) |
Shares converted from Class B (See Note 1) | | | (121,828 | ) | | | (2,066,900 | ) |
| | | | |
Net increase (decrease) | | | (219,450 | ) | | $ | (3,762,986 | ) |
| | | | |
Year ended October 31, 2018: | | | | | | | | |
Shares sold | | | 54,400 | | | $ | 953,788 | |
Shares issued to shareholders in reinvestment of dividends and distributions | | | 62,726 | | | | 1,040,344 | |
Shares redeemed | | | (190,681 | ) | | | (3,325,606 | ) |
| | | | |
Net increase (decrease) in shares outstanding before conversion | | | (73,555 | ) | | | (1,331,474 | ) |
Shares converted from Class B (See Note 1) | | | (131,697 | ) | | | (2,330,239 | ) |
| | | | |
Net increase (decrease) | | | (205,252 | ) | | $ | (3,661,713 | ) |
| | | | |
| | |
| | | | | | | | |
Class C | | Shares | | | Amount | |
| | |
Year ended October 31, 2019: | | | | | | | | |
Shares sold | | | 797,545 | | | $ | 13,650,632 | |
Shares issued to shareholders in reinvestment of dividends and distributions | | | 214,714 | | | | 3,396,089 | |
Shares redeemed | | | (2,127,881 | ) | | | (36,129,333 | ) |
| | | | |
Net increase (decrease) in shares outstanding before conversion | | | (1,115,622 | ) | | | (19,082,612 | ) |
Shares converted from Class C (See Note 1) | | | (200,541 | ) | | | (3,422,405 | ) |
| | | | |
Net increase (decrease) | | | (1,316,163 | ) | | $ | (22,505,017 | ) |
| | | | |
Year ended October 31, 2018: | | | | | | | | |
Shares sold | | | 943,151 | | | $ | 16,541,245 | |
Shares issued to shareholders in reinvestment of dividends and distributions | | | 251,595 | | | | 4,167,959 | |
Shares redeemed | | | (1,093,646 | ) | | | (19,054,723 | ) |
| | | | |
Net increase (decrease) | | | 101,100 | | | $ | 1,654,481 | |
| | | | |
| | |
| | | | | | | | |
Class I | | Shares | | | Amount | |
| | |
Year ended October 31, 2019: | | | | | | | | |
Shares sold | | | 21,928,440 | | | $ | 376,071,787 | |
Shares issued to shareholders in reinvestment of dividends and distributions | | | 1,979,627 | | | | 31,939,703 | |
Shares redeemed | | | (20,528,571 | ) | | | (345,295,261 | ) |
| | | | |
Net increase (decrease) in shares outstanding before conversion | | | 3,379,496 | | | | 62,716,229 | |
Shares converted into Class I (See Note 1) | | | 20,893 | | | | 360,269 | |
| | | | |
Net increase (decrease) | | | 3,400,389 | | | $ | 63,076,498 | |
| | | | |
Year ended October 31, 2018: | | | | | | | | |
Shares sold | | | 21,352,015 | | | $ | 378,690,014 | |
Shares issued to shareholders in reinvestment of dividends and distributions | | | 1,723,558 | | | | 28,971,052 | |
Shares redeemed | | | (14,889,150 | ) | | | (260,911,854 | ) |
| | | | |
Net increase (decrease) in shares outstanding before conversion | | | 8,186,423 | | | | 146,749,212 | |
Shares converted into Class I (See Note 1) | | | 147,369 | | | | 2,660,916 | |
| | | | |
Net increase (decrease) | | | 8,333,792 | | | $ | 149,410,128 | |
| | | | |
Notes to Financial Statements(continued)
Note 10–Recent Accounting Pronouncement
In March 2017, the Financial Accounting Standards Board issued an Accounting Standards Update, ASU2017-08, which amends the amortization period for certain callable debt securities that are held at a premium. The amendment requires the premium to be amortized to the earliest call date. This amendment does not require an accounting change for securities held at a discount. This guidance is effective for fiscal years beginning after December 15, 2018. At this time, management is evaluating the implications of the ASU and any impact on the financial statements has not yet been determined.
To improve the effectiveness of fair value disclosure requirements, the Financial Accounting Standards Board recently issued Accounting Standards Update (ASU)2018-13, Fair Value Measurement Disclosure Framework—Changes to the Disclosure Requirements for Fair Value Measurement (ASU2018-13), which adds, removes, and modifies certain aspects relating to fair value disclosure. ASU2018-13 is effective for interim and annual reporting periods beginning after December 15, 2019; early adoptions of the entire ASU2018-13, or
portions thereof, is permitted. Management has evaluated the implications of certain other provisions of the ASU and has determined to early adopt aspects related to the removal and modifications of certain fair value measurement disclosures under the ASU effective immediately. At this time, management is evaluating the implications of certain other provisions of the ASU related to new disclosure requirements and any impact on the financial statement disclosures has not yet been determined.
Note 11–Subsequent Events
In connection with the preparation of the financial statements of the Fund as of and for the year ended October 31, 2019, events and transactions subsequent to October 31, 2019, through the date the financial statements were issued have been evaluated by the Fund’s management for possible adjustment and/or disclosure. No subsequent events requiring financial statement adjustment or disclosure have been identified.
| | |
| 28 | | MainStay MacKay Convertible Fund |
Report of Independent Registered Public Accounting Firm
To the Shareholders and Board of Trustees
The MainStay Funds:
Opinion on the Financial Statements
We have audited the accompanying statement of assets and liabilities of MainStay MacKay Convertible Fund (the Fund), one of the funds constituting The MainStay Funds, including the portfolio of investments, as of October 31, 2019, the related statement of operations for the year then ended, the statements of changes in net assets for each of the years in thetwo-year period then ended, and the related notes (collectively, the financial statements) and the financial highlights for each of the years in the five-year period then ended. In our opinion, the financial statements and financial highlights present fairly, in all material respects, the financial position of the Fund as of October 31, 2019, the results of its operations for the year then ended, the changes in its net assets for each of the years in thetwo-year period then ended, and the financial highlights for each of the years in the five-year period then ended, in conformity with U.S. generally accepted accounting principles.
Basis for Opinion
These financial statements and financial highlights are the responsibility of the Fund’s management. Our responsibility is to express an opinion on these financial statements and financial highlights based on our audits. We are a public accounting firm registered with the Public Company Accounting Oversight Board (United States) (PCAOB) and are required to be independent with respect to the Fund in accordance with the U.S. federal securities laws and the applicable rules and regulations of the Securities and Exchange Commission and the PCAOB.
We conducted our audits in accordance with the standards of the PCAOB. Those standards require that we plan and perform the audit to obtain reasonable assurance about whether the financial statements and financial highlights are free of material misstatement, whether due to error or fraud. Our audits included performing procedures to assess the risks of material misstatement of the financial statements and financial highlights, whether due to error or fraud, and performing procedures that respond to those risks. Such procedures included examining, on a test basis, evidence regarding the amounts and disclosures in the financial statements and financial highlights. Such procedures also included confirmation of securities owned as of October 31, 2019, by correspondence with the custodian, the transfer agent, and brokers or by other appropriate auditing procedures when replies from brokers were not received. Our audits also included evaluating the accounting principles used and significant estimates made by management, as well as evaluating the overall presentation of the financial statements and financial highlights. We believe that our audits provide a reasonable basis for our opinion.

We have served as the auditor of one or more New York Life Investment Management investment companies since 2003.
Philadelphia, Pennsylvania
December 23, 2019
Federal Income Tax Information
(Unaudited)
The Fund is required under the Internal Revenue Code to advise shareholders in a written statement as to the federal tax status of dividends paid by the Fund during such fiscal years. Accordingly, the Fund paid $39,052,373 as long term capital gain distributions.
For the fiscal year ended October 31, 2019, the Fund designated approximately $11,839,736 under the Internal Revenue Code as qualified dividend income eligible for reduced tax rates.
The dividends paid by the Fund during the fiscal year ended October 31, 2019 should be multiplied by 23.02% to arrive at the amount eligible for the corporate dividend-received deduction.
In February 2020, shareholders will receive an IRS Form1099-DIV or substitute Form 1099, which will show the federal tax status of the distributions received by shareholders in calendar year 2019. The amounts that will be reported on such1099-DIV or substitute Form 1099 will be the amounts you are to use on your federal income tax return and will differ from the amounts which we must report for the Fund’s fiscal year end October 31, 2019.
Proxy Voting Policies and Procedures and Proxy Voting Record
A description of the policies and procedures that New York Life Investments uses to vote proxies related to the Fund’s securities is available without charge, upon request, by visiting the MainStay Funds’ website atnylinvestments.com/fundsor visiting the SEC’s website atwww.sec.gov.
The Fund is required to file with the SEC its proxy voting records for the12-month period ending June 30 on Form N-PX. The most recent Form N-PX or proxy voting record is available free of charge upon request by calling800-624-6782; visiting the MainStay Funds’ website atnylinvestments.com/funds; or visiting the SEC’s website atwww.sec.gov.
Shareholder Reports and Quarterly Portfolio Disclosure
The Fund is required to file its complete schedule of portfolio holdings with the SEC 60 days after its first and third fiscal quarter onForm N-PORT. The Fund’s holdings report is available free of charge by visiting the SEC’s website atwww.sec.govor upon request by calling New York Life Investments at800-624-6782.
| | |
| 30 | | MainStay MacKay Convertible Fund |
Board of Trustees and Officers (Unaudited)
The Trustees and officers of the Funds are listed below. The Board oversees the MainStay Group of Funds (which consists of MainStay Funds and MainStay Funds Trust), MainStay VP Funds Trust, MainStay MacKay DefinedTerm Municipal Opportunities Fund, the Manager and the Subadvisors, and elects the officers of the Funds who are responsible for theday-to-day operations of the Funds. Information pertaining to the Trustees and officers is set forth below. Each Trustee serves until his or her successor is elected and qualified or until his or her
resignation, death or removal. Under the Board’s retirement policy, unless an exception is made, a Trustee must tender his or her resignation by the end of the calendar year during which he or she reaches the age of 75. Officers are elected annually by the Board. The business address of each Trustee and officer listed below is 51 Madison Avenue, New York, New York 10010. A majority of the Trustees are not “interested persons” (as defined by the 1940 Act and rules adopted by the SEC thereunder) of the Fund (“Independent Trustees”).
| | | | | | | | | | | | |
| | | | | Name and
Year of Birth | | Term of Office,
Position(s) Held and
Length of Service | | Principal Occupation(s)
During Past Five Years | | Number of
Portfolios in
Fund Complex
Overseen by
Trustee | | Other Directorships
Held by Trustee |
Interested Trustee | | | | Yie-Hsin Hung* 1962 | | MainStay Funds: Trustee since 2017; MainStay Funds Trust:Trustee since 2017. | | Senior Vice President of New York Life since joining in 2010, Member of the Executive Management Committee since 2017, Chief Executive Officer, New York Life Investment Management Holdings LLC & New York Life Investment Management LLC since 2015. Senior Managing Director andCo-President of New York Life Investment Management LLC from January 2014 to May 2015. Previously held positions of increasing responsibility, including head of NYLIM International, Alternative Growth Businesses, and Institutional investments since joining New York Life in 2010. | | 74 | | MainStay VP Funds Trust:
Trustee since 2017 (31 portfolios); and
MainStay MacKay DefinedTerm Municipal Opportunities Fund: Trustee since 2017. |
| | * | This Trustee is considered to be an “interested person” of the MainStay Group of Funds, MainStay VP Funds Trust and MainStay MacKay DefinedTerm Municipal Opportunities Fund, within the meaning of the 1940 Act because of her affiliation with New York Life Insurance Company, New York Life Investment Management LLC, Candriam Belgium S.A., Candriam Luxembourg S.C.A., IndexIQ Advisors LLC, MacKay Shields LLC, NYL Investors LLC, NYLIFE Securities LLC and/or NYLIFE Distributors LLC, as described in detail above in the column entitled “Principal Occupation(s) During Past Five Years.” |
| | | | | | | | | | | | |
| | | | | Name and
Year of Birth | | Term of Office,
Position(s) Held and
Length of Service | | Principal Occupation(s)
During Past Five Years | | Number of
Portfolios in
Fund Complex
Overseen by
Trustee | | Other Directorships
Held by Trustee |
Independent Trustees | | | | David H. Chow 1957 | | MainStay Funds: Trustee since 2016, Advisory Board Member (June 2015 to December 2015); MainStay Funds Trust:Trustee since 2016, Advisory Board Member (June 2015 to December 2015). | | Founder and CEO, DanCourt Management, LLC (since 1999) | | 74 | | MainStay VP Funds Trust: Trustee since 2016, Advisory Board Member (June 2015 to December 2015) (31 portfolios);
MainStay MacKay DefinedTerm Municipal Opportunities Fund: Trustee since 2016, Advisory Board Member (June 2015 to December 2015);
Market Vectors Group of Exchange-Traded Funds: Independent Chairman of the Board of Trustees since 2008 and Trustee since 2006 (56 portfolios); and
Berea College of Kentucky: Trustee since 2009. |
| | | | Susan B. Kerley 1951 | | MainStay Funds: Chairman since 2017 and Trustee since 2007; MainStay Funds Trust:Chairman since 2017 and Trustee since 1990.** | | President, Strategic Management Advisors LLC (since 1990) | | 74 | | MainStay VP Funds Trust: Chairman since January 2017 and Trustee since 2007 (31 portfolios)***;
MainStay MacKay DefinedTerm Municipal Opportunities Fund: Chairman since 2017 and Trustee since 2011; and
Legg Mason Partners Funds: Trustee since 1991 (45 portfolios). |
| | | | Alan R. Latshaw 1951 | | MainStay Funds: Trustee; MainStay Funds Trust: Trustee and Audit Committee Financial Expert since 2007.** | | Retired; Partner, Ernst & Young LLP (2002 to 2003); Partner, Arthur Andersen LLP (1989 to 2002); Consultant to the MainStay Funds Audit and Compliance Committee (2004 to 2006) | | 74 | | MainStay VP Funds Trust: Trustee and Audit Committee Financial Expert since 2007 (31 portfolios)***;
MainStay MacKay DefinedTerm Municipal Opportunities Fund: Trustee and Audit Committee Financial Expert since 2011;
State Farm Associates Funds Trusts: Trustee since 2005 (4 portfolios);
and State Farm Variable Product Trust: Trustee since 2005 (9 portfolios). |
| | | | Richard H. Nolan, Jr. 1946 | | MainStay Funds: Trustee since 2007; MainStay Funds Trust:Trustee since 2007.** | | Managing Director, ICC Capital Management (since 2004); President—Shields/Alliance, Alliance Capital Management (1994 to 2004) | | 74 | | MainStay VP Funds Trust: Trustee since 2006 (31 portfolios)***; and
MainStay MacKay DefinedTerm Municipal Opportunities Fund: Trustee since 2011. |
| | | | Jacques P. Perold 1958 | | MainStay Funds: Trustee since 2016, Advisory Board Member (June 2015 to December 2015); MainStay Funds Trust:Trustee since 2016, Advisory Board Member (June 2015 to December 2015). | | Retired; President, Fidelity Management & Research Company (2009 to 2014); Founder, President and Chief Executive Officer, Geode Capital Management, LLC (2001 to 2009) | | 74 | | MainStay VP Funds Trust: Trustee since 2016, Advisory Board Member (June 2015 to December 2015) (31 portfolios);
MainStay MacKay DefinedTerm Municipal Opportunities Fund: Trustee since 2016, Advisory Board Member (June 2015 to December 2015);
Allstate Corporation: Director since 2015;MSCI, Inc.: Director since 2017 and
Boston University: Trustee since 2014. |
| | |
| 32 | | MainStay MacKay Convertible Fund |
| | | | | | | | | | | | |
| | | | | Name and
Year of Birth | | Term of Office,
Position(s) Held and
Length of Service | | Principal Occupation(s)
During Past Five Years | | Number of
Portfolios in
Fund Complex
Overseen by
Trustee | | Other Directorships
Held by Trustee |
Independent Trustees | | | | Richard S. Trutanic 1952 | | MainStay Funds: Trustee since 1994; MainStay Funds Trust: Trustee since 2007.** | | Chairman and Chief Executive Officer, Somerset & Company (financial advisory firm) (since 2004); Managing Director, The Carlyle Group (private investment firm) (2002 to 2004); Senior Managing Director, Partner and Board Member, Groupe Arnault S.A. (private investment firm) (1999 to 2002) | | 74 | | MainStay VP Funds Trust: Trustee since 2007 (31 portfolios)***; and
MainStay MacKay DefinedTerm Municipal Opportunities Fund: Trustee since 2011. |
| | ** | Includes prior service as a Director/Trustee of certain predecessor entities to MainStay Funds Trust. |
| | *** | Includes prior service as a Director of MainStay VP Series Fund, Inc., the predecessor to MainStay VP Funds Trust. |
| | | | | | | | |
| | | | | Name and
Year of Birth | | Position(s) Held and
Length of Service | | Principal Occupation(s)
During Past Five Years |
Officers
of the
Trust
(Who are
not
Trustees)* | | | | Kirk C. Lehneis 1974 | | President, MainStay Funds, MainStay Funds Trust (since 2017) | | Chief Operating Officer and Senior Managing Director (since 2016), New York Life Investment Management LLC; Chairman of the Board (since 2017), NYLIFE Distributors LLC; Chairman of the Board, NYLIM Service Company LLC (since 2017); Trustee, President and Principal Executive Officer of IndexIQ Trust, IndexIQ ETF Trust and IndexIQ Active ETF Trust (since January 2018); President, MainStay MacKay DefinedTerm Municipal Opportunities Fund and MainStay VP Funds Trust
(since 2017)**; Senior Managing Director, Global Product Development (2015 to 2016); Managing Director, Product Development (2010 to 2015), New York Life Investment Management LLC |
| | | | Jack R. Benintende 1964 | | Treasurer and Principal Financial and Accounting Officer, MainStay Funds (since 2007), MainStay Funds Trust (since 2009) | | Managing Director, New York Life Investment Management LLC (since 2007); Treasurer and Principal Financial and Accounting Officer, MainStay MacKay DefinedTerm Municipal Opportunities Fund (since 2011) and MainStay VP Funds Trust (since 2007)**; and Assistant Treasurer, New York Life Investment Management Holdings LLC (2008 to 2012) |
| | | | Kevin M. Bopp 1969 | | Vice President and Chief Compliance Officer, MainStay Funds and MainStay Funds Trust (since 2014) | | Chief Compliance Officer, New York Life Investment Management LLC, IndexIQ Trust, IndexIQ ETF Trust and IndexIQ Active ETF Trust (since 2016), Director and Associate General Counsel (2011 to 2014) and Vice President and Assistant General Counsel (2010 to 2011), New York Life Investment Management LLC; Vice President and Chief Compliance Officer, MainStay VP Funds Trust, MainStay MacKay DefinedTerm Municipal Opportunities Fund (since 2014); Assistant Secretary, MainStay Funds, MainStay Funds Trust and MainStay VP Funds Trust (2010 to 2014)**, MainStay MacKay DefinedTerm Municipal Opportunities Fund (2011 to 2014) |
| | | | J. Kevin Gao 1967 | | Secretary and Chief Legal Officer, MainStay Funds and MainStay Funds Trust (since 2010) | | Managing Director and Associate General Counsel, New York Life Investment Management LLC (since 2010); Secretary and Chief Legal Officer, MainStay MacKay DefinedTerm Municipal Opportunities Fund (since 2011) and MainStay VP Funds Trust (since 2010)** |
| | | | Scott T. Harrington 1959 | | Vice President—Administration, MainStay Funds (since 2005), MainStay Funds Trust (since 2009) | | Managing Director, New York Life Investment Management LLC (including predecessor advisory organizations) (since 2000); Member of the Board of Directors, New York Life Trust Company (since 2009); Vice President—Administration, MainStay MacKay DefinedTerm Municipal Opportunities Fund (since 2011) and MainStay VP Funds Trust (since 2005)** |
| | * | The officers listed above are considered to be “interested persons” of the MainStay Group of Funds, MainStay VP Funds Trust and MainStay MacKay Defined Term Municipal Opportunities Fund within the meaning of the 1940 Act because of their affiliation with the MainStay Group of Funds, New York Life Insurance Company and/or its affiliates, including New York Life Investment Management LLC, NYLIM Service Company LLC, NYLIFE Securities LLC and/or NYLIFE Distributors LLC, as described in detail in the column captioned “Principal Occupation(s) During Past Five Years.” Officers are elected annually by the Board. |
| | ** | Includes prior service as an Officer of MainStay VP Series Fund, Inc., the predecessor to MainStay VP Funds Trust. |
| | |
| 34 | | MainStay MacKay Convertible Fund |
MainStay Funds
Equity
U.S. Equity
MainStay Epoch U.S. All Cap Fund
MainStay Epoch U.S. Equity Yield Fund
MainStay Large Cap Growth Fund
MainStay MacKay Common Stock Fund
MainStay MacKay Growth Fund
MainStay MacKay S&P 500 Index Fund
MainStay MacKay Small Cap Core Fund1
MainStay MacKay U.S. Equity Opportunities Fund
MainStay MAP Equity Fund
International Equity
MainStay Epoch International Choice Fund
MainStay MacKay International Equity Fund
MainStay MacKay International Opportunities Fund
Emerging Markets Equity
MainStay Candriam Emerging Markets Equity Fund
MainStay MacKay Emerging Markets Equity Fund
Global Equity
MainStay Epoch Capital Growth Fund
MainStay Epoch Global Equity Yield Fund
Fixed Income
Taxable Income
MainStay Candriam Emerging Markets Debt Fund2
MainStay Floating Rate Fund
MainStay Indexed Bond Fund3
MainStay MacKay High Yield Corporate Bond Fund
MainStay MacKay Infrastructure Bond Fund
MainStay MacKay Short Duration High Yield Fund
MainStay MacKay Total Return Bond Fund
MainStay MacKay Unconstrained Bond Fund
Tax-Exempt Income
MainStay MacKay California Tax Free Opportunities Fund4
MainStay MacKay High Yield Municipal Bond Fund
MainStay MacKay Intermediate Tax Free Bond Fund
MainStay MacKay New York Tax Free Opportunities Fund5
MainStay MacKay Short Term Municipal Fund
MainStay MacKay Tax Free Bond Fund
Money Market
MainStay Money Market Fund
Mixed Asset
MainStay Balanced Fund
MainStay Income Builder Fund
MainStay MacKay Convertible Fund
Speciality
MainStay Cushing Energy Income Fund
MainStay Cushing MLP Premier Fund
MainStay Cushing Renaissance Advantage Fund
Asset Allocation
MainStay Conservative Allocation Fund
MainStay Growth Allocation Fund
MainStay Moderate Allocation Fund
MainStay Moderate Growth Allocation Fund
Manager
New York Life Investment Management LLC
New York, New York
Subadvisors
Candriam Belgium S.A.6
Brussels, Belgium
Candriam Luxembourg S.C.A.6
Strassen, Luxembourg
Cushing Asset Management, LP
Dallas, Texas
Epoch Investment Partners, Inc.
New York, New York
MacKay Shields LLC6
New York, New York
Markston International LLC
White Plains, New York
NYL Investors LLC6
New York, New York
Winslow Capital Management, LLC
Minneapolis, Minnesota
Legal Counsel
Dechert LLP
Washington, District of Columbia
Independent Registered Public Accounting Firm
KPMG LLP
Philadelphia, Pennsylvania
| 1. | Formerly known as MainStay Epoch U.S. Small Cap Fund. |
| 2. | Formerly known as MainStay MacKay Emerging Markets Debt Fund. |
| 3. | Effective December 5, 2019, MainStay Indexed Bond Fund was renamed MainStay Short Term Bond Fund. |
| 4. | Class A and Class I shares of this Fund are registered for sale in AZ, CA, MI, NV, OR, TX, UT and WA. Class I shares are registered for sale in CO, FL, GA, HI, ID, MA, MD, NH, NJ and NY. |
| 5. | This Fund is registered for sale in CA, CT, DE, FL, MA, NJ, NY and VT. |
| 6. | An affiliate of New York Life Investment Management LLC. |
Not part of the Annual Report
For more information
800-624-6782
nylinvestments.com/funds
“New York Life Investments” is both a service mark, and the common trade name, of the investment advisors affiliated with New York Life Insurance Company. The MainStay Funds® are managed by New York Life Investment Management LLC and distributed by NYLIFE Distributors LLC, 30 Hudson Street, Jersey City, NJ 07302, a wholly owned subsidiary of New York Life Insurance Company. NYLIFE Distributors LLC is a Member FINRA/SIPC.
©2019 NYLIFE Distributors LLC. All rights reserved.
| | |
| 1716013 MS159-19 | | MSC11-12/19 (NYLIM) NL210 |
MainStay Income Builder Fund
Message from the President and Annual Report
October 31, 2019

Beginning on January 1, 2021, paper copies of each MainStay Fund’s annual and semiannual shareholder reports will no longer be sent by mail, unless you specifically request paper copies of the reports from MainStay Funds or from your financial intermediary. Instead, the reports will be made available on the MainStay Funds’ website. You will be notified by mail and provided with a website address to access the report each time a new report is posted to the website.
If you already elected to receive shareholder reports electronically, you will not be affected by this change and you need not take any action. At any time, you may elect to receive reports and other communications from MainStay Funds electronically by calling toll-free 800-624-6782, by sending an e-mail to MainStayShareholderServices@nylim.com, or by contacting your financial intermediary.
You may elect to receive all future shareholder reports in paper form free of charge. If you hold shares of a MainStay Fund directly, you can inform MainStay Funds that you wish to receive paper copies of reports by calling toll-free 800-624-6782 or by sending an e-mail to MainStayShareholderServices@nylim.com. If you hold shares of a MainStay Fund through a financial intermediary, please contact the financial intermediary to make this election. Your election to receive reports in paper form will apply to all MainStay Funds in which you are invested and may apply to all funds held with your financial intermediary.
| | | | | | | | |
| | | | | |
| Not FDIC/NCUA Insured | | Not a Deposit | | May Lose Value | | No Bank Guarantee | | Not Insured by Any Government Agency |

This page intentionally left blank
Message from the President
Stock and bond markets generally gained ground during the12-month reporting period ended October 31, 2019, despite concerns regarding slowing U.S. and global economic growth and international trade conflicts.
After trending higher in November 2018, U.S. stocks and bonds dipped sharply in December 2018, over concerns regarding the pace of economic growth, a U.S. government shutdown and the potential impact of trade disputes between the United States and other nations, particularly China. U.S. markets recovered quickly in 2019 as trade tensions eased, the government reopened and the U.S. Federal Reserve Board (“Fed”) adopted a more accommodative tone regarding the future direction of interest rates. A wide spectrum of equity and fixed-income sectors gained ground through April 2019. Mixed macroeconomic signals and the inability of China and the United States to reach a trade agreement caused the market’s recovery to suffer during the spring and summer months of 2019. However, accommodative monetary policies from several central banks, including a series of interest rate cuts by the Fed, along with better-than-expected corporate earnings reassured investors and enabled markets to resume their advance.
Persistent, albeit slow, U.S. economic growth underpinned the U.S. stock market’s advance during the reporting period, positioning major U.S. equity indices to reach record territory by late October 2019. Sector strength shifted as investor sentiment alternated betweenrisk-on andrisk-off positions. In general, for the reporting period, cyclical, growth-oriented stocks outperformed their value-oriented counterparts by a small margin, with the information technology sector leading thelarge-cap S&P 500® Index. However, the traditionally more defensive areas of real estate and utilities generated above-average performance as well. Communication services, consumer discretionary, industrials and consumer staples performed in the middle of the pack, while materials, financials and health care lagged. Only the energy sector suffered declines, undermined by weak oil prices and concerns about future energy demand.
In the fixed-income markets, slowing economic growth, modest inflation and the Fed’s interest rate cuts created an environment of falling yields and rising prices for most bonds, with many areas of the market offering historically low yields by the end of the reporting period. Higher-credit-quality, longer-duration securities generally produced strong returns, with investment-
grade corporates and long-term Treasury bonds delivering particularly strong performance. A similar dynamic characterized the performance of the municipal bond market, with longer-term, higher-grade issues performing relatively well. On average, municipal bonds roughly matched the gains of corporate issues while providingtax-advantaged returns for eligible investors.
International stock and bond markets tended to underperform their U.S. counterparts, constrained by lackluster economic growth in the Eurozone and dramatically slowing growth in China and related parts of Asia amid persistent trade tensions with the United States. Uncertainties surrounding the unending Brexit drama took a further toll on investor confidence, with Britain seemingly unable to resolve its internal conflicts over how, or whether, to exit from the European Union. Nevertheless, on average, international securities delivered modestly positive returns, bolstered by the accommodative monetary policies implemented by European and Asian central banks. Bonds from both emerging and developed markets generally produced stronger returns than equities while repeating the pattern of outperformance by higher-quality, longer-term instruments seen in the United States.
As the economic growth cycle lengthens, investors are left to ponder how best to position their portfolios for an uncertain future. When the yield curve inverted earlier this year prompting concerns of a potential recession, we were reminded that the direction of the economy is continually subject to change, and perceptions of the economy can shift even more rapidly. As a MainStay investor, you can rely on us to manage our Funds with unflagging energy and dedication so that you can remain focused on your long-term objectives in the face of uncertainty and change. Our goal remains to provide you with the consistently reliable financial tools you need to achieve your long-term objectives.
Sincerely,

Kirk C. Lehneis
President
The opinions expressed are as of the date of this report and are subject to change. There is no guarantee that any forecast made will come to pass. This material does not constitute investment advice and is not intended as an endorsement of any specific investment. Past performance is no guarantee of future results.
Not part of the Annual Report
Table of Contents
Investors should refer to the Fund’s Summary Prospectus and/or Prospectus and consider the Fund’s investment objectives, strategies, risks, charges and expenses carefully before investing. The Summary Prospectus and/or Prospectus contain this and other information about the Fund. You may obtain copies of the Fund’s Summary Prospectus, Prospectus and Statement of Additional Information free of charge, upon request, by calling toll-free 800-624-6782, by writing to NYLIFE Distributors LLC, Attn: MainStay Marketing Department, 30 Hudson Street, Jersey City, NJ 07302 or by sending ane-mail to MainStayShareholderServices@nylim.com. These documents are also available via the MainStay Funds’ website at nylinvestments.com/funds. Please read the Summary Prospectus and/or Prospectus carefully before investing.
Investment and Performance Comparison1(Unaudited)
Performance data quoted represents past performance. Past performance is no guarantee of future results. Because of market volatility and other factors, current performance may be lower or higher than the figures shown. Investment return and principal value will fluctuate, and as a result, when shares are redeemed, they may be worth more or less than their original cost. The graph below depicts the historical performance of Class B shares2 of the Fund. Performance will vary from class to class based on differences in class-specific expenses and sales charges. For performance information current to the most recent month-end, please call 800-624-6782 or visit nylinvestments.com/funds.
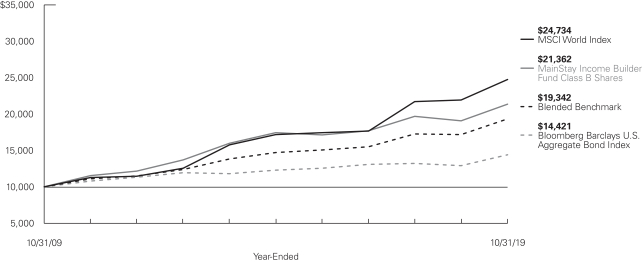
Average Annual Total Returns for the Year-Ended October 31, 2019
| | | | | | | | | | | | | | | | | | | | | | | | |
| Class | | Sales Charge | | | | Inception Date | | | One
Year | | | Five Years
or Since
Inception | | | Ten
Years | | | Gross
Expense
Ratio3 | |
| | | | | | | |
| Class A Shares | | Maximum 5.5% Initial Sales Charge | | With sales charges
Excluding sales charges | | | 1/3/1995 | | |
| 6.87
13.09 | %
| |
| 3.88
5.06 | %
| |
| 8.32
8.93 | %
| |
| 1.01
1.01 | %
|
| Investor Class Shares | | Maximum 5.5% Initial Sales Charge | | With sales charges
Excluding sales charges | | | 2/28/2008 | | |
| 6.76
12.98 |
| |
| 3.73
4.91 |
| |
| 8.08
8.70 |
| |
| 1.14
1.14 |
|
| Class B Shares2 | | Maximum 5% CDSC
if Redeemed Within the First Six Years of Purchase | | With sales charges Excluding sales charges | | | 12/29/1987 | | |
| 7.11
12.11 |
| |
| 3.80
4.14 |
| |
| 7.89
7.89 |
| |
| 1.89
1.89 |
|
| Class C Shares | | Maximum 1% CDSC
if Redeemed Within One Year of Purchase | | With sales charges
Excluding sales charges | | | 9/1/1998 | | |
| 11.13
12.13 |
| |
| 4.13
4.13 |
| |
| 7.89
7.89 |
| |
| 1.89
1.89 |
|
| Class I Shares | | No Sales Charge | | | | | 1/2/2004 | | | | 13.41 | | | | 5.33 | | | | 9.21 | | | | 0.76 | |
| Class R2 Shares | | No Sales Charge | | | | | 2/27/2015 | | | | 12.98 | | | | 4.62 | | | | N/A | | | | 1.11 | |
| Class R3 Shares | | No Sales Charge | | | | | 2/29/2016 | | | | 12.70 | | | | 8.35 | | | | N/A | | | | 1.36 | |
| Class R6 Shares | | No Sales Charge | | | | | 2/28/2018 | | | | 13.52 | | | | 7.49 | | | | N/A | | | | 0.66 | |
| 1. | The performance table and graph do not reflect the deduction of taxes that a shareholder would pay on distributions or Fund share redemptions. Total returns reflect maximum applicable sales charges as indicated in the table above, if any, changes in share price, and reinvestment of dividend and capital gain distributions. The graph assumes the initial investment amount shown above and reflects the deduction of all sales charges that would have applied for the period of investment. Performance figures may reflect certain fee waivers and/or expense limitations, without which total returns may have |
| | been lower. For more information on share classes and current fee waivers and/or expense limitations (if any), please refer to the Notes to Financial Statements. |
| 2. | Class B shares are closed to all new purchases as well as additional investments by existing Class B shareholders. |
| 3. | The gross expense ratios presented reflect the Fund’s “Total Annual Fund Operating Expenses” from the most recent Prospectus and may differ from other expense ratios disclosed in this report. |
The footnotes on the next page are an integral part of the table and graph and should be carefully read in conjunction with them.
| | | | | | | | | | | | |
| Benchmark Performance | | One
Year | | | Five
Years | | | Ten
Years | |
| | | |
MSCI World Index4 | | | 12.69 | % | | | 7.58 | % | | | 9.48 | % |
Bloomberg Barclays U.S. Aggregate Bond Index5 | | | 11.51 | | | | 3.24 | | | | 3.73 | |
Blended Benchmark Index6 | | | 12.49 | | | | 5.59 | | | | 6.82 | |
Morningstar World Allocation Category Average7 | | | 8.54 | | | | 3.56 | | | | 6.17 | |
| 4. | The MSCI World Index is the Fund’s primarybroad-based securities market index for comparison purposes. The MSCI World Index is a free float-adjusted market capitalization weighted index that is designed to measure the equity market performance of developed markets. Results assume reinvestment of all dividends and capital gains. An investment cannot be made directly in an index. |
| 5. | The Fund has selected the Bloomberg Barclays U.S. Aggregate Bond Index as a secondary benchmark. The Bloomberg Barclays U.S. Aggregate Bond Index is a broad-based benchmark that measures the investment grade, U.S. dollar-denominated, fixed-rate taxable bond market, including Treasurys, government-related and corporate securities, mortgage-backed securities (agency fixed-rate and hybrid adjustable rate mortgage pass-throughs), asset-backed securities, and commercial mortgage-backed securities. Results assume reinvestment of all dividends and capital gains. An investment cannot be made directly in an index. |
| 6. | The Fund has selected the Blended Benchmark Index as an additional benchmark. The Blended Benchmark Index consists of the MSCI World Index and the Bloomberg Barclays U.S. Aggregate Bond Index weighted 50%/50%, respectively. Results assume reinvestment of all dividends and capital gains. An investment cannot be made directly in an index. |
| 7. | The Morningstar World Allocation Category Average is representative of funds that seek to provide both capital appreciation and income by investing in three major areas: stocks, bonds, and cash. While these portfolios do explore the whole world, most of them focus on the U.S., Canada, Japan, and the larger markets in Europe. It is rare for such portfolios to invest more than 10% of their assets in emerging markets. These portfolios typically have at least 10% of assets in bonds, less than 70% of assets in stocks, and at least 40% of assets in non-U.S. stocks or bonds. Results are based on average total returns of similar funds with all dividends and capital gain distributions reinvested. |
The footnotes on the preceding page are an integral part of the table and graph and should be carefully read in conjunction with them.
| | |
| 6 | | MainStay Income Builder Fund |
Cost in Dollars of a $1,000 Investment in MainStay Income Builder Fund (Unaudited)
The example below is intended to describe the fees and expenses borne by shareholders during the six-month period from May 1, 2019, to October 31, 2019, and the impact of those costs on your investment.
Example
As a shareholder of the Fund you incur two types of costs: (1) transaction costs, including exchange fees and sales charges (loads) on purchases (as applicable), and (2) ongoing costs, including management fees, distribution and/or service (12b-1) fees, and other Fund expenses (as applicable). This example is intended to help you understand your ongoing costs (in dollars) of investing in the Fund and to compare these costs with the ongoing costs of investing in other mutual funds. The example is based on an investment of $1,000 made at the beginning of the six-month period and held for the entire period from May 1, 2019, to October 31, 2019.
This example illustrates your Fund’s ongoing costs in two ways:
Actual Expenses
The second and third data columns in the table below provide information about actual account values and actual expenses. You may use the information in these columns, together with the amount you invested, to estimate the expenses that you paid during the six months ended October 31, 2019. Simply divide your account value by $1,000 (for example, an $8,600 account value divided by $1,000 = 8.6), then
multiply the result by the number under the heading entitled “Expenses Paid During Period” to estimate the expenses you paid on your account during this period.
Hypothetical Example for Comparison Purposes
The fourth and fifth data columns in the table below provide information about hypothetical account values and hypothetical expenses based on the Fund’s actual expense ratio and an assumed rate of return of 5% per year before expenses, which is not the Fund’s actual return. The hypothetical account values and expenses may not be used to estimate the actual ending account balances or expenses you paid for thesix-month period shown. You may use this information to compare the ongoing costs of investing in the Fund with the ongoing costs of investing in other mutual funds. To do so, compare this 5% hypothetical example with the 5% hypothetical examples that appear in the shareholder reports of the other mutual funds.
Please note that the expenses shown in the table are meant to highlight your ongoing costs only and do not reflect any transactional costs, such as exchange fees or sales charges (loads). Therefore, the fourth and fifth data columns of the table are useful in comparing ongoing costs only and will not help you determine the relative total costs of owning different funds. In addition, if these transactional costs were included, your costs would have been higher.
| | | | | | | | | | | | | | | | | | | | | | |
| | | | | | | | | | | | | | | | | | |
| Share Class | | Beginning
Account
Value
5/1/19 | | | Ending Account
Value (Based
on Actual
Returns and
Expenses)
10/31/19 | | | Expenses
Paid
During
Period1 | | | Ending Account
Value (Based
on Hypothetical
5% Annualized
Return and
Actual Expenses)
10/31/19 | | | Expenses
Paid
During
Period1 | | | Net Expense
Ratio
During
Period2 |
| | | | | | |
| Class A Shares | | $ | 1,000.00 | | | $ | 1,054.10 | | | $ | 5.23 | | | $ | 1,020.11 | | | $ | 5.14 | | | 1.01% |
| | | | | | |
| Investor Class Shares | | $ | 1,000.00 | | | $ | 1,053.40 | | | $ | 5.95 | | | $ | 1,019.41 | | | $ | 5.85 | | | 1.15% |
| | | | | | |
| Class B Shares | | $ | 1,000.00 | | | $ | 1,049.60 | | | $ | 9.82 | | | $ | 1,015.63 | | | $ | 9.65 | | | 1.90% |
| | | | | | |
| Class C Shares | | $ | 1,000.00 | | | $ | 1,049.70 | | | $ | 9.82 | | | $ | 1,015.63 | | | $ | 9.65 | | | 1.90% |
| | | | | | |
| Class I Shares | | $ | 1,000.00 | | | $ | 1,055.50 | | | $ | 3.94 | | | $ | 1,021.37 | | | $ | 3.87 | | | 0.76% |
| | | | | | |
| Class R2 Shares | | $ | 1,000.00 | | | $ | 1,053.60 | | | $ | 5.75 | | | $ | 1,019.61 | | | $ | 5.65 | | | 1.11% |
| | | | | | |
| Class R3 Shares | | $ | 1,000.00 | | | $ | 1,051.80 | | | $ | 7.03 | | | $ | 1,018.35 | | | $ | 6.92 | | | 1.36% |
| | | | | | |
| Class R6 Shares | | $ | 1,000.00 | | | $ | 1,055.90 | | | $ | 3.47 | | | $ | 1,021.83 | | | $ | 3.41 | | | 0.67% |
| 1. | Expenses are equal to the Fund’s annualized expense ratio of each class multiplied by the average account value over the period, divided by 365 and multiplied by 184 (to reflect the six-month period). The table above represents the actual expenses incurred during the six-month period. In addition to the fees and expenses which the Fund bears directly, it also indirectly bears a pro rata share of the fees and expenses of the underlying funds in which it invests. Such indirect expenses are not included in the above-reported expense figures. |
| 2. | Expenses are equal to the Fund’s annualized expense ratio to reflect the six-month period. |
Portfolio Composition as of October 31, 2019(Unaudited)
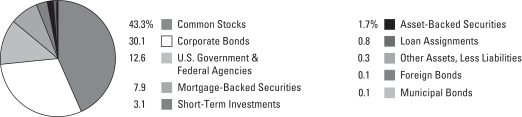
See Portfolio of Investments beginning on page 13 for specific holdings within these categories. The Fund’s holdings are subject to change.
Top Ten Holdings or Issuers Held as of October 31, 2019(excludingshort-term investments) (Unaudited)
| 1. | Federal National Mortgage Association, 2.50%–5.00%, due 9/1/33–4/1/49 |
| 2. | United States Treasury Bonds, 2.875%–4.50%, due 5/15/38–5/15/49 |
| 3. | Federal Home Loan Mortgage Corporation, 3.50%–5.00%, due 12/1/44–3/1/49 |
| 4. | Government National Mortgage Association, 2.50%–3.25%, due 1/16/40–6/20/49 |
| 5. | Federal Home Loan Mortgage Corporation, 2.50%–3.50%, due 5/25/29–10/25/49 |
| 6. | Bank of America Corp., 2.738%–8.57%, due 1/23/22–12/29/49 |
| 7. | Morgan Stanley, 3.125%–7.25%, due 11/1/22–12/31/49 |
| 8. | Federal National Mortgage Association, 3.00%–3.50%, due 7/25/43–10/25/49 |
| 9. | Verizon Communications, Inc. |
| 10. | United States Treasury Inflation—Indexed Notes, 0.75%–0.875%, due 7/15/28–1/15/29 |
| | |
| 8 | | MainStay Income Builder Fund |
Portfolio Management Discussion and Analysis(Unaudited)
Questions answered by portfolio managers Jae S. Yoon and Jonathan Swaney of New York Life Investment Management LLC, the Fund’s Manager; Dan Roberts, PhD,1 Stephen R. Cianci, CFA, and Neil Moriarty, III, of MacKay Shields LLC, the Subadvisor for the fixed-income portion of the Fund; and William W. Priest, CFA, Michael A. Welhoelter, CFA, John Tobin, PhD, CFA, and Kera Van Valen, CFA, of Epoch Investment Partners, Inc., the Subadvisor for the equity portion of the Fund.
How did MainStay Income Builder Fund perform relative to its benchmarks and peer group during the 12 months ended October 31, 2019?
For the 12 months ended October 31, 2019, Class I shares of MainStay Income Builder Fund returned 13.41%, outperforming the 12.69% return of the Fund’s primary benchmark, the MSCI World Index. Over the same period, Class I shares also outperformed the 11.51% return of the Bloomberg Barclays U.S. Aggregate Bond Index, which is the Fund’s secondary benchmark, and the 12.49% return of the Blended Benchmark Index, which is an additional benchmark of the Fund. For the 12 months ended October 31, 2019, Class I shares of the Fund outperformed the 8.54% return of the Morningstar World Allocation Category Average.2
Were there any changes to the Fund during the reporting period?
Effective December 31, 2018, Louis Cohen no longer served as a portfolio manager of the fixed-income portion of the Fund. Dan Roberts,1 Stephen Cianci and Neil Moriarty continue to manage the fixed-income portion of the Fund. For more information about this change refer to the supplement dated October 18, 2018.
Effective September 23, 2019, the Fund’s asset allocation investment process was revised to indicate that the Fund’s asset allocation decisions are made by a committee chaired by the Fund’s manager, New York Life Investment Management, in collaboration with the subadvisor for the Fund’s fixed-income portion, MacKay Shields.
During the reporting period, how was the Fund’s performance materially affected by investments in derivatives?
During the reporting period, the fixed-income portion of the Fund used equity futures to increase the Fund’s equity beta.3 This position enhanced the Fund’s returns. Over the same period, the fixed-income portion of the Fund used currency forwards to hedge currency exposure and U.S. Treasury futures to manage duration, both of which also positively affected the Fund’s performance.
What factors affected the relative performance of the equity portion of the Fund during the reporting period?
The equity portion of the Fund outperformed the MSCI World Index largely due to strong stock selection in the energy, finan-
cials and utilities sectors. An overweight in the utilities sector also helped drive relative performance as investors favored more defensive sectors in an environment characterized by spikes in volatility as well as economic and political uncertainty.
During the reporting period, the Fund’s equity investment strategy provided consistent income and downside protection during market sell-offs, while also participating in up markets.
During the reporting period, which sectors and countries were the strongest positive contributors to the relative performance of the equity portion of the Fund and which sectors and countries were particularly weak?
During the reporting period, the strongest positive sector contributions to the performance of the equity portion of the Fund relative to the MSCI World Index came from utilities and financials. (Contributions take weightings and total returns into account.) Overweight exposure to the utilities sector, together with good individual stock selection in the sector, were among the largest positive contributors to relative performance. Within utilities, overweight sector exposure and good individual stock selection both bolstered relative performance returns. In particular, the Fund focused on more regulated utilities where an aging infrastructure, the emergence of renewables, the shale revolution and digitization have driven growth in rate bases, earnings and cash flows. The financials sector also contributed significantly to relative performance, largely due to the Fund’s holdings of strongly appreciating insurance company stocks. Stock selection in the energy sector further enhanced relative performance, more than offsetting the detraction from the Fund’s overweight position in the lagging energy sector. The pressure on energy companies was driven by oil price declines over the reporting period and deteriorating trade negotiations that led to investor concern about global oil demand. During the same period, the most notable detractor from the Fund’s relative performance was stock selection in the consumer staples sector, primarily due to tobacco exposure.
From a country perspective, the Fund’s relative performance benefited most from stock selection in Germany, Italy and the United States, as well as underweight exposure to Japanese equities and overweight exposure to Italian equities. Conversely, the Fund’s stock selection and allocation in the United Kingdom detracted from relative performance, as did stock selection among French equities.
| 1. | Dan Roberts will serve as a portfolio manager of the Fund until January 1, 2020. |
| 2. | See page 5 for other share class returns, which may be higher or lower than Class I share returns. See page 6 for more information on benchmark and peer group returns. |
| 3. | Beta is a measure of volatility in relation to the market as a whole. A beta higher than 1 indicates that a security or portfolio will tend to exhibit higher volatility than the market. A beta lower than 1 indicates that a security or portfolio will tend to exhibit lower volatility than the market. |
During the reporting period, which individual stocks made the strongest positive contributions to absolute performance in the equity portion of the Fund and which stocks detracted the most?
Two of the largest contributors to the Fund’s absolute performance were Entergy and Munich Reinsurance. Entergy provides regulated electricity and natural gas services to customers in the states of Arkansas, Louisiana, Alabama and Texas. As investors gained confidence in the company’s exit from its unregulated merchant power generation businesses, its shares outperformed along with those of its regulated utility peers, buoyed by an environment of increasing market volatility and declining interest rates. Global financial services company Munich Re engages in reinsurance and primary insurance across both life and property & casualty market segments. Shares trended higher, reflecting a better pricing environment for reinsurers during renewals earlier in 2019, as well as general market optimism on a strengthening pricing outlook for reinsurers. As a result, the company’s earnings proved resilient in the face of elevated loss claims; the company recently raised its full-year 2019 earnings estimates, increased the annual dividend and announced a new share repurchase program. A rise in benchmark interest rates in September 2019 provided further lift to the company’s shares as improving yield curves4 relieved pressure on insurance companies to generate positive investment income on rate-sensitive products.
The most significant detractors from the Fund’s absolute performance included Kraft Heinz and Occidental Petroleum. Shares in Kraft Heinz, a North American packaged food and beverage company, were pressured following disappointing financial results and an abrupt change in capital allocation policy. When they took a larger write-down on two key brands and abruptly reduced the company’s dividend to strengthen the balance sheet for further industry consolidation, we exited the position. Global oil and gas producer Occidental Petroleum owns midstream, marketing and chemical assets that provide diversification in cash flow. The company’s shares underperformed as the company completed its acquisition of Anadarko Petroleum at a time when deteriorating trade negotiations heightened investor concerns regarding global oil demand and falling oil and gas prices. However, we continue to believe the company’s long-term growth will be driven by improving operating efficiency, leveraging an advantageous position in the Permian Basin and growing high-margin production.
What were some of the largest purchases and sales in the equity portion of the Fund during the reporting period?
During the reporting period, the equity portion of the Fund initiated new positions in CenterPoint Energy and Darden Restaurants. CenterPoint Energy is largely a regulated utility company that delivers electric transmission, distribution and power generation services to customers in the Houston metropolitan area and Indiana, and provides natural gas distribution services to customers in eight Midwest and Southern states. Cash flow growth is driven by high single-digit regulated rate base growth, with incremental contributions fromnon-utility operations. The company returns cash to shareholders through an attractive and growing dividend. Darden Restaurants is a full-service, casual dining restaurant company with eight brands and more than 1,700 owned and operated restaurants in the United States. Cash flows are sustained by the company’s leading brands, significant scale, strong balance sheet and ability to manage growth-related capital expenditures for new restaurants, among other factors. Cash flow growth drivers include same restaurant sales growth, net new restaurant growth and margin expansion from operating leverage and disciplined cost management. Darden returns cash to shareholders through an attractive and growing dividend, with a high earnings payout target and regular share repurchases.
Positions closed during the reporting period included Kraft Heinz, Vodafone and Arthur J. Gallagher (Gallagher). U.K.-based Vodafone provides telecommunication services in Europe, Asia and Africa. In May 2019, management reduced Vodafone’s full-year dividend citing a need for greater flexibility in assessing capital spending in the face of increased competitive dynamics in Italy, Spain and South Africa, and increased spectrum costs. As a result of the company’s change in capital allocation priorities, the Fund exited its position. Gallagher provides insurance brokerage, risk management, insurance claims management, employee-benefit consulting and related services to clients globally. Shares trended higher during the reporting period as the company continued to experience organic growth driven by an expanding global market for risk cover and risk analysis, as well as inorganic growth from ongoingbolt-on acquisitions. Although Gallagher instituted regular dividend increases, share price appreciation compressed the dividend yield, leading us to sell the Fund’s position in favor of higher-yielding alternatives.
How did sector and country weightings change in the equity portion of the Fund during the reporting period?
During the reporting period, the most substantial sector weighting increases in the equity portion of the Fund were in
| 4. | The yield curve is a line that plots the yields of various securities of similar quality—typically U.S. Treasury issues—across a range of maturities. The U.S. Treasury yield curve serves as a benchmark for other debt and is used in economic forecasting. |
| | |
| 10 | | MainStay Income Builder Fund |
consumer discretionary and industrials, while the most substantial sector weighting reduction was in communication services. Over the same period, the most substantial country weighting increases in the equity portion of the Fund were in the United States and Japan, while the most notable reduction was in the United Kingdom.
How was the equity portion of the Fund positioned at the end of the reporting period?
At the end of the reporting period, the largest sectors within the equity portion of the Fund were financials and utilities, while the smallest sectors were materials and real estate. Relative to the MSCI World Index, the Fund’s most significantly overweight sector exposure was in utilities, a defensive sector that is typically more heavily represented in the Fund. As of the same date, the Fund’s most significantly underweight exposures were in the information technology and consumer discretionary sectors.
What factors affected the relative performance of the fixed-income portion of the Fund during the reporting period?
The reporting period got off to a tumultuous start, in large part due to a variety of political and economic developments, including, but not limited to, fears of weaker growth in China, Japan and the European Union; restrictive U.S. Federal Reserve (Fed) policy; the U.S. administration’s public criticism of the Fed; trade wars with China; and the uncertainty surrounding the U.K.’s Brexit negotiations to separate from the European Union.
At the beginning of 2019, the Fed reversed course on their rate policy and announced that the Fed funds benchmark rate had risen to a level consistent with its policy objectives. The market focused on the fact that not only was the Fed no longer tightening monetary policy, but might very well reverse course and begin to cut rates. Indeed, over the ensuing months, the Fed cut rates three times. In an unusual set of circumstances, both Treasury securities and stocks rallied on the Fed’s pause and eventual loosening stance, reflecting cautious optimism regarding the durability of the current business cycle. Swayed by similar effects, corporate bond spreads5 tightened during the reporting period, as did spreads of credit-related securitized6 product (asset-backed and commercial mortgage-backed securities).
For the12-month period ending October 31, 2019 the fixed-income portion of The Fund produced solid relative returns,
performing in line with the Bloomberg Barclays U.S. Aggregate Bond Index. The Fund’s overweight to credit (investment grade and high yield), had a positive impact on relative performance, which was balanced by the negative impact of the Fund’s underweight to Treasury securities.
What was the Fund’s duration7 strategy during the reporting period?
During the reporting period, the Fund’s duration strategy was to keep duration neutral relative to the Bloomberg Barclays U.S. Aggregate Bond Index. As of October 31, 2019, the Fund’s duration was 5.9 years versus 5.8 years for the benchmark.
During the reporting period, which sectors were the strongest positive contributors to relative performance of the fixed-income portion of the Fund and which sectors were particularly weak?
Spread product, specifically investment-grade credit, high-yield and emerging-market debt, performed well during the reporting period and contributed positively to the relative performance of the fixed-income portion of the Fund relative to the Bloomberg Barclays U.S. Aggregate Bond Index. Emerging markets benefited from renewed risk appetites sparked by dovish central banks. Securitized assets, including residential mortgage-backed securities (RMBS) and consumer-related asset-backed securities (ABS), though positive for the reporting period, lagged the return of the benchmark. These securities are generally higher rated and shorter duration in nature.
What were some of the largest purchases and sales in the fixed-income portion of the Fund during the reporting period?
In general terms, as credit spreads narrowed during the reporting period and the compensation for risk compressed, we reduced the exposure of the fixed-income portion of the Fund to credit in the form of high-yield bonds and bank loans. At the same time, we methodically added securitized assets—such as ABS, RMBS and commercial mortgage-backed securities (CMBS)—into the fixed-income portion of the Fund, both to reduce volatility and for diversification purposes.
| 5. | The terms “spread” and “yield spread” may refer to the difference in yield between a security or type of security and comparable U.S. Treasury issues. The terms may also refer to the difference in yield between two specific securities or types of securities at a given time. |
| 6. | A securitization is a financial instrument created by an issuer by combining a pool of financial assets (such as mortgages). The financial instrument is then marketed to investors, sometimes in tiers. |
| 7. | Duration is a measure of the price sensitivity of a fixed-income investment to changes in interest rates. Duration is expressed as a number of years and is considered a more accurate sensitivity gauge than average maturity. |
How did the sector weightings in the fixed-income portion of the Fund change during the reporting period?
During the reporting period, the fixed-income portion of the Fund increased its exposure to securitized assets, such as RMBS, ABS and CMBS. At the same time, we trimmed exposure to both high-yield bonds and bank loans, thereby improving liquidity and the overall credit quality of the Fund as spreads tightened.
How was the fixed-income portion of the Fund positioned at the end of the reporting period?
Relative to the Bloomberg Barclays U.S. Aggregate Bond Index, the fixed-income portion of the Fund finished the reporting period with overweight exposure to investment grade corporate bonds and high-yield bonds, and underweight exposure to U.S. Treasury securities.
The opinions expressed are those of the portfolio managers as of the date of this report and are subject to change. There is no guarantee that any forecasts will come to pass. This material does not constitute investment advice and is not intended as an endorsement of any specific investment.
| | |
| 12 | | MainStay Income Builder Fund |
Portfolio of InvestmentsOctober 31, 2019
| | | | | | | | |
| | | Principal
Amount | | | Value | |
Long-Term Bonds 53.3%† Asset-Backed Securities 1.7% | |
Auto Floor Plan Asset-Backed Securities 0.4% | |
Ford Credit Floorplan Master Owner Trust
Series 2018-4, Class A
4.06%, due 11/15/30 | | $ | 2,395,000 | | | $ | 2,658,998 | |
Navistar Financial Dealer Note Master Owner Trust II
Series 2018-1, Class A
2.453% (1 Month LIBOR + 0.63%), due 9/25/23 (a)(b) | | | 2,895,000 | | | | 2,897,689 | |
| | | | | | | | |
| | | | | | | 5,556,687 | |
| | | | | | | | |
Automobile Asset-Backed Securities 0.5% | |
Santander Retail Auto Lease Trust
Series 2019-B, Class A3
2.30%, due 1/20/23 (a) | | | 1,725,000 | | | | 1,736,961 | |
Toyota Auto Loan Extended Note Trust
Series 2019-1A, Class A
2.56%, due 11/25/31 (a) | | | 1,925,000 | | | | 1,970,795 | |
Volkswagen Auto Lease Trust
Series 2019-A, Class A3
1.99%, due 11/21/22 | | | 2,480,000 | | | | 2,480,926 | |
World Omni Auto Receivables Trust
Series 2019-A, Class A3
3.04%, due 5/15/24 | | | 1,695,000 | | | | 1,730,505 | |
| | | | | | | | |
| | | | | | | 7,919,187 | |
| | | | | | | | |
Credit Cards 0.2% | |
Capital One Multi-Asset Execution Trust
Series 2019-A3, Class A3
2.06%, due 8/15/28 | | | 1,740,000 | | | | 1,732,172 | |
Discover Card Execution Note Trust
Series 2019-A1, Class A1
3.04%, due 7/15/24 | | | 1,745,000 | | | | 1,789,888 | |
| | | | | | | | |
| | | | | | | 3,522,060 | |
| | | | | | | | |
Home Equity 0.1% | |
Chase Funding Trust
Series 2002-2, Class 1A5
6.333%, due 4/25/32 (c) | | | 59,160 | | | | 60,196 | |
Countrywide Asset-Backed Certificates
Series 2003-5, Class AF5
5.119%, due 2/25/34 (c) | | | 369,925 | | | | 370,178 | |
Equity One MortgagePass-Through Trust
Series 2003-3, Class AF4
5.495%, due 12/25/33 (c) | | | 126,238 | | | | 127,362 | |
JPMorgan Mortgage Acquisition Trust
Series 2007-HE1, Class AF1
1.923% (1 Month LIBOR + 0.10%), due 3/25/47 (b) | | | 397,424 | | | | 276,490 | |
| | | | | | | | |
| | | Principal
Amount | | | Value | |
Home Equity (continued) | | | | | | | | |
MASTR Asset-Backed Securities Trust
Series 2006-HE4, Class A1
1.873% (1 Month LIBOR + 0.05%), due 11/25/36 (b) | | $ | 587,288 | | | $ | 269,142 | |
| | | | | | | | |
| | | | | | | 1,103,368 | |
| | | | | | | | |
Other Asset-Backed Securities 0.5% | |
American Tower Trust I
Series 2013, Class 2A
3.07%, due 3/15/48 (a) | | | 2,160,000 | | | | 2,186,973 | |
DLL Securitization Trust
Series 2019-MT3, Class A3
2.08%, due 2/21/23 (a) | | | 2,850,000 | | | | 2,849,147 | |
MVW Owner Trust
Series 2019-2A, Class A
2.22%, due 10/20/38 (a) | | | 2,280,000 | | | | 2,278,221 | |
| | | | | | | | |
| | | | | | | 7,314,341 | |
| | | | | | | | |
Student Loans 0.0%‡ | |
KeyCorp Student Loan Trust
Series 2000-A, Class A2
2.452% (3 Month LIBOR + 0.32%), due 5/25/29 (b) | | | 108,046 | | | | 107,585 | |
| | | | | | | | |
Total Asset-Backed Securities
(Cost $25,272,728) | | | | | | | 25,523,228 | |
| | | | | | | | |
|
| Corporate Bonds 30.1% | |
Aerospace & Defense 0.2% | |
L3Harris Technologies, Inc.
4.40%, due 6/15/28 | | | 2,215,000 | | | | 2,488,533 | |
| | | | | | | | |
|
Agriculture 0.3% | |
Altria Group, Inc.
3.80%, due 2/14/24 | | | 3,260,000 | | | | 3,420,205 | |
JBS Investments II GmbH
7.00%, due 1/15/26 (Austria) (a) | | | 1,170,000 | | | | 1,268,280 | |
| | | | | | | | |
| | | | | | | 4,688,485 | |
| | | | | | | | |
Airlines 0.8% | |
American Airlines Group, Inc.
4.625%, due 3/1/20 (a) | | | 3,700,000 | | | | 3,718,500 | |
American Airlines, Inc. | | | | | | | | |
Series 2016-2, Class AA, Pass Through Trust
3.20%, due 12/15/29 | | | 596,360 | | | | 616,392 | |
Series 2015-2, Class AA, Pass Through Trust
3.60%, due 3/22/29 | | | 834,235 | | | | 881,591 | |
Series 2016-2, Class AA, Pass Through Trust
3.65%, due 12/15/29 | | | 210,480 | | | | 220,617 | |
| | | | | | |
The notes to the financial statements are an integral part of,
and should be read in conjunction with, the financial statements. | | | | | 13 | |
Portfolio of InvestmentsOctober 31, 2019 (continued)
| | | | | | | | |
| | | Principal
Amount | | | Value | |
| Corporate Bonds (continued) | | | | | |
Airlines (continued) | | | | | | | | |
Continental Airlines, Inc.
Series 2009-2, Class 2, Pass Through Trust
7.25%, due 5/10/21 | | $ | 1,266,117 | | | $ | 1,267,442 | |
Delta Air Lines, Inc.
Series 2019-1, Class AA
3.204%, due 10/25/25 | | | 2,355,000 | | | | 2,463,339 | |
U.S. Airways Group, Inc. | | | | | | | | |
Series 2012-1, Class A
5.90%, due 4/1/26 | | | 1,436,227 | | | | 1,607,945 | |
Series 2010-1, Class A
6.25%, due 10/22/24 | | | 676,871 | | | | 740,736 | |
United Airlines, Inc.
Series 2007-1, Pass Through Trust
6.636%, due 1/2/24 | | | 1,262,752 | | | | 1,337,635 | |
| | | | | | | | |
| | | | | | | 12,854,197 | |
| | | | | | | | |
Auto Manufacturers 0.8% | |
Daimler Finance North America LLC
2.453% (3 Month LIBOR + 0.55%), due 5/4/21 (Germany) (a)(b) | | | 2,400,000 | | | | 2,400,645 | |
Ford Motor Credit Co. LLC | | | | | | | | |
3.35%, due 11/1/22 | | | 820,000 | | | | 822,444 | |
4.063%, due 11/1/24 | | | 1,935,000 | | | | 1,941,617 | |
4.25%, due 9/20/22 | | | 655,000 | | | | 673,647 | |
5.875%, due 8/2/21 | | | 350,000 | | | | 367,191 | |
General Motors Financial Co., Inc. | | | | | | | | |
3.15%, due 6/30/22 | | | 900,000 | | | | 914,033 | |
3.20%, due 7/13/20 | | | 1,800,000 | | | | 1,811,253 | |
3.45%, due 4/10/22 | | | 3,800,000 | | | | 3,873,424 | |
| | | | | | | | |
| | | | | | | 12,804,254 | |
| | | | | | | | |
Banks 7.4% | |
Bank of America Corp. | | | | | | | | |
2.738%, due 1/23/22 (d) | | | 3,260,000 | | | | 3,285,424 | |
3.004%, due 12/20/23 (d) | | | 1,794,000 | | | | 1,835,134 | |
3.194%, due 7/23/30 (d) | | | 1,425,000 | | | | 1,471,482 | |
3.458%, due 3/15/25 (d) | | | 1,700,000 | | | | 1,776,211 | |
3.499%, due 5/17/22 (d) | | | 4,490,000 | | | | 4,584,502 | |
3.50%, due 4/19/26 | | | 415,000 | | | | 441,277 | |
4.20%, due 8/26/24 | | | 2,615,000 | | | | 2,815,404 | |
6.30%, due 12/29/49 (d)(e) | | | 2,085,000 | | | | 2,370,728 | |
8.57%, due 11/15/24 | | | 485,000 | | | | 612,073 | |
Barclays Bank PLC (United Kingdom)
5.14%, due 10/14/20 | | | 785,000 | | | | 805,363 | |
Branch Banking & Trust Co.
2.636% (5 Year Treasury Constant Maturity Rate + 1.15%), due 9/17/29 (b) | | | 1,900,000 | | | | 1,895,015 | |
Citibank N.A. | | | | | | | | |
2.125%, due 10/20/20 | | | 4,590,000 | | | | 4,599,874 | |
3.40%, due 7/23/21 | | | 3,585,000 | | | | 3,675,146 | |
| | | | | | | | |
| | | Principal
Amount | | | Value | |
Banks (continued) | | | | | | | | |
Citigroup, Inc. | | | | | | | | |
3.352%, due 4/24/25 (d) | | $ | 2,565,000 | | | $ | 2,668,522 | |
3.668%, due 7/24/28 (d) | | | 1,180,000 | | | | 1,248,537 | |
3.98%, due 3/20/30 (d) | | | 2,370,000 | | | | 2,583,545 | |
4.05%, due 7/30/22 | | | 105,000 | | | | 110,183 | |
5.30%, due 5/6/44 | | | 1,200,000 | | | | 1,507,848 | |
6.625%, due 6/15/32 | | | 770,000 | | | | 1,023,687 | |
6.875%, due 6/1/25 | | | 1,715,000 | | | | 2,074,637 | |
Citizens Financial Group, Inc.
4.30%, due 12/3/25 | | | 3,405,000 | | | | 3,670,741 | |
Credit Suisse Group A.G.
2.593%, due 9/11/25 (Switzerland) (a)(d) | | | 900,000 | | | | 896,892 | |
Goldman Sachs Group, Inc. | | | | | | | | |
2.905%, due 7/24/23 (d) | | | 880,000 | | | | 893,493 | |
2.908%, due 6/5/23 (d) | | | 800,000 | | | | 813,265 | |
3.328% (3 Month LIBOR + 1.17%), due 5/15/26 (b) | | | 2,245,000 | | | | 2,272,007 | |
3.50%, due 11/16/26 | | | 1,085,000 | | | | 1,130,438 | |
5.25%, due 7/27/21 | | | 805,000 | | | | 848,582 | |
6.75%, due 10/1/37 | | | 829,000 | | | | 1,128,001 | |
HSBC Holdings PLC
3.973%, due 5/22/30 (United Kingdom) (d) | | | 1,190,000 | | | | 1,284,949 | |
Huntington Bancshares, Inc.
3.15%, due 3/14/21 | | | 3,535,000 | | | | 3,586,142 | |
JPMorgan Chase & Co. (d) | | | | | | | | |
3.207%, due 4/1/23 | | | 3,915,000 | | | | 4,009,104 | |
3.54%, due 5/1/28 | | | 2,970,000 | | | | 3,148,355 | |
Lloyds Banking Group PLC (United Kingdom) | | | | | | | | |
4.582%, due 12/10/25 | | | 1,633,000 | | | | 1,753,997 | |
4.65%, due 3/24/26 | | | 3,090,000 | | | | 3,339,348 | |
Morgan Stanley | | | | | | | | |
3.125%, due 1/23/23 | | | 4,435,000 | | | | 4,563,294 | |
3.875%, due 1/27/26 | | | 465,000 | | | | 502,244 | |
4.875%, due 11/1/22 | | | 1,125,000 | | | | 1,206,738 | |
5.00%, due 11/24/25 | | | 2,855,000 | | | | 3,209,410 | |
5.611% (3 Month LIBOR + 3.61%), due 12/31/49 (b)(e) | | | 1,890,000 | | | | 1,901,340 | |
7.25%, due 4/1/32 | | | 3,490,000 | | | | 4,990,435 | |
PNC Bank N.A.
2.55%, due 12/9/21 | | | 2,185,000 | | | | 2,213,177 | |
Royal Bank of Scotland Group PLC
6.00%, due 12/19/23 (United Kingdom) | | | 190,000 | | | | 210,993 | |
Santander Holdings USA, Inc.
2.65%, due 4/17/20 | | | 3,875,000 | | | | 3,882,882 | |
State Street Corp.
2.55%, due 8/18/20 | | | 2,605,000 | | | | 2,618,994 | |
| | | | |
| 14 | | MainStay Income Builder Fund | | The notes to the financial statements are an integral part of,
and should be read in conjunction with, the financial statements. |
| | | | | | | | |
| | | Principal
Amount | | | Value | |
| Corporate Bonds (continued) | | | | | |
Banks (continued) | | | | | | | | |
Toronto-Dominion Bank
3.15%, due 9/17/20 (Canada) | | $ | 4,255,000 | | | $ | 4,302,372 | |
U.S. Bank N.A.
2.442% (3 Month LIBOR + 0.29%), due 5/21/21 (b) | | | 2,655,000 | | | | 2,657,654 | |
Wachovia Corp.
5.50%, due 8/1/35 | | | 315,000 | | | | 399,950 | |
Wells Fargo & Co. | | | | | | | | |
2.406%, due 10/30/25 (d) | | | 4,165,000 | | | | 4,168,523 | |
4.90%, due 11/17/45 | | | 55,000 | | | | 66,550 | |
Wells Fargo Bank N.A. | | | | | | | | |
2.60%, due 1/15/21 | | | 2,595,000 | | | | 2,617,151 | |
3.55%, due 8/14/23 | | | 1,815,000 | | | | 1,908,150 | |
5.85%, due 2/1/37 | | | 140,000 | | | | 185,258 | |
| | | | | | | | |
| | | | | | | 111,765,021 | |
| | | | | | | | |
Beverages 0.3% | |
Anheuser-Busch InBev Worldwide, Inc. (Belgium) | | | | | | | | |
4.15%, due 1/23/25 | | | 635,000 | | | | 694,222 | |
4.75%, due 1/23/29 | | | 1,275,000 | | | | 1,481,813 | |
Diageo Capital PLC
2.364% (3 Month LIBOR + 0.24%), due 5/18/20 (United Kingdom) (b) | | | 2,420,000 | | | | 2,421,762 | |
| | | | | | | | |
| | | | | | | 4,597,797 | |
| | | | | | | | |
Biotechnology 0.5% | |
Biogen, Inc.
3.625%, due 9/15/22 | | | 3,480,000 | | | | 3,636,902 | |
Celgene Corp.
3.625%, due 5/15/24 | | | 3,600,000 | | | | 3,808,228 | |
| | | | | | | | |
| | | | | | | 7,445,130 | |
| | | | | | | | |
Building Materials 0.5% | |
Cemex S.A.B. de C.V.
3.125%, due 3/19/26 (Mexico) (a) | | EUR | 4,255,000 | | | | 4,888,727 | |
Standard Industries, Inc.
5.375%, due 11/15/24 (a) | | $ | 2,580,000 | | | | 2,654,304 | |
| | | | | | | | |
| | | | | | | 7,543,031 | |
| | | | | | | | |
Chemicals 0.5% | |
Air Liquide Finance S.A.
1.75%, due 9/27/21 (France) (a) | | | 1,725,000 | | | | 1,718,292 | |
Braskem Netherlands Finance B.V.
4.50%, due 1/10/28 (Netherlands) (a) | | | 2,135,000 | | | | 2,142,472 | |
Huntsman International LLC
4.50%, due 5/1/29 | | | 1,862,000 | | | | 1,968,279 | |
Orbia Advance Corp. S.A.B. de C.V.
4.00%, due 10/4/27 (Mexico) (a) | | | 1,800,000 | | | | 1,827,000 | |
| | | | | | | | |
| | | | | | | 7,656,043 | |
| | | | | | | | |
| | | | | | | | |
| | | Principal
Amount | | | Value | |
Commercial Services 0.6% | |
Ashtead Capital, Inc.
4.00%, due 5/1/28 (United Kingdom) (a) | | $ | 935,000 | | | $ | 938,506 | |
Cintas Corp. No 2
3.70%, due 4/1/27 | | | 2,740,000 | | | | 2,996,386 | |
Herc Holdings, Inc.
5.50%, due 7/15/27 (a) | | | 1,805,000 | | | | 1,870,431 | |
PayPal Holdings, Inc.
2.40%, due 10/1/24 | | | 2,780,000 | | | | 2,798,780 | |
| | | | | | | | |
| | | | | | | 8,604,103 | |
| | | | | | | | |
Computers 0.5% | |
Apple, Inc.
2.75%, due 1/13/25 | | | 1,990,000 | | | | 2,063,952 | |
Dell International LLC / EMC Corp. (a) | | | | | | | | |
4.90%, due 10/1/26 | | | 1,749,000 | | | | 1,897,649 | |
5.30%, due 10/1/29 | | | 810,000 | | | | 894,875 | |
International Business Machines Corp.
7.00%, due 10/30/25 | | | 2,050,000 | | | | 2,586,766 | |
| | | | | | | | |
| | | | | | | 7,443,242 | |
| | | | | | | | |
Distribution & Wholesale 0.1% | |
Performance Food Group, Inc.
5.50%, due 10/15/27 (a) | | | 1,610,000 | | | | 1,702,575 | |
| | | | | | | | |
|
Diversified Financial Services 1.5% | |
AerCap Ireland Capital DAC / AerCap Global Aviation Trust (Ireland) | | | | | | | | |
4.45%, due 12/16/21 | | | 1,465,000 | | | | 1,527,295 | |
4.625%, due 10/30/20 | | | 4,265,000 | | | | 4,370,677 | |
Air Lease Corp. | | | | | | | | |
2.75%, due 1/15/23 | | | 1,850,000 | | | | 1,867,060 | |
3.50%, due 1/15/22 | | | 890,000 | | | | 915,256 | |
4.25%, due 9/15/24 | | | 1,185,000 | | | | 1,272,099 | |
Allied Universal Holdco LLC / Allied Universal Finance Corp.
6.625%, due 7/15/26 (a) | | | 1,650,000 | | | | 1,761,375 | |
Ally Financial, Inc. | | | | | | | | |
3.875%, due 5/21/24 | | | 810,000 | | | | 845,964 | |
8.00%, due 11/1/31 | | | 2,245,000 | | | | 3,123,356 | |
Capital One Financial Corp.
4.20%, due 10/29/25 | | | 435,000 | | | | 468,954 | |
Caterpillar Financial Services Corp.
2.90%, due 3/15/21 | | | 4,990,000 | | | | 5,055,227 | |
Discover Financial Services
3.85%, due 11/21/22 | | | 1,491,000 | | | | 1,561,852 | |
Springleaf Finance Corp.
6.125%, due 3/15/24 | | | 540,000 | | | | 590,625 | |
| | | | | | | | |
| | | | | | | 23,359,740 | |
| | | | | | | | |
| | | | | | |
The notes to the financial statements are an integral part of,
and should be read in conjunction with, the financial statements. | | | | | 15 | |
Portfolio of InvestmentsOctober 31, 2019 (continued)
| | | | | | | | |
| | | Principal
Amount | | | Value | |
| Corporate Bonds (continued) | |
Electric 1.4% | |
AEP Transmission Co. LLC
3.10%, due 12/1/26 | | $ | 2,350,000 | | | $ | 2,457,321 | |
CMS Energy Corp. | | | | | | | | |
3.875%, due 3/1/24 | | | 1,540,000 | | | | 1,623,883 | |
5.05%, due 3/15/22 | | | 1,220,000 | | | | 1,293,847 | |
Connecticut Light & Power Co.
4.00%, due 4/1/48 | | | 1,145,000 | | | | 1,346,039 | |
Duquesne Light Holdings, Inc. (a) | | | | | | | | |
3.616%, due 8/1/27 | | | 2,265,000 | | | | 2,300,261 | |
6.40%, due 9/15/20 | | | 2,590,000 | | | | 2,677,030 | |
Entergy Louisiana LLC
4.00%, due 3/15/33 | | | 2,200,000 | | | | 2,524,845 | |
Evergy, Inc.
5.292%, due 6/15/22 (c) | | | 1,130,000 | | | | 1,208,244 | |
Public Service Electric & Gas Co.
3.00%, due 5/15/27 | | | 2,235,000 | | | | 2,332,646 | |
Puget Energy, Inc.
5.625%, due 7/15/22 | | | 815,000 | | | | 874,745 | |
Southern California Edison Co. | | | | | | | | |
3.70%, due 8/1/25 | | | 870,000 | | | | 922,338 | |
4.00%, due 4/1/47 | | | 1,320,000 | | | | 1,387,655 | |
WEC Energy Group, Inc.
4.271% (3 Month LIBOR + 2.113%), due 5/15/67 (b) | | | 1,095,000 | | | | 949,182 | |
| | | | | | | | |
| | | | | | | 21,898,036 | |
| | | | | | | | |
Environmental Controls 0.3% | |
Republic Services, Inc.
4.75%, due 5/15/23 | | | 1,615,000 | | | | 1,751,130 | |
Waste Management, Inc.
2.40%, due 5/15/23 | | | 2,275,000 | | | | 2,304,814 | |
| | | | | | | | |
| | | | | | | 4,055,944 | |
| | | | | | | | |
Food 1.0% | |
JBS USA LUX S.A. / JBS Food Co. / JBS USA Finance, Inc.
5.50%, due 1/15/30 (a) | | | 1,230,000 | | | | 1,323,788 | |
Kerry Group Financial Services Unlimited Co.
3.20%, due 4/9/23 (Ireland) (a) | | | 2,899,000 | | | | 2,949,278 | |
Mondelez International Holdings Netherlands (Netherlands) B.V.
2.125%, due 9/19/22 (a) | | | 2,690,000 | | | | 2,693,485 | |
Nestle Holdings, Inc.
3.10%, due 9/24/21 (a) | | | 2,975,000 | | | | 3,045,225 | |
Smithfield Foods, Inc. (a) | | | | | | | | |
2.70%, due 1/31/20 | | | 1,690,000 | | | | 1,690,153 | |
3.35%, due 2/1/22 | | | 1,575,000 | | | | 1,583,300 | |
Tyson Foods, Inc.
3.95%, due 8/15/24 | | | 2,255,000 | | | | 2,420,099 | |
| | | | | | | | |
| | | | | | | 15,705,328 | |
| | | | | | | | |
| | | | | | | | |
| | | Principal
Amount | | | Value | |
Gas 0.1% | |
Southern California Gas Co.
4.30%, due 1/15/49 | | $ | 845,000 | | | $ | 995,818 | |
| | | | | | | | |
|
Health Care—Products 0.5% | |
Becton Dickinson & Co. | | | | | | | | |
3.70%, due 6/6/27 | | | 1,441,000 | | | | 1,549,282 | |
4.669%, due 6/6/47 | | | 1,635,000 | | | | 1,966,509 | |
Stryker Corp.
2.625%, due 3/15/21 | | | 3,395,000 | | | | 3,426,932 | |
| | | | | | | | |
| | | | | | | 6,942,723 | |
| | | | | | | | |
Health Care—Services 0.0%‡ | |
Cigna Holding Co.
4.375%, due 12/15/20 | | | 270,000 | | | | 275,315 | |
| | | | | | | | |
|
Holding Company—Diversified 0.2% | |
CK Hutchison International (17) II, Ltd.
3.25%, due 9/29/27 (Hong Kong) (a) | | | 2,620,000 | | | | 2,693,060 | |
| | | | | | | | |
|
Home Builders 0.3% | |
Lennar Corp. | | | | | | | | |
4.50%, due 11/15/19 | | | 750,000 | | | | 750,375 | |
5.875%, due 11/15/24 | | | 1,345,000 | | | | 1,499,675 | |
MDC Holdings, Inc.
5.625%, due 2/1/20 | | | 2,750,000 | | | | 2,763,750 | |
| | | | | | | | |
| | | | | | | 5,013,800 | |
| | | | | | | | |
Insurance 2.3% | |
AXA Equitable Holdings, Inc.
5.00%, due 4/20/48 | | | 2,305,000 | | | | 2,485,258 | |
Jackson National Life Global Funding (a) | | | | | | | | |
2.20%, due 1/30/20 | | | 3,580,000 | | | | 3,582,619 | |
2.618% (3 Month LIBOR + 0.48%), due 6/11/21 (b) | | | 3,660,000 | | | | 3,673,836 | |
Liberty Mutual Group, Inc.
4.25%, due 6/15/23 (a) | | | 850,000 | | | | 902,145 | |
Lincoln National Corp.
3.625%, due 12/12/26 | | | 3,400,000 | | | | 3,599,482 | |
MassMutual Global Funding II (a) | | | | | | | | |
2.50%, due 10/17/22 | | | 3,347,000 | | | | 3,396,962 | |
2.95%, due 1/11/25 | | | 1,105,000 | | | | 1,141,260 | |
Peachtree Corners Funding Trust
3.976%, due 2/15/25 (a) | | | 940,000 | | | | 992,244 | |
Pricoa Global Funding I
2.55%, due 11/24/20 (a) | | | 2,135,000 | | | | 2,152,069 | |
Principal Life Global Funding II
2.375%, due 11/21/21 (a) | | | 4,070,000 | | | | 4,097,329 | |
Protective Life Corp.
8.45%, due 10/15/39 | | | 1,640,000 | | | | 2,583,115 | |
Prudential Financial, Inc.
5.625%, due 6/15/43 (d) | | | 1,405,000 | | | | 1,520,913 | |
| | | | |
| 16 | | MainStay Income Builder Fund | | The notes to the financial statements are an integral part of,
and should be read in conjunction with, the financial statements. |
| | | | | | | | |
| | | Principal
Amount | | | Value | |
| Corporate Bonds (continued) | |
Insurance (continued) | | | | | | | | |
Reliance Standard Life Global Funding II
2.50%, due 10/30/24 (United Kingdom) (a) | | $ | 2,420,000 | | | $ | 2,425,031 | |
Voya Financial, Inc.
3.65%, due 6/15/26 | | | 690,000 | | | | 727,672 | |
Willis North America, Inc.
2.95%, due 9/15/29 | | | 1,735,000 | | | | 1,726,447 | |
| | | | | | | | |
| | | | | | | 35,006,382 | |
| | | | | | | | |
Internet 0.7% | |
Expedia Group, Inc. | | | | | | | | |
3.25%, due 2/15/30 (a) | | | 3,165,000 | | | | 3,167,156 | |
3.80%, due 2/15/28 | | | 440,000 | | | | 461,638 | |
5.00%, due 2/15/26 | | | 60,000 | | | | 67,600 | |
GrubHub Holdings, Inc.
5.50%, due 7/1/27 (a) | | | 1,445,000 | | | | 1,354,687 | |
Tencent Holdings, Ltd. (China) (a) | | | | | | | | |
3.595%, due 1/19/28 | | | 1,475,000 | | | | 1,536,899 | |
3.925%, due 1/19/38 | | | 1,910,000 | | | | 2,043,917 | |
Weibo Corp.
3.50%, due 7/5/24 | | | 1,190,000 | | | | 1,212,540 | |
| | | | | | | | |
| | | | | | | 9,844,437 | |
| | | | | | | | |
Iron & Steel 0.3% | |
ArcelorMittal
4.55%, due 3/11/26 (Luxembourg) | | | 2,040,000 | | | | 2,157,173 | |
Vale Overseas, Ltd. (Brazil) | | | | | | | | |
6.25%, due 8/10/26 | | | 1,115,000 | | | | 1,299,198 | |
6.875%, due 11/21/36 | | | 864,000 | | | | 1,099,008 | |
| | | | | | | | |
| | | | | | | 4,555,379 | |
| | | | | | | | |
Lodging 0.5% | |
Las Vegas Sands Corp.
3.20%, due 8/8/24 | | | 1,415,000 | | | | 1,447,835 | |
Marriott International, Inc. | | | | | | | | |
2.30%, due 1/15/22 | | | 2,450,000 | | | | 2,462,090 | |
7.15%, due 12/1/19 | | | 1,900,000 | | | | 1,906,727 | |
Sands China, Ltd. (Macao) | | | | | | | | |
4.60%, due 8/8/23 | | | 810,000 | | | | 856,915 | |
5.125%, due 8/8/25 | | | 1,310,000 | | | | 1,444,471 | |
| | | | | | | | |
| | | | | | | 8,118,038 | |
| | | | | | | | |
Machinery—Diversified 0.4% | |
CNH Industrial Capital LLC | | | | | | | | |
4.20%, due 1/15/24 | | | 1,435,000 | | | | 1,531,123 | |
4.875%, due 4/1/21 | | | 3,945,000 | | | | 4,072,384 | |
John Deere Capital Corp.
3.65%, due 10/12/23 | | | 610,000 | | | | 649,347 | |
| | | | | | | | |
| | | | | | | 6,252,854 | |
| | | | | | | | |
Media 1.1% | |
Comcast Corp. | | | | | | | | |
3.25%, due 11/1/39 | | | 1,665,000 | | | | 1,688,004 | |
3.45%, due 10/1/21 | | | 5,085,000 | | | | 5,240,367 | |
4.70%, due 10/15/48 | | | 1,410,000 | | | | 1,736,328 | |
| | | | | | | | |
| | | Principal
Amount | | | Value | |
Media (continued) | | | | | | | | |
Diamond Sports Group LLC / Diamond Sports Finance Co.
6.625%, due 8/15/27 (a)(f) | | $ | 2,465,000 | | | $ | 2,538,950 | |
Grupo Televisa S.A.B.
5.25%, due 5/24/49 (Mexico) | | | 1,230,000 | | | | 1,345,906 | |
Sky, Ltd.
3.75%, due 9/16/24 (United Kingdom) (a) | | | 950,000 | | | | 1,023,236 | |
Time Warner Entertainment Co., L.P.
8.375%, due 3/15/23 | | | 800,000 | | | | 952,709 | |
UPCB Finance IV, Ltd.
5.375%, due 1/15/25 (Netherlands) (a) | | | 2,050,000 | | | | 2,114,062 | |
| | | | | | | | |
| | | | | | | 16,639,562 | |
| | | | | | | | |
Metal Fabricate & Hardware 0.3% | |
Precision Castparts Corp.
3.25%, due 6/15/25 | | | 4,040,000 | | | | 4,276,453 | |
| | | | | | | | |
|
Mining 0.2% | |
Anglo American Capital PLC
4.875%, due 5/14/25 (United Kingdom) (a) | | | 1,295,000 | | | | 1,406,462 | |
Corp. Nacional del Cobre de Chile
3.00%, due 9/30/29 (a) | | | 1,580,000 | | | | 1,576,161 | |
| | | | | | | | |
| | | | | | | 2,982,623 | |
| | | | | | | | |
Miscellaneous—Manufacturing 0.2% | |
Textron Financial Corp.
3.893% (3 Month LIBOR + 1.735%), due 2/15/67 (a)(b) | | | 3,540,000 | | | | 2,663,850 | |
| | | | | | | | |
|
Oil & Gas 0.6% | |
Cenovus Energy, Inc.
4.25%, due 4/15/27 (Canada) | | | 955,000 | | | | 1,002,146 | |
Gazprom Via Gaz Capital S.A.
7.288%, due 8/16/37 (Luxembourg) (a) | | | 2,065,000 | | | | 2,787,965 | |
Marathon Petroleum Corp.
5.125%, due 12/15/26 | | | 1,260,000 | | | | 1,439,966 | |
Petrobras Global Finance B.V.
7.375%, due 1/17/27 (Brazil) | | | 993,000 | | | | 1,202,523 | |
Valero Energy Corp. | | | | | | | | |
4.00%, due 4/1/29 | | | 1,435,000 | | | | 1,533,701 | |
6.625%, due 6/15/37 | | | 1,050,000 | | | | 1,370,137 | |
| | | | | | | | |
| | | | | | | 9,336,438 | |
| | | | | | | | |
Packaging & Containers 0.3% | |
Reynolds Group Issuer, Inc. / Reynolds Group Issuer LLC (New Zealand) | | | | | | | | |
5.125%, due 7/15/23 (a) | | | 2,700,000 | | | | 2,770,065 | |
5.75%, due 10/15/20 | | | 1,938,215 | | | | 1,944,902 | |
| | | | | | | | |
| | | | | | | 4,714,967 | |
| | | | | | | | |
| | | | | | |
The notes to the financial statements are an integral part of,
and should be read in conjunction with, the financial statements. | | | | | 17 | |
Portfolio of InvestmentsOctober 31, 2019 (continued)
| | | | | | | | |
| | | Principal
Amount | | | Value | |
| Corporate Bonds (continued) | |
Pharmaceuticals 0.6% | |
Allergan Funding SCS
3.45%, due 3/15/22 | | $ | 2,715,000 | | | $ | 2,781,931 | |
Bausch Health Cos., Inc.
5.75%, due 8/15/27 (a) | | | 1,075,000 | | | | 1,167,383 | |
Bristol-Myers Squibb Co.
3.40%, due 7/26/29 (a) | | | 1,770,000 | | | | 1,903,788 | |
GlaxoSmithKline Capital PLC
2.525% (3 Month LIBOR + 0.35%), due 5/14/21 (United Kingdom) (b) | | | 3,465,000 | | | | 3,473,807 | |
| | | | | | | | |
| | | | | | | 9,326,909 | |
| | | | | | | | |
Pipelines 0.7% | |
Columbia Pipeline Group, Inc.
3.30%, due 6/1/20 | | | 2,995,000 | | | | 3,012,804 | |
Enterprise Products Operating LLC | | | | | | | | |
3.125%, due 7/31/29 | | | 1,595,000 | | | | 1,637,555 | |
4.20%, due 1/31/50 | | | 405,000 | | | | 428,293 | |
MPLX, L.P.
4.875%, due 6/1/25 | | | 100,000 | | | | 109,827 | |
Southern Natural Gas Co. LLC
4.80%, due 3/15/47 (a) | | | 880,000 | | | | 974,622 | |
Spectra Energy Partners, L.P.
4.75%, due 3/15/24 | | | 1,740,000 | | | | 1,897,501 | |
Transcontinental Gas Pipe Line Co. LLC
4.60%, due 3/15/48 | | | 2,340,000 | | | | 2,524,810 | |
| | | | | | | | |
| | | | | | | 10,585,412 | |
| | | | | | | | |
Real Estate Investment Trusts 1.2% | |
Alexandria Real Estate Equities, Inc.
3.375%, due 8/15/31 | | | 1,290,000 | | | | 1,355,956 | |
American Tower Corp.
3.375%, due 10/15/26 | | | 2,945,000 | | | | 3,062,968 | |
Crown Castle International Corp. | | | | | | | | |
3.40%, due 2/15/21 | | | 2,080,000 | | | | 2,114,446 | |
5.25%, due 1/15/23 | | | 3,510,000 | | | | 3,833,917 | |
Digital Realty Trust, L.P. | | | | | | | | |
2.75%, due 2/1/23 | | | 140,000 | | | | 141,938 | |
3.60%, due 7/1/29 | | | 2,985,000 | | | | 3,133,848 | |
3.70%, due 8/15/27 | | | 500,000 | | | | 527,809 | |
GLP Capital, L.P. / GLP Financing II, Inc.
3.35%, due 9/1/24 | | | 1,280,000 | | | | 1,294,720 | |
Kilroy Realty, L.P.
3.45%, due 12/15/24 | | | 2,060,000 | | | | 2,146,799 | |
Welltower, Inc.
4.00%, due 6/1/25 | | | 890,000 | | | | 964,066 | |
| | | | | | | | |
| | | | | | | 18,576,467 | |
| | | | | | | | |
Retail 0.8% | |
Alimentation Couche-Tard, Inc.
3.55%, due 7/26/27 (Canada) (a) | | | 2,700,000 | | | | 2,798,734 | |
| | | | | | | | |
| | | Principal
Amount | | | Value | |
Retail (continued) | | | | | | | | |
CVS Health Corp. | | | | | | | | |
4.00%, due 12/5/23 | | $ | 3,725,000 | | | $ | 3,949,444 | |
4.78%, due 3/25/38 | | | 1,110,000 | | | | 1,232,005 | |
CVS Pass-Through Trust
5.789%, due 1/10/26 (a) | | | 139,753 | | | | 150,597 | |
McDonald’s Corp.
3.35%, due 4/1/23 | | | 2,875,000 | | | | 3,004,900 | |
Starbucks Corp.
4.45%, due 8/15/49 | | | 1,305,000 | | | | 1,508,708 | |
| | | | | | | | |
| | | | | | | 12,644,388 | |
| | | | | | | | |
Savings & Loans 0.1% | |
Nationwide Building Society
3.96%, due 7/18/30 (United Kingdom) (a)(d) | | | 1,325,000 | | | | 1,422,399 | |
| | | | | | | | |
|
Semiconductors 0.3% | |
Broadcom, Inc.
3.125%, due 10/15/22 (a) | | | 2,405,000 | | | | 2,449,271 | |
NXP B.V. / NXP Funding LLC
4.625%, due 6/15/22 (Netherlands) (a) | | | 1,610,000 | | | | 1,690,995 | |
| | | | | | | | |
| | | | | | | 4,140,266 | |
| | | | | | | | |
Software 0.3% | |
Fiserv, Inc. | | | | | | | | |
2.75%, due 7/1/24 | | | 825,000 | | | | 843,460 | |
3.20%, due 7/1/26 | | | 525,000 | | | | 548,531 | |
salesforce.com, Inc. | | | | | | | | |
3.25%, due 4/11/23 | | | 1,300,000 | | | | 1,355,886 | |
3.70%, due 4/11/28 | | | 1,915,000 | | | | 2,114,361 | |
| | | | | | | | |
| | | | | | | 4,862,238 | |
| | | | | | | | |
Telecommunications 1.3% | |
AT&T, Inc. | | | | | | | | |
3.312% (3 Month LIBOR + 1.18%), due 6/12/24 (b) | | | 2,005,000 | | | | 2,039,842 | |
4.35%, due 3/1/29 | | | 795,000 | | | | 878,993 | |
4.90%, due 8/15/37 | | | 1,840,000 | | | | 2,098,682 | |
CommScope Technologies LLC
6.00%, due 6/15/25 (a) | | | 850,000 | | | | 756,245 | |
CommScope, Inc.
5.00%, due 6/15/21 (a) | | | 1,189,000 | | | | 1,189,000 | |
Crown Castle Towers LLC
4.241%, due 7/15/48 (a) | | | 2,680,000 | | | | 2,951,207 | |
Sprint Spectrum Co. LLC / Sprint Spectrum Co. II LLC / Sprint Spectrum Co. III LLC
4.738%, due 9/20/29 (a) | | | 4,170,000 | | | | 4,446,304 | |
Telefonica Emisiones SAU (Spain) | | | | | | | | |
5.134%, due 4/27/20 | | | 2,425,000 | | | | 2,460,284 | |
5.462%, due 2/16/21 | | | 395,000 | | | | 412,081 | |
| | | | |
| 18 | | MainStay Income Builder Fund | | The notes to the financial statements are an integral part of,
and should be read in conjunction with, the financial statements. |
| | | | | | | | |
| | | Principal
Amount | | | Value | |
| Corporate Bonds (continued) | |
Telecommunications (continued) | | | | | | | | |
Verizon Communications, Inc.
3.258% (3 Month LIBOR + 1.10%), due 5/15/25 (b) | | $ | 2,705,000 | | | $ | 2,751,500 | |
| | | | | | | | |
| | | | | | | 19,984,138 | |
| | | | | | | | |
Transportation 0.1% | |
XPO Logistics, Inc.
6.50%, due 6/15/22 (a) | | | 761,000 | | | | 775,269 | |
| | | | | | | | |
Total Corporate Bonds
(Cost $439,981,656) | | | | | | | 457,240,644 | |
| | | | | | | | |
|
| Foreign Bonds 0.1% | |
Banks 0.1% | |
Barclays Bank PLC (United Kingdom) | | | | | | | | |
Series Reg S
10.00%, due 5/21/21 | | GBP | 1,186,000 | | | | 1,726,250 | |
| | | | | | | | |
Total Foreign Bonds
(Cost $1,902,897) | | | | | | | 1,726,250 | |
| | | | | | | | |
|
| Loan Assignments 0.8% (b) | |
Advertising 0.1% | |
Outfront Media Capital LLC
2017 Term Loan B
3.94% (3 Month LIBOR + 2.00%), due 3/18/24 | | $ | 2,035,821 | | | | 2,043,032 | |
| | | | | | | | |
|
Environmental Controls 0.3% | |
Advanced Disposal Services, Inc. Term Loan B3
4.086% (1 Week LIBOR + 2.25%), due 11/10/23 | | | 4,222,699 | | | | 4,227,918 | |
| | | | | | | | |
|
Household Products & Wares 0.1% | |
Prestige Brands, Inc.
Term Loan B4
3.786% (1 Month LIBOR + 2.00%), due 1/26/24 | | | 1,245,793 | | | | 1,246,042 | |
| | | | | | | | |
|
Telecommunications 0.2% | |
Level 3 Financing, Inc.
2017 Term Loan B
4.036% (1 Month LIBOR + 2.25%), due 2/22/24 | | | 3,175,000 | | | | 3,175,794 | |
| | | | | | | | |
|
Transportation 0.1% | |
XPO Logistics, Inc.
2018 Term Loan B
3.786% (1 Month LIBOR + 2.00%), due 2/24/25 | | | 1,575,000 | | | | 1,576,312 | |
| | | | | | | | |
Total Loan Assignments
(Cost $12,254,324) | | | | | | | 12,269,098 | |
| | | | | | | | |
| | | | | | | | |
| | | Principal
Amount | | | Value | |
| Mortgage-Backed Securities 7.9% | |
Agency (Collateralized Mortgage Obligations) 5.0% | |
Federal Home Loan Mortgage Corporation | | | | | | | | |
REMIC Series 4691, Class HA
2.50%, due 6/15/40 | | $ | 2,283,876 | | | $ | 2,306,672 | |
REMIC, Series 4900, Class BE
3.00%, due 3/25/49 | | | 2,425,016 | | | | 2,488,203 | |
REMIC, Series 4911, Class MB
3.00%, due 9/25/49 | | | 3,962,925 | | | | 4,058,557 | |
REMIC, Series 4926, Class BP
3.00%, due 10/25/49 (g) | | | 4,350,000 | | | | 4,489,200 | |
Series 2019-1, Class A1
3.50%, due 5/25/29 | | | 1,710,156 | | | | 1,778,203 | |
REMIC Series 4818, Class BD
3.50%, due 3/15/45 | | | 2,286,794 | | | | 2,351,915 | |
REMIC Series 4884, Class BA
3.50%, due 6/15/48 | | | 1,990,959 | | | | 2,047,196 | |
REMIC Series 4888, Class BA
3.50%, due 9/15/48 | | | 1,592,321 | | | | 1,656,563 | |
REMIC Series 4877, Class AT
3.50%, due 11/15/48 | | | 2,333,628 | | | | 2,456,128 | |
REMIC Series 4877, Class BE
3.50%, due 11/15/48 | | | 3,086,707 | | | | 3,226,526 | |
Federal National Mortgage Association | | | | | | | | |
REMICSeries 2013-77, Class CY
3.00%, due 7/25/43 | | | 1,902,000 | | | | 1,982,384 | |
Series 2019-25, Class PA
3.00%, due 5/25/48 | | | 1,943,094 | | | | 1,993,553 | |
Series 2019-13, Class PE
3.00%, due 3/25/49 | | | 2,458,978 | | | | 2,512,497 | |
REMIC,Series 2019-58, Class LP
3.00%, due 10/25/49 | | | 4,551,000 | | | | 4,673,779 | |
REMICSeries 2019-13, Class CA
3.50%, due 4/25/49 | | | 3,563,792 | | | | 3,743,283 | |
Government National Mortgage Association | | | | | | | | |
Series 2017-123, Class AB
2.50%, due 1/20/47 | | | 1,906,082 | | | | 1,914,842 | |
Series 2014-91, Class MA
3.00%, due 1/16/40 | | | 2,104,713 | | | | 2,172,332 | |
Series 2018-127, Class PB
3.00%, due 9/20/47 | | | 5,126,264 | | | | 5,239,677 | |
REMICSeries 2019-29, Class AP
3.00%, due 10/20/48 | | | 3,365,845 | | | | 3,431,546 | |
Series 2019-29, Class CB
3.00%, due 10/20/48 | | | 2,087,785 | | | | 2,130,313 | |
Series 2019-52, Class JL
3.00%, due 11/20/48 | | | 1,977,880 | | | | 2,023,072 | |
Series 2019-59, Class KA
3.00%, due 12/20/48 | | | 3,408,880 | | | | 3,495,028 | |
Series 2019-43, Class PL
3.00%, due 4/20/49 | | | 4,357,089 | | | | 4,499,236 | |
| | | | | | |
The notes to the financial statements are an integral part of,
and should be read in conjunction with, the financial statements. | | | | | 19 | |
Portfolio of InvestmentsOctober 31, 2019 (continued)
| | | | | | | | |
| | | Principal
Amount | | | Value | |
| Mortgage-Backed Securities (continued) | |
Agency (Collateralized Mortgage Obligations) (continued) | |
Government National Mortgage Association (continued) | | | | | | | | |
Series 2019-74, Class AT
3.00%, due 6/20/49 | | $ | 2,558,229 | | | $ | 2,624,152 | |
Series 2013-149, Class BA
3.25%, due 8/16/41 | | | 6,207,888 | | | | 6,486,317 | |
| | | | | | | | |
| | | | | | | 75,781,174 | |
| | | | | | | | |
Commercial Mortgage Loans
(Collateralized Mortgage Obligations) 2.5% | |
Bank | | | | | | | | |
Series 2019-BN21, Class A5
2.851%, due 10/17/52 | | | 4,600,000 | | | | 4,743,308 | |
Series 2019-BN19, Class A2
2.926%, due 8/15/61 | | | 2,865,000 | | | | 2,977,018 | |
Bayview Commercial Asset Trust
Series 2006-4A, Class A1
2.053% (1 Month LIBOR + 0.23%), due 12/25/36 (a)(b) | | | 82,004 | | | | 79,193 | |
Benchmark Mortgage Trust
Series 2019-B12, Class A5
3.116%, due 8/15/52 | | | 2,852,000 | | | | 3,012,503 | |
Four Times Square Trust
Series 2006-4TS, Class A
5.401%, due 12/13/28 (a) | | | 801,355 | | | | 824,905 | |
FREMF Mortgage Trust (a)(h) | | | | | | | | |
Series 2013-K33, Class B
3.499%, due 8/25/46 | | | 2,701,000 | | | | 2,821,064 | |
Series 2013-K35, Class B
3.939%, due 12/25/46 | | | 1,735,000 | | | | 1,831,765 | |
GS Mortgage Securities Trust | | | | | | | | |
Series 2019-GC42, Class A4
3.001%, due 9/1/52 | | | 1,175,000 | | | | 1,228,287 | |
Series 2019-GC40, Class A4
3.16%, due 7/10/52 | | | 2,002,000 | | | | 2,119,128 | |
Hawaii Hotel Trust
Series 2019-MAUI, Class A
3.064% (1 Month LIBOR + 1.15%), due 5/15/38 (a)(b) | | | 1,630,000 | | | | 1,631,537 | |
Hudson Yards Mortgage Trust
Series 2019-30HY, Class A
3.228%, due 7/10/39 (a) | | | 1,935,000 | | | | 2,058,569 | |
JP Morgan Chase Commercial Mortgage Securities Trust
Series 2013-C16, Class A4
4.166%, due 12/15/46 | | | 1,695,000 | | | | 1,823,628 | |
JPMBB Commercial Mortgage Securities Trust
Series 2015-C28, Class A4
3.227%, due 10/15/48 | | | 2,400,000 | | | | 2,517,007 | |
One Bryant Park Trust
Series 2019-OBP, Class A
2.516%, due 9/15/54 (a) | | | 3,930,000 | | | | 3,924,341 | |
| | | | | | | | |
| | | Principal
Amount | | | Value | |
Commercial Mortgage Loans
(Collateralized Mortgage Obligations) (continued) | |
Wells Fargo Commercial Mortgage Trust (a)(h) | | | | | | | | |
Series 2018-1745, Class A
3.749%, due 6/15/36 | | $ | 2,640,000 | | | $ | 2,895,179 | |
Series 2018-AUS, Class A
4.058%, due 8/17/36 | | | 3,000,000 | | | | 3,335,693 | |
| | | | | | | | |
| | | | | | | 37,823,125 | |
| | | | | | | | |
Whole Loan (Collateralized Mortgage Obligations) 0.4% | |
Chase Home Lending Mortgage Trust (a)(i) | | | | | | | | |
Series 2019-ATR2, Class A3
3.50%, due 7/25/49 | | | 1,571,216 | | | | 1,595,090 | |
Series 2019-ATR1, Class A4
4.00%, due 4/25/49 | | | 1,931,656 | | | | 1,938,300 | |
JP Morgan Mortgage Trust (a)(i) | | | | | | | | |
Series 2019-2, Class A4
4.00%, due 8/25/49 | | | 1,102,559 | | | | 1,109,364 | |
Series 2019-3, Class A3
4.00%, due 9/25/49 | | | 1,247,509 | | | | 1,264,662 | |
Series 2019-5, Class A4
4.00%, due 11/25/49 | | | 1,187,686 | | | | 1,192,296 | |
| | | | | | | | |
| | | | | | | 7,099,712 | |
| | | | | | | | |
Total Mortgage-Backed Securities
(Cost $118,351,077) | | | | | | | 120,704,011 | |
| | | | | | | | |
|
| Municipal Bonds 0.1% | |
New York 0.1% | |
New York State Thruway Authority, Revenue Bonds
Series M
2.90%, due 1/1/35 | | | 1,270,000 | | | | 1,285,570 | |
| | | | | | | | |
Total Municipal Bonds
(Cost $1,270,000) | | | | | | | 1,285,570 | |
| | | | | | | | |
|
| U.S. Government & Federal Agencies 12.6% | |
Federal Home Loan Mortgage Corporation
(Mortgage Pass-Through Securities) 2.6% | |
3.50%, due 1/1/48 | | | 10,730,634 | | | | 11,166,482 | |
3.50%, due 9/1/48 | | | 1,398,710 | | | | 1,441,718 | |
4.00%, due 2/1/49 | | | 1,712,711 | | | | 1,782,475 | |
4.00%, due 3/1/49 | | | 5,021,810 | | | | 5,211,222 | |
4.50%, due 11/1/48 | | | 9,867,935 | | | | 10,541,662 | |
5.00%, due 12/1/44 | | | 3,896,645 | | | | 4,297,629 | |
5.00%, due 12/1/48 | | | 5,430,414 | | | | 5,802,847 | |
| | | | | | | | |
| | | | | | | 40,244,035 | |
| | | | | | | | |
Federal National Mortgage Association
(Mortgage Pass-Through Securities) 6.3% | |
2.50%, due 12/1/37 | | | 3,036,023 | | | | 3,046,170 | |
| | | | |
| 20 | | MainStay Income Builder Fund | | The notes to the financial statements are an integral part of,
and should be read in conjunction with, the financial statements. |
| | | | | | | | |
| | | Principal
Amount | | | Value | |
| U.S. Government & Federal Agencies (continued) | |
Federal National Mortgage Association
(Mortgage Pass-Through Securities) (continued) | |
3.50%, due 3/1/37 | | $ | 5,006,818 | | | $ | 5,250,534 | |
3.50%, due 2/1/42 | | | 3,297,967 | | | | 3,441,861 | |
3.50%, due 8/1/46 | | | 7,132,986 | | | | 7,511,956 | |
3.50%, due 9/1/48 TBA (j) | | | 12,607,000 | | | | 12,943,843 | |
4.00%, due 4/1/48 | | | 10,296,478 | | | | 10,780,920 | |
4.00%, due 5/1/48 | | | 4,734,647 | | | | 4,942,358 | |
4.00%, due 9/1/48 | | | 6,817,249 | | | | 7,207,025 | |
4.00%, due 1/1/49 | | | 1,682,350 | | | | 1,782,806 | |
4.00%, due 2/1/49 | | | 1,358,997 | | | | 1,411,992 | |
4.00%, due 2/1/49 | | | 2,346,874 | | | | 2,440,171 | |
4.00%, due 4/1/49 | | | 12,051,060 | | | | 12,506,327 | |
4.50%, due 7/1/48 | | | 7,505,081 | | | | 7,921,564 | |
4.50%, due 1/1/49 | | | 8,705,372 | | | | 9,188,957 | |
5.00%, due 9/1/33 | | | 4,758,857 | | | | 5,253,483 | |
| | | | | | | | |
| | | | | | | 95,629,967 | |
| | | | | | | | |
Government National Mortgage Association
(Mortgage Pass-Through Securities) 0.0%‡ | |
6.50%, due 4/15/29 | | | 11 | | | | 12 | |
6.50%, due 8/15/29 | | | 8 | | | | 9 | |
| | | | | | | | |
| | | | | | | 21 | |
| | | | | | | | |
United States Treasury Bonds 2.7% | | | | | | | | |
2.875%, due 5/15/49 | | | 15,815,000 | | | | 18,223,081 | |
3.00%, due 5/15/45 | | | 5,885,000 | | | | 6,849,128 | |
4.375%, due 11/15/39 | | | 10,376,000 | | | | 14,402,780 | |
4.50%, due 5/15/38 | | | 1,390,000 | | | | 1,942,688 | |
| | | | | | | | |
| | | | | | | 41,417,677 | |
| | | | | | | | |
United States Treasury Notes 0.1% | | | | | | | | |
1.625%, due 8/15/29 | | | 1,070,000 | | | | 1,063,605 | |
| | | | | | | | |
|
United States Treasury Inflation—Indexed Notes 0.9% (k) | |
0.75%, due 7/15/28 | | | 4,272,294 | | | | 4,496,468 | |
0.875%, due 1/15/29 | | | 8,738,116 | | | | 9,293,405 | |
| | | | | | | | |
| | | | | | | 13,789,873 | |
| | | | | | | | |
Total U.S. Government & Federal Agencies
(Cost $184,868,573) | | | | 192,145,178 | |
| | | | | | | | |
TotalLong-Term Bonds
(Cost $783,901,255) | | | | | | | 810,893,979 | |
| | | | | | | | |
| | |
| | | | | | | | |
| | |
| | | Shares | | | | |
| Common Stocks 43.3% | |
Aerospace & Defense 0.9% | |
BAE Systems PLC (United Kingdom) | | | 1,254,184 | | | | 9,360,988 | |
Lockheed Martin Corp. | | | 12,513 | | | | 4,713,397 | |
| | | | | | | | |
| | | | | | | 14,074,385 | |
| | | | | | | | |
| | | | | | | | |
| | |
| | | Shares | | | Value | |
Air Freight & Logistics 0.7% | |
Deutsche Post A.G., Registered (Germany) | | | 191,358 | | | $ | 6,776,133 | |
United Parcel Service, Inc., Class B | | | 33,655 | | | | 3,876,047 | |
| | | | | | | | |
| | | | | | | 10,652,180 | |
| | | | | | | | |
Auto Components 0.4% | |
Cie Generale des Etablissements Michelin SCA (France) | | | 49,835 | | | | 6,063,883 | |
| | | | | | | | |
|
Banks 2.3% | |
BB&T Corp. | | | 94,493 | | | | 5,012,854 | |
Commonwealth Bank of Australia (Australia) | | | 68,604 | | | | 3,720,002 | |
Lloyds Banking Group PLC (United Kingdom) | | | 6,792,465 | | | | 4,997,617 | |
People’s United Financial, Inc. | | | 221,561 | | | | 3,582,641 | |
Royal Bank of Canada (Canada) | | | 60,230 | | | | 4,858,276 | |
Svenska Handelsbanken A.B., Class A (Sweden) | | | 365,242 | | | | 3,656,316 | |
Wells Fargo & Co. | | | 84,353 | | | | 4,355,145 | |
Westpac Banking Corp. (Australia) | | | 211,960 | | | | 4,121,893 | |
| | | | | | | | |
| | | | | | | 34,304,744 | |
| | | | | | | | |
Beverages 1.0% | |
Coca-Cola Co. | | | 118,008 | | | | 6,423,176 | |
Coca-Cola European Partners PLC (United Kingdom) | | | 64,721 | | | | 3,463,221 | |
PepsiCo., Inc. | | | 41,637 | | | | 5,711,347 | |
| | | | | | | | |
| | | | | | | 15,597,744 | |
| | | | | | | | |
Biotechnology 0.6% | |
AbbVie, Inc. | | | 69,683 | | | | 5,543,283 | |
Amgen, Inc. | | | 18,985 | | | | 4,048,551 | |
| | | | | | | | |
| | | | | | | 9,591,834 | |
| | | | | | | | |
Capital Markets 0.8% | |
BlackRock, Inc. | | | 8,660 | | | | 3,998,322 | |
CME Group, Inc. | | | 18,122 | | | | 3,728,601 | |
Macquarie Group, Ltd. (Australia) | | | 41,853 | | | | 3,863,775 | |
| | | | | | | | |
| | | | | | | 11,590,698 | |
| | | | | | | | |
Chemicals 1.7% | |
BASF S.E. (Germany) | | | 92,767 | | | | 7,059,281 | |
Dow, Inc. (l) | | | 141,370 | | | | 7,137,771 | |
LyondellBasell Industries N.V., Class A | | | 56,954 | | | | 5,108,774 | |
Nutrien, Ltd. (Canada) | | | 122,323 | | | | 5,845,816 | |
| | | | | | | | |
| | | | | | | 25,151,642 | |
| | | | | | | | |
Commercial Services & Supplies 0.0%‡ | |
Quad/Graphics, Inc. | | | 10 | | | | 45 | |
| | | | | | | | |
|
Communications Equipment 0.4% | |
Cisco Systems, Inc. | | | 128,363 | | | | 6,098,526 | |
| | | | | | | | |
| | | | | | |
The notes to the financial statements are an integral part of,
and should be read in conjunction with, the financial statements. | | | | | 21 | |
Portfolio of InvestmentsOctober 31, 2019 (continued)
| | | | | | | | |
| | |
| | | Shares | | | Value | |
| Common Stocks (continued) | |
Construction & Engineering 0.3% | |
Vinci S.A. (France) | | | 44,873 | | | $ | 5,034,712 | |
| | | | | | | | |
|
Diversified Telecommunication Services 2.4% | |
AT&T, Inc. | | | 220,832 | | | | 8,499,824 | |
BCE, Inc. (Canada) | | | 219,187 | | | | 10,397,695 | |
TELUS Corp. (Canada) | | | 160,180 | | | | 5,697,694 | |
Verizon Communications, Inc. | | | 190,280 | | | | 11,506,231 | |
| | | | | | | | |
| | | | | | | 36,101,444 | |
| | | | | | | | |
Electric Utilities 3.6% | |
American Electric Power Co., Inc. | | | 60,190 | | | | 5,681,334 | |
Duke Energy Corp. | | | 130,305 | | | | 12,282,549 | |
Entergy Corp. | | | 89,152 | | | | 10,830,185 | |
FirstEnergy Corp. | | | 214,693 | | | | 10,373,966 | |
PPL Corp. | | | 222,209 | | | | 7,441,780 | |
Terna Rete Elettrica Nazionale S.p.A. (Italy) | | | 1,147,503 | | | | 7,581,593 | |
| | | | | | | | |
| | | | | | | 54,191,407 | |
| | | | | | | | |
Electrical Equipment 0.9% | |
Eaton Corp. PLC | | | 98,160 | | | | 8,550,718 | |
Emerson Electric Co. | | | 80,470 | | | | 5,644,970 | |
| | | | | | | | |
| | | | | | | 14,195,688 | |
| | | | | | | | |
Equity Real Estate Investment Trusts 1.7% | |
Iron Mountain, Inc. | | | 204,303 | | | | 6,701,138 | |
Public Storage | | | 15,965 | | | | 3,557,960 | |
Unibail-Rodamco-Westfield (France) | | | 40,127 | | | | 6,207,329 | |
Welltower, Inc. | | | 110,586 | | | | 10,029,044 | |
| | | | | | | | |
| | | | | | | 26,495,471 | |
| | | | | | | | |
Food Products 0.7% | |
Nestle S.A., Registered (Switzerland) | | | 39,160 | | | | 4,180,772 | |
Orkla ASA (Norway) | | | 643,591 | | | | 6,182,460 | |
| | | | | | | | |
| | | | | | | 10,363,232 | |
| | | | | | | | |
Gas Utilities 0.9% | |
Naturgy Energy Group S.A. (Spain) | | | 155,115 | | | | 4,222,923 | |
Snam S.p.A. (Italy) | | | 1,739,700 | | | | 8,925,320 | |
| | | | | | | | |
| | | | | | | 13,148,243 | |
| | | | | | | | |
Health Care Providers & Services 0.3% | |
UnitedHealth Group, Inc. | | | 17,906 | | | | 4,524,846 | |
| | | | | | | | |
|
Hotels, Restaurants & Leisure 1.0% | |
Darden Restaurants, Inc. | | | 31,282 | | | | 3,512,030 | |
Las Vegas Sands Corp. | | | 118,224 | | | | 7,310,972 | |
McDonald’s Corp. | | | 20,495 | | | | 4,031,367 | |
| | | | | | | | |
| | | | | | | 14,854,369 | |
| | | | | | | | |
Household Durables 0.3% | |
Leggett & Platt, Inc. | | | 96,910 | | | | 4,971,483 | |
| | | | | | | | |
| | | | | | | | |
| | |
| | | Shares | | | Value | |
Household Products 0.7% | |
Kimberly-Clark Corp. | | | 43,147 | | | $ | 5,733,373 | |
Procter & Gamble Co. | | | 43,147 | | | | 5,372,233 | |
| | | | | | | | |
| | | | | | | 11,105,606 | |
| | | | | | | | |
Industrial Conglomerates 0.6% | |
3M Co. | | | 26,320 | | | | 4,342,537 | |
Siemens A.G., Registered (Germany) | | | 47,462 | | | | 5,472,353 | |
| | | | | | | | |
| | | | | | | 9,814,890 | |
| | | | | | | | |
Insurance 3.7% | |
Allianz S.E., Registered (Germany) | | | 50,267 | | | | 12,277,747 | |
Assicurazioni Generali S.p.A. (Italy) | | | 277,665 | | | | 5,628,428 | |
AXA S.A. (France) | | | 459,735 | | | | 12,144,301 | |
MetLife, Inc. | | | 141,307 | | | | 6,611,755 | |
Muenchener Rueckversicherungs-Gesellschaft A.G., Registered (Germany) | | | 37,186 | | | | 10,326,910 | |
SCOR S.E. (France) | | | 105,821 | | | | 4,458,876 | |
Tokio Marine Holdings, Inc. (Japan) | | | 85,400 | | | | 4,640,496 | |
| | | | | | | | |
| | | | | | | 56,088,513 | |
| | | | | | | | |
IT Services 0.4% | |
International Business Machines Corp. | | | 49,846 | | | | 6,665,906 | |
| | | | | | | | |
|
Media 0.0%‡ | |
ION Media Networks, Inc. (g)(l)(m)(n)(o) | | | 12 | | | | 4,760 | |
| | | | | | | | |
|
Multi-Utilities 2.0% | |
Ameren Corp. | | | 48,976 | | | | 3,805,435 | |
CenterPoint Energy, Inc. | | | 170,581 | | | | 4,958,790 | |
Dominion Energy, Inc. | | | 113,477 | | | | 9,367,527 | |
National Grid PLC (United Kingdom) | | | 771,905 | | | | 9,011,984 | |
WEC Energy Group, Inc. | | | 40,923 | | | | 3,863,131 | |
| | | | | | | | |
| | | | | | | 31,006,867 | |
| | | | | | | | |
Multiline Retail 0.3% | |
Target Corp. | | | 42,131 | | | | 4,504,225 | |
| | | | | | | | |
|
Oil, Gas & Consumable Fuels 3.9% | |
Chevron Corp. | | | 40,855 | | | | 4,744,900 | |
Enterprise Products Partners, L.P. | | | 244,430 | | | | 6,362,513 | |
Exxon Mobil Corp. | | | 96,213 | | | | 6,501,112 | |
Magellan Midstream Partners, L.P. | | | 85,647 | | | | 5,337,521 | |
Occidental Petroleum Corp. | | | 108,731 | | | | 4,403,606 | |
Pembina Pipeline Corp. (Canada) | | | 190,672 | | | | 6,712,824 | |
Phillips 66 | | | 50,335 | | | | 5,880,135 | |
Royal Dutch Shell PLC, Class A, Sponsored ADR (Netherlands) | | | 157,488 | | | | 9,129,579 | |
TOTAL S.A. (France) | | | 191,574 | | | | 10,070,978 | |
| | | | | | | | |
| | | | | | | 59,143,168 | |
| | | | | | | | |
Personal Products 0.5% | |
Unilever PLC (United Kingdom) | | | 120,381 | | | | 7,208,121 | |
| | | | | | | | |
| | | | |
| 22 | | MainStay Income Builder Fund | | The notes to the financial statements are an integral part of,
and should be read in conjunction with, the financial statements. |
| | | | | | | | |
| | |
| | | Shares | | | Value | |
| Common Stocks (continued) | |
Pharmaceuticals 4.6% | |
AstraZeneca PLC, Sponsored ADR (United Kingdom) | | | 141,739 | | | $ | 6,949,463 | |
GlaxoSmithKline PLC (United Kingdom) | | | 313,465 | | | | 7,181,347 | |
Johnson & Johnson | | | 44,010 | | | | 5,811,080 | |
Merck & Co., Inc. | | | 103,338 | | | | 8,955,271 | |
Novartis A.G., Registered (Switzerland) | | | 99,023 | | | | 8,641,551 | |
Pfizer, Inc. | | | 259,963 | | | | 9,974,780 | |
Roche Holding A.G. (Switzerland) | | | 22,682 | | | | 6,824,144 | |
Sanofi (France) | | | 87,945 | | | | 8,103,785 | |
Takeda Pharmaceutical Co., Ltd. (Japan) | | | 184,000 | | | | 6,692,768 | |
| | | | | | | | |
| | | | | | | 69,134,189 | |
| | | | | | | | |
Semiconductors & Semiconductor Equipment 1.5% | |
Broadcom, Inc. | | | 12,513 | | | | 3,664,432 | |
Intel Corp. | | | 78,312 | | | | 4,426,977 | |
KLA Corp. | | | 22,943 | | | | 3,878,285 | |
Taiwan Semiconductor Manufacturing Co., Ltd., Sponsored ADR (Taiwan) | | | 89,531 | | | | 4,622,486 | |
Texas Instruments, Inc. | | | 58,249 | | | | 6,872,799 | |
| | | | | | | | |
| | | | | | | 23,464,979 | |
| | | | | | | | |
Software 0.5% | |
Micro Focus International PLC (United Kingdom) | | | 198,262 | | | | 2,722,278 | |
Microsoft Corp. | | | 36,459 | | | | 5,227,127 | |
| | | | | | | | |
| | | | | | | 7,949,405 | |
| | | | | | | | |
Specialty Retail 0.3% | |
Home Depot, Inc. | | | 18,985 | | | | 4,453,501 | |
| | | | | | | | |
|
Technology Hardware, Storage & Peripherals 0.4% | |
Samsung Electronics Co., Ltd., GDR (Republic of Korea) | | | 4,953 | | | | 5,289,804 | |
| | | | | | | | |
|
Textiles, Apparel & Luxury Goods 0.3% | |
Hanesbrands, Inc. | | | 295,343 | | | | 4,492,167 | |
| | | | | | | | |
|
Tobacco 2.1% | |
Altria Group, Inc. | | | 181,650 | | | | 8,136,104 | |
British American Tobacco PLC (United Kingdom) | | | 177,335 | | | | 6,206,789 | |
British American Tobacco PLC, Sponsored ADR (United Kingdom) | | | 63,642 | | | | 2,224,924 | |
Imperial Brands PLC (United Kingdom) | | | 306,777 | | | | 6,725,321 | |
Philip Morris International, Inc. | | | 101,612 | | | | 8,275,281 | |
| | | | | | | | |
| | | | | | | 31,568,419 | |
| | | | | | | | |
Trading Companies & Distributors 0.3% | |
Watsco, Inc. | | | 28,046 | | | | 4,944,510 | |
| | | | | | | | |
| | | | | | | | |
| | |
| | | Shares | | | Value | |
Wireless Telecommunication Services 0.3% | |
Rogers Communications, Inc., Class B (Canada) | | | 84,642 | | | $ | 3,985,005 | |
| | | | | | | | |
Total Common Stocks
(Cost $608,859,132) | | | | | | | 657,830,611 | |
| | | | | | | | |
|
| Short-Term Investments 3.1% | |
Affiliated Investment Company 2.9% | |
MainStay U.S. Government Liquidity Fund, 1.76% (p) | | | 44,612,007 | | | | 44,612,007 | |
| | | | | | | | |
|
Unaffiliated Investment Company 0.2% | |
State Street Navigator Securities Lending Government Money Market Portfolio, 1.75% (p)(q) | | | 2,616,900 | | | | 2,616,900 | |
| | | | | | | | |
TotalShort-Term Investments
(Cost $47,228,907) | | | | | | | 47,228,907 | |
| | | | | | | | |
Total Investments
(Cost $1,439,989,294) | | | 99.7 | % | | | 1,515,953,497 | |
Other Assets, Less Liabilities | | | 0.3 | | | | 4,691,365 | |
Net Assets | | | 100.0 | % | | $ | 1,520,644,862 | |
| † | Percentages indicated are based on Fund net assets. |
| ‡ | Less than one-tenth of a percent. |
| (a) | May be sold to institutional investors only under Rule 144A or securities offered pursuant to Section 4(a)(2) of the Securities Act of 1933, as amended. |
| (b) | Floating rate—Rate shown was the rate in effect as of October 31, 2019. |
| (c) | Step coupon—Rate shown was the rate in effect as of October 31, 2019. |
| (d) | Fixed to floating rate—Rate shown was the rate in effect as of October 31, 2019. |
| (e) | Securities are perpetual and, thus, do not have a predetermined maturity date. The date shown, if applicable, reflects the next call date. |
| (f) | All or a portion of this security was held on loan. As of October 31, 2019, the aggregate market value of securities on loan was $2,552,713. The Fund received cash collateral with a value of $2,616,900 (See Note 2(M)). |
| (g) | Fair valued security—Represents fair value as measured in good faith under procedures approved by the Board of Trustees. As of October 31, 2019, the total market value of fair valued securities was $4,493,960, which represented 0.3% of the Fund’s net assets. |
| (h) | Collateral strip rate—A bond whose interest was based on the weighted net interest rate of the collateral. The coupon rate adjusts periodically based on a predetermined schedule. Rate shown was the rate in effect as of October 31, 2019. |
| (i) | Coupon rate may change based on changes of the underlying collateral or prepayments of principal. The coupon rate shown represents the rate at period end. |
| | | | | | |
The notes to the financial statements are an integral part of,
and should be read in conjunction with, the financial statements. | | | | | 23 | |
Portfolio of InvestmentsOctober 31, 2019 (continued)
| (j) | TBA—Securities purchased on a forward commitment basis with an approximate principal amount and maturity date. The actual principal amount and maturity date will be determined upon settlement. As of October 31, 2019, the total net market value of these securities was $12,943,843, which represented 0.9% of the Fund’s net assets. All or a portion of these securities are a part of a mortgage dollar roll agreement. |
| (k) | Treasury Inflation Protected Security—Pays a fixed rate of interest on a principal amount that is continuously adjusted for inflation based on the Consumer Price Index-Urban Consumers. |
| (l) | Non-income producing security. |
| (m) | Security in which significant unobservable inputs (Level 3) were used in determining fair value. |
| (n) | Restricted security. (See Note 5) |
| (o) | Illiquid investment—As of October 31, 2019, the total market value of these illiquid investments was $4,760, which represented less thanone-tenth of a percent of the Fund’s net assets. (Unaudited) |
| (p) | Current yield as of October 31, 2019. |
| (q) | Represents security purchased with cash collateral received for securities on loan. |
Foreign Currency Forward Contracts
As of October 31, 2019, the Fund held the following foreign currency forward contracts1:
| | | | | | | | | | | | | | | | | | | | |
| Currency Purchased | | | Currency Sold | | | Counterparty | | Settlement
Date | | Unrealized
Appreciation
(Depreciation) | |
| | | | | | |
EUR | | | 60,325,000 | | | | USD | | | | 66,959,302 | | | JPMorgan Chase Bank N.A. | | 11/1/19 | | $ | 321,152 | |
GBP | | | 35,331,000 | | | | USD | | | | 45,429,236 | | | JPMorgan Chase Bank N.A. | | 11/1/19 | | | 336,783 | |
JPY | | | 5,988,000,000 | | | | USD | | | | 55,303,370 | | | JPMorgan Chase Bank N.A. | | 2/3/20 | | | 482,207 | |
USD | | | 18,561,205 | | | | CAD | | | | 24,302,000 | | | JPMorgan Chase Bank N.A. | | 11/1/19 | | | 110,062 | |
USD | | | 18,627,047 | | | | CAD | | | | 24,302,000 | | | JPMorgan Chase Bank N.A. | | 2/3/20 | | | 167,214 | |
USD | | | 68,171,774 | | | | EUR | | | | 60,325,000 | | | JPMorgan Chase Bank N.A. | | 11/1/19 | | | 891,321 | |
Total unrealized appreciation | | | 2,308,739 | |
CAD | | | 24,302,000 | | | | USD | | | | 18,615,489 | | | JPMorgan Chase Bank N.A. | | 11/1/19 | | | (164,347 | ) |
JPY | | | 5,988,000,000 | | | | USD | | | | 55,899,143 | | | JPMorgan Chase Bank N.A. | | 11/1/19 | | | (449,564 | ) |
USD | | | 67,406,250 | | | | EUR | | | | 60,325,000 | | | JPMorgan Chase Bank N.A. | | 2/3/20 | | | (298,925 | ) |
USD | | | 44,265,503 | | | | GBP | | | | 35,331,000 | | | JPMorgan Chase Bank N.A. | | 11/1/19 | | | (1,500,515 | ) |
USD | | | 45,574,164 | | | | GBP | | | | 35,331,000 | | | JPMorgan Chase Bank N.A. | | 2/3/20 | | | (327,062 | ) |
USD | | | 54,950,904 | | | | JPY | | | | 5,988,000,000 | | | JPMorgan Chase Bank N.A. | | 11/1/19 | | | (498,675 | ) |
Total unrealized depreciation | | | (3,239,088 | ) |
Net unrealized depreciation | | $ | (930,349 | ) |
| 1. | Foreign Currency Forward Contracts are subject to limitations such that they cannot be “sold or repurchased,” although the Fund would be able to exit the transaction through other means, such as through the execution of an offsetting transaction. |
Futures Contracts
As of October 31, 2019, the Portfolio held the following futures contracts1:
| | | | | | | | | | | | | | | | | | | | |
Type | | Number of
Contracts | | | Expiration
Date | | | Value at
Trade Date | | | Current
Notional
Amount | | | Unrealized
Appreciation
(Depreciation)2 | |
Long Contracts | | | | | | | | | | | | | | | | | | | | |
| | | | | |
10-Year United States Treasury Note | | | 16 | | | | December 2019 | | | $ | 2,076,786 | | | $ | 2,084,750 | | | $ | 7,964 | |
| 5-Year United States Treasury Note | | | 279 | | | | December 2019 | | | | 33,276,210 | | | | 33,257,672 | | | | (18,538 | ) |
| 2-Year United States Treasury Note | | | 265 | | | | December 2019 | | | | 57,244,961 | | | | 57,134,414 | | | | (110,547 | ) |
| Nikkei 225 | | | 575 | | | | December 2019 | | | | 56,029,663 | | | | 60,487,082 | | | | 4,457,419 | |
| S&P 500 Index Mini | | | 1,125 | | | | December 2019 | | | | 168,966,203 | | | | 170,763,749 | | | | 1,797,546 | |
| United States Treasury Ultra Bond | | | 285 | | | | December 2019 | | | | 55,809,270 | | | | 54,078,750 | | | | (1,730,520 | ) |
| United States Treasury Bond | | | 76 | | | | December 2019 | | | | 12,461,317 | | | | 12,264,500 | | | | (196,817 | ) |
| | | | | | | | | | | | | | | | | | | | |
| Total Long Contracts | | | | | | | | | | | | | | | | | | | 4,206,507 | |
| | | | | | | | | | | | | | | | | | | | |
| | | | |
| 24 | | MainStay Income Builder Fund | | The notes to the financial statements are an integral part of,
and should be read in conjunction with, the financial statements. |
| | | | | | | | | | | | | | | | | | | | |
Type | | Number of
Contracts | | | Expiration
Date | | | Value at
Trade Date | | | Current
Notional
Amount | | | Unrealized
Appreciation
(Depreciation)2 | |
Short Contracts | | | | | | | | | | | | | |
| | | | | |
10-Year United States Treasury Ultra Note | | | (128 | ) | | | December 2019 | | | $ | (18,311,624 | ) | | $ | (18,190,000 | ) | | $ | 121,624 | |
| | | | | | | | | | | | | | | | | | | | |
| Total Short Contracts | | | | | | | | | | | | | | | | | | | 121,624 | |
| | | | | | | | | | | | | | | | | | | | |
| Net Unrealized Appreciation | | | | | | | | | | | | | | | | | | $ | 4,328,131 | |
| | | | | | | | | | | | | | | | | | | | |
| 1. | As of October 31, 2019, cash in the amount of $11,166,429 was on deposit with a broker or futures commission merchant for futures transactions. |
| 2. | Represents the difference between the value of the contracts at the time they were opened and the value as of October 31, 2019. |
The following abbreviations are used in the preceding pages:
ADR—American Depositary Receipt
CAD—Canadian Dollar
EUR—Euro
GBP—British Pound Sterling
GDR—Global Depositary Receipt
JPY—Japanese Yen
LIBOR—London Interbank Offered Rate
REMIC—Real Estate Mortgage Investment Conduit
USD—United States Dollar
The following is a summary of the fair valuations according to the inputs used as of October 31, 2019, for valuing the Fund’s assets and liabilities:
| | | | | | | | | | | | | | | | |
Description | | Quoted
Prices in
Active
Markets for
Identical
Assets
(Level 1) | | | Significant
Other
Observable
Inputs
(Level 2) | | | Significant
Unobservable
Inputs
(Level 3) | | | Total | |
| | | | |
Asset Valuation Inputs | | | | | | | | | | | | | | | | |
Investments in Securities (a) | | | | | | | | | | | | | | | | |
Long-Term Bonds | | | | | | | | | | | | | | | | |
Asset-Backed Securities | | $ | — | | | $ | 25,523,228 | | | $ | — | | | $ | 25,523,228 | |
Corporate Bonds | | | — | | | | 457,240,644 | | | | — | | | | 457,240,644 | |
Foreign Bonds | | | — | | | | 1,726,250 | | | | — | | | | 1,726,250 | |
Loan Assignments | | | — | | | | 12,269,098 | | | | — | | | | 12,269,098 | |
Mortgage-Backed Securities | | | — | | | | 120,704,011 | | | | — | | | | 120,704,011 | |
Municipal Bonds | | | — | | | | 1,285,570 | | | | — | | | | 1,285,570 | |
U.S. Government & Federal Agencies | | | — | | | | 192,145,178 | | | | — | | | | 192,145,178 | |
| | | | | | | | | | | | | | | | |
| TotalLong-Term Bonds | | | — | | | | 810,893,979 | | | | — | | | | 810,893,979 | |
| | | | | | | | | | | | | | | | |
| Common Stocks (b) | | | 657,825,851 | | | | — | | | | 4,760 | | | | 657,830,611 | |
Short-Term Investments | | | | | | | | | | | | | | | | |
Affiliated Investment Company | | | 44,612,007 | | | | — | | | | — | | | | 44,612,007 | |
Unaffiliated Investment Company | | | 2,616,900 | | | | — | | | | — | | | | 2,616,900 | |
| | | | | | | | | | | | | | | | |
| TotalShort-Term Investments | | | 47,228,907 | | | | — | | | | — | | | | 47,228,907 | |
| | | | | | | | | | | | | | | | |
| Total Investments in Securities | | | 705,054,758 | | | | 810,893,979 | | | | 4,760 | | | | 1,515,953,497 | |
| | | | | | | | | | | | | | | | |
Other Financial Instruments | | | | | | | | | | | | | | | | |
Foreign Currency Forward Contracts (c) | | | — | | | | 2,308,739 | | | | — | | | | 2,308,739 | |
Futures Contracts (c) | | | 6,384,553 | | | | — | | | | — | | | | 6,384,553 | |
| | | | | | | | | | | | | | | | |
| Total Other Financial Instruments | | | 6,384,553 | | | | 2,308,739 | | | | — | | | | 8,693,292 | |
| | | | | | | | | | | | | | | | |
| Total Investments in Securities and Other Financial Instruments | | $ | 711,439,311 | | | $ | 813,202,718 | | | $ | 4,760 | | | $ | 1,524,646,789 | |
| | | | | | | | | | | | | | | | |
| | | | | | |
The notes to the financial statements are an integral part of,
and should be read in conjunction with, the financial statements. | | | | | 25 | |
Portfolio of InvestmentsOctober 31, 2019 (continued)
| | | | | | | | | | | | | | | | |
Description | | Quoted
Prices in
Active
Markets for
Identical
Assets
(Level 1) | | | Significant
Other
Observable
Inputs
(Level 2) | | | Significant
Unobservable
Inputs
(Level 3) | | | Total | |
| | | | |
| Liability Valuation Inputs | | | | | | | | | | | | | | | | |
Other Financial Instruments | | | | | | | | | | | | | | | | |
Foreign Currency Forward Contracts (c) | | $ | — | | | $ | (3,239,088 | ) | | $ | — | | | $ | (3,239,088 | ) |
Futures Contracts (c) | | | (2,056,422 | ) | | | — | | | | — | | | | (2,056,422 | ) |
| | | | | | | | | | | | | | | | |
| Total Other Financial Instruments | | $ | (2,056,422 | ) | | $ | (3,239,088 | ) | | $ | — | | | $ | (5,295,510 | ) |
| | | | | | | | | | | | | | | | |
| (a) | For a complete listing of investments and their industries, see the Portfolio of Investments. |
| (b) | The Level 3 security valued at $4,760 is held in Media within the Common Stocks section of the Portfolio of Investments. |
| (c) | The value listed for these securities reflects unrealized appreciation (depreciation) as shown on the Portfolio of Investments. |
The following is a reconciliation of investments in which significant unobservable inputs (Level 3) were used in determining value:
| | | | | | | | | | | | | | | | | | | | | | | | | | | | | | | | | | | | | | | | |
Investments in Securities | | Balance
as of
October 31,
2018 | | | Accrued
Discounts
(Premiums) | | | Realized
Gain
(Loss) | | | Change in
Unrealized
Appreciation
(Depreciation) | | | Purchases | | | Sales (a) | | | Transfers
in to
Level 3 | | | Transfers
out of
Level 3 | | | Balance
as of
October 31,
2019 | | | Change in
Unrealized
Appreciation
(Depreciation)
from
Investments
Still Held at
October 31,
2019 (b) | |
| Long-Term Bonds | | | | | | | | | | | | | | | | | | | | | | | | | | | | | | | | | | | | | | | | |
Loan Assignments | | $ | 1,627,750 | | | $ | 1,070 | | | $ | (42,837 | ) | | $ | 50,267 | | | $ | — | | | $ | (1,636,250 | ) | | $ | — | | | $ | — | | | $ | — | | | $ | — | |
Mortgage-Backed Securities | | | 370,209 | | | | — | | | | (42,638 | ) | | | 26,968 | | | | — | | | | (354,539 | ) | | | — | | | | — | | | | — | | | | — | |
| Common Stocks | | | 7,431 | | | | — | | | | — | | | | (2,671 | ) | | | — | | | | — | | | | — | | | | — | | | | 4,760 | | | | (2,671 | ) |
| | | | | | | | | | | | | | | | | | | | | | | | | | | | | | | | | | | | | | | | |
| Total | | $ | 2,005,390 | | | $ | 1,070 | | | $ | (85,475 | ) | | $ | 74,564 | | | $ | — | | | $ | (1,990,789 | ) | | $ | — | | | $ | — | | | $ | 4,760 | | | $ | (2,671 | ) |
| | | | | | | | | | | | | | | | | | | | | | | | | | | | | | | | | | | | | | | | |
| (a) | Sales include principal reductions. |
| (b) | Included in “Net change in unrealized appreciation (depreciation) on investments” in the Statement of Operations. |
| | | | |
| 26 | | MainStay Income Builder Fund | | The notes to the financial statements are an integral part of,
and should be read in conjunction with, the financial statements. |
Statement of Assets and Liabilitiesas of October 31, 2019
| | | | |
| Assets | |
Investment in unaffiliated securities, at value
(identified cost $1,395,377,287) including securities on loan of $2,552,713 | | $ | 1,471,341,490 | |
Investment in affiliated investment company, at value
(identified cost $44,612,007) | | | 44,612,007 | |
Cash collateral on deposit at broker for futures contracts | | | 11,166,429 | |
Cash denominated in foreign currencies
(identified cost $243,450) | | | 250,400 | |
Cash | | | 4,338 | |
Receivables: | | | | |
Investment securities sold | | | 9,226,061 | |
Dividends and interest | | | 7,868,216 | |
Fund shares sold | | | 1,464,470 | |
Securities lending | | | 526 | |
Unrealized appreciation on foreign currency forward contracts | | | 2,308,739 | |
Other assets | | | 55,424 | |
| | | | |
Total assets | | | 1,548,298,100 | |
| | | | |
|
| Liabilities | |
Cash collateral received for securities on loan | | | 2,616,900 | |
Payables: | | | | |
Investment securities purchased | | | 17,480,112 | |
Fund shares redeemed | | | 2,313,344 | |
Manager (See Note 3) | | | 789,203 | |
NYLIFE Distributors (See Note 3) | | | 335,250 | |
Transfer agent (See Note 3) | | | 301,339 | |
Variation margin on futures contracts | | | 204,371 | |
Shareholder communication | | | 78,959 | |
Custodian | | | 51,469 | |
Professional fees | | | 40,170 | |
Trustees | | | 2,738 | |
Accrued expenses | | | 24,281 | |
Unrealized depreciation on foreign currency forward contracts | | | 3,239,088 | |
Dividend payable | | | 176,014 | |
| | | | |
Total liabilities | | | 27,653,238 | |
| | | | |
Net assets | | $ | 1,520,644,862 | |
| | | | |
|
| Composition of Net Assets | |
Shares of beneficial interest outstanding (par value of $.01 per share) unlimited number of shares authorized | | $ | 758,333 | |
Additional paid-in capital | | | 1,384,845,773 | |
| | | | |
| | | 1,385,604,106 | |
Total distributable earnings (loss) | | | 135,040,756 | |
| | | | |
Net assets | | $ | 1,520,644,862 | |
| | | | |
| | | | |
Class A | | | | |
Net assets applicable to outstanding shares | | $ | 625,049,388 | |
| | | | |
Shares of beneficial interest outstanding | | | 31,313,855 | |
| | | | |
Net asset value per share outstanding | | $ | 19.96 | |
Maximum sales charge (5.50% of offering price) | | | 1.16 | |
| | | | |
Maximum offering price per share outstanding | | $ | 21.12 | |
| | | | |
Investor Class | | | | |
Net assets applicable to outstanding shares | | $ | 88,050,090 | |
| | | | |
Shares of beneficial interest outstanding | | | 4,407,662 | |
| | | | |
Net asset value per share outstanding | | $ | 19.98 | |
Maximum sales charge (5.50% of offering price) | | | 1.16 | |
| | | | |
Maximum offering price per share outstanding | | $ | 21.14 | |
| | | | |
Class B | | | | |
Net assets applicable to outstanding shares | | $ | 26,396,266 | |
| | | | |
Shares of beneficial interest outstanding | | | 1,312,864 | |
| | | | |
Net asset value and offering price per share outstanding | | $ | 20.11 | |
| | | | |
Class C | | | | |
Net assets applicable to outstanding shares | | $ | 191,737,330 | |
| | | | |
Shares of beneficial interest outstanding | | | 9,555,198 | |
| | | | |
Net asset value and offering price per share outstanding | | $ | 20.07 | |
| | | | |
Class I | | | | |
Net assets applicable to outstanding shares | | $ | 484,613,820 | |
| | | | |
Shares of beneficial interest outstanding | | | 24,043,588 | |
| | | | |
Net asset value and offering price per share outstanding | | $ | 20.16 | |
| | | | |
Class R2 | | | | |
Net assets applicable to outstanding shares | | $ | 2,523,927 | |
| | | | |
Shares of beneficial interest outstanding | | | 126,527 | |
| | | | |
Net asset value and offering price per share outstanding | | $ | 19.95 | |
| | | | |
Class R3 | | | | |
Net assets applicable to outstanding shares | | $ | 589,538 | |
| | | | |
Shares of beneficial interest outstanding | | | 29,530 | |
| | | | |
Net asset value and offering price per share outstanding | | $ | 19.96 | |
| | | | |
Class R6 | | | | |
Net assets applicable to outstanding shares | | $ | 101,684,503 | |
| | | | |
Shares of beneficial interest outstanding | | | 5,044,112 | |
| | | | |
Net asset value and offering price per share outstanding | | $ | 20.16 | |
| | | | |
| | | | | | |
The notes to the financial statements are an integral part of,
and should be read in conjunction with, the financial statements. | | | | | 27 | |
Statement of Operationsfor the year ended October 31, 2019
| | | | |
| Investment Income (Loss) | |
Income | | | | |
Dividends-unaffiliated (a) | | $ | 27,779,691 | |
Interest (b) | | | 28,094,361 | |
Dividends-affiliated | | | 937,363 | |
Securities lending | | | 171,556 | |
| | | | |
Total income | | | 56,982,971 | |
| | | | |
Expenses | | | | |
Manager (See Note 3) | | | 9,138,050 | |
Distribution/Service—Class A (See Note 3) | | | 1,469,539 | |
Distribution/Service—Investor Class (See Note 3) | | | 216,921 | |
Distribution/Service—Class B (See Note 3) | | | 279,196 | |
Distribution/Service—Class C (See Note 3) | | | 1,985,637 | |
Distribution/Service—Class R2 (See Note 3) | | | 8,129 | |
Distribution/Service—Class R3 (See Note 3) | | | 1,543 | |
Transfer agent (See Note 3) | | | 1,844,243 | |
Professional fees | | | 173,568 | |
Shareholder communication | | | 158,103 | |
Registration | | | 149,695 | |
Custodian | | | 129,237 | |
Trustees | | | 36,680 | |
Shareholder service (See Note 3) | | | 3,560 | |
Miscellaneous | | | 72,513 | |
| | | | |
Total expenses before waiver/reimbursement | | | 15,666,614 | |
Expense waiver/reimbursement from Manager (See Note 3) | | | (31,325 | ) |
| | | | |
Net expenses | | | 15,635,289 | |
| | | | |
Net investment income (loss) | | | 41,347,682 | |
| | | | |
|
| Realized and Unrealized Gain (Loss) on Investments, Futures Contracts and Foreign Currency Transactions | |
Net realized gain (loss) on: | | | | |
Unaffiliated investment transactions | | | 15,706,413 | |
Futures transactions | | | 17,672,380 | |
Foreign currency forward transactions | | | 9,450,022 | |
Foreign currency transactions | | | (386,798 | ) |
| | | | |
Net realized gain (loss) on investments, futures transactions and foreign currency transactions | | | 42,442,017 | |
| | | | |
Net change in unrealized appreciation (depreciation) on: | | | | |
Unaffiliated investments | | | 82,606,138 | |
Futures contracts | | | 19,201,607 | |
Foreign currency forward contracts | | | (5,133,523 | ) |
Translation of other assets and liabilities in foreign currencies | | | 535,316 | |
| | | | |
Net change in unrealized appreciation (depreciation) on investments, futures contracts and foreign currencies | | | 97,209,538 | |
| | | | |
Net realized and unrealized gain (loss) on investments, futures transactions and foreign currency transactions | | | 139,651,555 | |
| | | | |
Net increase (decrease) in net assets resulting from operations | | $ | 180,999,237 | |
| | | | |
| (a) | Dividends recorded net of foreign withholding taxes in the amount of $1,439,311. |
| (b) | Interest recorded net of foreign withholding taxes in the amount of $839. |
| | | | |
| 28 | | MainStay Income Builder Fund | | The notes to the financial statements are an integral part of,
and should be read in conjunction with, the financial statements. |
Statements of Changes in Net Assets
for the years ended October 31, 2019 and October 31, 2018
| | | | | | | | |
| | | 2019 | | | 2018 | |
| Increase (Decrease) in Net Assets | |
Operations: | | | | | | | | |
Net investment income (loss) | | $ | 41,347,682 | | | $ | 45,607,528 | |
Net realized gain (loss) on investments, futures and foreign currency transactions | | | 42,442,017 | | | | 55,605,154 | |
Net change in unrealized appreciation (depreciation) on investments, futures contracts and foreign currencies | | | 97,209,538 | | | | (140,448,768 | ) |
| | | | |
Net increase (decrease) in net assets resulting from operations | | | 180,999,237 | | | | (39,236,086 | ) |
| | | | |
Distributions to shareholders: | | | | | | | | |
Class A | | | (27,133,176 | ) | | | (32,796,558 | ) |
Investor Class | | | (3,905,630 | ) | | | (4,533,690 | ) |
Class B | | | (1,069,632 | ) | | | (1,563,809 | ) |
Class C | | | (7,608,473 | ) | | | (10,983,845 | ) |
Class I | | | (23,286,147 | ) | | | (38,245,609 | ) |
Class R2 | | | (156,842 | ) | | | (211,253 | ) |
Class R3 | | | (10,576 | ) | | | (7,874 | ) |
Class R6 | | | (4,774,290 | ) | | | (1,115,473 | ) |
| | | | |
Total distributions to shareholders | | | (67,944,766 | ) | | | (89,458,111 | ) |
| | | | |
Capital share transactions: | | | | | | | | |
Net proceeds from sale of shares | | | 256,736,076 | | | | 256,249,660 | |
Net asset value of shares issued to shareholders in reinvestment of distributions | | | 62,014,408 | | | | 80,255,791 | |
Cost of shares redeemed | | | (408,508,034 | ) | | | (533,526,985 | ) |
| | | | |
Increase (decrease) in net assets derived from capital share transactions | | | (89,757,550 | ) | | | (197,021,534 | ) |
| | | | |
Net increase (decrease) in net assets | | | 23,296,921 | | | | (325,715,731 | ) |
|
| Net Assets | |
Beginning of year | | | 1,497,347,941 | | | | 1,823,063,672 | |
| | | | |
End of year | | $ | 1,520,644,862 | | | $ | 1,497,347,941 | |
| | | | |
| | | | | | |
The notes to the financial statements are an integral part of,
and should be read in conjunction with, the financial statements. | | | | | 29 | |
Financial Highlightsselected per share data and ratios
| | | | | | | | | | | | | | | | | | | | |
| |
| | | Year ended October 31, | |
| | | | | |
| Class A | | 2019 | | | 2018 | | | 2017 | | | 2016 | | | 2015 | |
| | | | | |
Net asset value at beginning of year | | $ | 18.51 | | | $ | 19.97 | | | $ | 18.30 | | | $ | 18.79 | | | $ | 20.51 | |
| | | | | | | | | | | | | | | | | | | | |
| | | | | |
Net investment income (loss) (a) | | | 0.54 | | | | 0.52 | | | | 0.48 | | | | 0.58 | | | | 0.68 | |
| | | | | |
Net realized and unrealized gain (loss) on investments | | | 1.73 | | | | (1.04 | ) | | | 1.83 | | | | (0.17 | ) | | | (0.98 | ) |
| | | | | |
Net realized and unrealized gain (loss) on foreign currency transactions | | | 0.06 | | | | 0.07 | | | | (0.09 | ) | | | 0.30 | | | | 0.15 | |
| | | | | | | | | | | | | | | | | | | | |
| | | | | |
Total from investment operations | | | 2.33 | | | | (0.45 | ) | | | 2.22 | | | | 0.71 | | | | (0.15 | ) |
| | | | | | | | | | | | | | | | | | | | |
| | | | | |
| Less dividends and distributions: | | | | | | | | | | | | | | | | | | | | |
| | | | | |
From net investment income | | | (0.56 | ) | | | (0.52 | ) | | | (0.55 | ) | | | (0.61 | ) | | | (0.70 | ) |
| | | | | |
From net realized gain on investments | | | (0.32 | ) | | | (0.49 | ) | | | — | | | | (0.59 | ) | | | (0.87 | ) |
| | | | | | | | | | | | | | | | | | | | |
| | | | | |
Total dividends and distributions | | | (0.88 | ) | | | (1.01 | ) | | | (0.55 | ) | | | (1.20 | ) | | | (1.57 | ) |
| | | | | | | | | | | | | | | | | | | | |
| | | | | |
Net asset value at end of year | | $ | 19.96 | | | $ | 18.51 | | | $ | 19.97 | | | $ | 18.30 | | | $ | 18.79 | |
| | | | | | | | | | | | | | | | | | | | |
| | | | | |
Total investment return (b) | | | 13.09 | % | | | (2.38 | %) | | | 12.30 | % | | | 4.08 | % | | | (0.81 | %) |
| | | | | |
| Ratios (to average net assets)/Supplemental Data: | | | | | | | | | | | | | | | | | | | | |
| | | | | |
Net investment income (loss) | | | 2.83 | % | | | 2.72 | % | | | 2.52 | % | | | 3.21 | % | | | 3.49 | % |
| | | | | |
Net expenses (c) | | | 1.02 | % | | | 1.01 | % | | | 1.01 | % | | | 1.02 | % | | | 1.02 | % |
| | | | | |
Portfolio turnover rate | | | 62 | %(d) | | | 44 | % (d) | | | 29 | % | | | 27 | % | | | 30 | % |
| | | | | |
Net assets at end of year (in 000’s) | | $ | 625,049 | | | $ | 571,206 | | | $ | 652,333 | | | $ | 574,390 | | | $ | 581,920 | |
| (a) | Per share data based on average shares outstanding during the year. |
| (b) | Total investment return is calculated exclusive of sales charges and assumes the reinvestment of dividends and distributions. For periods of less than one year, total return is not annualized. |
| (c) | In addition to the fees and expenses which the Fund bears directly, it also indirectly bears a pro-rata share of the fees and expenses of the underlying funds in which it invests. Such indirect expenses are not included in the above expense ratios. |
| (d) | The portfolio turnover rates not including mortgage dollar rolls were 54% and 36% for the years ended October 31, 2019 and 2018, respectively. |
| | | | | | | | | | | | | | | | | | | | |
| |
| | | Year ended October 31, | |
| | | | | |
| Investor Class | | 2019 | | | 2018 | | | 2017 | | | 2016 | | | 2015 | |
| | | | | |
Net asset value at beginning of year | | $ | 18.52 | | | $ | 19.99 | | | $ | 18.31 | | | $ | 18.80 | | | $ | 20.52 | |
| | | | | | | | | | | | | | | | | | | | |
| | | | | |
Net investment income (loss) (a) | | | 0.51 | | | | 0.50 | | | | 0.47 | | | | 0.56 | | | | 0.65 | |
| | | | | |
Net realized and unrealized gain (loss) on investments | | | 1.74 | | | | (1.05 | ) | | | 1.82 | | | | (0.16 | ) | | | (0.99 | ) |
| | | | | |
Net realized and unrealized gain (loss) on foreign currency transactions | | | 0.06 | | | | 0.07 | | | | (0.09 | ) | | | 0.28 | | | | 0.15 | |
| | | | | | | | | | | | | | | | | | | | |
| | | | | |
Total from investment operations | | | 2.31 | | | | (0.48 | ) | | | 2.20 | | | | 0.68 | | | | (0.19 | ) |
| | | | | | | | | | | | | | | | | | | | |
| | | | | |
| Less dividends and distributions: | | | | | | | | | | | | | | | | | | | | |
| | | | | |
From net investment income | | | (0.53 | ) | | | (0.50 | ) | | | (0.52 | ) | | | (0.58 | ) | | | (0.66 | ) |
| | | | | |
From net realized gain on investments | | | (0.32 | ) | | | (0.49 | ) | | | — | | | | (0.59 | ) | | | (0.87 | ) |
| | | | | | | | | | | | | | | | | | | | |
| | | | | |
Total dividends and distributions | | | (0.85 | ) | | | (0.99 | ) | | | (0.52 | ) | | | (1.17 | ) | | | (1.53 | ) |
| | | | | | | | | | | | | | | | | | | | |
| | | | | |
Net asset value at end of year | | $ | 19.98 | | | $ | 18.52 | | | $ | 19.99 | | | $ | 18.31 | | | $ | 18.80 | |
| | | | | | | | | | | | | | | | | | | | |
| | | | | |
Total investment return (b) | | | 12.98 | % | | | (2.56 | %) | | | 12.19 | % | | | 3.93 | % | | | (0.97 | %) |
| | | | | |
| Ratios (to average net assets)/Supplemental Data: | | | | | | | | | | | | | | | | | | | | |
| | | | | |
Net investment income (loss) | | | 2.70 | % | | | 2.59 | % | | | 2.45 | % | | | 3.09 | % | | | 3.34 | % |
| | | | | |
Net expenses (c) | | | 1.16 | % | | | 1.13 | % | | | 1.14 | % | | | 1.16 | % | | | 1.18 | % |
| | | | | |
Expenses (before waiver/reimbursement) (c) | | | 1.17 | % | | | 1.14 | % | | | 1.14 | % | | | 1.16 | % | | | 1.18 | % |
| | | | | |
Portfolio turnover rate | | | 62 | %(d) | | | 44 | % (d) | | | 29 | % | | | 27 | % | | | 30 | % |
| | | | | |
Net assets at end of year (in 000’s) | | $ | 88,050 | | | $ | 85,132 | | | $ | 94,000 | | | $ | 153,137 | | | $ | 159,798 | |
| (a) | Per share data based on average shares outstanding during the year. |
| (b) | Total investment return is calculated exclusive of sales charges and assumes the reinvestment of dividends and distributions. For periods of less than one year, total return is not annualized. |
| (c) | In addition to the fees and expenses which the Fund bears directly, it also indirectly bears a pro-rata share of the fees and expenses of the underlying funds in which it invests. Such indirect expenses are not included in the above expense ratios. |
| (d) | The portfolio turnover rates not including mortgage dollar rolls were 54% and 36% for the years ended October 31, 2019 and 2018, respectively. |
| | | | |
| 30 | | MainStay Income Builder Fund | | The notes to the financial statements are an integral part of,
and should be read in conjunction with, the financial statements. |
Financial Highlightsselected per share data and ratios
| | | | | | | | | | | | | | | | | | | | |
| |
| | | Year ended October 31, | |
| | | | | |
| Class B | | 2019 | | | 2018 | | | 2017 | | | 2016 | | | 2015 | |
| | | | | |
Net asset value at beginning of year | | $ | 18.64 | | | $ | 20.10 | | | $ | 18.40 | | | $ | 18.89 | | | $ | 20.61 | |
| | | | | | | | | | | | | | | | | | | | |
| | | | | |
Net investment income (loss) (a) | | | 0.37 | | | | 0.36 | | | | 0.32 | | | | 0.42 | | | | 0.51 | |
| | | | | |
Net realized and unrealized gain (loss) on investments | | | 1.75 | | | | (1.05 | ) | | | 1.83 | | | | (0.17 | ) | | | (0.99 | ) |
| | | | | |
Net realized and unrealized gain (loss) on foreign currency transactions | | | 0.06 | | | | 0.07 | | | | (0.09 | ) | | | 0.30 | | | | 0.15 | |
| | | | | | | | | | | | | | | | | | | | |
| | | | | |
Total from investment operations | | | 2.18 | | | | (0.62 | ) | | | 2.06 | | | | 0.55 | | | | (0.33 | ) |
| | | | | | | | | | | | | | | | | | | | |
| | | | | |
| Less dividends and distributions: | | | | | | | | | | | | | | | | | | | | |
| | | | | |
From net investment income | | | (0.39 | ) | | | (0.35 | ) | | | (0.36 | ) | | | (0.45 | ) | | | (0.52 | ) |
| | | | | |
From net realized gain on investments | | | (0.32 | ) | | | (0.49 | ) | | | — | | | | (0.59 | ) | | | (0.87 | ) |
| | | | | | | | | | | | | | | | | | | | |
| | | | | |
Total dividends and distributions | | | (0.71 | ) | | | (0.84 | ) | | | (0.36 | ) | | | (1.04 | ) | | | (1.39 | ) |
| | | | | | | | | | | | | | | | | | | | |
| | | | | |
Net asset value at end of year | | $ | 20.11 | | | $ | 18.64 | | | $ | 20.10 | | | $ | 18.40 | | | $ | 18.89 | |
| | | | | | | | | | | | | | | | | | | | |
| | | | | |
Total investment return (b) | | | 12.11 | % | | | (3.22 | %) | | | 11.27 | % | | | 3.20 | % | | | (1.70 | %) |
| | | | | |
| Ratios (to average net assets)/Supplemental Data: | | | | | | | | | | | | | | | | | | | | |
| | | | | |
Net investment income (loss) | | | 1.96 | % | | | 1.85 | % | | | 1.67 | % | | | 2.34 | % | | | 2.60 | % |
| | | | | |
Net expenses (c) | | | 1.91 | % | | | 1.88 | % | | | 1.89 | % | | | 1.91 | % | | | 1.93 | % |
| | | | | |
Expenses (before waiver/reimbursement) (c) | | | 1.92 | % | | | 1.89 | % | | | 1.89 | % | | | 1.91 | % | | | 1.93 | % |
| | | | | |
Portfolio turnover rate | | | 62 | %(d) | | | 44 | % (d) | | | 29 | % | | | 27 | % | | | 30 | % |
| | | | | |
Net assets at end of year (in 000’s) | | $ | 26,396 | | | $ | 30,343 | | | $ | 39,475 | | | $ | 42,253 | | | $ | 44,441 | |
| (a) | Per share data based on average shares outstanding during the year. |
| (b) | Total investment return is calculated exclusive of sales charges and assumes the reinvestment of dividends and distributions. For periods of less than one year, total return is not annualized. |
| (c) | In addition to the fees and expenses which the Fund bears directly, it also indirectly bears a pro-rata share of the fees and expenses of the underlying funds in which it invests. Such indirect expenses are not included in the above expense ratios. |
| (d) | The portfolio turnover rates not including mortgage dollar rolls were 54% and 36% for the years ended October 31, 2019 and 2018, respectively. |
| | | | | | | | | | | | | | | | | | | | |
| |
| | | Year ended October 31, | |
| | | | | |
| Class C | | 2019 | | | 2018 | | | 2017 | | | 2016 | | | 2015 | |
| | | | | |
Net asset value at beginning of year | | $ | 18.60 | | | $ | 20.07 | | | $ | 18.37 | | | $ | 18.86 | | | $ | 20.58 | |
| | | | | | | | | | | | | | | | | | | | |
| | | | | |
Net investment income (loss) (a) | | | 0.37 | | | | 0.36 | | | | 0.32 | | | | 0.42 | | | | 0.50 | |
| | | | | |
Net realized and unrealized gain (loss) on investments | | | 1.75 | | | | (1.06 | ) | | | 1.83 | | | | (0.17 | ) | | | (0.98 | ) |
| | | | | |
Net realized and unrealized gain (loss) on foreign currency transactions | | | 0.06 | | | | 0.07 | | | | (0.09 | ) | | | 0.30 | | | | 0.15 | |
| | | | | | | | | | | | | | | | | | | | |
| | | | | |
Total from investment operations | | | 2.18 | | | | (0.63 | ) | | | 2.06 | | | | 0.55 | | | | (0.33 | ) |
| | | | | | | | | | | | | | | | | | | | |
| | | | | |
| Less dividends and distributions: | | | | | | | | | | | | | | | | | | | | |
| | | | | |
From net investment income | | | (0.39 | ) | | | (0.35 | ) | | | (0.36 | ) | | | (0.45 | ) | | | (0.52 | ) |
| | | | | |
From net realized gain on investments | | | (0.32 | ) | | | (0.49 | ) | | | — | | | | (0.59 | ) | | | (0.87 | ) |
| | | | | | | | | | | | | | | | | | | | |
| | | | | |
Total dividends and distributions | | | (0.71 | ) | | | (0.84 | ) | | | (0.36 | ) | | | (1.04 | ) | | | (1.39 | ) |
| | | | | | | | | | | | | | | | | | | | |
| | | | | |
Net asset value at end of year | | $ | 20.07 | | | $ | 18.60 | | | $ | 20.07 | | | $ | 18.37 | | | $ | 18.86 | |
| | | | | | | | | | | | | | | | | | | | |
| | | | | |
Total investment return (b) | | | 12.13 | % | | | (3.28 | %) | | | 11.35 | % | | | 3.15 | % | | | (1.70 | %) |
| | | | | |
| Ratios (to average net assets)/Supplemental Data: | | | | | | | | | | | | | | | | | | | | |
| | | | | |
Net investment income (loss) | | | 1.95 | % | | | 1.85 | % | | | 1.65 | % | | | 2.32 | % | | | 2.58 | % |
| | | | | |
Net expenses (c) | | | 1.91 | % | | | 1.88 | % | | | 1.89 | % | | | 1.91 | % | | | 1.93 | % |
| | | | | |
Expenses (before waiver/reimbursement) (c) | | | 1.92 | % | | | 1.89 | % | | | 1.89 | % | | | 1.91 | % | | | 1.93 | % |
| | | | | |
Portfolio turnover rate | | | 62 | %(d) | | | 44 | % (d) | | | 29 | % | | | 27 | % | | | 30 | % |
| | | | | |
Net assets at end of year (in 000’s) | | $ | 191,737 | | | $ | 212,400 | | | $ | 266,592 | | | $ | 254,312 | | | $ | 235,811 | |
| (a) | Per share data based on average shares outstanding during the year. |
| (b) | Total investment return is calculated exclusive of sales charges and assumes the reinvestment of dividends and distributions. For periods of less than one year, total return is not annualized. |
| (c) | In addition to the fees and expenses which the Fund bears directly, it also indirectly bears a pro-rata share of the fees and expenses of the underlying funds in which it invests. Such indirect expenses are not included in the above expense ratios. |
| (d) | The portfolio turnover rates not including mortgage dollar rolls were 54% and 36% for the years ended October 31, 2019 and 2018, respectively. |
| | | | | | |
The notes to the financial statements are an integral part of,
and should be read in conjunction with, the financial statements. | | | | | 31 | |
Financial Highlightsselected per share data and ratios
| | | | | | | | | | | | | | | | | | | | |
| |
| | | Year ended October 31, | |
| | | | | |
| Class I | | 2019 | | | 2018 | | | 2017 | | | 2016 | | | 2015 | |
| | | | | |
Net asset value at beginning of year | | $ | 18.68 | | | $ | 20.15 | | | $ | 18.46 | | | $ | 18.95 | | | $ | 20.66 | |
| | | | | | | | | | | | | | | | | | | | |
| | | | | |
Net investment income (loss) (a) | | | 0.59 | | | | 0.58 | | | | 0.54 | | | | 0.63 | | | | 0.73 | |
| | | | | |
Net realized and unrealized gain (loss) on investments | | | 1.76 | | | | (1.06 | ) | | | 1.84 | | | | (0.16 | ) | | | (0.98 | ) |
| | | | | |
Net realized and unrealized gain (loss) on foreign currency transactions | | | 0.06 | | | | 0.07 | | | | (0.09 | ) | | | 0.28 | | | | 0.15 | |
| | | | | | | | | | | | | | | | | | | | |
| | | | | |
Total from investment operations | | | 2.41 | | | | (0.41 | ) | | | 2.29 | | | | 0.75 | | | | (0.10 | ) |
| | | | | | | | | | | | | | | | | | | | |
| | | | | |
| Less dividends and distributions: | | | | | | | | | | | | | | | | | | | | |
| | | | | |
From net investment income | | | (0.61 | ) | | | (0.57 | ) | | | (0.60 | ) | | | (0.65 | ) | | | (0.74 | ) |
| | | | | |
From net realized gain on investments | | | (0.32 | ) | | | (0.49 | ) | | | — | | | | (0.59 | ) | | | (0.87 | ) |
| | | | | | | | | | | | | | | | | | | | |
| | | | | |
Total dividends and distributions | | | (0.93 | ) | | | (1.06 | ) | | | (0.60 | ) | | | (1.24 | ) | | | (1.61 | ) |
| | | | | | | | | | | | | | | | | | | | |
| | | | | |
Net asset value at end of year | | $ | 20.16 | | | $ | 18.68 | | | $ | 20.15 | | | $ | 18.46 | | | $ | 18.95 | |
| | | | | | | | | | | | | | | | | | | | |
| | | | | |
Total investment return (b) | | | 13.41 | % | | | (2.17 | %) | | | 12.60 | % | | | 4.30 | % | | | (0.51 | %) |
| | | | | |
| Ratios (to average net assets)/Supplemental Data: | | | | | | | | | | | | | | | | | | | | |
| | | | | |
Net investment income (loss) | | | 3.09 | % | | | 3.03 | % | | | 2.77 | % | | | 3.44 | % | | | 3.75 | % |
| | | | | |
Net expenses (c) | | | 0.77 | % | | | 0.76 | % | | | 0.76 | % | | | 0.77 | % | | | 0.77 | % |
| | | | | |
Portfolio turnover rate | | | 62 | %(d) | | | 44 | % (d) | | | 29 | % | | | 27 | % | | | 30 | % |
| | | | | |
Net assets at end of year (in 000’s) | | $ | 484,614 | | | $ | 499,675 | | | $ | 766,054 | | | $ | 542,330 | | | $ | 513,629 | |
| (a) | Per share data based on average shares outstanding during the year. |
| (b) | Total investment return is calculated exclusive of sales charges and assumes the reinvestment of dividends and distributions. Class I shares are not subject to sales charges. For periods of less than one year, total return is not annualized. |
| (c) | In addition to the fees and expenses which the Fund bears directly, it also indirectly bears a pro-rata share of the fees and expenses of the underlying funds in which it invests. Such indirect expenses are not included in the above expense ratios. |
| (d) | The portfolio turnover rates not including mortgage dollar rolls were 54% and 36% for the years ended October 31, 2019 and 2018, respectively. |
| | | | | | | | | | | | | | | | | | | | |
| | |
| | | Year ended October 31, | | | February 27,
2015^
through
October 31, | |
| | | | | |
| Class R2 | | 2019 | | | 2018 | | | 2017 | | | 2016 | | | 2015 | |
| | | | | |
Net asset value at beginning of period | | $ | 18.50 | | | $ | 19.96 | | | $ | 18.29 | | | $ | 18.78 | | | $ | 20.08 | |
| | | | | | | | | | | | | | | | | | | | |
| | | | | |
Net investment income (loss) (a) | | | 0.52 | | | | 0.50 | | | | 0.46 | | | | 0.55 | | | | 0.36 | |
| | | | | |
Net realized and unrealized gain (loss) on investments | | | 1.73 | | | | (1.04 | ) | | | 1.83 | | | | (0.19 | ) | | | (1.35 | ) |
| | | | | |
Net realized and unrealized gain (loss) on foreign currency transactions | | | 0.06 | | | | 0.07 | | | | (0.09 | ) | | | 0.33 | | | | 0.20 | |
| | | | | | | | | | | | | | | | | | | | |
| | | | | |
Total from investment operations | | | 2.31 | | | | (0.47 | ) | | | 2.20 | | | | 0.69 | | | | (0.79 | ) |
| | | | | | | | | | | | | | | | | | | | |
| | | | | |
| Less dividends and distributions: | | | | | | | | | | | | | | | | | | | | |
| | | | | |
From net investment income | | | (0.54 | ) | | | (0.50 | ) | | | (0.53 | ) | | | (0.59 | ) | | | (0.51 | ) |
| | | | | |
From net realized gain on investments | | | (0.32 | ) | | | (0.49 | ) | | | — | | | | (0.59 | ) | | | — | |
| | | | | | | | | | | | | | | | | | | | |
| | | | | |
Total dividends and distributions | | | (0.86 | ) | | | (0.99 | ) | | | (0.53 | ) | | | (1.18 | ) | | | (0.51 | ) |
| | | | | | | | | | | | | | | | | | | | |
| | | | | |
Net asset value at end of period | | $ | 19.95 | | | $ | 18.50 | | | $ | 19.96 | | | $ | 18.29 | | | $ | 18.78 | |
| | | | | | | | | | | | | | | | | | | | |
| | | | | |
Total investment return (b) | | | 12.98 | % | | | (2.48 | %) | | | 12.20 | % | | | 3.99 | % | | | (3.92 | %) |
| | | | | |
| Ratios (to average net assets)/Supplemental Data: | | | | | | | | | | | | | | | | | | | | |
| | | | | |
Net investment income (loss) | | | 2.77 | % | | | 2.61 | % | | | 2.36 | % | | | 3.03 | % | | | 2.90 | % †† |
| | | | | |
Net expenses (c) | | | 1.12 | % | | | 1.11 | % | | | 1.11 | % | | | 1.12 | % | | | 1.12 | % †† |
| | | | | |
Portfolio turnover rate | | | 62 | %(d) | | | 44 | % (d) | | | 29 | % | | | 27 | % | | | 30 | % |
| | | | | |
Net assets at end of period (in 000’s) | | $ | 2,524 | | | $ | 3,587 | | | $ | 4,409 | | | $ | 838 | | | $ | 190 | |
| (a) | Per share data based on average shares outstanding during the period. |
| (b) | Total investment return is calculated exclusive of sales charges and assumes the reinvestment of dividends and distributions. Class R2 shares are not subject to sales charges. For periods of less than one year, total return is not annualized. |
| (c) | In addition to the fees and expenses which the Fund bears directly, it also indirectly bears a pro-rata share of the fees and expenses of the underlying funds in which it invests. Such indirect expenses are not included in the above expense ratios. |
| (d) | The portfolio turnover rates not including mortgage dollar rolls were 54% and 36% for the years ended October 31, 2019 and 2018, respectively. |
| | | | |
| 32 | | MainStay Income Builder Fund | | The notes to the financial statements are an integral part of,
and should be read in conjunction with, the financial statements. |
Financial Highlightsselected per share data and ratios
| | | | | | | | | | | | | | | | |
| | |
| | | Year ended October 31, | | | February 29,
2016^
through
October 31, | |
| | | | |
| Class R3 | | 2019 | | | 2018 | | | 2017 | | | 2016 | |
| | | | |
Net asset value at beginning of period | | $ | 18.51 | | | $ | 19.97 | | | $ | 18.30 | | | $ | 17.10 | |
| | | | | | | | | | | | | | | | |
| | | | |
Net investment income (loss) (a) | | | 0.45 | | | | 0.42 | | | | 0.42 | | | | 0.35 | |
| | | | |
Net realized and unrealized gain (loss) on investments | | | 1.76 | | | | (1.00 | ) | | | 1.82 | | | | (1.69 | ) |
| | | | |
Net realized and unrealized gain (loss) on foreign currency transactions | | | 0.06 | | | | 0.06 | | | | (0.09 | ) | | | 2.95 | |
| | | | | | | | | | | | | | | | |
| | | | |
Total from investment operations | | | 2.27 | | | | (0.52 | ) | | | 2.15 | | | | 1.61 | |
| | | | | | | | | | | | | | | | |
| | | | |
| Less dividends and distributions: | | | | | | | | | | | | | | | | |
| | | | |
From net investment income | | | (0.50 | ) | | | (0.45 | ) | | | (0.48 | ) | | | (0.41 | ) |
| | | | |
From net realized gain on investments | | | (0.32 | ) | | | (0.49 | ) | | | — | | | | — | |
| | | | | | | | | | | | | | | | |
| | | | |
Total dividends and distributions | | | (0.82 | ) | | | (0.94 | ) | | | (0.48 | ) | | | (0.41 | ) |
| | | | | | | | | | | | | | | | |
| | | | |
Net asset value at end of period | | $ | 19.96 | | | $ | 18.51 | | | $ | 19.97 | | | $ | 18.30 | |
| | | | | | | | | | | | | | | | |
| | | | |
Total investment return (b) | | | 12.70 | % | | | (2.73 | %) | | | 11.89 | % | | | 9.42 | % |
| | | | |
| Ratios (to average net assets)/Supplemental Data: | | | | | | | | | | | | | | | | |
| | | | |
Net investment income (loss) | | | 2.34 | % | | | 2.19 | % | | | 2.16 | % | | | 2.81 | %†† |
| | | | |
Net expenses (c) | | | 1.36 | % | | | 1.35 | % | | | 1.36 | % | | | 1.36 | %†† |
| | | | |
Portfolio turnover rate | | | 62 | %(d) | | | 44 | % (d) | | | 29 | % | | | 27 | % |
| | | | |
Net assets at end of period (in 000’s) | | $ | 590 | | | $ | 136 | | | $ | 201 | | | $ | 39 | |
| (a) | Per share data based on average shares outstanding during the period. |
| (b) | Total investment return is calculated exclusive of sales charges and assumes the reinvestment of dividends and distributions. Class R3 shares are not subject to sales charges. For periods of less than one year, total return is not annualized. |
| (c) | In addition to the fees and expenses which the Fund bears directly, it also indirectly bears a pro-rata share of the fees and expenses of the underlying funds in which it invests. Such indirect expenses are not included in the above expense ratios. |
| (d) | The portfolio turnover rates not including mortgage dollar rolls were 54% and 36% for the years ended October 31, 2019 and 2018, respectively. |
| | | | | | | | |
| | |
| Class R6 | | Year ended
October 31,
2019 | | | February 28,
2018^
through
October 31, 2018 | |
| | |
Net asset value at beginning of period | | $ | 18.68 | | | $ | 19.19 | |
| | | | | | | | |
| | |
Net investment income (loss) (a) | | | 0.61 | | | | 0.33 | |
| | |
Net realized and unrealized gain (loss) on investments | | | 1.76 | | | | (0.47 | ) |
| | |
Net realized and unrealized gain (loss) on foreign currency transactions | | | 0.06 | | | | 0.03 | |
| | | | | | | | |
| | |
Total from investment operations | | | 2.43 | | | | (0.11 | ) |
| | | | | | | | |
| | |
| Less dividends and distributions: | | | | | | | | |
| | |
From net investment income | | | (0.63 | ) | | | (0.40 | ) |
| | |
From net realized gain on investments | | | (0.32 | ) | | | — | |
| | | | | | | | |
| | |
Total dividends and distributions | | | (0.95 | ) | | | (0.40 | ) |
| | | | | | | | |
| | |
Net asset value at end of period | | $ | 20.16 | | | $ | 18.68 | |
| | | | | | | | |
| | |
Total investment return (b) | | | 13.52 | % | | | (0.61 | %) |
| | |
| Ratios (to average net assets)/Supplemental Data: | | | | | | | | |
| | |
Net investment income (loss) | | | 3.18 | % | | | 2.55 | % †† |
| | |
Net expenses (c) | | | 0.67 | % | | | 0.66 | % †† |
| | |
Portfolio turnover rate (d) | | | 62 | % | | | 44 | % |
| | |
Net assets at end of period (in 000’s) | | $ | 101,685 | | | $ | 94,869 | |
| (a) | Per share data based on average shares outstanding during the year. |
| (b) | Total investment return is calculated exclusive of sales charges and assumes the reinvestment of dividends and distributions. Class R6 shares are not subject to sales charges. For periods of less than one year, total return is not annualized. |
| (c) | In addition to the fees and expenses which the Fund bears directly, it also indirectly bears a pro-rata share of the fees and expenses of the underlying funds in which it invests. Such indirect expenses are not included in the above expense ratios. |
| (d) | The portfolio turnover rates not including mortgage dollar rolls were 54% and 36% for the year ended October 31, 2019 and period ended October 31, 2018, respectively. |
| | | | | | |
The notes to the financial statements are an integral part of,
and should be read in conjunction with, the financial statements. | | | | | 33 | |
Notes to Financial Statements
Note 1–Organization and Business
The MainStay Funds (the “Trust”) was organized on January 9, 1986, as a Massachusetts business trust and is governed by a Declaration of Trust. The Trust is registered under the Investment Company Act of 1940, as amended (the “1940 Act”), as an open-end management investment company, and is comprised of twelve funds (collectively referred to as the “Funds”). These financial statements and notes relate to the MainStay Income Builder Fund (the “Fund”), a “diversified” fund, as that term is defined in the 1940 Act, as interpreted or modified by regulatory authorities having jurisdiction, from time to time.
The Fund currently has eight classes of shares registered for sale. Class A shares commenced operations on January 3, 1995. Class B shares commenced operations on December 29, 1987. Class C shares commenced operations on September 1, 1998. Class I shares commenced operations on January 2, 2004. Investor Class shares commenced operations on February 28, 2008. Class R2 shares commenced operations on February 27, 2015. Class R3 shares commenced operations on February 29, 2016. Class R6 shares commenced operations on February 28, 2018.
Class B shares of the MainStay Group of Funds are closed to all new purchases as well as additional investments by existing Class B shareholders. Existing Class B shareholders may continue to reinvest dividends and capital gains distributions, as well as exchange their Class B shares for Class B shares of other funds in the MainStay Group of Funds as permitted by the current exchange privileges. Class B shareholders continue to be subject to any applicable contingent deferred sales charge (“CDSC”) at the time of redemption. All other features of the Class B shares, including but not limited to the fees and expenses applicable to Class B shares, remain unchanged. Unless redeemed, Class B shareholders will remain in Class B shares of their respective fund until the Class B shares are converted to Class A or Investor Class shares pursuant to the applicable conversion schedule.
Class A and Investor Class shares are offered at net asset value (“NAV”) per share plus an initial sales charge. No initial sales charge applies to investments of $1 million or more (and certain other qualified purchases) in Class A and Investor Class shares. However, a CDSC of 1.00% may be imposed on certain redemptions made within 18 months of the date of purchase on shares that were purchased without an initial sales charge. Class C shares are offered at NAV without an initial sales charge, although a 1.00% CDSC may be imposed on certain redemptions of such shares made within one year of the date of purchase of Class C shares. When Class B shares were offered, they were offered at NAV without an initial sales charge, although a CDSC that declines depending on the number of years a shareholder has held its Class B shares may be imposed on certain redemptions of such shares made within six years of the date of purchase of such shares. Class I, Class R2, Class R3 and Class R6 shares are offered at NAV without a sales charge. Depending upon eligibility, Class B shares convert to either Class A or Investor Class shares at the end of the calendar quarter eight years after the date they were purchased. In addition, depending upon eligibility, Class C shares convert to either Class A or Investor Class shares at the end of the calendar quarter ten years after the date they were purchased. Additionally, as disclosed in the Fund’s prospectus, Class A shares may convert automatically to Investor Class shares and Investor Class shares may convert automatically to Class A
shares. Under certain circumstances and as may be permitted by the Trust’s multiple class plan pursuant to Rule 18f-3 under the 1940 Act, specified share classes of the Fund may be converted to one or more other share classes of the Fund as disclosed in the capital share transactions within these Notes. The classes of shares have the same voting (except for issues that relate solely to one class), dividend, liquidation and other rights, and the same terms and conditions, except that under distribution plans pursuant to Rule 12b-1 under the 1940 Act, Class B and Class C shares are subject to higher distribution and/or service fees than Class A, Investor Class, Class R2 and Class R3 shares. Class I and Class R6 shares are not subject to a distribution and/or service fee. Class R2 and Class R3 shares are subject to a shareholder service fee, which is in addition to fees paid under the distribution plans for Class R2 and Class R3 shares.
The Fund’s investment objective is to seek current income consistent with reasonable opportunity for future growth of capital and income.
Note 2–Significant Accounting Policies
The Fund is an investment company and accordingly follows the investment company accounting and reporting guidance of the Financial Accounting Standards Board (“FASB”) Accounting Standard CodificationTopic 946 Financial Services—Investment Companies. The Fund prepares its financial statements in accordance with generally accepted accounting principles (“GAAP”) in the United States of America and follows the significant accounting policies described below.
(A) Securities Valuation. Investments are usually valued as of the close of regular trading on the New York Stock Exchange (the “Exchange”) (usually 4:00 p.m. Eastern time) on each day the Fund is open for business (“valuation date”).
The Board of Trustees of the Trust (the “Board”) adopted procedures establishing methodologies for the valuation of the Fund’s securities and other assets and delegated the responsibility for valuation determinations under those procedures to the Valuation Committee of the Trust (the “Valuation Committee”). The Board authorized the Valuation Committee to appoint a Valuation Subcommittee (the “Subcommittee”) to deal in the first instance with establishing the prices of securities for which market quotations are not readily available or the prices of which are not otherwise readily determinable under these procedures. The Subcommittee meets (in person, via electronic mail or via teleconference) on an as-needed basis. Subsequently, the Valuation Committee meets to ensure that actions taken by the Subcommittee were appropriate. The procedures state that, subject to the oversight of the Board and unless otherwise noted, the responsibility for theday-to-day valuation of portfolio assets (including fair value measurements for the Fund’s assets and liabilities) rests with New York Life Investment Management LLC (“New York Life Investments” or the “Manager”), aided to whatever extent necessary by the Subadvisors (as defined in Note 3(A)).
To assess the appropriateness of security valuations, the Manager, the Subadvisors or the Fund’s third-party service provider, who is subject to oversight by the Manager, regularly compares prior day prices, prices on comparable securities and the sale prices to the prior and current day prices and challenges prices with changes exceeding certain tolerance levels with third-party pricing services or broker sources. For those
| | |
| 34 | | MainStay Income Builder Fund |
securities valued through either a standardized fair valuation methodology or a fair valuation measurement, the Subcommittee deals in the first instance with such valuation and the Valuation Committee reviews and affirms, if appropriate, the reasonableness of the valuation based on such methodologies and measurements on a regular basis after considering information that is reasonably available and deemed relevant by the Valuation Committee. Any action taken by the Subcommittee with respect to the valuation of a portfolio security or other asset is submitted for review and ratification (if appropriate) to the Valuation Committee and the Board at the next regularly scheduled meeting.
“Fair value” is defined as the price the Fund would reasonably expect to receive upon selling an asset or liability in an orderly transaction to an independent buyer in the principal or most advantageous market for the asset or liability. Fair value measurements are determined within a framework that establishes a three-tier hierarchy which maximizes the use of observable market data and minimizes the use of unobservable inputs to establish a classification of fair value measurements for disclosure purposes. “Inputs” refer broadly to the assumptions that market participants would use in pricing the asset or liability, including assumptions about risk, such as the risk inherent in a particular valuation technique used to measure fair value using a pricing model and/or the risk inherent in the inputs for the valuation technique. Inputs may be observable or unobservable. Observable inputs reflect the assumptions market participants would use in pricing the asset or liability based on market data obtained from sources independent of the Fund. Unobservable inputs reflect the Fund’s own assumptions about the assumptions market participants would use in pricing the asset or liability based on the information available. The inputs or methodology used for valuing assets or liabilities may not be an indication of the risks associated with investing in those assets or liabilities. The three-tier hierarchy of inputs is summarized below.
| • | | Level 1—quoted prices in active markets for an identical asset or liability |
| • | | Level 2—other significant observable inputs (including quoted prices for a similar asset or liability in active markets, interest rates and yield curves, prepayment speeds, credit risk, etc.) |
| • | | Level 3—significant unobservable inputs (including the Fund’s own assumptions about the assumptions that market participants would use in measuring fair value of an asset or liability) |
The level of an asset or liability within the fair value hierarchy is based on the lowest level of an input, both individually and in the aggregate, that is significant to the fair value measurement. As of October 31, 2019, the aggregate value by input level of the Fund’s assets and liabilities is included at the end of the Fund’s Portfolio of Investments.
The Fund may use third-party vendor evaluations, whose prices may be derived from one or more of the following standard inputs, among others:
| | |
• Benchmark yields | | • Reported trades |
• Broker/dealer quotes | | • Issuer spreads |
• Two-sided markets | | • Benchmark securities |
• Bids/offers | | • Reference data (corporate actions or material event notices) |
• Industry and economic events | | • Comparable bonds |
• Monthly payment information | | |
An asset or liability for which market values cannot be measured using the methodologies described above is valued by methods deemed reasonable in good faith by the Valuation Committee, following the procedures established by the Board, to represent fair value. Under these procedures, the Fund generally uses a market-based approach which may use related or comparable assets or liabilities, recent transactions, market multiples, book values and other relevant information. The Fund may also use an income-based valuation approach in which the anticipated future cash flows of the asset or liability are discounted to calculate fair value. Discounts may also be applied due to the nature and/or duration of any restrictions on the disposition of the asset or liability. Fair value represents a good faith approximation of the value of a security. Fair value determinations involve the consideration of a number of subjective factors, an analysis of applicable facts and circumstances and the exercise of judgment. As a result, it is possible that the fair value for a security determined in good faith in accordance with the Fund’s valuation procedures may differ from valuations for the same security determined by other funds using their own valuation procedures. Although the Fund’s valuation procedures are designed to value a security at the price the Fund may reasonably expect to receive upon the security’s sale in an orderly transaction, there can be no assurance that any fair value determination thereunder would, in fact, approximate the amount that the Fund would actually realize upon the sale of the security or the price at which the security would trade if a reliable market price were readily available. During the year ended October 31, 2019, there were no material changes to the fair value methodologies.
Securities which may be valued in this manner include, but are not limited to: (i) a security for which trading has been halted or suspended; (ii) a debt security that has recently gone into default and for which there is not a current market quotation; (iii) a security of an issuer that has entered into a restructuring; (iv) a security that has been delisted from a national exchange; (v) a security for which the market price is not readily available from a third-party pricing source or, if so provided, does not, in the opinion of the Manager or the Subadvisors, reflect the security’s market value; (vi) a security subject to trading collars for which no or limited trading takes place; and (vii) a security whose principal market has been temporarily closed at a time when, under normal conditions, it would be open. Securities valued in this manner are generally categorized as Level 3 in the hierarchy. As of October 31, 2019, securities that were fair valued in such a manner are shown in the Portfolio of Investments.
Certain securities held by the Fund may principally trade in foreign markets. Events may occur between the time the foreign markets close
Notes to Financial Statements(continued)
and the time at which the Fund’s NAVs are calculated. These events may include, but are not limited to, situations relating to a single issuer in a market sector, significant fluctuations in U.S. or foreign markets, natural disasters, armed conflicts, governmental actions or other developments not tied directly to the securities markets. Should the Manager or the Subadvisors conclude that such events may have affected the accuracy of the last price of such securities reported on the local foreign market, the Subcommittee may, pursuant to procedures adopted by the Board, adjust the value of the local price to reflect the estimated impact on the price of such securities as a result of such events. In this instance, securities are generally categorized as Level 3 in the hierarchy. Additionally, certain foreign equity securities are also fair valued whenever the movement of a particular index exceeds certain thresholds. In such cases, the securities are fair valued by applying factors provided by a third-party vendor in accordance with valuation procedures adopted by the Board and are generally categorized as Level 2 in the hierarchy. As of October 31, 2019, there were no foreign equity securities held by the Fund that were fair valued in such a manner.
Equity securities are valued at the last quoted sales prices as of the close of regular trading on the relevant exchange on each valuation date. Securities that are not traded on the valuation date are valued at the mean of the last quoted bid and ask prices. Prices are normally taken from the principal market in which each security trades. These securities are generally categorized as Level 1 in the hierarchy.
Futures contracts are valued at the last posted settlement price on the market where such futures are primarily traded. Investments in mutual funds, including money market funds, are valued at their respective NAVs as of the close of the Exchange on the valuation date. These securities are generally categorized as Level 1 in the hierarchy.
Debt securities (other than convertible and municipal bonds) are valued at the evaluated bid prices (evaluated mean prices in the case of convertible and municipal bonds) supplied by a pricing agent or brokers selected by the Manager, in consultation with the Subadvisors. The evaluations are market-based measurements processed through a pricing application and represents the pricing agent’s good faith determination as to what a holder may receive in an orderly transaction under market conditions. The rules based logic utilizes valuation techniques that reflect participants’ assumptions and vary by asset class and per methodology, maximizing the use of relevant observable data including quoted prices for similar assets, benchmark yield curves and market corroborated inputs. The evaluated bid or mean prices are deemed by the Manager, in consultation with the Subadvisors to be representative of market values at the regular close of trading of the Exchange on each valuation date. Debt securities purchased on a delayed delivery basis are marked to market daily until settlement at the forward settlement date. Debt securities, including corporate bonds, U.S. government and federal agency bonds, municipal bonds, foreign bonds, convertible bonds, asset-backed securities and mortgage-backed securities are generally categorized as Level 2 in the hierarchy.
Foreign currency forward contracts are valued at their fair market values measured on the basis of the mean between the last current bid and ask prices based on dealer or exchange quotations and are generally categorized as Level 2 in the hierarchy.
Loan assignments, participations and commitments are valued at the average of bid quotations obtained from the engaged independent
pricing service and are generally categorized as Level 2 in the hierarchy. Certain loan assignments, participations and commitments may be valued by utilizing significant unobservable inputs obtained from the pricing service and are generally categorized as Level 3 in the hierarchy. As of October 31, 2019, there were no loan assignments held by the Fund that were fair valued in such a manner.
Temporary cash investments acquired in excess of 60 days to maturity at the time of purchase are valued using the latest bid prices or using valuations based on a matrix system (which considers such factors as security prices, yields, maturities and ratings), both as furnished by independent pricing services. Other temporary cash investments which mature in 60 days or less at the time of purchase (“Short-Term Investments”) are valued using the amortized cost method of valuation, unless the use of such method would be inappropriate. The amortized cost method involves valuing a security at its cost on the date of purchase and thereafter assuming a constant amortization to maturity of the difference between such cost and the value on maturity date. Amortized cost approximates the current fair value of a security. Securities valued using the amortized cost method are not valued using quoted prices in an active market and are generally categorized as Level 2 in the hierarchy.
The information above is not intended to reflect an exhaustive list of the methodologies that may be used to value portfolio investments. The valuation procedures permit the use of a variety of valuation methodologies in connection with valuing portfolio investments. The methodology used for a specific type of investment may vary based on the market data available or other considerations. The methodologies summarized above may not represent the specific means by which portfolio investments are valued on any particular business day.
A portfolio investment may be classified as an illiquid investment under the Trust’s written liquidity risk management program and related procedures (“Liquidity Program”). Illiquidity of an investment might prevent the sale of such investment at a time when the Manager or the Subadvisor might wish to sell, and these investments could have the effect of decreasing the overall level of the Fund’s liquidity. Further, the lack of an established secondary market may make it more difficult to value illiquid investments, requiring the Fund to rely on judgments that may be somewhat subjective in measuring value, which could vary materially from the amount that the Fund could realize upon disposition. Difficulty in selling illiquid investments may result in a loss or may be costly to the Fund. An illiquid investment is any investment that the Manager or Subadvisor reasonably expects cannot be sold or disposed of in current market conditions in seven calendar days or less without the sale or disposition significantly changing the market value of the investment. The liquidity classification of each investment will be made using information obtained after reasonable inquiry and taking into account, among other things, relevant market, trading and investment-specific considerations in accordance with the Liquidity Program. Illiquid investments are often valued in accordance with methods deemed by the Board in good faith to be reasonable and appropriate to accurately reflect their fair value. The liquidity of the Fund’s investments, as shown in the Portfolio of Investments, was determined as of October 31, 2019, and can change at any time. Illiquid investments as of October 31, 2019, are shown in the Portfolio of Investments.
| | |
| 36 | | MainStay Income Builder Fund |
(B) Income Taxes. The Fund’s policy is to comply with the requirements of the Internal Revenue Code of 1986, as amended (the “Internal Revenue Code”), applicable to regulated investment companies and to distribute all of its taxable income to the shareholders of the Fund within the allowable time limits. Therefore, no federal, state and local income tax provisions are required.
Management evaluates the Fund’s tax positions to determine if the tax positions taken meet the minimum recognition threshold in connection with accounting for uncertainties in income tax positions taken or expected to be taken for the purposes of measuring and recognizing tax liabilities in the financial statements. Recognition of tax benefits of an uncertain tax position is permitted only to the extent the position is “more likely than not” to be sustained assuming examination by taxing authorities. Management has analyzed the Fund’s tax positions taken on federal, state and local income tax returns for all open tax years (for up to three tax years) and has concluded that no provisions for federal, state and local income tax are required in the Fund’s financial statements. The Fund’s federal, state and local income tax and federal excise tax returns for tax years for which the applicable statutes of limitations have not expired are subject to examination by the Internal Revenue Service and state and local departments of revenue.
(C) Foreign Taxes. The Fund may be subject to foreign taxes on income and other transaction-based taxes imposed by certain countries in which it invests. A portion of the taxes on gains on investments or currency purchases/repatriation may be reclaimable. The Fund will accrue such taxes and reclaims as applicable, based upon its current interpretation of tax rules and regulations that exist in the markets in which it invests.
The Fund may be subject to taxation on realized capital gains, repatriation proceeds and other transaction-based taxes imposed by certain countries in which it invests. The Fund will accrue such taxes as applicable based upon its current interpretation of tax rules and regulations that exist in the market in which it invests. Capital gains taxes relating to positions still held are reflected as a liability on the Statement of Assets and Liabilities, as well as an adjustment to the Fund’s net unrealized appreciation (depreciation). Taxes related to capital gains realized, if any, are reflected as part of net realized gain (loss) in the Statement of Operations. Changes in tax liabilities related to capital gains taxes on unrealized investment gains, if any, are reflected as part of the change in net unrealized appreciation (depreciation) on investments in the Statement of Operations. Transaction-based charges are generally assessed as a percentage of the transaction amount.
(D) Dividends and Distributions to Shareholders. Dividends and distributions are recorded on the ex-dividend date. The Fund intends to declare and pay dividends from net investment income, if any, at least monthly and distributions from net realized capital and currency gains, if any, at least annually. Unless the shareholder elects otherwise, all dividends and distributions are reinvested in the same class of shares of the Fund, at NAV. Dividends and distributions to shareholders are determined in accordance with federal income tax regulations and may differ from determinations using GAAP.
(E) Security Transactions and Investment Income. The Fund records security transactions on the trade date. Realized gains and losses on security transactions are determined using the identified cost
method. Dividend income is recognized on the ex-dividend date; net of any foreign tax withheld at the source, and interest income is accrued as earned using the effective interest rate method and includes any realized gains and losses from repayments of principal on mortgage-backed securities. Discounts and premiums on securities purchased for the Fund are accreted and amortized, respectively, on the effective interest rate method over the life of the respective securities. Income frompayment-in-kind securities, to the extent the Fund held any such securities during the year ended October 31, 2019, is accreted daily based on the effective interest method.
Investment income and realized and unrealized gains and losses on investments of the Fund are allocated pro rata to the separate classes of shares based upon their relative net assets on the date the income is earned or realized and unrealized gains and losses are incurred.
The Fund may place a debt security on non-accrual status and reduce related interest income by ceasing current accruals and writing off all or a portion of any interest receivables when the collection of all or a portion of such interest has become doubtful. A debt security is removed from non-accrual status when the issuer resumes interest payments or when collectability of interest is reasonably assured.
(F) Expenses. Expenses of the Trust are allocated to the individual Funds in proportion to the net assets of the respective Funds when the expenses are incurred, except where direct allocations of expenses can be made. Expenses (other than transfer agent expenses and fees incurred under the shareholder services plans and/or the distribution plans further discussed in Note 3(B)) are allocated to separate classes of shares pro rata based upon their relative net assets on the date the expenses are incurred. The expenses borne by the Fund, including those of related parties to the Fund, are shown in the Statement of Operations.
Additionally, the Fund may invest in mutual funds, which are subject to management fees and other fees that may cause the costs of investing in mutual funds to be greater than the costs of owning the underlying securities directly. These indirect expenses of mutual funds are not included in the amounts shown as expenses in the Fund’s Statement of Operations or in the expense ratios included in the Financial Highlights.
(G) Use of Estimates. In preparing financial statements in conformity with GAAP, management makes estimates and assumptions that affect the reported amounts and disclosures in the financial statements. Actual results could differ from those estimates.
(H) Repurchase Agreements. The Fund may enter into repurchase agreements (i.e., buy a security from another party with the agreement that it will be sold back in the future) to earn income. The Fund may enter into repurchase agreements only with counterparties, usually financial institutions, that are deemed by the Manager or the Subadvisors to be creditworthy, pursuant to guidelines established by the Board. During the term of any repurchase agreement, the Manager or the Subadvisors will continue to monitor the creditworthiness of the counterparty. Under the 1940 Act, repurchase agreements are considered to be collateralized loans by the Fund to the counterparty secured by the securities transferred to the Fund.
Repurchase agreements are subject to counterparty risk, meaning the Fund could lose money by the counterparty’s failure to perform under
Notes to Financial Statements(continued)
the terms of the agreement. The Fund mitigates this risk by ensuring the repurchase agreement is collateralized by cash, U.S. government securities, fixed income securities and/or other securities. The collateral is held by the Fund’s custodian and valued daily on a mark to market basis to determine if the value, including accrued interest, exceeds the repurchase price. In the event of the counterparty’s default on the obligation to repurchase, the Fund has the right to liquidate the collateral and apply the proceeds in satisfaction of the obligation. Under certain circumstances, such as in the event of default or bankruptcy by the counterparty, realization and/or retention of the collateral may be limited or subject to delay, to legal proceedings and possible realized loss to the Fund. As of October 31, 2019, the Fund did not hold any repurchase agreements.
(I) Loan Assignments, Participations and Commitments. The Fund may invest in loan assignments and participations (“loans”). Commitments are agreements to make money available to a borrower in a specified amount, at a specified rate and within a specified time. The Fund records an investment when the borrower withdraws money on a commitment or when a funded loan is purchased (trade date) and records interest as earned. These loans pay interest at rates that are periodically reset by reference to a base lending rate plus a spread. These base lending rates are generally the prime rate offered by a designated U.S. bank or the London Interbank Offered Rate (“LIBOR”).
The loans in which the Fund may invest are generally readily marketable, but may be subject to some restrictions on resale. For example, the Fund may be contractually obligated to receive approval from the agent bank and/or borrower prior to the sale of these investments. If the Fund purchases an assignment from a lender, the Fund will generally have direct contractual rights against the borrower in favor of the lender. If the Fund purchases a participation interest either from a lender or a participant, the Fund typically will have established a direct contractual relationship with the seller of the participation interest, but not with the borrower. Consequently, the Fund is subject to the credit risk of the lender or participant who sold the participation interest to the Fund, in addition to the usual credit risk of the borrower. In the event that the borrower, selling participant or intermediate participants become insolvent or enter into bankruptcy, the Fund may incur certain costs and delays in realizing payment, or may suffer a loss of principal and/or interest.
Unfunded commitments represent the remaining obligation of the Fund to the borrower. At any point in time, up to the maturity date of the issue, the borrower may demand the unfunded portion. Unfunded amounts, if any, are marked to market and any unrealized gains or losses are recorded in the Statement of Assets and Liabilities. As of October 31, 2019, the Fund did not hold any unfunded commitments.
(J) Futures Contracts. A futures contract is an agreement to purchase or sell a specified quantity of an underlying instrument at a specified future date and price, or to make or receive a cash payment based on the value of a financial instrument (e.g., foreign currency, interest rate, security or securities index). The Fund is subject to risks such as market price risk and/or interest rate risk in the normal course of investing in these transactions. Upon entering into a futures contract, the Fund is required to pledge to the broker or futures commission merchant an amount of cash and/or U.S. government securities equal to a certain percentage of the collateral amount, known as the “initial
margin.” During the period the futures contract is open, changes in the value of the contract are recognized as unrealized appreciation or depreciation by marking to market such contract on a daily basis to reflect the market value of the contract at the end of each day’s trading. The Fund agrees to receive from or pay to the broker or futures commission merchant an amount of cash equal to the daily fluctuation in the value of the contract. Such receipts or payments are known as “variation margin.” When the futures contract is closed, the Fund records a realized gain or loss equal to the difference between the proceeds from (or cost of) the closing transaction and the Fund’s basis in the contract.
The use of futures contracts involves, to varying degrees, elements of market risk in excess of the amount recognized in the Statement of Assets and Liabilities. The contract or notional amounts and variation margin reflect the extent of the Fund’s involvement in open futures positions. There are several risks associated with the use of futures contracts as hedging techniques. There can be no assurance that a liquid market will exist at the time when the Fund seeks to close out a futures contract. If no liquid market exists, the Fund would remain obligated to meet margin requirements until the position is closed. Futures may involve a small initial investment relative to the risk assumed, which could result in losses greater than if they had not been used. Futures may be more volatile than direct investments in the instrument underlying the futures and may not correlate to the underlying instrument, causing a given hedge not to achieve its objectives. The Fund’s activities in futures contracts have minimal counterparty risk as they are conducted through regulated exchanges that guarantee the futures against default by the counterparty. In the event of a bankruptcy or insolvency of a futures commission merchant that holds margin on behalf of the Fund, the Fund may not be entitled to the return of the entire margin owed to the Fund, potentially resulting in a loss. The Fund may invest in futures contracts in order to hedge against anticipated changes in interest rates that might otherwise have an adverse effect upon the value of the Fund’s securities. The Fund may also use equity index futures contracts to increase the equity sensitivity to the Fund. The Fund’s investment in futures contracts and other derivatives may increase the volatility of the Fund’s NAVs and may result in a loss to the Fund. As of October 31, 2019, open futures contracts are shown in the Portfolio of Investments.
(K) Foreign Currency Forward Contracts. The Fund may enter into foreign currency forward contracts, which are agreements to buy or sell foreign currencies on a specified future date at a specified rate. The Fund is subject to foreign currency exchange rate risk in the normal course of investing in these transactions. During the period the forward contract is open, changes in the value of the contract are recognized as unrealized appreciation or depreciation by marking to market such contract on a daily basis to reflect the market value of the contract at the end of each day’s trading. Cash movement occurs on settlement date. When the forward contract is closed, the Fund records a realized gain or loss equal to the difference between the proceeds from (or cost of) the closing transaction and the Fund’s basis in the contract. The Fund may purchase and sell foreign currency forward contracts for purposes of seeking to enhance portfolio returns and manage portfolio risk more efficiently. Foreign currency forward contracts may also be used to gain exposure to a particular currency or to hedge against the risk of loss due to changing currency exchange rates. Foreign currency
| | |
| 38 | | MainStay Income Builder Fund |
forward contracts to purchase or sell a foreign currency may also be used in anticipation of future purchases or sales of securities denominated in foreign currency, even if the specific investments have not yet been selected.
The use of foreign currency forward contracts involves, to varying degrees, elements of risk in excess of the amount recognized in the Statement of Assets and Liabilities, including counterparty risk, market risk and illiquidity risk. Counterparty risk is heightened for these instruments because foreign currency forward contracts are not exchange-traded and therefore no clearinghouse or exchange stands ready to meet the obligations under such contracts. Thus, the Fund faces the risk that its counterparties under such contracts may not perform their obligations. Market risk is the risk that the value of a foreign currency forward contract will depreciate due to unfavorable changes in exchange rates. Illiquidity risk arises because the secondary market for foreign currency forward contracts may have less liquidity relative to markets for other securities and financial instruments. Risks also arise from the possible movements in the foreign exchange rates underlying these instruments. While the Fund may enter into forward contracts to reduce currency exchange risks, changes in currency exchange rates may result in poorer overall performance for the Fund than if it had not engaged in such transactions. Exchange rate movements can be large, depending on the currency, and can last for extended periods of time, affecting the value of the Fund’s assets. Moreover, there may be an imperfect correlation between the Fund’s holdings of securities denominated in a particular currency and forward contracts entered into by the Fund. Such imperfect correlation may prevent the Fund from achieving the intended hedge or expose the Fund to the risk of currency exchange loss. The unrealized appreciation (depreciation) on forward contracts also reflects the Fund’s exposure at the valuation date to credit loss in the event of a counterparty’s failure to perform its obligations. As of October 31, 2019, open foreign currency forward contracts are shown in the Portfolio of Investments.
(L) Foreign Currency Transactions. The Fund’s books and records are maintained in U.S. dollars. Prices of securities denominated in foreign currency amounts are translated into U.S. dollars at the mean between the buying and selling rates last quoted by any major U.S. bank at the following dates:
| (i) | market value of investment securities, other assets and liabilities— at the valuation date; and |
| (ii) | purchases and sales of investment securities, income and expenses—at the date of such transactions. |
The assets and liabilities that are denominated in foreign currency amounts are presented at the exchange rates and market values at the close of the period. The realized and unrealized changes in net assets arising from fluctuations in exchange rates and market prices of securities are not separately presented.
Net realized gain (loss) on foreign currency transactions represents net gains and losses on foreign currency forward contracts, net currency gains or losses realized as a result of differences between the amounts of securities sale proceeds or purchase cost, dividends, interest and withholding taxes as recorded on the Fund’s books, and the U.S. dollar equivalent amount actually received or paid. Net currency gains or losses from valuing such foreign currency denominated assets and
liabilities, other than investments at valuation date exchange rates, are reflected in unrealized foreign exchange gains or losses.
(M) Securities Lending. In order to realize additional income, the Fund may engage in securities lending, subject to the limitations set forth in the 1940 Act and relevant guidance by the staff of the Securities and Exchange Commission (“SEC”). In the event the Fund does engage in securities lending, the Fund will lend through its custodian, State Street Bank and Trust Company (“State Street”), acting as securities lending agent on behalf of the Fund. State Street will manage the Fund’s collateral in accordance with the securities lending agency agreement between the Fund and State Street, and indemnify the Fund against counterparty risk. The loans will be collateralized by cash (which may be invested in a money market fund) and/ornon-cash collateral (which may include U.S. Treasury securities and/or U.S. Government Agency securities issued or guaranteed by the United States government or its agencies or instrumentalities) at least equal at all times to the market value of the securities loaned. The Fund may bear the risk of delay in recovery of, or loss of rights in, the securities loaned should the borrower of the securities experience financial difficulty. The Fund may also record a realized gain or loss on securities deemed sold due to a borrower’s inability to return securities on loan. The Fund bears the risk of any loss on investment of cash collateral. The Fund will receive compensation for lending its securities in the form of fees or it will retain a portion of interest earned on the investment of any cash collateral. The Fund will also continue to receive interest and dividends on the securities loaned and any gain or loss in the market price of the securities loaned that may occur during the term of the loan will be for the account of the Fund. Income earned from securities lending activities, if any, is reflected in the Statement of Operations. As of October 31, 2019, the Fund had securities on loan with an aggregate market value of $2,552,713 and received cash collateral, which was invested into the State Street Navigator Securities Lending Government Money Market Portfolio, with a value of $2,616,900.
(N) Debt and Foreign Securities Risk. The ability of issuers of debt securities held by the Fund to meet their obligations may be affected by, among other things, economic or political developments in a specific country, industry or region. Debt securities are also subject to the risks associated with changes in interest rates.
The Fund may invest in high-yield debt securities (sometimes called “junk bonds”), which are generally considered speculative because they present a greater risk of loss, including default, than higher quality debt securities. These securities pay investors a premium—a higher interest rate or yield than investment grade debt securities—because of the increased risk of loss. These securities can also be subject to greater price volatility. In times of unusual or adverse market, economic or political conditions, these securities may experience higher than normal default rates.
The Fund may invest in foreign securities, which carry certain risks that are in addition to the usual risks inherent in domestic securities. These risks include those resulting from currency fluctuations, future adverse political or economic developments and possible imposition of currency exchange blockages or other foreign governmental laws or restrictions. These risks are likely to be greater in emerging markets than in developed markets. The ability of issuers of securities held by the Fund to
meet their obligations may be affected by, among other things,
Notes to Financial Statements(continued)
economic or political developments in a specific country, industry or region.
The Fund may invest in loans which are usually rated below investment grade and are generally considered speculative because they present a greater risk of loss, including default, than higher rated debt securities. These investments pay investors a higher interest rate than investment grade debt securities because of the increased risk of loss. Although certain loans are collateralized, there is no guarantee that the value of the collateral will be sufficient to repay the loan. In a recession or serious credit event, the value of these investments could decline significantly. As a result, the Fund’s NAVs could go down and you could lose money.
In addition, loans generally are subject to extended settlement periods that may be longer than seven days. As a result, the Fund may be adversely affected by selling other investments at an unfavorable time and/or under unfavorable conditions or engaging in borrowing transactions, such as borrowing against its credit facility, to raise cash to meet redemption obligations or pursue other investment opportunities.
In certain circumstances, loans may not be deemed to be securities. As a result, the Fund may not have the protection of anti-fraud provisions of the federal securities laws. In such cases, the Fund generally must rely on the contractual provisions in the loan agreement and common-law fraud protections under applicable state law.
(O) Counterparty Credit Risk. In order to better define its contractual rights and to secure rights that will help the Fund mitigate its counterparty risk, the Fund may enter into an International Swaps and Derivatives Association, Inc. Master Agreement (“ISDA Master Agreement”) or similar agreement with its counterparties. An ISDA Master Agreement is a bilateral agreement between the Fund and a counterparty that governs certain OTC derivatives and typically contains collateral posting terms and netting provisions. Under an ISDA Master Agreement, the Fund may, under certain circumstances, offset with the counterparty certain derivative financial instruments’ payables and/or receivables with collateral held and/or posted and create one single net payment. The provisions of the ISDA Master Agreement typically permit a single net payment in the event of default including the bankruptcy or insolvency of the counterparty. Bankruptcy or insolvency laws of a
particular jurisdiction may restrict or prohibit the right of offset in bankruptcy, insolvency or other events. In addition, certain ISDA Master Agreements may contain provisions for early termination of OTC derivative transactions in the event the net assets of the Fund decline below specific levels or if the Fund fails to meet the terms of its ISDA Master Agreements. The result would cause the Fund to accelerate payment of any net liability owed to the counterparty.
For financial reporting purposes, the Fund does not offset derivative assets and derivative liabilities that are subject to netting arrangements, if any, in the Statement of Assets and Liabilities.
(P) Indemnifications. Under the Trust’s organizational documents, its officers and trustees are indemnified against certain liabilities that may arise out of performance of their duties to the Trust. Additionally, in the normal course of business, the Fund enters into contracts with third-party service providers that contain a variety of representations and warranties and which may provide general indemnifications. The Fund’s maximum exposure under these arrangements is unknown, as this would involve future claims that may be made against the Fund that have not yet occurred. Based on experience, management is of the view that the risk of loss in connection with these potential indemnification obligations is remote. However, there can be no assurance that material liabilities related to such obligations will not arise in the future, which could adversely impact the Fund.
(Q) Quantitative Disclosure of Derivative Holdings. The following tables show additional disclosures related to the Fund’s derivative and hedging activities, including how such activities are accounted for and their effect on the Fund’s financial positions, performance and cash flows. The Fund entered into Treasury futures contracts in order to hedge against anticipated changes in interest rates that might otherwise have an adverse effect upon the value of the Fund’s securities. The Fund also entered into domestic and foreign equity index futures contracts to increase the equity sensitivity to the Fund. Foreign currency forward contracts were used to gain exposure to a particular currency or to hedge against the risk of loss due to changing currency exchange rates. These derivatives are not accounted for as hedging instruments.
Fair value of derivative instruments as of October 31, 2019:
Asset Derivatives
| | | | | | | | | | | | | | | | | | |
| | | Statement of
Assets and Liabilities
Location | | Foreign
Exchange
Contracts
Risk | | | Equity
Contracts
Risk | | | Interest
Rate
Contracts
Risk | | | Total | |
| | | | | |
Futures Contracts | | Net Assets—Net unrealized appreciation on investments and futures contracts (a) | | $ | — | | | $ | 6,254,965 | | | $ | 129,588 | | | $ | 6,384,553 | |
Forward Contracts | | Unrealized appreciation on foreign currency forward contracts | | | 2,308,739 | | | | — | | | | — | | | | 2,308,739 | |
| | | | | | |
Total Fair Value | | | | $ | 2,308,739 | | | $ | 6,254,965 | | | $ | 129,588 | | | $ | 8,693,292 | |
| | | | | | |
| | |
| 40 | | MainStay Income Builder Fund |
Liability Derivatives
| | | | | | | | | | | | | | | | | | |
| | | Statement of
Assets and Liabilities
Location | | Foreign
Exchange
Contracts
Risk | | | Equity
Contracts
Risk | | | Interest
Rate
Contracts
Risk | | | Total | |
| | | | | |
Futures Contracts | | Net Assets—Net unrealized depreciation on investments and futures contracts (a) | | $ | — | | | $ | — | | | $ | (2,056,422 | ) | | $ | (2,056,422 | ) |
Forward Contracts | | Unrealized depreciation on foreign currency forward contracts | | | (3,239,088 | ) | | | — | | | | — | | | | (3,239,088 | ) |
| | | | | | |
Total Fair Value | | | | $ | (3,239,088 | ) | | $ | — | | | $ | (2,056,422 | ) | | $ | (5,295,510 | ) |
| | | | | | |
| (a) | Includes cumulative appreciation (depreciation) of futures contracts as reported in the Portfolio of Investments. Only current day’s variation margin is reported within the Statement of Assets and Liabilities. |
The effect of derivative instruments on the Statement of Operations for the year ended October 31, 2019:
Realized Gain (Loss)
| | | | | | | | | | | | | | | | | | |
| | | Statement of
Operations
Location | | Foreign
Exchange
Contracts
Risk | | | Equity
Contracts
Risk | | | Interest
Rate
Contracts
Risk | | | Total | |
| | | | | |
Futures Contracts | | Net realized gain (loss) on futures transactions | | $ | — | | | $ | 4,496,405 | | | $ | 13,175,975 | | | $ | 17,672,380 | |
Forward Contracts | | Net realized gain (loss) on foreign currency forward transactions | | | 9,450,022 | | | | — | | | | — | | | | 9,450,022 | |
| | | | | | |
Total Realized Gain (Loss) | | | | $ | 9,450,022 | | | $ | 4,496,405 | | | $ | 13,175,975 | | | $ | 27,122,402 | |
| | | | | | |
Change in Unrealized Appreciation (Depreciation)
| | | | | | | | | | | | | | | | | | |
| | | Statement of
Operations
Location | | Foreign
Exchange
Contracts
Risk | | | Equity
Contracts
Risk | | | Interest
Rate
Contracts
Risk | | | Total | |
| | | | | |
Futures Contracts | | Net change in unrealized appreciation (depreciation) on futures contracts | | $ | — | | | $ | 16,769,094 | | | $ | 2,432,513 | | | $ | 19,201,607 | |
Forward Contracts | | Net change in unrealized appreciation (depreciation) on foreign currency forward contracts | | | (5,133,523 | ) | | | — | | | | — | | | | (5,133,523 | ) |
| | | | | | |
Total Change in Unrealized Appreciation (Depreciation) | | | | $ | (5,133,523 | ) | | $ | 16,769,094 | | | $ | 2,432,513 | | | $ | 14,068,084 | |
| | | | | | |
Average Notional Amount
| | | | | | | | | | | | | | | | |
| | | Foreign
Exchange
Contracts
Risk | | | Equity
Contracts
Risk | | | Interest Rate
Contracts
Risk | | | Total | |
| | | | |
Futures Contracts Long | | $ | — | | | $ | 216,279,512 | | | $ | 154,109,717 | | | $ | 370,389,229 | |
Futures Contracts Short | | $ | — | | | $ | — | | | $ | (22,723,145 | ) | | $ | (22,723,145 | ) |
Forward Contracts Long | | $ | 122,507,491 | | | $ | — | | | $ | — | | | $ | 122,507,491 | |
Forward Contracts Short | | $ | (200,479,633 | ) | | $ | — | | | $ | — | | | $ | (200,479,633 | ) |
| | | | |
Note 3–Fees and Related Party Transactions
(A) Manager and Subadvisors. New York Life Investments, a registered investment adviser and an indirect,wholly-owned subsidiary of New York Life Insurance Company (“New York Life”), serves as the Fund’s Manager, pursuant to an Amended and Restated Management Agreement (“Management Agreement”). The Manager provides offices,
conducts clerical, recordkeeping and bookkeeping services and keeps most of the financial and accounting records required to be maintained by the Fund. Except for the portion of salaries and expenses that are the responsibility of the Fund, the Manager pays the salaries and expenses of all personnel affiliated with the Fund and certain operational expenses of the Fund. The Fund reimburses New York Life Investments in an
Notes to Financial Statements(continued)
amount equal to a portion of the compensation of the Chief Compliance Officer attributable to the Fund. MacKay Shields LLC (“MacKay Shields” or the “Subadvisor”), a registered investment adviser and an indirect,wholly-owned subsidiary of New York Life, serves as a Subadvisor to the Fund and is responsible for theday-to-day portfolio management of the fixed-income portion of the Fund, pursuant to the terms of an Amended and Restated Subadvisory Agreement (“Subadvisory Agreement”) between New York Life Investments and MacKay Shields. Epoch Investment Partners, Inc. (“Epoch” or “Subadvisor” and, together with MacKay Shields, the “Subadvisors”), a registered investment adviser, also serves as a Subadvisor to the Fund and is responsible for theday-to-day portfolio management of the equity portion of the Fund, pursuant to the terms of an Amended and Restated Subadvisory Agreement between New York Life Investments and Epoch. Asset allocation decisions for the Fund are made by a committee chaired by MacKay Shields in collaboration with New York Life Investments. New York Life Investments pays for the services of the Subadvisors.
Under the Management Agreement, the Fund pays the Manager a monthly fee for the services performed and the facilities furnished at an annual rate of the Fund’s average daily net assets as follows: 0.64% up to $500 million; 0.60% from $500 million to $1 billion; 0.575% from $1 billion to $5 billion; and 0.565% in excess of $5 billion, plus a fee for fund accounting services previously provided by New York Life Investments under a separate fund accounting agreement furnished at an annual rate of the Fund’s average daily net assets as follows: 0.05% up to $20 million; 0.0333% from $20 million to $100 million; and 0.01% in excess of $100 million. During the year ended October 31, 2019, the effective management fee rate was 0.62%, inclusive of a fee for fund accounting services of 0.01% of the Fund’s average daily net assets (exclusive of any applicable waivers/reimbursements).
New York Life Investments has contractually agreed to waive fees and/or reimburse expenses so that Total Annual Fund Operating Expenses (excluding taxes, interest, litigation, extraordinary expenses, brokerage and other transaction expenses relating to the purchase or sale of portfolio investments, and acquired (underlying) fund fees and expenses) of Class R6 do not exceed those of Class I. This agreement will remain in effect until February 28, 2020 and shall renew automatically for one-year terms unless New York Life Investments provides written notice of termination prior to the start of the next term or upon approval of the Board.
During the year ended October 31, 2019, New York Life Investments earned fees from the Fund in the amount of $9,138,050, voluntarily waived and/or reimbursed certain class specific expenses in the amount of $31,325, and paid MacKay Shields and Epoch in the amount of $2,558,321 and $2,074,711, respectively.
State Street providessub-administration andsub-accounting services to the Fund pursuant to an agreement with New York Life Investments. These services include calculating the daily NAVs of the Fund, maintaining the general ledger andsub-ledger accounts for the calculation of the Fund’s NAVs and assisting New York Life Investments in conducting various aspects of the Fund’s administrative operations. For providing these services to the Fund, State Street is compensated by New York Life Investments.
Pursuant to an agreement between the Trust and New York Life Investments, New York Life Investments is responsible for providing or
procuring certain regulatory reporting services for the Fund. The Fund will reimburse New York Life Investments for the actual costs incurred by New York Life Investments in connection with providing or procuring these services for the Fund.
(B) Distribution, Service and Shareholder Service Fees. The Trust, on behalf of the Fund, has entered into a distribution agreement with NYLIFE Distributors LLC (the “Distributor”), an indirect,wholly-owned subsidiary of New York Life. The Fund has adopted distribution plans (the “Plans”) in accordance with the provisions of Rule 12b-1 under the 1940 Act.
Pursuant to the Class A, Investor Class and Class R2 Plans, the Distributor receives a monthly distribution fee from the Class A, Investor Class and Class R2 shares at an annual rate of 0.25% of the average daily net assets of the Class A, Investor Class and Class R2 shares for distribution and/or service activities as designated by the Distributor. Pursuant to the Class B and Class C Plans, Class B and Class C shares pay the Distributor a monthly distribution fee at an annual rate of 0.75% of the average daily net assets of the Class B and Class C shares, along with a service fee at an annual rate of 0.25% of the average daily net assets of the Class B and Class C shares, for a total 12b-1 fee of 1.00%. Pursuant to the Class R3 Plan, the Distributor receives a monthly distribution and/or service fee from the Class R3 shares at an annual rate of 0.50% of the average daily net assets of the Class R3 shares. Class I and Class R6 shares are not subject to a distribution and/or service fee.
The Plans provide that the distribution and service fees are payable to the Distributor regardless of the amounts actually expended by the Distributor for distribution of the Fund’s shares and service activities.
In accordance with the Shareholder Services Plan for the Class R2 and Class R3 shares, the Manager has agreed to provide, through its affiliates or independent third parties, various shareholder and administrative support services to shareholders of the Class R2 and Class R3 shares. For its services, the Manager, its affiliates or independent third-party service providers are entitled to a shareholder service fee accrued daily and paid monthly at an annual rate of 0.10% of the average daily net assets of the Class R2 and Class R3 shares. This is in addition to any fees paid under the Class R2 and Class R3 Plans.
During the year ended October 31, 2019, shareholder service fees incurred by the Fund were as follows:
| | | | |
Class R2 | | $ | 3,251 | |
Class R3 | | | 309 | |
(C) Sales Charges. During the year ended October 31, 2019, the Fund was advised by the Distributor that the amount of initial sales charges retained on sales of Class A and Investor Class shares were $139,662 and $34,984, respectively.
During the year ended October 31, 2019, the Fund was also advised that the Distributor retained CDSCs on redemptions of Class A, Investor Class, Class B and Class C shares of $15,641, $10, $33,219 and $11,775, respectively.
(D) Transfer, Dividend Disbursing and Shareholder Servicing Agent. NYLIM Service Company LLC, an affiliate of New York Life Investments, is the Fund’s transfer, dividend disbursing
| | |
| 42 | | MainStay Income Builder Fund |
and shareholder servicing agent pursuant to an agreement between NYLIM Service Company LLC and the Trust. NYLIM Service Company LLC has entered into an agreement with DST Asset Manager Solutions, Inc. (“DST”), pursuant to which DST performs certain transfer agent services on behalf of NYLIM Service Company LLC. During the year ended October 31, 2019, transfer agent expenses incurred by the Fund were as follows:
| | | | |
Class A | | $ | 584,183 | |
Investor Class | | | 215,813 | |
Class B | | | 69,549 | |
Class C | | | 494,471 | |
Class I | | | 476,676 | |
Class R2 | | | 3,252 | |
Class R3 | | | 299 | |
(E) Small Account Fee. Shareholders with small accounts adversely impact the cost of providing transfer agency services. In an effort to reduce total transfer agency expenses, the Fund has implemented a small account fee on certain types of accounts. Certain shareholders with an account balance of less than $1,000 are charged an annual per account fee of $20 (assessed semi-annually), the proceeds from which offset transfer agent fees as reflected in the Statement of Operations.
(F) Capital. As of October 31, 2019, New York Life and its affiliates beneficially held shares of the Fund with the values and percentages of net assets as follows:
| | | | | | | | |
Class R2 | | $ | 30,841 | | | | 1.2 | % |
Class R3 | | | 33,520 | | | | 5.7 | |
Class R6 | | | 100,670,596 | | | | 99.0 | |
(G) Investments in Affiliates (in 000’s). During the year ended October 31, 2019, purchases and sales transactions, income earned from investments and shares held of investment companies managed by New York Life Investments or its affiliates were as follows:
| | | | | | | | | | | | | | | | | | | | | | | | | | | | | | | | | | | | |
Affiliated Investment Company | | Value,
Beginning
of Year | | | Purchases
at Cost | | | Proceeds
from
Sales | | | Net
Realized
Gain/
(Loss)
on Sales | | | Change in
Unrealized
Appreciation/
(Depreciation) | | | Value,
End of
Year | | | Dividend
Income | | | Other
Distributions | | | Shares
End of
Year | |
MainStay U.S. Government Liquidity Fund | | $ | 47,219 | | | $ | 586,953 | | | $ | (589,560 | ) | | $ | — | | | $ | — | | | $ | 44,612 | | | $ | 937 | | | $ | — | | | | 44,612 | |
Note 4–Federal Income Tax
As of October 31, 2019, the cost and unrealized appreciation (depreciation) of the Fund’s investment portfolio, including applicable derivative contracts and other financial instruments, as determined on a federal income tax basis, were as follows:
| | | | | | | | | | | | | | | | |
| | | Federal Tax
Cost | | | Gross
Unrealized
Appreciation | | | Gross
Unrealized
(Depreciation) | | | Net
Unrealized
Appreciation/
(Depreciation) | |
Investments in Securities | | $ | 1,442,205,098 | | | $ | 116,366,440 | | | $ | (42,618,041 | ) | | $ | 73,748,399 | |
As of October 31, 2019, the components of accumulated gain (loss) on a tax basis were as follows:
| | | | | | | | | | | | | | | | |
Ordinary
Income | | Accumulated
Capital and
Other Gain
(Loss) | | | Other
Temporary
Differences | | | Unrealized
Appreciation
(Depreciation) | | | Total
Accumulated
Gain (Loss) | |
| | | | |
| $25,143,208 | | $ | 34,663,863 | | | $ | (176,014 | ) | | $ | 75,409,699 | | | $ | 135,040,756 | |
The difference between book-basis and tax-basis unrealized appreciation (depreciation) is primarily due to wash sale adjustments, tax treatment of derivative positions and partnerships. The other temporary differences are primarily due to dividends payable.
The following table discloses the current year reclassifications between total distributable earnings (loss) and additional paid-in capital arising
from permanent differences; net assets as of October 31, 2019 were not affected.
| | | | |
Total Distributable
Earnings (Loss) | | Additional
Paid-In
Capital | |
| |
| $19,572 | | $ | (19,572 | ) |
The reclassifications for the Fund are primarily due to equalization.
During the years ended October 31, 2019 and October 31, 2018, the tax character of distributions paid as reflected in the Statements of Changes in Net Assets were as follows:
| | | | | | | | |
| | | 2019 | | | 2018 | |
| | |
Distributions paid from: | | | | | | | | |
Ordinary Income | | $ | 42,706,502 | | | $ | 53,964,130 | |
Long-Term Capital Gain | | | 25,238,264 | | | | 35,493,981 | |
Total | | $ | 67,944,766 | | | $ | 89,458,111 | |
Note 5–Restricted Securities
Restricted securities are subject to legal or contractual restrictions on resale. Private placement securities are generally considered to be restricted except for those securities traded between qualified institutional investors under the provisions of Rule 144A of the Securities Act of 1933, as amended. Disposal of restricted securities may involve time consuming negotiations and expenses, and prompt sale at an acceptable price may be difficult to achieve.
Notes to Financial Statements(continued)
As of October 31, 2019, the Fund held the following restricted security.
| | | | | | | | | | | | | | | | | | | | |
Security | | Date of
Acquisition | | | Shares | | | Cost | | | 10/31/19
Value | | | Percent of
Net Assets | |
| | | | | |
ION Media Networks, Inc. Common Stock | | | 3/11/14 | | | | 12 | | | $ | 1 | | | $ | 4,760 | | | | 0.0 | %‡ |
| ‡ | Less than one-tenth of a percent. |
Note 6–Custodian
State Street is the custodian of cash and securities held by the Fund. Custodial fees are charged to the Fund based on the Fund’s net assets and/or the market value of securities held by the Fund and the number of certain transactions incurred by the Fund.
Note 7–Line of Credit
The Fund and certain other funds managed by New York Life Investments maintain a line of credit with a syndicate of banks in order to secure a source of funds for temporary purposes to meet unanticipated or excessive redemption requests.
Effective July 30, 2019, under the credit agreement (the “Credit Agreement”), the aggregate commitment amount is $600,000,000 with an additional uncommitted amount of $100,000,000. The commitment fee is an annual rate of 0.15% of the average commitment amount payable quarterly, regardless of usage, to State Street, who serves as the agent to the syndicate. The commitment fee is allocated among the Fund and certain other funds managed by New York Life Investments based upon their respective net assets and other factors. Interest on any revolving credit loan is charged based upon the Federal Funds Rate or LIBOR, whichever is higher. The Credit Agreement expires on July 28, 2020, although the Fund, certain other funds managed by New York Life Investments and the syndicate of banks may renew the Credit Agreement for an additional year on the same or different terms. Prior to July 30, 2019, the aggregate commitment amount and the commitment fee were the same as those under the current Credit Agreement. During the year ended October 31, 2019, there were no borrowings made or outstanding with respect to the Fund under the Credit Agreement.
Note 8–Interfund Lending Program
Pursuant to an exemptive order issued by the SEC, the Fund, along with certain other funds managed by New York Life Investments, may participate in an interfund lending program. The interfund lending program provides an alternative credit facility that permits the Fund and certain other funds managed by New York Life Investments to lend or borrow money for temporary purposes directly to or from one another subject to the conditions of the exemptive order. During the year ended October 31, 2019, there were no interfund loans made or outstanding with respect to the Fund.
Note 9–Purchases and Sales of Securities (in 000’s)
During the year ended October 31, 2019, purchases and sales of U.S. government securities were $513,587 and $410,444, respectively. Purchases and sales of securities, other than U.S. government securities andshort-term securities, were $364,296 and $535,403, respectively.
Note 10–Capital Share Transactions
Transactions in capital shares for the years ended October 31, 2019 and October 31, 2018, were as follows:
| | | | | | | | |
Class A | | Shares | | | Amount | |
| | |
Year ended October 31, 2019: | | | | | | | | |
Shares sold | | | 4,981,898 | | | $ | 96,149,062 | |
Shares issued to shareholders in reinvestment of dividends and distributions | | | 1,421,551 | | | | 26,274,145 | |
Shares redeemed | | | (6,544,982 | ) | | | (125,247,849 | ) |
| | | | |
Net increase (decrease) in shares outstanding before conversion | | | (141,533 | ) | | | (2,824,642 | ) |
Shares converted into Class A (See Note 1) | | | 711,316 | | | | 13,662,314 | |
Shares converted from Class A (See Note 1) | | | (117,451 | ) | | | (2,263,396 | ) |
| | | | |
Net increase (decrease) | | | 452,332 | | | $ | 8,574,276 | |
| | | | |
Year ended October 31, 2018: | | | | | | | | |
Shares sold | | | 3,277,142 | | | $ | 63,519,237 | |
Shares issued to shareholders in reinvestment of dividends and distributions | | | 1,625,451 | | | | 31,492,247 | |
Shares redeemed | | | (7,071,027 | ) | | | (136,048,540 | ) |
| | | | |
Net increase (decrease) in shares outstanding before conversion | | | (2,168,434 | ) | | | (41,037,056 | ) |
Shares converted into Class A (See Note 1) | | | 535,852 | | | | 10,454,119 | |
Shares converted from Class A (See Note 1) | | | (166,671 | ) | | | (3,136,944 | ) |
| | | | |
Net increase (decrease) | | | (1,799,253 | ) | | $ | (33,719,881 | ) |
| | | | |
|
| |
Investor Class | | Shares | | | Amount | |
| | |
Year ended October 31, 2019: | | | | | | | | |
Shares sold | | | 796,415 | | | $ | 15,532,775 | |
Shares issued to shareholders in reinvestment of dividends and distributions | | | 210,462 | | | | 3,887,189 | |
Shares redeemed | | | (860,683 | ) | | | (16,734,223 | ) |
| | | | |
Net increase (decrease) in shares outstanding before conversion | | | 146,194 | | | | 2,685,741 | |
Shares converted into Investor Class (See Note 1) | | | 192,064 | | | | 3,674,269 | |
Shares converted from Investor Class (See Note 1) | | | (526,692 | ) | | | (10,169,050 | ) |
| | | | |
Net increase (decrease) | | | (188,434 | ) | | $ | (3,809,040 | ) |
| | | | |
Year ended October 31, 2018: | | | | | | | | |
Shares sold | | | 349,978 | | | $ | 6,743,482 | |
Shares issued to shareholders in reinvestment of dividends and distributions | | | 232,814 | | | | 4,514,249 | |
Shares redeemed | | | (484,985 | ) | | | (9,337,314 | ) |
| | | | |
Net increase (decrease) in shares outstanding before conversion | | | 97,807 | | | | 1,920,417 | |
Shares converted into Investor Class (See Note 1) | | | 238,043 | | | | 4,518,940 | |
Shares converted from Investor Class (See Note 1) | | | (442,741 | ) | | | (8,657,466 | ) |
| | | | |
Net increase (decrease) | | | (106,891 | ) | | $ | (2,218,109 | ) |
| | | | |
| | |
| 44 | | MainStay Income Builder Fund |
| | | | | | | | |
Class B | | Shares | | | Amount | |
| | |
Year ended October 31, 2019: | | | | | | | | |
Shares sold | | | 275,897 | | | $ | 5,486,040 | |
Shares issued to shareholders in reinvestment of dividends and distributions | | | 49,952 | | | | 921,406 | |
Shares redeemed | | | (503,382 | ) | | | (9,808,333 | ) |
| | | | |
Net increase (decrease) in shares outstanding before conversion | | | (177,533 | ) | | | (3,400,887 | ) |
Shares converted from Class B (See Note 1) | | | (137,683 | ) | | | (2,631,122 | ) |
| | | | |
Net increase (decrease) | | | (315,216 | ) | | $ | (6,032,009 | ) |
| | | | |
Year ended October 31, 2018: | | | | | | | | |
Shares sold | | | 40,071 | | | $ | 780,294 | |
Shares issued to shareholders in reinvestment of dividends and distributions | | | 70,580 | | | | 1,380,721 | |
Shares redeemed | | | (274,725 | ) | | | (5,316,357 | ) |
| | | | |
Net increase (decrease) in shares outstanding before conversion | | | (164,074 | ) | | | (3,155,342 | ) |
Shares converted from Class B (See Note 1) | | | (171,397 | ) | | | (3,331,374 | ) |
| | | | |
Net increase (decrease) | | | (335,471 | ) | | $ | (6,486,716 | ) |
| | | | |
|
| |
Class C | | Shares | | | Amount | |
| | |
Year ended October 31, 2019: | | | | | | | | |
Shares sold | | | 1,170,495 | | | $ | 22,132,425 | |
Shares issued to shareholders in reinvestment of dividends and distributions | | | 369,675 | | | | 6,808,882 | |
Shares redeemed | | | (3,266,139 | ) | | | (61,979,887 | ) |
| | | | |
Net increase (decrease) in shares outstanding before conversion | | | (1,725,969 | ) | | | (33,038,580 | ) |
Shares converted from Class C (See Note 1) | | | (137,067 | ) | | | (2,598,707 | ) |
| | | | |
Net increase (decrease) | | | (1,863,036 | ) | | $ | (35,637,287 | ) |
| | | | |
Year ended October 31, 2018: | | | | | | | | |
Shares sold | | | 1,454,490 | | | $ | 28,456,058 | |
Shares issued to shareholders in reinvestment of dividends and distributions | | | 500,849 | | | | 9,775,626 | |
Shares redeemed | | | (3,821,801 | ) | | | (73,633,020 | ) |
| | | | |
Net increase (decrease) | | | (1,866,462 | ) | | $ | (35,401,336 | ) |
| | | | |
| | | | | | | | |
Class I | | Shares | | | Amount | |
| | |
Year ended October 31, 2019: | | | | | | | | |
Shares sold | | | 5,652,692 | | | $ | 108,456,027 | |
Shares issued to shareholders in reinvestment of dividends and distributions | | | 1,032,556 | | | | 19,283,867 | |
Shares redeemed | | | (9,407,029 | ) | | | (179,386,061 | ) |
| | | | |
Net increase (decrease) in shares outstanding before conversion | | | (2,721,781 | ) | | | (51,646,167 | ) |
Shares converted into Class I (See Note 1) | | | 17,180 | | | | 325,692 | |
| | | | |
Net increase (decrease) | | | (2,704,601 | ) | | $ | (51,320,475 | ) |
| | | | |
Year ended October 31, 2018: | | | | | | | | |
Shares sold | | | 7,928,175 | | | $ | 155,016,664 | |
Shares issued to shareholders in reinvestment of dividends and distributions | | | 1,629,572 | | | | 31,887,809 | |
Shares redeemed | | | (15,583,724 | ) | | | (302,323,889 | ) |
| | | | |
Net increase (decrease) in shares outstanding before conversion | | | (6,025,977 | ) | | | (115,419,416 | ) |
Shares converted into Class I (See Note 1) | | | 8,018 | | | | 152,725 | |
Shares converted from Class I (See Note 1) | | | (5,252,973 | ) | | | (99,476,079 | ) |
| | | | |
Net increase (decrease) | | | (11,270,932 | ) | | $ | (214,742,770 | ) |
| | | | |
|
| |
Class R2 | | Shares | | | Amount | |
| | |
Year ended October 31, 2019: | | | | | | | | |
Shares sold | | | 18,671 | | | $ | 351,189 | |
Shares issued to shareholders in reinvestment of dividends and distributions | | | 3,483 | | | | 64,008 | |
Shares redeemed | | | (89,592 | ) | | | (1,709,718 | ) |
| | | | |
Net increase (decrease) | | | (67,438 | ) | | $ | (1,294,521 | ) |
| | | | |
Year ended October 31, 2018: | | | | | | | | |
Shares sold | | | 20,004 | | | $ | 384,300 | |
Shares issued to shareholders in reinvestment of dividends and distributions | | | 4,394 | | | | 85,139 | |
Shares redeemed | | | (51,345 | ) | | | (991,089 | ) |
| | | | |
Net increase (decrease) | | | (26,947 | ) | | $ | (521,650 | ) |
| | | | |
|
| |
Class R3 | | Shares | | | Amount | |
| | |
Year ended October 31, 2019: | | | | | | | | |
Shares sold | | | 21,615 | | | $ | 416,299 | |
Shares issued to shareholders in reinvestment of dividends and distributions | | | 551 | | | | 10,372 | |
| | | | |
Net increase (decrease) | | | 22,166 | | | $ | 426,671 | |
| | | | |
Year ended October 31, 2018: | | | | | | | | |
Shares sold | | | 3,121 | | | $ | 59,541 | |
Shares issued to shareholders in reinvestment of dividends and distributions | | | 234 | | | | 4,527 | |
Shares redeemed | | | (6,078 | ) | | | (115,889 | ) |
| | | | |
Net increase (decrease) | | | (2,723 | ) | | $ | (51,821 | ) |
| | | | |
Notes to Financial Statements(continued)
| | | | | | | | |
Class R6 | | Shares | | | Amount | |
| | |
Year ended October 31, 2019: | | | | | | | | |
Shares sold | | | 425,473 | | | $ | 8,212,259 | |
Shares issued to shareholders in reinvestment of dividends and distributions | | | 254,786 | | | | 4,764,539 | |
Shares redeemed | | | (713,908 | ) | | | (13,641,963 | ) |
| | | | |
Net increase (decrease) | | | (33,649 | ) | | $ | (665,165 | ) |
| | | | |
Period ended October 31, 2018 (a): | | | | | | | | |
Shares sold | | | 67,172 | | | $ | 1,290,084 | |
Shares issued to shareholders in reinvestment of dividends and distributions | | | 58,226 | | | | 1,115,473 | |
Shares redeemed | | | (299,556 | ) | | | (5,760,887 | ) |
| | | | |
Net increase (decrease) in shares outstanding before conversion | | | (174,158 | ) | | | (3,355,330 | ) |
Shares converted into Class R6 (See Note 1) | | | 5,251,919 | | | | 99,476,079 | |
| | | | |
Net increase (decrease) | | | 5,077,761 | | | $ | 96,120,749 | |
| | | | |
| (a) | The inception date of the class was February 28, 2018. |
Note 11–Recent Accounting Pronouncement
In March 2017, the Financial Accounting Standards Board issued an Accounting Standards Update, ASU2017-08, which amends the amortization period for certain callable debt securities that are held at a premium. The amendment requires the premium to be amortized to the earliest call date. This amendment does not require an accounting change for securities held at a discount. This guidance is effective for fiscal years beginning after December 15, 2018. At this time,
management is evaluating the implications of the ASU and any impact on the financial statements has not yet been determined.
To improve the effectiveness of fair value disclosure requirements, the Financial Accounting Standards Board recently issued Accounting Standards Update (ASU)2018-13, Fair Value Measurement Disclosure Framework—Changes to the Disclosure Requirements for Fair Value Measurement (ASU2018-13), which adds, removes, and modifies certain aspects relating to fair value disclosure. ASU2018-13 is effective for interim and annual reporting periods beginning after December 15, 2019; early adoptions of the entire ASU 2018-13, or portions thereof, is permitted. Management has evaluated the implications of certain other provisions of the ASU and has determined to early adopt aspects related to the removal and modifications of certain fair value measurement disclosures under the ASU effective immediately. At this time, management is evaluating the implications of certain other provisions of the ASU related to new disclosure requirements and any impact on the financial statement disclosures has not yet been determined.
Note 12–Subsequent Events
In connection with the preparation of the financial statements of the Fund as of and for the year ended October 31, 2019, events and transactions subsequent to October 31, 2019, through the date the financial statements were issued have been evaluated by the Fund’s management for possible adjustment and/or disclosure. No subsequent events requiring financial statement adjustment or disclosure have been identified.
| | |
| 46 | | MainStay Income Builder Fund |
Report of Independent Registered Public Accounting Firm
To the Shareholders and Board of Trustees
The MainStay Funds:
Opinion on the Financial Statements
We have audited the accompanying statement of assets and liabilities of MainStay Income Builder Fund (the Fund), one of the funds constituting The MainStay Funds, including the portfolio of investments, as of October 31, 2019, the related statement of operations for the year then ended, the statements of changes in net assets for each of the years in thetwo-year period then ended, and the related notes (collectively, the financial statements) and the financial highlights for each of the years or periods in the five-year period then ended. In our opinion, the financial statements and financial highlights present fairly, in all material respects, the financial position of the Fund as of October 31, 2019, the results of its operations for the year then ended, the changes in its net assets for each of the years in thetwo-year period then ended, and the financial highlights for each of the years or periods in the five-year period then ended, in conformity with U.S. generally accepted accounting principles.
Basis for Opinion
These financial statements and financial highlights are the responsibility of the Fund’s management. Our responsibility is to express an opinion on these financial statements and financial highlights based on our audits. We are a public accounting firm registered with the Public Company Accounting Oversight Board (United States) (PCAOB) and are required to be independent with respect to the Fund in accordance with the U.S. federal securities laws and the applicable rules and regulations of the Securities and Exchange Commission and the PCAOB.
We conducted our audits in accordance with the standards of the PCAOB. Those standards require that we plan and perform the audit to obtain reasonable assurance about whether the financial statements and financial highlights are free of material misstatement, whether due to error or fraud. Our audits included performing procedures to assess the risks of material misstatement of the financial statements and financial highlights, whether due to error or fraud, and performing procedures that respond to those risks. Such procedures included examining, on a test basis, evidence regarding the amounts and disclosures in the financial statements and financial highlights. Such procedures also included confirmation of securities owned as of October 31, 2019, by correspondence with the custodian, the transfer agent, and brokers or by other appropriate auditing procedures when replies from brokers were not received. Our audits also included evaluating the accounting principles used and significant estimates made by management, as well as evaluating the overall presentation of the financial statements and financial highlights. We believe that our audits provide a reasonable basis for our opinion.

We have served as the auditor of one or more New York Life Investment Management investment companies since 2003.
Philadelphia, Pennsylvania
December 23, 2019
Federal Income Tax Information
(Unaudited)
The Fund is required under the Internal Revenue Code to advise shareholders in a written statement as to the federal tax status of dividends paid by the Fund during such fiscal years. Accordingly, the Fund paid $25,238,264 as long term capital gain distributions.
For the fiscal year ended October 31, 2019, the Fund designated approximately $16,494,663 under the Internal Revenue Code as qualified dividend income eligible for reduced tax rates.
The dividends paid by the Fund during the fiscal year ended October 31, 2019 should be multiplied by 17.88% to arrive at the amount eligible for the corporate dividend-received deduction.
In February 2020, shareholders will receive an IRS Form1099-DIV or substitute Form 1099, which will show the federal tax status of the distributions received by shareholders in calendar year 2019. The amounts that will be reported on such1099-DIV or substitute Form 1099 will be the amounts you are to use on your federal income tax return and will differ from the amounts which we must report for the Fund’s fiscal year end October 31, 2019.
Proxy Voting Policies and Procedures and Proxy Voting Record
A description of the policies and procedures that New York Life Investments uses to vote proxies related to the Fund’s securities is available without charge, upon request, by visiting the MainStay Funds’ website atnylinvestments.com/fundsor visiting the SEC’s website atwww.sec.gov.
The Fund is required to file with the SEC its proxy voting records for the12-month period ending June 30 on Form N-PX. The most recent Form N-PX or proxy voting record is available free of charge upon request by calling800-624-6782; visiting the MainStay Funds’ website atnylinvestments.com/funds; or visiting the SEC’s website atwww.sec.gov.
Shareholder Reports and Quarterly Portfolio Disclosure
The Fund is required to file its complete schedule of portfolio holdings with the SEC 60 days after its first and third fiscal quarter onForm N-PORT. The Fund’s holdings report is available free of charge by visiting the SEC’s website atwww.sec.govor upon request by calling New York Life Investments at800-624-6782.
| | |
| 48 | | MainStay Income Builder Fund |
Board of Trustees and Officers(Unaudited)
The Trustees and officers of the Funds are listed below. The Board oversees the MainStay Group of Funds (which consists of MainStay Funds and MainStay Funds Trust), MainStay VP Funds Trust, MainStay MacKay DefinedTerm Municipal Opportunities Fund, the Manager and the Subadvisors, and elects the officers of the Funds who are responsible for theday-to-day operations of the Funds. Information pertaining to the Trustees and officers is set forth below. Each Trustee serves until his or her successor is elected and qualified or until his or her
resignation, death or removal. Under the Board’s retirement policy, unless an exception is made, a Trustee must tender his or her resignation by the end of the calendar year during which he or she reaches the age of 75. Officers are elected annually by the Board. The business address of each Trustee and officer listed below is 51 Madison Avenue, New York, New York 10010. A majority of the Trustees are not “interested persons” (as defined by the 1940 Act and rules adopted by the SEC thereunder) of the Fund (“Independent Trustees”).
| | | | | | | | | | | | |
| | | | | Name and
Year of Birth | | Term of Office,
Position(s) Held and
Length of Service | | Principal Occupation(s)
During Past Five Years | | Number of
Portfolios in
Fund Complex
Overseen by
Trustee | | Other Directorships
Held by Trustee |
Interested Trustee | | | | Yie-Hsin Hung* 1962 | | MainStay Funds: Trustee since 2017; MainStay Funds Trust:Trustee since 2017. | | Senior Vice President of New York Life since joining in 2010, Member of the Executive Management Committee since 2017, Chief Executive Officer, New York Life Investment Management Holdings LLC & New York Life Investment Management LLC since 2015. Senior Managing Director andCo-President of New York Life Investment Management LLC from January 2014 to May 2015. Previously held positions of increasing responsibility, including head of NYLIM International, Alternative Growth Businesses, and Institutional investments since joining New York Life in 2010. | | 74 | | MainStay VP Funds Trust:
Trustee since 2017 (31 portfolios); and
MainStay MacKay DefinedTerm Municipal Opportunities Fund: Trustee since 2017. |
| | * | This Trustee is considered to be an “interested person” of the MainStay Group of Funds, MainStay VP Funds Trust and MainStay MacKay DefinedTerm Municipal Opportunities Fund, within the meaning of the 1940 Act because of her affiliation with New York Life Insurance Company, New York Life Investment Management LLC, Candriam Belgium S.A., Candriam Luxembourg S.C.A., IndexIQ Advisors LLC, MacKay Shields LLC, NYL Investors LLC, NYLIFE Securities LLC and/or NYLIFE Distributors LLC, as described in detail above in the column entitled “Principal Occupation(s) During Past Five Years.” |
| | | | | | | | | | | | |
| | | | | Name and
Year of Birth | | Term of Office,
Position(s) Held and
Length of Service | | Principal Occupation(s)
During Past Five Years | | Number of
Portfolios in
Fund Complex
Overseen by
Trustee | | Other Directorships
Held by Trustee |
Independent Trustees | | | | David H. Chow 1957 | | MainStay Funds: Trustee since 2016, Advisory Board Member (June 2015 to December 2015); MainStay Funds Trust:Trustee since 2016, Advisory Board Member (June 2015 to December 2015). | | Founder and CEO, DanCourt Management, LLC (since 1999) | | 74 | | MainStay VP Funds Trust: Trustee since 2016, Advisory Board Member (June 2015 to December 2015) (31 portfolios);
MainStay MacKay DefinedTerm Municipal Opportunities Fund: Trustee since 2016, Advisory Board Member (June 2015 to December 2015);
Market Vectors Group of Exchange-Traded Funds: Independent Chairman of the Board of Trustees since 2008 and Trustee since 2006 (56 portfolios); and
Berea College of Kentucky: Trustee since 2009. |
| | | | Susan B. Kerley 1951 | | MainStay Funds: Chairman since 2017 and Trustee since 2007; MainStay Funds Trust:Chairman since 2017 and Trustee since 1990.** | | President, Strategic Management Advisors LLC (since 1990) | | 74 | | MainStay VP Funds Trust: Chairman since January 2017 and Trustee since 2007 (31 portfolios)***;
MainStay MacKay DefinedTerm Municipal Opportunities Fund: Chairman since 2017 and Trustee since 2011; and
Legg Mason Partners Funds: Trustee since 1991 (45 portfolios). |
| | | | Alan R. Latshaw 1951 | | MainStay Funds: Trustee; MainStay Funds Trust: Trustee and Audit Committee Financial Expert since 2007.** | | Retired; Partner, Ernst & Young LLP (2002 to 2003); Partner, Arthur Andersen LLP (1989 to 2002); Consultant to the MainStay Funds Audit and Compliance Committee (2004 to 2006) | | 74 | | MainStay VP Funds Trust: Trustee and Audit Committee Financial Expert since 2007 (31 portfolios)***;
MainStay MacKay DefinedTerm Municipal Opportunities Fund: Trustee and Audit Committee Financial Expert since 2011;
State Farm Associates Funds Trusts: Trustee since 2005 (4 portfolios);
and State Farm Variable Product Trust: Trustee since 2005 (9 portfolios). |
| | | | Richard H. Nolan, Jr. 1946 | | MainStay Funds: Trustee since 2007; MainStay Funds Trust:Trustee since 2007.** | | Managing Director, ICC Capital Management (since 2004); President—Shields/Alliance, Alliance Capital Management (1994 to 2004) | | 74 | | MainStay VP Funds Trust: Trustee since 2006 (31 portfolios)***; and
MainStay MacKay DefinedTerm Municipal Opportunities Fund: Trustee since 2011. |
| | | | Jacques P. Perold 1958 | | MainStay Funds: Trustee since 2016, Advisory Board Member (June 2015 to December 2015); MainStay Funds Trust:Trustee since 2016, Advisory Board Member (June 2015 to December 2015). | | Retired; President, Fidelity Management & Research Company (2009 to 2014); Founder, President and Chief Executive Officer, Geode Capital Management, LLC (2001 to 2009) | | 74 | | MainStay VP Funds Trust: Trustee since 2016, Advisory Board Member (June 2015 to December 2015) (31 portfolios);
MainStay MacKay DefinedTerm Municipal Opportunities Fund: Trustee since 2016, Advisory Board Member (June 2015 to December 2015);
Allstate Corporation: Director since 2015;MSCI, Inc.: Director since 2017 and
Boston University: Trustee since 2014. |
| | |
| 50 | | MainStay Income Builder Fund |
| | | | | | | | | | | | |
| | | | | Name and
Year of Birth | | Term of Office,
Position(s) Held and
Length of Service | | Principal Occupation(s)
During Past Five Years | | Number of
Portfolios in
Fund Complex
Overseen by
Trustee | | Other Directorships
Held by Trustee |
Independent Trustees | | | | Richard S. Trutanic 1952 | | MainStay Funds: Trustee since 1994; MainStay Funds Trust: Trustee since 2007.** | | Chairman and Chief Executive Officer, Somerset & Company (financial advisory firm) (since 2004); Managing Director, The Carlyle Group (private investment firm) (2002 to 2004); Senior Managing Director, Partner and Board Member, Groupe Arnault S.A. (private investment firm) (1999 to 2002) | | 74 | | MainStay VP Funds Trust: Trustee since 2007 (31 portfolios)***; and
MainStay MacKay DefinedTerm Municipal Opportunities Fund: Trustee since 2011. |
| | ** | Includes prior service as a Director/Trustee of certain predecessor entities to MainStay Funds Trust. |
| | *** | Includes prior service as a Director of MainStay VP Series Fund, Inc., the predecessor to MainStay VP Funds Trust. |
| | | | | | | | |
| | | | | Name and
Year of Birth | | Position(s) Held and
Length of Service | | Principal Occupation(s)
During Past Five Years |
Officers
of the
Trust
(Who are
not
Trustees)* | | | | Kirk C. Lehneis 1974 | | President, MainStay Funds, MainStay Funds Trust (since 2017) | | Chief Operating Officer and Senior Managing Director (since 2016), New York Life Investment Management LLC; Chairman of the Board (since 2017), NYLIFE Distributors LLC; Chairman of the Board, NYLIM Service Company LLC (since 2017); Trustee, President and Principal Executive Officer of IndexIQ Trust, IndexIQ ETF Trust and IndexIQ Active ETF Trust (since January 2018); President, MainStay MacKay DefinedTerm Municipal Opportunities Fund and MainStay VP Funds Trust
(since 2017)**; Senior Managing Director, Global Product Development (2015 to 2016); Managing Director, Product Development (2010 to 2015), New York Life Investment Management LLC |
| | | | Jack R. Benintende 1964 | | Treasurer and Principal Financial and Accounting Officer, MainStay Funds (since 2007), MainStay Funds Trust (since 2009) | | Managing Director, New York Life Investment Management LLC (since 2007); Treasurer and Principal Financial and Accounting Officer, MainStay MacKay DefinedTerm Municipal Opportunities Fund (since 2011) and MainStay VP Funds Trust (since 2007)**; and Assistant Treasurer, New York Life Investment Management Holdings LLC (2008 to 2012) |
| | | | Kevin M. Bopp 1969 | | Vice President and Chief Compliance Officer, MainStay Funds and MainStay Funds Trust (since 2014) | | Chief Compliance Officer, New York Life Investment Management LLC, IndexIQ Trust, IndexIQ ETF Trust and IndexIQ Active ETF Trust (since 2016), Director and Associate General Counsel (2011 to 2014) and Vice President and Assistant General Counsel (2010 to 2011), New York Life Investment Management LLC; Vice President and Chief Compliance Officer, MainStay VP Funds Trust, MainStay MacKay DefinedTerm Municipal Opportunities Fund (since 2014); Assistant Secretary, MainStay Funds, MainStay Funds Trust and MainStay VP Funds Trust (2010 to 2014)**, MainStay MacKay DefinedTerm Municipal Opportunities Fund (2011 to 2014) |
| | | | J. Kevin Gao 1967 | | Secretary and Chief Legal Officer, MainStay Funds and MainStay Funds Trust (since 2010) | | Managing Director and Associate General Counsel, New York Life Investment Management LLC (since 2010); Secretary and Chief Legal Officer, MainStay MacKay DefinedTerm Municipal Opportunities Fund (since 2011) and MainStay VP Funds Trust (since 2010)** |
| | | | Scott T. Harrington 1959 | | Vice President—Administration, MainStay Funds (since 2005), MainStay Funds Trust (since 2009) | | Managing Director, New York Life Investment Management LLC (including predecessor advisory organizations) (since 2000); Member of the Board of Directors, New York Life Trust Company (since 2009); Vice President—Administration, MainStay MacKay DefinedTerm Municipal Opportunities Fund (since 2011) and MainStay VP Funds Trust (since 2005)** |
| | * | The officers listed above are considered to be “interested persons” of the MainStay Group of Funds, MainStay VP Funds Trust and MainStay MacKay Defined Term Municipal Opportunities Fund within the meaning of the 1940 Act because of their affiliation with the MainStay Group of Funds, New York Life Insurance Company and/or its affiliates, including New York Life Investment Management LLC, NYLIM Service Company LLC, NYLIFE Securities LLC and/or NYLIFE Distributors LLC, as described in detail in the column captioned “Principal Occupation(s) During Past Five Years.” Officers are elected annually by the Board. |
| | ** | Includes prior service as an Officer of MainStay VP Series Fund, Inc., the predecessor to MainStay VP Funds Trust. |
| | |
| 52 | | MainStay Income Builder Fund |
MainStay Funds
Equity
U.S. Equity
MainStay Epoch U.S. All Cap Fund
MainStay Epoch U.S. Equity Yield Fund
MainStay Large Cap Growth Fund
MainStay MacKay Common Stock Fund
MainStay MacKay Growth Fund
MainStay MacKay S&P 500 Index Fund
MainStay MacKay Small Cap Core Fund1
MainStay MacKay U.S. Equity Opportunities Fund
MainStay MAP Equity Fund
International Equity
MainStay Epoch International Choice Fund
MainStay MacKay International Equity Fund
MainStay MacKay International Opportunities Fund
Emerging Markets Equity
MainStay Candriam Emerging Markets Equity Fund
MainStay MacKay Emerging Markets Equity Fund
Global Equity
MainStay Epoch Capital Growth Fund
MainStay Epoch Global Equity Yield Fund
Fixed Income
Taxable Income
MainStay Candriam Emerging Markets Debt Fund2
MainStay Floating Rate Fund
MainStay Indexed Bond Fund3
MainStay MacKay High Yield Corporate Bond Fund
MainStay MacKay Infrastructure Bond Fund
MainStay MacKay Short Duration High Yield Fund
MainStay MacKay Total Return Bond Fund
MainStay MacKay Unconstrained Bond Fund
Tax-Exempt Income
MainStay MacKay California Tax Free Opportunities Fund4
MainStay MacKay High Yield Municipal Bond Fund
MainStay MacKay Intermediate Tax Free Bond Fund
MainStay MacKay New York Tax Free Opportunities Fund5
MainStay MacKay Short Term Municipal Fund
MainStay MacKay Tax Free Bond Fund
Money Market
MainStay Money Market Fund
Mixed Asset
MainStay Balanced Fund
MainStay Income Builder Fund
MainStay MacKay Convertible Fund
Speciality
MainStay Cushing Energy Income Fund
MainStay Cushing MLP Premier Fund
MainStay Cushing Renaissance Advantage Fund
Asset Allocation
MainStay Conservative Allocation Fund
MainStay Growth Allocation Fund
MainStay Moderate Allocation Fund
MainStay Moderate Growth Allocation Fund
Manager
New York Life Investment Management LLC
New York, New York
Subadvisors
Candriam Belgium S.A.6
Brussels, Belgium
Candriam Luxembourg S.C.A.6
Strassen, Luxembourg
Cushing Asset Management, LP
Dallas, Texas
Epoch Investment Partners, Inc.
New York, New York
MacKay Shields LLC6
New York, New York
Markston International LLC
White Plains, New York
NYL Investors LLC6
New York, New York
Winslow Capital Management, LLC
Minneapolis, Minnesota
Legal Counsel
Dechert LLP
Washington, District of Columbia
Independent Registered Public Accounting Firm
KPMG LLP
Philadelphia, Pennsylvania
| 1. | Formerly known as MainStay Epoch U.S. Small Cap Fund. |
| 2. | Formerly known as MainStay MacKay Emerging Markets Debt Fund. |
| 3. | Effective December 5, 2019, MainStay Indexed Bond Fund was renamed MainStay Short Term Bond Fund. |
| 4. | Class A and Class I shares of this Fund are registered for sale in AZ, CA, MI, NV, OR, TX, UT and WA. Class I shares are registered for sale in CO, FL, GA, HI, ID, MA, MD, NH, NJ and NY. |
| 5. | This Fund is registered for sale in CA, CT, DE, FL, MA, NJ, NY and VT. |
| 6. | An affiliate of New York Life Investment Management LLC. |
Not part of the Annual Report
For more information
800-624-6782
nylinvestments.com/funds
“New York Life Investments” is both a service mark, and the common trade name, of the investment advisors affiliated with New York Life Insurance Company. The MainStay Funds® are managed by New York Life Investment Management LLC and distributed by NYLIFE Distributors LLC, 30 Hudson Street, Jersey City, NJ 07302, a wholly owned subsidiary of New York Life Insurance Company. NYLIFE Distributors LLC is a Member FINRA/SIPC.
©2019 NYLIFE Distributors LLC. All rights reserved.
| | |
| 1717042 MS159-19 | | MSIB11-12/19 (NYLIM) NL216 |
MainStay Candriam Emerging Markets Debt Fund
(Formerly known as MainStay MacKay Emerging Markets Debt Fund)
Message from the President and Annual Report
October 31, 2019

Beginning on January 1, 2021, paper copies of each MainStay Fund’s annual and semiannual shareholder reports will no longer be sent by mail, unless you specifically request paper copies of the reports from MainStay Funds or from your financial intermediary. Instead, the reports will be made available on the MainStay Funds’ website. You will be notified by mail and provided with a website address to access the report each time a new report is posted to the website.
If you already elected to receive shareholder reports electronically, you will not be affected by this change and you need not take any action. At any time, you may elect to receive reports and other communications from MainStay Funds electronically by calling toll-free 800-624-6782, by sending an e-mail to MainStayShareholderServices@nylim.com, or by contacting your financial intermediary.
You may elect to receive all future shareholder reports in paper form free of charge. If you hold shares of a MainStay Fund directly, you can inform MainStay Funds that you wish to receive paper copies of reports by calling toll-free 800-624-6782 or by sending an e-mail to MainStayShareholderServices@nylim.com. If you hold shares of a MainStay Fund through a financial intermediary, please contact the financial intermediary to make this election. Your election to receive reports in paper form will apply to all MainStay Funds in which you are invested and may apply to all funds held with your financial intermediary.
| | | | | | | | |
| | | | | |
| Not FDIC/NCUA Insured | | Not a Deposit | | May Lose Value | | No Bank Guarantee | | Not Insured by Any Government Agency |

This page intentionally left blank
Message from the President
Stock and bond markets generally gained ground during the12-month reporting period ended October 31, 2019, despite concerns regarding slowing U.S. and global economic growth and international trade conflicts.
After trending higher in November 2018, U.S. stocks and bonds dipped sharply in December 2018, over concerns regarding the pace of economic growth, a U.S. government shutdown and the potential impact of trade disputes between the United States and other nations, particularly China. U.S. markets recovered quickly in 2019 as trade tensions eased, the government reopened and the U.S. Federal Reserve Board (“Fed”) adopted a more accommodative tone regarding the future direction of interest rates. A wide spectrum of equity and fixed-income sectors gained ground through April 2019. Mixed macroeconomic signals and the inability of China and the United States to reach a trade agreement caused the market’s recovery to suffer during the spring and summer months of 2019. However, accommodative monetary policies from several central banks, including a series of interest rate cuts by the Fed, along with better-than-expected corporate earnings reassured investors and enabled markets to resume their advance.
Persistent, albeit slow, U.S. economic growth underpinned the U.S. stock market’s advance during the reporting period, positioning major U.S. equity indices to reach record territory by late October 2019. Sector strength shifted as investor sentiment alternated betweenrisk-on andrisk-off positions. In general, for the reporting period, cyclical, growth-oriented stocks outperformed their value-oriented counterparts by a small margin, with the information technology sector leading thelarge-cap S&P 500® Index. However, the traditionally more defensive areas of real estate and utilities generated above-average performance as well. Communication services, consumer discretionary, industrials and consumer staples performed in the middle of the pack, while materials, financials and health care lagged. Only the energy sector suffered declines, undermined by weak oil prices and concerns about future energy demand.
In the fixed-income markets, slowing economic growth, modest inflation and the Fed’s interest rate cuts created an environment of falling yields and rising prices for most bonds, with many areas of the market offering historically low yields by the end of the reporting period. Higher-credit-quality, longer-duration securities generally produced strong returns, with investment-
grade corporates and long-term Treasury bonds delivering particularly strong performance. A similar dynamic characterized the performance of the municipal bond market, with longer-term, higher-grade issues performing relatively well. On average, municipal bonds roughly matched the gains of corporate issues while providingtax-advantaged returns for eligible investors.
International stock and bond markets tended to underperform their U.S. counterparts, constrained by lackluster economic growth in the Eurozone and dramatically slowing growth in China and related parts of Asia amid persistent trade tensions with the United States. Uncertainties surrounding the unending Brexit drama took a further toll on investor confidence, with Britain seemingly unable to resolve its internal conflicts over how, or whether, to exit from the European Union. Nevertheless, on average, international securities delivered modestly positive returns, bolstered by the accommodative monetary policies implemented by European and Asian central banks. Bonds from both emerging and developed markets generally produced stronger returns than equities while repeating the pattern of outperformance by higher-quality, longer-term instruments seen in the United States.
As the economic growth cycle lengthens, investors are left to ponder how best to position their portfolios for an uncertain future. When the yield curve inverted earlier this year prompting concerns of a potential recession, we were reminded that the direction of the economy is continually subject to change, and perceptions of the economy can shift even more rapidly. As a MainStay investor, you can rely on us to manage our Funds with unflagging energy and dedication so that you can remain focused on your long-term objectives in the face of uncertainty and change. Our goal remains to provide you with the consistently reliable financial tools you need to achieve your long-term objectives.
Sincerely,

Kirk C. Lehneis
President
The opinions expressed are as of the date of this report and are subject to change. There is no guarantee that any forecast made will come to pass. This material does not constitute investment advice and is not intended as an endorsement of any specific investment. Past performance is no guarantee of future results.
Not part of the Annual Report
Table of Contents
Investors should refer to the Fund’s Summary Prospectus and/or Prospectus and consider the Fund’s investment objectives, strategies, risks, charges and expenses carefully before investing. The Summary Prospectus and/or Prospectus contain this and other information about the Fund. You may obtain copies of the Fund’s Summary Prospectus, Prospectus and Statement of Additional Information free of charge, upon request, by calling toll-free 800-624-6782, by writing to NYLIFE Distributors LLC, Attn: MainStay Marketing Department, 30 Hudson Street, Jersey City, NJ 07302 or by sending ane-mail to MainStayShareholderServices@nylim.com. These documents are also available via the MainStay Funds’ website at nylinvestments.com/funds. Please read the Summary Prospectus and/or Prospectus carefully before investing.
Investment and Performance Comparison1,2(Unaudited)
Performance data quoted represents past performance. Past performance is no guarantee of future results. Because of market volatility and other factors, current performance may be lower or higher than the figures shown. Investment return and principal value will fluctuate, and as a result, when shares are redeemed, they may be worth more or less than their original cost. The graph below depicts the historical performance of Class B shares2 of the Fund. Performance will vary from class to class based on differences in class-specific expenses and sales charges. For performance information current to the most recent month-end, please call 800-624-6782 or visit nylinvestments.com/funds.
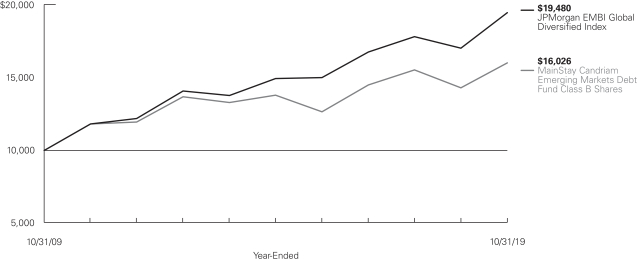
Average Annual Total Returns for the Year-Ended October 31, 2019
| | | | | | | | | | | | | | | | | | | | | | | | |
| Class | | Sales Charge | | | | Inception
Date | | | One Year | | | Five Years | | | Ten Years | | | Gross
Expense
Ratio3 | |
| | | | | | | |
| Class A Shares | | Maximum 4.5% Initial Sales Charge | | With sales charges Excluding sales charges | |
| 6/1/1998
|
| |
| 7.97
13.05 | %
| |
| 3.05
4.00 | %
| |
| 5.31
5.79 | %
| |
| 1.23
1.23 | %
|
| Investor Class Shares | | Maximum 4.5% Initial Sales Charge | | With sales charges Excluding sales charges | | | 2/28/2008 | | |
| 7.74
12.82 |
| |
| 2.85
3.80 |
| |
| 5.13
5.62 |
| |
| 1.46
1.46 |
|
| Class B Shares3 | | Maximum 5% CDSC if Redeemed Within the First Six Years of Purchase | | With sales charges Excluding sales charges | | | 6/1/1998 | | |
| 7.04
12.04 |
| |
| 2.70
3.02 |
| |
| 4.83
4.83 |
| |
| 2.21
2.21 |
|
| Class C Shares | | Maximum 1% CDSC if Redeemed Within One Year of Purchase | | With sales charges Excluding sales charges | | | 9/1/1998 | | |
| 10.91
11.91 |
| |
| 3.00
3.00 |
| |
| 4.83
4.83 |
| |
| 2.21
2.21 |
|
| Class I Shares | | No Sales Charge | | | | | 8/31/2007 | | | | 13.46 | | | | 4.28 | | | | 6.08 | | | | 0.98 | |
| 1. | The performance table and graph do not reflect the deduction of taxes that a shareholder would pay on distributions or Fund share redemptions. Total returns reflect maximum applicable sales charges as indicated in the table above, if any, changes in share price, and reinvestment of dividend and capital gain distributions. The graph assumes the initial investment amount shown above and reflects the deduction of all sales charges that would have applied for the period of investment. Performance figures may reflect certain fee waivers and/or expense limitations, without which total returns may have been lower. For more information on share classes and current fee waivers and/or expense limitations (if any), please refer to the Notes to Financial Statements. |
| 2. | The Fund replaced MacKay and modified its investment objective and principal investment strategies as of June 21, 2019. The performance in the bar chart and table prior to those dates reflects MacKay’s, investment objective and principal investment strategies. |
| 3. | Class B shares are closed to all new purchases as well as additional investments by existing Class B shareholders. |
| 4. | The gross expense ratios presented reflect the Fund’s “Total Annual Fund Operating Expenses” from the most recent Prospectus and may differ from other expense ratios disclosed in this report. |
The footnotes on the next page are an integral part of the table and graph and should be carefully read in conjunction with them.
| | | | | | | | | | |
| Benchmark Performance | | One
Year | | Five
Years | | | Ten
Years | |
| | | |
JPMorgan EMBI Global Diversified Index5 | | 14.35% | | | 5.44 | % | | | 6.90 | % |
Morningstar Emerging Markets Bond Category Average6 | | 11.12 | | | 3.64 | | | | 5.74 | |
| 5. | The JPMorgan EMBI Global Diversified Index is the Fund’s primary broad-based securities market index for comparison purposes. The JPMorgan EMBI Global Diversified Index is a market-capitalization weighted, total return index tracking the traded market for U.S. dollar-denominated Brady Bonds, Eurobonds, traded loans and local market debt instruments issued by sovereign and quasi-sovereign entities. Results assume reinvestment of all dividends and capital gains. An investment cannot be made directly in an index. |
| 6. | The Morningstar Emerging Markets Bond Category Average is representative of funds that invest more than 65% of their assets in foreign bonds from developing countries. The largest portion of the emerging-markets bond market comes from Latin America, followed by Eastern Europe. Africa, the Middle East, and Asia make up the rest. Results are based on average total returns of similar funds with all dividends and capital gain distributions reinvested. |
The footnotes on the preceding page are an integral part of the table and graph and should be carefully read in conjunction with them.
| | |
| 6 | | MainStay Candriam Emerging Markets Debt Fund |
Cost in Dollars of a $1,000 Investment in MainStay Candriam Emerging Markets Debt Fund (Unaudited)
The example below is intended to describe the fees and expenses borne by shareholders during the six-month period from May 1, 2019, to October 31, 2019, and the impact of those costs on your investment.
Example
As a shareholder of the Fund you incur two types of costs: (1) transaction costs, including exchange fees and sales charges (loads) on purchases (as applicable), and (2) ongoing costs, including management fees, distribution and/or service (12b-1) fees, and other Fund expenses (as applicable). This example is intended to help you understand your ongoing costs (in dollars) of investing in the Fund and to compare these costs with the ongoing costs of investing in other mutual funds. The example is based on an investment of $1,000 made at the beginning of the six-month period and held for the entire period from May 1, 2019, to October 31, 2019.
This example illustrates your Fund’s ongoing costs in two ways:
Actual Expenses
The second and third data columns in the table below provide information about actual account values and actual expenses. You may use the information in these columns, together with the amount you invested, to estimate the expenses that you paid during the six months ended October 31, 2019. Simply divide your account value by $1,000 (for example, an $8,600 account value divided by $1,000 = 8.6), then
multiply the result by the number under the heading entitled “Expenses Paid During Period” to estimate the expenses you paid on your account during this period.
Hypothetical Example for Comparison Purposes
The fourth and fifth data columns in the table below provide information about hypothetical account values and hypothetical expenses based on the Fund’s actual expense ratio and an assumed rate of return of 5% per year before expenses, which is not the Fund’s actual return. The hypothetical account values and expenses may not be used to estimate the actual ending account balances or expenses you paid for thesix-month period shown. You may use this information to compare the ongoing costs of investing in the Fund with the ongoing costs of investing in other mutual funds. To do so, compare this 5% hypothetical example with the 5% hypothetical examples that appear in the shareholder reports of the other mutual funds.
Please note that the expenses shown in the table are meant to highlight your ongoing costs only and do not reflect any transactional costs, such as exchange fees or sales charges (loads). Therefore, the fourth and fifth data columns of the table are useful in comparing ongoing costs only and will not help you determine the relative total costs of owning different funds. In addition, if these transactional costs were included, your costs would have been higher.
| | | | | | | | | | | | | | | | | | | | | | |
| | | | | | | | | | | | | | | | | | |
| Share Class | | Beginning
Account
Value
5/1/19 | | | Ending Account
Value (Based
on Actual
Returns and
Expenses)
10/31/19 | | | Expenses
Paid
During
Period1 | | | Ending Account
Value (Based
on Hypothetical
5% Annualized
Return and
Actual Expenses)
10/31/19 | | | Expenses
Paid
During
Period1 | | | Net Expense
Ratio
During
Period2 |
| | | | | | |
| Class A Shares | | $ | 1,000.00 | | | $ | 1,032.80 | | | $ | 6.15 | | | $ | 1,019.16 | | | $ | 6.11 | | | 1.20% |
| | | | | | |
| Investor Class Shares | | $ | 1,000.00 | | | $ | 1,030.90 | | | $ | 7.58 | | | $ | 1,017.74 | | | $ | 7.53 | | | 1.48% |
| | | | | | |
| Class B Shares | | $ | 1,000.00 | | | $ | 1,028.10 | | | $ | 11.45 | | | $ | 1,013.91 | | | $ | 11.37 | | | 2.24% |
| | | | | | |
| Class C Shares | | $ | 1,000.00 | | | $ | 1,027.00 | | | $ | 11.44 | | | $ | 1,013.91 | | | $ | 11.37 | | | 2.24% |
| | | | | | |
| Class I Shares | | $ | 1,000.00 | | | $ | 1,034.40 | | | $ | 4.62 | | | $ | 1,020.67 | | | $ | 4.58 | | | 0.90% |
| 1. | Expenses are equal to the Fund’s annualized expense ratio of each class multiplied by the average account value over the period, divided by 365 and multiplied by 184 (to reflect the six-month period). The table above represents the actual expenses incurred during the six-month period. In addition to the fees and expenses which the Fund bears directly, it also indirectly bears a pro rata share of the fees and expenses of the underlying funds in which it invests. Such indirect expenses are not included in the above-reported expense figures. |
| 2. | Expenses are equal to the Fund’s annualized expense ratio to reflect the six-month period. |
Country Composition as of October 31, 2019(Unaudited)
| | | | |
| |
| Ecuador | | | 5.8 | % |
| |
| Indonesia | | | 5.5 | |
| |
| Egypt | | | 5.4 | |
| |
| Mexico | | | 4.7 | |
| |
| Brazil | | | 4.5 | |
| |
| Ukraine | | | 4.5 | |
| |
| Chile | | | 4.3 | |
| |
| United States | | | 4.3 | |
| |
| Kazakhstan | | | 3.4 | |
| |
| Bahrain | | | 3.3 | |
| |
| United Arab Emirates | | | 3.2 | |
| |
| Croatia | | | 3.0 | |
| |
| Ghana | | | 2.9 | |
| |
| Ivory Coast | | | 2.7 | |
| |
| Nigeria | | | 2.7 | |
| |
| Qatar | | | 2.7 | |
| |
| Turkey | | | 2.7 | |
| |
| Argentina | | | 2.1 | |
| |
| Peru | | | 2.0 | |
| |
| South Africa | | | 2.0 | |
| |
| Jamaica | | | 1.9 | |
| |
| Poland | | | 1.9 | |
| |
| Dominican Republic | | | 1.8 | |
| |
| Azerbaijan | | | 1.7 | |
| | | | |
| |
| Paraguay | | | 1.7 | % |
| |
| Iraq | | | 1.6 | |
| |
| Romania | | | 1.6 | |
| |
| El Salvador | | | 1.5 | |
| |
| Panama | | | 1.5 | |
| |
| Belarus | | | 1.2 | |
| |
| Colombia | | | 1.1 | |
| |
| Costa Rica | | | 1.1 | |
| |
| Uruguay | | | 1.0 | |
| |
| Tajikistan | | | 0.9 | |
| |
| Angola | | | 0.8 | |
| |
| Pakistan | | | 0.8 | |
| |
| Senegal | | | 0.8 | |
| |
| Uzbekistan | | | 0.8 | |
| |
| Kenya | | | 0.7 | |
| |
| Namibia | | | 0.7 | |
| |
| Cameroon | | | 0.6 | |
| |
| Venezuela | | | 0.6 | |
| |
| Cayman Islands | | | 0.5 | |
| |
| Armenia | | | 0.3 | |
| |
| India | | | 0.3 | |
| |
| Other Assets, Less Liabilities | | | 0.9 | |
| | | | |
| | | 100.0 | % |
| | | | |
See Portfolio of Investments beginning on page 11 for specific holdings within these categories. The Fund’s holdings are subject to change.
Top Ten Issuers Held as of October 31, 2019(excludingshort-term investments) (Unaudited)
| 1. | Ecuador Government International Bond, 7.875%–10.75%, due 3/27/25–3/27/30 |
| 2. | Ukraine Government International Bond, 7.375%–7.75%, due 9/1/26–9/25/32 |
| 3. | Corp. Nacional del Cobre de Chile, 3.00%–4.25%, due 8/1/27–1/30/50 |
| 4. | Egypt Government International Bond, 6.875%–8.70%, due 4/30/40–3/1/49 |
| 5. | Petroleos Mexicanos, 6.50%–7.69%, due 3/13/27–1/23/50 |
| 6. | KazMunayGas National Co. JSC, 5.375%–6.375%, due 4/24/30–10/24/48 |
| 7. | Bahrain Government International Bond, 5.625%–7.50%, due 9/30/31–9/20/47 |
| 8. | Abu Dhabi Government International Bond, 2.50%–3.125%, due 9/30/29–9/30/49 |
| 9. | Croatia Government International Bond, 6.00%–6.375%, due 3/24/21–1/26/24 |
| 10. | Ghana Government International Bond, 7.875%–8.627%, due 8/7/23–6/16/49 |
| | |
| 8 | | MainStay Candriam Emerging Markets Debt Fund |
Portfolio Management Discussion and Analysis(Unaudited)
Questions answered by portfolio managers Dan Roberts, PhD, and Jakob Bak, PhD, CFA, of MacKay Shields LLC (“MacKay Shields”), the Fund’s former Subadvisor, and Diliana Deltcheva, CFA, Magda Branet, CFA, and Christopher Mey, CFA, of Candriam Luxembourg S.C.A., (“Candriam”), the Fund’s current Subadvisor.
How did MainStay Candriam Emerging Markets Debt Fund perform relative to its benchmark and peer group during the 12 months ended October 31, 2019?
For the 12 months ended October 31, 2019, Class I shares of MainStay Candriam Emerging Markets Debt Fund returned 13.46%, underperforming the 14.35% return of the Fund’s primary benchmark, the JPMorgan EMBI Global Diversified Index. Over the same period, Class I shares outperformed the 11.12% return of the Morningstar Emerging Markets Bond Category Average.1
Were there any changes to the Fund during the reporting period?
At a shareholder meeting held on June 7, 2019, shareholders approved a subadvisory agreement between Candriam and New York Life Investments, replacing MacKay Shields as subadvisor, effective June 21, 2019. Additionally, as previously supplemented, the Fund was renamed MainStay Candriam Emerging Markets Debt Fund and the Fund’s investment objective, principal investment strategies/investment process and principal risks were all modified, among other changes. For more information on these and other changes refer to the supplement dated June 21, 2019.
What factors affected the Fund’s relative performance during the reporting period?
MacKay Shields
MacKay Shields managed the Fund from November 1, 2018, through June 20, 2019. During this portion of the reporting period, the interest rate policy of the U.S. Federal Reserve (“Fed”) and various global central banks deeply influenced fixed-income markets. In the fourth quarter of 2018, in the wake of four interest rate hikes earlier that year, investors speculated that further monetary tightening might push the U.S. economy into recession. As a result, U.S. Treasury yields shifted lower and credit spreads2 widened. In early 2019, however, the Fed concluded that its benchmark interest rate had risen to a level consistent with its policy objectives given the prevailing environment of restrained inflation, trade policy in flux and aggregate demand failing to pressure resource capacity. Stocks rallied on the Fed’s shift to a more accommodative policy and the potential for future rate cuts, reflecting cautious optimism regarding the durability of the current business cycle. Swayed by similar effects, emerging-market debt spreads tightened, benefiting from renewed risk appetites sparked by dovish central banks.
The Fund outperformed the JPMorgan EMBI Global Diversified Index during this portion of the reporting period primarily due to its slightly longer duration3 versus the benchmark, coupled with the positive impact of the Fund’s lack of exposure to Mexico and Argentina. The Fund’s currency exposures to the Indonesian rupiah and Egyptian pound were further accretive versus theall-U.S. dollar benchmark.
Candriam
From June 21, 2019, to October 31, 2019, the Fund underperformed the JPMorgan EMBI Global Diversified Index primarily due to the Fund’s exposure to the Argentinian market during the month of August. On August 11, 2019, the country’s left-leaning opposition party scored an unexpected victory in primary elections, prompting a sharp market reaction. Investors priced in a higher default/restructuring probability for Argentinian bonds and a sharp depreciation of the Argentinian peso. Aside from this relatively weak performance in August, the Fund outperformed its benchmark.
What was the Fund’s duration strategy during the reporting period?
MacKay Shields
As of June 20, 2019, the Fund’s duration was 7 years, six months longer than the benchmark’s duration.
Candriam
The Fund’s relative modified duration4 increased from June 21, 2019, to October 31, 2019. In August and September, we increased the Fund’s duration to more than a full year longer than that of the benchmark. Subsequently, in October, we slightly reduced the Fund’s relative duration. As of October 31, 2019, the Fund’s duration remained roughly 1 year longer than that of the benchmark.
How was the Fund affected by shifting currency values during the reporting period?
MacKay Shields
From November 1, 2018, through June 20, 2019, the Fund’s long positions in the Indonesian rupiah, Mexican peso and Egyptian pound all added significantly to relative performance.
Candriam
The Fund’s emerging-market currency exposure added approximately 11 basis points to the relative performance of the Fund
| 1. | See page 5 for other share class returns, which may be higher or lower than Class I share returns. See page 6 for more information on benchmark and peer group returns. |
| 2. | The terms “spread” and “yield spread” may refer to the difference in yield between a security or type of security and comparable U.S. Treasury issues. The terms may also refer to the difference in yield between two specific securities or types of securities at a given time. |
| 3. | Duration is a measure of the price sensitivity of a fixed-income investment to changes in interest rates. Duration is expressed as a number of years and is considered a more accurate sensitivity gauge than average maturity. |
| 4. | Modified duration is inversely related to the approximate percentage change in price for a given change in yield. |
versus the JPMorgan EMBI Global Diversified Index from June 21, 2019, to October 31, 2019. (A basis point is oneone-hundredth of a percentage point.)
During the reporting period, which sectors were the strongest positive contributors to the Fund’s relative performance and which sectors were particularly weak?
MacKay Shields
The Fund’s investments in Central and South America, as well as Asia, provided positive contributions to relative performance. (Contributions take weightings and total returns into account.) Within Central America the sovereign bonds of El Salvador and Guatemala performed notably well, while in Costa Rica, credits from Instituto Costarricense de Electricidad, the Costa Ricangovernment-run electricity and telecommunication services provider, also enhanced relative returns. In South America, the government bonds of Paraguay and Ecuador provided the Fund’s strongest performance. In Europe, the Fund’s holdings of Turkish government bonds generated positive absolute returns but underperformed the JPMorgan EMBI Global Diversified Index.
Candriam
The most significant detractors from performance relative to the benchmark were the Fund’s overweight position in Argentina, as well as underweight exposure in Saudi Arabia and the Philippines. The strongest contributors to relative performance included overweight exposure to credits from Kazakhstan, an oil exporter with strong economic fundamentals; overweight exposure in Qatar, where we found reasonably priced investment-grade credit; and overweight exposure to bonds from Ukraine, an International Monetary Fund (IMF) program country with improving fundamentals. Other positive contributors to relative performance included underweight exposure in Lebanon, which faced rising concerns over the country’s debt sustainability, and overweight exposure to quasi-sovereign and corporate bonds from Brazil and Mexico.
What were some of the Fund’s largest purchases and sales during the reporting period?
MacKay Shields
During the portion of the reporting period in which MacKay Shields managed the Fund, we took advantage of relatively large spreads on bonds from Turkey and new issuer Uzbekistan by making significant purchases. Over the same portion of the reporting period, we sold the Fund’s U.S. dollar-denominated Cemex bonds from Mexico and purchased similar euro-denominated bonds to pick up almost a full percentage point on a currency-hedged basis.
Candriam
From June 21, 2019, to October 31, 2019, the Fund was rebalanced to be in line with Candriam’s emerging-market debt, hard currency strategy. We added select idiosyncratic stories under IMF program countries Egypt and Ukraine as these continue to offer value relative to the balance of risks. We also bought holdings in attractively priced energy exporters like Ecuador and Kazakhstan. We sold a significant portion of the corporate bond exposure in the fund, removing names in Asia like 1MDB, Alibaba and Bharti Airtel.
How did the Fund’s country and/or sector weightings change during the reporting period?
MacKay Shields
The Fund made no material change to sector weightings, which as of June 20, 2019, stood at 44% in sovereign/government bonds, 29% in quasi-sovereign instruments and the balance in corporate bonds. Regarding country weightings, the Fund moderately increased its position in Indonesian bonds while opportunistically decreasing holdings in Brazil and Russia.
Candriam
During the portion of the reporting period in which Candriam managed the Fund, we increased its exposure to investment-grade credits from markets such as Qatar, Indonesia and Romania as we rotated from a strongly overweight position to more modestly overweight exposure in high-yield credits. We sold the Fund’s holdings in Mexico and Brazil bonds, which had performed well over the period. We also took profits and reduced the Fund’s exposure to the Kazakhstan market over the month of October.
How was the Fund positioned at the end of the reporting period?
MacKay Shields
As of June 20, 2019, the Fund held overweight exposure in Asia and the United States, and underweight exposure in Africa, the Middle East and Europe.
Candriam
As of October 31, 2019, the Fund held overweight positions in countries such as Egypt and Ukraine that were benefiting from an IMF program, as well as countries such as Bahrain and Indonesia where we found investment-grade securities that we believed to be attractively valued. As of the same date, the Fund’s most significant underweight positions were in Russia and Saudi Arabia, where we found inadequate compensation given the sanctions or political risks related to available credits.
The opinions expressed are those of the portfolio managers as of the date of this report and are subject to change. There is no guarantee that any forecasts will come to pass. This material does not constitute investment advice and is not intended as an endorsement of any specific investment.
| | |
| 10 | | MainStay Candriam Emerging Markets Debt Fund |
Portfolio of InvestmentsOctober 31, 2019
| | | | | | | | |
| | | Principal Amount | | | Value | |
Long-Term Bonds 94.8%† Corporate Bonds 24.8% | |
Armenia 0.3% | |
Republic of Armenia International Bond
Series Reg S
3.95%, due 9/26/29 | | $ | 500,000 | | | $ | 487,109 | |
| | | | | | | | |
|
Azerbaijan 1.7% | |
State Oil Co. of The Azerbaijan Republic
Series Reg S
6.95%, due 3/18/30 | | | 2,000,000 | | | | 2,400,000 | |
| | | | | | | | |
|
Brazil 4.5% | |
Braskem Netherlands Finance B.V. | | | | | | | | |
Series Reg S
4.50%, due 1/10/28 | | | 1,000,000 | | | | 1,003,500 | |
Series Reg S
4.50%, due 1/31/30 | | | 900,000 | | | | 891,900 | |
Series Reg S
5.875%, due 1/31/50 | | | 350,000 | | | | 347,830 | |
Petrobras Global Finance B.V. | | | | | | | | |
7.25%, due 3/17/44 | | | 1,000,000 | | | | 1,214,500 | |
7.375%, due 1/17/27 | | | 1,500,000 | | | | 1,816,500 | |
Rumo Luxembourg S.A R.L.
Series Reg S
5.875%, due 1/18/25 | | | 1,000,000 | | | | 1,060,000 | |
| | | | | | | | |
| | | | | | | 6,334,230 | |
| | | | | | | | |
Cayman Islands 0.5% | |
Bioceanico Sovereign Certificate, Ltd.
Series Reg S
(zero coupon), due 6/5/34 | | | 1,000,000 | | | | 692,500 | |
| | | | | | | | |
|
Chile 4.3% | |
Corp. Nacional del Cobre de Chile | | | | | | | | |
Series Reg S
3.00%, due 9/30/29 | | | 1,550,000 | | | | 1,546,233 | |
Series Reg S
3.625%, due 8/1/27 | | | 1,000,000 | | | | 1,053,440 | |
Series Reg S
3.70%, due 1/30/50 | | | 1,800,000 | | | | 1,783,639 | |
Series Reg S
4.25%, due 7/17/42 | | | 1,500,000 | | | | 1,606,596 | |
| | | | | | | | |
| | | | | | | 5,989,908 | |
| | | | | | | | |
India 0.3% | |
Vedanta Resources, Ltd.
6.125%, due 8/9/24 (a) | | | 500,000 | | | | 463,277 | |
| | | | | | | | |
| | | | | | | | |
| | | Principal Amount | | | Value | |
Indonesia 2.8% | |
Listrindo Capital B.V.
4.95%, due 9/14/26 (a) | | $ | 1,000,000 | | | $ | 1,013,750 | |
Pertamina Persero PT
5.625%, due 5/20/43 (a) | | | 2,500,000 | | | | 2,874,148 | |
| | | | | | | | |
| | | | | | | 3,887,898 | |
| | | | | | | | |
Kazakhstan 3.4% | |
KazMunayGas National Co. JSC | | | | | | | | |
5.375%, due 4/24/30 (a) | | | 2,000,000 | | | | 2,300,040 | |
Series Reg S
5.75%, due 4/19/47 | | | 1,000,000 | | | | 1,168,976 | |
6.375%, due 10/24/48 (a) | | | 1,000,000 | | | | 1,257,800 | |
| | | | | | | | |
| | | | | | | 4,726,816 | |
| | | | | | | | |
Mexico 4.7% | |
Grupo Televisa S.A.B.
4.625%, due 1/30/26 (b) | | | 1,250,000 | | | | 1,346,234 | |
Minera Mexico, S.A. de C.V.
Series Reg S
4.50%, due 1/26/50 | | | 400,000 | | | | 392,280 | |
Petroleos Mexicanos | | | | | | | | |
6.50%, due 3/13/27 | | | 2,000,000 | | | | 2,120,000 | |
6.75%, due 9/21/47 | | | 1,385,000 | | | | 1,378,075 | |
Series Reg S
6.84%, due 1/23/30 | | | 800,000 | | | | 854,000 | |
Series Reg S
7.69%, due 1/23/50 | | | 500,000 | | | | 543,320 | |
| | | | | | | | |
| | | | | | | 6,633,909 | |
| | | | | | | | |
Peru 2.0% | |
Corp. Financiera de Desarrollo S.A.
Series Reg S
4.75%, due 7/15/25 | | | 2,000,000 | | | | 2,195,000 | |
Southern Copper Corp.
5.875%, due 4/23/45 | | | 500,000 | | | | 606,255 | |
| | | | | | | | |
| | | | | | | 2,801,255 | |
| | | | | | | | |
Venezuela 0.3% | |
Petroleos de Venezuela S.A. (c)(d)(e) | | | | | | | | |
5.375%, due 4/12/27 | | | 3,000,000 | | | | 180,000 | |
Series Reg S
6.00%, due 5/16/24 | | | 2,500,000 | | | | 150,000 | |
Series Reg S
6.00%, due 11/15/26 | | | 2,500,000 | | | | 150,000 | |
| | | | | | | | |
| | | | | | | 480,000 | |
| | | | | | | | |
Total Corporate Bonds
(Cost $34,375,307) | | | | | | | 34,896,902 | |
| | | | | | | | |
| | | | | | |
The notes to the financial statements are an integral part of,
and should be read in conjunction with, the financial statements. | | | | | 11 | |
Portfolio of InvestmentsOctober 31, 2019 (continued)
| | | | | | | | |
| | | Principal Amount | | | Value | |
| Foreign Government Bonds 70.0% | |
Angola 0.8% | |
Angolan Government International Bond
9.375%, due 5/8/48 (a) | | $ | 1,000,000 | | | $ | 1,056,450 | |
| | | | | | | | |
|
Argentina 2.1% | |
Argentine Republic Government International Bond | | | | | | | | |
7.125%, due 7/6/36 | | | 1,500,000 | | | | 585,015 | |
7.625%, due 4/22/46 | | | 2,500,000 | | | | 1,003,750 | |
Provincia de Buenos Aires
7.875%, due 6/15/27 (a) | | | 4,000,000 | | | | 1,380,040 | |
| | | | | | | | |
| | | | | | | 2,968,805 | |
| | | | | | | | |
Bahrain 3.3% | |
Bahrain Government International Bond | | | | | | | | |
Series Reg S
5.625%, due 9/30/31 | | | 2,250,000 | | | | 2,360,781 | |
7.50%, due 9/20/47 (a) | | | 2,000,000 | | | | 2,340,000 | |
| | | | | | | | |
| | | | | | | 4,700,781 | |
| | | | | | | | |
Belarus 1.2% | |
Republic of Belarus International Bond
7.625%, due 6/29/27 (a) | | | 1,500,000 | | | | 1,719,552 | |
| | | | | | | | |
|
Cameroon, United Republic Of 0.6% | |
Republic of Cameroon International Bond
9.50%, due 11/19/25 (a) | | | 750,000 | | | | 823,807 | |
| | | | | | | | |
|
Colombia 1.1% | |
Colombia Government International Bond
6.125%, due 1/18/41 | | | 1,200,000 | | | | 1,555,212 | |
| | | | | | | | |
|
Costa Rica 1.1% | |
Costa Rica Government International Bond
Series Reg S
7.00%, due 4/4/44 | | | 1,500,000 | | | | 1,479,390 | |
| | | | | | | | |
|
Croatia 3.0% | |
Croatia Government International Bond | | | | | | | | |
Series Reg S
6.00%, due 1/26/24 | | | 2,500,000 | | | | 2,873,300 | |
6.375%, due 3/24/21 (a) | | | 1,250,000 | | | | 1,319,480 | |
| | | | | | | | |
| | | | | | | 4,192,780 | |
| | | | | | | | |
| | | | | | | | |
| | | Principal Amount | | | Value | |
Dominican Republic 1.8% | |
Dominican Republic International Bond
Series Reg S
5.95%, due 1/25/27 | | $ | 2,250,000 | | | $ | 2,472,210 | |
| | | | | | | | |
|
Ecuador 5.8% | |
Ecuador Government International Bond | | | | | | | | |
Series Reg S
7.875%, due 3/27/25 | | | 1,600,000 | | | | 1,508,000 | |
Series Reg S
7.875%, due 1/23/28 | | | 3,500,000 | | | | 3,136,000 | |
Series Reg S
9.50%, due 3/27/30 | | | 2,000,000 | | | | 1,925,000 | |
Series Reg S
10.75%, due 1/31/29 | | | 1,500,000 | | | | 1,522,515 | |
| | | | | | | | |
| | | | | | | 8,091,515 | |
| | | | | | | | |
Egypt 5.4% | |
Egypt Government Bond
15.70%, due 11/7/27 | | | EGP 31,000,000 | | | | 2,052,739 | |
Egypt Government International Bond | | | | | | | | |
Series Reg S
6.875%, due 4/30/40 | | $ | 2,000,000 | | | | 1,941,044 | |
Series Reg S
7.903%, due 2/21/48 | | | 1,500,000 | | | | 1,501,005 | |
Series Reg S
8.70%, due 3/1/49 | | | 2,000,000 | | | | 2,140,740 | |
| | | | | | | | |
| | | | | | | 7,635,528 | |
| | | | | | | | |
El Salvador 1.5% | |
El Salvador Government International Bond | | | | | | | | |
Series Reg S
7.125%, due 1/20/50 (b) | | | 1,000,000 | | | | 1,014,500 | |
Series Reg S
7.625%, due 2/1/41 | | | 1,000,000 | | | | 1,083,760 | |
| | | | | | | | |
| | | | | | | 2,098,260 | |
| | | | | | | | |
Ghana 2.9% | |
Ghana Government International Bond | | | | | | | | |
Series Reg S
7.875%, due 8/7/23 | | | 3,000,000 | | | | 3,264,762 | |
Series��Reg S
8.627%, due 6/16/49 | | | 750,000 | | | | 748,125 | |
| | | | | | | | |
| | | | | | | 4,012,887 | |
| | | | | | | | |
Indonesia 2.7% | |
Indonesia Government International Bond
5.125%, due 1/15/45 (a) | | | 2,000,000 | | | | 2,375,355 | |
| | | | |
| 12 | | MainStay Candriam Emerging Markets Debt Fund | | The notes to the financial statements are an integral part of,
and should be read in conjunction with, the financial statements. |
| | | | | | | | |
| | | Principal Amount | | | Value | |
| Foreign Government Bonds (continued) | |
Indonesia (continued) | |
Indonesia Treasury Bond
6.125%, due 5/15/28 | | | IDR 20,000,000,000 | | | $ | 1,358,754 | |
| | | | | | | | |
| | | | | | | 3,734,109 | |
| | | | | | | | |
Iraq 1.6% | |
Iraq International Bond | | | | | | | | |
Series Reg S
5.80%, due 1/15/28 | | $ | 500,000 | | | | 480,100 | |
Series Reg S
6.752%, due 3/9/23 | | | 1,700,000 | | | | 1,712,614 | |
| | | | | | | | |
| | | | | | | 2,192,714 | |
| | | | | | | | |
Ivory Coast 2.7% | |
Ivory Coast Government International Bond | | | | | | | | |
Series Reg S
5.875%, due 10/17/31 | | | EUR 550,000 | | | | 620,635 | |
6.125%, due 6/15/33 (a) | | $ | 1,000,000 | | | | 980,200 | |
Series Reg S
6.375%, due 3/3/28 | | | 1,000,000 | | | | 1,032,820 | |
Series Reg S
6.875%, due 10/17/40 | | | EUR 1,000,000 | | | | 1,137,059 | |
| | | | | | | | |
| | | | | | | 3,770,714 | |
| | | | | | | | |
Jamaica 1.9% | |
Jamaica Government International Bond
7.875%, due 7/28/45 | | $ | 2,000,000 | | | | 2,637,520 | |
| | | | | | | | |
|
Kenya 0.7% | |
Kenya Government International Bond
7.25%, due 2/28/28 (a) | | | 1,000,000 | | | | 1,054,784 | |
| | | | | | | | |
|
Namibia 0.7% | |
Namibia International Bonds
Series Reg S
5.25%, due 10/29/25 | | | 1,000,000 | | | | 1,014,620 | |
| | | | | | | | |
|
Nigeria 2.7% | |
Nigeria Government International Bond | | | | | | | | |
6.50%, due 11/28/27 (a) | | | 2,250,000 | | | | 2,253,735 | |
Series Reg S
7.875%, due 2/16/32 | | | 1,500,000 | | | | 1,546,797 | |
| | | | | | | | |
| | | | | | | 3,800,532 | |
| | | | | | | | |
Pakistan 0.8% | |
Pakistan Government International Bond
8.25%, due 9/30/25 (a) | | | 1,000,000 | | | | 1,090,806 | |
| | | | | | | | |
| | | | | | | | |
| | | Principal Amount | | | Value | |
Panama 1.5% | |
Panama Government International Bond
3.87%, due 7/23/60 | | $ | 2,000,000 | | | $ | 2,130,000 | |
| | | | | | | | |
|
Paraguay 1.7% | |
Paraguay Government International Bond
6.10%, due 8/11/44 (a) | | | 2,000,000 | | | | 2,430,020 | |
| | | | | | | | |
|
Poland 1.9% | |
Republic of Poland Government Bond
2.50%, due 7/25/26 | | | PLN 10,000,000 | | | | 2,716,658 | |
| | | | | | | | |
|
Qatar 2.7% | |
Qatar Government International Bond | | | | | | | | |
Series Reg S
4.817%, due 3/14/49 | | $ | 1,500,000 | | | | 1,844,730 | |
Series Reg S
5.103%, due 4/23/48 | | | 1,500,000 | | | | 1,911,900 | |
| | | | | | | | |
| | | | | | | 3,756,630 | |
| | | | | | | | |
Romania 1.6% | |
Romanian Government International Bond
Series Reg S
5.125%, due 6/15/48 | | | 2,000,000 | | | | 2,304,160 | |
| | | | | | | | |
|
Senegal 0.8% | |
Senegal Government International Bond
Series Reg S
6.25%, due 7/30/24 | | | 1,000,000 | | | | 1,092,200 | |
| | | | | | | | |
|
South Africa 2.0% | |
Republic of South Africa Government International Bond | | | | | | | | |
5.75%, due 9/30/49 | | | 1,250,000 | | | | 1,209,525 | |
6.25%, due 3/8/41 | | | 1,500,000 | | | | 1,612,500 | |
| | | | | | | | |
| | | | | | | 2,822,025 | |
| | | | | | | | |
Tajikistan 0.9% | |
Republic of Tajikistan International Bond
Series Reg S
7.125%, due 9/14/27 | | | 1,500,000 | | | | 1,266,252 | |
| | | | | | | | |
| | | | | | |
The notes to the financial statements are an integral part of,
and should be read in conjunction with, the financial statements. | | | | | 13 | |
Portfolio of InvestmentsOctober 31, 2019 (continued)
| | | | | | | | |
| | | Principal Amount | | | Value | |
| Foreign Government Bonds (continued) | |
Turkey 2.7% | |
Turkey Government International Bond | | | | | | | | |
5.125%, due 2/17/28 | | $ | 2,000,000 | | | $ | 1,860,000 | |
6.00%, due 1/14/41 | | | 1,000,000 | | | | 895,000 | |
7.625%, due 4/26/29 | | | 1,000,000 | | | | 1,072,500 | |
| | | | | | | | |
| | | | | | | 3,827,500 | |
| | | | | | | | |
Ukraine 4.5% | |
Ukraine Government International Bond | | | | | | | | |
Series Reg S
7.375%, due 9/25/32 | | | 3,250,000 | | | | 3,399,493 | |
Series Reg S
7.75%, due 9/1/26 | | | 1,500,000 | | | | 1,610,625 | |
Series Reg S
7.75%, due 9/1/27 | | | 1,250,000 | | | | 1,343,625 | |
| | | | | | | | |
| | | | | | | 6,353,743 | |
| | | | | | | | |
United Arab Emirates 3.2% | |
Abu Dhabi Government International Bond | | | | | | | | |
Series Reg S
2.50%, due 9/30/29 | | | 2,400,000 | | | | 2,382,000 | |
Series Reg S
3.125%, due 9/30/49 | | | 2,200,000 | | | | 2,117,016 | |
| | | | | | | | |
| | | | | | | 4,499,016 | |
| | | | | | | | |
Uruguay 1.0% | |
Uruguay Government International Bond
7.625%, due 3/21/36 | | | 1,000,000 | | | | 1,477,510 | |
| | | | | | | | |
|
Uzbekistan 0.8% | |
Republic of Uzbekistan Bond
5.375%, due 2/20/29 (a) | | | 1,000,000 | | | | 1,097,092 | |
| | | | | | | | |
|
Venezuela 0.3% | |
Bollivarian Republic of Venezuela
Series Reg S
9.25%, due 5/7/28 (c)(d)(e) | | | 4,095,000 | | | | 424,856 | |
| | | | | | | | |
Total Foreign Government Bonds
(Cost $101,976,563) | | | | | | | 98,300,638 | |
| | | | | | | | |
TotalLong-Term Bonds
(Cost $136,351,870) | | | | | | | 133,197,540 | |
| | | | | | | | |
|
| Short-Term Investments 4.3% | |
Affiliated Investment Company 3.4% | |
MainStay U.S. Government Liquidity Fund, 1.76% (f) | | | 4,738,166 | | | | 4,738,166 | |
| | | | | | | | |
| | | | | | | | |
| | | Principal Amount | | | Value | |
Unaffiliated Investment Company 0.9% | |
State Street Navigator Securities Lending Government Money Market Portfolio, 1.75% (f)(g) | | $ | 1,263,650 | | | $ | 1,263,650 | |
| | | | | | | | |
TotalShort-Term Investments
(Cost $6,001,816) | | | | | | | 6,001,816 | |
| | | | | | | | |
Total Investments
(Cost $142,353,686) | | | 99.1 | % | | | 139,199,356 | |
Other Assets, Less Liabilities | | | 0.9 | | | | 1,209,035 | |
Net Assets | | | 100.0 | % | | $ | 140,408,391 | |
| † | Percentages indicated are based on Fund net assets. |
| (a) | May be sold to institutional investors only under Rule 144A or securities offered pursuant to Section 4(a)(2) of the Securities Act of 1933, as amended. |
| (b) | All or a portion of this security was held on loan. As of October 31, 2019, the aggregate market value of securities on loan was $1,244,333. The Fund received cash collateral with a value of $1,263,650 (See Note 2(K)). |
| (c) | Illiquid investment—As of October 31, 2019, the total market value of these illiquid investments was $904,856, which represented 0.6% of the Fund’s net assets. (Unaudited) |
| (e) | Issue in non-accrual status. |
| (f) | Current yield as of October 31, 2019. |
| (g) | Represents a security purchased with cash collateral received for securities on loan. |
The following abbreviations are used in the preceding pages:
EGP—Egyptian Pound
EUR—Euro
IDR—Indonesian Rupiah
PLN—Polish Zloty
| | | | |
| 14 | | MainStay Candriam Emerging Markets Debt Fund | | The notes to the financial statements are an integral part of,
and should be read in conjunction with, the financial statements. |
The following is a summary of the fair valuations according to the inputs used as of October 31, 2019, for valuing the Fund’s assets:
| | | | | | | | | | | | | | | | |
Description | | Quoted
Prices in Active
Markets for
Identical Assets
(Level 1) | | | Significant Other
Observable Inputs (Level 2) | | | Significant
Unobservable Inputs (Level 3) | | | Total | |
| | | | |
Asset Valuation Inputs | | | | | | | | | | | | | | | | |
| Investments in Securities (a) | | | | | | | | | | | | | | | | |
| Long-Term Bonds | | | | | | | | | | | | | | | | |
Corporate Bonds | | $ | — | | | $ | 34,896,902 | | | $ | — | | | $ | 34,896,902 | |
Foreign Government Bonds | | | — | | | | 98,300,638 | | | | — | | | | 98,300,638 | |
| | | | | | | | | | | | | | | | |
| TotalLong-Term Bonds | | | — | | | | 133,197,540 | | | | — | | | | 133,197,540 | |
| | | | | | | | | | | | | | | | |
| Short-Term Investments | | | | | | | | | | | | | | | | |
Affiliated Investment Company | | | 4,738,166 | | | | — | | | | — | | | | 4,738,166 | |
Unaffiliated Investment Company | | | 1,263,650 | | | | — | | | | — | | | | 1,263,650 | |
| | | | | | | | | | | | | | | | |
| TotalShort-Term Investments | | | 6,001,816 | | | | — | | | | — | | | | 6,001,816 | |
| | | | | | | | | | | | | | | | |
| Total Investments in Securities | | $ | 6,001,816 | | | $ | 133,197,540 | | | $ | — | | | $ | 139,199,356 | |
| | | | | | | | | | | | | | | | |
| (a) | For a complete listing of investments and their industries, see the Portfolio of Investments. |
| | | | | | |
The notes to the financial statements are an integral part of,
and should be read in conjunction with, the financial statements. | | | | | 15 | |
Statement of Assets and Liabilitiesas of October 31, 2019
| | | | |
| Assets | | | | |
Investment in unaffiliated securities, at value (identified cost $137,615,520) including securities on loan of $1,244,333 | | $ | 134,461,190 | |
Investment in affiliated investment company, at value (identified cost $4,738,166) | | | 4,738,166 | |
Cash denominated in foreign currencies (identified cost $1,786,306) | | | 1,823,613 | |
Due from custodian | | | 424,768 | |
Receivables: | | | | |
Dividends and interest | | | 1,703,433 | |
Investment securities sold | | | 1,141,663 | |
Fund shares sold | | | 175,353 | |
Securities lending | | | 325 | |
Other assets | | | 36,758 | |
| | | | |
Total assets | | | 144,505,269 | |
| | | | |
| |
| Liabilities | | | | |
Cash collateral received for securities on loan | | | 1,263,650 | |
Payables: | | | | |
Investment securities purchased | | | 2,359,166 | |
Fund shares redeemed | | | 260,832 | |
Manager (See Note 3) | | | 66,196 | |
Transfer agent (See Note 3) | | | 42,719 | |
NYLIFE Distributors (See Note 3) | | | 35,146 | |
Professional fees | | | 15,407 | |
Shareholder communication | | | 13,275 | |
Custodian | | | 13,140 | |
Trustees | | | 253 | |
Accrued expenses | | | 1,675 | |
Dividend payable | | | 25,419 | |
| | | | |
Total liabilities | | | 4,096,878 | |
| | | | |
Net assets | | $ | 140,408,391 | |
| | | | |
| |
| Composition of Net Assets | | | | |
Shares of beneficial interest outstanding (par value of $.01 per share) unlimited number of shares authorized | | $ | 134,277 | |
Additional paid-in capital | | | 152,593,302 | |
| | | | |
| | | 152,727,579 | |
Total distributable earnings (loss) | | | (12,319,188 | ) |
| | | | |
Net assets | | $ | 140,408,391 | |
| | | | |
| | | | |
Class A | | | | |
Net assets applicable to outstanding shares | | $ | 93,471,637 | |
| | | | |
Shares of beneficial interest outstanding | | | 8,934,265 | |
| | | | |
Net asset value per share outstanding | | $ | 10.46 | |
Maximum sales charge (4.50% of offering price) | | | 0.49 | |
| | | | |
Maximum offering price per share outstanding | | $ | 10.95 | |
| | | | |
Investor Class | | | | |
Net assets applicable to outstanding shares | | $ | 16,023,947 | |
| | | | |
Shares of beneficial interest outstanding | | | 1,516,302 | |
| | | | |
Net asset value per share outstanding | | $ | 10.57 | |
Maximum sales charge (4.50% of offering price) | | | 0.50 | |
| | | | |
Maximum offering price per share outstanding | | $ | 11.07 | |
| | | | |
Class B | | | | |
Net assets applicable to outstanding shares | | $ | 2,662,688 | |
| | | | |
Shares of beneficial interest outstanding | | | 259,590 | |
| | | | |
Net asset value and offering price per share outstanding | | $ | 10.26 | |
| | | | |
Class C | | | | |
Net assets applicable to outstanding shares | | $ | 11,149,851 | |
| | | | |
Shares of beneficial interest outstanding | | | 1,085,391 | |
| | | | |
Net asset value and offering price per share outstanding | | $ | 10.27 | |
| | | | |
Class I | | | | |
Net assets applicable to outstanding shares | | $ | 17,100,268 | |
| | | | |
Shares of beneficial interest outstanding | | | 1,632,157 | |
| | | | |
Net asset value and offering price per share outstanding | | $ | 10.48 | |
| | | | |
| | | | |
| 16 | | MainStay Candriam Emerging Markets Debt Fund | | The notes to the financial statements are an integral part of,
and should be read in conjunction with, the financial statements. |
Statement of Operationsfor the year ended October 31, 2019
| | | | |
| Investment Income (Loss) | | | | |
Income | | | | |
Interest (a) | | $ | 8,638,837 | |
Dividends-affiliated | | | 107,782 | |
Securities lending | | | 3,279 | |
| | | | |
Total income | | | 8,749,898 | |
| | | | |
Expenses | | | | |
Manager (See Note 3) | | | 1,045,279 | |
Distribution/Service—Class A (See Note 3) | | | 228,629 | |
Distribution/Service—Investor Class (See Note 3) | | | 40,845 | |
Distribution/Service—Class B (See Note 3) | | | 31,511 | |
Distribution/Service—Class C (See Note 3) | | | 152,048 | |
Transfer agent (See Note 3) | | | 263,308 | |
Registration | | | 91,456 | |
Professional fees | | | 80,173 | |
Shareholder communication | | | 40,999 | |
Custodian | | | 38,782 | |
Trustees | | | 3,470 | |
Interest expense | | | 2,406 | |
Miscellaneous | | | 12,770 | |
| | | | |
Total expenses before waiver/reimbursement | | | 2,031,676 | |
Expense waiver/reimbursement from Manager (See Note 3) | | | (50,154 | ) |
| | | | |
Net expenses | | | 1,981,522 | |
| | | | |
Net investment income (loss) | | | 6,768,376 | |
| | | | |
|
| Realized and Unrealized Gain (Loss) on Investments and Foreign Currency Transactions | |
Net realized gain (loss) on: | | | | |
Unaffiliated investment transactions | | | 3,675,499 | |
Foreign currency forward transactions | | | 38,232 | |
Foreign currency transactions | | | (23,850 | ) |
| | | | |
Net realized gain (loss) on investments and foreign currency transactions | | | 3,689,881 | |
| | | | |
Net change in unrealized appreciation (depreciation) on: | | | | |
Unaffiliated investments | | | 6,554,151 | |
Translation of other assets and liabilities in foreign currencies | | | 45,131 | |
| | | | |
Net change in unrealized appreciation (depreciation) on investments and foreign currencies | | | 6,599,282 | |
| | | | |
Net realized and unrealized gain (loss) on investments and foreign currency transactions | | | 10,289,163 | |
| | | | |
Net increase (decrease) in net assets resulting from operations | | $ | 17,057,539 | |
| | | | |
| (a) | Interest recorded net of foreign withholding taxes in the amount of $70,093. |
| | | | | | |
The notes to the financial statements are an integral part of,
and should be read in conjunction with, the financial statements. | | | | | 17 | |
Statements of Changes in Net Assets
for the years ended October 31, 2019 and October 31, 2018
| | | | | | | | |
| | | 2019 | | | 2018 | |
| Increase (Decrease) in Net Assets | |
Operations: | | | | | | | | |
Net investment income (loss) | | $ | 6,768,376 | | | $ | 6,836,483 | |
Net realized gain (loss) on investments and foreign currency transactions | | | 3,689,881 | | | | (3,996,697 | ) |
Net change in unrealized appreciation (depreciation) on investments and foreign currencies | | | 6,599,282 | | | | (14,832,643 | ) |
| | | | |
Net increase (decrease) in net assets resulting from operations | | | 17,057,539 | | | | (11,992,857 | ) |
| | | | |
Distributions to shareholders: | | | | | | | | |
Class A | | | (4,410,178 | ) | | | (4,090,630 | ) |
Investor Class | | | (730,210 | ) | | | (669,061 | ) |
Class B | | | (121,596 | ) | | | (150,872 | ) |
Class C | | | (581,845 | ) | | | (772,754 | ) |
Class I | | | (1,065,235 | ) | | | (718,293 | ) |
| | | | |
Total distributions to shareholders | | | (6,909,064 | ) | | | (6,401,610 | ) |
| | | | |
Capital share transactions: | | | | | | | | |
Net proceeds from sale of shares | | | 101,839,510 | | | | 26,866,744 | |
Net asset value of shares issued to shareholders in reinvestment of distributions | | | 6,590,775 | | | | 5,995,352 | |
Cost of shares redeemed | | | (113,866,471 | ) | | | (64,621,234 | ) |
| | | | |
Increase (decrease) in net assets derived from capital share transactions | | | (5,436,186 | ) | | | (31,759,138 | ) |
| | | | |
Net increase (decrease) in net assets | | | 4,712,289 | | | | (50,153,605 | ) |
| | |
| Net Assets | | | | | | | | |
Beginning of year | | | 135,696,102 | | | | 185,849,707 | |
| | | | |
End of year | | $ | 140,408,391 | | | $ | 135,696,102 | |
| | | | |
| | | | |
| 18 | | MainStay Candriam Emerging Markets Debt Fund | | The notes to the financial statements are an integral part of,
and should be read in conjunction with, the financial statements. |
Financial Highlightsselected per share data and ratios
| | | | | | | | | | | | | | | | | | | | |
| |
| | | Year ended October 31, | |
| | | | | |
| Class A | | 2019 | | | 2018 | | | 2017 | | | 2016 | | | 2015 | |
| | | | | |
Net asset value at beginning of year | | $ | 9.71 | | | $ | 10.88 | | | $ | 10.52 | | | $ | 9.60 | | | $ | 11.38 | |
| | | | | | | | | | | | | | | | | | | | |
| | | | | |
Net investment income (loss) (a) | | | 0.49 | | | | 0.45 | | | | 0.53 | | | | 0.57 | | | | 0.62 | |
| | | | | |
Net realized and unrealized gain (loss) on investments | | | 0.76 | | | | (1.19 | ) | | | 0.31 | | | | 0.87 | | | | (1.51 | ) |
| | | | | |
Net realized and unrealized gain (loss) on foreign currency transactions | | | 0.00 | ‡ | | | (0.00 | )‡ | | | (0.01 | ) | | | 0.01 | | | | 0.02 | |
| | | | | | | | | | | | | | | | | | | | |
| | | | | |
Total from investment operations | | | 1.25 | | | | (0.74 | ) | | | 0.83 | | | | 1.45 | | | | (0.87 | ) |
| | | | | | | | | | | | | | | | | | | | |
| | | | | |
| Less dividends and distributions: | | | | | | | | | | | | | | | | | | | | |
| | | | | |
From net investment income | | | (0.50 | ) | | | (0.43 | ) | | | (0.36 | ) | | | (0.29 | ) | | | (0.63 | ) |
| | | | | |
From net realized gain on investments | | | — | | | | — | | | | — | | | | — | | | | (0.22 | ) |
| | | | | |
Return of capital | | | — | | | | — | | | | (0.11 | ) | | | (0.24 | ) | | | (0.06 | ) |
| | | | | | | | | | | | | | | | | | | | |
| | | | | |
Total dividends and distributions | | | (0.50 | ) | | | (0.43 | ) | | | (0.47 | ) | | | (0.53 | ) | | | (0.91 | ) |
| | | | | | | | | | | | | | | | | | | | |
| | | | | |
Net asset value at end of year | | $ | 10.46 | | | $ | 9.71 | | | $ | 10.88 | | | $ | 10.52 | | | $ | 9.60 | |
| | | | | | | | | | | | | | | | | | | | |
| | | | | |
Total investment return (b) | | | 13.05 | % | | | (6.95 | %) | | | 8.18 | % | | | 15.63 | % | | | (7.54 | %) |
| | | | | |
| Ratios (to average net assets)/Supplemental Data: | | | | | | | | | | | | | | | | | | | | |
| | | | | |
Net investment income (loss) | | | 4.78 | % | | | 4.36 | % | | | 5.04 | % | | | 5.70 | %(c) | | | 6.18 | % |
| | | | | |
Net expenses (d) | | | 1.23 | % | | | 1.26 | % | | | 1.22 | % | | | 1.22 | %(e) | | | 1.23 | % |
| | | | | |
Expenses (before waiver/reimbursement) | | | 1.26 | % | | | 1.26 | % | | | 1.22 | % | | | 1.22 | % | | | 1.23 | % |
| | | | | |
Portfolio turnover rate | | | 102 | % | | | 44 | % | | | 37 | % | | | 38 | % | | | 19 | % |
| | | | | |
Net assets at end of year (in 000’s) | | $ | 93,472 | | | $ | 86,452 | | | $ | 110,238 | | | $ | 109,657 | | | $ | 98,573 | |
| ‡ | Less than one cent per share. |
| (a) | Per share data based on average shares outstanding during the year. |
| (b) | Total investment return is calculated exclusive of sales charges and assumes the reinvestment of dividends and distributions. For periods of less than one year, total return is not annualized. |
| (c) | Without the custody fee reimbursement, net investment income (loss) would have been 5.69%. |
| (d) | In addition to the fees and expenses which the Fund bears directly, it also indirectly bears a pro-rata share of the fees and expenses of the underlying funds in which it invests. Such indirect expenses are not included in the above expense ratios. |
| (e) | Without the custody fee reimbursement, net expenses would have been 1.23%. |
| | | | | | |
The notes to the financial statements are an integral part of,
and should be read in conjunction with, the financial statements. | | | | | 19 | |
Financial Highlightsselected per share data and ratios
| | | | | | | | | | | | | | | | | | | | |
| |
| | | Year ended October 31, | |
| | | | | |
| Investor Class | | 2019 | | | 2018 | | | 2017 | | | 2016 | | | 2015 | |
| | | | | |
Net asset value at beginning of year | | $ | 9.80 | | | $ | 10.98 | | | $ | 10.61 | | | $ | 9.68 | | | $ | 11.46 | |
| | | | | | | | | | | | | | | | | | | | |
| | | | | |
Net investment income (loss) (a) | | | 0.47 | | | | 0.43 | | | | 0.52 | | | | 0.55 | | | | 0.61 | |
| | | | | |
Net realized and unrealized gain (loss) on investments | | | 0.77 | | | | (1.20 | ) | | | 0.31 | | | | 0.88 | | | | (1.52 | ) |
| | | | | |
Net realized and unrealized gain (loss) on foreign currency transactions | | | 0.00 | ‡ | | | (0.00 | )‡ | | | (0.01 | ) | | | 0.01 | | | | 0.02 | |
| | | | | | | | | | | | | | | | | | | | |
| | | | | |
Total from investment operations | | | 1.24 | | | | (0.77 | ) | | | 0.82 | | | | 1.44 | | | | (0.89 | ) |
| | | | | | | | | | | | | | | | | | | | |
| | | | | |
| Less dividends and distributions: | | | | | | | | | | | | | | | | | | | | |
| | | | | |
From net investment income | | | (0.47 | ) | | | (0.41 | ) | | | (0.35 | ) | | | (0.27 | ) | | | (0.61 | ) |
| | | | | |
From net realized gain on investments | | | — | | | | — | | | | — | | | | — | | | | (0.22 | ) |
| | | | | |
Return of capital | | | — | | | | — | | | | (0.10 | ) | | | (0.24 | ) | | | (0.06 | ) |
| | | | | | | | | | | | | | | | | | | | |
| | | | | |
Total dividends and distributions | | | (0.47 | ) | | | (0.41 | ) | | | (0.45 | ) | | | (0.51 | ) | | | (0.89 | ) |
| | | | | | | | | | | | | | | | | | | | |
| | | | | |
Net asset value at end of year | | $ | 10.57 | | | $ | 9.80 | | | $ | 10.98 | | | $ | 10.61 | | | $ | 9.68 | |
| | | | | | | | | | | | | | | | | | | | |
| | | | | |
Total investment return (b) | | | 12.82 | % | | | (7.18 | %) | | | 7.99 | % | | | 15.38 | % | | | (7.66 | %) |
| | | | | |
| Ratios (to average net assets)/Supplemental Data: | | | | | | | | | | | | | | | | | | | | |
| | | | | |
Net investment income (loss) | | | 4.50 | % | | | 4.15 | % | | | 4.86 | % | | | 5.50 | %(c) | | | 6.01 | % |
| | | | | |
Net expenses (d) | | | 1.52 | % | | | 1.47 | % | | | 1.42 | % | | | 1.42 | %(e) | | | 1.41 | % |
| | | | | |
Expenses (before waiver/reimbursement) (d) | | | 1.56 | % | | | 1.49 | % | | | 1.42 | % | | | 1.42 | % | | | 1.41 | % |
| | | | | |
Portfolio turnover rate | | | 102 | % | | | 44 | % | | | 37 | % | | | 38 | % | | | 19 | % |
| | | | | |
Net assets at end of year (in 000’s) | | $ | 16,024 | | | $ | 15,911 | | | $ | 18,613 | | | $ | 32,318 | | | $ | 25,130 | |
| ‡ | Less than one cent per share. |
| (a) | Per share data based on average shares outstanding during the year. |
| (b) | Total investment return is calculated exclusive of sales charges and assumes the reinvestment of dividends and distributions. For periods of less than one year, total return is not annualized. |
| (c) | Without the custody fee reimbursement, net investment income (loss) would have been 5.49%. |
| (d) | In addition to the fees and expenses which the Fund bears directly, it also indirectly bears a pro-rata share of the fees and expenses of the underlying funds in which it invests. Such indirect expenses are not included in the above expense ratios. |
| (e) | Without the custody fee reimbursement, net expenses would have been 1.43%. |
| | | | |
| 20 | | MainStay Candriam Emerging Markets Debt Fund | | The notes to the financial statements are an integral part of,
and should be read in conjunction with, the financial statements. |
Financial Highlightsselected per share data and ratios
| | | | | | | | | | | | | | | | | | | | |
| |
| | | Year ended October 31, | |
| | | | | |
| Class B | | 2019 | | | 2018 | | | 2017 | | | 2016 | | | 2015 | |
| | | | | |
Net asset value at beginning of year | | $ | 9.52 | | | $ | 10.69 | | | $ | 10.34 | | | $ | 9.44 | | | $ | 11.20 | |
| | | | | | | | | | | | | | | | | | | | |
| | | | | |
Net investment income (loss) (a) | | | 0.38 | | | | 0.34 | | | | 0.43 | | | | 0.47 | | | | 0.52 | |
| | | | | |
Net realized and unrealized gain (loss) on investments | | | 0.75 | | | | (1.18 | ) | | | 0.30 | | | | 0.86 | | | | (1.48 | ) |
| | | | | |
Net realized and unrealized gain (loss) on foreign currency transactions | | | 0.00 | ‡ | | | 0.00 | ‡ | | | (0.01 | ) | | | 0.01 | | | | 0.02 | |
| | | | | | | | | | | | | | | | | | | | |
| | | | | |
Total from investment operations | | | 1.13 | | | | (0.84 | ) | | | 0.72 | | | | 1.34 | | | | (0.94 | ) |
| | | | | | | | | | | | | | | | | | | | |
| | | | | |
| Less dividends and distributions: | | | | | | | | | | | | | | | | | | | | |
| | | | | |
From net investment income | | | (0.39 | ) | | | (0.33 | ) | | | (0.29 | ) | | | (0.20 | ) | | | (0.54 | ) |
| | | | | |
From net realized gain on investments | | | — | | | | — | | | | — | | | | — | | | | (0.22 | ) |
| | | | | |
Return of capital | | | — | | | | — | | | | (0.08 | ) | | | (0.24 | ) | | | (0.06 | ) |
| | | | | | | | | | | | | | | | | | | | |
| | | | | |
Total dividends and distributions | | | (0.39 | ) | | | (0.33 | ) | | | (0.37 | ) | | | (0.44 | ) | | | (0.82 | ) |
| | | | | | | | | | | | | | | | | | | | |
| | | | | |
Net asset value at end of year | | $ | 10.26 | | | $ | 9.52 | | | $ | 10.69 | | | $ | 10.34 | | | $ | 9.44 | |
| | | | | | | | | | | | | | | | | | | | |
| | | | | |
Total investment return (b) | | | 12.04 | % | | | (7.98 | %) | | | 7.20 | % | | | 14.60 | % | | | (8.36 | %) |
| | | | | |
| Ratios (to average net assets)/Supplemental Data: | | | | | | | | | | | | | | | | | | | | |
| | | | | |
Net investment income (loss) | | | 3.76 | % | | | 3.37 | % | | | 4.11 | % | | | 4.78 | %(c) | | | 5.24 | % |
| | | | | |
Net expenses (d) | | | 2.27 | % | | | 2.22 | % | | | 2.17 | % | | | 2.17 | %(e) | | | 2.16 | % |
| | | | | |
Expenses (before waiver/reimbursement) (d) | | | 2.31 | % | | | 2.24 | % | | | 2.17 | % | | | 2.17 | % | | | 2.16 | % |
| | | | | |
Portfolio turnover rate | | | 102 | % | | | 44 | % | | | 37 | % | | | 38 | % | | | 19 | % |
| | | | | |
Net assets at end of year (in 000’s) | | $ | 2,663 | | | $ | 3,660 | | | $ | 6,012 | | | $ | 7,506 | | | $ | 8,111 | |
| ‡ | Less than one cent per share. |
| (a) | Per share data based on average shares outstanding during the year. |
| (b) | Total investment return is calculated exclusive of sales charges and assumes the reinvestment of dividends and distributions. For periods of less than one year, total return is not annualized. |
| (c) | Without the custody fee reimbursement, net investment income (loss) would have been 4.77%. |
| (d) | In addition to the fees and expenses which the Fund bears directly, it also indirectly bears a pro-rata share of the fees and expenses of the underlying funds in which it invests. Such indirect expenses are not included in the above expense ratios. |
| (e) | Without the custody fee reimbursement, net expenses would have been 2.18%. |
| | | | | | |
The notes to the financial statements are an integral part of,
and should be read in conjunction with, the financial statements. | | | | | 21 | |
Financial Highlightsselected per share data and ratios
| | | | | | | | | | | | | | | | | | | | |
| |
| | | Year ended October 31, | |
| | | | | |
| Class C | | 2019 | | | 2018 | | | 2017 | | | 2016 | | | 2015 | |
| | | | | |
Net asset value at beginning of year | | $ | 9.54 | | | $ | 10.70 | | | $ | 10.35 | | | $ | 9.45 | | | $ | 11.22 | |
| | | | | | | | | | | | | | | | | | | | |
| | | | | |
Net investment income (loss) (a) | | | 0.38 | | | | 0.35 | | | | 0.43 | | | | 0.47 | | | | 0.52 | |
| | | | | |
Net realized and unrealized gain (loss) on investments | | | 0.74 | | | | (1.18 | ) | | | 0.29 | | | | 0.86 | | | | (1.49 | ) |
| | | | | |
Net realized and unrealized gain (loss) on foreign currency transactions | | | 0.00 | ‡ | | | (0.00 | )‡ | | | (0.00 | )‡ | | | 0.01 | | | | 0.02 | |
| | | | | | | | | | | | | | | | | | | | |
| | | | | |
Total from investment operations | | | 1.12 | | | | (0.83 | ) | | | 0.72 | | | | 1.34 | | | | (0.95 | ) |
| | | | | | | | | | | | | | | | | | | | |
| | | | | |
| Less dividends and distributions: | | | | | | | | | | | | | | | | | | | | |
| | | | | |
From net investment income | | | (0.39 | ) | | | (0.33 | ) | | | (0.29 | ) | | | (0.20 | ) | | | (0.54 | ) |
| | | | | |
From net realized gain on investments | | | — | | | | — | | | | — | | | | — | | | | (0.22 | ) |
| | | | | |
Return of capital | | | — | | | | — | | | | (0.08 | ) | | | (0.24 | ) | | | (0.06 | ) |
| | | | | | | | | | | | | | | | | | | | |
| | | | | |
Total dividends and distributions | | | (0.39 | ) | | | (0.33 | ) | | | (0.37 | ) | | | (0.44 | ) | | | (0.82 | ) |
| | | | | | | | | | | | | | | | | | | | |
| | | | | |
Net asset value at end of year | | $ | 10.27 | | | $ | 9.54 | | | $ | 10.70 | | | $ | 10.35 | | | $ | 9.45 | |
| | | | | | | | | | | | | | | | | | | | |
| | | | | |
Total investment return (b) | | | 11.91 | % | | | (7.88 | %) | | | 7.19 | % | | | 14.58 | % | | | (8.43 | %) |
| | | | | |
| Ratios (to average net assets)/Supplemental Data: | | | | | | | | | | | | | | | | | | | | |
| | | | | |
Net investment income (loss) | | | 3.78 | % | | | 3.39 | % | | | 4.11 | % | | | 4.77 | %(c) | | | 5.24 | % |
| | | | | |
Net expenses (d) | | | 2.27 | % | | | 2.22 | % | | | 2.17 | % | | | 2.17 | %(e) | | | 2.16 | % |
| | | | | |
Expenses (before waiver/reimbursement) (d) | | | 2.31 | % | | | 2.24 | % | | | 2.17 | % | | | 2.17 | % | | | 2.16 | % |
| | | | | |
Portfolio turnover rate | | | 102 | % | | | 44 | % | | | 37 | % | | | 38 | % | | | 19 | % |
| | | | | |
Net assets at end of year (in 000’s) | | $ | 11,150 | | | $ | 19,246 | | | $ | 28,270 | | | $ | 35,789 | | | $ | 37,808 | |
| ‡ | Less than one cent per share. |
| (a) | Per share data based on average shares outstanding during the year. |
| (b) | Total investment return is calculated exclusive of sales charges and assumes the reinvestment of dividends and distributions. For periods of less than one year, total return is not annualized. |
| (c) | Without the custody fee reimbursement, net investment income (loss) would have been 4.76%. |
| (d) | In addition to the fees and expenses which the Fund bears directly, it also indirectly bears a pro-rata share of the fees and expenses of the underlying funds in which it invests. Such indirect expenses are not included in the above expense ratios. |
| (e) | Without the custody fee reimbursement, net expenses would have been 2.18%. |
| | | | |
| 22 | | MainStay Candriam Emerging Markets Debt Fund | | The notes to the financial statements are an integral part of,
and should be read in conjunction with, the financial statements. |
Financial Highlightsselected per share data and ratios
| | | | | | | | | | | | | | | | | | | | |
| |
| | | Year ended October 31, | |
| | | | | |
| Class I | | 2019 | | | 2018 | | | 2017 | | | 2016 | | | 2015 | |
| | | | | |
Net asset value at beginning of year | | $ | 9.72 | | | $ | 10.90 | | | $ | 10.53 | | | $ | 9.61 | | | $ | 11.39 | |
| | | | | | | | | | | | | | | | | | | | |
| | | | | |
Net investment income (loss) (a) | | | 0.52 | | | | 0.48 | | | | 0.56 | | | | 0.59 | | | | 0.65 | |
| | | | | |
Net realized and unrealized gain (loss) on investments | | | 0.76 | | | | (1.20 | ) | | | 0.32 | | | | 0.88 | | | | (1.52 | ) |
| | | | | |
Net realized and unrealized gain (loss) on foreign currency transactions | | | 0.00 | ‡ | | | (0.00 | )‡ | | | (0.01 | ) | | | 0.01 | | | | 0.02 | |
| | | | | | | | | | | | | | | | | | | | |
| | | | | |
Total from investment operations | | | 1.28 | | | | (0.72 | ) | | | 0.87 | | | | 1.48 | | | | (0.85 | ) |
| | | | | | | | | | | | | | | | | | | | |
| | | | | |
| Less dividends and distributions: | | | | | | | | | | | | | | | | | | | | |
| | | | | |
From net investment income | | | (0.52 | ) | | | (0.46 | ) | | | (0.39 | ) | | | (0.32 | ) | | | (0.65 | ) |
| | | | | |
From net realized gain on investments | | | — | | | | — | | | | — | | | | — | | | | (0.22 | ) |
| | | | | |
Return of capital | | | — | | | | — | | | | (0.11 | ) | | | (0.24 | ) | | | (0.06 | ) |
| | | | | | | | | | | | | | | | | | | | |
| | | | | |
Total dividends and distributions | | | (0.52 | ) | | | (0.46 | ) | | | (0.50 | ) | | | (0.56 | ) | | | (0.93 | ) |
| | | | | | | | | | | | | | | | | | | | |
| | | | | |
Net asset value at end of year | | $ | 10.48 | | | $ | 9.72 | | | $ | 10.90 | | | $ | 10.53 | | | $ | 9.61 | |
| | | | | | | | | | | | | | | | | | | | |
| | | | | |
Total investment return (b) | | | 13.46 | % | | | (6.80 | %) | | | 8.54 | % | | | 15.90 | % | | | (7.30 | %) |
| | | | | |
| Ratios (to average net assets)/Supplemental Data: | | | | | | | | | | | | | | | | | | | | |
| | | | | |
Net investment income (loss) | | | 4.99 | % | | | 4.60 | % | | | 5.22 | % | | | 5.96 | %(c) | | | 6.38 | % |
| | | | | |
Net expenses (d) | | | 0.94 | % | | | 1.01 | % | | | 0.97 | % | | | 0.97 | %(e) | | | 0.98 | % |
| | | | | |
Expenses (before waiver/reimbursement) | | | 1.01 | % | | | 1.01 | % | | | 0.97 | % | | | 0.97 | % | | | 0.98 | % |
| | | | | |
Portfolio turnover rate | | | 102 | % | | | 44 | % | | | 37 | % | | | 38 | % | | | 19 | % |
| | | | | |
Net assets at end of year (in 000’s) | | $ | 17,100 | | | $ | 10,428 | | | $ | 22,717 | | | $ | 13,759 | | | $ | 16,825 | |
| ‡ | Less than one cent per share. |
| (a) | Per share data based on average shares outstanding during the year. |
| (b) | Total investment return is calculated exclusive of sales charges and assumes the reinvestment of dividends and distributions. Class I shares are not subject to sales charges. For periods of less than one year, total return is not annualized. |
| (c) | Without the custody fee reimbursement, net investment income (loss) would have been 5.95%. |
| (d) | In addition to the fees and expenses which the Fund bears directly, it also indirectly bears a pro-rata share of the fees and expenses of the underlying funds in which it invests. Such indirect expenses are not included in the above expense ratios. |
| (e) | Without the custody fee reimbursement, net expenses would have been 0.98%. |
| | | | | | |
The notes to the financial statements are an integral part of,
and should be read in conjunction with, the financial statements. | | | | | 23 | |
Notes to Financial Statements
Note 1–Organization and Business
The MainStay Funds (the “Trust”) was organized on January 9, 1986, as a Massachusetts business trust and is governed by a Declaration of Trust. The Trust is registered under the Investment Company Act of 1940, as amended (the “1940 Act”), as an open-end management investment company, and is comprised of twelve funds (collectively referred to as the “Funds”). These financial statements and notes relate to the MainStay Candriam Emerging Markets Debt Fund (formerly known as MainStay MacKay Emerging Markets Debt Fund) (the “Fund”), a “diversified fund” as that term is defined in the 1940 Act as interpreted or modified by regulatory authorities having jurisdiction, from time to time.
The Fund currently has six classes of shares registered for sale. Class A and Class B shares commenced operations on June 1, 1998. Class C shares commenced operations on September 1, 1998. Class I shares commenced operations on August 31, 2007. Investor Class shares commenced operations on February 28, 2008. Class R6 shares were registered for sale effective as of February 28, 2017. As of October 31, 2019, Class R6 shares were not yet offered for sale.
Class B shares of the MainStay Group of Funds are closed to all new purchases as well as additional investments by existing Class B shareholders. Existing Class B shareholders may continue to reinvest dividends and capital gains distributions, as well as exchange their Class B shares for Class B shares of other funds in the MainStay Group of Funds as permitted by the current exchange privileges. Class B shareholders continue to be subject to any applicable contingent deferred sales charge (“CDSC”) at the time of redemption. All other features of the Class B shares, including but not limited to the fees and expenses applicable to Class B shares, remain unchanged. Unless redeemed, Class B shareholders will remain in Class B shares of their respective fund until the Class B shares are converted to Class A or Investor Class shares pursuant to the applicable conversion schedule.
Class A and Investor Class shares are offered at net asset value (“NAV”) per share plus an initial sales charge. No initial sales charge applies to investments of $1 million or more (and certain other qualified purchases) in Class A and Investor Class shares. However, a CDSC of 1.00% may be imposed on certain redemptions made within 18 months of the date of purchase on shares that were purchased without an initial sales charge. Class C shares are offered at NAV without an initial sales charge, although a 1.00% CDSC may be imposed on certain redemptions of such shares made within one year of the date of purchase of Class C shares. When Class B shares were offered, they were offered at NAV without an initial sales charge, although a CDSC that declines depending on the number of years a shareholder has held its Class B shares may be imposed on certain redemptions of such shares made within six years of the date of purchase of such shares. Class I shares are offered at NAV without a sales charge. Class R6 shares are currently expected to be offered at NAV without a sales charge. Depending upon eligibility, Class B shares convert to either Class A or Investor Class shares at the end of the calendar quarter eight years after the date they were purchased. In addition, depending upon eligibility, Class C shares convert to either Class A or Investor Class shares at the end of the calendar quarter ten years after the date they were purchased. Additionally, as disclosed in the Fund’s prospectus, Class A shares may convert automatically to Investor Class shares and Investor
Class shares may convert automatically to Class A shares. Under certain circumstances and as may be permitted by the Trust’s multiple class plan pursuant to Rule 18f-3 under the 1940 Act, specified share classes of the Fund may be converted to one or more other share classes of the Fund as disclosed in the capital share transactions within these Notes. The classes of shares have the same voting (except for issues that relate solely to one class), dividend, liquidation and other rights, and the same terms and conditions, except that under distribution plans pursuant to Rule 12b-1 under the 1940 Act, Class B and Class C shares are subject to higher distribution and/or service fees than Class A and Investor Class shares. Class I and Class R6 shares are not subject to a distribution and/or service fee.
The Fund’s investment objective is to seek total return.
Note 2–Significant Accounting Policies
The Fund is an investment company and accordingly follows the investment company accounting and reporting guidance of the Financial Accounting Standards Board (“FASB”) Accounting Standard CodificationTopic 946 Financial Services—Investment Companies. The Fund prepares its financial statements in accordance with generally accepted accounting principles (“GAAP”) in the United States of America and follows the significant accounting policies described below.
(A) Securities Valuation. Investments are usually valued as of the close of regular trading on the New York Stock Exchange (the “Exchange”) (usually 4:00 p.m. Eastern time) on each day the Fund is open for business (“valuation date”).
The Board of Trustees of the Trust (the “Board”) adopted procedures establishing methodologies for the valuation of the Fund’s securities and other assets and delegated the responsibility for valuation determinations under those procedures to the Valuation Committee of the Trust (the “Valuation Committee”). The Board authorized the Valuation Committee to appoint a Valuation Subcommittee (the “Subcommittee”) to deal in the first instance with establishing the prices of securities for which market quotations are not readily available or the prices of which are not otherwise readily determinable under these procedures. The Subcommittee meets (in person, via electronic mail or via teleconference) on an as-needed basis. Subsequently, the Valuation Committee meets to ensure that actions taken by the Subcommittee were appropriate. The procedures state that, subject to the oversight of the Board and unless otherwise noted, the responsibility for theday-to-day valuation of portfolio assets (including fair value measurements for the Fund’s assets and liabilities) rests with New York Life Investment Management LLC (“New York Life Investments” or the “Manager”), aided to whatever extent necessary by the Subadvisor (as defined in Note 3(A)).
To assess the appropriateness of security valuations, the Manager, the Subadvisor or the Fund’s third-party service provider, who is subject to oversight by the Manager, regularly compares prior day prices, prices on comparable securities and the sale prices to the prior and current day prices and challenges prices with changes exceeding certain tolerance levels with third-party pricing services or broker sources. For those securities valued through either a standardized fair valuation methodology or a fair valuation measurement, the Subcommittee deals in the first instance with such valuation and the Valuation Committee reviews
| | |
| 24 | | MainStay Candriam Emerging Markets Debt Fund |
and affirms, if appropriate, the reasonableness of the valuation based on such methodologies and measurements on a regular basis after considering information that is reasonably available and deemed relevant by the Valuation Committee. Any action taken by the Subcommittee with respect to the valuation of a portfolio security or other asset is submitted for review and ratification (if appropriate) to the Valuation Committee and the Board at the next regularly scheduled meeting.
“Fair value” is defined as the price the Fund would reasonably expect to receive upon selling an asset or liability in an orderly transaction to an independent buyer in the principal or most advantageous market for the asset or liability. Fair value measurements are determined within a framework that establishes a three-tier hierarchy which maximizes the use of observable market data and minimizes the use of unobservable inputs to establish a classification of fair value measurements for disclosure purposes. “Inputs” refer broadly to the assumptions that market participants would use in pricing the asset or liability, including assumptions about risk, such as the risk inherent in a particular valuation technique used to measure fair value using a pricing model and/or the risk inherent in the inputs for the valuation technique. Inputs may be observable or unobservable. Observable inputs reflect the assumptions market participants would use in pricing the asset or liability based on market data obtained from sources independent of the Fund. Unobservable inputs reflect the Fund’s own assumptions about the assumptions market participants would use in pricing the asset or liability based on the information available. The inputs or methodology used for valuing assets or liabilities may not be an indication of the risks associated with investing in those assets or liabilities. The three-tier hierarchy of inputs is summarized below.
| • | | Level 1—quoted prices in active markets for an identical asset or liability |
| • | | Level 2—other significant observable inputs (including quoted prices for a similar asset or liability in active markets, interest rates and yield curves, prepayment speeds, credit risk, etc.) |
| • | | Level 3—significant unobservable inputs (including the Fund’s own assumptions about the assumptions that market participants would use in measuring fair value of an asset or liability) |
The level of an asset or liability within the fair value hierarchy is based on the lowest level of an input, both individually and in the aggregate, that is significant to the fair value measurement. As of October 31, 2019, the aggregate value by input level of the Fund’s assets and liabilities is included at the end of the Fund’s Portfolio of Investments.
The Fund may use third-party vendor evaluations, whose prices may be derived from one or more of the following standard inputs, among others:
| | |
• Benchmark yields | | • Reported trades |
• Broker/dealer quotes | | • Issuer spreads |
• Two-sided markets | | • Benchmark securities |
• Bids/offers | | • Reference data (corporate actions or material event notices) |
• Industry and economic events | | • Comparable bonds |
�� Monthly payment information | | |
An asset or liability for which market values cannot be measured using the methodologies described above is valued by methods deemed reasonable in good faith by the Valuation Committee, following the procedures established by the Board, to represent fair value. Under these procedures, the Fund generally uses a market-based approach which may use related or comparable assets or liabilities, recent transactions, market multiples, book values and other relevant information. The Fund may also use an income-based valuation approach in which the anticipated future cash flows of the asset or liability are discounted to calculate fair value. Discounts may also be applied due to the nature and/or duration of any restrictions on the disposition of the asset or liability. Fair value represents a good faith approximation of the value of a security. Fair value determinations involve the consideration of a number of subjective factors, an analysis of applicable facts and circumstances and the exercise of judgment. As a result, it is possible that the fair value for a security determined in good faith in accordance with the Fund’s valuation procedures may differ from valuations for the same security determined by other funds using their own valuation procedures. Although the Fund’s valuation procedures are designed to value a security at the price the Fund may reasonably expect to receive upon the security’s sale in an orderly transaction, there can be no assurance that any fair value determination thereunder would, in fact, approximate the amount that the Fund would actually realize upon the sale of the security or the price at which the security would trade if a reliable market price were readily available. During the year ended October 31, 2019, there were no material changes to the fair value methodologies.
Securities which may be valued in this manner include, but are not limited to: (i) a security for which trading has been halted or suspended; (ii) a debt security that has recently gone into default and for which there is not a current market quotation; (iii) a security of an issuer that has entered into a restructuring; (iv) a security that has been delisted from a national exchange; (v) a security for which the market price is not readily available from a third-party pricing source or, if so provided, does not, in the opinion of the Manager or the Subadvisor, reflect the security’s market value; (vi) a security subject to trading collars for which no or limited trading takes place; and (vii) a security whose principal market has been temporarily closed at a time when, under normal conditions, it would be open. Securities valued in this manner are generally categorized as Level 3 in the hierarchy. As of October 31, 2019, there were no securities held by the Fund that were fair valued in such a manner.
Investments in mutual funds, including money market funds, are valued at their respective NAVs as of the close of the Exchange on the valuation date. These securities are generally categorized as Level 1 in the hierarchy.
Debt securities (other than convertible and municipal bonds) are valued at the evaluated bid prices (evaluated mean prices in the case of convertible and municipal bonds) supplied by a pricing agent or brokers selected by the Manager, in consultation with the Subadvisor. The evaluations are market-based measurements processed through a pricing application and represents the pricing agent’s good faith determination as to what a holder may receive in an orderly transaction under market conditions. The rules based logic utilizes valuation techniques that reflect participants’ assumptions and vary by asset class
Notes to Financial Statements(continued)
and per methodology, maximizing the use of relevant observable data including quoted prices for similar assets, benchmark yield curves and market corroborated inputs. The evaluated bid or mean prices are deemed by the Manager, in consultation with the Subadvisor, to be representative of market values at the regular close of trading of the Exchange on each valuation date. Debt securities purchased on a delayed delivery basis are marked to market daily until settlement at the forward settlement date. Debt securities, including corporate bonds, U.S. government and federal agency bonds, municipal bonds, foreign bonds, convertible bonds, asset-backed securities and mortgage-backed securities are generally categorized as Level 2 in the hierarchy.
Temporary cash investments acquired in excess of 60 days to maturity at the time of purchase are valued using the latest bid prices or using valuations based on a matrix system (which considers such factors as security prices, yields, maturities and ratings), both as furnished by independent pricing services. Other temporary cash investments which mature in 60 days or less at the time of purchase (“Short-Term Investments”) are valued using the amortized cost method of valuation, unless the use of such method would be inappropriate. The amortized cost method involves valuing a security at its cost on the date of purchase and thereafter assuming a constant amortization to maturity of the difference between such cost and the value on maturity date. Amortized cost approximates the current fair value of a security. Securities valued using the amortized cost method are not valued using quoted prices in an active market and are generally categorized as Level 2 in the hierarchy.
Foreign currency forward contracts are valued at their fair market values measured on the basis of the mean between the last current bid and ask prices based on dealer or exchange quotations and are generally categorized as Level 2 in the hierarchy.
The information above is not intended to reflect an exhaustive list of the methodologies that may be used to value portfolio investments. The valuation procedures permit the use of a variety of valuation methodologies in connection with valuing portfolio investments. The methodology used for a specific type of investment may vary based on the market data available or other considerations. The methodologies summarized above may not represent the specific means by which portfolio investments are valued on any particular business day.
A portfolio investment may be classified as an illiquid investment under the Trust’s written liquidity risk management program and related procedures (“Liquidity Program”). Illiquidity of an investment might prevent the sale of such investment at a time when the Manager or the Subadvisor might wish to sell, and these investments could have the effect of decreasing the overall level of the Fund’s liquidity. Further, the lack of an established secondary market may make it more difficult to value illiquid investments, requiring the Fund to rely on judgments that may be somewhat subjective in measuring value, which could vary materially from the amount that the Fund could realize upon disposition. Difficulty in selling illiquid investments may result in a loss or may be costly to the Fund. An illiquid investment is any investment that the Manager or Subadvisor reasonably expects cannot be sold or disposed of in current market conditions in seven calendar days or less without the sale or disposition significantly changing the market value of the investment. The liquidity classification of each investment will be made using information obtained after reasonable inquiry and taking into
account, among other things, relevant market, trading and investment-specific considerations in accordance with the Liquidity Program. Illiquid investments are often valued in accordance with methods deemed by the Board in good faith to be reasonable and appropriate to accurately reflect their fair value. The liquidity of the Fund’s investments, as shown in the Portfolio of Investments, was determined as of October 31, 2019, and can change at any time. Illiquid investments as of October 31, 2019, are shown in the Portfolio of Investments.
(B) Income Taxes. The Fund’s policy is to comply with the requirements of the Internal Revenue Code of 1986, as amended (the “Internal Revenue Code”), applicable to regulated investment companies and to distribute all of its taxable income to the shareholders of the Fund within the allowable time limits. Therefore, no federal, state and local income tax provisions are required.
Management evaluates the Fund’s tax positions to determine if the tax positions taken meet the minimum recognition threshold in connection with accounting for uncertainties in income tax positions taken or expected to be taken for the purposes of measuring and recognizing tax liabilities in the financial statements. Recognition of tax benefits of an uncertain tax position is permitted only to the extent the position is “more likely than not” to be sustained assuming examination by taxing authorities. Management has analyzed the Fund’s tax positions taken on federal, state and local income tax returns for all open tax years (for up to three tax years) and has concluded that no provisions for federal, state and local income tax are required in the Fund’s financial statements. The Fund’s federal, state and local income tax and federal excise tax returns for tax years for which the applicable statutes of limitations have not expired are subject to examination by the Internal Revenue Service and state and local departments of revenue.
(C) Foreign Taxes. The Fund may be subject to foreign taxes on income and other transaction-based taxes imposed by certain countries in which it invests. A portion of the taxes on gains on investments or currency purchases/repatriation may be reclaimable. The Fund will accrue such taxes and reclaims as applicable, based upon its current interpretation of tax rules and regulations that exist in the markets in which it invests.
The Fund may be subject to taxation on realized capital gains, repatriation proceeds and other transaction-based taxes imposed by certain countries in which it invests. The Fund will accrue such taxes as applicable based upon its current interpretation of tax rules and regulations that exist in the market in which it invests. Capital gains taxes relating to positions still held are reflected as a liability in the Statement of Assets and Liabilities, as well as an adjustment to the Fund’s net unrealized appreciation (depreciation). Taxes related to capital gains realized, if any, are reflected as part of net realized gain (loss) in the Statement of Operations. Changes in tax liabilities related to capital gains taxes on unrealized investment gains, if any, are reflected as part of the change in net unrealized appreciation (depreciation) on investments in the Statement of Operations. Transaction-based charges are generally assessed as a percentage of the transaction amount.
(D) Dividends and Distributions to Shareholders. Dividends and distributions are recorded on the ex-dividend date. The Fund intends to declare and pay dividends from net investment income, if any, at least monthly and distributions from net realized capital and
| | |
| 26 | | MainStay Candriam Emerging Markets Debt Fund |
currency gains, if any, at least annually. Unless the shareholder elects otherwise, all dividends and distributions are reinvested in the same class of shares of the Fund, at NAV. Dividends and distributions to shareholders are determined in accordance with federal income tax regulations and may differ from determinations using GAAP.
(E) Security Transactions and Investment Income. The Fund records security transactions on the trade date. Realized gains and losses on security transactions are determined using the identified cost method. Interest income is accrued as earned using the effective interest rate method. Discounts and premiums on securities purchased for the Fund are accreted and amortized, respectively, on the effective interest rate method over the life of the respective securities. Income frompayment-in-kind securities, to the extent the Fund held any such securities during the year ended October 31, 2019, is accreted daily based on the effective interest method.
Investment income and realized and unrealized gains and losses on investments of the Fund are allocated pro rata to the separate classes of shares based upon their relative net assets on the date the income is earned or realized and unrealized gains and losses are incurred.
The Fund may place a debt security on non-accrual status and reduce related interest income by ceasing current accruals and writing off all or a portion of any interest receivables when the collection of all or a portion of such interest has become doubtful. A debt security is removed from non-accrual status when the issuer resumes interest payments or when collectability of interest is reasonably assured.
(F) Expenses. Expenses of the Trust are allocated to the individual Funds in proportion to the net assets of the respective Funds when the expenses are incurred, except where direct allocations of expenses can be made. Expenses (other than transfer agent expenses and fees incurred under the shareholder services plans and/or the distribution plans further discussed in Note 3(B)) are allocated to separate classes of shares pro rata based upon their relative net assets on the date the expenses are incurred. The expenses borne by the Fund, including those of related parties to the Fund, are shown in the Statement of Operations.
Additionally, the Fund may invest in mutual funds, which are subject to management fees and other fees that may cause the costs of investing in mutual funds to be greater than the costs of owning the underlying securities directly. These indirect expenses of mutual funds are not included in the amounts shown as expenses in the Fund’s Statement of Operations or in the expense ratios included in the Financial Highlights.
(G) Use of Estimates. In preparing financial statements in conformity with GAAP, management makes estimates and assumptions that affect the reported amounts and disclosures in the financial statements. Actual results could differ from those estimates.
(H) Repurchase Agreements. The Fund may enter into repurchase agreements (i.e., buy a security from another party with the agreement that it will be sold back in the future) to earn income. The Fund may enter into repurchase agreements only with counterparties, usually financial institutions, that are deemed by the Manager or the Subadvisor to be creditworthy, pursuant to guidelines established by the Board. During the term of any repurchase agreement, the Manager or the Subadvisor will continue to monitor the creditworthiness of the
counterparty. Under the 1940 Act, repurchase agreements are considered to be collateralized loans by the Fund to the counterparty secured by the securities transferred to the Fund.
Repurchase agreements are subject to counterparty risk, meaning the Fund could lose money by the counterparty’s failure to perform under the terms of the agreement. The Fund mitigates this risk by ensuring the repurchase agreement is collateralized by cash, U.S. government securities, fixed income securities and/or other securities. The collateral is held by the Fund’s custodian and valued daily on a mark to market basis to determine if the value, including accrued interest, exceeds the repurchase price. In the event of the counterparty’s default on the obligation to repurchase, the Fund has the right to liquidate the collateral and apply the proceeds in satisfaction of the obligation. Under certain circumstances, such as in the event of default or bankruptcy by the counterparty, realization and/or retention of the collateral may be limited or subject to delay, to legal proceedings and possible realized loss to the Fund. As of October 31, 2019, the Fund did not hold any repurchase agreements.
(I) Foreign Currency Forward Contracts. The Fund may enter into foreign currency forward contracts, which are agreements to buy or sell foreign currencies on a specified future date at a specified rate. The Fund is subject to foreign currency exchange rate risk in the normal course of investing in these transactions. During the period the forward contract is open, changes in the value of the contract are recognized as unrealized appreciation or depreciation by marking to market such contract on a daily basis to reflect the market value of the contract at the end of each day’s trading. Cash movement occurs on settlement date. When the forward contract is closed, the Fund records a realized gain or loss equal to the difference between the proceeds from (or cost of) the closing transaction and the Fund’s basis in the contract. The Fund may purchase and sell foreign currency forward contracts for purposes of seeking to enhance portfolio returns and manage portfolio risk more efficiently. Foreign currency forward contracts may also be used to gain exposure to a particular currency or to hedge against the risk of loss due to changing currency exchange rates. Foreign currency forward contracts to purchase or sell a foreign currency may also be used in anticipation of future purchases or sales of securities denominated in foreign currency, even if the specific investments have not yet been selected.
The use of foreign currency forward contracts involves, to varying degrees, elements of risk in excess of the amount recognized in the Statement of Assets and Liabilities, including counterparty risk, market risk and illiquidity risk. Counterparty risk is heightened for these instruments because foreign currency forward contracts are not exchange-traded and therefore no clearinghouse or exchange stands ready to meet the obligations under such contracts. Thus, the Fund faces the risk that its counterparties under such contracts may not perform their obligations. Market risk is the risk that the value of a foreign currency forward contract will depreciate due to unfavorable changes in exchange rates. Illiquidity risk arises because the secondary market for foreign currency forward contracts may have less liquidity relative to markets for other securities and financial instruments. Risks also arise from the possible movements in the foreign exchange rates underlying these instruments. While the Fund may enter into forward contracts to reduce currency exchange risks, changes in currency exchange rates
Notes to Financial Statements(continued)
may result in poorer overall performance for the Fund than if it had not engaged in such transactions. Exchange rate movements can be large, depending on the currency, and can last for extended periods of time, affecting the value of the Fund’s assets. Moreover, there may be an imperfect correlation between the Fund’s holdings of securities denominated in a particular currency and forward contracts entered into by the Fund. Such imperfect correlation may prevent the Fund from achieving the intended hedge or expose the Fund to the risk of currency exchange loss. The unrealized appreciation (depreciation) on forward contracts also reflects the Fund’s exposure at the valuation date to credit loss in the event of a counterparty’s failure to perform its obligations. As of October 31, 2019, the Fund did not hold any foreign currency forward contracts.
(J) Foreign Currency Transactions. The Fund’s books and records are maintained in U.S. dollars. Prices of securities denominated in foreign currency amounts are translated into U.S. dollars at the mean between the buying and selling rates last quoted by any major U.S. bank at the following dates:
| (i) | market value of investment securities, other assets and liabilities—at the valuation date; and |
| (ii) | purchases and sales of investment securities, income and expenses—at the date of such transactions. |
The assets and liabilities that are denominated in foreign currency amounts are presented at the exchange rates and market values at the close of the period. The realized and unrealized changes in net assets arising from fluctuations in exchange rates and market prices of securities are not separately presented.
Net realized gain (loss) on foreign currency transactions represents net gains and losses on foreign currency forward contracts, net currency gains or losses realized as a result of differences between the amounts of securities sale proceeds or purchase cost, dividends, interest and withholding taxes as recorded on the Fund’s books, and the U.S. dollar equivalent amount actually received or paid. Net currency gains or losses from valuing such foreign currency denominated assets and liabilities, other than investments at valuation date exchange rates, are reflected in unrealized foreign exchange gains or losses.
(K) Securities Lending. In order to realize additional income, the Fund may engage in securities lending, subject to the limitations set forth in the 1940 Act and relevant guidance by the staff of the Securities and Exchange Commission (“SEC”). In the event the Fund does engage in securities lending, the Fund will lend through its custodian, State Street Bank and Trust Company (“State Street”), acting as securities lending agent on behalf of the Fund. State Street will manage the Fund’s collateral in accordance with the securities lending agency agreement between the Fund and State Street, and indemnify the Fund against counterparty risk. The loans will be collateralized by cash (which may be invested in a money market fund) and/ornon-cash collateral (which may include U.S. Treasury securities and/or U.S. Government Agency securities issued or guaranteed by the United States government or its agencies or instrumentalities) at least equal at all times to the market value of the securities loaned. The Fund may bear the risk of delay in recovery of, or loss of rights in, the securities loaned should the borrower of the securities experience financial difficulty. The Fund may also record a realized gain or loss on securities deemed sold due to a
borrower’s inability to return securities on loan. The Fund bears the risk of any loss on investment of cash collateral. The Fund will receive compensation for lending its securities in the form of fees or it will retain a portion of interest earned on the investment of any cash collateral. The Fund will also continue to receive interest and dividends on the securities loaned and any gain or loss in the market price of the securities loaned that may occur during the term of the loan will be for the account of the Fund. Income earned from securities lending activities, if any, is reflected in the Statement of Operations. As of October 31, 2019, the Fund had securities on loan with an aggregate market value of $1,244,333 and received cash collateral, which was invested into the State Street Navigator Securities Lending Government Money Market Portfolio, with a value of $1,263,650.
(L) High Yield and General Debt Securities Risk. The Fund’s principal investments include high yield debt securities (commonly referred to as “junk bonds”), which are considered speculative because they present a greater risk of loss, including default, than higher quality debt securities. These securities pay investors a premium—a higher interest rate or yield than investment grade debt securities—because of the increased risk of loss. These securities can also be subject to greater price volatility. In times of unusual or adverse market economic or political conditions, these securities may experience higher than normal default rates.
(M) Foreign Securities Risk. The Fund may invest in foreign securities, which carry certain risks that are in addition to the usual risks inherent in domestic securities. These risks include those resulting from currency fluctuations, future adverse political or economic developments and possible imposition of currency exchange blockages or other foreign governmental laws or restrictions. These risks are likely to be greater in emerging markets than in developed markets. The ability of issuers of debt securities held by the Fund to meet their obligations may be affected by, among other things, economic or political developments in a specific country, industry or region.
(N) Counterparty Credit Risk. In order to better define its contractual rights and to secure rights that will help the Fund mitigate its counterparty risk, the Fund may enter into an International Swaps and Derivatives Association, Inc. Master Agreement (“ISDA Master Agreement”) or similar agreement with its counterparties. An ISDA Master Agreement is a bilateral agreement between the Fund and a counterparty that governs certain OTC derivatives and typically contains collateral posting terms and netting provisions. Under an ISDA Master Agreement, the Fund may, under certain circumstances, offset with the counterparty certain derivative financial instruments’ payables and/or receivables with collateral held and/or posted and create one single net payment. The provisions of the ISDA Master Agreement typically permit a single net payment in the event of default including the bankruptcy or insolvency of the counterparty. Bankruptcy or insolvency laws of a particular jurisdiction may restrict or prohibit the right of offset in bankruptcy, insolvency or other events. In addition, certain ISDA Master Agreements may contain provisions for early termination of OTC derivative transactions in the event the net assets of the Fund decline below specific levels or if the Fund fails to meet the terms of its ISDA Master Agreements. The result would cause the Fund to accelerate payment of any net liability owed to the counterparty.
| | |
| 28 | | MainStay Candriam Emerging Markets Debt Fund |
For financial reporting purposes, the Fund does not offset derivative assets and derivative liabilities that are subject to netting arrangements, if any, in the Statement of Assets and Liabilities.
(O) Indemnifications. Under the Trust’s organizational documents, its officers and trustees are indemnified against certain liabilities that may arise out of performance of their duties to the Trust. Additionally, in the normal course of business, the Fund enters into contracts with third-party service providers that contain a variety of representations and warranties and which may provide general indemnifications. The Fund’s maximum exposure under these arrangements is unknown, as this would involve future claims that may be made against the Fund that have not yet occurred. Based on experience, management is of the view that the risk of loss in connection with these potential indemnification obligations is remote. However, there can be no assurance that material liabilities related to such obligations will not arise in the future, which could adversely impact the Fund.
(P) Quantitative Disclosure of Derivative Holdings. The following tables show additional disclosures related to the Fund’s derivative and hedging activities, including how such activities are accounted for and their effect on the Fund’s financial positions, performance and cash flows. The Fund entered into foreign currency forward contracts to hedge against the risk of loss due to changing currency exchange rates. These derivatives are not accounted for as hedging instruments.
The effect of derivative instruments on the Statement of Operations for the year ended October 31, 2019:
Realized Gain (Loss)
| | | | | | | | | | |
| | | Statement of
Operations
Location | | Foreign
Exchange
Contracts
Risk | | | Total | |
| | | |
Forward Contracts | | Net realized gain (loss) on foreign currency forward transactions | | $ | 38,232 | | | $ | 38,232 | |
| | | | | | |
Total Realized Gain (Loss) | | | | $ | 38,232 | | | $ | 38,232 | |
| | | | | | |
Average Notional Amount
| | | | | | | | | | |
| | | | | Foreign
Exchange
Contracts
Risk | | | Total | |
| | | |
Forward Contracts Short (a) | | | | $ | (3,068,553 | ) | | $ | (3,068,553 | ) |
| | | | | | |
| (a) | Positions were open three months during the reporting period. |
Note 3–Fees and Related Party Transactions
(A) Manager and Subadvisor. New York Life Investments, a registered investment adviser and an indirect,wholly-owned subsidiary of New York Life Insurance Company (“New York Life”), serves as the Fund’s Manager, pursuant to an Amended and Restated Management Agreement (“Management Agreement”). The Manager provides offices,
conducts clerical, recordkeeping and bookkeeping services and keeps most of the financial and accounting records required to be maintained by the Fund. Except for the portion of salaries and expenses that are the responsibility of the Fund, the Manager pays the salaries and expenses of all personnel affiliated with the Fund and certain operational expenses of the Fund. The Fund reimburses New York Life Investments in an amount equal to a portion of the compensation of the Chief Compliance Officer attributable to the Fund. The Fund’s subadvisor changed effective June 21, 2019 due to the termination of MacKay Shields LLC as the Fund’s subadvisor and the appointment of Candriam Luxembourg S.C.A. (“Candriam Luxembourg” or the “Subadvisor”) as the Fund’s subadvisor. Candriam Luxembourg, a registered investment adviser and an indirect,wholly-owned subsidiary of New York Life, serves as Subadvisor to the Fund and is responsible for theday-to-day portfolio management of the Fund. Pursuant to the terms of a Subadvisory Agreement (“Subadvisory Agreement”) between New York Life Investments and Candriam Luxembourg, New York Life Investments pays for the services of the Subadvisor.
Effective June 21, 2019, under the Management Agreement, the Fund pays the Manager a monthly fee for the services performed and the facilities furnished at an annual rate of the Fund’s average daily net assets as follows: 0.70% to $500 million and 0.65% in excess of $500 million.
Prior to June 21, 2019, the Fund paid the Manager a monthly fee for the services performed and the facilities furnished at an annual rate of the Fund’s average daily net assets as follows: 0.70% to $500 million and 0.65% in excess of $500 million, plus a fee for fund accounting services previously provided by New York Life Investments under a separate fund accounting agreement furnished at an annual rate of the Fund’s average net assets as follows: 0.05% up to $20 million; 0.0333% from $20 million to $100 million; and 0.01% in excess of $100 million. During the year ended October 31, 2019, the effective management fee rate was 0.72% inclusive of a fee for fund accounting services of 0.02% of the Fund’s average daily net assets.
Effective June 21, 2019, New York Life Investments has contractually agreed to waive fees and/or reimburse expenses so that Total Annual Fund Operating Expenses (excluding taxes, interest, litigation, extraordinary expenses, brokerage and other transaction expenses relating to the purchase or sale of portfolio investments, and acquired (underlying) fund fees and expenses) do not exceed the following percentages of average daily net assets: Class A, 1.17% and Class I, 0.85%. New York Life Investments will apply an equivalent waiver or reimbursement, in an equal number of basis points of the Class A shares waiver/reimbursement to the Investor Class, Class B and Class C shares. Additionally, New York Life Investments contractually has agreed to waive fees and/or reimburse expenses so that Total Annual Fund Operating Expenses (excluding taxes, interest, litigation, extraordinary expenses, brokerage and other transaction expenses relating to the purchase or sale of portfolio investments, and acquired (underlying) fund fees and expenses) of Class R6 do not exceed those of Class I. These agreements will remain in effect until February 28, 2020, and shall renew automatically for one-year terms unless New York Life Investments provides written notice of termination prior to the start of the next term or upon approval of the Board.
Notes to Financial Statements(continued)
During the year ended October 31, 2019, New York Life Investments earned fees from the Fund in the amount of $1,045,279 and waived fees/reimbursed expenses in the amount of $50,154 and paid MacKay Shields LLC and Candriam Luxembourg in the amount of $313,086 and $172,761, respectively.
State Street providessub-administration andsub-accounting services to the Fund pursuant to an agreement with New York Life Investments. These services include calculating the daily NAVs of the Fund, maintaining the general ledger andsub-ledger accounts for the calculation of the Fund’s NAVs and assisting New York Life Investments in conducting various aspects of the Fund’s administrative operations. For providing these services to the Fund, State Street is compensated by New York Life Investments.
Pursuant to an agreement between the Trust and New York Life Investments, New York Life Investments is responsible for providing or procuring certain regulatory reporting services for the Fund. The Fund will reimburse New York Life Investments for the actual costs incurred by New York Life Investments in connection with providing or procuring these services for the Fund.
(B) Distribution and Service Fees. The Trust, on behalf of the Fund, has entered into a distribution agreement with NYLIFE Distributors LLC (the “Distributor”), an indirect,wholly-owned subsidiary of New York Life. The Fund has adopted distribution plans (the “Plans”) in accordance with the provisions of Rule 12b-1 under the 1940 Act.
Pursuant to the Class A and Investor Class Plans, the Distributor receives a monthly distribution fee from the Class A and Investor Class shares at an annual rate of 0.25% of the average daily net assets of the Class A and Investor Class shares for distribution and/or service activities as designated by the Distributor. Pursuant to the Class B and Class C Plans, Class B and Class C shares pay the Distributor a monthly distribution fee at an annual rate of 0.75% of the average daily net assets of the Class B and Class C shares along with a service fee at an annual rate of 0.25% of the average daily net assets of the Class B and Class C shares, for a total 12b-1 fee of 1.00%. Class I and Class R6 shares are not subject to a distribution and/or service fee.
The Plans provide that the distribution and service fees are payable to the Distributor regardless of the amounts actually expended by the Distributor for distribution of the Fund’s shares and service activities.
(C) Sales Charges. During the year ended October 31, 2019, the Fund was advised by the Distributor that the amount of initial sales charges retained on sales of Class A and Investor Class shares were $13,038 and $2,486, respectively.
During the year ended October 31, 2019, the Fund was also advised that the Distributor retained CDSCs on redemptions of Class A, Investor Class, Class B and Class C shares of $1,395, $33, $2,713 and $1,125, respectively.
(D) Transfer, Dividend Disbursing and Shareholder Servicing Agent. NYLIM Service Company LLC, an affiliate of New York Life Investments, is the Fund’s transfer, dividend disbursing and shareholder servicing agent pursuant to an agreement between NYLIM Service Company LLC and the Trust. NYLIM Service Company LLC has entered into an agreement with DST Asset Manager Solutions, Inc. (“DST”), pursuant to which DST performs certain transfer agent services on behalf of NYLIM Service Company LLC. During the year ended October 31, 2019, transfer agent expenses incurred by the Fund were as follows:
| | | | |
Class A | | $ | 102,126 | |
Investor Class | | | 65,841 | |
Class B | | | 12,734 | |
Class C | | | 61,528 | |
Class I | | | 21,079 | |
(E) Small Account Fee. Shareholders with small accounts adversely impact the cost of providing transfer agency services. In an effort to reduce total transfer agency expenses, the Fund has implemented a small account fee on certain types of accounts. Certain shareholders with an account balance of less than $1,000 are charged an annual per account fee of $20 (assessed semi-annually), the proceeds from which offset transfer agent fees as reflected in the Statement of Operations.
(F) Investments in Affiliates (in 000’s). During the year ended October 31, 2019, purchases and sales transactions, income earned from investments and shares held of investment companies managed by New York Life Investments or its affiliates were as follows:
| | | | | | | | | | | | | | | | | | | | | | | | | | | | | | | | | | | | |
Affiliated Investment Company | | Value,
Beginning of
Year | | | Purchases at
Cost | | | Proceeds
from Sales | | | Net
Realized
Gain/(Loss)
on Sales | | | Change in
Unrealized
Appreciation/
(Depreciation) | | | Value,
End of
Year | | | Dividend
Income | | | Other
Distributions | | | Shares
End of
Year | |
MainStay U.S. Government Liquidity Fund | | $ | — | | | $ | 123,115 | | | $ | (118,377 | ) | | $ | — | | | $ | — | | | $ | 4,738 | | | $ | 108 | | | $ | — | | | | 4,738 | |
Note 4–Federal Income Tax
As of October 31, 2019, the cost and unrealized appreciation (depreciation) of the Fund’s investment portfolio, including applicable
derivative contracts and other financial instruments, as determined on a federal income tax basis, were as follows:
| | | | | | | | | | | | | | | | |
| | | Federal Tax
Cost | | | Gross
Unrealized
Appreciation | | | Gross
Unrealized
(Depreciation) | | | Net
Unrealized
Appreciation/
(Depreciation) | |
| | | | |
Investments in Securities | | $ | 142,457,621 | | | $ | 5,411,726 | | | $ | (8,669,991 | ) | | $ | (3,258,265 | ) |
| | |
| 30 | | MainStay Candriam Emerging Markets Debt Fund |
As of October 31, 2019, the components of accumulated gain (loss) on a tax basis were as follows:
| | | | | | | | |
Ordinary
Income | | Accumulated
Capital and
Other Gain
(Loss) | | Other
Temporary
Differences | | Unrealized
Appreciation
(Depreciation) | | Total
Accumulated
Gain (Loss) |
| | | | |
| $207,898 | | $(8,335,414) | | $(974,518) | | $(3,217,154) | | $(12,319,188) |
The difference between book-basis and tax-basis unrealized appreciation (depreciation) is primarily due to the wash sale adjustments. The other temporary differences are primarily due to interest accruals on defaulted securities.
As of October 31, 2019, for federal income tax purposes, capital loss carryforwards of $8,322,902 were available as shown in the table below, to the extent provided by the regulations to offset future realized gains of the Fund through the years indicated. To the extent that these capital loss carryforwards are used to offset future capital gains, it is probable that the capital gains so offset will not be distributed to shareholders. No capital gain distributions shall be made until any capital loss carryforwards have been fully utilized or expired.
| | | | |
Capital Loss
Available Through | | Short-Term
Capital Loss
Amounts (000’s) | | Long-Term
Capital Loss
Amounts (000’s) |
| | |
| Unlimited | | $— | | $8,323 |
The Fund utilized $4,325,445 of capital loss carryforwards during the year ended October 31, 2019.
During the years ended October 31, 2019 and October 31, 2018, the tax character of distributions paid as reflected in the Statements of Changes in Net Assets were as follows:
| | | | | | | | |
| | | 2019 | | | 2018 | |
| | |
Distributions paid from: | | | | | | | | |
Ordinary Income | | $ | 6,909,064 | | | $ | 6,401,610 | |
Note 5–Custodian
State Street is the custodian of cash and securities held by the Fund. Custodial fees are charged to the Fund based on the Fund’s net assets and/or the market value of securities held by the Fund and the number of certain transactions incurred by the Fund.
Note 6–Line of Credit
The Fund and certain other funds managed by New York Life Investments maintain a line of credit with a syndicate of banks in order to secure a source of funds for temporary purposes to meet unanticipated or excessive redemption requests.
Effective July 30, 2019, under the credit agreement (the “Credit Agreement”), the aggregate commitment amount is $600,000,000 with an additional uncommitted amount of $100,000,000. The commitment fee is an annual rate of 0.15% of the average commitment amount payable quarterly, regardless of usage, to State Street, who serves as the agent to the syndicate. The commitment fee is allocated among the Fund and certain other funds managed by New York Life Investments based upon their respective net assets and other factors. Interest on any
revolving credit loan is charged based upon the Federal Funds Rate or the one-month London Interbank Offered Rate (“LIBOR”), whichever is higher. The Credit Agreement expires on July 28, 2020, although the Fund, certain other funds managed by New York Life Investments and the syndicate of banks may renew the Credit Agreement for an additional year on the same or different terms. Prior to July 30, 2019, the aggregate commitment amount and the commitment fee were the same as those under the current Credit Agreement.
During the year ended October 31, 2019, the Fund utilized the line of credit for 1 day, with a balance of $28,295,000 at an interest rate of 3.06% and incurred interest expense in the amount of $2,406. As of October 31, 2019, there were no borrowings outstanding with respect to the Fund under the Credit Agreement.
Note 7–Interfund Lending Program
Pursuant to an exemptive order issued by the SEC, the Fund, along with certain other funds managed by New York Life Investments, may participate in an interfund lending program. The interfund lending program provides an alternative credit facility that permits the Fund and certain other funds managed by New York Life Investments to lend or borrow money for temporary purposes directly to or from one another subject to the conditions of the exemptive order. During the year ended October 31, 2019, there were no interfund loans made or outstanding with respect to the Fund.
Note 8–Purchases and Sales of Securities (in 000’s)
During the year ended October 31, 2019, purchases and sales of securities, other thanshort-term securities, were $141,800 and $146,922, respectively.
Note 9–Capital Share Transactions
Transactions in capital shares for the years ended October 31, 2019 and October 31, 2018, were as follows:
| | | | | | | | |
Class A | | Shares | | | Amount | |
| | |
Year ended October 31, 2019: | | | | | | | | |
Shares sold | | | 2,555,502 | | | $ | 26,374,018 | |
Shares issued to shareholders in reinvestment of dividends and distributions | | | 407,217 | | | | 4,170,024 | |
Shares redeemed | | | (3,094,426 | ) | | | (31,724,904 | ) |
| | | | |
Net increase (decrease) in shares outstanding before conversion | | | (131,707 | ) | | | (1,180,862 | ) |
Shares converted into Class A (See Note 1) | | | 183,520 | | | | 1,899,175 | |
Shares converted from Class A (See Note 1) | | | (24,697 | ) | | | (257,842 | ) |
| | | | |
Net increase (decrease) | | | 27,116 | | | $ | 460,471 | |
| | | | |
Year ended October 31, 2018: | | | | | | | | |
Shares sold | | | 1,033,435 | | | $ | 10,727,445 | |
Shares issued to shareholders in reinvestment of dividends and distributions | | | 371,003 | | | | 3,815,066 | |
Shares redeemed | | | (2,685,777 | ) | | | (27,743,123 | ) |
| | | | |
Net increase (decrease) in shares outstanding before conversion | | | (1,281,339 | ) | | | (13,200,612 | ) |
Shares converted into Class A (See Note 1) | | | 120,973 | | | | 1,265,379 | |
Shares converted from Class A (See Note 1) | | | (62,221 | ) | | | (638,453 | ) |
| | | | |
Net increase (decrease) | | | (1,222,587 | ) | | $ | (12,573,686 | ) |
| | | | |
Notes to Financial Statements(continued)
| | | | | | | | |
Investor Class | | Shares | | | Amount | |
Year ended October 31, 2019: | | | | | | | | |
Shares sold | | | 266,774 | | | $ | 2,815,350 | |
Shares issued to shareholders in reinvestment of dividends and distributions | | | 69,446 | | | | 716,993 | |
Shares redeemed | | | (416,144 | ) | | | (4,359,048 | ) |
| | | | |
Net increase (decrease) in shares outstanding before conversion | | | (79,924 | ) | | | (826,705 | ) |
Shares converted into Investor Class (See Note 1) | | | 106,852 | | | | 1,106,499 | |
Shares converted from Investor Class (See Note 1) | | | (134,281 | ) | | | (1,408,214 | ) |
| | | | |
Net increase (decrease) | | | (107,353 | ) | | $ | (1,128,420 | ) |
| | | | |
Year ended October 31, 2018: | | | | | | | | |
Shares sold | | | 107,694 | | | $ | 1,135,613 | |
Shares issued to shareholders in reinvestment of dividends and distributions | | | 63,477 | | | | 658,302 | |
Shares redeemed | | | (246,848 | ) | | | (2,577,946 | ) |
| | | | |
Net increase (decrease) in shares outstanding before conversion | | | (75,677 | ) | | | (784,031 | ) |
Shares converted into Investor Class (See Note 1) | | | 107,684 | | | | 1,120,234 | |
Shares converted from Investor Class (See Note 1) | | | (103,096 | ) | | | (1,088,826 | ) |
| | | | |
Net increase (decrease) | | | (71,089 | ) | | $ | (752,623 | ) |
| | | | |
| | |
| | | | | | | | |
Class B | | Shares | | | Amount | |
Year ended October 31, 2019: | | | | | | | | |
Shares sold | | | 75,759 | | | $ | 774,548 | |
Shares issued to shareholders in reinvestment of dividends and distributions | | | 10,855 | | | | 108,400 | |
Shares redeemed | | | (161,907 | ) | | | (1,630,432 | ) |
| | | | |
Net increase (decrease) in shares outstanding before conversion | | | (75,293 | ) | | | (747,484 | ) |
Shares converted from Class B (See Note 1) | | | (49,399 | ) | | | (494,342 | ) |
| | | | |
Net increase (decrease) | | | (124,692 | ) | | $ | (1,241,826 | ) |
| | | | |
Year ended October 31, 2018: | | | | | | | | |
Shares sold | | | 11,487 | | | $ | 117,997 | |
Shares issued to shareholders in reinvestment of dividends and distributions | | | 13,374 | | | | 135,164 | |
Shares redeemed | | | (138,705 | ) | | | (1,411,323 | ) |
| | | | |
Net increase (decrease) in shares outstanding before conversion | | | (113,844 | ) | | | (1,158,162 | ) |
Shares converted from Class B (See Note 1) | | | (64,534 | ) | | | (658,334 | ) |
| | | | |
Net increase (decrease) | | | (178,378 | ) | | $ | (1,816,496 | ) |
| | | | |
| | | | | | | | |
Class C | | Shares | | | Amount | |
Year ended October 31, 2019: | | | | | | | | |
Shares sold | | | 52,255 | | | $ | 529,219 | |
Shares issued to shareholders in reinvestment of dividends and distributions | | | 53,732 | | | | 535,313 | |
Shares redeemed | | | (954,406 | ) | | | (9,640,685 | ) |
| | | | |
Net increase (decrease) in shares outstanding before conversion | | | (848,419 | ) | | | (8,576,153 | ) |
Shares converted from Class C (See Note 1) | | | (84,254 | ) | | | (845,276 | ) |
| | | | |
Net increase (decrease) | | | (932,673 | ) | | $ | (9,421,429 | ) |
| | | | |
Year ended October 31, 2018: | | | | | | | | |
Shares sold | | | 147,944 | | | $ | 1,506,123 | |
Shares issued to shareholders in reinvestment of dividends and distributions | | | 70,549 | | | | 713,019 | |
Shares redeemed | | | (841,462 | ) | | | (8,512,109 | ) |
| | | | |
Net increase (decrease) in shares outstanding before conversion | | | (622,969 | ) | | | (6,292,967 | ) |
Shares converted from Class C (See Note 1) | | | (1,151 | ) | | | (12,281 | ) |
| | | | |
Net increase (decrease) | | | (624,120 | ) | | $ | (6,305,248 | ) |
| | | | |
| | |
| | | | | | | | |
Class I | | Shares | | | Amount | |
Year ended October 31, 2019: | | | | | | | | |
Shares sold | | | 6,746,992 | | | $ | 71,346,375 | |
Shares issued to shareholders in reinvestment of dividends and distributions | | | 101,826 | | | | 1,060,045 | |
Shares redeemed | | | (6,289,438 | ) | | | (66,511,402 | ) |
| | | | |
Net increase (decrease) | | | 559,380 | | | $ | 5,895,018 | |
| | | | |
Year ended October 31, 2018: | | | | | | | | |
Shares sold | | | 1,296,637 | | | $ | 13,379,566 | |
Shares issued to shareholders in reinvestment of dividends and distributions | | | 65,366 | | | | 673,801 | |
Shares redeemed | | | (2,375,313 | ) | | | (24,376,733 | ) |
| | | | |
Net increase (decrease) in shares outstanding before conversion | | | (1,013,310 | ) | | | (10,323,366 | ) |
Shares converted into Class I (See Note 1) | | | 1,130 | | | | 12,281 | |
| | | | |
Net increase (decrease) | | | (1,012,180 | ) | | $ | (10,311,085 | ) |
| | | | |
Note 10–Recent Accounting Pronouncement
In March 2017, the Financial Accounting Standards Board issued an Accounting Standards Update, ASU2017-08, which amends the amortization period for certain callable debt securities that are held at a premium. The amendment requires the premium to be amortized to the earliest call date. This amendment does not require an accounting change for securities held at a discount. This guidance is effective for fiscal years beginning after December 15, 2018. At this time, management is evaluating the implications of the ASU and any impact on the financial statements has not yet been determined.
To improve the effectiveness of fair value disclosure requirements, the Financial Accounting Standards Board recently issued Accounting Standards Update (ASU)2018-13, Fair Value Measurement Disclosure Framework—Changes to the Disclosure Requirements for Fair Value Measurement (ASU2018-13), which adds, removes, and modifies certain aspects relating to fair value disclosure. ASU2018-13 is effective for interim and annual reporting periods beginning after December 15, 2019; early adoptions of the entire ASU 2018-13, or portions thereof, is permitted. Management has evaluated the
| | |
| 32 | | MainStay Candriam Emerging Markets Debt Fund |
implications of certain other provisions of the ASU and has determined to early adopt aspects related to the removal and modifications of certain fair value measurement disclosures under the ASU effective immediately. At this time, management is evaluating the implications of certain other provisions of the ASU related to new disclosure requirements and any impact on the financial statement disclosures has not yet been determined.
Note 11–Subsequent Events
In connection with the preparation of the financial statements of the Fund as of and for the year ended October 31, 2019, events and
transactions subsequent to October 31, 2019, through the date the financial statements were issued have been evaluated by the Fund’s management for possible adjustment and/or disclosure. No subsequent events requiring financial statement adjustment or disclosure have been identified.
Report of Independent Registered Public Accounting Firm
To the Shareholders and Board of Trustees
The MainStay Funds:
Opinion on the Financial Statements
We have audited the accompanying statement of assets and liabilities of MainStay Candriam Emerging Markets Debt Fund (formerly, MainStay MacKay Emerging Markets Debt Fund) (the Fund), one of the funds constituting The MainStay Funds, including the portfolio of investments, as of October 31, 2019, the related statement of operations for the year then ended, the statements of changes in net assets for each of the years in thetwo-year period then ended, and the related notes (collectively, the financial statements) and the financial highlights for each of the years in thefive-year period then ended. In our opinion, the financial statements and financial highlights present fairly, in all material respects, the financial position of the Fund as of October 31, 2019, the results of its operations for the year then ended, the changes in its net assets for each of the years in thetwo-year period then ended, and the financial highlights for each of the years in thefive-year period then ended, in conformity with U.S. generally accepted accounting principles.
Basis for Opinion
These financial statements and financial highlights are the responsibility of the Fund’s management. Our responsibility is to express an opinion on these financial statements and financial highlights based on our audits. We are a public accounting firm registered with the Public Company Accounting Oversight Board (United States) (PCAOB) and are required to be independent with respect to the Fund in accordance with the U.S. federal securities laws and the applicable rules and regulations of the Securities and Exchange Commission and the PCAOB.
We conducted our audits in accordance with the standards of the PCAOB. Those standards require that we plan and perform the audit to obtain reasonable assurance about whether the financial statements and financial highlights are free of material misstatement, whether due to error or fraud. Our audits included performing procedures to assess the risks of material misstatement of the financial statements and financial highlights, whether due to error or fraud, and performing procedures that respond to those risks. Such procedures included examining, on a test basis, evidence regarding the amounts and disclosures in the financial statements and financial highlights. Such procedures also included confirmation of securities owned as of October 31, 2019, by correspondence with the custodian, the transfer agent, and brokers or by other appropriate auditing procedures when replies from brokers were not received. Our audits also included evaluating the accounting principles used and significant estimates made by management, as well as evaluating the overall presentation of the financial statements and financial highlights. We believe that our audits provide a reasonable basis for our opinion.

We have served as the auditor of one or more New York Life Investment Management investment companies since 2003.
Philadelphia, Pennsylvania
December 23, 2019
| | |
| 34 | | MainStay Candriam Emerging Markets Debt Fund |
Federal Income Tax Information
(Unaudited)
The Fund is required under the Internal Revenue Code to advise shareholders in a written statement as to the federal tax status of dividends paid by the Fund during such fiscal years.
For the fiscal year ended October 31, 2019, the Fund designated approximately $304 under the Internal Revenue Code as qualified dividend income eligible for reduced tax rates.
In February 2020, shareholders will receive an IRS Form1099-DIV or substitute Form 1099, which will show the federal tax status of the distributions received by shareholders in calendar year 2019. The amounts that will be reported on such1099-DIV or substitute Form 1099 will be the amounts you are to use on your federal income tax return and will differ from the amounts which we must report for the Fund’s fiscal year end October 31, 2019.
Proxy Voting Policies and Procedures and Proxy Voting Record
A description of the policies and procedures that New York Life Investments uses to vote proxies related to the Fund’s securities is available without charge, upon request, by visiting the MainStay Funds’ website atnylinvestments.com/fundsor visiting the SEC’s website atwww.sec.gov.
The Fund is required to file with the SEC its proxy voting records for the12-month period ending June 30 on Form N-PX. The most recent Form N-PX or proxy voting record is available free of charge upon request by calling800-624-6782; visiting the MainStay Funds’ website atnylinvestments.com/funds; or visiting the SEC’s website atwww.sec.gov.
Shareholder Reports and Quarterly Portfolio Disclosure
The Fund is required to file its complete schedule of portfolio holdings with the SEC 60 days after its first and third fiscal quarter onForm N-PORT. The Fund’s holdings report is available free of charge by visiting the SEC’s website atwww.sec.govor upon request by calling New York Life Investments at800-624-6782.
Board of Trustees and Officers(Unaudited)
The Trustees and officers of the Funds are listed below. The Board oversees the MainStay Group of Funds (which consists of MainStay Funds and MainStay Funds Trust), MainStay VP Funds Trust, MainStay MacKay DefinedTerm Municipal Opportunities Fund, the Manager and the Subadvisors, and elects the officers of the Funds who are responsible for theday-to-day operations of the Funds. Information pertaining to the Trustees and officers is set forth below. Each Trustee serves until his or her successor is elected and qualified or until his or her
resignation, death or removal. Under the Board’s retirement policy, unless an exception is made, a Trustee must tender his or her resignation by the end of the calendar year during which he or she reaches the age of 75. Officers are elected annually by the Board. The business address of each Trustee and officer listed below is 51 Madison Avenue, New York, New York 10010. A majority of the Trustees are not “interested persons” (as defined by the 1940 Act and rules adopted by the SEC thereunder) of the Fund (“Independent Trustees”).
| | | | | | | | | | | | |
| | | | | Name and
Year of Birth | | Term of Office,
Position(s) Held and
Length of Service | | Principal Occupation(s)
During Past Five Years | | Number of
Portfolios in
Fund Complex
Overseen by
Trustee | | Other Directorships
Held by Trustee |
Interested Trustee | | | | Yie-Hsin Hung* 1962 | | MainStay Funds: Trustee since 2017; MainStay Funds Trust:Trustee since 2017. | | Senior Vice President of New York Life since joining in 2010, Member of the Executive Management Committee since 2017, Chief Executive Officer, New York Life Investment Management Holdings LLC & New York Life Investment Management LLC since 2015. Senior Managing Director andCo-President of New York Life Investment Management LLC from January 2014 to May 2015. Previously held positions of increasing responsibility, including head of NYLIM International, Alternative Growth Businesses, and Institutional investments since joining New York Life in 2010. | | 74 | | MainStay VP Funds Trust:
Trustee since 2017 (31 portfolios); and
MainStay MacKay DefinedTerm Municipal Opportunities Fund: Trustee since 2017. |
| | * | This Trustee is considered to be an “interested person” of the MainStay Group of Funds, MainStay VP Funds Trust and MainStay MacKay DefinedTerm Municipal Opportunities Fund, within the meaning of the 1940 Act because of her affiliation with New York Life Insurance Company, New York Life Investment Management LLC, Candriam Belgium S.A., Candriam Luxembourg S.C.A., IndexIQ Advisors LLC, MacKay Shields LLC, NYL Investors LLC, NYLIFE Securities LLC and/or NYLIFE Distributors LLC, as described in detail above in the column entitled “Principal Occupation(s) During Past Five Years.” |
| | |
| 36 | | MainStay Candriam Emerging Markets Debt Fund |
| | | | | | | | | | | | |
| | | | | Name and
Year of Birth | | Term of Office,
Position(s) Held and
Length of Service | | Principal Occupation(s)
During Past Five Years | | Number of
Portfolios in
Fund Complex
Overseen by
Trustee | | Other Directorships
Held by Trustee |
Independent Trustees | | | | David H. Chow 1957 | | MainStay Funds: Trustee since 2016, Advisory Board Member (June 2015 to December 2015); MainStay Funds Trust:Trustee since 2016, Advisory Board Member (June 2015 to December 2015). | | Founder and CEO, DanCourt Management, LLC (since 1999) | | 74 | | MainStay VP Funds Trust: Trustee since 2016, Advisory Board Member (June 2015 to December 2015) (31 portfolios);
MainStay MacKay DefinedTerm Municipal Opportunities Fund: Trustee since 2016, Advisory Board Member (June 2015 to December 2015);
Market Vectors Group of Exchange-Traded Funds: Independent Chairman of the Board of Trustees since 2008 and Trustee since 2006 (56 portfolios); and
Berea College of Kentucky: Trustee since 2009. |
| | | | Susan B. Kerley 1951 | | MainStay Funds: Chairman since 2017 and Trustee since 2007; MainStay Funds Trust:Chairman since 2017 and Trustee since 1990.** | | President, Strategic Management Advisors LLC (since 1990) | | 74 | | MainStay VP Funds Trust: Chairman since January 2017 and Trustee since 2007 (31 portfolios)***;
MainStay MacKay DefinedTerm Municipal Opportunities Fund: Chairman since 2017 and Trustee since 2011; and
Legg Mason Partners Funds: Trustee since 1991 (45 portfolios). |
| | | | Alan R. Latshaw 1951 | | MainStay Funds: Trustee; MainStay Funds Trust: Trustee and Audit Committee Financial Expert since 2007.** | | Retired; Partner, Ernst & Young LLP (2002 to 2003); Partner, Arthur Andersen LLP (1989 to 2002); Consultant to the MainStay Funds Audit and Compliance Committee (2004 to 2006) | | 74 | | MainStay VP Funds Trust: Trustee and Audit Committee Financial Expert since 2007 (31 portfolios)***;
MainStay MacKay DefinedTerm Municipal Opportunities Fund: Trustee and Audit Committee Financial Expert since 2011;
State Farm Associates Funds Trusts: Trustee since 2005 (4 portfolios);
and State Farm Variable Product Trust: Trustee since 2005 (9 portfolios). |
| | | | Richard H. Nolan, Jr. 1946 | | MainStay Funds: Trustee since 2007; MainStay Funds Trust:Trustee since 2007.** | | Managing Director, ICC Capital Management (since 2004); President—Shields/Alliance, Alliance Capital Management (1994 to 2004) | | 74 | | MainStay VP Funds Trust: Trustee since 2006 (31 portfolios)***; and
MainStay MacKay DefinedTerm Municipal Opportunities Fund: Trustee since 2011. |
| | | | Jacques P. Perold 1958 | | MainStay Funds: Trustee since 2016, Advisory Board Member (June 2015 to December 2015); MainStay Funds Trust:Trustee since 2016, Advisory Board Member (June 2015 to December 2015). | | Retired; President, Fidelity Management & Research Company (2009 to 2014); Founder, President and Chief Executive Officer, Geode Capital Management, LLC (2001 to 2009) | | 74 | | MainStay VP Funds Trust: Trustee since 2016, Advisory Board Member (June 2015 to December 2015) (31 portfolios);
MainStay MacKay DefinedTerm Municipal Opportunities Fund: Trustee since 2016, Advisory Board Member (June 2015 to December 2015);
Allstate Corporation: Director since 2015;MSCI, Inc.: Director since 2017 and
Boston University: Trustee since 2014. |
| | | | | | | | | | | | |
| | | | | Name and
Year of Birth | | Term of Office,
Position(s) Held and
Length of Service | | Principal Occupation(s)
During Past Five Years | | Number of
Portfolios in
Fund Complex
Overseen by
Trustee | | Other Directorships
Held by Trustee |
Independent Trustees | | | | Richard S. Trutanic 1952 | | MainStay Funds: Trustee since 1994; MainStay Funds Trust: Trustee since 2007.** | | Chairman and Chief Executive Officer, Somerset & Company (financial advisory firm) (since 2004); Managing Director, The Carlyle Group (private investment firm) (2002 to 2004); Senior Managing Director, Partner and Board Member, Groupe Arnault S.A. (private investment firm) (1999 to 2002) | | 74 | | MainStay VP Funds Trust: Trustee since 2007 (31 portfolios)***; and
MainStay MacKay DefinedTerm Municipal Opportunities Fund: Trustee since 2011. |
| | ** | Includes prior service as a Director/Trustee of certain predecessor entities to MainStay Funds Trust. |
| | *** | Includes prior service as a Director of MainStay VP Series Fund, Inc., the predecessor to MainStay VP Funds Trust. |
| | |
| 38 | | MainStay Candriam Emerging Markets Debt Fund |
| | | | | | | | |
| | | | | Name and
Year of Birth | | Position(s) Held and
Length of Service | | Principal Occupation(s)
During Past Five Years |
Officers
of the
Trust
(Who are
not
Trustees)* | | | | Kirk C. Lehneis 1974 | | President, MainStay Funds, MainStay Funds Trust (since 2017) | | Chief Operating Officer and Senior Managing Director (since 2016), New York Life Investment Management LLC; Chairman of the Board (since 2017), NYLIFE Distributors LLC; Chairman of the Board, NYLIM Service Company LLC (since 2017); Trustee, President and Principal Executive Officer of IndexIQ Trust, IndexIQ ETF Trust and IndexIQ Active ETF Trust (since January 2018); President, MainStay MacKay DefinedTerm Municipal Opportunities Fund and MainStay VP Funds Trust
(since 2017)**; Senior Managing Director, Global Product Development (2015 to 2016); Managing Director, Product Development (2010 to 2015), New York Life Investment Management LLC |
| | | | Jack R. Benintende 1964 | | Treasurer and Principal Financial and Accounting Officer, MainStay Funds (since 2007), MainStay Funds Trust (since 2009) | | Managing Director, New York Life Investment Management LLC (since 2007); Treasurer and Principal Financial and Accounting Officer, MainStay MacKay DefinedTerm Municipal Opportunities Fund (since 2011) and MainStay VP Funds Trust (since 2007)**; and Assistant Treasurer, New York Life Investment Management Holdings LLC (2008 to 2012) |
| | | | Kevin M. Bopp 1969 | | Vice President and Chief Compliance Officer, MainStay Funds and MainStay Funds Trust (since 2014) | | Chief Compliance Officer, New York Life Investment Management LLC, IndexIQ Trust, IndexIQ ETF Trust and IndexIQ Active ETF Trust (since 2016), Director and Associate General Counsel (2011 to 2014) and Vice President and Assistant General Counsel (2010 to 2011), New York Life Investment Management LLC; Vice President and Chief Compliance Officer, MainStay VP Funds Trust, MainStay MacKay DefinedTerm Municipal Opportunities Fund (since 2014); Assistant Secretary, MainStay Funds, MainStay Funds Trust and MainStay VP Funds Trust (2010 to 2014)**, MainStay MacKay DefinedTerm Municipal Opportunities Fund (2011 to 2014) |
| | | | J. Kevin Gao 1967 | | Secretary and Chief Legal Officer, MainStay Funds and MainStay Funds Trust (since 2010) | | Managing Director and Associate General Counsel, New York Life Investment Management LLC (since 2010); Secretary and Chief Legal Officer, MainStay MacKay DefinedTerm Municipal Opportunities Fund (since 2011) and MainStay VP Funds Trust (since 2010)** |
| | | | Scott T. Harrington 1959 | | Vice President—Administration, MainStay Funds (since 2005), MainStay Funds Trust (since 2009) | | Managing Director, New York Life Investment Management LLC (including predecessor advisory organizations) (since 2000); Member of the Board of Directors, New York Life Trust Company (since 2009); Vice President—Administration, MainStay MacKay DefinedTerm Municipal Opportunities Fund (since 2011) and MainStay VP Funds Trust (since 2005)** |
| | * | The officers listed above are considered to be “interested persons” of the MainStay Group of Funds, MainStay VP Funds Trust and MainStay MacKay Defined Term Municipal Opportunities Fund within the meaning of the 1940 Act because of their affiliation with the MainStay Group of Funds, New York Life Insurance Company and/or its affiliates, including New York Life Investment Management LLC, NYLIM Service Company LLC, NYLIFE Securities LLC and/or NYLIFE Distributors LLC, as described in detail in the column captioned “Principal Occupation(s) During Past Five Years.” Officers are elected annually by the Board. |
| | ** | Includes prior service as an Officer of MainStay VP Series Fund, Inc., the predecessor to MainStay VP Funds Trust. |
MainStay Funds
Equity
U.S. Equity
MainStay Epoch U.S. All Cap Fund
MainStay Epoch U.S. Equity Yield Fund
MainStay Large Cap Growth Fund
MainStay MacKay Common Stock Fund
MainStay MacKay Growth Fund
MainStay MacKay S&P 500 Index Fund
MainStay MacKay Small Cap Core Fund1
MainStay MacKay U.S. Equity Opportunities Fund
MainStay MAP Equity Fund
International Equity
MainStay Epoch International Choice Fund
MainStay MacKay International Equity Fund
MainStay MacKay International Opportunities Fund
Emerging Markets Equity
MainStay Candriam Emerging Markets Equity Fund
MainStay MacKay Emerging Markets Equity Fund
Global Equity
MainStay Epoch Capital Growth Fund
MainStay Epoch Global Equity Yield Fund
Fixed Income
Taxable Income
MainStay Candriam Emerging Markets Debt Fund2
MainStay Floating Rate Fund
MainStay Indexed Bond Fund3
MainStay MacKay High Yield Corporate Bond Fund
MainStay MacKay Infrastructure Bond Fund
MainStay MacKay Short Duration High Yield Fund
MainStay MacKay Total Return Bond Fund
MainStay MacKay Unconstrained Bond Fund
Tax-Exempt Income
MainStay MacKay California Tax Free Opportunities Fund4
MainStay MacKay High Yield Municipal Bond Fund
MainStay MacKay Intermediate Tax Free Bond Fund
MainStay MacKay New York Tax Free Opportunities Fund5
MainStay MacKay Short Term Municipal Fund
MainStay MacKay Tax Free Bond Fund
Money Market
MainStay Money Market Fund
Mixed Asset
MainStay Balanced Fund
MainStay Income Builder Fund
MainStay MacKay Convertible Fund
Speciality
MainStay Cushing Energy Income Fund
MainStay Cushing MLP Premier Fund
MainStay Cushing Renaissance Advantage Fund
Asset Allocation
MainStay Conservative Allocation Fund
MainStay Growth Allocation Fund
MainStay Moderate Allocation Fund
MainStay Moderate Growth Allocation Fund
Manager
New York Life Investment Management LLC
New York, New York
Subadvisors
Candriam Belgium S.A.6
Brussels, Belgium
Candriam Luxembourg S.C.A.6
Strassen, Luxembourg
Cushing Asset Management, LP
Dallas, Texas
Epoch Investment Partners, Inc.
New York, New York
MacKay Shields LLC6
New York, New York
Markston International LLC
White Plains, New York
NYL Investors LLC6
New York, New York
Winslow Capital Management, LLC
Minneapolis, Minnesota
Legal Counsel
Dechert LLP
Washington, District of Columbia
Independent Registered Public Accounting Firm
KPMG LLP
Philadelphia, Pennsylvania
| 1. | Formerly known as MainStay Epoch U.S. Small Cap Fund. |
| 2. | Formerly known as MainStay MacKay Emerging Markets Debt Fund. |
| 3. | Effective December 5, 2019, MainStay Indexed Bond Fund was renamed MainStay Short Term Bond Fund. |
| 4. | Class A and Class I shares of this Fund are registered for sale in AZ, CA, MI, NV, OR, TX, UT and WA. Class I shares are registered for sale in CO, FL, GA, HI, ID, MA, MD, NH, NJ and NY. |
| 5. | This Fund is registered for sale in CA, CT, DE, FL, MA, NJ, NY and VT. |
| 6. | An affiliate of New York Life Investment Management LLC. |
Not part of the Annual Report
For more information
800-624-6782
nylinvestments.com/funds
“New York Life Investments” is both a service mark, and the common trade name, of the investment advisors affiliated with New York Life Insurance Company. The MainStay Funds® are managed by New York Life Investment Management LLC and distributed by NYLIFE Distributors LLC, 30 Hudson Street, Jersey City, NJ 07302, a wholly owned subsidiary of New York Life Insurance Company. NYLIFE Distributors LLC is a Member FINRA/SIPC.
©2019 NYLIFE Distributors LLC. All rights reserved.
| | |
| 1717391 MS159-19 | | MSEMD11-12/19 (NYLIM) NL218 |
MainStay MacKay International Equity Fund
Message from the President and Annual Report
October 31, 2019

Beginning on January 1, 2021, paper copies of each MainStay Fund’s annual and semiannual shareholder reports will no longer be sent by mail, unless you specifically request paper copies of the reports from MainStay Funds or from your financial intermediary. Instead, the reports will be made available on the MainStay Funds’ website. You will be notified by mail and provided with a website address to access the report each time a new report is posted to the website.
If you already elected to receive shareholder reports electronically, you will not be affected by this change and you need not take any action. At any time, you may elect to receive reports and other communications from MainStay Funds electronically by calling toll-free 800-624-6782, by sending an e-mail to MainStayShareholderServices@nylim.com, or by contacting your financial intermediary.
You may elect to receive all future shareholder reports in paper form free of charge. If you hold shares of a MainStay Fund directly, you can inform MainStay Funds that you wish to receive paper copies of reports by calling toll-free 800-624-6782 or by sending an e-mail to MainStayShareholderServices@nylim.com. If you hold shares of a MainStay Fund through a financial intermediary, please contact the financial intermediary to make this election. Your election to receive reports in paper form will apply to all MainStay Funds in which you are invested and may apply to all funds held with your financial intermediary.
| | | | | | | | |
| | | | | |
| Not FDIC/NCUA Insured | | Not a Deposit | | May Lose Value | | No Bank Guarantee | | Not Insured by Any Government Agency |

This page intentionally left blank
Message from the President
Stock and bond markets generally gained ground during the12-month reporting period ended October 31, 2019, despite concerns regarding slowing U.S. and global economic growth and international trade conflicts.
After trending higher in November 2018, U.S. stocks and bonds dipped sharply in December 2018, over concerns regarding the pace of economic growth, a U.S. government shutdown and the potential impact of trade disputes between the United States and other nations, particularly China. U.S. markets recovered quickly in 2019 as trade tensions eased, the government reopened and the U.S. Federal Reserve Board (“Fed”) adopted a more accommodative tone regarding the future direction of interest rates. A wide spectrum of equity and fixed-income sectors gained ground through April 2019. Mixed macroeconomic signals and the inability of China and the United States to reach a trade agreement caused the market’s recovery to suffer during the spring and summer months of 2019. However, accommodative monetary policies from several central banks, including a series of interest rate cuts by the Fed, along with better-than-expected corporate earnings reassured investors and enabled markets to resume their advance.
Persistent, albeit slow, U.S. economic growth underpinned the U.S. stock market’s advance during the reporting period, positioning major U.S. equity indices to reach record territory by late October 2019. Sector strength shifted as investor sentiment alternated betweenrisk-on andrisk-off positions. In general, for the reporting period, cyclical, growth-oriented stocks outperformed their value-oriented counterparts by a small margin, with the information technology sector leading thelarge-cap S&P 500® Index. However, the traditionally more defensive areas of real estate and utilities generated above-average performance as well. Communication services, consumer discretionary, industrials and consumer staples performed in the middle of the pack, while materials, financials and health care lagged. Only the energy sector suffered declines, undermined by weak oil prices and concerns about future energy demand.
In the fixed-income markets, slowing economic growth, modest inflation and the Fed’s interest rate cuts created an environment of falling yields and rising prices for most bonds, with many areas of the market offering historically low yields by the end of the reporting period. Higher-credit-quality, longer-duration securities generally produced strong returns, with investment-
grade corporates and long-term Treasury bonds delivering particularly strong performance. A similar dynamic characterized the performance of the municipal bond market, with longer-term, higher-grade issues performing relatively well. On average, municipal bonds roughly matched the gains of corporate issues while providingtax-advantaged returns for eligible investors.
International stock and bond markets tended to underperform their U.S. counterparts, constrained by lackluster economic growth in the Eurozone and dramatically slowing growth in China and related parts of Asia amid persistent trade tensions with the United States. Uncertainties surrounding the unending Brexit drama took a further toll on investor confidence, with Britain seemingly unable to resolve its internal conflicts over how, or whether, to exit from the European Union. Nevertheless, on average, international securities delivered modestly positive returns, bolstered by the accommodative monetary policies implemented by European and Asian central banks. Bonds from both emerging and developed markets generally produced stronger returns than equities while repeating the pattern of outperformance by higher-quality, longer-term instruments seen in the United States.
As the economic growth cycle lengthens, investors are left to ponder how best to position their portfolios for an uncertain future. When the yield curve inverted earlier this year prompting concerns of a potential recession, we were reminded that the direction of the economy is continually subject to change, and perceptions of the economy can shift even more rapidly. As a MainStay investor, you can rely on us to manage our Funds with unflagging energy and dedication so that you can remain focused on your long-term objectives in the face of uncertainty and change. Our goal remains to provide you with the consistently reliable financial tools you need to achieve your long-term objectives.
Sincerely,

Kirk C. Lehneis
President
The opinions expressed are as of the date of this report and are subject to change. There is no guarantee that any forecast made will come to pass. This material does not constitute investment advice and is not intended as an endorsement of any specific investment. Past performance is no guarantee of future results.
Not part of the Annual Report
Table of Contents
Investors should refer to the Fund’s Summary Prospectus and/or Prospectus and consider the Fund’s investment objectives, strategies, risks, charges and expenses carefully before investing. The Summary Prospectus and/or Prospectus contain this and other information about the Fund. You may obtain copies of the Fund’s Summary Prospectus, Prospectus and Statement of Additional Information free of charge, upon request, by callingtoll-free 800-624-6782, by writing to NYLIFE Distributors LLC, Attn: MainStay Marketing Department, 30 Hudson Street, Jersey City, NJ 07302 or by sending ane-mail to MainStayShareholderServices@nylim.com. These documents are also available via the MainStay Funds’ website at nylinvestments.com/funds. Please read the Summary Prospectus and/or Prospectus carefully before investing.
Investment and Performance Comparison1(Unaudited)
Performance data quoted represents past performance. Past performance is no guarantee of future results. Because of market volatility and other factors, current performance may be lower or higher than the figures shown. Investment return and principal value will fluctuate, and as a result, when shares are redeemed, they may be worth more or less than their original cost. The graph below depicts the historical performance of Class B shares2 of the Fund. Performance will vary from class to class based on differences in class-specific expenses and sales charges. For performance information current to the most recent month-end, please call 800-624-6782 or visit nylinvestments.com/funds.
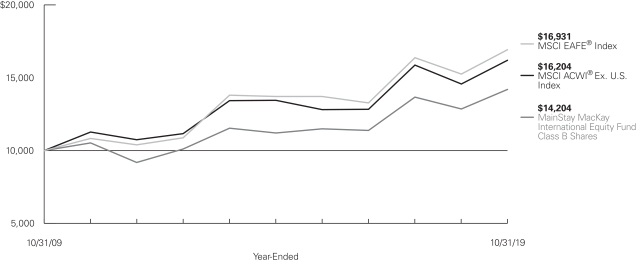
Average Annual Total Returns for the Year-Ended October 31, 2019
| | | | | | | | | | | | | | | | | | | | | | | | |
| Class | | Sales Charge | | | | Inception
Date | | | One Year
or Since
Inception | | | Five
Years | | | Ten
Years | | | Gross
Expense
Ratio3 | |
| | | | | | | |
| Class A Shares | | Maximum 5.5% Initial Sales Charge | | With sales charges Excluding sales charges | | | 1/3/1995 | | |
| 5.59
11.74 | %
| |
| 4.84
6.03 | %
| |
| 4.11
4.70 | %
| |
| 1.32
1.32 | %
|
| Investor Class Shares | | Maximum 5.5% Initial Sales Charge | | With sales charges Excluding sales charges | | | 2/28/2008 | | |
| 5.23
11.36 |
| |
| 4.48
5.67 |
| |
| 3.77
4.36 |
| |
| 1.70
1.70 |
|
| Class B Shares2 | | Maximum 5% CDSC
if Redeemed Within the
First Six Years of Purchase | | With sales charges Excluding sales charges | | | 9/13/1994 | | |
| 5.49
10.49 |
| |
| 4.55
4.88 |
| |
| 3.57
3.57 |
| |
| 2.44
2.44 |
|
| Class C Shares | | Maximum 1% CDSC if Redeemed Within One Year of Purchase | | With sales charges Excluding sales charges | | | 9/1/1998 | | |
| 9.49
10.49 |
| |
| 4.86
4.86 |
| |
| 3.57
3.57 |
| |
| 2.44
2.44 |
|
| Class I Shares | | No Sales Charge | | | | | 1/2/2004 | | | | 12.19 | | | | 6.33 | | | | 4.97 | | | | 1.07 | |
| Class R1 Shares | | No Sales Charge | | | | | 1/2/2004 | | | | 11.93 | | | | 6.20 | | | | 4.86 | | | | 1.17 | |
| Class R2 Shares | | No Sales Charge | | | | | 1/2/2004 | | | | 11.64 | | | | 5.94 | | | | 4.60 | | | | 1.42 | |
| Class R3 Shares | | No Sales Charge | | | | | 4/28/2006 | | | | 11.35 | | | | 5.67 | | | | 4.34 | | | | 1.67 | |
| Class R6 Shares | | No Sales Charge | | | | | 2/28/2019 | | | | 7.13 | | | | N/A | | | | N/A | | | | 1.00 | |
| 1. | The performance table and graph do not reflect the deduction of taxes that a shareholder would pay on distributions or Fund share redemptions. Total returns reflect maximum applicable sales charges as indicated in the table above, if any, changes in share price, and reinvestment of dividend and capital gain distributions. The graph assumes the initial investment amount shown above and reflects the deduction of all sales charges that would have applied for the period of investment. Performance figures may reflect certain fee waivers and/or expense limitations, without which total returns may have |
| | been lower. For more information on share classes and current fee waivers and/or expense limitations (if any), please refer to the Notes to Financial Statements. |
| 2. | Class B shares are closed to all new purchases as well as additional investments by existing Class B shareholders. |
| 3. | The gross expense ratios presented reflect the Fund’s “Total Annual Fund Operating Expenses” from the most recent Prospectus and may differ from other expense ratios disclosed in this report. |
The footnotes on the next page are an integral part of the table and graph and should be carefully read in conjunction with them.
| | | | | | | | | | | | |
| Benchmark Performance | | One Year | | | Five
Years | | | Ten Years | |
| | | |
MSCI ACWI® Ex U.S. Index4 | | | 11.27 | % | | | 3.82 | % | | | 4.94 | % |
MSCI EAFE® Index5 | | | 11.04 | | | | 4.31 | | | | 5.41 | |
Morningstar Foreign Large Growth Category Average6 | | | 14.78 | | | | 5.56 | | | | 6.84 | |
| 4. | The Fund has selected the MSCI ACWI® (All Country World Index) Ex U.S. Index as its primary broad-based securities market index for comparison purposes. The MSCI ACWI® Ex U.S. Index is a free float-adjusted market capitalization weighted index that is designed to measure the equity market performance of developed and emerging markets, excluding the U.S. Results assume reinvestment of all income and capital gains. An investment cannot be made directly in an index. |
| 5. | The MSCI EAFE® Index is the Fund’s secondary benchmark. The MSCI EAFE® Index consists of international stocks representing the developed world outside of North America. Results assume reinvestment of all income and capital gains. An investment cannot be made directly in an index. |
| 6. | The Morningstar Foreign Large Growth Category Average is representative of funds that focus on high-priced growth stocks, mainly outside of the United States. Most of these portfolios divide their assets among a dozen or more developed markets, including Japan, Britain, France, and Germany. These portfolios primarily invest in stocks that have market caps in the top 70% of each economically integrated market and will have less than 20% of assets invested in U.S. stocks. Results are based on average total returns of similar funds with all dividends and capital gain distributions reinvested. |
The footnotes on the preceding page are an integral part of the table and graph and should be carefully read in conjunction with them.
| | |
| 6 | | MainStay MacKay International Equity Fund |
Cost in Dollars of a $1,000 Investment in MainStay MacKay International Equity Fund (Unaudited)
The example below is intended to describe the fees and expenses borne by shareholders during the six-month period from May 1, 2019, to October 31, 2019, and the impact of those costs on your investment.
Example
As a shareholder of the Fund you incur two types of costs: (1) transaction costs, including exchange fees and sales charges (loads) on purchases (as applicable), and (2) ongoing costs, including management fees, distribution and/or service (12b-1) fees, and other Fund expenses (as applicable). This example is intended to help you understand your ongoing costs (in dollars) of investing in the Fund and to compare these costs with the ongoing costs of investing in other mutual funds. The example is based on an investment of $1,000 made at the beginning of the six-month period and held for the entire period from May 1, 2019, to October 31, 2019.
This example illustrates your Fund’s ongoing costs in two ways:
Actual Expenses
The second and third data columns in the table below provide information about actual account values and actual expenses. You may use the information in these columns, together with the amount you invested, to estimate the expenses that you paid during the six months ended October 31, 2019. Simply divide your account value by $1,000 (for example, an $8,600 account value divided by $1,000 = 8.6), then
multiply the result by the number under the heading entitled “Expenses Paid During Period” to estimate the expenses you paid on your account during this period.
Hypothetical Example for Comparison Purposes
The fourth and fifth data columns in the table below provide information about hypothetical account values and hypothetical expenses based on the Fund’s actual expense ratio and an assumed rate of return of 5% per year before expenses, which is not the Fund’s actual return. The hypothetical account values and expenses may not be used to estimate the actual ending account balances or expenses you paid for thesix-month period shown. You may use this information to compare the ongoing costs of investing in the Fund with the ongoing costs of investing in other mutual funds. To do so, compare this 5% hypothetical example with the 5% hypothetical examples that appear in the shareholder reports of the other mutual funds.
Please note that the expenses shown in the table are meant to highlight your ongoing costs only and do not reflect any transactional costs, such as exchange fees or sales charges (loads). Therefore, the fourth and fifth data columns of the table are useful in comparing ongoing costs only and will not help you determine the relative total costs of owning different funds. In addition, if these transactional costs were included, your costs would have been higher.
| | | | | | | | | | | | | | | | | | | | | | |
| | | | | | | | | | | | | | | | | | |
| Share Class | | Beginning
Account
Value
5/1/19 | | | Ending Account
Value (Based
on Actual
Returns and
Expenses)
10/31/19 | | | Expenses
Paid
During
Period1 | | | Ending Account
Value (Based on
Hypothetical 5%
Annualized
Return and
Actual Expenses)
10/31/19 | | | Expenses
Paid
During
Period1 | | | Net Expense
Ratio
During
Period2 |
| | | | | | |
| Class A Shares | | $ | 1,000.00 | | | $ | 1,032.60 | | | $ | 6.15 | | | $ | 1,019.16 | | | $ | 6.11 | | | 1.20% |
| | | | | | |
| Investor Class Shares | | $ | 1,000.00 | | | $ | 1,031.00 | | | $ | 8.04 | | | $ | 1,017.29 | | | $ | 7.98 | | | 1.57% |
| | | | | | |
| Class B Shares | | $ | 1,000.00 | | | $ | 1,026.80 | | | $ | 11.85 | | | $ | 1,013.51 | | | $ | 11.77 | | | 2.32% |
| | | | | | |
| Class C Shares | | $ | 1,000.00 | | | $ | 1,026.80 | | | $ | 11.90 | | | $ | 1,013.46 | | | $ | 11.82 | | | 2.33% |
| | | | | | |
| Class I Shares | | $ | 1,000.00 | | | $ | 1,035.40 | | | $ | 4.36 | | | $ | 1,020.92 | | | $ | 4.33 | | | 0.85% |
| | | | | | |
| Class R1 Shares | | $ | 1,000.00 | | | $ | 1,033.80 | | | $ | 5.38 | | | $ | 1,019.91 | | | $ | 5.35 | | | 1.05% |
| | | | | | |
| Class R2 Shares | | $ | 1,000.00 | | | $ | 1,032.50 | | | $ | 6.66 | | | $ | 1,018.65 | | | $ | 6.61 | | | 1.30% |
| | | | | | |
| Class R3 Shares | | $ | 1,000.00 | | | $ | 1,031.00 | | | $ | 7.93 | | | $ | 1,017.39 | | | $ | 7.88 | | | 1.55% |
| | | | | | |
| Class R6 Shares | | $ | 1,000.00 | | | $ | 1,035.30 | | | $ | 4.26 | | | $ | 1,021.02 | | | $ | 4.23 | | | 0.83% |
| 1. | Expenses are equal to the Fund’s annualized expense ratio of each class multiplied by the average account value over the period, divided by 365 and multiplied by 184 (to reflect the six-month period). The table above represents the actual expenses incurred during the six-month period. In addition to the fees and expenses which the Fund bears directly, it also indirectly bears a pro rata share of the fees and expenses of the underlying funds in which it invests. Such indirect expenses are not included in the above-reported expense figures. |
| 2. | Expenses are equal to the Fund’s annualized expense ratio to reflect the six-month period. |
Country Composition as of October 31, 2019(Unaudited)
| | | | |
| |
| United Kingdom | | | 21.1 | % |
| |
| Japan | | | 12.6 | |
| |
| Germany | | | 9.6 | |
| |
| Netherlands | | | 8.0 | |
| |
| Ireland | | | 7.3 | |
| |
| Spain | | | 5.1 | |
| |
| India | | | 4.7 | |
| |
| Canada | | | 3.7 | |
| |
| China | | | 3.7 | |
| |
| Switzerland | | | 3.7 | |
| | | | |
| |
| Sweden | | | 3.5 | % |
| |
| Denmark | | | 3.3 | |
| |
| United States | | | 2.8 | |
| |
| France | | | 2.5 | |
| |
| Italy | | | 2.1 | |
| |
| Taiwan | | | 1.6 | |
| |
| Mexico | | | 1.5 | |
| |
| Other Assets, Less Liabilities | | | 3.2 | |
| | | | |
| |
| | | 100.0 | % |
| | | | |
See Portfolio of Investments beginning on page 10 for specific holdings within these categories. The Fund’s holdings are subject to change.
Top Ten Holdings as of October 31, 2019(excludingshort-term investment) (Unaudited)
| 5. | Novo Nordisk A/S, Class B |
| 6. | Koninklijke Philips N.V. |
| | |
| 8 | | MainStay MacKay International Equity Fund |
Portfolio Management Discussion and Analysis(Unaudited)
Questions answered by portfolio managers Carlos Garcia-Tunon, CFA, Ian Murdoch, CFA, and Lawrence Rosenberg, CFA, of MacKay Shields LLC, the Fund’s Subadvisor.
How did MainStay MacKay International Equity Fund perform relative to its benchmarks and peer group during the 12 months ended October 31, 2019?
For the 12 months ended October 31, 2019, Class I shares of MainStay MacKay International Equity Fund returned 12.19%, outperforming the 11.27% return of the Fund’s primary benchmark, the MSCI ACWI® Ex U.S. Index, and the 11.04% return of the Fund’s secondary benchmark, the MSCI EAFE® Index. Over the same reporting period, Class I shares underperformed the 14.78% return of the Morningstar Foreign Large Growth Category Average.1
What factors affected the Fund’s relative performance during the reporting period?
The Fund outperformed its primary benchmark, the MSCI ACWI® Ex U.S. Index, during the reporting period due to positive stock selection on a country basis and a positive allocation effect on a sector basis, partially offset by a negative allocation effect on a country basis and negative stock selection on a sector basis.
During the reporting period, which sectors were the strongest positive contributors to the Fund’s relative performance and which sectors were particularly weak?
During the reporting period, the strongest positive contributions to the Fund’s relative performance came from the industrials, energy and financials sectors. (Contributions take weightings and total returns into account.) During the same reporting period, the weakest contributors to relative performance were the consumer discretionary, health care and consumer staples sectors.
During the reporting period, which individual stocks made the strongest positive contributions to the Fund’s absolute performance and which stocks detracted the most?
During the reporting period, the individual stocks that made the strongest positive contributions to the Fund’s absolute
performance included German online real estate and automotive marketplace provider Scout24, Canadian software holding company Constellation Software and French customer relationship management services firm Teleperformance. During the same reporting period, the Fund’s most significant detractors in terms of absolute contributions included U.K. medical technology company LivaNova, Hong Kong-listed global luggage company Samsonite International, and German Internet payment and processing firm Wirecard.
What were some of the Fund’s largest purchases and sales during the reporting period?
Over the reporting period, the Fund made its largest initial purchase in Dutch nutrition, health and sustainable living solutions producer DSM and made its largest addition to an existing position in Irish clinical research outsourcer ICON. The Fund made its largest full sale in German Internet access provider United Internet, while significantly reducing the size of its position in Japanese drug store operator Tsuruha Holdings.
How did the Fund’s sector and/or country weightings change during the reporting period?
During the reporting period, the Fund saw its largest weighting increases relative to the MSCI ACWI® Ex U.S. Index in the materials, industrials and health care sectors. Conversely, the Fund’s most substantial weighting decreases relative to the benchmark occurred in the consumer discretionary, information technology and communication services sectors.
How was the Fund positioned at the end of the reporting period?
Relative to the MSCI ACWI® Ex U.S. Index, the Fund ended the reporting period holding its most overweight sector exposures to health care, information technology and materials and its most underweight sector exposures to financials, energy and consumer staples.
| 1. | See page 5 for other share class returns, which may be higher or lower than Class I share returns. See page 6 for more information on benchmark and peer group returns. |
The opinions expressed are those of the portfolio managers as of the date of this report and are subject to change. There is no guarantee that any forecasts will come to pass. This material does not constitute investment advice and is not intended as an endorsement of any specific investment.
Portfolio of InvestmentsOctober 31, 2019
| | | | | | | | |
| | |
| | | Shares | | | Value | |
| Common Stocks 96.6%† | |
Canada 3.7% | |
Bank of Nova Scotia (Banks) | | | 102,859 | | | $ | 5,899,301 | |
Constellation Software, Inc. (Software) | | | 5,545 | | | | 5,476,503 | |
| | | | | | | | |
| | | | | | | 11,375,804 | |
| | | | | | | | |
China 3.7% | |
Tencent Holdings, Ltd. (Interactive Media & Services) | | | 285,098 | | | | 11,671,774 | |
| | | | | | | | |
|
Denmark 3.3% | |
Novo Nordisk A/S, Class B (Pharmaceuticals) | | | 189,073 | | | | 10,326,082 | |
| | | | | | | | |
|
France 2.5% | |
Teleperformance S.E. (Professional Services) | | | 33,687 | | | | 7,634,448 | |
| | | | | | | | |
|
Germany 9.6% | |
Carl Zeiss Meditec A.G. (Health Care Equipment & Supplies) | | | 45,843 | | | | 4,997,828 | |
Fresenius Medical Care A.G. & Co. KGaA (Health Care Providers & Services) | | | 115,055 | | | | 8,325,454 | |
Scout24 A.G. (Interactive Media & Services) (a) | | | 152,287 | | | | 9,417,941 | |
Symrise A.G. (Chemicals) | | | 74,411 | | | | 7,160,426 | |
| | | | | | | | |
| | | | | | | 29,901,649 | |
| | | | | | | | |
India 4.7% | |
HDFC Bank, Ltd. (Banks) | | | 349,084 | | | | 6,053,586 | |
Housing Development Finance Corp., Ltd. (Thrifts & Mortgage Finance) | | | 285,878 | | | | 8,613,169 | |
| | | | | | | | |
| | | | | | | 14,666,755 | |
| | | | | | | | |
Ireland 7.3% | |
Accenture PLC, Class A (IT Services) | | | 53,140 | | | | 9,853,219 | |
ICON PLC (Life Sciences Tools & Services) (b) | | | 88,189 | | | | 12,954,964 | |
| | | | | | | | |
| | | | | | | 22,808,183 | |
| | | | | | | | |
Italy 2.1% | |
Banca IFIS S.p.A. (Diversified Financial Services) | | | 108,813 | | | | 1,844,658 | |
DiaSorin S.p.A. (Health Care Equipment & Supplies) | | | 40,786 | | | | 4,594,350 | |
| | | | | | | | |
| | | | | | | 6,439,008 | |
| | | | | | | | |
Japan 12.6% | |
CyberAgent, Inc. (Media) | | | 172,700 | | | | 5,645,254 | |
Lion Corp. (Household Products) | | | 242,600 | | | | 5,108,551 | |
MonotaRO Co., Ltd. (Trading Companies & Distributors) (c) | | | 122,100 | | | | 3,736,832 | |
Relo Group, Inc. (Real Estate Management & Development) | | | 262,400 | | | | 6,475,563 | |
Takeda Pharmaceutical Co., Ltd. (Pharmaceuticals) | | | 88,921 | | | | 3,234,389 | |
TechnoPro Holdings, Inc. (Professional Services) | | | 90,600 | | | | 5,637,855 | |
| | | | | | | | |
| | |
| | | Shares | | | Value | |
Japan (continued) | |
Tsuruha Holdings, Inc. (Food & Staples Retailing) | | | 6,788 | | | $ | 768,749 | |
ZOZO, Inc. (Internet & Direct Marketing Retail) (c) | | | 374,596 | | | | 8,779,540 | |
| | | | | | | | |
| | | | | | | 39,386,733 | |
| | | | | | | | |
Mexico 1.5% | |
Regional S.A.B. de C.V. (Banks) | | | 864,239 | | | | 4,601,428 | |
| | | | | | | | |
|
Netherlands 8.0% | |
IMCD N.V. (Trading Companies & Distributors) | | | 76,855 | | | | 5,991,573 | |
Koninklijke DSM N.V. (Chemicals) | | | 72,911 | | | | 8,639,997 | |
Koninklijke Philips N.V. (Health Care Equipment & Supplies) | | | 233,473 | | | | 10,225,608 | |
| | | | | | | | |
| | | | | | | 24,857,178 | |
| | | | | | | | |
Spain 5.1% | |
Amadeus IT Group S.A. (IT Services) | | | 103,404 | | | | 7,650,756 | |
Industria de Diseno Textil S.A. (Specialty Retail) (c) | | | 260,556 | | | | 8,122,215 | |
| | | | | | | | |
| | | | | | | 15,772,971 | |
| | | | | | | | |
Sweden 3.5% | |
Hexagon AB, Class B (Electronic Equipment, Instruments & Components) | | | 213,488 | | | | 10,898,043 | |
| | | | | | | | |
|
Switzerland 3.7% | |
Sika A.G., Registered (Chemicals) | | | 20,797 | | | | 3,573,331 | |
TE Connectivity, Ltd. (Electronic Equipment, Instruments & Components) | | | 89,579 | | | | 8,017,321 | |
| | | | | | | | |
| | | | | | | 11,590,652 | |
| | | | | | | | |
Taiwan 1.6% | |
Taiwan Semiconductor Manufacturing Co., Ltd., Sponsored ADR (Semiconductors & Semiconductor Equipment) | | | 95,139 | | | | 4,912,027 | |
| | | | | | | | |
|
United Kingdom 21.1% | |
Big Yellow Group PLC (Equity Real Estate Investment Trusts) | | | 215,343 | | | | 3,185,547 | |
Compass Group PLC (Hotels, Restaurants & Leisure) | | | 285,025 | | | | 7,590,900 | |
Diageo PLC (Beverages) | | | 170,263 | | | | 6,979,312 | |
Experian PLC (Professional Services) | | | 159,600 | | | | 5,019,596 | |
HomeServe PLC (Commercial Services & Supplies) | | | 368,724 | | | | 5,535,694 | |
Johnson Matthey PLC (Chemicals) | | | 267,650 | | | | 10,643,705 | |
LivaNova PLC (Health Care Equipment & Supplies) (b) | | | 110,589 | | | | 7,821,960 | |
Prudential PLC (Insurance) | | | 576,017 | | | | 10,061,748 | |
St. James’s Place PLC (Capital Markets) | | | 653,973 | | | | 8,818,561 | |
| | | | | | | | |
| | | | | | | 65,657,023 | |
| | | | | | | | |
| | | | |
| 10 | | MainStay MacKay International Equity Fund | | The notes to the financial statements are an integral part of,
and should be read in conjunction with, the financial statements. |
| | | | | | | | |
| | |
| | | Shares | | | Value | |
| Common Stocks (continued) | |
United States 2.6% | |
Samsonite International S.A. (Textiles, Apparel & Luxury Goods) (a) | | | 1,297,940 | | | $ | 2,673,416 | |
STERIS PLC (Health Care Equipment & Supplies) | | | 39,429 | | | | 5,581,963 | |
| | | | | | | | |
| | | | | | | 8,255,379 | |
| | | | | | | | |
Total Common Stocks
(Cost $276,523,470) | | | | | | | 300,755,137 | |
| | | | | | | | |
|
| Short-Term Investment 0.2% | |
Affiliated Investment Company 0.2% | |
United States 0.2% | |
MainStay U.S. Government Liquidity Fund, 1.76% (d) | | | 599,056 | | | | 599,056 | |
| | | | | | | | |
TotalShort-Term Investment
(Cost $599,056) | | | | | | | 599,056 | |
| | | | | | | | |
Total Investments
(Cost $277,122,526) | | | 96.8 | % | | | 301,354,193 | |
Other Assets, Less Liabilities | | | 3.2 | | | | 9,977,696 | |
Net Assets | | | 100.0 | % | | $ | 311,331,889 | |
| † | Percentages indicated are based on Fund net assets. |
| (a) | May be sold to institutional investors only under Rule 144A or securities offered pursuant to Section 4(a)(2) of the Securities Act of 1933, as amended. |
| (b) | Non-income producing security. |
| (c) | All or a portion of this security was held on loan. As of October 31, 2019, the aggregate market value of securities on loan was $15,924,963. The Fund received non-cash collateral in the form of U.S. Treasury securities with a value of $16,845,172 (See Note 2(I)). |
| (d) | Current yield as of October 31, 2019. |
The following abbreviation is used in the preceding pages:
ADR—American Depositary Receipt
The following is a summary of the fair valuations according to the inputs used as of October 31, 2019, for valuing the Fund’s assets:
| | | | | | | | | | | | | | | | |
Description | | Quoted Prices in Active
Markets for
Identical Assets (Level 1) | | | Significant
Other
Observable
Inputs
(Level 2) | | | Significant
Unobservable
Inputs
(Level 3) | | | Total | |
| | | | |
Asset Valuation Inputs | | | | | | | | | | | | | | | | |
| Investments in Securities (a) | | | | | | | | | | | | | | | | |
| Common Stocks | | $ | 300,755,137 | | | $ | — | | | $ | — | | | $ | 300,755,137 | |
| Short-Term Investment | | | | | | | | | | | | | | | | |
Affiliated Investment Company | | | 599,056 | | | | — | | | | — | | | | 599,056 | |
| | | | | | | | | | | | | | | | |
| Total Investments in Securities | | $ | 301,354,193 | | | $ | — | | | $ | — | | | $ | 301,354,193 | |
| | | | | | | | | | | | | | | | |
| (a) | For a complete listing of investments and their industries, see the Portfolio of Investments. |
| | | | | | |
The notes to the financial statements are an integral part of,
and should be read in conjunction with, the financial statements. | | | | | 11 | |
Portfolio of InvestmentsOctober 31, 2019 (continued)
The table below sets forth the diversification of the Fund’s investments by industry.
Industry Diversification (Unaudited)
| | | | | | |
| | | Value | | Percent † | |
Banks | | $16,554,315 | | | 5.3 | % |
Beverages | | 6,979,312 | | | 2.2 | |
Capital Markets | | 8,818,561 | | | 2.8 | |
Chemicals | | 30,017,459 | | | 9.6 | |
Commercial Services & Supplies | | 5,535,694 | | | 1.8 | |
Diversified Financial Services | | 1,844,658 | | | 0.6 | |
Electronic Equipment, Instruments & Components | | 18,915,364 | | | 6.1 | |
Equity Real Estate Investment Trusts | | 3,185,547 | | | 1.0 | |
Food & Staples Retailing | | 768,749 | | | 0.2 | |
Health Care Equipment & Supplies | | 33,221,709 | | | 10.7 | |
Health Care Providers & Services | | 8,325,454 | | | 2.7 | |
Hotels, Restaurants & Leisure | | 7,590,900 | | | 2.4 | |
Household Products | | 5,108,551 | | | 1.6 | |
Insurance | | 10,061,748 | | | 3.2 | |
Interactive Media & Services | | 21,089,715 | | | 6.8 | |
Internet & Direct Marketing Retail | | 8,779,540 | | | 2.8 | |
IT Services | | 17,503,975 | | | 5.6 | |
Life Sciences Tools & Services | | 12,954,964 | | | 4.2 | |
Media | | 5,645,254 | | | 1.8 | |
Pharmaceuticals | | 13,560,471 | | | 4.4 | |
Professional Services | | 18,291,899 | | | 5.9 | |
Real Estate Management & Development | | 6,475,563 | | | 2.1 | |
Semiconductors & Semiconductor Equipment | | 4,912,027 | | | 1.6 | |
Software | | 5,476,503 | | | 1.8 | |
Specialty Retail | | 8,122,215 | | | 2.6 | |
Textiles, Apparel & Luxury Goods | | 2,673,416 | | | 0.9 | |
Thrifts & Mortgage Finance | | 8,613,169 | | | 2.8 | |
Trading Companies & Distributors | | 9,728,405 | | | 3.1 | |
| | | | | | |
| | 300,755,137 | | | 96.6 | |
Short-Term Investment | | 599,056 | | | 0.2 | |
Other Assets, Less Liabilities | | 9,977,696 | | | 3.2 | |
| | | | | | |
Net Assets | | $311,331,889 | | | 100.0 | % |
| | | | | | |
| † | Percentages indicated are based on Fund net assets. |
| | | | |
| 12 | | MainStay MacKay International Equity Fund | | The notes to the financial statements are an integral part of,
and should be read in conjunction with, the financial statements. |
Statement of Assets and Liabilitiesas of October 31, 2019
| | | | |
| Assets | | | | |
Investment in unaffiliated securities, at value
(identified cost $276,523,470) including securities on loan of $15,924,963 | | $ | 300,755,137 | |
Investment in affiliated investment company, at value (identified cost $599,056) | | | 599,056 | |
Cash denominated in foreign currencies
(identified cost $9,277,053) | | | 9,251,689 | |
Receivables: | | | | |
Dividends | | | 696,653 | |
Investment securities sold | | | 901,288 | |
Fund shares sold | | | 42,966 | |
Securities lending | | | 21,587 | |
Other assets | | | 39,159 | |
| | | | |
Total assets | | | 312,307,535 | |
| | | | |
| |
| Liabilities | | | | |
Due to custodian | | | 476,635 | |
Payables: | | | | |
Manager (See Note 3) | | | 192,766 | |
Fund shares redeemed | | | 146,074 | |
Transfer agent (See Note 3) | | | 50,714 | |
Custodian | | | 37,430 | |
NYLIFE Distributors (See Note 3) | | | 24,061 | |
Professional fees | | | 17,902 | |
Shareholder communication | | | 15,861 | |
Foreign capital gains tax (See Note 2(C)) | | | 6,998 | |
Trustees | | | 559 | |
Accrued expenses | | | 6,646 | |
| | | | |
Total liabilities | | | 975,646 | |
| | | | |
Net assets | | $ | 311,331,889 | |
| | | | |
| |
| Composition of Net Assets | | | | |
Shares of beneficial interest outstanding (par value of $.01 per share) unlimited number of shares authorized | | $ | 181,442 | |
Additional paid-in capital | | | 277,876,534 | |
| | | | |
| | | 278,057,976 | |
Total distributable earnings (loss) | | | 33,273,913 | |
| | | | |
Net assets | | $ | 311,331,889 | |
| | | | |
| | | | |
Class A | | | | |
Net assets applicable to outstanding shares | | $ | 57,565,555 | |
| | | | |
Shares of beneficial interest outstanding | | | 3,361,827 | |
| | | | |
Net asset value per share outstanding | | $ | 17.12 | |
Maximum sales charge (5.50% of offering price) | | | 1.00 | |
| | | | |
Maximum offering price per share outstanding | | $ | 18.12 | |
| | | | |
Investor Class | | | | |
Net assets applicable to outstanding shares | | $ | 23,870,347 | |
| | | | |
Shares of beneficial interest outstanding | | | 1,408,805 | |
| | | | |
Net asset value per share outstanding | | $ | 16.94 | |
Maximum sales charge (5.50% of offering price) | | | 0.99 | |
| | | | |
Maximum offering price per share outstanding | | $ | 17.93 | |
| | | | |
Class B | | | | |
Net assets applicable to outstanding shares | | $ | 3,344,613 | |
| | | | |
Shares of beneficial interest outstanding | | | 223,941 | |
| | | | |
Net asset value and offering price per share outstanding | | $ | 14.94 | |
| | | | |
Class C | | | | |
Net assets applicable to outstanding shares | | $ | 3,914,899 | |
| | | | |
Shares of beneficial interest outstanding | | | 262,140 | |
| | | | |
Net asset value and offering price per share outstanding | | $ | 14.93 | |
| | | | |
Class I | | | | |
Net assets applicable to outstanding shares | | $ | 43,280,008 | |
| | | | |
Shares of beneficial interest outstanding | | | 2,505,206 | |
| | | | |
Net asset value and offering price per share outstanding | | $ | 17.28 | |
| | | | |
Class R1 | | | | |
Net assets applicable to outstanding shares | | $ | 265,075 | |
| | | | |
Shares of beneficial interest outstanding | | | 15,455 | |
| | | | |
Net asset value and offering price per share outstanding | | $ | 17.15 | |
| | | | |
Class R2 | | | | |
Net assets applicable to outstanding shares | | $ | 453,990 | |
| | | | |
Shares of beneficial interest outstanding | | | 26,474 | |
| | | | |
Net asset value and offering price per share outstanding | | $ | 17.15 | |
| | | | |
Class R3 | | | | |
Net assets applicable to outstanding shares | | $ | 1,154,206 | |
| | | | |
Shares of beneficial interest outstanding | | | 68,065 | |
| | | | |
Net asset value and offering price per share outstanding | | $ | 16.96 | |
| | | | |
Class R6 | | | | |
Net assets applicable to outstanding shares | | $ | 177,483,196 | |
| | | | |
Shares of beneficial interest outstanding | | | 10,272,302 | |
| | | | |
Net asset value and offering price per share outstanding | | $ | 17.28 | |
| | | | |
| | | | | | |
The notes to the financial statements are an integral part of,
and should be read in conjunction with, the financial statements. | | | | | 13 | |
Statement of Operationsfor the year ended October 31, 2019
| | | | |
| Investment Income (Loss) | | | | |
Income | | | | |
Dividends—unaffiliated (a) | | $ | 5,410,664 | |
Securities lending | | | 69,453 | |
Interest | | | 18,042 | |
Dividends—affiliated | | | 9,099 | |
| | | | |
Total income | | | 5,507,258 | |
| | | | |
Expenses | | | | |
Manager (See Note 3) | | | 2,751,837 | |
Transfer agent (See Note 3) | | | 320,313 | |
Distribution/Service—Class A (See Note 3) | | | 147,738 | |
Distribution/Service—Investor Class (See Note 3) | | | 57,214 | |
Distribution/Service—Class B (See Note 3) | | | 38,141 | |
Distribution/Service—Class C (See Note 3) | | | 54,706 | |
Distribution/Service—Class R2 (See Note 3) | | | 1,173 | |
Distribution/Service—Class R3 (See Note 3) | | | 4,962 | |
Registration | | | 110,002 | |
Professional fees | | | 91,232 | |
Custodian | | | 88,286 | |
Shareholder communication | | | 35,614 | |
Trustees | | | 7,593 | |
Shareholder service (See Note 3) | | | 1,991 | |
Miscellaneous | | | 31,284 | |
| | | | |
Total expenses before waiver/reimbursement | | | 3,742,086 | |
Expense waiver/reimbursement from Manager (See Note 3) | | | (520,869 | ) |
| | | | |
Net expenses | | | 3,221,217 | |
| | | | |
Net investment income (loss) | | | 2,286,041 | |
| | | | |
|
| Realized and Unrealized Gain (Loss) on Investments and Foreign Currency Transactions | |
Net realized gain (loss) on: | | | | |
Unaffiliated investment transactions | | | 10,062,416 | |
Foreign currency transactions | | | (682,962 | ) |
| | | | |
Net realized gain (loss) on investments and foreign currency transactions | | | 9,379,454 | |
| | | | |
Net change in unrealized appreciation (depreciation) on: | | | | |
Unaffiliated investments (b) | | | 22,470,768 | |
Translation of other assets and liabilities in foreign currencies | | | 185,306 | |
| | | | |
Net change in unrealized appreciation (depreciation) on investments and foreign currencies | | | 22,656,074 | |
| | | | |
Net realized and unrealized gain (loss) on investments and foreign currency transactions | | | 32,035,528 | |
| | | | |
Net increase (decrease) in net assets resulting from operations | | $ | 34,321,569 | |
| | | | |
| (a) | Dividends recorded net of foreign withholding taxes in the amount of $519,131. |
| (b) | Net change in unrealized appreciation (depreciation) on investments recorded net of foreign capital gains tax in the amount of $(6,998). |
| | | | |
| 14 | | MainStay MacKay International Equity Fund | | The notes to the financial statements are an integral part of,
and should be read in conjunction with, the financial statements. |
Statements of Changes in Net Assets
for the years ended October 31, 2019 and October 31, 2018
| | | | | | | | |
| | | 2019 | | | 2018 | |
| Increase (Decrease) in Net Assets | |
Operations: | | | | | | | | |
Net investment income (loss) | | $ | 2,286,041 | | | $ | 895,933 | |
Net realized gain (loss) on investments and foreign currency transactions | | | 9,379,454 | | | | 38,217,248 | |
Net change in unrealized appreciation (depreciation) on investments and foreign currencies | | | 22,656,074 | | | | (55,576,108 | ) |
| | | | |
Net increase (decrease) in net assets resulting from operations | | | 34,321,569 | | | | (16,462,927 | ) |
| | | | |
Distributions to shareholders: | | | | | | | | |
Class A | | | (588,241 | ) | | | (306,159 | ) |
Investor Class | | | (216,775 | ) | | | (44,461 | ) |
Class B | | | (45,981 | ) | | | — | |
Class C | | | (75,618 | ) | | | — | |
Class I | | | (2,235,732 | ) | | | (1,621,018 | ) |
Class R1 | | | (20,555 | ) | | | (17,860 | ) |
Class R2 | | | (4,901 | ) | | | (5,543 | ) |
Class R3 | | | (8,671 | ) | | | (2,963 | ) |
| | | | |
Total distributions to shareholders | | | (3,196,474 | ) | | | (1,998,004 | ) |
| | | | |
Capital share transactions: | | | | | | | | |
Net proceeds from sale of shares | | | 52,866,647 | | | | 84,138,632 | |
Net asset value of shares issued to shareholders in reinvestment of distributions | | | 3,166,285 | | | | 1,980,858 | |
Cost of shares redeemed | | | (84,971,939 | ) | | | (62,141,023 | ) |
| | | | |
Increase (decrease) in net assets derived from capital share transactions | | | (28,939,007 | ) | | | 23,978,467 | |
| | | | |
Net increase (decrease) in net assets | | | 2,186,088 | | | | 5,517,536 | |
| | |
| Net Assets | | | | | | | | |
Beginning of year | | | 309,145,801 | | | | 303,628,265 | |
| | | | |
End of year | | $ | 311,331,889 | | | $ | 309,145,801 | |
| | | | |
| | | | | | |
The notes to the financial statements are an integral part of,
and should be read in conjunction with, the financial statements. | | | | | 15 | |
Financial Highlightsselected per share data and ratios
| | | | | | | | | | | | | | | | | | | | |
| |
| | | Year ended October 31, | |
| | | | | |
| Class A | | 2019 | | | 2018 | | | 2017 | | | 2016 | | | 2015 | |
| | | | | |
Net asset value at beginning of year | | $ | 15.48 | | | $ | 16.38 | | | $ | 13.51 | | | $ | 13.51 | | | $ | 13.11 | |
| | | | | | | | | | | | | | | | | | | | |
| | | | | |
Net investment income (loss) (a) | | | 0.09 | | | | 0.03 | | | | 0.00 | ‡ | | | 0.04 | | | | 0.03 | |
| | | | | |
Net realized and unrealized gain (loss) on investments | | | 1.73 | | | | (0.83 | ) | | | 2.90 | | | | (0.04 | ) | | | 0.49 | |
| | | | | |
Net realized and unrealized gain (loss) on foreign currency transactions | | | (0.03 | ) | | | (0.01 | ) | | | 0.01 | | | | 0.01 | | | | (0.03 | ) |
| | | | | | | | | | | | | | | | | | | | |
| | | | | |
Total from investment operations | | | 1.79 | | | | (0.81 | ) | | | 2.91 | | | | 0.01 | | | | 0.49 | |
| | | | | | | | | | | | | | | | | | | | |
| | | | | |
| Less dividends and distributions: | | | | | | | | | | | | | | | | | | | | |
| | | | | |
From net investment income | | | — | | | | (0.09 | ) | | | (0.04 | ) | | | (0.01 | ) | | | (0.09 | ) |
| | | | | |
From net realized gain on investments | | | (0.15 | ) | | | — | | | | — | | | | — | | | | — | |
| | | | | | | | | | | | | | | | | | | | |
| | | | | |
Total dividends and distributions | | | (0.15 | ) | | | (0.09 | ) | | | (0.04 | ) | | | (0.01 | ) | | | (0.09 | ) |
| | | | | | | | | | | | | | | | | | | | |
| | | | | |
Net asset value at end of year | | $ | 17.12 | | | $ | 15.48 | | | $ | 16.38 | | | $ | 13.51 | | | $ | 13.51 | |
| | | | | | | | | | | | | | | | | | | | |
| | | | | |
Total investment return (b) | | | 11.74 | % | | | (4.98 | %) | | | 21.59 | % | | | 0.05 | % | | | 3.78 | % |
| | | | | |
| Ratios (to average net assets)/Supplemental Data: | | | | | | | | | | | | | | | | | | | | |
| | | | | |
Net investment income (loss) | | | 0.57 | % | | | 0.17 | % | | | 0.01 | % | | | 0.28 | %(c) | | | 0.20 | % |
| | | | | |
Net expenses (d) | | | 1.21 | % | | | 1.32 | % | | | 1.34 | % | | | 1.32 | %(e) | | | 1.33 | % |
| | | | | |
Expenses (before waiver/reimbursement) | | | 1.35 | % | | | 1.32 | % | | | 1.34 | % | | | 1.32 | %(e) | | | 1.33 | % |
| | | | | |
Portfolio turnover rate | | | 58 | % | | | 53 | % | | | 45 | % | | | 33 | % | | | 42 | % |
| | | | | |
Net assets at end of year (in 000’s) | | $ | 57,566 | | | $ | 59,304 | | | $ | 54,553 | | | $ | 41,891 | | | $ | 43,405 | |
| ‡ | Less than one cent per share. |
| (a) | Per share data based on average shares outstanding during the year. |
| (b) | Total investment return is calculated exclusive of sales charges and assumes the reinvestment of dividends and distributions. For periods of less than one year, total return is not annualized. |
| (c) | Without the custody fee reimbursement, net investment income (loss) would have been 0.27%. |
| (d) | In addition to the fees and expenses which the Fund bears directly, it also indirectly bears a pro-rata share of the fees and expenses of the underlying funds in which it invests. Such indirect expenses are not included in the above expense ratios. |
| (e) | Without the custody fee reimbursement, net expenses would have been 1.33%. |
| | | | | | | | | | | | | | | | | | | | |
| |
| | | Year ended October 31, | |
| | | | | |
| Investor Class | | 2019 | | | 2018 | | | 2017 | | | 2016 | | | 2015 | |
| | | | | |
Net asset value at beginning of year | | $ | 15.38 | | | $ | 16.27 | | | $ | 13.43 | | | $ | 13.47 | | | $ | 13.07 | |
| | | | | | | | | | | | | | | | | | | | |
| | | | | |
Net investment income (loss) (a) | | | 0.03 | | | | (0.03 | ) | | | (0.04 | ) | | | (0.01 | ) | | | (0.02 | ) |
| | | | | |
Net realized and unrealized gain (loss) on investments | | | 1.71 | | | | (0.82 | ) | | | 2.87 | | | | (0.04 | ) | | | 0.50 | |
| | | | | |
Net realized and unrealized gain (loss) on foreign currency transactions | | | (0.03 | ) | | | (0.01 | ) | | | 0.01 | | | | 0.01 | | | | (0.03 | ) |
| | | | | | | | | | | | | | | | | | | | |
| | | | | |
Total from investment operations | | | 1.71 | | | | (0.86 | ) | | | 2.84 | | | | (0.04 | ) | | | 0.45 | |
| | | | | | | | | | | | | | | | | | | | |
| | | | | |
| Less dividends and distributions: | | | | | | | | | | | | | | | | | | | | |
| | | | | |
From net investment income | | | — | | | | (0.03 | ) | | | — | | | | — | | | | (0.05 | ) |
| | | | | |
From net realized gain on investments | | | (0.15 | ) | | | — | | | | — | | | | — | | | | — | |
| | | | | | | | | | | | | | | | | | | | |
| | | | | |
Total dividends and distributions | | | (0.15 | ) | | | (0.03 | ) | | | — | | | | — | | | | (0.05 | ) |
| | | | | | | | | | | | | | | | | | | | |
| | | | | |
Net asset value at end of year | | $ | 16.94 | | | $ | 15.38 | | | $ | 16.27 | | | $ | 13.43 | | | $ | 13.47 | |
| | | | | | | | | | | | | | | | | | | | |
| | | | | |
Total investment return (b) | | | 11.36 | % | | | (5.31 | %) | | | 21.15 | % | | | (0.30 | %) | | | 3.43 | % |
| | | | | |
| Ratios (to average net assets)/Supplemental Data: | | | | | | | | | | | | | | | | | | | | |
| | | | | |
Net investment income (loss) | | | 0.21 | % | | | (0.19 | %) | | | (0.26 | %) | | | (0.11 | %)(c) | | | (0.14 | %) |
| | | | | |
Net expenses (d) | | | 1.59 | % | | | 1.66 | % | | | 1.69 | % | | | 1.69 | % (e) | | | 1.68 | % |
| | | | | |
Expenses (before waiver/reimbursement) (d) | | | 1.75 | % | | | 1.70 | % | | | 1.69 | % | | | 1.69 | % (e) | | | 1.68 | % |
| | | | | |
Portfolio turnover rate | | | 58 | % | | | 53 | % | | | 45 | % | | | 33 | % | | | 42 | % |
| | | | | |
Net assets at end of year (in 000’s) | | $ | 23,870 | | | $ | 21,679 | | | $ | 25,029 | | | $ | 31,523 | | | $ | 34,329 | |
| (a) | Per share data based on average shares outstanding during the year. |
| (b) | Total investment return is calculated exclusive of sales charges and assumes the reinvestment of dividends and distributions. For periods of less than one year, total return is not annualized. |
| (c) | Without the custody fee reimbursement, net investment income (loss) would have been (0.12)%. |
| (d) | In addition to the fees and expenses which the Fund bears directly, it also indirectly bears a pro-rata share of the fees and expenses of the underlying funds in which it invests. Such indirect expenses are not included in the above expense ratios. |
| (e) | Without the custody fee reimbursement, net expenses would have been 1.70%. |
| | | | |
| 16 | | MainStay MacKay International Equity Fund | | The notes to the financial statements are an integral part of,
and should be read in conjunction with, the financial statements. |
Financial Highlightsselected per share data and ratios
| | | | | | | | | | | | | | | | | | | | |
| |
| | | Year ended October 31, | |
| | | | | |
| Class B | | 2019 | | | 2018 | | | 2017 | | | 2016 | | | 2015 | |
| | | | | |
Net asset value at beginning of year | | $ | 13.68 | | | $ | 14.55 | | | $ | 12.10 | | | $ | 12.23 | | | $ | 11.91 | |
| | | | | | | | | | | | | | | | | | | | |
| | | | | |
Net investment income (loss) (a) | | | (0.08 | ) | | | (0.14 | ) | | | (0.14 | ) | | | (0.10 | ) | | | (0.11 | ) |
| | | | | |
Net realized and unrealized gain (loss) on investments | | | 1.51 | | | | (0.72 | ) | | | 2.58 | | | | (0.04 | ) | | | 0.46 | |
| | | | | |
Net realized and unrealized gain (loss) on foreign currency transactions | | | (0.02 | ) | | | (0.01 | ) | | | 0.01 | | | | 0.01 | | | | (0.03 | ) |
| | | | | | | | | | | | | | | | | | | | |
| | | | | |
Total from investment operations | | | 1.41 | | | | (0.87 | ) | | | 2.45 | | | | (0.13 | ) | | | 0.32 | |
| | | | | | | | | | | | | | | | | | | | |
| | | | | |
| Less distributions: | | | | | | | | | | | | | | | | | | | | |
| | | | | |
From net realized gain on investments | | | (0.15 | ) | | | — | | | | — | | | | — | | | | — | |
| | | | | | | | | | | | | | | | | | | | |
| | | | | |
Net asset value at end of year | | $ | 14.94 | | | $ | 13.68 | | | $ | 14.55 | | | $ | 12.10 | | | $ | 12.23 | |
| | | | | | | | | | | | | | | | | | | | |
| | | | | |
Total investment return (b) | | | 10.49 | % | | | (5.98 | %) | | | 20.25 | % | | | (1.06 | %) | | | 2.69 | % |
| | | | | |
| Ratios (to average net assets)/Supplemental Data: | | | | | | | | | | | | | | | | | | | | |
| | | | | |
Net investment income (loss) | | | (0.59 | %) | | | (0.95 | %) | | | (1.05 | %) | | | (0.86 | %)(c) | | | (0.91 | %) |
| | | | | |
Net expenses (d) | | | 2.35 | % | | | 2.41 | % | | | 2.44 | % | | | 2.44 | % (e) | | | 2.43 | % |
| | | | | |
Expenses (before waiver/reimbursement) (d) | | | 2.50 | % | | | 2.44 | % | | | 2.44 | % | | | 2.44 | % (e) | | | 2.43 | % |
| | | | | |
Portfolio turnover rate | | | 58 | % | | | 53 | % | | | 45 | % | | | 33 | % | | | 42 | % |
| | | | | |
Net assets at end of year (in 000’s) | | $ | 3,345 | | | $ | 4,404 | | | $ | 6,210 | | | $ | 6,991 | | | $ | 8,982 | |
| (a) | Per share data based on average shares outstanding during the year. |
| (b) | Total investment return is calculated exclusive of sales charges and assumes the reinvestment of dividends and distributions. For periods of less than one year, total return is not annualized. |
| (c) | Without the custody fee reimbursement, net investment income (loss) would have been (0.87)%. |
| (d) | In addition to the fees and expenses which the Fund bears directly, it also indirectly bears a pro-rata share of the fees and expenses of the underlying funds in which it invests. Such indirect expenses are not included in the above expense ratios. |
| (e) | Without the custody fee reimbursement, net expenses would have been 2.45%. |
| | | | | | | | | | | | | | | | | | | | |
| |
| | | Year ended October 31, | |
| | | | | |
| Class C | | 2019 | | | 2018 | | | 2017 | | | 2016 | | | 2015 | |
| | | | | |
Net asset value at beginning of year | | $ | 13.68 | | | $ | 14.56 | | | $ | 12.10 | | | $ | 12.23 | | | $ | 11.92 | |
| | | | | | | | | | | | | | | | | | | | |
| | | | | |
Net investment income (loss) (a) | | | (0.09 | ) | | | (0.14 | ) | | | (0.14 | ) | | | (0.10 | ) | | | (0.11 | ) |
| | | | | |
Net realized and unrealized gain (loss) on investments | | | 1.51 | | | | (0.73 | ) | | | 2.59 | | | | (0.04 | ) | | | 0.45 | |
| | | | | |
Net realized and unrealized gain (loss) on foreign currency transactions | | | (0.02 | ) | | | (0.01 | ) | | | 0.01 | | | | 0.01 | | | | (0.03 | ) |
| | | | | | | | | | | | | | | | | | | | |
| | | | | |
Total from investment operations | | | 1.40 | | | | (0.88 | ) | | | 2.46 | | | | (0.13 | ) | | | 0.31 | |
| | | | | | | | | | | | | | | | | | | | |
| | | | | |
| Less distributions: | | | | | | | | | | | | | | | | | | | | |
| | | | | |
From net realized gain on investments | | | (0.15 | ) | | | — | | | | — | | | | — | | | | — | |
| | | | | | | | | | | | | | | | | | | | |
| | | | | |
Net asset value at end of year | | $ | 14.93 | | | $ | 13.68 | | | $ | 14.56 | | | $ | 12.10 | | | $ | 12.23 | |
| | | | | | | | | | | | | | | | | | | | |
| | | | | |
Total investment return (b) | | | 10.49 | % | | | (6.04 | %) | | | 20.33 | % | | | (1.06 | %) | | | 2.60 | % |
| | | | | |
| Ratios (to average net assets)/Supplemental Data: | | | | | | | | | | | | | | | | | | | | |
| | | | | |
Net investment income (loss) | | | (0.65 | %) | | | (0.93 | %) | | | (1.05 | %) | | | (0.84 | %)(c) | | | (0.90 | %) |
| | | | | |
Net expenses (d) | | | 2.35 | % | | | 2.41 | % | | | 2.44 | % | | | 2.44 | % (e) | | | 2.43 | % |
| | | | | |
Expenses (before waiver/reimbursement) (d) | | | 2.50 | % | | | 2.44 | % | | | 2.44 | % | | | 2.44 | % (e) | | | 2.43 | % |
| | | | | |
Portfolio turnover rate | | | 58 | % | | | 53 | % | | | 45 | % | | | 33 | % | | | 42 | % |
| | | | | |
Net assets at end of year (in 000’s) | | $ | 3,915 | | | $ | 6,960 | | | $ | 7,564 | | | $ | 7,850 | | | $ | 8,292 | |
| (a) | Per share data based on average shares outstanding during the year. |
| (b) | Total investment return is calculated exclusive of sales charges and assumes the reinvestment of dividends and distributions. For periods of less than one year, total return is not annualized. |
| (c) | Without the custody fee reimbursement, net investment income (loss) would have been (0.85)%. |
| (d) | In addition to the fees and expenses which the Fund bears directly, it also indirectly bears a pro-rata share of the fees and expenses of the underlying funds in which it invests. Such indirect expenses are not included in the above expense ratios. |
| (e) | Without the custody fee reimbursement, net expenses would have been 2.45%. |
| | | | | | |
The notes to the financial statements are an integral part of,
and should be read in conjunction with, the financial statements. | | | | | 17 | |
Financial Highlightsselected per share data and ratios
| | | | | | | | | | | | | | | | | | | | |
| |
| | | Year ended October 31, | |
| | | | | |
| Class I | | 2019 | | | 2018 | | | 2017 | | | 2016 | | | 2015 | |
| | | | | |
Net asset value at beginning of year | | $ | 15.57 | | | $ | 16.48 | | | $ | 13.59 | | | $ | 13.59 | | | $ | 13.19 | |
| | | | | | | | | | | | | | | | | | | | |
| | | | | |
Net investment income (loss) (a) | | | 0.09 | | | | 0.07 | | | | 0.05 | | | | 0.07 | | | | 0.06 | |
| | | | | |
Net realized and unrealized gain (loss) on investments | | | 1.81 | | | | (0.84 | ) | | | 2.90 | | | | (0.04 | ) | | | 0.50 | |
| | | | | |
Net realized and unrealized gain (loss) on foreign currency transactions | | | (0.03 | ) | | | (0.01 | ) | | | 0.01 | | | | 0.01 | | | | (0.03 | ) |
| | | | | | | | | | | | | | | | | | | | |
| | | | | |
Total from investment operations | | | 1.87 | | | | (0.78 | ) | | | 2.96 | | | | 0.04 | | | | 0.53 | |
| | | | | | | | | | | | | | | | | | | | |
| | | | | |
| Less dividends and distributions: | | | | | | | | | | | | | | | | | | | | |
| | | | | |
From net investment income | | | (0.01 | ) | | | (0.13 | ) | | | (0.07 | ) | | | (0.04 | ) | | | (0.13 | ) |
| | | | | |
From net realized gain on investments | | | (0.15 | ) | | | — | | | | — | | | | — | | | | — | |
| | | | | | | | | | | | | | | | | | | | |
| | | | | |
Total dividends and distributions | | | (0.16 | ) | | | (0.13 | ) | | | (0.07 | ) | | | (0.04 | ) | | | (0.13 | ) |
| | | | | | | | | | | | | | | | | | | | |
| | | | | |
Net asset value at end of year | | $ | 17.28 | | | $ | 15.57 | | | $ | 16.48 | | | $ | 13.59 | | | $ | 13.59 | |
| | | | | | | | | | | | | | | | | | | | |
| | | | | |
Total investment return (b) | | | 12.19 | % | | | (4.80 | %) | | | 21.94 | % | | | 0.29 | % | | | 4.04 | % |
| | | | | |
| Ratios (to average net assets)/Supplemental Data: | | | | | | | | | | | | | | | | | | | | |
| | | | | |
Net investment income (loss) | | | 0.55 | % | | | 0.42 | % | | | 0.31 | % | | | 0.54 | %(c) | | | 0.46 | % |
| | | | | |
Net expenses (d) | | | 0.92 | % | | | 1.07 | % | | | 1.09 | % | | | 1.07 | %(e) | | | 1.08 | % |
| | | | | |
Expenses (before waiver/reimbursement) | | | 1.10 | % | | | 1.07 | % | | | 1.09 | % | | | 1.07 | %(e) | | | 1.08 | % |
| | | | | |
Portfolio turnover rate | | | 58 | % | | | 53 | % | | | 45 | % | | | 33 | % | | | 42 | % |
| | | | | |
Net assets at end of year (in 000’s) | | $ | 43,280 | | | $ | 213,030 | | | $ | 205,009 | | | $ | 179,274 | | | $ | 224,307 | |
| (a) | Per share data based on average shares outstanding during the year. |
| (b) | Total investment return is calculated exclusive of sales charges and assumes the reinvestment of dividends and distributions. Class I shares are not subject to sales charges. For periods of less than one year, total return is not annualized. |
| (c) | Without the custody fee reimbursement, net investment income (loss) would have been 0.53%. |
| (d) | In addition to the fees and expenses which the Fund bears directly, it also indirectly bears a pro-rata share of the fees and expenses of the underlying funds in which it invests. Such indirect expenses are not included in the above expense ratios. |
| (e) | Without the custody fee reimbursement, net expenses would have been 1.08%. |
| | | | | | | | | | | | | | | | | | | | |
| |
| | | Year ended October 31, | |
| | | | | |
| Class R1 | | 2019 | | | 2018 | | | 2017 | | | 2016 | | | 2015 | |
| | | | | |
Net asset value at beginning of year | | $ | 15.48 | | | $ | 16.38 | | | $ | 13.51 | | | $ | 13.51 | | | $ | 13.11 | |
| | | | | | | | | | | | | | | | | | | | |
| | | | | |
Net investment income (loss) (a) | | | 0.05 | | | | 0.05 | | | | 0.03 | | | | 0.06 | | | | 0.04 | |
| | | | | |
Net realized and unrealized gain (loss) on investments | | | 1.80 | | | | (0.83 | ) | | | 2.89 | | | | (0.05 | ) | | | 0.50 | |
| | | | | |
Net realized and unrealized gain (loss) on foreign currency transactions | | | (0.03 | ) | | | (0.01 | ) | | | 0.01 | | | | 0.01 | | | | (0.03 | ) |
| | | | | | | | | | | | | | | | | | | | |
| | | | | |
Total from investment operations | | | 1.82 | | | | (0.79 | ) | | | 2.93 | | | | 0.02 | | | | 0.51 | |
| | | | | | | | | | | | | | | | | | | | |
| | | | | |
| Less dividends and distributions: | | | | | | | | | | | | | | | | | | | | |
| | | | | |
From net investment income | | | — | | | | (0.11 | ) | | | (0.06 | ) | | | (0.02 | ) | | | (0.11 | ) |
| | | | | |
From net realized gain on investments | | | (0.15 | ) | | | — | | | | — | | | | — | | | | — | |
| | | | | | | | | | | | | | | | | | | | |
| | | | | |
Total dividends and distributions | | | (0.15 | ) | | | (0.11 | ) | | | (0.06 | ) | | | (0.02 | ) | | | (0.11 | ) |
| | | | | | | | | | | | | | | | | | | | |
| | | | | |
Net asset value at end of year | | $ | 17.15 | | | $ | 15.48 | | | $ | 16.38 | | | $ | 13.51 | | | $ | 13.51 | |
| | | | | | | | | | | | | | | | | | | | |
| | | | | |
Total investment return (b) | | | 11.93 | % | | | (4.86 | %) | | | 21.78 | % | | | 0.18 | % | | | 3.95 | % |
| | | | | |
| Ratios (to average net assets)/Supplemental Data: | | | | | | | | | | | | | | | | | | | | |
| | | | | |
Net investment income (loss) | | | 0.33 | % | | | 0.29 | % | | | 0.21 | % | | | 0.41 | %(c) | | | 0.33 | % |
| | | | | |
Net expenses (d) | | | 1.11 | % | | | 1.17 | % | | | 1.19 | % | | | 1.17 | %(e) | | | 1.18 | % |
| | | | | |
Expenses (before waiver/reimbursement) | | | 1.19 | % | | | 1.17 | % | | | 1.19 | % | | | 1.17 | %(e) | | | 1.18 | % |
| | | | | |
Portfolio turnover rate | | | 58 | % | | | 53 | % | | | 45 | % | | | 33 | % | | | 42 | % |
| | | | | |
Net assets at end of year (in 000’s) | | $ | 265 | | | $ | 2,109 | | | $ | 2,616 | | | $ | 2,478 | | | $ | 3,032 | |
| (a) | Per share data based on average shares outstanding during the year. |
| (b) | Total investment return is calculated exclusive of sales charges and assumes the reinvestment of dividends and distributions. Class R1 shares are not subject to sales charges. For periods of less than one year, total return is not annualized. |
| (c) | Without the custody fee reimbursement, net investment income (loss) would have been 0.40%. |
| (d) | In addition to the fees and expenses which the Fund bears directly, it also indirectly bears a pro-rata share of the fees and expenses of the underlying funds in which it invests. Such indirect expenses are not included in the above expense ratios. |
| (e) | Without the custody fee reimbursement, net expenses would have been 1.18%. |
| | | | |
| 18 | | MainStay MacKay International Equity Fund | | The notes to the financial statements are an integral part of,
and should be read in conjunction with, the financial statements. |
Financial Highlightsselected per share data and ratios
| | | | | | | | | | | | | | | | | | | | |
| |
| | | Year ended October 31, | |
| | | | | |
| Class R2 | | 2019 | | | 2018 | | | 2017 | | | 2016 | | | 2015 | |
| | | | | |
Net asset value at beginning of year | | $ | 15.52 | | | $ | 16.42 | | | $ | 13.54 | | | $ | 13.54 | | | $ | 13.14 | |
| | | | | | | | | | | | | | | | | | | | |
| | | | | |
Net investment income (loss) (a) | | | 0.06 | | | | (0.02 | ) | | | 0.01 | | | | 0.01 | | | | 0.01 | |
| | | | | |
Net realized and unrealized gain (loss) on investments | | | 1.75 | | | | (0.79 | ) | | | 2.88 | | | | (0.01 | ) | | | 0.50 | |
| | | | | |
Net realized and unrealized gain (loss) on foreign currency transactions | | | (0.03 | ) | | | (0.01 | ) | | | 0.01 | | | | 0.00 | ‡ | | | (0.03 | ) |
| | | | | | | | | | | | | | | | | | | | |
| | | | | |
Total from investment operations | | | 1.78 | | | | (0.82 | ) | | | 2.90 | | | | 0.00 | ‡ | | | 0.48 | |
| | | | | | | | | | | | | | | | | | | | |
| | | | | |
| Less dividends and distributions: | | | | | | | | | | | | | | | | | | | | |
| | | | | |
From net investment income | | | — | | | | (0.08 | ) | | | (0.02 | ) | | | — | | | | (0.08 | ) |
| | | | | |
From net realized gain on investments | | | (0.15 | ) | | | — | | | | — | | | | — | | | | — | |
| | | | | | | | | | | | | | | | | | | | |
| | | | | |
Total dividends and distributions | | | (0.15 | ) | | | (0.08 | ) | | | (0.02 | ) | | | — | | | | (0.08 | ) |
| | | | | | | | | | | | | | | | | | | | |
| | | | | |
Net asset value at end of year | | $ | 17.15 | | | $ | 15.52 | | | $ | 16.42 | | | $ | 13.54 | | | $ | 13.54 | |
| | | | | | | | | | | | | | | | | | | | |
| | | | | |
Total investment return (b) | | | 11.64 | % | | | (5.06 | %)(c) | | | 21.55 | %(c) | | | (0.07 | %) | | | 3.73 | % |
| | | | | |
| Ratios (to average net assets)/Supplemental Data: | | | | | | | | | | | | | | | | | | | | |
| | | | | |
Net investment income (loss) | | | 0.38 | % | | | (0.13 | %) | | | 0.06 | % | | | 0.08 | % | | | 0.11 | % |
| | | | | |
Net expenses (d) | | | 1.31 | % | | | 1.42 | % | | | 1.44 | % | | | 1.42 | % | | | 1.43 | % |
| | | | | |
Expenses (before waiver/reimbursement) | | | 1.45 | % | | | 1.42 | % | | | 1.44 | % | | | 1.42 | % | | | 1.43 | % |
| | | | | |
Portfolio turnover rate | | | 58 | % | | | 53 | % | | | 45 | % | | | 33 | % | | | 42 | % |
| | | | | |
Net assets at end of year (in 000’s) | | $ | 454 | | | $ | 602 | | | $ | 1,201 | | | $ | 847 | | | $ | 2,313 | |
| ‡ | Less than one cent per share. |
| (a) | Per share data based on average shares outstanding during the year. |
| (b) | Total investment return is calculated exclusive of sales charges and assumes the reinvestment of dividends and distributions. Class R2 shares are not subject to sales charges. For periods of less than one year, total return is not annualized. |
| (c) | Total investment return may reflect adjustments to conform to generally accepted accounting principles. |
| (d) | In addition to the fees and expenses which the Fund bears directly, it also indirectly bears a pro-rata share of the fees and expenses of the underlying funds in which it invests. Such indirect expenses are not included in the above expense ratios. |
| | | | | | | | | | | | | | | | | | | | |
| |
| | | Year ended October 31, | |
| | | | | |
| Class R3 | | 2019 | | | 2018 | | | 2017 | | | 2016 | | | 2015 | |
| | | | | |
Net asset value at beginning of year | | $ | 15.38 | | | $ | 16.29 | | | $ | 13.44 | | | $ | 13.48 | | | $ | 13.07 | |
| | | | | | | | | | | | | | | | | | | | |
| | | | | |
Net investment income (loss) (a) | | | 0.03 | | | | (0.04 | ) | | | (0.04 | ) | | | (0.01 | ) | | | (0.02 | ) |
| | | | | |
Net realized and unrealized gain (loss) on investments | | | 1.73 | | | | (0.82 | ) | | | 2.88 | | | | (0.04 | ) | | | 0.50 | |
| | | | | |
Net realized and unrealized gain (loss) on foreign currency transactions | | | (0.03 | ) | | | (0.01 | ) | | | 0.01 | | | | 0.01 | | | | (0.03 | ) |
| | | | | | | | | | | | | | | | | | | | |
| | | | | |
Total from investment operations | | | 1.73 | | | | (0.87 | ) | | | 2.85 | | | | (0.04 | ) | | | 0.45 | |
| | | | | | | | | | | | | | | | | | | | |
| | | | | |
| Less dividends and distributions: | | | | | | | | | | | | | | | | | | | | |
| | | | | |
From net investment income | | | — | | | | (0.04 | ) | | | — | | | | — | | | | (0.04 | ) |
| | | | | |
From net realized gain on investments | | | (0.15 | ) | | | — | | | | — | | | | — | | | | — | |
| | | | | | | | | | | | | | | | | | | | |
| | | | | |
Total dividends and distributions | | | (0.15 | ) | | | (0.04 | ) | | | — | | | | — | | | | (0.04 | ) |
| | | | | | | | | | | | | | | | | | | | |
| | | | | |
Net asset value at end of year | | $ | 16.96 | | | $ | 15.38 | | | $ | 16.29 | | | $ | 13.44 | | | $ | 13.48 | |
| | | | | | | | | | | | | | | | | | | | |
| | | | | |
Total investment return (b) | | | 11.35 | % | | | (5.39 | %)(c) | | | 21.21 | % | | | (0.30 | %) | | | 3.44 | % |
| | | | | |
| Ratios (to average net assets)/Supplemental Data: | | | | | | | | | | | | | | | | | | | | |
| | | | | |
Net investment income (loss) | | | 0.22 | % | | | (0.21 | %) | | | (0.27 | %) | | | (0.11 | %)(d) | | | (0.15 | %) |
| | | | | |
Net expenses (e) | | | 1.56 | % | | | 1.67 | % | | | 1.69 | % | | | 1.67 | % (f) | | | 1.68 | % |
| | | | | |
Expenses (before waiver/reimbursement) | | | 1.70 | % | | | 1.67 | % | | | 1.69 | % | | | 1.67 | % (f) | | | 1.68 | % |
| | | | | |
Portfolio turnover rate | | | 58 | % | | | 53 | % | | | 45 | % | | | 33 | % | | | 42 | % |
| | | | | |
Net assets at end of year (in 000’s) | | $ | 1,154 | | | $ | 1,057 | | | $ | 1,446 | | | $ | 1,108 | | | $ | 1,204 | |
| (a) | Per share data based on average shares outstanding during the year. |
| (b) | Total investment return is calculated exclusive of sales charges and assumes the reinvestment of dividends and distributions. Class R3 shares are not subject to sales charges. For periods of less than one year, total return is not annualized. |
| (c) | Total investment return may reflect adjustments to conform to generally accepted accounting principles. |
| (d) | Without the custody fee reimbursement, net investment income (loss) would have been (0.12)%. |
| (e) | In addition to the fees and expenses which the Fund bears directly, it also indirectly bears a pro-rata share of the fees and expenses of the underlying funds in which it invests. Such indirect expenses are not included in the above expense ratios. |
| (f) | Without the custody fee reimbursement, net expenses would have been 1.68%. |
| | | | | | |
The notes to the financial statements are an integral part of,
and should be read in conjunction with, the financial statements. | | | | | 19 | |
Financial Highlightsselected per share data and ratios
| | | | |
| |
| Class R6 | | February 28,
2019^
through
October 31,
2019 | |
| |
Net asset value at beginning of period | | $ | 16.13 | |
| | | | |
| |
Net investment income (loss) (a) | | | 0.15 | |
| |
Net realized and unrealized gain (loss) on investments | | | 1.02 | |
| |
Net realized and unrealized gain (loss) on foreign currency transactions | | | (0.02 | ) |
| | | | |
| |
Total from investment operations | | | 1.15 | |
| | | | |
| |
Net asset value at end of period | | $ | 17.28 | |
| | | | |
| |
Total investment return (b) | | | 7.13 | % |
| |
| Ratios (to average net assets)/Supplemental Data: | | | | |
| |
Net investment income (loss) | | | 1.37 | %†† |
| |
Net expenses (c) | | | 0.83 | %†† |
| |
Expenses (before waiver/reimbursement) (c) | | | 1.00 | %†† |
| |
Portfolio turnover rate | | | 58 | % |
| |
Net assets at end of period (in 000’s) | | $ | 177,483 | |
| (a) | Per share data based on average shares outstanding during the period. |
| (b) | Total investment return is calculated exclusive of sales charges and assumes the reinvestment of dividends and distributions. Class R6 shares are not subject to sales charges. For periods of less than one year, total return is not annualized. |
| (c) | In addition to the fees and expenses which the Fund bears directly, it also indirectly bears a pro-rata share of the fees and expenses of the underlying funds in which it invests. Such indirect expenses are not included in the above expense ratios. |
| | | | |
| 20 | | MainStay MacKay International Equity Fund | | The notes to the financial statements are an integral part of,
and should be read in conjunction with, the financial statements. |
Notes to Financial Statements
Note 1–Organization and Business
The MainStay Funds (the “Trust”) was organized on January 9, 1986, as a Massachusetts business trust and is governed by a Declaration of Trust. The Trust is registered under the Investment Company Act of 1940, as amended (the “1940 Act”), as an open-end management investment company, and is comprised of twelve funds (collectively referred to as the “Funds”). These financial statements and notes relate to the MainStay MacKay International Equity Fund (the “Fund”), a “diversified” fund, as that term is defined in the 1940 Act, as interpreted or modified by regulatory authorities having jurisdiction, from time to time.
The Fund currently has nine classes of shares registered for sale. Class A shares commenced operations on January 3, 1995. Class B shares commenced operations on September 13, 1994. Class C shares commenced operations on September 1, 1998. Class I, Class R1 and Class R2 shares commenced operations on January 2, 2004. Class R3 shares commenced operations on April 28, 2006. Investor Class shares commenced operations on February 28, 2008. Class R6 shares of the Fund were registered for sale effective as of February 28, 2017. Class R6 shares commenced operations on February 28, 2019.
Class B shares of the MainStay Group of Funds are closed to all new purchases as well as additional investments by existing Class B shareholders. Existing Class B shareholders may continue to reinvest dividends and capital gains distributions, as well as exchange their Class B shares for Class B shares of other funds in the MainStay Group of Funds as permitted by the current exchange privileges. Class B shareholders continue to be subject to any applicable contingent deferred sales charge (“CDSC”) at the time of redemption. All other features of the Class B shares, including but not limited to the fees and expenses applicable to Class B shares, remain unchanged. Unless redeemed, Class B shareholders will remain in Class B shares of their respective fund until the Class B shares are converted to Class A or Investor Class shares pursuant to the applicable conversion schedule.
Class A and Investor Class shares are offered at net asset value (“NAV”) per share plus an initial sales charge. No initial sales charge applies to investments of $1 million or more (and certain other qualified purchases) in Class A and Investor Class shares. However, a CDSC of 1.00% may be imposed on certain redemptions made within 18 months of the date of purchase on shares that were purchased without an initial sales charge. Class C shares are offered at NAV without an initial sales charge, although a 1.00% CDSC may be imposed on certain redemptions of such shares made within one year of the date of purchase of Class C shares. When Class B shares were offered, they were offered at NAV without an initial sales charge, although a CDSC that declines depending on the number of years a shareholder has held its Class B shares may be imposed on certain redemptions of such shares made within six years of the date of purchase of such shares. Class I, Class R1, Class R2, Class R3 and Class R6 shares are offered at NAV without a sales charge. Depending upon eligibility, Class B shares convert to either Class A or Investor Class shares at the end of the calendar quarter eight years after the date they were purchased. In addition, depending upon eligibility, Class C shares convert to either Class A or Investor Class shares at the end of the calendar quarter ten years after the date they were purchased. Additionally, as disclosed in
the Fund’s prospectus, Class A shares may convert automatically to Investor Class shares and Investor Class shares may convert automatically to Class A shares. Under certain circumstances and as may be permitted by the Trust’s multiple class plan pursuant to Rule 18f-3 under the 1940 Act, specified share classes of the Fund may be converted to one or more other share classes of the Fund as disclosed in the capital share transactions within these Notes. The classes of shares have the same voting (except for issues that relate solely to one class), dividend, liquidation and other rights, and the same terms and conditions, except that under distribution plans pursuant to Rule 12b-1 under the 1940 Act, Class B and Class C shares are subject to higher distribution and/or service fees than Class A, Investor Class, Class R2 and Class R3 shares. Class I, Class R1 and Class R6 shares are not subject to a distribution and/or service fee. Class R1, Class R2 and Class R3 shares are subject to a shareholder service fee, which is in addition to fees paid under the distribution plans for Class R2 and Class R3 shares.
The Fund’s investment objective is to seeklong-term growth of capital.
Note 2–Significant Accounting Policies
The Fund is an investment company and accordingly follows the investment company accounting and reporting guidance of the Financial Accounting Standards Board (“FASB”) Accounting Standard CodificationTopic 946 Financial Services—Investment Companies. The Fund prepares its financial statements in accordance with generally accepted accounting principles (“GAAP”) in the United States of America and follows the significant accounting policies described below.
(A) Securities Valuation. Investments are usually valued as of the close of regular trading on the New York Stock Exchange (the “Exchange”) (usually 4:00 p.m. Eastern time) on each day the Fund is open for business (“valuation date”).
The Board of Trustees of the Trust (the “Board”) adopted procedures establishing methodologies for the valuation of the Fund’s securities and other assets and delegated the responsibility for valuation determinations under those procedures to the Valuation Committee of the Trust (the “Valuation Committee��). The Board authorized the Valuation Committee to appoint a Valuation Subcommittee (the “Subcommittee”) to deal in the first instance with establishing the prices of securities for which market quotations are not readily available or the prices of which are not otherwise readily determinable under these procedures. The Subcommittee meets (in person, via electronic mail or via teleconference) on an as-needed basis. Subsequently, the Valuation Committee meets to ensure that actions taken by the Subcommittee were appropriate. The procedures state that, subject to the oversight of the Board and unless otherwise noted, the responsibility for theday-to-day valuation of portfolio assets (including fair value measurements for the Fund’s assets and liabilities) rests with New York Life Investment Management LLC (“New York Life Investments” or the “Manager”), aided to whatever extent necessary by the Subadvisor (as defined in Note 3(A)).
To assess the appropriateness of security valuations, the Manager, the Subadvisor or the Fund’s third-party service provider, who is subject to oversight by the Manager, regularly compares prior day prices, prices on comparable securities and the sale prices to the prior and current day prices and challenges prices with changes exceeding certain tolerance
Notes to Financial Statements(continued)
levels with third-party pricing services or broker sources. For those securities valued through either a standardized fair valuation methodology or a fair valuation measurement, the Subcommittee deals in the first instance with such valuation and the Valuation Committee reviews and affirms, if appropriate, the reasonableness of the valuation based on such methodologies and measurements on a regular basis after considering information that is reasonably available and deemed relevant by the Valuation Committee. Any action taken by the Subcommittee with respect to the valuation of a portfolio security or other asset is submitted for review and ratification (if appropriate) to the Valuation Committee and the Board at the next regularly scheduled meeting.
“Fair value” is defined as the price the Fund would reasonably expect to receive upon selling an asset or liability in an orderly transaction to an independent buyer in the principal or most advantageous market for the asset or liability. Fair value measurements are determined within a framework that establishes a three-tier hierarchy which maximizes the use of observable market data and minimizes the use of unobservable inputs to establish a classification of fair value measurements for disclosure purposes. “Inputs” refer broadly to the assumptions that market participants would use in pricing the asset or liability, including assumptions about risk, such as the risk inherent in a particular valuation technique used to measure fair value using a pricing model and/or the risk inherent in the inputs for the valuation technique. Inputs may be observable or unobservable. Observable inputs reflect the assumptions market participants would use in pricing the asset or liability based on market data obtained from sources independent of the Fund. Unobservable inputs reflect the Fund’s own assumptions about the assumptions market participants would use in pricing the asset or liability based on the information available. The inputs or methodology used for valuing assets or liabilities may not be an indication of the risks associated with investing in those assets or liabilities. The three-tier hierarchy of inputs is summarized below.
| • | | Level 1—quoted prices in active markets for an identical asset or liability |
| • | | Level 2—other significant observable inputs (including quoted prices for a similar asset or liability in active markets, interest rates and yield curves, prepayment speeds, credit risk, etc.) |
| • | | Level 3—significant unobservable inputs (including the Fund’s own assumptions about the assumptions that market participants would use in measuring fair value of an asset or liability) |
The level of an asset or liability within the fair value hierarchy is based on the lowest level of an input, both individually and in the aggregate, that is significant to the fair value measurement. As of October 31, 2019, the aggregate value by input level of the Fund’s assets and liabilities is included at the end of the Fund’s Portfolio of Investments.
The Fund may use third-party vendor evaluations, whose prices may be derived from one or more of the following standard inputs, among others:
| | |
• Broker/dealer quotes | | • Benchmark securities |
• Two-sided markets | | • Reference data (corporate actions or material event notices) |
• Bids/offers | | • Monthly payment information |
• Industry and economic events | | • Reported trades |
An asset or liability for which market values cannot be measured using the methodologies described above is valued by methods deemed reasonable in good faith by the Valuation Committee, following the procedures established by the Board, to represent fair value. Under these procedures, the Fund generally uses a market-based approach which may use related or comparable assets or liabilities, recent transactions, market multiples, book values and other relevant information. The Fund may also use an income-based valuation approach in which the anticipated future cash flows of the asset or liability are discounted to calculate fair value. Discounts may also be applied due to the nature and/or duration of any restrictions on the disposition of the asset or liability. Fair value represents a good faith approximation of the value of a security. Fair value determinations involve the consideration of a number of subjective factors, an analysis of applicable facts and circumstances and the exercise of judgment. As a result, it is possible that the fair value for a security determined in good faith in accordance with the Fund’s valuation procedures may differ from valuations for the same security determined by other funds using their own valuation procedures. Although the Fund’s valuation procedures are designed to value a security at the price the Fund may reasonably expect to receive upon the security’s sale in an orderly transaction, there can be no assurance that any fair value determination thereunder would, in fact, approximate the amount that the Fund would actually realize upon the sale of the security or the price at which the security would trade if a reliable market price were readily available. During the year ended October 31, 2019, there were no material changes to the fair value methodologies.
Securities which may be valued in this manner include, but are not limited to: (i) a security for which trading has been halted or suspended; (ii) a debt security that has recently gone into default and for which there is not a current market quotation; (iii) a security of an issuer that has entered into a restructuring; (iv) a security that has been delisted from a national exchange; (v) a security for which the market price is not readily available from a third-party pricing source or, if so provided, does not, in the opinion of the Manager or the Subadvisor, reflect the security’s market value; (vi) a security subject to trading collars for which no or limited trading takes place; and (vii) a security whose principal market has been temporarily closed at a time when, under normal conditions, it would be open. Securities valued in this manner are generally categorized as Level 3 in the hierarchy. As of October 31, 2019, there were no securities held by the Fund that were fair valued in such a manner.
Certain securities held by the Fund may principally trade in foreign markets. Events may occur between the time the foreign markets close and the time at which the Fund’s NAVs are calculated. These events may include, but are not limited to, situations relating to a single issuer in a market sector, significant fluctuations in U.S. or foreign markets, natural disasters, armed conflicts, governmental actions or other developments not tied directly to the securities markets. Should the Manager or the Subadvisor conclude that such events may have affected the accuracy of the last price of such securities reported on the local foreign market, the Subcommittee may, pursuant to procedures adopted by the Board, adjust the value of the local price to reflect the estimated impact on the price of such securities as a result of such events. In this instance, securities are generally categorized as Level 3 in the hierarchy. Additionally, certain foreign equity securities are also fair valued
| | |
| 22 | | MainStay MacKay International Equity Fund |
whenever the movement of a particular index exceeds certain thresholds. In such cases, the securities are fair valued by applying factors provided by a third-party vendor in accordance with valuation procedures adopted by the Board and are generally categorized as Level 2 in the hierarchy. As of October 31, 2019, no foreign equity securities held by the Fund were fair valued in such a manner.
Equity securities, including exchange-traded funds (“ETFs”), are valued at the last quoted sales prices as of the close of regular trading on the relevant exchange on each valuation date. Securities that are not traded on the valuation date are valued at the mean of the last quoted bid and ask prices. Prices are normally taken from the principal market in which each security trades. These securities are generally categorized as Level 1 in the hierarchy.
Investments in mutual funds, including money market funds, are valued at their respective NAVs as of the close of the Exchange on the valuation date. These securities are generally categorized as Level 1 in the hierarchy.
Temporary cash investments acquired in excess of 60 days to maturity at the time of purchase are valued using the latest bid prices or using valuations based on a matrix system (which considers such factors as security prices, yields, maturities and ratings), both as furnished by independent pricing services. Other temporary cash investments which mature in 60 days or less at the time of purchase (“Short-Term Investments”) are valued using the amortized cost method of valuation, unless the use of such method would be inappropriate. The amortized cost method involves valuing a security at its cost on the date of purchase and thereafter assuming a constant amortization to maturity of the difference between such cost and the value on maturity date. Amortized cost approximates the current fair value of a security. Securities valued using the amortized cost method are not valued using quoted prices in an active market and are generally categorized as Level 2 in the hierarchy.
The information above is not intended to reflect an exhaustive list of the methodologies that may be used to value portfolio investments. The valuation procedures permit the use of a variety of valuation methodologies in connection with valuing portfolio investments. The methodology used for a specific type of investment may vary based on the market data available or other considerations. The methodologies summarized above may not represent the specific means by which portfolio investments are valued on any particular business day.
(B) Income Taxes. The Fund’s policy is to comply with the requirements of the Internal Revenue Code of 1986, as amended (the “Internal Revenue Code”), applicable to regulated investment companies and to distribute all of its taxable income to the shareholders of the Fund within the allowable time limits. Therefore, no federal, state and local income tax provisions are required.
Management evaluates the Fund’s tax positions to determine if the tax positions taken meet the minimum recognition threshold in connection with accounting for uncertainties in income tax positions taken or expected to be taken for the purposes of measuring and recognizing tax liabilities in the financial statements. Recognition of tax benefits of an uncertain tax position is permitted only to the extent the position is “more likely than not” to be sustained assuming examination by taxing authorities. Management has analyzed the Fund’s tax positions taken on
federal, state and local income tax returns for all open tax years (for up to three tax years) and has concluded that no provisions for federal, state and local income tax are required in the Fund’s financial statements. The Fund’s federal, state and local income tax and federal excise tax returns for tax years for which the applicable statutes of limitations have not expired are subject to examination by the Internal Revenue Service and state and local departments of revenue.
(C) Foreign Taxes. The Fund may be subject to foreign taxes on income and other transaction-based taxes imposed by certain countries in which it invests. A portion of the taxes on gains on investments or currency purchases/repatriation may be reclaimable. The Fund will accrue such taxes and reclaims as applicable, based upon its current interpretation of tax rules and regulations that exist in the markets in which it invests.
The Fund may be subject to taxation on realized capital gains, repatriation proceeds and other transaction-based taxes imposed by certain countries in which it invests. The Fund will accrue such taxes as applicable based upon its current interpretation of tax rules and regulations that exist in the market in which it invests. Capital gains taxes relating to positions still held are reflected as a liability in the Statement of Assets and Liabilities, as well as an adjustment to the Fund’s net unrealized appreciation (depreciation). Taxes related to capital gains realized, if any, are reflected as part of net realized gain (loss) in the Statement of Operations. Changes in tax liabilities related to capital gains taxes on unrealized investment gains, if any, are reflected as part of the change in net unrealized appreciation (depreciation) on investments in the Statement of Operations. Transaction-based charges are generally assessed as a percentage of the transaction amount.
(D) Dividends and Distributions to Shareholders. Dividends and distributions are recorded on the ex-dividend date. The Fund intends to declare and pay dividends from net investment income and distributions from net realized capital and currency gains, if any, at least annually. Unless the shareholder elects otherwise, all dividends and distributions are reinvested in the same class of shares of the Fund, at NAV. Dividends and distributions to shareholders are determined in accordance with federal income tax regulations and may differ from determinations using GAAP.
(E) Security Transactions and Investment Income. The Fund records security transactions on the trade date. Realized gains and losses on security transactions are determined using the identified cost method. Dividend income is recognized on the ex-dividend date; net of any foreign tax withheld at the source, and interest income is accrued as earned using the effective interest rate method.
Investment income and realized and unrealized gains and losses on investments of the Fund are allocated pro rata to the separate classes of shares based upon their relative net assets on the date the income is earned or realized and unrealized gains and losses are incurred.
(F) Expenses. Expenses of the Trust are allocated to the individual Funds in proportion to the net assets of the respective Funds when the expenses are incurred, except where direct allocations of expenses can be made. Expenses (other than transfer agent expenses and fees incurred under the shareholder services plans and/or the distribution plans further discussed in Note 3(B)) are allocated to separate classes of shares pro rata based upon their relative net assets on the date the
Notes to Financial Statements(continued)
expenses are incurred. The expenses borne by the Fund, including those of related parties to the Fund, are shown in the Statement of Operations.
Additionally, the Fund may invest in ETFs and mutual funds, which are subject to management fees and other fees that may cause the costs of investing in ETFs and mutual funds to be greater than the costs of owning the underlying securities directly. These indirect expenses of ETFs and mutual funds are not included in the amounts shown as expenses in the Fund’s Statement of Operations or in the expense ratios included in the Financial Highlights.
(G) Use of Estimates. In preparing financial statements in conformity with GAAP, management makes estimates and assumptions that affect the reported amounts and disclosures in the financial statements. Actual results could differ from those estimates.
(H) Repurchase Agreements. The Fund may enter into repurchase agreements (i.e., buy a security from another party with the agreement that it will be sold back in the future) to earn income. The Fund may enter into repurchase agreements only with counterparties, usually financial institutions, that are deemed by the Manager or the Subadvisor to be creditworthy, pursuant to guidelines established by the Board. During the term of any repurchase agreement, the Manager or the Subadvisor will continue to monitor the creditworthiness of the counterparty. Under the 1940 Act, repurchase agreements are considered to be collateralized loans by the Fund to the counterparty secured by the securities transferred to the Fund.
Repurchase agreements are subject to counterparty risk, meaning the Fund could lose money by the counterparty’s failure to perform under the terms of the agreement. The Fund mitigates this risk by ensuring the repurchase agreement is collateralized by cash, U.S. government securities, fixed income securities and/or other securities. The collateral is held by the Fund’s custodian and valued daily on a mark to market basis to determine if the value, including accrued interest, exceeds the repurchase price. In the event of the counterparty’s default on the obligation to repurchase, the Fund has the right to liquidate the collateral and apply the proceeds in satisfaction of the obligation. Under certain circumstances, such as in the event of default or bankruptcy by the counterparty, realization and/or retention of the collateral may be limited or subject to delay, to legal proceedings and possible realized loss to the Fund. As of October 31, 2019, the Fund did not hold any repurchase agreements.
(I) Securities Lending. In order to realize additional income, the Fund may engage in securities lending, subject to the limitations set forth in the 1940 Act and relevant guidance by the staff of the Securities and Exchange Commission (“SEC”). In the event the Fund does engage in securities lending, the Fund will lend through its custodian, State Street Bank and Trust Company (“State Street”), acting as securities lending agent on behalf of the Fund. State Street will manage the Fund’s collateral in accordance with the securities lending agency agreement between the Fund and State Street, and indemnify the Fund against counterparty risk. The loans will be collateralized by cash (which may be invested in a money market fund) and/ornon-cash collateral (which may include U.S. Treasury securities and/or U.S. Government Agency securities issued or guaranteed by the United States government or its agencies or instrumentalities) at least equal at all times to
the market value of the securities loaned. The Fund may bear the risk of delay in recovery of, or loss of rights in, the securities loaned should the borrower of the securities experience financial difficulty. The Fund may also record a realized gain or loss on securities deemed sold due to a borrower’s inability to return securities on loan. The Fund bears the risk of any loss on investment of cash collateral. The Fund will receive compensation for lending its securities in the form of fees or it will retain a portion of interest earned on the investment of any cash collateral. The Fund will also continue to receive interest and dividends on the securities loaned and any gain or loss in the market price of the securities loaned that may occur during the term of the loan will be for the account of the Fund. Income earned from securities lending activities, if any, is reflected in the Statement of Operations. As of October 31, 2019, the Fund had securities on loan with an aggregate market value of $15,924,963 and receivednon-cash collateral in the form of U.S. Treasury securities with a value of $16,845,172.
(J) Foreign Currency Transactions. The Fund’s books and records are maintained in U.S. dollars. Prices of securities denominated in foreign currency amounts are translated into U.S. dollars at the mean between the buying and selling rates last quoted by any major U.S. bank at the following dates:
| (i) | market value of investment securities, other assets and liabilities— at the valuation date; and |
| (ii) | purchases and sales of investment securities, income and expenses—at the date of such transactions. |
The assets and liabilities that are denominated in foreign currency amounts are presented at the exchange rates and market values at the close of the period. The realized and unrealized changes in net assets arising from fluctuations in exchange rates and market prices of securities are not separately presented.
Net realized gain (loss) on foreign currency transactions represents net gains and losses on foreign currency forward contracts, net currency gains or losses realized as a result of differences between the amounts of securities sale proceeds or purchase cost, dividends, interest and withholding taxes as recorded on the Fund’s books, and the U.S. dollar equivalent amount actually received or paid. Net currency gains or losses from valuing such foreign currency denominated assets and liabilities, other than investments at valuation date exchange rates, are reflected in unrealized foreign exchange gains or losses.
(K) Foreign Securities Risk. The Fund invests in foreign securities, which carry certain risks that are in addition to the usual risks inherent in domestic securities. These risks include those resulting from currency fluctuations, future adverse political or economic developments and possible imposition of currency exchange blockages or other foreign governmental laws or restrictions. These risks are likely to be greater in emerging markets than in developed markets. The ability of issuers of securities held by the Fund to meet their obligations may be affected by, among other things, economic or political developments in a specific country, industry or region.
(L) Indemnifications. Under the Trust’s organizational documents, its officers and trustees are indemnified against certain liabilities that may arise out of performance of their duties to the Trust. Additionally, in the normal course of business, the Fund enters into contracts with
| | |
| 24 | | MainStay MacKay International Equity Fund |
third-party service providers that contain a variety of representations and warranties and which may provide general indemnifications. The Fund’s maximum exposure under these arrangements is unknown, as this would involve future claims that may be made against the Fund that have not yet occurred. Based on experience, management is of the view that the risk of loss in connection with these potential indemnification obligations is remote. However, there can be no assurance that material liabilities related to such obligations will not arise in the future, which could adversely impact the Fund.
Note 3–Fees and Related Party Transactions
(A) Manager and Subadvisor. New York Life Investments, a registered investment adviser and an indirect,wholly-owned subsidiary of New York Life Insurance Company (“New York Life”), serves as the Fund’s Manager, pursuant to an Amended and Restated Management Agreement (“Management Agreement”). The Manager provides offices, conducts clerical, recordkeeping and bookkeeping services and keeps most of the financial and accounting records required to be maintained by the Fund. Except for the portion of salaries and expenses that are the responsibility of the Fund, the Manager pays the salaries and expenses of all personnel affiliated with the Fund and certain operational expenses of the Fund. The Fund reimburses New York Life Investments in an amount equal to a portion of the compensation of the Chief Compliance Officer attributable to the Fund. MacKay Shields LLC (“MacKay Shields” or the “Subadvisor”), a registered investment adviser and an indirect,wholly-owned subsidiary of New York Life, serves as Subadvisor to the Fund and is responsible for theday-to-day portfolio management of the Fund. Pursuant to the terms of an Amended and Restated Subadvisory Agreement (“Subadvisory Agreement”) between New York Life Investments and MacKay Shields, New York Life Investments pays for the services of the Subadvisor.
Under the Management Agreement, the Fund pays the Manager a monthly fee for the services performed and the facilities furnished at an annual rate of the Fund’s average daily net assets as follows: 0.89% up to $500 million; and 0.85% in excess of $500 million.
During the year ended October 31, 2019, the effective management fee rate (exclusive of any applicable waivers/reimbursements) was 0.89%.
Effective January 1, 2019, New York Life Investments has contractually agreed to waive fees and/or reimburse expenses so that Total Annual Fund Operating Expenses (excluding taxes, interest, litigation, extraordinary expenses, brokerage and other transaction expenses relating to the purchase or sale of portfolio investments and acquired (underlying) fund fees and expenses) do not exceed the following percentages of average daily net assets: Class I, 0.85% and Class R6, 0.83%. New York Life Investments will apply an equivalent waiver or reimbursement, in an equal number of basis points of the Class R6 shares waiver/reimbursement to the Class A, Investor Class, Class B, Class C, Class R1, Class R2 and Class R3 shares. This agreement will remain in effect until February 28, 2020, and shall renew automatically for one-year terms unless New York Life Investments provides written notice of termination prior to the start of the next term or upon approval of the Board.
Prior to January 1, 2019, New York Life Investments had contractually agreed to waive fees and/or reimburse expenses so that Total Annual
Fund Operating Expenses (excluding taxes, interest, litigation, extraordinary expenses, brokerage and other transaction expenses relating to the purchase or sale of portfolio investments, and acquired (underlying) fund fees and expenses) of Class R6 would not exceed those of Class I.
New York Life Investments has voluntarily agreed to waive fees and/or reimburse expenses so that Total Annual Fund Operating Expenses (excluding taxes, interest, litigation, extraordinary expenses, brokerage and other transaction expenses relating to the purchase or sale of portfolio investments and acquired (underlying) fund fees and expenses) of a class do not exceed the following percentages of average daily net assets: Investor Class, 1.85%; Class B, 2.60%; and Class C, 2.60%. These voluntary waivers or reimbursements may be discontinued at any time without notice.
During the year ended October 31, 2019, New York Life Investments earned fees from the Fund in the amount of $2,751,837 and waived its fees and/or reimbursed expenses in the amount of $520,869 and paid the Subadvisor in the amount of $1,115,711.
State Street providessub-administration andsub-accounting services to the Fund pursuant to an agreement with New York Life Investments. These services include calculating the daily NAVs of the Fund, maintaining the general ledger andsub-ledger accounts for the calculation of the Fund’s NAVs and assisting New York Life Investments in conducting various aspects of the Fund’s administrative operations. For providing these services to the Fund, State Street is compensated by New York Life Investments.
Pursuant to an agreement between the Trust and New York Life Investments, New York Life Investments is responsible for providing or procuring certain regulatory reporting services for the Fund. The Fund will reimburse New York Life Investments for the actual costs incurred by New York Life Investments in connection with providing or procuring these services for the Fund.
(B) Distribution, Service and Shareholder Service Fees. The Trust, on behalf of the Fund, has entered into a distribution agreement with NYLIFE Distributors LLC (the “Distributor”), an indirect,wholly-owned subsidiary of New York Life. The Fund has adopted distribution plans (the “Plans”) in accordance with the provisions of Rule 12b-1 under the 1940 Act.
Pursuant to the Class A, Investor Class and Class R2 Plans, the Distributor receives a monthly distribution fee from the Class A, Investor Class and Class R2 shares at an annual rate of 0.25% of the average daily net assets of the Class A, Investor Class and Class R2 shares for distribution and/or service activities as designated by the Distributor. Pursuant to the Class B and Class C Plans, Class B and Class C shares pay the Distributor a monthly distribution fee at an annual rate of 0.75% of the average daily net assets of the Class B and Class C shares, along with a service fee at an annual rate of 0.25% of the average daily net assets of the Class B and Class C shares, for a total 12b-1 fee of 1.00%. Pursuant to the Class R3 Plan, the Distributor receives a monthly distribution and/or service fee from the Class R3 shares at an annual rate of 0.50% of the average daily net assets of the Class R3 shares. Class I, Class R1 and Class R6 shares are not subject to a distribution and/or service fee.
Notes to Financial Statements(continued)
The Plans provide that the distribution and service fees are payable to the Distributor regardless of the amounts actually expended by the Distributor for distribution of the Fund’s shares and service activities.
In accordance with the Shareholder Services Plans for the Class R1, Class R2 and Class R3 shares, the Manager has agreed to provide, through its affiliates or independent third parties, various shareholder and administrative support services to shareholders of the Class R1, Class R2 and Class R3 shares. For its services, the Manager, its affiliates or independent third-party service providers are entitled to a shareholder service fee accrued daily and paid monthly at an annual rate of 0.10% of the average daily net assets of the Class R1, Class R2 and Class R3 shares. This is in addition to any fees paid under the Class R2 and Class R3 Plans.
During the year ended October 31, 2019, shareholder service fees incurred by the Fund were as follows:
| | | | |
Class R1 | | $ | 530 | |
Class R2 | | | 469 | |
Class R3 | | | 992 | |
(C) Sales Charges. During the year ended October 31, 2019, the Fund was advised by the Distributor that the amount of initial sales charges retained on sales of Class A and Investor Class shares were $8,156 and $7,399, respectively.
During the year ended October 31, 2019, the Fund was also advised that the Distributor retained CDSCs on redemptions of Class A, Class B and Class C shares of $1,587, $2,720 and $240, respectively.
(D) Transfer, Dividend Disbursing and Shareholder Servicing Agent. NYLIM Service Company LLC, an affiliate of New York Life Investments, is the Fund’s transfer, dividend disbursing and shareholder servicing agent pursuant to an agreement between NYLIM Service Company LLC and the Trust. NYLIM Service Company LLC has entered into an agreement with DST Asset Manager Solutions, Inc. (“DST”), pursuant to which DST performs certain transfer agent services on behalf of NYLIM Service Company LLC. During the year ended October 31, 2019, transfer agent expenses incurred by the Fund were as follows:
| | | | |
Class A | | $ | 55,644 | |
Investor Class | | | 111,975 | |
Class B | | | 18,731 | |
Class C | | | 26,964 | |
Class I | | | 105,185 | |
Class R1 | | | 439 | |
Class R2 | | | 435 | |
Class R3 | | | 940 | |
(E) Small Account Fee. Shareholders with small accounts adversely impact the cost of providing transfer agency services. In an effort to reduce total transfer agency expenses, the Fund has implemented a small account fee on certain types of accounts. Certain shareholders with an account balance of less than $1,000 are charged an annual per account fee of $20 (assessed semi-annually), the proceeds from which offset transfer agent fees as reflected in the Statement of Operations.
(F) Investments in Affiliates (in 000’s). During the year ended October 31, 2019, purchases and sales transactions, income earned from investments and shares held of investment companies managed by New York Life Investments or its affiliates were as follows:
| | | | | | | | | | | | | | | | | | | | | | | | | | | | | | | | | | | | |
Affiliated Investment
Company | | Value,
Beginning
of Year | | | Purchases
at Cost | | | Proceeds
from
Sales | | | Net
Realized
Gain/(Loss)
on Sales | | | Change in
Unrealized
Appreciation/
(Depreciation) | | | Value,
End of
Year | | | Dividend
Income | | | Other
Distributions | | | Shares
End of
Year | |
MainStay U.S. Government Liquidity Fund | | $ | 615 | | | $ | 35,017 | | | $ | (35,033 | ) | | $ | — | | | $ | — | | | $ | 599 | | | $ | 9 | | | $ | — | | | | 599 | |
(G) Capital. As of October 31, 2019, New York Life and its affiliates beneficially held shares of the Fund with the values and percentages of net assets as follows:
| | | | | | | | |
Class R6 | | $ | 86,876,528 | | | | 48.9 | % |
Note 4–Federal Income Tax
As of October 31, 2019, the cost and unrealized appreciation (depreciation) of the Fund’s investment portfolio, including applicable derivative contracts and other financial instruments, as determined on a federal income tax basis, were as follows:
| | | | | | | | | | | | | | | | |
| | | Federal Tax
Cost | | | Gross
Unrealized
Appreciation | | | Gross
Unrealized
(Depreciation) | | | Net
Unrealized
Appreciation/
(Depreciation) | |
| | | | |
Investments in Securities | | $ | 278,410,550 | | | $ | 31,031,740 | | | $ | (8,088,097 | ) | | $ | 22,943,643 | |
As of October 31, 2019, the components of accumulated gain (loss) on a tax basis were as follows:
| | | | | | | | |
Ordinary
Income | | Accumulated
Capital and
Other Gain
(Loss) | | Other
Temporary
Differences | | Unrealized
Appreciation
(Depreciation) | | Total
Accumulated
Gain (Loss) |
| | | | |
| $1,693,594 | | $8,715,025 | | $(36,846) | | $22,902,140 | | $33,273,913 |
The difference between book-basis and tax-basis unrealized appreciation (depreciation) is primarily due to wash sale adjustments and Passive Foreign Investment Company (PFIC) adjustments. The other temporary differences are primarily due to foreign taxes payable.
| | |
| 26 | | MainStay MacKay International Equity Fund |
The following table discloses the current year reclassifications between total distributable earnings (loss) and additional paid-in capital arising from permanent differences; net assets as of October 31, 2019 were not affected.
| | |
Total Distributable Earnings (Loss) | | Additional Paid-In Capital |
| |
| $(95) | | $95 |
The reclassifications for the Fund are primarily due to equalization.
During the years ended October 31, 2019 and October 31, 2018, the tax character of distributions paid as reflected in the Statements of Changes in Net Assets was as follows:
| | | | | | | | |
| | | 2019 | | | 2018 | |
| | |
Distributions paid from: | | | | | | | | |
Ordinary Income | | $ | 119,582 | | | $ | 1,998,004 | |
Long-term capital gains | | | 3,076,892 | | | | — | |
Total | | $ | 3,196,474 | | | $ | 1,998,004 | |
Note 5–Custodian
State Street is the custodian of cash and securities held by the Fund. Custodial fees are charged to the Fund based on the Fund’s net assets and/or the market value of securities held by the Fund and the number of certain transactions incurred by the Fund.
Note 6–Line of Credit
The Fund and certain other funds managed by New York Life Investments maintain a line of credit with a syndicate of banks in order to secure a source of funds for temporary purposes to meet unanticipated or excessive redemption requests.
Effective July 30, 2019, under the credit agreement (the “Credit Agreement”), the aggregate commitment amount is $600,000,000 with an additional uncommitted amount of $100,000,000. The commitment fee is an annual rate of 0.15% of the average commitment amount payable quarterly, regardless of usage, to State Street, who serves as the agent to the syndicate. The commitment fee is allocated among the Fund and certain other funds managed by New York Life Investments based upon their respective net assets and other factors. Interest on any revolving credit loan is charged based upon the Federal Funds Rate or the one-month London Interbank Offered Rate (“LIBOR”), whichever is higher. The Credit Agreement expires on July 28, 2020, although the Fund, certain other funds managed by New York Life Investments and the syndicate of banks may renew the Credit Agreement for an additional year on the same or different terms. Prior to July 30, 2019, the aggregate commitment amount and the commitment fee were the same as those under the current Credit Agreement. During the year ended October 31, 2019, there were no borrowings made or outstanding with respect to the Fund under the Credit Agreement.
Note 7–Interfund Lending Program
Pursuant to an exemptive order issued by the SEC, the Fund, along with certain other funds managed by New York Life Investments, may participate in an interfund lending program. The interfund lending program
provides an alternative credit facility that permits the Fund and certain other funds managed by New York Life Investments to lend or borrow money for temporary purposes directly to or from one another subject to the conditions of the exemptive order. During the year ended October 31, 2019, there were no interfund loans made or outstanding with respect to the Fund.
Note 8–Purchases and Sales of Securities (in 000’s)
During the year ended October 31, 2019, purchases and sales of securities, other thanshort-term securities, were $173,008 and $193,984, respectively.
Note 9–Capital Share Transactions
Transactions in capital shares for the years ended October 31, 2019 and October 31, 2018, were as follows:
| | | | | | | | |
Class A | | Shares | | | Amount | |
| | |
Year ended October 31, 2019: | | | | | | | | |
Shares sold | | | 891,776 | | | $ | 14,799,175 | |
Shares issued to shareholders in reinvestment of dividends and distributions | | | 39,110 | | | | 581,950 | |
Shares redeemed | | | (1,432,293 | ) | | | (23,509,575 | ) |
| | | | |
Net increase (decrease) in shares outstanding before conversion | | | (501,407 | ) | | | (8,128,450 | ) |
Shares converted into Class A (See Note 1) | | | 87,551 | | | | 1,426,304 | |
Shares converted from Class A (See Note 1) | | | (55,231 | ) | | | (895,055 | ) |
| | | | |
Net increase (decrease) | | | (469,087 | ) | | $ | (7,597,201 | ) |
| | | | |
Year ended October 31, 2018: | | | | | | | | |
Shares sold | | | 915,766 | | | $ | 15,804,049 | |
Shares issued to shareholders in reinvestment of dividends and distributions | | | 17,877 | | | | 301,222 | |
Shares redeemed | | | (652,088 | ) | | | (11,185,225 | ) |
| | | | |
Net increase (decrease) in shares outstanding before conversion | | | 281,555 | | | | 4,920,046 | |
Shares converted into Class A (See Note 1) | | | 235,657 | | | | 4,058,475 | |
Shares converted from Class A (See Note 1) | | | (16,148 | ) | | | (277,043 | ) |
| | | | |
Net increase (decrease) | | | 501,064 | | | $ | 8,701,478 | |
| | | | |
|
| |
Notes to Financial Statements(continued)
| | | | | | | | |
Investor Class | | Shares | | | Amount | |
| | |
Year ended October 31, 2019: | | | | | | | | |
Shares sold | | | 387,057 | | | $ | 6,426,137 | |
Shares issued to shareholders in reinvestment of dividends and distributions | | | 14,658 | | | | 216,498 | |
Shares redeemed | | | (451,502 | ) | | | (7,463,061 | ) |
| | | | |
Net increase (decrease) in shares outstanding before conversion | | | (49,787 | ) | | | (820,426 | ) |
Shares converted into Investor Class (See Note 1) | | | 110,259 | | | | 1,756,513 | |
Shares converted from Investor Class (See Note 1) | | | (61,483 | ) | | | (998,419 | ) |
| | | | |
Net increase (decrease) | | | (1,011 | ) | | $ | (62,332 | ) |
| | | | |
Year ended October 31, 2018: | | | | | | | | |
Shares sold | | | 181,940 | | | $ | 3,114,134 | |
Shares issued to shareholders in reinvestment of dividends and distributions | | | 2,537 | | | | 42,599 | |
Shares redeemed | | | (142,385 | ) | | | (2,425,059 | ) |
| | | | |
Net increase (decrease) in shares outstanding before conversion | | | 42,092 | | | | 731,674 | |
Shares converted into Investor Class (See Note 1) | | | 51,656 | | | | 881,872 | |
Shares converted from Investor Class (See Note 1) | | | (222,310 | ) | | | (3,809,182 | ) |
| | | | |
Net increase (decrease) | | | (128,562 | ) | | $ | (2,195,636 | ) |
| | | | |
|
| |
Class B | | Shares | | | Amount | |
| | |
Year ended October 31, 2019: | | | | | | | | |
Shares sold | | | 116,426 | | | $ | 1,720,865 | |
Shares issued to shareholders in reinvestment of dividends and distributions | | | 3,501 | | | | 45,898 | |
Shares redeemed | | | (171,357 | ) | | | (2,495,992 | ) |
| | | | |
Net increase (decrease) in shares outstanding before conversion | | | (51,430 | ) | | | (729,229 | ) |
Shares converted from Class B (See Note 1) | | | (46,670 | ) | | | (652,096 | ) |
| | | | |
Net increase (decrease) | | | (98,100 | ) | | $ | (1,381,325 | ) |
| | | | |
Year ended October 31, 2018: | | | | | | | | |
Shares sold | | | 19,666 | | | $ | 295,697 | |
Shares redeemed | | | (67,685 | ) | | | (1,025,420 | ) |
| | | | |
Net increase (decrease) in shares outstanding before conversion | | | (48,019 | ) | | | (729,723 | ) |
Shares converted from Class B (See Note 1) | | | (56,653 | ) | | | (865,791 | ) |
| | | | |
Net increase (decrease) | | | (104,672 | ) | | $ | (1,595,514 | ) |
| | | | |
|
| |
| | | | | | | | |
Class C | | Shares | | | Amount | |
| | |
Year ended October 31, 2019: | | | | | | | | |
Shares sold | | | 62,946 | | | $ | 898,110 | |
Shares issued to shareholders in reinvestment of dividends and distributions | | | 5,556 | | | | 72,842 | |
Shares redeemed | | | (269,808 | ) | | | (3,860,218 | ) |
| | | | |
Net increase (decrease) in shares outstanding before conversion | | | (201,306 | ) | | | (2,889,266 | ) |
Shares converted from Class C (See Note 1) | | | (45,392 | ) | | | (638,968 | ) |
| | | | |
Net increase (decrease) | | | (246,698 | ) | | $ | (3,528,234 | ) |
| | | | |
Year ended October 31, 2018: | | | | | | | | |
Shares sold | | | 106,648 | | | $ | 1,618,061 | |
Shares redeemed | | | (117,432 | ) | | | (1,776,629 | ) |
| | | | |
Net increase (decrease) | | | (10,784 | ) | | $ | (158,568 | ) |
| | | | |
|
| |
Class I | | Shares | | | Amount | |
| | |
Year ended October 31, 2019: | | | | | | | | |
Shares sold | | | 1,072,727 | | | $ | 17,223,161 | |
Shares issued to shareholders in reinvestment of dividends and distributions | | | 149,207 | | | | 2,233,635 | |
Shares redeemed | | | (1,629,800 | ) | | | (26,063,040 | ) |
| | | | |
Net increase (decrease) in shares outstanding before conversion | | | (407,866 | ) | | | (6,606,244 | ) |
Shares converted into Class I (See Note 1) | | | 104 | | | | 1,721 | |
Shares converted from Class I (See Note 1) | | | (10,765,614 | ) | | | (174,508,600 | ) |
| | | | |
Net increase (decrease) | | | (11,173,376 | ) | | $ | (181,113,123 | ) |
| | | | |
Year ended October 31, 2018: | | | | | | | | |
Shares sold | | | 3,653,814 | | | $ | 62,248,511 | |
Shares issued to shareholders in reinvestment of dividends and distributions | | | 95,420 | | | | 1,614,501 | |
Shares redeemed | | | (2,512,532 | ) | | | (43,353,547 | ) |
| | | | |
Net increase (decrease) in shares outstanding before conversion | | | 1,236,702 | | | | 20,509,465 | |
Shares converted into Class I (See Note 1) | | | 653 | | | | 11,669 | |
| | | | |
Net increase (decrease) | | | 1,237,355 | | | $ | 20,521,134 | |
| | | | |
|
| |
Class R1 | | Shares | | | Amount | |
| | |
Year ended October 31, 2019: | | | | | | | | |
Shares sold | | | 1,899 | | | $ | 30,050 | |
Shares issued to shareholders in reinvestment of dividends and distributions | | | 204 | | | | 3,038 | |
Shares redeemed | | | (122,890 | ) | | | (1,840,520 | ) |
| | | | |
Net increase (decrease) | | | (120,787 | ) | | $ | (1,807,432 | ) |
| | | | |
Year ended October 31, 2018: | | | | | | | | |
Shares sold | | | 12,744 | | | $ | 221,403 | |
Shares issued to shareholders in reinvestment of dividends and distributions | | | 1,061 | | | | 17,860 | |
Shares redeemed | | | (37,224 | ) | | | (638,649 | ) |
| | | | |
Net increase (decrease) | | | (23,419 | ) | | $ | (399,386 | ) |
| | | | |
|
| |
| | |
| 28 | | MainStay MacKay International Equity Fund |
| | | | | | | | |
Class R2 | | Shares | | | Amount | |
| | |
Year ended October 31, 2019: | | | | | | | | |
Shares sold | | | 3,373 | | | $ | 53,250 | |
Shares issued to shareholders in reinvestment of dividends and distributions | | | 254 | | | | 3,783 | |
Shares redeemed | | | (15,961 | ) | | | (257,168 | ) |
| | | | |
Net increase (decrease) | | | (12,334 | ) | | $ | (200,135 | ) |
| | | | |
Year ended October 31, 2018: | | | | | | | | |
Shares sold | | | 24,226 | | | $ | 421,614 | |
Shares issued to shareholders in reinvestment of dividends and distributions | | | 102 | | | | 1,720 | |
Shares redeemed | | | (58,640 | ) | | | (988,905 | ) |
| | | | |
Net increase (decrease) | | | (34,312 | ) | | $ | (565,571 | ) |
| | | | |
|
| |
Class R3 | | Shares | | | Amount | |
| | |
Year ended October 31, 2019: | | | | | | | | |
Shares sold | | | 16,622 | | | $ | 265,663 | |
Shares issued to shareholders in reinvestment of dividends and distributions | | | 585 | | | | 8,641 | |
Shares redeemed | | | (17,844 | ) | | | (273,670 | ) |
| | | | |
Net increase (decrease) | | | (637 | ) | | $ | 634 | |
| | | | |
Year ended October 31, 2018: | | | | | | | | |
Shares sold | | | 24,025 | | | $ | 415,163 | |
Shares issued to shareholders in reinvestment of dividends and distributions | | | 176 | | | | 2,956 | |
Shares redeemed | | | (44,289 | ) | | | (747,589 | ) |
| | | | |
Net increase (decrease) | | | (20,088 | ) | | $ | (329,470 | ) |
| | | | |
|
| |
Class R6 | | Shares | | | Amount | |
| | |
Period ended October 31, 2019 (a): | | | | | | | | |
Shares sold | | | 687,023 | | | $ | 11,450,236 | |
Shares redeemed | | | (1,178,021 | ) | | | (19,208,695 | ) |
| | | | |
Net increase (decrease) in shares outstanding before conversion | | | (490,998 | ) | | | (7,758,459 | ) |
Shares converted into Class R6 (See Note 1) | | | 10,763,300 | | | | 174,508,600 | |
| | | | |
Net increase (decrease) | | | 10,272,302 | | | $ | 166,750,141 | |
| | | | |
| (a) | The inception date of the class was February 28, 2019. |
Note 10–Recent Accounting Pronouncement
To improve the effectiveness of fair value disclosure requirements, the Financial Accounting Standards Board recently issued Accounting Standards Update (ASU)2018-13, Fair Value Measurement Disclosure Framework—Changes to the Disclosure Requirements for Fair Value Measurement (ASU2018-13), which adds, removes, and modifies certain aspects relating to fair value disclosure. ASU2018-13 is effective for interim and annual reporting periods beginning after December 15, 2019; early adoptions of the entire ASU 2018-13, or portions thereof, is permitted. Management has evaluated the implications of certain other provisions of the ASU and has determined to early adopt aspects related to the removal and modifications of certain fair value measurement disclosures under the ASU effective immediately. At this time, management is evaluating the implications of certain other provisions of the ASU related to new disclosure requirements and any impact on the financial statement disclosures has not yet been determined.
Note 11–Subsequent Events
In connection with the preparation of the financial statements of the Fund as of and for the year ended October 31, 2019, events and transactions subsequent to October 31, 2019, through the date the financial statements were issued have been evaluated by the Fund’s management for possible adjustment and/or disclosure. No subsequent events requiring financial statement adjustment or disclosure have been identified.
Report of Independent Registered Public Accounting Firm
To the Shareholders and Board of Trustees
The MainStay Funds:
Opinion on the Financial Statements
We have audited the accompanying statement of assets and liabilities of MainStay MacKay International Equity Fund (the Fund), one of the funds constituting The MainStay Funds, including the portfolio of investments, as of October 31, 2019, the related statement of operations for the year then ended, the statements of changes in net assets for each of the years in thetwo-year period then ended, and the related notes (collectively, the financial statements) and the financial highlights for each of the years or periods in thefive-year period then ended. In our opinion, the financial statements and financial highlights present fairly, in all material respects, the financial position of the Fund as of October 31, 2019, the results of its operations for the year then ended, the changes in its net assets for each of the years in thetwo-year period then ended, and the financial highlights for each of the years or periods in thefive-year period then ended, in conformity with U.S. generally accepted accounting principles.
Basis for Opinion
These financial statements and financial highlights are the responsibility of the Fund’s management. Our responsibility is to express an opinion on these financial statements and financial highlights based on our audits. We are a public accounting firm registered with the Public Company Accounting Oversight Board (United States) (PCAOB) and are required to be independent with respect to the Fund in accordance with the U.S. federal securities laws and the applicable rules and regulations of the Securities and Exchange Commission and the PCAOB.
We conducted our audits in accordance with the standards of the PCAOB. Those standards require that we plan and perform the audit to obtain reasonable assurance about whether the financial statements and financial highlights are free of material misstatement, whether due to error or fraud. Our audits included performing procedures to assess the risks of material misstatement of the financial statements and financial highlights, whether due to error or fraud, and performing procedures that respond to those risks. Such procedures included examining, on a test basis, evidence regarding the amounts and disclosures in the financial statements and financial highlights. Such procedures also included confirmation of securities owned as of October 31, 2019, by correspondence with the custodian and the transfer agent. Our audits also included evaluating the accounting principles used and significant estimates made by management, as well as evaluating the overall presentation of the financial statements and financial highlights. We believe that our audits provide a reasonable basis for our opinion.

We have served as the auditor of one or more New York Life Investment Management investment companies since 2003.
Philadelphia, Pennsylvania
December 23, 2019
| | |
| 30 | | MainStay MacKay International Equity Fund |
Federal Income Tax Information
(Unaudited)
The Fund is required under the Internal Revenue Code to advise shareholders in a written statement as to the federal tax status of dividends paid by the Fund during such fiscal years. Accordingly, the Fund paid $3,076,917 as long term capital gain distributions.
For the fiscal year ended October 31, 2019, the Fund designated approximately $464,146 under the Internal Revenue Code as qualified dividend income eligible for reduced tax rates.
In accordance with federal tax law, the Fund elected to provide each shareholder with their portion of the Fund’s foreign taxes paid and the income sourced from foreign countries. Accordingly, the Fund made the following designations regarding its fiscal year ended October 31, 2019:
| • | | the total amount of taxes credited to foreign countries was $344,564. |
| • | | the total amount of income sourced from foreign countries was $4,913,960. |
In February 2020, shareholders will receive an IRS Form1099-DIV or substitute Form 1099, which will show the federal tax status of the distributions received by shareholders in calendar year 2019. The amounts that will be reported on such1099-DIV or substitute Form 1099 will be the amounts you are to use on your federal income tax return and will differ from the amounts which we must report for the Fund’s fiscal year end October 31, 2019.
Proxy Voting Policies and Procedures and Proxy Voting Record
A description of the policies and procedures that New York Life Investments uses to vote proxies related to the Fund’s securities is available without charge, upon request, by visiting the MainStay Funds’ website atnylinvestments.com/fundsor visiting the SEC’s website atwww.sec.gov.
The Fund is required to file with the SEC its proxy voting records for the12-month period ending June 30 on Form N-PX. The most recent Form N-PX or proxy voting record is available free of charge upon request by calling800-624-6782; visiting the MainStay Funds’ website atnylinvestments.com/funds; or visiting the SEC’s website atwww.sec.gov.
Shareholder Reports and Quarterly Portfolio Disclosure
The Fund is required to file its complete schedule of portfolio holdings with the SEC 60 days after its first and third fiscal quarter onForm N-PORT. The Fund’s holdings report is available free of charge by visiting the SEC’s website atwww.sec.govor upon request by calling New York Life Investments at800-624-6782.
Board of Trustees and Officers (Unaudited)
The Trustees and officers of the Funds are listed below. The Board oversees the MainStay Group of Funds (which consists of MainStay Funds and MainStay Funds Trust), MainStay VP Funds Trust, MainStay MacKay DefinedTerm Municipal Opportunities Fund, the Manager and the Subadvisors, and elects the officers of the Funds who are responsible for theday-to-day operations of the Funds. Information pertaining to the Trustees and officers is set forth below. Each Trustee serves until his or her successor is elected and qualified or until his or her
resignation, death or removal. Under the Board’s retirement policy, unless an exception is made, a Trustee must tender his or her resignation by the end of the calendar year during which he or she reaches the age of 75. Officers are elected annually by the Board. The business address of each Trustee and officer listed below is 51 Madison Avenue, New York, New York 10010. A majority of the Trustees are not “interested persons” (as defined by the 1940 Act and rules adopted by the SEC thereunder) of the Fund (“Independent Trustees”).
| | | | | | | | | | | | |
| | | | | Name and
Year of Birth | | Term of Office,
Position(s) Held and
Length of Service | | Principal Occupation(s)
During Past Five Years | | Number of
Portfolios in
Fund Complex
Overseen by
Trustee | | Other Directorships
Held by Trustee |
Interested Trustee | | | | Yie-Hsin Hung* 1962 | | MainStay Funds: Trustee since 2017; MainStay Funds Trust:Trustee since 2017. | | Senior Vice President of New York Life since joining in 2010, Member of the Executive Management Committee since 2017, Chief Executive Officer, New York Life Investment Management Holdings LLC & New York Life Investment Management LLC since 2015. Senior Managing Director andCo-President of New York Life Investment Management LLC from January 2014 to May 2015. Previously held positions of increasing responsibility, including head of NYLIM International, Alternative Growth Businesses, and Institutional investments since joining New York Life in 2010. | | 74 | | MainStay VP Funds Trust:
Trustee since 2017 (31 portfolios); and
MainStay MacKay DefinedTerm Municipal Opportunities Fund: Trustee since 2017. |
| | * | This Trustee is considered to be an “interested person” of the MainStay Group of Funds, MainStay VP Funds Trust and MainStay MacKay DefinedTerm Municipal Opportunities Fund, within the meaning of the 1940 Act because of her affiliation with New York Life Insurance Company, New York Life Investment Management LLC, Candriam Belgium S.A., Candriam Luxembourg S.C.A., IndexIQ Advisors LLC, MacKay Shields LLC, NYL Investors LLC, NYLIFE Securities LLC and/or NYLIFE Distributors LLC, as described in detail above in the column entitled “Principal Occupation(s) During Past Five Years.” |
| | |
| 32 | | MainStay MacKay International Equity Fund |
| | | | | | | | | | | | |
| | | | | Name and
Year of Birth | | Term of Office,
Position(s) Held and
Length of Service | | Principal Occupation(s)
During Past Five Years | | Number of
Portfolios in
Fund Complex
Overseen by
Trustee | | Other Directorships
Held by Trustee |
Independent Trustees | | | | David H. Chow 1957 | | MainStay Funds: Trustee since 2016, Advisory Board Member (June 2015 to December 2015); MainStay Funds Trust:Trustee since 2016, Advisory Board Member (June 2015 to December 2015). | | Founder and CEO, DanCourt Management, LLC (since 1999) | | 74 | | MainStay VP Funds Trust: Trustee since 2016, Advisory Board Member (June 2015 to December 2015) (31 portfolios);
MainStay MacKay DefinedTerm Municipal Opportunities Fund: Trustee since 2016, Advisory Board Member (June 2015 to December 2015);
Market Vectors Group of Exchange-Traded Funds: Independent Chairman of the Board of Trustees since 2008 and Trustee since 2006 (56 portfolios); and
Berea College of Kentucky: Trustee since 2009. |
| | | | Susan B. Kerley 1951 | | MainStay Funds: Chairman since 2017 and Trustee since 2007; MainStay Funds Trust:Chairman since 2017 and Trustee since 1990.** | | President, Strategic Management Advisors LLC (since 1990) | | 74 | | MainStay VP Funds Trust: Chairman since January 2017 and Trustee since 2007 (31 portfolios)***;
MainStay MacKay DefinedTerm Municipal Opportunities Fund: Chairman since 2017 and Trustee since 2011; and
Legg Mason Partners Funds: Trustee since 1991 (45 portfolios). |
| | | | Alan R. Latshaw 1951 | | MainStay Funds: Trustee; MainStay Funds Trust: Trustee and Audit Committee Financial Expert since 2007.** | | Retired; Partner, Ernst & Young LLP (2002 to 2003); Partner, Arthur Andersen LLP (1989 to 2002); Consultant to the MainStay Funds Audit and Compliance Committee (2004 to 2006) | | 74 | | MainStay VP Funds Trust: Trustee and Audit Committee Financial Expert since 2007 (31 portfolios)***;
MainStay MacKay DefinedTerm Municipal Opportunities Fund: Trustee and Audit Committee Financial Expert since 2011;
State Farm Associates Funds Trusts: Trustee since 2005 (4 portfolios);
and State Farm Variable Product Trust: Trustee since 2005 (9 portfolios). |
| | | | Richard H. Nolan, Jr. 1946 | | MainStay Funds: Trustee since 2007; MainStay Funds Trust:Trustee since 2007.** | | Managing Director, ICC Capital Management (since 2004); President—Shields/Alliance, Alliance Capital Management (1994 to 2004) | | 74 | | MainStay VP Funds Trust: Trustee since 2006 (31 portfolios)***; and
MainStay MacKay DefinedTerm Municipal Opportunities Fund: Trustee since 2011. |
| | | | Jacques P. Perold 1958 | | MainStay Funds: Trustee since 2016, Advisory Board Member (June 2015 to December 2015); MainStay Funds Trust:Trustee since 2016, Advisory Board Member (June 2015 to December 2015). | | Retired; President, Fidelity Management & Research Company (2009 to 2014); Founder, President and Chief Executive Officer, Geode Capital Management, LLC (2001 to 2009) | | 74 | | MainStay VP Funds Trust: Trustee since 2016, Advisory Board Member (June 2015 to December 2015) (31 portfolios);
MainStay MacKay DefinedTerm Municipal Opportunities Fund: Trustee since 2016, Advisory Board Member (June 2015 to December 2015);
Allstate Corporation: Director since 2015;MSCI, Inc.: Director since 2017 and
Boston University: Trustee since 2014. |
| | | | | | | | | | | | |
| | | | | Name and
Year of Birth | | Term of Office,
Position(s) Held and
Length of Service | | Principal Occupation(s)
During Past Five Years | | Number of
Portfolios in
Fund Complex
Overseen by
Trustee | | Other Directorships
Held by Trustee |
Independent Trustees | | | | Richard S. Trutanic 1952 | | MainStay Funds: Trustee since 1994; MainStay Funds Trust: Trustee since 2007.** | | Chairman and Chief Executive Officer, Somerset & Company (financial advisory firm) (since 2004); Managing Director, The Carlyle Group (private investment firm) (2002 to 2004); Senior Managing Director, Partner and Board Member, Groupe Arnault S.A. (private investment firm) (1999 to 2002) | | 74 | | MainStay VP Funds Trust: Trustee since 2007 (31 portfolios)***; and
MainStay MacKay DefinedTerm Municipal Opportunities Fund: Trustee since 2011. |
| | ** | Includes prior service as a Director/Trustee of certain predecessor entities to MainStay Funds Trust. |
| | *** | Includes prior service as a Director of MainStay VP Series Fund, Inc., the predecessor to MainStay VP Funds Trust. |
| | |
| 34 | | MainStay MacKay International Equity Fund |
| | | | | | | | |
| | | | | Name and
Year of Birth | | Position(s) Held and
Length of Service | | Principal Occupation(s)
During Past Five Years |
Officers
of the
Trust
(Who are
not
Trustees)* | | | | Kirk C. Lehneis 1974 | | President, MainStay Funds, MainStay Funds Trust (since 2017) | | Chief Operating Officer and Senior Managing Director (since 2016), New York Life Investment Management LLC; Chairman of the Board (since 2017), NYLIFE Distributors LLC; Chairman of the Board, NYLIM Service Company LLC (since 2017); Trustee, President and Principal Executive Officer of IndexIQ Trust, IndexIQ ETF Trust and IndexIQ Active ETF Trust (since January 2018); President, MainStay MacKay DefinedTerm Municipal Opportunities Fund and MainStay VP Funds Trust
(since 2017)**; Senior Managing Director, Global Product Development (2015 to 2016); Managing Director, Product Development (2010 to 2015), New York Life Investment Management LLC |
| | | | Jack R. Benintende 1964 | | Treasurer and Principal Financial and Accounting Officer, MainStay Funds (since 2007), MainStay Funds Trust (since 2009) | | Managing Director, New York Life Investment Management LLC (since 2007); Treasurer and Principal Financial and Accounting Officer, MainStay MacKay DefinedTerm Municipal Opportunities Fund (since 2011) and MainStay VP Funds Trust (since 2007)**; and Assistant Treasurer, New York Life Investment Management Holdings LLC (2008 to 2012) |
| | | | Kevin M. Bopp 1969 | | Vice President and Chief Compliance Officer, MainStay Funds and MainStay Funds Trust (since 2014) | | Chief Compliance Officer, New York Life Investment Management LLC, IndexIQ Trust, IndexIQ ETF Trust and IndexIQ Active ETF Trust (since 2016), Director and Associate General Counsel (2011 to 2014) and Vice President and Assistant General Counsel (2010 to 2011), New York Life Investment Management LLC; Vice President and Chief Compliance Officer, MainStay VP Funds Trust, MainStay MacKay DefinedTerm Municipal Opportunities Fund (since 2014); Assistant Secretary, MainStay Funds, MainStay Funds Trust and MainStay VP Funds Trust (2010 to 2014)**, MainStay MacKay DefinedTerm Municipal Opportunities Fund (2011 to 2014) |
| | | | J. Kevin Gao 1967 | | Secretary and Chief Legal Officer, MainStay Funds and MainStay Funds Trust (since 2010) | | Managing Director and Associate General Counsel, New York Life Investment Management LLC (since 2010); Secretary and Chief Legal Officer, MainStay MacKay DefinedTerm Municipal Opportunities Fund (since 2011) and MainStay VP Funds Trust (since 2010)** |
| | | | Scott T. Harrington 1959 | | Vice President—Administration, MainStay Funds (since 2005), MainStay Funds Trust (since 2009) | | Managing Director, New York Life Investment Management LLC (including predecessor advisory organizations) (since 2000); Member of the Board of Directors, New York Life Trust Company (since 2009); Vice President—Administration, MainStay MacKay DefinedTerm Municipal Opportunities Fund (since 2011) and MainStay VP Funds Trust (since 2005)** |
| | * | The officers listed above are considered to be “interested persons” of the MainStay Group of Funds, MainStay VP Funds Trust and MainStay MacKay Defined Term Municipal Opportunities Fund within the meaning of the 1940 Act because of their affiliation with the MainStay Group of Funds, New York Life Insurance Company and/or its affiliates, including New York Life Investment Management LLC, NYLIM Service Company LLC, NYLIFE Securities LLC and/or NYLIFE Distributors LLC, as described in detail in the column captioned “Principal Occupation(s) During Past Five Years.” Officers are elected annually by the Board. |
| | ** | Includes prior service as an Officer of MainStay VP Series Fund, Inc., the predecessor to MainStay VP Funds Trust. |
MainStay Funds
Equity
U.S. Equity
MainStay Epoch U.S. All Cap Fund
MainStay Epoch U.S. Equity Yield Fund
MainStay Large Cap Growth Fund
MainStay MacKay Common Stock Fund
MainStay MacKay Growth Fund
MainStay MacKay S&P 500 Index Fund
MainStay MacKay Small Cap Core Fund1
MainStay MacKay U.S. Equity Opportunities Fund
MainStay MAP Equity Fund
International Equity
MainStay Epoch International Choice Fund
MainStay MacKay International Equity Fund
MainStay MacKay International Opportunities Fund
Emerging Markets Equity
MainStay Candriam Emerging Markets Equity Fund
MainStay MacKay Emerging Markets Equity Fund
Global Equity
MainStay Epoch Capital Growth Fund
MainStay Epoch Global Equity Yield Fund
Fixed Income
Taxable Income
MainStay Candriam Emerging Markets Debt Fund2
MainStay Floating Rate Fund
MainStay Indexed Bond Fund3
MainStay MacKay High Yield Corporate Bond Fund
MainStay MacKay Infrastructure Bond Fund
MainStay MacKay Short Duration High Yield Fund
MainStay MacKay Total Return Bond Fund
MainStay MacKay Unconstrained Bond Fund
Tax-Exempt Income
MainStay MacKay California Tax Free Opportunities Fund4
MainStay MacKay High Yield Municipal Bond Fund
MainStay MacKay Intermediate Tax Free Bond Fund
MainStay MacKay New York Tax Free Opportunities Fund5
MainStay MacKay Short Term Municipal Fund
MainStay MacKay Tax Free Bond Fund
Money Market
MainStay Money Market Fund
Mixed Asset
MainStay Balanced Fund
MainStay Income Builder Fund
MainStay MacKay Convertible Fund
Speciality
MainStay Cushing Energy Income Fund
MainStay Cushing MLP Premier Fund
MainStay Cushing Renaissance Advantage Fund
Asset Allocation
MainStay Conservative Allocation Fund
MainStay Growth Allocation Fund
MainStay Moderate Allocation Fund
MainStay Moderate Growth Allocation Fund
Manager
New York Life Investment Management LLC
New York, New York
Subadvisors
Candriam Belgium S.A.6
Brussels, Belgium
Candriam Luxembourg S.C.A.6
Strassen, Luxembourg
Cushing Asset Management, LP
Dallas, Texas
Epoch Investment Partners, Inc.
New York, New York
MacKay Shields LLC6
New York, New York
Markston International LLC
White Plains, New York
NYL Investors LLC6
New York, New York
Winslow Capital Management, LLC
Minneapolis, Minnesota
Legal Counsel
Dechert LLP
Washington, District of Columbia
Independent Registered Public Accounting Firm
KPMG LLP
Philadelphia, Pennsylvania
| 1. | Formerly known as MainStay Epoch U.S. Small Cap Fund. |
| 2. | Formerly known as MainStay MacKay Emerging Markets Debt Fund. |
| 3. | Effective December 5, 2019, MainStay Indexed Bond Fund was renamed MainStay Short Term Bond Fund. |
| 4. | Class A and Class I shares of this Fund are registered for sale in AZ, CA, MI, NV, OR, TX, UT and WA. Class I shares are registered for sale in CO, FL, GA, HI, ID, MA, MD, NH, NJ and NY. |
| 5. | This Fund is registered for sale in CA, CT, DE, FL, MA, NJ, NY and VT. |
| 6. | An affiliate of New York Life Investment Management LLC. |
Not part of the Annual Report
For more information
800-624-6782
nylinvestments.com/funds
“New York Life Investments” is both a service mark, and the common trade name, of the investment advisors affiliated with New York Life Insurance Company. The MainStay Funds® are managed by New York Life Investment Management LLC and distributed by NYLIFE Distributors LLC, 30 Hudson Street, Jersey City, NJ 07302, a wholly owned subsidiary of New York Life Insurance Company. NYLIFE Distributors LLC is a Member FINRA/SIPC.
©2019 NYLIFE Distributors LLC. All rights reserved.
| | |
| 1715994 MS159-19 | | MSIE11-12/19 (NYLIM) NL213 |
MainStay MacKay Common Stock Fund
Message from the President and Annual Report
October 31, 2019

Beginning on January 1, 2021, paper copies of each MainStay Fund’s annual and semiannual shareholder reports will no longer be sent by mail, unless you specifically request paper copies of the reports from MainStay Funds or from your financial intermediary. Instead, the reports will be made available on the MainStay Funds’ website. You will be notified by mail and provided with a website address to access the report each time a new report is posted to the website.
If you already elected to receive shareholder reports electronically, you will not be affected by this change and you need not take any action. At any time, you may elect to receive reports and other communications from MainStay Funds electronically by calling toll-free 800-624-6782, by sending an e-mail to MainStayShareholderServices@nylim.com, or by contacting your financial intermediary.
You may elect to receive all future shareholder reports in paper form free of charge. If you hold shares of a MainStay Fund directly, you can inform MainStay Funds that you wish to receive paper copies of reports by calling toll-free 800-624-6782 or by sending an e-mail to MainStayShareholderServices@nylim.com. If you hold shares of a MainStay Fund through a financial intermediary, please contact the financial intermediary to make this election. Your election to receive reports in paper form will apply to all MainStay Funds in which you are invested and may apply to all funds held with your financial intermediary.
| | | | | | | | |
| | | | | |
| Not FDIC/NCUA Insured | | Not a Deposit | | May Lose Value | | No Bank Guarantee | | Not Insured by Any Government Agency |

This page intentionally left blank
Message from the President
Stock and bond markets generally gained ground during the12-month reporting period ended October 31, 2019, despite concerns regarding slowing U.S. and global economic growth and international trade conflicts.
After trending higher in November 2018, U.S. stocks and bonds dipped sharply in December 2018, over concerns regarding the pace of economic growth, a U.S. government shutdown and the potential impact of trade disputes between the United States and other nations, particularly China. U.S. markets recovered quickly in 2019 as trade tensions eased, the government reopened and the U.S. Federal Reserve Board (“Fed”) adopted a more accommodative tone regarding the future direction of interest rates. A wide spectrum of equity and fixed-income sectors gained ground through April 2019. Mixed macroeconomic signals and the inability of China and the United States to reach a trade agreement caused the market’s recovery to suffer during the spring and summer months of 2019. However, accommodative monetary policies from several central banks, including a series of interest rate cuts by the Fed, along with better-than-expected corporate earnings reassured investors and enabled markets to resume their advance.
Persistent, albeit slow, U.S. economic growth underpinned the U.S. stock market’s advance during the reporting period, positioning major U.S. equity indices to reach record territory by late October 2019. Sector strength shifted as investor sentiment alternated betweenrisk-on andrisk-off positions. In general, for the reporting period, cyclical, growth-oriented stocks outperformed their value-oriented counterparts by a small margin, with the information technology sector leading thelarge-cap S&P 500® Index. However, the traditionally more defensive areas of real estate and utilities generated above-average performance as well. Communication services, consumer discretionary, industrials and consumer staples performed in the middle of the pack, while materials, financials and health care lagged. Only the energy sector suffered declines, undermined by weak oil prices and concerns about future energy demand.
In the fixed-income markets, slowing economic growth, modest inflation and the Fed’s interest rate cuts created an environment of falling yields and rising prices for most bonds, with many areas of the market offering historically low yields by the end of the reporting period. Higher-credit-quality, longer-duration securities generally produced strong returns, with investment-
grade corporates and long-term Treasury bonds delivering particularly strong performance. A similar dynamic characterized the performance of the municipal bond market, with longer-term, higher-grade issues performing relatively well. On average, municipal bonds roughly matched the gains of corporate issues while providingtax-advantaged returns for eligible investors.
International stock and bond markets tended to underperform their U.S. counterparts, constrained by lackluster economic growth in the Eurozone and dramatically slowing growth in China and related parts of Asia amid persistent trade tensions with the United States. Uncertainties surrounding the unending Brexit drama took a further toll on investor confidence, with Britain seemingly unable to resolve its internal conflicts over how, or whether, to exit from the European Union. Nevertheless, on average, international securities delivered modestly positive returns, bolstered by the accommodative monetary policies implemented by European and Asian central banks. Bonds from both emerging and developed markets generally produced stronger returns than equities while repeating the pattern of outperformance by higher-quality, longer-term instruments seen in the United States.
As the economic growth cycle lengthens, investors are left to ponder how best to position their portfolios for an uncertain future. When the yield curve inverted earlier this year prompting concerns of a potential recession, we were reminded that the direction of the economy is continually subject to change, and perceptions of the economy can shift even more rapidly. As a MainStay investor, you can rely on us to manage our Funds with unflagging energy and dedication so that you can remain focused on your long-term objectives in the face of uncertainty and change. Our goal remains to provide you with the consistently reliable financial tools you need to achieve your long-term objectives.
Sincerely,

Kirk C. Lehneis
President
The opinions expressed are as of the date of this report and are subject to change. There is no guarantee that any forecast made will come to pass. This material does not constitute investment advice and is not intended as an endorsement of any specific investment. Past performance is no guarantee of future results.
Not part of the Annual Report
Table of Contents
Investors should refer to the Fund’s Summary Prospectus and/or Prospectus and consider the Fund’s investment objectives, strategies, risks, charges and expenses carefully before investing. The Summary Prospectus and/or Prospectus contain this and other information about the Fund. You may obtain copies of the Fund’s Summary Prospectus, Prospectus and Statement of Additional Information free of charge, upon request, by calling toll-free 800-624-6782, by writing to NYLIFE Distributors LLC, Attn: MainStay Marketing Department, 30 Hudson Street, Jersey City, NJ 07302 or by sending ane-mail to MainStayShareholderServices@nylim.com. These documents are also available via the MainStay Funds’ website at nylinvestments.com/funds. Please read the Summary Prospectus and/or Prospectus carefully before investing.
Investment and Performance Comparison1(Unaudited)
Performance data quoted represents past performance. Past performance is no guarantee of future results. Because of market volatility and other factors, current performance may be lower or higher than the figures shown. Investment return and principal value will fluctuate, and as a result, when shares are redeemed, they may be worth more or less than their original cost. The graph below depicts the historical performance of Class B shares2 of the Fund. Performance will vary from class to class based on differences in class-specific expenses and sales charges. For performance information current to the most recent month-end, please call 800-624-6782 or visit nylinvestments.com/funds.
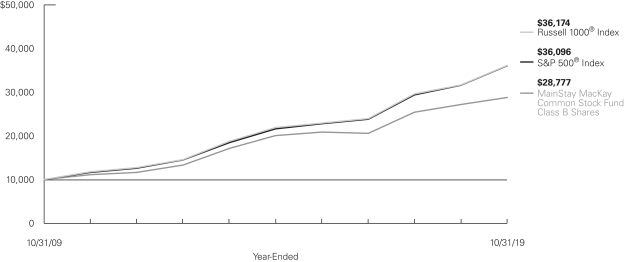
Average Annual Total Returns for the Year-Ended October 31, 2019
| | | | | | | | | | | | | | | | | | | | | | | | |
| Class | | Sales Charge | | | | Inception
Date | | | One
Year | | | Five Years
or Since
Inception | | | Ten
Years | | | Gross
Expense
Ratio3 | |
| | | | | | | |
| Class A Shares | | Maximum 5.5%
Initial Sales Charge | | With sales charges Excluding sales charges | |
| 6/1/1998
|
| |
| 0.93
6.80 | %
| |
| 7.33
8.55 | %
| |
| 11.74
12.38 | %
| |
| 0.97
0.97 | %
|
| Investor Class Shares | | Maximum 5.5%
Initial Sales Charge | | With sales charges Excluding sales charges | |
| 2/28/2008
|
| |
| 0.65
6.51 |
| |
| 7.07
8.29 |
| |
| 11.34
11.98 |
| |
| 1.23
1.23 |
|
| Class B Shares2 | | Maximum 5% CDSC
if Redeemed Within the
First Six Years of Purchase | | With sales charges Excluding sales charges | |
| 6/1/1998
|
| |
| 1.03
5.71 |
| |
| 7.19
7.49 |
| |
| 11.15
11.15 |
| |
| 1.98
1.98 |
|
| Class C Shares | | Maximum 1% CDSC
if Redeemed Within
One Year of Purchase | | With sales charges Excluding sales charges | |
| 9/1/1998
|
| |
| 4.78
5.72 |
| |
| 7.49
7.49 |
| |
| 11.14
11.14 |
| |
| 1.98
1.98 |
|
| Class I Shares | | No Sales Charge | | | | | 12/28/2004 | | | | 7.06 | | | | 8.83 | | | | 12.67 | | | | 0.71 | |
| Class R3 Shares | | No Sales Charge | | | | | 2/29/2016 | | | | 6.42 | | | | 12.39 | | | | N/A | | | | 1.32 | |
| 1. | The performance table and graph do not reflect the deduction of taxes that a shareholder would pay on distributions or Fund share redemptions. Total returns reflect maximum applicable sales charges as indicated in the table above, if any, changes in share price, and reinvestment of dividend and capital gain distributions. The graph assumes the initial investment amount shown above and reflects the deduction of all sales charges that would have applied for the period of investment. Performance figures may reflect certain fee waivers and/or expense limitations, without which total returns may have |
| | been lower. For more information on share classes and current fee waivers and/or expense limitations (if any), please refer to the Notes to Financial Statements. |
| 2. | Class B shares are closed to all new purchases as well as additional investments by existing Class B shareholders. |
| 3. | The gross expense ratios presented reflect the Fund’s “Total Annual Fund Operating Expenses” from the most recent Prospectus and may differ from other expense ratios disclosed in this report. |
The footnotes on the next page are an integral part of the table and graph and should be carefully read in conjunction with them.
| | | | | | | | | | | | |
| Benchmark Performance | | One
Year | | | Five Years | | | Ten
Years | |
| | | |
| S&P 500® Index4 | | | 14.33 | % | | | 10.78 | % | | | 13.70 | % |
Russell 1000® Index5 | | | 14.15 | | | | 10.55 | | | | 13.72 | |
Morningstar Large Blend Category Average6 | | | 12.66 | | | | 8.94 | | | | 12.22 | |
| 4. | The S&P 500® Index is the Fund’s primary broad-based securities market index for comparison purposes. “S&P 500®” is a trademark of the McGraw-Hill Companies, Inc. The S&P 500® Index is widely regarded as the standard index for measuringlarge-cap U.S. stock market performance. Results assume reinvestment of all dividends and capital gains. An investment cannot be made directly in an index. |
| 5. | The Russell 1000® Index is the Fund’s secondary benchmark. The Russell 1000® Index measures the performance of thelarge-cap segment of the U.S. equity universe. It is a subset of the Russell 3000® Index and includes approximately 1,000 of the largest companies based on a combination of their market cap and current index membership. Results assume |
| | reinvestment of all dividends and capital gains. An investment cannot be made directly in an index. |
| 6. | The Morningstar Large Blend Category Average is representative of funds that represent the overall U.S. stock market in size, growth rates and price. Stocks in the top 70% of the capitalization of the U.S. equity market are defined as large cap. The blend style is assigned to portfolios where neither growth nor value characteristics predominate. These portfolios tend to invest across the spectrum of U.S. industries, and owing to their broad exposure, the portfolios’ returns are often similar to those of the S&P 500 Index. Results are based on average total returns of similar funds with all dividends and capital gain distributions reinvested. |
The footnotes on the preceding page are an integral part of the table and graph and should be carefully read in conjunction with them.
| | |
| 6 | | MainStay MacKay Common Stock Fund |
Cost in Dollars of a $1,000 Investment in MainStay MacKay Common Stock Fund (Unaudited)
The example below is intended to describe the fees and expenses borne by shareholders during the six-month period from May 1, 2019, to October 31, 2019, and the impact of those costs on your investment.
Example
As a shareholder of the Fund you incur two types of costs: (1) transaction costs, including exchange fees and sales charges (loads) on purchases (as applicable), and (2) ongoing costs, including management fees, distribution and/or service (12b-1) fees, and other Fund expenses (as applicable). This example is intended to help you understand your ongoing costs (in dollars) of investing in the Fund and to compare these costs with the ongoing costs of investing in other mutual funds. The example is based on an investment of $1,000 made at the beginning of the six-month period and held for the entire period from May 1, 2019, to October 31, 2019.
This example illustrates your Fund’s ongoing costs in two ways:
Actual Expenses
The second and third data columns in the table below provide information about actual account values and actual expenses. You may use the information in these columns, together with the amount you invested, to estimate the expenses that you paid during the six months ended October 31, 2019. Simply divide your account value by $1,000 (for example, an $8,600 account value divided by $1,000 = 8.6), then
multiply the result by the number under the heading entitled “Expenses Paid During Period” to estimate the expenses you paid on your account during this period.
Hypothetical Example for Comparison Purposes
The fourth and fifth data columns in the table below provide information about hypothetical account values and hypothetical expenses based on the Fund’s actual expense ratio and an assumed rate of return of 5% per year before expenses, which is not the Fund’s actual return. The hypothetical account values and expenses may not be used to estimate the actual ending account balances or expenses you paid for thesix-month period shown. You may use this information to compare the ongoing costs of investing in the Fund with the ongoing costs of investing in other mutual funds. To do so, compare this 5% hypothetical example with the 5% hypothetical examples that appear in the shareholder reports of the other mutual funds.
Please note that the expenses shown in the table are meant to highlight your ongoing costs only and do not reflect any transactional costs, such as exchange fees or sales charges (loads). Therefore, the fourth and fifth data columns of the table are useful in comparing ongoing costs only and will not help you determine the relative total costs of owning different funds. In addition, if these transactional costs were included, your costs would have been higher.
| | | | | | | | | | | | | | | | | | | | | | |
| | | | | | | | | | | | | | | | | | |
| Share Class | | Beginning
Account
Value
5/1/19 | | | Ending Account
Value (Based
on Actual
Returns and
Expenses)
10/31/19 | | | Expenses
Paid
During
Period1 | | | Ending Account
Value (Based
on Hypothetical
5% Annualized
Return and
Actual Expenses)
10/31/19 | | | Expenses
Paid
During
Period1 | | | Net Expense
Ratio
During
Period2 |
| | | | | | |
| Class A Shares | | $ | 1,000.00 | | | $ | 1,016.30 | | | $ | 4.98 | | | $ | 1,020.27 | | | $ | 4.99 | | | 0.98% |
| | | | | | |
| Investor Class Shares | | $ | 1,000.00 | | | $ | 1,015.10 | | | $ | 6.25 | | | $ | 1,019.00 | | | $ | 6.26 | | | 1.23% |
| | | | | | |
| Class B Shares | | $ | 1,000.00 | | | $ | 1,011.20 | | | $ | 10.04 | | | $ | 1,015.22 | | | $ | 10.06 | | | 1.98% |
| | | | | | |
| Class C Shares | | $ | 1,000.00 | | | $ | 1,011.20 | | | $ | 10.04 | | | $ | 1,015.22 | | | $ | 10.06 | | | 1.98% |
| | | | | | |
| Class I Shares | | $ | 1,000.00 | | | $ | 1,017.50 | | | $ | 3.71 | | | $ | 1,021.53 | | | $ | 3.72 | | | 0.73% |
| | | | | | |
| Class R3 Shares | | $ | 1,000.00 | | | $ | 1,014.30 | | | $ | 6.75 | | | $ | 1,018.50 | | | $ | 6.77 | | | 1.33% |
| 1. | Expenses are equal to the Fund’s annualized expense ratio of each class multiplied by the average account value over the period, divided by 365 and multiplied by 184 (to reflect the six-month period). The table above represents the actual expenses incurred during the six-month period. In addition to the fees and expenses which the Fund bears directly, it also indirectly bears a pro rata share of the fees and expenses of the underlying funds in which it invests. Such indirect expenses are not included in the above-reported expense figures. |
| 2. | Expenses are equal to the Fund’s annualized expense ratio to reflect the six-month period. |
Industry Composition as of October 31, 2019(Unaudited)
| | | | |
| |
| Software | | | 7.1 | % |
| |
| Interactive Media & Services | | | 6.3 | |
| |
| IT Services | | | 6.2 | |
| |
| Insurance | | | 5.2 | |
| |
| Internet & Direct Marketing Retail | | | 4.7 | |
| |
| Technology Hardware, Storage & Peripherals | | | 4.7 | |
| |
| Health Care Providers & Services | | | 4.4 | |
| |
| Semiconductors & Semiconductor Equipment | | | 4.4 | |
| |
| Oil, Gas & Consumable Fuels | | | 4.3 | |
| |
| Banks | | | 3.5 | |
| |
| Equity Real Estate Investment Trusts | | | 3.4 | |
| |
| Specialty Retail | | | 3.0 | |
| |
| Consumer Finance | | | 2.7 | |
| |
| Aerospace & Defense | | | 2.5 | |
| |
| Biotechnology | | | 2.3 | |
| |
| Diversified Financial Services | | | 2.3 | |
| |
| Media | | | 2.2 | |
| |
| Food & Staples Retailing | | | 2.1 | |
| |
| Health Care Equipment & Supplies | | | 2.1 | |
| |
| Household Products | | | 2.1 | |
| |
| Electronic Equipment, Instruments & Components | | | 1.9 | |
| |
| Hotels, Restaurants & Leisure | | | 1.9 | |
| |
| Pharmaceuticals | | | 1.7 | |
| |
| Exchange-Traded Fund | | | 1.6 | |
| |
| Electric Utilities | | | 1.3 | |
| |
| Entertainment | | | 1.3 | |
| |
| Professional Services | | | 1.3 | |
| | | | |
| |
| Household Durables | | | 1.2 | % |
| |
| Food Products | | | 1.1 | |
| |
| Multiline Retail | | | 1.1 | |
| |
| Independent Power & Renewable Electricity Producers | | | 1.0 | |
| |
| Multi-Utilities | | | 1.0 | |
| |
| Commercial Services & Supplies | | | 0.9 | |
| |
| Airlines | | | 0.8 | |
| |
| Diversified Telecommunication Services | | | 0.8 | |
| |
| Beverages | | | 0.7 | |
| |
| Capital Markets | | | 0.7 | |
| |
| Life Sciences Tools & Services | | | 0.7 | |
| |
| Machinery | | | 0.7 | |
| |
| Chemicals | | | 0.6 | |
| |
| Road & Rail | | | 0.4 | |
| |
| Building Products | | | 0.3 | |
| |
| Tobacco | | | 0.3 | |
| |
| Communications Equipment | | | 0.2 | |
| |
| Distributors | | | 0.2 | |
| |
| Energy Equipment & Services | | | 0.2 | |
| |
| Metals & Mining | | | 0.2 | |
| |
| Real Estate Management & Development | | | 0.2 | |
| |
| Health Care Technology | | | 0.1 | |
| |
| Textiles, Apparel & Luxury Goods | | | 0.1 | |
| |
| Short-Term Investment | | | 0.0 | ‡ |
| |
| Other Assets, Less Liabilities | | | –0.0 | ‡ |
| | | | |
| | | 100.0 | % |
| | | | |
See Portfolio of Investments beginning on page 10 for specific holdings within these categories. The Fund’s holdings are subject to change.
| ‡ | Less than one-tenth of a percent. |
Top Ten Holdings as of October 31, 2019(excludingshort-term investment) (Unaudited)
| 5. | Facebook, Inc., Class A |
| 6. | Berkshire Hathaway, Inc., Class B |
| | |
| 8 | | MainStay MacKay Common Stock Fund |
Portfolio Management Discussion and Analysis(Unaudited)
Questions answered by Migene Kim, CFA, and Mona Patni of MacKay Shields LLC, the Fund’s Subadvisor.
How did MainStay MacKay Common Stock Fund perform relative to its benchmarks and peer group during the 12 months ended October 31, 2019?
For the 12 months ended October 31, 2019, Class I shares of MainStay MacKay Common Stock Fund returned 7.06%, underperforming the 14.33% return of the Fund’s primary benchmark, the S&P 500® Index, and the 14.15% return of the Fund’s secondary benchmark, the Russell 1000® Index. Over the same period, Class I shares also underperformed the 12.66% return of the Morningstar Large Blend Category Average.1
Were there any changes to the Fund during the reporting period?
Effective December 18, 2018, Andrew Ver Planck no longer served as a portfolio manager of the Fund. Migene Kim and Mona Patni continue to serve as portfolio managers of the Fund. For more information about this change refer to the supplement dated December 18, 2018.
What factors affected the Fund’s relative performance during the reporting period?
During the reporting period, the Fund underperformed the S&P 500® Index due to stock selection. U.S. equities underwent a steep sell-off during the fourth quarter of 2018 before sharply rebounding during the final week of the year. The year-end rally continued throughout 2019, interrupted by several trade-war related selloffs, most notably in May and August. As a result, domestic equity markets were subject to risk-on and risk-off episodes, frequently trading from one headline to another. Market leadership also proved narrow. Growth-style investing significantly dominated value-style investing during the reporting period. Elevated macro-driven volatility, lack of market breadth and consistency, and the sustained outperformance of the richly valued growth segment of the market provided us with a challenging investment climate for stock selection. Markets did not reward valuation, as cheap stocks got cheaper. Trend-following approaches held up better, but were difficult to capture in the narrow and volatile market environment that prevailed.
During the reporting period, which sectors were the strongest positive contributors to the Fund’s relative performance, and which sectors were particularly weak?
During the reporting period, the weakest contributions to relative performance came from the consumer discretionary, health care and information technology sectors. (Contributions take
weightings and total returns into account.) During the same period, the industrials and consumer staples sectors provided stronger contributions to the Fund’s performance than other sectors, but still detracted from performance relative to the S&P 500® Index.
During the reporting period, which individual stocks made the strongest positive contributions to the Fund’s absolute performance and which stocks detracted the most?
The individual stocks that made the strongest positive contributions to the Fund’s absolute performance during the reporting period included systems software developer Microsoft, household products maker Procter & Gamble, and interactive media & services platform Facebook. The stocks that detracted the most from the Fund’s absolute performance included drug retailer Walgreens Boots Alliance, department store retailer Nordstrom and integrated oil & gas company Exxon Mobil.
What were some of the Fund’s largest purchases and sales during the reporting period?
During the reporting period, the Fund’s largest initial purchase was in semiconductor & telecommunications company QUALCOMM, while its largest increased purchase was in Microsoft, mentioned above. During the same period, the Fund sold its full position in diversified financial services firm Citigroup, while its most significantly reduced position size was Exxon Mobil, also mentioned above.
How did the Fund’s sector weightings change during the reporting period?
The Fund’s largest increases in sector exposures relative to the S&P 500® Index were in the financials and real estate sectors. Conversely, the Fund’s largest decreases in benchmark-relative sector exposures were in the health care and energy sectors.
How was the Fund positioned at the end of the reporting period?
Relative to the S&P 500® Index, the Fund ended the reporting period with its largest overweight exposures to the information technology and consumer discretionary sectors, and most underweight exposures to the health care and industrials sectors.
| 1. | See page 5 for other share class returns, which may be higher or lower than Class I share returns. See page 6 for more information on benchmark and peer group returns. |
The opinions expressed are those of the portfolio managers as of the date of this report and are subject to change. There is no guarantee that any forecasts will come to pass. This material does not constitute investment advice and is not intended as an endorsement of any specific investment.
Portfolio of InvestmentsOctober 31, 2019
| | | | | | | | |
| | |
| | | Shares | | | Value | |
| Common Stocks 98.4%† | |
Aerospace & Defense 2.5% | |
Boeing Co. | | | 921 | | | $ | 313,057 | |
Curtiss-Wright Corp. | | | 4,296 | | | | 581,034 | |
L3Harris Technologies, Inc. | | | 1,975 | | | | 407,462 | |
Lockheed Martin Corp. | | | 5,208 | | | | 1,961,750 | |
Northrop Grumman Corp. | | | 4,362 | | | | 1,537,518 | |
| | | | | | | | |
| | | | | | | 4,800,821 | |
| | | | | | | | |
Airlines 0.8% | |
Delta Air Lines, Inc. | | | 13,156 | | | | 724,632 | |
Southwest Airlines Co. | | | 9,545 | | | | 535,761 | |
United Airlines Holdings, Inc. (a) | | | 3,577 | | | | 324,935 | |
| | | | | | | | |
| | | | | | | 1,585,328 | |
| | | | | | | | |
Banks 3.5% | |
Bank of America Corp. | | | 83,782 | | | | 2,619,863 | |
East West Bancorp, Inc. | | | 4,583 | | | | 196,702 | |
JPMorgan Chase & Co. | | | 25,839 | | | | 3,227,808 | |
Signature Bank | | | 3,582 | | | | 423,822 | |
Wells Fargo & Co. | | | 6,044 | | | | 312,052 | |
| | | | | | | | |
| | | | | | | 6,780,247 | |
| | | | | | | | |
Beverages 0.7% | |
Coca-Cola Co. | | | 19,175 | | | | 1,043,695 | |
PepsiCo., Inc. | | | 3,027 | | | | 415,214 | |
| | | | | | | | |
| | | | | | | 1,458,909 | |
| | | | | | | | |
Biotechnology 2.3% | |
AbbVie, Inc. | | | 8,463 | | | | 673,232 | |
Amgen, Inc. | | | 3,280 | | | | 699,460 | |
Biogen, Inc. (a) | | | 3,613 | | | | 1,079,239 | |
Gilead Sciences, Inc. | | | 28,676 | | | | 1,826,948 | |
Incyte Corp. (a) | | | 2,886 | | | | 242,193 | |
| | | | | | | | |
| | | | | | | 4,521,072 | |
| | | | | | | | |
Building Products 0.3% | |
Johnson Controls International PLC | | | 3,177 | | | | 137,659 | |
Masco Corp. | | | 7,547 | | | | 349,049 | |
| | | | | | | | |
| | | | | | | 486,708 | |
| | | | | | | | |
Capital Markets 0.7% | |
Ameriprise Financial, Inc. | | | 2,362 | | | | 356,402 | |
Intercontinental Exchange, Inc. | | | 10,752 | | | | 1,014,129 | |
| | | | | | | | |
| | | | | | | 1,370,531 | |
| | | | | | | | |
Chemicals 0.6% | |
Dow, Inc. | | | 5,649 | | | | 285,218 | |
DuPont de Nemours, Inc. | | | 5,694 | | | | 375,291 | |
Ecolab, Inc. | | | 1,068 | | | | 205,131 | |
Sherwin-Williams Co. | | | 591 | | | | 338,241 | |
| | | | | | | | |
| | | | | | | 1,203,881 | |
| | | | | | | | |
Commercial Services & Supplies 0.9% | |
Clean Harbors, Inc. (a) | | | 6,024 | | | | 496,739 | |
| | | | | | | | |
| | |
| | | Shares | | | Value | |
Commercial Services & Supplies (continued) | |
Republic Services, Inc. | | | 8,455 | | | $ | 739,897 | |
Waste Management, Inc. | | | 4,210 | | | | 472,404 | |
| | | | | | | | |
| | | | | | | 1,709,040 | |
| | | | | | | | |
Communications Equipment 0.2% | |
Cisco Systems, Inc. | | | 9,138 | | | | 434,146 | |
| | | | | | | | |
|
Consumer Finance 2.7% | |
American Express Co. | | | 13,201 | | | | 1,548,213 | |
Capital One Financial Corp. | | | 12,402 | | | | 1,156,487 | |
Discover Financial Services | | | 14,619 | | | | 1,173,321 | |
Synchrony Financial | | | 40,016 | | | | 1,415,366 | |
| | | | | | | | |
| | | | | | | 5,293,387 | |
| | | | | | | | |
Distributors 0.2% | |
LKQ Corp. (a) | | | 12,854 | | | | 436,907 | |
| | | | | | | | |
|
Diversified Financial Services 2.3% | |
Berkshire Hathaway, Inc., Class B (a) | | | 20,829 | | | | 4,427,829 | |
| | | | | | | | |
|
Diversified Telecommunication Services 0.8% | |
AT&T, Inc. | | | 23,385 | | | | 900,089 | |
Verizon Communications, Inc. | | | 11,170 | | | | 675,450 | |
| | | | | | | | |
| | | | | | | 1,575,539 | |
| | | | | | | | |
Electric Utilities 1.3% | |
ALLETE, Inc. | | | 400 | | | | 34,424 | |
American Electric Power Co., Inc. | | | 2,457 | | | | 231,916 | |
Duke Energy Corp. | | | 2,492 | | | | 234,896 | |
Entergy Corp. | | | 6,174 | | | | 750,017 | |
Exelon Corp. | | | 7,046 | | | | 320,523 | |
PNM Resources, Inc. | | | 3,303 | | | | 172,251 | |
Southern Co. | | | 11,651 | | | | 730,052 | |
| | | | | | | | |
| | | | | | | 2,474,079 | |
| | | | | | | | |
Electronic Equipment, Instruments & Components 1.9% | |
Arrow Electronics, Inc. (a) | | | 15,751 | | | | 1,248,739 | |
Avnet, Inc. | | | 23,741 | | | | 939,194 | |
Jabil, Inc. | | | 33,660 | | | | 1,239,361 | |
Tech Data Corp. (a) | | | 2,009 | | | | 244,094 | |
| | | | | | | | |
| | | | | | | 3,671,388 | |
| | | | | | | | |
Energy Equipment & Services 0.2% | |
Schlumberger, Ltd. | | | 14,296 | | | | 467,336 | |
| | | | | | | | |
|
Entertainment 1.3% | |
Netflix, Inc. (a) | | | 3,338 | | | | 959,375 | |
Take-Two Interactive Software, Inc. (a) | | | 8,241 | | | | 991,804 | |
Walt Disney Co. | | | 4,243 | | | | 551,251 | |
| | | | | | | | |
| | | | | | | 2,502,430 | |
| | | | | | | | |
| | | | |
| 10 | | MainStay MacKay Common Stock Fund | | The notes to the financial statements are an integral part of,
and should be read in conjunction with, the financial statements. |
| | | | | | | | |
| | |
| | | Shares | | | Value | |
| Common Stocks (continued) | |
Equity Real Estate Investment Trusts 3.4% | |
American Campus Communities, Inc. | | | 4,184 | | | $ | 209,116 | |
American Tower Corp. | | | 4,625 | | | | 1,008,620 | |
Apartment Investment & Management Co., Class A | | | 11,512 | | | | 631,779 | |
Crown Castle International Corp. | | | 1,178 | | | | 163,495 | |
Equinix, Inc. | | | 152 | | | | 86,151 | |
Equity Residential | | | 975 | | | | 86,443 | |
Host Hotels & Resorts, Inc. | | | 59,395 | | | | 973,484 | |
Mid-America Apartment Communities, Inc. | | | 4,499 | | | | 625,316 | |
Prologis, Inc. | | | 5,439 | | | | 477,327 | |
Public Storage | | | 2,318 | | | | 516,589 | |
Sabra Health Care REIT, Inc. | | | 236 | | | | 5,806 | |
SBA Communications Corp. | | | 1,823 | | | | 438,705 | |
Simon Property Group, Inc. | | | 578 | | | | 87,093 | |
Ventas, Inc. | | | 15,441 | | | | 1,005,209 | |
Welltower, Inc. | | | 3,015 | | | | 273,430 | |
| | | | | | | | |
| | | | | | | 6,588,563 | |
| | | | | | | | |
Food & Staples Retailing 2.1% | |
Costco Wholesale Corp. | | | 1,579 | | | | 469,137 | |
Sysco Corp. | | | 19,503 | | | | 1,557,705 | |
Walmart, Inc. | | | 17,393 | | | | 2,039,503 | |
| | | | | | | | |
| | | | | | | 4,066,345 | |
| | | | | | | | |
Food Products 1.1% | |
General Mills, Inc. | | | 124 | | | | 6,307 | |
Hershey Co. | | | 5,882 | | | | 863,889 | |
Tyson Foods, Inc., Class A | | | 15,127 | | | | 1,252,364 | |
| | | | | | | | |
| | | | | | | 2,122,560 | |
| | | | | | | | |
Health Care Equipment & Supplies 2.1% | |
Abbott Laboratories | | | 9,576 | | | | 800,649 | |
Danaher Corp. | | | 8,368 | | | | 1,153,278 | |
Hill-Rom Holdings, Inc. | | | 3,634 | | | | 380,443 | |
Hologic, Inc. (a) | | | 16,676 | | | | 805,618 | |
Intuitive Surgical, Inc. (a) | | | 880 | | | | 486,596 | |
Medtronic PLC | | | 4,530 | | | | 493,317 | |
| | | | | | | | |
| | | | | | | 4,119,901 | |
| | | | | | | | |
Health Care Providers & Services 4.4% | |
AmerisourceBergen Corp. | | | 15,463 | | | | 1,320,231 | |
Anthem, Inc. | | | 6,629 | | | | 1,783,731 | |
Cardinal Health, Inc. | | | 9,364 | | | | 463,050 | |
Centene Corp. (a) | | | 13,819 | | | | 733,513 | |
HCA Healthcare, Inc. | | | 4,699 | | | | 627,504 | |
McKesson Corp. | | | 9,818 | | | | 1,305,794 | |
UnitedHealth Group, Inc. | | | 9,029 | | | | 2,281,628 | |
| | | | | | | | |
| | | | | | | 8,515,451 | |
| | | | | | | | |
Health Care Technology 0.1% | |
Cerner Corp. | | | 2,072 | | | | 139,073 | |
| | | | | | | | |
| | | | | | | | |
| | |
| | | Shares | | | Value | |
Hotels, Restaurants & Leisure 1.9% | |
Darden Restaurants, Inc. | | | 282 | | | $ | 31,660 | |
McDonald’s Corp. | | | 5,795 | | | | 1,139,877 | |
MGM Resorts International | | | 3,208 | | | | 91,428 | |
Norwegian Cruise Line Holdings, Ltd. (a) | | | 7,691 | | | | 390,395 | |
Starbucks Corp. | | | 23,651 | | | | 1,999,929 | |
Yum! Brands, Inc. | | | 275 | | | | 27,970 | |
| | | | | | | | |
| | | | | | | 3,681,259 | |
| | | | | | | | |
Household Durables 1.2% | |
NVR, Inc. (a) | | | 198 | | | | 720,045 | |
PulteGroup, Inc. | | | 34,390 | | | | 1,349,463 | |
Toll Brothers, Inc. | | | 8,475 | | | | 337,051 | |
| | | | | | | | |
| | | | | | | 2,406,559 | |
| | | | | | | | |
Household Products 2.1% | |
Kimberly-Clark Corp. | | | 3,413 | | | | 453,520 | |
Procter & Gamble Co. | | | 29,502 | | | | 3,673,294 | |
| | | | | | | | |
| | | | | | | 4,126,814 | |
| | | | | | | | |
Independent Power & Renewable Electricity Producers 1.0% | |
AES Corp. | | | 74,660 | | | | 1,272,953 | |
NRG Energy, Inc. | | | 16,811 | | | | 674,457 | |
| | | | | | | | |
| | | | | | | 1,947,410 | |
| | | | | | | | |
Insurance 5.2% | |
Allstate Corp. | | | 12,976 | | | | 1,380,906 | |
American International Group, Inc. | | | 29,353 | | | | 1,554,535 | |
Brighthouse Financial, Inc. (a) | | | 15,152 | | | | 572,139 | |
Everest Re Group, Ltd. | | | 684 | | | | 175,850 | |
First American Financial Corp. | | | 14,497 | | | | 895,625 | |
MetLife, Inc. | | | 32,684 | | | | 1,529,284 | |
Old Republic International Corp. | | | 38,019 | | | | 849,344 | |
Progressive Corp. | | | 20,359 | | | | 1,419,022 | |
Prudential Financial, Inc. | | | 8,541 | | | | 778,427 | |
Reinsurance Group of America, Inc. | | | 2,923 | | | | 474,900 | |
Travelers Cos., Inc. | | | 3,677 | | | | 481,908 | |
| | | | | | | | |
| | | | | | | 10,111,940 | |
| | | | | | | | |
Interactive Media & Services 6.3% | |
Alphabet, Inc. (a) | | | | | | | | |
Class A | | | 2,748 | | | | 3,459,182 | |
Class C | | | 2,839 | | | | 3,577,452 | |
Facebook, Inc., Class A (a) | | | 24,892 | | | | 4,770,552 | |
Twitter, Inc. (a) | | | 15,478 | | | | 463,876 | |
| | | | | | | | |
| | | | | | | 12,271,062 | |
| | | | | | | | |
Internet & Direct Marketing Retail 4.7% | |
Amazon.com, Inc. (a) | | | 3,612 | | | | 6,417,296 | |
eBay, Inc. | | | 37,580 | | | | 1,324,695 | |
Expedia Group, Inc. | | | 10,156 | | | | 1,387,919 | |
| | | | | | | | |
| | | | | | | 9,129,910 | |
| | | | | | | | |
IT Services 6.2% | |
Accenture PLC, Class A | | | 1,035 | | | | 191,910 | |
Akamai Technologies, Inc. (a) | | | 13,880 | | | | 1,200,620 | |
| | | | | | |
The notes to the financial statements are an integral part of,
and should be read in conjunction with, the financial statements. | | | | | 11 | |
Portfolio of InvestmentsOctober 31, 2019 (continued)
| | | | | | | | |
| | |
| | | Shares | | | Value | |
| Common Stocks (continued) | |
IT Services (continued) | |
CACI International, Inc., Class A (a) | | | 5,070 | | | $ | 1,134,412 | |
DXC Technology Co. | | | 15,663 | | | | 433,395 | |
Leidos Holdings, Inc. | | | 16,364 | | | | 1,411,068 | |
Mastercard, Inc., Class A | | | 6,817 | | | | 1,887,014 | |
MAXIMUS, Inc. | | | 15,130 | | | | 1,161,076 | |
PayPal Holdings, Inc. (a) | | | 21,196 | | | | 2,206,503 | |
Visa, Inc., Class A | | | 13,181 | | | | 2,357,554 | |
| | | | | | | | |
| | | | | | | 11,983,552 | |
| | | | | | | | |
Life Sciences Tools & Services 0.7% | |
Illumina, Inc. (a) | | | 1,123 | | | | 331,869 | |
IQVIA Holdings, Inc. (a) | | | 5,188 | | | | 749,251 | |
Thermo Fisher Scientific, Inc. | | | 1,123 | | | | 339,123 | |
| | | | | | | | |
| | | | | | | 1,420,243 | |
| | | | | | | | |
Machinery 0.7% | |
Cummins, Inc. | | | 8,433 | | | | 1,454,524 | |
| | | | | | | | |
|
Media 2.2% | |
Charter Communications, Inc., Class A (a) | | | 2,440 | | | | 1,141,579 | |
Comcast Corp., Class A | | | 61,509 | | | | 2,756,833 | |
News Corp. | | | | | | | | |
Class A | | | 10,807 | | | | 148,164 | |
Class B | | | 22,466 | | | | 317,220 | |
| | | | | | | | |
| | | | | | | 4,363,796 | |
| | | | | | | | |
Metals & Mining 0.2% | |
Steel Dynamics, Inc. | | | 12,635 | | | | 383,599 | |
| | | | | | | | |
|
Multi-Utilities 1.0% | |
CenterPoint Energy, Inc. | | | 43,431 | | | | 1,262,539 | |
Consolidated Edison, Inc. | | | 1,888 | | | | 174,111 | |
DTE Energy Co. | | | 4,371 | | | | 556,516 | |
| | | | | | | | |
| | | | | | | 1,993,166 | |
| | | | | | | | |
Multiline Retail 1.1% | |
Dollar General Corp. | | | 3,882 | | | | 622,440 | |
Target Corp. | | | 14,806 | | | | 1,582,909 | |
| | | | | | | | |
| | | | | | | 2,205,349 | |
| | | | | | | | |
Oil, Gas & Consumable Fuels 4.3% | |
Chevron Corp. | | | 25,108 | | | | 2,916,043 | |
ConocoPhillips | | | 30,623 | | | | 1,690,390 | |
Exxon Mobil Corp. | | | 14,281 | | | | 964,967 | |
HollyFrontier Corp. | | | 23,564 | | | | 1,294,606 | |
Valero Energy Corp. | | | 15,701 | | | | 1,522,683 | |
| | | | | | | | |
| | | | | | | 8,388,689 | |
| | | | | | | | |
Pharmaceuticals 1.7% | |
Johnson & Johnson | | | 11,574 | | | | 1,528,231 | |
Merck & Co., Inc. | | | 14,622 | | | | 1,267,143 | |
Mylan N.V. (a) | | | 7,327 | | | | 140,312 | |
Pfizer, Inc. | | | 8,260 | | | | 316,936 | |
| | | | | | | | |
| | | | | | | 3,252,622 | |
| | | | | | | | |
| | | | | | | | |
| | |
| | | Shares | | | Value | |
Professional Services 1.3% | |
ManpowerGroup, Inc. | | | 13,836 | | | $ | 1,257,969 | |
Nielsen Holdings PLC | | | 61,813 | | | | 1,246,150 | |
| | | | | | | | |
| | | | | | | 2,504,119 | |
| | | | | | | | |
Real Estate Management & Development 0.2% | |
CBRE Group, Inc., Class A (a) | | | 6,971 | | | | 373,297 | |
| | | | | | | | |
|
Road & Rail 0.4% | |
Union Pacific Corp. | | | 4,277 | | | | 707,672 | |
| | | | | | | | |
|
Semiconductors & Semiconductor Equipment 4.4% | |
Applied Materials, Inc. | | | 15,269 | | | | 828,496 | |
Broadcom, Inc. | | | 7,320 | | | | 2,143,662 | |
Intel Corp. | | | 10,055 | | | | 568,409 | |
Micron Technology, Inc. (a) | | | 35,831 | | | | 1,703,764 | |
NVIDIA Corp. | | | 1,487 | | | | 298,917 | |
Qorvo, Inc. (a) | | | 3,315 | | | | 268,051 | |
QUALCOMM, Inc. | | | 24,952 | | | | 2,007,139 | |
Texas Instruments, Inc. | | | 6,754 | | | | 796,904 | |
| | | | | | | | |
| | | | | | | 8,615,342 | |
| | | | | | | | |
Software 7.1% | |
Adobe, Inc. (a) | | | 821 | | | | 228,181 | |
Cadence Design Systems, Inc. (a) | | | 11,608 | | | | 758,583 | |
CDK Global, Inc. | | | 13,428 | | | | 678,651 | |
Intuit, Inc. | | | 18 | | | | 4,635 | |
j2 Global, Inc. | | | 1,062 | | | | 100,848 | |
Microsoft Corp. | | | 67,239 | | | | 9,640,055 | |
NortonLifeLock, Inc. | | | 58,061 | | | | 1,328,436 | |
Salesforce.com, Inc. (a) | | | 6,699 | | | | 1,048,326 | |
| | | | | | | | |
| | | | | | | 13,787,715 | |
| | | | | | | | |
Specialty Retail 3.0% | |
Aaron’s, Inc. | | | 16,739 | | | | 1,254,253 | |
AutoZone, Inc. (a) | | | 1,303 | | | | 1,491,127 | |
Best Buy Co., Inc. | | | 15,626 | | | | 1,122,416 | |
Home Depot, Inc. | | | 8,561 | | | | 2,008,239 | |
| | | | | | | | |
| | | | | | | 5,876,035 | |
| | | | | | | | |
Technology Hardware, Storage & Peripherals 4.7% | |
Apple, Inc. | | | 32,883 | | | | 8,179,975 | |
HP, Inc. | | | 58,899 | | | | 1,023,076 | |
| | | | | | | | |
| | | | | | | 9,203,051 | |
| | | | | | | | |
Textiles, Apparel & Luxury Goods 0.1% | |
NIKE, Inc., Class B | | | 2,064 | | | | 184,831 | |
Skechers U.S.A., Inc., Class A (a) | | | 1,389 | | | | 51,907 | |
| | | | | | | | |
| | | | | | | 236,738 | |
| | | | | | | | |
Tobacco 0.3% | |
Altria Group, Inc. | | | 10,521 | | | | 471,235 | |
Philip Morris International, Inc. | | | 1,681 | | | | 136,902 | |
| | | | | | | | |
| | | | | | | 608,137 | |
| | | | | | | | |
Total Common Stocks
(Cost $172,361,052) | | | | | | | 191,784,071 | |
| | | | | | | | |
| | | | |
| 12 | | MainStay MacKay Common Stock Fund | | The notes to the financial statements are an integral part of,
and should be read in conjunction with, the financial statements. |
| | | | | | | | |
| | |
| | | Shares | | | Value | |
| Exchange-Traded Fund 1.6% | |
SPDR S&P 500 ETF Trust | | | 10,037 | | | $ | 3,044,523 | |
| | | | | | | | |
Total Exchange-Traded Fund
(Cost $2,917,030) | | | | | | | 3,044,523 | |
| | | | | | | | |
|
| Short-Term Investment 0.0%‡ | |
Affiliated Investment Company 0.0%‡ | |
MainStay U.S. Government Liquidity Fund, 1.76% (b) | | | 30,055 | | | | 30,054 | |
| | | | | | | | |
TotalShort-Term Investment
(Cost $30,054) | | | | | | | 30,054 | |
| | | | | | | | |
Total Investments
(Cost $175,308,136) | | | 100.0 | % | | | 194,858,648 | |
Other Assets, Less Liabilities | | | (0.0 | )‡ | | | (47,363 | ) |
Net Assets | | | 100.0 | % | | $ | 194,811,285 | |
| † | Percentages indicated are based on Fund net assets. |
| ‡ | Less than one-tenth of a percent. |
| (a) | Non-income producing security. |
| (b) | Current yield as of October 31, 2019. |
The following abbreviations are used in the preceding pages:
ETF—Exchange-Traded Fund
SPDR—Standard & Poor’s Depositary Receipt
The following is a summary of the fair valuations according to the inputs used as of October 31, 2019, for valuing the Fund’s assets:
| | | | | | | | | | | | | | | | |
Description | | Quoted
Prices in
Active
Markets for
Identical
Assets
(Level 1) | | | Significant
Other
Observable
Inputs
(Level 2) | | | Significant
Unobservable
Inputs
(Level 3) | | | Total | |
| | | | |
Asset Valuation Inputs | | | | | | | | | | | | | | | | |
| Investments in Securities (a) | | | | | | | | | | | | | | | | |
| Common Stocks | | $ | 191,784,071 | | | $ | — | | | $ | — | | | $ | 191,784,071 | |
| Exchange-Traded Fund | | | 3,044,523 | | | | — | | | | — | | | | 3,044,523 | |
| Short-Term Investment | | | | | | | | | | | | | | | | |
Affiliated Investment Company | | | 30,054 | | | | — | | | | — | | | | 30,054 | |
| | | | | | | | | | | | | | | | |
| Total Investments in Securities | | $ | 194,858,648 | | | $ | — | | | $ | — | | | $ | 194,858,648 | |
| | | | | | | | | | | | | | | | |
| (a) | For a complete listing of investments and their industries, see the Portfolio of Investments. |
| | | | | | |
The notes to the financial statements are an integral part of,
and should be read in conjunction with, the financial statements. | | | | | 13 | |
Statement of Assets and Liabilitiesas of October 31, 2019
| | | | |
| Assets | | | | |
Investment in securities, at value (identified cost $175,278,082) | | $ | 194,828,594 | |
Investment in affiliated investment company, at value (identified cost $30,054) | | | 30,054 | |
Receivables: | | | | |
Dividends | | | 116,084 | |
Fund shares sold | | | 11,819 | |
Other assets | | | 33,169 | |
| | | | |
Total assets | | | 195,019,720 | |
| | | | |
| |
| Liabilities | | | | |
Due to custodian | | | 361 | |
Payables: | | | | |
Manager (See Note 3) | | | 89,520 | |
Transfer agent (See Note 3) | | | 30,351 | |
NYLIFE Distributors (See Note 3) | | | 30,262 | |
Professional fees | | | 15,601 | |
Fund shares redeemed | | | 14,733 | |
Custodian | | | 11,463 | |
Shareholder communication | | | 10,390 | |
Trustees | | | 346 | |
Accrued expenses | | | 5,408 | |
| | | | |
Total liabilities | | | 208,435 | |
| | | | |
Net assets | | $ | 194,811,285 | |
| | | | |
| |
| Composition of Net Assets | | | | |
Shares of beneficial interest outstanding (par value of $.01 per share) unlimited number of shares authorized | | $ | 78,666 | |
Additional paid-in capital | | | 164,327,431 | |
| | | | |
| | | 164,406,097 | |
Total distributable earnings (loss) | | | 30,405,188 | |
| | | | |
Net assets | | $ | 194,811,285 | |
| | | | |
| | | | |
Class A | | | | |
Net assets applicable to outstanding shares | | $ | 63,814,038 | |
| | | | |
Shares of beneficial interest outstanding | | | 2,561,141 | |
| | | | |
Net asset value per share outstanding | | $ | 24.92 | |
Maximum sales charge (5.50% of offering price) | | | 1.45 | |
| | | | |
Maximum offering price per share outstanding | | $ | 26.37 | |
| | | | |
Investor Class | | | | |
Net assets applicable to outstanding shares | | $ | 17,203,075 | |
| | | | |
Shares of beneficial interest outstanding | | | 690,966 | |
| | | | |
Net asset value per share outstanding | | $ | 24.90 | |
Maximum sales charge (5.50% of offering price) | | | 1.45 | |
| | | | |
Maximum offering price per share outstanding | | $ | 26.35 | |
| | | | |
Class B | | | | |
Net assets applicable to outstanding shares | | $ | 4,718,398 | |
| | | | |
Shares of beneficial interest outstanding | | | 209,722 | |
| | | | |
Net asset value and offering price per share outstanding | | $ | 22.50 | |
| | | | |
Class C | | | | |
Net assets applicable to outstanding shares | | $ | 10,945,638 | |
| | | | |
Shares of beneficial interest outstanding | | | 486,963 | |
| | | | |
Net asset value and offering price per share outstanding | | $ | 22.48 | |
| | | | |
Class I | | | | |
Net assets applicable to outstanding shares | | $ | 97,902,999 | |
| | | | |
Shares of beneficial interest outstanding | | | 3,908,591 | |
| | | | |
Net asset value and offering price per share outstanding | | $ | 25.05 | |
| | | | |
Class R3 | | | | |
Net assets applicable to outstanding shares | | $ | 227,137 | |
| | | | |
Shares of beneficial interest outstanding | | | 9,171 | |
| | | | |
Net asset value and offering price per share outstanding | | $ | 24.77 | |
| | | | |
| | | | |
| 14 | | MainStay MacKay Common Stock Fund | | The notes to the financial statements are an integral part of,
and should be read in conjunction with, the financial statements. |
Statement of Operationsfor the year ended October 31, 2019
| | | | |
| Investment Income (Loss) | | | | |
Income | | | | |
Dividends-unaffiliated | | $ | 4,055,295 | |
Securities lending | | | 5,650 | |
Dividends-affiliated | | | 3,316 | |
Interest | | | 91 | |
Other | | | 789 | |
| | | | |
Total income | | | 4,065,141 | |
| | | | |
Expenses | | | | |
Manager (See Note 3) | | | 1,084,722 | |
Distribution/Service—Class A (See Note 3) | | | 157,334 | |
Distribution/Service—Investor Class (See Note 3) | | | 41,668 | |
Distribution/Service—Class B (See Note 3) | | | 51,666 | |
Distribution/Service—Class C (See Note 3) | | | 125,017 | |
Distribution/Service—Class R3 (See Note 3) | | | 842 | |
Transfer agent (See Note 3) | | | 189,323 | |
Registration | | | 109,519 | |
Professional fees | | | 70,574 | |
Custodian | | | 31,763 | |
Shareholder communication | | | 16,397 | |
Trustees | | | 4,931 | |
Shareholder service (See Note 3) | | | 168 | |
Miscellaneous | | | 16,619 | |
| | | | |
Total expenses before waiver/reimbursement | | | 1,900,543 | |
Expense waiver/reimbursement from Manager (See Note 3) | | | (13,526 | ) |
| | | | |
Net expenses | | | 1,887,017 | |
| | | | |
Net investment income (loss) | | | 2,178,124 | |
| | | | |
|
| Realized and Unrealized Gain (Loss) on Investments | |
Net realized gain (loss) on unaffiliated investments | | | 10,856,225 | |
Net change in unrealized appreciation (depreciation) on unaffiliated investments | | | (457,951 | ) |
| | | | |
Net realized and unrealized gain (loss) on investments | | | 10,398,274 | |
| | | | |
Net increase (decrease) in net assets resulting from operations | | $ | 12,576,398 | |
| | | | |
| | | | | | |
The notes to the financial statements are an integral part of,
and should be read in conjunction with, the financial statements. | | | | | 15 | |
Statements of Changes in Net Assets
for the years ended October 31, 2019 and October 31, 2018
| | | | | | | | |
| | | 2019 | | | 2018 | |
| Increase (Decrease) in Net Assets | |
Operations: | | | | | | | | |
Net investment income (loss) | | $ | 2,178,124 | | | $ | 1,661,304 | |
Net realized gain (loss) on investments | | | 10,856,225 | | | | 22,973,916 | |
Net change in unrealized appreciation (depreciation) on investments | | | (457,951 | ) | | | (10,553,207 | ) |
| | | | |
Net increase (decrease) in net assets resulting from operations | | | 12,576,398 | | | | 14,082,013 | |
| | | | |
Distributions to shareholders: | | | | | | | | |
Class A | | | (7,174,046 | ) | | | (504,518 | ) |
Investor Class | | | (1,811,319 | ) | | | (109,255 | ) |
Class B | | | (659,612 | ) | | | — | |
Class C | | | (1,668,996 | ) | | | — | |
Class I | | | (11,081,969 | ) | | | (1,062,640 | ) |
Class R3 | | | (14,964 | ) | | | (647 | ) |
| | | | |
Total distributions to shareholders | | | (22,410,906 | ) | | | (1,677,060 | ) |
| | | | |
Capital share transactions: | | | | | | | | |
Net proceeds from sale of shares | | | 66,241,784 | | | | 59,074,323 | |
Net asset value of shares issued to shareholders in reinvestment of distributions | | | 21,959,979 | | | | 1,632,738 | |
Cost of shares redeemed | | | (83,441,713 | ) | | | (62,972,216 | ) |
| | | | |
Increase (decrease) in net assets derived from capital share transactions | | | 4,760,050 | | | | (2,265,155 | ) |
| | | | |
Net increase (decrease) in net assets | | | (5,074,458 | ) | | | 10,139,798 | |
| | |
| Net Assets | | | | | | | | |
Beginning of year | | | 199,885,743 | | | | 189,745,945 | |
| | | | |
End of year | | $ | 194,811,285 | | | $ | 199,885,743 | |
| | | | |
| | | | |
| 16 | | MainStay MacKay Common Stock Fund | | The notes to the financial statements are an integral part of,
and should be read in conjunction with, the financial statements. |
Financial Highlightsselected per share data and ratios
| | | | | | | | | | | | | | | | | | | | |
| |
| | | Year ended October 31, | |
| | | | | |
| Class A | | 2019 | | | 2018 | | | 2017 | | | 2016 | | | 2015 | |
| | | | | |
Net asset value at beginning of year | | $ | 26.31 | | | $ | 24.56 | | | $ | 19.95 | | | $ | 20.20 | | | $ | 19.39 | |
| | | | | | | | | | | | | | | | | | | | |
| | | | | |
Net investment income (loss) (a) | | | 0.26 | | | | 0.24 | | | | 0.23 | | | | 0.25 | | | | 0.20 | |
| | | | | |
Net realized and unrealized gain (loss) on investments | | | 1.28 | | | | 1.74 | | | | 4.63 | | | | (0.28 | ) | | | 0.76 | |
| | | | | | | | | | | | | | | | | | | | |
| | | | | |
Total from investment operations | | | 1.54 | | | | 1.98 | | | | 4.86 | | | | (0.03 | ) | | | 0.96 | |
| | | | | | | | | | | | | | | | | | | | |
| | | | | |
| Less dividends and distributions: | | | | | | | | | | | | | | | | | | | | |
| | | | | |
From net investment income | | | (0.22 | ) | | | (0.23 | ) | | | (0.25 | ) | | | (0.22 | ) | | | (0.15 | ) |
| | | | | |
From net realized gain on investments | | | (2.71 | ) | | | — | | | | — | | | | — | | | | — | |
| | | | | | | | | | | | | | | | | | | | |
| | | | | |
Total dividends and distributions | | | (2.93 | ) | | | (0.23 | ) | | | (0.25 | ) | | | (0.22 | ) | | | (0.15 | ) |
| | | | | | | | | | | | | | | | | | | | |
| | | | | |
Net asset value at end of year | | $ | 24.92 | | | $ | 26.31 | | | $ | 24.56 | | | $ | 19.95 | | | $ | 20.20 | |
| | | | | | | | | | | | | | | | | | | | |
| | | | | |
Total investment return (b) | | | 6.80 | % | | | 8.07 | % | | | 24.59 | % | | | (0.13 | %) | | | 4.95 | % |
| | | | | |
| Ratios (to average net assets)/Supplemental Data: | | | | | | | | | | | | | | | | | | | | |
| | | | | |
Net investment income (loss) | | | 1.08 | % | | | 0.90 | % | | | 1.05 | % | | | 1.29 | % (c) | | | 1.01 | % |
| | | | | |
Net expenses (d) | | | 0.97 | % | | | 0.97 | % | | | 0.96 | % | | | 0.95 | % (e) | | | 0.96 | % |
| | | | | |
Portfolio turnover rate | | | 164 | % | | | 137 | % | | | 134 | % | | | 164 | % | | | 158 | % |
| | | | | |
Net assets at end of year (in 000’s) | | $ | 63,814 | | | $ | 63,956 | | | $ | 53,909 | | | $ | 42,928 | | | $ | 52,985 | |
| (a) | Per share data based on average shares outstanding during the year. |
| (b) | Total investment return is calculated exclusive of sales charges and assumes the reinvestment of dividends and distributions. For periods of less than one year, total return is not annualized. |
| (c) | Without the custody fee reimbursement, net investment income (loss) would have been 1.28%. |
| (d) | In addition to the fees and expenses which the Fund bears directly, it also indirectly bears a pro-rata share of the fees and expenses of the underlying funds in which it invests. Such indirect expenses are not included in the above expense ratios. |
| (e) | Without the custody fee reimbursement, net expenses would have been 0.96%. |
| | | | | | | | | | | | | | | | | | | | |
| |
| | | Year ended October 31, | |
| | | | | |
| Investor Class | | 2019 | | | 2018 | | | 2017 | | | 2016 | | | 2015 | |
| | | | | |
Net asset value at beginning of year | | $ | 26.29 | | | $ | 24.53 | | | $ | 19.93 | | | $ | 20.19 | | | $ | 19.38 | |
| | | | | | | | | | | | | | | | | | | | |
| | | | | |
Net investment income (loss) (a) | | | 0.20 | | | | 0.18 | | | | 0.18 | | | | 0.21 | | | | 0.16 | |
| | | | | |
Net realized and unrealized gain (loss) on investments | | | 1.27 | | | | 1.74 | | | | 4.62 | | | | (0.29 | ) | | | 0.76 | |
| | | | | | | | | | | | | | | | | | | | |
| | | | | |
Total from investment operations | | | 1.47 | | | | 1.92 | | | | 4.80 | | | | (0.08 | ) | | | 0.92 | |
| | | | | | | | | | | | | | | | | | | | |
| | | | | |
| Less dividends and distributions: | | | | | | | | | | | | | | | | | | | | |
| | | | | |
From net investment income | | | (0.15 | ) | | | (0.16 | ) | | | (0.20 | ) | | | (0.18 | ) | | | (0.11 | ) |
| | | | | |
From net realized gain on investments | | | (2.71 | ) | | | — | | | | — | | | | — | | | | — | |
| | | | | | | | | | | | | | | | | | | | |
| | | | | |
Total dividends and distributions | | | (2.86 | ) | | | (0.16 | ) | | | (0.20 | ) | | | (0.18 | ) | | | (0.11 | ) |
| | | | | | | | | | | | | | | | | | | | |
| | | | | |
Net asset value at end of year | | $ | 24.90 | | | $ | 26.29 | | | $ | 24.53 | | | $ | 19.93 | | | $ | 20.19 | |
| | | | | | | | | | | | | | | | | | | | |
| | | | | |
Total investment return (b) | | | 6.51 | % | | | 7.82 | % | | | 24.25 | % | | | (0.39 | %) | | | 4.77 | % |
| | | | | |
| Ratios (to average net assets)/Supplemental Data: | | | | | | | | | | | | | | | | | | | | |
| | | | | |
Net investment income (loss) | | | 0.82 | % | | | 0.68 | % | | | 0.83 | % | | | 1.05 | % (c) | | | 0.82 | % |
| | | | | |
Net expenses (d) | | | 1.23 | % | | | 1.21 | % | | | 1.22 | % | | | 1.20 | % (e) | | | 1.17 | % |
| | | | | |
Expenses (before waiver/reimbursement) (d) | | | 1.27 | % | | | 1.23 | % | | | 1.22 | % | | | 1.20 | % (e) | | | 1.17 | % |
| | | | | |
Portfolio turnover rate | | | 164 | % | | | 137 | % | | | 134 | % | | | 164 | % | | | 158 | % |
| | | | | |
Net assets at end of year (in 000’s) | | $ | 17,203 | | | $ | 16,580 | | | $ | 17,216 | | | $ | 21,880 | | | $ | 22,939 | |
| (a) | Per share data based on average shares outstanding during the year. |
| (b) | Total investment return is calculated exclusive of sales charges and assumes the reinvestment of dividends and distributions. For periods of less than one year, total return is not annualized. |
| (c) | Without the custody fee reimbursement, net investment income (loss) would have been 1.04%. |
| (d) | In addition to the fees and expenses which the Fund bears directly, it also indirectly bears a pro-rata share of the fees and expenses of the underlying funds in which it invests. Such indirect expenses are not included in the above expense ratios. |
| (e) | Without the custody fee reimbursement, net expenses would have been 1.21%. |
| | | | | | |
The notes to the financial statements are an integral part of,
and should be read in conjunction with, the financial statements. | | | | | 17 | |
Financial Highlightsselected per share data and ratios
| | | | | | | | | | | | | | | | | | | | |
| |
| | | Year ended October 31, | |
| | | | | |
| Class B | | 2019 | | | 2018 | | | 2017 | | | 2016 | | | 2015 | |
| | | | | |
Net asset value at beginning of year | | $ | 24.04 | | | $ | 22.46 | | | $ | 18.25 | | | $ | 18.49 | | | $ | 17.81 | |
| | | | | | | | | | | | | | | | | | | | |
| | | | | |
Net investment income (loss) (a) | | | 0.02 | | | | (0.02 | ) | | | 0.01 | | | | 0.05 | | | | 0.02 | |
| | | | | |
Net realized and unrealized gain (loss) on investments | | | 1.15 | | | | 1.60 | | | | 4.24 | | | | (0.26 | ) | | | 0.69 | |
| | | | | | | | | | | | | | | | | | | | |
| | | | | |
Total from investment operations | | | 1.17 | | | | 1.58 | | | | 4.25 | | | | (0.21 | ) | | | 0.71 | |
| | | | | | | | | | | | | | | | | | | | |
| | | | | |
| Less dividends and distributions: | | | | | | | | | | | | | | | | | | | | |
| | | | | |
From net investment income | | | — | | | | — | | | | (0.04 | ) | | | (0.03 | ) | | | (0.03 | ) |
| | | | | |
From net realized gain on investments | | | (2.71 | ) | | | — | | | | — | | | | — | | | | — | |
| | | | | | | | | | | | | | | | | | | | |
| | | | | |
Total dividends and distributions | | | (2.71 | ) | | | — | | | | (0.04 | ) | | | (0.03 | ) | | | (0.03 | ) |
| | | | | | | | | | | | | | | | | | | | |
| | | | | |
Net asset value at end of year | | $ | 22.50 | | | $ | 24.04 | | | $ | 22.46 | | | $ | 18.25 | | | $ | 18.49 | |
| | | | | | | | | | | | | | | | | | | | |
| | | | | |
Total investment return (b) | | | 5.71 | % | | | 7.03 | % | | | 23.31 | % | | | (1.12 | %) | | | 4.01 | % |
| | | | | |
| Ratios (to average net assets)/Supplemental Data: | | | | | | | | | | | | | | | | | | | | |
| | | | | |
Net investment income (loss) | | | 0.10 | % | | | (0.07 | %) | | | 0.06 | % | | | 0.30 | % (c) | | | 0.09 | % |
| | | | | |
Net expenses (d) | | | 1.98 | % | | | 1.96 | % | | | 1.97 | % | | | 1.95 | % (e) | | | 1.92 | % |
| | | | | |
Expenses (before waiver/reimbursement) (d) | | | 2.02 | % | | | 1.98 | % | | | 1.97 | % | | | 1.95 | % (e) | | | 1.92 | % |
| | | | | |
Portfolio turnover rate | | | 164 | % | | | 137 | % | | | 134 | % | | | 164 | % | | | 158 | % |
| | | | | |
Net assets at end of year (in 000’s) | | $ | 4,718 | | | $ | 5,855 | | | $ | 6,635 | | | $ | 6,604 | | | $ | 6,816 | |
| (a) | Per share data based on average shares outstanding during the year. |
| (b) | Total investment return is calculated exclusive of sales charges and assumes the reinvestment of dividends and distributions. For periods of less than one year, total return is not annualized. |
| (c) | Without the custody fee reimbursement, net investment income (loss) would have been 0.29%. |
| (d) | In addition to the fees and expenses which the Fund bears directly, it also indirectly bears a pro-rata share of the fees and expenses of the underlying funds in which it invests. Such indirect expenses are not included in the above expense ratios. |
| (e) | Without the custody fee reimbursement, net expenses would have been 1.96%. |
| | | | | | | | | | | | | | | | | | | | |
| |
| | | Year ended October 31, | |
| | | | | |
| Class C | | 2019 | | | 2018 | | | 2017 | | | 2016 | | | 2015 | |
| | | | | |
Net asset value at beginning of year | | $ | 24.02 | | | $ | 22.45 | | | $ | 18.24 | | | $ | 18.48 | | | $ | 17.80 | |
| | | | | | | | | | | | | | | | | | | | |
| | | | | |
Net investment income (loss) (a) | | | 0.02 | | | | (0.02 | ) | | | 0.01 | | | | 0.06 | | | | 0.01 | |
| | | | | |
Net realized and unrealized gain (loss) on investments | | | 1.15 | | | | 1.59 | | | | 4.24 | | | | (0.27 | ) | | | 0.70 | |
| | | | | | | | | | | | | | | | | | | | |
| | | | | |
Total from investment operations | | | 1.17 | | | | 1.57 | | | | 4.25 | | | | (0.21 | ) | | | 0.71 | |
| | | | | | | | | | | | | | | | | | | | |
| | | | | |
| Less dividends and distributions: | | | | | | | | | | | | | | | | | | | | |
| | | | | |
From net investment income | | | — | | | | — | | | | (0.04 | ) | | | (0.03 | ) | | | (0.03 | ) |
| | | | | |
From net realized gain on investments | | | (2.71 | ) | | | — | | | | — | | | | — | | | | — | |
| | | | | | | | | | | | | | | | | | | | |
| | | | | |
Total dividends and distributions | | | (2.71 | ) | | | — | | | | (0.04 | ) | | | (0.03 | ) | | | (0.03 | ) |
| | | | | | | | | | | | | | | | | | | | |
| | | | | |
Net asset value at end of year | | $ | 22.48 | | | $ | 24.02 | | | $ | 22.45 | | | $ | 18.24 | | | $ | 18.48 | |
| | | | | | | | | | | | | | | | | | | | |
| | | | | |
Total investment return (b) | | | 5.72 | % | | | 6.99 | % | | | 23.33 | % | | | (1.12 | %) | | | 4.01 | % |
| | | | | |
| Ratios (to average net assets)/Supplemental Data: | | | | | | | | | | | | | | | | | | | | |
| | | | | |
Net investment income (loss) | | | 0.10 | % | | | (0.08 | %) | | | 0.06 | % | | | 0.34 | % (c) | | | 0.06 | % |
| | | | | |
Net expenses (d) | | | 1.98 | % | | | 1.96 | % | | | 1.97 | % | | | 1.95 | % (e) | | | 1.92 | % |
| | | | | |
Expenses (before waiver/reimbursement) (d) | | | 2.02 | % | | | 1.98 | % | | | 1.97 | % | | | 1.95 | % (e) | | | 1.92 | % |
| | | | | |
Portfolio turnover rate | | | 164 | % | | | 137 | % | | | 134 | % | | | 164 | % | | | 158 | % |
| | | | | |
Net assets at end of year (in 000’s) | | $ | 10,946 | | | $ | 14,964 | | | $ | 15,459 | | | $ | 16,509 | | | $ | 25,775 | |
| (a) | Per share data based on average shares outstanding during the year. |
| (b) | Total investment return is calculated exclusive of sales charges and assumes the reinvestment of dividends and distributions. For periods of less than one year, total return is not annualized. |
| (c) | Without the custody fee reimbursement, net investment income (loss) would have been 0.33%. |
| (d) | In addition to the fees and expenses which the Fund bears directly, it also indirectly bears a pro-rata share of the fees and expenses of the underlying funds in which it invests. Such indirect expenses are not included in the above expense ratios. |
| (e) | Without the custody fee reimbursement, net expenses would have been 1.96%. |
| | | | |
| 18 | | MainStay MacKay Common Stock Fund | | The notes to the financial statements are an integral part of,
and should be read in conjunction with, the financial statements. |
Financial Highlightsselected per share data and ratios
| | | | | | | | | | | | | | | | | | | | |
| |
| | | Year ended October 31, | |
| | | | | |
| Class I | | 2019 | | | 2018 | | | 2017 | | | 2016 | | | 2015 | |
| | | | | |
Net asset value at beginning of year | | $ | 26.44 | | | $ | 24.67 | | | $ | 20.04 | | | $ | 20.29 | | | $ | 19.45 | |
| | | | | | | | | | | | | | | | | | | | |
| | | | | |
Net investment income (loss) (a) | | | 0.32 | | | | 0.31 | | | | 0.29 | | | | 0.31 | | | | 0.26 | |
| | | | | |
Net realized and unrealized gain (loss) on investments | | | 1.28 | | | | 1.74 | | | | 4.65 | | | | (0.29 | ) | | | 0.76 | |
| | | | | | | | | | | | | | | | | | | | |
| | | | | |
Total from investment operations | | | 1.60 | | | | 2.05 | | | | 4.94 | | | | 0.02 | | | | 1.02 | |
| | | | | | | | | | | | | | | | | | | | |
| | | | | |
| Less dividends and distributions: | | | | | | | | | | | | | | | | | | | | |
| | | | | |
From net investment income | | | (0.28 | ) | | | (0.28 | ) | | | (0.31 | ) | | | (0.27 | ) | | | (0.18 | ) |
| | | | | |
From net realized gain on investments | | | (2.71 | ) | | | — | | | | — | | | | — | | | | — | |
| | | | | | | | | | | | | | | | | | | | |
| | | | | |
Total dividends and distributions | | | (2.99 | ) | | | (0.28 | ) | | | (0.31 | ) | | | (0.27 | ) | | | (0.18 | ) |
| | | | | | | | | | | | | | | | | | | | |
| | | | | |
Net asset value at end of year | | $ | 25.05 | | | $ | 26.44 | | | $ | 24.67 | | | $ | 20.04 | | | $ | 20.29 | |
| | | | | | | | | | | | | | | | | | | | |
| | | | | |
Total investment return (b) | | | 7.06 | % | | | 8.36 | % | | | 24.89 | % | | | 0.12 | % | | | 5.26 | % |
| | | | | |
| Ratios (to average net assets)/Supplemental Data: | | | | | | | | | | | | | | | | | | | | |
| | | | | |
Net investment income (loss) | | | 1.34 | % | | | 1.16 | % | | | 1.31 | % | | | 1.55 | % (c) | | | 1.30 | % |
| | | | | |
Net expenses (d) | | | 0.72 | % | | | 0.71 | % | | | 0.71 | % | | | 0.70 | % (e) | | | 0.71 | % |
| | | | | |
Portfolio turnover rate | | | 164 | % | | | 137 | % | | | 134 | % | | | 164 | % | | | 158 | % |
| | | | | |
Net assets at end of year (in 000’s) | | $ | 97,903 | | | $ | 98,395 | | | $ | 96,441 | | | $ | 87,774 | | | $ | 91,561 | |
| (a) | Per share data based on average shares outstanding during the year. |
| (b) | Total investment return is calculated exclusive of sales charges and assumes the reinvestment of dividends and distributions. Class I shares are not subject to sales charges. For periods of less than one year, total return is not annualized. |
| (c) | Without the custody fee reimbursement, net investment income (loss) would have been 1.54%. |
| (d) | In addition to the fees and expenses which the Fund bears directly, it also indirectly bears a pro-rata share of the fees and expenses of the underlying funds in which it invests. Such indirect expenses are not included in the above expense ratios. |
| (e) | Without the custody fee reimbursement, net expenses would have been 0.71%. |
| | | | | | | | | | | | | | | | |
| | |
| | | Year ended October 31, | | | February 29,
2016^ through
October 31,
2016 | |
| | | | |
| Class R3 | | 2019 | | | 2018 | | | 2017 | | | | |
| | | | |
Net asset value at beginning of period | | $ | 26.17 | | | $ | 24.48 | | | $ | 19.90 | | | $ | 18.44 | |
| | | | | | | | | | | | | | | | |
| | | | |
Net investment income (loss) (a) | | | 0.17 | | | | 0.14 | | | | 0.13 | | | | 0.10 | |
| | | | |
Net realized and unrealized gain (loss) on investments | | | 1.28 | | | | 1.73 | | | | 4.65 | | | | 1.36 | |
| | | | | | | | | | | | | | | | |
| | | | |
Total from investment operations | | | 1.45 | | | | 1.87 | | | | 4.78 | | | | 1.46 | |
| | | | | | | | | | | | | | | | |
| | | | |
| Less dividends and distributions: | | | | | | | | | | | | | | | | |
| | | | |
From net investment income | | | (0.14 | ) | | | (0.18 | ) | | | (0.20 | ) | | | — | |
| | | | |
From net realized gain on investments | | | (2.71 | ) | | | — | | | | — | | | | — | |
| | | | | | | | | | | | | | | | |
| | | | |
Total dividends and distributions | | | (2.85 | ) | | | (0.18 | ) | | | (0.20 | ) | | | — | |
| | | | | | | | | | | | | | | | |
| | | | |
Net asset value at end of period | | $ | 24.77 | | | $ | 26.17 | | | $ | 24.48 | | | $ | 19.90 | |
| | | | | | | | | | | | | | | | |
| | | | |
Total investment return (b) | | | 6.42 | % | | | 7.66 | % | | | 24.17 | % | | | 7.92 | %(c) |
| | | | |
| Ratios (to average net assets)/Supplemental Data: | | | | | | | | | | | | | | | | |
| | | | |
Net investment income (loss) | | | 0.70 | % | | | 0.52 | % | | | 0.60 | % | | | 0.74 | %††(d) |
| | | | |
Net expenses (e) | | | 1.32 | % | | | 1.32 | % | | | 1.31 | % | | | 1.31 | %††(f) |
| | | | |
Portfolio turnover rate | | | 164 | % | | | 137 | % | | | 134 | % | | | 164 | % |
| | | | |
Net assets at end of period (in 000’s) | | $ | 227 | | | $ | 137 | | | $ | 86 | | | $ | 29 | |
| (a) | Per share data based on average shares outstanding during the year. |
| (b) | Total investment return is calculated exclusive of sales charges and assumes the reinvestment of dividends and distributions. Class R3 shares are not subject to sales charges. For periods of less than one year, total return is not annualized. |
| (c) | Total investment return may reflect adjustments to conform to generally accepted accounting principles. |
| (d) | Without the custody fee reimbursement, net investment income (loss) would have been 0.73%. |
| (e) | In addition to the fees and expenses which the Fund bears directly, it also indirectly bears a pro-rata share of the fees and expenses of the underlying funds in which it invests. Such indirect expenses are not included in the above expense ratios. |
| (f) | Without the custody fee reimbursement, net expenses would have been 1.32%. |
| | | | | | |
The notes to the financial statements are an integral part of,
and should be read in conjunction with, the financial statements. | | | | | 19 | |
Notes to Financial Statements
Note 1–Organization and Business
The MainStay Funds (the “Trust”) was organized on January 9, 1986, as a Massachusetts business trust and is governed by a Declaration of Trust. The Trust is registered under the Investment Company Act of 1940, as amended (the “1940 Act”), as an open-end management investment company, and is comprised of twelve funds (collectively referred to as the “Funds”). These financial statements and notes relate to the MainStay MacKay Common Stock Fund (the “Fund”), a “diversified” fund, as that term is defined in the 1940 Act, as interpreted or modified by regulatory authorities having jurisdiction, from time to time.
The Fund currently has eight classes of shares registered for sale. Class A and Class B shares commenced operations on June 1, 1998. Class C shares commenced operations on September 1, 1998. Class I shares commenced operations on December 28, 2004. Investor Class shares commenced operations on February 28, 2008. Class R3 shares commenced operations on February 29, 2016. Class R2 shares were registered for sale effective as of December 14, 2007. Class R6 shares were registered for sale effective as of February 28, 2017. As of October 31, 2019, Class R2 and Class R6 shares were not yet offered for sale.
Class B shares of the MainStay Group of Funds are closed to all new purchases as well as additional investments by existing Class B shareholders. Existing Class B shareholders may continue to reinvest dividends and capital gains distributions, as well as exchange their Class B shares for Class B shares of other funds in the MainStay Group of Funds as permitted by the current exchange privileges. Class B shareholders continue to be subject to any applicable contingent deferred sales charge (“CDSC”) at the time of redemption. All other features of the Class B shares, including but not limited to the fees and expenses applicable to Class B shares, remain unchanged. Unless redeemed, Class B shareholders will remain in Class B shares of their respective fund until the Class B shares are converted to Class A or Investor Class shares pursuant to the applicable conversion schedule.
Class A and Investor Class shares are offered at net asset value (“NAV”) per share plus an initial sales charge. No initial sales charge applies to investments of $1 million or more (and certain other qualified purchases) in Class A and Investor Class shares. However, a CDSC of 1.00% may be imposed on certain redemptions made within 18 months of the date of purchase on shares that were purchased without an initial sales charge. Class C shares are offered at NAV without an initial sales charge, although a 1.00% CDSC may be imposed on certain redemptions of such shares made within one year of the date of purchase of Class C shares. When Class B shares were offered, they were offered at NAV without an initial sales charge, although a CDSC that declines depending on the number of years a shareholder has held its Class B shares may be imposed on certain redemptions of such shares made within six years of the date of purchase of such shares. Class I, Class R1, Class R2, Class R3 and Class R6 shares are offered at NAV without a sales charge. Class R2 and Class R6 shares are currently expected to be offered at NAV without a sales charge. Depending upon eligibility, Class B shares convert to either Class A or Investor Class shares at the end of the calendar quarter eight years after the date they were purchased. In addition, depending upon eligibility, Class C shares convert to either Class A or Investor Class shares at the end of the calendar quarter ten years after the date they were purchased.
Additionally, as disclosed in the Fund’s prospectus, Class A shares may convert automatically to Investor Class shares and Investor Class shares may convert automatically to Class A shares. Under certain circumstances and as may be permitted by the Trust’s multiple class plan pursuant to Rule 18f-3 under the 1940 Act, specified share classes of the Fund may be converted to one or more other share classes of the Fund as disclosed in the capital share transactions within these Notes. The classes of shares have the same voting (except for issues that relate solely to one class), dividend, liquidation and other rights, and the same terms and conditions, except that under distribution plans pursuant to Rule 12b-1 under the 1940 Act, Class B and Class C shares are subject to higher distribution and/or service fees than Class A, Investor Class, Class R2 and Class R3 shares. Class I, Class R1 and Class R6 shares are not subject to a distribution and/or service fee. Class R1, Class R2 and Class R3 shares are subject to a shareholder service fee, which is in addition to fees paid under the distribution plans for Class R2 and Class R3 shares.
The Fund’s investment objective is to seeklong-term growth of capital.
Note 2–Significant Accounting Policies
The Fund is an investment company and accordingly follows the investment company accounting and reporting guidance of the Financial Accounting Standards Board (“FASB”) Accounting Standard CodificationTopic 946 Financial Services—Investment Companies. The Fund prepares its financial statements in accordance with generally accepted accounting principles (“GAAP”) in the United States of America and follows the significant accounting policies described below.
(A) Securities Valuation. Investments are usually valued as of the close of regular trading on the New York Stock Exchange (the “Exchange”) (usually 4:00 p.m. Eastern time) on each day the Fund is open for business (“valuation date”).
The Board of Trustees of the Trust (the “Board”) adopted procedures establishing methodologies for the valuation of the Fund’s securities and other assets and delegated the responsibility for valuation determinations under those procedures to the Valuation Committee of the Trust (the “Valuation Committee”). The Board authorized the Valuation Committee to appoint a Valuation Subcommittee (the “Subcommittee”) to deal in the first instance with establishing the prices of securities for which market quotations are not readily available or the prices of which are not otherwise readily determinable under these procedures. The Subcommittee meets (in person, via electronic mail or via teleconference) on an as-needed basis. Subsequently, the Valuation Committee meets to ensure that actions taken by the Subcommittee were appropriate. The procedures state that, subject to the oversight of the Board and unless otherwise noted, the responsibility for theday-to-day valuation of portfolio assets (including fair value measurements for the Fund’s assets and liabilities) rests with New York Life Investment Management LLC (“New York Life Investments” or the “Manager”), aided to whatever extent necessary by the Subadvisor (as defined in Note 3(A)).
To assess the appropriateness of security valuations, the Manager, the Subadvisor or the Fund’s third-party service provider, who is subject to oversight by the Manager, regularly compares prior day prices, prices on comparable securities and the sale prices to the prior and current
| | |
| 20 | | MainStay MacKay Common Stock Fund |
day prices and challenges prices with changes exceeding certain tolerance levels with third-party pricing services or broker sources. For those securities valued through either a standardized fair valuation methodology or a fair valuation measurement, the Subcommittee deals in the first instance with such valuation and the Valuation Committee reviews and affirms, if appropriate, the reasonableness of the valuation based on such methodologies and measurements on a regular basis after considering information that is reasonably available and deemed relevant by the Valuation Committee. Any action taken by the Subcommittee with respect to the valuation of a portfolio security or other asset is submitted for review and ratification (if appropriate) to the Valuation Committee and the Board at the next regularly scheduled meeting.
“Fair value” is defined as the price the Fund would reasonably expect to receive upon selling an asset or liability in an orderly transaction to an independent buyer in the principal or most advantageous market for the asset or liability. Fair value measurements are determined within a framework that establishes a three-tier hierarchy which maximizes the use of observable market data and minimizes the use of unobservable inputs to establish a classification of fair value measurements for disclosure purposes. “Inputs” refer broadly to the assumptions that market participants would use in pricing the asset or liability, including assumptions about risk, such as the risk inherent in a particular valuation technique used to measure fair value using a pricing model and/or the risk inherent in the inputs for the valuation technique. Inputs may be observable or unobservable. Observable inputs reflect the assumptions market participants would use in pricing the asset or liability based on market data obtained from sources independent of the Fund. Unobservable inputs reflect the Fund’s own assumptions about the assumptions market participants would use in pricing the asset or liability based on the information available. The inputs or methodology used for valuing assets or liabilities may not be an indication of the risks associated with investing in those assets or liabilities. The three-tier hierarchy of inputs is summarized below.
| • | | Level 1—quoted prices in active markets for an identical asset or liability |
| • | | Level 2—other significant observable inputs (including quoted prices for a similar asset or liability in active markets, interest rates and yield curves, prepayment speeds, credit risk, etc.) |
| • | | Level 3—significant unobservable inputs (including the Fund’s own assumptions about the assumptions that market participants would use in measuring fair value of an asset or liability) |
The level of an asset or liability within the fair value hierarchy is based on the lowest level of an input, both individually and in the aggregate, that is significant to the fair value measurement. As of October 31, 2019, the aggregate value by input level of the Fund’s assets and liabilities is included at the end of the Fund’s Portfolio of Investments.
The Fund may use third-party vendor evaluations, whose prices may be derived from one or more of the following standard inputs, among others:
| | |
• Broker/dealer quotes | | • Benchmark securities |
• Two-sided markets | | • Reference data (corporate actions or material event notices) |
• Bids/offers | | • Monthly payment information |
• Industry and economic events | | • Reported trades |
An asset or liability for which market values cannot be measured using the methodologies described above is valued by methods deemed reasonable in good faith by the Valuation Committee, following the procedures established by the Board, to represent fair value. Under these procedures, the Fund generally uses a market-based approach which may use related or comparable assets or liabilities, recent transactions, market multiples, book values and other relevant information. The Fund may also use an income-based valuation approach in which the anticipated future cash flows of the asset or liability are discounted to calculate fair value. Discounts may also be applied due to the nature and/or duration of any restrictions on the disposition of the asset or liability. Fair value represents a good faith approximation of the value of a security. Fair value determinations involve the consideration of a number of subjective factors, an analysis of applicable facts and circumstances and the exercise of judgment. As a result, it is possible that the fair value for a security determined in good faith in accordance with the Fund’s valuation procedures may differ from valuations for the same security determined by other funds using their own valuation procedures. Although the Fund’s valuation procedures are designed to value a security at the price the Fund may reasonably expect to receive upon the security’s sale in an orderly transaction, there can be no assurance that any fair value determination thereunder would, in fact, approximate the amount that the Fund would actually realize upon the sale of the security or the price at which the security would trade if a reliable market price were readily available. During the year ended October 31, 2019, there were no material changes to the fair value methodologies.
Securities which may be valued in this manner include, but are not limited to: (i) a security for which trading has been halted or suspended; (ii) a debt security that has recently gone into default and for which there is not a current market quotation; (iii) a security of an issuer that has entered into a restructuring; (iv) a security that has been delisted from a national exchange; (v) a security for which the market price is not readily available from a third-party pricing source or, if so provided, does not, in the opinion of the Manager or the Subadvisor, reflect the security’s market value; (vi) a security subject to trading collars for which no or limited trading takes place; and (vii) a security whose principal market has been temporarily closed at a time when, under normal conditions, it would be open. Securities valued in this manner are generally categorized as Level 3 in the hierarchy. As of October 31, 2019, there were no securities held by the Fund that were fair valued in such a manner.
Equity securities, including exchange-traded funds (“ETFs”), are valued at the last quoted sales prices as of the close of regular trading on the relevant exchange on each valuation date. Securities that are not traded on the valuation date are valued at the mean of the last quoted bid and ask prices. Prices are normally taken from the principal market in which each security trades. These securities are generally categorized as Level 1 in the hierarchy.
Investments in mutual funds, including money market funds, are valued at their respective NAVs as of the close of the Exchange on the valuation date. These securities are generally categorized as Level 1 in the hierarchy.
Temporary cash investments acquired in excess of 60 days to maturity at the time of purchase are valued using the latest bid prices or using
Notes to Financial Statements(continued)
valuations based on a matrix system (which considers such factors as security prices, yields, maturities and ratings), both as furnished by independent pricing services. Other temporary cash investments which mature in 60 days or less at the time of purchase (“Short-Term Investments”) are valued using the amortized cost method of valuation, unless the use of such method would be inappropriate. The amortized cost method involves valuing a security at its cost on the date of purchase and thereafter assuming a constant amortization to maturity of the difference between such cost and the value on maturity date. Amortized cost approximates the current fair value of a security. Securities valued using the amortized cost method are not valued using quoted prices in an active market and are generally categorized as Level 2 in the hierarchy.
The information above is not intended to reflect an exhaustive list of the methodologies that may be used to value portfolio investments. The valuation procedures permit the use of a variety of valuation methodologies in connection with valuing portfolio investments. The methodology used for a specific type of investment may vary based on the market data available or other considerations. The methodologies summarized above may not represent the specific means by which portfolio investments are valued on any particular business day.
(B) Income Taxes. The Fund’s policy is to comply with the requirements of the Internal Revenue Code of 1986, as amended (the “Internal Revenue Code”), applicable to regulated investment companies and to distribute all of its taxable income to the shareholders of the Fund within the allowable time limits. Therefore, no federal, state and local income tax provisions are required.
Management evaluates the Fund’s tax positions to determine if the tax positions taken meet the minimum recognition threshold in connection with accounting for uncertainties in income tax positions taken or expected to be taken for the purposes of measuring and recognizing tax liabilities in the financial statements. Recognition of tax benefits of an uncertain tax position is permitted only to the extent the position is “more likely than not” to be sustained assuming examination by taxing authorities. Management has analyzed the Fund’s tax positions taken on federal, state and local income tax returns for all open tax years (for up to three tax years) and has concluded that no provisions for federal, state and local income tax are required in the Fund’s financial statements. The Fund’s federal, state and local income tax and federal excise tax returns for tax years for which the applicable statutes of limitations have not expired are subject to examination by the Internal Revenue Service and state and local departments of revenue.
(C) Dividends and Distributions to Shareholders. Dividends and distributions are recorded on the ex-dividend date. The Fund intends to declare and pay dividends from net investment income and distributions from net realized capital and currency gains, if any, at least annually. Unless the shareholder elects otherwise, all dividends and distributions are reinvested in the same class of shares of the Fund, at NAV. Dividends and distributions to shareholders are determined in accordance with federal income tax regulations and may differ from determinations using GAAP.
(D) Security Transactions and Investment Income. The Fund records security transactions on the trade date. Realized gains and losses on security transactions are determined using the identified cost
method. Dividend income is recognized on the ex-dividend date; net of any foreign tax withheld at the source, and interest income is accrued as earned using the effective interest rate method.
Investment income and realized and unrealized gains and losses on investments of the Fund are allocated pro rata to the separate classes of shares based upon their relative net assets on the date the income is earned or realized and unrealized gains and losses are incurred.
(E) Expenses. Expenses of the Trust are allocated to the individual Funds in proportion to the net assets of the respective Funds when the expenses are incurred, except where direct allocations of expenses can be made. Expenses (other than transfer agent expenses and fees incurred under the shareholder services plans and/or the distribution plans further discussed in Note 3(B)) are allocated to separate classes of shares pro rata based upon their relative net assets on the date the expenses are incurred. The expenses borne by the Fund, including those of related parties to the Fund, are shown in the Statement of Operations.
Additionally, the Fund may invest in ETFs and mutual funds, which are subject to management fees and other fees that may cause the costs of investing in ETFs and mutual funds to be greater than the costs of owning the underlying securities directly. These indirect expenses of ETFs and mutual funds are not included in the amounts shown as expenses in the Fund’s Statement of Operations or in the expense ratios included in the Financial Highlights.
(F) Use of Estimates. In preparing financial statements in conformity with GAAP, management makes estimates and assumptions that affect the reported amounts and disclosures in the financial statements. Actual results could differ from those estimates.
(G) Securities Lending. In order to realize additional income, the Fund may engage in securities lending, subject to the limitations set forth in the 1940 Act and relevant guidance by the staff of the Securities and Exchange Commission (“SEC”). In the event the Fund does engage in securities lending, the Fund will lend through its custodian, State Street Bank and Trust Company (“State Street”), acting as securities lending agent on behalf of the Fund. State Street will manage the Fund’s collateral in accordance with the securities lending agency agreement between the Fund and State Street, and indemnify the Fund against counterparty risk. The loans will be collateralized by cash (which may be invested in a money market fund) and/ornon-cash collateral (which may include U.S. Treasury securities and/or U.S. Government Agency securities issued or guaranteed by the United States government or its agencies or instrumentalities) at least equal at all times to the market value of the securities loaned. The Fund may bear the risk of delay in recovery of, or loss of rights in, the securities loaned should the borrower of the securities experience financial difficulty. The Fund may also record a realized gain or loss on securities deemed sold due to a borrower’s inability to return securities on loan. The Fund bears the risk of any loss on investment of cash collateral. The Fund will receive compensation for lending its securities in the form of fees or it will retain a portion of interest earned on the investment of any cash collateral. The Fund will also continue to receive interest and dividends on the securities loaned and any gain or loss in the market price of the securities loaned that may occur during the term of the loan will be for the account of the Fund. Income earned from securities lending activities, if
| | |
| 22 | | MainStay MacKay Common Stock Fund |
any, is reflected in the Statement of Operations. As of October 31, 2019, the Fund did not have any portfolio securities on loan.
(H) Indemnifications. Under the Trust’s organizational documents, its officers and trustees are indemnified against certain liabilities that may arise out of performance of their duties to the Trust. Additionally, in the normal course of business, the Fund enters into contracts with third-party service providers that contain a variety of representations and warranties and which may provide general indemnifications. The Fund’s maximum exposure under these arrangements is unknown, as this would involve future claims that may be made against the Fund that have not yet occurred. Based on experience, management is of the view that the risk of loss in connection with these potential indemnification obligations is remote. However, there can be no assurance that material liabilities related to such obligations will not arise in the future, which could adversely impact the Fund.
Note 3–Fees and Related Party Transactions
(A) Manager and Subadvisor. New York Life Investments, a registered investment adviser and an indirect,wholly-owned subsidiary of New York Life Insurance Company (“New York Life”), serves as the Fund’s Manager, pursuant to an Amended and Restated Management Agreement (“Management Agreement”). The Manager provides offices, conducts clerical, recordkeeping and bookkeeping services and keeps most of the financial and accounting records required to be maintained by the Fund. Except for the portion of salaries and expenses that are the responsibility of the Fund, the Manager pays the salaries and expenses of all personnel affiliated with the Fund and certain operational expenses of the Fund. The Fund reimburses New York Life Investments in an amount equal to a portion of the compensation of the Chief Compliance Officer attributable to the Fund. MacKay Shields LLC (“MacKay Shields” or the “Subadvisor”), a registered investment adviser and an indirect,wholly-owned subsidiary of New York Life, serves as Subadvisor to the Fund and is responsible for theday-to-day portfolio management of the Fund. Pursuant to the terms of an Amended and Restated Subadvisory Agreement (“Subadvisory Agreement”) between New York Life Investments and MacKay Shields, New York Life Investments pays for the services of the Subadvisor.
Under the Management Agreement, the Fund pays the Manager a monthly fee for the services performed and facilities furnished at an annual rate of the Fund’s average daily net assets as follows: 0.55% up to $500 million; 0.525% from $500 million to $1 billion; and 0.50% on assets in excess of $1 billion. During the year ended October 31, 2019, the effective management fee rate was 0.55%.
New York Life Investments has contractually agreed to waive fees and/or reimburse expenses so that Total Annual Fund Operating Expenses (excluding taxes, interest, litigation, extraordinary expenses, brokerage and other transaction expenses relating to the purchase or sale of portfolio investments, and acquired (underlying) fund fees and expenses) of Class R6 do not exceed those of Class I. This agreement will remain in effect until February 28, 2020, and shall renew automatically for one-year terms unless New York Life Investments provides written notice of termination prior to the start of the next term or upon approval of the Board.
New York Life Investments has agreed to voluntarily waive fees and/or reimburse expenses so that Total Annual Fund Operating Expenses
(excluding taxes, interest, litigation, extraordinary expenses, brokerage and other transaction expenses relating to the purchase and sale of portfolio investments, and acquired (underlying) fund fees and expenses) of a class do not exceed the following percentages of average daily net assets: Investor Class, 1.85%; Class B, 2.60%; and Class C, 2.60%. These voluntary waivers or reimbursements may be discontinued at any time without notice.
During the year ended October 31, 2019, New York Life Investments earned fees from the Fund in the amount of $1,084,722 and voluntarily waived and/or reimbursed certain class specific expenses in the amount of $13,526 and paid the Subadvisor in the amount of $535,598.
State Street providessub-administration andsub-accounting services to the Fund pursuant to an agreement with New York Life Investments. These services include calculating the daily NAVs of the Fund, maintaining the general ledger andsub-ledger accounts for the calculation of the Fund’s NAVs and assisting New York Life Investments in conducting various aspects of the Fund’s administrative operations. For providing these services to the Fund, State Street is compensated by New York Life Investments.
Pursuant to an agreement between the Trust and New York Life Investments, New York Life Investments is responsible for providing or procuring certain regulatory reporting services for the Fund. The Fund will reimburse New York Life Investments for the actual costs incurred by New York Life Investments in connection with providing or procuring these services for the Fund.
(B) Distribution, Service and Shareholder Service Fees. The Trust, on behalf of the Fund, has entered into a distribution agreement with NYLIFE Distributors LLC (the “Distributor”), an indirect,wholly-owned subsidiary of New York Life. The Fund has adopted distribution plans (the “Plans”) in accordance with the provisions of Rule 12b-1 under the 1940 Act.
Pursuant to the Class A, Investor Class and Class R2 Plans, the Distributor receives a monthly distribution fee from the Class A, Investor Class and Class R2 shares at an annual rate of 0.25% of the average daily net assets of the Class A, Investor Class and Class R2 shares for distribution and/or service activities as designated by the Distributor. Pursuant to the Class B and Class C Plans, Class B and Class C shares pay the Distributor a monthly distribution fee at an annual rate of 0.75% of the average daily net assets of the Class B and Class C shares, along with a service fee at an annual rate of 0.25% of the average daily net assets of the Class B and Class C shares, for a total 12b-1 fee of 1.00%. Pursuant to the Class R3 Plan, the Distributor receives a monthly distribution and/or service fee from the Class R3 shares at an annual rate of 0.50% of the average daily net assets of the Class R3 shares. Class I and Class R6 shares are not subject to a distribution and/or service fee.
The Plans provide that the distribution and service fees are payable to the Distributor regardless of the amounts actually expended by the Distributor for distribution of the Fund’s shares and service activities.
In accordance with the Shareholder Services Plan for the Class R2 and Class R3 shares, the Manager has agreed to provide, through its affiliates or independent third parties, various shareholder and administrative support services to shareholders of the Class R2 and Class R3 shares. For its services, the Manager, its affiliates or independent
Notes to Financial Statements(continued)
third-party service providers are entitled to a shareholder service fee accrued daily and paid monthly at an annual rate of 0.10% of the average daily net assets of the Class R2 and Class R3 shares. This is in addition to any fees paid under the Class R2 and Class R3 Plans.
During the year ended October 31, 2019, shareholder service fees incurred by the Fund were as follows:
(C) Sales Charges. During the year ended October 31, 2019, the Fund was advised by the Distributor that the amount of initial sales charges retained on sales of Class A and Investor Class shares were $15,195 and $8,450, respectively.
During the year ended October 31, 2019, the Fund was also advised that the Distributor retained CDSCs on redemptions of Class A, Class B and Class C shares of $2,027, $6,328 and $710, respectively.
(D) Transfer, Dividend Disbursing and Shareholder Servicing Agent. NYLIM Service Company LLC, an affiliate of New York Life Investments, is the Fund’s transfer, dividend disbursing and shareholder servicing agent pursuant to an agreement between NYLIM Service Company LLC and the Trust. NYLIM Service Company
LLC has entered into an agreement with DST Asset Manager Solutions, Inc. (“DST”), pursuant to which DST performs certain transfer agent services on behalf of NYLIM Service Company LLC. During the year ended October 31, 2019, transfer agent expenses incurred by the Fund were as follows:
| | | | |
Class A | | $ | 27,776 | |
Investor Class | | | 56,847 | |
Class B | | | 17,633 | |
Class C | | | 42,676 | |
Class I | | | 44,317 | |
Class R3 | | | 74 | |
(E) Small Account Fee. Shareholders with small accounts adversely impact the cost of providing transfer agency services. In an effort to reduce total transfer agency expenses, the Fund has implemented a small account fee on certain types of accounts. Certain shareholders with an account balance of less than $1,000 are charged an annual per account fee of $20 (assessed semi-annually), the proceeds from which offset transfer agent fees as reflected in the Statement of Operations.
(F) Investments in Affiliates (in 000’s). During the year ended October 31, 2019, purchases and sales transactions, income earned from investments and shares held of investment companies managed by New York Life Investments or its affiliates were as follows:
| | | | | | | | | | | | | | | | | | | | | | | | | | | | | | | | | | | | |
Affiliated Investment Company | | Value,
Beginning of
Year | | | Purchases
at Cost | | | Proceeds
from Sales | | | Net Realized
Gain/(Loss)
on Sales | | | Change in
Unrealized
Appreciation/
(Depreciation) | | | Value,
End of
Year | | | Dividend
Income | | | Other
Distributions | | | Shares
End of
Year | |
MainStay U.S. Government Liquidity Fund | | $ | 67 | | | $ | 30,548 | | | $ | (30,585 | ) | | $ | — | | | $ | — | | | $ | 30 | | | $ | 3 | | | $ | — | | | | 30 | |
(G) Capital. As of October 31, 2019, New York Life and its affiliates beneficially held shares of the Fund with the values and percentages of net assets as follows:
Note 4–Federal Income Tax
As of October 31, 2019, the cost and unrealized appreciation (depreciation) of the Fund’s investment portfolio, including applicable derivative contracts and other financial instruments, as determined on a federal income tax basis, were as follows:
| | | | | | | | | | | | | | | | |
| | | Federal Tax
Cost | | | Gross
Unrealized
Appreciation | | | Gross
Unrealized
(Depreciation) | | | Net
Unrealized
Appreciation/
(Depreciation) | |
Investments
in Securities | | $ | 176,053,538 | | | $ | 21,100,082 | | | $ | (2,294,972 | ) | | $ | 18,805,110 | |
As of October 31, 2019, the components of accumulated gain (loss) on a tax basis were as follows:
| | | | | | | | |
Ordinary
Income | | Accumulated
Capital and
Other Gain
(Loss) | | Other
Temporary
Differences | | Unrealized
Appreciation
(Depreciation) | | Total
Accumulated
Gain (Loss) |
| | | | |
| $2,071,174 | | $9,528,904 | | $— | | $18,805,110 | | $30,405,188 |
The difference between book-basis and tax-basis unrealized appreciation (depreciation) is primarily due to wash sale adjustments.
The following table discloses the current year reclassifications between total distributable earnings (loss) and additional paid-in capital arising from permanent differences; net assets as of October 31, 2019 were not affected.
| | | | |
Total
Distributable
Earnings
(Loss) | | Additional
Paid-In
Capital | |
| |
| $(875,556) | | $ | 875,556 | |
The reclassifications for the Fund are primarily due to equalization.
During the years ended October 31, 2019 and October 31, 2018, the tax character of distributions paid as reflected in the Statements of Changes in Net Assets were as follows:
| | | | | | | | |
| | | 2019 | | | 2018 | |
| | |
Distributions paid from: | | | | | | | | |
Ordinary Income | | $ | 8,124,295 | | | $ | 1,677,060 | |
Long-term capital gains | | | 14,286,611 | | | | — | |
| Total | | $ | 22,410,906 | | | $ | 1,677,060 | |
| | |
| 24 | | MainStay MacKay Common Stock Fund |
Note 5–Custodian
State Street is the custodian of cash and securities held by the Fund. Custodial fees are charged to the Fund based on the Fund’s net assets and/or the market value of securities held by the Fund and the number of certain transactions incurred by the Fund.
Note 6–Line of Credit
The Fund and certain other funds managed by New York Life Investments maintain a line of credit with a syndicate of banks in order to secure a source of funds for temporary purposes to meet unanticipated or excessive redemption requests.
Effective July 30, 2019, under the credit agreement (the “Credit Agreement”), the aggregate commitment amount is $600,000,000 with an additional uncommitted amount of $100,000,000. The commitment fee is an annual rate of 0.15% of the average commitment amount payable quarterly, regardless of usage, to State Street, who serves as the agent to the syndicate. The commitment fee is allocated among the Fund and certain other funds managed by New York Life Investments based upon their respective net assets and other factors. Interest on any revolving credit loan is charged based upon the Federal Funds Rate or the one-month London Interbank Offered Rate (“LIBOR”), whichever is higher. The Credit Agreement expires on July 28, 2020, although the Fund, certain other funds managed by New York Life Investments and the syndicate of banks may renew the Credit Agreement for an additional year on the same or different terms. Prior to July 30, 2019, the aggregate commitment amount and the commitment fee were the same as those under the current Credit Agreement. During the year ended October 31, 2019, there were no borrowings made or outstanding with respect to the Fund under the Credit Agreement.
Note 7–Interfund Lending Program
Pursuant to an exemptive order issued by the SEC, the Fund, along with certain other funds managed by New York Life Investments, may participate in an interfund lending program. The interfund lending program provides an alternative credit facility that permits the Fund and certain other funds managed by New York Life Investments to lend or borrow money for temporary purposes directly to or from one another subject to the conditions of the exemptive order. During the year ended October 31, 2019, there were no interfund loans made or outstanding with respect to the Fund.
Note 8–Purchases and Sales of Securities (in 000’s)
During the year ended October 31, 2019, purchases and sales of securities, other thanshort-term securities, were $322,709 and $337,923, respectively.
Note 9–Capital Share Transactions
Transactions in capital shares for the years ended October 31, 2019 and October 31, 2018, were as follows:
| | | | | | | | |
Class A | | Shares | | | Amount | |
| | |
Year ended October 31, 2019: | | | | | | | | |
Shares sold | | | 634,867 | | | $ | 15,446,282 | |
Shares issued to shareholders in reinvestment of dividends and distributions | | | 308,961 | | | | 7,090,652 | |
Shares redeemed | | | (864,519 | ) | | | (20,741,150 | ) |
| | | | |
Net increase (decrease) in shares outstanding before conversion | | | 79,309 | | | | 1,795,784 | |
Shares converted into Class A (See Note 1) | | | 77,193 | | | | 1,826,016 | |
Shares converted from Class A (See Note 1) | | | (25,769 | ) | | | (619,768 | ) |
| | | | |
Net increase (decrease) | | | 130,733 | | | $ | 3,002,032 | |
| | | | |
Year ended October 31, 2018: | | | | | | | | |
Shares sold | | | 567,715 | | | $ | 14,915,276 | |
Shares issued to shareholders in reinvestment of dividends and distributions | | | 19,112 | | | | 488,895 | |
Shares redeemed | | | (490,183 | ) | | | (12,797,701 | ) |
| | | | |
Net increase (decrease) in shares outstanding before conversion | | | 96,644 | | | | 2,606,470 | |
Shares converted into Class A (See Note 1) | | | 152,900 | | | | 4,063,461 | |
Shares converted from Class A (See Note 1) | | | (14,162 | ) | | | (374,984 | ) |
| | | | |
Net increase (decrease) | | | 235,382 | | | $ | 6,294,947 | |
| | | | |
| | |
| | | | | | | | |
Investor Class | | Shares | | | Amount | |
| | |
Year ended October 31, 2019: | | | | | | | | |
Shares sold | | | 208,041 | | | $ | 5,077,628 | |
Shares issued to shareholders in reinvestment of dividends and distributions | | | 78,698 | | | | 1,809,263 | |
Shares redeemed | | | (217,777 | ) | | | (5,309,122 | ) |
| | | | |
Net increase (decrease) in shares outstanding before conversion | | | 68,962 | | | | 1,577,769 | |
Shares converted into Investor Class (See Note 1) | | | 47,135 | | | | 1,116,052 | |
Shares converted from Investor Class (See Note 1) | | | (55,763 | ) | | | (1,323,068 | ) |
| | | | |
Net increase (decrease) | | | 60,334 | | | $ | 1,370,753 | |
| | | | |
Year ended October 31, 2018: | | | | | | | | |
Shares sold | | | 103,313 | | | $ | 2,733,830 | |
Shares issued to shareholders in reinvestment of dividends and distributions | | | 3,927 | | | | 100,577 | |
Shares redeemed | | | (66,844 | ) | | | (1,765,739 | ) |
| | | | |
Net increase (decrease) in shares outstanding before conversion | | | 40,396 | | | | 1,068,668 | |
Shares converted into Investor Class (See Note 1) | | | 29,664 | | | | 788,176 | |
Shares converted from Investor Class (See Note 1) | | | (141,244 | ) | | | (3,754,085 | ) |
| | | | |
Net increase (decrease) | | | (71,184 | ) | | $ | (1,897,241 | ) |
| | | | |
| | |
| | | | | | | | |
Notes to Financial Statements(continued)
| | | | | | | | |
Class B | | Shares | | | Amount | |
| | |
Year ended October 31, 2019: | | | | | | | | |
Shares sold | | | 75,506 | | | $ | 1,687,776 | |
Shares issued to shareholders in reinvestment of dividends and distributions | | | 30,000 | | | | 627,606 | |
Shares redeemed | | | (111,007 | ) | | | (2,443,239 | ) |
| | | | |
Net increase (decrease) in shares outstanding before conversion | | | (5,501 | ) | | | (127,857 | ) |
Shares converted from Class B (See Note 1) | | | (28,333 | ) | | | (600,229 | ) |
| | | | |
Net increase (decrease) | | | (33,834 | ) | | $ | (728,086 | ) |
| | | | |
Year ended October 31, 2018: | | | | | | | | |
Shares sold | | | 17,385 | | | $ | 425,028 | |
Shares redeemed | | | (39,619 | ) | | | (950,724 | ) |
| | | | |
Net increase (decrease) in shares outstanding before conversion | | | (22,234 | ) | | | (525,696 | ) |
Shares converted from Class B (See Note 1) | | | (29,591 | ) | | | (722,568 | ) |
| | | | |
Net increase (decrease) | | | (51,825 | ) | | $ | (1,248,264 | ) |
| | | | |
| | |
| | | | | | | | |
Class C | | Shares | | | Amount | |
| | |
Year ended October 31, 2019: | | | | | | | | |
Shares sold | | | 84,098 | | | $ | 1,779,072 | |
Shares issued to shareholders in reinvestment of dividends and distributions | | | 65,052 | | | | 1,359,589 | |
Shares redeemed | | | (266,298 | ) | | | (5,719,806 | ) |
| | | | |
Net increase (decrease) in shares outstanding before conversion | | | (117,148 | ) | | | (2,581,145 | ) |
Shares converted from Class C (See Note 1) | | | (18,800 | ) | | | (399,003 | ) |
| | | | |
Net increase (decrease) | | | (135,948 | ) | | $ | (2,980,148 | ) |
| | | | |
Year ended October 31, 2018: | | | | | | | | |
Shares sold | | | 87,450 | | | $ | 2,084,523 | |
Shares redeemed | | | (153,217 | ) | | | (3,697,525 | ) |
| | | | |
Net increase (decrease) | | | (65,767 | ) | | $ | (1,613,002 | ) |
| | | | |
| | |
| | | | | | | | |
Class I | | Shares | | | Amount | |
| | |
Year ended October 31, 2019: | | | | | | | | |
Shares sold | | | 1,781,608 | | | $ | 42,155,132 | |
Shares issued to shareholders in reinvestment of dividends and distributions | | | 480,594 | | | | 11,063,276 | |
Shares redeemed | | | (2,074,881 | ) | | | (49,216,070 | ) |
| | | | |
Net increase (decrease) | | | 187,321 | | | $ | 4,002,338 | |
| | | | |
Year ended October 31, 2018: | | | | | | | | |
Shares sold | | | 1,421,800 | | | $ | 38,823,618 | |
Shares issued to shareholders in reinvestment of dividends and distributions | | | 40,660 | | | | 1,042,924 | |
Shares redeemed | | | (1,650,017 | ) | | | (43,712,786 | ) |
| | | | |
Net increase (decrease) | | | (187,557 | ) | | $ | (3,846,244 | ) |
| | | | |
| | |
| | | | | | | | |
Class R3 | | Shares | | | Amount | |
| | |
Year ended October 31, 2019: | | | | | | | | |
Shares sold | | | 4,060 | | | $ | 95,894 | |
Shares issued to shareholders in reinvestment of dividends and distributions | | | 419 | | | | 9,593 | |
Shares redeemed | | | (531 | ) | | | (12,326 | ) |
| | | | |
Net increase (decrease) | | | 3,948 | | | $ | 93,161 | |
| | | | |
Year ended October 31, 2018: | | | | | | | | |
Shares sold | | | 3,394 | | | $ | 92,048 | |
Shares issued to shareholders in reinvestment of dividends and distributions | | | 13 | | | | 342 | |
Shares redeemed | | | (1,694 | ) | | | (47,741 | ) |
| | | | |
Net increase (decrease) | | | 1,713 | | | $ | 44,649 | |
| | | | |
Note 10–Litigation
The Fund has been named as a defendant in the case entitledKirschner v. FitzSimons,No.12-2652 (S.D.N.Y.) (the “FitzSimonsaction”) as a result of its ownership of shares in the Tribune Company (“Tribune”) in 2007 when Tribune effected a leveraged buyout transaction (“LBO”) by which Tribune converted to a privately-held company. In its complaint, the plaintiff asserts claims against certain insiders, shareholders, professional advisers, and others involved in the LBO. Separately, the complaint also seeks to obtain from former Tribune shareholders, including the Fund, any proceeds they received in connection with the LBO. The sole claim and cause of action brought against the Fund is for fraudulent conveyance pursuant to United States Bankruptcy Code Section 548(a)(1)(A).
In June 2011, certain Tribune creditors filed numerous additional actions asserting state law constructive fraudulent conveyance claims (the “SLCFC actions”) against specifically-named former Tribune shareholders and, in some cases, putative defendant classes comprised of former Tribune shareholders. One of the SLCFC actions, entitledDeutsche Bank Trust Co. Americas v. Blackrock Institutional Trust Co., No. 11-9319 (S.D.N.Y.) (the “Deutsche Bank action”), named the Fund as a defendant.
TheFitzSimonsaction andDeutsche Bankaction have been consolidated with the majority of the other Tribune LBO-related lawsuits in a multidistrict litigation proceeding entitledIn re Tribune Co. Fraudulent Conveyance Litig., No. 11-md-2296 (S.D.N.Y.) (the “MDL Proceeding”).
On September 23, 2013, the District Court granted the defendants’ motion to dismiss the SLCFC actions, including the Deutsche Bank action, on the basis that the plaintiffs did not have standing to pursue their claims. On September 30, 2013, the plaintiffs in the SLCFC actions filed a notice of appeal to the United States Court of Appeals for the Second Circuit. On October 28, 2013, the defendants filed a joint notice of cross-appeal of that same order. On November 5, 2014, the Second Circuit Court of Appeals held an oral argument on appeal. On March 29, 2016, the United States Court of Appeals for the Second Circuit issued its opinion on the appeal of the SLCFC actions. The appeals court affirmed the District Court’s dismissal of those lawsuits, but on different grounds than the District Court. The appeals court held that while the plaintiffs have standing under the U.S. Bankruptcy Code, their claims were preempted by Section 546(e) of the Bankruptcy Code—the statutory safe harbor for settlement payments. On April 12, 2016, the plaintiffs in the SLCFC actions filed a petition seeking rehearingen bancbefore the appeals court. On July 22, 2016, the appeals court denied the petition. On September 9, 2016, the plaintiffs filed a petition for writ of certiorari in the U.S. Supreme Court challenging the Second Circuit’s decision that the safe harbor of Section 546(e) applied to their claims. Certain shareholder defendants filed a joint brief in opposition to the petition for certiorari on October 24, 2016. The plaintiffs filed a reply in support of the petition on November 4, 2016. On April 3, 2018, Justice Kennedy and Justice Thomas issued a “Statement” related to the petition for certiorari suggesting that the Second Circuit and/or District Court may want to take steps to reexamine the application of the Section 546(e) safe harbor to the previously dismissed state law constructive fraudulent transfer claims based on the Supreme Court’s decision inMerit Management Group LP v. FTI Consulting, Inc. On April 10, 2018, the plaintiffs filed in the Second Circuit a motion for that
| | |
| 26 | | MainStay MacKay Common Stock Fund |
court to recall its mandate, vacate its prior decision, and remand to the District Court for further proceedings consistent withMerit Management. On April 20, 2018, the shareholder defendants filed a response to the plaintiffs’ motion to recall the mandate. On May 15, 2018, the Second Circuit issued an order recalling the mandate “in anticipation of further panel review.”
On August 2, 2013, the plaintiff in the FitzSimons action filed a Fifth Amended Complaint. On May 23, 2014, the defendants filed motions to dismiss theFitzSimonsaction, including a global motion to dismiss Count I, which is the claim brought against former Tribune shareholders for intentional fraudulent conveyance under U.S. federal law. On January 6, 2017, the United States District Court for the Southern District of New York granted the shareholder defendants’ motion to dismiss the intentional fraudulent conveyance claim in the FitzSimons action. In dismissing the intentional fraudulent conveyance claim, the Court denied the plaintiff’s request to amend the complaint. The Court’s order is not immediately appealable, but the plaintiff has asked the Court to direct entry of a final judgment in order to make the order immediately appealable. On February 23, 2017, the Court issued an order stating that it intends to permit an interlocutory appeal of the dismissal order, but will wait to do so until it has resolved outstanding motions to dismiss filed by other defendants.
On July 18, 2017, the plaintiff submitted a letter to the District Court seeking leave to amend its complaint to add a constructive fraudulent transfer claim. The shareholder defendants opposed that request.
On August 24, 2017, the Court denied the plaintiff’s request without prejudice to renewal of the request in the event of an intervening change in the law. On March 8, 2018, plaintiff renewed the request for leave to file a motion to amend the complaint to assert a constructive fraudulent transfer claim based on the Supreme Court’s ruling inMerit Management.The shareholder defendants opposed that request. On June 18, 2018, the District Court ordered that the request would be stayed pending further action by the Second Circuit in the still-pending appeal, discussed above. On December 18, 2018, the plaintiff filed a letter with the District Court requesting that the stay be dissolved in order to permit briefing on the motion to amend the complaint and indicating the plaintiff’s intention to file another motion to amend the complaint to reinstate claims for intentional fraudulent transfer. The shareholder defendants opposed that request. On January 14, 2019, the Court held a case management conference, during which the Court stated that it would not lift the stay prior to further action from the Second Circuit. The Court stated that it would allow the plaintiff to file a motion to amend to try to reinstate its intentional fraudulent transfer claim. On January 23, 2019, the Court ordered the parties still facing pending claims to participate in a mediation. On March 27, 2019, the Court held a telephone conference and decided to allow the plaintiff to file a motion for leave to amend. On April 4, 2019, the plaintiff filed a motion to amend the Fifth Amended Complaint to assert a federal constructive fraudulent transfer claim against certain shareholder defendants. On April 10, 2019, the shareholders’ defendants filed a brief in opposition to the plaintiff’s motion to amend. On April 12, 2019, the
plaintiff filed a reply brief. The Court denied leave to amend the complaint on April 23, 2019. On June 13, 2019, the Court entered judgment pursuant to Rule 54(b), which would permit an appeal of the Court’s dismissal of the claim against the shareholder defendants. On July 15, 2019, the Trustee filed a notice of appeal to the Second Circuit. In addition, the District Court has entered two bar orders in connection with the plaintiff’s settlement with certain non-shareholder defendants. The orders bar claims against the settling defendants, but contain a judgment reduction provision that preserves the value of any potential claim by a shareholder defendant against a settling defendant. Specifically, the judgment reduction provision reduces the amount of money recoverable against a shareholder defendant to the extent the shareholder defendant could have recovered on a claim against a settling defendant.
The value of the proceeds received by the Fund in connection with the LBO and the Fund’s cost basis in shares of Tribune was as follows:
| | | | | | | | |
Fund | | Proceeds | | | Cost Basis | |
MainStay MacKay Common Stock Fund | | $ | 751,774 | | | $ | 729,369 | |
At this stage of the proceedings, the Fund does not believe a loss is probable; however, it is difficult to assess with any reasonable certainty the outcome of the pending litigation or the effect, if any, on the Fund’s net asset value.
Note 11–Recent Accounting Pronouncement
To improve the effectiveness of fair value disclosure requirements, the Financial Accounting Standards Board recently issued Accounting Standards Update (ASU)2018-13, Fair Value Measurement Disclosure Framework—Changes to the Disclosure Requirements for Fair Value Measurement (ASU2018-13), which adds, removes, and modifies certain aspects relating to fair value disclosure. ASU2018-13 is effective for interim and annual reporting periods beginning after December 15, 2019; early adoptions of the entire ASU 2018-13, or portions thereof, is permitted. Management has evaluated the implications of certain other provisions of the ASU and has determined to early adopt aspects related to the removal and modifications of certain fair value measurement disclosures under the ASU effective immediately. At this time, management is evaluating the implications of certain other provisions of the ASU related to new disclosure requirements and any impact on the financial statement disclosures has not yet been determined.
Note 12–Subsequent Events
In connection with the preparation of the financial statements of the Fund as of and for the year ended October 31, 2019, events and transactions subsequent to October 31, 2019, through the date the financial statements were issued have been evaluated by the Fund’s management for possible adjustment and/or disclosure. No subsequent events requiring financial statement adjustment or disclosure have been identified.
Report of Independent Registered Public Accounting Firm
To the Shareholders and Board of Trustees
The MainStay Funds:
Opinion on the Financial Statements
We have audited the accompanying statement of assets and liabilities of MainStay MacKay Common Stock Fund (the Fund), one of the funds constituting The MainStay Funds, including the portfolio of investments, as of October 31, 2019, the related statement of operations for the year then ended, the statements of changes in net assets for each of the years in thetwo-year period then ended, and the related notes (collectively, the financial statements) and the financial highlights for each of the years or periods in thefive-year period then ended. In our opinion, the financial statements and financial highlights present fairly, in all material respects, the financial position of the Fund as of October 31, 2019, the results of its operations for the year then ended, the changes in its net assets for each of the years in thetwo-year period then ended, and the financial highlights for each of the years or periods in thefive-year period then ended, in conformity with U.S. generally accepted accounting principles.
Basis for Opinion
These financial statements and financial highlights are the responsibility of the Fund’s management. Our responsibility is to express an opinion on these financial statements and financial highlights based on our audits. We are a public accounting firm registered with the Public Company Accounting Oversight Board (United States) (PCAOB) and are required to be independent with respect to the Fund in accordance with the U.S. federal securities laws and the applicable rules and regulations of the Securities and Exchange Commission and the PCAOB.
We conducted our audits in accordance with the standards of the PCAOB. Those standards require that we plan and perform the audit to obtain reasonable assurance about whether the financial statements and financial highlights are free of material misstatement, whether due to error or fraud. Our audits included performing procedures to assess the risks of material misstatement of the financial statements and financial highlights, whether due to error or fraud, and performing procedures that respond to those risks. Such procedures included examining, on a test basis, evidence regarding the amounts and disclosures in the financial statements and financial highlights. Such procedures also included confirmation of securities owned as of October 31, 2019, by correspondence with the custodian and the transfer agent. Our audits also included evaluating the accounting principles used and significant estimates made by management, as well as evaluating the overall presentation of the financial statements and financial highlights. We believe that our audits provide a reasonable basis for our opinion.

We have served as the auditor of one or more New York Life Investment Management investment companies since 2003.
Philadelphia, Pennsylvania
December 23, 2019
| | |
| 28 | | MainStay MacKay Common Stock Fund |
Federal Income Tax Information
(Unaudited)
The Fund is required under the Internal Revenue Code to advise shareholders in a written statement as to the federal tax status of dividends paid by the Fund during such fiscal years. Accordingly, the Fund paid $14,286,611 as long term capital gain distributions.
For the fiscal year ended October 31, 2019, the Fund designated approximately $3,011,270 under the Internal Revenue Code as qualified dividend income eligible for reduced tax rates.
The dividends paid by the Fund during the fiscal year ended October 31, 2019 should be multiplied by 36.44% to arrive at the amount eligible for the corporate dividend-received deduction.
In February 2020, shareholders will receive an IRS Form1099-DIV or substitute Form 1099, which will show the federal tax status of the distributions received by shareholders in calendar year 2019. The amounts that will be reported on such1099-DIV or substitute Form 1099 will be the amounts you are to use on your federal income tax return and will differ from the amounts which we must report for the Fund’s fiscal year end October 31, 2019.
Proxy Voting Policies and Procedures and Proxy Voting Record
A description of the policies and procedures that New York Life Investments uses to vote proxies related to the Fund’s securities is available without charge, upon request, by visiting the MainStay Funds’ website atnylinvestments.com/fundsor visiting the SEC’s website atwww.sec.gov.
The Fund is required to file with the SEC its proxy voting records for the12-month period ending June 30 on Form N-PX. The most recent Form N-PX or proxy voting record is available free of charge upon request by calling800-624-6782; visiting the MainStay Funds’ website atnylinvestments.com/funds; or visiting the SEC’s website atwww.sec.gov.
Shareholder Reports and Quarterly Portfolio Disclosure
The Fund is required to file its complete schedule of portfolio holdings with the SEC 60 days after its first and third fiscal quarter onForm N-PORT. The Fund’s holdings report is available free of charge by visiting the SEC’s website atwww.sec.govor upon request by calling New York Life Investments at800-624-6782.
Board of Trustees and Officers (Unaudited)
The Trustees and officers of the Funds are listed below. The Board oversees the MainStay Group of Funds (which consists of MainStay Funds and MainStay Funds Trust), MainStay VP Funds Trust, MainStay MacKay DefinedTerm Municipal Opportunities Fund, the Manager and the Subadvisors, and elects the officers of the Funds who are responsible for theday-to-day operations of the Funds. Information pertaining to the Trustees and officers is set forth below. Each Trustee serves until his or her successor is elected and qualified or until his or her
resignation, death or removal. Under the Board’s retirement policy, unless an exception is made, a Trustee must tender his or her resignation by the end of the calendar year during which he or she reaches the age of 75. Officers are elected annually by the Board. The business address of each Trustee and officer listed below is 51 Madison Avenue, New York, New York 10010. A majority of the Trustees are not “interested persons” (as defined by the 1940 Act and rules adopted by the SEC thereunder) of the Fund (“Independent Trustees”).
| | | | | | | | | | | | |
| | | | | Name and
Year of Birth | | Term of Office,
Position(s) Held and
Length of Service | | Principal Occupation(s)
During Past Five Years | | Number of
Portfolios in
Fund Complex
Overseen by
Trustee | | Other Directorships
Held by Trustee |
Interested Trustee | | | | Yie-Hsin Hung* 1962 | | MainStay Funds: Trustee since 2017; MainStay Funds Trust:Trustee since 2017. | | Senior Vice President of New York Life since joining in 2010, Member of the Executive Management Committee since 2017, Chief Executive Officer, New York Life Investment Management Holdings LLC & New York Life Investment Management LLC since 2015. Senior Managing Director andCo-President of New York Life Investment Management LLC from January 2014 to May 2015. Previously held positions of increasing responsibility, including head of NYLIM International, Alternative Growth Businesses, and Institutional investments since joining New York Life in 2010. | | 74 | | MainStay VP Funds Trust:
Trustee since 2017 (31 portfolios); and
MainStay MacKay DefinedTerm Municipal Opportunities Fund: Trustee since 2017. |
| | * | This Trustee is considered to be an “interested person” of the MainStay Group of Funds, MainStay VP Funds Trust and MainStay MacKay DefinedTerm Municipal Opportunities Fund, within the meaning of the 1940 Act because of her affiliation with New York Life Insurance Company, New York Life Investment Management LLC, Candriam Belgium S.A., Candriam Luxembourg S.C.A., IndexIQ Advisors LLC, MacKay Shields LLC, NYL Investors LLC, NYLIFE Securities LLC and/or NYLIFE Distributors LLC, as described in detail above in the column entitled “Principal Occupation(s) During Past Five Years.” |
| | |
| 30 | | MainStay MacKay Common Stock Fund |
| | | | | | | | | | | | |
| | | | | Name and
Year of Birth | | Term of Office,
Position(s) Held and
Length of Service | | Principal Occupation(s)
During Past Five Years | | Number of
Portfolios in
Fund Complex
Overseen by
Trustee | | Other Directorships
Held by Trustee |
Independent Trustees | | | | David H. Chow 1957 | | MainStay Funds: Trustee since 2016, Advisory Board Member (June 2015 to December 2015); MainStay Funds Trust:Trustee since 2016, Advisory Board Member (June 2015 to December 2015). | | Founder and CEO, DanCourt Management, LLC (since 1999) | | 74 | | MainStay VP Funds Trust: Trustee since 2016, Advisory Board Member (June 2015 to December 2015) (31 portfolios);
MainStay MacKay DefinedTerm Municipal Opportunities Fund: Trustee since 2016, Advisory Board Member (June 2015 to December 2015);
Market Vectors Group of Exchange-Traded Funds: Independent Chairman of the Board of Trustees since 2008 and Trustee since 2006 (56 portfolios); and
Berea College of Kentucky: Trustee since 2009. |
| | | | Susan B. Kerley 1951 | | MainStay Funds: Chairman since 2017 and Trustee since 2007; MainStay Funds Trust:Chairman since 2017 and Trustee since 1990.** | | President, Strategic Management Advisors LLC (since 1990) | | 74 | | MainStay VP Funds Trust: Chairman since January 2017 and Trustee since 2007 (31 portfolios)***;
MainStay MacKay DefinedTerm Municipal Opportunities Fund: Chairman since 2017 and Trustee since 2011; and
Legg Mason Partners Funds: Trustee since 1991 (45 portfolios). |
| | | | Alan R. Latshaw 1951 | | MainStay Funds: Trustee; MainStay Funds Trust: Trustee and Audit Committee Financial Expert since 2007.** | | Retired; Partner, Ernst & Young LLP (2002 to 2003); Partner, Arthur Andersen LLP (1989 to 2002); Consultant to the MainStay Funds Audit and Compliance Committee (2004 to 2006) | | 74 | | MainStay VP Funds Trust: Trustee and Audit Committee Financial Expert since 2007 (31 portfolios)***;
MainStay MacKay DefinedTerm Municipal Opportunities Fund: Trustee and Audit Committee Financial Expert since 2011;
State Farm Associates Funds Trusts: Trustee since 2005 (4 portfolios);
and State Farm Variable Product Trust: Trustee since 2005 (9 portfolios). |
| | | | Richard H. Nolan, Jr. 1946 | | MainStay Funds: Trustee since 2007; MainStay Funds Trust:Trustee since 2007.** | | Managing Director, ICC Capital Management (since 2004); President—Shields/Alliance, Alliance Capital Management (1994 to 2004) | | 74 | | MainStay VP Funds Trust: Trustee since 2006 (31 portfolios)***; and
MainStay MacKay DefinedTerm Municipal Opportunities Fund: Trustee since 2011. |
| | | | Jacques P. Perold 1958 | | MainStay Funds: Trustee since 2016, Advisory Board Member (June 2015 to December 2015); MainStay Funds Trust:Trustee since 2016, Advisory Board Member (June 2015 to December 2015). | | Retired; President, Fidelity Management & Research Company (2009 to 2014); Founder, President and Chief Executive Officer, Geode Capital Management, LLC (2001 to 2009) | | 74 | | MainStay VP Funds Trust: Trustee since 2016, Advisory Board Member (June 2015 to December 2015) (31 portfolios);
MainStay MacKay DefinedTerm Municipal Opportunities Fund: Trustee since 2016, Advisory Board Member (June 2015 to December 2015);
Allstate Corporation: Director since 2015;MSCI, Inc.: Director since 2017 and
Boston University: Trustee since 2014. |
| | | | | | | | | | | | |
| | | | | Name and
Year of Birth | | Term of Office,
Position(s) Held and
Length of Service | | Principal Occupation(s)
During Past Five Years | | Number of
Portfolios in
Fund Complex
Overseen by
Trustee | | Other Directorships
Held by Trustee |
Independent Trustees | | | | Richard S. Trutanic 1952 | | MainStay Funds: Trustee since 1994; MainStay Funds Trust: Trustee since 2007.** | | Chairman and Chief Executive Officer, Somerset & Company (financial advisory firm) (since 2004); Managing Director, The Carlyle Group (private investment firm) (2002 to 2004); Senior Managing Director, Partner and Board Member, Groupe Arnault S.A. (private investment firm) (1999 to 2002) | | 74 | | MainStay VP Funds Trust: Trustee since 2007 (31 portfolios)***; and
MainStay MacKay DefinedTerm Municipal Opportunities Fund: Trustee since 2011. |
| | ** | Includes prior service as a Director/Trustee of certain predecessor entities to MainStay Funds Trust. |
| | *** | Includes prior service as a Director of MainStay VP Series Fund, Inc., the predecessor to MainStay VP Funds Trust. |
| | |
| 32 | | MainStay MacKay Common Stock Fund |
| | | | | | | | |
| | | | | Name and
Year of Birth | | Position(s) Held and
Length of Service | | Principal Occupation(s)
During Past Five Years |
Officers
of the
Trust
(Who are
not
Trustees)* | | | | Kirk C. Lehneis 1974 | | President, MainStay Funds, MainStay Funds Trust (since 2017) | | Chief Operating Officer and Senior Managing Director (since 2016), New York Life Investment Management LLC; Chairman of the Board (since 2017), NYLIFE Distributors LLC; Chairman of the Board, NYLIM Service Company LLC (since 2017); Trustee, President and Principal Executive Officer of IndexIQ Trust, IndexIQ ETF Trust and IndexIQ Active ETF Trust (since January 2018); President, MainStay MacKay DefinedTerm Municipal Opportunities Fund and MainStay VP Funds Trust
(since 2017)**; Senior Managing Director, Global Product Development (2015 to 2016); Managing Director, Product Development (2010 to 2015), New York Life Investment Management LLC |
| | | | Jack R. Benintende 1964 | | Treasurer and Principal Financial and Accounting Officer, MainStay Funds (since 2007), MainStay Funds Trust (since 2009) | | Managing Director, New York Life Investment Management LLC (since 2007); Treasurer and Principal Financial and Accounting Officer, MainStay MacKay DefinedTerm Municipal Opportunities Fund (since 2011) and MainStay VP Funds Trust (since 2007)**; and Assistant Treasurer, New York Life Investment Management Holdings LLC (2008 to 2012) |
| | | | Kevin M. Bopp 1969 | | Vice President and Chief Compliance Officer, MainStay Funds and MainStay Funds Trust (since 2014) | | Chief Compliance Officer, New York Life Investment Management LLC, IndexIQ Trust, IndexIQ ETF Trust and IndexIQ Active ETF Trust (since 2016), Director and Associate General Counsel (2011 to 2014) and Vice President and Assistant General Counsel (2010 to 2011), New York Life Investment Management LLC; Vice President and Chief Compliance Officer, MainStay VP Funds Trust, MainStay MacKay DefinedTerm Municipal Opportunities Fund (since 2014); Assistant Secretary, MainStay Funds, MainStay Funds Trust and MainStay VP Funds Trust (2010 to 2014)**, MainStay MacKay DefinedTerm Municipal Opportunities Fund (2011 to 2014) |
| | | | J. Kevin Gao 1967 | | Secretary and Chief Legal Officer, MainStay Funds and MainStay Funds Trust (since 2010) | | Managing Director and Associate General Counsel, New York Life Investment Management LLC (since 2010); Secretary and Chief Legal Officer, MainStay MacKay DefinedTerm Municipal Opportunities Fund (since 2011) and MainStay VP Funds Trust (since 2010)** |
| | | | Scott T. Harrington 1959 | | Vice President—Administration, MainStay Funds (since 2005), MainStay Funds Trust (since 2009) | | Managing Director, New York Life Investment Management LLC (including predecessor advisory organizations) (since 2000); Member of the Board of Directors, New York Life Trust Company (since 2009); Vice President—Administration, MainStay MacKay DefinedTerm Municipal Opportunities Fund (since 2011) and MainStay VP Funds Trust (since 2005)** |
| | * | The officers listed above are considered to be “interested persons” of the MainStay Group of Funds, MainStay VP Funds Trust and MainStay MacKay Defined Term Municipal Opportunities Fund within the meaning of the 1940 Act because of their affiliation with the MainStay Group of Funds, New York Life Insurance Company and/or its affiliates, including New York Life Investment Management LLC, NYLIM Service Company LLC, NYLIFE Securities LLC and/or NYLIFE Distributors LLC, as described in detail in the column captioned “Principal Occupation(s) During Past Five Years.” Officers are elected annually by the Board. |
| | ** | Includes prior service as an Officer of MainStay VP Series Fund, Inc., the predecessor to MainStay VP Funds Trust. |
MainStay Funds
Equity
U.S. Equity
MainStay Epoch U.S. All Cap Fund
MainStay Epoch U.S. Equity Yield Fund
MainStay Large Cap Growth Fund
MainStay MacKay Common Stock Fund
MainStay MacKay Growth Fund
MainStay MacKay S&P 500 Index Fund
MainStay MacKay Small Cap Core Fund1
MainStay MacKay U.S. Equity Opportunities Fund
MainStay MAP Equity Fund
International Equity
MainStay Epoch International Choice Fund
MainStay MacKay International Equity Fund
MainStay MacKay International Opportunities Fund
Emerging Markets Equity
MainStay Candriam Emerging Markets Equity Fund
MainStay MacKay Emerging Markets Equity Fund
Global Equity
MainStay Epoch Capital Growth Fund
MainStay Epoch Global Equity Yield Fund
Fixed Income
Taxable Income
MainStay Candriam Emerging Markets Debt Fund2
MainStay Floating Rate Fund
MainStay Indexed Bond Fund3
MainStay MacKay High Yield Corporate Bond Fund
MainStay MacKay Infrastructure Bond Fund
MainStay MacKay Short Duration High Yield Fund
MainStay MacKay Total Return Bond Fund
MainStay MacKay Unconstrained Bond Fund
Tax-Exempt Income
MainStay MacKay California Tax Free Opportunities Fund4
MainStay MacKay High Yield Municipal Bond Fund
MainStay MacKay Intermediate Tax Free Bond Fund
MainStay MacKay New York Tax Free Opportunities Fund5
MainStay MacKay Short Term Municipal Fund
MainStay MacKay Tax Free Bond Fund
Money Market
MainStay Money Market Fund
Mixed Asset
MainStay Balanced Fund
MainStay Income Builder Fund
MainStay MacKay Convertible Fund
Speciality
MainStay Cushing Energy Income Fund
MainStay Cushing MLP Premier Fund
MainStay Cushing Renaissance Advantage Fund
Asset Allocation
MainStay Conservative Allocation Fund
MainStay Growth Allocation Fund
MainStay Moderate Allocation Fund
MainStay Moderate Growth Allocation Fund
Manager
New York Life Investment Management LLC
New York, New York
Subadvisors
Candriam Belgium S.A.6
Brussels, Belgium
Candriam Luxembourg S.C.A.6
Strassen, Luxembourg
Cushing Asset Management, LP
Dallas, Texas
Epoch Investment Partners, Inc.
New York, New York
MacKay Shields LLC6
New York, New York
Markston International LLC
White Plains, New York
NYL Investors LLC6
New York, New York
Winslow Capital Management, LLC
Minneapolis, Minnesota
Legal Counsel
Dechert LLP
Washington, District of Columbia
Independent Registered Public Accounting Firm
KPMG LLP
Philadelphia, Pennsylvania
| 1. | Formerly known as MainStay Epoch U.S. Small Cap Fund. |
| 2. | Formerly known as MainStay MacKay Emerging Markets Debt Fund. |
| 3. | Effective December 5, 2019, MainStay Indexed Bond Fund was renamed MainStay Short Term Bond Fund. |
| 4. | Class A and Class I shares of this Fund are registered for sale in AZ, CA, MI, NV, OR, TX, UT and WA. Class I shares are registered for sale in CO, FL, GA, HI, ID, MA, MD, NH, NJ and NY. |
| 5. | This Fund is registered for sale in CA, CT, DE, FL, MA, NJ, NY and VT. |
| 6. | An affiliate of New York Life Investment Management LLC. |
Not part of the Annual Report
For more information
800-624-6782
nylinvestments.com/funds
“New York Life Investments” is both a service mark, and the common trade name, of the investment advisors affiliated with New York Life Insurance Company. The MainStay Funds® are managed by New York Life Investment Management LLC and distributed by NYLIFE Distributors LLC, 30 Hudson Street, Jersey City, NJ 07302, a wholly owned subsidiary of New York Life Insurance Company. NYLIFE Distributors LLC is a Member FINRA/SIPC.
©2019 NYLIFE Distributors LLC. All rights reserved.
| | |
| 1716826 MS159-19 | | MSCS11-12/19 (NYLIM) NL219 |
MainStay Large Cap Growth Fund
Message from the President and Annual Report
October 31, 2019

Beginning on January 1, 2021, paper copies of each MainStay Fund’s annual and semiannual shareholder reports will no longer be sent by mail, unless you specifically request paper copies of the reports from MainStay Funds or from your financial intermediary. Instead, the reports will be made available on the MainStay Funds’ website. You will be notified by mail and provided with a website address to access the report each time a new report is posted to the website.
If you already elected to receive shareholder reports electronically, you will not be affected by this change and you need not take any action. At any time, you may elect to receive reports and other communications from MainStay Funds electronically by calling toll-free 800-624-6782, by sending an e-mail to MainStayShareholderServices@nylim.com, or by contacting your financial intermediary.
You may elect to receive all future shareholder reports in paper form free of charge. If you hold shares of a MainStay Fund directly, you can inform MainStay Funds that you wish to receive paper copies of reports by calling toll-free 800-624-6782 or by sending an e-mail to MainStayShareholderServices@nylim.com. If you hold shares of a MainStay Fund through a financial intermediary, please contact the financial intermediary to make this election. Your election to receive reports in paper form will apply to all MainStay Funds in which you are invested and may apply to all funds held with your financial intermediary.
| | | | | | | | |
| | | | | |
| Not FDIC/NCUA Insured | | Not a Deposit | | May Lose Value | | No Bank Guarantee | | Not Insured by Any Government Agency |

This page intentionally left blank
Message from the President
Stock and bond markets generally gained ground during the12-month reporting period ended October 31, 2019, despite concerns regarding slowing U.S. and global economic growth and international trade conflicts.
After trending higher in November 2018, U.S. stocks and bonds dipped sharply in December 2018, over concerns regarding the pace of economic growth, a U.S. government shutdown and the potential impact of trade disputes between the United States and other nations, particularly China. U.S. markets recovered quickly in 2019 as trade tensions eased, the government reopened and the U.S. Federal Reserve Board (“Fed”) adopted a more accommodative tone regarding the future direction of interest rates. A wide spectrum of equity and fixed-income sectors gained ground through April 2019. Mixed macroeconomic signals and the inability of China and the United States to reach a trade agreement caused the market’s recovery to suffer during the spring and summer months of 2019. However, accommodative monetary policies from several central banks, including a series of interest rate cuts by the Fed, along with better-than-expected corporate earnings reassured investors and enabled markets to resume their advance.
Persistent, albeit slow, U.S. economic growth underpinned the U.S. stock market’s advance during the reporting period, positioning major U.S. equity indices to reach record territory by late October 2019. Sector strength shifted as investor sentiment alternated betweenrisk-on andrisk-off positions. In general, for the reporting period, cyclical, growth-oriented stocks outperformed their value-oriented counterparts by a small margin, with the information technology sector leading thelarge-cap S&P 500® Index. However, the traditionally more defensive areas of real estate and utilities generated above-average performance as well. Communication services, consumer discretionary, industrials and consumer staples performed in the middle of the pack, while materials, financials and health care lagged. Only the energy sector suffered declines, undermined by weak oil prices and concerns about future energy demand.
In the fixed-income markets, slowing economic growth, modest inflation and the Fed’s interest rate cuts created an environment of falling yields and rising prices for most bonds, with many areas of the market offering historically low yields by the end of the reporting period. Higher-credit-quality, longer-duration securities generally produced strong returns, with investment-
grade corporates and long-term Treasury bonds delivering particularly strong performance. A similar dynamic characterized the performance of the municipal bond market, with longer-term, higher-grade issues performing relatively well. On average, municipal bonds roughly matched the gains of corporate issues while providingtax-advantaged returns for eligible investors.
International stock and bond markets tended to underperform their U.S. counterparts, constrained by lackluster economic growth in the Eurozone and dramatically slowing growth in China and related parts of Asia amid persistent trade tensions with the United States. Uncertainties surrounding the unending Brexit drama took a further toll on investor confidence, with Britain seemingly unable to resolve its internal conflicts over how, or whether, to exit from the European Union. Nevertheless, on average, international securities delivered modestly positive returns, bolstered by the accommodative monetary policies implemented by European and Asian central banks. Bonds from both emerging and developed markets generally produced stronger returns than equities while repeating the pattern of outperformance by higher-quality, longer-term instruments seen in the United States.
As the economic growth cycle lengthens, investors are left to ponder how best to position their portfolios for an uncertain future. When the yield curve inverted earlier this year prompting concerns of a potential recession, we were reminded that the direction of the economy is continually subject to change, and perceptions of the economy can shift even more rapidly. As a MainStay investor, you can rely on us to manage our Funds with unflagging energy and dedication so that you can remain focused on your long-term objectives in the face of uncertainty and change. Our goal remains to provide you with the consistently reliable financial tools you need to achieve your long-term objectives.
Sincerely,

Kirk C. Lehneis
President
The opinions expressed are as of the date of this report and are subject to change. There is no guarantee that any forecast made will come to pass. This material does not constitute investment advice and is not intended as an endorsement of any specific investment. Past performance is no guarantee of future results.
Not part of the Annual Report
Table of Contents
Investors should refer to the Fund’s Summary Prospectus and/or Prospectus and consider the Fund’s investment objectives, strategies, risks, charges and expenses carefully before investing. The Summary Prospectus and/or Prospectus contain this and other information about the Fund. You may obtain copies of the Fund’s Summary Prospectus, Prospectus and Statement of Additional Information free of charge, upon request, by calling toll-free 800-624-6782, by writing to NYLIFE Distributors LLC, Attn: MainStay Marketing Department, 30 Hudson Street, Jersey City, NJ 07302 or by sending ane-mail to MainStayShareholderServices@nylim.com. These documents are also available via the MainStay Funds’ website at nylinvestments.com/funds. Please read the Summary Prospectus and/or Prospectus carefully before investing.
Investment and Performance Comparison1(Unaudited)
Performance data quoted represents past performance. Past performance is no guarantee of future results. Because of market volatility and other factors, current performance may be lower or higher than the figures shown. Investment return and principal value will fluctuate, and as a result, when shares are redeemed, they may be worth more or less than their original cost. The graph below depicts the historical performance of Class A shares of the Fund. Performance will vary from class to class based on differences in class-specific expenses and sales charges. For performance information current to the most recent month-end, please call800-624-6782 or visit nylinvestments.com/funds.
(With sales charges)
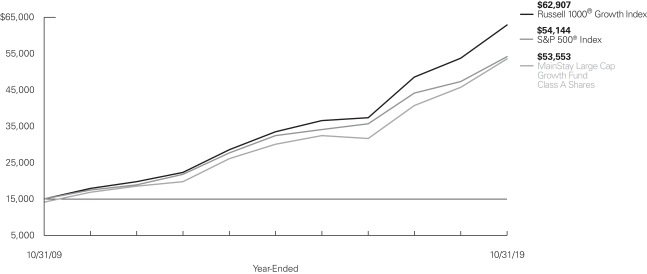
Average Annual Total Returns for the Year-Ended October 31, 2019
| | | | | | | | | | | | | | | | | | |
| Class | | Sales Charge | | | | Inception
Date | | | One
Year | | Five
Years | | Ten Years
or Since
Inception | | Gross
Expense
Ratio2 | |
| | | | | | | |
| Class A Shares | | Maximum 5.5% Initial Sales Charge | | With sales charges Excluding sales charges | | | 7/1/1995 | | | 10.61%
17.05 | | 11.00%
12.26 | | 13.57%
14.22 | |
| 0.98
0.98 | %
|
| Investor Class Shares | | Maximum 5.5% Initial Sales Charge | | With sales charges Excluding sales charges | | | 2/28/2008 | | | 10.53
16.96 | | 10.91
12.18 | | 13.48
14.13 | |
| 1.07
1.07 |
|
| Class B Shares3 | | Maximum 5% CDSC if Redeemed Within the First Six Years of Purchase | | With sales charges Excluding sales charges | |
| 4/1/2005
|
| | 11.40
15.96 | | 11.14
11.34 | | 13.28
13.28 | |
| 1.82
1.82 |
|
| Class C Shares | | Maximum 1% CDSC if Redeemed Within One Year of Purchase | | With sales charges Excluding sales charges | |
| 4/1/2005
|
| | 15.06
15.97 | | 11.33
11.33 | | 13.26
13.26 | |
| 1.82
1.82 |
|
| Class I Shares | | No Sales Charge | | | | | 4/1/2005 | | | 17.29 | | 12.53 | | 14.51 | | | 0.73 | |
| Class R1 Shares | | No Sales Charge | | | | | 4/1/2005 | | | 17.25 | | 12.44 | | 14.39 | | | 0.83 | |
| Class R2 Shares | | No Sales Charge | | | | | 4/1/2005 | | | 16.89 | | 12.13 | | 14.10 | | | 1.08 | |
| Class R3 Shares | | No Sales Charge | | | | | 4/28/2006 | | | 16.69 | | 11.87 | | 13.82 | | | 1.33 | |
| Class R6 Shares | | No Sales Charge | | | | | 6/17/2013 | | | 17.49 | | 12.67 | | 14.67 | | | 0.64 | |
| 1. | The performance table and graph do not reflect the deduction of taxes that a shareholder would pay on distributions or Fund share redemptions. Total returns reflect maximum applicable sales charges as indicated in the table above, if any, changes in share price, and reinvestment of dividend and capital gain distributions. The graph assumes the initial investment amount shown above and reflects the deduction of all sales charges that would have applied for the period of investment. Performance figures may reflect certain fee waivers and/or expense limitations, without which total returns may have |
| | been lower. For more information on share classes and current fee waivers and/or expense limitations (if any), please refer to the Notes to Financial Statements. |
| 2. | The gross expense ratios presented reflect the Fund’s “Total Annual Fund Operating Expenses” from the most recent Prospectus and may differ from other expense ratios disclosed in this report. |
| 3. | Class B shares are closed to all new purchases as well as additional investments by existing Class B shareholders. |
The footnotes on the next page are an integral part of the table and graph and should be carefully read in conjunction with them.
| | | | | | | | | | | | |
| Benchmark Performance | | One
Year | | | Five
Years | | | Ten
Years | |
| | | |
Russell 1000® Growth Index4 | | | 17.10 | % | | | 13.43 | % | | | 15.41 | % |
S&P 500® Index5 | | | 14.33 | | | | 10.78 | | | | 13.70 | |
Morningstar Large Growth Category Average6 | | | 14.51 | | | | 11.00 | | | | 13.63 | |
| 4. | The Russell 1000® Growth Index is the Fund’s primary broad-based securities market index for comparison purposes. The Russell 1000® Growth Index measures the performance of thelarge-cap growth segment of the U.S. equity universe. It includes those Russell 1000® Index companies with higherprice-to-book ratios and higher forecasted growth values. Results assume reinvestment of all dividends and capital gains. An investment cannot be made directly in an index. |
| 5. | The S&P 500® Index is the Fund’s secondary benchmark. “S&P 500®” is a trademark of The McGraw-Hill Companies, Inc. The S&P 500® Index is widely regarded as the standard index for measuringlarge-cap U.S. stock- |
| | market performance. Results assume reinvestment of all dividends and capital gains. An investment cannot be made directly in an index. |
| 6. | The Morningstar Large Growth Category Average is representative of funds that invest primarily in big U.S. companies that are projected to grow faster than other large-cap stocks. Stocks in the top 70% of the capitalization of the U.S. equity market are defined as large cap. Growth is defined based on fast growth and high valuations. Most of these portfolios focus on companies in rapidly expanding industries. Results are based on average total returns of similar funds with all dividends and capital gain distributions reinvested. |
The footnotes on the preceding page are an integral part of the table and graph and should be carefully read in conjunction with them.
| | |
| 6 | | MainStay Large Cap Growth Fund |
Cost in Dollars of a $1,000 Investment in MainStay Large Cap Growth Fund (Unaudited)
The example below is intended to describe the fees and expenses borne by shareholders during the six-month period from May 1, 2019, to October 31, 2019, and the impact of those costs on your investment.
Example
As a shareholder of the Fund you incur two types of costs: (1) transaction costs, including exchange fees and sales charges (loads) on purchases (as applicable), and (2) ongoing costs, including management fees, distribution and/or service (12b-1) fees, and other Fund expenses (as applicable). This example is intended to help you understand your ongoing costs (in dollars) of investing in the Fund and to compare these costs with the ongoing costs of investing in other mutual funds. The example is based on an investment of $1,000 made at the beginning of the six-month period and held for the entire period from May 1, 2019, to October 31, 2019.
This example illustrates your Fund’s ongoing costs in two ways:
Actual Expenses
The second and third data columns in the table below provide information about actual account values and actual expenses. You may use the information in these columns, together with the amount you invested, to estimate the expenses that you paid during the six months ended October 31, 2019. Simply divide your account value by $1,000 (for example, an $8,600 account value divided by $1,000 = 8.6), then
multiply the result by the number under the heading entitled “Expenses Paid During Period” to estimate the expenses you paid on your account during this period.
Hypothetical Example for Comparison Purposes
The fourth and fifth data columns in the table below provide information about hypothetical account values and hypothetical expenses based on the Fund’s actual expense ratio and an assumed rate of return of 5% per year before expenses, which is not the Fund’s actual return. The hypothetical account values and expenses may not be used to estimate the actual ending account balances or expenses you paid for thesix-month period shown. You may use this information to compare the ongoing costs of investing in the Fund with the ongoing costs of investing in other mutual funds. To do so, compare this 5% hypothetical example with the 5% hypothetical examples that appear in the shareholder reports of the other mutual funds.
Please note that the expenses shown in the table are meant to highlight your ongoing costs only and do not reflect any transactional costs, such as exchange fees or sales charges (loads). Therefore, the fourth and fifth data columns of the table are useful in comparing ongoing costs only and will not help you determine the relative total costs of owning different funds. In addition, if these transactional costs were included, your costs would have been higher.
| | | | | | | | | | | | | | | | | | | | | | |
| | | | | | | | | | | | | | | | | | |
| Share Class | | Beginning
Account
Value
5/1/19 | | | Ending Account
Value (Based
on Actual
Returns and
Expenses)
10/31/19 | | | Expenses
Paid
During
Period1 | | | Ending Account
Value (Based
on Hypothetical
5% Annualized
Return and
Actual Expenses)
10/31/19 | | | Expenses
Paid
During
Period1 | | | Net Expense
Ratio
During
Period2 |
| | | | | | |
| Class A Shares | | $ | 1,000.00 | | | $ | 1,021.30 | | | $ | 4.99 | | | $ | 1,020.27 | | | $ | 4.99 | | | 0.98% |
| | | | | | |
| Investor Class Shares | | $ | 1,000.00 | | | $ | 1,020.60 | | | $ | 5.55 | | | $ | 1,019.71 | | | $ | 5.55 | | | 1.09% |
| | | | | | |
| Class B Shares | | $ | 1,000.00 | | | $ | 1,017.50 | | | $ | 9.36 | | | $ | 1,015.93 | | | $ | 9.35 | | | 1.84% |
| | | | | | |
| Class C Shares | | $ | 1,000.00 | | | $ | 1,016.20 | | | $ | 9.35 | | | $ | 1,015.93 | | | $ | 9.35 | | | 1.84% |
| | | | | | |
| Class I Shares | | $ | 1,000.00 | | | $ | 1,022.40 | | | $ | 3.72 | | | $ | 1,021.53 | | | $ | 3.72 | | | 0.73% |
| | | | | | |
| Class R1 Shares | | $ | 1,000.00 | | | $ | 1,022.10 | | | $ | 4.23 | | | $ | 1,021.02 | | | $ | 4.23 | | | 0.83% |
| | | | | | |
| Class R2 Shares | | $ | 1,000.00 | | | $ | 1,021.40 | | | $ | 5.50 | | | $ | 1,019.76 | | | $ | 5.50 | | | 1.08% |
| | | | | | |
| Class R3 Shares | | $ | 1,000.00 | | | $ | 1,020.60 | | | $ | 6.77 | | | $ | 1,018.50 | | | $ | 6.77 | | | 1.33% |
| | | | | | |
| Class R6 Shares | | $ | 1,000.00 | | | $ | 1,023.20 | | | $ | 3.26 | | | $ | 1,021.98 | | | $ | 3.26 | | | 0.64% |
| 1. | Expenses are equal to the Fund’s annualized expense ratio of each class multiplied by the average account value over the period, divided by 365 and multiplied by 184 (to reflect the six-month period). The table above represents the actual expenses incurred during the six-month period. In addition to the fees and expenses which the Fund bears directly, it also indirectly bears a pro rata share of the fees and expenses of the underlying funds in which it invests. Such indirect expenses are not included in the above-reported expense figures. |
| 2. | Expenses are equal to the Fund’s annualized expense ratio to reflect the six-month period. |
Industry Composition as of October 31, 2019(Unaudited)
| | | | |
| |
| Software | | | 17.9 | % |
| |
| IT Services | | | 16.2 | |
| |
| Interactive Media & Services | | | 10.4 | |
| |
| Internet & Direct Marketing Retail | | | 8.7 | |
| |
| Technology Hardware, Storage & Peripherals | | | 5.1 | |
| |
| Health Care Equipment & Supplies | | | 4.6 | |
| |
| Textiles, Apparel & Luxury Goods | | | 4.3 | |
| |
| Pharmaceuticals | | | 3.7 | |
| |
| Specialty Retail | | | 3.6 | |
| |
| Semiconductors & Semiconductor Equipment | | | 3.4 | |
| |
| Aerospace & Defense | | | 3.1 | |
| |
| Chemicals | | | 2.4 | |
| |
| Health Care Providers & Services | | | 2.0 | |
| |
| Automobiles | | | 1.9 | |
| | | | |
| |
| Capital Markets | | | 1.8 | % |
| |
| Equity Real Estate Investment Trusts | | | 1.5 | |
| |
| Life Sciences Tools & Services | | | 1.5 | |
| |
| Professional Services | | | 1.3 | |
| |
| Biotechnology | | | 1.2 | |
| |
| Health Care Technology | | | 1.0 | |
| |
| Machinery | | | 1.0 | |
| |
| Road & Rail | | | 1.0 | |
| |
| Entertainment | | | 0.9 | |
| |
| Food & Staples Retailing | | | 0.9 | |
| |
| Leisure Products | | | 0.2 | |
| |
| Short-Term Investments | | | 0.5 | |
| |
| Other Assets, Less Liabilities | | | –0.1 | |
| | | | |
| | | 100.0 | % |
| | | | |
See Portfolio of Investments beginning on page 10 for specific holdings within these categories. The Fund’s holdings are subject to change.
Top Ten Holdings as of October 31, 2019(excludingshort-term investments) (Unaudited)
| 6. | Facebook, Inc., Class A |
7. salesforce.com, Inc.
| 8. | Mastercard, Inc., Class A |
| | |
| 8 | | MainStay Large Cap Growth Fund |
Portfolio Management Discussion and Analysis(Unaudited)
Questions answered by portfolio managers Justin H. Kelly, CFA, and Patrick M. Burton, CFA, of Winslow Capital Management, LLC, the Fund’s Subadvisor.
How did MainStay Large Cap Growth Fund perform relative to its benchmarks and peer group during the 12 months ended October 31, 2019?
For the 12 months ended October 31, 2019, Class I shares of MainStay Large Cap Growth Fund returned 17.29%, outperforming the 17.10% return of the Fund’s primary benchmark, the Russell 1000® Growth Index. Over the same period, Class I shares also outperformed the 14.33% return of the S&P 500® Index, which is the Fund’s secondary benchmark, and the 14.51% return of the Morningstar Large Growth Category Average.1
What factors affected the Fund’s relative performance during the reporting period?
The Fund outperformed the Russell 1000® Growth Index during the reporting period largely due to good individual security selection, most notably in the information technology and health care sectors. Security selection proved weakest in the communication services and consumer discretionary sectors. The Fund’s relative strong gains were broadly based, with eight of eleven sectors positively contributing to relative performance versus the benchmark. (Contributions take weightings and total returns into account.)
During the reporting period, which sectors were the strongest positive contributors to the Fund’s relative performance and which sectors were particularly weak?
The information technology and health care sectors were the strongest contributors to the Fund’s relative performance during the reporting period, while the communication services and consumer discretionary sectors detracted most from relative performance.
During the reporting period, which individual stocks made the strongest positive contributions to the Fund’s absolute performance and which stocks detracted the most?
The two stocks that made the strongest positive contribution to the Fund’s absolute performance during the reporting period
were multinational technology company Apple and Moody’s Corporation, a credit rating, research and risk analysis firm. The two stocks that detracted the most from absolute performance included small business technology provider GoDaddy and online social media company Facebook.
What were some of the Fund’s largest purchases and sales during the reporting period?
The Fund’s largest purchases during the reporting period included Facebook and Apple, both mentioned above. The Fund’s largest sales during the reporting period included global real estate investment trust (REIT) American Tower and aerospace manufacturer Boeing.
How did the Fund’s sector weightings change during the reporting period?
The Fund’s allocation to the information technology sector increased the most during the reporting period, followed by increased exposure to the consumer discretionary sector. The Fund’s allocation to the industrials sector decreased the most during the reporting period, followed by health care.
How was the Fund positioned at the end of the reporting period?
As of October 31, 2019, the Fund’s exposure across Winslow Capital Management’s proprietary three types of growth was as follows: 40% consistent growth (companies that have greaterearnings-per-share growth than the market and are demonstrably not cyclical); 38% dynamic growth (companies that have dynamic positions with superior competitive advantages and that generate revenue growth at or above 10%); and 22% cyclical growth (companies that have exposure to product, industry, regulatory or economic cycles and have prospects for superior earnings growth in the coming 24 months). At the sector level, the Fund held its largest overweight exposures relative to the Russell 1000® Growth Index in the information technology and consumer discretionary sectors. Its most significant underweight exposures included the consumer staples and industrials sectors.
| 1. | See page 5 for other share class returns, which may be higher or lower than Class I share returns. See page 6 for more information on benchmark and peer group returns. |
The opinions expressed are those of the portfolio managers as of the date of this report and are subject to change. There is no guarantee that any forecasts will come to pass. This material does not constitute investment advice and is not intended as an endorsement of any specific investment.
Portfolio of InvestmentsOctober 31, 2019
| | | | | | | | |
| | |
| | | Shares | | | Value | |
| Common Stocks 99.6%† | |
Aerospace & Defense 3.1% | |
Boeing Co. | | | 733,050 | | | $ | 249,171,026 | |
Northrop Grumman Corp. | | | 321,730 | | | | 113,403,390 | |
| | | | | | | | |
| | | | | | | 362,574,416 | |
| | | | | | | | |
Automobiles 1.9% | |
Ferrari N.V. | | | 1,348,860 | | | | 215,979,463 | |
| | | | | | | | |
|
Biotechnology 1.2% | |
Exact Sciences Corp. (a) | | | 1,610,900 | | | | 140,148,300 | |
| | | | | | | | |
|
Capital Markets 1.8% | |
Moody’s Corp. | | | 945,250 | | | | 208,607,222 | |
| | | | | | | | |
|
Chemicals 2.4% | |
Linde PLC | | | 605,130 | | | | 120,027,535 | |
Sherwin-Williams Co. | | | 269,315 | | | | 154,134,361 | |
| | | | | | | | |
| | | | | | | 274,161,896 | |
| | | | | | | | |
Entertainment 0.9% | |
Walt Disney Co. | | | 854,500 | | | | 111,016,640 | |
| | | | | | | | |
|
Equity Real Estate Investment Trusts 1.5% | |
Equinix, Inc. | | | 303,850 | | | | 172,216,103 | |
| | | | | | | | |
|
Food & Staples Retailing 0.9% | |
Costco Wholesale Corp. | | | 370,800 | | | | 110,168,388 | |
| | | | | | | | |
|
Health Care Equipment & Supplies 4.6% | |
Abbott Laboratories | | | 2,211,820 | | | | 184,930,270 | |
Intuitive Surgical, Inc. (a) | | | 292,310 | | | | 161,632,815 | |
Stryker Corp. | | | 877,870 | | | | 189,856,945 | |
| | | | | | | | |
| | | | | | | 536,420,030 | |
| | | | | | | | |
Health Care Providers & Services 2.0% | |
UnitedHealth Group, Inc. | | | 927,600 | | | | 234,404,520 | |
| | | | | | | | |
|
Health Care Technology 1.0% | |
Veeva Systems, Inc., Class A (a) | | | 826,750 | | | | 117,257,952 | |
| | | | | | | | |
|
Interactive Media & Services 10.4% | |
Alphabet, Inc. (a) | | | | | | | | |
Class A | | | 262,990 | | | | 331,051,812 | |
Class C | | | 267,041 | | | | 336,501,035 | |
Facebook, Inc., Class A (a) | | | 2,819,180 | | | | 540,295,847 | |
| | | | | | | | |
| | | | | | | 1,207,848,694 | |
| | | | | | | | |
Internet & Direct Marketing Retail 8.7% | |
Alibaba Group Holding, Ltd., Sponsored ADR (a) | | | 828,870 | | | | 146,436,463 | |
Amazon.com, Inc. (a) | | | 427,890 | | | | 760,215,048 | |
MercadoLibre, Inc. (a) | | | 204,170 | | | | 106,478,738 | |
| | | | | | | | |
| | | | | | | 1,013,130,249 | |
| | | | | | | | |
| | | | | | | | |
| | |
| | | Shares | | | Value | |
IT Services 16.2% | |
Automatic Data Processing, Inc. | | | 1,110,150 | | | $ | 180,099,635 | |
Fiserv, Inc. (a) | | | 2,320,510 | | | | 246,298,931 | |
GoDaddy, Inc., Class A (a) | | | 2,456,850 | | | | 159,768,956 | |
Mastercard, Inc., Class A | | | 1,431,900 | | | | 396,364,239 | |
Pagseguro Digital, Ltd., Class A (a) | | | 2,682,570 | | | | 99,469,696 | |
PayPal Holdings, Inc. (a) | | | 2,309,830 | | | | 240,453,303 | |
Visa, Inc., Class A | | | 3,132,400 | | | | 560,261,064 | |
| | | | | | | | |
| | | | | | | 1,882,715,824 | |
| | | | | | | | |
Leisure Products 0.2% | |
Peloton Interactive, Inc., Class A (a)(b) | | | 856,600 | | | | 20,447,042 | |
| | | | | | | | |
|
Life Sciences Tools & Services 1.5% | |
Thermo Fisher Scientific, Inc. | | | 577,420 | | | | 174,369,292 | |
| | | | | | | | |
|
Machinery 1.0% | |
Fortive Corp. | | | 1,745,190 | | | | 120,418,110 | |
| | | | | | | | |
|
Pharmaceuticals 3.7% | |
AstraZeneca PLC, Sponsored ADR | | | 4,155,200 | | | | 203,729,456 | |
Zoetis, Inc. | | | 1,777,140 | | | | 227,331,749 | |
| | | | | | | | |
| | | | | | | 431,061,205 | |
| | | | | | | | |
Professional Services 1.3% | |
CoStar Group, Inc. (a) | | | 274,240 | | | | 150,700,365 | |
| | | | | | | | |
|
Road & Rail 1.0% | |
Union Pacific Corp. | | | 694,710 | | | | 114,946,717 | |
| | | | | | | | |
|
Semiconductors & Semiconductor Equipment 3.4% | |
Microchip Technology, Inc. | | | 1,578,100 | | | | 148,799,049 | |
NVIDIA Corp. | | | 788,400 | | | | 158,484,168 | |
Texas Instruments, Inc. | | | 779,900 | | | | 92,020,401 | |
| | | | | | | | |
| | | | | | | 399,303,618 | |
| | | | | | | | |
Software 17.9% | |
Adobe, Inc. (a) | | | 1,225,860 | | | | 340,703,270 | |
Intuit, Inc. | | | 975,910 | | | | 251,296,825 | |
Microsoft Corp. | | | 6,269,030 | | | | 898,790,831 | |
salesforce.com, Inc. (a) | | | 2,944,890 | | | | 460,845,836 | |
Workday, Inc., Class A (a) | | | 794,770 | | | | 128,879,903 | |
| | | | | | | | |
| | | | | | | 2,080,516,665 | |
| | | | | | | | |
Specialty Retail 3.6% | |
Five Below, Inc. (a) | | | 1,069,700 | | | | 133,830,167 | |
Lowe’s Cos., Inc. | | | 2,548,540 | | | | 284,442,549 | |
| | | | | | | | |
| | | | | | | 418,272,716 | |
| | | | | | | | |
Technology Hardware, Storage & Peripherals 5.1% | |
Apple, Inc. | | | 2,399,400 | | | | 596,874,744 | |
| | | | | | | | |
| | | | |
| 10 | | MainStay Large Cap Growth Fund | | The notes to the financial statements are an integral part of,
and should be read in conjunction with, the financial statements. |
| | | | | | | | |
| | |
| | | Shares | | | Value | |
| Common Stocks (continued) | |
Textiles, Apparel & Luxury Goods 4.3% | |
NIKE, Inc., Class B | | | 3,464,840 | | | $ | 310,276,422 | |
VF Corp. | | | 2,316,150 | | | | 190,595,983 | |
| | | | | | | | |
| | | | | | | 500,872,405 | |
| | | | | | | | |
Total Common Stocks
(Cost $6,769,029,182) | | | | | | | 11,594,432,576 | |
| | | | | | | | |
| |
| Short-Term Investments 0.5% | | | | | |
Affiliated Investment Company 0.3% | | | | | | | | |
MainStay U.S. Government Liquidity Fund, 1.76% (c) | | | 35,342,993 | | | | 35,342,993 | |
| | | | | | | | |
|
Unaffiliated Investment Company 0.2% | |
State Street Navigator Securities Lending Government Money Market Portfolio, 1.75% (c)(d) | | | 20,519,380 | | | | 20,519,380 | |
| | | | | | | | |
TotalShort-Term Investments
(Cost $55,862,373) | | | | | | | 55,862,373 | |
| | | | | | | | |
Total Investments
(Cost $6,824,891,555) | | | 100.1 | % | | | 11,650,294,949 | |
Other Assets, Less Liabilities | | | (0.1 | ) | | | (10,903,400 | ) |
Net Assets | | | 100.0 | % | | $ | 11,639,391,549 | |
| † | Percentages indicated are based on Fund net assets. |
| (a) | Non-income producing security. |
| (b) | All or a portion of this security was held on loan. As of October 31, 2019, the aggregate market value of securities on loan was $20,242,290; the total market value of collateral held by the Fund was $20,565,138. The market value of the collateral held included non-cash collateral in the form of U.S. Treasury securities with a value of $45,758 (See Note 2(G)). |
| (c) | Current yield as of October 31, 2019. |
| (d) | Represents security purchased with cash collateral received for securities on loan. |
The following abbreviation is used in the preceding pages:
ADR—American Depositary Receipt
The following is a summary of the fair valuations according to the inputs used as of October 31, 2019, for valuing the Fund’s assets:
| | | | | | | | | | | | | | | | |
Description | | Quoted
Prices in
Active
Markets for
Identical
Assets
(Level 1) | | | Significant
Other
Observable
Inputs
(Level 2) | | | Significant
Unobservable
Inputs
(Level 3) | | | Total | |
| | | | |
Asset Valuation Inputs | | | | | | | | | | | | | | | | |
| Investments in Securities (a) | | | | | | | | | | | | | | | | |
| Common Stocks | | $ | 11,594,432,576 | | | $ | — | | | $ | — | | | $ | 11,594,432,576 | |
| Short-Term Investments | | | | | | | | | | | | | | | | |
Affiliated Investment Company | | | 35,342,993 | | | | — | | | | — | | | | 35,342,993 | |
Unaffiliated Investment Company | | | 20,519,380 | | | | — | | | | — | | | | 20,519,380 | |
| | | | | | | | | | | | | | | | |
| TotalShort-Term Investments | | | 55,862,373 | | | | — | | | | — | | | | 55,862,373 | |
| | | | | | | | | | | | | | | | |
| Total Investments in Securities | | $ | 11,650,294,949 | | | $ | — | | | $ | — | | | $ | 11,650,294,949 | |
| | | | | | | | | | | | | | | | |
| (a) | For a complete listing of investments and their industries, see the Portfolio of Investments. |
| | | | | | |
The notes to the financial statements are an integral part of,
and should be read in conjunction with, the financial statements. | | | | | 11 | |
Statement of Assets and Liabilitiesas of October 31, 2019
| | | | |
| Assets | | | | |
Investment in unaffiliated securities, at value (identified cost $6,789,548,562) including securities on loan of $20,242,290 | | $ | 11,614,951,956 | |
Investment in affiliated investment company, at value (identified cost $35,342,993) | | | 35,342,993 | |
Receivables: | | | | |
Investment securities sold | | | 36,601,187 | |
Fund shares sold | | | 21,776,232 | |
Dividends | | | 3,910,637 | |
Securities lending | | | 88,390 | |
Other assets | | | 89,714 | |
| | | | |
Total assets | | | 11,712,761,109 | |
| | | | |
| |
| Liabilities | | | | |
Cash collateral received for securities on loan | | | 20,519,380 | |
Payables: | | | | |
Fund shares redeemed | | | 44,338,509 | |
Manager (See Note 3) | | | 6,174,339 | |
Transfer agent (See Note 3) | | | 1,412,618 | |
NYLIFE Distributors (See Note 3) | | | 425,548 | |
Shareholder communication | | | 194,015 | |
Professional fees | | | 153,422 | |
Custodian | | | 51,513 | |
Trustees | | | 21,889 | |
Accrued expenses | | | 78,327 | |
| | | | |
Total liabilities | | | 73,369,560 | |
| | | | |
Net assets | | $ | 11,639,391,549 | |
| | | | |
| |
| Composition of Net Assets | | | | |
Shares of beneficial interest outstanding (par value of $.01 per share) unlimited number of shares authorized | | $ | 11,284,085 | |
Additional paid-in capital | | | 5,631,297,190 | |
| | | | |
| | | 5,642,581,275 | |
Total distributable earnings (loss) | | | 5,996,810,274 | |
| | | | |
Net assets | | $ | 11,639,391,549 | |
| | | | |
| | | | |
Class A | | | | |
Net assets applicable to outstanding shares | | $ | 1,008,608,353 | |
| | | | |
Shares of beneficial interest outstanding | | | 105,190,297 | |
| | | | |
Net asset value per share outstanding | | $ | 9.59 | |
Maximum sales charge (5.50% of offering price) | | | 0.56 | |
| | | | |
Maximum offering price per share outstanding | | $ | 10.15 | |
| | | | |
Investor Class | | | | |
Net assets applicable to outstanding shares | | $ | 109,236,183 | |
| | | | |
Shares of beneficial interest outstanding | | | 11,597,992 | |
| | | | |
Net asset value per share outstanding | | $ | 9.42 | |
Maximum sales charge (5.50% of offering price) | | | 0.55 | |
| | | | |
Maximum offering price per share outstanding | | $ | 9.97 | |
| | | | |
Class B | | | | |
Net assets applicable to outstanding shares | | $ | 21,015,425 | |
| | | | |
Shares of beneficial interest outstanding | | | 2,783,203 | |
| | | | |
Net asset value and offering price per share outstanding | | $ | 7.55 | |
| | | | |
Class C | | | | |
Net assets applicable to outstanding shares | | $ | 131,945,314 | |
| | | | |
Shares of beneficial interest outstanding | | | 17,513,389 | |
| | | | |
Net asset value and offering price per share outstanding | | $ | 7.53 | |
| | | | |
Class I | | | | |
Net assets applicable to outstanding shares | | $ | 6,080,319,914 | |
| | | | |
Shares of beneficial interest outstanding | | | 579,672,542 | |
| | | | |
Net asset value and offering price per share outstanding | | $ | 10.49 | |
| | | | |
Class R1 | | | | |
Net assets applicable to outstanding shares | | $ | 919,235,684 | |
| | | | |
Shares of beneficial interest outstanding | | | 90,415,918 | |
| | | | |
Net asset value and offering price per share outstanding | | $ | 10.17 | |
| | | | |
Class R2 | | | | |
Net assets applicable to outstanding shares | | $ | 163,288,432 | |
| | | | |
Shares of beneficial interest outstanding | | | 17,135,828 | |
| | | | |
Net asset value and offering price per share outstanding | | $ | 9.53 | |
| | | | |
Class R3 | | | | |
Net assets applicable to outstanding shares | | $ | 57,283,213 | |
| | | | |
Shares of beneficial interest outstanding | | | 6,417,874 | |
| | | | |
Net asset value and offering price per share outstanding | | $ | 8.93 | |
| | | | |
Class R6 | | | | |
Net assets applicable to outstanding shares | | $ | 3,148,459,031 | |
| | | | |
Shares of beneficial interest outstanding | | | 297,681,504 | |
| | | | |
Net asset value and offering price per share outstanding | | $ | 10.58 | |
| | | | |
| | | | |
| 12 | | MainStay Large Cap Growth Fund | | The notes to the financial statements are an integral part of,
and should be read in conjunction with, the financial statements. |
Statement of Operationsfor the year ended October 31, 2019
| | | | |
| Investment Income (Loss) | | | | |
Income | | | | |
Dividends-unaffiliated (a) | | $ | 87,883,211 | |
Dividends-affiliated | | | 1,619,200 | |
Securities lending | | | 621,456 | |
Interest | | | 2,376 | |
| | | | |
Total income | | | 90,126,243 | |
| | | | |
Expenses | | | | |
Manager (See Note 3) | | | 71,525,027 | |
Transfer agent (See Note 3) | | | 8,634,638 | |
Distribution/Service—Class A (See Note 3) | | | 2,378,800 | |
Distribution/Service—Investor Class (See Note 3) | | | 278,633 | |
Distribution/Service—Class B (See Note 3) | | | 235,393 | |
Distribution/Service—Class C (See Note 3) | | | 1,645,671 | |
Distribution/Service—Class R2 (See Note 3) | | | 503,258 | |
Distribution/Service—Class R3 (See Note 3) | | | 297,736 | |
Shareholder service (See Note 3) | | | 1,230,836 | |
Professional fees | | | 695,328 | |
Shareholder communication | | | 466,974 | |
Trustees | | | 287,434 | |
Registration | | | 230,653 | |
Custodian | | | 107,262 | |
Miscellaneous | | | 388,075 | |
| | | | |
Total expenses before waiver/reimbursement | | | 88,905,718 | |
Expense waiver/reimbursement from Manager (See Note 3) | | | (176,956 | ) |
| | | | |
Net expenses | | | 88,728,762 | |
| | | | |
Net investment income (loss) | | | 1,397,481 | |
| | | | |
|
| Realized and Unrealized Gain (Loss) on Investments | |
Net realized gain (loss) on unaffiliated investments | | | 1,343,085,065 | |
Net change in unrealized appreciation (depreciation) on unaffiliated investments | | | 462,179,012 | |
| | | | |
Net realized and unrealized gain (loss) on investments | | | 1,805,264,077 | |
| | | | |
Net increase (decrease) in net assets resulting from operations | | $ | 1,806,661,558 | |
| | | | |
| (a) | Dividends recorded net of foreign withholding taxes in the amount of $264,708. |
| | | | | | |
The notes to the financial statements are an integral part of,
and should be read in conjunction with, the financial statements. | | | | | 13 | |
Statements of Changes in Net Assets
for the years ended October 31, 2019 and October 31, 2018
| | | | | | | | |
| | | 2019 | | | 2018 | |
| Increase (Decrease) in Net Assets | |
Operations: | | | | | | | | |
Net investment income (loss) | | $ | 1,397,481 | | | $ | (1,280,547 | ) |
Net realized gain (loss) on investments | | | 1,343,085,065 | | | | 2,288,400,255 | |
Net change in unrealized appreciation (depreciation) on investments | | | 462,179,012 | | | | (810,084,748 | ) |
| | | | |
Net increase (decrease) in net assets resulting from operations | | | 1,806,661,558 | | | | 1,477,034,960 | |
| | | | |
Distributions to shareholders: | | | | | | | | |
Class A | | | (198,645,333 | ) | | | (129,538,086 | ) |
Investor Class | | | (19,327,235 | ) | | | (16,387,495 | ) |
Class B | | | (5,587,234 | ) | | | (5,472,548 | ) |
Class C | | | (41,980,795 | ) | | | (38,578,584 | ) |
Class I | | | (1,039,849,373 | ) | | | (948,232,853 | ) |
Class R1 | | | (190,986,946 | ) | | | (224,360,524 | ) |
Class R2 | | | (40,446,981 | ) | | | (45,003,587 | ) |
Class R3 | | | (11,941,266 | ) | | | (12,069,586 | ) |
Class R6 | | | (419,727,421 | ) | | | (294,234,482 | ) |
| | | | |
Total distributions to shareholders | | | (1,968,492,584 | ) | | | (1,713,877,745 | ) |
| | | | |
Capital share transactions: | | | | | | | | |
Net proceeds from sale of shares | | | 2,510,739,822 | | | | 2,653,181,595 | |
Net asset value of shares issued to shareholders in reinvestment of distributions | | | 1,806,158,715 | | | | 1,568,090,662 | |
Cost of shares redeemed | | | (4,066,296,731 | ) | | | (4,616,519,806 | ) |
| | | | |
Increase (decrease) in net assets derived from capital share transactions | | | 250,601,806 | | | | (395,247,549 | ) |
| | | | |
Net increase (decrease) in net assets | | | 88,770,780 | | | | (632,090,334 | ) |
| | |
| Net Assets | | | | | | | | |
Beginning of year | | | 11,550,620,769 | | | | 12,182,711,103 | |
| | | | |
End of year | | $ | 11,639,391,549 | | | $ | 11,550,620,769 | |
| | | | |
| | | | |
| 14 | | MainStay Large Cap Growth Fund | | The notes to the financial statements are an integral part of,
and should be read in conjunction with, the financial statements. |
Financial Highlightsselected per share data and ratios
| | | | | | | | | | | | | | | | | | | | |
| |
| | | Year ended October 31, | |
| | | | | |
| Class A | | 2019 | | | 2018 | | | 2017 | | | 2016 | | | 2015 | |
| | | | | |
Net asset value at beginning of year | | $ | 9.95 | | | $ | 10.41 | | | $ | 9.17 | | | $ | 10.68 | | | $ | 10.91 | |
| | | | | | | | | | | | | | | | | | | | |
| | | | | |
Net investment income (loss) (a) | | | (0.02 | ) | | | (0.02 | ) | | | (0.01 | ) | | | (0.01 | ) | | | (0.02 | ) |
| | | | | |
Net realized and unrealized gain (loss) on investments | | | 1.48 | | | | 1.12 | | | | 2.31 | | | | (0.23 | ) | | | 0.85 | |
| | | | | | | | | | | | | | | | | | | | |
| | | | | |
Total from investment operations | | | 1.46 | | | | 1.10 | | | | 2.30 | | | | (0.24 | ) | | | 0.83 | |
| | | | | | | | | | | | | | | | | | | | |
| | | | | |
| Less dividends and distributions: | | | | | | | | | | | | | | | | | | | | |
| | | | | |
From net investment income | | | — | | | | (0.00 | )‡ | | | — | | | | — | | | | — | |
| | | | | |
From net realized gain on investments | | | (1.82 | ) | | | (1.56 | ) | | | (1.06 | ) | | | (1.27 | ) | | | (1.06 | ) |
| | | | | | | | | | | | | | | | | | | | |
| | | | | |
Total dividends and distributions | | | (1.82 | ) | | | (1.56 | ) | | | (1.06 | ) | | | (1.27 | ) | | | (1.06 | ) |
| | | | | | | | | | | | | | | | | | | | |
| | | | | |
Net asset value at end of year | | $ | 9.59 | | | $ | 9.95 | | | $ | 10.41 | | | $ | 9.17 | | | $ | 10.68 | |
| | | | | | | | | | | | | | | | | | | | |
| | | | | |
Total investment return (b) | | | 17.05 | % | | | 12.36 | % | | | 28.54 | % | | | (2.44 | %) | | | 8.10 | % |
| | | | | |
| Ratios (to average net assets)/Supplemental Data: | | | | | | | | | | | | | | | | | | | | |
| | | | | |
Net investment income (loss) | | | (0.20 | %) | | | (0.21 | %) | | | (0.15 | %) | | | (0.13 | %) | | | (0.23 | %) |
| | | | | |
Net expenses (c) | | | 0.99 | % | | | 0.97 | % | | | 1.00 | % | | | 0.99 | % | | | 0.99 | % |
| | | | | |
Expenses (before waiver/reimbursement) (c) | | | 0.99 | % | | | 0.98 | % | | | 1.00 | % | | | 1.00 | % | | | 0.99 | % |
| | | | | |
Portfolio turnover rate | | | 54 | % | | | 52 | % | | | 61 | % | | | 84 | % | | | 66 | % |
| | | | | |
Net assets at end of year (in 000’s) | | $ | 1,008,608 | | | $ | 1,092,962 | | | $ | 960,123 | | | $ | 882,021 | | | $ | 1,202,852 | |
| ‡ | Less than one cent per share. |
| (a) | Per share data based on average shares outstanding during the year. |
| (b) | Total investment return is calculated exclusive of sales charges and assumes the reinvestment of dividends and distributions. For periods of less than one year, total return is not annualized. |
| (c) | In addition to the fees and expenses which the Fund bears directly, it also indirectly bears a pro-rata share of the fees and expenses of the underlying funds in which it invests. Such indirect expenses are not included in the above expense ratios. |
| | | | | | | | | | | | | | | | | | | �� | |
| |
| | | Year ended October 31, | |
| | | | | |
| Investor Class | | 2019 | | | 2018 | | | 2017 | | | 2016 | | | 2015 | |
| | | | | |
Net asset value at beginning of year | | $ | 9.81 | | | $ | 10.30 | | | $ | 9.09 | | | $ | 10.61 | | | $ | 10.84 | |
| | | | | | | | | | | | | | | | | | | | |
| | | | | |
Net investment income (loss) (a) | | | (0.03 | ) | | | (0.03 | ) | | | (0.02 | ) | | | (0.02 | ) | | | (0.03 | ) |
| | | | | |
Net realized and unrealized gain (loss) on investments | | | 1.46 | | | | 1.10 | | | | 2.29 | | | | (0.23 | ) | | | 0.86 | |
| | | | | | | | | | | | | | | | | | | | |
| | | | | |
Total from investment operations | | | 1.43 | | | | 1.07 | | | | 2.27 | | | | (0.25 | ) | | | 0.83 | |
| | | | | | | | | | | | | | | | | | | | |
| | | | | |
| Less distributions: | | | | | | | | | | | | | | | | | | | | |
| | | | | |
From net realized gain on investments | | | (1.82 | ) | | | (1.56 | ) | | | (1.06 | ) | | | (1.27 | ) | | | (1.06 | ) |
| | | | | | | | | | | | | | | | | | | | |
| | | | | |
Net asset value at end of year | | $ | 9.42 | | | $ | 9.81 | | | $ | 10.30 | | | $ | 9.09 | | | $ | 10.61 | |
| | | | | | | | | | | | | | | | | | | | |
| | | | | |
Total investment return (b) | | | 16.96 | % | | | 12.19 | % | | | 28.45 | % | | | (2.57 | %) | | | 8.16 | % |
| | | | | |
| Ratios (to average net assets)/Supplemental Data: | | | | | | | | | | | | | | | | | | | | |
| | | | | |
Net investment income (loss) | | | (0.31 | %) | | | (0.30 | %) | | | (0.19 | %) | | | (0.19 | %) | | | (0.28 | %) |
| | | | | |
Net expenses (c) | | | 1.09 | % | | | 1.06 | % | | | 1.07 | % | | | 1.05 | % | | | 1.04 | % |
| | | | | |
Expenses (before waiver/reimbursement) (c) | | | 1.10 | % | | | 1.07 | % | | | 1.07 | % | | | 1.06 | % | | | 1.04 | % |
| | | | | |
Portfolio turnover rate | | | 54 | % | | | 52 | % | | | 61 | % | | | 84 | % | | | 66 | % |
| | | | | |
Net assets at end of year (in 000’s) | | $ | 109,236 | | | $ | 103,987 | | | $ | 108,078 | | | $ | 167,631 | | | $ | 180,154 | |
| (a) | Per share data based on average shares outstanding during the year. |
| (b) | Total investment return is calculated exclusive of sales charges and assumes the reinvestment of dividends and distributions. For periods of less than one year, total return is not annualized. |
| (c) | In addition to the fees and expenses which the Fund bears directly, it also indirectly bears a pro-rata share of the fees and expenses of the underlying funds in which it invests. Such indirect expenses are not included in the above expense ratios. |
| | | | | | |
The notes to the financial statements are an integral part of,
and should be read in conjunction with, the financial statements. | | | | | 15 | |
Financial Highlightsselected per share data and ratios
| | | | | | | | | | | | | | | | | | | | |
| |
| | | Year ended October 31, | |
| | | | | |
| Class B | | 2019 | | | 2018 | | | 2017 | | | 2016 | | | 2015 | |
| | | | | |
Net asset value at beginning of year | | $ | 8.26 | | | $ | 8.98 | | | $ | 8.11 | | | $ | 9.67 | | | $ | 10.04 | |
| | | | | | | | | | | | | | | | | | | | |
| | | | | |
Net investment income (loss) (a) | | | (0.08 | ) | | | (0.09 | ) | | | (0.08 | ) | | | (0.08 | ) | | | (0.10 | ) |
| | | | | |
Net realized and unrealized gain (loss) on investments | | | 1.19 | | | | 0.93 | | | | 2.01 | | | | (0.21 | ) | | | 0.79 | |
| | | | | | | | | | | | | | | | | | | | |
| | | | | |
Total from investment operations | | | 1.11 | | | | 0.84 | | | | 1.93 | | | | (0.29 | ) | | | 0.69 | |
| | | | | | | | | | | | | | | | | | | | |
| | | | | |
| Less distributions: | | | | | | | | | | | | | | | | | | | | |
| | | | | |
From net realized gain on investments | | | (1.82 | ) | | | (1.56 | ) | | | (1.06 | ) | | | (1.27 | ) | | | (1.06 | ) |
| | | | | | | | | | | | | | | | | | | | |
| | | | | |
Net asset value at end of year | | $ | 7.55 | | | $ | 8.26 | | | $ | 8.98 | | | $ | 8.11 | | | $ | 9.67 | |
| | | | | | | | | | | | | | | | | | | | |
| | | | | |
Total investment return (b) | | | 15.96 | % | | | 11.28 | % (c) | | | 27.61 | % | | | (3.32 | %) | | | 7.34 | % |
| | | | | |
| Ratios (to average net assets)/Supplemental Data: | | | | | | | | | | | | | | | | | | | | |
| | | | | |
Net investment income (loss) | | | (1.05 | %) | | | (1.04 | %) | | | (0.96 | %) | | | (0.94 | %) | | | (1.03 | %) |
| | | | | |
Net expenses (d) | | | 1.84 | % | | | 1.81 | % | | | 1.82 | % | | | 1.80 | % | | | 1.79 | % |
| | | | | |
Expenses (before waiver/reimbursement) (d) | | | 1.85 | % | | | 1.82 | % | | | 1.82 | % | | | 1.81 | % | | | 1.79 | % |
| | | | | |
Portfolio turnover rate | | | 54 | % | | | 52 | % | | | 61 | % | | | 84 | % | | | 66 | % |
| | | | | |
Net assets at end of year (in 000’s) | | $ | 21,015 | | | $ | 25,685 | | | $ | 31,793 | | | $ | 36,549 | | | $ | 47,779 | |
| (a) | Per share data based on average shares outstanding during the year. |
| (b) | Total investment return is calculated exclusive of sales charges and assumes the reinvestment of dividends and distributions. For periods of less than one year, total return is not annualized. |
| (c) | Total investment return may reflect adjustments to conform to generally accepted accounting principles. |
| (d) | In addition to the fees and expenses which the Fund bears directly, it also indirectly bears a pro-rata share of the fees and expenses of the underlying funds in which it invests. Such indirect expenses are not included in the above expense ratios. |
| | | | | | | | | | | | | | | | | | | | |
| |
| | | Year ended October 31, | |
| | | | | |
| Class C | | 2019 | | | 2018 | | | 2017 | | | 2016 | | | 2015 | |
| | | | | |
Net asset value at beginning of year | | $ | 8.25 | | | $ | 8.96 | | | $ | 8.10 | | | $ | 9.66 | | | $ | 10.03 | |
| | | | | | | | | | | | | | | | | | | | |
| | | | | |
Net investment income (loss) (a) | | | (0.07 | ) | | | (0.09 | ) | | | (0.08 | ) | | | (0.08 | ) | | | (0.10 | ) |
| | | | | |
Net realized and unrealized gain (loss) on investments | | | 1.17 | | | | 0.94 | | | | 2.00 | | | | (0.21 | ) | | | 0.79 | |
| | | | | | | | | | | | | | | | | | | | |
| | | | | |
Total from investment operations | | | 1.10 | | | | 0.85 | | | | 1.92 | | | | (0.29 | ) | | | 0.69 | |
| | | | | | | | | | | | | | | | | | | | |
| | | | | |
| Less distributions: | | | | | | | | | | | | | | | | | | | | |
| | | | | |
From net realized gain on investments | | | (1.82 | ) | | | (1.56 | ) | | | (1.06 | ) | | | (1.27 | ) | | | (1.06 | ) |
| | | | | | | | | | | | | | | | | | | | |
| | | | | |
Net asset value at end of year | | $ | 7.53 | | | $ | 8.25 | | | $ | 8.96 | | | $ | 8.10 | | | $ | 9.66 | |
| | | | | | | | | | | | | | | | | | | | |
| | | | | |
Total investment return (b) | | | 15.97 | % | | | 11.42 | % | | | 27.51 | % | | | (3.31 | %) | | | 7.35 | % |
| | | | | |
| Ratios (to average net assets)/Supplemental Data: | | | | | | | | | | | | | | | | | | | | |
| | | | | |
Net investment income (loss) | | | (1.04 | %) | | | (1.05 | %) | | | (0.96 | %) | | | (0.94 | %) | | | (1.04 | %) |
| | | | | |
Net expenses (c) | | | 1.84 | % | | | 1.81 | % | | | 1.82 | % | | | 1.80 | % | | | 1.79 | % |
| | | | | |
Expenses (before waiver/reimbursement) (c) | | | 1.85 | % | | | 1.82 | % | | | 1.82 | % | | | 1.81 | % | | | 1.79 | % |
| | | | | |
Portfolio turnover rate | | | 54 | % | | | 52 | % | | | 61 | % | | | 84 | % | | | 66 | % |
| | | | | |
Net assets at end of year (in 000’s) | | $ | 131,945 | | | $ | 197,231 | | | $ | 229,283 | | | $ | 306,409 | | | $ | 408,078 | |
| (a) | Per share data based on average shares outstanding during the year. |
| (b) | Total investment return is calculated exclusive of sales charges and assumes the reinvestment of dividends and distributions. For periods of less than one year, total return is not annualized. |
| (c) | In addition to the fees and expenses which the Fund bears directly, it also indirectly bears a pro-rata share of the fees and expenses of the underlying funds in which it invests. Such indirect expenses are not included in the above expense ratios. |
| | | | |
| 16 | | MainStay Large Cap Growth Fund | | The notes to the financial statements are an integral part of,
and should be read in conjunction with, the financial statements. |
Financial Highlightsselected per share data and ratios
| | | | | | | | | | | | | | | | | | | | |
| |
| | | Year ended October 31, | |
| | | | | |
| Class I | | 2019 | | | 2018 | | | 2017 | | | 2016 | | | 2015 | |
| | | | | |
Net asset value at beginning of year | | $ | 10.69 | | | $ | 11.06 | | | $ | 9.65 | | | $ | 11.15 | | | $ | 11.32 | |
| | | | | | | | | | | | | | | | | | | | |
| | | | | |
Net investment income (loss) (a) | | | 0.00 | ‡ | | | 0.00 | ‡ | | | 0.01 | | | | 0.01 | | | | 0.00 | ‡ |
| | | | | |
Net realized and unrealized gain (loss) on investments | | | 1.62 | | | | 1.20 | | | | 2.46 | | | | (0.24 | ) | | | 0.89 | |
| | | | | | | | | | | | | | | | | | | | |
| | | | | |
Total from investment operations | | | 1.62 | | | | 1.20 | | | | 2.47 | | | | (0.23 | ) | | | 0.89 | |
| | | | | | | | | | | | | | | | | | | | |
| | | | | |
| Less dividends and distributions: | | | | | | | | | | | | | | | | | | | | |
| | | | | |
From net investment income | | | — | | | | (0.01 | ) | | | — | | | | — | | | | — | |
| | | | | |
From net realized gain on investments | | | (1.82 | ) | | | (1.56 | ) | | | (1.06 | ) | | | (1.27 | ) | | | (1.06 | ) |
| | | | | | | | | | | | | | | | | | | | |
| | | | | |
Total dividends and distributions | | | (1.82 | ) | | | (1.57 | ) | | | (1.06 | ) | | | (1.27 | ) | | | (1.06 | ) |
| | | | | | | | | | | | | | | | | | | | |
| | | | | |
Net asset value at end of year | | $ | 10.49 | | | $ | 10.69 | | | $ | 11.06 | | | $ | 9.65 | | | $ | 11.15 | |
| | | | | | | | | | | | | | | | | | | | |
| | | | | |
Total investment return (b) | | | 17.29 | % | | | 12.54 | %(c) | | | 28.92 | % | | | (2.23 | %) | | | 8.36 | % |
| | | | | |
| Ratios (to average net assets)/Supplemental Data: | | | | | | | | | | | | | | | | | | | | |
| | | | | |
Net investment income (loss) | | | 0.05 | % | | | 0.04 | % | | | 0.12 | % | | | 0.12 | % | | | 0.02 | % |
| | | | | |
Net expenses (d) | | | 0.74 | % | | | 0.72 | % | | | 0.75 | % | | | 0.74 | % | | | 0.74 | % |
| | | | | |
Expenses (before waiver/reimbursement) (d) | | | 0.74 | % | | | 0.73 | % | | | 0.75 | % | | | 0.75 | % | | | 0.74 | % |
| | | | | |
Portfolio turnover rate | | | 54 | % | | | 52 | % | | | 61 | % | | | 84 | % | | | 66 | % |
| | | | | |
Net assets at end of year (in 000’s) | | $ | 6,080,320 | | | $ | 6,275,780 | | | $ | 6,752,754 | | | $ | 8,994,997 | | | $ | 12,150,253 | |
| ‡ | Less than one cent per share. |
| (a) | Per share data based on average shares outstanding during the year. |
| (b) | Total investment return is calculated exclusive of sales charges and assumes the reinvestment of dividends and distributions. Class I shares are not subject to sales charges. For periods of less than one year, total return is not annualized. |
| (c) | Total investment return may reflect adjustments to conform to generally accepted accounting principles. |
| (d) | In addition to the fees and expenses which the Fund bears directly, it also indirectly bears a pro-rata share of the fees and expenses of the underlying funds in which it invests. Such indirect expenses are not included in the above expense ratios. |
| | | | | | | | | | | | | | | | | | | | |
| |
| | | Year ended October 31, | |
| | | | | |
| Class R1 | | 2019 | | | 2018 | | | 2017 | | | 2016 | | | 2015 | |
| | | | | |
Net asset value at beginning of year | | $ | 10.43 | | | $ | 10.83 | | | $ | 9.48 | | | $ | 10.99 | | | $ | 11.17 | |
| | | | | | | | | | | | | | | | | | | | |
| | | | | |
Net investment income (loss) (a) | | | (0.00 | )‡ | | | (0.01 | ) | | | 0.00 | ‡ | | | 0.00 | ‡ | | | (0.01 | ) |
| | | | | |
Net realized and unrealized gain (loss) on investments | | | 1.56 | | | | 1.17 | | | | 2.41 | | | | (0.24 | ) | | | 0.89 | |
| | | | | | | | | | | | | | | | | | | | |
| | | | | |
Total from investment operations | | | 1.56 | | | | 1.16 | | | | 2.41 | | | | (0.24 | ) | | | 0.88 | |
| | | | | | | | | | | | | | | | | | | | |
| | | | | |
| Less distributions: | | | | | | | | | | | | | | | | | | | | |
| | | | | |
From net realized gain on investments | | | (1.82 | ) | | | (1.56 | ) | | | (1.06 | ) | | | (1.27 | ) | | | (1.06 | ) |
| | | | | | | | | | | | | | | | | | | | |
| | | | | |
Net asset value at end of year | | $ | 10.17 | | | $ | 10.43 | | | $ | 10.83 | | | $ | 9.48 | | | $ | 10.99 | |
| | | | | | | | | | | | | | | | | | | | |
| | | | | |
Total investment return (b) | | | 17.25 | % | | | 12.46 | % | | | 28.79 | % | | | (2.37 | %) | | | 8.39 | % |
| | | | | |
| Ratios (to average net assets)/Supplemental Data: | | | | | | | | | | | | | | | | | | | | |
| | | | | |
Net investment income (loss) | | | (0.04 | %) | | | (0.06 | %) | | | 0.01 | % | | | 0.02 | % | | | (0.08 | %) |
| | | | | |
Net expenses (c) | | | 0.84 | % | | | 0.82 | % | | | 0.85 | % | | | 0.84 | % | | | 0.84 | % |
| | | | | |
Expenses (before waiver/reimbursement) (c) | | | 0.84 | % | | | 0.83 | % | | | 0.85 | % | | | 0.85 | % | | | 0.84 | % |
| | | | | |
Portfolio turnover rate | | | 54 | % | | | 52 | % | | | 61 | % | | | 84 | % | | | 66 | % |
| | | | | |
Net assets at end of year (in 000’s) | | $ | 919,236 | | | $ | 1,102,423 | | | $ | 1,596,638 | | | $ | 1,636,560 | | | $ | 1,952,248 | |
| ‡ | Less than one cent per share. |
| (a) | Per share data based on average shares outstanding during the year. |
| (b) | Total investment return is calculated exclusive of sales charges and assumes the reinvestment of dividends and distributions. Class R1 shares are not subject to sales charges. For periods of less than one year, total return is not annualized. |
| (c) | In addition to the fees and expenses which the Fund bears directly, it also indirectly bears a pro-rata share of the fees and expenses of the underlying funds in which it invests. Such indirect expenses are not included in the above expense ratios. |
| | | | | | |
The notes to the financial statements are an integral part of,
and should be read in conjunction with, the financial statements. | | | | | 17 | |
Financial Highlightsselected per share data and ratios
| | | | | | | | | | | | | | | | | | | | |
| |
| | | Year ended October 31, | |
| | | | | |
| Class R2 | | 2019 | | | 2018 | | | 2017 | | | 2016 | | | 2015 | |
| | | | | |
Net asset value at beginning of year | | $ | 9.90 | | | $ | 10.38 | | | $ | 9.15 | | | $ | 10.68 | | | $ | 10.92 | |
| | | | | | | | | | | | | | | | | | | | |
| | | | | |
Net investment income (loss) (a) | | | (0.03 | ) | | | (0.03 | ) | | | (0.02 | ) | | | (0.02 | ) | | | (0.03 | ) |
| | | | | |
Net realized and unrealized gain (loss) on investments | | | 1.48 | | | | 1.11 | | | | 2.31 | | | | (0.24 | ) | | | 0.85 | |
| | | | | | | | | | | | | | | | | | | | |
| | | | | |
Total from investment operations | | | 1.45 | | | | 1.08 | | | | 2.29 | | | | (0.26 | ) | | | 0.82 | |
| | | | | | | | | | | | | | | | | | | | |
| | | | | |
| Less distributions: | | | | | | | | | | | | | | | | | | | | |
| | | | | |
From net realized gain on investments | | | (1.82 | ) | | | (1.56 | ) | | | (1.06 | ) | | | (1.27 | ) | | | (1.06 | ) |
| | | | | | | | | | | | | | | | | | | | |
| | | | | |
Net asset value at end of year | | $ | 9.53 | | | $ | 9.90 | | | $ | 10.38 | | | $ | 9.15 | | | $ | 10.68 | |
| | | | | | | | | | | | | | | | | | | | |
| | | | | |
Total investment return (b) | | | 16.89 | % | | | 12.17 | % (c) | | | 28.49 | % | | | (2.66 | %) | | | 8.00 | % |
| | | | | |
| Ratios (to average net assets)/Supplemental Data: | | | | | | | | | | | | | | | | | | | | |
| | | | | |
Net investment income (loss) | | | (0.29 | %) | | | (0.31 | %) | | | (0.24 | %) | | | (0.23 | %) | | | (0.32 | %) |
| | | | | |
Net expenses (d) | | | 1.09 | % | | | 1.07 | % | | | 1.10 | % | | | 1.09 | % | | | 1.09 | % |
| | | | | |
Expenses (before waiver/reimbursement) (d) | | | 1.09 | % | | | 1.08 | % | | | 1.10 | % | | | 1.10 | % | | | 1.09 | % |
| | | | | |
Portfolio turnover rate | | | 54 | % | | | 52 | % | | | 61 | % | | | 84 | % | | | 66 | % |
| | | | | |
Net assets at end of year (in 000’s) | | $ | 163,288 | | | $ | 227,298 | | | $ | 303,192 | | | $ | 391,535 | | | $ | 674,630 | |
| (a) | Per share data based on average shares outstanding during the year. |
| (b) | Total investment return is calculated exclusive of sales charges and assumes the reinvestment of dividends and distributions. Class R2 shares are not subject to sales charges. For periods of less than one year, total return is not annualized. |
| (c) | Total investment return may reflect adjustments to conform to generally accepted accounting principles. |
| (d) | In addition to the fees and expenses which the Fund bears directly, it also indirectly bears a pro-rata share of the fees and expenses of the underlying funds in which it invests. Such indirect expenses are not included in the above expense ratios. |
| | | | | | | | | | | | | | | | | | | | |
| |
| | | Year ended October 31, | |
| | | | | |
| Class R3 | | 2019 | | | 2018 | | | 2017 | | | 2016 | | | 2015 | |
| | | | | |
Net asset value at beginning of year | | $ | 9.41 | | | $ | 9.96 | | | $ | 8.85 | | | $ | 10.39 | | | $ | 10.67 | |
| | | | | | | | | | | | | | | | | | | | |
| | | | | |
Net investment income (loss) (a) | | | (0.05 | ) | | | (0.05 | ) | | | (0.04 | ) | | | (0.04 | ) | | | (0.06 | ) |
| | | | | |
Net realized and unrealized gain (loss) on investments | | | 1.39 | | | | 1.06 | | | | 2.21 | | | | (0.23 | ) | | | 0.84 | |
| | | | | | | | | | | | | | | | | | | | |
| | | | | |
Total from investment operations | | | 1.34 | | | | 1.01 | | | | 2.17 | | | | (0.27 | ) | | | 0.78 | |
| | | | | | | | | | | | | | | | | | | | |
| | | | | |
| Less distributions: | | | | | | | | | | | | | | | | | | | | |
| | | | | |
From net realized gain on investments | | | (1.82 | ) | | | (1.56 | ) | | | (1.06 | ) | | | (1.27 | ) | | | (1.06 | ) |
| | | | | | | | | | | | | | | | | | | | |
| | | | | |
Net asset value at end of year | | $ | 8.93 | | | $ | 9.41 | | | $ | 9.96 | | | $ | 8.85 | | | $ | 10.39 | |
| | | | | | | | | | | | | | | | | | | | |
| | | | | |
Total investment return (b) | | | 16.69 | % | | | 11.97 | % | | | 28.05 | % | | | (2.83 | %) | | | 7.79 | % |
| | | | | |
| Ratios (to average net assets)/Supplemental Data: | | | | | | | | | | | | | | | | | | | | |
| | | | | |
Net investment income (loss) | | | (0.55 | %) | | | (0.55 | %) | | | (0.49 | %) | | | (0.48 | %) | | | (0.57 | %) |
| | | | | |
Net expenses (c) | | | 1.34 | % | | | 1.32 | % | | | 1.35 | % | | | 1.34 | % | | | 1.34 | % |
| | | | | |
Expenses (before reimbursement/waiver) (c) | | | 1.34 | % | | | 1.33 | % | | | 1.35 | % | | | 1.35 | % | | | 1.34 | % |
| | | | | |
Portfolio turnover rate | | | 54 | % | | | 52 | % | | | 61 | % | | | 84 | % | | | 66 | % |
| | | | | |
Net assets at end of year (in 000’s) | | $ | 57,283 | | | $ | 61,850 | | | $ | 78,634 | | | $ | 87,060 | | | $ | 114,118 | |
| (a) | Per share data based on average shares outstanding during the year. |
| (b) | Total investment return is calculated exclusive of sales charges and assumes the reinvestment of dividends and distributions. Class R3 shares are not subject to sales charges. For periods of less than one year, total return is not annualized. |
| (c) | In addition to the fees and expenses which the Fund bears directly, it also indirectly bears a pro-rata share of the fees and expenses of the underlying funds in which it invests. Such indirect expenses are not included in the above expense ratios. |
| | | | |
| 18 | | MainStay Large Cap Growth Fund | | The notes to the financial statements are an integral part of,
and should be read in conjunction with, the financial statements. |
Financial Highlightsselected per share data and ratios
| | | | | | | | | | | | | | | | | | | | |
| |
| | | Year ended October 31, | |
| | | | | |
| Class R6 | | 2019 | | | 2018 | | | 2017 | | | 2016 | | | 2015 | |
| | | | | |
Net asset value at beginning of year | | $ | 10.76 | | | $ | 11.12 | | | $ | 9.69 | | | $ | 11.18 | | | $ | 11.33 | |
| | | | | | | | | | | | | | | | | | | | |
| | | | | |
Net investment income (loss) (a) | | | 0.01 | | | | 0.01 | | | | 0.02 | | | | 0.02 | | | | 0.01 | |
| | | | | |
Net realized and unrealized gain (loss) on investments | | | 1.63 | | | | 1.21 | | | | 2.47 | | | | (0.24 | ) | | | 0.90 | |
| | | | | | | | | | | | | | | | | | | | |
| | | | | |
Total from investment operations | | | 1.64 | | | | 1.22 | | | | 2.49 | | | | (0.22 | ) | | | 0.91 | |
| | | | | | | | | | | | | | | | | | | | |
| | | | | |
| Less dividends and distributions: | | | | | | | | | | | | | | | | | | | | |
| | | | | |
From net investment income | | | — | | | | (0.02 | ) | | | — | | | | — | | | | — | |
| | | | | |
From net realized gain on investments | | | (1.82 | ) | | | (1.56 | ) | | | (1.06 | ) | | | (1.27 | ) | | | (1.06 | ) |
| | | | | | | | | | | | | | | | | | | | |
| | | | | |
Total dividends and distributions | | | (1.82 | ) | | | (1.58 | ) | | | (1.06 | ) | | | (1.27 | ) | | | (1.06 | ) |
| | | | | | | | | | | | | | | | | | | | |
| | | | | |
Net asset value at end of year | | $ | 10.58 | | | $ | 10.76 | | | $ | 11.12 | | | $ | 9.69 | | | $ | 11.18 | |
| | | | | | | | | | | | | | | | | | | | |
| | | | | |
Total investment return (b) | | | 17.49 | % | | | 12.72 | % | | | 29.02 | % | | | (2.12 | %) | | | 8.55 | % |
| | | | | |
| Ratios (to average net assets)/Supplemental Data: | | | | | | | | | | | | | | | | | | | | |
| | | | | |
Net investment income (loss) | | | 0.13 | % | | | 0.13 | % | | | 0.21 | % | | | 0.23 | % | | | 0.11 | % |
| | | | | |
Net expenses (c) | | | 0.64 | % | | | 0.63 | % | | | 0.63 | % | | | 0.62 | % | | | 0.62 | % |
| | | | | |
Expenses (before waiver/reimbursement) (c) | | | 0.64 | % | | | 0.64 | % | | | 0.63 | % | | | 0.63 | % | | | 0.62 | % |
| | | | | |
Portfolio turnover rate | | | 54 | % | | | 52 | % | | | 61 | % | | | 84 | % | | | 66 | % |
| | | | | |
Net assets at end of year (in 000’s) | | $ | 3,148,459 | | | $ | 2,463,405 | | | $ | 2,122,217 | | | $ | 1,693,868 | | | $ | 1,311,034 | |
| (a) | Per share data based on average shares outstanding during the year. |
| (b) | Total investment return is calculated exclusive of sales charges and assumes the reinvestment of dividends and distributions. Class R6 shares are not subject to sales charges. For periods of less than one year, total return is not annualized. |
| (c) | In addition to the fees and expenses which the Fund bears directly, it also indirectly bears a pro-rata share of the fees and expenses of the underlying funds in which it invests. Such indirect expenses are not included in the above expense ratios. |
| | | | | | |
The notes to the financial statements are an integral part of,
and should be read in conjunction with, the financial statements. | | | | | 19 | |
Notes to Financial Statements
Note 1–Organization and Business
The MainStay Funds (the “Trust”) was organized on January 9, 1986, as a Massachusetts business trust and is governed by a Declaration of Trust. The Trust is registered under the Investment Company Act of 1940, as amended (the “1940 Act”), as an open-end management investment company, and is comprised of twelve funds (collectively referred to as the “Funds”). These financial statements and notes relate to the MainStay Large Cap Growth Fund (the “Fund”), a “diversified” fund, as that term is defined in the 1940 Act, as interpreted or modified by regulatory authorities having jurisdiction, from time to time.
The Fund currently has nine classes of shares registered for sale. Class A shares commenced operations on July 1, 1995. Class B, Class C, Class I, Class R1 and Class R2 shares commenced operations on April 1, 2005. Class R3 shares commenced operations on April 28, 2006. Investor Class shares commenced operations on February 28, 2008. Class R6 shares commenced operations on June 17, 2013.
Class B shares of the MainStay Group of Funds are closed to all new purchases as well as additional investments by existing Class B shareholders. Existing Class B shareholders may continue to reinvest dividends and capital gains distributions, as well as exchange their Class B shares for Class B shares of other funds in the MainStay Group of Funds as permitted by the current exchange privileges. Class B shareholders continue to be subject to any applicable contingent deferred sales charge (“CDSC”) at the time of redemption. All other features of the Class B shares, including but not limited to the fees and expenses applicable to Class B shares, remain unchanged. Unless redeemed, Class B shareholders will remain in Class B shares of their respective fund until the Class B shares are converted to Class A or Investor Class shares pursuant to the applicable conversion schedule.
Class A and Investor Class shares are offered at net asset value (“NAV”) per share plus an initial sales charge. No initial sales charge applies to investments of $1 million or more (and certain other qualified purchases) in Class A and Investor Class shares. However, a CDSC of 1.00% may be imposed on certain redemptions made within 18 months of the date of purchase on shares that were purchased without an initial sales charge. Class C shares are offered at NAV without an initial sales charge, although a 1.00% CDSC may be imposed on certain redemptions of such shares made within one year of the date of purchase of Class C shares. When Class B shares were offered, they were offered at NAV without an initial sales charge, although a CDSC that declines depending on the number of years a shareholder has held its Class B shares may be imposed on certain redemptions of such shares made within six years of the date of purchase of such shares. Class I, Class R1, Class R2, Class R3 and Class R6 shares are offered at NAV without a sales charge. Depending upon eligibility, Class B shares convert to either Class A or Investor Class shares at the end of the calendar quarter eight years after the date they were purchased. In addition, depending upon eligibility, Class C shares convert to either Class A or Investor Class shares at the end of the calendar quarter ten years after the date they were purchased. Additionally, as disclosed in the Fund’s prospectus, Class A shares may convert automatically to Investor Class shares and Investor Class shares may convert automatically to Class A shares. Under certain circumstances and as may be permitted by the Trust’s multiple class plan pursuant to Rule 18f-3 under the 1940 Act, specified share classes of the Fund may be
converted to one or more other share classes of the Fund as disclosed in the capital share transactions within these Notes. The classes of shares have the same voting (except for issues that relate solely to one class), dividend, liquidation and other rights, and the same terms and conditions, except that under distribution plans pursuant to Rule 12b-1 under the 1940 Act, Class B and Class C shares are subject to higher distribution and/or service fees than Class A, Investor Class, Class R2 and Class R3 shares. Class I, Class R1 and Class R6 shares are not subject to a distribution and/or service fee. Class R1, Class R2 and Class R3 shares are subject to a shareholder service fee, which is in addition to fees paid under the distribution plans for Class R2 and Class R3 shares.
The Fund’s investment objective is to seek long-term growth of capital.
Note 2–Significant Accounting Policies
The Fund is an investment company and accordingly follows the investment company accounting and reporting guidance of the Financial Accounting Standards Board (“FASB”) Accounting Standard CodificationTopic 946 Financial Services—Investment Companies. The Fund prepares its financial statements in accordance with generally accepted accounting principles (“GAAP”) in the United States of America and follows the significant accounting policies described below.
(A) Securities Valuation. Investments are usually valued as of the close of regular trading on the New York Stock Exchange (the “Exchange”) (usually 4:00 p.m. Eastern time) on each day the Fund is open for business (“valuation date”).
The Board of Trustees of the Trust (the “Board”) adopted procedures establishing methodologies for the valuation of the Fund’s securities and other assets and delegated the responsibility for valuation determinations under those procedures to the Valuation Committee of the Trust (the “Valuation Committee”). The Board authorized the Valuation Committee to appoint a Valuation Subcommittee (the “Subcommittee”) to deal in the first instance with establishing the prices of securities for which market quotations are not readily available or the prices of which are not otherwise readily determinable under these procedures. The Subcommittee meets (in person, via electronic mail or via teleconference) on an as-needed basis. Subsequently, the Valuation Committee meets to ensure that actions taken by the Subcommittee were appropriate. The procedures state that, subject to the oversight of the Board and unless otherwise noted, the responsibility for theday-to-day valuation of portfolio assets (including fair value measurements for the Fund’s assets and liabilities) rests with New York Life Investment Management LLC (“New York Life Investments” or the “Manager”), aided to whatever extent necessary by the Subadvisor (as defined in Note 3(A)).
To assess the appropriateness of security valuations, the Manager, the Subadvisor or the Fund’s third-party service provider, who is subject to oversight by the Manager, regularly compares prior day prices, prices on comparable securities and the sale prices to the prior and current day prices and challenges prices with changes exceeding certain tolerance levels with third-party pricing services or broker sources. For those securities valued through either a standardized fair valuation methodology or a fair valuation measurement, the Subcommittee deals in the first instance with such valuation and the Valuation Committee reviews
| | |
| 20 | | MainStay Large Cap Growth Fund |
and affirms, if appropriate, the reasonableness of the valuation based on such methodologies and measurements on a regular basis after considering information that is reasonably available and deemed relevant by the Valuation Committee. Any action taken by the Subcommittee with respect to the valuation of a portfolio security or other asset is submitted for review and ratification (if appropriate) to the Valuation Committee and the Board at the next regularly scheduled meeting.
“Fair value” is defined as the price the Fund would reasonably expect to receive upon selling an asset or liability in an orderly transaction to an independent buyer in the principal or most advantageous market for the asset or liability. Fair value measurements are determined within a framework that establishes a three-tier hierarchy which maximizes the use of observable market data and minimizes the use of unobservable inputs to establish a classification of fair value measurements for disclosure purposes. “Inputs” refer broadly to the assumptions that market participants would use in pricing the asset or liability, including assumptions about risk, such as the risk inherent in a particular valuation technique used to measure fair value using a pricing model and/or the risk inherent in the inputs for the valuation technique. Inputs may be observable or unobservable. Observable inputs reflect the assumptions market participants would use in pricing the asset or liability based on market data obtained from sources independent of the Fund. Unobservable inputs reflect the Fund’s own assumptions about the assumptions market participants would use in pricing the asset or liability based on the information available. The inputs or methodology used for valuing assets or liabilities may not be an indication of the risks associated with investing in those assets or liabilities. The three-tier hierarchy of inputs is summarized below.
| • | | Level 1—quoted prices in active markets for an identical asset or liability |
| • | | Level 2—other significant observable inputs (including quoted prices for a similar asset or liability in active markets, interest rates and yield curves, prepayment speeds, credit risk, etc.) |
| • | | Level 3—significant unobservable inputs (including the Fund’s own assumptions about the assumptions that market participants would use in measuring fair value of an asset or liability) |
The level of an asset or liability within the fair value hierarchy is based on the lowest level of an input, both individually and in the aggregate, that is significant to the fair value measurement. As of October 31, 2019, the aggregate value by input level of the Fund’s assets and liabilities is included at the end of the Fund’s Portfolio of Investments.
The Fund may use third-party vendor evaluations, whose prices may be derived from one or more of the following standard inputs, among others:
| | |
• Broker/dealer quotes | | • Benchmark securities |
• Two-sided markets | | • Reference data (corporate actions or material event notices) |
• Bids/offers | | • Monthly payment information |
• Industry and economic events | | • Reported trades |
An asset or liability for which market values cannot be measured using the methodologies described above is valued by methods deemed reasonable in good faith by the Valuation Committee, following the
procedures established by the Board, to represent fair value. Under these procedures, the Fund generally uses a market-based approach which may use related or comparable assets or liabilities, recent transactions, market multiples, book values and other relevant information. The Fund may also use an income-based valuation approach in which the anticipated future cash flows of the asset or liability are discounted to calculate fair value. Discounts may also be applied due to the nature and/or duration of any restrictions on the disposition of the asset or liability. Fair value represents a good faith approximation of the value of a security. Fair value determinations involve the consideration of a number of subjective factors, an analysis of applicable facts and circumstances and the exercise of judgment. As a result, it is possible that the fair value for a security determined in good faith in accordance with the Fund’s valuation procedures may differ from valuations for the same security determined by other funds using their own valuation procedures. Although the Fund’s valuation procedures are designed to value a security at the price the Fund may reasonably expect to receive upon the security’s sale in an orderly transaction, there can be no assurance that any fair value determination thereunder would, in fact, approximate the amount that the Fund would actually realize upon the sale of the security or the price at which the security would trade if a reliable market price were readily available. During the year ended October 31, 2019, there were no material changes to the fair value methodologies.
Securities which may be valued in this manner include, but are not limited to: (i) a security for which trading has been halted or suspended; (ii) a debt security that has recently gone into default and for which there is not a current market quotation; (iii) a security of an issuer that has entered into a restructuring; (iv) a security that has been delisted from a national exchange; (v) a security for which the market price is not readily available from a third-party pricing source or, if so provided, does not, in the opinion of the Manager or the Subadvisor, reflect the security’s market value; (vi) a security subject to trading collars for which no or limited trading takes place; and (vii) a security whose principal market has been temporarily closed at a time when, under normal conditions, it would be open. Securities valued in this manner are generally categorized as Level 3 in the hierarchy. As of October 31, 2019, there were no securities held by the Fund that were fair valued in such a manner.
Equity securities are valued at the last quoted sales prices as of the close of regular trading on the relevant exchange on each valuation date. Securities that are not traded on the valuation date are valued at the mean of the last quoted bid and ask prices. Prices are normally taken from the principal market in which each security trades. These securities are generally categorized as Level 1 in the hierarchy.
Investments in mutual funds, including money market funds, are valued at their respective NAVs as of the close of the Exchange on the valuation date. These securities are generally categorized as Level 1 in the hierarchy.
Temporary cash investments acquired in excess of 60 days to maturity at the time of purchase are valued using the latest bid prices or using valuations based on a matrix system (which considers such factors as security prices, yields, maturities and ratings), both as furnished by independent pricing services. Other temporary cash investments which mature in 60 days or less at the time of purchase (“Short-Term
Notes to Financial Statements(continued)
Investments”) are valued using the amortized cost method of valuation, unless the use of such method would be inappropriate. The amortized cost method involves valuing a security at its cost on the date of purchase and thereafter assuming a constant amortization to maturity of the difference between such cost and the value on maturity date. Amortized cost approximates the current fair value of a security. Securities valued using the amortized cost method are not valued using quoted prices in an active market and are generally categorized as Level 2 in the hierarchy.
The information above is not intended to reflect an exhaustive list of the methodologies that may be used to value portfolio investments. The valuation procedures permit the use of a variety of valuation methodologies in connection with valuing portfolio investments. The methodology used for a specific type of investment may vary based on the market data available or other considerations. The methodologies summarized above may not represent the specific means by which portfolio investments are valued on any particular business day.
(B) Income Taxes. The Fund’s policy is to comply with the requirements of the Internal Revenue Code of 1986, as amended (the “Internal Revenue Code”), applicable to regulated investment companies and to distribute all of its taxable income to the shareholders of the Fund within the allowable time limits. Therefore, no federal, state and local income tax provisions are required.
Management evaluates the Fund’s tax positions to determine if the tax positions taken meet the minimum recognition threshold in connection with accounting for uncertainties in income tax positions taken or expected to be taken for the purposes of measuring and recognizing tax liabilities in the financial statements. Recognition of tax benefits of an uncertain tax position is permitted only to the extent the position is “more likely than not” to be sustained assuming examination by taxing authorities. Management has analyzed the Fund’s tax positions taken on federal, state and local income tax returns for all open tax years (for up to three tax years) and has concluded that no provisions for federal, state and local income tax are required in the Fund’s financial statements. The Fund’s federal, state and local income tax and federal excise tax returns for tax years for which the applicable statutes of limitations have not expired are subject to examination by the Internal Revenue Service and state and local departments of revenue.
(C) Dividends and Distributions to Shareholders. Dividends and distributions are recorded on the ex-dividend date. The Fund intends to declare and pay dividends from net investment income and distributions from net realized capital and currency gains, if any, at least annually. Unless the shareholder elects otherwise, all dividends and distributions are reinvested in the same class of shares of the Fund, at NAV. Dividends and distributions to shareholders are determined in accordance with federal income tax regulations and may differ from determinations using GAAP.
(D) Security Transactions and Investment Income. The Fund records security transactions on the trade date. Realized gains and losses on security transactions are determined using the identified cost method. Dividend income is recognized on the ex-dividend date; net of any foreign tax withheld at the source, and interest income is accrued as earned using the effective interest rate method.
Investment income and realized and unrealized gains and losses on investments of the Fund are allocated pro rata to the separate classes of shares based upon their relative net assets on the date the income is earned or realized and unrealized gains and losses are incurred.
(E) Expenses. Expenses of the Trust are allocated to the individual Funds in proportion to the net assets of the respective Funds when the expenses are incurred, except where direct allocations of expenses can be made. Expenses (other than transfer agent expenses and fees incurred under the shareholder services plans and/or the distribution plans further discussed in Note 3(B)) are allocated to separate classes of shares pro rata based upon their relative net assets on the date the expenses are incurred. The expenses borne by the Fund, including those of related parties to the Fund, are shown in the Statement of Operations.
Additionally, the Fund may invest in mutual funds, which are subject to management fees and other fees that may cause the costs of investing in mutual funds to be greater than the costs of owning the underlying securities directly. These indirect expenses of mutual funds are not included in the amounts shown as expenses in the Fund’s Statement of Operations or in the expense ratios included in the Financial Highlights.
(F) Use of Estimates. In preparing financial statements in conformity with GAAP, management makes estimates and assumptions that affect the reported amounts and disclosures in the financial statements. Actual results could differ from those estimates.
(G) Securities Lending. In order to realize additional income, the Fund may engage in securities lending, subject to the limitations set forth in the 1940 Act and relevant guidance by the staff of the Securities and Exchange Commission (“SEC”). In the event the Fund does engage in securities lending, the Fund will lend through its custodian, State Street Bank and Trust Company (“State Street”), acting as securities lending agent on behalf of the Fund. State Street will manage the Fund’s collateral in accordance with the securities lending agency agreement between the Fund and State Street, and indemnify the Fund against counterparty risk. The loans will be collateralized by cash (which may be invested in a money market fund) and/ornon-cash collateral (which may include U.S. Treasury securities and/or U.S. Government Agency securities issued or guaranteed by the United States government or its agencies or instrumentalities) at least equal at all times to the market value of the securities loaned. The Fund may bear the risk of delay in recovery of, or loss of rights in, the securities loaned should the borrower of the securities experience financial difficulty. The Fund may also record a realized gain or loss on securities deemed sold due to a borrower’s inability to return securities on loan. The Fund bears the risk of any loss on investment of cash collateral. The Fund will receive compensation for lending its securities in the form of fees or it will retain a portion of interest earned on the investment of any cash collateral. The Fund will also continue to receive interest and dividends on the securities loaned and any gain or loss in the market price of the securities loaned that may occur during the term of the loan will be for the account of the Fund. Income earned from securities lending activities, if any, is reflected in the Statement of Operations. As of October 31, 2019, the Fund had securities on loan with an aggregate market value of $20,242,290; the total market value of collateral held by the Fund was $20,565,138. The market value of the collateral held includednon-cash collateral in the form of U.S. Treasury securities with a value
| | |
| 22 | | MainStay Large Cap Growth Fund |
of $45,758 and cash collateral, which was invested into the State Street Navigator Securities Lending Government Money Market Portfolio, with a value of $20,519,380.
(H) Indemnifications. Under the Trust’s organizational documents, its officers and trustees are indemnified against certain liabilities that may arise out of performance of their duties to the Trust. Additionally, in the normal course of business, the Fund enters into contracts with third-party service providers that contain a variety of representations and warranties and which may provide general indemnifications. The Fund’s maximum exposure under these arrangements is unknown, as this would involve future claims that may be made against the Fund that have not yet occurred. Based on experience, management is of the view that the risk of loss in connection with these potential indemnification obligations is remote. However, there can be no assurance that material liabilities related to such obligations will not arise in the future, which could adversely impact the Fund.
Note 3–Fees and Related Party Transactions
(A) Manager and Subadvisor. New York Life Investments, a registered investment adviser and an indirect,wholly-owned subsidiary of New York Life Insurance Company (“New York Life”), serves as the Fund’s Manager, pursuant to an Amended and Restated Management Agreement (“Management Agreement”). The Manager provides offices, conducts clerical, recordkeeping and bookkeeping services and keeps most of the financial and accounting records required to be maintained by the Fund. Except for the portion of salaries and expenses that are the responsibility of the Fund, the Manager pays the salaries and expenses of all personnel affiliated with the Fund and certain operational expenses of the Fund. The Fund reimburses New York Life Investments in an amount equal to a portion of the compensation of the Chief Compliance Officer attributable to the Fund. Winslow Capital Management, LLC. (“Winslow” or the “Subadvisor”), a registered investment adviser, serves as Subadvisor to the Fund and is responsible for theday-to-day portfolio management of the Fund. Pursuant to the terms of a Subadvisory Agreement (“Subadvisory Agreement”) between New York Life Investments and Winslow, New York Life Investments pays for the services of the Subadvisor.
Under the Management Agreement, the Fund pays the Manager a monthly fee for the services performed and the facilities furnished at an annual rate of the Fund’s average daily net assets as follows: 0.75% up to $500 million; 0.725% from $500 million to $750 million; 0.71% from $750 million to $1 billion; 0.70% from $1 billion to $2 billion; 0.66% from $2 billion to $3 billion; 0.61% from $3 billion to $7 billion; 0.585% from $7 billion to $9 billion; and 0.575% in excess of $9 billion.
New York Life Investments has contractually agreed to waive a portion of its management fee so that the management fee does not exceed 0.55% of the Fund’s average daily net assets from $11 billion to $13 billion; and 0.525% of the Fund’s average daily net assets over $13 billion. This agreement will remain in effect until February 28, 2020 and shall renew automatically for one-year terms unless New York Life Investments provides written notice of termination prior to the start of the next term or upon approval of the Board.
New York Life Investments has also contractually agreed to waive fees and/or reimburse expenses so that Total Annual Fund Operating Expenses (excluding taxes, interest, litigation, extraordinary expenses,
brokerage and other transaction expenses relating to the purchase and sale of portfolio investments, and acquired (underlying) fund fees and expenses) of Class I shares do not exceed 0.88% of the Fund’s average daily net assets. New York Life Investments has also contractually agreed to waive fees and/or reimburse expenses so that Total Annual Fund Operating Expenses (excluding taxes, interest, litigation, extraordinary expenses, brokerage and other transaction expenses relating to the purchase or sale of portfolio investments, and acquired (underlying) fund fees and expenses) of Class R6 do not exceed those of Class I. These agreements will remain in effect until February 28, 2020, and shall renew automatically for one-year terms unless New York Life Investments provides written notice of termination prior to the start of the next term or upon approval of the Board.
Additionally, New York Life Investments has agreed to further voluntarily waive fees and/or reimburse expenses so that Total Annual Fund Operating Expenses (excluding taxes, interest, litigation, extraordinary expenses, brokerage and other transaction expenses relating to the purchase and sale of portfolio investments, and acquired (underlying) fund fees and expenses) of Class R1 shares do not exceed 0.95% of its average daily net assets. This voluntary waiver or reimbursement may be discontinued at any time without notice.
During the year ended October 31, 2019, the effective management fee rate was 0.62%, exclusive of any applicable waivers/reimbursements.
During the year ended October 31, 2019, New York Life Investments earned fees from the Fund in the amount of $71,525,027 and waived its fees and/or reimbursed expenses in the amount of $176,956 and paid the Subadvisor in the amount of $27,740,386.
State Street providessub-administration andsub-accounting services to the Fund pursuant to an agreement with New York Life Investments. These services include calculating the daily NAVs of the Fund, maintaining the general ledger andsub-ledger accounts for the calculation of the Fund’s NAVs and assisting New York Life Investments in conducting various aspects of the Fund’s administrative operations. For providing these services to the Fund, State Street is compensated by New York Life Investments.
Pursuant to an agreement between the Trust and New York Life Investments, New York Life Investments is responsible for providing or procuring certain regulatory reporting services for the Fund. The Fund will reimburse New York Life Investments for the actual costs incurred by New York Life Investments in connection with providing or procuring these services for the Fund.
(B) Distribution, Service and Shareholder Service Fees. The Trust, on behalf of the Fund, has entered into a distribution agreement with NYLIFE Distributors LLC (the “Distributor”), an indirect,wholly-owned subsidiary of New York Life. The Fund has adopted distribution plans (the “Plans”) in accordance with the provisions of Rule 12b-1 under the 1940 Act.
Pursuant to the Class A, Investor Class and Class R2 Plans, the Distributor receives a monthly distribution fee from the Class A, Investor Class and Class R2 shares at an annual rate of 0.25% of the average daily net assets of the Class A, Investor Class and Class R2 shares for distribution and/or service activities as designated by the Distributor. Pursuant to the Class B and Class C Plans, Class B and Class C shares pay the Distributor a monthly distribution fee at an annual rate of 0.75%
Notes to Financial Statements(continued)
of the average daily net assets of the Class B and Class C shares, along with a service fee at an annual rate of 0.25% of the average daily net assets of the Class B and Class C shares, for a total 12b-1 fee of 1.00%. Pursuant to the Class R3 Plan, the Distributor receives a monthly distribution and/or service fee from the Class R3 shares at an annual rate of 0.50% of the average daily net assets of the Class R3 shares. Class I, Class R1 and Class R6 shares are not subject to a distribution and/or service fee.
The Plans provide that the distribution and service fees are payable to the Distributor regardless of the amounts actually expended by the Distributor for distribution of the Fund’s shares and service activities.
In accordance with the Shareholder Services Plans for the Class R1, Class R2 and Class R3 shares, the Manager has agreed to provide, through its affiliates or independent third parties, various shareholder and administrative support services to shareholders of the Class R1, Class R2 and Class R3 shares. For its services, the Manager, its affiliates or independent third-party service providers are entitled to a shareholder service fee accrued daily and paid monthly at an annual rate of 0.10% of the average daily net assets of the Class R1, Class R2 and Class R3 shares. This is in addition to any fees paid under the Class R2 and Class R3 Plans.
During the year ended October 31, 2019, shareholder service fees incurred by the Fund were as follows:
| | | | |
Class R1 | | $ | 969,986 | |
Class R2 | | | 201,303 | |
Class R3 | | | 59,547 | |
(C) Sales Charges. During the year ended October 31, 2019, the Fund was advised by the Distributor that the amount of initial sales charges retained on sales of Class A and Investor Class shares were $168,259 and $61,304, respectively.
During the year ended October 31, 2019, the Fund was also advised that the Distributor retained CDSCs on redemptions of Class A, Investor Class, Class B and Class C shares of $2,720, $152, $10,213 and $10,755, respectively.
(D) Transfer, Dividend Disbursing and Shareholder Servicing Agent. NYLIM Service Company LLC, an affiliate of New York Life Investments, is the Fund’s transfer, dividend disbursing and shareholder servicing agent pursuant to an agreement between NYLIM Service Company LLC and the Trust. NYLIM Service Company LLC has entered into an agreement with DST Asset Manager Solutions, Inc. (“DST”), pursuant to which DST performs certain transfer agent services on behalf of NYLIM Service Company LLC. During the year ended October 31, 2019, transfer agent expenses incurred by the Fund were as follows:
| | | | |
Class A | | $ | 916,859 | |
Investor Class | | | 239,275 | |
Class B | | | 50,536 | |
Class C | | | 353,304 | |
Class I | | | 5,884,760 | |
Class R1 | | | 937,575 | |
Class R2 | | | 194,794 | |
Class R3 | | | 57,535 | |
(E) Small Account Fee. Shareholders with small accounts adversely impact the cost of providing transfer agency services. In an effort to reduce total transfer agency expenses, the Fund has implemented a small account fee on certain types of accounts. Certain shareholders with an account balance of less than $1,000 are charged an annual per account fee of $20 (assessed semi-annually), the proceeds from which offset transfer agent fees as reflected in the Statement of Operations.
(F) Investments in Affiliates (in 000’s). During the year ended October 31, 2019, purchases and sales transactions, income earned from investments and shares held of investment companies managed by New York Life Investments or its affiliates were as follows:
| | | | | | | | | | | | | | | | | | | | | | | | | | | | | | | | | | | | |
Affiliated Investment Company | | Value,
Beginning of
Year | | | Purchases
at Cost | | | Proceeds
from Sales | | | Net Realized
Gain/(Loss)
on Sales | | | Change in
Unrealized
Appreciation/
(Depreciation) | | | Value, End
of Year | | | Dividend
Income | | | Other
Distributions | | | Shares
End of
Year | |
MainStay U.S. Government Liquidity Fund | | $ | 199,452 | | | $ | 2,666,120 | | | $ | (2,830,229 | ) | | $ | — | | | $ | — | | | $ | 35,343 | | | $ | 1,619 | | | $ | — | | | | 35,343 | |
Note 4–Federal Income Tax
As of October 31, 2019, the cost and unrealized appreciation (depreciation) of the Fund’s investment portfolio, including applicable derivative contracts and other financial instruments, as determined on a federal income tax basis, were as follows:
| | | | | | | | | | | | | | | | |
| | | Federal Tax
Cost | | | Gross
Unrealized
Appreciation | | | Gross
Unrealized
(Depreciation) | | | Net
Unrealized
Appreciation/
(Depreciation) | |
| | | | |
Investments
in Securities | | $ | 6,841,371,127 | | | $ | 4,875,840,311 | | | $ | (66,916,489 | ) | | $ | 4,808,923,822 | |
As of October 31, 2019, the components of accumulated gain (loss) on a tax basis were as follows:
| | | | | | | | |
Ordinary
Income | | Accumulated
Capital and
Other Gain
(Loss) | | Other
Temporary
Differences | | Unrealized
Appreciation
(Depreciation) | | Total
Accumulated
Gain (Loss) |
| | | | |
| $39,258,684 | | $1,148,627,768 | | $— | | $4,808,923,822 | | $5,996,810,274 |
The difference between book-basis and tax-basis unrealized appreciation (depreciation) is primarily due to wash sale adjustments.
| | |
| 24 | | MainStay Large Cap Growth Fund |
The following table discloses the current year reclassifications between total distributable earnings (loss) and additional paid-in capital arising from permanent differences; net assets as of October 31, 2019 were not affected.
| | | | |
Total
Distributable
Earnings
(Loss) | | Additional
Paid-In
Capital | |
| |
| $(153,752,476) | | $ | 153,752,476 | |
The reclassifications for the Fund are primarily due to equalization.
During the years ended October 31, 2019 and October 31, 2018, the tax character of distributions paid as reflected in the Statements of Changes in Net Assets was as follows:
| | | | | | | | |
| | | 2019 | | | 2018 | |
| | |
Distributions paid from: | | | | | | | | |
Ordinary Income | | $ | 18,825,573 | | | $ | 205,327,756 | |
Long-Term Capital Gain | | | 1,949,667,011 | | | | 1,508,549,989 | |
Total | | $ | 1,968,492,584 | | | $ | 1,713,877,745 | |
Note 5–Custodian
State Street is the custodian of cash and securities held by the Fund. Custodial fees are charged to the Fund based on the Fund’s net assets and/or the market value of securities held by the Fund and the number of certain transactions incurred by the Fund.
Note 6–Line of Credit
The Fund and certain other funds managed by New York Life Investments maintain a line of credit with a syndicate of banks in order to secure a source of funds for temporary purposes to meet unanticipated or excessive redemption requests.
Effective July 30, 2019, under the credit agreement (the “Credit Agreement”), the aggregate commitment amount is $600,000,000 with an additional uncommitted amount of $100,000,000. The commitment fee is an annual rate of 0.15% of the average commitment amount payable quarterly, regardless of usage, to State Street, who serves as the agent to the syndicate. The commitment fee is allocated among the Fund and certain other funds managed by New York Life Investments based upon their respective net assets and other factors. Interest on any revolving credit loan is charged based upon the Federal Funds Rate or the one-month London Interbank Offered Rate (“LIBOR”), whichever is higher. The Credit Agreement expires on July 28, 2020, although the Fund, certain other funds managed by New York Life Investments and the syndicate of banks may renew the Credit Agreement for an additional year on the same or different terms. Prior to July 30, 2019, the aggregate commitment amount and the commitment fee were the same as those under the current Credit Agreement. During the year ended October 31, 2019, there were no borrowings made or outstanding with respect to the Fund under the Credit Agreement.
Note 7–Interfund Lending Program
Pursuant to an exemptive order issued by the SEC, the Fund, along with certain other funds managed by New York Life Investments, may participate in an interfund lending program. The interfund lending program provides an alternative credit facility that permits the Fund and certain other funds managed by New York Life Investments to lend or borrow money for temporary purposes directly to or from one another subject to the conditions of the exemptive order. During the year ended October 31, 2019, there were no interfund loans made or outstanding with respect to the Fund.
Note 8–Purchases and Sales of Securities (in 000’s)
During the year ended October 31, 2019, purchases and sales of securities, other thanshort-term securities, were $6,197,633 and $7,875,101, respectively.
Note 9–Capital Share Transactions
Transactions in capital shares for the years ended October 31, 2019 and October 31, 2018, were as follows:
| | | | | | | | |
Class A | | Shares | | | Amount | |
| | |
Year ended October 31, 2019: | | | | | | | | |
Shares sold | | | 29,353,059 | | | $ | 268,426,134 | |
Shares issued to shareholders in reinvestment of dividends and distributions | | | 20,331,404 | | | | 172,410,314 | |
Shares redeemed | | | (55,548,829 | ) | | | (472,290,215 | ) |
| | | | |
Net increase (decrease) in shares outstanding before conversion | | | (5,864,366 | ) | | | (31,453,767 | ) |
Shares converted into Class A (See Note 1) | | | 1,705,566 | | | | 15,553,995 | |
Shares converted from Class A (See Note 1) | | | (536,402 | ) | | | (4,840,292 | ) |
| | | | |
Net increase (decrease) | | | (4,695,202 | ) | | $ | (20,740,064 | ) |
| | | | |
Year ended October 31, 2018: | | | | | | | | |
Shares sold | | | 42,230,349 | | | $ | 436,720,943 | |
Shares issued to shareholders in reinvestment of dividends and distributions | | | 12,586,881 | | | | 111,645,636 | |
Shares redeemed | | | (33,979,838 | ) | | | (341,156,596 | ) |
| | | | |
Net increase (decrease) in shares outstanding before conversion | | | 20,837,392 | | | | 207,209,983 | |
Shares converted into Class A (See Note 1) | | | 2,993,726 | | | | 30,439,439 | |
Shares converted from Class A (See Note 1) | | | (6,170,055 | ) | | | (60,392,537 | ) |
| | | | |
Net increase (decrease) | | | 17,661,063 | | | $ | 177,256,885 | |
| | | | |
Notes to Financial Statements(continued)
| | | | | | | | |
Investor Class | | Shares | | | Amount | |
| | |
Year ended October 31, 2019: | | | | | | | | |
Shares sold | | | 3,830,144 | | | $ | 34,793,099 | |
Shares issued to shareholders in reinvestment of dividends and distributions | | | 2,314,791 | | | | 19,305,358 | |
Shares redeemed | | | (4,639,102 | ) | | | (42,517,572 | ) |
| | | | |
Net increase (decrease) in shares outstanding before conversion | | | 1,505,833 | | | | 11,580,885 | |
Shares converted into Investor Class (See Note 1) | | | 523,941 | | | | 4,642,395 | |
Shares converted from Investor Class (See Note 1) | | | (1,032,429 | ) | | | (9,357,385 | ) |
| | | | |
Net increase (decrease) | | | 997,345 | | | $ | 6,865,895 | |
| | | | |
Year ended October 31, 2018: | | | | | | | | |
Shares sold | | | 2,315,575 | | | $ | 23,413,077 | |
Shares issued to shareholders in reinvestment of dividends and distributions | | | 1,870,663 | | | | 16,368,293 | |
Shares redeemed | | | (1,711,588 | ) | | | (16,884,001 | ) |
| | | | |
Net increase (decrease) in shares outstanding before conversion | | | 2,474,650 | | | | 22,897,369 | |
Shares converted into Investor Class (See Note 1) | | | 383,765 | | | | 3,862,501 | |
Shares converted from Investor Class (See Note 1) | | | (2,753,111 | ) | | | (27,624,467 | ) |
| | | | |
Net increase (decrease) | | | 105,304 | | | $ | (864,597 | ) |
| | | | |
| | |
| | | | | | | | |
Class B | | Shares | | | Amount | |
| | |
Year ended October 31, 2019: | | | | | | | | |
Shares sold | | | 1,028,282 | | | $ | 7,641,188 | |
Shares issued to shareholders in reinvestment of dividends and distributions | | | 790,046 | | | | 5,317,008 | |
Shares redeemed | | | (1,621,167 | ) | | | (11,932,161 | ) |
| | | | |
Net increase (decrease) in shares outstanding before conversion | | | 197,161 | | | | 1,026,035 | |
Shares converted from Class B (See Note 1) | | | (522,415 | ) | | | (3,658,594 | ) |
| | | | |
Net increase (decrease) | | | (325,254 | ) | | $ | (2,632,559 | ) |
| | | | |
Year ended October 31, 2018: | | | | | | | | |
Shares sold | | | 241,914 | | | $ | 2,022,860 | |
Shares issued to shareholders in reinvestment of dividends and distributions | | | 692,472 | | | | 5,138,144 | |
Shares redeemed | | | (791,214 | ) | | | (6,631,504 | ) |
| | | | |
Net increase (decrease) in shares outstanding before conversion | | | 143,172 | | | | 529,500 | |
Shares converted from Class B (See Note 1) | | | (576,581 | ) | | | (4,863,880 | ) |
| | | | |
Net increase (decrease) | | | (433,409 | ) | | $ | (4,334,380 | ) |
| | | | |
| | | | | | | | |
Class C | | Shares | | | Amount | |
| | |
Year ended October 31, 2019: | | | | | | | | |
Shares sold | | | 5,117,693 | | | $ | 35,118,258 | |
Shares issued to shareholders in reinvestment of dividends and distributions | | | 4,192,160 | | | | 28,171,313 | |
Shares redeemed | | | (15,033,369 | ) | | | (106,518,704 | ) |
| | | | |
Net increase (decrease) in shares outstanding before conversion | | | (5,723,516 | ) | | | (43,229,133 | ) |
Shares converted from Class C (See Note 1) | | | (678,697 | ) | | | (4,791,685 | ) |
| | | | |
Net increase (decrease) | | | (6,402,213 | ) | | $ | (48,020,818 | ) |
| | | | |
Year ended October 31, 2018: | | | | | | | | |
Shares sold | | | 3,673,084 | | | $ | 29,233,083 | |
Shares issued to shareholders in reinvestment of dividends and distributions | | | 3,165,875 | | | | 23,459,136 | |
Shares redeemed | | | (8,509,547 | ) | | | (70,998,343 | ) |
| | | | |
Net increase (decrease) | | | (1,670,588 | ) | | $ | (18,306,124 | ) |
| | | | |
| | |
| | | | | | | | |
Class I | | Shares | | | Amount | |
| | |
Year ended October 31, 2019: | | | | | | | | |
Shares sold | | | 107,314,262 | | | $ | 1,046,676,942 | |
Shares issued to shareholders in reinvestment of dividends and distributions | | | 101,104,248 | | | | 936,225,334 | |
Shares redeemed | | | (210,936,037 | ) | | | (2,057,495,143 | ) |
| | | | |
Net increase (decrease) in shares outstanding before conversion | | | (2,517,527 | ) | | | (74,592,867 | ) |
Shares converted into Class I (See Note 1) | | | 264,091 | | | | 2,538,508 | |
Shares converted from Class I (See Note 1) | | | (5,018,712 | ) | | | (47,690,432 | ) |
| | | | |
Net increase (decrease) | | | (7,272,148 | ) | | $ | (119,744,791 | ) |
| | | | |
Year ended October 31, 2018: | | | | | | | | |
Shares sold | | | 112,191,066 | | | $ | 1,206,894,936 | |
Shares issued to shareholders in reinvestment of dividends and distributions | | | 90,493,251 | | | | 860,590,813 | |
Shares redeemed | | | (223,290,202 | ) | | | (2,402,653,084 | ) |
| | | | |
Net increase (decrease) in shares outstanding before conversion | | | (20,605,885 | ) | | | (335,167,335 | ) |
Shares converted into Class I (See Note 1) | | | 5,585,360 | | | | 58,612,453 | |
Shares converted from Class I (See Note 1) | | | (8,691,745 | ) | | | (91,176,410 | ) |
| | | | |
Net increase (decrease) | | | (23,712,270 | ) | | $ | (367,731,292 | ) |
| | | | |
| | |
| 26 | | MainStay Large Cap Growth Fund |
| | | | | | | | |
Class R1 | | Shares | | | Amount | |
| | |
Year ended October 31, 2019: | | | | | | | | |
Shares sold | | | 13,776,879 | | | $ | 131,313,852 | |
Shares issued to shareholders in reinvestment of dividends and distributions | | | 21,267,138 | | | | 190,978,900 | |
Shares redeemed | | | (50,343,112 | ) | | | (459,758,100 | ) |
| | | | |
Net increase (decrease) in shares outstanding before conversion | | | (15,299,095 | ) | | | (137,465,348 | ) |
Shares converted from Class R1 (See Note 1) | | | (8,876 | ) | | | (86,942 | ) |
| | | | |
Net increase (decrease) | | | (15,307,971 | ) | | $ | (137,552,290 | ) |
| | | | |
Year ended October 31, 2018: | | | | | | | | |
Shares sold | | | 17,515,552 | | | $ | 185,633,941 | |
Shares issued to shareholders in reinvestment of dividends and distributions | | | 24,175,895 | | | | 224,352,308 | |
Shares redeemed | | | (83,439,927 | ) | | | (890,472,249 | ) |
| | | | |
Net increase (decrease) in shares outstanding before conversion | | | (41,748,480 | ) | | | (480,486,000 | ) |
Shares converted from Class R1 (See Note 1) | | | (3,154 | ) | | | (32,750 | ) |
| | | | |
Net increase (decrease) | | | (41,751,634 | ) | | $ | (480,518,750 | ) |
| | | | |
| | |
| | | | | | | | |
Class R2 | | Shares | | | Amount | |
| | |
Year ended October 31, 2019: | | | | | | | | |
Shares sold | | | 5,658,840 | | | $ | 49,861,139 | |
Shares issued to shareholders in reinvestment of dividends and distributions | | | 3,133,404 | | | | 26,445,932 | |
Shares redeemed | | | (14,608,830 | ) | | | (132,155,213 | ) |
| | | | |
Net increase (decrease) | | | (5,816,586 | ) | | $ | (55,848,142 | ) |
| | | | |
Year ended October 31, 2018: | | | | | | | | |
Shares sold | | | 6,634,712 | | | $ | 64,592,751 | |
Shares issued to shareholders in reinvestment of dividends and distributions | | | 3,351,675 | | | | 29,628,809 | |
Shares redeemed | | | (16,238,968 | ) | | | (161,651,454 | ) |
| | | | |
Net increase (decrease) in shares outstanding before conversion | | | (6,252,581 | ) | | | (67,429,894 | ) |
Shares converted from Class R2 (See Note 1) | | | (69 | ) | | | (759 | ) |
| | | | |
Net increase (decrease) | | | (6,252,650 | ) | | $ | (67,430,653 | ) |
| | | | |
| | |
| | | | | | | | |
Class R3 | | Shares | | | Amount | |
| | |
Year ended October 31, 2019: | | | | | | | | |
Shares sold | | | 1,243,682 | | | $ | 10,656,909 | |
Shares issued to shareholders in reinvestment of dividends and distributions | | | 1,368,016 | | | | 10,834,685 | |
Shares redeemed | | | (2,768,367 | ) | | | (23,244,763 | ) |
| | | | |
Net increase (decrease) | | | (156,669 | ) | | $ | (1,753,169 | ) |
| | | | |
Year ended October 31, 2018: | | | | | | | | |
Shares sold | | | 1,306,683 | | | $ | 12,397,991 | |
Shares issued to shareholders in reinvestment of dividends and distributions | | | 1,273,708 | | | | 10,711,886 | |
Shares redeemed | | | (3,899,378 | ) | | | (36,048,817 | ) |
| | | | |
Net increase (decrease) | | | (1,318,987 | ) | | $ | (12,938,940 | ) |
| | | | |
| | | | | | | | |
Class R6 | | Shares | | | Amount | |
| | |
Year ended October 31, 2019: | | | | | | | | |
Shares sold | | | 96,897,227 | | | $ | 926,252,301 | |
Shares issued to shareholders in reinvestment of dividends and distributions | | | 44,637,714 | | | | 416,469,871 | |
Shares redeemed | | | (77,804,055 | ) | | | (760,384,860 | ) |
| | | | |
Net increase (decrease) in shares outstanding before conversion | | | 63,730,886 | | | | 582,337,312 | |
Shares converted into Class R6 (See Note 1) | | | 4,982,451 | | | | 47,690,432 | |
| | | | |
Net increase (decrease) | | | 68,713,337 | | | $ | 630,027,744 | |
| | | | |
Year ended October 31, 2018: | | | | | | | | |
Shares sold | | | 64,001,645 | | | $ | 692,272,013 | |
Shares issued to shareholders in reinvestment of dividends and distributions | | | 29,936,782 | | | | 286,195,637 | |
Shares redeemed | | | (64,420,735 | ) | | | (690,023,758 | ) |
| | | | |
Net increase (decrease) in shares outstanding before conversion | | | 29,517,692 | | | | 288,443,892 | |
Shares converted into Class R6 (See Note 1) | | | 8,642,314 | | | | 91,176,410 | |
| | | | |
Net increase (decrease) | | | 38,160,006 | | | $ | 379,620,302 | |
| | | | |
Note 10–Recent Accounting Pronouncement
To improve the effectiveness of fair value disclosure requirements, the Financial Accounting Standards Board recently issued Accounting Standards Update (ASU)2018-13, Fair Value Measurement Disclosure Framework—Changes to the Disclosure Requirements for Fair Value Measurement (ASU2018-13), which adds, removes, and modifies certain aspects relating to fair value disclosure. ASU2018-13 is effective for interim and annual reporting periods beginning after December 15, 2019; early adoptions of the entire ASU 2018-13, or portions thereof, is permitted. Management has evaluated the implications of certain other provisions of the ASU and has determined to early adopt aspects related to the removal and modifications of certain fair value measurement disclosures under the ASU effective immediately. At this time, management is evaluating the implications of certain other provisions of the ASU related to new disclosure requirements and any impact on the financial statement disclosures has not yet been determined.
Note 11–Subsequent Events
In connection with the preparation of the financial statements of the Fund as of and for the year ended October 31, 2019, events and transactions subsequent to October 31, 2019, through the date the financial statements were issued have been evaluated by the Fund’s management for possible adjustment and/or disclosure. No subsequent events requiring financial statement adjustment or disclosure have been identified.
Report of Independent Registered Public Accounting Firm
To the Shareholders and Board of Trustees
The MainStay Funds:
Opinion on the Financial Statements
We have audited the accompanying statement of assets and liabilities of MainStay Large Cap Growth Fund (the Fund), one of the funds constituting The MainStay Funds, including the portfolio of investments, as of October 31, 2019, the related statement of operations for the year then ended, the statements of changes in net assets for each of the years in thetwo-year period then ended, and the related notes (collectively, the financial statements) and the financial highlights for each of the years in thefive-year period then ended. In our opinion, the financial statements and financial highlights present fairly, in all material respects, the financial position of the Fund as of October 31, 2019, the results of its operations for the year then ended, the changes in its net assets for each of the years in thetwo-year period then ended, and the financial highlights for each of the years in thefive-year period then ended, in conformity with U.S. generally accepted accounting principles.
Basis for Opinion
These financial statements and financial highlights are the responsibility of the Fund’s management. Our responsibility is to express an opinion on these financial statements and financial highlights based on our audits. We are a public accounting firm registered with the Public Company Accounting Oversight Board (United States) (PCAOB) and are required to be independent with respect to the Fund in accordance with the U.S. federal securities laws and the applicable rules and regulations of the Securities and Exchange Commission and the PCAOB.
We conducted our audits in accordance with the standards of the PCAOB. Those standards require that we plan and perform the audit to obtain reasonable assurance about whether the financial statements and financial highlights are free of material misstatement, whether due to error or fraud. Our audits included performing procedures to assess the risks of material misstatement of the financial statements and financial highlights, whether due to error or fraud, and performing procedures that respond to those risks. Such procedures included examining, on a test basis, evidence regarding the amounts and disclosures in the financial statements and financial highlights. Such procedures also included confirmation of securities owned as of October 31, 2019, by correspondence with the custodian and the transfer agent. Our audits also included evaluating the accounting principles used and significant estimates made by management, as well as evaluating the overall presentation of the financial statements and financial highlights. We believe that our audits provide a reasonable basis for our opinion.

We have served as the auditor of one or more New York Life Investment Management investment companies since 2003.
Philadelphia, Pennsylvania
December 23, 2019
| | |
| 28 | | MainStay Large Cap Growth Fund |
Federal Income Tax Information
(Unaudited)
The Fund is required under the Internal Revenue Code to advise shareholders in a written statement as to the federal tax status of dividends paid by the Fund during such fiscal years. Accordingly, the Fund paid $1,949,667,011 as long term capital gain distributions.
For the fiscal year ended October 31, 2019, the Fund designated approximately $18,825,573 under the Internal Revenue Code as qualified dividend income eligible for reduced tax rates.
The dividends paid by the Fund during the fiscal year ended October 31, 2019 should be multiplied by 100.0% to arrive at the amount eligible for the corporate dividend-received deduction.
In February 2020, shareholders will receive an IRS Form1099-DIV or substitute Form 1099, which will show the federal tax status of the distributions received by shareholders in calendar year 2019. The amounts that will be reported on such1099-DIV or substitute Form 1099 will be the amounts you are to use on your federal income tax return and will differ from the amounts which we must report for the Fund’s fiscal year end October 31, 2019.
Proxy Voting Policies and Procedures and Proxy Voting Record
A description of the policies and procedures that New York Life Investments uses to vote proxies related to the Fund’s securities is available without charge, upon request, by visiting the MainStay Funds’ website atnylinvestments.com/fundsor visiting the SEC’s website atwww.sec.gov.
The Fund is required to file with the SEC its proxy voting records for the12-month period ending June 30 on Form N-PX. The most recent Form N-PX or proxy voting record is available free of charge upon request by calling800-624-6782; visiting the MainStay Funds’ website atnylinvestments.com/funds; or visiting the SEC’s website atwww.sec.gov.
Shareholder Reports and Quarterly Portfolio Disclosure
The Fund is required to file its complete schedule of portfolio holdings with the SEC 60 days after its first and third fiscal quarter on Form N-PORT. The Fund’s holdings report is available free of charge by visiting the SEC’s website atwww.sec.govor upon request by calling New York Life Investments at800-624-6782.
Board of Trustees and Officers (Unaudited)
The Trustees and officers of the Funds are listed below. The Board oversees the MainStay Group of Funds (which consists of MainStay Funds and MainStay Funds Trust), MainStay VP Funds Trust, MainStay MacKay DefinedTerm Municipal Opportunities Fund, the Manager and the Subadvisors, and elects the officers of the Funds who are responsible for theday-to-day operations of the Funds. Information pertaining to the Trustees and officers is set forth below. Each Trustee serves until his or her successor is elected and qualified or until his or her
resignation, death or removal. Under the Board’s retirement policy, unless an exception is made, a Trustee must tender his or her resignation by the end of the calendar year during which he or she reaches the age of 75. Officers are elected annually by the Board. The business address of each Trustee and officer listed below is 51 Madison Avenue, New York, New York 10010. A majority of the Trustees are not “interested persons” (as defined by the 1940 Act and rules adopted by the SEC thereunder) of the Fund (“Independent Trustees”).
| | | | | | | | | | | | |
| | | | | Name and
Year of Birth | | Term of Office,
Position(s) Held and
Length of Service | | Principal Occupation(s)
During Past Five Years | | Number of
Portfolios in
Fund Complex
Overseen by
Trustee | | Other Directorships
Held by Trustee |
Interested Trustee | | | | Yie-Hsin Hung* 1962 | | MainStay Funds: Trustee since 2017; MainStay Funds Trust:Trustee since 2017. | | Senior Vice President of New York Life since joining in 2010, Member of the Executive Management Committee since 2017, Chief Executive Officer, New York Life Investment Management Holdings LLC & New York Life Investment Management LLC since 2015. Senior Managing Director andCo-President of New York Life Investment Management LLC from January 2014 to May 2015. Previously held positions of increasing responsibility, including head of NYLIM International, Alternative Growth Businesses, and Institutional investments since joining New York Life in 2010. | | 74 | | MainStay VP Funds Trust:
Trustee since 2017 (31 portfolios); and
MainStay MacKay DefinedTerm Municipal Opportunities Fund: Trustee since 2017. |
| | * | This Trustee is considered to be an “interested person” of the MainStay Group of Funds, MainStay VP Funds Trust and MainStay MacKay DefinedTerm Municipal Opportunities Fund, within the meaning of the 1940 Act because of her affiliation with New York Life Insurance Company, New York Life Investment Management LLC, Candriam Belgium S.A., Candriam Luxembourg S.C.A., IndexIQ Advisors LLC, MacKay Shields LLC, NYL Investors LLC, NYLIFE Securities LLC and/or NYLIFE Distributors LLC, as described in detail above in the column entitled “Principal Occupation(s) During Past Five Years.” |
| | |
| 30 | | MainStay Large Cap Growth Fund |
| | | | | | | | | | | | |
| | | | | Name and
Year of Birth | | Term of Office,
Position(s) Held and
Length of Service | | Principal Occupation(s)
During Past Five Years | | Number of
Portfolios in
Fund Complex
Overseen by
Trustee | | Other Directorships
Held by Trustee |
Independent Trustees | | | | David H. Chow 1957 | | MainStay Funds: Trustee since 2016, Advisory Board Member (June 2015 to December 2015); MainStay Funds Trust:Trustee since 2016, Advisory Board Member (June 2015 to December 2015). | | Founder and CEO, DanCourt Management, LLC (since 1999) | | 74 | | MainStay VP Funds Trust: Trustee since 2016, Advisory Board Member (June 2015 to December 2015) (31 portfolios);
MainStay MacKay DefinedTerm Municipal Opportunities Fund: Trustee since 2016, Advisory Board Member (June 2015 to December 2015);
Market Vectors Group of Exchange-Traded Funds: Independent Chairman of the Board of Trustees since 2008 and Trustee since 2006 (56 portfolios); and
Berea College of Kentucky: Trustee since 2009. |
| | | | Susan B. Kerley 1951 | | MainStay Funds: Chairman since 2017 and Trustee since 2007; MainStay Funds Trust:Chairman since 2017 and Trustee since 1990.** | | President, Strategic Management Advisors LLC (since 1990) | | 74 | | MainStay VP Funds Trust: Chairman since January 2017 and Trustee since 2007 (31 portfolios)***;
MainStay MacKay DefinedTerm Municipal Opportunities Fund: Chairman since 2017 and Trustee since 2011; and
Legg Mason Partners Funds: Trustee since 1991 (45 portfolios). |
| | | | Alan R. Latshaw 1951 | | MainStay Funds: Trustee; MainStay Funds Trust: Trustee and Audit Committee Financial Expert since 2007.** | | Retired; Partner, Ernst & Young LLP (2002 to 2003); Partner, Arthur Andersen LLP (1989 to 2002); Consultant to the MainStay Funds Audit and Compliance Committee (2004 to 2006) | | 74 | | MainStay VP Funds Trust: Trustee and Audit Committee Financial Expert since 2007 (31 portfolios)***;
MainStay MacKay DefinedTerm Municipal Opportunities Fund: Trustee and Audit Committee Financial Expert since 2011;
State Farm Associates Funds Trusts: Trustee since 2005 (4 portfolios);
and State Farm Variable Product Trust: Trustee since 2005 (9 portfolios). |
| | | | Richard H. Nolan, Jr. 1946 | | MainStay Funds: Trustee since 2007; MainStay Funds Trust:Trustee since 2007.** | | Managing Director, ICC Capital Management (since 2004); President—Shields/Alliance, Alliance Capital Management (1994 to 2004) | | 74 | | MainStay VP Funds Trust: Trustee since 2006 (31 portfolios)***; and
MainStay MacKay DefinedTerm Municipal Opportunities Fund: Trustee since 2011. |
| | | | Jacques P. Perold 1958 | | MainStay Funds: Trustee since 2016, Advisory Board Member (June 2015 to December 2015); MainStay Funds Trust:Trustee since 2016, Advisory Board Member (June 2015 to December 2015). | | Retired; President, Fidelity Management & Research Company (2009 to 2014); Founder, President and Chief Executive Officer, Geode Capital Management, LLC (2001 to 2009) | | 74 | | MainStay VP Funds Trust: Trustee since 2016, Advisory Board Member (June 2015 to December 2015) (31 portfolios);
MainStay MacKay DefinedTerm Municipal Opportunities Fund: Trustee since 2016, Advisory Board Member (June 2015 to December 2015);
Allstate Corporation: Director since 2015;MSCI, Inc.: Director since 2017 and
Boston University: Trustee since 2014. |
| | | | | | | | | | | | |
| | | | | Name and
Year of Birth | | Term of Office,
Position(s) Held and
Length of Service | | Principal Occupation(s)
During Past Five Years | | Number of
Portfolios in
Fund Complex
Overseen by
Trustee | | Other Directorships
Held by Trustee |
Independent Trustees | | | | Richard S. Trutanic 1952 | | MainStay Funds: Trustee since 1994; MainStay Funds Trust: Trustee since 2007.** | | Chairman and Chief Executive Officer, Somerset & Company (financial advisory firm) (since 2004); Managing Director, The Carlyle Group (private investment firm) (2002 to 2004); Senior Managing Director, Partner and Board Member, Groupe Arnault S.A. (private investment firm) (1999 to 2002) | | 74 | | MainStay VP Funds Trust: Trustee since 2007 (31 portfolios)***; and
MainStay MacKay DefinedTerm Municipal Opportunities Fund: Trustee since 2011. |
| | ** | Includes prior service as a Director/Trustee of certain predecessor entities to MainStay Funds Trust. |
| | *** | Includes prior service as a Director of MainStay VP Series Fund, Inc., the predecessor to MainStay VP Funds Trust. |
| | |
| 32 | | MainStay Large Cap Growth Fund |
| | | | | | | | |
| | | | | Name and
Year of Birth | | Position(s) Held and
Length of Service | | Principal Occupation(s)
During Past Five Years |
Officers
of the
Trust
(Who are
not
Trustees)* | | | | Kirk C. Lehneis 1974 | | President, MainStay Funds, MainStay Funds Trust (since 2017) | | Chief Operating Officer and Senior Managing Director (since 2016), New York Life Investment Management LLC; Chairman of the Board (since 2017), NYLIFE Distributors LLC; Chairman of the Board, NYLIM Service Company LLC (since 2017); Trustee, President and Principal Executive Officer of IndexIQ Trust, IndexIQ ETF Trust and IndexIQ Active ETF Trust (since January 2018); President, MainStay MacKay DefinedTerm Municipal Opportunities Fund and MainStay VP Funds Trust
(since 2017)**; Senior Managing Director, Global Product Development (2015 to 2016); Managing Director, Product Development (2010 to 2015), New York Life Investment Management LLC |
| | | | Jack R. Benintende 1964 | | Treasurer and Principal Financial and Accounting Officer, MainStay Funds (since 2007), MainStay Funds Trust (since 2009) | | Managing Director, New York Life Investment Management LLC (since 2007); Treasurer and Principal Financial and Accounting Officer, MainStay MacKay DefinedTerm Municipal Opportunities Fund (since 2011) and MainStay VP Funds Trust (since 2007)**; and Assistant Treasurer, New York Life Investment Management Holdings LLC (2008 to 2012) |
| | | | Kevin M. Bopp 1969 | | Vice President and Chief Compliance Officer, MainStay Funds and MainStay Funds Trust (since 2014) | | Chief Compliance Officer, New York Life Investment Management LLC, IndexIQ Trust, IndexIQ ETF Trust and IndexIQ Active ETF Trust (since 2016), Director and Associate General Counsel (2011 to 2014) and Vice President and Assistant General Counsel (2010 to 2011), New York Life Investment Management LLC; Vice President and Chief Compliance Officer, MainStay VP Funds Trust, MainStay MacKay DefinedTerm Municipal Opportunities Fund (since 2014); Assistant Secretary, MainStay Funds, MainStay Funds Trust and MainStay VP Funds Trust (2010 to 2014)**, MainStay MacKay DefinedTerm Municipal Opportunities Fund (2011 to 2014) |
| | | | J. Kevin Gao 1967 | | Secretary and Chief Legal Officer, MainStay Funds and MainStay Funds Trust (since 2010) | | Managing Director and Associate General Counsel, New York Life Investment Management LLC (since 2010); Secretary and Chief Legal Officer, MainStay MacKay DefinedTerm Municipal Opportunities Fund (since 2011) and MainStay VP Funds Trust (since 2010)** |
| | | | Scott T. Harrington 1959 | | Vice President—Administration, MainStay Funds (since 2005), MainStay Funds Trust (since 2009) | | Managing Director, New York Life Investment Management LLC (including predecessor advisory organizations) (since 2000); Member of the Board of Directors, New York Life Trust Company (since 2009); Vice President—Administration, MainStay MacKay DefinedTerm Municipal Opportunities Fund (since 2011) and MainStay VP Funds Trust (since 2005)** |
| | * | The officers listed above are considered to be “interested persons” of the MainStay Group of Funds, MainStay VP Funds Trust and MainStay MacKay Defined Term Municipal Opportunities Fund within the meaning of the 1940 Act because of their affiliation with the MainStay Group of Funds, New York Life Insurance Company and/or its affiliates, including New York Life Investment Management LLC, NYLIM Service Company LLC, NYLIFE Securities LLC and/or NYLIFE Distributors LLC, as described in detail in the column captioned “Principal Occupation(s) During Past Five Years.” Officers are elected annually by the Board. |
| | ** | Includes prior service as an Officer of MainStay VP Series Fund, Inc., the predecessor to MainStay VP Funds Trust. |
MainStay Funds
Equity
U.S. Equity
MainStay Epoch U.S. All Cap Fund
MainStay Epoch U.S. Equity Yield Fund
MainStay Large Cap Growth Fund
MainStay MacKay Common Stock Fund
MainStay MacKay Growth Fund
MainStay MacKay S&P 500 Index Fund
MainStay MacKay Small Cap Core Fund1
MainStay MacKay U.S. Equity Opportunities Fund
MainStay MAP Equity Fund
International Equity
MainStay Epoch International Choice Fund
MainStay MacKay International Equity Fund
MainStay MacKay International Opportunities Fund
Emerging Markets Equity
MainStay Candriam Emerging Markets Equity Fund
MainStay MacKay Emerging Markets Equity Fund
Global Equity
MainStay Epoch Capital Growth Fund
MainStay Epoch Global Equity Yield Fund
Fixed Income
Taxable Income
MainStay Candriam Emerging Markets Debt Fund2
MainStay Floating Rate Fund
MainStay Indexed Bond Fund3
MainStay MacKay High Yield Corporate Bond Fund
MainStay MacKay Infrastructure Bond Fund
MainStay MacKay Short Duration High Yield Fund
MainStay MacKay Total Return Bond Fund
MainStay MacKay Unconstrained Bond Fund
Tax-Exempt Income
MainStay MacKay California Tax Free Opportunities Fund4
MainStay MacKay High Yield Municipal Bond Fund
MainStay MacKay Intermediate Tax Free Bond Fund
MainStay MacKay New York Tax Free Opportunities Fund5
MainStay MacKay Short Term Municipal Fund
MainStay MacKay Tax Free Bond Fund
Money Market
MainStay Money Market Fund
Mixed Asset
MainStay Balanced Fund
MainStay Income Builder Fund
MainStay MacKay Convertible Fund
Speciality
MainStay Cushing Energy Income Fund
MainStay Cushing MLP Premier Fund
MainStay Cushing Renaissance Advantage Fund
Asset Allocation
MainStay Conservative Allocation Fund
MainStay Growth Allocation Fund
MainStay Moderate Allocation Fund
MainStay Moderate Growth Allocation Fund
Manager
New York Life Investment Management LLC
New York, New York
Subadvisors
Candriam Belgium S.A.6
Brussels, Belgium
Candriam Luxembourg S.C.A.6
Strassen, Luxembourg
Cushing Asset Management, LP
Dallas, Texas
Epoch Investment Partners, Inc.
New York, New York
MacKay Shields LLC6
New York, New York
Markston International LLC
White Plains, New York
NYL Investors LLC6
New York, New York
Winslow Capital Management, LLC
Minneapolis, Minnesota
Legal Counsel
Dechert LLP
Washington, District of Columbia
Independent Registered Public Accounting Firm
KPMG LLP
Philadelphia, Pennsylvania
| 1. | Formerly known as MainStay Epoch U.S. Small Cap Fund. |
| 2. | Formerly known as MainStay MacKay Emerging Markets Debt Fund. |
| 3. | Effective December 5, 2019, MainStay Indexed Bond Fund was renamed MainStay Short Term Bond Fund. |
| 4. | Class A and Class I shares of this Fund are registered for sale in AZ, CA, MI, NV, OR, TX, UT and WA. Class I shares are registered for sale in CO, FL, GA, HI, ID, MA, MD, NH, NJ and NY. |
| 5. | This Fund is registered for sale in CA, CT, DE, FL, MA, NJ, NY and VT. |
| 6. | An affiliate of New York Life Investment Management LLC. |
Not part of the Annual Report
For more information
800-624-6782
nylinvestments.com/funds
“New York Life Investments” is both a service mark, and the common trade name, of the investment advisors affiliated with New York Life Insurance Company. The MainStay Funds® are managed by New York Life Investment Management LLC and distributed by NYLIFE Distributors LLC, 30 Hudson Street, Jersey City, NJ 07302, a wholly owned subsidiary of New York Life Insurance Company. NYLIFE Distributors LLC is a Member FINRA/SIPC.
©2019 NYLIFE Distributors LLC. All rights reserved.
| | |
| 1715995 MS159-19 | | MSLG11-12/19 (NYLIM) NL221 |
MainStay MAP Equity Fund
Message from the President and Annual Report
October 31, 2019

Beginning on January 1, 2021, paper copies of each MainStay Fund’s annual and semiannual shareholder reports will no longer be sent by mail, unless you specifically request paper copies of the reports from MainStay Funds or from your financial intermediary. Instead, the reports will be made available on the MainStay Funds’ website. You will be notified by mail and provided with a website address to access the report each time a new report is posted to the website.
If you already elected to receive shareholder reports electronically, you will not be affected by this change and you need not take any action. At any time, you may elect to receive reports and other communications from MainStay Funds electronically by calling toll-free 800-624-6782, by sending an e-mail to MainStayShareholderServices@nylim.com, or by contacting your financial intermediary.
You may elect to receive all future shareholder reports in paper form free of charge. If you hold shares of a MainStay Fund directly, you can inform MainStay Funds that you wish to receive paper copies of reports by calling toll-free 800-624-6782 or by sending an e-mail to MainStayShareholderServices@nylim.com. If you hold shares of a MainStay Fund through a financial intermediary, please contact the financial intermediary to make this election. Your election to receive reports in paper form will apply to all MainStay Funds in which you are invested and may apply to all funds held with your financial intermediary.
| | | | | | | | |
| | | | | |
| Not FDIC/NCUA Insured | | Not a Deposit | | May Lose Value | | No Bank Guarantee | | Not Insured by Any Government Agency |

This page intentionally left blank
Message from the President
Stock and bond markets generally gained ground during the12-month reporting period ended October 31, 2019, despite concerns regarding slowing U.S. and global economic growth and international trade conflicts.
After trending higher in November 2018, U.S. stocks and bonds dipped sharply in December 2018, over concerns regarding the pace of economic growth, a U.S. government shutdown and the potential impact of trade disputes between the United States and other nations, particularly China. U.S. markets recovered quickly in 2019 as trade tensions eased, the government reopened and the U.S. Federal Reserve Board (“Fed”) adopted a more accommodative tone regarding the future direction of interest rates. A wide spectrum of equity and fixed-income sectors gained ground through April 2019. Mixed macroeconomic signals and the inability of China and the United States to reach a trade agreement caused the market’s recovery to suffer during the spring and summer months of 2019. However, accommodative monetary policies from several central banks, including a series of interest rate cuts by the Fed, along with better-than-expected corporate earnings reassured investors and enabled markets to resume their advance.
Persistent, albeit slow, U.S. economic growth underpinned the U.S. stock market’s advance during the reporting period, positioning major U.S. equity indices to reach record territory by late October 2019. Sector strength shifted as investor sentiment alternated betweenrisk-on andrisk-off positions. In general, for the reporting period, cyclical, growth-oriented stocks outperformed their value-oriented counterparts by a small margin, with the information technology sector leading thelarge-cap S&P 500® Index. However, the traditionally more defensive areas of real estate and utilities generated above-average performance as well. Communication services, consumer discretionary, industrials and consumer staples performed in the middle of the pack, while materials, financials and health care lagged. Only the energy sector suffered declines, undermined by weak oil prices and concerns about future energy demand.
In the fixed-income markets, slowing economic growth, modest inflation and the Fed’s interest rate cuts created an environment of falling yields and rising prices for most bonds, with many areas of the market offering historically low yields by the end of the reporting period. Higher-credit-quality, longer-duration securities generally produced strong returns, with investment-
grade corporates and long-term Treasury bonds delivering particularly strong performance. A similar dynamic characterized the performance of the municipal bond market, with longer-term, higher-grade issues performing relatively well. On average, municipal bonds roughly matched the gains of corporate issues while providingtax-advantaged returns for eligible investors.
International stock and bond markets tended to underperform their U.S. counterparts, constrained by lackluster economic growth in the Eurozone and dramatically slowing growth in China and related parts of Asia amid persistent trade tensions with the United States. Uncertainties surrounding the unending Brexit drama took a further toll on investor confidence, with Britain seemingly unable to resolve its internal conflicts over how, or whether, to exit from the European Union. Nevertheless, on average, international securities delivered modestly positive returns, bolstered by the accommodative monetary policies implemented by European and Asian central banks. Bonds from both emerging and developed markets generally produced stronger returns than equities while repeating the pattern of outperformance by higher-quality, longer-term instruments seen in the United States.
As the economic growth cycle lengthens, investors are left to ponder how best to position their portfolios for an uncertain future. When the yield curve inverted earlier this year prompting concerns of a potential recession, we were reminded that the direction of the economy is continually subject to change, and perceptions of the economy can shift even more rapidly. As a MainStay investor, you can rely on us to manage our Funds with unflagging energy and dedication so that you can remain focused on your long-term objectives in the face of uncertainty and change. Our goal remains to provide you with the consistently reliable financial tools you need to achieve your long-term objectives.
Sincerely,

Kirk C. Lehneis
President
The opinions expressed are as of the date of this report and are subject to change. There is no guarantee that any forecast made will come to pass. This material does not constitute investment advice and is not intended as an endorsement of any specific investment. Past performance is no guarantee of future results.
Not part of the Annual Report
Table of Contents
Investors should refer to the Fund’s Summary Prospectus and/or Prospectus and consider the Fund’s investment objectives, strategies, risks, charges and expenses carefully before investing. The Summary Prospectus and/or Prospectus contain this and other information about the Fund. You may obtain copies of the Fund’s Summary Prospectus, Prospectus and Statement of Additional Information free of charge, upon request, by calling toll-free 800-624-6782, by writing to NYLIFE Distributors LLC, Attn: MainStay Marketing Department, 30 Hudson Street, Jersey City, NJ 07302 or by sending ane-mail to MainStayShareholderServices@nylim.com. These documents are also available via the MainStay Funds’ website at nylinvestments.com/funds. Please read the Summary Prospectus and/or Prospectus carefully before investing.
Investment and Performance Comparison1(Unaudited)
Performance data quoted represents past performance. Past performance is no guarantee of future results. Because of market volatility and other factors, current performance may be lower or higher than the figures shown. Investment return and principal value will fluctuate, and as a result, when shares are redeemed, they may be worth more or less than their original cost. The graph below depicts the historical performance of Class I shares of the Fund. Performance will vary from class to class based on differences in class-specific expenses and sales charges. For performance information current to the most recent month-end, please call 800-624-6782 or visit nylinvestments.com/funds.
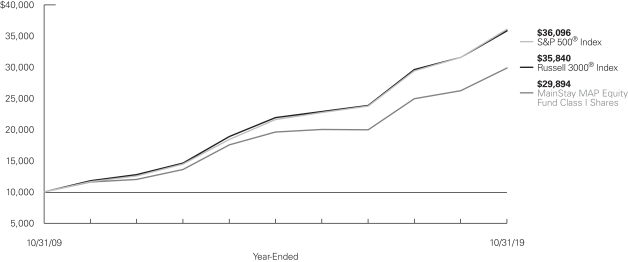
Average Annual Total Returns for the Year-Ended October 31, 2019
| | | | | | | | | | | | | | | | | | | | | | | | |
| Class | | Sales Charge | | | | Inception
Date | | | One Year | | | Five Years | | | Ten Years | | | Gross
Expense
Ratio2 | |
| | | | | | | |
| Class A Shares | | Maximum 5.5% Initial Sales Charge | | With sales charges Excluding sales charges | |
| 6/9/1999
|
| |
| 7.29
13.54 | %
| |
| 7.27
8.49 | %
| |
| 10.67
11.30 | %
| |
| 1.10
1.10 | %
|
| Investor Class Shares | | Maximum 5.5% Initial Sales Charge | | With sales charges Excluding sales charges | |
| 2/28/2008
|
| |
| 7.04
13.27 |
| |
| 7.06
8.28 |
| |
| 10.46
11.08 |
| |
| 1.31
1.31 |
|
| Class B Shares3 | | Maximum 5% CDSC if Redeemed Within the First Six Years of Purchase | | With sales charges Excluding sales charges | | | 6/9/1999 | | |
| 7.45
12.45 |
| |
| 7.22
7.48 |
| |
| 10.26
10.26 |
| |
| 2.06
2.06 |
|
| Class C Shares | | Maximum 1% CDSC if Redeemed Within One Year of Purchase | | With sales charges Excluding sales charges | |
| 6/9/1999
|
| |
| 11.45
12.45 |
| |
| 7.48
7.48 |
| |
| 10.26
10.26 |
| |
| 2.06
2.06 |
|
| Class I Shares | | No Sales Charge | | | | | 1/21/1971 | | | | 13.80 | | | | 8.77 | | | | 11.57 | | | | 0.85 | |
| Class R1 Shares | | No Sales Charge | | | | | 1/2/2004 | | | | 13.71 | | | | 8.66 | | | | 11.46 | | | | 0.95 | |
| Class R2 Shares | | No Sales Charge | | | | | 1/2/2004 | | | | 13.42 | | | | 8.38 | | | | 11.18 | | | | 1.20 | |
| Class R3 Shares | | No Sales Charge | | | | | 4/28/2006 | | | | 13.14 | | | | 8.11 | | | | 10.91 | | | | 1.45 | |
| 1. | The performance table and graph do not reflect the deduction of taxes that a shareholder would pay on distributions or Fund share redemptions. Total returns reflect maximum applicable sales charges as indicated in the table above, if any, changes in share price, and reinvestment of dividend and capital gain distributions. The graph assumes the initial investment amount shown above and reflects the deduction of all sales charges that would have applied for the period of investment. Performance figures may reflect certain fee waivers and/or expense limitations, without which total returns may have |
| | been lower. For more information on share classes and current fee waivers and/or expense limitations, if any, please refer to the Notes to Financial Statements. |
| 2. | The gross expense ratios presented reflect the Fund’s “Total Annual Fund Operating Expenses” from the most recent Prospectus and may differ from other expense ratios disclosed in this report. |
| 3. | Class B shares are closed to all new purchases as well as additional investments by existing Class B shareholders. |
The footnotes on the next page are an integral part of the table and graph and should be carefully read in conjunction with them.
| | | | | | | | | | | | |
| Benchmark Performance | | One Year | | | Five Years | | | Ten Years | |
| | | |
Russell 3000® Index4 | | | 13.49 | % | | | 10.31 | % | | | 13.62 | % |
S&P 500® Index5 | | | 14.33 | | | | 10.78 | | | | 13.70 | |
Morningstar Large Blend Category Average6 | | | 12.66 | | | | 8.94 | | | | 12.22 | |
| 4. | The Russell 3000® Index is the Fund’s primary broad-based securities market index for comparison purposes. The Russell 3000® Index measures the performance of the largest 3,000 U.S. companies representing approximately 98% of the investable U.S. equity market. Results assume reinvestment of all dividends and capital gains. An investment cannot be made directly in an index. |
| 5. | The S&P 500® Index is the Fund’s secondary benchmark. “S&P 500®” is a trademark of The McGraw-Hill Companies, Inc. The S&P 500® Index is widely regarded as the standard index for measuring large-cap U.S. stock market performance. Results assume reinvestment of all dividends and capital gains. An investment cannot be made directly in an index. |
| 6. | The Morningstar Large Blend Category Average is representative of funds that represent the overall U.S. stock market in size, growth rates and price. Stocks in the top 70% of the capitalization of the U.S. equity market are defined as large cap. The blend style is assigned to portfolios where neither growth nor value characteristics predominate. These portfolios tend to invest across the spectrum of U.S. industries, and owing to their broad exposure, the portfolios’ returns are often similar to those of the S&P 500 Index. Results are based on average total returns of similar funds with all dividends and capital gain distributions reinvested. |
The footnotes on the preceding page are an integral part of the table and graph and should be carefully read in conjunction with them.
| | |
| 6 | | MainStay MAP Equity Fund |
|
Cost in Dollars of a $1,000 Investment in MainStay MAP Equity Fund (Unaudited) |
The example below is intended to describe the fees and expenses borne by shareholders during thesix-month period from May 1, 2019, to October 31, 2019, and the impact of those costs on your investment.
Example
As a shareholder of the Fund you incur two types of costs: (1) transaction costs, including exchange fees and sales charges (loads) on purchases (as applicable), and (2) ongoing costs, including management fees, distribution and/or service(12b-1) fees, and other Fund expenses (as applicable). This example is intended to help you understand your ongoing costs (in dollars) of investing in the Fund and to compare these costs with the ongoing costs of investing in other mutual funds. The example is based on an investment of $1,000 made at the beginning of thesix-month period and held for the entire period from May 1, 2019, to October 31, 2019.
This example illustrates your Fund’s ongoing costs in two ways:
Actual Expenses
The second and third data columns in the table below provide information about actual account values and actual expenses. You may use the information in these columns, together with the amount you invested, to estimate the expenses that you paid during the six months ended October 31, 2019. Simply divide your account value by $1,000 (for example, an $8,600 account value divided by $1,000 = 8.6), then
multiply the result by the number under the heading entitled “Expenses Paid During Period” to estimate the expenses you paid on your account during this period.
Hypothetical Example for Comparison Purposes
The fourth and fifth data columns in the table below provide information about hypothetical account values and hypothetical expenses based on the Fund’s actual expense ratio and an assumed rate of return of 5% per year before expenses, which is not the Fund’s actual return. The hypothetical account values and expenses may not be used to estimate the actual ending account balances or expenses you paid for thesix-month period shown. You may use this information to compare the ongoing costs of investing in the Fund with the ongoing costs of investing in other mutual funds. To do so, compare this 5% hypothetical example with the 5% hypothetical examples that appear in the shareholder reports of the other mutual funds.
Please note that the expenses shown in the table are meant to highlight your ongoing costs only and do not reflect any transactional costs, such as exchange fees or sales charges (loads). Therefore, the fourth and fifth data columns of the table are useful in comparing ongoing costs only and will not help you determine the relative total costs of owning different funds. In addition, if these transactional costs were included, your costs would have been higher.
| | | | | | | | | | | | | | | | | | | | | | |
| | | | | | | | | | | | | | | | | | |
| Share Class | | Beginning
Account
Value
5/1/19 | | | Ending Account
Value (Based
on Actual
Returns and
Expenses)
10/31/19 | | | Expenses
Paid
During
Period1 | | | Ending Account
Value (Based
on Hypothetical
5% Annualized
Return and
Actual Expenses)
10/31/19 | | | Expenses
Paid
During
Period1 | | | Net Expense
Ratio
During
Period2 |
| | | | | | |
| Class A Shares | | $ | 1,000.00 | | | $ | 1,041.20 | | | $ | 5.66 | | | $ | 1,019.66 | | | $ | 5.60 | | | 1.10% |
| | | | | | |
| Investor Class Shares | | $ | 1,000.00 | | | $ | 1,040.00 | | | $ | 6.84 | | | $ | 1,018.50 | | | $ | 6.77 | | | 1.33% |
| | | | | | |
| Class B Shares | | $ | 1,000.00 | | | $ | 1,036.20 | | | $ | 10.68 | | | $ | 1,014.72 | | | $ | 10.56 | | | 2.08% |
| | | | | | |
| Class C Shares | | $ | 1,000.00 | | | $ | 1,036.20 | | | $ | 10.68 | | | $ | 1,014.72 | | | $ | 10.56 | | | 2.08% |
| | | | | | |
| Class I Shares | | $ | 1,000.00 | | | $ | 1,042.50 | | | $ | 4.38 | | | $ | 1,020.92 | | | $ | 4.33 | | | 0.85% |
| | | | | | |
| Class R1 Shares | | $ | 1,000.00 | | | $ | 1,042.00 | | | $ | 4.94 | | | $ | 1,020.37 | | | $ | 4.89 | | | 0.96% |
| | | | | | |
| Class R2 Shares | | $ | 1,000.00 | | | $ | 1,040.70 | | | $ | 6.22 | | | $ | 1,019.11 | | | $ | 6.16 | | | 1.21% |
| | | | | | |
| Class R3 Shares | | $ | 1,000.00 | | | $ | 1,039.40 | | | $ | 7.45 | | | $ | 1,017.90 | | | $ | 7.38 | | | 1.45% |
| 1. | Expenses are equal to the Fund’s annualized expense ratio of each class multiplied by the average account value over the period, divided by 365 and multiplied by 184 (to reflect thesix-month period). The table above represents the actual expenses incurred during thesix-month period. In addition to the fees and expenses which the Fund bears directly, it also indirectly bears a pro rata share of the fees and expenses of the underlying funds in which it invests. Such indirect expenses are not included in the above-reported expense figures. |
| 2. | Expenses are equal to the Fund’s annualized expense ratio to reflect thesix-month period. |
Industry Composition as of October 31, 2019(Unaudited)
| | | | |
| |
| Aerospace & Defense | | | 7.5 | % |
| |
| Interactive Media & Services | | | 7.2 | |
| |
| Software | | | 7.2 | |
| |
| Media | | | 6.6 | |
| |
| Banks | | | 6.1 | |
| |
| Technology Hardware, Storage & Peripherals | | | 5.5 | |
| |
| Insurance | | | 4.4 | |
| |
| Capital Markets | | | 3.9 | |
| |
| Entertainment | | | 3.6 | |
| |
| IT Services | | | 3.5 | |
| |
| Specialty Retail | | | 3.4 | |
| |
| Pharmaceuticals | | | 3.2 | |
| |
| Health Care Providers & Services | | | 3.1 | |
| |
| Health Care Equipment & Supplies | | | 3.0 | |
| |
| Oil, Gas & Consumable Fuels | | | 2.6 | |
| |
| Road & Rail | | | 2.6 | |
| |
| Semiconductors & Semiconductor Equipment | | | 2.5 | |
| |
| Chemicals | | | 1.7 | |
| |
| Beverages | | | 1.5 | |
| |
| Consumer Finance | | | 1.4 | |
| |
| Diversified Telecommunication Services | | | 1.4 | |
| |
| Hotels, Restaurants & Leisure | | | 1.3 | |
| |
| Internet & Direct Marketing Retail | | | 1.3 | |
| |
| Biotechnology | | | 1.2 | |
| | | | |
| |
| Diversified Financial Services | | | 1.2 | % |
| |
| Machinery | | | 1.2 | |
| |
| Communications Equipment | | | 1.1 | |
| |
| Life Sciences Tools & Services | | | 1.0 | |
| |
| Electrical Equipment | | | 0.9 | |
| |
| Industrial Conglomerates | | | 0.8 | |
| |
| Food Products | | | 0.7 | |
| |
| Air Freight & Logistics | | | 0.6 | |
| |
| Construction & Engineering | | | 0.6 | |
| |
| Equity Real Estate Investment Trusts | | | 0.6 | |
| |
| Food & Staples Retailing | | | 0.6 | |
| |
| Multiline Retail | | | 0.6 | |
| |
| Electronic Equipment, Instruments & Components | | | 0.5 | |
| |
| Household Durables | | | 0.5 | |
| |
| Thrifts & Mortgage Finance | | | 0.5 | |
| |
| Tobacco | | | 0.4 | |
| |
| Household Products | | | 0.3 | |
| |
| Real Estate Management & Development | | | 0.3 | |
| |
| Energy Equipment & Services | | | 0.2 | |
| |
| Short-Term Investment | | | 1.1 | |
| |
| Other Assets, Less Liabilities | | | 0.6 | |
| | | | |
| |
| | | 100.0 | % |
| | | | |
See Portfolio of Investments beginning on page 13 for specific holdings within these categories. The Fund’s holdings are subject to change.
Top Ten Holdings as of October 31, 2019(excluding short-term investment) (Unaudited)
| 6. | Liberty Media Corp-Liberty SiriusXM |
| | |
| 8 | | MainStay MAP Equity Fund |
Portfolio Management Discussion and Analysis(Unaudited)
Questions answered by portfolio managers Christopher Mullarkey and James Mulvey of Markston International LLC (“Markston”), a Subadvisor to the Fund; and portfolio managers William W. Priest, CFA, Michael A. Welhoelter, CFA, David N. Pearl and Justin Howell of Epoch Investment Partners, Inc. (“Epoch”), a Subadvisor to the Fund.
How did MainStay MAP Equity Fund perform relative to its benchmarks and peer group during the 12 months ended October 31, 2019?
For the 12 months ended October 31, 2019, Class I shares of MainStay MAP Equity Fund returned 13.80%, outperforming the 13.49% return of the Fund’s primary benchmark, the Russell 3000® Index, and underperforming the 14.33% return of the S&P 500® Index, which is the Fund’s secondary benchmark. Over the same period, Class I shares outperformed the 12.66% return of the Morningstar Large Blend Category Average.1
Were there any changes to the Fund during the reporting period?
Effective February 28, 2019, Justin Howell was added as a portfolio manager of the Epoch portion of the Fund. As of the end of the reporting period, William Priest, Michael Welhoelter and David Pearl continued to manage the Epoch portion of the Fund.
What factors affected the Fund’s relative performance during the reporting period?
Markston
During the reporting period, the Markston portion of the Fund outperformed the Russell 3000® Index primarily due to investments in the communication services sector, where returns benefited from overweight exposure to the sector and good individual stock selections.
The reporting period can be broken down into two parts: a macro-inducedsell-off at the end of 2018 and the strong performance of the equity markets throughout 2019. Markets rallied in the new year despite ongoing trade tensions between the United States and China, supported by solid corporate earnings, a modestly growing economy and a more accommodating shift in Federal Reserve monetary policy. As long-term “Value with a Catalyst” investors, we look to use macro-induced volatility in our favor to build portfolios of high-quality stocks that can do well as the market appreciates while protecting investors against downside risk. Our approach targets companies where the current valuation is disconnected from positive long-term prospects, while favoring business models that we believe are highly scalable, profitable and defensible. Additionally, we seek companies that exhibit at least three of our seven “Alpha2 Generators.” These include insider buying, management change, stock repurchase by the company, sale orspin-off of a division, tax loss carry forwards, consolidating industries, and our triple discount valuation mechanism.
The relatively good performance of our portion of the Fund over the past year resulted partly from significantly overweight exposure to communication services, a sector that outperformed the broader benchmark average. Relative performance was further enhanced by the strong performance of individual communication services holdings that outperformed the sector’s average.
Epoch
During the reporting period, the Epoch portion of the Fund outperformed the Russell 3000® Index primarily driven by positive security selection in the consumer discretionary, financials, information technology and materials sectors. Alternatively, certain holdings in the health care sector detracted somewhat from relative performance. Ten of eleven sectors posted positive returns for the same period. Against this backdrop, the Epoch portion of the Fund’s less-than-benchmark weight in real estate and utilities, the two best performing sectors for the reporting period, also detracted from relative performance.
During the reporting period, which sectors were the strongest positive contributors to the Fund’s relative performance and which sectors were particularly weak?
Markston
As mentioned earlier, the strongest positive sector contributor to relative performance in the Markston portion of the Fund was communication services. (Contributions take weightings and total returns into account.) Investments in the energy sector also bolstered relative returns, primarily due to good stock selection, as did financial sector investments, where overweight exposure drove the bulk of the outperformance. Notable detractors from relative performance included investments in the consumer discretionary sector, largely due to underweight exposure; the consumer staples sector, where security selection undermined relative performance; and materials, where stock selection proved primarily responsible.
Epoch
In the Epoch portion of the Fund, the consumer discretionary, energy and materials sectors generated the strongest contributions to relative performance during the reporting period,
while communication services, health care and real estate detracted most significantly.
| 1. | See page 5 for other share class returns, which may be higher or lower than Class I share returns. See page 6 for more information on benchmark and peer group returns. |
| 2. | Alpha measures the relationship between a mutual fund’s return and its beta over a three-year period. Often, alpha is viewed as the excess return (positive or negative) or the value added by the portfolio manager. Beta is a measure of volatility in relation to the market as a whole. A beta higher than 1 indicates that a security or portfolio will tend to exhibit higher volatility than the market. A beta lower than 1 indicates that a security or portfolio will tend to exhibit lower volatility than the market. |
During the reporting period, which individual stocks made the strongest positive contributions to the Fund’s absolute performance and which stocks detracted the most?
Markston
The stocks that made the strongest contributions to absolute performance in the Markston portion of the Fund included software giant Microsoft, consumer technology company Apple and Internet advertising leader Alphabet.
Despite its size, Microsoft continues to generate double-digit revenue growth with its cloud business being the key driver of outperformance over the past year. We believe the company’s cloud business is still in its early growth phase, and margins are poised for further rapid expansion. At the same time, the more mature parts of Microsoft’s business continue to generate meaningful free cash flow that is being returned to shareholders through buybacks and dividends, and reinvested into the company’s areas of more explosive growth. We have tremendous respect for CEO Satya Nadella as a capital allocator. Since taking over in 2014, he has reignited growth and transformed Microsoft from a mature software company into a dominant player in the rapidly growing cloud industry. While the Fund continues to hold Microsoft shares as of October 31, 2019, we trimmed the size of its position during the reporting period as the stock price increased.
Apple sells consumer products such as smartphones, tablets, computers and watches, as well as offering services to its user base. Over the past year, the company was able to stabilize iPhone sales while ramping up its high-margin services business. The company now has 420 million paid subscribers, and we expect it to easily surpass its initial 500 million goal by 2020. In our opinion, growth in Apple’s higher margin services is likely to outpace products going forward as the smartphone market has matured. This trend should not only boost margins, but also support Apple’s valuation with recurring, high-margin revenues commanding a premium valuation multiple versus device sales. As with Microsoft, the Fund continues to hold Apple shares, though we trimmed the position size during the reporting period.
Alphabet, which owns Google, averaged strong and constant currency revenue growth during the reporting period, doubling the size of its cloud business. We believe Google remains well positioned given its dominance in online search. In addition, the company is unique among its digital advertising peers in that its users explicitly show commercial intent, leading to higher conversion rates. As of the end of the reporting period, we continue to view Alphabet as a top secular growth story trading at a very reasonable valuation. The Fund continues to hold its position.
Shares in Walgreens Boots Alliance (Walgreens), a retail pharmacy and pharmaceutical wholesale company, detracted most from absolute performance in the Markston portion of the Fund. The company faced ongoing pharmacy reimbursement pressures during the reporting period, with a reduction in corresponding offsets, including lower branded-drug inflation and a smaller-than-usual tailwind from break-open generic drugs. Additionally, challenging conditions in the U.K. consumer market undermined results for the company’s Boots division. To combat these pressures, Walgreens stepped up its multi-year cost reduction initiative and plans to reduce annual spending by at least $1.8 billion by 2022. The company also continues to pursue strategic partnerships with an emphasis on expanding its scope and reach in health care services. By driving increased store traffic and volume growth, management plans to better leverage the company’s nationwide footprint. Walgreens has inked partnerships with a number of companies, including diagnostics firm LabCorp, UnitedHealth’s MedExpress and insurer Humana. The Fund continues to hold its position in the stock.
Another significant detractor from absolute performance, online retailer Qurate Retail Group, faced significant margin pressures at its QVC and Home Shopping Network (HSN) segments. These pressures were due in part to the rapid growth of electronics sales, which is an inherentlylow-margin business, and in part to increased fulfillment, freight and marketing costs, as well as bad debt reserves. The Fund reduced its exposure to the stock, but still maintains a position because we see reasons for optimism. Management is currently restructuring QVC and HSN to be two separate brands that still operate as a unified entity from the perspectives of support and procurement, creating meaningful synergies in the process. Additionally, the company continues to buy back stock at attractive valuations, raising the possibility that the firm could be taken private.
Integrated retail pharmacy, pharmacy benefits management and managed care company CVS Health (CVS) also detracted from absolute performance. The company’s stock faced a combination of industry headwinds (pharmacy reimbursement pressure, lower branded-drug inflation and shrinking margins for generics) and company-specific impediments. We expect that a number of these obstacles should ease next year, setting the stage for a return to growth in 2020. We also remain constructive on CVS’s efforts to vertically integrate into the managed care business through Aetna, and believe that the reconfigured company will be well positioned in the ongoing shift to value-based care, given its unique set of assets (retail drugstores, pharmacy benefits management, and health insurance), clinical capabilities and high patient touch points. The Fund continues to hold its position in CVS shares.
| | |
| 10 | | MainStay MAP Equity Fund |
Epoch
Microsoft made the strongest absolute contribution to the Epoch portion of the Fund. Shares rose after the company reported better-than-expected third-quarter revenue and earnings, with sales increasing by double digits as more large businesses outsourced their storage and data server needs to Microsoft’s Azure infrastructure. We believe the cloud opportunity remains vast and the company is investing appropriately to capture their fair share of this growth. We expect margins to continue improving as the business scales and to normalize in a few years. In our opinion, all these factors should drive strong revenue and free cash flow growth for many years.
Holdings in semiconductor equipment maker Applied Materials also bolstered absolute returns after the company reported third-quarter revenue and earnings that exceeded consensus expectations. The company generated strong sales, although servicing revenue was slightly weaker on lower spare parts utilization. Stocks of companies in the semiconductor group were volatile during the reporting period on investor concerns that revenues and profits have peaked in the current cycle. Despite this, we believe that spending on semiconductor equipment remains healthy and expect revenue at Applied Materials to grow by double digits longer term.
Holdings in independent oil and gas producer Occidental Petroleum detracted from the absolute performance of the Epoch portion of the Fund. The company’s share price dipped after Occidental agreed to acquire Anadarko Petroleum in a cash and stock deal valued at approximately $38 billion, a price some analysts panned as too expensive. However, Occidental forecast over $2.0 billion in cost synergies to be realized over the next few years. Furthermore, Anadarko’s sizeable land holdings in the Permian Basin are among the most profitable oil and gas well locations in the country. The Fund continues to hold the position.
Shares in consumer electronics maker Apple, another detractor from the absolute performance of the Epoch portion of the Fund, declined in late 2018 due to concerns over waning demand for the iPhone based on previously published reports from supply-chain vendors. The company subsequently reduced their guidance for quarterly revenue for their fiscal first quarter ending in December 2018 largely due to anticipated iPhone weakness in China. The Fund exited its position in the stock.
What were some of the Fund’s largest purchases and sales during the reporting period?
Markston
The largest purchase in the Markston portion of the Fund during the reporting period was a position in social media company Facebook. We started buying shares in October 2018 after a
several months-long decline in stock price, and continued to purchase it through January 2019. Prior to our entry point, the stock was too richly valued to meet our criteria as a “Value with a Catalyst” candidate. However, the stock price decline allowed the Fund to establish a position in this high-quality name at an attractive valuation. It is one of the dominant leaders in digital advertising, a market that continues to exhibit robust revenue growth. At the same time, we see the company’s messaging platform as having large monetization optionality that is not yet priced in by the market.
We also added to the Fund’s existing positions in investment banking firm Morgan Stanley and insurer American International Group, both of which exhibited some of the alpha generators we look for as part of our investment process. We took advantage of the late-2018sell-off in the financials sector to increase the Fund’s exposure to both stocks.
During the reporting period, the largest sales in the Markston portion of the Fund included Apple, W.R. Berkley and Boeing. We reduced the Fund’s overweight exposure to Apple, our largest single position, to raise cash for redemptions and to reduce portfolio risk. We exited our entire position in insurer W.R. Berkley as the stock reached our target valuation. Finally, we modestly reduced the Fund’s holdings in aircraft maker Boeing, partly to reduce risk and partly to take longer-term profits in the stock, which had more than doubled since the start of 2017.
Epoch
During the reporting period, the largest new purchase in the Epoch portion of the Fund was in shares of Facebook, the world’s largest online social network with more than two billion monthly active users. Users engage with each other in different ways, exchanging messages and sharing news events, photos, and videos. In addition, the company owns Facebook Messenger, Instagram and WhatsApp. Facebook estimates that at least one of these services is used daily by close to 2.0 billion people worldwide. Facebook’s stock corrected significantly after its July 2018 peak, when it had announced significant investments in operating and capital expenses for the safety and security of its network, and a slowdown in revenue growth as it transitions its monetization strategy to stories from newsfeed on both Facebook and Instagram. Since then, the company has reported two consecutive quarters of better-than-expected revenue growth, indicating that its revenue transition, while difficult, may not prove as challenging as expected. Starting in 2020, we expect Facebook to return to vigorous growth as expenses grow more in line with revenues, an upside not reflected in the company’s current valuation.
Another significant purchase was of Huntington Ingalls, which designs, builds and maintains nuclear andnon-nuclear ships for
the U.S. Navy and the U.S. Coast Guard. The company also provides after-market services for military ships worldwide. In our opinion, the company is a well-positioned defense contractor with high visibility given a firm backlog of $40 billion, or approximately five years of current revenue. We also believe that it is well run by a management team that consistently takes a conservative approach toward revenue and profit recognition, leaving only execution and congressional priorities as key risk factors. The company has been winding down a large capital expenditure program that was focused on upgrading its shipyards, in the wake of which we expect free cash flow to effectively double over the next few years.
During the reporting period, the Fund sold its entire position in specialty chemical producer WR Grace & Co. after the company issued second-quarter financial results in which it lowered its guidance for full fiscal year revenue and profits. Management cited several factors contributing to the reduced forecast, including the explosion of a Philadelphia refinery that had been a large Grace customer and the subsequent bankruptcy of its owner; equipment failure that disrupted operations at one of Grace’s silicas manufacturing plants; and the global automotive production slowdown, which prompted another customer to reduce production. As a result of these near-term headwinds, we opted to redeploy the Fund’s assets into other ideas with a more favorable risk/reward ratio.
Another major sale involved the Fund’s position in medical products maker Allergan, which we exited in light of growing uncertainties regarding the company’s future cash flow growth. Key challenges facing the company include the loss of patent protection on its chronic dry eye drug Restasis; the fact that Allergan will stop selling and recall remaining supplies of some of its breast implant products in the European Union on the request of French regulators; and the lack of any meaningful updates or guidance from the company on its drug pipeline after management reduced its forward guidance for revenue and profits.
How did the Fund’s sector weightings change during the reporting period?
Markston
During the reporting period, the most significant sector weighting increase in the Markston portion of the Fund was in communication services, while the weighting in information technology increased to a smaller degree. Over the same period, the Markston portion of the Fund decreased its sector exposure to health care and, nominally, energy.
Epoch
The Epoch portion of the Fund increased its sector weighting to communication services and, to a lesser degree, industrials during the reporting period. Decreased sector allocations included information technology and health care.
How was the Fund positioned at the end of the reporting period?
Markston
As of October 31, 2019, the Markston portion of the Fund held its most overweight exposure relative to the Russell 3000® Index in shares of Apple, Boeing and Alphabet. As of the same date, the Markston portion of the Fund held no exposure to Amazon, Exxon Mobil or Verizon, all of which represent significant benchmark weights.
Epoch
As of October 31, 2019, the largest overweight sector positions relative to the Russell 3000® Index in the Epoch portion of the Fund included financials and communication services. As of the same date, the most significantly underweight positions relative to the benchmark in the Epoch portion of the Fund included consumer staples and information technology.
The opinions expressed are those of the portfolio managers as of the date of this report and are subject to change. There is no guarantee that any forecasts will come to pass. This material does not constitute investment advice and is not intended as an endorsement of any specific investment.
| | |
| 12 | | MainStay MAP Equity Fund |
Portfolio of InvestmentsOctober 31, 2019
| | | | | | | | |
| | |
| | | Shares | | | Value | |
| Common Stocks 98.3%† | |
Aerospace & Defense 7.5% | | | | | | | | |
Boeing Co. | | | 105,044 | | | $ | 35,705,506 | |
Hexcel Corp. | | | 83,736 | | | | 6,248,380 | |
Huntington Ingalls Industries, Inc. | | | 23,938 | | | | 5,401,849 | |
Raytheon Co. | | | 82,300 | | | | 17,464,883 | |
United Technologies Corp. | | | 93,365 | | | | 13,405,347 | |
| | | | | | | | |
| | | | | | | 78,225,965 | |
| | | | | | | | |
Air Freight & Logistics 0.6% | |
XPO Logistics, Inc. (a) | | | 75,552 | | | | 5,772,173 | |
| | | | | | | | |
|
Banks 6.1% | |
Bank of America Corp. | | | 861,369 | | | | 26,935,009 | |
Bank OZK | | | 142,210 | | | | 3,990,413 | |
Citigroup, Inc. | | | 90,005 | | | | 6,467,759 | |
JPMorgan Chase & Co. | | | 106,215 | | | | 13,268,378 | |
U.S. Bancorp | | | 104,163 | | | | 5,939,374 | |
Wells Fargo & Co. | | | 143,310 | | | | 7,399,095 | |
| | | | | | | | |
| | | | | | | 64,000,028 | |
| | | | | | | | |
Beverages 1.5% | |
Coca-Cola Co. | | | 87,285 | | | | 4,750,923 | |
PepsiCo., Inc. | | | 80,200 | | | | 11,001,034 | |
| | | | | | | | |
| | | | | | | 15,751,957 | |
| | | | | | | | |
Biotechnology 1.2% | |
AbbVie, Inc. | | | 102,913 | | | | 8,186,729 | |
Celgene Corp. (a) | | | 38,000 | | | | 4,105,140 | |
| | | | | | | | |
| | | | | | | 12,291,869 | |
| | | | | | | | |
Capital Markets 3.9% | |
Bank of New York Mellon Corp. | | | 67,951 | | | | 3,176,709 | |
Charles Schwab Corp. | | | 118,461 | | | | 4,822,547 | |
Goldman Sachs Group, Inc. | | | 37,007 | | | | 7,896,554 | |
KKR & Co., Inc., Class A | | | 200,637 | | | | 5,784,365 | |
Morgan Stanley | | | 271,077 | | | | 12,483,096 | |
State Street Corp. | | | 98,525 | | | | 6,509,547 | |
| | | | | | | | |
| | | | | | | 40,672,818 | |
| | | | | | | | |
Chemicals 1.7% | |
Corteva, Inc. (a) | | | 64,966 | | | | 1,713,803 | |
Dow, Inc. (a) | | | 58,801 | | | | 2,968,862 | |
DuPont de Nemours, Inc. | | | 116,703 | | | | 7,691,895 | |
Linde PLC | | | 27,108 | | | | 5,376,872 | |
| | | | | | | | |
| | | | | | | 17,751,432 | |
| | | | | | | | |
Communications Equipment 1.1% | |
Arista Networks, Inc. (a) | | | 21,904 | | | | 5,357,061 | |
Plantronics, Inc. | | | 152,429 | | | | 6,008,751 | |
| | | | | | | | |
| | | | | | | 11,365,812 | |
| | | | | | | | |
Construction & Engineering 0.6% | |
Jacobs Engineering Group, Inc. | | | 64,828 | | | | 6,066,604 | |
| | | | | | | | |
| | | | | | | | |
| | |
| | | Shares | | | Value | |
Consumer Finance 1.4% | |
American Express Co. | | | 96,385 | | | $ | 11,304,033 | |
Discover Financial Services | | | 38,235 | | | | 3,068,741 | |
| | | | | | | | |
| | | | | | | 14,372,774 | |
| | | | | | | | |
Diversified Financial Services 1.2% | |
AXA Equitable Holdings, Inc. | | | 281,157 | | | | 6,072,991 | |
Berkshire Hathaway, Inc., Class B (a) | | | 28,093 | | | | 5,972,010 | |
| | | | | | | | |
| | | | | | | 12,045,001 | |
| | | | | | | | |
Diversified Telecommunication Services 1.4% | |
AT&T, Inc. | | | 328,003 | | | | 12,624,836 | |
GCI Liberty, Inc., Class A (a) | | | 22,788 | | | | 1,594,704 | |
| | | | | | | | |
| | | | | | | 14,219,540 | |
| | | | | | | | |
Electrical Equipment 0.9% | |
AMETEK, Inc. | | | 53,222 | | | | 4,877,797 | |
Rockwell Automation, Inc. | | | 27,270 | | | | 4,690,167 | |
| | | | | | | | |
| | | | | | | 9,567,964 | |
| | | | | | | | |
Electronic Equipment, Instruments & Components 0.5% | |
TE Connectivity, Ltd. | | | 64,366 | | | | 5,760,757 | |
| | | | | | | | |
|
Energy Equipment & Services 0.2% | |
Schlumberger, Ltd. | | | 63,000 | | | | 2,059,470 | |
| | | | | | | | |
|
Entertainment 3.6% | |
Electronic Arts, Inc. (a) | | | 53,317 | | | | 5,139,759 | |
Liberty Media Corp-Liberty Formula One, Class C (a) | | | 58,600 | | | | 2,490,500 | |
Lions Gate Entertainment Corp., Class B | | | 48,788 | | | | 365,422 | |
Madison Square Garden Co., Class A (a) | | | 39,078 | | | | 10,430,700 | |
Walt Disney Co. | | | 146,088 | | | | 18,979,753 | |
| | | | | | | | |
| | | | | | | 37,406,134 | |
| | | | | | | | |
Equity Real Estate Investment Trusts 0.6% | |
Ventas, Inc. | | | 89,319 | | | | 5,814,667 | |
| | | | | | | | |
|
Food & Staples Retailing 0.6% | |
Walgreens Boots Alliance, Inc. | | | 116,788 | | | | 6,397,647 | |
| | | | | | | | |
|
Food Products 0.7% | |
Mondelez International, Inc., Class A | | | 57,157 | | | | 2,997,885 | |
Post Holdings, Inc. (a) | | | 39,928 | | | | 4,108,591 | |
| | | | | | | | |
| | | | | | | 7,106,476 | |
| | | | | | | | |
Health Care Equipment & Supplies 3.0% | |
Abbott Laboratories | | | 51,000 | | | | 4,264,110 | |
Boston Scientific Corp. (a) | | | 127,734 | | | | 5,326,508 | |
Danaher Corp. | | | 45,132 | | | | 6,220,092 | |
Medtronic PLC | | | 141,975 | | | | 15,461,078 | |
| | | | | | | | |
| | | | | | | 31,271,788 | |
| | | | | | | | |
Health Care Providers & Services 3.1% | |
Centene Corp. (a) | | | 148,503 | | | | 7,882,539 | |
| | | | | | |
The notes to the financial statements are an integral part of,
and should be read in conjunction with, the financial statements. | | | | | 13 | |
Portfolio of InvestmentsOctober 31, 2019 (continued)
| | | | | | | | |
| | |
| | | Shares | | | Value | |
| Common Stocks (continued) | | | | | | | | |
Health Care Providers & Services (continued) | | | | | |
CVS Health Corp. | | | 247,202 | | | $ | 16,411,741 | |
UnitedHealth Group, Inc. | | | 33,305 | | | | 8,416,173 | |
| | | | | | | | |
| | | | | | | 32,710,453 | |
| | | | | | | | |
Hotels, Restaurants & Leisure 1.3% | |
Marriott International, Inc., Class A | | | 23,500 | | | | 2,973,925 | |
McDonald’s Corp. | | | 25,130 | | | | 4,943,071 | |
MGM Resorts International | | | 206,409 | | | | 5,882,656 | |
| | | | | | | | |
| | | | | | | 13,799,652 | |
| | | | | | | | |
Household Durables 0.5% | |
LGI Homes, Inc. (a) | | | 63,819 | | | | 5,008,515 | |
| | | | | | | | |
|
Household Products 0.3% | |
Procter & Gamble Co. | | | 28,924 | | | | 3,601,327 | |
| | | | | | | | |
|
Industrial Conglomerates 0.8% | |
Honeywell International, Inc. | | | 49,481 | | | | 8,546,853 | |
| | | | | | | | |
|
Insurance 4.4% | |
American International Group, Inc. | | | 310,890 | | | | 16,464,734 | |
Chubb, Ltd. | | | 33,070 | | | | 5,040,529 | |
MetLife, Inc. | | | 218,939 | | | | 10,244,156 | |
Travelers Cos., Inc. | | | 77,148 | | | | 10,111,017 | |
Willis Towers Watson PLC | | | 20,532 | | | | 3,837,431 | |
| | | | | | | | |
| | | | | | | 45,697,867 | |
| | | | | | | | |
Interactive Media & Services 7.2% | |
Alphabet, Inc. (a)
Class A | | | 9,678 | | | | 12,182,666 | |
Class C | | | 30,088 | | | | 37,914,189 | |
Facebook, Inc., Class A (a) | | | 116,454 | | | | 22,318,410 | |
Tencent Holdings, Ltd., ADR | | | 57,100 | | | | 2,312,550 | |
| | | | | | | | |
| | | | | | | 74,727,815 | |
| | | | | | | | |
Internet & Direct Marketing Retail 1.3% | |
Alibaba Group Holding, Ltd., Sponsored ADR (a) | | | 12,235 | | | | 2,161,557 | |
Booking Holdings, Inc. (a) | | | 2,270 | | | | 4,650,708 | |
eBay, Inc. | | | 97,050 | | | | 3,421,012 | |
Qurate Retail, Inc., Series A (a) | | | 165,966 | | | | 1,583,316 | |
Trip.com Group, Ltd. (a) | | | 41,412 | | | | 1,366,182 | |
| | | | | | | | |
| | | | | | | 13,182,775 | |
| | | | | | | | |
IT Services 3.5% | |
Automatic Data Processing, Inc. | | | 27,900 | | | | 4,526,217 | |
PayPal Holdings, Inc. (a) | | | 196,906 | | | | 20,497,915 | |
Visa, Inc., Class A | | | 63,869 | | | | 11,423,609 | |
| | | | | | | | |
| | | | | | | 36,447,741 | |
| | | | | | | | |
Life Sciences Tools & Services 1.0% | |
Agilent Technologies, Inc. | | | 80,188 | | | | 6,074,241 | |
| | | | | | | | |
| | |
| | | Shares | | | Value | |
Life Sciences Tools & Services (continued) | | | | | |
Charles River Laboratories International, Inc. (a) | | | 33,494 | | | $ | 4,353,550 | |
| | | | | | | | |
| | | | | | | 10,427,791 | |
| | | | | | | | |
Machinery 1.2% | |
Caterpillar, Inc. | | | 15,000 | | | | 2,067,000 | |
Ingersoll-Rand PLC | | | 49,106 | | | | 6,231,060 | |
Middleby Corp. (a) | | | 36,002 | | | | 4,354,442 | |
| | | | | | | | |
| | | | | | | 12,652,502 | |
| | | | | | | | |
Media 6.6% | |
Charter Communications, Inc., Class A (a) | | | 11,924 | | | | 5,578,763 | |
Comcast Corp., Class A | | | 335,902 | | | | 15,055,128 | |
Discovery, Inc., Class C (a) | | | 121,253 | | | | 3,060,426 | |
Fox Corp., Class A | | | 91,335 | | | | 2,926,373 | |
Liberty Broadband Corp. (a) | |
Class A | | | 17,658 | | | | 2,083,467 | |
Class C | | | 104,823 | | | | 12,376,452 | |
Liberty Media Corp-Liberty SiriusXM (a) | |
Class A | | | 148,255 | | | | 6,658,132 | |
Class C | | | 365,739 | | | | 16,527,745 | |
MSG Networks, Inc., Class A (a) | | | 35,445 | | | | 574,564 | |
Nexstar Media Group, Inc., Class A | | | 43,287 | | | | 4,211,392 | |
| | | | | | | | |
| | | | | | | 69,052,442 | |
| | | | | | | | |
Multiline Retail 0.6% | |
Dollar General Corp. | | | 36,948 | | | | 5,924,242 | |
| | | | | | | | |
|
Oil, Gas & Consumable Fuels 2.6% | |
ConocoPhillips | | | 55,323 | | | | 3,053,830 | |
Enbridge, Inc. | | | 128,419 | | | | 4,675,736 | |
EOG Resources, Inc. | | | 20,970 | | | | 1,453,431 | |
Marathon Petroleum Corp. | | | 99,236 | | | | 6,346,142 | |
Occidental Petroleum Corp. | | | 120,259 | | | | 4,870,489 | |
Phillips 66 | | | 43,160 | | | | 5,041,951 | |
Williams Cos., Inc. | | | 80,500 | | | | 1,795,955 | |
| | | | | | | | |
| | | | | | | 27,237,534 | |
| | | | | | | | |
Pharmaceuticals 3.2% | |
Allergan PLC | | | 60,232 | | | | 10,607,457 | |
Johnson & Johnson | | | 39,466 | | | | 5,211,091 | |
Merck & Co., Inc. | | | 71,300 | | | | 6,178,858 | |
Pfizer, Inc. | | | 304,218 | | | | 11,672,845 | |
| | | | | | | | |
| | | | | | | 33,670,251 | |
| | | | | | | | |
Real Estate Management & Development 0.3% | |
Jones Lang LaSalle, Inc. | | | 24,364 | | | | 3,569,813 | |
| | | | | | | | |
|
Road & Rail 2.6% | |
CSX Corp. | | | 97,616 | | | | 6,859,476 | |
Norfolk Southern Corp. | | | 18,545 | | | | 3,375,190 | |
Union Pacific Corp. | | | 105,447 | | | | 17,447,261 | |
| | | | | | | | |
| | | | | | | 27,681,927 | |
| | | | | | | | |
| | | | |
| 14 | | MainStay MAP Equity Fund | | The notes to the financial statements are an integral part of,
and should be read in conjunction with, the financial statements. |
| | | | | | | | |
| | |
| | | Shares | �� | | Value | |
| Common Stocks (continued) | | | | | | | | |
Semiconductors & Semiconductor Equipment 2.5% | |
Applied Materials, Inc. | | | 118,513 | | | $ | 6,430,515 | |
Broadcom, Inc. | | | 26,966 | | | | 7,896,993 | |
Intel Corp. | | | 33,229 | | | | 1,878,435 | |
Micron Technology, Inc. (a) | | | 96,605 | | | | 4,593,568 | |
Texas Instruments, Inc. | | | 16,150 | | | | 1,905,539 | |
Universal Display Corp. | | | 18,166 | | | | 3,636,470 | |
| | | | | | | | |
| | | | | | | 26,341,520 | |
| | | | | | | | |
Software 7.2% | |
LogMeIn, Inc. | | | 55,966 | | | | 3,675,847 | |
Microsoft Corp. | | | 421,374 | | | | 60,412,390 | |
Oracle Corp. | | | 201,806 | | | | 10,996,409 | |
| | | | | | | | |
| | | | | | | 75,084,646 | |
| | | | | | | | |
Specialty Retail 3.4% | |
CarMax, Inc. (a) | | | 43,855 | | | | 4,085,970 | |
Home Depot, Inc. | | | 66,149 | | | | 15,517,233 | |
Lowe’s Cos., Inc. | | | 91,800 | | | | 10,245,798 | |
TJX Cos., Inc. | | | 97,172 | | | | 5,601,966 | |
| | | | | | | | |
| | | | | | | 35,450,967 | |
| | | | | | | | |
Technology Hardware, Storage & Peripherals 5.5% | |
Apple, Inc. | | | 230,525 | | | | 57,345,399 | |
| | | | | | | | |
|
Thrifts & Mortgage Finance 0.5% | |
Axos Financial, Inc. (a) | | | 185,623 | | | | 5,392,348 | |
| | | | | | | | |
|
Tobacco 0.4% | |
Philip Morris International, Inc. | | | 57,979 | | | | 4,721,810 | |
| | | | | | | | |
Total Common Stocks
(Cost $606,009,690) | | | | | | | 1,026,197,066 | |
| | | | | | | | |
| | | | | | | | |
| | |
| | | Shares | | | Value | |
| Short-Term Investment 1.1% | |
Affiliated Investment Company 1.1% | |
MainStay U.S. Government Liquidity Fund, 1.76% (b) | | | 10,978,905 | | | $ | 10,978,905 | |
| | | | | | | | |
Total Short-Term Investment
(Cost $10,978,905) | | | | 10,978,905 | |
| | | | | | | | |
Total Investments
(Cost $616,988,595) | | | 99.4 | % | | | 1,037,175,971 | |
Other Assets, Less Liabilities | | | 0.6 | | | | 6,477,259 | |
Net Assets | | | 100.0 | % | | $ | 1,043,653,230 | |
| † | Percentages indicated are based on Fund net assets. |
| (a) | Non-income producing security. |
| (b) | Current yield as of October 31, 2019. |
The following abbreviations are used in the preceding pages:
ADR—American Depositary Receipt
The following is a summary of the fair valuations according to the inputs used as of October 31, 2019, for valuing the Fund’s assets:
| | | | | | | | | | | | | | | | |
Description | | Quoted
Prices in
Active
Markets for
Identical
Assets
(Level 1) | | | Significant
Other
Observable
Inputs
(Level 2) | | | Significant
Unobservable
Inputs
(Level 3) | | | Total | |
| | | | |
Asset Valuation Inputs | | | | | | | | | | | | | | | | |
| Investments in Securities (a) | | | | | | | | | | | | | | | | |
Common Stocks | | $ | 1,026,197,066 | | | $ | — | | | $ | — | | | $ | 1,026,197,066 | |
Short-Term Investment | | | | | | | | | | | | | | | | |
Affiliated Investment Company | | | 10,978,905 | | | | — | | | | — | | | | 10,978,905 | |
| | | | | | | | | | | | | | | | |
| Total Investments in Securities | | $ | 1,037,175,971 | | | $ | — | | | $ | — | | | $ | 1,037,175,971 | |
| | | | | | | | | | | | | | | | |
| (a) | For a complete listing of investments and their industries, see the Portfolio of Investments. |
| | | | | | |
The notes to the financial statements are an integral part of,
and should be read in conjunction with, the financial statements. | | | | | 15 | |
Statement of Assets and Liabilitiesas of October 31, 2019
| | | | |
| Assets | | | | |
Investment in securities, at value
(identified cost $606,009,690) | | $ | 1,026,197,066 | |
Investment in affiliated investment company, at value (identified cost $10,978,905) | | | 10,978,905 | |
Cash | | | 96,560 | |
Receivables: | | | | |
Investment securities sold | | | 7,635,943 | |
Dividends | | | 1,072,602 | |
Fund shares sold | | | 101,420 | |
Securities lending | | | 885 | |
Other assets | | | 40,562 | |
| | | | |
Total assets | | | 1,046,123,943 | |
| | | | |
| |
| Liabilities | | | | |
Payables: | | | | |
Investment securities purchased | | | 781,140 | |
Manager (See Note 3) | | | 665,790 | |
Fund shares redeemed | | | 651,446 | |
NYLIFE Distributors (See Note 3) | | | 144,476 | |
Transfer agent (See Note 3) | | | 138,154 | |
Shareholder communication | | | 36,056 | |
Professional fees | | | 27,289 | |
Custodian | | | 13,710 | |
Trustees | | | 1,875 | |
Accrued expenses | | | 10,777 | |
| | | | |
Total liabilities | | | 2,470,713 | |
| | | | |
Net assets | | $ | 1,043,653,230 | |
| | | | |
| |
| Composition of Net Assets | | | | |
Shares of beneficial interest outstanding (par value of $.01 per share) unlimited number of shares authorized | | $ | 244,740 | |
Additional paid-in capital | | | 542,574,631 | |
| | | | |
| | | 542,819,371 | |
Total distributable earnings (loss) | | | 500,833,859 | |
| | | | |
Net assets | | $ | 1,043,653,230 | |
| | | | |
| | | | |
Class A | | | | |
Net assets applicable to outstanding shares | | $ | 427,039,872 | |
| | | | |
Shares of beneficial interest outstanding | | | 10,110,426 | |
| | | | |
Net asset value per share outstanding | | $ | 42.24 | |
Maximum sales charge (5.50% of offering price) | | | 2.46 | |
| | | | |
Maximum offering price per share outstanding | | $ | 44.70 | |
| | | | |
Investor Class | | | | |
Net assets applicable to outstanding shares | | $ | 80,733,023 | |
| | | | |
Shares of beneficial interest outstanding | | | 1,914,359 | |
| | | | |
Net asset value per share outstanding | | $ | 42.17 | |
Maximum sales charge (5.50% of offering price) | | | 2.45 | |
| | | | |
Maximum offering price per share outstanding | | $ | 44.62 | |
| | | | |
Class B | | | | |
Net assets applicable to outstanding shares | | $ | 21,088,061 | |
| | | | |
Shares of beneficial interest outstanding | | | 571,876 | |
| | | | |
Net asset value and offering price per share outstanding | | $ | 36.88 | |
| | | | |
Class C | | | | |
Net assets applicable to outstanding shares | | $ | 22,932,941 | |
| | | | |
Shares of beneficial interest outstanding | | | 621,848 | |
| | | | |
Net asset value and offering price per share outstanding | | $ | 36.88 | |
| | | | |
Class I | | | | |
Net assets applicable to outstanding shares | | $ | 488,730,424 | |
| | | | |
Shares of beneficial interest outstanding | | | 11,181,489 | |
| | | | |
Net asset value and offering price per share outstanding | | $ | 43.71 | |
| | | | |
Class R1 | | | | |
Net assets applicable to outstanding shares | | $ | 35,310 | |
| | | | |
Shares of beneficial interest outstanding | | | 828 | |
| | | | |
Net asset value and offering price per share outstanding | | $ | 42.64 | |
| | | | |
Class R2 | | | | |
Net assets applicable to outstanding shares | | $ | 779,826 | |
| | | | |
Shares of beneficial interest outstanding | | | 18,356 | |
| | | | |
Net asset value and offering price per share outstanding | | $ | 42.48 | |
| | | | |
Class R3 | | | | |
Net assets applicable to outstanding shares | | $ | 2,313,773 | |
| | | | |
Shares of beneficial interest outstanding | | | 54,781 | |
| | | | |
Net asset value and offering price per share outstanding | | $ | 42.24 | |
| | | | |
| | | | |
| 16 | | MainStay MAP Equity Fund | | The notes to the financial statements are an integral part of,
and should be read in conjunction with, the financial statements. |
Statement of Operationsfor the year ended October 31, 2019
| | | | |
| Investment Income (Loss) | | | | |
Income | | | | |
Dividends-unaffiliated (a) | | $ | 17,972,014 | |
Dividends-affiliated | | | 307,891 | |
Securities lending | | | 12,757 | |
Interest | | | 47 | |
Other | | | 61,081 | |
| | | | |
Total income | | | 18,353,790 | |
| | | | |
Expenses | | | | |
Manager (See Note 3) | | | 7,794,215 | |
Distribution/Service—Class A (See Note 3) | | | 998,125 | |
Distribution/Service—Investor Class (See Note 3) | | | 197,165 | |
Distribution/Service—Class B (See Note 3) | | | 232,433 | |
Distribution/Service—Class C (See Note 3) | | | 397,844 | |
Distribution/Service—Class R2 (See Note 3) | | | 2,076 | |
Distribution/Service—Class R3 (See Note 3) | | | 10,246 | |
Transfer agent (See Note 3) | | | 962,975 | |
Professional fees | | | 122,624 | |
Registration | | | 117,516 | |
Shareholder communication | | | 84,929 | |
Custodian | | | 36,073 | |
Trustees | | | 25,336 | |
Shareholder service (See Note 3) | | | 2,911 | |
Miscellaneous | | | 54,324 | |
| | | | |
Total expenses before waiver/reimbursement | | | 11,038,792 | |
Expense waiver/reimbursement from Manager (See Note 3) | | | (70,880 | ) |
| | | | |
Net expenses | | | 10,967,912 | |
| | | | |
Net investment income (loss) | | | 7,385,878 | |
| | | | |
|
| Realized and Unrealized Gain (Loss) on Investments and Foreign Currency Transactions | |
Net realized gain (loss) on: | | | | |
Unaffiliated investment transactions | | | 94,813,725 | |
Foreign currency transactions | | | (3,552 | ) |
| | | | |
Net realized gain (loss) on investments and foreign currency transactions | | | 94,810,173 | |
| | | | |
Net change in unrealized appreciation (depreciation) on: | | | | |
Unaffiliated investments | | | 30,301,476 | |
Translation of other assets and liabilities in foreign currencies | | | 8,349 | |
| | | | |
Net change in unrealized appreciation (depreciation) on investments and foreign currencies | | | 30,309,825 | |
| | | | |
Net realized and unrealized gain (loss) on investments and foreign currency transactions | | | 125,119,998 | |
| | | | |
Net increase (decrease) in net assets resulting from operations | | $ | 132,505,876 | |
| | | | |
| (a) | Dividends recorded net of foreign withholding taxes in the amount of $46,698. |
| | | | | | |
The notes to the financial statements are an integral part of,
and should be read in conjunction with, the financial statements. | | | | | 17 | |
Statements of Changes in Net Assets
for the years ended October 31, 2019 and October 31, 2018
| | | | | | | | |
| | | 2019 | | | 2018 | |
| Increase (Decrease) in Net Assets | |
Operations: | | | | | | | | |
Net investment income (loss) | | $ | 7,385,878 | | | $ | 7,088,903 | |
Net realized gain (loss) on investments and foreign currency transactions | | | 94,810,173 | | | | 110,011,138 | |
Net change in unrealized appreciation (depreciation) on investments and foreign currencies | | | 30,309,825 | | | | (51,597,006 | ) |
| | | | |
Net increase (decrease) in net assets resulting from operations | | | 132,505,876 | | | | 65,503,035 | |
| | | | |
Distributions to shareholders: | | | | | | | | |
Class A | | | (37,992,504 | ) | | | (40,500,400 | ) |
Investor Class | | | (7,461,062 | ) | | | (9,291,957 | ) |
Class B | | | (2,760,444 | ) | | | (3,932,227 | ) |
Class C | | | (6,682,486 | ) | | | (8,673,806 | ) |
Class I | | | (47,487,185 | ) | | | (63,813,864 | ) |
Class R1 | | | (3,004 | ) | | | (340,768 | ) |
Class R2 | | | (85,314 | ) | | | (268,113 | ) |
Class R3 | | | (183,995 | ) | | | (101,402 | ) |
| | | | |
Total distributions to shareholders | | | (102,655,994 | ) | | | (126,922,537 | ) |
| | | | |
Capital share transactions: | | | | | | | | |
Net proceeds from sale of shares | | | 206,925,503 | | | | 63,328,482 | |
Net asset value of shares issued to shareholders in reinvestment of distributions | | | 100,091,433 | | | | 123,817,205 | |
Cost of shares redeemed | | | (334,234,347 | ) | | | (322,246,615 | ) |
| | | | |
Increase (decrease) in net assets derived from capital share transactions | | | (27,217,411 | ) | | | (135,100,928 | ) |
| | | | |
Net increase (decrease) in net assets | | | 2,632,471 | | | | (196,520,430 | ) |
| | |
| Net Assets | | | | | | | | |
Beginning of year | | | 1,041,020,759 | | | | 1,237,541,189 | |
| | | | |
End of year | | $ | 1,043,653,230 | | | $ | 1,041,020,759 | |
| | | | |
| | | | |
| 18 | | MainStay MAP Equity Fund | | The notes to the financial statements are an integral part of,
and should be read in conjunction with, the financial statements. |
Financial Highlightsselected per share data and ratios
| | | | | | | | | | | | | | | | | | | | |
| |
| | | Year ended October 31, | |
| | | | | |
| Class A | | 2019 | | | 2018 | | | 2017 | | | 2016 | | | 2015 | |
| | | | | |
Net asset value at beginning of year | | $ | 41.20 | | | $ | 43.76 | | | $ | 35.92 | | | $ | 43.32 | | | $ | 46.81 | |
| | | | | | | | | | | | | | | | | | | | |
| | | | | |
Net investment income (loss) (a) | | | 0.26 | | | | 0.23 | | | | 0.21 | | | | 0.33 | | | | 0.38 | |
| | | | | |
Net realized and unrealized gain (loss) on investments | | | 4.88 | | | | 1.78 | | | | 8.50 | | | | (0.63 | ) | | | 0.50 | |
| | | | | |
Net realized and unrealized gain (loss) on foreign currency transactions | | | 0.00 | ‡ | | | 0.01 | | | | 0.00 | ‡ | | | (0.00 | )‡ | | | (0.00 | )‡ |
| | | | | | | | | | | | | | | | | | | | |
| | | | | |
Total from investment operations | | | 5.14 | | | | 2.02 | | | | 8.71 | | | | (0.30 | ) | | | 0.88 | |
| | | | | | | | | | | | | | | | | | | | |
| | | | | |
| Less dividends and distributions: | | | | | | | | | | | | | | | | | | | | |
| | | | | |
From net investment income | | | (0.28 | ) | | | (0.21 | ) | | | (0.48 | ) | | | (0.40 | ) | | | (0.67 | ) |
| | | | | |
From net realized gain on investments | | | (3.82 | ) | | | (4.37 | ) | | | (0.39 | ) | | | (6.70 | ) | | | (3.70 | ) |
| | | | | | | | | | | | | | | | | | | | |
| | | | | |
Total dividends and distributions | | | (4.10 | ) | | | (4.58 | ) | | | (0.87 | ) | | | (7.10 | ) | | | (4.37 | ) |
| | | | | | | | | | | | | | | | | | | | |
| | | | | |
Net asset value at end of year | | $ | 42.24 | | | $ | 41.20 | | | $ | 43.76 | | | $ | 35.92 | | | $ | 43.32 | |
| | | | | | | | | | | | | | | | | | | | |
| | | | | |
Total investment return (b) | | | 13.54 | % | | | 4.88 | % | | | 24.73 | % | | | (0.57 | %) | | | 1.80 | % |
| | | | | |
| Ratios (to average net assets)/Supplemental Data: | | | | | | | | | | | | | | | | | | | | |
| | | | | |
Net investment income (loss) | | | 0.67 | % | | | 0.57 | % | | | 0.52 | % | | | 0.92 | % | | | 0.85 | % |
| | | | | |
Net expenses (c) | | | 1.11 | % | | | 1.10 | % | | | 1.10 | %(d) | | | 1.09 | % (d) | | | 1.11 | % |
| | | | | |
Portfolio turnover rate | | | 20 | % | | | 15 | % | | | 15 | % | | | 42 | % | | | 51 | % |
| | | | | |
Net assets at end of year (in 000’s) | | $ | 427,040 | | | $ | 384,637 | | | $ | 389,582 | | | $ | 285,431 | | | $ | 336,812 | |
| ‡ | Less than one cent per share. |
| (a) | Per share data based on average shares outstanding during the year. |
| (b) | Total investment return is calculated exclusive of sales charges and assumes the reinvestment of dividends and distributions. For periods of less than one year, total return is not annualized. |
| (c) | In addition to the fees and expenses which the Fund bears directly, it also indirectly bears a pro-rata share of the fees and expenses of the underlying funds in which it invests. Such indirect expenses are not included in the above expense ratios. |
| (d) | Net of interest expense which is less than one-tenth of a percent. (See Note 6) |
| | | | | | | | | | | | | | | | | | | | |
| |
| | | Year ended October 31, | |
| | | | | |
| Investor Class | | 2019 | | | 2018 | | | 2017 | | | 2016 | | | 2015 | |
| | | | | |
Net asset value at beginning of year | | $ | 41.15 | | | $ | 43.68 | | | $ | 35.85 | | | $ | 43.27 | | | $ | 46.77 | |
| | | | | | | | | | | | | | | | | | | | |
| | | | | |
Net investment income (loss) (a) | | | 0.18 | | | | 0.17 | | | | 0.14 | | | | 0.25 | | | | 0.31 | |
| | | | | |
Net realized and unrealized gain (loss) on investments | | | 4.86 | | | | 1.78 | | | | 8.49 | | | | (0.63 | ) | | | 0.50 | |
| | | | | |
Net realized and unrealized gain (loss) on foreign currency transactions ‡ | | | 0.00 | | | | (0.00 | ) | | | 0.00 | | | | (0.00 | ) | | | (0.00 | ) |
| | | | | | | | | | | | | | | | | | | | |
| | | | | |
Total from investment operations | | | 5.04 | | | | 1.95 | | | | 8.63 | | | | (0.38 | ) | | | 0.81 | |
| | | | | | | | | | | | | | | | | | | | |
| | | | | |
| Less dividends and distributions: | | | | | | | | | | | | | | | | | | | | |
| | | | | |
From net investment income | | | (0.20 | ) | | | (0.11 | ) | | | (0.41 | ) | | | (0.34 | ) | | | (0.61 | ) |
| | | | | |
From net realized gain on investments | | | (3.82 | ) | | | (4.37 | ) | | | (0.39 | ) | | | (6.70 | ) | | | (3.70 | ) |
| | | | | | | | | | | | | | | | | | | | |
| | | | | |
Total dividends and distributions | | | (4.02 | ) | | | (4.48 | ) | | | (0.80 | ) | | | (7.04 | ) | | | (4.31 | ) |
| | | | | | | | | | | | | | | | | | | | |
| | | | | |
Net asset value at end of year | | $ | 42.17 | | | $ | 41.15 | | | $ | 43.68 | | | $ | 35.85 | | | $ | 43.27 | |
| | | | | | | | | | | | | | | | | | | | |
| | | | | |
Total investment return (b) | | | 13.27 | % | | | 4.69 | % | | | 24.50 | % | | | (0.79 | %) | | | 1.63 | % |
| | | | | |
| Ratios (to average net assets)/Supplemental Data: | | | | | | | | | | | | | | | | | | | | |
| | | | | |
Net investment income (loss) | | | 0.46 | % | | | 0.39 | % | | | 0.36 | % | | | 0.71 | % | | | 0.71 | % |
| | | | | |
Net expenses (c) | | | 1.33 | % | | | 1.29 | % | | | 1.29 | %(d) | | | 1.29 | % (d) | | | 1.25 | % |
| | | | | |
Expenses (before waiver/reimbursement) | | | 1.38 | % | | | 1.31 | % | | | 1.29 | % | | | 1.29 | % | | | 1.25 | % |
| | | | | |
Portfolio turnover rate | | | 20 | % | | | 15 | % | | | 15 | % | | | 42 | % | | | 51 | % |
| | | | | |
Net assets at end of year (in 000’s) | | $ | 80,733 | | | $ | 76,844 | | | $ | 90,928 | | | $ | 139,775 | | | $ | 151,582 | |
| ‡ | Less than one cent per share. |
| (a) | Per share data based on average shares outstanding during the year. |
| (b) | Total investment return is calculated exclusive of sales charges and assumes the reinvestment of dividends and distributions. For periods of less than one year, total return is not annualized. |
| (c) | In addition to the fees and expenses which the Fund bears directly, it also indirectly bears a pro-rata share of the fees and expenses of the underlying funds in which it invests. Such indirect expenses are not included in the above expense ratios. |
| (d) | Net of interest expense which is less than one-tenth of a percent. (See Note 6) |
| | | | | | |
The notes to the financial statements are an integral part of,
and should be read in conjunction with, the financial statements. | | | | | 19 | |
Financial Highlightsselected per share data and ratios
| | | | | | | | | | | | | | | | | | | | |
| |
| | | Year ended October 31, | |
| | | | | |
| Class B | | 2019 | | | 2018 | | | 2017 | | | 2016 | | | 2015 | |
| | | | | |
Net asset value at beginning of year | | $ | 36.53 | | | $ | 39.43 | | | $ | 32.42 | | | $ | 39.74 | | | $ | 43.25 | |
| | | | | | | | | | | | | | | | | | | | |
| | | | | |
Net investment income (loss) (a) | | | (0.09 | ) | | | (0.13 | ) | | | (0.13 | ) | | | (0.01 | ) | | | (0.01 | ) |
| | | | | |
Net realized and unrealized gain (loss) on investments | | | 4.26 | | | | 1.60 | | | | 7.67 | | | | (0.60 | ) | | | 0.48 | |
| | | | | |
Net realized and unrealized gain (loss) on foreign currency transactions ‡ | | | 0.00 | | | | (0.00 | ) | | | 0.00 | | | | (0.00 | ) | | | (0.00 | ) |
| | | | | | | | | | | | | | | | | | | | |
| | | | | |
Total from investment operations | | | 4.17 | | | | 1.47 | | | | 7.54 | | | | (0.61 | ) | | | 0.47 | |
| | | | | | | | | | | | | | | | | | | | |
| | | | | |
| Less dividends and distributions: | | | | | | | | | | | | | | | | | | | | |
| | | | | |
From net investment income | | | — | | | | — | | | | (0.14 | ) | | | (0.01 | ) | | | (0.28 | ) |
| | | | | |
From net realized gain on investments | | | (3.82 | ) | | | (4.37 | ) | | | (0.39 | ) | | | (6.70 | ) | | | (3.70 | ) |
| | | | | | | | | | | | | | | | | | | | |
| | | | | |
Total dividends and distributions | | | (3.82 | ) | | | (4.37 | ) | | | (0.53 | ) | | | (6.71 | ) | | | (3.98 | ) |
| | | | | | | | | | | | | | | | | | | | |
| | | | | |
Net asset value at end of year | | $ | 36.88 | | | $ | 36.53 | | | $ | 39.43 | | | $ | 32.42 | | | $ | 39.74 | |
| | | | | | | | | | | | | | | | | | | | |
| | | | | |
Total investment return (b) | | | 12.45 | % | | | 3.91 | % | | | 23.55 | % | | | (1.52 | %) | | | 0.89 | % |
| | | | | |
| Ratios (to average net assets)/Supplemental Data: | | | | | | | | | | | | | | | | | | | | |
| | | | | |
Net investment income (loss) | | | (0.27 | %) | | | (0.35 | %) | | | (0.37 | %) | | | (0.03 | %) | | | (0.03 | %) |
| | | | | |
Net expenses (c) | | | 2.08 | % | | | 2.04 | % | | | 2.05 | % (d) | | | 2.04 | % (d) | | | 2.00 | % |
| | | | | |
Expenses (before waiver/reimbursement) | | | 2.13 | % | | | 2.06 | % | | | 2.05 | % | | | 2.04 | % | | | 2.00 | % |
| | | | | |
Portfolio turnover rate | | | 20 | % | | | 15 | % | | | 15 | % | | | 42 | % | | | 51 | % |
| | | | | |
Net assets at end of year (in 000’s) | | $ | 21,088 | | | $ | 26,571 | | | $ | 35,841 | | | $ | 40,977 | | | $ | 54,423 | |
| ‡ | Less than one cent per share. |
| (a) | Per share data based on average shares outstanding during the year. |
| (b) | Total investment return is calculated exclusive of sales charges and assumes the reinvestment of dividends and distributions. For periods of less than one year, total return is not annualized. |
| (c) | In addition to the fees and expenses which the Fund bears directly, it also indirectly bears a pro-rata share of the fees and expenses of the underlying funds in which it invests. Such indirect expenses are not included in the above expense ratios. |
| (d) | Net of interest expense which is less than one-tenth of a percent. (See Note 6) |
| | | | | | | | | | | | | | | | | | | | |
| |
| | | Year ended October 31, | |
| | | | | |
| Class C | | 2019 | | | 2018 | | | 2017 | | | 2016 | | | 2015 | |
| | | | | |
Net asset value at beginning of year | | $ | 36.53 | | | $ | 39.43 | | | $ | 32.42 | | | $ | 39.73 | | | $ | 43.25 | |
| | | | | | | | | | | | | | | | | | | | |
| | | | | |
Net investment income (loss) (a) | | | (0.07 | ) | | | (0.14 | ) | | | (0.13 | ) | | | (0.01 | ) | | | (0.02 | ) |
| | | | | |
Net realized and unrealized gain (loss) on investments | | | 4.24 | | | | 1.61 | | | | 7.67 | | | | (0.59 | ) | | | 0.48 | |
| | | | | |
Net realized and unrealized gain (loss) on foreign currency transactions ‡ | | | 0.00 | | | | (0.00 | ) | | | 0.00 | | | | (0.00 | ) | | | (0.00 | ) |
| | | | | | | | | | | | | | | | | | | | |
| | | | | |
Total from investment operations | | | 4.17 | | | | 1.47 | | | | 7.54 | | | | (0.60 | ) | | | 0.46 | |
| | | | | | | | | | | | | | | | | | | | |
| | | | | |
| Less dividends and distributions: | | | | | | | | | | | | | | | | | | | | |
| | | | | |
From net investment income | | | — | | | | — | | | | (0.14 | ) | | | (0.01 | ) | | | (0.28 | ) |
| | | | | |
From net realized gain on investments | | | (3.82 | ) | | | (4.37 | ) | | | (0.39 | ) | | | (6.70 | ) | | | (3.70 | ) |
| | | | | | | | | | | | | | | | | | | | |
| | | | | |
Total dividends and distributions | | | (3.82 | ) | | | (4.37 | ) | | | (0.53 | ) | | | (6.71 | ) | | | (3.98 | ) |
| | | | | | | | | | | | | | | | | | | | |
| | | | | |
Net asset value at end of year | | $ | 36.88 | | | $ | 36.53 | | | $ | 39.43 | | | $ | 32.42 | | | $ | 39.73 | |
| | | | | | | | | | | | | | | | | | | | |
| | | | | |
Total investment return (b) | | | 12.45 | % | | | 3.91 | % | | | 23.55 | % | | | (1.52 | %) | | | 0.89 | % |
| | | | | |
| Ratios (to average net assets)/Supplemental Data: | | | | | | | | | | | | | | | | | | | | |
| | | | | |
Net investment income (loss) | | | (0.22 | %) | | | (0.36 | %) | | | (0.37 | %) | | | (0.03 | %) | | | (0.04 | %) |
| | | | | |
Net expenses (c) | | | 2.07 | % | | | 2.04 | % | | | 2.05 | % (d) | | | 2.04 | % (d) | | | 2.00 | % |
| | | | | |
Expenses (before waiver/reimbursement) | | | 2.12 | % | | | 2.06 | % | | | 2.05 | % | | | 2.04 | % | | | 2.00 | % |
| | | | | |
Portfolio turnover rate | | | 20 | % | | | 15 | % | | | 15 | % | | | 42 | % | | | 51 | % |
| | | | | |
Net assets at end of year (in 000’s) | | $ | 22,933 | | | $ | 65,288 | | | $ | 79,665 | | | $ | 92,457 | | | $ | 125,642 | |
| ‡ | Less than one cent per share. |
| (a) | Per share data based on average shares outstanding during the year. |
| (b) | Total investment return is calculated exclusive of sales charges and assumes the reinvestment of dividends and distributions. For periods of less than one year, total return is not annualized. |
| (c) | In addition to the fees and expenses which the Fund bears directly, it also indirectly bears a pro-rata share of the fees and expenses of the underlying funds in which it invests. Such indirect expenses are not included in the above expense ratios. |
| (d) | Net of interest expense which is less than one-tenth of a percent. (See Note 6) |
| | | | |
| 20 | | MainStay MAP Equity Fund | | The notes to the financial statements are an integral part of,
and should be read in conjunction with, the financial statements. |
Financial Highlightsselected per share data and ratios
| | | | | | | | | | | | | | | | | | | | |
| |
| | | Year ended October 31, | |
| | | | | |
| Class I | | 2019 | | | 2018 | | | 2017 | | | 2016 | | | 2015 | |
| | | | | |
Net asset value at beginning of year | | $ | 42.51 | | | $ | 45.00 | | | $ | 36.92 | | | $ | 44.35 | | | $ | 47.82 | |
| | | | | | | | | | | | | | | | | | | | |
| | | | | |
Net investment income (loss) (a) | | | 0.38 | | | | 0.36 | | | | 0.34 | | | | 0.43 | | | | 0.50 | |
| | | | | |
Net realized and unrealized gain (loss) on investments | | | 5.02 | | | | 1.84 | | | | 8.70 | | | | (0.65 | ) | | | 0.52 | |
| | | | | |
Net realized and unrealized gain (loss) on foreign currency transactions ‡ | | | 0.00 | | | | (0.00 | ) | | | 0.00 | | | | (0.00 | ) | | | (0.00 | ) |
| | | | | | | | | | | | | | | | | | | | |
| | | | | |
Total from investment operations | | | 5.40 | | | | 2.20 | | | | 9.04 | | | | (0.22 | ) | | | 1.02 | |
| | | | | | | | | | | | | | | | | | | | |
| | | | | |
| Less dividends and distributions: | | | | | | | | | | | | | | | | | | | | |
| | | | | |
From net investment income | | | (0.38 | ) | | | (0.32 | ) | | | (0.57 | ) | | | (0.51 | ) | | | (0.79 | ) |
| | | | | |
From net realized gain on investments | | | (3.82 | ) | | | (4.37 | ) | | | (0.39 | ) | | | (6.70 | ) | | | (3.70 | ) |
| | | | | | | | | | | | | | | | | | | | |
| | | | | |
Total dividends and distributions | | | (4.20 | ) | | | (4.69 | ) | | | (0.96 | ) | | | (7.21 | ) | | | (4.49 | ) |
| | | | | | | | | | | | | | | | | | | | |
| | | | | |
Net asset value at end of year | | $ | 43.71 | | | $ | 42.51 | | | $ | 45.00 | | | $ | 36.92 | | | $ | 44.35 | |
| | | | | | | | | | | | | | | | | | | | |
| | | | | |
Total investment return (b) | | | 13.80 | % | | | 5.17 | % | | | 25.01 | % | | | (0.33 | %) | | | 2.06 | % |
| | | | | |
| Ratios (to average net assets)/Supplemental Data: | | | | | | | | | | | | | | | | | | | | |
| | | | | |
Net investment income (loss) | | | 0.93 | % | | | 0.83 | % | | | 0.84 | % | | | 1.17 | % | | | 1.10 | % |
| | | | | |
Net expenses (c) | | | 0.86 | % | | | 0.85 | % | | | 0.85 | %(d) | | | 0.84 | % (d) | | | 0.86 | % |
| | | | | |
Portfolio turnover rate | | | 20 | % | | | 15 | % | | | 15 | % | | | 42 | % | | | 51 | % |
| | | | | |
Net assets at end of year (in 000’s) | | $ | 488,730 | | | $ | 484,839 | | | $ | 634,730 | | | $ | 807,694 | | | $ | 1,119,884 | |
| ‡ | Less than one cent per share. |
| (a) | Per share data based on average shares outstanding during the year. |
| (b) | Total investment return is calculated exclusive of sales charges and assumes the reinvestment of dividends and distributions. Class I shares are not subject to sales charges. For periods of less than one year, total return is not annualized. |
| (c) | In addition to the fees and expenses which the Fund bears directly, it also indirectly bears a pro-rata share of the fees and expenses of the underlying funds in which it invests. Such indirect expenses are not included in the above expense ratios. |
| (d) | Net of interest expense which is less than one-tenth of a percent. (See Note 6) |
| | | | | | | | | | | | | | | | | | | | |
| |
| | | Year ended October 31, | |
| | | | | |
| Class R1 | | 2019 | | | 2018 | | | 2017 | | | 2016 | | | 2015 | |
| | | | | |
Net asset value at beginning of year | | $ | 41.53 | | | $ | 44.07 | | | $ | 36.16 | | | $ | 43.57 | | | $ | 47.05 | |
| | | | | | | | | | | | | | | | | | | | |
| | | | | |
Net investment income (loss) (a) | | | 0.33 | | | | 0.37 | | | | 0.27 | | | | 0.38 | | | | 0.45 | |
| | | | | |
Net realized and unrealized gain (loss) on investments | | | 4.91 | | | | 1.73 | | | | 8.56 | | | | (0.63 | ) | | | 0.50 | |
| | | | | |
Net realized and unrealized gain (loss) on foreign currency transactions ‡ | | | 0.00 | | | | (0.00 | ) | | | 0.00 | | | | (0.00 | ) | | | (0.00 | ) |
| | | | | | | | | | | | | | | | | | | | |
| | | | | |
Total from investment operations | | | 5.24 | | | | 2.10 | | | | 8.83 | | | | (0.25 | ) | | | 0.95 | |
| | | | | | | | | | | | | | | | | | | | |
| | | | | |
| Less dividends and distributions: | | | | | | | | | | | | | | | | | | | | |
| | | | | |
From net investment income | | | (0.31 | ) | | | (0.27 | ) | | | (0.53 | ) | | | (0.46 | ) | | | (0.73 | ) |
| | | | | |
From net realized gain on investments | | | (3.82 | ) | | | (4.37 | ) | | | (0.39 | ) | | | (6.70 | ) | | | (3.70 | ) |
| | | | | | | | | | | | | | | | | | | | |
| | | | | |
Total dividends and distributions | | | (4.13 | ) | | | (4.64 | ) | | | (0.92 | ) | | | (7.16 | ) | | | (4.43 | ) |
| | | | | | | | | | | | | | | | | | | | |
| | | | | |
Net asset value at end of year | | $ | 42.64 | | | $ | 41.53 | | | $ | 44.07 | | | $ | 36.16 | | | $ | 43.57 | |
| | | | | | | | | | | | | | | | | | | | |
| | | | | |
Total investment return (b) | | | 13.71 | % | | | 5.05 | % | | | 24.92 | % | | | (0.43 | %) | | | 1.94 | % |
| | | | | |
| Ratios (to average net assets)/Supplemental Data: | | | | | | | | | | | | | | | | | | | | |
| | | | | |
Net investment income (loss) | | | 0.83 | % | | | 0.88 | % | | | 0.67 | % | | | 1.06 | % | | | 1.02 | % |
| | | | | |
Net expenses (c) | | | 0.96 | % | | | 0.95 | % | | | 0.95 | %(d) | | | 0.94 | % (d) | | | 0.96 | % |
| | | | | |
Portfolio turnover rate | | | 20 | % | | | 15 | % | | | 15 | % | | | 42 | % | | | 51 | % |
| | | | | |
Net assets at end of year (in 000’s) | | $ | 35 | | | $ | 30 | | | $ | 3,208 | | | $ | 2,500 | | | $ | 3,607 | |
| ‡ | Less than one cent per share. |
| (a) | Per share data based on average shares outstanding during the year. |
| (b) | Total investment return is calculated exclusive of sales charges and assumes the reinvestment of dividends and distributions. Class R1 shares are not subject to sales charges. For periods of less than one year, total return is not annualized. |
| (c) | In addition to the fees and expenses which the Fund bears directly, it also indirectly bears a pro-rata share of the fees and expenses of the underlying funds in which it invests. Such indirect expenses are not included in the above expense ratios. |
| (d) | Net of interest expense which is less than one-tenth of a percent. (See Note 6) |
| | | | | | |
The notes to the financial statements are an integral part of,
and should be read in conjunction with, the financial statements. | | | | | 21 | |
Financial Highlightsselected per share data and ratios
| | | | | | | | | | | | | | | | | | | | |
| |
| | | Year ended October 31, | |
| | | | | |
| Class R2 | | 2019 | | | 2018 | | | 2017 | | | 2016 | | | 2015 | |
| | | | | |
Net asset value at beginning of year | | $ | 41.38 | | | $ | 43.93 | | | $ | 36.05 | | | $ | 43.44 | | | $ | 46.92 | |
| | | | | | | | | | | | | | | | | | | | |
| | | | | |
Net investment income (loss) (a) | | | 0.23 | | | | 0.21 | | | | 0.20 | | | | 0.29 | | | | 0.34 | |
| | | | | |
Net realized and unrealized gain (loss) on investments | | | 4.89 | | | | 1.78 | | | | 8.50 | | | | (0.63 | ) | | | 0.49 | |
| | | | | |
Net realized and unrealized gain (loss) on foreign currency transactions ‡ | | | 0.00 | | | | (0.00 | ) | | | 0.00 | | | | (0.00 | ) | | | (0.00 | ) |
| | | | | | | | | | | | | | | | | | | | |
| | | | | |
Total from investment operations | | | 5.12 | | | | 1.99 | | | | 8.70 | | | | (0.34 | ) | | | 0.83 | |
| | | | | | | | | | | | | | | | | | | | |
| | | | | |
| Less dividends and distributions: | | | | | | | | | | | | | | | | | | | | |
| | | | | |
From net investment income | | | (0.20 | ) | | | (0.17 | ) | | | (0.43 | ) | | | (0.35 | ) | | | (0.61 | ) |
| | | | | |
From net realized gain on investments | | | (3.82 | ) | | | (4.37 | ) | | | (0.39 | ) | | | (6.70 | ) | | | (3.70 | ) |
| | | | | | | | | | | | | | | | | | | | |
| | | | | |
Total dividends and distributions | | | (4.02 | ) | | | (4.54 | ) | | | (0.82 | ) | | | (7.05 | ) | | | (4.31 | ) |
| | | | | | | | | | | | | | | | | | | | |
| | | | | |
Net asset value at end of year | | $ | 42.48 | | | $ | 41.38 | | | $ | 43.93 | | | $ | 36.05 | | | $ | 43.44 | |
| | | | | | | | | | | | | | | | | | | | |
| | | | | |
Total investment return (b) | | | 13.42 | % | | | 4.77 | % | | | 24.60 | % | | | (0.68 | %) | | | 1.68 | % |
| | | | | |
| Ratios (to average net assets)/Supplemental Data: | | | | | | | | | | | | | | | | | | | | |
| | | | | |
Net investment income (loss) | | | 0.59 | % | | | 0.50 | % | | | 0.51 | % | | | 0.80 | % | | | 0.76 | % |
| | | | | |
Net expenses (c) | | | 1.21 | % | | | 1.20 | % | | | 1.20 | %(d) | | | 1.20 | % (d) | | | 1.21 | % |
| | | | | |
Portfolio turnover rate | | | 20 | % | | | 15 | % | | | 15 | % | | | 42 | % | | | 51 | % |
| | | | | |
Net assets at end of year (in 000’s) | | $ | 780 | | | $ | 881 | | | $ | 2,583 | | | $ | 3,528 | | | $ | 9,993 | |
| ‡ | Less than one cent per share. |
| (a) | Per share data based on average shares outstanding during the year. |
| (b) | Total investment return is calculated exclusive of sales charges and assumes the reinvestment of dividends and distributions. Class R2 shares are not subject to sales charges. For periods of less than one year, total return is not annualized. |
| (c) | In addition to the fees and expenses which the Fund bears directly, it also indirectly bears a pro-rata share of the fees and expenses of the underlying funds in which it invests. Such indirect expenses are not included in the above expense ratios. |
| (d) | Net of interest expense which is less than one-tenth of a percent. (See Note 6) |
| | | | | | | | | | | | | | | | | | | | |
| |
| | | Year ended October 31, | |
| | | | | |
| Class R3 | | 2019 | | | 2018 | | | 2017 | | | 2016 | | | 2015 | |
| | | | | |
Net asset value at beginning of year | | $ | 41.15 | | | $ | 43.71 | | | $ | 35.87 | | | $ | 43.22 | | | $ | 46.68 | |
| | | | | | | | | | | | | | | | | | | | |
| | | | | |
Net investment income (loss) (a) | | | 0.13 | | | | 0.08 | | | | 0.07 | | | | 0.20 | | | | 0.22 | |
| | | | | |
Net realized and unrealized gain (loss) on investments | | | 4.87 | | | | 1.79 | | | | 8.50 | | | | (0.62 | ) | | | 0.51 | |
| | | | | |
Net realized and unrealized gain (loss) on foreign currency transactions ‡ | | | 0.00 | | | | (0.00 | ) | | | 0.00 | | | | (0.00 | ) | | | (0.00 | ) |
| | | | | | | | | | | | | | | | | | | | |
| | | | | |
Total from investment operations | | | 5.00 | | | | 1.87 | | | | 8.57 | | | | (0.42 | ) | | | 0.73 | |
| | | | | | | | | | | | | | | | | | | | |
| | | | | |
| Less dividends and distributions: | | | | | | | | | | | | | | | | | | | | |
| | | | | |
From net investment income | | | (0.09 | ) | | | (0.06 | ) | | | (0.34 | ) | | | (0.23 | ) | | | (0.49 | ) |
| | | | | |
From net realized gain on investments | | | (3.82 | ) | | | (4.37 | ) | | | (0.39 | ) | | | (6.70 | ) | | | (3.70 | ) |
| | | | | | | | | | | | | | | | | | | | |
| | | | | |
Total dividends and distributions | | | (3.91 | ) | | | (4.43 | ) | | | (0.73 | ) | | | (6.93 | ) | | | (4.19 | ) |
| | | | | | | | | | | | | | | | | | | | |
| | | | | |
Net asset value at end of year | | $ | 42.24 | | | $ | 41.15 | | | $ | 43.71 | | | $ | 35.87 | | | $ | 43.22 | |
| | | | | | | | | | | | | | | | | | | | |
| | | | | |
Total investment return (b) | | | 13.14 | % | | | 4.51 | % | | | 24.29 | % | | | (0.91 | %) | | | 1.42 | % |
| | | | | |
| Ratios (to average net assets)/Supplemental Data: | | | | | | | | | | | | | | | | | | | | |
| | | | | |
Net investment income (loss) | | | 0.32 | % | | | 0.20 | % | | | 0.17 | % | | | 0.57 | % | | | 0.51 | % |
| | | | | |
Net expenses (c) | | | 1.46 | % | | | 1.45 | % | | | 1.45 | %(d) | | | 1.44 | % (d) | | | 1.46 | % |
| | | | | |
Portfolio turnover rate | | | 20 | % | | | 15 | % | | | 15 | % | | | 42 | % | | | 51 | % |
| | | | | |
Net assets at end of year (in 000’s) | | $ | 2,314 | | | $ | 1,931 | | | $ | 1,004 | | | $ | 806 | | | $ | 1,062 | |
| ‡ | Less than one cent per share. |
| (a) | Per share data based on average shares outstanding during the year. |
| (b) | Total investment return is calculated exclusive of sales charges and assumes the reinvestment of dividends and distributions. Class R3 shares are not subject to sales charges. For periods of less than one year, total return is not annualized. |
| (c) | In addition to the fees and expenses which the Fund bears directly, it also indirectly bears a pro-rata share of the fees and expenses of the underlying funds in which it invests. Such indirect expenses are not included in the above expense ratios. |
| (d) | Net of interest expense which is less than one-tenth of a percent. (See Note 6) |
| | | | |
| 22 | | MainStay MAP Equity Fund | | The notes to the financial statements are an integral part of,
and should be read in conjunction with, the financial statements. |
Notes to Financial Statements
Note 1–Organization and Business
The MainStay Funds (the “Trust”) was organized on January 9, 1986, as a Massachusetts business trust and is governed by a Declaration of Trust. The Trust is registered under the Investment Company Act of 1940, as amended (the “1940 Act”), as an open-end management investment company, and is comprised of twelve funds (collectively referred to as the “Funds”). These financial statements and notes relate to the MainStay MAP Equity Fund (the “Fund”), a “diversified” fund, as that term is defined in the 1940 Act, as interpreted or modified by regulatory authorities having jurisdiction, from time to time.
The Fund currently has nine classes of shares registered for sale. Class A, Class B and Class C shares commenced operations on June 9, 1999. Class I shares commenced operations in January 21, 1971 (under a former class designation) and were redesignated as Class I shares on June 9, 1999. Class R1 and Class R2 shares commenced operations on January 2, 2004. Class R3 shares commenced operations on April 28, 2006. Investor Class shares commenced operations on February 28, 2008. Class R6 shares were registered for sale effective as of February 28, 2017. As of October 31, 2019, Class R6 shares were not yet offered for sale.
Class B shares of the MainStay Group of Funds are closed to all new purchases as well as additional investments by existing Class B shareholders. Existing Class B shareholders may continue to reinvest dividends and capital gains distributions, as well as exchange their Class B shares for Class B shares of other funds in the MainStay Group of Funds as permitted by the current exchange privileges. Class B shareholders continue to be subject to any applicable contingent deferred sales charge (“CDSC”) at the time of redemption. All other features of the Class B shares, including but not limited to the fees and expenses applicable to Class B shares, remain unchanged. Unless redeemed, Class B shareholders will remain in Class B shares of their respective fund until the Class B shares are converted to Class A or Investor Class shares pursuant to the applicable conversion schedule.
Class A and Investor Class shares are offered at net asset value (“NAV”) per share plus an initial sales charge. No initial sales charge applies to investments of $1 million or more (and certain other qualified purchases) in Class A and Investor Class shares. However, a CDSC of 1.00% may be imposed on certain redemptions made within 18 months of the date of purchase on shares that were purchased without an initial sales charge. Class C shares are offered at NAV without an initial sales charge, although a 1.00% CDSC may be imposed on certain redemptions of such shares made within one year of the date of purchase of Class C shares. When Class B shares were offered, they were offered at NAV without an initial sales charge, although a CDSC that declines depending on the number of years a shareholder has held its Class B shares may be imposed on certain redemptions of such shares made within six years of the date of purchase of such shares. Class I, Class R1, Class R2 and Class R3 shares are offered at NAV without a sales charge. Class R6 shares are currently expected to be offered at NAV without a sales charge. Depending upon eligibility, Class B shares convert to either Class A or Investor Class shares at the end of the calendar quarter eight years after the date they were purchased. In addition, depending upon eligibility, Class C shares convert to either Class A or Investor Class shares at the end of the calendar quarter ten years after the date they were purchased. Additionally, as disclosed in the
Fund’s prospectus, Class A shares may convert automatically to Investor Class shares and Investor Class shares may convert automatically to Class A shares. Under certain circumstances and as may be permitted by the Trust’s multiple class plan pursuant to Rule 18f-3 under the 1940 Act, specified share classes of the Fund may be converted to one or more other share classes of the Fund as disclosed in the capital share transactions within these Notes. The classes of shares have the same voting (except for issues that relate solely to one class), dividend, liquidation and other rights, and the same terms and conditions, except that under distribution plans pursuant to Rule 12b-1 under the 1940 Act, Class B and Class C shares are subject to higher distribution and/or service fees than Class A, Investor Class, Class R2 and Class R3 shares. Class I, Class R1 and Class R6 shares are not subject to a distribution and/or service fee. Class R1, Class R2 and Class R3 shares are subject to a shareholder service fee, which is in addition to fees paid under the distribution plans for Class R2 and Class R3 shares.
The Fund’s investment objective is to seeklong-term appreciation of capital.
Note 2–Significant Accounting Policies
The Fund is an investment company and accordingly follows the investment company accounting and reporting guidance of the Financial Accounting Standards Board (“FASB”) Accounting Standard CodificationTopic 946 Financial Services—Investment Companies. The Fund prepares its financial statements in accordance with generally accepted accounting principles (“GAAP”) in the United States of America and follows the significant accounting policies described below.
(A) Securities Valuation. Investments are usually valued as of the close of regular trading on the New York Stock Exchange (the “Exchange”) (usually 4:00 p.m. Eastern time) on each day the Fund is open for business (“valuation date”).
The Board of Trustees of the Trust (the “Board”) adopted procedures establishing methodologies for the valuation of the Fund’s securities and other assets and delegated the responsibility for valuation determinations under those procedures to the Valuation Committee of the Trust (the “Valuation Committee”). The Board authorized the Valuation Committee to appoint a Valuation Subcommittee (the “Subcommittee”) to deal in the first instance with establishing the prices of securities for which market quotations are not readily available or the prices of which are not otherwise readily determinable under these procedures. The Subcommittee meets (in person, via electronic mail or via teleconference) on an as-needed basis. Subsequently, the Valuation Committee meets to ensure that actions taken by the Subcommittee were appropriate. The procedures state that, subject to the oversight of the Board and unless otherwise noted, the responsibility for theday-to-day valuation of portfolio assets (including fair value measurements for the Fund’s assets and liabilities) rests with New York Life Investment Management LLC (“New York Life Investments” or the “Manager”), aided to whatever extent necessary by the Subadvisors (as defined in Note 3(A)).
To assess the appropriateness of security valuations, the Manager, the Subadvisors or the Fund’s third-party service provider, who is subject to oversight by the Manager, regularly compares prior day prices, prices on comparable securities and the sale prices to the prior and current day prices and challenges prices with changes exceeding certain tolerance
Notes to Financial Statements(continued)
levels with third-party pricing services or broker sources. For those securities valued through either a standardized fair valuation methodology or a fair valuation measurement, the Subcommittee deals in the first instance with such valuation and the Valuation Committee reviews and affirms, if appropriate, the reasonableness of the valuation based on such methodologies and measurements on a regular basis after considering information that is reasonably available and deemed relevant by the Valuation Committee. Any action taken by the Subcommittee with respect to the valuation of a portfolio security or other asset is submitted for review and ratification (if appropriate) to the Valuation Committee and the Board at the next regularly scheduled meeting.
“Fair value” is defined as the price the Fund would reasonably expect to receive upon selling an asset or liability in an orderly transaction to an independent buyer in the principal or most advantageous market for the asset or liability. Fair value measurements are determined within a framework that establishes a three-tier hierarchy which maximizes the use of observable market data and minimizes the use of unobservable inputs to establish a classification of fair value measurements for disclosure purposes. “Inputs” refer broadly to the assumptions that market participants would use in pricing the asset or liability, including assumptions about risk, such as the risk inherent in a particular valuation technique used to measure fair value using a pricing model and/or the risk inherent in the inputs for the valuation technique. Inputs may be observable or unobservable. Observable inputs reflect the assumptions market participants would use in pricing the asset or liability based on market data obtained from sources independent of the Fund. Unobservable inputs reflect the Fund’s own assumptions about the assumptions market participants would use in pricing the asset or liability based on the information available. The inputs or methodology used for valuing assets or liabilities may not be an indication of the risks associated with investing in those assets or liabilities. The three-tier hierarchy of inputs is summarized below.
| • | | Level 1—quoted prices in active markets for an identical asset or liability |
| • | | Level 2—other significant observable inputs (including quoted prices for a similar asset or liability in active markets, interest rates and yield curves, prepayment speeds, credit risk, etc.) |
| • | | Level 3—significant unobservable inputs (including the Fund’s own assumptions about the assumptions that market participants would use in measuring fair value of an asset or liability) |
The level of an asset or liability within the fair value hierarchy is based on the lowest level of an input, both individually and in the aggregate, that is significant to the fair value measurement. As of October 31, 2019, the aggregate value by input level of the Fund’s assets and liabilities is included at the end of the Fund’s Portfolio of Investments.
The Fund may use third-party vendor evaluations, whose prices may be derived from one or more of the following standard inputs, among others:
| | |
• Broker/dealer quotes | | • Benchmark securities |
• Two-sided markets | | • Reference data (corporate actions or material event notices) |
• Bids/offers | | • Monthly payment information |
• Industry and economic events | | • Reported trades |
An asset or liability for which market values cannot be measured using the methodologies described above is valued by methods deemed reasonable in good faith by the Valuation Committee, following the procedures established by the Board, to represent fair value. Under these procedures, the Fund generally uses a market-based approach which may use related or comparable assets or liabilities, recent transactions, market multiples, book values and other relevant information. The Fund may also use an income-based valuation approach in which the anticipated future cash flows of the asset or liability are discounted to calculate fair value. Discounts may also be applied due to the nature and/or duration of any restrictions on the disposition of the asset or liability. Fair value represents a good faith approximation of the value of a security. Fair value determinations involve the consideration of a number of subjective factors, an analysis of applicable facts and circumstances and the exercise of judgment. As a result, it is possible that the fair value for a security determined in good faith in accordance with the Fund’s valuation procedures may differ from valuations for the same security determined by other funds using their own valuation procedures. Although the Fund’s valuation procedures are designed to value a security at the price the Fund may reasonably expect to receive upon the security’s sale in an orderly transaction, there can be no assurance that any fair value determination thereunder would, in fact, approximate the amount that the Fund would actually realize upon the sale of the security or the price at which the security would trade if a reliable market price were readily available. During the year ended October 31, 2019, there were no material changes to the fair value methodologies.
Securities which may be valued in this manner include, but are not limited to: (i) a security for which trading has been halted or suspended; (ii) a debt security that has recently gone into default and for which there is not a current market quotation; (iii) a security of an issuer that has entered into a restructuring; (iv) a security that has been delisted from a national exchange; (v) a security for which the market price is not readily available from a third-party pricing source or, if so provided, does not, in the opinion of the Manager or the Subadvisors, reflect the security’s market value; (vi) a security subject to trading collars for which no or limited trading takes place; and (vii) a security whose principal market has been temporarily closed at a time when, under normal conditions, it would be open. Securities valued in this manner are generally categorized as Level 3 in the hierarchy. As of October 31, 2019, there were no securities held by the Fund that were fair valued in such a manner.
Certain securities held by the Fund may principally trade in foreign markets. Events may occur between the time the foreign markets close and the time at which the Fund’s NAVs are calculated. These events may include, but are not limited to, situations relating to a single issuer in a market sector, significant fluctuations in U.S. or foreign markets, natural disasters, armed conflicts, governmental actions or other developments not tied directly to the securities markets. Should the Manager or the Subadvisors conclude that such events may have affected the accuracy of the last price of such securities reported on the local foreign market, the Subcommittee may, pursuant to procedures adopted by the Board, adjust the value of the local price to reflect the estimated impact on the price of such securities as a result of such events. In this instance, securities are generally categorized as Level 3 in the hierarchy. Additionally, certain foreign equity securities are also fair valued
| | |
| 24 | | MainStay MAP Equity Fund |
whenever the movement of a particular index exceeds certain thresholds. In such cases, the securities are fair valued by applying factors provided by a third-party vendor in accordance with valuation procedures adopted by the Board and are generally categorized as Level 2 in the hierarchy. As of October 31, 2019, there were no securities held by the Fund that were fair valued in such a manner.
Equity securities are valued at the last quoted sales prices as of the close of regular trading on the relevant exchange on each valuation date. Securities that are not traded on the valuation date are valued at the mean of the last quoted bid and ask prices. Prices are normally taken from the principal market in which each security trades. These securities are generally categorized as Level 1 in the hierarchy.
Investments in mutual funds, including money market funds, are valued at their respective NAVs as of the close of the Exchange on the valuation date. These securities are generally categorized as Level 1 in the hierarchy.
Temporary cash investments acquired in excess of 60 days to maturity at the time of purchase are valued using the latest bid prices or using valuations based on a matrix system (which considers such factors as security prices, yields, maturities and ratings), both as furnished by independent pricing services. Other temporary cash investments which mature in 60 days or less at the time of purchase (“Short-Term Investments”) are valued using the amortized cost method of valuation, unless the use of such method would be inappropriate. The amortized cost method involves valuing a security at its cost on the date of purchase and thereafter assuming a constant amortization to maturity of the difference between such cost and the value on maturity date. Amortized cost approximates the current fair value of a security. Securities valued using the amortized cost method are not valued using quoted prices in an active market and are generally categorized as Level 2 in the hierarchy.
The information above is not intended to reflect an exhaustive list of the methodologies that may be used to value portfolio investments. The valuation procedures permit the use of a variety of valuation methodologies in connection with valuing portfolio investments. The methodology used for a specific type of investment may vary based on the market data available or other considerations. The methodologies summarized above may not represent the specific means by which portfolio investments are valued on any particular business day.
(B) Income Taxes. The Fund’s policy is to comply with the requirements of the Internal Revenue Code of 1986, as amended (the “Internal Revenue Code”), applicable to regulated investment companies and to distribute all of its taxable income to the shareholders of the Fund within the allowable time limits. Therefore, no federal, state and local income tax provisions are required.
Management evaluates the Fund’s tax positions to determine if the tax positions taken meet the minimum recognition threshold in connection with accounting for uncertainties in income tax positions taken or expected to be taken for the purposes of measuring and recognizing tax liabilities in the financial statements. Recognition of tax benefits of an uncertain tax position is permitted only to the extent the position is “more likely than not” to be sustained assuming examination by taxing authorities. Management has analyzed the Fund’s tax positions taken on federal, state and local income tax returns for all open tax years (for up
to three tax years) and has concluded that no provisions for federal, state and local income tax are required in the Fund’s financial statements. The Fund’s federal, state and local income tax and federal excise tax returns for tax years for which the applicable statutes of limitations have not expired are subject to examination by the Internal Revenue Service and state and local departments of revenue.
(C) Foreign Taxes. The Fund may be subject to foreign taxes on income and other transaction-based taxes imposed by certain countries in which it invests. A portion of the taxes on gains on investments or currency purchases/repatriation may be reclaimable. The Fund will accrue such taxes and reclaims as applicable, based upon its current interpretation of tax rules and regulations that exist in the markets in which it invests.
The Fund may be subject to taxation on realized capital gains, repatriation proceeds and other transaction-based taxes imposed by certain countries in which it invests. The Fund will accrue such taxes as applicable based upon its current interpretation of tax rules and regulations that exist in the market in which it invests. Capital gains taxes relating to positions still held are reflected as a liability in the Statement of Assets and Liabilities, as well as an adjustment to the Fund’s net unrealized appreciation (depreciation). Taxes related to capital gains realized, if any, are reflected as part of net realized gain (loss) in the Statement of Operations. Changes in tax liabilities related to capital gains taxes on unrealized investment gains, if any, are reflected as part of the change in net unrealized appreciation (depreciation) on investments in the Statement of Operations. Transaction-based charges are generally assessed as a percentage of the transaction amount.
(D) Dividends and Distributions to Shareholders. Dividends and distributions are recorded on the ex-dividend date. The Fund intends to declare and pay dividends from net investment income and distributions from net realized capital and currency gains, if any, at least annually. Unless the shareholder elects otherwise, all dividends and distributions are reinvested in the same class of shares of the Fund, at NAV. Dividends and distributions to shareholders are determined in accordance with federal income tax regulations and may differ from determinations using GAAP.
(E) Security Transactions and Investment Income. The Fund records security transactions on the trade date. Realized gains and losses on security transactions are determined using the identified cost method. Dividend income is recognized on the ex-dividend date; net of any foreign tax withheld at the source, and interest income is accrued as earned using the effective interest rate method.
Investment income and realized and unrealized gains and losses on investments of the Fund are allocated pro rata to the separate classes of shares based upon their relative net assets on the date the income is earned or realized and unrealized gains and losses are incurred.
(F) Expenses. Expenses of the Trust are allocated to the individual Funds in proportion to the net assets of the respective Funds when the expenses are incurred, except where direct allocations of expenses can be made. Expenses (other than transfer agent expenses and fees incurred under the shareholder services plans and/or the distribution plans further discussed in Note 3(B)) are allocated to separate classes of shares pro rata based upon their relative net assets on the date the
Notes to Financial Statements(continued)
expenses are incurred. The expenses borne by the Fund, including those of related parties to the Fund, are shown in the Statement of Operations.
Additionally, the Fund may invest in mutual funds, which are subject to management fees and other fees that may cause the costs of investing in mutual funds to be greater than the costs of owning the underlying securities directly. These indirect expenses of mutual funds are not included in the amounts shown as expenses in the Fund’s Statement of Operations or in the expense ratios included in the Financial Highlights.
(G) Use of Estimates. In preparing financial statements in conformity with GAAP, management makes estimates and assumptions that affect the reported amounts and disclosures in the financial statements. Actual results could differ from those estimates.
(H) Repurchase Agreements. The Fund may enter into repurchase agreements (i.e., buy a security from another party with the agreement that it will be sold back in the future) to earn income. The Fund may enter into repurchase agreements only with counterparties, usually financial institutions, that are deemed by the Manager or the Subadvisors to be creditworthy, pursuant to guidelines established by the Board. During the term of any repurchase agreement, the Manager or the Subadvisors will continue to monitor the creditworthiness of the counterparty. Under the 1940 Act, repurchase agreements are considered to be collateralized loans by the Fund to the counterparty secured by the securities transferred to the Fund.
Repurchase agreements are subject to counterparty risk, meaning the Fund could lose money by the counterparty’s failure to perform under the terms of the agreement. The Fund mitigates this risk by ensuring the repurchase agreement is collateralized by cash, U.S. government securities, fixed income securities and/or other securities. The collateral is held by the Fund’s custodian and valued daily on a mark to market basis to determine if the value, including accrued interest, exceeds the repurchase price. In the event of the counterparty’s default on the obligation to repurchase, the Fund has the right to liquidate the collateral and apply the proceeds in satisfaction of the obligation. Under certain circumstances, such as in the event of default or bankruptcy by the counterparty, realization and/or retention of the collateral may be limited or subject to delay, to legal proceedings and possible realized loss to the Fund. As of October 31, 2019, the Fund did not hold any repurchase agreements.
(I) Rights and Warrants. Rights are certificates that permit the holder to purchase a certain number of shares, or a fractional share, of a new stock from the issuer at a specific price. Warrants are instruments that entitle the holder to buy an equity security at a specific price for a specific period of time. These investments can provide a greater potential for profit or loss than an equivalent investment in the underlying security. Prices of these investments do not necessarily move in tandem with the prices of the underlying securities.
There is risk involved in the purchase of rights and warrants in that these investments are speculative investments. The Fund could also lose the entire value of its investment in warrants if such warrants are not exercised by the date of its expiration. The Fund is exposed to risk until the sale or exercise of each right or warrant is completed. As of October 31, 2019, the Fund did not hold any rights or warrants.
(J) Securities Lending. In order to realize additional income, the Fund may engage in securities lending, subject to the limitations set forth in the 1940 Act and relevant guidance by the staff of the Securities and Exchange Commission (“SEC”). In the event the Fund does engage in securities lending, the Fund will lend through its custodian, State Street Bank and Trust Company (“State Street”), acting as securities lending agent on behalf of the Fund. State Street will manage the Fund’s collateral in accordance with the securities lending agency agreement between the Fund and State Street, and indemnify the Fund against counterparty risk. The loans will be collateralized by cash (which may be invested in a money market fund) and/ornon-cash collateral (which may include U.S. Treasury securities and/or U.S. Government Agency securities issued or guaranteed by the United States government or its agencies or instrumentalities) at least equal at all times to the market value of the securities loaned. The Fund may bear the risk of delay in recovery of, or loss of rights in, the securities loaned should the borrower of the securities experience financial difficulty. The Fund may also record a realized gain or loss on securities deemed sold due to a borrower’s inability to return securities on loan. The Fund bears the risk of any loss on investment of cash collateral. The Fund will receive compensation for lending its securities in the form of fees or it will retain a portion of interest earned on the investment of any cash collateral. The Fund will also continue to receive interest and dividends on the securities loaned and any gain or loss in the market price of the securities loaned that may occur during the term of the loan will be for the account of the Fund. Income earned from securities lending activities, if any, is reflected in the Statement of Operations. As of October 31, 2019, the Fund did not have any portfolio securities on loan.
(K) Foreign Currency Transactions. The Fund’s books and records are maintained in U.S. dollars. Prices of securities denominated in foreign currency amounts are translated into U.S. dollars at the mean between the buying and selling rates last quoted by any major U.S. bank at the following dates:
| (i) | market value of investment securities, other assets and liabilities— at the valuation date; and |
| (ii) | purchases and sales of investment securities, income and expenses—at the date of such transactions. |
The assets and liabilities that are denominated in foreign currency amounts are presented at the exchange rates and market values at the close of the period. The realized and unrealized changes in net assets arising from fluctuations in exchange rates and market prices of securities are not separately presented.
Net realized gain (loss) on foreign currency transactions represents net gains and losses on foreign currency forward contracts, net currency gains or losses realized as a result of differences between the amounts of securities sale proceeds or purchase cost, dividends, interest and withholding taxes as recorded on the Fund’s books, and the U.S. dollar equivalent amount actually received or paid. Net currency gains or losses from valuing such foreign currency denominated assets and liabilities, other than investments at valuation date exchange rates, are reflected in unrealized foreign exchange gains or losses.
(L) Foreign Securities Risk. The Fund may invest in foreign securities, which carry certain risks that are in addition to the usual risks inherent in domestic securities. These risks include those resulting from
| | |
| 26 | | MainStay MAP Equity Fund |
currency fluctuations, future adverse political or economic developments and possible imposition of currency exchange blockages or other foreign governmental laws or restrictions. These risks are likely to be greater in emerging markets than in developed markets. The ability of issuers of debt securities held by the Fund to meet their obligations may be affected by, among other things, economic or political developments in a specific country, industry or region.
(M) Indemnifications. Under the Trust’s organizational documents, its officers and trustees are indemnified against certain liabilities that may arise out of performance of their duties to the Trust. Additionally, in the normal course of business, the Fund enters into contracts with third-party service providers that contain a variety of representations and warranties and which may provide general indemnifications. The Fund’s maximum exposure under these arrangements is unknown, as this would involve future claims that may be made against the Fund that have not yet occurred. Based on experience, management is of the view that the risk of loss in connection with these potential indemnification obligations is remote. However, there can be no assurance that material liabilities related to such obligations will not arise in the future, which could adversely impact the Fund.
Note 3–Fees and Related Party Transactions
(A) Manager and Subadvisors. New York Life Investments, a registered investment adviser and an indirect,wholly-owned subsidiary of New York Life Insurance Company (“New York Life”), serves as the Fund’s Manager, pursuant to an Amended and Restated Management Agreement (“Management Agreement”). The Manager provides offices, conducts clerical, recordkeeping and bookkeeping services and keeps most of the financial and accounting records required to be maintained by the Fund. Except for the portion of salaries and expenses that are the responsibility of the Fund, the Manager pays the salaries and expenses of all personnel affiliated with the Fund and certain operational expenses of the Fund. The Fund reimburses New York Life Investments in an amount equal to a portion of the compensation of the Chief Compliance Officer attributable to the Fund. Markston International LLC (“Markston” or a “Subadvisor”) and Epoch Investment Partners, Inc. (“Epoch” or a “Subadvisor”), each a registered investment adviser, serve as Subadvisors to the Fund and each manages a portion of the Fund’s assets, as designated by New York Life Investments from time to time, subject to the oversight of New York Life Investments. Each Subadvisor is responsible for theday-to-day portfolio management of the Fund with respect to its allocated portion of the Fund’s assets. Pursuant to the terms of an Amended and Restated Subadvisory Agreement between New York Life Investments and Epoch, and pursuant to the terms of a Subadvisory Agreement between New York Life Investments and Markston (“Subadvisory Agreements”), New York Life Investments pays for the services of the Subadvisors.
Under the Management Agreement, the Fund pays the Manager a monthly fee for the services performed and the facilities furnished at an annual rate of the Fund’s average daily net assets as follows: 0.75% up to $1 billion; 0.70% from $1 billion to $3 billion; and 0.675% in excess of $3 billion, plus a fee for fund accounting services previously provided by New York Life Investments under a separate fund accounting agreement furnished at an annual rate of the Fund’s average daily net assets as follows: 0.05% up to $20 million; 0.0333% from $20 million to
$100 million; and 0.01% in excess of $100 million. During the year ended October 31, 2019, the effective management fee rate was 0.76% inclusive of a fee for fund accounting services of 0.01% of the Fund’s average daily net assets.
New York Life Investments has contractually agreed to waive fees and/or reimburse expenses so that Total Annual Fund Operating Expenses (excluding taxes, interest, litigation, extraordinary expenses, brokerage and other transaction expenses relating to the purchase or sale of portfolio investments, and acquired (underlying) fund fees and expenses) of Class R6 do not exceed those of Class I. This agreement will remain in effect until February 28, 2020 and shall renew automatically for one-year terms unless New York Life Investments provides written notice of termination prior to the start of the next term or upon approval of the Board.
During the year ended October 31, 2019, New York Life Investments earned fees from the Fund in the amount of $7,794,215 and waived its fees and/or reimbursed certain class specific expenses in the amount of $70,880 and paid the Markston and Epoch in the amount of $2,764,104 and $1,450,916, respectively.
State Street providessub-administration andsub-accounting services to the Fund pursuant to an agreement with New York Life Investments. These services include calculating the daily NAVs of the Fund, maintaining the general ledger andsub-ledger accounts for the calculation of the Fund’s NAVs and assisting New York Life Investments in conducting various aspects of the Fund’s administrative operations. For providing these services to the Fund, State Street is compensated by New York Life Investments.
Pursuant to an agreement between the Trust and New York Life Investments, New York Life Investments is responsible for providing or procuring certain regulatory reporting services for the Fund. The Fund will reimburse New York Life Investments for the actual costs incurred by New York Life Investments in connection with providing or procuring these services for the Fund.
(B) Distribution, Service and Shareholder Service Fees. The Trust, on behalf of the Fund, has entered into a distribution agreement with NYLIFE Distributors LLC (the “Distributor”), an indirect,wholly-owned subsidiary of New York Life. The Fund has adopted distribution plans (the “Plans”) in accordance with the provisions of Rule 12b-1 under the 1940 Act.
Pursuant to the Class A, Investor Class and Class R2 Plans, the Distributor receives a monthly distribution fee from the Class A, Investor Class and Class R2 shares at an annual rate of 0.25% of the average daily net assets of the Class A, Investor Class and Class R2 shares for distribution and/or service activities as designated by the Distributor. Pursuant to the Class B and Class C Plans, Class B and Class C shares pay the Distributor a monthly distribution fee at an annual rate of 0.75% of the average daily net assets of the Class B and Class C shares, along with a service fee at an annual rate of 0.25% of the average daily net assets of the Class B and Class C shares, for a total 12b-1 fee of 1.00%. Pursuant to the Class R3 Plan, the Distributor receives a monthly distribution and/or service fee from the Class R3 shares at an annual rate of 0.50% of the average daily net assets of the Class R3 shares. Class I, Class R1 and Class R6 shares are not subject to a distribution and/or service fee.
Notes to Financial Statements(continued)
The Plans provide that the distribution and service fees are payable to the Distributor regardless of the amounts actually expended by the Distributor for distribution of the Fund’s shares and service activities.
In accordance with the Shareholder Services Plans for the Class R1, Class R2 and Class R3 shares, the Manager has agreed to provide, through its affiliates or independent third parties, various shareholder and administrative support services to shareholders of the Class R1, Class R2 and Class R3 shares. For its services, the Manager, its affiliates or independent third-party service providers are entitled to a shareholder service fee accrued daily and paid monthly at an annual rate of 0.10% of the average daily net assets of the Class R1, Class R2 and Class R3 shares. This is in addition to any fees paid under the Class R2 and Class R3 Plans.
During the year ended October 31, 2019, shareholder service fees incurred by the Fund were as follows:
| | | | |
Class R1 | | $ | 32 | |
Class R2 | | | 830 | |
Class R3 | | | 2,049 | |
(C) Sales Charges. During the year ended October 31, 2019, the Fund was advised by the Distributor that the amount of initial sales charges retained on sales of Class A and Investor Class shares were $32,192 and $19,846, respectively.
During the year ended October 31, 2019, the Fund was also advised that the Distributor retained CDSCs on redemptions of Class A, Class B and Class C shares of $529, $14,080 and $1,594, respectively.
(D) Transfer, Dividend Disbursing and Shareholder Servicing Agent. NYLIM Service Company LLC, an affiliate of New York Life Investments, is the Fund’s transfer, dividend disbursing and shareholder servicing agent pursuant to an agreement between NYLIM Service Company LLC and the Trust. NYLIM Service Company LLC has entered into an agreement with DST Asset Manager Solutions, Inc. (“DST”), pursuant to which DST performs certain transfer agent services on behalf of NYLIM Service Company LLC. During the year ended October 31, 2019, transfer agent expenses incurred by the Fund were as follows:
| | | | |
Class A | | $ | 228,537 | |
Investor Class | | | 253,854 | |
Class B | | | 74,744 | |
Class C | | | 127,247 | |
Class I | | | 276,918 | |
Class R1 | | | 18 | |
Class R2 | | | 485 | |
Class R3 | | | 1,172 | |
(E) Small Account Fee. Shareholders with small accounts adversely impact the cost of providing transfer agency services. In an effort to reduce total transfer agency expenses, the Fund has implemented a small account fee on certain types of accounts. Certain shareholders with an account balance of less than $1,000 are charged an annual per account fee of $20 (assessed semi-annually), the proceeds from which offset transfer agent fees as reflected in the Statement of Operations.
(F) Investments in Affiliates (in 000’s). During the year ended October 31, 2019, purchases and sales transactions, income earned from investments and shares held of investment companies managed by New York Life Investments or its affiliates were as follows:
| | | | | | | | | | | | | | | | | | | | | | | | | | | | | | | | | | | | |
Affiliated Investment Company | | Value,
Beginning of
Year | | | Purchases
at Cost | | | Proceeds
from
Sales | | | Net
Realized
Gain/
(Loss)
on Sales | | | Change in
Unrealized
Appreciation/
(Depreciation) | | | Value,
End of
Year | | | Dividend
Income | | | Other
Distributions | | | Shares
End of
Year | |
| | | | | | | | | |
MainStay U.S. Government Liquidity Fund | | $ | 14,615 | | | $ | 230,110 | | | $ | (233,746 | ) | | $ | — | | | $ | — | | | $ | 10,979 | | | $ | 308 | | | $ | — | | | | 10,979 | |
(G) Capital. As of October 31, 2019, New York Life and its affiliates beneficially held shares of the Fund with the values and percentages of net assets as follows:
Note 4–Federal Income Tax
As of October 31, 2019, the cost and unrealized appreciation (depreciation) of the Fund’s investment portfolio, including applicable derivative contracts and other financial instruments, as determined on a federal income tax basis, were as follows:
| | | | | | | | | | | | | | | | |
| | | Federal
Tax Cost | | | Gross
Unrealized
Appreciation | | | Gross
Unrealized
(Depreciation) | | | Net
Unrealized
Appreciation/
(Depreciation) | |
Investments in Securities | | $ | 621,592,663 | | | $ | 436,192,652 | | | $ | (20,609,344 | ) | | $ | 415,583,308 | |
As of October 31, 2019, the components of accumulated gain (loss) on a tax basis were as follows:
| | | | | | | | |
Ordinary
Income | | Accumulated
Capital and
Other Gain
(Loss) | | Other Temporary Differences | | Unrealized
Appreciation
(Depreciation) | | Total
Accumulated
Gain (Loss) |
| | | | |
| $7,936,105 | | $77,313,161 | | $— | | $415,584,593 | | $500,833,859 |
The difference between book-basis and tax-basis unrealized appreciation (depreciation) is primarily due to wash sale adjustments.
The following table discloses the current year reclassifications between total distributable earnings (loss) and additional paid-in capital arising from permanent differences; net assets as of October 31, 2019 were not affected.
| | | | |
Total
Distributable
Earnings (Loss) | | Additional
Paid-In
Capital | |
| $(16,233,383) | | $ | 16,233,383 | |
| | |
| 28 | | MainStay MAP Equity Fund |
The reclassifications for the Fund are primarily due to equalization.
During the years ended October 31, 2019 and October 31, 2018, the tax character of distributions paid as reflected in the Statements of Changes in Net Assets were as follows:
| | | | | | | | |
| | | 2019 | | | 2018 | |
| | |
Distributions paid from: | | | | | | | | |
Ordinary Income | | $ | 9,513,106 | | | $ | 24,592,000 | |
Long-Term Capital Gain | | | 93,142,888 | | | | 102,330,537 | |
Total | | $ | 102,655,994 | | | $ | 126,922,537 | |
Note 5–Custodian
State Street is the custodian of cash and securities held by the Fund. Custodial fees are charged to the Fund based on the Fund’s net assets and/or the market value of securities held by the Fund and the number of certain transactions incurred by the Fund.
Note 6–Line of Credit
The Fund and certain other funds managed by New York Life Investments maintain a line of credit with a syndicate of banks in order to secure a source of funds for temporary purposes to meet unanticipated or excessive redemption requests.
Effective July 30, 2019, under the credit agreement (the “Credit Agreement”), the aggregate commitment amount is $600,000,000 with an additional uncommitted amount of $100,000,000. The commitment fee is an annual rate of 0.15% of the average commitment amount payable quarterly, regardless of usage, to State Street, who serves as the agent to the syndicate. The commitment fee is allocated among the Fund and certain other funds managed by New York Life Investments based upon their respective net assets and other factors. Interest on any revolving credit loan is charged based upon the Federal Funds Rate or the one-month London Interbank Offered Rate (“LIBOR”), whichever is higher. The Credit Agreement expires on July 28, 2020, although the Fund, certain other funds managed by New York Life Investments and the syndicate of banks may renew the Credit Agreement for an additional year on the same or different terms. Prior to July 30, 2019, the aggregate commitment amount and the commitment fee were the same as those under the current Credit Agreement. During the year ended October 31, 2019, there were no borrowings made or outstanding with respect to the Fund under the Credit Agreement.
Note 7–Interfund Lending Program
Pursuant to an exemptive order issued by the SEC, the Fund, along with certain other funds managed by New York Life Investments, may participate in an interfund lending program. The interfund lending program provides an alternative credit facility that permits the Fund and certain other funds managed by New York Life Investments to lend or borrow money for temporary purposes directly to or from one another, subject to the conditions of the exemptive order. During the year ended October 31, 2019, there were no interfund loans made or outstanding with respect to the Fund.
Note 8–Purchases and Sales of Securities (in 000’s)
During the year ended October 31, 2019, purchases and sales of securities, other thanshort-term securities, were $197,911 and $319,612, respectively.
Note 9–Capital Share Transactions
Transactions in capital shares for the years ended October 31, 2019 and October 31, 2018, were as follows:
| | | | | | | | |
Class A | | Shares | | | Amount | |
| | |
Year ended October 31, 2019: | | | | | | | | |
Shares sold | | | 2,193,042 | | | $ | 88,416,773 | |
Shares issued to shareholders in reinvestment of dividends and distributions | | | 959,941 | | | | 36,592,967 | |
Shares redeemed | | | (2,695,902 | ) | | | (108,469,574 | ) |
| | | | |
Net increase (decrease) in shares outstanding before conversion | | | 457,081 | | | | 16,540,166 | |
Shares converted into Class A (See Note 1) | | | 381,380 | | | | 15,059,585 | |
Shares converted from Class A (See Note 1) | | | (63,849 | ) | | | (2,494,726 | ) |
| | | | |
Net increase (decrease) | | | 774,612 | | | $ | 29,105,025 | |
| | | | |
Year ended October 31, 2018: | | | | | | | | |
Shares sold | | | 453,868 | | | $ | 19,096,232 | |
Shares issued to shareholders in reinvestment of dividends and distributions | | | 967,361 | | | | 38,916,938 | |
Shares redeemed | | | (1,492,836 | ) | | | (62,832,187 | ) |
| | | | |
Net increase (decrease) in shares outstanding before conversion | | | (71,607 | ) | | | (4,819,017 | ) |
Shares converted into Class A (See Note 1) | | | 545,533 | | | | 23,128,807 | |
Shares converted from Class A (See Note 1) | | | (41,220 | ) | | | (1,733,006 | ) |
| | | | |
Net increase (decrease) | | | 432,706 | | | $ | 16,576,784 | |
| | | | |
| | |
| | | | | | | | |
Investor Class | | Shares | | | Amount | |
Year ended October 31, 2019: | | | | | | | | |
Shares sold | | | 376,122 | | | $ | 15,510,818 | |
Shares issued to shareholders in reinvestment of dividends and distributions | | | 195,177 | | | | 7,444,065 | |
Shares redeemed | | | (487,973 | ) | | | (19,883,494 | ) |
| | | | |
Net increase (decrease) in shares outstanding before conversion | | | 83,326 | | | | 3,071,389 | |
Shares converted into Investor Class (See Note 1) | | | 163,198 | | | | 6,249,214 | |
Shares converted from Investor Class (See Note 1) | | | (199,711 | ) | | | (8,062,305 | ) |
| | | | |
Net increase (decrease) | | | 46,813 | | | $ | 1,258,298 | |
| | | | |
Year ended October 31, 2018: | | | | | | | | |
Shares sold | | | 119,628 | | | $ | 5,041,881 | |
Shares issued to shareholders in reinvestment of dividends and distributions | | | 230,335 | | | | 9,270,981 | |
Shares redeemed | | | (195,259 | ) | | | (8,227,153 | ) |
| | | | |
Net increase (decrease) in shares outstanding before conversion | | | 154,704 | | | | 6,085,709 | |
Shares converted into Investor Class (See Note 1) | | | 113,705 | | | | 4,789,103 | |
Shares converted from Investor Class (See Note 1) | | | (482,609 | ) | | | (20,465,858 | ) |
| | | | |
Net increase (decrease) | | | (214,200 | ) | | $ | (9,591,046 | ) |
| | | | |
Notes to Financial Statements(continued)
| | | | | | | | |
Class B | | Shares | | | Amount | |
Year ended October 31, 2019: | | | | | | | | |
Shares sold | | | 193,247 | | | $ | 7,064,260 | |
Shares issued to shareholders in reinvestment of dividends and distributions | | | 82,120 | | | | 2,757,564 | |
Shares redeemed | | | (306,929 | ) | | | (10,953,996 | ) |
| | | | |
Net increase (decrease) in shares outstanding before conversion | | | (31,562 | ) | | | (1,132,172 | ) |
Shares converted from Class B (See Note 1) | | | (123,914 | ) | | | (4,171,710 | ) |
| | | | |
Net increase (decrease) | | | (155,476 | ) | | $ | (5,303,882 | ) |
| | | | |
Year ended October 31, 2018: | | | | | | | | |
Shares sold | | | 17,896 | | | $ | 674,738 | |
Shares issued to shareholders in reinvestment of dividends and distributions | | | 108,629 | | | | 3,908,458 | |
Shares redeemed | | | (155,747 | ) | | | (5,848,176 | ) |
| | | | |
Net increase (decrease) in shares outstanding before conversion | | | (29,222 | ) | | | (1,264,980 | ) |
Shares converted from Class B (See Note 1) | | | (152,395 | ) | | | (5,730,073 | ) |
| | | | |
Net increase (decrease) | | | (181,617 | ) | | $ | (6,995,053 | ) |
| | | | |
| | |
| | | | | | | | |
Class C | | Shares | | | Amount | |
Year ended October 31, 2019: | | | | | | | | |
Shares sold | | | 136,922 | | | $ | 4,460,201 | |
Shares issued to shareholders in reinvestment of dividends and distributions | | | 192,648 | | | | 6,467,171 | |
Shares redeemed | | | (1,292,587 | ) | | | (43,926,478 | ) |
| | | | |
Net increase (decrease) in shares outstanding before conversion | | | (963,017 | ) | | | (32,999,106 | ) |
Shares converted from Class C (See Note 1) | | | (202,437 | ) | | | (6,793,370 | ) |
| | | | |
Net increase (decrease) | | | (1,165,454 | ) | | $ | (39,792,476 | ) |
| | | | |
Year ended October 31, 2018: | | | | | | | | |
Shares sold | | | 59,753 | | | $ | 2,248,778 | |
Shares issued to shareholders in reinvestment of dividends and distributions | | | 229,749 | | | | 8,266,357 | |
Shares redeemed | | | (522,638 | ) | | | (19,740,133 | ) |
| | | | |
Net increase (decrease) | | | (233,136 | ) | | $ | (9,224,998 | ) |
| | | | |
| | |
| | | | | | | | |
Class I | | Shares | | | Amount | |
Year ended October 31, 2019: | | | | | | | | |
Shares sold | | | 2,323,482 | | | $ | 91,108,977 | |
Shares issued to shareholders in reinvestment of dividends and distributions | | | 1,183,116 | | | | 46,567,457 | |
Shares redeemed | | | (3,736,910 | ) | | | (150,569,250 | ) |
| | | | |
Net increase (decrease) in shares outstanding before conversion | | | (230,312 | ) | | | (12,892,816 | ) |
Shares converted into Class I (See Note 1) | | | 5,272 | | | | 213,312 | |
| | | | |
Net increase (decrease) | | | (225,040 | ) | | $ | (12,679,504 | ) |
| | | | |
Year ended October 31, 2018: | | | | | | | | |
Shares sold | | | 788,856 | | | $ | 34,282,571 | |
Shares issued to shareholders in reinvestment of dividends and distributions | | | 1,515,623 | | | | 62,761,957 | |
Shares redeemed | | | (5,002,025 | ) | | | (219,135,881 | ) |
| | | | |
Net increase (decrease) in shares outstanding before conversion | | | (2,697,546 | ) | | | (122,091,353 | ) |
Shares converted into Class I (See Note 1) | | | 253 | | | | 11,027 | |
| | | | |
Net increase (decrease) | | | (2,697,293 | ) | | $ | (122,080,326 | ) |
| | | | |
| | | | | | | | |
Class R1 | | Shares | | | Amount | |
Year ended October 31, 2019: | | | | | | | | |
Shares sold | | | 32 | | | $ | 1,259 | |
Shares issued to shareholders in reinvestment of dividends and distributions | | | 78 | | | | 3,004 | |
Shares redeemed | | | (7 | ) | | | (283 | ) |
| | | | |
Net increase (decrease) | | | 103 | | | $ | 3,980 | |
| | | | |
Year ended October 31, 2018: | | | | | | | | |
Shares sold | | | 4,042 | | | $ | 173,227 | |
Shares issued to shareholders in reinvestment of dividends and distributions | | | 8,414 | | | | 340,769 | |
Shares redeemed | | | (84,525 | ) | | | (3,620,010 | ) |
| | | | |
Net increase (decrease) | | | (72,069 | ) | | $ | (3,106,014 | ) |
| | | | |
| | |
| | | | | | | | |
Class R2 | | Shares | | | Amount | |
Year ended October 31, 2019: | | | | | | | | |
Shares sold | | | 3,044 | | | $ | 115,295 | |
Shares issued to shareholders in reinvestment of dividends and distributions | | | 1,962 | | | | 75,316 | |
Shares redeemed | | | (7,940 | ) | | | (306,623 | ) |
| | | | |
Net increase (decrease) | | | (2,934 | ) | | $ | (116,012 | ) |
| | | | |
Year ended October 31, 2018: | | | | | | | | |
Shares sold | | | 4,106 | | | $ | 173,691 | |
Shares issued to shareholders in reinvestment of dividends and distributions | | | 6,319 | | | | 255,592 | |
Shares redeemed | | | (47,936 | ) | | | (2,120,017 | ) |
| | | | |
Net increase (decrease) | | | (37,511 | ) | | $ | (1,690,734 | ) |
| | | | |
| | |
| | | | | | | | |
Class R3 | | Shares | | | Amount | |
Year ended October 31, 2019: | | | | | | | | |
Shares sold | | | 6,211 | | | $ | 247,920 | |
Shares issued to shareholders in reinvestment of dividends and distributions | | | 4,809 | | | | 183,889 | |
Shares redeemed | | | (3,161 | ) | | | (124,649 | ) |
| | | | |
Net increase (decrease) | | | 7,859 | | | $ | 307,160 | |
| | | | |
Year ended October 31, 2018: | | | | | | | | |
Shares sold | | | 38,554 | | | $ | 1,637,364 | |
Shares issued to shareholders in reinvestment of dividends and distributions | | | 2,385 | | | | 96,153 | |
Shares redeemed | | | (16,984 | ) | | | (723,058 | ) |
| | | | |
Net increase (decrease) | | | 23,955 | | | $ | 1,010,459 | |
| | | | |
Note 10–Recent Accounting Pronouncements
To improve the effectiveness of fair value disclosure requirements, the Financial Accounting Standards Board recently issued Accounting Standards Update (ASU)2018-13, Fair Value Measurement Disclosure Framework—Changes to the Disclosure Requirements for Fair Value Measurement (ASU2018-13), which adds, removes, and modifies certain aspects relating to fair value disclosure. ASU2018-13 is effective for interim and annual reporting periods beginning after December 15, 2019; early adoptions of the entire ASU 2018-13, or portions thereof, is permitted. Management has evaluated the implications of certain other provisions of the ASU and has determined to early adopt aspects related to the removal and modifications of certain fair value measurement disclosures under the ASU effective immediately. At this time, management is evaluating the implications of certain other provisions of the ASU related to new disclosure requirements and any impact on the financial statement disclosures has not yet been determined.
| | |
| 30 | | MainStay MAP Equity Fund |
Note 11–Subsequent Events
In connection with the preparation of the financial statements of the Fund as of and for the year ended October 31, 2019, events and transactions subsequent to October 31, 2019, through the date the financial statements were issued have been evaluated by the Fund’s management for possible adjustment and/or disclosure. No subsequent events requiring financial statement adjustment or disclosure have been identified.
Report of Independent Registered Public Accounting Firm
To the Shareholders and Board of Trustees
The MainStay Funds:
Opinion on the Financial Statements
We have audited the accompanying statement of assets and liabilities of MainStay MAP Equity Fund (the Fund), one of the funds constituting The MainStay Funds, including the portfolio of investments, as of October 31, 2019, the related statement of operations for the year then ended, the statements of changes in net assets for each of the years in thetwo-year period then ended, and the related notes (collectively, the financial statements) and the financial highlights for each of the years in the five-year period then ended. In our opinion, the financial statements and financial highlights present fairly, in all material respects, the financial position of the Fund as of October 31, 2019, the results of its operations for the year then ended, the changes in its net assets for each of the years in thetwo-year period then ended, and the financial highlights for each of the years in the five-year period then ended, in conformity with U.S. generally accepted accounting principles.
Basis for Opinion
These financial statements and financial highlights are the responsibility of the Fund’s management. Our responsibility is to express an opinion on these financial statements and financial highlights based on our audits. We are a public accounting firm registered with the Public Company Accounting Oversight Board (United States) (PCAOB) and are required to be independent with respect to the Fund in accordance with the U.S. federal securities laws and the applicable rules and regulations of the Securities and Exchange Commission and the PCAOB.
We conducted our audits in accordance with the standards of the PCAOB. Those standards require that we plan and perform the audit to obtain reasonable assurance about whether the financial statements and financial highlights are free of material misstatement, whether due to error or fraud. Our audits included performing procedures to assess the risks of material misstatement of the financial statements and financial highlights, whether due to error or fraud, and performing procedures that respond to those risks. Such procedures included examining, on a test basis, evidence regarding the amounts and disclosures in the financial statements and financial highlights. Such procedures also included confirmation of securities owned as of October 31, 2019, by correspondence with the custodian, the transfer agent, and brokers or by other appropriate auditing procedures when replies from brokers were not received. Our audits also included evaluating the accounting principles used and significant estimates made by management, as well as evaluating the overall presentation of the financial statements and financial highlights. We believe that our audits provide a reasonable basis for our opinion.

We have served as the auditor of one or more New York Life Investment Management investment companies since 2003.
Philadelphia, Pennsylvania
December 23, 2019
| | |
| 32 | | MainStay MAP Equity Fund |
Federal Income Tax Information
(Unaudited)
The Fund is required under the Internal Revenue Code to advise shareholders in a written statement as to the federal tax status of dividends paid by the Fund during such fiscal years. Accordingly, the Fund paid $93,142,888 as long term capital gain distributions.
For the fiscal year ended October 31, 2019, the Fund designated approximately $9,513,106 under the Internal Revenue Code as qualified dividend income eligible for reduced tax rates.
The dividends paid by the Fund during the fiscal year ended October 31, 2019 should be multiplied by 100.00% to arrive at the amount eligible for the corporate dividend-received deduction.
In February 2020, shareholders will receive an IRS Form1099-DIV or substitute Form 1099, which will show the federal tax status of the distributions received by shareholders in calendar year 2019. The amounts that will be reported on such1099-DIV or substitute Form 1099 will be the amounts you are to use on your federal income tax return and will differ from the amounts which we must report for the Fund’s fiscal year end October 31, 2019.
Proxy Voting Policies and Procedures and Proxy Voting Record
A description of the policies and procedures that New York Life Investments uses to vote proxies related to the Fund’s securities is available without charge, upon request, by visiting the MainStay Funds’ website atnylinvestments.com/fundsor visiting the SEC’s website atwww.sec.gov.
The Fund is required to file with the SEC its proxy voting records for the12-month period ending June 30 on Form N-PX. The most recent Form N-PX or proxy voting record is available free of charge upon request by calling800-624-6782; visiting the MainStay Funds’ website atnylinvestments.com/funds; or visiting the SEC’s website atwww.sec.gov.
Shareholder Reports and Quarterly Portfolio Disclosure
The Fund is required to file its complete schedule of portfolio holdings with the SEC 60 days after its first and third fiscal quarter onForm N-PORT. The Fund’s holdings report is available free of charge by visiting the SEC’s website atwww.sec.govor upon request by calling New York Life Investments at800-624-6782.
Board of Trustees and Officers (Unaudited)
The Trustees and officers of the Funds are listed below. The Board oversees the MainStay Group of Funds (which consists of MainStay Funds and MainStay Funds Trust), MainStay VP Funds Trust, MainStay MacKay DefinedTerm Municipal Opportunities Fund, the Manager and the Subadvisors, and elects the officers of the Funds who are responsible for theday-to-day operations of the Funds. Information pertaining to the Trustees and officers is set forth below. Each Trustee serves until his or her successor is elected and qualified or until his or her
resignation, death or removal. Under the Board’s retirement policy, unless an exception is made, a Trustee must tender his or her resignation by the end of the calendar year during which he or she reaches the age of 75. Officers are elected annually by the Board. The business address of each Trustee and officer listed below is 51 Madison Avenue, New York, New York 10010. A majority of the Trustees are not “interested persons” (as defined by the 1940 Act and rules adopted by the SEC thereunder) of the Fund (“Independent Trustees”).
| | | | | | | | | | | | |
| | | | | Name and
Year of Birth | | Term of Office,
Position(s) Held and
Length of Service | | Principal Occupation(s)
During Past Five Years | | Number of
Portfolios in
Fund Complex
Overseen by
Trustee | | Other Directorships
Held by Trustee |
Interested Trustee | | | | Yie-Hsin Hung* 1962 | | MainStay Funds: Trustee since 2017; MainStay Funds Trust:Trustee since 2017. | | Senior Vice President of New York Life since joining in 2010, Member of the Executive Management Committee since 2017, Chief Executive Officer, New York Life Investment Management Holdings LLC & New York Life Investment Management LLC since 2015. Senior Managing Director andCo-President of New York Life Investment Management LLC from January 2014 to May 2015. Previously held positions of increasing responsibility, including head of NYLIM International, Alternative Growth Businesses, and Institutional investments since joining New York Life in 2010. | | 74 | | MainStay VP Funds Trust:
Trustee since 2017 (31 portfolios); and
MainStay MacKay DefinedTerm Municipal Opportunities Fund: Trustee since 2017. |
| | * | This Trustee is considered to be an “interested person” of the MainStay Group of Funds, MainStay VP Funds Trust and MainStay MacKay DefinedTerm Municipal Opportunities Fund, within the meaning of the 1940 Act because of her affiliation with New York Life Insurance Company, New York Life Investment Management LLC, Candriam Belgium S.A., Candriam Luxembourg S.C.A., IndexIQ Advisors LLC, MacKay Shields LLC, NYL Investors LLC, NYLIFE Securities LLC and/or NYLIFE Distributors LLC, as described in detail above in the column entitled “Principal Occupation(s) During Past Five Years.” |
| | |
| 34 | | MainStay MAP Equity Fund |
| | | | | | | | | | | | |
| | | | | Name and
Year of Birth | | Term of Office,
Position(s) Held and
Length of Service | | Principal Occupation(s)
During Past Five Years | | Number of
Portfolios in
Fund Complex
Overseen by
Trustee | | Other Directorships
Held by Trustee |
Independent Trustees | | | | David H. Chow 1957 | | MainStay Funds: Trustee since 2016, Advisory Board Member (June 2015 to December 2015); MainStay Funds Trust:Trustee since 2016, Advisory Board Member (June 2015 to December 2015). | | Founder and CEO, DanCourt Management, LLC (since 1999) | | 74 | | MainStay VP Funds Trust: Trustee since 2016, Advisory Board Member (June 2015 to December 2015) (31 portfolios);
MainStay MacKay DefinedTerm Municipal Opportunities Fund: Trustee since 2016, Advisory Board Member (June 2015 to December 2015);
Market Vectors Group of Exchange-Traded Funds: Independent Chairman of the Board of Trustees since 2008 and Trustee since 2006 (56 portfolios); and
Berea College of Kentucky: Trustee since 2009. |
| | | | Susan B. Kerley 1951 | | MainStay Funds: Chairman since 2017 and Trustee since 2007; MainStay Funds Trust:Chairman since 2017 and Trustee since 1990.** | | President, Strategic Management Advisors LLC (since 1990) | | 74 | | MainStay VP Funds Trust: Chairman since January 2017 and Trustee since 2007 (31 portfolios)***;
MainStay MacKay DefinedTerm Municipal Opportunities Fund: Chairman since 2017 and Trustee since 2011; and
Legg Mason Partners Funds: Trustee since 1991 (45 portfolios). |
| | | | Alan R. Latshaw 1951 | | MainStay Funds: Trustee; MainStay Funds Trust: Trustee and Audit Committee Financial Expert since 2007.** | | Retired; Partner, Ernst & Young LLP (2002 to 2003); Partner, Arthur Andersen LLP (1989 to 2002); Consultant to the MainStay Funds Audit and Compliance Committee (2004 to 2006) | | 74 | | MainStay VP Funds Trust: Trustee and Audit Committee Financial Expert since 2007 (31 portfolios)***;
MainStay MacKay DefinedTerm Municipal Opportunities Fund: Trustee and Audit Committee Financial Expert since 2011;
State Farm Associates Funds Trusts: Trustee since 2005 (4 portfolios);
and State Farm Variable Product Trust: Trustee since 2005 (9 portfolios). |
| | | | Richard H. Nolan, Jr. 1946 | | MainStay Funds: Trustee since 2007; MainStay Funds Trust:Trustee since 2007.** | | Managing Director, ICC Capital Management (since 2004); President—Shields/Alliance, Alliance Capital Management (1994 to 2004) | | 74 | | MainStay VP Funds Trust: Trustee since 2006 (31 portfolios)***; and
MainStay MacKay DefinedTerm Municipal Opportunities Fund: Trustee since 2011. |
| | | | Jacques P. Perold 1958 | | MainStay Funds: Trustee since 2016, Advisory Board Member (June 2015 to December 2015); MainStay Funds Trust:Trustee since 2016, Advisory Board Member (June 2015 to December 2015). | | Retired; President, Fidelity Management & Research Company (2009 to 2014); Founder, President and Chief Executive Officer, Geode Capital Management, LLC (2001 to 2009) | | 74 | | MainStay VP Funds Trust: Trustee since 2016, Advisory Board Member (June 2015 to December 2015) (31 portfolios);
MainStay MacKay DefinedTerm Municipal Opportunities Fund: Trustee since 2016, Advisory Board Member (June 2015 to December 2015);
Allstate Corporation: Director since 2015;MSCI, Inc.: Director since 2017 and
Boston University: Trustee since 2014. |
| | | | | | | | | | | | |
| | | | | Name and
Year of Birth | | Term of Office,
Position(s) Held and
Length of Service | | Principal Occupation(s)
During Past Five Years | | Number of
Portfolios in
Fund Complex
Overseen by
Trustee | | Other Directorships
Held by Trustee |
Independent Trustees | | | | Richard S. Trutanic 1952 | | MainStay Funds: Trustee since 1994; MainStay Funds Trust: Trustee since 2007.** | | Chairman and Chief Executive Officer, Somerset & Company (financial advisory firm) (since 2004); Managing Director, The Carlyle Group (private investment firm) (2002 to 2004); Senior Managing Director, Partner and Board Member, Groupe Arnault S.A. (private investment firm) (1999 to 2002) | | 74 | | MainStay VP Funds Trust: Trustee since 2007 (31 portfolios)***; and
MainStay MacKay DefinedTerm Municipal Opportunities Fund: Trustee since 2011. |
| | ** | Includes prior service as a Director/Trustee of certain predecessor entities to MainStay Funds Trust. |
| | *** | Includes prior service as a Director of MainStay VP Series Fund, Inc., the predecessor to MainStay VP Funds Trust. |
| | |
| 36 | | MainStay MAP Equity Fund |
| | | | | | | | |
| | | | | Name and
Year of Birth | | Position(s) Held and
Length of Service | | Principal Occupation(s)
During Past Five Years |
Officers
of the
Trust
(Who are
not
Trustees)* | | | | Kirk C. Lehneis 1974 | | President, MainStay Funds, MainStay Funds Trust (since 2017) | | Chief Operating Officer and Senior Managing Director (since 2016), New York Life Investment Management LLC; Chairman of the Board (since 2017), NYLIFE Distributors LLC; Chairman of the Board, NYLIM Service Company LLC (since 2017); Trustee, President and Principal Executive Officer of IndexIQ Trust, IndexIQ ETF Trust and IndexIQ Active ETF Trust (since January 2018); President, MainStay MacKay DefinedTerm Municipal Opportunities Fund and MainStay VP Funds Trust
(since 2017)**; Senior Managing Director, Global Product Development (2015 to 2016); Managing Director, Product Development (2010 to 2015), New York Life Investment Management LLC |
| | | | Jack R. Benintende 1964 | | Treasurer and Principal Financial and Accounting Officer, MainStay Funds (since 2007), MainStay Funds Trust (since 2009) | | Managing Director, New York Life Investment Management LLC (since 2007); Treasurer and Principal Financial and Accounting Officer, MainStay MacKay DefinedTerm Municipal Opportunities Fund (since 2011) and MainStay VP Funds Trust (since 2007)**; and Assistant Treasurer, New York Life Investment Management Holdings LLC (2008 to 2012) |
| | | | Kevin M. Bopp 1969 | | Vice President and Chief Compliance Officer, MainStay Funds and MainStay Funds Trust (since 2014) | | Chief Compliance Officer, New York Life Investment Management LLC, IndexIQ Trust, IndexIQ ETF Trust and IndexIQ Active ETF Trust (since 2016), Director and Associate General Counsel (2011 to 2014) and Vice President and Assistant General Counsel (2010 to 2011), New York Life Investment Management LLC; Vice President and Chief Compliance Officer, MainStay VP Funds Trust, MainStay MacKay DefinedTerm Municipal Opportunities Fund (since 2014); Assistant Secretary, MainStay Funds, MainStay Funds Trust and MainStay VP Funds Trust (2010 to 2014)**, MainStay MacKay DefinedTerm Municipal Opportunities Fund (2011 to 2014) |
| | | | J. Kevin Gao 1967 | | Secretary and Chief Legal Officer, MainStay Funds and MainStay Funds Trust (since 2010) | | Managing Director and Associate General Counsel, New York Life Investment Management LLC (since 2010); Secretary and Chief Legal Officer, MainStay MacKay DefinedTerm Municipal Opportunities Fund (since 2011) and MainStay VP Funds Trust (since 2010)** |
| | | | Scott T. Harrington 1959 | | Vice President—Administration, MainStay Funds (since 2005), MainStay Funds Trust (since 2009) | | Managing Director, New York Life Investment Management LLC (including predecessor advisory organizations) (since 2000); Member of the Board of Directors, New York Life Trust Company (since 2009); Vice President—Administration, MainStay MacKay DefinedTerm Municipal Opportunities Fund (since 2011) and MainStay VP Funds Trust (since 2005)** |
| | * | The officers listed above are considered to be “interested persons” of the MainStay Group of Funds, MainStay VP Funds Trust and MainStay MacKay Defined Term Municipal Opportunities Fund within the meaning of the 1940 Act because of their affiliation with the MainStay Group of Funds, New York Life Insurance Company and/or its affiliates, including New York Life Investment Management LLC, NYLIM Service Company LLC, NYLIFE Securities LLC and/or NYLIFE Distributors LLC, as described in detail in the column captioned “Principal Occupation(s) During Past Five Years.” Officers are elected annually by the Board. |
| | ** | Includes prior service as an Officer of MainStay VP Series Fund, Inc., the predecessor to MainStay VP Funds Trust. |
MainStay Funds
Equity
U.S. Equity
MainStay Epoch U.S. All Cap Fund
MainStay Epoch U.S. Equity Yield Fund
MainStay Large Cap Growth Fund
MainStay MacKay Common Stock Fund
MainStay MacKay Growth Fund
MainStay MacKay S&P 500 Index Fund
MainStay MacKay Small Cap Core Fund1
MainStay MacKay U.S. Equity Opportunities Fund
MainStay MAP Equity Fund
International Equity
MainStay Epoch International Choice Fund
MainStay MacKay International Equity Fund
MainStay MacKay International Opportunities Fund
Emerging Markets Equity
MainStay Candriam Emerging Markets Equity Fund
MainStay MacKay Emerging Markets Equity Fund
Global Equity
MainStay Epoch Capital Growth Fund
MainStay Epoch Global Equity Yield Fund
Fixed Income
Taxable Income
MainStay Candriam Emerging Markets Debt Fund2
MainStay Floating Rate Fund
MainStay Indexed Bond Fund3
MainStay MacKay High Yield Corporate Bond Fund
MainStay MacKay Infrastructure Bond Fund
MainStay MacKay Short Duration High Yield Fund
MainStay MacKay Total Return Bond Fund
MainStay MacKay Unconstrained Bond Fund
Tax-Exempt Income
MainStay MacKay California Tax Free Opportunities Fund4
MainStay MacKay High Yield Municipal Bond Fund
MainStay MacKay Intermediate Tax Free Bond Fund
MainStay MacKay New York Tax Free Opportunities Fund5
MainStay MacKay Short Term Municipal Fund
MainStay MacKay Tax Free Bond Fund
Money Market
MainStay Money Market Fund
Mixed Asset
MainStay Balanced Fund
MainStay Income Builder Fund
MainStay MacKay Convertible Fund
Speciality
MainStay Cushing Energy Income Fund
MainStay Cushing MLP Premier Fund
MainStay Cushing Renaissance Advantage Fund
Asset Allocation
MainStay Conservative Allocation Fund
MainStay Growth Allocation Fund
MainStay Moderate Allocation Fund
MainStay Moderate Growth Allocation Fund
Manager
New York Life Investment Management LLC
New York, New York
Subadvisors
Candriam Belgium S.A.6
Brussels, Belgium
Candriam Luxembourg S.C.A.6
Strassen, Luxembourg
Cushing Asset Management, LP
Dallas, Texas
Epoch Investment Partners, Inc.
New York, New York
MacKay Shields LLC6
New York, New York
Markston International LLC
White Plains, New York
NYL Investors LLC6
New York, New York
Winslow Capital Management, LLC
Minneapolis, Minnesota
Legal Counsel
Dechert LLP
Washington, District of Columbia
Independent Registered Public Accounting Firm
KPMG LLP
Philadelphia, Pennsylvania
| 1. | Formerly known as MainStay Epoch U.S. Small Cap Fund. |
| 2. | Formerly known as MainStay MacKay Emerging Markets Debt Fund. |
| 3. | Effective December 5, 2019, MainStay Indexed Bond Fund was renamed MainStay Short Term Bond Fund. |
| 4. | Class A and Class I shares of this Fund are registered for sale in AZ, CA, MI, NV, OR, TX, UT and WA. Class I shares are registered for sale in CO, FL, GA, HI, ID, MA, MD, NH, NJ and NY. |
| 5. | This Fund is registered for sale in CA, CT, DE, FL, MA, NJ, NY and VT. |
| 6. | An affiliate of New York Life Investment Management LLC. |
Not part of the Annual Report
For more information
800-624-6782
nylinvestments.com/funds
“New York Life Investments” is both a service mark, and the common trade name, of the investment advisors affiliated with New York Life Insurance Company. The MainStay Funds® are managed by New York Life Investment Management LLC and distributed by NYLIFE Distributors LLC, 30 Hudson Street, Jersey City, NJ 07302, a wholly owned subsidiary of New York Life Insurance Company. NYLIFE Distributors LLC is a Member FINRA/SIPC.
©2019 NYLIFE Distributors LLC. All rights reserved.
| | |
| 1717394 MS159-19 | | MSMP11-12/19 (NYLIM) NL220 |
Item 2. Code of Ethics.
As of the end of the period covered by this report, the Registrant has adopted a code of ethics (the “Code”) that applies to the Registrant’s principal executive officer (“PEO”) and principal financial officer (“PFO”). A copy of the Code is filed herewith. The Registrant did not grant any waivers, including implicit waivers, from any provisions of the Code to the PEO or PFO during the period covered by this report.
Item 3. Audit Committee Financial Expert.
The Board of Trustees has determined that the Registrant has three audit committee financial experts serving on its Audit Committee. The Audit Committee financial experts are Alan R. Latshaw, David H. Chow and Susan B. Kerley. Mr. Latshaw, Mr. Chow and Ms. Kerley are “independent” within the meaning of that term under the Investment Company Act of 1940.
Item 4. Principal Accountant Fees and Services.
(a) Audit Fees
The aggregate fees billed for the fiscal year ended October 31, 2019 for professional services rendered by KPMG LLP (“KPMG”) for the audit of the Registrant’s annual financial statements or services that are normally provided by KPMG in connection with statutory and regulatory filings or engagements for that fiscal year were $781,900.
The aggregate fees billed for the fiscal year ended October 31, 2018 for professional services rendered by KPMG for the audit of the Registrant’s annual financial statements or services that are normally provided by KPMG in connection with statutory and regulatory filings or engagements for that fiscal year were $757,200.
(b) Audit-Related Fees
The aggregate fees billed for assurance and related services by KPMG that are reasonably related to the performance of the audit of the Registrant’s financial statements and are not reported under paragraph (a) of this Item were: (i) $0 for the fiscal year ended October 31, 2019, and (ii) $0 for the fiscal year ended October 31, 2018.
(c) Tax Fees
The aggregate fees billed for professional services rendered by KPMG for tax compliance, tax advice, and tax planning were: (i) $0 during the fiscal year ended October 31, 2019, and (ii) $0 during the fiscal year ended October 31, 2018. These services primarily included preparation of federal, state and local income tax returns and excise tax returns, as well as services relating to excise tax distribution requirements.
(d) All Other Fees
The aggregate fees billed for products and services provided by KPMG, other than the services reported in paragraphs (a) through (c) of this Item were: (i) $0 during the fiscal year ended October 31, 2019, and (ii) $0 during the fiscal year ended October 31, 2018.
(e) Pre-Approval Policies and Procedures
| | (1) | The Registrant’s Audit and Compliance Committee has adoptedpre-approval policies and procedures (the “Procedures”) to govern the Committee’spre-approval of (i) all audit services and permissiblenon-audit services to be provided to the Registrant by its independent accountant, and (ii) all permissiblenon-audit services to be provided by such independent accountant to the Registrant’s investment adviser and to any entity controlling, controlled by or under common control with the investment adviser that provides ongoing services to the Registrant (collectively, the “Service Affiliates”) if the services directly relate to the Registrant’s operations and financial reporting. In accordance with the Procedures, the Audit and Compliance Committee is responsible for the engagement of the independent accountant to certify the Registrant’s financial statements for each fiscal year. With respect to thepre-approval ofnon-audit services provided to the Registrant and its Service Affiliates, the Procedures provide that the Audit and Compliance Committee may annuallypre-approve a list of the types of services that may be provided to the Registrant or its Service Affiliates, or the Audit and Compliance Committee maypre-approve such services on aproject-by-project basis as they arise. Unless a type of service has received generalpre-approval, it will require specificpre-approval by the Audit and Compliance Committee if it is to be provided by the independent accountant. The Procedures also permit the Audit and Compliance Committee to delegate authority to one or more of its members topre-approve any proposednon-audit services that have not been previouslypre-approved by the Audit and Compliance Committee, subject to the ratification by the full Audit and Compliance Committee no later than its next scheduled meeting. To date, the Audit and Compliance Committee has not delegated such authority. |
| | (2) | With respect to the services described in paragraphs (b) through (d) of this Item 4, no amount was approved by the Audit and Compliance Committee pursuant to paragraph (c)(7)(i)(C) of Rule2-01 of RegulationS-X. |
(f) There were no hours expended on KPMG’s engagement to audit the Registrant’s financial statements for the most recent fiscal year attributable to work performed by persons other than KPMG’s full-time, permanent employees.
(g) Allnon-audit fees billed by KPMG for services rendered to the Registrant for the fiscal years ended October 31, 2019 and October 31, 2018 are disclosed in 4(b)-(d) above.
The aggregatenon-audit fees billed by KPMG for services rendered to the Registrant’s investment adviser (not including anysub-adviser whose role is primarily portfolio management and is subcontracted with or overseen by another investment adviser), and any entity controlling, controlled by, or under common control with the adviser that provides ongoing services to the Registrant were approximately: (i) $24,200 for the fiscal year ended October 31, 2019, and (ii) $331,321 for the fiscal year ended October 31, 2018.
(h) The Registrant’s Audit and Compliance Committee has determined that thenon-audit services rendered by KPMG for the fiscal year ended October 31, 2019 to the Registrant’s investment adviser and any entity controlling, controlled by, or under common control with the Registrant’s investment adviser
that provides ongoing services to the Registrant that were not required to bepre-approved by the Audit and Compliance Committee because they did not relate directly to the operations and financial reporting of the registrant were compatible with maintaining the respective independence of KPMG during the relevant time period.
| Item 5. | Audit Committee of Listed Registrants |
Not applicable.
| Item 6. | Schedule of Investments |
The Schedule of Investments is included as part of Item 1 of this report.
| Item 7. | Disclosure of Proxy Voting Policies and Procedures forClosed-End Management Investment Companies. |
Not applicable.
| Item 8. | Portfolio Managers ofClosed-End Management Investment Companies. |
Not applicable.
| Item 9. | Purchases of Equity Securities byClosed-End Management Investment Company and Affiliated Purchasers. |
Not Applicable.
| Item 10. | Submission of Matters to a Vote of Security Holders. |
Since the Registrant’s last response to this Item, there have been no material changes to the procedures by which shareholders may recommend nominees to the Registrant’s Board of Trustees.
Item 11. Controls and Procedures.
(a) Based on an evaluation of the Registrant’s Disclosure Controls and Procedures (as defined in Rule30a-3(c) under the Investment Company Act of 1940) (the “Disclosure Controls”), as of a date within 90 days prior to the filing date (the “Filing Date”) of this FormN-CSR (the “Report”), the Registrant’s principal executive officer and principal financial officer have concluded that the Disclosure Controls are reasonably designed to ensure that information required to be disclosed by the Registrant in the Report is recorded, processed, summarized and reported by the Filing Date, including ensuring that information required to be disclosed in the Report is accumulated and communicated to the Registrant’s management, including the Registrant’s principal executive officer and principal financial officer, as appropriate to allow timely decisions regarding required disclosure.
(b) There were no changes in the Registrant’s internal control over financial reporting (as defined in Rule30a-3(d)) under the Investment Company Act of 1940 that occurred during the period covered by this report that has materially affected, or is reasonably likely to materially affect, the Registrant’s internal control over financial reporting.
Item 12. Exhibits.
| | |
| (a)(1) | | Code of Ethics |
| |
| (a)(2) | | Certifications of principal executive officer and principal financial officer as required by Rule30a-2 under the Investment Company Act of 1940. |
| |
| (b) | | Certifications of principal executive officer and principal financial officer as required by Section 906 of the Sarbanes-Oxley Act of 2002. |
SIGNATURES
Pursuant to the requirements of the Securities Exchange Act of 1934 and the Investment Company Act of 1940, the Registrant has duly caused this Report to be signed on its behalf by the undersigned, thereunto duly authorized.
THE MAINSTAY FUNDS
| | |
| By: | | /s/ Kirk C. Lehneis |
| | Kirk C. Lehneis |
| | President and Principal Executive Officer |
Date: January 9, 2020
Pursuant to the requirements of the Securities Exchange Act of 1934 and the Investment Company Act of 1940, this Report has been signed below by the following persons on behalf of the Registrant and in the capacities and on the dates indicated.
| | |
| By: | | /s/ Kirk C. Lehneis |
| | Kirk C. Lehneis |
| | President and Principal Executive Officer |
Date: January 9, 2020
| | |
| By: | | /s/ Jack R. Benintende |
| | Jack R. Benintende |
| | Treasurer and Principal Financial and Accounting Officer |
Date: January 9, 2020
EXHIBIT INDEX
| | |
| (a)(1) | | Code of Ethics |
| |
| (a)(2) | | Certifications of principal executive officer and principal financial officer as required by Rule30a-2 under the Investment Company Act of 1940. |
| |
| (b) | | Certification of principal executive officer and principal financial officer as required by Section 906 of the Sarbanes-Oxley Act of 2002. |