UNITED STATES
SECURITIES AND EXCHANGE COMMISSION
Washington, D.C. 20549
Form N-CSR
CERTIFIED SHAREHOLDER REPORT OF REGISTERED MANAGEMENT
INVESTMENT COMPANIES
Investment Company Act File Number 811-04550
THE MAINSTAY FUNDS
(Exact name of Registrant as specified in charter)
51 Madison Avenue, New York, NY 10010
(Address of principal executive offices) (Zip code)
J. Kevin Gao, Esq.
30 Hudson Street
Jersey City, New Jersey 07302
(Name and address of agent for service)
Registrant’s telephone number, including area code: (212) 576-7000
Date of fiscal year end: October 31
Date of reporting period: October 31, 2017
FORM N-CSR
| Item 1. | Reports to Stockholders. |
MainStay Unconstrained Bond Fund
Message from the President and Annual Report
October 31, 2017


This page intentionally left blank
Message from the President
The 12 months ended October 31, 2017, brought strong performance to equity markets in the United States and abroad.
According to FTSE-Russell data for the U.S. market, stocks at all capitalization levels earned solid double-digit overall returns during the reporting period. Total returns for stocks in general exceeded 20% at all capitalization levels. Growth stocks were particularly strong, outperforming value stocks for companies of all sizes except among microcaps, where value stocks outperformed growth stocks.
Several factors contributed to the strength of domestic and international stock markets during the reporting period. Following the U.S. presidential election in November 2016, many investors looked forward to business tax incentives and possible tax cuts for consumers that could stimulate economic growth. During the reporting period, corporate earnings reports remained strong; and growth in U.S. real gross domestic product remained positive, with a substantial advance during the second quarter of 2017. Developed international markets and emerging markets were also strong, boosted by positive macroeconomic data and growing confidence that Europe was well on its way to financial recovery. Despite wide variations among emerging markets, many saw strong appreciation in local-currency terms and benefited from a weaker U.S. dollar.
During the reporting period, the Federal Open Market Committee raised the federal funds target range three times—in December of 2016 and in March and June of 2017. These incremental increases raised the federal funds target range to 1.00% to 1.25% by the end of the reporting period. These tightening moves were followed by higher U.S. Treasury yields at all maturities, with the greatest increases at the short-end of the maturity spectrum.
As interest rates rise, bond prices tend to decline (and vice versa). As a result, some portions of the U.S. Treasury market recorded negative total returns during the reporting period. Agency securities posted small but positive total returns, as did
asset-backed and mortgage-backed securities. Other bond categories, particularly those with looser ties to U.S. interest rates, did considerably better. Emerging-market debt recorded solid single-digit returns; high-yield bonds were generally stronger; and convertible bonds, which are closely tied to the performance of underlying stocks, provided some of the strongest overall returns of any fixed-income sector during the reporting period.
At MainStay, we have always encouraged investors to diversify their investments and maintain a long-term perspective, even when markets are strong. Asset classes that perform well in one environment may perform differently in another; and in today’s ever-changing world, wide market swings are not unknown.
MainStay offers Funds with a wide array of investment objectives to help our shareholders pursue the appropriate diversification for their long-range financial goals. We also offer several investment boutiques, allowing our shareholders to choose the style—or mix of styles—that’s best suited to their investment needs. We believe that relatively few individual investors can match the level of professional experience and market insight that our portfolio managers provide.
The report that follows provides more detailed information on the specific markets, investment strategies and portfolio decisions that affected your MainStay Fund during the 12 months ended October 31, 2017. We encourage you to read the report carefully and use it to help you evaluate your progress toward your financial goals.
Sincerely,

Kirk C. Lehneis
President
The opinions expressed are as of the date of this report and are subject to change. There is no guarantee that any forecast made will come to pass. This material does not constitute investment advice and is not intended as an endorsement of any specific investment. Past performance is no guarantee of future results.
Not part of the Annual Report
Table of Contents
Investors should refer to the Fund’s Summary Prospectus and/or Prospectus and consider the Fund’s investment objectives, strategies, risks, charges and expenses carefully before investing. The Summary Prospectus and/or Prospectus contain this and other information about the Fund. You may obtain copies of the Fund’s Summary Prospectus, Prospectus and Statement of Additional Information free of charge, upon request, by calling toll-free 800-MAINSTAY (624-6782), by writing to NYLIFE Distributors LLC, Attn: MainStay Marketing Department, 30 Hudson Street, Jersey City, NJ 07302 or by sending an e-mail to MainStayShareholderServices@nylim.com. These documents are also available via the MainStay Funds’ website at mainstayinvestments.com/documents. Please read the Summary Prospectus and/or Prospectus carefully before investing.
Investment and Performance Comparison1 (Unaudited)
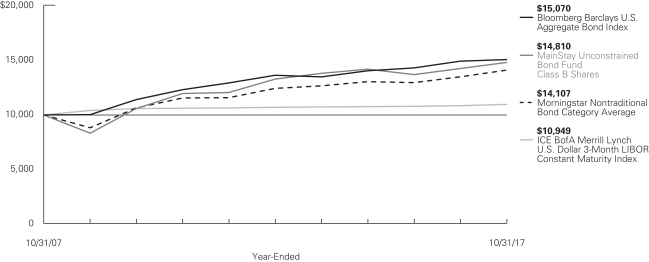
Performance data quoted represents past performance. Past performance is no guarantee of future results. Because of market volatility and other factors, current performance may be lower or higher than the figures shown. Investment return and principal value will fluctuate, and as a result, when shares are redeemed, they may be worth more or less than their original cost. The graph below depicts the historical performance of Class B shares2 of the Fund. Performance will vary from class to class based on differences in class-specific expenses and sales charges. For performance information current to the most recent month-end, please call 800-MAINSTAY (624-6782) or visit mainstayinvestments.com.
Average Annual Total Returns for the Year-Ended October 31, 2017
| | | | | | | | | | | | | | | | | | | | | | | | |
| Class | | Sales Charge | | | | Inception
Date | | | One Year | | | Five Years or Since
Inception | | | Ten Years or Since
Inception | | | Gross
Expense
Ratio3 | |
| Class A Shares | | Maximum 4.5% Initial Sales Charge | | With sales charges Excluding sales charges | | | 2/28/1997 | | |
| –0.06
4.65 | %
| |
| 2.08
3.02 | %
| |
| 4.41
4.89 | %
| |
| 1.16
1.16 | %
|
| Investor Class Shares | | Maximum 4.5% Initial Sales Charge | | With sales charges Excluding sales charges | | | 2/28/2008 | | |
| –0.12
4.59 |
| |
| 2.03
2.97 |
| |
| 4.49
4.99 |
| |
| 1.18
1.18 |
|
| Class B Shares2 | | Maximum 5% CDSC
if Redeemed Within the First Six��Years of Purchase | | With sales charges Excluding sales charges | |
| 2/28/1997
|
| |
| –1.14
3.86 |
| |
| 1.87
2.22 |
| |
| 4.01
4.01 |
| |
| 1.93
1.93 |
|
| Class C Shares | | Maximum 1% CDSC if Redeemed Within
One Year of Purchase | | With sales charges Excluding sales charges | |
| 9/1/1998
|
| |
| 2.86
3.86 |
| |
| 2.22
2.22 |
| |
| 4.00
4.00 |
| |
| 1.93
1.93 |
|
| Class I Shares | | No Sales Charge | | | | | 1/2/2004 | | | | 4.90 | | | | 3.30 | | | | 5.17 | | | | 0.91 | |
| Class R2 Shares | | No Sales Charge | | | | | 2/28/2014 | | | | 4.54 | | | | 2.01 | | | | N/A | | | | 1.28 | |
| Class R3 Shares | | No Sales Charge | | | | | 2/29/2016 | | | | 4.28 | | | | 8.42 | | | | N/A | | | | 1.50 | |
| 1. | The performance table and graph do not reflect the deduction of taxes that a shareholder would pay on distributions or Fund share redemptions. Total returns reflect maximum applicable sales charges as indicated in the table above, if any, changes in share price, and reinvestment of dividend and capital gain distributions. The graph assumes the initial investment amount shown above and reflects the deduction of all sales charges that would have applied for the period of investment. Performance figures may reflect certain fee waivers and/or expense limitations, without which total returns may have |
| | been lower. For more information on share classes and current fee waivers and/or expense limitations (if any), please refer to the Notes to Financial Statements. |
| 2. | Class B shares are closed to all new purchases as well as additional investments by existing Class B shareholders. |
| 3. | The gross expense ratios presented reflect the Fund’s “Total Annual Fund Operating Expenses” from the most recent Prospectus and may differ from other expense ratios disclosed in this report. |
The footnotes on the next page are an integral part of the table and graph and should be carefully read in conjunction with them.
| | | | | | | | | | | | |
| Benchmark Performance | | One
Year | | | Five Years
or Since
Inception | | | Ten Years
or Since
Inception | |
Bloomberg Barclays U.S. Aggregate Bond Index4 | | | 0.90 | % | | | 2.04 | % | | | 4.19 | % |
ICE BofA Merrill Lynch U.S. Dollar 3-Month LIBOR Constant Maturity Index5 | | | 1.06 | | | | 0.48 | | | | 0.91 | |
Morningstar Nontraditional Bond Category Average6 | | | 4.51 | | | | 2.13 | | | | 3.50 | |
| 4. | The Bloomberg Barclays U.S. Aggregate Bond Index is the Fund’s primary broad-based securities market index for comparison purposes. The Bloomberg Barclays U.S. Aggregate Bond Index is a broad-based benchmark that measures the investment grade, U.S. dollar-denominated, fixed-rate taxable bond market, including Treasuries, government-related and corporate securities, mortgage-backed securities (agency fixed-rate and hybrid adjustable rate mortgage pass-throughs), asset-backed securities, and commercial mortgage-backed securities. Results assume reinvestment of all dividends and capital gains. An investment cannot be made directly in an index. |
| 5. | The Fund has selected the ICE BofA Merrill Lynch U.S. Dollar 3-Month LIBOR Constant Maturity Index as a secondary benchmark. The ICE BofA Merrill Lynch U.S. Dollar 3-Month LIBOR Constant Maturity Index represents the |
| | London InterBank Offered Rate (“LIBOR”) with a constant 3-month average maturity. LIBOR is a composite of interest rates at which banks borrow from one another in the London market, and it is a widely used benchmark for short-term interest rates. Results assume reinvestment of all dividends and capital gains. An investment cannot be made directly in an index. |
| 6. | The Fund has selected the Morningstar Nontraditional Bond Category Average as an additional benchmark. The Morningstar Nontraditional Bond Category Average contains funds that pursue strategies divergent in one or more ways from conventional practice in the broader bond-fund universe. Morningstar category averages are equal-weighted returns based on constituents of the category at the end of the period. Results assume reinvestment of all dividends and capital gains. An investment cannot be made directly in an index. |
The footnotes on the preceding page are an integral part of the table and graph and should be carefully read in conjunction with them.
| | |
| 6 | | MainStay Unconstrained Bond Fund |
Cost in Dollars of a $1,000 Investment in MainStay Unconstrained Bond Fund (Unaudited)
The example below is intended to describe the fees and expenses borne by shareholders during the six-month period from May 1, 2017, to October 31, 2017, and the impact of those costs on your investment.
Example
As a shareholder of the Fund you incur two types of costs: (1) transaction costs, including exchange fees and sales charges (loads) on purchases (as applicable), and (2) ongoing costs, including management fees, distribution and/or service (12b-1) fees, and other Fund expenses (as applicable). This example is intended to help you understand your ongoing costs (in dollars) of investing in the Fund and to compare these costs with the ongoing costs of investing in other mutual funds. The example is based on an investment of $1,000 made at the beginning of the six-month period and held for the entire period from May 1, 2017, to October 31, 2017.
This example illustrates your Fund’s ongoing costs in two ways:
Actual Expenses
The second and third data columns in the table below provide information about actual account values and actual expenses. You may use the information in these columns, together with the amount you invested, to estimate the expenses that you paid during the six months ended October 31, 2017. Simply divide your account value by $1,000 (for example, an $8,600 account value divided by $1,000 = 8.6), then
multiply the result by the number under the heading entitled “Expenses Paid During Period” to estimate the expenses you paid on your account during this period.
Hypothetical Example for Comparison Purposes
The fourth and fifth data columns in the table below provide information about hypothetical account values and hypothetical expenses based on the Fund’s actual expense ratio and an assumed rate of return of 5% per year before expenses, which is not the Fund’s actual return. The hypothetical account values and expenses may not be used to estimate the actual ending account balances or expenses you paid for the six-month period shown. You may use this information to compare the ongoing costs of investing in the Fund with the ongoing costs of investing in other mutual funds. To do so, compare this 5% hypothetical example with the 5% hypothetical examples that appear in the shareholder reports of the other mutual funds.
Please note that the expenses shown in the table are meant to highlight your ongoing costs only and do not reflect any transactional costs, such as exchange fees or sales charges (loads). Therefore, the fourth and fifth data columns of the table are useful in comparing ongoing costs only and will not help you determine the relative total costs of owning different funds. In addition, if these transactional costs were included, your costs would have been higher.
| | | | | | | | | | | | | | | | | | | | | | |
| | | | | | | | | | | | | | | | | | |
| Share Class | | Beginning
Account
Value
5/1/17 | | | Ending Account
Value (Based
on Actual
Returns and
Expenses)
10/31/17 | | | Expenses
Paid
During
Period1 | | | Ending Account
Value (Based
on Hypothetical
5% Annualized
Return and
Actual Expenses)
10/31/17 | | | Expenses
Paid
During
Period1 | | | Net Expense
Ratio
During
Period2 |
| | | | | | |
| Class A Shares | | $ | 1,000.00 | | | $ | 1,021.50 | | | $ | 5.76 | | | $ | 1,019.50 | | | $ | 5.75 | | | 1.13% |
| | | | | | |
| Investor Class Shares | | $ | 1,000.00 | | | $ | 1,021.20 | | | $ | 5.86 | | | $ | 1,019.40 | | | $ | 5.85 | | | 1.15% |
| | | | | | |
| Class B Shares | | $ | 1,000.00 | | | $ | 1,017.60 | | | $ | 9.66 | | | $ | 1,015.60 | | | $ | 9.65 | | | 1.90% |
| | | | | | |
| Class C Shares | | $ | 1,000.00 | | | $ | 1,017.60 | | | $ | 9.66 | | | $ | 1,015.60 | | | $ | 9.65 | | | 1.90% |
| | | | | | |
| Class I Shares | | $ | 1,000.00 | | | $ | 1,022.80 | | | $ | 4.49 | | | $ | 1,020.80 | | | $ | 4.48 | | | 0.88% |
| | | | | | |
| Class R2 Shares | | $ | 1,000.00 | | | $ | 1,022.10 | | | $ | 6.27 | | | $ | 1,019.00 | | | $ | 6.26 | | | 1.23% |
| | | | | | |
| Class R3 Shares | | $ | 1,000.00 | | | $ | 1,019.70 | | | $ | 7.48 | | | $ | 1,017.80 | | | $ | 7.48 | | | 1.47% |
| 1. | Expenses are equal to the Fund’s annualized expense ratio of each class multiplied by the average account value over the period, divided by 365 and multiplied by 184 (to reflect the six-month period). The table above represents the actual expenses incurred during the six-month period. |
| 2. | Expenses are equal to the Fund’s annualized expense ratio to reflect the six-month period. |
Portfolio Composition as of October 31, 2017 (Unaudited)
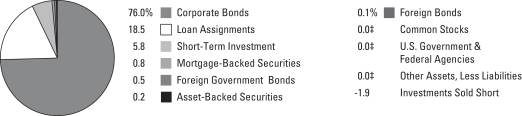
See Portfolio of Investments beginning on page 11 for specific holdings within these categories.
| ‡ | Less than one-tenth of a percent. |
Top Ten Holdings or Issuers Held as of October 31, 2017 (excluding short-term investment) (Unaudited)
| 1. | Goldman Sachs Group, Inc., 2.35%–5.25%, due 7/27/21–6/5/23 |
| 2. | Bank of America Corp., 3.248%–8.57%, due 6/1/19–12/29/49 |
| 3. | Morgan Stanley, 3.625%–5.45%, due 11/1/22–12/31/49 |
| 4. | PepsiCo, Inc., 1.35%–2.00%, due 5/2/19–4/15/21 |
| 5. | Kreditanstalt fuer Wiederaufbau, 1.50%, due 2/6/19 |
| 6. | Microsoft Corp., 1.10%–1.85%, due 8/8/19–2/6/20 |
| 7. | Liberty Mutual Group, Inc., 6.50%–10.75%, due 3/15/35–6/15/88 |
| 8. | Amazon.com, Inc., 1.20%–3.875%, due 11/29/17–8/22/37 |
| 9. | Citigroup, Inc., 6.30%, due 12/29/49 |
| 10. | Quikrete Holdings, Inc., 3.992%, due 11/15/23 |
| | |
| 8 | | MainStay Unconstrained Bond Fund |
Portfolio Management Discussion and Analysis (Unaudited)
Questions answered by portfolio managers Dan Roberts, PhD, Michael Kimble, CFA, and Louis N. Cohen, CFA, of MacKay Shields LLC, the Fund’s Subadvisor.
How did MainStay Unconstrained Bond Fund perform relative to its benchmarks and peers during the 12 months ended October 31, 2017?
Excluding all sales charges, MainStay Unconstrained Bond Fund returned 4.65% for Class A shares, 4.59% for Investor Class shares and 3.86% for Class B and Class C shares for the 12 months ended October 31, 2017. Over the same period, the Fund returned 4.90% for Class I shares, 4.54% for Class R2 shares and 4.28% for Class R3 shares. For the 12 months ended October 31, 2017, all share classes outperformed the 0.90% return of the Bloomberg Barclays U.S. Aggregate Bond Index,1 which is the Fund’s primary benchmark, and the 1.06% return of the ICE BofA Merrill Lynch U.S. Dollar 3-Month LIBOR Constant Maturity Index,1 which is the Fund’s secondary benchmark. For the 12 months ended October 31, 2017, Class A, Investor Class, Class I and Class R2 shares outperformed—and all other share classes underperformed—the 4.51% return of the Morningstar Nontraditional Bond Category Average,2 which is an additional benchmark of the Fund. See page 5 for Fund returns with applicable sales charges.
What factors affected the Fund’s relative performance during the reporting period?
The Fund’s outperformance relative to the Bloomberg Barclays U.S. Aggregate Bond Index resulted primarily from the Fund’s overweight position in spread product3—specifically high-yield corporate bonds, investment-grade corporate bonds and, to a lesser extent, bank loans—as credit spreads tightened during the reporting period. Most industries held in the Fund generated positive returns, with financials, basic industry, capital goods and technology being the primary contributors to the Fund’s relative performance. (Contributions take weightings and total returns into account.) Throughout the reporting period, our strategy was to maintain overweight positions in spread products. The Fund’s allocation to high-yield corporate bonds was reduced in favor of investment-grade corporate bonds, as spreads continued to narrow during the reporting period. U.S. Treasury yields rose across the maturity spectrum during the reporting period. This benefited the Fund, which held an underweight position relative to the Index in U.S. Treasury securities. The Fund’s duration4 was shorter than that of the Bloomberg Barclays U.S. Aggregate Bond Index during the reporting period, so the Fund was less sensitive than its benchmark to rising U.S. Treasury yields. The Fund’s shorter-duration profile, which was
achieved by shorting the front end of the yield curve with U.S. Treasury futures and swaps, contributed positively to the Fund’s performance relative to its longer-duration benchmark.
What was the Fund’s duration strategy during the reporting period?
To reduce the Fund’s sensitivity to interest rates, we maintained a duration that was significantly shorter than that of the Bloomberg Barclays U.S. Aggregate Bond Index. At the end of the reporting period, the Fund’s duration was 1.2 years.
What specific factors, risks or market forces prompted significant decisions for the Fund during the reporting period?
Throughout the reporting period we promoted credit risk as the principal driver of performance. We expected credit (investment-grade corporate bonds, high-yield corporate bonds and bank loans) to have returns superior to those of government-related debt because a low-interest-rate environment could spark healthy demand for higher-yielding products. While we continued to believe that credit spreads could tighten modestly, we reduced the Fund’s exposure to high-yield credits in favor of investment-grade credits as spreads continued to tighten.
During the reporting period we also selectively and rather moderately added to the Fund’s weighting in emerging-market debt, with a focus on quasi-sovereigns in stable regimes such as Mexico as well as hard-currency corporate bonds that provided a margin of safety. Valuations generally remained fair across the credit sectors, but we believe that greater vigilance may be needed as we navigate the late stages of the current economic cycle.
Which sectors were the strongest contributors to the Fund’s performance and which sectors were particularly weak?
During the reporting period the Fund’s position in high-yield corporate bonds was the most substantial positive contributor to performance, on an absolute and a relative basis. An overweight position in investment-grade corporate bonds, as well as the Fund’s emerging-market exposure, contributed positively to returns. Within the Fund’s credit sleeves, financial services, basic industry and technology were the top-performing sectors, while retail lagged the overall market.
| 1. | See footnote on page 6 for more information about this index. |
| 2. | See footnote on page 6 for more information on Morningstar Nontraditional Bond Category Average. |
| 3. | The terms “spread” and “yield spread” may refer to the difference in yield between a security or type of security and comparable U.S. Treasury issues. The terms may also refer to the difference in yield between two specific securities or types of securities at a given time. The term “spread product” refers to asset classes that typically trade at a spread to comparable U.S. Treasury securities. The term “credit spread” typically refers to the difference in yield between corporate or municipal bonds (or a specific category of these bonds) and comparable U.S. Treasury issues. |
| 4. | Duration is a measure of the price sensitivity of a fixed-income investment to changes in interest rates. Duration is expressed as a number of years and is considered a more accurate sensitivity gauge than average maturity. |
Along with the Fund’s overweight position in credit came an underweight position in market sectors that was more sensitive to interest rates, like U.S. Treasury securities and mortgage-backed securities. Both of these sectors were negatively affected by higher interest rates, so the Fund’s underweight positions relative to the Bloomberg Barclays U.S. Aggregate Bond Index helped relative performance during the reporting period.
Did the Fund make any significant purchases or sales during the reporting period?
During the reporting period we purchased bonds in Mexico-based chemical/petrochemical company Mexichem and storage/information management company Iron Mountain. Both bonds were new issues with attractive coupons, and the companies have been consistent cash generators. We sold positions in kidney dialysis center operator Fresenius Medical Care and aircraft leasing company Aviation Capital Group as we identified opportunities in the marketplace that were more attractive.
How did the Fund’s sector weightings change during the reporting period?
During the reporting period, we trimmed the Fund’s allocation to high-yield corporate bonds as credit spreads narrowed. Over the same period, we added to the Fund’s investment-grade corporate bond allocation and, to a lesser degree, increased the Fund’s weighting in emerging-market debt. The Fund’s weighting in bank loans remained flat throughout the reporting period. The Fund’s exposure to commercial mortgage-backed securities declined, as we elected not to reinvest paydowns back into the sector.
How was the Fund positioned at the end of the reporting period?
As of October 31, 2017, the Fund remained overweight relative to the Bloomberg Barclays U.S. Aggregate Bond Index in high-yield and investment-grade corporate bonds. At the end of the reporting period, the Fund was underweight relative to the Index in U.S. Treasury securities, agency debentures, mortgage-backed securities and asset-backed securities.
The opinions expressed are those of the portfolio managers as of the date of this report and are subject to change. There is no guarantee that any forecasts will come to pass. This material does not constitute investment advice and is not intended as an endorsement of any specific investment.
| | |
| 10 | | MainStay Unconstrained Bond Fund |
Portfolio of Investments October 31, 2017
| | | | | | | | |
| | | Principal
Amount | | | Value | |
Long-Term Bonds 96.1%† Asset-Backed Securities 0.2% | |
Home Equity 0.2% | | | | | | | | |
Carrington Mortgage Loan Trust Series 2006-NC4, Class A5
1.298% (1-month USD-LIBOR-BBA + 0.06%), due 10/25/36 (a) | | $ | 43,852 | | | $ | 43,717 | |
First NLC Trust
Series 2007-1, Class A1
1.308% (1-month USD-LIBOR-BBA + 0.07%), due 8/25/37 (a)(b) | | | 348,859 | | | | 221,809 | |
Home Equity Loan Trust Series 2007-FRE1, Class 2AV1 1.368% (1-month USD-LIBOR-BBA + 0.13%), due 4/25/37 (a) | | | 9,044 | | | | 9,040 | |
HSI Asset Securitization Corp. Trust Series 2007-NC1, Class A1
1.338% (1-month USD-LIBOR-BBA + 0.10%), due 4/25/37 (a) | | | 3,331 | | | | 2,331 | |
JPMorgan Mortgage Acquisition Trust Series 2007-HE1, Class AF1
1.338% (1-month USD-LIBOR-BBA + 0.10%), due 3/25/47 (a) | | | 133,028 | | | | 88,469 | |
MASTR Asset-Backed Securities Trust Series 2006-HE4, Class A1
1.288% (1-month USD-LIBOR-BBA + 0.05%), due 11/25/36 (a) | | | 91,170 | | | | 45,294 | |
Morgan Stanley ABS Capital I, Inc. (a) | | | | | | | | |
Series 2006-HE6, Class A2B
1.338% (1-month USD-LIBOR-BBA + 0.10%), due 9/25/36 | | | 330,081 | | | | 173,941 | |
Series 2006-HE8, Class A2B
1.338% (1-month USD-LIBOR-BBA + 0.10%), due 10/25/36 | | | 166,383 | | | | 97,129 | |
Series 2007-HE4, Class A2A
1.348% (1-month USD-LIBOR-BBA + 0.11%), due 2/25/37 | | | 90,575 | | | | 43,951 | |
Series 2007-NC2, Class A2FP
1.388% (1-month USD-LIBOR-BBA + 0.15%), due 2/25/37 | | | 338,388 | | | | 216,995 | |
Securitized Asset-Backed Receivables LLC Trust
Series 2007-BR4, Class A2A
1.328% (1-month USD-LIBOR-BBA + 0.09%), due 5/25/37 (a) | | | 384,775 | | | | 267,457 | |
Soundview Home Loan Trust (a) | | | | | | | | |
Series 2007-OPT1, Class 2A1
1.318% (1-month USD-LIBOR-BBA + 0.08%), due 6/25/37 | | | 338,101 | | | | 242,920 | |
| | | | | | | | |
| | | Principal
Amount | | | Value | |
Home Equity (continued) | |
Soundview Home Loan Trust (continued) | |
Series 2006-EQ2, Class A2
1.348% (1-month USD-LIBOR-BBA + 0.11%), due 1/25/37 | | $ | 201,639 | | | $ | 146,351 | |
Specialty Underwriting & Residential Finance Trust
Series 2006-BC4, Class A2B
1.348% (1-month USD-LIBOR-BBA + 0.11%), due 9/25/37 (a) | | | 877,155 | | | | 422,566 | |
| | | | | | | | |
| | | | | | | 2,021,970 | |
| | | | | | | | |
Student Loans 0.0%‡ | |
KeyCorp Student Loan Trust Series 2000-A, Class A2
1.637% (3-month USD-LIBOR-BBA + 0.32%), due 5/25/29 (a) | | | 579,680 | | | | 576,559 | |
| | | | | | | | |
Total Asset-Backed Securities (Cost $3,314,008) | | | | | | | 2,598,529 | |
| | | | | | | | |
|
| Corporate Bonds 76.0% | |
Advertising 0.2% | |
Lamar Media Corp.
5.375%, due 1/15/24 (c) | | | 2,695,000 | | | | 2,829,750 | |
| | | | | | | | |
|
Aerospace & Defense 1.2% | |
Moog, Inc.
5.25%, due 12/1/22 (b) | | | 5,505,000 | | | | 5,711,437 | |
Orbital ATK, Inc. (c) | | | | | | | | |
5.25%, due 10/1/21 | | | 2,250,000 | | | | 2,314,688 | |
5.50%, due 10/1/23 | | | 4,045,000 | | | | 4,305,397 | |
Rockwell Collins, Inc.
3.50%, due 3/15/27 | | | 3,350,000 | | | | 3,438,505 | |
| | | | | | | | |
| | | | | | | 15,770,027 | |
| | | | | | | | |
Agriculture 0.6% | |
Philip Morris International, Inc.
1.625%, due 2/21/19 | | | 8,215,000 | | | | 8,197,886 | |
| | | | | | | | |
|
Airlines 1.5% | |
Continental Airlines, Inc. | | | | | | | | |
Series 2007-1, Class A
5.983%, due 10/19/23 | | | 2,796,697 | | | | 3,092,895 | |
Series 2003-ERJ-1
7.875%, due 1/2/20 | | | 72,996 | | | | 74,164 | |
Series 2005-ERJ1
9.798%, due 10/1/22 | | | 311,778 | | | | 342,176 | |
Delta Air Lines, Inc. | | | | | | | | |
Series 2011-1, Class A
5.30%, due 10/15/20 | | | 725,496 | | | | 755,459 | |
Series 2007-1, Class A
6.821%, due 2/10/24 | | | 1,428,621 | | | | 1,644,771 | |
| † | Percentages indicated are based on Fund net assets. |
| ¨ | | Among the Fund’s 10 largest holdings or issuers held, as of October 31, 2017, excluding short-term investment. May be subject to change daily. (Unaudited) |
| | | | | | |
The notes to the financial statements are an integral part of,
and should be read in conjunction with, the financial statements. | | | | | 11 | |
Portfolio of Investments October 31, 2017 (continued)
| | | | | | | | |
| | | Principal
Amount | | | Value | |
| Corporate Bonds (continued) | |
Airlines (continued) | |
U.S. Airways Group, Inc. | | | | | | | | |
Series 2012-1, Class A
5.90%, due 4/1/26 | | $ | 2,101,345 | | | $ | 2,365,400 | |
Series 2010-1, Class A
6.25%, due 10/22/24 | | | 5,948,753 | | | | 6,647,731 | |
United Airlines, Inc.
Series 2014-2, Class B
4.625%, due 3/3/24 | | | 5,016,968 | | | | 5,199,586 | |
| | | | | | | | |
| | | | | | | 20,122,182 | |
| | | | | | | | |
Auto Manufacturers 2.4% | |
Daimler Finance North America LLC
2.30%, due 1/6/20 (b) | | | 6,950,000 | | | | 6,977,978 | |
Ford Holdings LLC
9.30%, due 3/1/30 | | | 93,000 | | | | 131,251 | |
Ford Motor Co. | | | | | | | | |
7.45%, due 7/16/31 | | | 39,000 | | | | 50,657 | |
8.90%, due 1/15/32 | | | 3,009,000 | | | | 4,157,561 | |
Ford Motor Credit Co. LLC
2.681%, due 1/9/20 | | | 3,345,000 | | | | 3,374,302 | |
General Motors Co.
5.15%, due 4/1/38 | | | 2,620,000 | | | | 2,724,865 | |
General Motors Financial Co., Inc.
3.45%, due 4/10/22 | | | 8,590,000 | | | | 8,781,868 | |
Toyota Motor Credit Corp.
1.95%, due 4/17/20 | | | 5,700,000 | | | | 5,702,267 | |
| | | | | | | | |
| | | | | | | 31,900,749 | |
| | | | | | | | |
Auto Parts & Equipment 0.5% | |
Schaeffler Finance B.V.
4.75%, due 5/15/23 (b) | | | 6,490,000 | | | | 6,676,587 | |
| | | | | | | | |
|
Banks 16.4% | |
¨Bank of America Corp. | | | | | | | | |
3.248%, due 10/21/27 | | | 5,170,000 | | | | 5,088,570 | |
3.30%, due 1/11/23 | | | 510,000 | | | | 522,438 | |
4.25%, due 10/22/26 | | | 7,260,000 | | | | 7,622,647 | |
5.125%, due 6/17/19 (d)(e) | | | 4,990,000 | | | | 5,108,513 | |
5.625%, due 7/1/20 | | | 1,720,000 | | | | 1,866,471 | |
6.11%, due 1/29/37 | | | 2,807,000 | | | | 3,529,684 | |
6.30%, due 3/10/26 (d)(e) | | | 3,570,000 | | | | 4,067,230 | |
7.625%, due 6/1/19 | | | 5,420,000 | | | | 5,878,650 | |
8.57%, due 11/15/24 | | | 1,645,000 | | | | 2,116,614 | |
Bank of New York Mellon Corp. | | | | | | | | |
2.661% (3-month USD-LIBOR-BBA + 0.634%), due 5/16/23 (a) | | | 4,660,000 | | | | 4,666,628 | |
4.625%, due 9/20/26 (d)(e) | | | 5,050,000 | | | | 5,195,187 | |
Barclays Bank PLC
5.14%, due 10/14/20 | | | 8,037,000 | | | | 8,586,409 | |
BB&T Corp.
2.75%, due 4/1/22 | | | 6,370,000 | | | | 6,453,280 | |
| | | | | | | | |
| | | Principal
Amount | | | Value | |
Banks (continued) | |
Capital One Financial Corp. | | | | | | | | |
4.20%, due 10/29/25 | | $ | 800,000 | | | $ | 824,839 | |
5.55%, due 6/01/20 (c)(d)(e) | | | 1,535,000 | | | | 1,609,831 | |
¨Citigroup, Inc.
6.30%, due 5/15/24 (d)(e) | | | 10,800,000 | | | | 11,740,032 | |
Citizens Financial Group, Inc.
4.15%, due 9/28/22 (b) | | | 2,270,000 | | | | 2,360,139 | |
¨Goldman Sachs Group, Inc. | | | | | | | | |
2.35%, due 11/15/21 | | | 12,990,000 | | | | 12,866,106 | |
2.908% (3-month USD-LIBOR-BBA + 1.053%), due 6/5/23 (a) | | | 4,285,000 | | | | 4,276,855 | |
3.00%, due 4/26/22 | | | 7,000,000 | | | | 7,067,518 | |
3.625%, due 1/22/23 | | | 7,257,000 | | | | 7,506,270 | |
5.25%, due 7/27/21 | | | 6,047,000 | | | | 6,624,739 | |
JPMorgan Chase & Co.
6.125%, due 4/30/24 (d)(e) | | | 7,595,000 | | | | 8,430,450 | |
¨Kreditanstalt fuer Wiederaufbau
1.50%, due 2/6/19 | | | 12,800,000 | | | | 12,770,627 | |
¨Morgan Stanley | | | | | | | | |
3.625%, due 1/20/27 | | | 6,055,000 | | | | 6,165,555 | |
3.70%, due 10/23/24 | | | 6,700,000 | | | | 6,960,714 | |
4.00%, due 7/23/25 | | | 1,920,000 | | | | 2,021,923 | |
4.875%, due 11/1/22 | | | 4,287,000 | | | | 4,642,322 | |
5.00%, due 11/24/25 | | | 2,465,000 | | | | 2,688,856 | |
5.45%, due 7/15/19 (d)(e) | | | 11,425,000 | | | | 11,847,725 | |
PNC Bank N.A.
3.10%, due 10/25/27 | | | 3,925,000 | | | | 3,903,085 | |
Royal Bank of Canada
2.50%, due 1/19/21 | | | 5,565,000 | | | | 5,617,097 | |
Royal Bank of Scotland Group PLC
5.125%, due 5/28/24 (c) | | | 8,746,000 | | | | 9,358,364 | |
Santander Holdings USA, Inc. (b) | | | | | | | | |
3.70%, due 3/28/22 | | | 2,000,000 | | | | 2,046,371 | |
4.40%, due 7/13/27 | | | 1,445,000 | | | | 1,483,885 | |
Santander UK Group Holdings PLC
3.571%, due 1/10/23 | | | 2,650,000 | | | | 2,705,800 | |
Toronto-Dominion Bank
1.80%, due 7/13/21 | | | 6,995,000 | | | | 6,873,391 | |
U.S. Bank N.A. | | | | | | | | |
1.40%, due 4/26/19 | | | 3,730,000 | | | | 3,710,980 | |
2.00%, due 1/24/20 | | | 3,205,000 | | | | 3,208,416 | |
US Bancorp
2.20%, due 4/25/19 | | | 3,410,000 | | | | 3,429,265 | |
Wells Fargo & Co. | | | | | | | | |
3.584% (3-month USD-LIBOR-BBA + 1.31%), due 5/22/28 (a) | | | 2,145,000 | | | | 2,165,448 | |
5.90%, due 6/15/24 (d)(e) | | | 3,690,000 | | | | 4,046,270 | |
Wells Fargo Capital X
5.95%, due 12/1/86 | | | 1,490,000 | | | | 1,676,250 | |
| | | | | | | | |
| | | | | | | 221,331,444 | |
| | | | | | | | |
| | | | |
| 12 | | MainStay Unconstrained Bond Fund | | The notes to the financial statements are an integral part of,
and should be read in conjunction with, the financial statements. |
| | | | | | | | |
| | | Principal
Amount | | | Value | |
| Corporate Bonds (continued) | |
Beverages 1.9% | |
Constellation Brands, Inc.
4.75%, due 11/15/24 | | $ | 6,765,000 | | | $ | 7,440,286 | |
Dr Pepper Snapple Group, Inc.
3.20%, due 11/15/21 | | | 4,768,000 | | | | 4,887,484 | |
¨PepsiCo, Inc. | | | | | | | | |
1.35%, due 10/4/19 | | | 7,170,000 | | | | 7,117,892 | |
1.55%, due 5/2/19 | | | 2,050,000 | | | | 2,045,026 | |
2.00%, due 4/15/21 | | | 4,040,000 | | | | 4,029,088 | |
| | | | | | | | |
| | | | | | | 25,519,776 | |
| | | | | | | | |
Building Materials 1.1% | |
Masco Corp. | | | | | | | | |
4.45%, due 4/1/25 | | | 5,116,000 | | | | 5,482,766 | |
7.125%, due 3/15/20 | | | 290,000 | | | | 320,256 | |
Standard Industries, Inc.
5.375%, due 11/15/24 (b) | | | 8,400,000 | | | | 8,861,160 | |
| | | | | | | | |
| | | | | | | 14,664,182 | |
| | | | | | | | |
Chemicals 1.8% | |
Air Liquide Finance S.A. (b) | | | | | | | | |
1.375%, due 9/27/19 | | | 4,135,000 | | | | 4,084,367 | |
1.75%, due 9/27/21 | | | 2,785,000 | | | | 2,719,335 | |
Ashland LLC
4.75%, due 8/15/22 (c) | | | 2,970,000 | | | | 3,133,944 | |
Braskem Netherlands Finance B.V. (b) | | | | | | | | |
3.50%, due 1/10/23 | | | 1,870,000 | | | | 1,869,439 | |
4.50%, due 1/10/28 | | | 2,505,000 | | | | 2,493,226 | |
Dow Chemical Co.
8.55%, due 5/15/19 | | | 693,000 | | | | 760,964 | |
Mexichem S.A.B. de C.V.
4.00%, due 10/4/27 (b) | | | 2,600,000 | | | | 2,598,700 | |
WR Grace & Co-Conn
5.125%, due 10/1/21 (b) | | | 6,410,000 | | | | 6,890,750 | |
| | | | | | | | |
| | | | | | | 24,550,725 | |
| | | | | | | | |
Commercial Services 0.3% | |
Service Corp. International (c) | | | | | | | | |
5.375%, due 1/15/22 | | | 1,835,000 | | | | 1,885,463 | |
5.375%, due 5/15/24 | | | 2,200,000 | | | | 2,321,000 | |
| | | | | | | | |
| | | | | | | 4,206,463 | |
| | | | | | | | |
Computers 0.8% | |
Apple, Inc.
1.55%, due 2/8/19 | | | 6,765,000 | | | | 6,759,682 | |
International Business Machines Corp.
1.90%, due 1/27/20 | | | 4,500,000 | | | | 4,508,328 | |
| | | | | | | | |
| | | | | | | 11,268,010 | |
| | | | | | | | |
Cosmetics & Personal Care 0.5% | |
Estee Lauder Cos., Inc.
1.80%, due 2/7/20 | | | 2,785,000 | | | | 2,778,910 | |
| | | | | | | | |
| | | Principal
Amount | | | Value | |
Cosmetics & Personal Care (continued) | |
Unilever Capital Corp.
1.80%, due 5/5/20 | | $ | 4,500,000 | | | $ | 4,488,995 | |
| | | | | | | | |
| | | | | | | 7,267,905 | |
| | | | | | | | |
Diversified Financial Services 2.4% | |
AerCap Ireland Capital DAC / AerCap Global Aviation Trust | | | | | | | | |
3.50%, due 5/26/22 | | | 4,430,000 | | | | 4,551,933 | |
4.50%, due 5/15/21 | | | 1,465,000 | | | | 1,555,818 | |
Air Lease Corp. | | | | | | | | |
2.125%, due 1/15/20 | | | 3,275,000 | | | | 3,271,414 | |
2.625%, due 7/1/22 | | | 2,040,000 | | | | 2,032,290 | |
Capital One Bank USA N.A.
3.375%, due 2/15/23 | | | 3,000,000 | | | | 3,050,149 | |
GE Capital International Funding Co.
2.342%, due 11/15/20 | | | 6,800,000 | | | | 6,833,660 | |
Peachtree Corners Funding Trust
3.976%, due 2/15/25 (b) | | | 1,690,000 | | | | 1,723,093 | |
Protective Life Global Funding (b) | | | | | | | | |
1.555%, due 9/13/19 | | | 4,200,000 | | | | 4,162,662 | |
2.161%, due 9/25/20 | | | 1,355,000 | | | | 1,348,975 | |
Springleaf Finance Corp.
6.00%, due 6/1/20 (c) | | | 3,100,000 | | | | 3,251,125 | |
| | | | | | | | |
| | | | | | | 31,781,119 | |
| | | | | | | | |
Electric 4.2% | |
Appalachian Power Co.
3.30%, due 6/1/27 | | | 1,800,000 | | | | 1,814,963 | |
Baltimore Gas & Electric Co.
2.40%, due 8/15/26 | | | 4,150,000 | | | | 3,943,003 | |
CMS Energy Corp. | | | | | | | | |
3.875%, due 3/1/24 | | | 3,818,000 | | | | 4,013,560 | |
6.25%, due 2/1/20 | | | 1,980,000 | | | | 2,150,238 | |
Consolidated Edison, Inc.
2.00%, due 3/15/20 | | | 2,815,000 | | | | 2,815,349 | |
Entergy Arkansas, Inc.
3.50%, due 4/1/26 | | | 1,235,000 | | | | 1,277,287 | |
FirstEnergy Transmission LLC
5.45%, due 7/15/44 (b) | | | 5,533,000 | | | | 6,399,985 | |
Florida Power & Light Co.
2.75%, due 6/1/23 | | | 2,680,000 | | | | 2,715,042 | |
Great Plains Energy, Inc. | | | | | | | | |
4.85%, due 6/1/21 | | | 5,200,000 | | | | 5,525,156 | |
5.292%, due 6/15/22 (f) | | | 663,000 | | | | 726,552 | |
IPALCO Enterprises, Inc.
3.45%, due 7/15/20 | | | 8,560,000 | | | | 8,677,700 | |
MidAmerican Energy Co.
3.10%, due 5/1/27 | | | 6,000,000 | | | | 6,044,759 | |
Potomac Electric Power Co.
4.15%, due 3/15/43 | | | 1,305,000 | | | | 1,394,396 | |
Public Service Electric & Gas Co.
3.00%, due 5/15/27 | | | 3,405,000 | | | | 3,407,687 | |
| | | | | | |
The notes to the financial statements are an integral part of,
and should be read in conjunction with, the financial statements. | | | | | 13 | |
Portfolio of Investments October 31, 2017 (continued)
| | | | | | | | |
| | | Principal
Amount | | | Value | |
| Corporate Bonds (continued) | |
Electric (continued) | |
WEC Energy Group, Inc. 3.428% (3-month USD-LIBOR-BBA + 2.113%), due 5/15/67 (a) | | | $ 5,495,000 | | | $ | 5,290,037 | |
| | | | | | | | |
| | | | | | | 56,195,714 | |
| | | | | | | | |
Electronics 0.6% | |
Honeywell International, Inc.
1.40%, due 10/30/19 | | | 7,840,000 | | | | 7,795,863 | |
| | | | | | | | |
|
Environmental Controls 0.3% | |
Waste Management, Inc.
2.40%, due 5/15/23 | | | 3,880,000 | | | | 3,813,272 | |
| | | | | | | | |
|
Food 3.4% | |
J.M. Smucker Co.
1.75%, due 3/15/18 | | | 5,645,000 | | | | 5,649,813 | |
Kerry Group Financial Services
3.20%, due 4/9/23 (b) | | | 4,595,000 | | | | 4,586,570 | |
Kroger Co.
1.50%, due 9/30/19 | | | 4,130,000 | | | | 4,085,841 | |
Mondelez International Holdings Netherlands B.V. (b) | | | | | | | | |
1.625%, due 10/28/19 | | | 4,500,000 | | | | 4,455,284 | |
2.00%, due 10/28/21 | | | 4,885,000 | | | | 4,793,744 | |
Premier Foods Finance PLC
6.50%, due 3/15/21 (b) | | | GBP 4,500,000 | | | | 6,110,756 | |
Smithfield Foods, Inc. (b) | | | | | | | | |
2.70%, due 1/31/20 | | | $ 2,675,000 | | | | 2,682,465 | |
3.35%, due 2/1/22 | | | 2,490,000 | | | | 2,522,208 | |
Sysco Corp.
3.25%, due 7/15/27 | | | 5,240,000 | | | | 5,234,671 | |
Tyson Foods, Inc.
3.95%, due 8/15/24 | | | 5,450,000 | | | | 5,745,064 | |
| | | | | | | | |
| | | | | | | 45,866,416 | |
| | | | | | | | |
Forest Products & Paper 0.7% | |
Georgia-Pacific LLC | | | | | | | | |
5.40%, due 11/1/20 (b) | | | 4,375,000 | | | | 4,777,408 | |
8.00%, due 1/15/24 | | | 2,945,000 | | | | 3,786,534 | |
International Paper Co.
7.30%, due 11/15/39 | | | 693,000 | | | | 965,879 | |
| | | | | | | | |
| | | | | | | 9,529,821 | |
| | | | | | | | |
Gas 0.8% | |
AmeriGas Partners, L.P. / AmeriGas Finance Corp. (c) | | | | | | | | |
5.50%, due 5/20/25 | | | 2,825,000 | | | | 2,888,562 | |
5.625%, due 5/20/24 | | | 2,708,000 | | | | 2,853,555 | |
5.75%, due 5/20/27 | | | 1,890,000 | | | | 1,930,163 | |
| | | | | | | | |
| | | Principal
Amount | | | Value | |
Gas (continued) | |
NiSource Finance Corp.
3.49%, due 5/15/27 | | $ | 3,120,000 | | | $ | 3,162,841 | |
| | | | | | | | |
| | | | | | | 10,835,121 | |
| | | | | | | | |
Health Care—Products 0.9% | |
Becton Dickinson & Co.
3.363%, due 6/6/24 | | | 2,860,000 | | | | 2,883,798 | |
Medtronic Global Holdings SCA
1.70%, due 3/28/19 | | | 4,780,000 | | | | 4,775,058 | |
Stryker Corp.
2.625%, due 3/15/21 | | | 2,179,000 | | | | 2,199,565 | |
Zimmer Biomet Holdings, Inc.
2.70%, due 4/1/20 | | | 1,895,000 | | | | 1,911,232 | |
| | | | | | | | |
| | | | | | | 11,769,653 | |
| | | | | | | | |
Health Care—Services 0.4% | |
Laboratory Corp. of America Holdings
2.50%, due 11/1/18 | | | 5,500,000 | | | | 5,532,566 | |
| | | | | | | | |
|
Home Builders 3.8% | |
CalAtlantic Group, Inc. (c) | | | | | | | | |
6.25%, due 12/15/21 | | | 2,875,000 | | | | 3,184,063 | |
8.375%, due 1/15/21 | | | 4,560,000 | | | | 5,306,700 | |
D.R. Horton, Inc. | | | | | | | | |
3.75%, due 3/1/19 | | | 2,750,000 | | | | 2,794,618 | |
5.75%, due 8/15/23 | | | 4,250,000 | | | | 4,814,486 | |
KB Home
8.00%, due 3/15/20 (c) | | | 2,250,000 | | | | 2,503,125 | |
Lennar Corp. | | | | | | | | |
4.50%, due 6/15/19 | | | 3,300,000 | | | | 3,390,750 | |
4.50%, due 11/15/19 | | | 4,740,000 | | | | 4,888,125 | |
MDC Holdings, Inc. | | | | | | | | |
5.50%, due 1/15/24 | | | 7,025,000 | | | | 7,560,656 | |
5.625%, due 2/1/20 | | | 1,608,000 | | | | 1,726,590 | |
Meritage Homes Corp.
7.00%, due 4/1/22 (c) | | | 7,800,000 | | | | 8,892,000 | |
Toll Brothers Finance Corp.
5.875%, due 2/15/22 | | | 5,750,000 | | | | 6,375,312 | |
| | | | | | | | |
| | | | | | | 51,436,425 | |
| | | | | | | | |
Insurance 4.7% | |
Chubb Corp.
3.609% (3-month USD-LIBOR-BBA + 2.25%), due 3/29/67 (a) | | | 9,873,000 | | | | 9,823,635 | |
Jackson National Life Global Funding
2.20%, due 1/30/20 (b) | | | 2,830,000 | | | | 2,834,821 | |
¨Liberty Mutual Group, Inc. (b) | | | | | | | | |
6.50%, due 3/15/35 | | | 870,000 | | | | 1,104,837 | |
7.80%, due 3/7/87 | | | 7,453,000 | | | | 9,446,678 | |
10.75% (3-month USD-LIBOR-BBA + 7.12%), due 6/15/88 (a) | | | 938,000 | | | | 1,557,080 | |
| | | | |
| 14 | | MainStay Unconstrained Bond Fund | | The notes to the financial statements are an integral part of,
and should be read in conjunction with, the financial statements. |
| | | | | | | | |
| | | Principal
Amount | | | Value | |
| Corporate Bonds (continued) | |
Insurance (continued) | |
Lincoln National Corp.
3.672% (3-month USD-LIBOR-BBA + 2.358%), due 5/17/66 (a) | | | $ 3,537,000 | | | $ | 3,329,201 | |
MassMutual Global Funding II
2.50%, due 4/13/22 (b) | | | 3,600,000 | | | | 3,594,503 | |
Oil Insurance, Ltd.
4.317% (3-month USD-LIBOR-BBA + 2.982%), due 12/01/17 (a)(b)(d) | | | 5,727,000 | | | | 5,454,968 | |
Pricoa Global Funding I
2.55%, due 11/24/20 (b) | | | 2,725,000 | | | | 2,756,165 | |
Protective Life Corp.
8.45%, due 10/15/39 | | | 3,621,000 | | | | 5,381,064 | |
Provident Cos., Inc.
7.25%, due 3/15/28 | | | 2,960,000 | | | | 3,745,198 | |
Scottish Widows, Ltd.
Series Reg S
5.50%, due 6/16/23 | | | GBP 6,500,000 | | | | 9,734,646 | |
Voya Financial, Inc.
3.65%, due 6/15/26 | | | $ 1,240,000 | | | | 1,250,725 | |
XLIT, Ltd.
4.45%, due 3/31/25 | | | 2,600,000 | | | | 2,655,139 | |
| | | | | | | | |
| | | | | | | 62,668,660 | |
| | | | | | | | |
Internet 1.4% | |
¨Amazon.com, Inc. | | | | | | | | |
1.20%, due 11/29/17 | | | 6,364,000 | | | | 6,362,806 | |
3.875%, due 8/22/37 (b) | | | 5,250,000 | | | | 5,468,085 | |
Priceline Group, Inc.
3.60%, due 6/1/26 | | | 6,700,000 | | | | 6,848,116 | |
| | | | | | | | |
| | | | | | | 18,679,007 | |
| | | | | | | | |
Iron & Steel 1.0% | |
Steel Dynamics, Inc.
5.25%, due 4/15/23 | | | 7,666,000 | | | | 7,915,145 | |
Vale Overseas, Ltd.
6.25%, due 8/10/26 | | | 4,330,000 | | | | 4,989,242 | |
| | | | | | | | |
| | | | | | | 12,904,387 | |
| | | | | | | | |
Leisure Time 0.5% | |
Royal Caribbean Cruises, Ltd.
7.25%, due 3/15/18 | | | 6,115,000 | | | | 6,237,585 | |
| | | | | | | | |
|
Lodging 0.6% | |
Marriott International, Inc. | | | | | | | | |
6.75%, due 5/15/18 | | | 946,000 | | | | 970,990 | |
7.15%, due 12/1/19 | | | 2,341,000 | | | | 2,573,601 | |
Wyndham Worldwide Corp.
4.15%, due 4/1/24 | | | 4,160,000 | | | | 4,216,540 | |
| | | | | | | | |
| | | | | | | 7,761,131 | |
| | | | | | | | |
| | | | | | | | |
| | | Principal
Amount | | | Value | |
Machinery—Construction & Mining 0.5% | |
Caterpillar Financial Services Corp. (MTN)
2.10%, due 1/10/20 | | | $ 6,640,000 | | | $ | 6,668,419 | |
| | | | | | | | |
|
Media 0.9% | |
DISH DBS Corp.
4.25%, due 4/1/18 (c) | | | 3,350,000 | | | | 3,375,795 | |
Sky PLC
3.75%, due 9/16/24 (b) | | | 4,095,000 | | | | 4,216,990 | |
Time Warner Cos., Inc.
6.95%, due 1/15/28 | | | 3,035,000 | | | | 3,773,994 | |
Time Warner Entertainment Co., L.P.
8.375%, due 3/15/23 | | | 1,087,000 | | | | 1,349,396 | |
| | | | | | | | |
| | | | | | | 12,716,175 | |
| | | | | | | | |
Mining 0.3% | |
FMG Resources (August 2006) Pty, Ltd.
9.75%, due 3/1/22 (b) | | | 3,935,000 | | | | 4,397,363 | |
| | | | | | | | |
|
Miscellaneous—Manufacturing 1.7% | |
Amsted Industries, Inc.
5.00%, due 3/15/22 (b) | | | 7,860,000 | | | | 8,115,450 | |
Siemens Financieringsmaatschappij N.V. (b) | | | | | | | | |
2.15%, due 5/27/20 | | | 1,900,000 | | | | 1,907,010 | |
2.70%, due 3/16/22 | | | 3,320,000 | | | | 3,366,731 | |
Textron Financial Corp.
3.05% (3-month USD-LIBOR-BBA + 1.735%), due 2/15/67 (a)(b) | | | 11,250,000 | | | | 9,787,500 | |
| | | | | | | | |
| | | | | | | 23,176,691 | |
| | | | | | | | |
Oil & Gas 3.9% | |
Anadarko Petroleum Corp.
(zero coupon), due 10/10/36 | | | 19,735,000 | | | | 8,435,804 | |
Andeavor | |
5.125%, due 4/1/24 | | | 8,050,000 | | | | 8,482,531 | |
5.125%, due 12/15/26 (b) | | | 2,000,000 | | | | 2,215,931 | |
Chevron Corp.
1.686%, due 2/28/19 | | | 3,200,000 | | | | 3,199,480 | |
Murphy Oil USA, Inc.
6.00%, due 8/15/23 | | | 7,318,000 | | | | 7,674,753 | |
Petrobras Global Finance B.V.
7.375%, due 1/17/27 (c) | | | 9,350,000 | | | | 10,383,175 | |
Petroleos Mexicanos
6.75%, due 9/21/47 (b) | | | 8,225,000 | | | | 8,477,507 | |
QEP Resources, Inc.
5.375%, due 10/1/22 | | | 3,350,000 | | | | 3,324,875 | |
| | | | | | | | |
| | | | | | | 52,194,056 | |
| | | | | | | | |
Packaging & Containers 1.1% | |
Crown European Holdings S.A.
4.00%, due 7/15/22 (b) | | | EUR 7,700,000 | | | | 10,075,243 | |
| | | | | | |
The notes to the financial statements are an integral part of,
and should be read in conjunction with, the financial statements. | | | | | 15 | |
Portfolio of Investments October 31, 2017 (continued)
| | | | | | | | |
| | | Principal
Amount | | | Value | |
| Corporate Bonds (continued) | |
Packaging & Containers (continued) | |
WestRock Co.
3.00%, due 9/15/24 (b) | | | $ 2,735,000 | | | $ | 2,725,161 | |
WestRock MWV LLC
7.375%, due 9/1/19 | | | 1,800,000 | | | | 1,957,845 | |
| | | | | | | | |
| | | | | | | 14,758,249 | |
| | | | | | | | |
Pharmaceuticals 1.5% | |
Eli Lilly & Co.
2.35%, due 5/15/22 | | | 2,200,000 | | | | 2,208,562 | |
Endo Dac / Endo Finance LLC / Endo Finco, Inc.
6.00%, due 7/15/23 (b) | | | 3,865,000 | | | | 3,130,650 | |
Johnson & Johnson
2.25%, due 3/3/22 | | | 5,450,000 | | | | 5,472,406 | |
Pfizer, Inc.
1.20%, due 6/1/18 | | | 9,540,000 | | | | 9,525,618 | |
| | | | | | | | |
| | | | | | | 20,337,236 | |
| | | | | | | | |
Pipelines 1.2% | |
Andeavor Logistics, L.P. / Tesoro Logistics Finance Corp. | | | | | | | | |
5.875%, due 10/1/20 | | | 3,810,000 | | | | 3,876,675 | |
6.125%, due 10/15/21 | | | 3,500,000 | | | | 3,613,750 | |
Kinder Morgan, Inc. | | | | | | | | |
5.625%, due 11/15/23 (b) | | | 2,449,000 | | | | 2,732,472 | |
7.75%, due 1/15/32 | | | 2,035,000 | | | | 2,614,023 | |
Targa Resources Partners, L.P. / Targa Resources Partners Finance Corp.
5.25%, due 5/1/23 | | | 3,725,000 | | | | 3,832,094 | |
| | | | | | | | |
| | | | | | | 16,669,014 | |
| | | | | | | | |
Real Estate Investment Trusts 1.3% | |
Crown Castle International Corp. | | | | | | | | |
3.20%, due 9/1/24 | | | 5,715,000 | | | | 5,679,029 | |
5.25%, due 1/15/23 | | | 2,625,000 | | | | 2,905,330 | |
Digital Realty Trust, L.P.
3.70%, due 8/15/27 | | | 3,605,000 | | | | 3,651,990 | |
Host Hotels & Resorts, L.P.
3.75%, due 10/15/23 | | | 472,000 | | | | 485,252 | |
Iron Mountain, Inc. | | | | | | | | |
4.875%, due 9/15/27 (b) | | | 2,187,000 | | | | 2,215,015 | |
5.75%, due 8/15/24 (c) | | | 2,210,000 | | | | 2,265,250 | |
Ventas Realty, L.P. / Ventas Capital Corp.
2.70%, due 4/1/20 | | | 1,000 | | | | 1,009 | |
| | | | | | | | |
| | | | | | | 17,202,875 | |
| | | | | | | | |
Retail 2.8% | |
AutoZone, Inc.
3.75%, due 6/1/27 | | | 3,565,000 | | | | 3,615,289 | |
Brinker International, Inc.
2.60%, due 5/15/18 | | | 1,875,000 | | | | 1,875,000 | |
| | | | | | | | |
| | | Principal
Amount | | | Value | |
Retail (continued) | |
CK Hutchison International (17) II, Ltd.
3.25%, due 9/29/27 (b) | | $ | 3,855,000 | | | $ | 3,805,868 | |
CVS Pass-Through Trust
5.789%, due 1/10/26 (b)(g) | | | 56,479 | | | | 61,598 | |
Darden Restaurants, Inc.
3.85%, due 5/1/27 | | | 2,700,000 | | | | 2,757,005 | |
QVC, Inc.
4.85%, due 4/1/24 | | | 6,500,000 | | | | 6,837,133 | |
Starbucks Corp.
2.45%, due 6/15/26 | | | 4,279,000 | | | | 4,121,595 | |
Suburban Propane Partners, L.P. / Suburban Energy Finance Corp.
5.50%, due 6/1/24 (c) | | | 5,355,000 | | | | 5,328,225 | |
TJX Cos., Inc.
2.25%, due 9/15/26 | | | 10,505,000 | | | | 9,827,497 | |
| | | | | | | | |
| | | | | | | 38,229,210 | |
| | | | | | | | |
Semiconductors 1.4% | |
NXP B.V. / NXP Funding LLC (b) | | | | | | | | |
4.125%, due 6/1/21 | | | 6,300,000 | | | | 6,583,500 | |
4.625%, due 6/15/22 | | | 2,960,000 | | | | 3,170,900 | |
Sensata Technologies B.V.
5.00%, due 10/1/25 (b) | | | 8,700,000 | | | | 9,222,000 | |
| | | | | | | | |
| | | | | | | 18,976,400 | |
| | | | | | | | |
Software 1.0% | |
First Data Corp.
7.00%, due 12/1/23 (b) | | | 755,000 | | | | 807,865 | |
¨Microsoft Corp. | | | | | | | | |
1.10%, due 8/8/19 | | | 6,040,000 | | | | 5,977,392 | |
1.85%, due 2/6/20 | | | 6,190,000 | | | | 6,193,686 | |
| | | | | | | | |
| | | | | | | 12,978,943 | |
| | | | | | | | |
Telecommunications 3.1% | |
AT&T, Inc.
3.20%, due 3/1/22 | | | 5,840,000 | | | | 5,941,756 | |
Hughes Satellite Systems Corp.
6.50%, due 6/15/19 | | | 2,250,000 | | | | 2,382,188 | |
Rogers Communications, Inc.
3.625%, due 12/15/25 | | | 6,760,000 | | | | 6,945,311 | |
Sprint Capital Corp.
8.75%, due 3/15/32 (c) | | | 1,000,000 | | | | 1,212,500 | |
Sprint Spectrum Co. LLC / Sprint Spectrum Co. II LLC / Sprint Spectrum Co. III LLC
3.36%, due 3/20/23 (b) | | | 4,758,000 | | | | 4,826,991 | |
T-Mobile USA, Inc. (c) | | | | | | | | |
6.00%, due 3/1/23 | | | 3,000,000 | | | | 3,161,250 | |
6.125%, due 1/15/22 | | | 4,525,000 | | | | 4,706,000 | |
Telefonica Emisiones SAU | | | | | | | | |
4.103%, due 3/8/27 | | | 2,755,000 | | | | 2,838,321 | |
5.462%, due 2/16/21 | | | 1,000 | | | | 1,093 | |
| | | | |
| 16 | | MainStay Unconstrained Bond Fund | | The notes to the financial statements are an integral part of,
and should be read in conjunction with, the financial statements. |
| | | | | | | | |
| | | Principal
Amount | | | Value | |
| Corporate Bonds (continued) | |
Telecommunications (continued) | |
VEON Holdings B.V.
4.95%, due 6/16/24 (b) | | | $ 4,500,000 | | | $ | 4,604,670 | |
Verizon Communications, Inc. | | | | | | | | |
4.125%, due 3/16/27 | | | 685,000 | | | | 714,820 | |
5.15%, due 9/15/23 | | | 3,573,000 | | | | 4,004,599 | |
| | | | | | | | |
| | | | | | | 41,339,499 | |
| | | | | | | | |
Textiles 0.4% | |
Cintas Corp. No 2
2.90%, due 4/1/22 | | | 4,920,000 | | | | 4,996,516 | |
| | | | | | | | |
Total Corporate Bonds
(Cost $1,003,220,779) | | | | | | | 1,021,753,072 | |
| | | | | | | | |
|
| Foreign Bonds 0.1% | |
Barclays Bank PLC
Series Reg S
10.00%, due 5/21/21 | | | GBP 449,000 | | | | 754,334 | |
| | | | | | | | |
Total Foreign Bonds
(Cost $737,101) | | | | | | | 754,334 | |
| | | | | | | | |
|
| Foreign Government Bonds 0.5% | |
Portugal 0.5% | |
Portugal Government International Bond
5.125%, due 10/15/24 (b) | | | $ 6,387,000 | | | | 6,761,534 | |
| | | | | | | | |
Total Foreign Government Bonds
(Cost $6,541,722) | | | | | | | 6,761,534 | |
| | | | | | | | |
|
| Loan Assignments 18.5% (a) | |
Advertising 0.6% | |
Outfront Media Capital LLC
2017 Term Loan B
3.489% (1-month USD-LIBOR-BBA + 2.25%), due 3/18/24 | | | 7,878,750 | | | | 7,927,992 | |
| | | | | | | | |
|
Auto Manufacturers 0.3% | |
Navistar International Corp.
2017 Term Loan B
5.24% (1-month USD-LIBOR-BBA + 4.00%), due 8/7/20 | | | 4,402,632 | | | | 4,430,148 | |
| | | | | | | | |
|
Auto Parts & Equipment 0.7% | |
TI Group Automotive Systems LLC
2015 Term Loan
3.992% (1-month USD-LIBOR-BBA + 2.75%), due 6/30/22 | | | 8,836,082 | | | | 8,858,172 | |
| | | | | | | | |
| | | | | | | | |
| | | Principal
Amount | | | Value | |
Building Materials 1.4% | |
Builders FirstSource, Inc.
2017 Term Loan B
4.333% (3-month USD-LIBOR-BBA + 3.00%), due 2/29/24 | | $ | 2,709,422 | | | $ | 2,716,759 | |
Forterra Finance LLC
2017 Term Loan B
4.242% (1-month USD-LIBOR-BBA + 3.00%), due 10/25/23 | | | 5,041,044 | | | | 4,206,570 | |
¨Quikrete Holdings, Inc.
2016 1st Lien Term Loan
3.992% (1-month USD-LIBOR-BBA + 2.75%), due 11/15/23 | | | 11,612,250 | | | | 11,619,508 | |
| | | | | | | | |
| | | | | | | 18,542,837 | |
| | | | | | | | |
Chemicals 0.3% | |
Axalta Coating Systems U.S. Holdings, Inc. Term Loan
3.333% (3-month USD-LIBOR-BBA + 2.00%), due 6/1/24 | | | 4,647,492 | | | | 4,669,763 | |
| | | | | | | | |
|
Commercial Services 1.9% | |
USAGM HoldCo LLC
2015 2nd Lien Term Loan
9.88% (3-month USD-LIBOR-BBA + 8.50%), due 7/28/23 (h) | | | 8,750,000 | | | | 8,531,250 | |
Allied Universal Holdco LLC
2015 Term Loan
5.083% (3-month USD-LIBOR-BBA + 3.75%), due 7/28/22 | | | 8,618,750 | | | | 8,583,353 | |
Global Payments, Inc.
Term Loan B2
3.242% (1-month USD-LIBOR-BBA + 2.00%), due 4/21/23 | | | 2,562,125 | | | | 2,568,174 | |
KAR Auction Services, Inc.
Term Loan B4
3.625% (3-month USD-LIBOR-BBA + 2.25%), due 3/11/21 | | | 5,730,962 | | | | 5,757,227 | |
| | | | | | | | |
| | | | | | | 25,440,004 | |
| | | | | | | | |
Computers 0.3% | |
Tempo Acquisition LLC
Term Loan
4.242% (1-month USD-LIBOR-BBA + 3.00%), due 5/1/24 | | | 4,099,725 | | | | 4,109,122 | |
| | | | | | | | |
|
Containers, Packaging & Glass 0.8% | |
Berry Plastics Group, Inc.
Term Loan K
3.488% (1-month USD-LIBOR-BBA + 2.25%), due 2/8/20 | | | 3,921,569 | | | | 3,937,910 | |
| | | | | | |
The notes to the financial statements are an integral part of,
and should be read in conjunction with, the financial statements. | | | | | 17 | |
Portfolio of Investments October 31, 2017 (continued)
| | | | | | | | |
| | | Principal
Amount | | | Value | |
| Loan Assignments (continued) | |
Containers, Packaging & Glass (continued) | |
Reynolds Group Holdings, Inc.
USD 2017 Term Loan
3.992% (1-month USD-LIBOR-BBA + 2.75%), due 2/5/23 | | $ | 2,796,803 | | | $ | 2,811,626 | |
BWAY Holding Co., Inc.
2017 Term Loan B
4.522% (2-month USD-LIBOR-BBA + 3.25%), due 4/3/24 | | | 10,350 | | | | 10,376 | |
2017 Term Loan B
4.599% (3-month USD-LIBOR-BBA + 3.25%), due 4/3/24 | | | 4,119,300 | | | | 4,129,598 | |
| | | | | | | | |
| | | | | | | 10,889,510 | |
| | | | | | | | |
Electrical Components & Equipment 0.3% | |
Electro Rent Corp.
1st Lien Term Loan
6.272% (2-month USD-LIBOR-BBA + 5.00%), due 1/19/24 (h) | | | 3,314,950 | | | | 3,356,387 | |
| | | | | | | | |
|
Electronics 0.5% | |
Dell Inc.
2017 1st Lien Term Loan
3.25%, due 9/7/23 | | | 6,114,274 | | | | 6,128,447 | |
| | | | | | | | |
|
Entertainment 0.4% | |
Mohegan Tribal Gaming Authority
2016 Term Loan B
5.242% (1-month USD-LIBOR-BBA + 4.00%), due 10/13/23 | | | 2,977,500 | | | | 3,006,655 | |
Regal Cinemas Corp.
2017 Term Loan
3.242% (1-month USD-LIBOR-BBA + 2.00%), due 4/1/22 | | | 2,568,563 | | | | 2,564,995 | |
| | | | | | | | |
| | | | | | | 5,571,650 | |
| | | | | | | | |
Environmental Controls 0.9% | |
GFL Environmental, Inc.
Term Loan B
4.083% (3-month USD-LIBOR-BBA + 2.75%), due 9/29/23 | | | 5,940,000 | | | | 5,958,563 | |
Advanced Disposal Services, Inc.
Term Loan B3
3.953% (1-week USD-LIBOR-BBA + 2.75%), due 11/10/23 | | | 5,855,000 | | | | 5,901,354 | |
| | | | | | | | |
| | | | | | | 11,859,917 | |
| | | | | | | | |
Food 0.4% | |
Pinnacle Foods Finance LLC
2017 Term Loan B
3.232% (1-month USD-LIBOR-BBA + 2.00%), due 2/2/24 | | | 5,428,975 | | | | 5,451,370 | |
| | | | | | | | |
| | | | | | | | |
| | | Principal
Amount | | | Value | |
Food Services 0.1% | |
Aramark Services, Inc.
2017 USD Term Loan B
3.242% (1-month USD-LIBOR-BBA + 2.00%), due 3/28/24 | | $ | 1,867,668 | | | $ | 1,872,337 | |
| | | | | | | | |
|
Hand & Machine Tools 0.4% | |
Milacron LLC
Amended Term Loan B
4.242% (1-month USD-LIBOR-BBA + 3.00%), due 9/28/23 | | | 4,883,100 | | | | 4,903,448 | |
| | | | | | | | |
|
Health Care—Products 0.6% | |
Ortho-Clinical Diagnostics S.A.
Term Loan B
5.083% (3-month USD-LIBOR-BBA + 3.75%), due 6/30/21 | | | 7,272,963 | | | | 7,293,720 | |
Sterigenics-Nordion Holdings LLC
2017 Term Loan B
4.242% (1-month USD-LIBOR-BBA + 3.00%), due 5/15/22 | | | 980,075 | | | | 981,300 | |
| | | | | | | | |
| | | | | | | 8,275,020 | |
| | | | | | | | |
Health Care—Services 0.8% | |
INC Research LLC
2017 Term Loan B
3.492% (1-month USD-LIBOR-BBA + 2.25%), due 8/1/24 | | | 6,275,391 | | | | 6,306,767 | |
MPH Acquisition Holdings LLC
2016 Term Loan B
4.333% (3-month USD-LIBOR-BBA + 3.00%), due 6/7/23 | | | 4,773,415 | | | | 4,806,829 | |
| | | | | | | | |
| | | | | | | 11,113,596 | |
| | | | | | | | |
Household Products & Wares 0.9% | |
KIK Custom Products, Inc.
2015 Term Loan B
5.74% (1-month USD-LIBOR-BBA + 4.50%), due 8/26/22 | | | 5,510,478 | | | | 5,566,960 | |
Prestige Brands, Inc.
Term Loan B5
3.992% (1-month USD-LIBOR-BBA + 2.75%), due 1/26/24 | | | 6,425,554 | | | | 6,456,679 | |
| | | | | | | | |
| | | | | | | 12,023,639 | |
| | | | | | | | |
Iron & Steel 0.5% | |
Signode Industrial Group U.S., Inc. (h) Term Loan B
3.992%, (1-month USD-LIBOR-BBA + 2.75%), due 5/4/21 | | | 3,709,040 | | | | 3,736,858 | |
Term Loan B
4.082%, (3-month USD-LIBOR-BBA + 2.75%), due 5/4/21 | | | 3,341,477 | | | | 3,366,538 | |
| | | | | | | | |
| | | | |
| 18 | | MainStay Unconstrained Bond Fund | | The notes to the financial statements are an integral part of,
and should be read in conjunction with, the financial statements. |
| | | | | | | | |
| | | Principal
Amount | | | Value | |
| Loan Assignments (continued) | |
Lodging 0.8% | |
Hilton Worldwide Finance LLC
Term Loan B2
3.238% (1-month USD-LIBOR-BBA + 2.00%), due 10/25/23 | | $ | 10,594,054 | | | $ | 10,653,201 | |
Boyd Gaming Corp.
Term Loan B3
3.702% (1-week USD-LIBOR-BBA + 2.50%), due 9/15/23 | | | 359,910 | | | | 361,309 | |
| | | | | | | | |
| | | | | | | 11,014,510 | |
| | | | | | | | |
Machinery—Diversified 1.0% | |
Husky Injection Molding Systems, Ltd.
1st Lien Term Loan
4.492% (1-month USD-LIBOR-BBA + 3.25%), due 6/30/21 | | | 7,901,336 | | | | 7,957,001 | |
Zebra Technologies Corp.
2017 Term Loan B
3.371% (3-month USD-LIBOR-BBA + 2.00%), due 10/27/21 | | | 5,273,916 | | | | 5,294,532 | |
| | | | | | | | |
| | | | | | | 13,251,533 | |
| | | | | | | | |
Media 1.2% | |
Charter Communications Operating LLC Repriced Term Loan F
3.25% (1-month USD-LIBOR-BBA + 2.00%), due 1/3/21 | | | 8,697,612 | | | | 8,731,437 | |
Virgin Media Bristol LLC
Term Loan I
3.989% (1-month USD-LIBOR-BBA + 2.75%), due 1/31/25 | | | 4,100,000 | | | | 4,114,735 | |
Nielsen Finance LLC
Term Loan B4
3.238% (1-month USD-LIBOR-BBA + 2.00%), due 10/4/23 | | | 3,945,175 | | | | 3,959,520 | |
| | | | | | | | |
| | | | | | | 16,805,692 | |
| | | | | | | | |
Mining, Steel, Iron & Non-Precious Metals 0.3% | |
Gates Global LLC
2017 USD Term Loan B
4.583% (3-month USD-LIBOR-BBA + 3.25%), due 4/1/24 | | | 4,041,958 | | | | 4,062,629 | |
| | | | | | | | |
|
Pharmaceuticals 0.4% | |
Change Healthcare Holdings, Inc.
2017 Term Loan B
3.992% (1-month USD-LIBOR-BBA + 2.75%), due 3/1/24 | | | 5,457,575 | | | | 5,484,104 | |
| | | | | | | | |
| | | | | | | | |
| | | Principal
Amount | | | Value | |
Real Estate 0.4% | |
Realogy Corp.
2017 Term Loan B
3.492% (1-month USD-LIBOR-BBA + 2.25%), due 7/20/22 | | $ | 4,867,080 | | | $ | 4,888,374 | |
| | | | | | | | |
|
Retail 0.1% | |
1011778 B.C. Unlimited Liability Co. Term Loan B3
3.492% (1-month USD-LIBOR-BBA + 2.25%), due 2/16/24 | | | 952,387 | | | | 952,387 | |
Term Loan B3
3.582% (3-month USD-LIBOR-BBA + 2.25%), due 2/16/24 | | | 609,747 | | | | 609,747 | |
| | | | | | | | |
|
Software 0.3% | |
First Data Corp.
2017 Term Loan
3.738% (1-month USD-LIBOR-BBA + 2.50%), due 4/26/24 | | | 3,662,825 | | | | 3,680,161 | |
| | | | | | | | |
|
Telecommunications 1.7% | |
SBA Senior Finance II LLC
Term Loan B1
3.50% (1-month USD-LIBOR-BBA + 2.25%), due 3/24/21 | | | 8,743,640 | | | | 8,769,145 | |
Level 3 Financing, Inc.
2017 Term Loan B
3.489% (1-month USD-LIBOR-BBA + 2.25%), due 2/22/24 | | | 9,000,000 | | | | 9,022,500 | |
Sprint Communications, Inc.
1st Lien Term Loan B
3.75% (1-month USD-LIBOR-BBA + 2.50%), due 2/2/24 | | | 5,124,250 | | | | 5,137,978 | |
| | | | | | | | |
| | | | | | | 22,929,623 | |
| | | | | | | | |
Transportation 0.2% | |
XPO Logistics, Inc.
2017 Term Loan B
3.599% (3-month USD-LIBOR-BBA + 2.25%), due 11/1/21 | | | 3,285,000 | | | | 3,300,696 | |
| | | | | | | | |
Total Loan Assignments
(Cost $248,983,930) | | | | | | | 249,506,211 | |
| | | | | | | | |
|
| Mortgage-Backed Securities 0.8% | |
Commercial Mortgage Loans (Collateralized Mortgage Obligations) 0.0%‡ | |
Bayview Commercial Asset Trust
Series 2006-4A, Class A1
1.468% (1-month LIBOR + 0.23%), due 12/25/36 (a)(b) | | | 27,965 | | | | 26,724 | |
| | | | | | |
The notes to the financial statements are an integral part of,
and should be read in conjunction with, the financial statements. | | | | | 19 | |
Portfolio of Investments October 31, 2017 (continued)
| | | | | | | | |
| | | Principal
Amount | | | Value | |
| Mortgage-Backed Securities (continued) | |
Commercial Mortgage Loans (Collateralized Mortgage Obligations) (continued) | |
Wells Fargo Mortgage Backed Securities Trust
Series 2006-AR10, Class 5A2
3.376%, due 7/25/36 (i) | | $ | 88,861 | | | $ | 89,455 | |
| | | | | | | | |
| | | | | | | 116,179 | |
| | | | | | | | |
Residential Mortgage
(Collateralized Mortgage Obligation) 0.8% | |
Japan Finance Organization for Municipalities
Series Reg S
1.375%, due 2/5/18 | | | 10,610,000 | | | | 10,590,785 | |
| | | | | | | | |
|
Whole Loan Collateral
(Collateralized Mortgage Obligation) 0.0%‡ | |
Banc of America Mortgage Trust
Series 2005-J, Class 1A1
3.544%, due 11/25/35 (i) | | | 90,762 | | | | 84,786 | |
| | | | | | | | |
Total Mortgage-Backed Securities
(Cost $10,795,367) | | | | | | | 10,791,750 | |
| | | | | | | | |
|
| U.S. Government & Federal Agencies 0.0%‡ | |
United States Treasury Notes 0.0%‡ | |
2.125%, due 8/15/21 | | | 70,000 | | | | 70,667 | |
| | | | | | | | |
Total U.S. Government & Federal Agencies
(Cost $70,880) | | | | | | | 70,667 | |
| | | | | | | | |
Total Long-Term Bonds
(Cost $1,273,663,787) | | | | | | | 1,292,236,097 | |
| | | | | | | | |
| | |
| | | | | | | | |
| | |
Shares | | | | |
| Common Stocks 0.0%‡† | |
Media 0.0%‡ | |
ION Media Networks, Inc. (g)(h)(j)(k) | | | 22 | | | | 14,929 | |
| | | | | | | | |
Total Common Stocks
(Cost $0) | | | | | | | 14,929 | |
| | | | | | | | |
| | |
| | | | | | | | |
| | | | | | | | |
| | | Principal
Amount | | | Value | |
| Short-Term Investment 5.8% | |
Repurchase Agreement 5.8% | |
Fixed Income Clearing Corp.
0.34%, dated 10/31/17
due 11/1/17
Proceeds at Maturity $78,467,008 (Collateralized by a United States Treasury Note with a rate of 2.00% and a maturity date of 10/30/22, with a Principal Amount of $79,455,000 and a Market Value of $80,038,597) | | $ | 78,466,267 | | | $ | 78,466,267 | |
| | | | | | | | |
Total Short-Term Investment
(Cost $78,466,267) | | | | | | | 78,466,267 | |
| | | | | | | | |
Total Investments, Before Investments Sold Short
(Cost $1,352,130,054) | | | 101.9 | % | | | 1,370,717,293 | |
| | | | | | | | |
|
Long-Term Bonds Sold Short (1.9%) Corporate Bonds Sold Short (1.9%) | |
Internet (0.7%) | |
Netflix, Inc.
4.375%, due 11/15/26 (b) | | | (10,400,000 | ) | | | (10,198,500 | ) |
| | | | | | | | |
|
Oil & Gas (1.2%) | |
Noble Energy, Inc. | | | | | | | | |
3.90%, due 11/15/24 | | | (12,115,000 | ) | | | (12,490,929 | ) |
4.15%, due 12/15/21 | | | (3,000,000 | ) | | | (3,164,753 | ) |
| | | | | | | | |
| | | | | | | (15,655,682 | ) |
| | | | | | | | |
Total Investments Sold Short
(Cost $23,922,038) | | | | | | | (25,854,182 | ) |
| | | | | | | | |
Total Investments, Net of Investments Sold Short
(Cost $1,328,208,016) | | | 100.0 | | | | 1,344,863,111 | |
Other Assets, Less Liabilities | | | 0.0 | ‡ | | | 429,657 | |
Net Assets | | | 100.0 | % | | $ | 1,345,292,768 | |
| ‡ | Less than one-tenth of a percent. |
| (a) | Floating rate—Rate shown was the rate in effect as of October 31, 2017. |
| (b) | May be sold to institutional investors only under Rule 144A or securities offered pursuant to Section 4(a)(2) of the Securities Act of 1933, as amended. |
| (c) | Security, or a portion thereof, was maintained in a segregated account at the Fund's custodian as collateral for securities Sold Short. (See Note 2(O)) |
| (d) | Securities are perpetual and, thus, do not have a predetermined maturity date. The date shown, if applicable, reflects the next call date. |
| (e) | Fixed to floating rate—Rate shown was the rate in effect as of October 31, 2017. |
| | | | |
| 20 | | MainStay Unconstrained Bond Fund | | The notes to the financial statements are an integral part of,
and should be read in conjunction with, the financial statements. |
| (f) | Step coupon—Rate shown was the rate in effect as of October 31, 2017. |
| (g) | Fair valued security—Represents fair value as measured in good faith under procedures approved by the Board of Trustees. As of October 31, 2017, the total market value of fair valued securities was $76,527, which represented less than one-tenth of a percent of the Fund's net assets. |
| (h) | Security in which significant unobservable inputs (Level 3) were used in determining fair value. |
| (i) | Collateral strip rate—A bond whose interest was based on the weighted net interest rate of the collateral. The coupon rate adjusts periodically |
| | based on a predetermined schedule. Rate shown was the rate in effect as of October 31, 2017. |
| (j) | Illiquid security—As of October 31, 2017, the total market value of this security deemed illiquid under procedures approved by the Board of Trustees was $14,929, which represented less than one-tenth of a percent of the Fund's net assets. (Unaudited) |
| (l) | Non-income producing security. |
As of October 31, 2017, the Fund held the following foreign currency forward contracts1:
| | | | | | | | | | | | | | | | | | | | | | |
Foreign Currency Buy Contracts | | Settlement
Date | | | Counterparty | | Contract
Amount
Purchased | | | Contract
Amount
Sold | | | Unrealized
Appreciation
(Depreciation) | |
Euro vs. U.S. Dollar | | | 11/1/17 | | | JPMorgan Chase Bank N.A. | | | EUR | | | | 8,734,000 | | | $ | 10,317,238 | | | $ | (143,443 | ) |
Pound Sterling vs. U.S. Dollar | | | 11/1/17 | | | JPMorgan Chase Bank N.A. | | | GBP | | | | 12,639,000 | | | | 16,749,203 | | | | 37,286 | |
| | | | | | |
| | | | | | | | | | | | | | | | | | | | | | |
Foreign Currency Sales Contracts | | | | | | | Contract
Amount
Sold | | | Contract
Amount
Purchased | | | | |
Euro vs. U.S. Dollar | | | 11/1/17 | | | JPMorgan Chase Bank N.A. | | | EUR | | | | 8,734,000 | | | | 10,214,413 | | | | 40,617 | |
Euro vs. U.S. Dollar | | | 2/1/18 | | | JPMorgan Chase Bank N.A. | | | | | | | 8,727,000 | | | | 10,364,822 | | | | 144,275 | |
Pound Sterling vs. U.S. Dollar | | | 11/1/17 | | | JPMorgan Chase Bank N.A. | | | GBP | | | | 12,639,000 | | | | 16,542,555 | | | | (243,933 | ) |
Pound Sterling vs. U.S. Dollar | | | 2/1/18 | | | JPMorgan Chase Bank N.A. | | | | | | | 12,799,000 | | | | 17,010,741 | | | | (37,898 | ) |
Net unrealized appreciation (depreciation) on foreign currency forward contracts | | | | | | | | | | | | | | $ | (203,096 | ) |
| 1. | Foreign Currency Forward Contracts are subject to limitations such that they cannot be “sold or repurchased,” although the Fund would be able to exit the transaction through other means, such as through the execution of an offsetting transaction. |
As of October 31, 2017, the Fund held the following futures contracts1:
| | | | | | | | | | | | | | | | | | | | |
Type | | Number of
Contracts
Long
(Short) | | | Expiration
Date | | | Value at
Trade Date | | | Current
Notional
Amount | | | Unrealized
Appreciation (Depreciation)2 | |
| 2-Year United States Treasury Note | | | (2,855 | ) | | | December 2017 | | | $ | (617,298,364 | ) | | $ | (614,851,018 | ) | | $ | 2,447,346 | |
| 10-Year United States Treasury Note | | | 481 | | | | December 2017 | | | | 60,921,991 | | | | 60,094,938 | | | | (827,053 | ) |
| Euro Bund | | | (373 | ) | | | December 2017 | | | | (70,651,631 | ) | | | (70,713,063 | ) | | | (61,432 | ) |
| United States Treasury Long Bond | | | (228 | ) | | | December 2017 | | | | (35,428,797 | ) | | | (34,762,875 | ) | | | 665,922 | |
| | | | | | | | | | | | | | | | | | | | |
| | | | | | | | | | $ | (662,456,801 | ) | | $ | (660,232,018 | ) | | $ | 2,224,783 | |
| | | | | | | | | | | | | | | | | | | | |
| 1. | As of October 31, 2017, cash in the amount of $1,321,713 was on deposit with a broker for futures transactions. |
| 2. | Represents the difference between the value of the contracts at the time they were opened and the value as of October 31, 2017. |
As of October 31, 2017, the Fund held the following centrally cleared interest rate swap agreements1:
| | | | | | | | | | | | | | | | | | | | | | | | | | | | | | |
Notional Amount | | | Currency | | | Expiration
Date | | | Payments made by Fund | | Payments
Received by Fund | | Payment
Frequency Paid/ Received | | | Upfront
Premiums Received/
(Paid) | | | Value | | | Unrealized
Appreciation /
(Depreciation) | |
| | $400,000,000 | | | | USD | | | | 2/16/2018 | | | Fixed 0.670% | | 3-Month USD-LIBOR | | | Quarterly | | | $ | (7,354 | ) | | $ | 899,000 | | | $ | 891,646 | |
| | 725,000,000 | | | | USD | | | | 7/22/2018 | | | Fixed 0.937% | | 3-Month USD-LIBOR | | | Quarterly | | | | (18,847 | ) | | | 3,332,673 | | | | 3,313,826 | |
| | 250,000,000 | | | | USD | | | | 8/8/2019 | | | Fixed 1.621% | | 3-Month USD-LIBOR | | | Quarterly | | | | 52,497 | | | | 723,052 | | | | 775,549 | |
| | | | | | | | | | | | | | | | | | | | | $ | 26,296 | | | $ | 4,954,725 | | | $ | 4,981,021 | |
| | | | | | |
The notes to the financial statements are an integral part of,
and should be read in conjunction with, the financial statements. | | | | | 21 | |
Portfolio of Investments October 31, 2017 (continued)
As of October 31, 2017, the Fund held the following OTC credit default swap contracts:
| | | | | | | | | | | | | | | | | | | | | | | | | | | | | | | | | | | | |
| Reference Entity | | Counterparty | | | Termination
Date | | | Buy/Sell
Protection2 | | | Notional
Amount (000)3 | | | (Pay)/
Receive
Fixed
Rate4 | | | Payment
Frequency Paid/
Received | | | Upfront
Premiums
Received/
(Paid) | | | Value | | | Unrealized
Appreciation/
(Depreciation)5 | |
Staples, Inc.
2.75%, 1/12/18 | | | Credit Suisse First Boston | | | | 6/20/2019 | | | | Buy | | | | 7,000 | | | | (1.00 | )% | | | Quarterly | | | $ | (159,498 | ) | | $ | 109,771 | | | $ | (49,727 | ) |
| | | | | | | | | | | | | | | | | | | | | | | | | | | $ | (159,498 | ) | | $ | 109,771 | | | $ | (49,727 | ) |
| 1. | As of October 31, 2017, cash in the amount of $1,565,827 was on deposit with a broker for centrally cleared swap agreements. |
| 2. | Buy—Fund pays premium and buys credit protection. If a credit event occurs, as defined under the terms of that particular swap agreement, the Fund will either (i) receive from the seller of protection an amount equal to the notional amount of the swap and deliver the referenced obligation or underlying securities comprising the referenced index or (ii) receive a net settlement amount in the form of cash or securities equal to the notional amount of the swap less the recovery value of the referenced obligation or underlying securities comprising the referenced index. |
| | Sell—Fund receives premium and sells credit protection. If a credit event occurs, as defined under the terms of that particular swap agreement, the Fund will either (i) pay to the buyer of protection an amount equal to the notional amount of the swap and take delivery of the referenced obligation or underlying securities comprising the referenced index or (ii) pay a net settlement amount in the form of cash or securities equal to the notional amount of the swap less the recovery value of the referenced obligation or underlying securities comprising the referenced index. |
| 3. | The maximum potential amount the Fund could be required to pay as a seller of credit protection or receive as a buyer of credit protection if a credit event occurs as defined under the terms of that particular swap contract. |
| 4. | The annual fixed rate represents the interest received by the Fund (as a seller of protection) or paid by the Fund (as a buyer of protection) annually on the notional amount of the credit default swap contract. |
| 5. | Represents the difference between the value of the credit default swap contracts at the time they were opened and the value at October 31, 2017. |
The following abbreviations are used in the preceding pages:
BBA—British Bankers' Association
EUR—Euro
GBP—British Pound Sterling
LIBOR—London InterBank Offered Rate
MTN—Medium Term Note
| | | | |
| 22 | | MainStay Unconstrained Bond Fund | | The notes to the financial statements are an integral part of,
and should be read in conjunction with, the financial statements. |
The following is a summary of the fair valuations according to the inputs used as of October 31, 2017, for valuing the Fund's assets and liabilities.
Asset Valuation Inputs
| | | | | | | | | | | | | | | | |
Description | | Quoted
Prices in Active Markets for Identical Assets (Level 1) | | | Significant Other Observable Inputs (Level 2) | | | Significant
Unobservable
Inputs (Level 3) | | | Total | |
| Investments in Securities (a) | | | | | | | | | | | | | | | | |
| Long-Term Bonds | | | | | | | | | | | | | | | | |
Asset-Backed Securities | | $ | — | | | $ | 2,598,529 | | | $ | — | | | $ | 2,598,529 | |
Corporate Bonds | | | — | | | | 1,021,753,072 | | | | — | | | | 1,021,753,072 | |
Foreign Bonds | | | — | | | | 754,334 | | | | — | | | | 754,334 | |
Foreign Government Bonds | | | — | | | | 6,761,534 | | | | — | | | | 6,761,534 | |
Loan Assignments (b) | | | — | | | | 230,515,178 | | | | 18,991,033 | | | | 249,506,211 | |
Mortgage-Backed Securities | | | — | | | | 10,791,750 | | | | — | | | | 10,791,750 | |
U.S. Government & Federal Agencies | | | — | | | | 70,667 | | | | — | | | | 70,667 | |
| | | | | | | | | | | | | | | | |
| Total Long-Term Bonds | | | — | | | | 1,273,245,064 | | | | 18,991,033 | | | | 1,292,236,097 | |
| | | | | | | | | | | | | | | | |
| Common Stocks (c) | | | — | | | | — | | | | 14,929 | | | | 14,929 | |
| Short-Term Investment | | | | | | | | | | | | | | | | |
Repurchase Agreement | | | — | | | | 78,466,267 | | | | — | | | | 78,466,267 | |
| | | | | | | | | | | | | | | | |
| Total Investments in Securities | | | — | | | | 1,351,711,331 | | | | 19,005,962 | | | | 1,370,717,293 | |
| | | | | | | | | | | | | | | | |
| Other Financial Instruments | | | | | | | | | | | | | | | | |
Foreign Currency Forward Contract (d) | | | — | | | | 222,178 | | | | — | | | | 222,178 | |
Futures Contracts (d) | | | 3,113,268 | | | | — | | | | — | | | | 3,113,268 | |
Interest Rate Swap Contracts (d) | | | — | | | | 4,981,021 | | | | — | | | | 4,981,021 | |
| | | | | | | | | | | | | | | | |
| Total Other Financial Instruments | | | 3,113,268 | | | | 5,203,199 | | | | — | | | | 8,316,467 | |
| | | | | | | | | | | | | | | | |
| Total Investments in Securities and Other Financial Instruments | | $ | 3,113,268 | | | $ | 1,356,914,530 | | | $ | 19,005,962 | | | $ | 1,379,033,760 | |
| | | | | | | | | | | | | | | | |
Liability Valuation Inputs
| | | | | | | | | | | | | | | | |
Description | | Quoted
Prices in
Active
Markets for Identical Assets (Level 1) | | | Significant
Other Observable
Inputs (Level 2) | | | Significant
Unobservable
Inputs (Level 3) | | | Total | |
| Long-Term Bonds Sold Short | | | | | | | | | | | | | | | | |
Corporate Bonds Sold Short | | | — | | | | (25,854,182 | ) | | | — | | | | (25,854,182 | ) |
| | | | | | | | | | | | | | | | |
| Total Long-Term Bonds Sold Short | | | — | | | | (25,854,182 | ) | | | — | | | | (25,854,182 | ) |
| | | | | | | | | | | | | | | | |
Other Financial Instruments | | | | | | | | | | | | | | | | |
Foreign Currency Forward Contracts (d) | | | — | | | | (425,274 | ) | | | — | | | | (425,274 | ) |
Futures Contracts (d) | | | (888,485 | ) | | | — | | | | — | | | | (888,485 | ) |
Credit Default Swap Contracts (d) | | | — | | | | (49,727 | ) | | | — | | | | (49,727 | ) |
| | | | | | | | | | | | | | | | |
| Total Other Financial Instruments | | | (888,485 | ) | | | (475,001 | ) | | | — | | | | (1,363,486 | ) |
| | | | | | | | | | | | | | | | |
| Total Investments in Securities Sold Short and Other Financial Instruments | | $ | (888,485 | ) | | $ | (26,329,183 | ) | | $ | — | | | $ | (27,217,668 | ) |
| | | | | | | | | | | | | | | | |
| (a) | For a complete listing of investments and their industries, see the Portfolio of Investments. |
| (b) | The Level 3 securities valued at $8,531,250, $3,356,387, and $7,103,396 are held in Commercial Services, Electrical Components & Equipment, and Iron & Steel, respectively, within the Loan Assignments section of the Portfolio of Investments. |
| (c) | The Level 3 security valued at $14,929 is held in Media within the Common Stocks section of the Portfolio of Investments. |
| (d) | The value listed for these securities reflects unrealized appreciation (depreciation) as shown on the Portfolio of Investments. |
The Fund recognizes transfers between the levels as of the beginning of the period.
| | | | | | |
The notes to the financial statements are an integral part of,
and should be read in conjunction with, the financial statements. | | | | | 23 | |
Portfolio of Investments October 31, 2017 (continued)
As of October 31, 2017, securities with a market value of $16,786,233 transferred from Level 2 to Level 3. The transfer occurred as a result of utilizing significant unobservable inputs. As of October 31, 2016, the fair value obtained for these securities, as determined based on information provided by an independent pricing source, utilized significant observable inputs.
As of October 31, 2017, a security with a market value of $8,673,520 transferred from Level 3 to Level 2. The transfer occurred as a result of utilizing significant observable inputs. As of October 31, 2016, the fair value obtained for these securities, as determined based on information provided by an independent pricing source, utilized significant unobservable inputs.
The following is a reconciliation of investments in which significant unobservable inputs (Level 3) were used in determining value:
| | | | | | | | | | | | | | | | | | | | | | | | | | | | | | | | | | | | | | | | |
Investments in Securities | | Balance
as of October 31,
2016 | | | Accrued
Discounts (Premiums) | | | Realized
Gain
(Loss) | | | Change in Unrealized
Appreciation
(Depreciation) | | | Purchases | | | Sales (a) | | | Transfers
in to Level 3 | | | Transfers
out of Level 3 | | | Balance
as of October 31,
2017 | | | Change in Unrealized Appreciation (Depreciation) from Investments Still Held at October 31, 2017 (b) | |
| Long-Term Bonds | | | | | | | | | | | | | | | | | | | | | | | | | | | | | | | | | | | | | | | | |
Loan Assignments | | | | | | | | | | | | | | | | | | | | | | | | | | | | | | | | | | | | | | | | |
Commercial Services | | $ | 8,673,520 | | | $ | 10,965 | | | $ | — | | | $ | (175,028 | ) | | $ | — | | | $ | — | | | $ | 8,695,313 | | | $ | (8,673,520 | ) | | $ | 8,531,250 | | | $ | (175,028 | ) |
Electrical Components & Equipment | | | — | | | | 4,844 | | | | 358 | | | | 86,335 | | | | 3,289,900 | | | | (25,050 | ) | | | — | | | | — | | | | 3,356,387 | | | | 86,335 | |
Hand & Machine Tools | | | 6,635,753 | | | | — | | | | — | | | | (33,013 | ) | | | — | | | | (6,602,740 | ) | | | — | | | | — | | | | — | | | | — | |
Health Care—Products | | | 987,525 | | | | 149 | | | | (652 | ) | | | 515 | | | | — | | | | (987,537 | ) | | | — | | | | — | | | | — | | | | — | |
Iron & Steel | | | — | | | | 3,269 | | | | 2,508 | | | | 82,655 | | | | — | | | | (1,075,956 | ) | | | 8,090,920 | | | | — | | | | 7,103,396 | | | | 82,655 | |
Machinery—Construction & Mining | | | 2,535,260 | | | | 227 | | | | 13 | | | | 8,377 | | | | — | | | | (2,543,877 | ) | | | — | | | | — | | | | — | | | | — | |
Retail Stores | | | 729,051 | | | | (87 | ) | | | (2,159 | ) | | | (4,078 | ) | | | — | | | | (722,727 | ) | | | — | | | | — | | | | — | | | | — | |
| Common Stocks | | | | | | | | | | | | | | | | | | | | | | | | | | | | | | | | | | | | | | | | |
Media | | | 11,778 | | | | — | | | | — | | | | 3,151 | | | | — | | | | — | | | | — | | | | — | | | | 14,929 | | | | 3,151 | |
| | | | | | | | | | | | | | | | | | | | | | | | | | | | | | | | | | | | | | | | |
| Total | | $ | 19,572,887 | | | $ | 19,367 | | | $ | 68 | | | $ | (31,086 | ) | | $ | 3,289,900 | | | $ | (11,957,887 | ) | | $ | 16,786,233 | | | $ | (8,673,520 | ) | | $ | 19,005,962 | | | $ | (2,887 | ) |
| | | | | | | | | | | | | | | | | | | | | | | | | | | | | | | | | | | | | | | | |
| (a) | Sales include principal reductions. |
| (b) | Included in "Net change in unrealized appreciation (depreciation) on investments" in the Statement of Operations. |
| | | | |
| 24 | | MainStay Unconstrained Bond Fund | | The notes to the financial statements are an integral part of,
and should be read in conjunction with, the financial statements. |
Statement of Assets and Liabilities as of October 31, 2017
| | | | |
| Assets | |
Investment in securities, at value (identified cost $1,352,130,054) | | $ | 1,370,717,293 | |
Cash denominated in foreign currencies (identified cost $204,823) | | | 202,861 | |
Cash collateral on deposit at broker for futures contracts | | | 1,321,713 | |
Cash collateral on deposit at broker for swap contracts | | | 1,565,827 | |
Receivables: | | | | |
Dividends and interest | | | 10,308,443 | |
Fund shares sold | | | 2,140,262 | |
Investment securities sold | | | 676,635 | |
Variation margin on futures contracts | | | 1,336,295 | |
Variation margin on centrally cleared swap contracts | | | 142,390 | |
Premiums paid for OTC swap contracts | | | 159,498 | |
Other assets | | | 45,064 | |
Unrealized appreciation on foreign currency forward contracts | | | 222,178 | |
| | | | |
Total assets | | | 1,388,838,459 | |
| | | | |
| |
| Liabilities | | | | |
Investments sold short (proceeds $23,922,038) | | | 25,854,182 | |
Due to custodian | | | 475,569 | |
Payables: | | | | |
Investment securities purchased | | | 12,734,628 | |
Fund shares redeemed | | | 1,960,004 | |
Manager (See Note 3) | | | 651,922 | |
Interest on investments sold short | | | 474,707 | |
NYLIFE Distributors (See Note 3) | | | 227,151 | |
Transfer agent (See Note 3) | | | 185,192 | |
Broker fees and charges on short sales | | | 134,131 | |
Shareholder communication | | | 93,534 | |
Professional fees | | | 18,680 | |
Custodian | | | 7,552 | |
Trustees | | | 3,352 | |
Accrued expenses | | | 3,809 | |
Dividend payable | | | 246,277 | |
Unrealized depreciation on OTC swap contracts | | | 49,727 | |
Unrealized depreciation on foreign currency forward contracts | | | 425,274 | |
| | | | |
Total liabilities | | | 43,545,691 | |
| | | | |
Net assets | | $ | 1,345,292,768 | |
| | | | |
| |
| Composition of Net Assets | | | | |
Shares of beneficial interest outstanding (par value of $.01 per share) unlimited number of shares authorized | | $ | 1,511,703 | |
Additional paid-in capital | | | 1,504,564,008 | |
| | | | |
| | | 1,506,075,711 | |
Distributions in excess of net investment income | | | (108,683 | ) |
Accumulated net realized gain (loss) on investments, investments sold short, futures transactions, swap transactions and foreign currency transactions | | | (184,288,059 | ) |
Net unrealized appreciation (depreciation) on investments, swap contracts and futures contracts | | | 25,743,316 | |
Net unrealized appreciation (depreciation) on investments sold short | | | (1,932,144 | ) |
Net unrealized appreciation (depreciation) on translation of other assets and liabilities in foreign currencies and foreign currency forward contracts | | | (197,373 | ) |
| | | | |
Net assets | | $ | 1,345,292,768 | |
| | | | |
| | | | |
Class A | | | | |
Net assets applicable to outstanding shares | | $ | 302,192,462 | |
| | | | |
Shares of beneficial interest outstanding | | | 33,954,273 | |
| | | | |
Net asset value per share outstanding | | $ | 8.90 | |
Maximum sales charge (4.50% of offering price) | | | 0.42 | |
| | | | |
Maximum offering price per share outstanding | | $ | 9.32 | |
| | | | |
Investor Class | | | | |
Net assets applicable to outstanding shares | | $ | 22,032,666 | |
| | | | |
Shares of beneficial interest outstanding | | | 2,456,058 | |
| | | | |
Net asset value per share outstanding | | $ | 8.97 | |
Maximum sales charge (4.50% of offering price) | | | 0.42 | |
| | | | |
Maximum offering price per share outstanding | | $ | 9.39 | |
| | | | |
Class B | | | | |
Net assets applicable to outstanding shares | | $ | 15,222,669 | |
| | | | |
Shares of beneficial interest outstanding | | | 1,718,974 | |
| | | | |
Net asset value and offering price per share outstanding | | $ | 8.86 | |
| | | | |
Class C | | | | |
Net assets applicable to outstanding shares | | $ | 167,594,947 | |
| | | | |
Shares of beneficial interest outstanding | | | 18,940,156 | |
| | | | |
Net asset value and offering price per share outstanding | | $ | 8.85 | |
| | | | |
Class I | | | | |
Net assets applicable to outstanding shares | | $ | 837,363,032 | |
| | | | |
Shares of beneficial interest outstanding | | | 94,001,128 | |
| | | | |
Net asset value and offering price per share outstanding | | $ | 8.91 | |
| | | | |
Class R2 | | | | |
Net assets applicable to outstanding shares | | $ | 772,724 | |
| | | | |
Shares of beneficial interest outstanding | | | 86,866 | |
| | | | |
Net asset value and offering price per share outstanding | | $ | 8.90 | |
| | | | |
Class R3 | | | | |
Net assets applicable to outstanding shares | | $ | 114,268 | |
| | | | |
Shares of beneficial interest outstanding | | | 12,835 | |
| | | | |
Net asset value and offering price per share outstanding | | $ | 8.90 | |
| | | | |
| | | | | | |
The notes to the financial statements are an integral part of,
and should be read in conjunction with, the financial statements. | | | | | 25 | |
Statement of Operations for the year ended October 31, 2017
| | | | |
| Investment Income (Loss) | |
Income | | | | |
Interest | | $ | 53,762,317 | |
Dividends | | | 8,730 | |
Other income | | | 1,455 | |
| | | | |
Total income | | | 53,772,502 | |
| | | | |
Expenses | | | | |
Manager (See Note 3) | | | 7,836,288 | |
Distribution/Service—Class A (See Note 3) | | | 832,149 | |
Distribution/Service—Investor Class (See Note 3) | | | 75,728 | |
Distribution/Service—Class B (See Note 3) | | | 167,782 | |
Distribution/Service—Class C (See Note 3) | | | 1,914,272 | |
Distribution/Service—Class R2 (See Note 3) | | | 1,730 | |
Distribution/Service—Class R3 (See Note 3) | | | 396 | |
Transfer agent (See Note 3) | | | 2,207,627 | |
Interest on investments sold short | | | 958,233 | |
Broker fees and charges on short sales | | | 598,501 | |
Shareholder communication | | | 171,275 | |
Registration | | | 157,665 | |
Professional fees | | | 115,463 | |
Interest expense | | | 55,285 | |
Trustees | | | 33,876 | |
Custodian | | | 23,475 | |
Shareholder service (See Note 3) | | | 771 | |
Miscellaneous | | | 61,549 | |
| | | | |
Total expenses | | | 15,212,065 | |
| | | | |
Net investment income (loss) | | | 38,560,437 | |
| | | | |
|
| Realized and Unrealized Gain (Loss) on Investments, Futures Contracts, Swap Contracts and Foreign Currency Transactions | |
Net realized gain (loss) on: | | | | |
Investment transactions | | | 1,957,755 | |
Investments sold short | | | 748,141 | |
Futures transactions | | | 313,993 | |
Swap transactions | | | 5,251,159 | |
Foreign currency forward transactions | | | 299,762 | |
Foreign currency transactions | | | (222,833 | ) |
| | | | |
Net realized gain (loss) on investments, investments sold short, futures transactions, swap transactions and foreign currency transactions | | | 8,347,977 | |
| | | | |
Net change in unrealized appreciation (depreciation) on: | | | | |
Investments | | | 17,236,493 | |
Investments sold short | | | (109,620 | ) |
Futures contracts | | | 830,700 | |
Swap contracts | | | 168,927 | |
Foreign currency forward contracts | | | (2,371,396 | ) |
Translation of other assets and liabilities in foreign currencies | | | 651,309 | |
| | | | |
Net change in unrealized appreciation (depreciation) on investments, investments sold short, futures contracts, swap contracts and foreign currency transactions | | | 16,406,413 | |
| | | | |
Net realized and unrealized gain (loss) on investments, investments sold short, futures transactions, swap transactions and foreign currency transactions | | | 24,754,390 | |
| | | | |
Net increase (decrease) in net assets resulting from operations | | $ | 63,314,827 | |
| | | | |
| | | | |
| 26 | | MainStay Unconstrained Bond Fund | | The notes to the financial statements are an integral part of,
and should be read in conjunction with, the financial statements. |
Statements of Changes in Net Assets
for the years ended October 31, 2017 and October 31, 2016
| | | | | | | | |
| | | 2017 | | | 2016 | |
| Increase (Decrease) in Net Assets | |
Operations: | | | | | | | | |
Net investment income (loss) | | $ | 38,560,437 | | | $ | 65,976,301 | |
Net realized gain (loss) on investments, investments sold short, futures transactions, swap transactions and foreign currency transactions | | | 8,347,977 | | | | (126,707,512 | ) |
Net change in unrealized appreciation (depreciation) on investments, investments sold short, futures contracts, swap contracts and foreign currency transactions | | | 16,406,413 | | | | 111,755,483 | |
| | | | |
Net increase (decrease) in net assets resulting from operations | | | 63,314,827 | | | | 51,024,272 | |
| | | | |
Dividends to shareholders: | | | | | | | | |
From net investment income: | | | | | | | | |
Class A | | | (11,903,949 | ) | | | (17,448,500 | ) |
Investor Class | | | (1,038,268 | ) | | | (1,174,147 | ) |
Class B | | | (465,521 | ) | | | (553,640 | ) |
Class C | | | (5,354,418 | ) | | | (7,691,473 | ) |
Class I | | | (29,662,522 | ) | | | (34,272,357 | ) |
Class R2 | | | (22,874 | ) | | | (5,314 | ) |
Class R3 | | | (2,527 | ) | | | (626 | ) |
| | | | |
| | | (48,450,079 | ) | | | — | |
| | | | |
Return of capital: | | | | | | | | |
Class A | | | (174,809 | ) | | | — | |
Investor Class | | | (15,247 | ) | | | — | |
Class B | | | (6,836 | ) | | | — | |
Class C | | | (78,629 | ) | | | — | |
Class I | | | (435,593 | ) | | | — | |
Class R2 | | | (336 | ) | | | — | |
Class R3 | | | (37 | ) | | | — | |
| | | | |
| | | (711,487 | ) | | | — | |
| | | | |
Total dividends to shareholders | | | (49,161,566 | ) | | | (61,146,057 | ) |
| | | | |
Capital share transactions: | | | | | | | | |
Net proceeds from sale of shares | | | 338,495,940 | | | | 289,363,678 | |
Net asset value of shares issued to shareholders in reinvestment of dividends | | | 43,219,924 | | | | 52,612,771 | |
Cost of shares redeemed | | | (470,140,388 | ) | | | (1,127,795,232 | ) |
| | | | |
Increase (decrease) in net assets derived from capital share transactions | | | (88,424,524 | ) | | | (785,818,783 | ) |
| | | | |
Net increase (decrease) in net assets | | | (74,271,263 | ) | | | (795,940,568 | ) |
|
| Net Assets | |
Beginning of year | | | 1,419,564,031 | | | | 2,215,504,599 | |
| | | | |
End of year | | $ | 1,345,292,768 | | | $ | 1,419,564,031 | |
| | | | |
Undistributed (distributions in excess of) net investment income at end of year | | $ | (108,683 | ) | | $ | 6,955,097 | |
| | | | |
| | | | | | |
The notes to the financial statements are an integral part of,
and should be read in conjunction with, the financial statements. | | | | | 27 | |
Financial Highlights selected per share data and ratios
| | | | | | | | | | | | | | | | | | | | |
| | | Year ended October 31, | |
| Class A | | 2017 | | | 2016 | | | 2015 | | | 2014 | | | 2013 | |
Net asset value at beginning of year | | $ | 8.81 | | | $ | 8.72 | | | $ | 9.27 | | | $ | 9.28 | | | $ | 9.22 | |
| | | | | | | | | | | | | | | | | | | | |
Net investment income (loss) (a) | | | 0.25 | | | | 0.35 | | | | 0.36 | | | | 0.36 | | | | 0.40 | |
Net realized and unrealized gain (loss) on investments | | | 0.15 | | | | 0.08 | | | | (0.63 | ) | | | (0.05 | ) | | | 0.06 | |
Net realized and unrealized gain (loss) on foreign currency transactions | | | (0.00 | )‡ | | | (0.02 | ) | | | 0.02 | | | | 0.01 | | | | (0.01 | ) |
| | | | | | | | | | | | | | | | | | | | |
Total from investment operations | | | 0.40 | | | | 0.41 | | | | (0.25 | ) | | | 0.32 | | | | 0.45 | |
| | | | | | | | | | | | | | | | | | | | |
| Less dividends and distributions: | | | | | | | | | | | | | | | | | | | | |
From net investment income | | | (0.31 | ) | | | (0.32 | ) | | | (0.30 | ) | | | (0.33 | ) | | | (0.39 | ) |
Return of capital | | | (0.00 | )‡ | | | — | | | | — | | | | — | | | | — | |
| | | | | | | | | | | | | | | | | | | | |
Total dividends and distributions | | | (0.31 | ) | | | (0.32 | ) | | | (0.30 | ) | | | (0.33 | ) | | | (0.39 | ) |
| | | | | | | | | | | | | | | | | | | | |
Net asset value at end of year | | $ | 8.90 | | | $ | 8.81 | | | $ | 8.72 | | | $ | 9.27 | | | $ | 9.28 | |
| | | | | | | | | | | | | | | | | | | | |
Total investment return (b) | | | 4.65 | % | | | 4.94 | % | | | (2.70 | %) | | | 3.48 | % | | | 4.96 | % |
| Ratios (to average net assets)/Supplemental Data: | | | | | | | | | | | | | | | | | | | | |
Net investment income (loss) | | | 2.79 | % | | | 4.04 | % | | | 4.01 | % | | | 3.81 | % | | | 4.25 | % |
Net expenses (excluding short sale expenses) | | | 1.01 | % | | | 1.00 | % | | | 0.96 | % | | | 0.98 | % | | | 1.00 | % |
Expenses (including short sales expenses) | | | 1.13 | % | | | 1.16 | % | | | 1.01 | % | | | 1.04 | % | | | 1.12 | % |
Short sale expenses | | | 0.12 | % | | | 0.16 | % | | | 0.05 | % | | | 0.06 | % | | | 0.12 | % |
Portfolio turnover rate | | | 41 | % | | | 15 | % | | | 22 | % | | | 19 | % | | | 23 | % |
Net assets at end of year (in 000’s) | | $ | 302,192 | | | $ | 412,834 | | | $ | 584,184 | | | $ | 675,552 | | | $ | 317,917 | |
| ‡ | Less than one cent per share. |
| (a) | Per share data based on average shares outstanding during the year. |
| (b) | Total investment return is calculated exclusive of sales charges and assumes the reinvestment of dividends and distributions. For periods of less than one year, total return is not annualized. |
| | | | | | | | | | | | | | | | | | | | |
| | | Year ended October 31, | |
| Investor Class | | 2017 | | | 2016 | | | 2015 | | | 2014 | | | 2013 | |
Net asset value at beginning of year | | $ | 8.88 | | | $ | 8.78 | | | $ | 9.33 | | | $ | 9.34 | | | $ | 9.28 | |
| | | | | | | | | | | | | | | | | | | | |
Net investment income (loss) (a) | | | 0.24 | | | | 0.35 | | | | 0.36 | | | | 0.36 | | | | 0.39 | |
Net realized and unrealized gain (loss) on investments | | | 0.16 | | | | 0.10 | | | | (0.63 | ) | | | (0.05 | ) | | | 0.06 | |
Net realized and unrealized gain (loss) on foreign currency transactions | | | (0.00 | )‡ | | | (0.03 | ) | | | 0.02 | | | | 0.01 | | | | (0.01 | ) |
| | | | | | | | | | | | | | | | | | | | |
Total from investment operations | | | 0.40 | | | | 0.42 | | | | (0.25 | ) | | | 0.32 | | | | 0.44 | |
| | | | | | | | | | | | | | | | | | | | |
| Less dividends and distributions: | | | | | | | | | | | | | | | | | | | | |
From net investment income | | | (0.31 | ) | | | (0.32 | ) | | | (0.30 | ) | | | (0.33 | ) | | | (0.38 | ) |
Return of capital | | | (0.00 | )‡ | | | — | | | | — | | | | — | | | | — | |
| | | | | | | | | | | | | | | | | | | | |
Total dividends and distributions | | | (0.31 | ) | | | (0.32 | ) | | | (0.30 | ) | | | (0.33 | ) | | | (0.38 | ) |
| | | | | | | | | | | | | | | | | | | | |
Net asset value at end of year | | $ | 8.97 | | | $ | 8.88 | | | $ | 8.78 | | | $ | 9.33 | | | $ | 9.34 | |
| | | | | | | | | | | | | | | | | | | | |
Total investment return (b) | | | 4.59 | % | | | 5.00 | % | | | (2.70 | %) | | | 3.42 | % | | | 4.76 | % |
| Ratios (to average net assets)/Supplemental Data: | | | | | | | | | | | | | | | | | | | | |
Net investment income (loss) | | | 2.74 | % | | | 4.01 | % | | | 3.99 | % | | | 3.78 | % | | | 4.12 | % |
Net expenses (excluding short sale expenses) | | | 1.03 | % | | | 1.02 | % | | | 0.98 | % | | | 1.00 | % | | | 1.15 | % |
Expenses (including short sales) | | | 1.15 | % | | | 1.18 | % | | | 1.03 | % | | | 1.06 | % | | | 1.27 | % |
Short sale expenses | | | 0.12 | % | | | 0.16 | % | | | 0.05 | % | | | 0.06 | % | | | 0.12 | % |
Portfolio turnover rate | | | 41 | % | | | 15 | % | | | 22 | % | | | 19 | % | | | 23 | % |
Net assets at end of year (in 000’s) | | $ | 22,033 | | | $ | 31,851 | | | $ | 32,498 | | | $ | 31,690 | | | $ | 28,341 | |
| ‡ | Less than one cent per share. |
| (a) | Per share data based on average shares outstanding during the year. |
| (b) | Total investment return is calculated exclusive of sales charges and assumes the reinvestment of dividends and distributions. For periods of less than one year, total return is not annualized. |
| | | | |
| 28 | | MainStay Unconstrained Bond Fund | | The notes to the financial statements are an integral part of,
and should be read in conjunction with, the financial statements. |
Financial Highlights selected per share data and ratios
| | | | | | | | | | | | | | | | | | | | |
| | | Year ended October 31, | |
| Class B | | 2017 | | | 2016 | | | 2015 | | | 2014 | | | 2013 | |
Net asset value at beginning of year | | $ | 8.77 | | | $ | 8.68 | | | $ | 9.23 | | | $ | 9.24 | | | $ | 9.18 | |
| | | | | | | | | | | | | | | | | | | | |
Net investment income (loss) (a) | | | 0.18 | | | | 0.28 | | | | 0.29 | | | | 0.28 | | | | 0.31 | |
Net realized and unrealized gain (loss) on investments | | | 0.15 | | | | 0.10 | | | | (0.62 | ) | | | (0.04 | ) | | | 0.07 | |
Net realized and unrealized gain (loss) on foreign currency transactions | | | (0.00 | )‡ | | | (0.03 | ) | | | 0.02 | | | | 0.01 | | | | (0.01 | ) |
| | | | | | | | | | | | | | | | | | | | |
Total from investment operations | | | 0.33 | | | | 0.35 | | | | (0.31 | ) | | | 0.25 | | | | 0.37 | |
| | | | | | | | | | | | | | | | | | | | |
| Less dividends and distributions: | | | | | | | | | | | | | | | | | | | | |
From net investment income | | | (0.24 | ) | | | (0.26 | ) | | | (0.24 | ) | | | (0.26 | ) | | | (0.31 | ) |
Return of capital | | | (0.00 | )‡ | | | — | | | | — | | | | — | | | | — | |
| | | | | | | | | | | | | | | | | | | | |
Total dividends and distributions | | | (0.24 | ) | | | (0.26 | ) | | | (0.24 | ) | | | (0.26 | ) | | | (0.31 | ) |
| | | | | | | | | | | | | | | | | | | | |
Net asset value at end of year | | $ | 8.86 | | | $ | 8.77 | | | $ | 8.68 | | | $ | 9.23 | | | $ | 9.24 | |
| | | | | | | | | | | | | | | | | | | | |
Total investment return (b) | | | 3.86 | % | | | 4.16 | % | | | (3.45 | %) | | | 2.71 | % | | | 4.05 | % |
| Ratios (to average net assets)/Supplemental Data: | | | | | | | | | | | | | | | | | | | | |
Net investment income (loss) | | | 2.00 | % | | | 3.26 | % | | | 3.24 | % | | | 3.03 | % | | | 3.38 | % |
Net expenses (excluding short sales expenses) | | | 1.78 | % | | | 1.77 | % | | | 1.73 | % | | | 1.75 | % | | | 1.90 | % |
Expenses (including short sales expenses) | | | 1.90 | % | | | 1.93 | % | | | 1.78 | % | | | 1.81 | % | | | 2.02 | % |
Short sale expenses | | | 0.12 | % | | | 0.16 | % | | | 0.05 | % | | | 0.06 | % | | | 0.12 | % |
Portfolio turnover rate | | | 41 | % | | | 15 | % | | | 22 | % | | | 19 | % | | | 23 | % |
Net assets at end of year (in 000’s) | | $ | 15,223 | | | $ | 18,313 | | | $ | 19,833 | | | $ | 22,460 | | | $ | 19,254 | |
| ‡ | Less than one cent per share. |
| (a) | Per share data based on average shares outstanding during the year. |
| (b) | Total investment return is calculated exclusive of sales charges and assumes the reinvestment of dividends and distributions. For periods of less than one year, total return is not annualized. |
| | | | | | | | | | | | | | | | | | | | |
| | | Year ended October 31, | |
| Class C | | 2017 | | | 2016 | | | 2015 | | | 2014 | | | 2013 | |
Net asset value at beginning of year | | $ | 8.76 | | | $ | 8.67 | | | $ | 9.22 | | | $ | 9.23 | | | $ | 9.18 | |
| | | | | | | | | | | | | | | | | | | | |
Net investment income (loss) (a) | | | 0.18 | | | | 0.28 | | | | 0.29 | | | | 0.28 | | | | 0.31 | |
Net realized and unrealized gain (loss) on investments | | | 0.15 | | | | 0.10 | | | | (0.62 | ) | | | (0.04 | ) | | | 0.06 | |
Net realized and unrealized gain (loss) on foreign currency transactions | | | (0.00 | )‡ | | | (0.03 | ) | | | 0.02 | | | | 0.01 | | | | (0.01 | ) |
| | | | | | | | | | | | | | | | | | | | |
Total from investment operations | | | 0.33 | | | | 0.35 | | | | (0.31 | ) | | | 0.25 | | | | 0.36 | |
| | | | | | | | | | | | | | | | | | | | |
| Less dividends and distributions: | | | | | | | | | | | | | | | | | | | | |
From net investment income | | | (0.24 | ) | | | (0.26 | ) | | | (0.24 | ) | | | (0.26 | ) | | | (0.31 | ) |
Return of capital | | | (0.00 | )‡ | | | — | | | | — | | | | — | | | | — | |
| | | | | | | | | | | | | | | | | | | | |
Total dividends and distributions | | | (0.24 | ) | | | (0.26 | ) | | | (0.24 | ) | | | (0.26 | ) | | | (0.31 | ) |
| | | | | | | | | | | | | | | | | | | | |
Net asset value at end of year | | $ | 8.85 | | | $ | 8.76 | | | $ | 8.67 | | | $ | 9.22 | | | $ | 9.23 | |
| | | | | | | | | | | | | | | | | | | | |
Total investment return (b) | | | 3.86 | % | | | 4.16 | % | | | (3.46 | %) | | | 2.71 | % | | | 4.05 | % |
| Ratios (to average net assets)/Supplemental Data: | | | | | | | | | | | | | | | | | | | | |
Net investment income (loss) | | | 2.00 | % | | | 3.27 | % | | | 3.24 | % | | | 3.05 | % | | | 3.34 | % |
Net expenses (excluding short sale expenses) | | | 1.78 | % | | | 1.77 | % | | | 1.73 | % | | | 1.75 | % | | | 1.90 | % |
Expenses (including short sales) | | | 1.90 | % | | | 1.93 | % | | | 1.78 | % | | | 1.81 | % | | | 2.02 | % |
Short sale expenses | | | 0.12 | % | | | 0.16 | % | | | 0.05 | % | | | 0.06 | % | | | 0.12 | % |
Portfolio turnover rate | | | 41 | % | | | 15 | % | | | 22 | % | | | 19 | % | | | 23 | % |
Net assets at end of year (in 000’s) | | $ | 167,595 | | | $ | 220,513 | | | $ | 315,183 | | | $ | 345,900 | | | $ | 113,183 | |
| ‡ | Less than one cent per share. |
| (a) | Per share data based on average shares outstanding during the year. |
| (b) | Total investment return is calculated exclusive of sales charges and assumes the reinvestment of dividends and distributions. For periods of less than one year, total return is not annualized. |
| | | | | | |
The notes to the financial statements are an integral part of,
and should be read in conjunction with, the financial statements. | | | | | 29 | |
Financial Highlights selected per share data and ratios
| | | | | | | | | | | | | | | | | | | | |
| | | Year ended October 31, | |
| Class I | | 2017 | | | 2016 | | | 2015 | | | 2014 | | | 2013 | |
Net asset value at beginning of year | | $ | 8.82 | | | $ | 8.72 | | | $ | 9.28 | | | $ | 9.29 | | | $ | 9.23 | |
| | | | | | | | | | | | | | | | | | | | |
Net investment income (loss) (a) | | | 0.26 | | | | 0.37 | | | | 0.38 | | | | 0.38 | | | | 0.41 | |
Net realized and unrealized gain (loss) on investments | | | 0.16 | | | | 0.11 | | | | (0.63 | ) | | | (0.05 | ) | | | 0.07 | |
Net realized and unrealized gain (loss) on foreign currency transactions | | | (0.00 | )‡ | | | (0.03 | ) | | | 0.02 | | | | 0.01 | | | | (0.01 | ) |
| | | | | | | | | | | | | | | | | | | | |
Total from investment operations | | | 0.42 | | | | 0.45 | | | | (0.23 | ) | | | 0.34 | | | | 0.47 | |
| | | | | | | | | | | | | | | | | | | | |
| Less dividends and distributions: | | | | | | | | | | | | | | | | | | | | |
From net investment income | | | (0.33 | ) | | | (0.35 | ) | | | (0.33 | ) | | | (0.35 | ) | | | (0.41 | ) |
Return of capital | | | (0.00 | )‡ | | | — | | | | — | | | | — | | | | — | |
| | | | | | | | | | | | | | | | | | | | |
Total dividends and distributions | | | (0.33 | ) | | | (0.35 | ) | | | (0.33 | ) | | | (0.35 | ) | | | (0.41 | ) |
| | | | | | | | | | | | | | | | | | | | |
Net asset value at end of year | | $ | 8.91 | | | $ | 8.82 | | | $ | 8.72 | | | $ | 9.28 | | | $ | 9.29 | |
| | | | | | | | | | | | | | | | | | | | |
Total investment return (b) | | | 4.90 | % | | | 5.32 | % | | | (2.56 | %) | | | 3.73 | % | | | 5.32 | % |
| Ratios (to average net assets)/Supplemental Data: | | | | | | | | | | | | | | | | | | | | |
Net investment income (loss) | | | 2.99 | % | | | 4.30 | % | | | 4.25 | % | | | 4.08 | % | | | 4.45 | % |
Net expenses (excluding short sale expenses) | | | 0.76 | % | | | 0.75 | % | | | 0.71 | % | | | 0.73 | % | | | 0.75 | % |
Expenses (including short sales) | | | 0.88 | % | | | 0.91 | % | | | 0.76 | % | | | 0.79 | % | | | 0.87 | % |
Short sale expenses | | | 0.12 | % | | | 0.16 | % | | | 0.05 | % | | | 0.06 | % | | | 0.12 | % |
Portfolio turnover rate | | | 41 | % | | | 15 | % | | | 22 | % | | | 19 | % | | | 23 | % |
Net assets at end of year (in 000’s) | | $ | 837,363 | | | $ | 735,359 | | | $ | 1,263,695 | | | $ | 1,481,314 | | | $ | 294,560 | |
| ‡ | Less than one cent per share. |
| (a) | Per share data based on average shares outstanding during the year. |
| (b) | Total investment return is calculated exclusive of sales charges and assumes the reinvestment of dividends and distributions. Class I shares are not subject to sales charges. For periods of less than one year, total return is not annualized. |
| | | | | | | | | | | | | | | | |
| | | Year ended October 31, | | | February 28,
2014** through October 31, | |
| Class R2 | | 2017 | | | 2016 | | | 2015 | | | 2014 | |
Net asset value at beginning of period | | $ | 8.81 | | | $ | 8.72 | | | $ | 9.27 | | | $ | 9.39 | |
| | | | | | | | | | | | | | | | |
Net investment income (loss) (a) | | | 0.23 | | | | 0.34 | | | | 0.35 | | | | 0.23 | |
Net realized and unrealized gain (loss) on investments | | | 0.16 | | | | 0.10 | | | | (0.63 | ) | | | (0.16 | ) |
Net realized and unrealized gain (loss) on foreign currency transactions | | | (0.00 | )‡ | | | (0.03 | ) | | | 0.02 | | | | 0.02 | |
| | | | | | | | | | | | | | | | |
Total from investment operations | | | 0.39 | | | | 0.41 | | | | (0.26 | ) | | | 0.09 | |
| | | | | | | | | | | | | | | | |
| Less dividends and distributions: | | | | | | | | | | | | | | | | |
From net investment income | | | (0.30 | ) | | | (0.32 | ) | | | (0.29 | ) | | | (0.21 | ) |
Return of capital | | | (0.00 | )‡ | | | — | | | | — | | | | — | |
| | | | | | | | | | | | | | | | |
Total dividends and distributions | | | (0.30 | ) | | | (0.32 | ) | | | (0.29 | ) | | | (0.21 | ) |
| | | | | | | | | | | | | | | | |
Net asset value at end of period | | $ | 8.90 | | | $ | 8.81 | | | $ | 8.72 | | | $ | 9.27 | |
| | | | | | | | | | | | | | | | |
Total investment return (b) | | | 4.54 | % | | | 4.84 | % | | | (2.81 | %) | | | 0.99 | % |
| Ratios (to average net assets)/Supplemental Data: | | | | | | | | | | | | | | | | |
Net investment income (loss) | | | 2.63 | % | | | 3.97 | % | | | 3.87 | % | | | 3.78 | %†† |
Net expenses | | | 1.11 | % | | | 1.12 | % | | | 1.06 | % | | | 1.08 | %†† |
Expenses (including short sales) | | | 1.23 | % | | | 1.28 | % | | | 1.11 | % | | | 1.14 | %†† |
Short sale expenses | | | 0.12 | % | | | 0.16 | % | | | 0.05 | % | | | 0.06 | %†† |
Portfolio turnover rate | | | 41 | % | | | 15 | % | | | 22 | % | | | 19 | % |
Net assets at end of period (in 000’s) | | $ | 773 | | | $ | 662 | | | $ | 112 | | | $ | 336 | |
| ‡ | Less than one cent per share. |
| (a) | Per share data based on average shares outstanding during the period. |
| (b) | Total investment return is calculated exclusive of sales charges and assumes the reinvestment of dividends and distributions. Class R2 shares are not subject to sales charges. For periods of less than one year, total return is not annualized. |
| | | | |
| 30 | | MainStay Unconstrained Bond Fund | | The notes to the financial statements are an integral part of,
and should be read in conjunction with, the financial statements. |
Financial Highlights selected per share data and ratios
| | | | | | | | |
| | | | | | February 29,
2016**
through October 31, | |
| Class R3 | | 2017 | | | 2016 | |
Net asset value at beginning of period | | $ | 8.81 | | | $ | 8.20 | |
| | | | | | | | |
Net investment income (loss) (a) | | | 0.21 | | | | 0.21 | |
Net realized and unrealized gain (loss) on investments | | | 0.16 | | | | 0.86 | |
Net realized and unrealized gain (loss) on foreign currency transactions | | | (0.00 | )‡ | | | (0.27 | ) |
| | | | | | | | |
Total from investment operations | | | 0.37 | | | | 0.80 | |
| | | | | | | | |
| Less dividends and distributions: | | | | | | | | |
From net investment income | | | (0.28 | ) | | | (0.19 | ) |
Return of capital | | | (0.00 | )‡ | | | — | |
| | | | | | | | |
Total dividends and distributions | | | (0.28 | ) | | | (0.19 | ) |
| | | | | | | | |
Net asset value at end of period | | $ | 8.90 | | | $ | 8.81 | |
| | | | | | | | |
Total investment return (b) | | | 4.28 | % | | | 9.77 | % |
| Ratios (to average net assets)/Supplemental Data: | | | | | | | | |
Net investment income (loss) | | | 2.34 | % | | | 3.32 | %†† |
Net expenses | | | 1.36 | % | | | 1.34 | %†† |
Expenses (including short sales) | | | 1.48 | % | | | 1.50 | %†† |
Short sale expenses | | | 0.12 | % | | | 0.16 | % |
Portfolio turnover rate | | | 41 | % | | | 15 | % |
Net assets at end of period (in 000’s) | | $ | 114 | | | $ | 32 | |
| ‡ | Less than one cent per share. |
| (a) | Per share data based on average shares outstanding during the period. |
| (b) | Total investment return is calculated exclusive of sales charges and assumes the reinvestment of dividends and distributions. Class R3 shares are not subject to sales charges. For periods of less than one year, total return is not annualized. |
| | | | | | |
The notes to the financial statements are an integral part of,
and should be read in conjunction with, the financial statements. | | | | | 31 | |
Notes to Financial Statements
Note 1–Organization and Business
The MainStay Funds (the “Trust”) was organized on January 9, 1986, as a Massachusetts business trust, and is governed by a Declaration of Trust. The Trust is registered under the Investment Company Act of 1940, as amended (the “1940 Act”), as an open-end management investment company, and is comprised of twelve funds (collectively referred to as the “Funds”). These financial statements and notes relate to the MainStay Unconstrained Bond Fund, (the “Fund”), a “diversified” fund, as that term is defined in the 1940 Act, as interpreted or modified by regulatory authorities having jurisdiction, from time to time.
The Fund currently has nine classes of shares registered for sale. Class A and Class B shares have an inception date of on February 28, 1997. Class C shares commenced operations on September 1, 1998. Class I shares has an inception date of January 2, 2004. Investor Class shares has an inception date of February 28, 2008. Class R2 shares commenced operations on February 28, 2014. Class R3 shares has an inception date of February 29, 2016. Class R6 and Class T shares of the Fund were registered for sale effective as of February 28, 2017. As of October 31, 2017, Class R6 and Class T shares were not yet offered for sale. Effective February 28, 2017, Class B shares of the MainStay Group of Funds were closed to all new purchases as well as additional investments by existing Class B shareholders. Existing Class B shareholders may continue to reinvest dividends and capital gains distributions, as well as exchange their Class B shares for Class B shares of other MainStay Group of Funds as permitted by the current exchange privileges. Class B shareholders continue to be subject to any applicable contingent deferred sales charge (“CDSC”) at the time of redemption. All other features of the Class B shares, including but not limited to the fees and expenses applicable to Class B shares, remain unchanged. Unless redeemed, Class B shareholders will remain in Class B shares of their respective fund until the Class B shares are converted to Class A or Investor Class shares pursuant to the applicable conversion schedule.
Class A and Investor Class shares are offered at net asset value (“NAV”) per share plus an initial sales charge. No initial sales charge applies to investments of $1 million or more (and certain other qualified purchases) in Class A and Investor Class shares. Effective August 1, 2017, contingent deferred sales charge (“CDSC”) of 1.00% may be imposed on certain redemptions of Class A and Investor Class shares made within 18 months of the date of purchase on shares that were made without an initial sales charge. For purchases of Class A and Investor Class shares made from January 1, 2017 through July 31, 2017, a CDSC of 1.00% may be imposed on certain redemptions of such shares made within 24 months of the date of purchase on shares that were purchased without an initial sales charge. For purchases of Class A and Investor Class shares made prior to January 1, 2017, a CDSC of 1.00% may be imposed on certain redemptions made within one year of the date of purchase on shares purchased without a sales charge. Class C shares are offered at NAV without an initial sales charge, although a 1.00% CDSC may be imposed on redemptions made within one year of the date of purchase of Class C shares. When Class B shares were offered, they were offered at NAV without an initial sales charge, although a CDSC that declines depending on the number of years a shareholder has held its Class B shares may be imposed on redemptions made within six years of the date of purchase of such shares. Class T shares are offered at NAV per share plus an initial sales
charge. Class I and Class R2 shares are offered at NAV and are not subject to a sales charge. Depending upon eligibility, Class B shares convert to either Class A or Investor Class shares at the end of the calendar quarter eight years after the date they were purchased. Additionally, depending upon eligibility, Class A shares may convert to Investor Class shares and Investor Class shares may convert to Class A shares. Under certain circumstances and as may be permitted by the Trust’s multiple class plan under Rule 18f-3 of the 1940 Act, an exchange/conversion may be made from specified share classes of the Fund to one or more other share classes of the Fund as disclosed in the capital share transactions within these notes. The nine classes of shares have the same voting (except for issues that relate solely to one class), dividend, liquidation and other rights, and the same terms and conditions, except that under distribution plans pursuant to Rule 12b-1 under the 1940 Act, Class B and Class C shares are subject to higher distribution and/or service fee rates than Class A, Investor Class, Class T and Class R2 shares. Class I and Class R6 shares are not subject to a distribution and/or service fee. Class R2 shares are subject to a shareholder service fee. This is in addition to any fees paid under a distribution plan, where applicable.
The Fund’s investment objective is to seek total return by investing primarily in domestic and foreign debt securities.
Note 2–Significant Accounting Policies
The Fund is an investment company and accordingly follows the investment company accounting and reporting guidance of the Financial Accounting Standards Board (“FASB”) Accounting Standard Codification Topic 946 Financial Services—Investment Companies. The Fund prepares its financial statements in accordance with generally accepted accounting principles (“GAAP”) in the United States of America and follows the significant accounting policies described below.
(A) Securities Valuation. Investments are usually valued as of the close of regular trading on the New York Stock Exchange (the “Exchange”) (usually 4:00 p.m. Eastern time) on each day the Fund is open for business (“valuation date”).
The Board of Trustees of the Trust (the “Board”) adopted procedures establishing methodologies for the valuation of the Fund’s securities and other assets and delegated the responsibility for valuation determinations under those procedures to the Valuation Committee of the Trust (the “Valuation Committee”). The Board authorized the Valuation Committee to appoint a Valuation Subcommittee (the “Subcommittee”) to deal in the first instance with establishing the prices of securities for which market quotations are not readily available or the prices of which are not otherwise readily determinable under these procedures. The Subcommittee meets (in person, via electronic mail or via teleconference) on an as-needed basis. Subsequently, the Valuation Committee meets to ensure that actions taken by the Subcommittee were appropriate. The procedures state that, subject to the oversight of the Board and unless otherwise noted, the responsibility for the day-to-day valuation of portfolio assets (including fair value measurements for the Fund’s assets and liabilities) rests with New York Life Investment Management LLC (“New York Life Investments” or the “Manager”), aided to whatever extent necessary by the Subadvisor (as defined in Note 3(A)).
| | |
| 32 | | MainStay Unconstrained Bond Fund |
To assess the appropriateness of security valuations, the Manager, the Subadvisor or the Fund’s third-party service provider, who is subject to oversight by the Manager, regularly compares prior day prices, prices on comparable securities and the sale prices to the prior and current day prices and challenges prices with changes exceeding certain tolerance levels with third-party pricing services or broker sources. For those securities valued through either a standardized fair valuation methodology or a fair valuation measurement, the Subcommittee deals in the first instance with such valuation and the Valuation Committee reviews and affirms, if appropriate, the reasonableness of the valuation based on such methodologies and measurements on a regular basis after considering information that is reasonably available and deemed relevant by the Valuation Committee. Any action taken by the Subcommittee with respect to the valuation of a portfolio security or other asset is submitted for review and ratification (if appropriate) to the Valuation Committee and the Board at the next regularly scheduled meeting.
“Fair value” is defined as the price the Fund would reasonably expect to receive upon selling an asset or liability in an orderly transaction to an independent buyer in the principal or most advantageous market for the asset or liability. Fair value measurements are determined within a framework that establishes a three-tier hierarchy which maximizes the use of observable market data and minimizes the use of unobservable inputs to establish a classification of fair value measurements for disclosure purposes. “Inputs” refer broadly to the assumptions that market participants would use in pricing the asset or liability, including assumptions about risk, such as the risk inherent in a particular valuation technique used to measure fair value using a pricing model and/or the risk inherent in the inputs for the valuation technique. Inputs may be observable or unobservable. Observable inputs reflect the assumptions market participants would use in pricing the asset or liability based on market data obtained from sources independent of the Fund. Unobservable inputs reflect the Fund’s own assumptions about the assumptions market participants would use in pricing the asset or liability based on the information available. The inputs or methodology used for valuing assets or liabilities may not be an indication of the risks associated with investing in those assets or liabilities. The three-tier hierarchy of inputs is summarized below.
| • | | Level 1—quoted prices in active markets for an identical asset or liability |
| • | | Level 2—other significant observable inputs (including quoted prices for a similar asset or liability in active markets, interest rates and yield curves, prepayment speeds, credit risk, etc.) |
| • | | Level 3—significant unobservable inputs (including the Fund’s own assumptions about the assumptions that market participants would use in measuring fair value of an asset or liability) |
The level of an asset or liability within the fair value hierarchy is based on the lowest level of an input, both individually and in the aggregate, that is significant to the fair value measurement. As of October 31, 2017, the aggregate value by input level of the Fund’s assets and liabilities is included at the end of the Fund’s Portfolio of Investments.
The Fund may use third-party vendor evaluations, whose prices may be derived from one or more of the following standard inputs, among others:
| | |
• Benchmark yields | | • Reported trades |
• Broker/dealer quotes | | • Issuer spreads |
• Two-sided markets | | • Benchmark securities |
• Bids/offers | | • Reference data (corporate actions or material event notices) |
• Industry and economic events | | • Comparable bonds |
• Monthly payment information | | |
An asset or liability for which market values cannot be measured using the methodologies described above is valued by methods deemed reasonable in good faith by the Valuation Committee, following the procedures established by the Board, to represent fair value. Under these procedures, the Fund generally uses a market-based approach which may use related or comparable assets or liabilities, recent transactions, market multiples, book values and other relevant information. The Fund may also use an income-based valuation approach in which the anticipated future cash flows of the asset or liability are discounted to calculate fair value. Discounts may also be applied due to the nature and/or duration of any restrictions on the disposition of the asset or liability. Fair value represents a good faith approximation of the value of a security. Fair value determinations involve the consideration of a number of subjective factors, an analysis of applicable facts and circumstances and the exercise of judgment. As a result, it is possible that the fair value for a security determined in good faith in accordance with the Fund’s valuation procedures may differ from valuations for the same security determined by other funds using their own valuation procedures. Although the Fund’s valuation procedures are designed to value a security at the price the Fund may reasonably expect to receive upon the security’s sale in an orderly transaction, there can be no assurance that any fair value determination thereunder would, in fact, approximate the amount that the Fund would actually realize upon the sale of the security or the price at which the security would trade if a reliable market price were readily available. During the year ended October 31, 2017, there were no material changes to the fair value methodologies.
Securities which may be valued in this manner include, but are not limited to: (i) a security for which trading has been halted or suspended; (ii) a debt security that has recently gone into default and for which there is not a current market quotation; (iii) a security of an issuer that has entered into a restructuring; (iv) a security that has been de-listed from a national exchange; (v) a security for which the market price is not readily available from a third-party pricing source or, if so provided, does not, in the opinion of the Manager or Subadvisor reflect the security’s market value; (vi) a security subject to trading collars for which no or limited trading takes place; and (vii) a security whose principal market has been temporarily closed at a time when, under normal conditions, it would be open. Securities for which market quotations or observable inputs are not readily available are generally categorized as Level 3 in the hierarchy. As of October 31, 2017, a security that was fair valued in such a manner is shown in the Portfolio of Investments.
Notes to Financial Statements (continued)
Equity securities, rights and warrants are valued at the last quoted sales prices as of the close of regular trading on the relevant exchange on each valuation date. Securities that are not traded on the valuation date are valued at the mean of the last quoted bid and ask prices. Prices are normally taken from the principal market in which each security trades. Futures contracts are valued at the last posted settlement price on the market where such futures are primarily traded. Investments in mutual funds, including money market funds, are valued at their respective NAVs as of the close of the Exchange on the valuation date. These securities are generally categorized as Level 1 in the hierarchy.
Debt securities (other than convertible and municipal bonds) are valued at the evaluated bid prices (evaluated mean prices in the case of convertible and municipal bonds) supplied by a pricing agent or broker selected by the Manager, in consultation with the Subadvisor. Those values reflect broker/dealer supplied prices and electronic data processing techniques, if the evaluated bid or mean prices are deemed by the Manager, in consultation with the Subadvisor, to be representative of market values at the regular close of trading of the Exchange on each valuation date. Debt securities purchased on a delayed delivery basis are marked to market daily until settlement at the forward settlement date. Debt securities, including corporate bonds, U.S. Government & federal agency bonds, municipal bonds, foreign bonds, convertible bonds, asset-backed securities and mortgage-backed securities are generally categorized as Level 2 in the hierarchy.
Certain securities held by the Fund may principally trade in foreign markets. Events may occur between the time the foreign markets close and the time at which the Fund’s NAVs are calculated. These events may include, but are not limited to, situations relating to a single issuer in a market sector, significant fluctuations in U.S. or foreign markets, natural disasters, armed conflicts, governmental actions or other developments not tied directly to the securities markets. Should the Manager or Subadvisor conclude that such events may have affected the accuracy of the last price of such securities reported on the local foreign market, the Subcommittee may, pursuant to procedures adopted by the Board, adjust the value of the local price to reflect the estimated impact on the price of such securities as a result of such events. In this instance, securities are generally categorized as Level 3 in the hierarchy. Additionally, certain foreign equity securities are also fair valued whenever the movement of a particular index exceeds certain thresholds. In such cases, the securities are fair valued by applying factors provided by a third-party vendor in accordance with valuation procedures adopted by the Board and are generally categorized as Level 2 in the hierarchy. As of October 31, 2017, no foreign equity securities held by the Fund were fair valued in such a manner.
Foreign currency forward contracts are valued at their fair market values measured on the basis of the mean between the last current bid and ask prices based on dealer or exchange quotations and are generally categorized as Level 2 in the hierarchy.
Loan assignments, participations and commitments are valued at the average of bid quotations obtained from the engaged independent pricing service and are generally categorized as Level 2 in the hierarchy. Certain loan assignments, participations and commitments may be valued by utilizing significant unobservable inputs obtained from the pricing service and are generally categorized as Level 3 in the hierarchy.
As of October 31, 2017, the Fund held Level 3 securities with a value of $18,991,033 that were valued by utilizing significant unobservable inputs.
Temporary cash investments acquired in excess of 60 days to maturity at the time of purchase are valued using the latest bid prices or using valuations based on a matrix system (which considers such factors as security prices, yields, maturities and ratings), both as furnished by independent pricing services. Other temporary cash investments which mature in 60 days or less at the time of purchase (“Short-Term Investments”) are valued using the amortized cost method of valuation, unless the use of such method would be inappropriate. The amortized cost method involves valuing a security at its cost on the date of purchase and thereafter assuming a constant amortization to maturity of the difference between such cost and the value on maturity date. Amortized cost approximates the current fair value of a security. Securities valued using the amortized cost method are not valued using quoted prices in an active market and are generally categorized as Level 2 in the hierarchy.
Swaps are marked to market daily based upon quotations from pricing agents, brokers or market makers. These securities are generally categorized as Level 2 in the hierarchy.
The information above is not intended to reflect an exhaustive list of the methodologies that may be used to value portfolio investments. The valuation procedures permit the use of a variety of valuation methodologies in connection with valuing portfolio investments. The methodology used for a specific type of investment may vary based on the market data available or other considerations. The methodologies summarized above may not represent the specific means by which portfolio investments are valued on any particular business day.
A portfolio security or other asset may be determined to be illiquid under procedures approved by the Board. Illiquidity of a security might prevent the sale of such security at a time when the Manager or Subadvisor might wish to sell, and these securities could have the effect of decreasing the overall level of the Fund’s liquidity. Further, the lack of an established secondary market may make it more difficult to value illiquid securities, requiring the Fund to rely on judgments that may be somewhat subjective in measuring value, which could vary materially from the amount that the Fund may realize upon disposition. Difficulty in selling illiquid securities may result in a loss or may be costly to the Fund. Under the supervision of the Board, the Manager or Subadvisor determines the liquidity of the Fund’s investments; in doing so, the Manager or Subadvisor may consider various factors, including: (i) the frequency of trades and quotations; (ii) the number of dealers and prospective purchasers; (iii) dealer undertakings to make a market; and (iv) the nature of the security and the market in which it trades (e.g., the time needed to dispose of the security, the method of soliciting offers and the mechanics of transfer). Illiquid securities are often valued in accordance with methods deemed by the Board in good faith to be reasonable and appropriate to accurately reflect their fair value. The liquidity of the Fund’s investments, as shown in the Portfolio of Investments, was determined as of October 31, 2017 and can change at any time in response to, among other relevant factors, market conditions or events or developments with respect to an individual issuer or instrument. As of October 31, 2017, securities deemed to be illiquid under procedures approved by the Board are shown in the Portfolio of Investments.
| | |
| 34 | | MainStay Unconstrained Bond Fund |
(B) Income Taxes. The Fund’s policy is to comply with the requirements of the Internal Revenue Code of 1986, as amended (the “Internal Revenue Code”), applicable to regulated investment companies and to distribute all of its taxable income to the shareholders of the Fund within the allowable time limits. Therefore, no federal, state and local income tax provisions are required.
Management evaluates the Fund’s tax positions to determine if the tax positions taken meet the minimum recognition threshold in connection with accounting for uncertainties in income tax positions taken or expected to be taken for the purposes of measuring and recognizing tax liabilities in the financial statements. Recognition of tax benefits of an uncertain tax position is permitted only to the extent the position is “more likely than not” to be sustained assuming examination by taxing authorities. Management has analyzed the Fund’s tax positions taken on federal, state and local income tax returns for all open tax years (for up to three tax years), and has concluded that no provisions for federal, state and local income tax are required in the Fund’s financial statements. The Fund’s federal, state and local income tax and federal excise tax returns for tax years for which the applicable statutes of limitations have not expired are subject to examination by the Internal Revenue Service and state and local departments of revenue.
(C) Foreign Taxes. The Fund may be subject to foreign taxes on income and other transaction-based taxes imposed by certain countries in which it invests. A portion of the taxes on gains on investments or currency purchases/repatriation may be reclaimable. The Fund will accrue such taxes and reclaims as applicable, based upon its current interpretation of tax rules and regulations that exist in the markets in which it invests.
(D) Dividends and Distributions to Shareholders. Dividends and distributions are recorded on the ex-dividend date. The Fund intends to declare and pay dividends from net investment income, if any, at least monthly and distributions from net realized capital and currency gains, if any, at least annually. Unless the shareholder elects otherwise, all dividends and distributions are reinvested in the same class of shares of the Fund, at NAV. Dividends and distributions to shareholders are determined in accordance with federal income tax regulations and may differ from determinations using GAAP.
(E) Security Transactions and Investment Income. The Fund records security transactions on the trade date. Realized gains and losses on security transactions are determined using the identified cost method. Dividend income is recognized on the ex-dividend date; net of any foreign tax withheld at the source, and interest income is accrued as earned using the effective interest rate method and includes any realized gains and losses from repayments of principal on mortgage-backed securities. Discounts and premiums on securities purchased, other than Short-Term Investments, for the Fund are accreted and amortized, respectively, on the effective interest rate method over the life of the respective securities. Discounts and premiums on Short-Term Investments are accreted and amortized, respectively, on the straight-line method. The straight-line method approximates the effective interest method for Short-Term Investments.
Investment income and realized and unrealized gains and losses on investments of the Fund are allocated pro rata to separate classes of shares based upon their relative net assets on the date the income is earned or realized and unrealized gains and losses are incurred.
The Fund may place a debt security on non-accrual status and reduce related interest income by ceasing current accruals and writing off all or a portion of any interest receivables when the collection of all or a portion of such interest has become doubtful. A debt security is removed from non-accrual status when the issuer resumes interest payments or when collectability of interest is reasonably assured.
(F) Expenses. Expenses of the Trust are allocated to the individual Funds in proportion to the net assets of the respective Funds when the expenses are incurred, except where direct allocations of expenses can be made. Expenses (other than transfer agent expenses and fees incurred under the shareholder services plans and/or the distribution plans further discussed in Note 3(B)) are allocated to separate classes of shares pro rata based upon their relative net assets on the date the expenses are incurred. The expenses borne by the Fund, including those of related parties to the Fund, are shown in the Statement of Operations.
(G) Use of Estimates. In preparing financial statements in conformity with GAAP, management makes estimates and assumptions that affect the reported amounts and disclosures in the financial statements. Actual results could differ from those estimates.
(H) Repurchase Agreements. The Fund may enter into repurchase agreements (i.e., buy a security from another party with the agreement that it be sold back in the future) to earn income. The Fund may enter into repurchase agreements only with counterparties, usually financial institutions, that are deemed by the Manager or Subadvisor to be creditworthy, pursuant to guidelines established by the Board. During the term of any repurchase agreement, the Manager or Subadvisor will continue to monitor the creditworthiness of the counterparty. Under the 1940 Act, repurchase agreements are considered to be collateralized loans by the Fund to the counterparty secured by the securities transferred to the Fund.
Repurchase agreements are subject to counterparty risk, meaning the Fund could lose money by the counterparty’s failure to perform under the terms of the agreement. The Fund mitigates this risk by ensuring the repurchase agreement is collateralized by cash, U.S. government securities, fixed income securities and/or other securities. The collateral is held by the Fund’s custodian and valued daily on a mark to market basis to determine if the value, including accrued interest, exceeds the repurchase price. In the event of the counterparty’s default on the obligation to repurchase, the Fund has the right to liquidate the collateral and apply the proceeds in satisfaction of the obligation. Under certain circumstances, such as in the event of default or bankruptcy by the counterparty, realization and/or retention of the collateral may be limited or subject to delay, to legal proceedings and possible realized loss to the Fund.
(I) Futures Contracts. A futures contract is an agreement to purchase or sell a specified quantity of an underlying instrument at a specified future date and price, or to make or receive a cash payment based on the value of a financial instrument (e.g., foreign currency, interest rate, security or securities index). The Fund is subject to risks such as market price risk and/or interest rate risk in the normal course of investing in these transactions. Upon entering into a futures contract, the Fund is required to pledge to the broker or futures commission mer-
Notes to Financial Statements (continued)
chant an amount of cash and/or U.S. government securities equal to a certain percentage of the collateral amount, known as the “initial margin.” During the period the futures contract is open, changes in the value of the contract are recognized as unrealized appreciation or depreciation by marking to market such contract on a daily basis to reflect the market value of the contract at the end of each day’s trading. The Fund agrees to receive from or pay to the broker or futures commission merchant an amount of cash equal to the daily fluctuation in the value of the contract. Such receipts or payments are known as “variation margin.” When the futures contract is closed, the Fund records a realized gain or loss equal to the difference between the proceeds from (or cost of) the closing transaction and the Fund’s basis in the contract.
The use of futures contracts involves, to varying degrees, elements of market risk in excess of the amount recognized in the Statement of Assets and Liabilities. The contract or notional amounts and variation margin reflect the extent of the Fund’s involvement in open futures positions. There are several risks associated with the use of futures contracts as hedging techniques. There can be no assurance that a liquid market will exist at the time when the Fund seeks to close out a futures contract. If no liquid market exists, the Fund would remain obligated to meet margin requirements until the position is closed. Futures may involve a small initial investment relative to the risk assumed, which could result in losses greater than if they had not been used. Futures may be more volatile than direct investments in the instrument underlying the futures and may not correlate to the underlying instrument, causing a given hedge not to achieve its objectives. The Fund’s activities in futures contracts have minimal counterparty risk as they are conducted through regulated exchanges that guarantee the futures against default by the counterparty. In the event of a bankruptcy or insolvency of a futures commission merchant that holds margin on behalf of the Fund, the Fund may not be entitled to the return of the entire margin owed to the Fund, potentially resulting in a loss. The Fund may invest in futures contracts to help manage the duration and yield curve of the portfolio while minimizing the exposure to wider bid/ask spreads in traditional bonds. The Fund’s investment in futures contracts and other derivatives may increase the volatility of the Fund’s NAVs and may result in a loss to the Fund. As of October 31, 2017, all open futures contracts are shown in the Portfolio of Investments.
(J) Loan Assignments, Participations and Commitments. The Fund may invest in loan assignments and participations (“loans”). Commitments are agreements to make money available to a borrower in a specified amount, at a specified rate and within a specified time. The Fund records an investment when the borrower withdraws money on a commitment or when a funded loan is purchased (trade date) and records interest as earned. These loans pay interest at rates that are periodically reset by reference to a base lending rate plus a spread. These base lending rates are generally the prime rate offered by a designated U.S. bank or the London InterBank Offered Rate (“LIBOR”).
The loans in which the Fund may invest are generally readily marketable, but may be subject to some restrictions on resale. For example, the Fund may be contractually obligated to receive approval from the agent bank and/or borrower prior to the sale of these investments. If the Fund purchases an assignment from a lender, the Fund will generally have direct contractual rights against the borrower in favor of the lender.
If the Fund purchases a participation interest either from a lender or a participant, the Fund typically will have established a direct contractual relationship with the seller of the participation interest, but not with the borrower. Consequently, the Fund is subject to the credit risk of the lender or participant who sold the participation interest to the Fund, in addition to the usual credit risk of the borrower. In the event that the borrower, selling participant or intermediate participants become insolvent or enters into bankruptcy, the Fund may incur certain costs and delays in realizing payment, or may suffer a loss of principal and/or interest.
Unfunded commitments represent the remaining obligation of the Fund to the borrower. At any point in time, up to the maturity date of the issue, the borrower may demand the unfunded portion. Unfunded amounts, if any, are marked to market and any unrealized gains or losses are recorded in the Statement of Assets and Liabilities. As of October 31, 2017, the Fund did not hold any unfunded commitments.
(K) Swap Contracts. The Fund may enter into credit default, interest rate, equity, index and currency exchange rate swap contracts (“swaps”). In a typical swap transaction, two parties agree to exchange the future returns (or differentials in rates of future returns) earned or realized at periodic intervals on a particular investment or instrument based on a notional principal amount. Generally, the Fund will enter into a swap on a net basis, which means that the two payment streams under the swap are netted, with the Fund receiving or paying (as the case may be) only the net amount of the two payment streams. Therefore, the Fund’s current obligation under a swap generally will be equal to the net amount to be paid or received under the swap, based on the relative value of notional positions attributable to each counterparty to the swap. The payments may be adjusted for transaction costs, interest payments, the amount of interest paid on the investment or instrument or other factors. Collateral, in the form of cash or securities, may be required to be held in segregated accounts with the custodian bank or broker in accordance with the terms of the swap. Swap agreements are privately negotiated in the over the counter (“OTC”) market and may be executed in a multilateral or other trade facilities platform, such as a registered commodities exchange (“centrally cleared swaps”).
Certain standardized swaps, including certain credit default and interest rate swaps, are subject to mandatory clearing and exchange-trading, and more types of standardized swaps are expected to be subject to mandatory clearing and exchange-trading in the future. The counterparty risk for exchange-traded and cleared derivatives is expected to be generally lower than for uncleared derivatives, but cleared contracts are not risk-free. In a cleared derivative transaction, the Fund typically enters into the transaction with a financial institution counterparty, and performance of the transaction is effectively guaranteed by a central clearinghouse, thereby reducing or eliminating the Fund’s exposure to the credit risk of its original counterparty. The Fund will be required to post specified levels of margin with the clearinghouse or at the instruction of the clearinghouse; the margin required by a clearinghouse may be greater than the margin the Fund would be required to post in an uncleared transaction. As of October 31, 2017, all swap positions outstanding are shown in the Portfolio of Investments.
Swaps are marked to market daily based upon quotations from pricing agents, brokers or market makers and the change in value, if any, is recorded as unrealized appreciation or depreciation. Any payments
| | |
| 36 | | MainStay Unconstrained Bond Fund |
made or received upon entering into a swap would be amortized or accreted over the life of the swap and recorded as a realized gain or loss. Early termination of a swap is recorded as a realized gain or loss. Daily changes in valuation of centrally cleared swaps, if any, are recorded as a receivable or payable for the change in value as appropriate (“variation margin”) on the Statement of Assets and Liabilities.
The Fund bears the risk of loss of the amount expected to be received under a swap in the event of the default or bankruptcy of the swap counterparty. The Fund may be able to eliminate its exposure under a swap either by assignment or other disposition, or by entering into an offsetting swap with the same party or a similar credit-worthy party. Swaps are not actively traded on financial markets. Entering into swaps involves elements of credit, market and documentation risk in excess of the amounts recognized on the Statement of Assets and Liabilities. Such risks involve the possibilities that there will be no liquid market for these swaps, that the counterparty to the swaps may default on its obligation to perform or disagree as to the meaning of the contractual terms in the swaps and that there may be unfavorable changes in interest rates, the price of the index or the security underlying these transactions.
Interest Rate Swaps: An interest rate swap is an agreement between two parties where one stream of future interest payments is exchanged for another based on a specified principal amount. Interest rate swaps often exchange a fixed payment for a floating payment that is linked to an interest rate (most often the LIBOR). The Fund will typically use interest rate swaps to limit, or manage, its exposure to fluctuations in interest rates, or to obtain a marginally lower interest rate than it would have been able to get without the swap.
Credit Default Swaps: The Fund may enter into credit default swaps to simulate long and short bond positions or to take an active long or short position with respect to the likelihood of a default or credit event by the issuer of the underlying reference obligation. The types of reference obligations underlying the swaps that may be entered into by the Fund include debt obligations of a single issuer of corporate or sovereign debt, a basket of obligations of different issuers or a credit index. A credit index is an equally-weighted credit default swap index that is designed to track a representative segment of the credit default swap market (e.g., investment grade, high volatility, below investment grade or emerging markets) and provides an investor with exposure to specific “baskets” of issuers of certain debt instruments. Index credit default swaps have standardized terms including a fixed spread and standard maturity dates. The composition of the obligations within a particular index changes periodically. Credit default swaps involve one party, the protection buyer, making a stream of payments to another party, the protection seller, in exchange for the right to receive a contingent payment if there is a credit event related to the underlying reference obligation. In the event that the reference obligation matures prior to the termination date of the contract, a similar security will be substituted for the duration of the contract term. Credit events are defined under individual swap agreements and generally include bankruptcy, failure to pay, restructuring, repudiation/moratorium, obligation acceleration and obligation default. Selling protection effectively adds leverage to a portfolio up to the notional amount of the swap agreement. Potential liabilities under these contracts may be reduced by: the auction rates of the underlying reference obligations; upfront payments received at the inception of a swap; and net amounts received from credit default swaps purchased with the identical reference obligation.
(L) Foreign Currency Forward Contracts. The Fund may enter into foreign currency forward contracts, which are agreements to buy or sell foreign currencies on a specified future date at a specified rate. The Fund is subject to foreign currency exchange rate risk in the normal course of investing in these transactions. During the period the forward contract is open, changes in the value of the contract are recognized as unrealized appreciation or depreciation by marking to market such contract on a daily basis to reflect the market value of the contract at the end of each day’s trading. Cash movement occurs on settlement date. When the forward contract is closed, the Fund records a realized gain or loss equal to the difference between the proceeds from (or cost of) the closing transaction and the Fund’s basis in the contract. The Fund may purchase and sell foreign currency forward contracts for purposes of seeking to enhance portfolio returns and manage portfolio risk more efficiently. Foreign currency forward contracts may also be used to gain exposure to a particular currency or to hedge against the risk of loss due to changing currency exchange rates. Foreign currency forward contracts to purchase or sell a foreign currency may also be used in anticipation of future purchases or sales of securities denominated in foreign currency, even if the specific investments have not yet been selected.
The use of foreign currency forward contracts involves, to varying degrees, elements of risk in excess of the amount recognized in the Statement of Assets and Liabilities, including counterparty risk, market risk and illiquidity risk. Counterparty risk is heightened for these instruments because foreign currency forward contracts are not exchange-traded and therefore no clearinghouse or exchange stands ready to meet the obligations under such contracts. Thus, the Fund faces the risk that its counterparties under such contracts may not perform their obligations. Market risk is the risk that the value of a foreign currency forward contract will depreciate due to unfavorable changes in exchange rates. Illiquidity risk arises because the secondary market for foreign currency forward contracts may have less liquidity relative to markets for other securities and financial instruments. Risks also arise from the possible movements in the foreign exchange rates underlying these instruments. While the Fund may enter into forward contracts to reduce currency exchange risks, changes in currency exchange rates may result in poorer overall performance for the Fund than if it had not engaged in such transactions. Exchange rate movements can be large, depending on the currency, and can last for extended periods of time, affecting the value of the Fund’s assets. Moreover, there may be an imperfect correlation between the Fund’s holdings of securities denominated in a particular currency and forward contracts entered into by the Fund. Such imperfect correlation may prevent the Fund from achieving the intended hedge or expose the Fund to the risk of currency exchange loss. The unrealized appreciation (depreciation) on forward contracts also reflects the Fund’s exposure at the valuation date to credit loss in the event of a counterparty’s failure to perform its obligations. As of October 31, 2017, all open foreign currency forward contracts are shown in the Portfolio of Investments.
(M) Foreign Currency Transactions. The Fund’s books and records are maintained in U.S. dollars. Prices of securities denominated in foreign currency amounts are translated into U.S. dollars at the mean between the buying and selling rates last quoted by any major U.S. bank at the following dates:
| (i) | market value of investment securities, other assets and liabilities—at the valuation date; and |
Notes to Financial Statements (continued)
| (ii) | purchases and sales of investment securities, income and expenses—at the date of such transactions. |
The assets and liabilities that are denominated in foreign currency amounts are presented at the exchange rates and market values at the close of the period. The realized and unrealized changes in net assets arising from fluctuations in exchange rates and market prices of securities are not separately presented.
Net realized gain (loss) on foreign currency transactions represents net gains and losses on foreign currency forward contracts, net currency gains or losses realized as a result of differences between the amounts of securities sale proceeds or purchase cost, dividends, interest and withholding taxes as recorded on the Fund’s books, and the U.S. dollar equivalent amount actually received or paid. Net currency gains or losses from valuing such foreign currency denominated assets and liabilities, other than investments at valuation date exchange rates, are reflected in unrealized foreign exchange gains or losses.
(N) Rights and Warrants. Rights are certificates that permit the holder to purchase a certain number of shares, or a fractional share, of a new stock from the issuer at a specific price. Warrants are instruments that entitle the holder to buy an equity security at a specific price for a specific period of time. These investments can provide a greater potential for profit or loss than an equivalent investment in the underlying security. Prices of these investments do not necessarily move in tandem with the prices of the underlying securities.
There is risk involved in the purchase of rights and warrants in that these investments are speculative investments. The Fund could also lose the entire value of its investment in warrants if such warrants are not exercised by the date of its expiration. The Fund is exposed to risk until the sale or exercise of each right or warrant is completed. As of October 31, 2017, the Fund did not hold any rights or warrants.
(O) Securities Sold Short. During the year ended October 31, 2017, the Fund engaged in sales of securities it did not own (“short sales”) as part of its investment strategies. When the Fund enters into a short sale, it must segregate or maintain with a broker the cash proceeds from the security sold short or other securities as collateral for its obligation to deliver the security upon conclusion of the sale. During the period a short position is open, depending on the nature and type of security, a short position is reflected as a liability and is marked to market in accordance with the valuation methodologies previously detailed (See Note 2(A)). Liabilities for securities sold short are closed out by purchasing the applicable securities for delivery to the counterparty broker. A gain, limited to the price at which the Fund sold the security short, or a loss, unlimited as to dollar amount, will be recognized upon termination of a short sale if the market price on the date the short position is closed out is less or greater, respectively, than the proceeds originally received. Any such gain or loss may be offset, completely or in part, by the change in the value of the hedged investments. Interest on short positions held is accrued daily, while dividends declared on short positions existing on the record date are recorded on the ex-dividend date as a dividend expense in the Statement of Operations. Broker fees and other expenses related to securities sold short are disclosed in the Statement of Operations. Short sales involve risk of loss in excess of the related amounts reflected in the Statement of Assets and Liabilities.
(P) Securities Lending. In order to realize additional income, the Fund may engage in securities lending, subject to the limitations set forth in the 1940 Act and relevant guidance by the staff of the Securities and Exchange Commission (“SEC”). In the event the Fund does engage in securities lending, the Fund will lend through its custodian, State Street Bank and Trust Company (“State Street”). State Street will manage the Fund’s collateral in accordance with the lending agreement between the Fund and State Street, and indemnify the Fund against counterparty risk. The loans will be collateralized by U.S. Treasury securities at least equal at all times to the market value of the securities loaned. The Fund may bear the risk of delay in recovery of, or loss of rights in, the securities loaned should the borrower of the securities experience financial difficulty. The Fund may also record a realized gain or loss on securities deemed sold due to a borrower’s inability to return securities on loan. The Fund bears the risk of any loss on investment of the collateral. The Fund will receive compensation for lending its securities in the form of fees or it will retain a portion of interest on the investment of any cash received as collateral. The Fund will also continue to receive interest and dividends on the securities loaned and any gain or loss in the market price of the securities loaned that may occur during the term of the loan will be for the account of the Fund. During the year ended October 31, 2017, the Fund did not have any portfolio securities on loan.
(Q) Restricted Securities. Restricted securities, as disclosed in Note 5, are securities which have been purchased through a private offering and cannot be resold to the general public without prior registration under the Securities Act of 1933, as amended. Disposal of these securities may involve time-consuming negotiations and expenses, and it may be difficult to obtain a prompt sale at an acceptable price.
(R) Debt and Foreign Securities Risk. The Fund’s principal investments may include high yield debt securities (commonly referred to as “junk bonds”), which are considered speculative because they present a greater risk of loss, including default, than higher quality debt securities. These securities pay investors a premium—a higher interest rate or yield than investment grade debt securities—because of the increased risk of loss. These securities can also be subject to greater price volatility. In times of unusual or adverse market, economic or political conditions, these securities may experience higher than normal default rates.
The Fund may invest in loans which are usually rated below investment grade and are generally considered speculative because they present a greater risk of loss, including default, than higher rated debt securities. These investments pay investors a higher interest rate than investment grade debt securities because of the increased risk of loss. Although certain loans are collateralized, there is no guarantee that the value of the collateral will be sufficient to repay the loan. In a recession or serious credit event, the value of these investments could decline significantly. As a result of these and other events, the Fund’s NAVs could go down and you could lose money.
In addition, loans generally are subject to the extended settlement periods that may be longer than seven days. As a result, the Fund may be adversely affected by selling other investments at an unfavorable time and/or under unfavorable conditions or engaging in borrowing
| | |
| 38 | | MainStay Unconstrained Bond Fund |
transactions, such as borrowing against its credit facility, to raise cash to meet redemption obligations or pursue other investment opportunities.
In certain circumstances, loans may not be deemed to be securities. As a result, the Fund may not have the protection of anti-fraud provisions of the federal securities laws. In such cases, the Fund generally must rely on the contractual provisions in the loan agreement and common-law fraud protections under applicable state law.
The Fund may invest in foreign securities, which carry certain risks that are in addition to the usual risks inherent in domestic securities. These risks include those resulting from currency fluctuations, future adverse political or economic developments and possible imposition of currency exchange blockages or other foreign governmental laws or restrictions. These risks are likely to be greater in emerging markets than in developed markets. The ability of issuers of debt securities held by the Fund to meet their obligations may be affected by, among other things, economic or political developments in a specific country, industry or region.
(S) Counterparty Credit Risk. In order to better define its contractual rights and to secure rights that will help the Fund mitigate its counterparty risk, the Fund may enter into an International Swaps and Derivatives Association, Inc. Master Agreement (“ISDA Master Agreement”) or similar agreement with its counterparties. An ISDA Master Agreement is a bilateral agreement between the Fund and a counterparty that governs certain OTC derivatives and typically contains collateral posting terms and netting provisions. Under an ISDA Master Agreement, the Fund may, under certain circumstances, offset with the counterparty certain derivative financial instruments’ payables and/or receivables with collateral held and/or posted and create one single net payment. The provisions of the ISDA Master Agreement typically permit a single net payment in the event of default including the bankruptcy or insolvency of the counterparty. Bankruptcy or insolvency laws of a particular jurisdiction may restrict or prohibit the right of offset in bankruptcy, insolvency or other events. In addition, certain ISDA Master Agreements may contain provisions for early termination of OTC
derivative transactions in the event the net assets of the Fund decline below specific levels or if the Fund fails to meet the terms of its ISDA Master Agreements. The result would cause the Fund to accelerate payment of any net liability owed to the counterparty.
For financial reporting purposes, the Fund does not offset derivative assets and derivative liabilities that are subject to netting arrangements, if any, in the Statement of Assets and Liabilities.
(T) Indemnifications. Under the Trust’s organizational documents, its officers and trustees are indemnified against certain liabilities that may arise out of performance of their duties to the Trust. Additionally, in the normal course of business, the Fund enters into contracts with third-party service providers that contain a variety of representations and warranties and which may provide general indemnifications. The Fund’s maximum exposure under these arrangements is unknown, as this would involve future claims that may be made against the Fund that have not yet occurred. Based on experience, management is of the view that the risk of loss in connection with these potential indemnification obligations is remote. However, there can be no assurance that material liabilities related to such obligations will not arise in the future, which could adversely impact the Fund.
(U) Quantitative Disclosure of Derivative Holdings. The following tables show additional disclosures related to the Fund’s derivative and hedging activities, including how such activities are accounted for and their effect on the Fund’s financial positions, performance and cash flows. The Fund entered into futures contracts to help manage the duration and yield curve positioning of the portfolio while minimizing the exposure to wider bid/ask spreads in traditional bonds. The Fund entered into interest rate and credit default swap contracts in order to obtain a desired return at a lower cost to the Fund, rather than directly investing in an instrument yielding that desired return or to hedge against credit and interest rate risk. The Fund also entered into foreign currency forward contracts to gain exposure to a particular currency or to hedge against the risk of loss due to changing currency exchange rates. These derivatives are not accounted for as hedging instruments.
Fair value of derivative instruments as of October 31, 2017:
Asset Derivatives
| | | | | | | | | | | | | | | | | | |
| | | Statement of
Assets and Liabilities
Location | | Foreign
Exchange
Contracts
Risk | | | Credit
Contracts
Risk | | | Interest
Rate
Contracts
Risk | | | Total | |
Futures Contracts | | Net Assets—Net unrealized
appreciation on investments and futures contracts (a) | | $ | — | | | $ | — | | | $ | 3,113,268 | | | $ | 3,113,268 | |
Centrally Cleared Swap Contracts | | Net Assets—Net unrealized
appreciation on investments and swap contracts (b) | | | — | | | | — | | | | 4,981,021 | | | | 4,981,021 | |
Forward Contracts | | Unrealized appreciation on foreign currency forward contracts | | | 222,178 | | | | — | | | | — | | | | 222,178 | |
| | | | | | |
Total Fair Value | | | | $ | 222,178 | | | $ | | | | $ | 8,094,289 | | | $ | 8,316,467 | |
| | | | | | |
Notes to Financial Statements (continued)
Liability Derivatives
| | | | | | | | | | | | | | | | | | |
| | | Statement of
Assets and Liabilities
Location | | Foreign
Exchange
Contracts
Risk | | | Credit
Contracts
Risk | | | Interest
Rate
Contracts
Risk | | | Total | |
Futures Contracts | | Net Assets—Net unrealized appreciation on investments and futures contracts (a) | | $ | — | | | $ | — | | | $ | (888,485 | ) | | $ | (888,485 | ) |
OTC Swap Contracts | | Unrealized depreciation on OTC swap contracts | | | — | | | | (49,727 | ) | | | — | | | | (49,727 | ) |
Forward Contracts | | Unrealized depreciation on foreign currency forward contracts | | | (425,274 | ) | | | — | | | | — | | | | (425,274 | ) |
| | | | | | |
Total Fair Value | | | | $ | (425,274 | ) | | $ | (49,727 | ) | | $ | (888,485 | ) | | $ | (1,363,486 | ) |
| | | | | | |
| (a) | Includes cumulative appreciation (depreciation) of futures contracts as reported in the Portfolio of Investments. Only current day’s variation margin is reported within the Statement of Assets and Liabilities. |
| (b) | Includes cumulative appreciation (depreciation) of centrally cleared swap agreements as reported in the Portfolio of Investments. Only the current day’s variation margin is reported within the Statement of Assets and Liabilities. |
The effect of derivative instruments on the Statement of Operations for the year ended October 31, 2017:
Realized Gain (Loss)
| | | | | | | | | | | | | | | | | | |
| | | Statement of
Operations
Location | | Foreign
Exchange
Contracts
Risk | | | Credit
Contracts
Risk | | | Interest
Rate
Contracts
Risk | | | Total | |
Futures Contracts | | Net realized gain (loss) on futures transactions | | $ | — | | | $ | — | | | $ | 313,993 | | | $ | 313,993 | |
Swap Contracts | | Net realized gain (loss) on swap transactions | | | — | | | | (168,651 | ) | | | 5,419,810 | | | | 5,251,159 | |
Forward Contracts | | Net realized gain (loss) on foreign currency transactions | | | 299,762 | | | | — | | | | — | | | | 299,762 | |
| | | | | | |
Total Realized Gain (Loss) | | | | $ | 299,762 | | | $ | (168,651 | ) | | $ | 5,733,803 | | | $ | 5,864,914 | |
| | | | | | |
Change in Unrealized Appreciation (Depreciation)
| | | | | | | | | | | | | | | | | | |
| | | Statement of Operations Location | | Foreign
Exchange
Contracts
Risk | | | Credit
Contracts
Risk | | | Interest
Rate
Contracts
Risk | | | Total | |
Futures Contracts | | Net change in unrealized appreciation (depreciation) on futures contracts | | $ | — | | | $ | — | | | $ | 830,700 | | | $ | 830,700 | |
Swap Contracts | | Net change in unrealized appreciation (depreciation) on swap contracts | | | — | | | | 215,305 | | | | (46,378 | ) | | | 168,927 | |
Forward Contracts | | Net change in unrealized appreciation (depreciation) on translation of other assets and liabilities in foreign currencies and foreign currency forward contracts | | | (2,371,396 | ) | | | — | | | | — | | | | (2,371,396 | ) |
| | | | | | |
Total Change in Unrealized Appreciation (Depreciation) | | $ | (2,371,396 | ) | | $ | 215,305 | | | $ | 784,322 | | | $ | (1,371,769 | ) |
| | | | | | |
Average Notional Amount
| | | | | | | | | | | | | | | | |
| | | Foreign
Exchange
Contracts
Risk | | | Credit
Contracts
Risk | | | Interest Rate Contracts
Risk | | | Total | |
Futures Contracts Long | | $ | — | | | $ | — | | | $ | 60,724,238 | | | $ | 60,724,238 | |
Futures Contracts Short | | $ | — | | | $ | — | | | $ | (631,132,920 | ) | | $ | (631,132,920 | ) |
Swap Contracts Long | | $ | — | | | $ | 7,000,000 | | | $ | 2,013,286,027 | | | $ | 2,020,286,027 | |
Forward Contracts Long (a) | | $ | 18,278,555 | | | $ | — | | | $ | — | | | $ | 18,278,555 | |
Forward Contracts Short | | $ | (45,574,841 | ) | | $ | — | | | $ | — | | | $ | (45,574,841 | ) |
| | | | | | | | | | | | | | | | |
| (a) | Positions were open nine months during the reporting period. |
| | |
| 40 | | MainStay Unconstrained Bond Fund |
Note 3–Fees and Related Party Transactions
(A) Manager and Subadvisor. New York Life Investments, a registered investment adviser and an indirect, wholly-owned subsidiary of New York Life Insurance Company (“New York Life”), serves as the Fund’s Manager, pursuant to an Amended and Restated Management Agreement (“Management Agreement”). The Manager provides offices, conducts clerical, recordkeeping and bookkeeping services and keeps most of the financial and accounting records required to be maintained by the Fund. Except for the portion of salaries and expenses that are the responsibility of the Fund, the Manager pays the salaries and expenses of all personnel affiliated with the Fund and certain operational expenses of the Fund. The Fund reimburses New York Life Investments in an amount equal to a portion of the compensation of the Chief Compliance Officer attributable to the Fund. MacKay Shields LLC (“MacKay Shields” or the “Subadvisor”), a registered investment adviser and an indirect, wholly-owned subsidiary of New York Life, serves as Subadvisor to the Fund and is responsible for the day-to-day portfolio management of the Fund. Pursuant to the terms of an amended and restated Subadvisory Agreement (“Subadvisory Agreement”) between New York Life Investments and MacKay Shields, New York Life Investments pays for the services of the Subadvisor.
Under the Management Agreement, the Fund pays the Manager a monthly fee for the services performed and the facilities furnished at an annual rate of the Fund’s the Fund’s average daily net assets as follows: 0.60% up to $500 million; 0.55% from $500 million to $1 billion; 0.50% from $1 billion to $5 billion; and 0.475% in excess of $5 billion, plus a fee for fund accounting services previously provided by New York Life Investments under a separate fund accounting agreement furnished at an annual rate of the Fund’s average daily net assets as follows: 0.05% up to $20 million; 0.0333% from $20 million to $100 million; and 0.01% in excess of $100 million. During the year ended October 31, 2017, the effective management fee rate was 0.57%, inclusive of a fee for fund accounting services of 0.01% of the Fund’s average daily net assets.
During the year ended October 31, 2017, New York Life Investments earned fees from the Fund in the amount of $7,836,288.
State Street provides sub-administration and sub-accounting services to the Fund pursuant to an agreement with New York Life Investments. These services include calculating the daily NAVs of the Fund, maintaining the general ledger and sub-ledger accounts for the calculation of the Fund’s NAVs and assisting New York Life Investments in conducting various aspects of the Fund’s administrative operations. For providing these services to the Fund, State Street is compensated by New York Life Investments.
(B) Distribution, Service and Shareholder Service Fees. The Trust, on behalf of the Fund, has entered into a distribution agreement with NYLIFE Distributors LLC (the “Distributor”), an indirect, wholly-owned subsidiary of New York Life. The Fund has adopted distribution plans (the “Plans”) in accordance with the provisions of Rule 12b-1 under the 1940 Act.
Pursuant to the Class A, Investor Class, Class T and Class R2 Plans, the Distributor receives a monthly distribution fee from the Class A, Investor Class, Class T and Class R2 shares at an annual rate of 0.25% of the average daily net assets of the Class A, Investor Class, Class T and Class R2 shares for distribution and/or service activities as designated
by the Distributor. Pursuant to the Class B and Class C Plans, Class B and Class C shares pay the Distributor a monthly distribution fee at an annual rate of 0.75% of the average daily net assets of the Class B and Class C shares, along with a service fee at an annual rate of 0.25% of the average daily net assets of the Class B and Class C shares, for a total 12b-1 fee of 1.00%. Pursuant to the Class R3 Plan, the Distributor receives a monthly distribution and/or service fee from the Class R3 shares at an annual rate of 0.50% of the average daily net assets of the Class R3 shares. Class I and Class R6 shares are not subject to a distribution and/or service fee.
The Plans provide that the distribution and service fees are payable to the Distributor regardless of the amounts actually expended by the Distributor for distribution of the Fund’s shares and service activities.
In accordance with the Shareholder Services Plan for the Class R2 shares, the Manager has agreed to provide, through its affiliates or independent third parties, various shareholder and administrative support services to shareholders of the Class R2 shares. For its services, the Manager, its affiliates or independent third party service providers are entitled to a shareholder service fee accrued daily and paid monthly at an annual rate of 0.10% of the average daily net assets of the Class R2 shares. This is in addition to any fees paid under the Class R2 Plan.
During the year ended October 31, 2017, shareholder service fees incurred by the Fund were as follows:
| | | | |
Class R2 | | $ | 692 | |
Class R3 | | | 79 | |
(C) Sales Charges. During the year ended October 31, 2017, the Fund was advised by the Distributor that the amount of initial sales charges retained on sales of Class A and Investor Class shares were $48,903 and $11,136, respectively.
During the year ended October 31, 2017, the Fund was also advised that the Distributor retained CDSCs on redemptions of Class A, Class B and Class C shares of $7,500, $35,655 and $10,981, respectively.
(D) Transfer, Dividend Disbursing and Shareholder Servicing Agent. NYLIM Service Company LLC, an affiliate of New York Life Investments, is the Fund’s transfer, dividend disbursing and shareholder servicing agent pursuant to an agreement between NYLIM Service Company LLC and the Trust. NYLIM Service Company LLC has entered into an agreement with Boston Financial Data Services, Inc. (“BFDS”) pursuant to which BFDS performs certain transfer agent services on behalf of NYLIM Service Company LLC. During the year ended October 31, 2017, transfer agent expenses incurred by the Fund were as follows:
| | | | |
Class A | | $ | 519,376 | |
Investor Class | | | 53,777 | |
Class B | | | 29,760 | |
Class C | | | 339,744 | |
Class I | | | 1,263,770 | |
Class R2 | | | 1,077 | |
Class R3 | | | 123 | |
Notes to Financial Statements (continued)
(E) Small Account Fee. Shareholders with small accounts adversely impact the cost of providing transfer agency services. In an effort to reduce total transfer agency expenses, the Fund has implemented a small account fee on certain types of accounts. Certain shareholders with an account balance of less than $1,000 are charged an annual per account fee of $20 (assessed semi-annually), the proceeds from which offset transfer agent fees as reflected in the Statement of Operations.
(F) Capital. As of October 31, 2017, New York Life and its affiliates beneficially held shares of the Fund with the values and percentages of net assets as follows:
| | | | | | | | |
Class A | | $ | 3,282,542 | | | | 1.1 | % |
Class R3 | | | 28,616 | | | | 25 | |
Note 4–Federal Income Tax
As of October 31, 2017, the cost and unrealized appreciation (depreciation) of the Fund’s investment portfolio, including applicable derivative contracts and other financial instruments, as determined on a federal income tax basis, were as follows:
| | | | | | | | | | | | | | | | |
| | | Federal
Tax Cost | | | Gross
Unrealized
Appreciation | | | Gross
Unrealized
Depreciation | | | Net
Unrealized
Appreciation/
(Depreciation) | |
Investments in Securities | | $ | 1,328,210,867 | | | $ | 33,399,710 | | | $ | (11,822,021 | ) | | $ | 21,577,689 | |
As of October 31, 2017, the components of accumulated gain (loss) on a tax basis were as follows:
| | | | | | | | | | | | | | |
Ordinary
Income | | Accumulated
Capital and Other Gain (Loss) | | Other
Temporary
Differences | | | Unrealized
Appreciation
(Depreciation) | | | Total
Accumulated Gain (Loss) | |
$— | | $(182,175,654) | | $ | (246,277 | ) | | $ | 21,638,988 | | | $ | (160,782,943 | ) |
The difference between book-basis and tax-basis unrealized appreciation (depreciation) is primarily due to wash sale adjustments, mark to market of futures contracts, mark to market of foreign forward contracts, swap adjustments and straddle adjustment. The other temporary differences are primarily due to dividends payable.
The following table discloses the current year reclassifications between undistributed net investment income (loss), accumulated net realized gain (loss) on investments and additional paid-in capital arising from permanent differences; net assets as of October 31, 2017 were not affected.
| | | | | | | | | | |
Undistributed Net Investment Income (Loss) | | | Accumulated Net Realized Gain (Loss) on Investments | | | Additional Paid-In Capital | |
| $ | 2,825,862 | | | $ | (2,352,859 | ) | | $ | (473,003 | ) |
The reclassifications for the Fund are primarily due foreign currency gain (loss), swap adjustments, expiration of capital loss carryforwards and derivative transactions.
As of October 31, 2017, for federal income tax purposes, capital loss carryforwards of $182,120,078 were available as shown in the table below, to the extent provided by the regulations to offset future realized gains of the Fund through the years indicated. To the extent that these capital loss carryforwards are used to offset future capital gains, it is probable that the capital gains so offset will not be distributed to shareholders. No capital gain distributions shall be made until any capital loss carryforwards have been fully utilized or expired.
| | | | | | | | | | |
Capital Loss Available Through | | | Short-Term Capital Loss Amounts (000’s) | | | Long-Term Capital Loss Amounts (000’s) | |
| | Unlimited | | | $ | 24,995 | | | $ | 157,125 | |
The Fund utilized $6,237,707 of capital loss carryforwards during the year ended October 31, 2017. The Fund had $473,003 of capital loss carryforward that expired during the year ended October 31, 2017.
During the years ended October 31, 2017 and October 31, 2016, the tax character of distributions paid as reflected in the Statements of Changes in Net Assets was as follows:
| | | | | | | | |
| | | 2017 | | | 2016 | |
Distributions paid from: | | | | | | | | |
Ordinary Income | | $ | 48,450,079 | | | $ | 61,146,057 | |
Tax Return of Capital | | | 711,487 | | | | — | |
Total | | $ | 49,161,566 | | | $ | 61,146,057 | |
Note 5–Restricted Securities
As of October 31, 2017, the Fund held the following restricted securities:
| | | | | | | | | | | | | | | | | | | | |
Security | | Date of
Acquisition | | | Shares | | | Cost | | | 10/31/2017
Value | | | Percentage of
Net Assets | |
ION Media Networks, Inc. Common Stock | | | 3/11/14 | | | | 22 | | | $ | 0 | | | $ | 14,929 | | | | 0.0 | %‡ |
| ‡ | Less than one-tenth of a percent. |
Note 6–Custodian
State Street is the custodian of cash and securities held by the Fund. Custodial fees are charged to the Fund based on the Fund’s net assets and/or the market value of securities held by the Fund and the number of certain transactions incurred by the Fund.
Note 7–Line of Credit
The Fund and certain other funds managed by New York Life Investments, maintain a line of credit with a syndicate of banks in order to secure a source of funds for temporary purposes to meet unanticipated or excessive redemption requests.
Effective August 1, 2017, under the credit agreement (the “Credit Agreement”), the aggregate commitment amount is $600,000,000 with an additional uncommitted amount of $100,000,000. The commitment fee is an annual rate of 0.15% of the average commitment amount payable quarterly, regardless of usage, to State Street, who serves as
| | |
| 42 | | MainStay Unconstrained Bond Fund |
the agent to the syndicate. The commitment fee is allocated among the Fund and certain other funds managed by New York Life Investments based upon their respective net assets and other factors. Interest on any revolving credit loan is charged based upon the Federal Funds Rate or the one-month LIBOR, whichever is higher. The Credit Agreement expires on July 31, 2018, although the Fund, certain other funds managed by New York Life Investments and the syndicate of banks may renew the Credit Agreement for an additional year on the same or different terms. Prior to August 1, 2017, the aggregate commitment amount and the commitment fee of the previous credit agreement were the same as those under the Credit Agreement, but Bank of New York Mellon served as agent to the syndicate. During the year ended October 31, 2017, there were no borrowings made or outstanding with respect to the Fund under the Credit Agreement or the credit agreement for which Bank of New York Mellon served as agent.
Note 8–Interfund Lending Program
Pursuant to an exemptive order issued by the SEC, the Fund, along with certain other funds managed by New York Life Investments, may participate in an interfund lending program. The interfund lending program provides an alternative credit facility that permits the Fund and certain other funds managed by New York Life Investments to lend or borrow money for temporary purposes directly to or from one another subject to the conditions of the exemptive order. During the year ended October 31, 2017, there were no interfund loans made or outstanding with respect to the Fund.
Note 9–Purchases and Sales of Securities (in 000’s)
During the year ended October 31, 2017, purchases and sales of securities, other than short-term securities, were $522,929 and $633,874 respectively.
Note 10–Capital Share Transactions
| | | | | | | | |
Class A | | Shares | | | Amount | |
Year ended October 31, 2017: | | | | | | | | |
Shares sold | | | 6,504,414 | | | $ | 57,344,117 | |
Shares issued to shareholders in reinvestment of dividends and distributions | | | 1,221,667 | | | | 10,741,115 | |
Shares redeemed | | | (15,623,261 | ) | | | (137,648,462 | ) |
| | | | |
Net increase (decrease) in shares outstanding before conversion | | | (7,897,180 | ) | | | (69,563,230 | ) |
Shares converted into Class A (See Note 1) | | | 1,319,822 | | | | 11,709,691 | |
Shares converted from Class A (See Note 1) | | | (6,335,574 | ) | | | (55,695,953 | ) |
| | | | |
Net increase (decrease) | | | (12,912,932 | ) | | $ | (113,549,492 | ) |
| | | | |
Year ended October 31, 2016: | | | | | | | | |
Shares sold | | | 9,689,567 | | | $ | 82,882,860 | |
Shares issued to shareholders in reinvestment of dividends and distributions | | | 1,776,445 | | | | 15,146,253 | |
Shares redeemed | | | (31,183,466 | ) | | | (265,172,868 | ) |
| | | | |
Net increase (decrease) in shares outstanding before conversion | | | (19,717,454 | ) | | | (167,143,755 | ) |
Shares converted into Class A (See Note 1) | | | 338,252 | | | | 2,910,604 | |
Shares converted from Class A (See Note 1) | | | (779,019 | ) | | | (6,726,023 | ) |
| | | | |
Net increase (decrease) | | | (20,158,221 | ) | | $ | (170,959,174 | ) |
| | | | |
| | |
| | | | | | | | |
Investor Class | | Shares | | | Amount | |
Year ended October 31, 2017: | | | | | | | | |
Shares sold | | | 371,571 | | | $ | 3,304,500 | |
Shares issued to shareholders in reinvestment of dividends and distributions | | | 115,291 | | | | 1,021,772 | |
Shares redeemed | | | (504,774 | ) | | | (4,488,274 | ) |
| | | | |
Net increase (decrease) in shares outstanding before conversion | | | (17,912 | ) | | | (162,002 | ) |
Shares converted into Investor Class (See Note 1) | | | 184,584 | | | | 1,641,307 | |
Shares converted from Investor Class (See Note 1) | | | (1,299,121 | ) | | | (11,617,639 | ) |
| | | | |
Net increase (decrease) | | | (1,132,449 | ) | | $ | (10,138,334 | ) |
| | | | |
Year ended October 31, 2016: | | | | | | | | |
Shares sold | | | 402,584 | | | $ | 3,472,246 | |
Shares issued to shareholders in reinvestment of dividends and distributions | | | 132,076 | | | | 1,136,141 | |
Shares redeemed | | | (570,340 | ) | | | (4,903,575 | ) |
| | | | |
Net increase (decrease) in shares outstanding before conversion | | | (35,680 | ) | | | (295,188 | ) |
Shares converted into Investor Class (See Note 1) | | | 237,630 | | | | 2,063,359 | |
Shares converted from Investor Class (See Note 1) | | | (314,544 | ) | | | (2,729,075 | ) |
| | | | |
Net increase (decrease) | | | (112,594 | ) | | $ | (960,904 | ) |
| | | | |
| | |
| | | | | | | | |
Notes to Financial Statements (continued)
| | | | | | | | |
Class B | | Shares | | | Amount | |
Year ended October 31, 2017: | | | | | | | | |
Shares sold | | | 89,558 | | | $ | 783,183 | |
Shares issued to shareholders in reinvestment of dividends and distributions | | | 45,171 | | | | 395,036 | |
Shares redeemed | | | (421,641 | ) | | | (3,700,114 | ) |
| | | | |
Net increase (decrease) in shares outstanding before conversion | | | (286,912 | ) | | | (2,521,895 | ) |
Shares converted from Class B (See Note 1) | | | (83,048 | ) | | | (728,689 | ) |
| | | | |
Net increase (decrease) | | | (369,960 | ) | | $ | (3,250,584 | ) |
| | | | |
Year ended October 31, 2016: | | | | | | | | |
Shares sold | | | 257,316 | | | $ | 2,217,439 | |
Shares issued to shareholders in reinvestment of dividends and distributions | | | 55,629 | | | | 472,172 | |
Shares redeemed | | | (407,095 | ) | | | (3,461,954 | ) |
| | | | |
Net increase (decrease) in shares outstanding before conversion | | | (94,150 | ) | | | (772,343 | ) |
Shares converted from Class B (See Note 1) | | | (102,988 | ) | | | (877,313 | ) |
| | | | |
Net increase (decrease) | | | (197,138 | ) | | $ | (1,649,656 | ) |
| | | | |
| | |
| | | | | | | | |
Class C | | Shares | | | Amount | |
Year ended October 31, 2017: | | | | | | | | |
Shares sold | | | 1,690,444 | | | $ | 14,793,719 | |
Shares issued to shareholders in reinvestment of dividends and distributions | | | 510,867 | | | | 4,464,460 | |
Shares redeemed | | | (8,433,451 | ) | | | (73,920,932 | ) |
| | | | |
Net increase (decrease) in shares outstanding before conversion | | | (6,232,140 | ) | | | (54,662,753 | ) |
Shares converted from Class C (See Note 1) | | | (1,494 | ) | | | (13,173 | ) |
| | | | |
Net increase (decrease) | | | (6,233,634 | ) | | $ | (54,675,926 | ) |
| | | | |
Year ended October 31, 2016: | | | | | | | | |
Shares sold | | | 3,156,329 | | | $ | 26,785,970 | |
Shares issued to shareholders in reinvestment of dividends and distributions | | | 722,783 | | | | 6,125,064 | |
Shares redeemed | | | (15,059,753 | ) | | | (127,522,835 | ) |
| | | | |
Net increase (decrease) in shares outstanding before conversion | | | (11,180,641 | ) | | | (94,611,801 | ) |
Shares converted from Class C (See Note 1) | | | (1,045 | ) | | | (8,594 | ) |
| | | | |
Net increase (decrease) | | | (11,181,686 | ) | | $ | (94,620,395 | ) |
| | | | |
| | |
| | | | | | | | |
| | | | | | | | |
Class I | | Shares | | | Amount | |
Year ended October 31, 2017: | | | | | | | | |
Shares sold | | | 29,685,612 | | | $ | 262,008,540 | |
Shares issued to shareholders in reinvestment of dividends and distributions | | | 3,015,175 | | | | 26,571,767 | |
Shares redeemed | | | (28,317,188 | ) | | | (250,279,904 | ) |
| | | | |
Net increase (decrease) in shares outstanding before conversion | | | 4,383,599 | | | | 38,300,403 | |
Shares converted into Class I (See Note 1) | | | 6,216,130 | | | | 54,704,456 | |
| | | | |
Net increase (decrease) | | | 10,599,729 | | | $ | 93,004,859 | |
| | | | |
Year ended October 31, 2016: | | | | | | | | |
Shares sold | | | 20,252,896 | | | $ | 173,334,533 | |
Shares issued to shareholders in reinvestment of dividends and distributions | | | 3,482,882 | | | | 29,727,201 | |
Shares redeemed | | | (85,800,191 | ) | | | (726,642,179 | ) |
| | | | |
Net increase (decrease) in shares outstanding before conversion | | | (62,064,413 | ) | | | (523,580,445 | ) |
Shares converted into Class I (See Note 1) | | | 621,620 | | | | 5,366,742 | |
| | | | |
Net increase (decrease) | | | (61,442,793 | ) | | $ | (518,213,703 | ) |
| | | | |
| | |
| | | | | | | | |
Class R2 | | Shares | | | Amount | |
Year ended October 31, 2017: | | | | | | | | |
Shares sold | | | 19,091 | | | $ | 168,608 | |
Shares issued to shareholders in reinvestment of dividends and distributions | | | 2,637 | | | | 23,210 | |
Shares redeemed | | | (10,063 | ) | | | (88,228 | ) |
| | | | |
Net increase (decrease) | | | 11,665 | | | $ | 103,590 | |
| | | | |
Period ended October 31, 2016: | | | | | | | | |
Shares sold | | | 72,683 | | | $ | 641,451 | |
Shares issued to shareholders in reinvestment of dividends and distributions | | | 616 | | | | 5,314 | |
Shares redeemed | | | (10,934 | ) | | | (91,821 | ) |
| | | | |
Net increase (decrease) | | | 62,365 | | | $ | 554,944 | |
| | | | |
| | |
| | | | | | | | |
Class R3 | | Shares | | | Amount | |
Period ended October 31, 2017: | | | | | | | | |
Shares sold | | | 10,579 | | | $ | 93,273 | |
Shares issued to shareholders in reinvestment of dividends and distributions | | | 291 | | | | 2,564 | |
Shares redeemed | | | (1,643 | ) | | | (14,474 | ) |
| | | | |
Net increase (decrease) | | | 9,227 | | | $ | 81,363 | |
| | | | |
Year ended October 31, 2016: | | | | | | | | |
Shares sold | | | 3,536 | | | $ | 29,179 | |
Shares issued to shareholders in reinvestment of dividends and distributions | | | 72 | | | | 626 | |
| | | | |
Net increase (decrease) | | | 3,608 | | | $ | 29,805 | |
| | | | |
| | |
| 44 | | MainStay Unconstrained Bond Fund |
Note 11–Subsequent Events
In connection with the preparation of the financial statements of the Fund as of and for the year ended October 31, 2017, events and transactions subsequent to October 31, 2017, through the date the financial statements were issued have been evaluated by the Fund’s management for possible adjustment and/or disclosure. No subsequent events requiring financial statement adjustment or disclosure have been identified.
Report of Independent Registered Public Accounting Firm
The Board of Trustees and Shareholders of
The MainStay Funds:
We have audited the accompanying statement of assets and liabilities, including the portfolio of investments, of MainStay Unconstrained Bond Fund (the “Fund”), one of the funds constituting The MainStay Funds, as of October 31, 2017, and the related statement of operations for the year then ended, the statements of changes in net assets for each of the years in the two-year period then ended, and the financial highlights for each of the years or periods in the five-year period then ended. These financial statements and financial highlights are the responsibility of the Fund’s management. Our responsibility is to express an opinion on these financial statements and financial highlights based on our audits.
We conducted our audits in accordance with the standards of the Public Company Accounting Oversight Board (United States). Those standards require that we plan and perform the audit to obtain reasonable assurance about whether the financial statements and financial highlights are free of material misstatement. An audit includes examining, on a test basis, evidence supporting the amounts and disclosures in the financial statements. Our procedures included confirmation of securities owned as of October 31, 2017, by correspondence with the custodian and brokers or by other appropriate auditing procedures where replies from brokers were not received. An audit also includes assessing the accounting principles used and significant estimates made by management, as well as evaluating the overall financial statement presentation. We believe that our audits provide a reasonable basis for our opinion.
In our opinion, the financial statements and financial highlights referred to above present fairly, in all material respects, the financial position of MainStay Unconstrained Bond Fund as of October 31, 2017, the results of its operations for the year then ended, the changes in its net assets for each of the years in the two-year period then ended, and the financial highlights for each of the years or periods in the five-year period then ended, in conformity with U.S. generally accepted accounting principles.

Philadelphia, Pennsylvania
December 21, 2017
| | |
| 46 | | MainStay Unconstrained Bond Fund |
Other Matters
(Unaudited)
At a meeting held on June 22, 2017, the Board approved submitting the following proposal (“Proposal”) to shareholders of the Funds at a special meeting held on October 23, 2017 (with any postponements or adjournments, “Special Meeting”):
To elect eight Trustees to the Board
On or about September 28, 2017, shareholders of record of the Funds as of the close of business on August 24, 2017 were sent a proxy statement containing information regarding the Proposal. The proxy statement also included information about the Special Meeting, at which shareholders of the Funds were asked to consider and approve the Proposal. In addition, the proxy statement included information about voting on the Proposal and options shareholders had to do so.
The Special Meeting was held on October 23, 2017, and the Proposal passed.
The results of the Special Meeting (all Funds and classes thereof voting together) were as follows:
Proposal—To elect eight Trustees to the Board:
Yie-Hsin Hung:
| | | | |
Votes
For | | Votes
Witheld | | Total |
| 2,644,056,263.750 | | 21,799,781.292 | | 2,665,856,045.042 |
David H. Chow:
| | | | |
Votes
For | | Votes
Witheld | | Total |
| 2,644,576,776.557 | | 21,279,268.485 | | 2,665,856,045.042 |
Susan B. Kerley:
| | | | |
Votes
For | | Votes
Witheld | | Total |
| 2,645,459,747.343 | | 20,396,297.699 | | 2,665,856,045.042 |
Alan R. Latshaw:
| | | | |
Votes
For | | Votes
Witheld | | Total |
| 2,644,443,039.401 | | 21,413,005.641 | | 2,665,856,045.042 |
Peter Meenan:
| | | | |
Votes
For | | Votes
Witheld | | Total |
| 2,640,156,421.578 | | 25,699,623.464 | | 2,665,856,045.042 |
Richard H. Nolan, Jr.:
| | | | |
Votes
For | | Votes
Witheld | | Total |
| 2,641,415,514.849 | | 24,440,530.193 | | 2,665,856,045.042 |
Jacques P. Perold:
| | | | |
Votes
For | | Votes
Witheld | | Total |
| 2,645,300,993.731 | | 20,555,051.311 | | 2,665,856,045.042 |
Richard S. Trutanic:
| | | | |
Votes
For | | Votes
Witheld | | Total |
| 2,641,761,336.311 | | 24,094,708.731 | | 2,665,856,045.042 |
Federal Income Tax Information
(Unaudited)
For the fiscal year ended October 31, 2017, the Fund designated approximately $12,193 under the Internal Revenue Code as qualified dividend income eligible for reduced tax rates.
In February 2018, shareholders will receive an IRS Form 1099-DIV or substitute Form 1099, which will show the federal tax status of the distributions received by shareholders in calendar year 2017. The amounts that will be reported on such 1099-DIV or substitute Form 1099 will be the amounts you are to use on your federal income tax return and will differ from the amounts which we must report for the Fund’s fiscal year end October 31, 2017.
Proxy Voting Policies and Procedures and Proxy Voting Record
A description of the policies and procedures that New York Life Investments uses to vote proxies related to the Fund’s securities is available without charge, upon request, (i) by visiting the MainStay Funds’ website at mainstayinvestments.com; and (ii) on the Securities and Exchange Commission’s (“SEC”) website at www.sec.gov.
The Fund is required to file with the SEC its proxy voting records for the Fund for the 12-month period ending June 30 on Form N-PX. The most recent Form N-PX or proxy voting record is available free of charge upon request by calling 800-MAINSTAY (624-6782); visiting the MainStay Funds’ website at mainstayinvestments.com; or on the SEC’s website at www.sec.gov.
Shareholder Reports and Quarterly Portfolio Disclosure
The Fund is required to file its complete schedule of portfolio holdings with the SEC for its first and third fiscal quarters on Form N-Q. The Fund’s Form N-Q is available without charge, on the SEC’s website at www.sec.gov or by calling MainStay Investments at 800-MAINSTAY (624-6782). You also can obtain and review copies of Form N-Q by visiting the SEC’s Public Reference Room in Washington, DC (information on the operation of the Public Reference Room may be obtained by calling 1-800-SEC-0330).
Board of Trustees and Officers (Unaudited)
The Trustees and officers of the Funds are listed below. The Board oversees the MainStay Group of Funds (which consists of The MainStay Funds and MainStay Funds Trust), MainStay VP Funds Trust, MainStay DefinedTerm Municipal Opportunities Fund, the Manager and the Subadvisors, and elects the officers of the Funds who are responsible for the day-to-day operations of the Funds. Information pertaining to the Trustees and officers is set forth below. Each Trustee serves until his or her successor is elected and qualified or until his or her resignation, death or removal. Under the Board’s retirement policy, unless an exception is made, a Trustee must tender his or her resignation by the
end of the calendar year during which he or she reaches the age of 75. Mr. Meenan reached the age of 75 during the calendar year 2016, and his term was extended for one additional year. Accordingly, Mr. Meenan is expected to serve until the end of calendar year 2017, at which time he intends to retire. Officers are elected annually by the Board. The business address of each Trustee and officer listed below is 51 Madison Avenue, New York, New York 10010. A majority of the Trustees are not “interested persons” (as defined by the 1940 Act and rules adopted by the SEC thereunder) of the Fund (“Independent Trustees”).
| | | | | | | | | | | | |
| | | | | Name and Date of Birth | | Term of Office, Position(s) Held and Length of Service | | Principal Occupation(s) During Past Five Years | | Number of
Portfolios in
the MainStay
Group of Funds
Overseen by
Trustee | | Other Directorships Held by Trustee |
| Interested Trustee | | | | Yie-Hsin Hung* 8/12/62 | | The MainStay Funds: Trustee since January 2017; MainStay Funds Trust: Trustee since January 2017. | | Senior Vice President of New York Life since joining in 2010, Member of the Executive Management Committee since January 1, 2017, Chief Executive Officer, New York Life Investment Management Holdings LLC & New York Life Investment Management LLC since May 2015. Senior Managing Director and Co-President of New York Life Investment Management LLC from January 2014 to May 2015. Previously held positions of increasing responsibility, including head of NYLIM International, Alternative Growth Businesses, and Institutional investments since joining New York Life in 2010. | | 82 | | None |
| | * | This Trustee is considered to be an “interested person” of the MainStay Group of Funds, MainStay VP Funds Trust and MainStay DefinedTerm Municipal Opportunities Fund, within the meaning of the 1940 Act because of her affiliation with New York Life Insurance Company, New York Life Investment Management LLC, Candriam Belgium, Candriam France S.A.S., Cornerstone Capital Management Holdings LLC, MacKay Shields LLC, NYL Investors LLC, NYLIFE Securities LLC and/or NYLIFE Distributors LLC, as described in detail above in the column entitled “Principal Occupation(s) During Past Five Years.” |
| | |
| 48 | | MainStay Unconstrained Bond Fund |
| | | | | | | | | | | | |
| | | | | Name and Date of Birth | | Term of Office, Position(s) Held and Length of Service | | Principal Occupation(s) During Past Five Years | | Number of
Portfolios in
the MainStay
Group of Funds
Overseen by
Trustee | | Other Directorships Held by Trustee |
| Independent Trustees | | | | David H. Chow 12/29/57 | | The MainStay Funds: Trustee since January 2016, Advisory Board Member (June 2015 to December 2015); MainStay Funds Trust: Trustee since January 2016, Advisory Board Member (June 2015 to December 2015). | | Founder and CEO, DanCourt Management, LLC (since 1999) | | 82 | | VanEck Vectors Group of Exchange-Traded Funds: Independent Chairman of the Board of Trustees since 2008 and Trustee since 2006 (57 portfolios); and
Berea College of Kentucky: Trustee since 2009. |
| | | | Susan B. Kerley 8/12/51 | | The MainStay Funds: Chairman since January 2017 and Trustee since 2007; MainStay Funds Trust: Chairman since January 2017 and Trustee since 1990.** | | President, Strategic Management Advisors LLC (since 1990) | | 82 | | Legg Mason Partners Funds: Trustee since 1991 (54 portfolios). |
| | | | Alan R. Latshaw 3/27/51 | | The MainStay Funds: Trustee and Audit Committee Financial Expert since 2006; MainStay Funds Trust: Trustee and Audit Committee Financial Expert since 2007.** | | Retired; Partner, Ernst & Young LLP (2002 to 2003); Partner, Arthur Andersen LLP (1989 to 2002); Consultant to the MainStay Funds Audit and Compliance Committee (2004 to 2006) | | 82 | | State Farm Associates Funds Trusts: Trustee since 2005 (4 portfolios);
State Farm Mutual Fund Trust: Trustee since 2005 (15 portfolios); and
State Farm Variable Product Trust: Trustee since 2005 (9 portfolios). |
| | | | Peter Meenan 12/5/41 | | The MainStay Funds: Trustee since 2007; MainStay Funds Trust: Trustee since 2002.** | | Retired; Independent Consultant (2004 to 2013); President and Chief Executive Officer, Babson—United, Inc. (financial services firm) (2000 to 2004); Independent Consultant (1999 to 2000); Head of Global Funds, Citicorp (1995 to 1999) | | 82 | | None |
| | | | Richard H. Nolan, Jr. 11/16/46 | | The MainStay Funds: Trustee since 2007; MainStay Funds Trust: Trustee since 2007.** | | Managing Director, ICC Capital Management (since 2004); President—Shields/Alliance, Alliance Capital Management (1994 to 2004) | | 82 | | None |
| | | | Jacques P. Perold 5/12/58 | | The MainStay Funds: Trustee since January 2016, Advisory Board Member (June 2015 to December 2015); MainStay Funds Trust: Trustee since January 2016, Advisory Board Member (June 2015 to December 2015). | | Retired; President, Fidelity Management & Research Company (2009 to 2014); Founder, President and Chief Executive Officer, Geode Capital Management, LCC (2001 to 2009) | | 82 | | Allstate Corporation: Director since 2015; MSCI, Inc. Director since March 2017 and
Boston University: Trustee since 2014. |
| | | | Richard S. Trutanic 2/13/52 | | The MainStay Funds: Trustee since 1994; MainStay Funds Trust: Trustee since 2007.** | | Chairman and Chief Executive Officer, Somerset & Company (financial advisory firm) (since 2004); Managing Director, The Carlyle Group (private investment firm) (2002 to 2004); Senior Managing Director, Partner and Board Member, Groupe Arnault S.A. (private investment firm) (1999 to 2002) | | 82 | | None |
| | ** | Includes prior service as a Director/Trustee of certain predecessor entities to MainStay Funds Trust. |
| | | | | | | | |
| | | | | Name and Date of Birth | | Position(s) Held and Length of Service | | Principal Occupation(s) During Past Five Years |
Officers of the Trust (Who are not Trustees)* | | | | Kirk C. Lehneis 6/29/74 | | President, The MainStay Funds, MainStay Funds Trust (since September 2017) | | Chief Operating Officer and Senior Managing Director (since 2016), New York Life Investment Management LLC; Chairman of the Board (since September 2017), NYLIFE Distributors LLC; Chairman of the Board, NYLIM Service Company LLC (since September 2017); President, MainStay DefinedTerm Municipal Opportunities Fund and MainStay VP Funds Trust (since September 2017); Senior Managing Director, Global Product Development (From March 2015—May 2016); Managing Director, Product Development (From March 2010—February 2015) |
| | | | Jack R. Benintende 5/12/64 | | Treasurer and Principal Financial and Accounting Officer, The MainStay Funds (since 2007), MainStay Funds Trust (since 2009) | | Managing Director, New York Life Investment Management LLC (since 2007); Treasurer and Principal Financial and Accounting Officer, MainStay DefinedTerm Municipal Opportunities Fund (since 2011) and MainStay VP Funds Trust (since 2007)**; and Assistant Treasurer, New York Life Investment Management Holdings LLC (2008 to 2012) |
| | | | Kevin M. Bopp 2/24/69 | | Vice President and Chief Compliance Officer, The MainStay Funds and MainStay Funds Trust (since 2014) | | Chief Compliance Officer, New York Life Investment Management LLC, IndexIQ ETF (since January 2016), Director and Associate General Counsel (2011 to 2014) and Vice President and Assistant General Counsel (2010 to 2011), New York Life Investment Management LLC; Vice President and ChiefCompliance Officer, MainStay VP Funds Trust, MainStay DefinedTerm Municipal Opportunities Fund (since 2014); Assistant Secretary, MainStay Funds, MainStay Funds Trust and MainStay VP Funds Trust (2010 to 2014)**, MainStay DefinedTerm Municipal Opportunities Fund (2011 to 2014) |
| | | | J. Kevin Gao 10/13/67 | | Secretary and Chief Legal Officer, The MainStay Funds and MainStay Funds Trust (since 2010) | | Managing Director and Associate General Counsel, New York Life Investment Management LLC (since 2010); Secretary and Chief Legal Officer, MainStay DefinedTerm Municipal Opportunities Fund (since 2011) and MainStay VP Funds Trust (since 2010)** |
| | | | Scott T. Harrington 2/8/59 | | Vice President—Administration, The MainStay Funds (since 2005), MainStay Funds Trust (since 2009) | | Director, New York Life Investment Management LLC (including predecessor advisory organizations) (since 2000); Member of the Board of Directors, New York Life Trust Company (since 2009); Vice President—Administration, MainStay DefinedTerm Municipal Opportunities Fund (since 2011) and MainStay VP Funds Trust (since 2005)** |
| | * | The officers listed above are considered to be “interested persons” of the MainStay Group of Funds, MainStay VP Funds Trust and MainStay Defined Term Municipal Opportunities Fund within the meaning of the 1940 Act because of their affiliation with the MainStay Group of Funds, New York Life Insurance Company and/or its affiliates, including New York Life Investment Management LLC, NYLIM Service Company LLC, NYLIFE Securities LLC and/or NYLIFE Distributors LLC, as described in detail in the column captioned “Principal Occupation(s) During Past Five Years.” Officers are elected annually by the Board. |
| | ** | Includes prior service as an officer of MainStay VP Series Fund, Inc., the predecessor to MainStay VP Funds Trust. |
| | |
| 50 | | MainStay Unconstrained Bond Fund |
MainStay Funds
Equity
U.S. Equity
MainStay Common Stock Fund
MainStay Cornerstone Growth Fund
MainStay Epoch U.S. All Cap Fund
MainStay Epoch U.S. Equity Yield Fund
MainStay Epoch U.S. Small Cap Fund
MainStay Large Cap Growth Fund
MainStay MAP Equity Fund
MainStay S&P 500 Index Fund
MainStay U.S. Equity Opportunities Fund
International/Global Equity
MainStay Candriam Emerging Markets Equity Fund
MainStay Emerging Markets Equity Fund
MainStay Epoch Capital Growth Fund
MainStay Epoch Global Choice Fund
MainStay Epoch Global Equity Yield Fund
MainStay Epoch International Choice Fund
MainStay Epoch International Small Cap Fund
MainStay International Equity Fund
MainStay International Opportunities Fund
Income
Taxable Bond
MainStay Emerging Markets Debt Fund
MainStay Floating Rate Fund
MainStay Government Fund
MainStay High Yield Corporate Bond Fund
MainStay Indexed Bond Fund
MainStay Short Duration High Yield Fund
MainStay Total Return Bond Fund
MainStay Unconstrained Bond Fund
Municipal/Tax Advantaged Bond
MainStay California Tax Free Opportunities Fund1
MainStay High Yield Municipal Bond Fund
MainStay New York Tax Free Opportunities Fund2
MainStay Tax Advantaged Short Term Bond Fund
MainStay Tax Free Bond Fund
Money Market
MainStay Money Market Fund
Mixed Asset
MainStay Balanced Fund
MainStay Convertible Fund
MainStay Income Builder Fund
Alternative
MainStay Absolute Return Multi-Strategy Fund
MainStay Cushing Energy Income Fund
MainStay Cushing MLP Premier Fund
MainStay Cushing Renaissance Advantage Fund
Asset Allocation/Target Date
MainStay Conservative Allocation Fund
MainStay Growth Allocation Fund
MainStay Moderate Allocation Fund
MainStay Moderate Growth Allocation Fund
MainStay Retirement 2010 Fund
MainStay Retirement 2020 Fund
MainStay Retirement 2030 Fund
MainStay Retirement 2040 Fund
MainStay Retirement 2050 Fund
MainStay Retirement 2060 Fund
Manager
New York Life Investment Management LLC
New York, New York
Subadvisors
Candriam Belgium S.A.3
Brussels, Belgium
Candriam France S.A.S.3
Paris, France
Cornerstone Capital Management Holdings LLC3
New York, New York
Cushing Asset Management, LP
Dallas, Texas
Epoch Investment Partners, Inc.
New York, New York
MacKay Shields LLC3
New York, New York
Markston International LLC
White Plains, New York
NYL Investors LLC3
New York, New York
Winslow Capital Management, LLC
Minneapolis, Minnesota
Legal Counsel
Dechert LLP
Washington, District of Columbia
Independent Registered Public Accounting Firm
KPMG LLP
Philadelphia, Pennsylvania
1. Class A and Class I shares of this Fund are registered for sale in AZ, CA, MI, NV, OR, TX, UT and WA. Class I shares are registered for sale in CO, FL, GA, HI, ID, MA, MD, NH, NJ and NY.
2. This Fund is registered for sale in CA, CT, DE, FL, MA, NJ, NY and VT.
3. An affiliate of New York Life Investment Management LLC.
Not part of the Annual Report
For more information
800-MAINSTAY (624-6782)
mainstayinvestments.com
MainStay Investments® is a registered service mark and name under which New York Life Investment Management LLC does business. MainStay Investments, an indirect subsidiary of New York Life Insurance Company, New York, NY 10010, provides investment advisory products and services. The MainStay Funds® are managed by New York Life Investment Management LLC and distributed by NYLIFE Distributors LLC, 30 Hudson Street, Jersey City, NJ 07302, a wholly owned subsidiary of New York Life Insurance Company. NYLIFE Distributors LLC is a Member FINRA/SIPC.
©2017 NYLIFE Distributors LLC. All rights reserved.
| | | | | | | | |
| Not FDIC/NCUA Insured | | Not a Deposit | | May Lose Value | | No Bank Guarantee | | Not Insured by Any Government Agency |
| | |
| 1717044 MS286-17 | | MSUB11-12/17 (NYLIM) NL217 |
MainStay Government Fund
Message from the President and Annual Report
October 31, 2017


This page intentionally left blank
Message from the President
The 12 months ended October 31, 2017, brought strong performance to equity markets in the United States and abroad.
According to FTSE-Russell data for the U.S. market, stocks at all capitalization levels earned solid double-digit overall returns during the reporting period. Total returns for stocks in general exceeded 20% at all capitalization levels. Growth stocks were particularly strong, outperforming value stocks for companies of all sizes except among microcaps, where value stocks outperformed growth stocks.
Several factors contributed to the strength of domestic and international stock markets during the reporting period. Following the U.S. presidential election in November 2016, many investors looked forward to business tax incentives and possible tax cuts for consumers that could stimulate economic growth. During the reporting period, corporate earnings reports remained strong; and growth in U.S. real gross domestic product remained positive, with a substantial advance during the second quarter of 2017. Developed international markets and emerging markets were also strong, boosted by positive macroeconomic data and growing confidence that Europe was well on its way to financial recovery. Despite wide variations among emerging markets, many saw strong appreciation in local-currency terms and benefited from a weaker U.S. dollar.
During the reporting period, the Federal Open Market Committee raised the federal funds target range three times—in December of 2016 and in March and June of 2017. These incremental increases raised the federal funds target range to 1.00% to 1.25% by the end of the reporting period. These tightening moves were followed by higher U.S. Treasury yields at all maturities, with the greatest increases at the short-end of the maturity spectrum.
As interest rates rise, bond prices tend to decline (and vice versa). As a result, some portions of the U.S. Treasury market recorded negative total returns during the reporting period. Agency securities posted small but positive total returns, as did
asset-backed and mortgage-backed securities. Other bond categories, particularly those with looser ties to U.S. interest rates, did considerably better. Emerging-market debt recorded solid single-digit returns; high-yield bonds were generally stronger; and convertible bonds, which are closely tied to the performance of underlying stocks, provided some of the strongest overall returns of any fixed-income sector during the reporting period.
At MainStay, we have always encouraged investors to diversify their investments and maintain a long-term perspective, even when markets are strong. Asset classes that perform well in one environment may perform differently in another; and in today’s ever-changing world, wide market swings are not unknown.
MainStay offers Funds with a wide array of investment objectives to help our shareholders pursue the appropriate diversification for their long-range financial goals. We also offer several investment boutiques, allowing our shareholders to choose the style—or mix of styles—that’s best suited to their investment needs. We believe that relatively few individual investors can match the level of professional experience and market insight that our portfolio managers provide.
The report that follows provides more detailed information on the specific markets, investment strategies and portfolio decisions that affected your MainStay Fund during the 12 months ended October 31, 2017. We encourage you to read the report carefully and use it to help you evaluate your progress toward your financial goals.
Sincerely,

Kirk C. Lehneis
President
The opinions expressed are as of the date of this report and are subject to change. There is no guarantee that any forecast made will come to pass. This material does not constitute investment advice and is not intended as an endorsement of any specific investment. Past performance is no guarantee of future results.
Not part of the Annual Report
Table of Contents
Investors should refer to the Fund’s Summary Prospectus and/or Prospectus and consider the Fund’s investment objectives, strategies, risks, charges and expenses carefully before investing. The Summary Prospectus and/or Prospectus contain this and other information about the Fund. You may obtain copies of the Fund’s Summary Prospectus, Prospectus and Statement of Additional Information free of charge, upon request, by calling toll-free 800-MAINSTAY (624-6782), by writing to NYLIFE Distributors LLC, Attn: MainStay Marketing Department, 30 Hudson Street, Jersey City, NJ 07302 or by sending an e-mail to MainStayShareholderServices@nylim.com. These documents are also available via the MainStay Funds’ website at mainstayinvestments.com/documents. Please read the Summary Prospectus and/or Prospectus carefully before investing.
Investment and Performance Comparison1 (Unaudited)
Performance data quoted represents past performance. Past performance is no guarantee of future results. Because of market volatility and other factors, current performance may be lower or higher than the figures shown. Investment return and principal value will fluctuate, and as a result, when shares are redeemed, they may be worth more or less than their original cost. The graph below depicts the historical performance of Class B shares2 of the Fund. Performance will vary from class to class based on differences in class-specific expenses and sales charges. For performance information current to the most recent month-end, please call 800-MAINSTAY (624-6782) or visit mainstayinvestments.com.
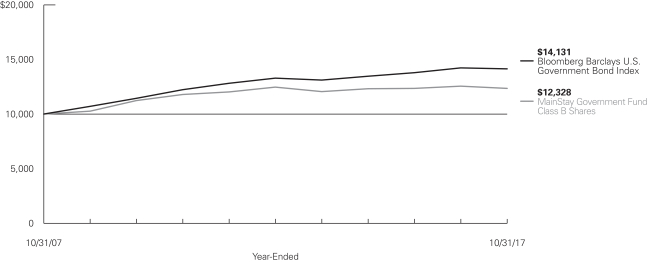
Average Annual Total Returns for the Year-Ended October 31, 2017
| | | | | | | | | | | | | | | | | | | | | | | | |
| Class | | Sales Charge | | | | Inception
Date | | | One
Year | | | Five
Years | | | Ten Years
or Since
Inception | | | Gross
Expense
Ratio3 | |
| Class A Shares | | Maximum 4.5% Initial Sales Charge | | With sales charges Excluding sales charges | |
| 1/3/1995
|
| |
| –5.08
–0.60 | %
| |
| –0.12
0.80 | %
| |
| 2.59
3.07 | %
| |
| 0.99
0.99 | %
|
| Investor Class Shares | | Maximum 4.5% Initial Sales Charge | | With sales charges Excluding sales charges | |
| 2/28/2008
|
| |
| –5.37
–0.91 |
| |
| –0.38
0.54 |
| |
| 2.11
2.59 |
| |
| 1.24
1.24 |
|
| Class B Shares2 | | Maximum 5% CDSC if Redeemed Within the First
Six Years of Purchase | | With sales charges Excluding sales charges | |
| 5/1/1986
|
| |
| –6.53
–1.66 |
| |
| –0.59
–0.21 |
| |
| 2.11
2.11 |
| |
| 1.99
1.99 |
|
| Class C Shares | | Maximum 1% CDSC if Redeemed Within One Year of Purchase | | With sales charges Excluding sales charges | |
| 9/1/1998
|
| |
| –2.64
–1.66 |
| |
| –0.21
–0.21 |
| |
| 2.10
2.10 |
| |
| 1.99
1.99 |
|
| Class I Shares | | No Sales Charge | | | | | 1/2/2004 | | | | –0.23 | | | | 1.07 | | | | 3.38 | | | | 0.74 | |
| 1. | The performance table and graph do not reflect the deduction of taxes that a shareholder would pay on distributions or Fund share redemptions. Total returns reflect maximum applicable sales charges as indicated in the table above, if any, changes in share price, and reinvestment of dividend and capital gain distributions. The graph assumes the initial investment amount shown above and reflects the deduction of all sales charges that would have applied for the period of investment. Performance figures may reflect certain fee waivers and/or expense limitations, without which total returns may have |
| | been lower. For more information on share classes and current fee waivers and/or expense limitations (if any), please refer to the Notes to Financial Statements. |
| 2. | Class B shares are closed to all new purchases as well as additional investments by existing Class B shareholders. |
| 3. | The gross expense ratios presented reflect the Fund’s “Total Annual Fund Operating Expenses” from the most recent Prospectus and may differ from other expense ratios disclosed in this report. |
The footnotes on the next page are an integral part of the table and graph and should be carefully read in conjunction with them.
| | | | | | | | | | | | |
| Benchmark Performance | | One Year | | | Five
Years | | | Ten Years
or Since
Inception | |
Bloomberg Barclays U.S. Government Bond Index4 | | | –0.62 | % | | | 1.26 | % | | | 3.52 | % |
Morningstar Intermediate Government Category Average5 | | | –0.51 | | | | 1.06 | | | | 3.44 | |
| 4. | The Bloomberg Barclays U.S. Government Bond Index is the Fund’s primary broad-based securities market index for comparison purposes. The Bloomberg Barclays U.S. Government Bond Index consists of publicly issued debt of the U.S. Treasury and government agencies. Results assume reinvestment of all income and capital gains. An investment cannot be made directly in an index. |
| 5. | The Morningstar Intermediate Government Category Average is representative of funds that have at least 90% of their bond holdings in bonds backed by U.S. government or by U.S. government-linked agencies. These funds have durations between 3.5 and 6 years. Results are based on average total returns of similar funds with all dividends and capital gain distributions reinvested. |
The footnotes on the preceding page are an integral part of the table and graph and should be carefully read in conjunction with them.
| | |
| 6 | | MainStay Government Fund |
Cost in Dollars of a $1,000 Investment in MainStay Government Fund (Unaudited)
The example below is intended to describe the fees and expenses borne by shareholders during the six-month period from May 1, 2017, to October 31, 2017, and the impact of those costs on your investment.
Example
As a shareholder of the Fund you incur two types of costs: (1) transaction costs, including exchange fees and sales charges (loads) on purchases (as applicable), and (2) ongoing costs, including management fees, distribution and/or service (12b-1) fees, and other Fund expenses (as applicable). This example is intended to help you understand your ongoing costs (in dollars) of investing in the Fund and to compare these costs with the ongoing costs of investing in other mutual funds. The example is based on an investment of $1,000 made at the beginning of the six-month period and held for the entire period from May 1, 2017, to October 31, 2017.
This example illustrates your Fund’s ongoing costs in two ways:
Actual Expenses
The second and third data columns in the table below provide information about actual account values and actual expenses. You may use the information in these columns, together with the amount you invested, to estimate the expenses that you paid during the six months ended October 31, 2017. Simply divide your account value by $1,000 (for example, an $8,600 account value divided by $1,000 = 8.6), then
multiply the result by the number under the heading entitled “Expenses Paid During Period” to estimate the expenses you paid on your account during this period.
Hypothetical Example for Comparison Purposes
The fourth and fifth data columns in the table below provide information about hypothetical account values and hypothetical expenses based on the Fund’s actual expense ratio and an assumed rate of return of 5% per year before expenses, which is not the Fund’s actual return. The hypothetical account values and expenses may not be used to estimate the actual ending account balances or expenses you paid for the six-month period shown. You may use this information to compare the ongoing costs of investing in the Fund with the ongoing costs of investing in other mutual funds. To do so, compare this 5% hypothetical example with the 5% hypothetical examples that appear in the shareholder reports of the other mutual funds.
Please note that the expenses shown in the table are meant to highlight your ongoing costs only and do not reflect any transactional costs, such as exchange fees or sales charges (loads). Therefore, the fourth and fifth data columns of the table are useful in comparing ongoing costs only and will not help you determine the relative total costs of owning different funds. In addition, if these transactional costs were included, your costs would have been higher.
| | | | | | | | | | | | | | | | | | | | | | |
| | | | | | | | | | | | | | | | | | |
| Share Class | | Beginning
Account
Value
5/1/17 | | | Ending Account
Value (Based
on Actual
Returns and
Expenses)
10/31/17 | | | Expenses
Paid
During
Period1 | | | Ending Account
Value (Based
on Hypothetical
5% Annualized
Return and
Actual Expenses)
10/31/17 | | | Expenses
Paid
During
Period1 | | | Net Expense
Ratio
During
Period2 |
| | | | | | |
| Class A Shares | | $ | 1,000.00 | | | $ | 1,008.30 | | | $ | 5.01 | | | $ | 1,020.20 | | | $ | 5.04 | | | 0.99% |
| | | | | | |
| Investor Class Shares | | $ | 1,000.00 | | | $ | 1,006.50 | | | $ | 6.68 | | | $ | 1,018.60 | | | $ | 6.72 | | | 1.32% |
| | | | | | |
| Class B Shares | | $ | 1,000.00 | | | $ | 1,002.70 | | | $ | 10.45 | | | $ | 1,014.80 | | | $ | 10.51 | | | 2.07% |
| | | | | | |
| Class C Shares | | $ | 1,000.00 | | | $ | 1,002.70 | | | $ | 10.45 | | | $ | 1,014.80 | | | $ | 10.51 | | | 2.07% |
| | | | | | |
| Class I Shares | | $ | 1,000.00 | | | $ | 1,010.70 | | | $ | 3.75 | | | $ | 1,021.50 | | | $ | 3.77 | | | 0.74% |
| 1. | Expenses are equal to the Fund’s annualized expense ratio of each class multiplied by the average account value over the period, divided by 365 and multiplied by 184 (to reflect the six-month period). The table above represents the actual expenses incurred during the six-month period. |
| 2. | Expenses are equal to the Fund’s annualized expense ratio to reflect the six-month period. |
Portfolio Composition as of October 31, 2017 (Unaudited)
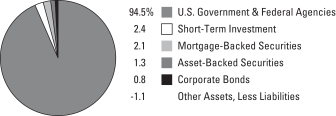
See Portfolio of Investments beginning on page 12 for specific holdings within these categories.
Top Ten Holdings as of October 31, 2017 (excluding short-term investment) (Unaudited)
| 1. | Tennessee Valley Authority, 4.65%, due 6/15/35 |
| 2. | Federal Home Loan Mortgage Corporation (Mortgage Pass-Through Securities), 4.00%, due 3/1/41 |
| 3. | Federal Home Loan Mortgage Corporation (Mortgage Pass-Through Securities), 4.00%, due 2/1/41 |
| 4. | Government National Mortgage Association (Mortgage Pass-Through Securities), 4.00%, due 10/15/41 |
| 5. | Federal Home Loan Mortgage Corporation (Mortgage Pass-Through Securities), 3.00%, due 6/1/45 |
| 6. | Federal National Mortgage Association (Mortgage Pass-Through Securities), 4.50%, due 1/1/41 |
| 7. | Federal National Mortgage Association (Mortgage Pass-Through Securities), 3.50%, due 11/1/41 |
| 8. | Federal National Mortgage Association (Mortgage Pass-Through Securities), 3.00%, due 4/1/43 |
| 9. | Federal Home Loan Mortgage Corporation (Mortgage Pass-Through Securities), 3.50%, due 8/1/43 |
| 10. | Federal Home Loan Mortgage Corporation (Mortgage Pass-Through Securities), 4.00%, due 12/1/40 |
| | |
| 8 | | MainStay Government Fund |
Portfolio Management Discussion and Analysis (Unaudited)
Questions answered by portfolio managers Dan Roberts, PhD, Louis N. Cohen, CFA, and Steven H. Rich, PhD, of MacKay Shields LLC, the Fund’s Subadvisor.
How did MainStay Government Fund perform relative to its primary benchmark and peers during the 12 months ended October 31, 2017?
Excluding all sales charges, MainStay Government Fund returned –0.60% for Class A shares, –0.91% for Investor Class shares and –1.66% for Class B and Class C shares for the 12 months ended October 31, 2017. Over the same period, the Fund’s Class I shares returned –0.23%. For the 12 months ended October 31, 2017, Class I shares and Class A shares outperformed—and all other share classes underperformed—the –0.62% return of the Bloomberg Barclays U.S. Government Bond Index,1 which is the Fund’s broad-based securities-market index. Over the same period, Class I shares outperformed—and all other share classes underperformed—the –0.51% return of the Morningstar Intermediate Government Category Average.2 See page 5 for Fund returns with applicable sales charges.
What factors affected the Fund’s relative performance during the reporting period?
The Fund’s performance relative to the Bloomberg Barclays U.S. Government Bond Index was affected primarily by four factors during the reporting period: duration3 positioning, yield-curve4 posture, sector weightings and issue selection.
The Fund’s duration was shorter than that of the Bloomberg Barclays U.S. Government Bond Index during the reporting period. As a result, the Fund was less sensitive to changes in U.S. Treasury yields than the benchmark and longer-duration peers. The short-duration posture was beneficial for the Fund’s relative performance, as yields rose across the yield curve.
During the reporting period, the spread5 between the 2- and 30-year U.S. Treasury benchmark yields narrowed. An absence of positive momentum related to the U.S. presidential administration’s pro-cyclical agenda deflated post-election expectations and caused longer-maturity U.S. Treasury yields to fall from their 2016 year-end values. This stood in contrast to the general rise in short-term yields. This flattening of the yield curve would have benefited Fund peers that were more concentrated in longer-duration securities.
Agency mortgage pass-through securities6 were the largest class of securities in the Fund. The Fund’s commitment to agency mortgage pass-throughs imparted a yield advantage
over lower-yielding U.S. Treasury securities and agency debentures. This benefit was, however, slightly offset by the underperformance of agency mortgage-backed securities relative to comparable-duration U.S. Treasury securities. Although the mortgage sector was initially unnerved by the Federal Reserve’s preparations to trim its balance sheet by slowing reinvestment of principal runoff from its mortgage holdings, investors eventually took the news in stride. Range bound U.S. Treasury yields further calmed investors’ concerns. From the end of 2016 through the end of the reporting period, yields on securities with maturities of 5 years and longer moved no more than 20 basis points. In light of the Fund’s commitment to mortgage-backed securities, the Fund’s performance benefited relative to the Bloomberg Barclays U.S. Government Bond Index, which holds no mortgage-backed securities, and relative to peers with less exposure to the mortgage sector.
The Fund’s mortgage allocation favored mortgage-backed securities issued by Fannie Mae and Freddie Mac. Given the outperformance of Fannie Mae and Freddie Mac issues during the reporting period, the Fund benefited relative to peers with larger Ginnie Mae commitments. Ginnie Mae securities typically exhibit faster prepayment speeds than equivalent Fannie Mae and Freddie Mac issues because Ginnie Mae-eligible borrowers can be more responsive to refinancing opportunities. Faster prepayment rates hampered the returns of mortgage-backed securities because the majority of the mortgage market was currently priced above par at the end of the reporting period and prepayments return principal to investors at par.
Underweighting the Ginnie Mae sector was one strategy to cushion against faster prepayment rates. A second strategy to moderate the effect of faster prepayments was to own mortgage securities backed by loans whose borrowers are less responsive to lower mortgage rates. An example is a mortgage security associated with a pool of smaller-balance loans. Borrowers with smaller outstanding loan balances have less incentive to respond to lower mortgage rates because the economic benefits associated with refinancing correlates with loan size. A third strategy involved mortgage-backed securities collateralized by loans with lower mortgages rates, which are less likely to be refinanceable at advantageous rates.
We favored mortgage securities backed by 30-year loans whose longer loan-term offered exposure to a broader segment of the
| 1. | See footnote on page 6 for more information on the Bloomberg Barclays U.S. Government Bond Index. |
| 2. | See footnote on page 6 for more information on the Morningstar Intermediate Government Category Average. |
| 3. | Duration is a measure of the price sensitivity of a fixed-income investment to changes in interest rates. Duration is expressed as a number of years and is considered a more accurate sensitivity gauge than average maturity. |
| 4. | The yield curve is a line that plots the yields of various securities of similar quality—typically U.S. Treasury issues—across a range of maturities. The U.S. Treasury yield curve serves as a benchmark for other debt and is used in economic forecasting. |
| 5. | The terms “spread” and “yield spread” may refer to the difference in yield between a security or type of security and comparable U.S. Treasury issues. The term may also refer to the difference in yield between two specific securities or types of securities at a given time. |
| 6. | Mortgage pass-through securities consist of a pool of residential mortgage loans in which homeowners’ monthly payments of principal, interest and prepayments pass from the original bank through a government agency or an investment bank to investors. |
U.S. Treasury yield curve. In turn, their wide cash-flow window aligned well with a flatter yield curve. As a consequence, the reporting period’s yield-curve trajectory would have been less promising for peers with larger commitments to mortgage securities backed by shorter-term loans, such as 15- or 20-year loans.
Low portfolio turnover benefited the Fund relative to peers with higher turnover by limiting transaction costs. The Fund sought to preserve yield by remaining nearly fully invested, which avoided large cash balances that can detract from performance.
What was the Fund’s duration strategy during the reporting period?
The Fund’s duration extended from 3.5 to 4.6 years during the reporting period. The Bloomberg Barclays U.S. Government Bond Index’s duration was stable at 6.1 years during the reporting period. Being shorter than the duration of the benchmark, the Fund’s duration posture had a beneficial impact on relative performance because U.S. Treasury yields rose, on average, across the yield curve. The Fund’s duration extension signaled the propensity of mortgage-backed securities to lengthen as residential mortgage rates rise and refinancing opportunities abate.
What specific factors, risks or market forces prompted significant decisions for the Fund during the reporting period?
Most of the Fund’s residential mortgage exposure is taken via mortgage passthroughs rather than collateralized mortgage obligations (CMOs). In our opinion, the compensation demanded by the market for the better predictability of CMO cash-flows was excessive.
The reporting period highlighted a housing market buoyed by rising home prices (which tend to promote turnover) and higher mortgage rates (which tend to dampen affordability). To mute the impact of these changes, we emphasized mortgage pass-through securities whose underlying loan pools were less sensitive to mortgage-rate changes. We believed that these “call-protected” pass-through securities (those less likely to be prepaid by the underlying mortgage holders) could be a source of better value because the loan pools would tend to be less responsive to mortgage-rate volatility. We believe that this, in turn, could help stabilize prepayment speeds and enable investors to preserve more of the security’s yield. A loan pool comprised of smaller-balance loans (e.g., a loan pool where no mortgage is larger than $150,000) is one instance of a mortgage-backed security with superior call protection.
Generally, we diversify a portion of the Fund away from agency mortgage securities to avoid concentration risk. Other investments in the Fund include U.S. Treasury securities, agency debentures, commercial mortgage-backed securities, asset-backed securities and investment-grade corporate bonds. The Fund ended the reporting period with 87% exposure to agency mortgage securities, 7% exposure to other government-related sectors, 2% exposure to securities collateralized by commercial mortgages or non-mortgage receivables and 2% in cash or cash equivalents.
During the reporting period, which aspects of the Fund’s positioning were the strongest positive contributors to the Fund’s performance and which aspects detracted the most?
Duration was the principal contributor to the Fund’s performance relative to the Bloomberg Barclays U.S. Government Bond Index. (Contributions take weightings and total returns into account.) Because the Fund was positioned to be less sensitive to changes in U.S. Treasury yields, it benefited as longer-term yields declined in 2017.
The yield advantage of mortgage-backed securities relative to comparable-duration U.S. Treasury securities contributed to the Fund’s absolute and relative performance.
A performance headwind during the reporting period was the Fund’s commitment to mortgage-backed securities, which underperformed comparable-duration U.S. Treasury securities. We offset some of this drag on performance by favoring mortgage-backed securities with stable cash flows, which better positioned the Fund to withstand progressively lower mortgage rates in 2017.
Issue selection, specifically our willingness to underweight Ginnie Mae securities in favor of Fannie Mae and Freddie Mac pass-through securities contributed to performance relative to the Fund’s peers, as Ginnie Mae prepayment rates accelerated as mortgage rates fell, causing Ginnie Mae security performance to lag. Our willingness to favor 30-year loan terms over shorter (15- and 20-year) loan terms was also advantageous. More sensitive to a flatter curve (because of their wider cash-flow windows as the long loan-term expands the window over which borrowers may prepay), 30-year loan terms tended to outperform during the reporting period.
Did the Fund make any significant purchases or sales during the reporting period?
Sector exposures remained relatively stable during the reporting period. We were inclined to recycle mortgage prepayments back into the mortgage sector.
| | |
| 10 | | MainStay Government Fund |
How was the Fund positioned at the end of the reporting period?
As of October 31, 2017, the Fund held underweight positions relative to the Bloomberg Barclays U.S. Government Bond Index in U.S. Treasury securities and agency debentures and an overweight position in agency mortgage pass-through securities. As of the same date, the Fund held modestly overweight positions relative to the Index in asset-backed securities and commercial mortgage-backed securities. As of October 31, 2017, the Fund’s collective non-government exposure was about 4% of net assets, and the Fund held about 2% of net assets in cash or cash equivalents.
The opinions expressed are those of the portfolio managers as of the date of this report and are subject to change. There is no guarantee that any forecasts will come to pass. This material does not constitute investment advice and is not intended as an endorsement of any specific investment.
Portfolio of Investments October 31, 2017
| | | | | | | | |
| | | Principal
Amount | | | Value | |
Long-Term Bonds 98.7%†
Asset-Backed Securities 1.3% | | | | | |
Other ABS 0.2% | | | | | | | | |
Small Business Administration Participation Certificates
Series 2015-20G, Class 1 2.88%, due 7/1/35 | | $ | 284,360 | | | $ | 288,179 | |
| | | | | | | | |
| | |
Utilities 1.1% | | | | | | | | |
Atlantic City Electric Transition Funding LLC Series 2002-1, Class A4 5.55%, due 10/20/23 | | | 1,306,709 | | | | 1,403,450 | |
| | | | | | | | |
Total Asset-Backed Securities (Cost $1,603,911) | | | | | | | 1,691,629 | |
| | | | | | | | |
|
| Corporate Bonds 0.8% | |
Electric 0.8% | |
Duke Energy Florida Project Finance LLC 2.538%, due 9/1/31 | | | 1,100,000 | | | | 1,067,678 | |
| | | | | | | | |
Total Corporate Bonds
(Cost $1,099,958) | | | | | | | 1,067,678 | |
| | | | | | | | |
|
| Mortgage-Backed Securities 2.1% | |
Commercial Mortgage Loans (Collateralized Mortgage Obligations) 1.3% | |
BXP Trust
Series 2017-GM, Class A
3.379%, due 6/13/39 (a) | | | 1,055,000 | | | | 1,073,734 | |
Four Times Square Trust Series 2006-4TS, Class A
5.401%, due 12/13/28 (a) | | | 607,412 | | | | 657,611 | |
| | | | | | | | |
| | | | 1,731,345 | |
| | | | | | | | |
Residential Mortgages
(Collateralized Mortgage Obligations) 0.8% | |
Citigroup Mortgage Loan Trust, Inc. Series 2006-AR6, Class 1A1
3.494%, due 8/25/36 (b) | | | 163,139 | | | | 149,918 | |
Mortgage Equity Conversion Asset Trust Series 2007-FF2, Class A
1.70% (1-year Treasury Constant Maturity Rate + 0.47%), due 2/25/42 (a)(c)(d)(e)(f) | | | 980,036 | | | | 835,554 | |
| | | | | | | | |
| | | | 985,472 | |
| | | | | | | | |
Total Mortgage-Backed Securities (Cost $2,803,823) | | | | | | | 2,716,817 | |
| | | | | | | | |
| | | | | | | | |
| | | Principal
Amount | | | Value | |
| U.S. Government & Federal Agencies 94.5% | |
Fannie Mae Strip (Collateralized Mortgage Obligations) (g) 0.0%‡ | |
Series 360, Class 2, IO 5.00%, due 8/25/35 | | $ | 156,890 | | | $ | 31,085 | |
Series 361, Class 2, IO 6.00%, due 10/25/35 | | | 32,824 | | | | 6,659 | |
| | | | | | | | |
| | | | 37,744 | |
| | | | | | | | |
Federal Home Loan Mortgage Corporation
(Mortgage Pass-Through Securities) 31.1% | |
2.50%, due 8/1/46 | | | 1,166,783 | | | | 1,127,251 | |
2.901% (1-year Treasury Constant Maturity Rate + 2.25%), due 2/1/37 (d) | | | 38,024 | | | | 40,051 | |
3.00%, due 4/1/45 | | | 2,292,999 | | | | 2,297,810 | |
¨3.00%, due 6/1/45 | | | 2,849,433 | | | | 2,855,632 | |
3.00%, due 7/1/45 | | | 1,271,444 | | | | 1,274,255 | |
3.00%, due 5/1/46 | | | 794,758 | | | | 796,702 | |
3.229% (1-year Treasury Constant Maturity Rate + 2.25%), due 6/1/35 (d) | | | 110,958 | | | | 116,795 | |
3.353% (12-month USD-LIBOR-BBA + 1.625%), due 3/1/35 (d) | | | 21,567 | | | | 22,601 | |
3.50%, due 10/1/25 | | | 258,633 | | | | 270,762 | |
3.50%, due 11/1/25 | | | 1,703,121 | | | | 1,783,194 | |
3.50%, due 4/1/42 | | | 783,716 | | | | 811,169 | |
3.50%, due 5/1/42 | | | 625,007 | | | | 645,696 | |
3.50%, due 7/1/42 | | | 308,737 | | | | 318,948 | |
3.50%, due 6/1/43 | | | 807,830 | | | | 834,568 | |
¨3.50%, due 8/1/43 | | | 2,563,263 | | | | 2,649,884 | |
3.50%, due 1/1/44 | | | 855,864 | | | | 884,143 | |
3.50%, due 5/1/44 | | | 276,200 | | | | 285,874 | |
3.50%, due 3/1/45 | | | 1,079,342 | | | | 1,110,327 | |
3.50%, due 12/1/45 | | | 459,639 | | | | 472,835 | |
3.50%, due 5/1/46 | | | 660,007 | | | | 678,955 | |
4.00%, due 3/1/25 | | | 632,123 | | | | 663,800 | |
4.00%, due 7/1/25 | | | 287,774 | | | | 302,631 | |
4.00%, due 8/1/31 | | | 102,127 | | | | 108,282 | |
4.00%, due 8/1/39 | | | 215,141 | | | | 228,782 | |
¨4.00%, due 12/1/40 | | | 2,409,527 | | | | 2,563,894 | |
¨4.00%, due 2/1/41 | | | 3,805,327 | | | | 4,044,429 | |
¨4.00%, due 3/1/41 | | | 4,063,207 | | | | 4,324,705 | |
4.00%, due 4/1/41 | | | 383,950 | | | | 406,857 | |
4.00%, due 1/1/42 | | | 2,076,739 | | | | 2,210,593 | |
4.00%, due 12/1/42 | | | 619,069 | | | | 654,935 | |
4.00%, due 11/1/43 | | | 190,584 | | | | 200,277 | |
4.00%, due 2/1/46 | | | 1,022,255 | | | | 1,073,013 | |
4.50%, due 3/1/41 | | | 505,938 | | | | 547,131 | |
4.50%, due 8/1/41 | | | 759,417 | | | | 822,485 | |
5.00%, due 1/1/20 | | | 34,767 | | | | 35,407 | |
5.00%, due 6/1/33 | | | 319,199 | | | | 347,894 | |
5.00%, due 8/1/33 | | | 265,033 | | | | 288,722 | |
| † | Percentages indicated are based on Fund net assets. |
| ¨ | | Among the Fund’s 10 largest holdings, as of October 31, 2017, excluding short-term investment. May be subject to change daily. (Unaudited) |
| | | | |
| 12 | | MainStay Government Fund | | The notes to the financial statements are an integral part of,
and should be read in conjunction with, the financial statements. |
| | | | | | | | |
| | | Principal
Amount | | | Value | |
| U.S. Government & Federal Agencies (continued) | |
Federal Home Loan Mortgage Corporation
(Mortgage Pass-Through Securities) (continued) | |
5.00%, due 5/1/36 | | $ | 276,521 | | | $ | 301,119 | |
5.00%, due 10/1/39 | | | 673,004 | | | | 743,420 | |
5.50%, due 1/1/21 | | | 128,239 | | | | 133,108 | |
5.50%, due 11/1/35 | | | 300,220 | | | | 337,632 | |
5.50%, due 11/1/36 | | | 78,771 | | | | 89,389 | |
6.50%, due 4/1/37 | | | 65,214 | | | | 74,188 | |
| | | | | | | | |
| | | | 39,780,145 | |
| | | | | | | | |
Federal National Mortgage Association
(Mortgage Pass-Through Securities) 44.6% | |
2.00%, due 11/1/31 | | | 909,972 | | | | 892,471 | |
2.50%, due 2/1/43 | | | 776,139 | | | | 752,916 | |
2.95% (6-month USD-LIBOR-BBA + 1.55%), due 11/1/34 (d) | | | 95,236 | | | | 98,789 | |
3.00%, due 10/1/32 | | | 723,572 | | | | 740,415 | |
¨3.00%, due 4/1/43 | | | 2,641,467 | | | | 2,657,232 | |
3.00%, due 3/1/46 | | | 913,232 | | | | 914,265 | |
3.00%, due 9/1/46 | | | 2,301,156 | | | | 2,292,212 | |
3.00%, due 10/1/46 | | | 1,728,196 | | | | 1,721,434 | |
3.356% (12-month USD-LIBOR-BBA + 1.606%), due 4/1/34 (d) | | | 252,218 | | | | 269,540 | |
3.50%, due 11/1/25 | | | 816,634 | | | | 851,082 | |
3.50%, due 11/1/32 | | | 539,384 | | | | 562,230 | |
3.50%, due 2/1/41 | | | 1,608,762 | | | | 1,662,463 | |
¨3.50%, due 11/1/41 | | | 2,706,711 | | | | 2,803,806 | |
3.50%, due 12/1/41 | | | 301,881 | | | | 312,106 | |
3.50%, due 1/1/42 | | | 1,407,859 | | | | 1,461,886 | |
3.50%, due 3/1/42 | | | 1,743,570 | | | | 1,800,597 | |
3.50%, due 8/1/42 | | | 1,140,654 | | | | 1,178,089 | |
3.50%, due 12/1/42 | | | 696,903 | | | | 722,609 | |
3.50%, due 2/1/43 | | | 982,829 | | | | 1,019,075 | |
3.50%, due 5/1/43 | | | 582,232 | | | | 601,273 | |
3.50%, due 6/1/43 | | | 716,103 | | | | 739,724 | |
4.00%, due 9/1/31 | | | 997,890 | | | | 1,056,470 | |
4.00%, due 2/1/41 | | | 1,157,144 | | | | 1,227,032 | |
4.00%, due 3/1/41 | | | 1,716,490 | | | | 1,833,675 | |
4.00%, due 10/1/41 | | | 391,322 | | | | 418,000 | |
4.00%, due 3/1/42 | | | 1,050,389 | | | | 1,112,604 | |
4.00%, due 4/1/42 | | | 495,441 | | | | 524,844 | |
4.00%, due 6/1/42 | | | 1,486,564 | | | | 1,572,834 | |
4.00%, due 7/1/42 | | | 1,388,096 | | | | 1,468,823 | |
4.50%, due 11/1/18 | | | 108,580 | | | | 110,430 | |
4.50%, due 6/1/23 | | | 222,858 | | | | 233,376 | |
4.50%, due 5/1/39 | | | 491,996 | | | | 535,226 | |
4.50%, due 6/1/39 | | | 1,480,185 | | | | 1,609,324 | |
4.50%, due 7/1/39 | | | 1,594,183 | | | | 1,738,483 | |
4.50%, due 8/1/39 | | | 1,293,125 | | | | 1,407,067 | |
4.50%, due 9/1/40 | | | 1,140,905 | | | | 1,244,630 | |
4.50%, due 12/1/40 | | | 1,583,119 | | | | 1,710,376 | |
| | | | | | | | |
| | | Principal
Amount | | | Value | |
Federal National Mortgage Association
(Mortgage Pass-Through Securities) (continued) | |
¨4.50%, due 1/1/41 | | $ | 2,573,729 | | | $ | 2,808,205 | |
4.50%, due 2/1/41 | | | 844,622 | | | | 917,617 | |
4.50%, due 8/1/41 | | | 584,262 | | | | 633,107 | |
4.50%, due 12/1/43 | | | 363,049 | | | | 388,665 | |
5.00%, due 9/1/20 | | | 3,742 | | | | 3,802 | |
5.00%, due 11/1/33 | | | 329,984 | | | | 361,811 | |
5.00%, due 6/1/35 | | | 297,401 | | | | 325,201 | |
5.00%, due 10/1/35 | | | 124,495 | | | | 136,539 | |
5.00%, due 1/1/36 | | | 64,786 | | | | 71,070 | |
5.00%, due 2/1/36 | | | 458,770 | | | | 503,045 | |
5.00%, due 5/1/36 | | | 311,011 | | | | 341,056 | |
5.00%, due 6/1/36 | | | 51,582 | | | | 56,400 | |
5.00%, due 9/1/36 | | | 86,137 | | | | 94,449 | |
5.00%, due 3/1/40 | | | 802,328 | | | | 886,309 | |
5.00%, due 2/1/41 | | | 1,715,177 | | | | 1,906,683 | |
5.50%, due 6/1/19 | | | 114,347 | | | | 116,156 | |
5.50%, due 11/1/19 | | | 113,661 | | | | 115,441 | |
5.50%, due 4/1/21 | | | 237,310 | | | | 245,695 | |
5.50%, due 6/1/33 | | | 935,584 | | | | 1,046,094 | |
5.50%, due 11/1/33 | | | 544,747 | | | | 608,495 | |
5.50%, due 12/1/33 | | | 660,121 | | | | 737,825 | |
5.50%, due 6/1/34 | | | 163,732 | | | | 182,913 | |
5.50%, due 12/1/34 | | | 45,614 | | | | 50,907 | |
5.50%, due 3/1/35 | | | 268,729 | | | | 299,695 | |
5.50%, due 12/1/35 | | | 65,098 | | | | 72,747 | |
5.50%, due 4/1/36 | | | 190,697 | | | | 212,826 | |
5.50%, due 9/1/36 | | | 69,251 | | | | 77,388 | |
5.50%, due 7/1/37 | | | 202,846 | | | | 230,591 | |
6.00%, due 11/1/32 | | | 174,617 | | | | 198,395 | |
6.00%, due 1/1/33 | | | 121,379 | | | | 137,408 | |
6.00%, due 3/1/33 | | | 129,292 | | | | 145,685 | |
6.00%, due 9/1/34 | | | 58,634 | | | | 66,419 | |
6.00%, due 9/1/35 | | | 427,101 | | | | 490,030 | |
6.00%, due 10/1/35 | | | 194,948 | | | | 222,348 | |
6.00%, due 6/1/36 | | | 141,231 | | | | 160,314 | |
6.00%, due 11/1/36 | | | 211,815 | | | | 239,535 | |
6.00%, due 4/1/37 | | | 29,222 | | | | 30,653 | |
6.50%, due 10/1/31 | | | 102,455 | | | | 115,375 | |
6.50%, due 2/1/37 | | | 42,040 | | | | 46,597 | |
| | | | | | | | |
| | | | 57,140,899 | |
| | | | | | | | |
Government National Mortgage Association
(Mortgage Pass-Through Securities) 11.3% | |
3.00%, due 6/20/46 | | | 827,834 | | | | 828,756 | |
3.50%, due 4/1/45 TBA (h) | | | 1,700,000 | | | | 1,763,684 | |
3.50%, due 12/20/46 | | | 1,416,775 | | | | 1,478,101 | |
4.00%, due 7/15/39 | | | 298,854 | | | | 314,279 | |
4.00%, due 9/20/40 | | | 1,413,733 | | | | 1,504,998 | |
4.00%, due 11/20/40 | | | 235,905 | | | | 251,134 | |
4.00%, due 1/15/41 | | | 1,349,368 | | | | 1,425,688 | |
| | | | | | |
The notes to the financial statements are an integral part of,
and should be read in conjunction with, the financial statements. | | | | | 13 | |
Portfolio of Investments October 31, 2017 (continued)
| | | | | | | | |
| | | Principal
Amount | | | Value | |
| U.S. Government & Federal Agencies (continued) | |
Government National Mortgage Association
(Mortgage Pass-Through Securities) (continued) | |
¨4.00%, due 10/15/41 | | $ | 2,995,676 | | | $ | 3,188,446 | |
4.00%, due 6/20/47 | | | 1,265,810 | | | | 1,306,466 | |
4.50%, due 5/20/40 | | | 1,247,005 | | | | 1,340,542 | |
5.00%, due 2/20/41 | | | 302,203 | | | | 330,609 | |
6.00%, due 8/15/32 | | | 254,769 | | | | 289,379 | |
6.00%, due 12/15/32 | | | 95,413 | | | | 107,272 | |
6.50%, due 8/15/28 | | | 89,731 | | | | 99,331 | |
6.50%, due 4/15/31 | | | 258,724 | | | | 298,731 | |
| | | | | | | | |
| | | | 14,527,416 | |
| | | | | | | | |
Overseas Private Investment Corporation 1.6% | |
5.142%, due 12/15/23 | | | 1,863,469 | | | | 2,041,922 | |
| | | | | | | | |
|
Tennessee Valley Authority 5.3% | |
¨4.65%, due 6/15/35 | | | 5,605,000 | | | | 6,748,515 | |
| | | | | | | | |
| | |
United States Treasury Notes 0.6% | | | | | | | | |
2.375%, due 8/15/24 | | | 800,000 | | | | 808,031 | |
| | | | | | | | |
Total U.S. Government & Federal Agencies (Cost $117,496,576) | | | | | | | 121,084,672 | |
| | | | | | | | |
Total Long-Term Bonds
(Cost $123,004,268) | | | | | | | 126,560,796 | |
| | | | | | | | |
| | |
| Short-Term Investment 2.4% | | | | | | | | |
Repurchase Agreement 2.4% | | | | | | | | |
Fixed Income Clearing Corp.
0.34%, dated 10/31/17
due 11/1/17
Proceeds at Maturity $3,021,398 (Collateralized by a United States Treasury Note with a rate of 1.625% and a maturity date of 4/30/23, with a Principal Amount of $3,160,000 and a Market Value of $3,085,689) | | | 3,021,369 | | | | 3,021,369 | |
| | | | | | | | |
Total Short-Term Investment (Cost $3,021,369) | | | | | | | 3,021,369 | |
| | | | | | | | |
Total Investments
(Cost $126,025,637) | | | 101.1 | % | | | 129,582,165 | |
Other Assets, Less Liabilities | | | (1.1 | ) | | | (1,437,285 | ) |
Net Assets | | | 100.0 | % | | $ | 128,144,880 | |
| ‡ | Less than one-tenth of a percent. |
| (a) | May be sold to institutional investors only under Rule 144A or securities offered pursuant to Section 4(a)(2) of the Securities Act of 1933, as amended. |
| (b) | Collateral strip rate—A bond whose interest was based on the weighted net interest rate of the collateral. The coupon rate adjusts periodically |
| | based on a predetermined schedule. Rate shown was the rate in effect as of October 31, 2017. |
| (c) | Security in which significant unobservable inputs (Level 3) were used in determining fair value. |
| (d) | Floating rate—Rate shown was the rate in effect as of October 31, 2017. |
| (e) | Illiquid security—As of October 31, 2017, the total market value of the security deemed illiquid under procedures approved by the Board of Trustees was $835,554, which represented 0.7% of the Fund’s net assets. (Unaudited) |
| (f) | Fair valued security—Represents fair value as measured in good faith under procedures approved by the Board of Trustees. As of October 31, 2017, the total market value of this security was $835,554, which represented 0.7% of the Fund’s net assets. |
| (g) | Collateralized Mortgage Obligation Interest Only Strip—Pays a fixed or variable rate of interest based on mortgage loans or mortgage pass-through securities. The principal amount of the underlying pool represents the notional amount on which the current interest was calculated. The value of these stripped securities may be particularly sensitive to changes in prevailing interest rates and are typically more sensitive to changes in prepayment rates than traditional mortgage-backed securities. |
| (h) | TBA—Securities purchased on a forward commitment basis with an approximate principal amount and maturity date. The actual principal amount and maturity date will be determined upon settlement. As of October 31, 2017, the total net market value of these securities was $1,763,684, which represented 1.4% of the Fund’s net assets. All or a portion of these securities are a part of a mortgage dollar roll agreement. |
The following abbreviations are used in the preceding pages:
BBA—British Bankers’ Association
IO—Interest Only
LIBOR—London InterBank Offered Rate
| | | | |
| 14 | | MainStay Government Fund | | The notes to the financial statements are an integral part of,
and should be read in conjunction with, the financial statements. |
The following is a summary of the fair valuations according to the inputs used as of October 31, 2017, for valuing the Fund’s assets.
Asset Valuation Inputs
| | | | | | | | | | | | | | | | |
Description | | Quoted
Prices in
Active
Markets for
Identical
Assets (Level 1) | | | Significant
Other
Observable
Inputs (Level 2) | | | Significant
Unobservable
Inputs (Level 3) | | | Total | |
| Investments in Securities (a) | | | | | | | | | | | | | | | | |
| Long-Term Bonds | | | | | | | | | | | | | | | | |
Asset-Backed Securities | | $ | — | | | $ | 1,691,629 | | | $ | — | | | $ | 1,691,629 | |
Corporate Bonds | | | — | | | | 1,067,678 | | | | — | | | | 1,067,678 | |
Mortgage-Backed Securities (b) | | | — | | | | 1,881,263 | | | | 835,554 | | | | 2,716,817 | |
U.S. Government & Federal Agencies | | | — | | | | 121,084,672 | | | | — | | | | 121,084,672 | |
| | | | | | | | | | | | | | | | |
| Total Long-Term Bonds | | | — | | | | 125,725,242 | | | | 835,554 | | | | 126,560,796 | |
| | | | | | | | | | | | | | | | |
| Short-Term Investment | | | | | | | | | | | | | | | | |
Repurchase Agreement | | | — | | | | 3,021,369 | | | | — | | | | 3,021,369 | |
| | | | | | | | | | | | | | | | |
| Total Investments in Securities | | $ | — | | | $ | 128,746,611 | | | $ | 835,554 | | | $ | 129,582,165 | |
| | | | | | | | | | | | | | | | |
| (a) | For a complete listing of investments and their industries, see the Portfolio of Investments. |
| (b) | The Level 3 security valued at $835,554 is held in Residential Mortgages (Collateralized Mortgage Obligations) within the Mortgage-Backed Securities section of the Portfolio of Investments. |
The Fund recognizes transfers between the levels as of the beginning of the period.
For the year ended October 31, 2017, the Fund did not have any transfers among levels. (See Note 2)
The following is a reconciliation of investments in which significant unobservable inputs (Level 3) were used in determining value:
| | | | | | | | | | | | | | | | | | | | | | | | | | | | | | | | | | | | | | | | |
Investments in Securities | | Balance
as of
October 31,
2016 | | | Accrued
Discounts
(Premiums) | | | Realized
Gain
(Loss) | | | Change in
Unrealized
Appreciation
(Depreciation) | | | Purchases | | | Sales (a) | | | Transfers
in to
Level 3 | | | Transfers
out of
Level 3 | | | Balance
as of
October 31,
2017 | | | Change in
Unrealized
Appreciation
(Depreciation) from
Investments
Still Held at
October 31,
2017 (b) | |
Long-Term Bonds | | | | | | | | | | | | | | | | | | | | | | | | | | | | | | | | | | | | | | | | |
Mortgage-Backed Securities | | | | | | | | | | | | | | | | | | | | | | | | | | | | | | | | | | | | | | | | |
Residential Mortgages (Collateralized Mortgage Obligations) | | $ | 931,266 | | | $ | 971 | | | $ | 3,650 | | | $ | 15,239 | | | $ | — | | | $ | (115,572 | ) | | $ | — | | | $ | — | | | $ | 835,554 | | | $ | 1,552 | |
| | | | | | | | | | | | | | | | | | | | | | | | | | | | | | | | | | | | | | | | |
| Total | | $ | 931,266 | | | $ | 971 | | | $ | 3,650 | | | $ | 15,239 | | | $ | — | | | $ | (115,572 | ) | | $ | — | | | $ | — | | | $ | 835,554 | | | $ | 1,552 | |
| | | | | | | | | | | | | | | | | | | | | | | | | | | | | | | | | | | | | | | | |
| (a) | Sales include principal reductions. |
| (b) | Included in “Net change in unrealized appreciation (depreciation) on investments” in the Statement of Operations. |
| | | | | | |
The notes to the financial statements are an integral part of,
and should be read in conjunction with, the financial statements. | | | | | 15 | |
Statement of Assets and Liabilities as of October 31, 2017
| | | | |
| Assets | |
Investment in securities, at value
(identified cost $126,025,637) | | $ | 129,582,165 | |
Receivables: | | | | |
Interest | | | 479,151 | |
Fund shares sold | | | 89,334 | |
Investment securities sold | | | 4,071 | |
Other assets | | | 24,266 | |
| | | | |
Total assets | | | 130,178,987 | |
| | | | |
| |
| Liabilities | | | | |
Payables: | | | | |
Investment securities purchased | | | 1,765,730 | |
Fund shares redeemed | | | 102,758 | |
Manager (See Note 3) | | | 54,253 | |
NYLIFE Distributors (See Note 3) | | | 35,467 | |
Transfer agent (See Note 3) | | | 25,461 | |
Shareholder communication | | | 18,387 | |
Professional fees | | | 6,276 | |
Custodian | | | 4,061 | |
Trustees | | | 322 | |
Accrued expenses | | | 5,354 | |
Dividend payable | | | 16,038 | |
| | | | |
Total liabilities | | | 2,034,107 | |
| | | | |
Net assets | | $ | 128,144,880 | |
| | | | |
| |
| Composition of Net Assets | | | | |
Shares of beneficial interest outstanding (par value of $.01 per share) unlimited number of shares authorized | | $ | 153,685 | |
Additional paid-in capital | | | 125,613,250 | |
| | | | |
| | | 125,766,935 | |
Undistributed net investment income | | | 28,789 | |
Accumulated net realized gain (loss) on investments | | | (1,207,372 | ) |
Net unrealized appreciation (depreciation) on investments | | | 3,556,528 | |
| | | | |
Net assets | | $ | 128,144,880 | |
| | | | |
| | | | |
Class A | | | | |
Net assets applicable to outstanding shares | | $ | 82,828,377 | |
| | | | |
Shares of beneficial interest outstanding | | | 9,947,108 | |
| | | | |
Net asset value per share outstanding | | $ | 8.33 | |
Maximum sales charge (4.50% of offering price) | | | 0.39 | |
| | | | |
Maximum offering price per share outstanding | | $ | 8.72 | |
| | | | |
Investor Class | | | | |
Net assets applicable to outstanding shares | | $ | 24,187,465 | |
| | | | |
Shares of beneficial interest outstanding | | | 2,892,546 | |
| | | | |
Net asset value per share outstanding | | $ | 8.36 | |
Maximum sales charge (4.50% of offering price) | | | 0.39 | |
| | | | |
Maximum offering price per share outstanding | | $ | 8.75 | |
| | | | |
Class B | | | | |
Net assets applicable to outstanding shares | | $ | 4,730,226 | |
| | | | |
Shares of beneficial interest outstanding | | | 567,964 | |
| | | | |
Net asset value and offering price per share outstanding | | $ | 8.33 | |
| | | | |
Class C | | | | |
Net assets applicable to outstanding shares | | $ | 9,472,447 | |
| | | | |
Shares of beneficial interest outstanding | | | 1,137,892 | |
| | | | |
Net asset value and offering price per share outstanding | | $ | 8.32 | |
| | | | |
Class I | | | | |
Net assets applicable to outstanding shares | | $ | 6,926,365 | |
| | | | |
Shares of beneficial interest outstanding | | | 822,964 | |
| | | | |
Net asset value and offering price per share outstanding | | $ | 8.42 | |
| | | | |
| | | | |
| 16 | | MainStay Government Fund | | The notes to the financial statements are an integral part of,
and should be read in conjunction with, the financial statements. |
Statement of Operations for the year ended October 31, 2017
| | | | |
| Investment Income (Loss) | |
Income | | | | |
Interest | | $ | 4,386,749 | |
Other income | | | 148 | |
| | | | |
Total income | | | 4,386,897 | |
| | | | |
Expenses | | | | |
Manager (See Note 3) | | | 716,225 | |
Distribution/Service—Class A (See Note 3) | | | 199,503 | |
Distribution/Service—Investor Class (See Note 3) | | | 89,940 | |
Distribution/Service—Class B (See Note 3) | | | 56,441 | |
Distribution/Service—Class C (See Note 3) | | | 126,771 | |
Transfer agent (See Note 3) | | | 310,932 | |
Registration | | | 83,244 | |
Professional fees | | | 63,281 | |
Shareholder communication | | | 32,883 | |
Custodian | | | 8,544 | |
Trustees | | | 3,542 | |
Miscellaneous | | | 12,561 | |
| | | | |
Total expenses | | | 1,703,867 | |
| | | | |
Net investment income (loss) | | | 2,683,030 | |
| | | | |
|
| Realized and Unrealized Gain (Loss) on Investments | |
Net realized gain (loss) on investments | | | (609,487 | ) |
Net change in unrealized appreciation (depreciation) on investments | | | (3,841,831 | ) |
| | | | |
Net realized and unrealized gain (loss) on investments | | | (4,451,318 | ) |
| | | | |
Net increase (decrease) in net assets resulting from operations | | $ | (1,768,288 | ) |
| | | | |
| | | | | | |
The notes to the financial statements are an integral part of,
and should be read in conjunction with, the financial statements. | | | | | 17 | |
Statements of Changes in Net Assets
for the years ended October 31, 2017 and October 31, 2016
| | | | | | | | |
| | | 2017 | | | 2016 | |
| Increase (Decrease) in Net Assets | |
Operations: | | | | | | | | |
Net investment income (loss) | | $ | 2,683,030 | | | $ | 2,938,702 | |
Net realized gain (loss) on investments and futures transactions | | | (609,487 | ) | | | 89,722 | |
Net change in unrealized appreciation (depreciation) on investments and futures contracts | | | (3,841,831 | ) | | | 777,765 | |
| | | | |
Net increase (decrease) in net assets resulting from operations | | | (1,768,288 | ) | | | 3,806,189 | |
| | | | |
Dividends to shareholders: | | | | | | | | |
From net investment income: | | | | | | | | |
Class A | | | (1,689,227 | ) | | | (1,808,126 | ) |
Investor Class | | | (634,565 | ) | | | (717,921 | ) |
Class B | | | (58,276 | ) | | | (77,285 | ) |
Class C | | | (129,650 | ) | | | (200,490 | ) |
Class I | | | (224,077 | ) | | | (135,148 | ) |
| | | | |
Total dividends to shareholders | | | (2,735,795 | ) | | | (2,938,970 | ) |
| | | | |
Capital share transactions: | | | | | | | | |
Net proceeds from sale of shares | | | 27,812,690 | | | | 43,966,459 | |
Net asset value of shares issued to shareholders in reinvestment of dividends | | | 2,523,795 | | | | 2,705,385 | |
Cost of shares redeemed | | | (71,575,286 | ) | | | (36,142,554 | ) |
| | | | |
Increase (decrease) in net assets derived from capital share transactions | | | (41,238,801 | ) | | | 10,529,290 | |
| | | | |
Net increase (decrease) in net assets | | | (45,742,884 | ) | | | 11,396,509 | |
| | |
| Net Assets | | | | | | | | |
Beginning of year | | | 173,887,764 | | | | 162,491,255 | |
| | | | |
End of year | | $ | 128,144,880 | | | $ | 173,887,764 | |
| | | | |
Undistributed net investment income at end of year | | $ | 28,789 | | | $ | 58,917 | |
| | | | |
| | | | |
| 18 | | MainStay Government Fund | | The notes to the financial statements are an integral part of,
and should be read in conjunction with, the financial statements. |
Financial Highlights selected per share data and ratios
| | | | | | | | | | | | | | | | | | | | |
| | | Year ended October 31, | |
| Class A | | 2017 | | | 2016 | | | 2015 | | | 2014 | | | 2013 | |
Net asset value at beginning of year | | $ | 8.56 | | | $ | 8.51 | | | $ | 8.63 | | | $ | 8.57 | | | $ | 9.02 | |
| | | | | | | | | | | | | | | | | | | | |
Net investment income (loss) (a) | | | 0.17 | | | | 0.17 | | | | 0.20 | | | | 0.21 | | | | 0.19 | |
Net realized and unrealized gain (loss) on investments | | | (0.22 | ) | | | 0.05 | | | | (0.10 | ) | | | 0.08 | | | | (0.41 | ) |
| | | | | | | | | | | | | | | | | | | | |
Total from investment operations | | | (0.05 | ) | | | 0.22 | | | | 0.10 | | | | 0.29 | | | | (0.22 | ) |
| | | | | | | | | | | | | | | | | | | | |
| Less dividends and distributions: | | | | | | | | | | | | | | | | | | | | |
From net investment income | | | (0.18 | ) | | | (0.17 | ) | | | (0.20 | ) | | | (0.21 | ) | | | (0.20 | ) |
From net realized gain on investments | | | — | | | | — | | | | (0.02 | ) | | | (0.02 | ) | | | (0.03 | ) |
| | | | | | | | | | | | | | | | | | | | |
Total dividends and distributions | | | (0.18 | ) | | | (0.17 | ) | | | (0.22 | ) | | | (0.23 | ) | | | (0.23 | ) |
| | | | | | | | | | | | | | | | | | | | |
Net asset value at end of year | | $ | 8.33 | | | $ | 8.56 | | | $ | 8.51 | | | $ | 8.63 | | | $ | 8.57 | |
| | | | | | | | | | | | | | | | | | | | |
Total investment return (b) | | | (0.60 | %) | | | 2.60 | % | | | 1.17 | % | | | 3.46 | % | | | (2.50 | %) |
| Ratios (to average net assets)/Supplemental Data: | | | | | | | | | | | | | | | | | | | | |
Net investment income (loss) | | | 2.07 | % | | | 1.99 | %(c) | | | 2.38 | % | | | 2.47 | % | | | 2.17 | % |
Net expenses | | | 1.00 | % | | | 0.98 | %(d) | | | 1.00 | % | | | 0.98 | % | | | 1.03 | % |
Expenses (before waiver/reimbursement) | | | 1.00 | % | | | 0.99 | % | | | 1.00 | % | | | 0.98 | % | | | 1.09 | % |
Portfolio turnover rate (e) | | | 20 | % | | | 41 | % | | | 13 | % | | | 14 | % | | | 28 | % |
Net assets at end of year (in 000’s) | | $ | 82,828 | | | $ | 93,242 | | | $ | 90,119 | | | $ | 100,212 | | | $ | 143,234 | |
| (a) | Per share data based on average shares outstanding during the year. |
| (b) | Total investment return is calculated exclusive of sales charges and assumes the reinvestment of dividends and distributions. For periods of less than one year, total return is not annualized. |
| (c) | Without the custody fee reimbursement, net investment income (loss) would have been 1.98%. |
| (d) | Without the custody fee reimbursement, net expenses would have been 0.99%. |
| (e) | The portfolio turnover rates not including mortgage dollar rolls were 6%, 16% and 7% for the years ended October 31, 2017, 2016, and 2013, respectively. |
| | | | | | | | | | | | | | | | | | | | |
| | | Year ended October 31, | |
| Investor Class | | 2017 | | | 2016 | | | 2015 | | | 2014 | | | 2013 | |
Net asset value at beginning of year | | $ | 8.59 | | | $ | 8.54 | | | $ | 8.66 | | | $ | 8.60 | | | $ | 9.05 | |
| | | | | | | | | | | | | | | | | | | | |
Net investment income (loss) (a) | | | 0.15 | | | | 0.15 | | | | 0.18 | | | | 0.19 | | | | 0.18 | |
Net realized and unrealized gain (loss) on investments | | | (0.23 | ) | | | 0.05 | | | | (0.10 | ) | | | 0.08 | | | | (0.42 | ) |
| | | | | | | | | | | | | | | | | | | | |
Total from investment operations | | | (0.08 | ) | | | 0.20 | | | | 0.08 | | | | 0.27 | | | | (0.24 | ) |
| | | | | | | | | | | | | | | | | | | | |
| Less dividends and distributions: | | | | | | | | | | | | | | | | | | | | |
From net investment income | | | (0.15 | ) | | | (0.15 | ) | | | (0.18 | ) | | | (0.19 | ) | | | (0.18 | ) |
From net realized gain on investments | | | — | | | | — | | | | (0.02 | ) | | | (0.02 | ) | | | (0.03 | ) |
| | | | | | | | | | | | | | | | | | | | |
Total dividends and distributions | | | (0.15 | ) | | | (0.15 | ) | | | (0.20 | ) | | | (0.21 | ) | | | (0.21 | ) |
| | | | | | | | | | | | | | | | | | | | |
Net asset value at end of year | | $ | 8.36 | | | $ | 8.59 | | | $ | 8.54 | | | $ | 8.66 | | | $ | 8.60 | |
| | | | | | | | | | | | | | | | | | | | |
Total investment return (b) | | | (0.91 | %) | | | 2.34 | % | | | 0.88 | % | | | 3.15 | % | | | (2.66 | %) |
| Ratios (to average net assets)/Supplemental Data: | | | | | | | | | | | | | | | | | | | | |
Net investment income (loss) | | | 1.77 | % | | | 1.74 | %(c) | | | 2.11 | % | | | 2.19 | % | | | 2.01 | % |
Net expenses | | | 1.30 | % | | | 1.23 | %(d) | | | 1.28 | % | | | 1.26 | % | | | 1.19 | % |
Expenses (before waiver/reimbursement) | | | 1.30 | % | | | 1.24 | % | | | 1.28 | % | | | 1.26 | % | | | 1.25 | % |
Portfolio turnover rate (e) | | | 20 | % | | | 41 | % | | | 13 | % | | | 14 | % | | | 28 | % |
Net assets at end of year (in 000’s) | | $ | 24,187 | | | $ | 40,094 | | | $ | 42,444 | | | $ | 45,947 | | | $ | 50,200 | |
| (a) | Per share data based on average shares outstanding during the year. |
| (b) | Total investment return is calculated exclusive of sales charges and assumes the reinvestment of dividends and distributions. For periods of less than one year, total return is not annualized. |
| (c) | Without the custody fee reimbursement, net investment income (loss) would have been 1.73%. |
| (d) | Without the custody fee reimbursement, net expenses would have been 1.24%. |
| (e) | The portfolio turnover rates not including mortgage dollar rolls were 6%, 16% and 7% for the years ended October 31, 2017, 2016, and 2013, respectively. |
| | | | | | |
The notes to the financial statements are an integral part of,
and should be read in conjunction with, the financial statements. | | | | | 19 | |
Financial Highlights selected per share data and ratios
| | | | | | | | | | | | | | | | | | | | |
| | | Year ended October 31, | |
| Class B | | 2017 | | | 2016 | | | 2015 | | | 2014 | | | 2013 | |
Net asset value at beginning of year | | $ | 8.56 | | | $ | 8.51 | | | $ | 8.63 | | | $ | 8.57 | | | $ | 9.02 | |
| | | | | | | | | | | | | | | | | | | | |
Net investment income (loss) (a) | | | 0.08 | | | | 0.08 | | | | 0.12 | | | | 0.12 | | | | 0.11 | |
Net realized and unrealized gain (loss) on investments | | | (0.22 | ) | | | 0.05 | | | | (0.10 | ) | | | 0.08 | | | | (0.42 | ) |
| | | | | | | | | | | | | | | | | | | | |
Total from investment operations | | | (0.14 | ) | | | 0.13 | | | | 0.02 | | | | 0.20 | | | | (0.31 | ) |
| | | | | | | | | | | | | | | | | | | | |
| Less dividends and distributions: | | | | | | | | | | | | | | | | | | | | |
From net investment income | | | (0.09 | ) | | | (0.08 | ) | | | (0.12 | ) | | | (0.12 | ) | | | (0.11 | ) |
From net realized gain on investments | | | — | | | | — | | | | (0.02 | ) | | | (0.02 | ) | | | (0.03 | ) |
| | | | | | | | | | | | | | | | | | | | |
Total dividends and distributions | | | (0.09 | ) | | | (0.08 | ) | | | (0.14 | ) | | | (0.14 | ) | | | (0.14 | ) |
| | | | | | | | | | | | | | | | | | | | |
Net asset value at end of year | | $ | 8.33 | | | $ | 8.56 | | | $ | 8.51 | | | $ | 8.63 | | | $ | 8.57 | |
| | | | | | | | | | | | | | | | | | | | |
Total investment return (b) | | | (1.66 | %) | | | 1.59 | % | | | 0.14 | % | | | 2.38 | % | | | (3.40 | %) |
| Ratios (to average net assets)/Supplemental Data: | | | | | | | | | | | | | | | | | | | | |
Net investment income (loss) | | | 1.01 | % | | | 0.99 | %(c) | | | 1.35 | % | | | 1.44 | % | | | 1.26 | % |
Net expenses | | | 2.05 | % | | | 1.98 | %(d) | | | 2.03 | % | | | 2.01 | % | | | 1.94 | % |
Expenses (before waiver/reimbursement) | | | 2.05 | % | | | 1.99 | % | | | 2.03 | % | | | 2.01 | % | | | 2.00 | % |
Portfolio turnover rate (e) | | | 20 | % | | | 41 | % | | | 13 | % | | | 14 | % | | | 28 | % |
Net assets at end of year (in 000’s) | | $ | 4,730 | | | $ | 7,154 | | | $ | 8,363 | | | $ | 10,550 | | | $ | 14,783 | |
| (a) | Per share data based on average shares outstanding during the year. |
| (b) | Total investment return is calculated exclusive of sales charges and assumes the reinvestment of dividends and distributions. For periods of less than one year, total return is not annualized. |
| (c) | Without the custody fee reimbursement, net investment income (loss) would have been 0.98%. |
| (d) | Without the custody fee reimbursement, net expenses would have been 1.99%. |
| (e) | The portfolio turnover rates not including mortgage dollar rolls were 6%, 16% and 7% for the years ended October 31, 2017, 2016, and 2013, respectively. |
| | | | | | | | | | | | | | | | | | | | |
| | | Year ended October 31, | |
| Class C | | 2017 | | | 2016 | | | 2015 | | | 2014 | | | 2013 | |
Net asset value at beginning of year | | $ | 8.55 | | | $ | 8.50 | | | $ | 8.62 | | | $ | 8.56 | | | $ | 9.01 | |
| | | | | | | | | | | | | | | | | | | | |
Net investment income (loss) (a) | | | 0.08 | | | | 0.08 | | | | 0.12 | | | | 0.12 | | | | 0.11 | |
Net realized and unrealized gain (loss) on investments | | | (0.22 | ) | | | 0.05 | | | | (0.10 | ) | | | 0.08 | | | | (0.42 | ) |
| | | | | | | | | | | | | | | | | | | | |
Total from investment operations | | | (0.14 | ) | | | 0.13 | | | | 0.02 | | | | 0.20 | | | | (0.31 | ) |
| | | | | | | | | | | | | | | | | | | | |
| Less dividends and distributions: | | | | | | | | | | | | | | | | | | | | |
From net investment income | | | (0.09 | ) | | | (0.08 | ) | | | (0.12 | ) | | | (0.12 | ) | | | (0.11 | ) |
From net realized gain on investments | | | — | | | | — | | | | (0.02 | ) | | | (0.02 | ) | | | (0.03 | ) |
| | | | | | | | | | | | | | | | | | | | |
Total dividends and distributions | | | (0.09 | ) | | | (0.08 | ) | | | (0.14 | ) | | | (0.14 | ) | | | (0.14 | ) |
| | | | | | | | | | | | | | | | | | | | |
Net asset value at end of year | | $ | 8.32 | | | $ | 8.55 | | | $ | 8.50 | | | $ | 8.62 | | | $ | 8.56 | |
| | | | | | | | | | | | | | | | | | | | |
Total investment return (b) | | | (1.66 | %) | | | 1.59 | % | | | 0.14 | % | | | 2.39 | % | | | (3.41 | %) |
| Ratios (to average net assets)/Supplemental Data: | | | | | | | | | | | | | | | | | | | | |
Net investment income (loss) | | | 1.00 | % | | | 0.99 | %(c) | | | 1.34 | % | | | 1.44 | % | | | 1.24 | % |
Net expenses | | | 2.05 | % | | | 1.98 | %(d) | | | 2.03 | % | | | 2.01 | % | | | 1.94 | % |
Expenses (before waiver/reimbursement) | | | 2.05 | % | | | 1.99 | % | | | 2.03 | % | | | 2.01 | % | | | 2.00 | % |
Portfolio turnover rate (e) | | | 20 | % | | | 41 | % | | | 13 | % | | | 14 | % | | | 28 | % |
Net assets at end of year (in 000’s) | | $ | 9,472 | | | $ | 19,338 | | | $ | 17,073 | | | $ | 11,226 | | | $ | 12,593 | |
| (a) | Per share data based on average shares outstanding during the year. |
| (b) | Total investment return is calculated exclusive of sales charges and assumes the reinvestment of dividends and distributions. For periods of less than one year, total return is not annualized. |
| (c) | Without the custody fee reimbursement, net investment income (loss) would have been 0.98%. |
| (d) | Without the custody fee reimbursement, net expenses would have been 1.99%. |
| (e) | The portfolio turnover rates not including mortgage dollar rolls were 6%, 16% and 7% for the years ended October 31, 2017, 2016, and 2013, respectively. |
| | | | |
| 20 | | MainStay Government Fund | | The notes to the financial statements are an integral part of,
and should be read in conjunction with, the financial statements. |
Financial Highlights selected per share data and ratios
| | | | | | | | | | | | | | | | | | | | |
| | | Year ended October 31, | |
| Class I | | 2017 | | | 2016 | | | 2015 | | | 2014 | | | 2013 | |
Net asset value at beginning of year | | $ | 8.64 | | | $ | 8.59 | | | $ | 8.71 | | | $ | 8.65 | | | $ | 9.10 | |
| | | | | | | | | | | | | | | | | | | | |
Net investment income (loss) (a) | | | 0.20 | | | | 0.19 | | | | 0.22 | | | | 0.23 | | | | 0.21 | |
Net realized and unrealized gain (loss) on investments | | | (0.22 | ) | | | 0.05 | | | | (0.09 | ) | | | 0.09 | | | | (0.41 | ) |
| | | | | | | | | | | | | | | | | | | | |
Total from investment operations | | | (0.02 | ) | | | 0.24 | | | | 0.13 | | | | 0.32 | | | | (0.20 | ) |
| | | | | | | | | | | | | | | | | | | | |
| Less dividends and distributions: | | | | | | | | | | | | | | | | | | | | |
From net investment income | | | (0.20 | ) | | | (0.19 | ) | | | (0.23 | ) | | | (0.24 | ) | | | (0.22 | ) |
From net realized gain on investments | | | — | | | | — | | | | (0.02 | ) | | | (0.02 | ) | | | (0.03 | ) |
| | | | | | | | | | | | | | | | | | | | |
Total dividends and distributions | | | (0.20 | ) | | | (0.19 | ) | | | (0.25 | ) | | | (0.26 | ) | | | (0.25 | ) |
| | | | | | | | | | | | | | | | | | | | |
Net asset value at end of year | | $ | 8.42 | | | $ | 8.64 | | | $ | 8.59 | | | $ | 8.71 | | | $ | 8.65 | |
| | | | | | | | | | | | | | | | | | | | |
Total investment return (b) | | | (0.23 | %) | | | 2.83 | % | | | 1.41 | % | | | 3.69 | % | | | (2.24 | %) |
| Ratios (to average net assets)/Supplemental Data: | | | | | | | | | | | | | | | | | | | | |
Net investment income (loss) | | | 2.33 | % | | | 2.16 | %(c) | | | 2.57 | % | | | 2.70 | % | | | 2.42 | % |
Net expenses | | | 0.75 | % | | | 0.73 | %(d) | | | 0.75 | % | | | 0.73 | % | | | 0.78 | % |
Expenses (before waiver/reimbursement) | | | 0.75 | % | | | 0.74 | % | | | 0.75 | % | | | 0.73 | % | | | 0.84 | % |
Portfolio turnover rate (e) | | | 20 | % | | | 41 | % | | | 13 | % | | | 14 | % | | | 28 | % |
Net assets at end of year (in 000’s) | | $ | 6,926 | | | $ | 14,061 | | | $ | 4,492 | | | $ | 10,020 | | | $ | 3,561 | |
| (a) | Per share data based on average shares outstanding during the year. |
| (b) | Total investment return is calculated exclusive of sales charges and assumes the reinvestment of dividends and distributions. Class I shares are not subject to sales charges. For periods of less than one year, total return is not annualized. |
| (c) | Without the custody fee reimbursement, net investment income (loss) would have been 2.15%. |
| (d) | Without the custody fee reimbursement, net expenses would have been 0.74%. |
| (e) | The portfolio turnover rates not including mortgage dollar rolls were 6%, 16% and 7% for the years ended October 31, 2017, 2016, and 2013, respectively. |
| | | | | | |
The notes to the financial statements are an integral part of,
and should be read in conjunction with, the financial statements. | | | | | 21 | |
Notes to Financial Statements
Note 1–Organization and Business
The MainStay Funds (the “Trust”) was organized on January 9, 1986, as a Massachusetts business trust and is governed by a Declaration of Trust. The Trust is registered under the Investment Company Act of 1940, as amended (the “1940 Act”), as an open-end management investment company, and is comprised of twelve funds (collectively referred to as the “Funds”). These financial statements and notes relate to the MainStay Government Fund (the “Fund”), a “diversified” fund, as that term is defined in the 1940 Act, as interpreted or modified by regulatory authorities having jurisdiction, from time to time.
The Fund currently has seven classes of shares registered for sale. Class A shares commenced operations on January 3, 1995. Class B shares commenced operations on May 1, 1986. Class C shares commenced operations on September 1, 1998. Class I shares commenced operations on January 2, 2004. Class R6 and Class T shares of the Fund were registered for sale effective as of February 28, 2017. As of October 31, 2017, Class R6 and Class T shares were not yet offered for sale. Investor Class shares commenced operations on February 28, 2008. Effective February 28, 2017, Class B shares of the MainStay Group of Funds were closed to all new purchases as well as additional investments by existing Class B shareholders. Existing Class B shareholders may continue to reinvest dividends and capital gains distributions, as well as exchange their Class B shares for Class B shares of other MainStay Group of Funds as permitted by the current exchange privileges. Class B shareholders continue to be subject to any applicable contingent deferred sales charge (“CDSC”) at the time of redemption. All other features of the Class B shares, including but not limited to the fees and expenses applicable to Class B shares, remain unchanged. Unless redeemed, Class B shareholders will remain in Class B shares of their respective fund until the Class B shares are converted to Class A or Investor Class shares pursuant to the applicable conversion schedule.
Class A and Investor Class shares are offered at net asset value (“NAV”) per share plus an initial sales charge. No initial sales charge applies to investments of $1 million or more (and certain other qualified purchases) in Class A and Investor Class shares. Effective August 1, 2017, a CDSC of 1.00% may be imposed on certain redemptions of Class A and Investor Class shares made within 18 months of the date of purchase on shares that were purchased without an initial sales charge. For purchases of Class A and Investor Class shares made from January 1, 2017, through July 31, 2017, a CDSC of 1.00% may be imposed on certain redemptions of such shares made within 24 months of the date of purchase on shares that were purchased without an initial sales charge. For purchases of Class A and Investor Class shares made prior to January 1, 2017, a CDSC of 1.00% may be imposed on certain redemptions made within one year of the date of purchase on shares that were purchased without an initial sales charge. Class C shares are offered at NAV without an initial sales charge, although a 1.00% CDSC may be imposed on certain redemptions made within one year of the date of purchase of Class C shares. When Class B shares were offered, they were offered at NAV without an initial sales charge, although a CDSC that declines depending on the number of years a shareholder has held its Class B shares may be imposed on redemptions made within six years of the date of purchase of such shares. Class I shares are offered at NAV and are not subject to a sales charge. Class T shares are currently expected to be offered at NAV plus an initial sales charge.
Class R6 shares are currently expected to be offered at NAV and to not be subject to a sales charge. Depending upon eligibility, Class B shares convert to either Class A or Investor Class shares at the end of the calendar quarter eight years after the date they were purchased. Additionally, as disclosed in the Fund’s prospectus, Class A shares may convert automatically to Investor Class shares and Investor Class shares may convert automatically to Class A shares. Under certain circumstances and as may be permitted by the Trust’s multiple class plan under Rule 18f-3 of the 1940 Act, specified share classes of the Fund may be converted to one or more other share classes of the Fund as disclosed in the capital share transactions within these notes. The seven classes of shares have the same voting (except for issues that relate solely to one class), dividend, liquidation and other rights, and the same terms and conditions, except that under distribution plans pursuant to Rule 12b-1 under the 1940 Act, Class B and Class C shares are subject to higher distribution and/or service fees than Class A, Investor Class and Class T shares. Class I and Class R6 shares are not subject to a distribution and/or service fee.
The Fund’s investment objective is to seek current income.
Note 2–Significant Accounting Policies
The Fund is an investment company and accordingly follows the investment company accounting and reporting guidance of the Financial Accounting Standards Board (“FASB”) Accounting Standard Codification Topic 946 Financial Services—Investment Companies. The Fund prepares its financial statements in accordance with generally accepted accounting principles (“GAAP”) in the United States of America and follows the significant accounting policies described below.
(A) Securities Valuation. Investments are usually valued as of the close of regular trading on the New York Stock Exchange (the “Exchange”) (usually 4:00 p.m. Eastern time) on each day the Fund is open for business (“valuation date”).
The Board of Trustees of the Trust (the “Board”) adopted procedures establishing methodologies for the valuation of the Fund’s securities and other assets and delegated the responsibility for valuation determinations under those procedures to the Valuation Committee of the Trust (the “Valuation Committee”). The Board authorized the Valuation Committee to appoint a Valuation Subcommittee (the “Subcommittee”) to deal in the first instance with establishing the prices of securities for which market quotations are not readily available or the prices of which are not otherwise readily determinable under these procedures. The Subcommittee meets (in person, via electronic mail or via teleconference) on an as-needed basis. Subsequently, the Valuation Committee meets to ensure that actions taken by the Subcommittee were appropriate. The procedures state that, subject to the oversight of the Board and unless otherwise noted, the responsibility for the day-to-day valuation of portfolio assets (including fair value measurements for the Fund’s assets and liabilities) rests with New York Life Investment Management LLC (“New York Life Investments” or the “Manager”), aided to whatever extent necessary by the Subadvisor (as defined in Note 3(A)).
To assess the appropriateness of security valuations, the Manager, the Subadvisor or the Fund’s third-party service provider, who is subject to oversight by the Manager, regularly compares prior day prices, prices
| | |
| 22 | | MainStay Government Fund |
on comparable securities and the sale prices to the prior and current day prices and challenges prices with changes exceeding certain tolerance levels with third-party pricing services or broker sources. For those securities valued through either a standardized fair valuation methodology or a fair valuation measurement, the Subcommittee deals in the first instance with such valuation and the Valuation Committee reviews and affirms, if appropriate, the reasonableness of the valuation based on such methodologies and measurements on a regular basis after considering information that is reasonably available and deemed relevant by the Valuation Committee. Any action taken by the Subcommittee with respect to the valuation of a portfolio security or other asset is submitted for review and ratification (if appropriate) to the Valuation Committee and the Board at the next regularly scheduled meeting.
“Fair value” is defined as the price the Fund would reasonably expect to receive upon selling an asset or liability in an orderly transaction to an independent buyer in the principal or most advantageous market for the asset or liability. Fair value measurements are determined within a framework that establishes a three-tier hierarchy which maximizes the use of observable market data and minimizes the use of unobservable inputs to establish a classification of fair value measurements for disclosure purposes. “Inputs” refer broadly to the assumptions that market participants would use in pricing the asset or liability, including assumptions about risk, such as the risk inherent in a particular valuation technique used to measure fair value using a pricing model and/or the risk inherent in the inputs for the valuation technique. Inputs may be observable or unobservable. Observable inputs reflect the assumptions market participants would use in pricing the asset or liability based on market data obtained from sources independent of the Fund. Unobservable inputs reflect the Fund’s own assumptions about the assumptions market participants would use in pricing the asset or liability based on the information available. The inputs or methodology used for valuing assets or liabilities may not be an indication of the risks associated with investing in those assets or liabilities. The three-tier hierarchy of inputs is summarized below.
| • | | Level 1—quoted prices in active markets for an identical asset or liability |
| • | | Level 2—other significant observable inputs (including quoted prices for a similar asset or liability in active markets, interest rates and yield curves, prepayment speeds, credit risk, etc.) |
| • | | Level 3—significant unobservable inputs (including the Fund’s own assumptions about the assumptions that market participants would use in measuring fair value of an asset or liability) |
The level of an asset or liability within the fair value hierarchy is based on the lowest level of an input, both individually and in the aggregate, that is significant to the fair value measurement. As of October 31, 2017, the aggregate value by input level of the Fund’s assets and liabilities is included at the end of the Fund’s Portfolio of Investments.
The Fund may use third-party vendor evaluations, whose prices may be derived from one or more of the following standard inputs, among others:
| | |
• Benchmark yields | | • Reported trades |
• Broker/dealer quotes | | • Issuer spreads |
• Two-sided markets | | • Benchmark securities |
• Bids/offers | | • Reference data (corporate actions or material event notices) |
• Industry and economic events | | • Comparable bonds |
• Monthly payment information | | |
An asset or liability for which market values cannot be measured using the methodologies described above is valued by methods deemed reasonable in good faith by the Valuation Committee, following the procedures established by the Board, to represent fair value. Under these procedures, the Fund generally uses a market-based approach which may use related or comparable assets or liabilities, recent transactions, market multiples, book values and other relevant information. The Fund may also use an income-based valuation approach in which the anticipated future cash flows of the asset or liability are discounted to calculate fair value. Discounts may also be applied due to the nature and/or duration of any restrictions on the disposition of the asset or liability. Fair value represents a good faith approximation of the value of a security. Fair value determinations involve the consideration of a number of subjective factors, an analysis of applicable facts and circumstances and the exercise of judgment. As a result, it is possible that the fair value for a security determined in good faith in accordance with the Fund’s valuation procedures may differ from valuations for the same security determined by other funds using their own valuation procedures. Although the Fund’s valuation procedures are designed to value a security at the price the Fund may reasonably expect to receive upon the security’s sale in an orderly transaction, there can be no assurance that any fair value determination thereunder would, in fact, approximate the amount that the Fund would actually realize upon the sale of the security or the price at which the security would trade if a reliable market price were readily available. During the year ended October 31, 2017, there were no material changes to the fair value methodologies.
Securities which may be valued in this manner include, but are not limited to: (i) a security for which trading has been halted or suspended; (ii) a debt security that has recently gone into default and for which there is not a current market quotation; (iii) a security of an issuer that has entered into a restructuring; (iv) a security that has been de-listed from a national exchange; (v) a security for which the market price is not readily available from a third-party pricing source or, if so provided, does not, in the opinion of the Manager or Subadvisor reflect the security’s market value; (vi) a security subject to trading collars for which no or limited trading takes place; and (vii) a security whose principal market has been temporarily closed at a time when, under normal conditions, it would be open. Securities for which market quotations or observable inputs are not readily available are generally categorized as Level 3 in the hierarchy. As of October 31, 2017, a security that was fair valued in such a manner is shown in the Portfolio of Investments.
Futures contracts are valued at the last posted settlement price on the market where such futures are primarily traded. Investments in mutual
Notes to Financial Statements (continued)
funds, including money market funds, are valued at their respective NAVs as of the close of the Exchange on the valuation date. These securities are generally categorized as Level 1 in the hierarchy.
Debt securities (other than convertible and municipal bonds) are valued at the evaluated bid prices (evaluated mean prices in the case of convertible and municipal bonds) supplied by a pricing agent or brokers selected by the Manager, in consultation with the Subadvisor. Those values reflect broker/dealer supplied prices and electronic data processing techniques, if the evaluated bid or mean prices are deemed by the Manager, in consultation with the Subadvisor, to be representative of market values at the regular close of trading of the Exchange on each valuation date. Debt securities purchased on a delayed delivery basis are marked to market daily until settlement at the forward settlement date. Debt securities, including corporate bonds, U.S. government & federal agency bonds, municipal bonds, foreign bonds, convertible bonds, asset-backed securities and mortgage-backed securities are generally categorized as Level 2 in the hierarchy.
Temporary cash investments acquired in excess of 60 days to maturity at the time of purchase are valued using the latest bid prices or using valuations based on a matrix system (which considers such factors as security prices, yields, maturities and ratings), both as furnished by independent pricing services. Other temporary cash investments which mature in 60 days or less at the time of purchase (“Short-Term Investments”) are valued using the amortized cost method of valuation, unless the use of such method would be inappropriate. The amortized cost method involves valuing a security at its cost on the date of purchase and thereafter assuming a constant amortization to maturity of the difference between such cost and the value on maturity date. Amortized cost approximates the current fair value of a security. Securities valued using the amortized cost method are not valued using quoted prices in an active market and are generally categorized as Level 2 in the hierarchy.
The information above is not intended to reflect an exhaustive list of the methodologies that may be used to value portfolio investments. The valuation procedures permit the use of a variety of valuation methodologies in connection with valuing portfolio investments. The methodology used for a specific type of investment may vary based on the market data available or other considerations. The methodologies summarized above may not represent the specific means by which portfolio investments are valued on any particular business day.
A portfolio security or other asset may be determined to be illiquid under procedures approved by the Board. Illiquidity of a security might prevent the sale of such security at a time when the Manager or Subadvisor might wish to sell, and these securities could have the effect of decreasing the overall level of the Fund’s liquidity. Further, the lack of an established secondary market may make it more difficult to value illiquid securities, requiring the Fund to rely on judgments that may be somewhat subjective in measuring value, which could vary materially from the amount that the Fund may realize upon disposition. Difficulty in selling illiquid securities may result in a loss or may be costly to the Fund. Under the supervision of the Board, the Manager or Subadvisor determines the liquidity of the Fund’s investments; in doing so, the Manager or Subadvisor may consider various factors, including (i) the frequency of trades and quotations; (ii) the number of dealers and prospective purchasers; (iii) dealer undertakings to make a market; and
(iv) the nature of the security and the market in which it trades (e.g., the time needed to dispose of the security, the method of soliciting offers and the mechanics of transfer). Illiquid securities are often valued in accordance with methods deemed by the Board in good faith to be reasonable and appropriate to accurately reflect their fair value. The liquidity of the Fund’s investments, as shown in the Portfolio of Investments, was determined as of October 31, 2017 and can change at any time in response to, among other relevant factors, market conditions or events or developments with respect to an individual issuer or instrument. As of October 31, 2017, securities deemed to be illiquid under procedures approved by the Board are shown in the Portfolio of Investments.
(B) Income Taxes. The Fund’s policy is to comply with the requirements of the Internal Revenue Code of 1986, as amended (the “Internal Revenue Code”), applicable to regulated investment companies and to distribute all of its taxable income to the shareholders of the Fund within the allowable time limits. Therefore, no federal, state and local income tax provisions are required.
Management evaluates the Fund’s tax positions to determine if the tax positions taken meet the minimum recognition threshold in connection with accounting for uncertainties in income tax positions taken or expected to be taken for the purposes of measuring and recognizing tax liabilities in the financial statements. Recognition of tax benefits of an uncertain tax position is permitted only to the extent the position is “more likely than not” to be sustained assuming examination by taxing authorities. Management has analyzed the Fund’s tax positions taken on federal, state and local income tax returns for all open tax years (for up to three tax years) and has concluded that no provisions for federal, state and local income tax are required in the Fund’s financial statements. The Fund’s federal, state and local income tax and federal excise tax returns for tax years for which the applicable statutes of limitations have not expired are subject to examination by the Internal Revenue Service and state and local departments of revenue.
(C) Dividends and Distributions to Shareholders. Dividends and distributions are recorded on the ex-dividend date. The Fund intends to declare and pay dividends from net investment income, if any, at least monthly and distributions from net realized capital and currency gains, if any, at least annually. Unless the shareholder elects otherwise, all dividends and distributions are reinvested in the same class of shares of the Fund, at NAV. Dividends and distributions to shareholders are determined in accordance with federal income tax regulations and may differ from determinations using GAAP.
(D) Security Transactions and Investment Income. The Fund records security transactions on the trade date. Realized gains and losses on security transactions are determined using the identified cost method. Interest income is accrued as earned using the effective interest rate method and includes any realized gains and losses from repayments of principal on mortgage-backed securities. Discounts and premiums on securities purchased, other than Short-Term Investments, for the Fund are accreted and amortized, respectively, on the effective interest rate method over the life of the respective securities. Discounts and premiums on Short-Term Investments are accreted and amortized, respectively, on the straight-line method. The straight-line method approximates the effective interest method for Short-Term Investments.
| | |
| 24 | | MainStay Government Fund |
Investment income and realized and unrealized gains and losses on investments of the Fund are allocated pro rata to separate classes of shares based upon their relative net assets on the date the income is earned or realized and unrealized gains and losses are incurred.
The Fund may place a debt security on non-accrual status and reduce related interest income by ceasing current accruals and writing off all or a portion of any interest receivables when the collection of all or a portion of such interest has become doubtful. A debt security is removed from non-accrual status when the issuer resumes interest payments or when collectability of interest is reasonably assured.
(E) Expenses. Expenses of the Trust are allocated to the individual Funds in proportion to the net assets of the respective Funds when the expenses are incurred, except where direct allocations of expenses can be made. Expenses (other than transfer agent expenses and fees incurred under the shareholder services plans and/or the distribution plans further discussed in Note 3(B)) are allocated to separate classes of shares pro rata based upon their relative net assets on the date the expenses are incurred. The expenses borne by the Fund, including those of related parties to the Fund, are shown in the Statement of Operations.
(F) Use of Estimates. In preparing financial statements in conformity with GAAP, management makes estimates and assumptions that affect the reported amounts and disclosures in the financial statements. Actual results could differ from those estimates.
(G) Repurchase Agreements. The Fund may enter into repurchase agreements (i.e., buy a security from another party with the agreement that it be sold back in the future) to earn income. The Fund may enter into repurchase agreements only with counterparties, usually financial institutions, that are deemed by the Manager or Subadvisor to be creditworthy, pursuant to guidelines established by the Board. During the term of any repurchase agreement, the Manager or Subadvisor will continue to monitor the creditworthiness of the counterparty. Under the 1940 Act, repurchase agreements are considered to be collateralized loans by the Fund to the counterparty secured by the securities transferred to the Fund.
Repurchase agreements are subject to counterparty risk, meaning the Fund could lose money by the counterparty’s failure to perform under the terms of the agreement. The Fund mitigates this risk by ensuring the repurchase agreement is collateralized by cash, U.S. government securities, fixed income securities and/or other securities. The collateral is held by the Fund’s custodian and valued daily on a mark to market basis to determine if the value, including accrued interest, exceeds the repurchase price. In the event of the counterparty’s default on the obligation to repurchase, the Fund has the right to liquidate the collateral and apply the proceeds in satisfaction of the obligation. Under certain circumstances, such as in the event of default or bankruptcy by the counterparty, realization and/or retention of the collateral may be limited or subject to delay, to legal proceedings and possible realized loss to the Fund.
(H) Futures Contracts. A futures contract is an agreement to purchase or sell a specified quantity of an underlying instrument at a specified future date and price, or to make or receive a cash payment based on the value of a financial instrument (e.g., foreign currency, interest rate, security, or securities index). The Fund is subject to risks
such as market price risk and/or interest rate risk in the normal course of investing in these transactions. Upon entering into a futures contract, the Fund is required to pledge to the broker or futures commission merchant an amount of cash and/or U.S. government securities equal to a certain percentage of the collateral amount, known as the “initial margin.” During the period the futures contract is open, changes in the value of the contract are recognized as unrealized appreciation or depreciation by marking to market such contract on a daily basis to reflect the market value of the contract at the end of each day’s trading. The Fund agrees to receive from or pay to the broker or futures commission merchant an amount of cash equal to the daily fluctuation in the value of the contract. Such receipts or payments are known as “variation margin.” When the futures contract is closed, the Fund records a realized gain or loss equal to the difference between the proceeds from (or cost of) the closing transaction and the Fund’s basis in the contract.
The use of futures contracts involves, to varying degrees, elements of market risk in excess of the amount recognized in the Statement of Assets and Liabilities. The contract or notional amounts and variation margin reflect the extent of the Fund’s involvement in open futures positions. There are several risks associated with the use of futures contracts as hedging techniques. There can be no assurance that a liquid market will exist at the time when the Fund seeks to close out a futures contract. If no liquid market exists, the Fund would remain obligated to meet margin requirements until the position is closed. Futures may involve a small initial investment relative to the risk assumed, which could result in losses greater than if they had not been used. Futures may be more volatile than direct investments in the instrument underlying the futures and may not correlate to the underlying instrument, causing a given hedge not to achieve its objectives. The Fund’s activities in futures contracts have minimal counterparty risk as they are conducted through regulated exchanges that guarantee the futures against default by the counterparty. In the event of a bankruptcy or insolvency of a futures commission merchant that holds margin on behalf of the Fund, the Fund may not be entitled to the return of the entire margin owed to the Fund, potentially resulting in a loss. The Fund’s investment in futures contracts and other derivatives may increase the volatility of the Fund’s NAVs and may result in a loss to the Fund. As of October 31, 2017, the Fund did not hold any futures contracts.
(I) Dollar Rolls. The Fund may enter into dollar roll transactions in which it sells mortgage-backed securities (“MBS”) from its portfolio to a counterparty from whom it simultaneously agrees to buy a similar security on a delayed delivery basis. The Fund generally transfers MBS where the MBS are “to be announced,” therefore, the Fund accounts for these transactions as purchases and sales.
The securities sold in connection with the dollar rolls are removed from the portfolio and a realized gain or loss is recognized. The securities the Fund has agreed to acquire are included at market value in the Portfolio of Investments and liabilities for such purchase commitments are included as payables for investments purchased. During the roll period, the Fund foregoes principal and interest paid on the securities. The Fund is compensated by the difference between the current sales price and the forward price for the future as well as by the earnings on the cash proceeds of the initial sale. Dollar rolls may be renewed without
Notes to Financial Statements (continued)
physical delivery of the securities subject to the contract. The Fund maintains liquid assets from its portfolio having a value not less than the repurchase price, including accrued interest. Dollar roll transactions involve certain risks, including the risk that the securities returned to the Fund at the end of the roll period, while substantially similar, could be inferior to what was initially sold to the counterparty.
The Fund accounts for a dollar roll transaction as a purchase and sale whereby the difference in the sales price and purchase price of the security sold is recorded as a realized gain (loss).
(J) Securities Lending. In order to realize additional income, the Fund may engage in securities lending, subject to the limitations set forth in the 1940 Act and relevant guidance by the staff of the Securities and Exchange Commission (“SEC”). In the event the Fund does engage in securities lending, the Fund will lend through its custodian, State Street Bank and Trust Company (“State Street”). State Street will manage the Fund’s collateral in accordance with the lending agreement between the Fund and State Street, and indemnify the Fund against counterparty risk. The loans will be collateralized by U.S. Treasury securities at least equal at all times to the market value of the securities loaned. The Fund may bear the risk of delay in recovery of, or loss of rights in, the securities loaned should the borrower of the securities experience financial difficulty. The Fund may also record a realized gain or loss on securities deemed sold due to a borrower’s inability to return securities on loan. The Fund bears the risk of any loss on investment of the collateral. The Fund will receive compensation for lending its securities in the form of fees or it will retain a portion of interest on the investment of any cash received as collateral. The Fund will also continue to receive interest and dividends on the securities loaned and any gain or loss in the market price of the securities loaned that may occur during the term of the loan will be for the account of the Fund. During the year ended October 31, 2017, the Fund did not have any portfolio securities on loan.
(K) Government Risk. Investments in the Fund are not guaranteed, even though some of the Fund’s underlying investments are guaranteed by the U.S. Government or its agencies or instrumentalities. The principal risk of mortgage-related and asset-backed securities is that the underlying debt may be prepaid ahead of schedule, if interest rates fall, thereby reducing the value of the Fund’s investment. If interest rates rise, less of the debt may be prepaid and the Fund may lose money because the Fund may be unable to invest in higher yielding assets. The Fund is subject to interest-rate risk and can lose principal value when interest rates rise. Bonds are also subject to credit risk, in which the bond issuer may fail to pay interest and principal in a timely manner.
(L) Indemnifications. Under the Trust’s organizational documents, its officers and trustees are indemnified against certain liabilities that may arise out of performance of their duties to the Trust. Additionally, in the normal course of business, the Fund enters into contracts with third-party service providers that contain a variety of representations and warranties and which may provide general indemnifications. The Fund’s maximum exposure under these arrangements is unknown, as this would involve future claims that may be made against the Fund that have not yet occurred. Based on experience, management is of the view that the risk of loss in connection with these potential indemnification obligations is remote. However, there can be no assurance that material
liabilities related to such obligations will not arise in the future, which could adversely impact the Fund.
Note 3–Fees and Related Party Transactions
(A) Manager and Subadvisor. New York Life Investments, a registered investment adviser and an indirect, wholly-owned subsidiary of New York Life Insurance Company (“New York Life”), serves as the Fund’s Manager, pursuant to an Amended and Restated Management Agreement (“Management Agreement”). The Manager provides offices, conducts clerical, recordkeeping and bookkeeping services and keeps most of the financial and accounting records required to be maintained by the Fund. Except for the portion of salaries and expenses that are the responsibility of the Fund, the Manager pays the salaries and expenses of all personnel affiliated with the Fund and certain operational expenses of the Fund. The Fund reimburses New York Life Investments in an amount equal to a portion of the compensation of the Chief Compliance Officer attributable to the Fund. MacKay Shields LLC (“MacKay Shields” or the “Subadvisor”), a registered investment adviser and an indirect, wholly-owned subsidiary of New York Life, serves as Subadvisor to the Fund and is responsible for the day-to-day portfolio management of the Fund. Pursuant to the terms of an Amended and Restated Subadvisory Agreement (“Subadvisory Agreement”) between New York Life Investments and MacKay Shields, New York Life Investments pays for the services of the Subadvisor.
Under the Management Agreement, the Fund pays the Manager a monthly fee for the services performed and the facilities furnished at an annual rate of its average daily net assets as follows: 0.50% up to $500 million; 0.475% from $500 million to $1 billion; and 0.45% in excess of $1 billion.
During the year ended October 31, 2017, the effective management fee rate (exclusive of any applicable waiver/reimbursements) was 0.50%.
New York Life Investments has contractually agreed to waive fees and/or reimburse expenses so that Total Annual Fund Operating Expenses (excluding taxes, interest, litigation, extraordinary expenses, brokerage and other transaction expenses relating to the purchase or sale of portfolio investments and acquired (underlying) fund fees and expenses) for the Fund’s Class A shares do not exceed 1.00% of its average daily net assets. New York Life Investments will apply an equivalent waiver or reimbursement, in an equal number of basis points, to the other share classes of the Fund except Class R6. This agreement will remain in effect until February 28, 2018, and shall renew automatically for one-year terms unless New York Life Investments provides written notice of termination prior to the start of the next term or upon approval by the Board.
During the year ended October 31, 2017, New York Life Investments earned fees from the Fund in the amount of $716,225.
State Street provides sub-administration and sub-accounting services to the Fund pursuant to an agreement with New York Life Investments. These services include calculating the daily NAVs of the Fund, maintaining the general ledger and sub-ledger accounts for the calculation of the Fund’s NAVs and assisting New York Life Investments in conducting various aspects of the Fund’s administrative operations. For providing these services to the Fund, State Street is compensated by New York Life Investments.
| | |
| 26 | | MainStay Government Fund |
(B) Distribution and Service Fees. The Trust, on behalf of the Fund, has entered into a distribution agreement with NYLIFE Distributors LLC (the “Distributor”), an indirect, wholly-owned subsidiary of New York Life. The Fund has adopted distribution plans (the “Plans”) in accordance with the provisions of Rule 12b-1 under the 1940 Act.
Pursuant to the Class A, Investor Class and Class T Plans, the Distributor receives a monthly distribution fee from the Class A, Investor Class and Class T shares at an annual rate of 0.25% of the average daily net assets of the Class A, Investor Class and Class T shares for distribution and/or service activities as designated by the Distributor. Pursuant to the Class B and Class C Plans, Class B and Class C shares pay the Distributor a monthly distribution fee at an annual rate of 0.75% of the average daily net assets of the Class B and Class C shares along with a service fee at an annual rate of 0.25% of the average daily net assets of the Class B and Class C shares, for a total 12b-1 fee of 1.00%. Class I and Class R6 shares are not subject to a distribution and/or service fee.
The Plans provide that the distribution and service fees are payable to the Distributor regardless of the amounts actually expended by the Distributor for distribution of the Fund’s shares and service activities.
(C) Sales Charges. During the year ended October 31, 2017, the Fund was advised by the Distributor that the amount of initial sales charges retained on sales of Class A and Investor Class shares were $5,785 and $4,155, respectively.
During the year ended October 31, 2017, the Fund was also advised that the Distributor retained CDSCs on redemptions of Class A, Investor Class, Class B and Class C shares of $11,573, $1, $14,005 and $2,858, respectively.
(D) Transfer, Dividend Disbursing and Shareholder Servicing Agent. NYLIM Service Company LLC, an affiliate of New York Life Investments, is the Fund’s transfer, dividend disbursing and shareholder servicing agent pursuant to an agreement between NYLIM Service Company LLC and the Trust. NYLIM Service Company LLC has entered into an agreement with Boston Financial Data Services, Inc. (“BFDS”) pursuant to which BFDS performs certain transfer agent services on behalf of NYLIM Service Company LLC. During the year ended October 31, 2017, transfer agent expenses incurred by the Fund were as follows:
| | | | |
Class A | | $ | 82,735 | |
Investor Class | | | 144,815 | |
Class B | | | 22,794 | |
Class C | | | 50,998 | |
Class I | | | 9,590 | |
(E) Small Account Fee. Shareholders with small accounts adversely impact the cost of providing transfer agency services. In an effort to reduce total transfer agency expenses, the Fund has implemented a small account fee on certain types of accounts. Certain shareholders with an account balance of less than $1,000 are charged an annual per account fee of $20 (assessed semi-annually), the proceeds from which offset transfer agent fees as reflected in the Statement of Operations.
Note 4–Federal Income Tax
As of October 31, 2017, the cost and unrealized appreciation (depreciation) of the Fund’s investment portfolio, including applicable derivative contracts and other financial instruments, as determined on a federal income tax basis, were as follows:
| | | | | | | | | | | | | | | | |
| | | Federal
Tax Cost | | | Gross
Unrealized
Appreciation | | | Gross
Unrealized
Depreciation | | | Net
Unrealized
Appreciation/
(Depreciation) | |
Investments in Securities | | $ | 126,025,637 | | | $ | 4,441,108 | | | $ | (884,580 | ) | | $ | 3,556,528 | |
As of October 31, 2017, the components of accumulated gain (loss) on a tax basis were as follows:
| | | | | | | | | | | | | | | | |
Ordinary
Income | | Accumulated
Capital and Other Gain (Loss) | | | Other
Temporary
Differences | | | Unrealized
Appreciation
(Depreciation) | | | Total
Accumulated Gain (Loss) | |
$44,827 | | $ | (1,207,372 | ) | | $ | (16,038 | ) | | $ | 3,556,528 | | | $ | 2,377,945 | |
Other temporary differences are primarily due to dividends payable.
The following table discloses the current year reclassifications between undistributed net investment income (loss), accumulated net realized gain (loss) on investments, and additional paid-in capital arising from permanent differences; net assets as of October 31, 2017 were not affected.
| | | | |
Undistributed Net Investment Income (Loss) | | Accumulated Net Realized Gain (Loss) on Investments | | Additional Paid-In Capital |
$22,637 | | $(22,637) | | $— |
The reclassifications for the Fund are primarily due to Mortgage Roll Adjustment.
As of October 31, 2017, for federal income tax purposes, capital loss carryforwards of $1,207,372 were available as shown in the table below, to the extent provided by the regulations to offset future realized gains of the Fund through the years indicated. To the extent that these capital loss carryforwards are used to offset future capital gains, it is probable that the capital gains so offset will not be distributed to shareholders. No capital gain distributions shall be made until any capital loss carryforwards have been fully utilized or expired.
| | | | | | | | |
Capital Loss
Available Through | | Short-Term
Capital Loss
Amounts (000’s) | | | Long-Term Capital Loss
Amounts (000’s) | |
| Unlimited | | $ | 806 | | | $ | 401 | |
During the years ended October 31, 2017 and October 31, 2016, the tax character of distributions paid as reflected in the Statements of Changes in Net Assets was as follows:
| | | | | | | | |
| | | 2017 | | | 2016 | |
Distributions paid from: | | | | | | | | |
Ordinary Income | | $ | 2,735,795 | | | $ | 2,938,970 | |
Notes to Financial Statements (continued)
Note 5–Custodian
State Street is the custodian of cash and securities held by the Fund. Custodial fees are charged to the Fund based on the Fund’s net assets and/or the market value of securities held by the Fund and the number of certain transactions incurred by the Fund.
Note 6–Line of Credit
The Fund and certain other funds managed by New York Life Investments, maintain a line of credit with a syndicate of banks in order to secure a source of funds for temporary purposes to meet unanticipated or excessive redemption requests.
Effective August 1, 2017, under the credit agreement (the “Credit Agreement”), the aggregate commitment amount is $600,000,000 with an additional uncommitted amount of $100,000,000. The commitment fee is an annual rate of 0.15% of the average commitment amount payable quarterly, regardless of usage, to State Street, who serves as the agent to the syndicate. The commitment fee is allocated among the Fund and certain other funds managed by New York Life Investments based upon their respective net assets and other factors. Interest on any revolving credit loan is charged based upon the Federal Funds Rate or the one-month LIBOR, whichever is higher. The Credit Agreement expires on July 31, 2018, although the Fund, certain other funds managed by New York Life Investments and the syndicate of banks may renew the Credit Agreement for an additional year on the same or different terms. Prior to August 1, 2017, the aggregate commitment amount and commitment fee of the previous credit agreement were the same as those under the Credit Agreement, but Bank of New York Mellon served as agent to the syndicate. During the year ended October 31, 2017, there were no borrowings made or outstanding with respect to the Fund under the Credit Agreement or the credit agreement for which Bank of New York Mellon served as agent.
Note 7–Interfund Lending Program
Pursuant to an exemptive order issued by the SEC, the Fund, along with certain other funds managed by New York Life Investments, may participate in an interfund lending program. The interfund lending program provides an alternative credit facility that permits the Fund and certain other funds managed by New York Life Investments to lend or borrow money for temporary purposes directly to or from one another subject to the conditions of the exemptive order. During the year ended October 31, 2017, there were no interfund loans made or outstanding with respect to the Fund.
Note 8–Purchases and Sales of Securities (in 000’s)
During the year ended October 31, 2017, purchases and sales of U.S. Government securities were $27,958 and $67,227, respectively. Purchases and sales of securities, other than U.S. Government securities and short-term securities, were $1,082 and $578, respectively.
Note 9–Capital Share Transactions
| | | | | | | | |
Class A | | Shares | | | Amount | |
Year ended October 31, 2017: | | | | | | | | |
Shares sold | | | 442,066 | | | $ | 3,696,298 | |
Shares issued to shareholders in reinvestment of dividends and distributions | | | 185,394 | | | | 1,545,806 | |
Shares redeemed | | | (3,049,836 | ) | | | (25,436,408 | ) |
| | | | |
Net increase (decrease) in shares outstanding before conversion | | | (2,422,376 | ) | | | (20,194,304 | ) |
Shares converted into Class A (See Note 1) | | | 1,563,241 | | | | 13,077,517 | |
Shares converted from Class A (See Note 1) | | | (92,688 | ) | | | (772,095 | ) |
| | | | |
Net increase (decrease) | | | (951,823 | ) | | $ | (7,888,882 | ) |
| | | | |
Year ended October 31, 2016: | | | | | | | | |
Shares sold | | | 1,671,833 | | | $ | 14,300,084 | |
Shares issued to shareholders in reinvestment of dividends and distributions | | | 193,141 | | | | 1,650,198 | |
Shares redeemed | | | (1,755,494 | ) | | | (14,999,000 | ) |
| | | | |
Net increase (decrease) in shares outstanding before conversion | | | 109,480 | | | | 951,282 | |
Shares converted into Class A (See Note 1) | | | 281,575 | | | | 2,406,374 | |
Shares converted from Class A (See Note 1) | | | (84,395 | ) | | | (722,690 | ) |
| | | | |
Net increase (decrease) | | | 306,660 | | | $ | 2,634,966 | |
| | | | |
|
| |
Investor Class | | Shares | | | Amount | |
Year ended October 31, 2017: | | | | | | | | |
Shares sold | | | 130,052 | | | $ | 1,093,794 | |
Shares issued to shareholders in reinvestment of dividends and distributions | | | 73,026 | | | | 611,415 | |
Shares redeemed | | | (607,500 | ) | | | (5,096,604 | ) |
| | | | |
Net increase (decrease) in shares outstanding before conversion | | | (404,422 | ) | | | (3,391,395 | ) |
Shares converted into Investor Class (See Note 1) | | | 169,422 | | | | 1,419,001 | |
Shares converted from Investor Class (See Note 1) | | | (1,539,319 | ) | | | (12,939,187 | ) |
| | | | |
Net increase (decrease) | | | (1,774,319 | ) | | $ | (14,911,581 | ) |
| | | | |
Year ended October 31, 2016: | | | | | | | | |
Shares sold | | | 283,003 | | | $ | 2,429,081 | |
Shares issued to shareholders in reinvestment of dividends and distributions | | | 80,330 | | | | 688,984 | |
Shares redeemed | | | (607,459 | ) | | | (5,214,634 | ) |
| | | | |
Net increase (decrease) in shares outstanding before conversion | | | (244,126 | ) | | | (2,096,569 | ) |
Shares converted into Investor Class (See Note 1) | | | 189,526 | | | | 1,626,591 | |
Shares converted from Investor Class (See Note 1) | | | (246,625 | ) | | | (2,116,170 | ) |
| | | | |
Net increase (decrease) | | | (301,225 | ) | | $ | (2,586,148 | ) |
| | | | |
| | |
| 28 | | MainStay Government Fund |
| | | | | | | | |
Class B | | Shares | | | Amount | |
Year ended October 31, 2017: | | | | | | | | |
Shares sold | | | 39,552 | | | $ | 330,200 | |
Shares issued to shareholders in reinvestment of dividends and distributions | | | 6,476 | | | | 53,997 | |
Shares redeemed | | | (212,714 | ) | | | (1,777,702 | ) |
| | | | |
Net increase (decrease) in shares outstanding before conversion | | | (166,686 | ) | | | (1,393,505 | ) |
Shares converted from Class B (See Note 1) | | | (101,530 | ) | | | (847,690 | ) |
| | | | |
Net increase (decrease) | | | (268,216 | ) | | $ | (2,241,195 | ) |
| | | | |
Year ended October 31, 2016: | | | | | | | | |
Shares sold | | | 194,937 | | | $ | 1,665,656 | |
Shares issued to shareholders in reinvestment of dividends and distributions | | | 8,341 | | | | 71,211 | |
Shares redeemed | | | (210,091 | ) | | | (1,795,096 | ) |
| | | | |
Net increase (decrease) in shares outstanding before conversion | | | (6,813 | ) | | | (58,229 | ) |
Shares converted from Class B (See Note 1) | | | (139,939 | ) | | | (1,194,105 | ) |
| | | | |
Net increase (decrease) | | | (146,752 | ) | | $ | (1,252,334 | ) |
| | | | |
|
| |
Class C | | Shares | | | Amount | |
Year ended October 31, 2017: | | | | | | | | |
Shares sold | | | 130,417 | | | $ | 1,087,194 | |
Shares issued to shareholders in reinvestment of dividends and distributions | | | 12,652 | | | | 105,425 | |
Shares redeemed | | | (1,266,564 | ) | | | (10,556,654 | ) |
| | | | |
Net increase (decrease) | | | (1,123,495 | ) | | $ | (9,364,035 | ) |
| | | | |
Year ended October 31, 2016: | | | | | | | | |
Shares sold | | | 1,197,365 | | | $ | 10,197,898 | |
Shares issued to shareholders in reinvestment of dividends and distributions | | | 19,643 | | | | 167,630 | |
Shares redeemed | | | (963,265 | ) | | | (8,238,085 | ) |
| | | | |
Net increase (decrease) | | | 253,743 | | | $ | 2,127,443 | |
| | | | |
| | |
| | | | | | | | |
| | | | | | | | |
Class I | | Shares | | | Amount | |
Year ended October 31, 2017: | | | | | | | | |
Shares sold | | | 2,565,649 | | | $ | 21,605,204 | |
Shares issued to shareholders in reinvestment of dividends and distributions | | | 24,623 | | | | 207,152 | |
Shares redeemed | | | (3,402,111 | ) | | | (28,707,918 | ) |
| | | | |
Net increase (decrease) in shares outstanding before conversion | | | (811,839 | ) | | | (6,895,562 | ) |
Shares converted into Class I (See Note 1) | | | 7,422 | | | | 62,454 | |
| | | | |
Net increase (decrease) | | | (804,417 | ) | | $ | (6,833,108 | ) |
| | | | |
Year ended October 31, 2016: | | | | | | | | |
Shares sold | | | 1,769,610 | | | $ | 15,373,740 | |
Shares issued to shareholders in reinvestment of dividends and distributions | | | 14,742 | | | | 127,362 | |
Shares redeemed | | | (679,762 | ) | | | (5,895,739 | ) |
| | | | |
Net increase (decrease) | | | 1,104,590 | | | $ | 9,605,363 | |
| | | | |
Note 10–Subsequent Events
In connection with the preparation of the financial statements of the Fund as of and for the year ended October 31, 2017, events and transactions subsequent to October 31, 2017, through the date the financial statements were issued have been evaluated by the Fund’s management for possible adjustment and/or disclosure. No subsequent events requiring financial statement adjustment or disclosure have been identified.
Report of Independent Registered Public Accounting Firm
The Board of Trustees and Shareholders of
The MainStay Funds:
We have audited the accompanying statement of assets and liabilities, including the portfolio of investments, of MainStay Government Fund (the “Fund”), one of the funds constituting The MainStay Funds, as of October 31, 2017, and the related statement of operations for the year then ended, the statements of changes in net assets for each of the years in the two-year period then ended, and the financial highlights for each of the years in the five-year period then ended. These financial statements and financial highlights are the responsibility of the Fund’s management. Our responsibility is to express an opinion on these financial statements and financial highlights based on our audits.
We conducted our audits in accordance with the standards of the Public Company Accounting Oversight Board (United States). Those standards require that we plan and perform the audit to obtain reasonable assurance about whether the financial statements and financial highlights are free of material misstatement. An audit includes examining, on a test basis, evidence supporting the amounts and disclosures in the financial statements. Our procedures included confirmation of securities owned as of October 31, 2017, by correspondence with the custodian and brokers or by other appropriate auditing procedures where replies from brokers were not received. An audit also includes assessing the accounting principles used and significant estimates made by management, as well as evaluating the overall financial statement presentation. We believe that our audits provide a reasonable basis for our opinion.
In our opinion, the financial statements and financial highlights referred to above present fairly, in all material respects, the financial position of MainStay Government Fund as of October 31, 2017, the results of its operations for the year then ended, the changes in its net assets for each of the years in the two-year period then ended, and the financial highlights for each of the years in the five-year period then ended, in conformity with U.S. generally accepted accounting principles.

Philadelphia, Pennsylvania
December 21, 2017
| | |
| 30 | | MainStay Government Fund |
Other Matters
(Unaudited)
At a meeting held on June 22, 2017, the Board approved submitting the following proposal (“Proposal”) to shareholders of the Funds at a special meeting held on October 23, 2017 (with any postponements or adjournments, “Special Meeting”):
To elect eight Trustees to the Board.
On or about September 28, 2017, shareholders of record of the Funds as of the close of business on August 24, 2017 were sent a proxy statement containing information regarding the Proposal. The proxy statement also included information about the Special Meeting, at which shareholders of the Funds were asked to consider and approve the Proposal. In addition, the proxy statement included information about voting on the Proposal and options shareholders had to do so.
The Special Meeting was held on October 23, 2017, and the Proposal passed.
The results of the Special Meeting (all Funds and classes thereof voting together) were as follows:
Proposal—To elect eight Trustees to the Board:
Yie-Hsin Hung:
| | | | |
Votes For | | Votes Witheld | | Total |
| 2,644,056,263.750 | | 21,799,781.292 | | 2,665,856,045.042 |
David H. Chow:
| | | | |
Votes For | | Votes Witheld | | Total |
| 2,644,576,776.557 | | 21,279,268.485 | | 2,665,856,045.042 |
Susan B. Kerley:
| | | | |
Votes For | | Votes Witheld | | Total |
| 2,645,459,747.343 | | 20,396,297.699 | | 2,665,856,045.042 |
Alan R. Latshaw:
| | | | |
Votes For | | Votes Witheld | | Total |
| 2,644,443,039.401 | | 21,413,005.641 | | 2,665,856,045.042 |
Peter Meenan:
| | | | |
Votes For | | Votes Witheld | | Total |
| 2,640,156,421.578 | | 25,699,623.464 | | 2,665,856,045.042 |
Richard H. Nolan, Jr.:
| | | | |
Votes For | | Votes Witheld | | Total |
| 2,641,415,514.849 | | 24,440,530.193 | | 2,665,856,045.042 |
Jacques P. Perold:
| | | | |
Votes For | | Votes Witheld | | Total |
| 2,645,300,993.731 | | 20,555,051.311 | | 2,665,856,045.042 |
Richard S. Trutanic:
| | | | |
Votes For | | Votes Witheld | | Total |
| 2,641,761,336.311 | | 24,094,708.731 | | 2,665,856,045.042 |
Federal Income Tax Information
(Unaudited)
In February 2018, shareholders will receive an IRS Form 1099-DIV or substitute Form 1099, which will show the federal tax status of the distributions received by shareholders in calendar year 2017. The amounts that will be reported on such 1099-DIV or substitute Form 1099 will be the amounts you are to use on your federal income tax return and will differ from the amounts which we must report for the Fund’s fiscal year end October 31, 2017.
Proxy Voting Policies and Procedures and Proxy Voting Record
A description of the policies and procedures that New York Life Investments uses to vote proxies related to the Fund’s securities is available without charge, upon request, (i) by visiting the MainStay Funds’ website at mainstayinvestments.com; and (ii) on the Securities and Exchange Commission’s (“SEC”) website at www.sec.gov.
The Fund is required to file with the SEC its proxy voting records for the Fund for the 12-month period ending June 30 on Form N-PX. The most recent Form N-PX or proxy voting record is available free of charge upon request by calling 800-MAINSTAY (624-6782); visiting the MainStay Funds’ website at mainstayinvestments.com; or on the SEC’s website at www.sec.gov.
Shareholder Reports and Quarterly Portfolio Disclosure
The Fund is required to file its complete schedule of portfolio holdings with the SEC for its first and third fiscal quarters on Form N-Q. The Fund’s Form N-Q is available without charge, on the SEC’s website at www.sec.gov or by calling MainStay Investments at 800-MAINSTAY (624-6782). You also can obtain and review copies of Form N-Q by visiting the SEC’s Public Reference Room in Washington, DC (information on the operation of the Public Reference Room may be obtained by calling 1-800-SEC-0330).
Board of Trustees and Officers (Unaudited)
The Trustees and officers of the Funds are listed below. The Board oversees the MainStay Group of Funds (which consists of The MainStay Funds and MainStay Funds Trust), MainStay VP Funds Trust, MainStay DefinedTerm Municipal Opportunities Fund, the Manager and the Subadvisors, and elects the officers of the Funds who are responsible for the day-to-day operations of the Funds. Information pertaining to the Trustees and officers is set forth below. Each Trustee serves until his or her successor is elected and qualified or until his or her resignation, death or removal. Under the Board’s retirement policy, unless an exception is made, a Trustee must tender his or her resignation by the
end of the calendar year during which he or she reaches the age of 75. Mr. Meenan reached the age of 75 during the calendar year 2016, and his term was extended for one additional year. Accordingly, Mr. Meenan is expected to serve until the end of calendar year 2017, at which time he intends to retire. Officers are elected annually by the Board. The business address of each Trustee and officer listed below is 51 Madison Avenue, New York, New York 10010. A majority of the Trustees are not “interested persons” (as defined by the 1940 Act and rules adopted by the SEC thereunder) of the Fund (“Independent Trustees”).
| | | | | | | | | | | | |
| | | | | Name and Date of Birth | | Term of Office, Position(s) Held and Length of Service | | Principal Occupation(s) During Past Five Years | | Number of
Portfolios in
the MainStay
Group of Funds
Overseen by
Trustee | | Other Directorships Held by Trustee |
| Interested Trustee | | | | Yie-Hsin Hung* 8/12/62 | | The MainStay Funds: Trustee since January 2017; MainStay Funds Trust: Trustee since January 2017. | | Senior Vice President of New York Life since joining in 2010, Member of the Executive Management Committee since January 1, 2017, Chief Executive Officer, New York Life Investment Management Holdings LLC & New York Life Investment Management LLC since May 2015. Senior Managing Director and Co-President of New York Life Investment Management LLC from January 2014 to May 2015. Previously held positions of increasing responsibility, including head of NYLIM International, Alternative Growth Businesses, and Institutional investments since joining New York Life in 2010. | | 82 | | None |
| | * | This Trustee is considered to be an “interested person” of the MainStay Group of Funds, MainStay VP Funds Trust and MainStay DefinedTerm Municipal Opportunities Fund, within the meaning of the 1940 Act because of her affiliation with New York Life Insurance Company, New York Life Investment Management LLC, Candriam Belgium, Candriam France S.A.S., Cornerstone Capital Management Holdings LLC, MacKay Shields LLC, NYL Investors LLC, NYLIFE Securities LLC and/or NYLIFE Distributors LLC, as described in detail above in the column entitled “Principal Occupation(s) During Past Five Years.” |
| | |
| 32 | | MainStay Government Fund |
| | | | | | | | | | | | |
| | | | | Name and Date of Birth | | Term of Office, Position(s) Held and Length of Service | | Principal Occupation(s) During Past Five Years | | Number of
Portfolios in
the MainStay
Group of Funds
Overseen by
Trustee | | Other Directorships Held by Trustee |
| Independent Trustees | | | | David H. Chow 12/29/57 | | The MainStay Funds: Trustee since January 2016, Advisory Board Member (June 2015 to December 2015); MainStay Funds Trust: Trustee since January 2016, Advisory Board Member (June 2015 to December 2015). | | Founder and CEO, DanCourt Management, LLC (since 1999) | | 82 | | VanEck Vectors Group of Exchange-Traded Funds: Independent Chairman of the Board of Trustees since 2008 and Trustee since 2006 (57 portfolios); and
Berea College of Kentucky: Trustee since 2009. |
| | | | Susan B. Kerley 8/12/51 | | The MainStay Funds: Chairman since January 2017 and Trustee since 2007; MainStay Funds Trust: Chairman since January 2017 and Trustee since 1990.** | | President, Strategic Management Advisors LLC (since 1990) | | 82 | | Legg Mason Partners Funds: Trustee since 1991 (54 portfolios). |
| | | | Alan R. Latshaw 3/27/51 | | The MainStay Funds: Trustee and Audit Committee Financial Expert since 2006; MainStay Funds Trust: Trustee and Audit Committee Financial Expert since 2007.** | | Retired; Partner, Ernst & Young LLP (2002 to 2003); Partner, Arthur Andersen LLP (1989 to 2002); Consultant to the MainStay Funds Audit and Compliance Committee (2004 to 2006) | | 82 | | State Farm Associates Funds Trusts: Trustee since 2005 (4 portfolios);
State Farm Mutual Fund Trust: Trustee since 2005 (15 portfolios); and
State Farm Variable Product Trust: Trustee since 2005 (9 portfolios). |
| | | | Peter Meenan 12/5/41 | | The MainStay Funds: Trustee since 2007; MainStay Funds Trust: Trustee since 2002.** | | Retired; Independent Consultant (2004 to 2013); President and Chief Executive Officer, Babson—United, Inc. (financial services firm) (2000 to 2004); Independent Consultant (1999 to 2000); Head of Global Funds, Citicorp (1995 to 1999) | | 82 | | None |
| | | | Richard H. Nolan, Jr. 11/16/46 | | The MainStay Funds: Trustee since 2007; MainStay Funds Trust: Trustee since 2007.** | | Managing Director, ICC Capital Management (since 2004); President—Shields/Alliance, Alliance Capital Management (1994 to 2004) | | 82 | | None |
| | | | Jacques P. Perold 5/12/58 | | The MainStay Funds: Trustee since January 2016, Advisory Board Member (June 2015 to December 2015); MainStay Funds Trust: Trustee since January 2016, Advisory Board Member (June 2015 to December 2015). | | Retired; President, Fidelity Management & Research Company (2009 to 2014); Founder, President and Chief Executive Officer, Geode Capital Management, LCC (2001 to 2009) | | 82 | | Allstate Corporation: Director since 2015; MSCI, Inc. Director since March 2017 and
Boston University: Trustee since 2014. |
| | | | Richard S. Trutanic 2/13/52 | | The MainStay Funds: Trustee since 1994; MainStay Funds Trust: Trustee since 2007.** | | Chairman and Chief Executive Officer, Somerset & Company (financial advisory firm) (since 2004); Managing Director, The Carlyle Group (private investment firm) (2002 to 2004); Senior Managing Director, Partner and Board Member, Groupe Arnault S.A. (private investment firm) (1999 to 2002) | | 82 | | None |
| | ** | Includes prior service as a Director/Trustee of certain predecessor entities to MainStay Funds Trust. |
| | | | | | | | |
| | | | | Name and Date of Birth | | Position(s) Held and Length of Service | | Principal Occupation(s) During Past Five Years |
Officers of the Trust (Who are not Trustees)* | | | | Kirk C. Lehneis 6/29/74 | | President, The MainStay Funds, MainStay Funds Trust (since September 2017) | | Chief Operating Officer and Senior Managing Director (since 2016), New York Life Investment Management LLC; Chairman of the Board (since September 2017), NYLIFE Distributors LLC; Chairman of the Board, NYLIM Service Company LLC (since September 2017); President, MainStay DefinedTerm Municipal Opportunities Fund and MainStay VP Funds Trust (since September 2017); Senior Managing Director, Global Product Development (From March 2015—May 2016); Managing Director, Product Development (From March 2010—February 2015) |
| | | | Jack R. Benintende 5/12/64 | | Treasurer and Principal Financial and Accounting Officer, The MainStay Funds (since 2007), MainStay Funds Trust (since 2009) | | Managing Director, New York Life Investment Management LLC (since 2007); Treasurer and Principal Financial and Accounting Officer, MainStay DefinedTerm Municipal Opportunities Fund (since 2011) and MainStay VP Funds Trust (since 2007)**; and Assistant Treasurer, New York Life Investment Management Holdings LLC (2008 to 2012) |
| | | | Kevin M. Bopp 2/24/69 | | Vice President and Chief Compliance Officer, The MainStay Funds and MainStay Funds Trust (since 2014) | | Chief Compliance Officer, New York Life Investment Management LLC, IndexIQ ETF (since January 2016), Director and Associate General Counsel (2011 to 2014) and Vice President and Assistant General Counsel (2010 to 2011), New York Life Investment Management LLC; Vice President and ChiefCompliance Officer, MainStay VP Funds Trust, MainStay DefinedTerm Municipal Opportunities Fund (since 2014); Assistant Secretary, MainStay Funds, MainStay Funds Trust and MainStay VP Funds Trust (2010 to 2014)**, MainStay DefinedTerm Municipal Opportunities Fund (2011 to 2014) |
| | | | J. Kevin Gao 10/13/67 | | Secretary and Chief Legal Officer, The MainStay Funds and MainStay Funds Trust (since 2010) | | Managing Director and Associate General Counsel, New York Life Investment Management LLC (since 2010); Secretary and Chief Legal Officer, MainStay DefinedTerm Municipal Opportunities Fund (since 2011) and MainStay VP Funds Trust (since 2010)** |
| | | | Scott T. Harrington 2/8/59 | | Vice President—Administration, The MainStay Funds (since 2005), MainStay Funds Trust (since 2009) | | Director, New York Life Investment Management LLC (including predecessor advisory organizations) (since 2000); Member of the Board of Directors, New York Life Trust Company (since 2009); Vice President—Administration, MainStay DefinedTerm Municipal Opportunities Fund (since 2011) and MainStay VP Funds Trust (since 2005)** |
| | * | The officers listed above are considered to be “interested persons” of the MainStay Group of Funds, MainStay VP Funds Trust and MainStay Defined Term Municipal Opportunities Fund within the meaning of the 1940 Act because of their affiliation with the MainStay Group of Funds, New York Life Insurance Company and/or its affiliates, including New York Life Investment Management LLC, NYLIM Service Company LLC, NYLIFE Securities LLC and/or NYLIFE Distributors LLC, as described in detail in the column captioned “Principal Occupation(s) During Past Five Years.” Officers are elected annually by the Board. |
| | ** | Includes prior service as an officer of MainStay VP Series Fund, Inc., the predecessor to MainStay VP Funds Trust. |
| | |
| 34 | | MainStay Government Fund |
MainStay Funds
Equity
U.S. Equity
MainStay Common Stock Fund
MainStay Cornerstone Growth Fund
MainStay Epoch U.S. All Cap Fund
MainStay Epoch U.S. Equity Yield Fund
MainStay Epoch U.S. Small Cap Fund
MainStay Large Cap Growth Fund
MainStay MAP Equity Fund
MainStay S&P 500 Index Fund
MainStay U.S. Equity Opportunities Fund
International/Global Equity
MainStay Candriam Emerging Markets Equity Fund
MainStay Emerging Markets Equity Fund
MainStay Epoch Capital Growth Fund
MainStay Epoch Global Choice Fund
MainStay Epoch Global Equity Yield Fund
MainStay Epoch International Choice Fund
MainStay Epoch International Small Cap Fund
MainStay International Equity Fund
MainStay International Opportunities Fund
Income
Taxable Bond
MainStay Emerging Markets Debt Fund
MainStay Floating Rate Fund
MainStay Government Fund
MainStay High Yield Corporate Bond Fund
MainStay Indexed Bond Fund
MainStay Short Duration High Yield Fund
MainStay Total Return Bond Fund
MainStay Unconstrained Bond Fund
Municipal/Tax Advantaged Bond
MainStay California Tax Free Opportunities Fund1
MainStay High Yield Municipal Bond Fund
MainStay New York Tax Free Opportunities Fund2
MainStay Tax Advantaged Short Term Bond Fund
MainStay Tax Free Bond Fund
Money Market
MainStay Money Market Fund
Mixed Asset
MainStay Balanced Fund
MainStay Convertible Fund
MainStay Income Builder Fund
Alternative
MainStay Absolute Return Multi-Strategy Fund
MainStay Cushing Energy Income Fund
MainStay Cushing MLP Premier Fund
MainStay Cushing Renaissance Advantage Fund
Asset Allocation/Target Date
MainStay Conservative Allocation Fund
MainStay Growth Allocation Fund
MainStay Moderate Allocation Fund
MainStay Moderate Growth Allocation Fund
MainStay Retirement 2010 Fund
MainStay Retirement 2020 Fund
MainStay Retirement 2030 Fund
MainStay Retirement 2040 Fund
MainStay Retirement 2050 Fund
MainStay Retirement 2060 Fund
Manager
New York Life Investment Management LLC
New York, New York
Subadvisors
Candriam Belgium S.A.3
Brussels, Belgium
Candriam France S.A.S.3
Paris, France
Cornerstone Capital Management Holdings LLC3
New York, New York
Cushing Asset Management, LP
Dallas, Texas
Epoch Investment Partners, Inc.
New York, New York
MacKay Shields LLC3
New York, New York
Markston International LLC
White Plains, New York
NYL Investors LLC3
New York, New York
Winslow Capital Management, LLC
Minneapolis, Minnesota
Legal Counsel
Dechert LLP
Washington, District of Columbia
Independent Registered Public Accounting Firm
KPMG LLP
Philadelphia, Pennsylvania
1. Class A and Class I shares of this Fund are registered for sale in AZ, CA, MI, NV, OR, TX, UT and WA. Class I shares are registered for sale in CO, FL, GA, HI, ID, MA, MD, NH, NJ and NY.
2. This Fund is registered for sale in CA, CT, DE, FL, MA, NJ, NY and VT.
3. An affiliate of New York Life Investment Management LLC.
Not part of the Annual Report
For more information
800-MAINSTAY (624-6782)
mainstayinvestments.com
MainStay Investments® is a registered service mark and name under which New York Life Investment Management LLC does business. MainStay Investments, an indirect subsidiary of New York Life Insurance Company, New York, NY 10010, provides investment advisory products and services. The MainStay Funds® are managed by New York Life Investment Management LLC and distributed by NYLIFE Distributors LLC, 30 Hudson Street, Jersey City, NJ 07302, a wholly owned subsidiary of New York Life Insurance Company. NYLIFE Distributors LLC is a Member FINRA/SIPC.
©2017 NYLIFE Distributors LLC. All rights reserved.
| | | | | | | | |
| Not FDIC/NCUA Insured | | Not a Deposit | | May Lose Value | | No Bank Guarantee | | Not Insured by Any Government Agency |
| | |
| 1716016 MS286-17 | | MSG11-12/17 (NYLIM) NL211 |
MainStay High Yield Corporate Bond Fund
Message from the President and Annual Report
October 31, 2017


This page intentionally left blank
Message from the President
The 12 months ended October 31, 2017, brought strong performance to equity markets in the United States and abroad.
According to FTSE-Russell data for the U.S. market, stocks at all capitalization levels earned solid double-digit overall returns during the reporting period. Total returns for stocks in general exceeded 20% at all capitalization levels. Growth stocks were particularly strong, outperforming value stocks for companies of all sizes except among microcaps, where value stocks outperformed growth stocks.
Several factors contributed to the strength of domestic and international stock markets during the reporting period. Following the U.S. presidential election in November 2016, many investors looked forward to business tax incentives and possible tax cuts for consumers that could stimulate economic growth. During the reporting period, corporate earnings reports remained strong; and growth in U.S. real gross domestic product remained positive, with a substantial advance during the second quarter of 2017. Developed international markets and emerging markets were also strong, boosted by positive macroeconomic data and growing confidence that Europe was well on its way to financial recovery. Despite wide variations among emerging markets, many saw strong appreciation in local-currency terms and benefited from a weaker U.S. dollar.
During the reporting period, the Federal Open Market Committee raised the federal funds target range three times—in December of 2016 and in March and June of 2017. These incremental increases raised the federal funds target range to 1.00% to 1.25% by the end of the reporting period. These tightening moves were followed by higher U.S. Treasury yields at all maturities, with the greatest increases at the short-end of the maturity spectrum.
As interest rates rise, bond prices tend to decline (and vice versa). As a result, some portions of the U.S. Treasury market recorded negative total returns during the reporting period. Agency securities posted small but positive total returns, as did
asset-backed and mortgage-backed securities. Other bond categories, particularly those with looser ties to U.S. interest rates, did considerably better. Emerging-market debt recorded solid single-digit returns; high-yield bonds were generally stronger; and convertible bonds, which are closely tied to the performance of underlying stocks, provided some of the strongest overall returns of any fixed-income sector during the reporting period.
At MainStay, we have always encouraged investors to diversify their investments and maintain a long-term perspective, even when markets are strong. Asset classes that perform well in one environment may perform differently in another; and in today’s ever-changing world, wide market swings are not unknown.
MainStay offers Funds with a wide array of investment objectives to help our shareholders pursue the appropriate diversification for their long-range financial goals. We also offer several investment boutiques, allowing our shareholders to choose the style—or mix of styles—that’s best suited to their investment needs. We believe that relatively few individual investors can match the level of professional experience and market insight that our portfolio managers provide.
The report that follows provides more detailed information on the specific markets, investment strategies and portfolio decisions that affected your MainStay Fund during the 12 months ended October 31, 2017. We encourage you to read the report carefully and use it to help you evaluate your progress toward your financial goals.
Sincerely,

Kirk C. Lehneis
President
The opinions expressed are as of the date of this report and are subject to change. There is no guarantee that any forecast made will come to pass. This material does not constitute investment advice and is not intended as an endorsement of any specific investment. Past performance is no guarantee of future results.
Not part of the Annual Report
Table of Contents
Investors should refer to the Fund’s Summary Prospectus and/or Prospectus and consider the Fund’s investment objectives, strategies, risks, charges and expenses carefully before investing. The Summary Prospectus and/or Prospectus contain this and other information about the Fund. You may obtain copies of the Fund’s Summary Prospectus, Prospectus and Statement of Additional Information free of charge, upon request, by calling toll-free 800-MAINSTAY (624-6782), by writing to NYLIFE Distributors LLC, Attn: MainStay Marketing Department, 30 Hudson Street, Jersey City, NJ 07302 or by sending an e-mail to MainStayShareholderServices@nylim.com. These documents are also available via the MainStay Funds’ website at mainstayinvestments.com/documents. Please read the Summary Prospectus and/or Prospectus carefully before investing.
Investment and Performance Comparison1 (Unaudited)
Performance data quoted represents past performance. Past performance is no guarantee of future results. Because of market volatility and other factors, current performance may be lower or higher than the figures shown. Investment return and principal value will fluctuate, and as a result, when shares are redeemed, they may be worth more or less than their original cost. The graph below depicts the historical performance of Class I shares of the Fund. Performance will vary from class to class based on differences in class-specific expenses and sales charges. For performance information current to the most recent month-end, please call 800-MAINSTAY (624-6782) or visit mainstayinvestments.com.
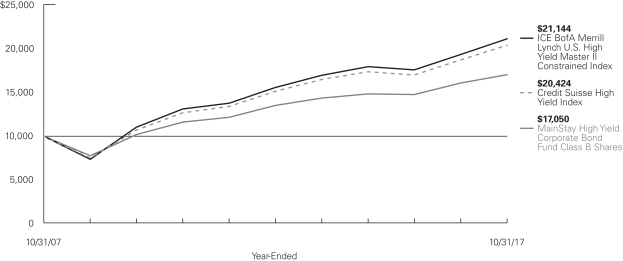
Average Annual Total Returns for the Year-Ended October 31, 2017
| | | | | | | | | | | | | | | | | | | | | | | | |
| Class | | Sales Charge | | | | Inception
Date | | | One Year | | | Five Years
or Since
Inception | | | Ten Years
or Since
Inception | | | Gross
Expense
Ratio2 | |
| Class A Shares | | Maximum 4.5% Initial Sales Charge | | With sales charges Excluding sales charges | | | 1/3/1995 | | |
| 2.10
6.91 | %
| |
| 4.62
5.59 | %
| |
| 5.83
6.32 | %
| |
| 0.95
0.95 | %
|
| Investor Class Shares | | Maximum 4.5% Initial Sales Charge | | With sales charges Excluding sales charges | | | 2/28/2008 | | |
| 2.09
6.90 |
| |
| 4.60
5.57 |
| |
| 6.47
6.97 |
| |
| 1.03
1.03 |
|
| Class B Shares3 | | Maximum 5% CDSC
if Redeemed Within the First Six Years of Purchase | | With sales charges Excluding sales charges | | | 5/1/1986 | | |
| 1.06
6.06 |
| |
| 4.44
4.75 |
| |
| 5.48
5.48 |
| |
| 1.78
1.78 |
|
| Class C Shares | | Maximum 1% CDSC
if Redeemed Within One Year of Purchase | | With sales charges Excluding sales charges | | | 9/1/1998 | | |
| 4.87
5.87 |
| |
| 4.75
4.75 |
| |
| 5.46
5.46 |
| |
| 1.78
1.78 |
|
| Class I Shares | | No Sales Charge | | | | | 1/2/2004 | | | | 7.17 | | | | 5.89 | | | | 6.60 | | | | 0.70 | |
| Class R1 Shares | | No Sales Charge | | | | | 6/29/2012 | | | | 7.07 | | | | 5.75 | | | | 6.37 | | | | 0.80 | |
| Class R2 Shares | | No Sales Charge | | | | | 5/1/2008 | | | | 6.80 | | | | 5.48 | | | | 6.80 | | | | 1.05 | |
| Class R3 Shares | | No Sales Charge | | | | | 2/29/2016 | | | | 6.58 | | | | 13.30 | | | | N/A | | | | 1.30 | |
| Class R6 Shares | | No Sales Charge | | | | | 6/17/2013 | | | | 7.36 | | | | 5.78 | | | | N/A | | | | 0.58 | |
| 1. | The performance table and graph do not reflect the deduction of taxes that a shareholder would pay on distributions or Fund share redemptions. Total returns reflect maximum applicable sales charges as indicated in the table above, if any, changes in share price, and reinvestment of dividend and capital gain distributions. The graph assumes the initial investment amount shown above and reflects the deduction of all sales charges that would have applied for the period of investment. Performance figures may reflect certain fee waivers and/or expense limitations, without which total returns may have been |
| | lower. For more information on share classes and current fee waivers and/or expense limitations (if any), please refer to the Notes to Financial Statements. |
| 2. | The gross expense ratios presented reflect the Fund’s “Total Annual Fund Operating Expenses” from the most recent Prospectus and may differ from other expense ratios disclosed in this report. |
| 3. | Class B shares are closed to all new purchases as well as additional investments by existing Class B shareholders. |
The footnotes on the next page are an integral part of the table and graph and should be carefully read in conjunction with them.
| | | | | | | | | | | | |
| Benchmark Performance | | One Year | | | Five Years
or Since
Inception | | | Ten Years
or Since
Inception | |
ICE BofA Merrill Lynch U.S. High Yield Master II Constrained Index4 | | | 9.14 | % | | | 6.30 | % | | | 7.78 | % |
Credit Suisse High Yield Index5 | | | 9.02 | | | | 6.17 | | | | 7.40 | |
Morningstar High Yield Bond Category Average6 | | | 7.93 | | | | 5.01 | | | | 6.20 | |
| 4. | The ICE BofA Merrill Lynch U.S. High Yield Master II Constrained Index is the Fund’s primary broad-based securities market index for comparison purposes. The ICE BofA Merrill Lynch U.S. High Yield Master II Constrained Index is a market value-weighted index of all domestic and Yankee high-yield bonds, including deferred interest bonds and payment-in-kind securities. Issuers included in the Index have maturities of one year or more and have a credit rating lower than BBB-/Baa3, but are not in default. No single issuer may constitute greater than 2% of the Index. Results assume reinvestment of all dividends and capital gains. An investment cannot be made directly in an index. |
| 5. | The Credit Suisse High Yield Index is the Fund’s secondary benchmark. The |
| | Credit Suisse High Yield Index is designed to mirror the investable universe of the U.S. dollar-denominated high yield debt market. Results assume reinvestment of all dividends and capital gains. An investment cannot be made directly in an index. |
| 6. | The Morningstar High Yield Bond Category Average is representative of funds that concentrate on lower-quality bonds, which are riskier than those of higher-quality companies. These portfolios primarily invest in U.S. high-income debt securities where at least 65% or more of bond assets are not rated or are rated by a major agency such as Standard & Poor’s or Moody’s at the level of BB and below. Results are based on average total returns of similar funds with all dividends and capital gain distributions reinvested. |
The footnotes on the preceding page are an integral part of the table and graph and should be carefully read in conjunction with them.
| | |
| 6 | | MainStay High Yield Corporate Bond Fund |
Cost in Dollars of a $1,000 Investment in MainStay High Yield Corporate Bond Fund (Unaudited)
The example below is intended to describe the fees and expenses borne by shareholders during the six-month period from May 1, 2017, to October 31, 2017, and the impact of those costs on your investment.
Example
As a shareholder of the Fund you incur two types of costs: (1) transaction costs, including exchange fees and sales charges (loads) on purchases (as applicable), and (2) ongoing costs, including management fees, distribution and/or service (12b-1) fees, and other Fund expenses (as applicable). This example is intended to help you understand your ongoing costs (in dollars) of investing in the Fund and to compare these costs with the ongoing costs of investing in other mutual funds. The example is based on an investment of $1,000 made at the beginning of the six-month period and held for the entire period from May 1, 2017, to October 31, 2017.
This example illustrates your Fund’s ongoing costs in two ways:
Actual Expenses
The second and third data columns in the table below provide information about actual account values and actual expenses. You may use the information in these columns, together with the amount you invested, to estimate the expenses that you paid during the six months ended October 31, 2017. Simply divide your account value by $1,000 (for example, an $8,600 account value divided by $1,000 = 8.6), then
multiply the result by the number under the heading entitled “Expenses Paid During Period” to estimate the expenses you paid on your account during this period.
Hypothetical Example for Comparison Purposes
The fourth and fifth data columns in the table below provide information about hypothetical account values and hypothetical expenses based on the Fund’s actual expense ratio and an assumed rate of return of 5% per year before expenses, which is not the Fund’s actual return. The hypothetical account values and expenses may not be used to estimate the actual ending account balances or expenses you paid for the six-month period shown. You may use this information to compare the ongoing costs of investing in the Fund with the ongoing costs of investing in other mutual funds. To do so, compare this 5% hypothetical example with the 5% hypothetical examples that appear in the shareholder reports of the other mutual funds.
Please note that the expenses shown in the table are meant to highlight your ongoing costs only and do not reflect any transactional costs, such as exchange fees or sales charges (loads). Therefore, the fourth and fifth data columns of the table are useful in comparing ongoing costs only and will not help you determine the relative total costs of owning different funds. In addition, if these transactional costs were included, your costs would have been higher.
| | | | | | | | | | | | | | | | | | | | | | |
| | | | | | | | | | | | | | | | | | |
| Share Class | | Beginning
Account
Value
5/1/17 | | | Ending Account
Value (Based
on Actual
Returns and
Expenses)
10/31/17 | | | Expenses
Paid
During
Period1 | | | Ending Account
Value (Based
on Hypothetical
5% Annualized
Return and
Actual Expenses)
10/31/17 | | | Expenses
Paid
During
Period1 | | | Net Expense
Ratio
During
Period2 |
| | | | | | |
| Class A Shares | | $ | 1,000.00 | | | $ | 1,027.70 | | | $ | 4.96 | | | $ | 1,020.30 | | | $ | 4.94 | | | 0.97% |
| | | | | | |
| Investor Class Shares | | $ | 1,000.00 | | | $ | 1,027.60 | | | $ | 5.26 | | | $ | 1,020.00 | | | $ | 5.24 | | | 1.03% |
| | | | | | |
| Class B Shares | | $ | 1,000.00 | | | $ | 1,023.50 | | | $ | 9.08 | | | $ | 1,016.20 | | | $ | 9.05 | | | 1.78% |
| | | | | | |
| Class C Shares | | $ | 1,000.00 | | | $ | 1,023.50 | | | $ | 9.08 | | | $ | 1,016.20 | | | $ | 9.05 | | | 1.78% |
| | | | | | |
| Class I Shares | | $ | 1,000.00 | | | $ | 1,028.90 | | | $ | 3.68 | | | $ | 1,021.60 | | | $ | 3.67 | | | 0.72% |
| | | | | | |
| Class R1 Shares | | $ | 1,000.00 | | | $ | 1,028.40 | | | $ | 4.14 | | | $ | 1,021.10 | | | $ | 4.13 | | | 0.81% |
| | | | | | |
| Class R2 Shares | | $ | 1,000.00 | | | $ | 1,027.10 | | | $ | 5.47 | | | $ | 1,019.80 | | | $ | 5.45 | | | 1.07% |
| | | | | | |
| Class R3 Shares | | $ | 1,000.00 | | | $ | 1,026.10 | | | $ | 6.74 | | | $ | 1,018.60 | | | $ | 6.72 | | | 1.32% |
| | | | | | |
| Class R6 Shares | | $ | 1,000.00 | | | $ | 1,029.80 | | | $ | 2.97 | | | $ | 1,022.30 | | | $ | 2.96 | | | 0.58% |
| 1. | Expenses are equal to the Fund’s annualized expense ratio of each class multiplied by the average account value over the period, divided by 365 and multiplied by 184 (to reflect the six-month period). The table above represents the actual expenses incurred during the six-month period. |
| 2. | Expenses are equal to the Fund’s annualized expense ratio to reflect the six-month period. |
Portfolio Composition as of October 31, 2017 (Unaudited)
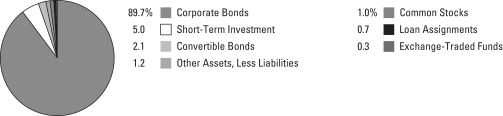
See Portfolio of Investments beginning on page 11 for specific holdings within these categories.
Top Ten Holdings or Issuers Held as of October 31, 2017 (excluding short-term investment) (Unaudited)
| 1. | T-Mobile USA, Inc., 4.00%–6.836%, due 1/15/22–4/15/27 |
| 2. | CCO Holdings LLC / CCO Holdings Capital Corp., 5.00%–5.875%, due 9/30/22–2/1/28 |
| 3. | HCA, Inc., 4.25%–8.36%, due 10/15/19–11/6/33 |
| 4. | Equinix, Inc., 5.375%–5.875%, due 1/1/22–5/15/27 |
| 6. | Freeport McMoRan, Inc., 6.50%–6.875%, due 11/15/20–2/15/23 |
| 7. | Micron Technology, Inc., 5.25%–7.50%, due 8/1/23–2/1/25 |
| 8. | Comstock Resources, Inc. |
| 9. | Carlson Travel, Inc., 6.75%–9.50%, due 12/15/23–12/15/24 |
| 10. | MPLX, L.P., 4.875%–5.50%, due 2/15/23–6/1/25 |
| | |
| 8 | | MainStay High Yield Corporate Bond Fund |
Portfolio Management Discussion and Analysis (Unaudited)
Questions answered by portfolio manager Andrew Susser of MacKay Shields LLC, the Fund’s Subadvisor.
How did MainStay High Yield Corporate Bond Fund perform relative to its primary benchmark and peers during the 12 months ended October 31, 2017?
Excluding all sales charges, MainStay High Yield Corporate Bond Fund returned 6.91% for Class A shares, 6.90% for Investor Class shares, 6.06% for Class B shares and 5.87% for Class C shares for the 12 months ended October 31, 2017. Over the same period, Class I shares returned 7.17%, Class R1 shares returned 7.07%, Class R2 shares returned 6.80%, Class R3 shares returned 6.58% and Class R6 shares returned 7.36%. For the 12 months ended October 31, 2017, all share classes underperformed the 9.14% return of the ICE BofA Merrill Lynch U.S. High Yield Master II Constrained Index,1 which is the Fund’s primary benchmark; the 9.02% return of the Credit Suisse High Yield Index,1 which is the Fund’s secondary benchmark (formerly the Fund’s primary benchmark); and the 7.93% return of the Morningstar High Yield Bond Category Average.2 See page 5 for Fund returns with applicable sales charges.
Were there any changes to the Fund during the reporting period?
Effective February 28, 2017, the Fund selected the ICE BofA Merrill Lynch U.S. High Yield Master II Constrained Index as its primary benchmark as a replacement for the Credit Suisse High Yield Index. The Fund selected the ICE BofA Merrill Lynch U.S. High Yield Master II Constrained Index as its primary benchmark because it believes that this index is more reflective of its current investment style than the Credit Suisse High Yield Index.
What factors affected the Fund’s relative performance during the reporting period?
The current market environment continues to favor higher-yielding, lower-quality issues, with CCC-rated3 and distressed credits having outperformed the ICE BofA Merrill Lynch U.S. High Yield Master II Constrained Index throughout the reporting period. The Fund’s security selection in CCC-rated credits underperformed comparably rated securities in the Index during the reporting period. Given the narrowing in spreads4 of CCC-rated bonds relative to the ICE BofA Merrill Lynch U.S. High Yield Master II Constrained Index, the Fund reduced its exposure to lower-quality securities that have appreciated in price.
What was the Fund’s duration5 strategy during the reporting period?
The Fund is not managed to a duration strategy, and the Fund’s duration positioning during the reporting period resulted from our bottom-up investment process. During the reporting period, the Fund’s duration was shorter than that of the ICE BofA Merrill Lynch U.S. High Yield Master II Constrained Index. As of October 31, 2017, the Fund’s modified duration to worst6 was approximately 3.0 years, which was shorter than the 3.5-year duration of the ICE BofA Merrill Lynch U.S. High Yield Master II Constrained Index on the same date.
What specific factors, risks or market forces prompted significant decisions for the Fund during the reporting period?
High-yield spreads have continued to tighten into 2017 from the wide levels experienced in February 2016, especially in the commodity and in CCC-rated sectors, both of which significantly outperformed the ICE BofA Merrill Lynch U.S. High Yield Master II Constrained Index during the reporting period. As a result, the Fund began to reduce positions in the areas of the high-yield market that had appreciated in price because of relative value, and the Fund added to higher-quality positions at risk-adjusted yields that in our view were relatively attractive.
Which sectors were the strongest contributors to the Fund’s relative performance, and which sectors were particularly weak?
Security selection in the retail sector contributed positively to the Fund’s performance relative to the ICE BofA Merrill Lynch U.S. High Yield Master II Constrained Index, aided by the Fund’s position in specialty retailers and by our avoidance of bonds issued by department stores, which fell in price during the reporting period. (Contributions take weightings and total returns into account.) In the automotive sector, security selection, coupled with an overweight position relative to the Index, contributed positively to the Fund’s relative performance. Relative performance was helped by the Fund’s positions in auto parts distributors and service centers.
The Fund’s underweight position in the energy sector, specifically in oil field equipment & services companies, detracted from
| 1. | See footnote on page 6 for more information on this index. |
| 2. | See footnote on page 6 for more information on the Morningstar High Yield Bond Category Average. |
| 3. | An obligation rated ‘CCC’ by Standard & Poor’s (“S&P”) is deemed by S&P to be currently vulnerable to nonpayment and is dependent upon favorable business, financial and economic conditions for the obligor to meet its financial commitment on the obligation. It is the opinion of S&P that in the event of adverse business, financial or economic conditions, the obligor is not likely to have the capacity to meet its financial commitment on the obligation. When applied to Fund holdings, ratings are based solely on the creditworthiness of the bonds in the portfolio and are not meant to represent the security or safety of the Fund. |
| 4. | The terms “spread” and “yield spread” may refer to the difference in yield between a security or type of security and comparable U.S. Treasury issues. The terms may also refer to the difference in yield between two specific securities or types of securities at a given time. |
| 5. | Duration is a measure of the price sensitivity of a fixed-income investment to changes in interest rates. Duration is expressed as a number of years and is considered a more accurate sensitivity gauge than average maturity. |
| 6. | Modified duration is inversely related to the approximate percentage change in price for a given change in yield. Duration to worst is the duration of a bond computed using the bond’s nearest call date or maturity, whichever comes first. This measure ignores future cash flow fluctuations due to embedded optionality. |
relative performance, as that industry outperformed the ICE BofA Merrill Lynch U.S. High Yield Master II Constrained Index during the reporting period. Credit selection in the utilities sector was negative because the Fund held a position in Texas-based electricity provider Reliant Energy, which detracted from relative performance. Security selection in the capital goods sector also detracted from the Fund’s relative performance, as the Fund’s position in auto parts manufacturing company Exide Technologies lagged the ICE BofA Merrill Lynch U.S. High Yield Master II Constrained Index during the reporting period.
Did the Fund make any significant purchases or sales during the reporting period?
During the reporting period, the Fund purchased bonds in Big River Steel, the newest flat-rolled steel plant in the United States. The bond carries a secured first lien on the company’s assets. The Fund also increased its position in mobile communications provider T-Mobile. T-Mobile has strategically important assets and has grown free cash flow with moderate leverage relative to its peers.
During the reporting period, the Fund sold its entire position in musical instrument retailer Guitar Center. The company continued to see declining same-store sales, as well as weakening
margin trends across its businesses. The Fund also eliminated its position in The Fresh Market, a regional grocer and specialty food retailer.
How did the Fund’s sector weightings change during the reporting period?
During the reporting period, there were no material changes to the Fund’s sector weightings. The Fund’s credit risk profile was also largely unchanged during the reporting period. There were small increases in the Fund’s weightings in the media and capital goods sectors because of valuations and yield levels that we found attractive. During the reporting period, the Fund reduced its exposure to the automotive and transportation sectors.
How was the Fund positioned at the end of the reporting period?
As of October 31, 2017, the Fund held overweight positions relative to the ICE BofA Merrill Lynch U.S. High Yield Master II Constrained Index in the basic industry, automotive and consumer goods sectors. As of the same date, the Fund held underweight positions relative to the Index in the banking, health care and telecommunications sectors.
The opinions expressed are those of the portfolio manager as of the date of this report and are subject to change. There is no guarantee that any forecasts will come to pass. This material does not constitute investment advice and is not intended as an endorsement of any specific investment.
| | |
| 10 | | MainStay High Yield Corporate Bond Fund |
Portfolio of Investments October 31, 2017
| | | | | | | | |
| | | Principal
Amount | | | Value | |
Long-Term Bonds 92.5%† Convertible Bonds 2.1% | |
Auto Parts & Equipment 0.5% | |
¨Exide Technologies (a)(b)(c)(d) | |
7.00% (7.00% PIK), due 4/30/25 | | $ | 79,988,767 | | | $ | 36,874,821 | |
7.25% (7.25% PIK), due 4/30/25 (e) | | | 19,200,000 | | | | 17,702,400 | |
| | | | | | | | |
| | | | | | | 54,577,221 | |
| | | | | | | | |
Media 0.3% | |
DISH Network Corp.
3.375%, due 8/15/26 | | | 26,910,000 | | | | 29,079,619 | |
| | | | | | | | |
|
Mining 0.6% | |
Aleris International, Inc.
6.00%, due 6/1/20 (a)(c)(d)(f) | | | 11,797 | | | | 10,662 | |
Detour Gold Corp.
5.50%, due 11/30/17 | | | 60,973,000 | | | | 61,277,865 | |
| | | | | | | | |
| | | | | | | 61,288,527 | |
| | | | | | | | |
Oil & Gas 0.4% | |
¨Comstock Resources, Inc. (b) | |
7.75% (7.75% PIK), due 4/1/19 | | | 13,937,099 | | | | 11,289,050 | |
9.50% (9.50% PIK), due 6/15/20 | | | 32,776,617 | | | | 25,893,528 | |
| | | | | | | | |
| | | | | | | 37,182,578 | |
| | | | | | | | |
Real Estate Investment Trusts 0.3% | |
VEREIT, Inc.
3.75%, due 12/15/20 | | | 30,668,000 | | | | 31,894,873 | |
| | | | | | | | |
Total Convertible Bonds
(Cost $242,705,934) | | | | | | | 214,022,818 | |
| | | | | | | | |
|
| Corporate Bonds 89.7% | |
Advertising 0.6% | |
Lamar Media Corp. | |
5.00%, due 5/1/23 | | | 2,500,000 | | | | 2,581,550 | |
5.375%, due 1/15/24 | | | 4,515,000 | | | | 4,740,750 | |
5.75%, due 2/1/26 | | | 5,015,000 | | | | 5,409,931 | |
5.875%, due 2/1/22 | | | 27,771,000 | | | | 28,499,989 | |
Outfront Media Capital LLC / Outfront Media Capital Corp. | | | | | | | | |
5.25%, due 2/15/22 | | | 14,600,000 | | | | 15,074,500 | |
5.625%, due 2/15/24 | | | 7,556,000 | | | | 7,952,690 | |
| | | | | | | | |
| | | | | | | 64,259,410 | |
| | | | | | | | |
Aerospace & Defense 1.5% | |
KLX, Inc.
5.875%, due 12/1/22 (e) | | | 40,655,000 | | | | 42,535,294 | |
Orbital ATK, Inc. | |
5.25%, due 10/1/21 | | | 5,235,000 | | | | 5,385,506 | |
5.50%, due 10/1/23 | | | 14,135,000 | | | | 15,044,941 | |
Spirit AeroSystems, Inc.
5.25%, due 3/15/22 | | | 10,035,000 | | | | 10,414,943 | |
| | | | | | | | |
| | | Principal
Amount | | | Value | |
Aerospace & Defense (continued) | |
TransDigm, Inc. | |
5.50%, due 10/15/20 | | $ | 4,015,000 | | | $ | 4,070,206 | |
6.00%, due 7/15/22 | | | 6,935,000 | | | | 7,195,063 | |
6.50%, due 7/15/24 | | | 27,691,000 | | | | 28,590,957 | |
6.50%, due 5/15/25 | | | 17,230,000 | | | | 17,768,437 | |
Triumph Group, Inc.
7.75%, due 8/15/25 (e) | | | 18,015,000 | | | | 19,253,531 | |
| | | | | | | | |
| | | | | | | 150,258,878 | |
| | | | | | | | |
Apparel 0.3% | |
Hanesbrands, Inc.
4.875%, due 5/15/26 (e) | | | 9,000,000 | | | | 9,258,750 | |
William Carter Co.
5.25%, due 8/15/21 | | | 17,560,000 | | | | 18,042,900 | |
| | | | | | | | |
| | | | | | | 27,301,650 | |
| | | | | | | | |
Auto Manufacturers 1.1% | |
BCD Acquisition, Inc.
9.625%, due 9/15/23 (e) | | | 22,615,000 | | | | 24,706,888 | |
Ford Holdings LLC | |
9.30%, due 3/1/30 | | | 18,195,000 | | | | 25,678,718 | |
9.375%, due 3/1/20 | | | 1,695,000 | | | | 1,949,323 | |
Ford Motor Co.
9.98%, due 2/15/47 | | | 980,000 | | | | 1,559,070 | |
General Motors Financial Co., Inc.
6.75%, due 6/1/18 | | | 15,000,000 | | | | 15,423,376 | |
McLaren Finance PLC
5.75%, due 8/1/22 (e) | | | 25,035,000 | | | | 25,766,022 | |
Wabash National Corp.
5.50%, due 10/1/25 (e) | | | 16,590,000 | | | | 16,923,459 | |
| | | | | | | | |
| | | | | | | 112,006,856 | |
| | | | | | | | |
Auto Parts & Equipment 3.4% | |
Adient Global Holdings, Ltd.
4.875%, due 8/15/26 (e) | | | 22,040,000 | | | | 22,673,650 | |
Allison Transmission, Inc.
5.00%, due 10/1/24 (e) | | | 3,000,000 | | | | 3,127,500 | |
American Axle & Manufacturing, Inc. (e) | |
6.25%, due 4/1/25 | | | 18,621,000 | | | | 19,086,525 | |
6.50%, due 4/1/27 | | | 16,000,000 | | | | 16,340,000 | |
Cooper-Standard Automotive, Inc.
5.625%, due 11/15/26 (e) | | | 1,025,000 | | | | 1,063,438 | |
Dana Financing Luxembourg S.A.R.L.
5.75%, due 4/15/25 (e) | | | 13,190,000 | | | | 13,981,400 | |
¨Exide Technologies
11.00% (4.00% Cash and 7.00% PIK), due 4/30/22 (a)(b)(c)(d)(e) | | | 99,727,055 | | | | 80,579,460 | |
Goodyear Tire & Rubber Co. | |
4.875%, due 3/15/27 | | | 12,405,000 | | | | 12,622,087 | |
5.125%, due 11/15/23 | | | 5,000,000 | | | | 5,150,000 | |
| † | Percentages indicated are based on Fund net assets. |
| ¨ | | Among the Fund's 10 largest holdings or issuers held, as of October 31, 2017, excluding short-term investment. May be subject to change daily. (Unaudited) |
| | | | | | |
The notes to the financial statements are an integral part of,
and should be read in conjunction with, the financial statements. | | | | | 11 | |
Portfolio of Investments October 31, 2017 (continued)
| | | | | | | | |
| | | Principal
Amount | | | Value | |
| Corporate Bonds (continued) | |
Auto Parts & Equipment (continued) | |
IHO Verwaltungs GmbH (b)(e) | |
4.125% (4.125% Cash or
4.875% PIK), due 9/15/21 | | $ | 28,735,000 | | | $ | 29,309,700 | |
4.50% (4.50% Cash or 5.25% PIK), due 9/15/23 | | | 27,055,000 | | | | 27,900,469 | |
4.75% (4.75% Cash or 5.50% PIK), due 9/15/26 | | | 20,145,000 | | | | 20,547,900 | |
International Automotive Components Group S.A.
9.125%, due 6/1/18 (e) | | | 13,980,000 | | | | 13,980,000 | |
Meritor, Inc.
6.75%, due 6/15/21 | | | 7,573,000 | | | | 7,828,589 | |
Nexteer Automotive Group, Ltd.
5.875%, due 11/15/21 (e) | | | 24,020,000 | | | | 25,100,900 | |
Schaeffler Finance B.V.
4.75%, due 5/15/23 (e) | | | 24,030,000 | | | | 24,720,862 | |
Tenneco, Inc.
5.00%, due 7/15/26 | | | 16,318,000 | | | | 16,761,850 | |
Titan International, Inc.
6.875%, due 10/1/20 | | | 4,447,000 | | | | 4,580,410 | |
ZF North America Capital, Inc.
4.75%, due 4/29/25 (e) | | | 10,800,000 | | | | 11,340,000 | |
| | | | | | | | |
| | | | | | | 356,694,740 | |
| | | | | | | | |
Banks 0.2% | |
Citigroup, Inc.
6.30%, due 5/15/24 (g)(h) | | | 3,750,000 | | | | 4,076,400 | |
Provident Funding Associates, L.P. / PFG Finance Corp.
6.375%, due 6/15/25 (e) | | | 16,750,000 | | | | 17,713,125 | |
Wells Fargo & Co.
5.90%, due 6/15/24 (g)(h) | | | 1,715,000 | | | | 1,880,583 | |
| | | | | | | | |
| | | | | | | 23,670,108 | |
| | | | | | | | |
Biotechnology 0.3% | |
AMAG Pharmaceuticals, Inc.
7.875%, due 9/1/23 (e) | | | 28,045,000 | | | | 28,535,788 | |
| | | | | | | | |
|
Building Materials 1.5% | |
Airxcel, Inc.
8.50%, due 2/15/22 (e) | | | 9,635,000 | | | | 10,213,100 | |
BMC East LLC
5.50%, due 10/1/24 (e) | | | 10,000,000 | | | | 10,475,000 | |
Gibraltar Industries, Inc.
6.25%, due 2/1/21 | | | 11,600,000 | | | | 11,904,500 | |
Griffon Corp.
5.25%, due 3/1/22 (e) | | | 7,145,000 | | | | 7,250,032 | |
James Hardie International Finance, Ltd.
5.875%, due 2/15/23 (e) | | | 31,950,000 | | | | 33,547,500 | |
| | | | | | | | |
| | | Principal
Amount | | | Value | |
Building Materials (continued) | |
RSI Home Products, Inc.
6.50%, due 3/15/23 (e) | | $ | 11,000,000 | | | $ | 11,522,500 | |
Standard Industries, Inc.
5.125%, due 2/15/21 (e) | | | 7,645,000 | | | | 7,883,906 | |
Summit Materials LLC / Summit Materials Finance Corp. | | | | | | | | |
5.125%, due 6/1/25 (e) | | | 5,000,000 | | | | 5,062,500 | |
6.125%, due 7/15/23 | | | 35,515,000 | | | | 36,846,812 | |
8.50%, due 4/15/22 | | | 17,520,000 | | | | 19,578,600 | |
USG Corp.
4.875%, due 6/1/27 (e) | | | 5,000,000 | | | | 5,187,500 | |
| | | | | | | | |
| | | | | | | 159,471,950 | |
| | | | | | | | |
Chemicals 2.2% | |
Blue Cube Spinco, Inc. | |
9.75%, due 10/15/23 | | | 32,610,000 | | | | 38,724,375 | |
10.00%, due 10/15/25 | | | 25,375,000 | | | | 30,894,063 | |
GCP Applied Technologies, Inc.
9.50%, due 2/1/23 (e) | | | 26,760,000 | | | | 29,971,200 | |
Kissner Holdings, L.P. / Kissner Milling Co., Ltd. / BSC Holding, Inc. / Kissner USA
8.375%, due 12/1/22 (e) | | | 23,525,000 | | | | 23,760,250 | |
NOVA Chemicals Corp. (e) | |
4.875%, due 6/1/24 | | | 19,795,000 | | | | 20,166,156 | |
5.25%, due 8/1/23 | | | 10,000,000 | | | | 10,312,500 | |
5.25%, due 6/1/27 | | | 10,900,000 | | | | 11,118,000 | |
Olin Corp.
5.50%, due 8/15/22 | | | 19,094,000 | | | | 20,430,580 | |
PolyOne Corp.
5.25%, due 3/15/23 | | | 32,754,000 | | | | 35,210,550 | |
PQ Corp.
6.75%, due 11/15/22 (e) | | | 1,385,000 | | | | 1,495,800 | |
Westlake Chemical Corp.
4.625%, due 2/15/21 | | | 3,660,000 | | | | 3,769,800 | |
| | | | | | | | |
| | | | | | | 225,853,274 | |
| | | | | | | | |
Coal 0.4% | |
CONSOL Energy, Inc. | |
5.875%, due 4/15/22 | | | 15,035,000 | | | | 15,335,700 | |
8.00%, due 4/1/23 | | | 28,045,000 | | | | 30,008,150 | |
| | | | | | | | |
| | | | | | | 45,343,850 | |
| | | | | | | | |
Commercial Services 4.4% | |
Ashtead Capital, Inc. (e) | |
4.125%, due 8/15/25 | | | 6,015,000 | | | | 6,060,113 | |
4.375%, due 8/15/27 | | | 8,010,000 | | | | 8,110,125 | |
5.625%, due 10/1/24 | | | 18,785,000 | | | | 19,988,179 | |
Avis Budget Car Rental LLC / Avis Budget Finance, Inc. | | | | | | | | |
5.50%, due 4/1/23 | | | 26,923,000 | | | | 27,259,538 | |
6.375%, due 4/1/24 (e) | | | 24,370,000 | | | | 25,283,875 | |
| | | | |
| 12 | | MainStay High Yield Corporate Bond Fund | | The notes to the financial statements are an integral part of,
and should be read in conjunction with, the financial statements. |
| | | | | | | | |
| | | Principal
Amount | | | Value | |
| Corporate Bonds (continued) | |
Commercial Services (continued) | |
Cimpress N.V.
7.00%, due 4/1/22 (e) | | $ | 37,845,000 | | | $ | 39,406,106 | |
Flexi-Van Leasing, Inc.
7.875%, due 8/15/18 (e) | | | 9,500,000 | | | | 9,500,000 | |
Gartner, Inc.
5.125%, due 4/1/25 (e) | | | 34,051,000 | | | | 36,008,932 | |
Great Lakes Dredge & Dock Corp.
8.00%, due 5/15/22 | | | 15,665,000 | | | | 16,448,250 | |
IHS Markit, Ltd. (e) | |
4.75%, due 2/15/25 | | | 13,010,000 | | | | 13,758,075 | |
5.00%, due 11/1/22 | | | 65,020,000 | | | | 69,896,500 | |
Jaguar Holding Co. II / Pharmaceutical Product Development LLC
6.375%, due 8/1/23 (e) | | | 14,976,000 | | | | 15,631,200 | |
Laureate Education, Inc.
8.25%, due 5/1/25 (e) | | | 11,015,000 | | | | 11,854,894 | |
Nielsen Co. Luxembourg S.A.R.L. (e) | |
5.00%, due 2/1/25 | | | 27,015,000 | | | | 27,960,525 | |
5.50%, due 10/1/21 | | | 4,500,000 | | | | 4,635,000 | |
Nielsen Finance LLC / Nielsen Finance Co. | |
4.50%, due 10/1/20 | | | 13,715,000 | | | | 13,903,581 | |
5.00%, due 4/15/22 (e) | | | 61,935,000 | | | | 63,793,050 | |
Ritchie Bros. Auctioneers, Inc.
5.375%, due 1/15/25 (e) | | | 12,920,000 | | | | 13,598,300 | |
United Rentals North America, Inc. | |
4.625%, due 7/15/23 | | | 10,600,000 | | | | 11,050,500 | |
4.625%, due 10/15/25 | | | 5,000,000 | | | | 5,115,750 | |
4.875%, due 1/15/28 | | | 3,000,000 | | | | 3,015,000 | |
WEX, Inc.
4.75%, due 2/1/23 (e) | | | 9,823,000 | | | | 10,068,575 | |
| | | | | | | | |
| | | | | | | 452,346,068 | |
| | | | | | | | |
Computers 0.5% | |
Conduent Finance, Inc. / Conduent Business Services LLC
10.50%, due 12/15/24 (e) | | | 5,855,000 | | | | 6,894,263 | |
Exela Intermediate LLC / Exela Finance, Inc.
10.00%, due 7/15/23 (e) | | | 13,390,000 | | | | 12,820,925 | |
NCR Corp.
6.375%, due 12/15/23 | | | 28,370,000 | | | | 30,215,752 | |
| | | | | | | | |
| | | | | | | 49,930,940 | |
| | | | | | | | |
Cosmetics & Personal Care 0.5% | |
Edgewell Personal Care Co. | |
4.70%, due 5/19/21 | | | 33,940,000 | | | | 35,806,700 | |
4.70%, due 5/24/22 | | | 19,403,000 | | | | 20,615,687 | |
| | | | | | | | |
| | | | | | | 56,422,387 | |
| | | | | | | | |
| | | | | | | | |
| | | Principal
Amount | | | Value | |
Distribution & Wholesale 0.2% | |
American Tire Distributors, Inc.
10.25%, due 3/1/22 (e) | | $ | 16,785,000 | | | $ | 17,519,344 | |
H&E Equipment Services, Inc.
5.625%, due 9/1/25 (e) | | | 4,015,000 | | | | 4,240,844 | |
| | | | | | | | |
| | | | | | | 21,760,188 | |
| | | | | | | | |
Diversified Financial Services 3.0% | |
AerCap Ireland Capital DAC / AerCap Global Aviation Trust | | | | | | | | |
4.625%, due 10/30/20 | | | 9,250,000 | | | | 9,825,697 | |
5.00%, due 10/1/21 | | | 16,340,000 | | | | 17,663,532 | |
Ally Financial, Inc.
8.00%, due 11/1/31 | | | 901,000 | | | | 1,189,320 | |
CFG Holdings, Ltd. / CFG Finance LLC
11.50%, due 11/15/19 (e) | | | 25,930,000 | | | | 26,318,950 | |
Credit Acceptance Corp. | |
6.125%, due 2/15/21 | | | 8,362,000 | | | | 8,508,335 | |
7.375%, due 3/15/23 | | | 25,095,000 | | | | 26,349,750 | |
Drawbridge Special Opportunities Fund, L.P. / Drawbridge Special Opportunities Finance
5.00%, due 8/1/21 (e) | | | 22,000,000 | | | | 22,645,730 | |
Jefferies Finance LLC / JFIN Co-Issuer Corp. (e) | | | | | | | | |
7.25%, due 8/15/24 | | | 11,250,000 | | | | 11,489,063 | |
6.875%, due 4/15/22 | | | 1,600,000 | | | | 1,616,000 | |
Ladder Capital Finance Holdings LLLP / Ladder Capital Finance Corp. (e) | | | | | | | | |
5.25%, due 3/15/22 | | | 22,070,000 | | | | 22,842,450 | |
5.25%, due 10/1/25 | | | 8,700,000 | | | | 8,667,375 | |
5.875%, due 8/1/21 | | | 25,700,000 | | | | 26,535,250 | |
Lincoln Finance, Ltd.
7.375%, due 4/15/21 (e) | | | 18,090,000 | | | | 19,130,175 | |
LPL Holdings, Inc.
5.75%, due 9/15/25 (e) | | | 25,445,000 | | | | 26,462,800 | |
Nationstar Mortgage LLC / Nationstar Capital Corp. | | | | | | | | |
6.50%, due 8/1/18 | | | 12,000,000 | | | | 12,030,000 | |
7.875%, due 10/1/20 | | | 6,025,000 | | | | 6,160,563 | |
Ocwen Loan Servicing LLC
8.375%, due 11/15/22 (e) | | | 17,015,000 | | | | 17,100,075 | |
OneMain Financial Holdings LLC
6.75%, due 12/15/19 (e) | | | 3,000,000 | | | | 3,112,500 | |
VFH Parent LLC / Orchestra
Co-Issuer, Inc.
6.75%, due 6/15/22 (e) | | | 26,865,000 | | | | 27,934,227 | |
Werner FinCo, L.P. / Werner FinCo, Inc.
8.75%, due 7/15/25 (e) | | | 11,430,000 | | | | 11,772,900 | |
| | | | | | | | |
| | | | | | | 307,354,692 | |
| | | | | | | | |
| | | | | | |
The notes to the financial statements are an integral part of,
and should be read in conjunction with, the financial statements. | | | | | 13 | |
Portfolio of Investments October 31, 2017 (continued)
| | | | | | | | |
| | | Principal
Amount | | | Value | |
| Corporate Bonds (continued) | |
Electric 2.1% | |
Calpine Corp. | |
5.75%, due 1/15/25 | | $ | 3,485,000 | | | $ | 3,310,750 | |
5.875%, due 1/15/24 (e) | | | 20,321,000 | | | | 21,032,235 | |
6.00%, due 1/15/22 (e) | | | 34,773,000 | | | | 35,903,122 | |
GenOn Energy, Inc. (i)(j) | |
7.875%, due 6/15/17 | | | 81,632,000 | | | | 58,366,880 | |
9.50%, due 10/15/18 | | | 59,085,000 | | | | 41,654,925 | |
NRG Energy, Inc. | |
6.25%, due 5/1/24 | | | 5,010,000 | | | | 5,323,125 | |
6.625%, due 1/15/27 | | | 22,015,000 | | | | 23,445,975 | |
NRG REMA LLC
Series C
9.681%, due 7/2/26 | | | 38,680,000 | | | | 27,462,800 | |
Public Service Co. of New Mexico
7.95%, due 5/15/18 | | | 2,927,000 | | | | 3,022,428 | |
| | | | | | | | |
| | | | | | | 219,522,240 | |
| | | | | | | | |
Electrical Components & Equipment 0.7% | |
General Cable Corp.
5.75%, due 10/1/22 | | | 45,055,000 | | | | 46,181,375 | |
WESCO Distribution, Inc.
5.375%, due 12/15/21 | | | 20,549,000 | | | | 21,177,799 | |
| | | | | | | | |
| | | | | | | 67,359,174 | |
| | | | | | | | |
Engineering & Construction 0.5% | |
Tutor Perini Corp.
6.875%, due 5/1/25 (e) | | | 10,010,000 | | | | 10,798,287 | |
Weekley Homes LLC / Weekley Finance Corp. | | | | | | | | |
6.00%, due 2/1/23 | | | 26,379,000 | | | | 25,851,420 | |
6.625%, due 8/15/25 (e) | | | 11,015,000 | | | | 10,712,088 | |
| | | | | | | | |
| | | | | | | 47,361,795 | |
| | | | | | | | |
Entertainment 1.2% | |
Churchill Downs, Inc.
5.375%, due 12/15/21 | | | 24,615,000 | | | | 25,261,143 | |
Eldorado Resorts, Inc.
6.00%, due 4/1/25 | | | 6,590,000 | | | | 6,952,450 | |
GLP Capital, L.P. / GLP Financing II, Inc. | |
4.875%, due 11/1/20 | | | 2,000,000 | | | | 2,110,000 | |
5.375%, due 4/15/26 | | | 6,860,000 | | | | 7,425,950 | |
Jacobs Entertainment, Inc.
7.875%, due 2/1/24 (e) | | | 10,359,000 | | | | 11,187,720 | |
NAI Entertainment Holdings / NAI Entertainment Holdings Finance Corp.
5.00%, due 8/1/18 (e) | | | 18,020,000 | | | | 18,038,020 | |
Rivers Pittsburgh Borrower, L.P. / Rivers Pittsburgh Finance Corp.
6.125%, due 8/15/21 (e) | | | 15,855,000 | | | | 15,954,094 | |
Sterling Entertainment Enterprises LLC
9.75%, due 12/15/19 (a)(c)(d)(f) | | | 35,000,000 | | | | 36,312,500 | |
| | | | | | | | |
| | | | | | | 123,241,877 | |
| | | | | | | | |
| | | | | | | | |
| | | Principal
Amount | | | Value | |
Food 2.1% | |
B&G Foods, Inc. | |
4.625%, due 6/1/21 | | $ | 16,520,000 | | | $ | 16,850,400 | |
5.25%, due 4/1/25 | | | 16,250,000 | | | | 16,595,313 | |
C&S Group Enterprises LLC
5.375%, due 7/15/22 (e) | | | 52,250,000 | | | | 50,682,500 | |
Ingles Markets, Inc.
5.75%, due 6/15/23 | | | 17,707,000 | | | | 17,397,127 | |
KeHE Distributors LLC / KeHE Finance Corp.
7.625%, due 8/15/21 (e) | | | 25,080,000 | | | | 25,205,400 | |
Land O' Lakes, Inc.
6.00%, due 11/15/22 (e) | | | 26,400,000 | | | | 29,667,000 | |
Land O'Lakes Capital Trust I
7.45%, due 3/15/28 (e) | | | 16,324,000 | | | | 19,099,080 | |
Post Holdings, Inc.
5.75%, due 3/1/27 (e) | | | 3,000,000 | | | | 3,116,250 | |
TreeHouse Foods, Inc.
6.00%, due 2/15/24 (e) | | | 18,285,000 | | | | 19,564,950 | |
Wells Enterprises, Inc.
6.75%, due 2/1/20 (e) | | | 22,457,000 | | | | 23,018,425 | |
| | | | | | | | |
| | | | | | | 221,196,445 | |
| | | | | | | | |
Forest Products & Paper 0.8% | |
Mercer International, Inc.
6.50%, due 2/1/24 | | | 16,933,000 | | | | 17,906,647 | |
Smurfit Kappa Treasury Funding, Ltd.
7.50%, due 11/20/25 | | | 52,580,000 | | | | 63,884,700 | |
| | | | | | | | |
| | | | | | | 81,791,347 | |
| | | | | | | | |
Gas 0.7% | |
AmeriGas Partners, L.P. / AmeriGas Finance Corp. | | | | | | | | |
5.50%, due 5/20/25 | | | 6,575,000 | | | | 6,722,938 | |
5.625%, due 5/20/24 | | | 24,506,000 | | | | 25,823,197 | |
5.75%, due 5/20/27 | | | 19,060,000 | | | | 19,465,025 | |
5.875%, due 8/20/26 | | | 24,425,000 | | | | 25,402,000 | |
| | | | | | | | |
| | | | | | | 77,413,160 | |
| | | | | | | | |
Health Care—Products 0.5% | |
Alere, Inc.
6.50%, due 6/15/20 | | | 895,000 | | | | 909,544 | |
Halyard Health, Inc.
6.25%, due 10/15/22 | | | 11,331,000 | | | | 11,847,694 | |
Hill-Rom Holdings, Inc.
5.75%, due 9/1/23 (e) | | | 13,765,000 | | | | 14,487,662 | |
Hologic, Inc. (e) | |
4.375%, due 10/15/25 | | | 11,000,000 | | | | 11,176,000 | |
5.25%, due 7/15/22 | | | 12,730,000 | | | | 13,286,937 | |
| | | | | | | | |
| | | | | | | 51,707,837 | |
| | | | | | | | |
Health Care—Services 4.8% | |
Acadia Healthcare Co., Inc. | |
5.625%, due 2/15/23 | | | 24,930,000 | | | | 25,603,110 | |
6.50%, due 3/1/24 | | | 11,580,000 | | | | 12,202,425 | |
| | | | |
| 14 | | MainStay High Yield Corporate Bond Fund | | The notes to the financial statements are an integral part of,
and should be read in conjunction with, the financial statements. |
| | | | | | | | |
| | | Principal
Amount | | | Value | |
| Corporate Bonds (continued) | |
Health Care—Services (continued) | |
Centene Corp. | |
4.75%, due 1/15/25 | | $ | 11,965,000 | | | $ | 12,353,863 | |
5.625%, due 2/15/21 | | | 14,930,000 | | | | 15,489,875 | |
6.125%, due 2/15/24 | | | 22,817,000 | | | | 24,528,275 | |
CHS / Community Health Systems, Inc.
6.25%, due 3/31/23 | | | 13,575,000 | | | | 13,065,938 | |
Fresenius Medical Care U.S.
Finance II, Inc. (e) | | | | | | | | |
5.625%, due 7/31/19 | | | 11,680,000 | | | | 12,342,545 | |
5.875%, due 1/31/22 | | | 4,500,000 | | | | 5,024,655 | |
6.50%, due 9/15/18 | | | 4,730,000 | | | | 4,912,821 | |
¨HCA, Inc. | |
4.25%, due 10/15/19 | | | 5,000,000 | | | | 5,150,000 | |
5.00%, due 3/15/24 | | | 9,959,000 | | | | 10,494,296 | |
5.25%, due 4/15/25 | | | 19,000,000 | | | | 20,235,000 | |
5.25%, due 6/15/26 | | | 11,805,000 | | | | 12,557,569 | |
5.375%, due 2/1/25 | | | 24,525,000 | | | | 25,291,406 | |
5.875%, due 3/15/22 | | | 12,030,000 | | | | 13,172,850 | |
5.875%, due 5/1/23 | | | 4,603,000 | | | | 4,930,964 | |
5.875%, due 2/15/26 | | | 19,500,000 | | | | 20,499,375 | |
7.50%, due 2/15/22 | | | 9,417,000 | | | | 10,688,295 | |
7.50%, due 12/15/23 | | | 1,500,000 | | | | 1,725,000 | |
7.50%, due 11/6/33 | | | 2,500,000 | | | | 2,812,500 | |
7.58%, due 9/15/25 | | | 8,020,000 | | | | 9,162,850 | |
7.69%, due 6/15/25 | | | 29,225,000 | | | | 33,170,375 | |
8.36%, due 4/15/24 | | | 4,524,000 | | | | 5,327,010 | |
HealthSouth Corp.
5.75%, due 11/1/24 | | | 18,575,000 | | | | 19,016,156 | |
Molina Healthcare, Inc.
5.375%, due 11/15/22 | | | 19,025,000 | | | | 19,795,512 | |
MPH Acquisition Holdings LLC
7.125%, due 6/1/24 (e) | | | 60,250,000 | | | | 64,844,062 | |
Tenet Healthcare Corp. | | | | | | | | |
4.625%, due 7/15/24 (e) | | | 9,800,000 | | | | 9,640,750 | |
5.125%, due 5/1/25 (e) | | | 10,000,000 | | | | 9,737,500 | |
6.00%, due 10/1/20 | | | 8,000,000 | | | | 8,400,000 | |
6.75%, due 6/15/23 | | | 10,020,000 | | | | 9,406,275 | |
7.50%, due 1/1/22 (e) | | | 3,785,000 | | | | 3,983,713 | |
8.125%, due 4/1/22 | | | 24,435,000 | | | | 24,557,175 | |
WellCare Health Plans, Inc.
5.25%, due 4/1/25 | | | 15,885,000 | | | | 16,718,962 | |
West Street Merger Sub, Inc.
6.375%, due 9/1/25 (e) | | | 8,515,000 | | | | 8,632,081 | |
| | | | | | | | |
| | | | | | | 495,473,183 | |
| | | | | | | | |
Home Builders 2.0% | |
Ashton Woods USA LLC / Ashton Woods Finance Co. (e) | | | | | | | | |
6.75%, due 8/1/25 | | | 11,496,000 | | | | 11,381,040 | |
6.875%, due 2/15/21 | | | 21,140,000 | | | | 21,694,925 | |
| | | | | | | | |
| | | Principal
Amount | | | Value | |
Home Builders (continued) | | | | | | | | |
Brookfield Residential Properties, Inc. (e) | |
6.375%, due 5/15/25 | | $ | 6,665,000 | | | $ | 6,981,587 | |
6.50%, due 12/15/20 | | | 24,800,000 | | | | 25,327,000 | |
Brookfield Residential Properties, Inc. / Brookfield Residential U.S. Corp.
6.125%, due 7/1/22 (e) | | | 37,996,000 | | | | 39,658,325 | |
Century Communities, Inc.
6.875%, due 5/15/22 | | | 34,796,000 | | | | 36,513,183 | |
M/I Homes, Inc.
5.625%, due 8/1/25 | | | 10,000,000 | | | | 10,162,500 | |
Mattamy Group Corp.
6.50%, due 10/1/25 (e) | | | 17,020,000 | | | | 17,743,350 | |
New Home Co., Inc.
7.25%, due 4/1/22 | | | 20,030,000 | | | | 20,931,350 | |
Shea Homes, L.P. / Shea Homes Funding Corp. (e) | | | | | | | | |
5.875%, due 4/1/23 | | | 4,365,000 | | | | 4,528,688 | |
6.125%, due 4/1/25 | | | 5,610,000 | | | | 5,834,400 | |
Toll Brothers Finance Corp.
5.875%, due 2/15/22 | | | 5,000,000 | | | | 5,543,750 | |
| | | | | | | | |
| | | | | | | 206,300,098 | |
| | | | | | | | |
Household Products & Wares 0.8% | |
Prestige Brands, Inc.
6.375%, due 3/1/24 (e) | | | 31,308,000 | | | | 33,343,020 | |
Spectrum Brands, Inc. | |
5.75%, due 7/15/25 | | | 19,492,000 | | | | 20,704,013 | |
6.625%, due 11/15/22 | | | 27,090,000 | | | | 28,159,513 | |
| | | | | | | | |
| | | | | | | 82,206,546 | |
| | | | | | | | |
Insurance 1.4% | |
American Equity Investment Life Holding Co.
5.00%, due 6/15/27 | | | 27,640,000 | | | | 29,003,033 | |
Fairfax Financial Holdings, Ltd. | |
7.375%, due 4/15/18 | | | 9,092,000 | | | | 9,314,995 | |
8.30%, due 4/15/26 | | | 5,435,000 | | | | 6,665,393 | |
Fidelity & Guaranty Life Holdings, Inc.
6.375%, due 4/1/21 (e) | | | 30,178,000 | | | | 31,083,340 | |
MGIC Investment Corp.
5.75%, due 8/15/23 | | | 30,580,000 | | | | 33,638,000 | |
Radian Group, Inc.
4.50%, due 10/1/24 | | | 10,225,000 | | | | 10,480,625 | |
USIS Merger Sub, Inc.
6.875%, due 5/1/25 (e) | | | 20,000,000 | | | | 20,750,000 | |
| | | | | | | | |
| | | | | | | 140,935,386 | |
| | | | | | | | |
Internet 2.2% | |
Cogent Communications Group, Inc.
5.375%, due 3/1/22 (e) | | | 17,046,000 | | | | 18,004,837 | |
Match Group, Inc. | |
6.375%, due 6/1/24 | | | 4,760,000 | | | | 5,170,550 | |
6.75%, due 12/15/22 | | | 55,699,000 | | | | 57,439,594 | |
| | | | | | |
The notes to the financial statements are an integral part of,
and should be read in conjunction with, the financial statements. | | | | | 15 | |
Portfolio of Investments October 31, 2017 (continued)
| | | | | | | | |
| | | Principal
Amount | | | Value | |
| Corporate Bonds (continued) | |
Internet (continued) | |
Netflix, Inc. | |
4.875%, due 4/15/28 (e) | | $ | 16,440,000 | | | $ | 16,340,538 | |
5.375%, due 2/1/21 | | | 10,580,000 | | | | 11,294,150 | |
5.50%, due 2/15/22 | | | 17,305,000 | | | | 18,537,981 | |
5.75%, due 3/1/24 | | | 34,256,000 | | | | 36,696,740 | |
5.875%, due 2/15/25 | | | 10,411,000 | | | | 11,239,716 | |
Symantec Corp.
5.00%, due 4/15/25 (e) | | | 13,860,000 | | | | 14,483,700 | |
VeriSign, Inc. | |
4.625%, due 5/1/23 | | | 6,615,000 | | | | 6,821,719 | |
4.75%, due 7/15/27 | | | 7,015,000 | | | | 7,225,450 | |
5.25%, due 4/1/25 | | | 25,661,000 | | | | 27,842,185 | |
| | | | | | | | |
| | | | | | | 231,097,160 | |
| | | | | | | | |
Iron & Steel 1.3% | |
Allegheny Ludlum LLC
6.95%, due 12/15/25 | | | 11,518,000 | | | | 11,633,180 | |
Allegheny Technologies, Inc. | |
7.875%, due 8/15/23 | | | 18,170,000 | | | | 19,918,862 | |
9.375%, due 6/1/19 | | | 8,265,000 | | | | 9,029,513 | |
Big River Steel LLC / BRS Finance Corp.
7.25%, due 9/1/25 (e) | | | 44,225,000 | | | | 47,431,312 | |
BlueScope Steel Finance, Ltd. / BlueScope Steel Finance USA LLC
6.50%, due 5/15/21 (e) | | | 47,055,000 | | | | 49,172,475 | |
| | | | | | | | |
| | | | | | | 137,185,342 | |
| | | | | | | | |
Leisure Time 1.6% | |
Brunswick Corp.
4.625%, due 5/15/21 (e) | | | 22,433,000 | | | | 22,828,533 | |
¨Carlson Travel, Inc. (e) | |
6.75%, due 12/15/23 | | | 72,516,000 | | | | 71,790,840 | |
9.50%, due 12/15/24 | | | 41,365,000 | | | | 38,779,688 | |
Vista Outdoor, Inc.
5.875%, due 10/1/23 | | | 32,352,000 | | | | 33,403,440 | |
| | | | | | | | |
| | | | | | | 166,802,501 | |
| | | | | | | | |
Lodging 0.8% | |
Boyd Gaming Corp.
6.375%, due 4/1/26 | | | 4,015,000 | | | | 4,406,463 | |
Choice Hotels International, Inc.
5.75%, due 7/1/22 | | | 29,270,000 | | | | 32,416,525 | |
Hilton Domestic Operating Co., Inc.
4.25%, due 9/1/24 | | | 12,220,000 | | | | 12,479,675 | |
Jack Ohio Finance LLC / Jack Ohio Finance 1 Corp.
6.75%, due 11/15/21 (e) | | | 18,480,000 | | | | 19,727,400 | |
MGM Resorts International
6.75%, due 10/1/20 | | | 2,664,000 | | | | 2,930,400 | |
Station Casinos LLC
5.00%, due 10/1/25 (e) | | | 15,910,000 | | | | 15,929,887 | |
| | | | | | | | |
| | | | | | | 87,890,350 | |
| | | | | | | | |
| | | | | | | | |
| | | Principal
Amount | | | Value | |
Machinery—Construction & Mining 0.1% | |
BlueLine Rental Finance Corp. / BlueLine Rental LLC
9.25%, due 3/15/24 (e) | | $ | 10,025,000 | | | $ | 10,877,125 | |
| | | | | | | | |
|
Machinery—Diversified 0.3% | |
Briggs & Stratton Corp.
6.875%, due 12/15/20 | | | 10,585,000 | | | | 11,643,500 | |
Tennant Co.
5.625%, due 5/1/25 (e) | | | 10,365,000 | | | | 10,818,469 | |
Zebra Technologies Corp.
7.25%, due 10/15/22 | | | 8,325,000 | | | | 8,793,281 | |
| | | | | | | | |
| | | | | | | 31,255,250 | |
| | | | | | | | |
Media 6.9% | |
Altice Financing S.A.
7.50%, due 5/15/26 (e) | | | 15,335,000 | | | | 16,810,994 | |
Altice Luxembourg S.A.
7.75%, due 5/15/22 (e) | | | 3,495,000 | | | | 3,700,331 | |
Altice U.S. Finance I Corp.
5.375%, due 7/15/23 (e) | | | 20,225,000 | | | | 21,084,562 | |
Block Communications, Inc.
6.875%, due 2/15/25 (e) | | | 38,347,000 | | | | 41,414,760 | |
Cablevision Systems Corp.
7.75%, due 4/15/18 | | | 11,030,000 | | | | 11,279,388 | |
¨CCO Holdings LLC / CCO Holdings Capital Corp. | | | | | | | | |
5.00%, due 2/1/28 (e) | | | 51,215,000 | | | | 50,830,887 | |
5.125%, due 2/15/23 | | | 24,030,000 | | | | 24,810,975 | |
5.125%, due 5/1/23 (e) | | | 14,918,000 | | | | 15,552,015 | |
5.125%, due 5/1/27 (e) | | | 39,725,000 | | | | 40,122,250 | |
5.25%, due 9/30/22 | | | 3,010,000 | | | | 3,100,300 | |
5.375%, due 5/1/25 (e) | | | 5,025,000 | | | | 5,213,438 | |
5.75%, due 2/15/26 (e) | | | 29,345,000 | | | | 30,680,197 | |
5.875%, due 4/1/24 (e) | | | 23,715,000 | | | | 25,256,475 | |
5.875%, due 5/1/27 (e) | | | 7,930,000 | | | | 8,304,296 | |
Charter Communications Operating LLC / Charter Communications Operating Capital | | | | | | | | |
3.579%, due 7/23/20 | | | 4,000,000 | | | | 4,107,596 | |
4.464%, due 7/23/22 | | | 6,165,000 | | | | 6,510,698 | |
Cogeco Communications, Inc.
4.875%, due 5/1/20 (e) | | | 10,700,000 | | | | 10,887,250 | |
CSC Holdings LLC
10.125%, due 1/15/23 (e) | | | 5,935,000 | | | | 6,795,575 | |
DISH DBS Corp. | |
5.125%, due 5/1/20 | | | 5,000,000 | | | | 5,112,500 | |
5.875%, due 7/15/22 | | | 10,020,000 | | | | 10,076,413 | |
5.875%, due 11/15/24 | | | 24,045,000 | | | | 24,014,944 | |
6.75%, due 6/1/21 | | | 3,065,000 | | | | 3,218,250 | |
Midcontinent Communications / Midcontinent Finance Corp.
6.875%, due 8/15/23 (e) | | | 20,030,000 | | | | 21,482,175 | |
| | | | |
| 16 | | MainStay High Yield Corporate Bond Fund | | The notes to the financial statements are an integral part of,
and should be read in conjunction with, the financial statements. |
| | | | | | | | |
| | | Principal
Amount | | | Value | |
| Corporate Bonds (continued) | |
Media (continued) | |
Quebecor Media, Inc.
5.75%, due 1/15/23 | | $ | 52,855,000 | | | $ | 57,347,675 | |
SFR Group S.A. (e) | |
6.00%, due 5/15/22 | | | 47,210,000 | | | | 49,216,425 | |
6.25%, due 5/15/24 | | | 9,700,000 | | | | 10,160,750 | |
7.375%, due 5/1/26 | | | 22,815,000 | | | | 24,526,125 | |
Sirius XM Radio, Inc.
5.00%, due 8/1/27 (e) | | | 7,010,000 | | | | 7,071,338 | |
UPCB Finance IV, Ltd.
5.375%, due 1/15/25 (e) | | | 2,690,000 | | | | 2,750,525 | |
Videotron, Ltd. | |
5.00%, due 7/15/22 | | | 25,289,000 | | | | 27,312,120 | |
5.125%, due 4/15/27 (e) | | | 21,735,000 | | | | 22,848,919 | |
5.375%, due 6/15/24 (e) | | | 29,120,000 | | | | 31,449,600 | |
Virgin Media Secured Finance PLC
5.25%, due 1/15/21 | | | 83,250,000 | | | | 88,661,250 | |
| | | | | | | | |
| | | | | | | 711,710,996 | |
| | | | | | | | |
Metal Fabricate & Hardware 1.3% | |
Grinding Media, Inc. / Moly-Cop AltaSteel, Ltd.
7.375%, due 12/15/23 (e) | | | 41,880,000 | | | | 45,544,500 | |
Novelis Corp. (e) | |
5.875%, due 9/30/26 | | | 30,900,000 | | | | 31,846,158 | |
6.25%, due 8/15/24 | | | 21,250,000 | | | | 22,418,750 | |
Optimas OE Solutions Holding LLC / Optimas OE Solutions, Inc.
8.625%, due 6/1/21 (e) | | | 18,775,000 | | | | 18,962,750 | |
Park-Ohio Industries, Inc.
6.625%, due 4/15/27 (e) | | | 17,020,000 | | | | 18,466,700 | |
| | | | | | | | |
| | | | | | | 137,238,858 | |
| | | | | | | | |
Mining 3.5% | |
Alcoa Nederland Holding B.V. (e) | |
6.75%, due 9/30/24 | | | 7,910,000 | | | | 8,792,123 | |
7.00%, due 9/30/26 | | | 15,600,000 | | | | 17,784,000 | |
Aleris International, Inc. | |
7.875%, due 11/1/20 | | | 43,612,000 | | | | 43,528,265 | |
9.50%, due 4/1/21 (e) | | | 44,005,000 | | | | 46,920,331 | |
First Quantum Minerals, Ltd.
7.25%, due 4/1/23 (e) | | | 16,740,000 | | | | 17,702,550 | |
¨Freeport McMoRan, Inc. | |
6.50%, due 11/15/20 | | | 34,975,000 | | | | 35,630,781 | |
6.75%, due 2/1/22 | | | 21,026,000 | | | | 21,867,040 | |
6.875%, due 2/15/23 | | | 68,126,000 | | | | 74,520,988 | |
Hecla Mining Co.
6.875%, due 5/1/21 | | | 42,858,000 | | | | 43,929,450 | |
Joseph T. Ryerson & Son, Inc.
11.00%, due 5/15/22 (e) | | | 9,500,000 | | | | 10,735,000 | |
Lundin Mining Corp. (e) | |
7.50%, due 11/1/20 | | | 3,500,000 | | | | 3,640,350 | |
7.875%, due 11/1/22 | | | 10,015,000 | | | | 10,841,238 | |
| | | | | | | | |
| | | Principal
Amount | | | Value | |
Mining (continued) | |
Petra Diamonds U.S. Treasury PLC
7.25%, due 5/1/22 (e) | | $ | 23,645,000 | | | $ | 23,479,485 | |
| | | | | | | | |
| | | | | | | 359,371,601 | |
| | | | | | | | |
Miscellaneous—Manufacturing 1.3% | |
Amsted Industries, Inc.
5.00%, due 3/15/22 (e) | | | 18,260,000 | | | | 18,853,450 | |
CTP Transportation Products LLC / CTP Finance, Inc.
8.25%, due 12/15/19 (e) | | | 28,950,000 | | | | 27,719,625 | |
EnPro Industries, Inc. | |
5.875%, due 9/15/22 | | | 17,495,000 | | | | 18,304,144 | |
5.875%, due 9/15/22 (e) | | | 6,800,000 | | | | 7,114,500 | |
Fxi Holdings, Inc.
7.875%, due 11/1/24 (e) | | | 4,000,000 | | | | 4,055,000 | |
Gates Global LLC / Gates Global Co.
6.00%, due 7/15/22 (e) | | | 36,494,000 | | | | 37,543,202 | |
Koppers, Inc.
6.00%, due 2/15/25 (e) | | | 17,475,000 | | | | 18,741,938 | |
| | | | | | | | |
| | | | | | | 132,331,859 | |
| | | | | | | | |
Oil & Gas 7.6% | |
Ascent Resources Utica Holdings LLC / ARU Finance Corp.
10.00%, due 4/1/22 (e) | | | 20,515,000 | | | | 22,258,775 | |
California Resources Corp. | |
5.00%, due 1/15/20 | | | 53,170,000 | | | | 35,092,200 | |
8.00%, due 12/15/22 (e) | | | 28,035,000 | | | | 18,503,100 | |
Callon Petroleum Co.
6.125%, due 10/1/24 | | | 22,540,000 | | | | 23,441,600 | |
Calumet Specialty Products Partners, L.P. / Calumet Finance Corp. | | | | | | | | |
6.50%, due 4/15/21 | | | 4,000,000 | | | | 3,915,000 | |
7.625%, due 1/15/22 | | | 4,161,000 | | | | 4,077,780 | |
11.50%, due 1/15/21 (e) | | | 33,285,000 | | | | 38,319,356 | |
Carrizo Oil & Gas, Inc.
7.50%, due 9/15/20 | | | 14,490,000 | | | | 14,779,800 | |
¨Comstock Resources, Inc.
10.00% (10.00% Cash or
12.25% PIK), due 3/15/20 (b) | | | 71,610,000 | | | | 74,116,350 | |
Continental Resources, Inc.
5.00%, due 9/15/22 | | | 22,040,000 | | | | 22,287,950 | |
Delek Logistics Partners, L.P.
6.75%, due 5/15/25 (e) | | | 10,445,000 | | | | 10,640,844 | |
Gulfport Energy Corp. | |
6.00%, due 10/15/24 | | | 47,184,000 | | | | 47,184,000 | |
6.375%, due 5/15/25 | | | 21,725,000 | | | | 22,050,875 | |
6.375%, due 1/15/26 (e) | | | 5,000,000 | | | | 5,050,000 | |
Jones Energy Holdings LLC / Jones Energy Finance Corp.
6.75%, due 4/1/22 | | | 5,102,000 | | | | 3,966,805 | |
| | | | | | |
The notes to the financial statements are an integral part of,
and should be read in conjunction with, the financial statements. | | | | | 17 | |
Portfolio of Investments October 31, 2017 (continued)
| | | | | | | | |
| | | Principal
Amount | | | Value | |
| Corporate Bonds (continued) | |
Oil & Gas (continued) | |
Matador Resources Co.
6.875%, due 4/15/23 | | $ | 12,665,000 | | | $ | 13,393,238 | |
Murphy Oil Corp.
6.875%, due 8/15/24 | | | 9,590,000 | | | | 10,309,250 | |
Murphy Oil USA, Inc.
6.00%, due 8/15/23 | | | 23,635,000 | | | | 24,787,206 | |
Newfield Exploration Co. | |
5.625%, due 7/1/24 | | | 19,385,000 | | | | 20,960,031 | |
5.75%, due 1/30/22 | | | 14,140,000 | | | | 15,200,500 | |
Oasis Petroleum, Inc.
6.875%, due 3/15/22 | | | 7,500,000 | | | | 7,687,500 | |
Parsley Energy LLC / Parsley
Finance Corp. (e) | | | | | | | | |
5.25%, due 8/15/25 | | | 14,125,000 | | | | 14,266,250 | |
5.625%, due 10/15/27 | | | 7,000,000 | | | | 7,223,160 | |
6.25%, due 6/1/24 | | | 6,100,000 | | | | 6,466,000 | |
PDC Energy, Inc. | |
6.125%, due 9/15/24 | | | 6,015,000 | | | | 6,278,156 | |
7.75%, due 10/15/22 | | | 34,910,000 | | | | 36,393,675 | |
PetroQuest Energy, Inc.
10.00% (1.00% Cash and
9.00% PIK), due 2/15/21 (b) | | | 67,970,097 | | | | 50,977,573 | |
Range Resources Corp. | |
5.75%, due 6/1/21 | | | 23,225,000 | | | | 23,919,427 | |
5.875%, due 7/1/22 | | | 23,861,000 | | | | 24,457,525 | |
Rex Energy Corp.
8.00%, due 10/1/20 | | | 116,480,000 | | | | 44,262,400 | |
RSP Permian, Inc. | |
5.25%, due 1/15/25 (e) | | | 10,300,000 | | | | 10,480,250 | |
6.625%, due 10/1/22 | | | 17,780,000 | | | | 18,691,225 | |
Southwestern Energy Co.
7.50%, due 4/1/26 | | | 17,195,000 | | | | 17,839,812 | |
Stone Energy Corp.
7.50%, due 5/31/22 | | | 24,562,822 | | | | 24,132,973 | |
WPX Energy, Inc. | |
6.00%, due 1/15/22 | | | 40,535,000 | | | | 42,207,069 | |
7.50%, due 8/1/20 | | | 22,420,000 | | | | 24,325,700 | |
| | | | | | | | |
| | | | | | | 789,943,355 | |
| | | | | | | | |
Oil & Gas Services 0.4% | |
Forum Energy Technologies, Inc.
6.25%, due 10/1/21 | | | 44,275,000 | | | | 44,164,313 | |
| | | | | | | | |
|
Packaging & Containers 0.0%‡ | |
Ardagh Packaging Finance PLC / Ardagh Holdings USA, Inc.
7.25%, due 5/15/24 (e) | | | 1,200,000 | | | | 1,318,500 | |
Sealed Air Corp.
5.50%, due 9/15/25 (e) | | | 2,465,000 | | | | 2,717,663 | |
| | | | | | | | |
| | | | | | | 4,036,163 | |
| | | | | | | | |
| | | | | | | | |
| | | Principal
Amount | | | Value | |
Pharmaceuticals 0.7% | |
Catalent Pharma Solutions, Inc.
4.875%, due 1/15/26 (e) | | $ | 15,620,000 | | | $ | 15,854,300 | |
Endo Finance LLC
5.75%, due 1/15/22 (e) | | | 6,435,000 | | | | 5,630,625 | |
Endo Finance LLC / Endo Finco, Inc.
5.375%, due 1/15/23 (e) | | | 20,000,000 | | | | 16,100,000 | |
Endo Ltd. / Endo Finance LLC / Endo Finco, Inc.
6.00%, due 2/1/25 (e) | | | 7,000,000 | | | | 5,565,000 | |
inVentiv Group Holdings, Inc. / inVentiv Health, Inc. / inVentiv Health Clinical, Inc.
7.50%, due 10/1/24 (e) | | | 4,077,000 | | | | 4,494,893 | |
Valeant Pharmaceuticals International, Inc. (e) | | | | | | | | |
5.50%, due 11/1/25 | | | 9,000,000 | | | | 9,202,500 | |
7.50%, due 7/15/21 | | | 17,015,000 | | | | 16,738,506 | |
| | | | | | | | |
| | | | | | | 73,585,824 | |
| | | | | | | | |
Pipelines 3.8% | |
Andeavor Logistics, L.P. / Tesoro Logistics Finance Corp. | | | | | | | | |
6.125%, due 10/15/21 | | | 1,010,000 | | | | 1,042,825 | |
6.25%, due 10/15/22 | | | 14,005,000 | | | | 14,915,325 | |
6.375%, due 5/1/24 | | | 5,005,000 | | | | 5,480,475 | |
ANR Pipeline Co. | |
7.375%, due 2/15/24 | | | 2,555,000 | | | | 3,074,497 | |
9.625%, due 11/1/21 | | | 10,349,000 | | | | 13,046,849 | |
Antero Midstream Partners, L.P. / Antero Midstream Finance Corp.
5.375%, due 9/15/24 | | | 12,015,000 | | | | 12,495,600 | |
Cheniere Corpus Christi Holdings LLC | |
5.875%, due 3/31/25 | | | 19,380,000 | | | | 20,978,850 | |
7.00%, due 6/30/24 | | | 2,000,000 | | | | 2,282,500 | |
Cheniere Energy Partners, L.P.
5.25%, due 10/1/25 (e) | | | 10,015,000 | | | | 10,315,450 | |
Genesis Energy, L.P. / Genesis Energy Finance Corp. | | | | | | | | |
5.75%, due 2/15/21 | | | 4,770,000 | | | | 4,843,458 | |
6.75%, due 8/1/22 | | | 44,670,000 | | | | 46,121,775 | |
Holly Energy Partners, L.P. / Holly Energy Finance Corp.
6.00%, due 8/1/24 (e) | | | 18,020,000 | | | | 18,875,950 | |
¨MPLX, L.P. | |
4.875%, due 12/1/24 | | | 27,495,000 | | | | 29,902,374 | |
4.875%, due 6/1/25 | | | 30,580,000 | | | | 33,120,850 | |
5.50%, due 2/15/23 | | | 36,010,000 | | | | 37,079,497 | |
NGPL PipeCo LLC (e) | |
4.375%, due 8/15/22 | | | 8,875,000 | | | | 9,130,156 | |
4.875%, due 8/15/27 | | | 16,630,000 | | | | 17,212,050 | |
| | | | |
| 18 | | MainStay High Yield Corporate Bond Fund | | The notes to the financial statements are an integral part of,
and should be read in conjunction with, the financial statements. |
| | | | | | | | |
| | | Principal
Amount | | | Value | |
| Corporate Bonds (continued) | |
Pipelines (continued) | |
NuStar Logistics, L.P. | |
6.75%, due 2/1/21 | | $ | 17,215,000 | | | $ | 18,678,275 | |
8.15%, due 4/15/18 | | | 6,454,000 | | | | 6,631,485 | |
Rockies Express Pipeline LLC (e) | |
6.00%, due 1/15/19 | | | 17,415,000 | | | | 18,024,525 | |
6.85%, due 7/15/18 | | | 3,000,000 | | | | 3,082,500 | |
Sabine Pass Liquefaction LLC
5.875%, due 6/30/26 | | | 25,290,000 | | | | 28,611,258 | |
SemGroup Corp.
6.375%, due 3/15/25 (e) | | | 11,362,000 | | | | 11,191,570 | |
Tallgrass Energy Partners, L.P. / Tallgrass Energy Finance Corp.
5.50%, due 9/15/24 (e) | | | 30,045,000 | | | | 31,059,019 | |
| | | | | | | | |
| | | | | | | 397,197,113 | |
| | | | | | | | |
Private Equity 0.0%‡ | |
Icahn Enterprises, L.P. / Icahn Enterprises Finance Corp.
5.875%, due 2/1/22 | | | 3,900,000 | | | | 4,029,207 | |
| | | | | | | | |
|
Real Estate 1.6% | |
AAF Holdings LLC / AAF Finance Co. 12.00% (12.00% Cash or 12.75% PIK), due 7/1/19 (b)(e) | | | 36,070,960 | | | | 37,874,508 | |
CBRE Services, Inc. | |
5.00%, due 3/15/23 | | | 31,132,000 | | | | 32,219,823 | |
5.25%, due 3/15/25 | | | 11,505,000 | | | | 12,662,398 | |
Howard Hughes Corp.
5.375%, due 3/15/25 (e) | | | 29,390,000 | | | | 30,198,225 | |
Realogy Group LLC / Realogy
Co-Issuer Corp.
4.875%, due 6/1/23 (e) | | | 16,835,000 | | | | 17,335,000 | |
Rialto Holdings LLC / Rialto Corp.
7.00%, due 12/1/18 (e) | | | 32,565,000 | | | | 32,646,412 | |
| | | | | | | | |
| | | | | | | 162,936,366 | |
| | | | | | | | |
Real Estate Investment Trusts 4.3% | |
Crown Castle International Corp. | |
4.875%, due 4/15/22 | | | 2,000,000 | | | | 2,167,186 | |
5.25%, due 1/15/23 | | | 81,518,000 | | | | 90,223,505 | |
CTR Partnership LP / CareTrust Capital Corp.
5.25%, due 6/1/25 | | | 13,665,000 | | | | 14,040,788 | |
¨Equinix, Inc. | |
5.375%, due 1/1/22 | | | 20,391,000 | | | | 21,305,129 | |
5.375%, due 4/1/23 | | | 17,525,000 | | | | 18,094,563 | |
5.375%, due 5/15/27 | | | 50,650,000 | | | | 54,258,812 | |
5.75%, due 1/1/25 | | | 33,597,000 | | | | 36,032,782 | |
5.875%, due 1/15/26 | | | 32,425,000 | | | | 35,140,594 | |
FelCor Lodging, L.P.
5.625%, due 3/1/23 | | | 27,772,000 | | | | 28,709,305 | |
| | | | | | | | |
| | | Principal
Amount | | | Value | |
Real Estate Investment Trusts (continued) | |
Host Hotels & Resorts, L.P.
6.00%, due 10/1/21 | | $ | 13,000,000 | | | $ | 14,440,823 | |
MGM Growth Properties Operating Partnership, L.P. / MGP Finance Co-Issuer, Inc. | | | | | | | | |
4.50%, due 9/1/26 | | | 9,020,000 | | | | 9,053,825 | |
4.50%, due 1/15/28 (e) | | | 7,000,000 | | | | 6,982,500 | |
5.625%, due 5/1/24 | | | 60,430,000 | | | | 65,264,400 | |
MPT Operating Partnership, L.P. / MPT Finance Corp.
5.00%, due 10/15/27 | | | 20,025,000 | | | | 20,575,687 | |
Sabra Health Care, L.P. / Sabra Capital Corp. | | | | | | | | |
5.375%, due 6/1/23 | | | 800,000 | | | | 826,000 | |
5.50%, due 2/1/21 | | | 5,050,000 | | | | 5,207,813 | |
SBA Communications Corp.
4.00%, due 10/1/22 (e) | | | 13,000,000 | | | | 13,195,000 | |
Starwood Property Trust, Inc.
5.00%, due 12/15/21 | | | 10,000,000 | | | | 10,475,000 | |
VEREIT Operating Partnership, L.P.
4.125%, due 6/1/21 | | | 4,000,000 | | | | 4,179,426 | |
| | | | | | | | |
| | | | | | | 450,173,138 | |
| | | | | | | | |
Retail 3.9% | |
1011778 B.C. ULC / New Red Finance, Inc.
5.00%, due 10/15/25 (e) | | | 10,000,000 | | | | 10,187,500 | |
Asbury Automotive Group, Inc.
6.00%, due 12/15/24 | | | 50,273,000 | | | | 53,038,015 | |
Beacon Escrow Corp.
4.875%, due 11/1/25 (e) | | | 12,195,000 | | | | 12,343,779 | |
Cumberland Farms, Inc.
6.75%, due 5/1/25 (e) | | | 20,020,000 | | | | 21,271,250 | |
Dollar Tree, Inc.
5.75%, due 3/1/23 | | | 29,690,000 | | | | 31,137,387 | |
DriveTime Automotive Group, Inc. / Bridgecrest Acceptance Corp.
8.00%, due 6/1/21 (e) | | | 45,301,000 | | | | 45,527,505 | |
GameStop Corp.
5.50%, due 10/1/19 (e) | | | 8,025,000 | | | | 8,195,531 | |
Group 1 Automotive, Inc. | |
5.00%, due 6/1/22 | | | 16,040,000 | | | | 16,556,488 | |
5.25%, due 12/15/23 (e) | | | 8,020,000 | | | | 8,260,600 | |
KFC Holding Co. / Pizza Hut Holdings LLC / Taco Bell of America LLC (e) | | | | | | | | |
4.75%, due 6/1/27 | | | 10,000,000 | | | | 10,262,500 | |
5.00%, due 6/1/24 | | | 16,490,000 | | | | 17,396,950 | |
5.25%, due 6/1/26 | | | 29,750,000 | | | | 31,613,837 | |
L Brands, Inc. | |
5.625%, due 2/15/22 | | | 9,110,000 | | | | 9,743,145 | |
5.625%, due 10/15/23 | | | 2,765,000 | | | | 2,944,725 | |
| | | | | | |
The notes to the financial statements are an integral part of,
and should be read in conjunction with, the financial statements. | | | | | 19 | |
Portfolio of Investments October 31, 2017 (continued)
| | | | | | | | |
| | | Principal
Amount | | | Value | |
| Corporate Bonds (continued) | |
Retail (continued) | |
L Brands, Inc. (continued) | |
6.625%, due 4/1/21 | | $ | 14,030,000 | | | $ | 15,450,538 | |
6.75%, due 7/1/36 | | | 5,000,000 | | | | 4,887,500 | |
8.50%, due 6/15/19 | | | 3,395,000 | | | | 3,709,038 | |
Men's Wearhouse, Inc.
7.00%, due 7/1/22 | | | 44,616,000 | | | | 42,385,200 | |
Penske Automotive Group, Inc.
5.75%, due 10/1/22 | | | 27,491,000 | | | | 28,358,891 | |
Rite Aid Corp. | |
6.125%, due 4/1/23 (e) | | | 34,555,000 | | | | 32,136,150 | |
6.75%, due 6/15/21 | | | 2,000,000 | | | | 1,987,500 | |
| | | | | | | | |
| | | | | | | 407,394,029 | |
| | | | | | | | |
Semiconductors 1.3% | |
¨Micron Technology, Inc. | |
5.25%, due 8/1/23 (e) | | | 18,305,000 | | | | 19,158,013 | |
5.25%, due 1/15/24 (e) | | | 8,000,000 | | | | 8,410,000 | |
5.50%, due 2/1/25 | | | 23,054,000 | | | | 24,494,875 | |
7.50%, due 9/15/23 | | | 64,625,000 | | | | 71,572,187 | |
Qorvo, Inc.
6.75%, due 12/1/23 | | | 5,000,000 | | | | 5,412,500 | |
Sensata Technologies UK Financing Co. PLC
6.25%, due 2/15/26 (e) | | | 2,485,000 | | | | 2,721,075 | |
| | | | | | | | |
| | | | | | | 131,768,650 | |
| | | | | | | | |
Software 2.9% | |
ACI Worldwide, Inc.
6.375%, due 8/15/20 (e) | | | 43,650,000 | | | | 44,462,981 | |
Ascend Learning LLC
6.875%, due 8/1/25 (e) | | | 25,700,000 | | | | 26,920,750 | |
Donnelley Financial Solutions, Inc.
8.25%, due 10/15/24 | | | 25,270,000 | | | | 27,133,662 | |
First Data Corp. (e) | |
5.00%, due 1/15/24 | | | 3,500,000 | | | | 3,635,625 | |
7.00%, due 12/1/23 | | | 8,135,000 | | | | 8,704,613 | |
MSCI, Inc. (e) | |
4.75%, due 8/1/26 | | | 11,290,000 | | | | 11,755,713 | |
5.25%, due 11/15/24 | | | 25,772,000 | | | | 27,253,890 | |
5.75%, due 8/15/25 | | | 25,791,000 | | | | 27,854,280 | |
Open Text Corp.
5.875%, due 6/1/26 (e) | | | 17,240,000 | | | | 18,683,850 | |
PTC, Inc.
6.00%, due 5/15/24 | | | 47,968,000 | | | | 52,042,882 | |
Quintiles IMS, Inc. (e) | |
4.875%, due 5/15/23 | | | 17,747,000 | | | | 18,456,880 | |
5.00%, due 10/15/26 | | | 32,113,000 | | | | 34,120,062 | |
| | | | | | | | |
| | | | | | | 301,025,188 | |
| | | | | | | | |
Storage & Warehousing 0.2% | |
Algeco Scotsman Global Finance PLC
8.50%, due 10/15/18 (e) | | | 20,615,000 | | | | 20,202,700 | |
| | | | | | | | |
| | | | | | | | |
| | | Principal
Amount | | | Value | |
Telecommunications 5.8% | |
CenturyLink, Inc.
5.625%, due 4/1/25 | | $ | 16,020,000 | | | $ | 15,619,500 | |
Cogent Communications Finance, Inc.
5.625%, due 4/15/21 (e) | | | 35,015,000 | | | | 35,890,375 | |
Frontier Communications Corp. | |
10.50%, due 9/15/22 | | | 32,465,000 | | | | 28,325,712 | |
11.00%, due 9/15/25 | | | 32,071,000 | | | | 27,220,261 | |
Hughes Satellite Systems Corp. | |
5.25%, due 8/1/26 | | | 21,850,000 | | | | 22,343,373 | |
6.625%, due 8/1/26 | | | 25,220,000 | | | | 26,607,100 | |
7.625%, due 6/15/21 | | | 38,030,000 | | | | 42,498,525 | |
Inmarsat Finance PLC
4.875%, due 5/15/22 (e) | | | 22,020,000 | | | | 22,464,804 | |
Level 3 Communications, Inc.
5.75%, due 12/1/22 | | | 10,750,000 | | | | 11,045,625 | |
Level 3 Financing, Inc. | |
5.375%, due 8/15/22 | | | 2,000,000 | | | | 2,060,560 | |
5.375%, due 1/15/24 | | | 12,520,000 | | | | 13,005,150 | |
Qualitytech LP / QTS Finance Corp.
4.75%, due 11/15/25 (e) | | | 12,000,000 | | | | 12,222,000 | |
Sprint Capital Corp. | |
6.875%, due 11/15/28 | | | 52,425,000 | | | | 55,930,922 | |
8.75%, due 3/15/32 | | | 6,000,000 | | | | 7,275,000 | |
Sprint Communications, Inc. | |
7.00%, due 3/1/20 (e) | | | 26,910,000 | | | | 29,197,350 | |
9.00%, due 11/15/18 (e) | | | 3,523,000 | | | | 3,738,784 | |
9.25%, due 4/15/22 | | | 16,831,000 | | | | 20,617,975 | |
¨T-Mobile USA, Inc. | |
4.00%, due 4/15/22 | | | 5,000,000 | | | | 5,171,875 | |
5.125%, due 4/15/25 | | | 25,615,000 | | | | 26,824,028 | |
5.375%, due 4/15/27 | | | 20,175,000 | | | | 21,839,437 | |
6.00%, due 4/15/24 | | | 15,315,000 | | | | 16,387,050 | |
6.125%, due 1/15/22 | | | 16,040,000 | | | | 16,681,600 | |
6.375%, due 3/1/25 | | | 41,867,000 | | | | 45,216,360 | |
6.50%, due 1/15/24 | | | 14,485,000 | | | | 15,462,738 | |
6.50%, due 1/15/26 | | | 31,965,000 | | | | 35,365,117 | |
6.625%, due 4/1/23 | | | 30,115,000 | | | | 31,620,750 | |
6.836%, due 4/28/23 | | | 8,915,000 | | | | 9,405,325 | |
| | | | | | | | |
| | | | | | | 600,037,296 | |
| | | | | | | | |
Trucking & Leasing 0.2% | |
Fortress Transportation & Infrastructure Investors LLC
6.75%, due 3/15/22 (e) | | | 22,535,000 | | | | 23,605,413 | |
| | | | | | | | |
Total Corporate Bonds
(Cost $8,963,284,178) | | | | | | | 9,311,579,664 | |
| | | | | | | | |
|
| Loan Assignments 0.7% (k) | |
Diversified Financial Services 0.1% | |
Jane Street Group LLC
Initial Term Loans
5.813% (2-month USD-LIBOR-BBA + 4.50%), due 8/25/22 | | | 143,750 | | | | 145,188 | |
Initial Term Loans
5.88% (3-month USD-LIBOR-BBA + 4.50%), due 8/25/22 | | | 11,356,250 | | | | 11,469,812 | |
| | | | | | | | |
| | | | | | | 11,615,000 | |
| | | | | | | | |
| | | | |
| 20 | | MainStay High Yield Corporate Bond Fund | | The notes to the financial statements are an integral part of,
and should be read in conjunction with, the financial statements. |
| | | | | | | | |
| | | Principal
Amount | | | Value | |
| Loan Assignments (continued) | |
Metals & Mining 0.2% | |
Neenah Foundry Co. (c)(f)
2016 Term Loan
7.772% (2-month USD-LIBOR-BBA + 6.50%), due 4/26/19 | | $ | 8,243,275 | | | $ | 8,119,626 | |
2016 Term Loan
7.812% (2-month USD-LIBOR-BBA + 6.50%), due 4/26/19 | | | 8,653,150 | | | | 8,523,352 | |
| | | | | | | | |
| | | | | | | 16,642,978 | |
| | | | | | | | |
|
Retail 0.3% | |
Bass Pro Group LLC
Term Loan B
6.242% (1-month USD-LIBOR-BBA + 5.00%), due 9/25/24 | | | 36,900,000 | | | | 35,850,675 | |
| | | | | | | | |
|
Transportation 0.1% | |
American Commercial Lines LLC
2015 1st Lien Term Loan
9.992% (1-month USD-LIBOR-BBA + 8.75%), due 11/12/20 | | | 11,263,696 | | | | 8,597,951 | |
| | | | | | | | |
Total Loan Assignments
(Cost $75,005,981) | | | | | | | 72,706,604 | |
| | | | | | | | |
Total Long-Term Bonds (Cost $9,280,996,093) | | | | | | | 9,598,309,086 | |
| | | | | | | | |
| | |
| | | | | | | | |
| | |
Shares | | | | |
| Common Stocks 1.0%† | |
Auto Parts & Equipment 0.0%‡ | |
¨Exide Technologies
(a)(c)(d)(f)(l) | | | 2,084,972 | | | | 3,398,505 | |
| | | | | | | | |
|
Lodging 0.0%‡ | |
Majestic Star Casino LLC Membership Units (a)(c)(d)(f)(l) | | | 446,020 | | | | 423,719 | |
| | | | | | | | |
|
Media 0.0% ‡ | |
ION Media Networks, Inc.
(a)(c)(d)(f) | | | 2,287 | | | | 1,551,935 | |
| | | | | | | | |
|
Metals & Mining 0.1% | |
Neenah Enterprises, Inc.
(a)(c)(d)(f)(l) | | | 720,961 | | | | 8,644,323 | |
| | | | | | | | |
|
Oil, Gas & Consumable Fuels 0.6% | |
¨Comstock Resources, Inc. (l) | | | 78,894 | | | | 372,380 | |
PetroQuest Energy, Inc. (l) | | | 908,262 | | | | 1,634,871 | |
Rex Energy Corp. (c)(l) | | | 103,000 | | | | 194,670 | |
Stone Energy Corp. (c)(f)(l) | | | 2,074,193 | | | | 61,022,758 | |
Titan Energy LLC (l) | | | 91,174 | | | | 351,020 | |
| | | | | | | | |
| | | | | | | 63,575,699 | |
| | | | | | | | |
Specialty Retail 0.3% | |
American Eagle Outfitters, Inc. | | | 1,865,034 | | | | 24,282,743 | |
| | | | | | | | |
Total Common Stocks
(Cost $172,772,301) | | | | | | | 101,876,924 | |
| | | | | | | | |
| | | | | | | | |
| | |
Shares | | | Value | |
| Exchange-Traded Funds (l) 0.3% | | | | | |
iShares Gold Trust | | | 618,700 | | | $ | 7,554,327 | |
SPDR Gold Shares | | | 189,000 | | | | 22,806,630 | |
| | | | | | | | |
Total Exchange-Traded Funds (Cost $28,668,073) | | | | | | | 30,360,957 | |
| | | | | | | | |
| | |
| | | | | | | | |
| | | Principal Amount | | | | |
| Short-Term Investment 5.0% | |
Money Market Fund 5.0% | |
State Street Institutional U.S. Government Money Market Fund, Premier Class 0.96% | | $ | 525,223,834 | | | | 525,223,834 | |
| | | | | | | | |
Total Short-Term Investment (Cost $525,223,834) | | | | | | | 525,223,834 | |
| | | | | | | | |
Total Investments
(Cost $10,007,660,301) | | | 98.8 | % | | | 10,255,770,801 | |
Other Assets, Less Liabilities | | | 1.2 | | | | 124,922,068 | |
Net Assets | | | 100.0 | % | | $ | 10,380,692,869 | |
| ‡ | Less than one-tenth of a percent. |
| (a) | Security in which significant unobservable inputs (Level 3) were used in determining fair value. |
| (b) | PIK ("Payment-in-Kind")—issuer may pay interest or dividends with additional securities and/or in cash. |
| (c) | Illiquid security—As of October 31, 2017, the total market value of these securities deemed illiquid under procedures approved by the Board of Trustees was $263,358,731, which represented 2.5% of the Fund's net assets. (Unaudited) |
| (d) | Fair valued security—Represents fair value as measured in good faith under procedures approved by the Board of Trustees. As of October 31, 2017, the total market value of fair valued securities was $185,498,325, which represented 1.8% of the Fund's net assets. |
| (e) | May be sold to institutional investors only under Rule 144A or securities offered pursuant to Section 4(a)(2) of the Securities Act of 1933, as amended. |
| (g) | Fixed to floating rate—Rate shown was the rate in effect as of October 31, 2017. |
| (h) | Securities are perpetual and, thus, do not have a predetermined maturity date. The date shown, if applicable, reflects the next call date. |
| (j) | Issue in non-accrual status. |
| (k) | Floating rate—Rate shown was the rate in effect as of October 31, 2017. |
| (l) | Non-income producing security. |
The following abbreviations are used in the preceding pages:
BBA—British Bankers' Association
LIBOR—London InterBank Offered Rate
SPDR—Standard & Poor's Depositary Receipt
| | | | | | |
The notes to the financial statements are an integral part of,
and should be read in conjunction with, the financial statements. | | | | | 21 | |
Portfolio of Investments October 31, 2017 (continued)
The following is a summary of the fair valuations according to the inputs used as of October 31, 2017, for valuing the Fund's assets.
Asset Valuation Inputs
| | | | | | | | | | | | | | | | |
Description | | Quoted Prices in Active Markets for Identical Assets (Level 1) | | | Significant Other Observable Inputs (Level 2) | | | Significant Unobservable Inputs (Level 3) | | | Total | |
| Investments in Securities (a) | | | | | | | | | | | | | | | | |
Long-Term Bonds | | | | | | | | | | | | | | | | |
Convertible Bonds (b) | | $ | — | | | $ | 159,434,935 | | | $ | 54,587,883 | | | $ | 214,022,818 | |
Corporate Bonds (c) | | | — | | | | 9,194,687,704 | | | | 116,891,960 | | | | 9,311,579,664 | |
Loan Assignments | | | — | | | | 72,706,604 | | | | — | | | | 72,706,604 | |
| | | | | | | | | | | | | | | | |
| Total Long-Term Bonds | | | — | | | | 9,426,829,243 | | | | 171,479,843 | | | | 9,598,309,086 | |
| | | | | | | | | | | | | | | | |
| Common Stocks (d) | | | 87,858,442 | | | | — | | | | 14,018,482 | | | | 101,876,924 | |
| Exchange-Traded Funds | | | 30,360,957 | | | | — | | | | — | | | | 30,360,957 | |
Short-Term Investment | | | | | | | | | | | | | | | | |
Money Market Fund | | | 525,223,834 | | | | — | | | | — | | | | 525,223,834 | |
| | | | | | | | | | | | | | | | |
| Total Investments in Securities | | $ | 643,443,233 | | | $ | 9,426,829,243 | | | $ | 185,498,325 | | | $ | 10,255,770,801 | |
| | | | | | | | | | | | | | | | |
| (a) | For a complete listing of investments and their industries, see the Portfolio of Investments. |
| (b) | The Level 3 securities valued at $54,577,221 and $10,662 are held in Auto Parts & Equipment and Mining, respectively, within the Convertible Bonds section of the Portfolio of Investments. |
| (c) | The Level 3 securities valued at $80,579,460 and $36,312,500 are held in Auto Parts & Equipment and Entertainment, respectively, within the Corporate Bonds section of the Portfolio of Investments. |
| (d) | The Level 3 securities valued at $3,398,505, $423,719, $1,551,935, and $8,644,323 are held in Auto Parts & Equipment, Lodging, Media, and Metals & Mining, respectively, within the Common Stocks section of the Portfolio of Investments. |
The Fund recognizes transfers between the levels as of the beginning of the period.
As of October 31, 2017, a security with a market value of $2,712,058 transferred from Level 3 to Level 1. The transfer occurred as a result of utilizing significant observable inputs from an independent pricing service. As of October 31, 2016, the fair value obtained for this common stock, utilized significant unobservable inputs.
| | | | |
| 22 | | MainStay High Yield Corporate Bond Fund | | The notes to the financial statements are an integral part of,
and should be read in conjunction with, the financial statements. |
The following is a reconciliation of investments in which significant unobservable inputs (Level 3) were used in determining value:
| | | | | | | | | | | | | | | | | | | | | | | | | | | | | | | | | | | | | | | | |
Investments in
Securities | | Balance
as of
October 31, 2016 | | | Accrued Discounts (Premiums) | | | Realized Gain (Loss) | | | Change in Unrealized Appreciation (Depreciation) | | | Purchases | | | Sales | | | Transfers
in to Level 3 | | | Transfers out of Level 3 | | | Balance
as of October 31, 2017 | | | Change in Unrealized Appreciation (Depreciation) from Investments Still Held as of October 31, 2017 (b) | |
| Long-Term Bonds | | | | | | | | | | | | | | | | | | | | | | | | | | | | | | | | | | | | | | | | |
Convertible Bonds | | | | | | | | | | | | | | | | | | | | | | | | | | | | | | | | | | | | | | | | |
Auto Parts
& Equipment | | $ | 53,695,454 | | | $ | 851,193 | | | $ | 18,331 | | | $ | (22,604,712 | ) | | $ | 25,382,848 | (a) | | $ | (2,765,893 | ) | | $ | — | | | $ | — | | | $ | 54,577,221 | | | $ | (22,604,712 | ) |
Mining | | | — | | | | 512 | | | | — | | | | 1,278 | | | | 8,872 | (c) | | | — | | | | — | | | | — | | | | 10,662 | | | | 1,278 | |
Corporate Bonds | | | | | | | | | | | | | | | | | | | | | | | | | | | | | | | | | | | | | | | | |
Auto Parts
& Equipment | | | 59,108,560 | | | | 1,251,944 | | | | (4,357,422 | ) | | | (2,508,108 | ) | | | 90,577,940 | (a) | | | (63,493,454 | ) | | | — | | | | — | | | | 80,579,460 | | | | (8,341,729 | ) |
Entertainment | | | 36,312,500 | | | | — | | | | — | | | | — | | | | — | | | | — | | | | — | | | | — | | | | 36,312,500 | | | | — | |
Oil & Gas | | | 4,800,000 | | | | — | | | | — | | | | (4,800,000 | ) | | | — | | | | — | | | | — | | | | — | | | | — | | | | — | |
Loan Assignments | | | | | | | | | | | | | | | | | | | | | | | | | | | | | | | | | | | | | | | | |
Software | | | 3,007,500 | | | | 666 | | | | 39,930 | | | | (22,382 | ) | | | — | | | | (3,025,714 | )(d) | | | — | | | | — | | | | — | | | | — | |
Common Stocks | | | | | | | | | | | | | | | | | | | | | | | | | | | | | | | | | | | | | | | | |
Auto Parts
& Equipment | | | 4,164,619 | | | | — | | | | — | | | | (769,056 | ) | | | 2,942 | | | | — | | | | — | | | | — | | | | 3,398,505 | | | | (769,056 | ) |
Electric | | | 412,308 | | | | — | | | | | | | | (412,308 | ) | | | — | | | | | | | | — | | | | — | | | | — | | | | — | |
Lodging | | | 55,753 | | | | — | | | | — | | | | 367,966 | | | | — | | | | — | | | | — | | | | — | | | | 423,719 | | | | 367,966 | |
Media | | | 1,213,706 | | | | — | | | | — | | | | 324,657 | | | | 13,572 | | | | — | | | | — | | | | — | | | | 1,551,935 | | | | 324,657 | |
Metals & Mining | | | 7,902,967 | | | | — | | | | — | | | | 706,542 | | | | 34,814 | | | | — | | | | — | | | | — | | | | 8,644,323 | | | | 706,542 | |
Oil & Gas | | | 2,712,058 | | | | — | | | | — | | | | — | | | | — | | | | — | | | | — | | | | (2,712,058 | ) | | | — | | | | — | |
| | | | | | | | | | | | | | | | | | | | | | | | | | | | | | | | | | | | | | | | |
| Total | | $ | 173,385,425 | | | $ | 2,104,315 | | | $ | (4,299,161 | ) | | $ | (29,716,123 | ) | | $ | 116,020,988 | | | $ | (69,285,061 | ) | | $ | — | | | $ | (2,712,058 | ) | | $ | 185,498,325 | | | $ | (30,315,054 | ) |
| | | | | | | | | | | | | | | | | | | | | | | | | | | | | | | | | | | | | | | | |
| (a) | Purchases include PIK securities. |
| (b) | Included in “Net change in unrealized appreciation (depreciation) on investments” in the Statement of Operations. |
| (c) | Security acquired through merger with MainStay High Yield Opportunities Fund. |
| (d) | Sales include principal reductions. |
| | | | | | |
The notes to the financial statements are an integral part of,
and should be read in conjunction with, the financial statements. | | | | | 23 | |
Statement of Assets and Liabilities as of October 31, 2017
| | | | |
| Assets | |
Investment in securities, at value
(identified cost $10,007,660,301) | | $ | 10,255,770,801 | |
Cash | | | 4,911,919 | |
Receivables: | | | | |
Dividends and interest | | | 159,033,242 | |
Fund shares sold | | | 15,349,878 | |
Investment securities sold | | | 9,972,580 | |
Other assets | | | 174,403 | |
| | | | |
Total assets | | | 10,445,212,823 | |
| | | | |
| |
| Liabilities | | | | |
Payables: | | | | |
Investment securities purchased | | | 35,142,619 | |
Fund shares redeemed | | | 16,654,956 | |
Manager (See Note 3) | | | 4,784,274 | |
NYLIFE Distributors (See Note 3) | | | 1,501,508 | |
Transfer agent (See Note 3) | | | 1,186,705 | |
Shareholder communication | | | 902,777 | |
Professional fees | | | 96,581 | |
Trustees | | | 25,523 | |
Custodian | | | 6,379 | |
Accrued expenses | | | 56,417 | |
Dividend payable | | | 4,162,215 | |
| | | | |
Total liabilities | | | 64,519,954 | |
| | | | |
Net assets | | $ | 10,380,692,869 | |
| | | | |
| |
| Composition of Net Assets | | | | |
Shares of beneficial interest outstanding (par value of $.01 per share) unlimited number of shares authorized | | $ | 17,988,135 | |
Additional paid-in capital | | | 10,404,912,611 | |
| | | | |
| | | 10,422,900,746 | |
Distributions in excess of net investment income | | | (11,523,635 | ) |
Accumulated net realized gain (loss) on investments | | | (278,794,742 | ) |
Net unrealized appreciation (depreciation) on investments | | | 248,110,500 | |
| | | | |
Net assets | | $ | 10,380,692,869 | |
| | | | |
| | | | |
Class A | | | | |
Net assets applicable to outstanding shares | | $ | 3,683,112,901 | |
| | | | |
Shares of beneficial interest outstanding | | | 638,271,818 | |
| | | | |
Net asset value per share outstanding | | $ | 5.77 | |
Maximum sales charge (4.50% of offering price) | | | 0.27 | |
| | | | |
Maximum offering price per share outstanding | | $ | 6.04 | |
| | | | |
Investor Class | | | | |
Net assets applicable to outstanding shares | | $ | 167,139,086 | |
| | | | |
Shares of beneficial interest outstanding | | | 28,732,347 | |
| | | | |
Net asset value per share outstanding | | $ | 5.82 | |
Maximum sales charge (4.50% of offering price) | | | 0.27 | |
| | | | |
Maximum offering price per share outstanding | | $ | 6.09 | |
| | | | |
Class B | | | | |
Net assets applicable to outstanding shares | | $ | 108,263,476 | |
| | | | |
Shares of beneficial interest outstanding | | | 18,853,131 | |
| | | | |
Net asset value and offering price per share outstanding | | $ | 5.74 | |
| | | | |
Class C | | | | |
Net assets applicable to outstanding shares | | $ | 676,463,244 | |
| | | | |
Shares of beneficial interest outstanding | | | 117,751,362 | |
| | | | |
Net asset value and offering price per share outstanding | | $ | 5.74 | |
| | | | |
Class I | | | | |
Net assets applicable to outstanding shares | | $ | 4,067,559,653 | |
| | | | |
Shares of beneficial interest outstanding | | | 704,204,372 | |
| | | | |
Net asset value and offering price per share outstanding | | $ | 5.78 | |
| | | | |
Class R1 | | | | |
Net assets applicable to outstanding shares | | $ | 37,202 | |
| | | | |
Shares of beneficial interest outstanding | | | 6,450 | |
| | | | |
Net asset value and offering price per share outstanding | | $ | 5.77 | |
| | | | |
Class R2 | | | | |
Net assets applicable to outstanding shares | | $ | 9,562,426 | |
| | | | |
Shares of beneficial interest outstanding | | | 1,656,497 | |
| | | | |
Net asset value and offering price per share outstanding | | $ | 5.77 | |
| | | | |
Class R3 | | | | |
Net assets applicable to outstanding shares | | $ | 392,206 | |
| | | | |
Shares of beneficial interest outstanding | | | 68,029 | |
| | | | |
Net asset value and offering price per share outstanding | | $ | 5.77 | |
| | | | |
Class R6 | | | | |
Net assets applicable to outstanding shares | | $ | 1,668,162,675 | |
| | | | |
Shares of beneficial interest outstanding | | | 289,269,536 | |
| | | | |
Net asset value and offering price per share��outstanding | | $ | 5.77 | |
| | | | |
| | | | |
| 24 | | MainStay High Yield Corporate Bond Fund | | The notes to the financial statements are an integral part of,
and should be read in conjunction with, the financial statements. |
Statement of Operations for the year ended October 31, 2017
| | | | |
| Investment Income (Loss) | |
Income | | | | |
Interest | | $ | 640,314,416 | |
Dividends | | | 974,635 | |
Other income | | | 10,686 | |
| | | | |
Total income | | | 641,299,737 | |
| | | | |
Expenses | | | | |
Manager (See Note 3) | | | 55,840,794 | |
Distribution/Service—Class A (See Note 3) | | | 9,039,556 | |
Distribution/Service—Investor Class (See Note 3) | | | 687,314 | |
Distribution/Service—Class B (See Note 3) | | | 1,218,513 | |
Distribution/Service—Class C (See Note 3) | | | 6,992,177 | |
Distribution/Service—Class R2 (See Note 3) | | | 25,896 | |
Distribution/Service—Class R3 (See Note 3) | | | 1,298 | |
Transfer agent (See Note 3) | | | 14,295,396 | |
Shareholder communication | | | 2,545,951 | |
Professional fees | | | 551,236 | |
Registration | | | 388,940 | |
Trustees | | | 255,126 | |
Custodian | | | 49,836 | |
Shareholder service (See Note 3) | | | 10,668 | |
Miscellaneous | | | 409,437 | |
| | | | |
Total expenses | | | 92,312,138 | |
| | | | |
Net investment income (loss) | | | 548,987,599 | |
| | | | |
|
| Realized and Unrealized Gain (Loss) on Investments | |
Net realized gain (loss) on investments | | | 72,799,100 | |
Net change in unrealized appreciation (depreciation) on investments | | | 66,411,721 | |
| | | | |
Net realized and unrealized gain (loss) on investments | | | 139,210,821 | |
| | | | |
Net increase (decrease) in net assets resulting from operations | | $ | 688,198,420 | |
| | | | |
| | | | | | |
The notes to the financial statements are an integral part of,
and should be read in conjunction with, the financial statements. | | | | | 25 | |
Statements of Changes in Net Assets
for the years ended October 31, 2017 and October 31, 2016
| | | | | | | | |
| | | 2017 | | | 2016 | |
| Increase (Decrease) in Net Assets | |
Operations: | | | | | | | | |
Net investment income (loss) | | $ | 548,987,599 | | | $ | 550,763,289 | |
Net realized gain (loss) on investments and foreign currency transactions | | | 72,799,100 | | | | (176,341,240 | ) |
Net change in unrealized appreciation (depreciation) on investments | | | 66,411,721 | | | | 497,852,071 | |
| | | | |
Net increase (decrease) in net assets resulting from operations | | | 688,198,420 | | | | 872,274,120 | |
| | | | |
Dividends to shareholders: | | | | | | | | |
From net investment income: | | | | | | | | |
Class A | | | (191,741,233 | ) | | | (200,856,443 | ) |
Investor Class | | | (14,209,393 | ) | | | (16,834,723 | ) |
Class B | | | (5,575,422 | ) | | | (6,779,447 | ) |
Class C | | | (32,240,202 | ) | | | (33,383,656 | ) |
Class I | | | (289,948,747 | ) | | | (298,724,674 | ) |
Class R1 | | | (2,677 | ) | | | (2,849 | ) |
Class R2 | | | (537,905 | ) | | | (563,018 | ) |
Class R3 | | | (13,936 | ) | | | (3,132 | ) |
Class R6 | | | (18,838,061 | ) | | | (1,932,527 | ) |
| | | | |
| | | (553,107,576 | ) | | | (559,080,469 | ) |
| | | | |
Return of capital: | | | | | | | | |
Class A | | | (31,015,011 | ) | | | (14,079,363 | ) |
Investor Class | | | (2,298,433 | ) | | | (1,171,791 | ) |
Class B | | | (901,850 | ) | | | (550,202 | ) |
Class C | | | (5,214,999 | ) | | | (2,721,786 | ) |
Class I | | | (46,900,521 | ) | | | (20,070,724 | ) |
Class R1 | | | (433 | ) | | | (200 | ) |
Class R2 | | | (87,009 | ) | | | (39,656 | ) |
Class R3 | | | (2,254 | ) | | | (283 | ) |
Class R6 | | | (3,047,141 | ) | | | (140,193 | ) |
| | | | |
| | | (89,467,651 | ) | | | (38,774,198 | ) |
| | | | |
Total dividends to shareholders | | | (642,575,227 | ) | | | (597,854,667 | ) |
| | | | |
Capital share transactions: | | | | | | | | |
Net proceeds from sale of shares (a) | | | 4,854,487,899 | | | | 3,245,684,029 | |
Net asset value of shares issued in connection with the acquisition of MainStay High Yield Opportunities Fund | | | 317,232,064 | | | | — | |
Net asset value of shares issued to shareholders in reinvestment of dividends and distributions | | | 586,154,449 | | | | 541,478,631 | |
Cost of shares redeemed | | | (5,451,117,279 | ) | | | (3,369,343,971 | ) |
| | | | |
Increase (decrease) in net assets derived from capital share transactions | | | 306,757,133 | | | | 417,818,689 | |
| | | | |
Net increase (decrease) in net assets | | | 352,380,326 | | | | 692,238,142 | |
| | | | | | | | |
| | | 2017 | | | 2016 | |
| Net Assets | | | | | | | | |
Beginning of year | | | 10,028,312,543 | | | | 9,336,074,401 | |
| | | | |
End of year | | $ | 10,380,692,869 | | | $ | 10,028,312,543 | |
| | | | |
Distributions in excess of net investment income at end of year | | $ | (11,523,635 | ) | | $ | (9,109,811 | ) |
| | | | |
| (a) | Includes in-kind subscriptions in the amount of $11,683,015 during the year ended October 31, 2017. (See Note 11) |
| | | | |
| 26 | | MainStay High Yield Corporate Bond Fund | | The notes to the financial statements are an integral part of,
and should be read in conjunction with, the financial statements. |
Financial Highlights selected per share data and ratios
| | | | | | | | | | | | | | | | | | | | |
| | | Year ended October 31, | |
| Class A | | 2017 | | | 2016 | | | 2015 | | | 2014 | | | 2013 | |
Net asset value at beginning of year | | $ | 5.74 | | | $ | 5.57 | | | $ | 5.93 | | | $ | 6.08 | | | $ | 6.08 | |
| | | | | | | | | | | | | | | | | | | | |
Net investment income (loss) (a) | | | 0.30 | | | | 0.33 | | | | 0.31 | | | | 0.34 | | | | 0.36 | |
Net realized and unrealized gain (loss) on investments | | | 0.09 | | | | 0.20 | | | | (0.31 | ) | | | (0.09 | ) | | | 0.06 | |
Net realized and unrealized gain (loss) on foreign currency transactions | | | — | | | | 0.00 | ‡ | | | — | | | | — | | | | — | |
| | | | | | | | | | | | | | | | | | | | |
Total from investment operations | | | 0.39 | | | | 0.53 | | | | 0.00 | ‡ | | | 0.25 | | | | 0.42 | |
| | | | | | | | | | | | | | | | | | | | |
| Less dividends and distributions: | | | | | | | | | | | | | | | | | | | | |
From net investment��income | | | (0.31 | ) | | | (0.34 | ) | | | (0.31 | ) | | | (0.40 | ) | | | (0.42 | ) |
Return of capital | | | (0.05 | ) | | | (0.02 | ) | | | (0.05 | ) | | | — | | | | — | |
| | | | | | | | | | | | | | | | | | | | |
Total dividends and distributions | | | (0.36 | ) | | | (0.36 | ) | | | (0.36 | ) | | | (0.40 | ) | | | (0.42 | ) |
| | | | | | | | | | | | | | | | | | | | |
Net asset value at end of year | | $ | 5.77 | | | $ | 5.74 | | | $ | 5.57 | | | $ | 5.93 | | | $ | 6.08 | |
| | | | | | | | | | | | | | | | | | | | |
Total investment return (b) | | | 6.91 | % | | | 9.96 | % | | | 0.06 | % | | | 4.14 | % | | | 7.15 | % |
| Ratios (to average net assets)/Supplemental Data: | | | | | | | | | | | | | | | | | | | | |
Net investment income (loss) | | | 5.25 | % | | | 5.98 | % | | | 5.45 | % | | | 5.52 | % | | | 5.89 | % |
Net expenses | | | 0.97 | % | | | 0.95 | % | | | 0.96 | % | | | 0.99 | % | | | 1.01 | % |
Portfolio turnover rate | | | 43 | % | | | 41 | % | | | 38 | % | | | 41 | % | | | 40 | % |
Net assets at end of year (in 000’s) | | $ | 3,683,113 | | | $ | 3,551,864 | | | $ | 3,364,517 | | | $ | 3,678,466 | | | $ | 4,055,185 | |
| ‡ | Less than one cent per share. |
| (a) | Per share data based on average shares outstanding during the year. |
| (b) | Total investment return is calculated exclusive of sales charges and assumes the reinvestment of dividends and distributions. For periods of less than one year, total return is not annualized. |
| | | | | | | | | | | | | | | | | | | | |
| | | Year ended October 31, | |
| Investor Class | | 2017 | | | 2016 | | | 2015 | | | 2014 | | | 2013 | |
Net asset value at beginning of year | | $ | 5.79 | | | $ | 5.62 | | | $ | 5.99 | | | $ | 6.14 | | | $ | 6.13 | |
| | | | | | | | | | | | | | | | | | | | |
Net investment income (loss) (a) | | | 0.30 | | | | 0.33 | | | | 0.31 | | | | 0.34 | | | | 0.36 | |
Net realized and unrealized gain (loss) on investments | | | 0.09 | | | | 0.20 | | | | (0.31 | ) | | | (0.09 | ) | | | 0.07 | |
Net realized and unrealized gain (loss) on foreign currency transactions | | | — | | | | 0.00 | ‡ | | | — | | | | — | | | | — | |
| | | | | | | | | | | | | | | | | | | | |
Total from investment operations | | | 0.39 | | | | 0.53 | | | | (0.00 | )‡ | | | 0.25 | | | | 0.43 | |
| | | | | | | | | | | | | | | | | | | | |
| Less dividends and distributions: | | | | | | | | | | | | | | | | | | | | |
From net investment income | | | (0.31 | ) | | | (0.34 | ) | | | (0.32 | ) | | | (0.40 | ) | | | (0.42 | ) |
Return of capital | | | (0.05 | ) | | | (0.02 | ) | | | (0.05 | ) | | | — | | | | — | |
| | | | | | | | | | | | | | | | | | | | |
Total dividends and distributions | | | (0.36 | ) | | | (0.36 | ) | | | (0.37 | ) | | | (0.40 | ) | | | (0.42 | ) |
| | | | | | | | | | | | | | | | | | | | |
Net asset value at end of year | | $ | 5.82 | | | $ | 5.79 | | | $ | 5.62 | | | $ | 5.99 | | | $ | 6.14 | |
| | | | | | | | | | | | | | | | | | | | |
Total investment return (b) | | | 6.90 | % | | | 9.91 | % | | | (0.07 | %) | | | 4.13 | % | | | 7.24 | % |
| Ratios (to average net assets)/Supplemental Data: | | | | | | | | | | | | | | | | | | | | |
Net investment income (loss) | | | 5.21 | % | | | 5.90 | % | | | 5.39 | % | | | 5.50 | % | | | 5.88 | % |
Net expenses | | | 1.02 | % | | | 1.03 | % | | | 1.02 | % | | | 1.01 | % | | | 1.02 | % |
Portfolio turnover rate | | | 43 | % | | | 41 | % | | | 38 | % | | | 41 | % | | | 40 | % |
Net assets at end of year (in 000’s) | | $ | 167,139 | | | $ | 287,493 | | | $ | 282,451 | | | $ | 296,535 | | | $ | 307,643 | |
| ‡ | Less than one cent per share. |
| (a) | Per share data based on average shares outstanding during the year. |
| (b) | Total investment return is calculated exclusive of sales charges and assumes the reinvestment of dividends and distributions. For periods of less than one year, total return is not annualized. |
| | | | | | |
The notes to the financial statements are an integral part of,
and should be read in conjunction with, the financial statements. | | | | | 27 | |
Financial Highlights selected per share data and ratios
| | | | | | | | | | | | | | | | | | | | |
| | | Year ended October 31, | |
| Class B | | 2017 | | | 2016 | | | 2015 | | | 2014 | | | 2013 | |
Net asset value at beginning of year | | $ | 5.71 | | | $ | 5.54 | | | $ | 5.90 | | | $ | 6.05 | | | $ | 6.05 | |
| | | | | | | | | | | | | | | | | | | | |
Net investment income (loss) (a) | | | 0.26 | | | | 0.28 | | | | 0.27 | | | | 0.29 | | | | 0.31 | |
Net realized and unrealized gain (loss) on investments | | | 0.08 | | | | 0.20 | | | | (0.32 | ) | | | (0.09 | ) | | | 0.06 | |
Net realized and unrealized gain (loss) on foreign currency transactions | | | — | | | | 0.00 | ‡ | | | — | | | | — | | | | — | |
| | | | | | | | | | | | | | | | | | | | |
Total from investment operations | | | 0.34 | | | | 0.48 | | | | (0.05 | ) | | | 0.20 | | | | 0.37 | |
| | | | | | | | | | | | | | | | | | | | |
| Less dividends and distributions: | | | | | | | | | | | | | | | | | | | | |
From net investment income | | | (0.27 | ) | | | (0.29 | ) | | | (0.26 | ) | | | (0.35 | ) | | | (0.37 | ) |
Return of capital | | | (0.04 | ) | | | (0.02 | ) | | | (0.05 | ) | | | — | | | | — | |
| | | | | | | | | | | | | | | | | | | | |
Total dividends and distributions | | | (0.31 | ) | | | (0.31 | ) | | | (0.31 | ) | | | (0.35 | ) | | | (0.37 | ) |
| | | | | | | | | | | | | | | | | | | | |
Net asset value at end of year | | $ | 5.74 | | | $ | 5.71 | | | $ | 5.54 | | | $ | 5.90 | | | $ | 6.05 | |
| | | | | | | | | | | | | | | | | | | | |
Total investment return (b) | | | 6.06 | % | | | 8.85 | % | | | (0.60 | %) | | | 3.35 | % | | | 6.36 | % |
| Ratios (to average net assets)/Supplemental Data: | | | | | | | | | | | | | | | | | | | | |
Net investment income (loss) | | | 4.47 | % | | | 5.16 | % | | | 4.64 | % | | | 4.75 | % | | | 5.13 | % |
Net expenses | | | 1.77 | % | | | 1.78 | % | | | 1.77 | % | | | 1.76 | % | | | 1.77 | % |
Portfolio turnover rate | | | 43 | % | | | 41 | % | | | 38 | % | | | 41 | % | | | 40 | % |
Net assets at end of year (in 000’s) | | $ | 108,263 | | | $ | 132,509 | | | $ | 139,683 | | | $ | 172,640 | | | $ | 197,273 | |
| ‡ | Less than one cent per share. |
| (a) | Per share data based on average shares outstanding during the year. |
| (b) | Total investment return is calculated exclusive of sales charges and assumes the reinvestment of dividends and distributions. For periods of less than one year, total return is not annualized. |
| | | | | | | | | | | | | | | | | | | | |
| | | Year ended October 31, | |
| Class C | | 2017 | | | 2016 | | | 2015 | | | 2014 | | | 2013 | |
Net asset value at beginning of year | | $ | 5.72 | | | $ | 5.55 | | | $ | 5.90 | | | $ | 6.05 | | | $ | 6.05 | |
| | | | | | | | | | | | | | | | | | | | |
Net investment income (loss) (a) | | | 0.26 | | | | 0.28 | | | | 0.27 | | | | 0.29 | | | | 0.31 | |
Net realized and unrealized gain (loss) on investments | | | 0.07 | | | | 0.20 | | | | (0.31 | ) | | | (0.09 | ) | | | 0.06 | |
Net realized and unrealized gain (loss) on foreign currency transactions | | | — | | | | 0.00 | ‡ | | | — | | | | — | | | | — | |
| | | | | | | | | | | | | | | | | | | | |
Total from investment operations | | | 0.33 | | | | 0.48 | | | | (0.04 | ) | | | 0.20 | | | | 0.37 | |
| | | | | | | | | | | | | | | | | | | | |
| Less dividends and distributions: | | | | | | | | | | | | | | | | | | | | |
From net investment income | | | (0.27 | ) | | | (0.29 | ) | | | (0.26 | ) | | | (0.35 | ) | | | (0.37 | ) |
Return of capital | | | (0.04 | ) | | | (0.02 | ) | | | (0.05 | ) | | | — | | | | — | |
| | | | | | | | | | | | | | | | | | | | |
Total dividends and distributions | | | (0.31 | ) | | | (0.31 | ) | | | (0.31 | ) | | | (0.35 | ) | | | (0.37 | ) |
| | | | | | | | | | | | | | | | | | | | |
Net asset value at end of year | | $ | 5.74 | | | $ | 5.72 | | | $ | 5.55 | | | $ | 5.90 | | | $ | 6.05 | |
| | | | | | | | | | | | | | | | | | | | |
Total investment return (b) | | | 5.87 | % | | | 9.04 | % | | | (0.60 | %) | | | 3.34 | % | | | 6.36 | % |
| Ratios (to average net assets)/Supplemental Data: | | | | | | | | | | | | | | | | | | | | |
Net investment income (loss) | | | 4.45 | % | | | 5.15 | % | | | 4.64 | % | | | 4.75 | % | | | 5.13 | % |
Net expenses | | | 1.77 | % | | | 1.78 | % | | | 1.77 | % | | | 1.76 | % | | | 1.77 | % |
Portfolio turnover rate | | | 43 | % | | | 41 | % | | | 38 | % | | | 41 | % | | | 40 | % |
Net assets at end of year (in 000’s) | | $ | 676,463 | | | $ | 678,364 | | | $ | 679,392 | | | $ | 785,873 | | | $ | 814,589 | |
| ‡ | Less than one cent per share. |
| (a) | Per share data based on average shares outstanding during the year. |
| (b) | Total investment return is calculated exclusive of sales charges and assumes the reinvestment of dividends and distributions. For periods of less than one year, total return is not annualized. |
| | | | |
| 28 | | MainStay High Yield Corporate Bond Fund | | The notes to the financial statements are an integral part of,
and should be read in conjunction with, the financial statements. |
Financial Highlights selected per share data and ratios
| | | | | | | | | | | | | | | | | | | | |
| | | Year ended October 31, | |
| Class I | | 2017 | | | 2016 | | | 2015 | | | 2014 | | | 2013 | |
Net asset value at beginning of year | | $ | 5.75 | | | $ | 5.58 | | | $ | 5.94 | | | $ | 6.08 | | | $ | 6.08 | |
| | | | | | | | | | | | | | | | | | | | |
Net investment income (loss) (a) | | | 0.32 | | | | 0.34 | | | | 0.33 | | | | 0.35 | | | | 0.37 | |
Net realized and unrealized gain (loss) on investments | | | 0.08 | | | | 0.20 | | | | (0.31 | ) | | | (0.08 | ) | | | 0.07 | |
Net realized and unrealized gain (loss) on foreign currency transactions | | | — | | | | 0.00 | ‡ | | | — | | | | — | | | | — | |
| | | | | | | | | | | | | | | | | | | | |
Total from investment operations | | | 0.40 | | | | 0.54 | | | | 0.02 | | | | 0.27 | | | | 0.44 | |
| | | | | | | | | | | | | | | | | | | | |
| Less dividends and distributions: | | | | | | | | | | | | | | | | | | | | |
From net investment income | | | (0.32 | ) | | | (0.35 | ) | | | (0.33 | ) | | | (0.41 | ) | | | (0.44 | ) |
Return of capital | | | (0.05 | ) | | | (0.02 | ) | | | (0.05 | ) | | | — | | | | — | |
| | | | | | | | | | | | | | | | | | | | |
Total dividends and distributions | | | (0.37 | ) | | | (0.37 | ) | | | (0.38 | ) | | | (0.41 | ) | | | (0.44 | ) |
| | | | | | | | | | | | | | | | | | | | |
Net asset value at end of year | | $ | 5.78 | | | $ | 5.75 | | | $ | 5.58 | | | $ | 5.94 | | | $ | 6.08 | |
| | | | | | | | | | | | | | | | | | | | |
Total investment return (b) | | | 7.17 | % | | | 10.23 | % | | | 0.32 | % | | | 4.58 | % | | | 7.40 | % |
| Ratios (to average net assets)/Supplemental Data: | | | | | | | | | | | | | | | | | | | | |
Net investment income (loss) | | | 5.51 | % | | | 6.23 | % | | | 5.70 | % | | | 5.76 | % | | | 6.13 | % |
Net expenses | | | 0.72 | % | | | 0.70 | % | | | 0.71 | % | | | 0.74 | % | | | 0.76 | % |
Portfolio turnover rate | | | 43 | % | | | 41 | % | | | 38 | % | | | 41 | % | | | 40 | % |
Net assets at end of year (in 000’s) | | $ | 4,067,560 | | | $ | 5,313,266 | | | $ | 4,844,891 | | | $ | 3,762,169 | | | $ | 3,393,780 | |
| ‡ | Less than one cent per share. |
| (a) | Per share data based on average shares outstanding during the year. |
| (b) | Total investment return is calculated exclusive of sales charges and assumes the reinvestment of dividends and distributions. Class I shares are not subject to sales charges. For periods of less than one year, total return is not annualized. |
| | | | | | | | | | | | | | | | | | | | |
| | | Year ended October 31, | |
| Class R1 | | 2017 | | | 2016 | | | 2015 | | | 2014 | | | 2013 | |
Net asset value at beginning of year | | $ | 5.74 | | | $ | 5.57 | | | $ | 5.93 | | | $ | 6.08 | | | $ | 6.08 | |
| | | | | | | | | | | | | | | | | | | | |
Net investment income (loss) (a) | | | 0.32 | | | | 0.34 | | | | 0.32 | | | | 0.34 | | | | 0.37 | |
Net realized and unrealized gain (loss) on investments | | | 0.07 | | | | 0.19 | | | | (0.31 | ) | | | (0.08 | ) | | | 0.06 | |
Net realized and unrealized gain (loss) on foreign currency transactions | | | — | | | | 0.00 | ‡ | | | — | | | | — | | | | — | |
| | | | | | | | | | | | | | | �� | | | | | |
Total from investment operations | | | 0.39 | | | | 0.53 | | | | 0.01 | | | | 0.26 | | | | 0.43 | |
| | | | | | | | | | | | | | | | | | | | |
| Less dividends and distributions: | | | | | | | | | | | | | | | | | | | | |
From net investment income | | | (0.31 | ) | | | (0.34 | ) | | | (0.32 | ) | | | (0.41 | ) | | | (0.43 | ) |
Return of capital | | | (0.05 | ) | | | (0.02 | ) | | | (0.05 | ) | | | — | | | | — | |
| | | | | | | | | | | | | | | | | | | | |
Total dividends and distributions | | | (0.36 | ) | | | (0.36 | ) | | | (0.37 | ) | | | (0.41 | ) | | | (0.43 | ) |
| | | | | | | | | | | | | | | | | | | | |
Net asset value at end of year | | $ | 5.77 | | | $ | 5.74 | | | $ | 5.57 | | | $ | 5.93 | | | $ | 6.08 | |
| | | | | | | | | | | | | | | | | | | | |
Total investment return (b) | | | 7.07 | % | | | 10.13 | % | | | 0.21 | % | | | 4.31 | % | | | 7.32 | % |
| Ratios (to average net assets)/Supplemental Data: | | | | | | | | | | | | | | | | | | | | |
Net investment income (loss) | | | 5.48 | % | | | 6.11 | % | | | 5.60 | % | | | 5.66 | % | | | 6.03 | % |
Net expenses | | | 0.82 | % | | | 0.80 | % | | | 0.81 | % | | | 0.84 | % | | | 0.86 | % |
Portfolio turnover rate | | | 43 | % | | | 41 | % | | | 38 | % | | | 41 | % | | | 40 | % |
Net assets at end of year (in 000’s) | | $ | 37 | | | $ | 59 | | | $ | 39 | | | $ | 29 | | | $ | 28 | |
| ‡ | Less than one cent per share. |
| (a) | Per share data based on average shares outstanding during the period. |
| (b) | Total investment return is calculated exclusive of sales charges and assumes the reinvestment of dividends and distributions. Class R1 shares are not subject to sales charges. For periods of less than one year, total return is not annualized. |
| | | | | | |
The notes to the financial statements are an integral part of,
and should be read in conjunction with, the financial statements. | | | | | 29 | |
Financial Highlights selected per share data and ratios
| | | | | | | | | | | | | | | | | | | | |
| | | Year ended October 31, | |
| Class R2 | | 2017 | | | 2016 | | | 2015 | | | 2014 | | | 2013 | |
Net asset value at beginning of year | | $ | 5.74 | | | $ | 5.57 | | | $ | 5.93 | | | $ | 6.08 | | | $ | 6.08 | |
| | | | | | | | | | | | | | | | | | | | |
Net investment income (loss) (a) | | | 0.30 | | | | 0.32 | | | | 0.31 | | | | 0.33 | | | | 0.35 | |
Net realized and unrealized gain (loss) on investments | | | 0.08 | | | | 0.20 | | | | (0.31 | ) | | | (0.09 | ) | | | 0.07 | |
Net realized and unrealized gain (loss) on foreign currency transactions | | | — | | | | 0.00 | ‡ | | | — | | | | — | | | | — | |
| | | | | | | | | | | | | | | | | | | | |
Total from investment operations | | | 0.38 | | | | 0.52 | | | | (0.00 | )‡ | | | 0.24 | | | | 0.42 | |
| | | | | | | | | | | | | | | | | | | | |
| Less dividends and distributions: | | | | | | | | | | | | | | | | | | | | |
From net investment income | | | (0.30 | ) | | | (0.33 | ) | | | (0.31 | ) | | | (0.39 | ) | | | (0.42 | ) |
Return of capital | | | (0.05 | ) | | | (0.02 | ) | | | (0.05 | ) | | | — | | | | — | |
| | | | | | | | | | | | | | | | | | | | |
Total dividends and distributions | | | (0.35 | ) | | | (0.35 | ) | | | (0.36 | ) | | | (0.39 | ) | | | (0.42 | ) |
| | | | | | | | | | | | | | | | | | | | |
Net asset value at end of year | | $ | 5.77 | | | $ | 5.74 | | | $ | 5.57 | | | $ | 5.93 | | | $ | 6.08 | |
| | | | | | | | | | | | | | | | | | | | |
Total investment return (b) | | | 6.80 | % | | | 9.83 | % | | | (0.04 | %) | | | 4.04 | % | | | 7.06 | % |
| Ratios (to average net assets)/Supplemental Data: | | | | | | | | | | | | | | | | | | | | |
Net investment income (loss) | | | 5.16 | % | | | 5.89 | % | | | 5.35 | % | | | 5.43 | % | | | 5.79 | % |
Net expenses | | | 1.07 | % | | | 1.05 | % | | | 1.06 | % | | | 1.09 | % | | | 1.11 | % |
Portfolio turnover rate | | | 43 | % | | | 41 | % | | | 38 | % | | | 41 | % | | | 40 | % |
Net assets at end of year (in 000’s) | | $ | 9,562 | | | $ | 10,917 | | | $ | 10,084 | | | $ | 11,049 | | | $ | 15,008 | |
| ‡ | Less than one cent per share. |
| (a) | Per share data based on average shares outstanding during the year. |
| (b) | Total investment return is calculated exclusive of sales charges and assumes the reinvestment of dividends and distributions. Class R2 shares are not subject to sales charges. For periods of less than one year, total return is not annualized. |
| | | | | | | | | | | | | | | | | | | | |
| Class R3 | | Year ended
October 31,
2017 | | | February 29,
2016**
through
October 31,
2016 | | | | | | | | | | |
Net asset value at beginning of period | | $ | 5.74 | | | $ | 5.17 | | | | | | | | | | | | | |
| | | | | | | | | | | | | | | | | | | | |
Net investment income (loss) (a) | | | 0.28 | | | | 0.20 | | | | | | | | | | | | | |
Net realized and unrealized gain (loss) on investments | | | 0.09 | | | | 0.60 | | | | | | | | | | | | | |
| | | | | | | | | | | | | | | | | | | | |
Total from investment operations | | | 0.37 | | | | 0.80 | | | | | | | | | | | | | |
| | | | | | | | | | | | | | | | | | | | |
| Less dividends and distributions: | | | | | | | | | | | | | | | | | | | | |
From net investment income | | | (0.29 | ) | | | (0.21 | ) | | | | | | | | | | | | |
Return of capital | | | (0.05 | ) | | | (0.02 | ) | | | | | | | | | | | | |
| | | | | | | | | | | | | | | | | | | | |
Total dividends and distributions | | | (0.34 | ) | | | (0.23 | ) | | | | | | | | | | | | |
| | | | | | | | | | | | | | | | | | | | |
Net asset value at end of period | | $ | 5.77 | | | $ | 5.74 | | | | | | | | | | | | | |
| | | | | | | | | | | | | | | | | | | | |
Total investment return (b) | | | 6.58 | % | | | 15.59 | % | | | | | | | | | | | | |
| Ratios (to average net assets)/Supplemental Data: | | | | | | | | | | | | | | | | | | | | |
Net investment income (loss) | | | 4.81 | % | | | 5.40 | %†† | | | | | | | | | | | | |
Net expenses | | | 1.32 | % | | | 1.30 | %†† | | | | | | | | | | | | |
Portfolio turnover rate | | | 43 | % | | | 41 | % | | | | | | | | | | | | |
Net assets at end of period (in 000’s) | | $ | 392 | | | $ | 130 | | | | | | | | | | | | | |
| (a) | Per share data based on average shares outstanding during the period. |
| (b) | Total investment return is calculated exclusive of sales charges and assumes the reinvestment of dividends and distributions. Class R3 shares are not subject to sales charges. For periods of less than one year, total return is not annualized. |
| | | | |
| 30 | | MainStay High Yield Corporate Bond Fund | | The notes to the financial statements are an integral part of,
and should be read in conjunction with, the financial statements. |
Financial Highlights selected per share data and ratios
| | | | | | | | | | | | | | | | | | | | |
| | | Year ended October 31, | | | June 17,
2013**
through
October 31, | |
| Class R6 | | 2017 | | | 2016 | | | 2015 | | | 2014 | | | 2013 | |
Net asset value at beginning of period | | $ | 5.74 | | | $ | 5.58 | | | $ | 5.94 | | | $ | 6.09 | | | $ | 6.11 | |
| | | | | | | | | | | | | | | | | | | | |
Net investment income (loss) (a) | | | 0.32 | | | | 0.35 | | | | 0.34 | | | | 0.36 | | | | 0.14 | |
Net realized and unrealized gain (loss) on investments | | | 0.09 | | | | 0.19 | | | | (0.31 | ) | | | (0.08 | ) | | | 0.03 | |
| | | | | | | | | | | | | | | | | | | | |
Total from investment operations | | | 0.41 | | | | 0.54 | | | | 0.03 | | | | 0.28 | | | | 0.17 | |
| | | | | | | | | | | | | | | | | | | | |
| Less dividends and distributions: | | | | | | | | | | | | | | | | | | | | |
From net investment income | | | (0.33 | ) | | | (0.36 | ) | | | (0.34 | ) | | | (0.43 | ) | | | (0.19 | ) |
Return of capital | | | (0.05 | ) | | | (0.02 | ) | | | (0.05 | ) | | | — | | | | — | |
| | | | | | | | | | | | | | | | | | | | |
Total dividends and distributions | | | (0.38 | ) | | | (0.38 | ) | | | (0.39 | ) | | | (0.43 | ) | | | (0.19 | ) |
| | | | | | | | | | | | | | | | | | | | |
Net asset value at end of period | | $ | 5.77 | | | $ | 5.74 | | | $ | 5.58 | | | $ | 5.94 | | | $ | 6.09 | |
| | | | | | | | | | | | | | | | | | | | |
Total investment return (b) | | | 7.36 | % | | | 10.24 | % | | | 0.50 | % | | | 4.60 | % | | | 2.79 | % |
| Ratios (to average net assets)/Supplemental Data: | | | | | | | | | | | | | | | | | | | | |
Net investment income (loss) | | | 5.45 | % | | | 6.23 | % | | | 5.84 | % | | | 5.88 | % | | | 6.24 | %†† |
Net expenses | | | 0.58 | % | | | 0.58 | % | | | 0.58 | % | | | 0.58 | % | | | 0.59 | %†† |
Portfolio turnover rate | | | 43 | % | | | 41 | % | | | 38 | % | | | 41 | % | | | 40 | % |
Net assets at end of period (in 000’s) | | $ | 1,668,163 | | | $ | 53,712 | | | $ | 15,017 | | | $ | 9,093 | | | $ | 26 | |
| (a) | Per share data based on average shares outstanding during the period. |
| (b) | Total investment return is calculated exclusive of sales charges and assumes the reinvestment of dividends and distributions. Class R6 shares are not subject to sales charges. For periods of less than one year, total return is not annualized. |
| | | | | | |
The notes to the financial statements are an integral part of,
and should be read in conjunction with, the financial statements. | | | | | 31 | |
Notes to Financial Statements
Note 1–Organization and Business
The MainStay Funds (the “Trust”) was organized on January 9, 1986, as a Massachusetts business trust and is governed by a Declaration of Trust. The Trust is registered under the Investment Company Act of 1940, as amended (the “1940 Act”), as an open-end management investment company, and is comprised of twelve funds (collectively referred to as the “Funds”). These financial statements and notes relate to the MainStay High Yield Corporate Bond Fund (the “Fund”), a “diversified” fund, as that term is defined in the 1940 Act, as interpreted or modified by regulatory authorities having jurisdiction, from time to time.
The Fund currently has ten classes of shares registered for sale. Class A shares commenced operations on January 3, 1995. Class B shares commenced operations on May 1, 1986. Class C shares commenced operations on September 1, 1998. Class I shares commenced operations on January 2, 2004. Class R2 shares were first offered to the public on December 14, 2007, but did not commence operations until May 1, 2008. Investor Class shares commenced operations on February 28, 2008. Class R1 shares commenced operations on June 29, 2012. Class R6 shares commenced operations on June 17, 2013. Class R3 shares commenced operations on February 29, 2016. Class T shares of the Fund were registered for sale effective as of February 28, 2017. As of October 31, 2017, Class T shares were not yet offered for sale.
Effective February 28, 2017, Class B shares of the MainStay Group of Funds were closed to all new purchases as well as additional investments by existing Class B shareholders. Existing Class B shareholders may continue to reinvest dividends and capital gains distributions, as well as exchange their Class B shares for Class B shares of other MainStay Group of Funds as permitted by the current exchange privileges. Class B shareholders continue to be subject to any applicable contingent deferred sales charge (“CDSC”) at the time of redemption. All other features of the Class B shares, including but not limited to the fees and expenses applicable to Class B shares, remain unchanged. Unless redeemed, Class B shareholders will remain in Class B shares of their respective fund until the Class B shares are converted to Class A or Investor Class shares pursuant to the applicable conversion schedule.
Class A and Investor Class shares are offered at net asset value (“NAV”) per share plus an initial sales charge. No initial sales charge applies to investments of $1 million or more (and certain other qualified purchases) in Class A and Investor Class shares. Effective August 1, 2017, a CDSC of 1.00% may be imposed on certain redemptions of Class A and Investor Class shares made within 18 months of the date of purchase on shares that were purchased without an initial sales charge. For purchases of Class A and Investor Class shares made from January 1, 2017 through July 31, 2017, a CDSC of 1.00% may be imposed on certain redemptions of such shares made within 24 months of the date of purchase on shares that were purchased without an initial sales charge. For purchases of Class A and Investor Class shares made prior to January 1, 2017, a CDSC of 1.00% may be imposed on certain redemptions made within one year of the date of purchase on shares that were purchased without an initial sales charge. Class C shares are offered at NAV without an initial sales charge, although a 1.00% CDSC may be imposed on redemptions made within one year of the date of purchase of Class C shares. When Class B shares were offered, they
were offered at NAV without an initial sales charge, although a CDSC that declines depending on the number of years a shareholder has held its Class B shares may be imposed on redemptions made within six years of the date of purchase of such shares. Class I, Class R1, Class R2 and Class R3 and Class R6 shares are offered at NAV and are not subject to a sales charge. When available for sale, Class T shares are currently expected to be offered at NAV plus an initial sales charge. Depending upon eligibility, Class B shares convert to either Class A or Investor Class shares at the end of the calendar quarter eight years after the date they were purchased. Additionally, as disclosed in the Fund’s prospectus, Class A shares may convert automatically to Investor Class shares and Investor Class shares may convert automatically to Class A shares. Under certain circumstances and as may be permitted by the Trust’s multiple class plan pursuant to Rule 18f-3 under the 1940 Act, specified share classes of the Fund may be converted to one or more other share classes of the Fund as disclosed in the capital share transactions within these Notes. The classes of shares have the same voting (except for issues that relate solely to one class), dividend, liquidation and other rights, and the same terms and conditions, except that under distribution plans pursuant to Rule 12b-1 under the 1940 Act, Class B and Class C shares are subject to higher distribution and/or service fees than Class A, Investor Class, Class R2, Class R3 and Class T shares. Class I, Class R1 and Class R6 shares are not subject to a distribution and/or service fee. Class R1, Class R2 and Class R3 shares are subject to a shareholder service fee, which is in addition to fees paid under the distribution plans for Class R2 and Class R3 shares.
The Fund’s investment objective is to seek maximum current income through investment in a diversified portfolio of high-yield debt securities. Capital appreciation is a secondary objective.
Note 2–Significant Accounting Policies
The Fund is an investment company and accordingly follows the investment company accounting and reporting guidance of the Financial Accounting Standards Board (“FASB”) Accounting Standard Codification Topic 946 Financial Services—Investment Companies. The Fund prepares its financial statements in accordance with generally accepted accounting principles (“GAAP”) in the United States of America and follows the significant accounting policies described below.
(A) Securities Valuation. Investments are usually valued as of the close of regular trading on the New York Stock Exchange (the “Exchange”) (usually 4:00 p.m. Eastern time) on each day the Fund is open for business (“valuation date”).
The Board of Trustees of the Trust (the “Board”) adopted procedures establishing methodologies for the valuation of the Fund’s securities and other assets and delegated the responsibility for valuation determinations under those procedures to the Valuation Committee of the Trust (the “Valuation Committee”). The Board authorized the Valuation Committee to appoint a Valuation Subcommittee (the “Subcommittee”) to deal in the first instance with establishing the prices of securities for which market quotations are not readily available or the prices of which are not otherwise readily determinable under these procedures. The Subcommittee meets (in person, via electronic mail or via teleconference) on an as-needed basis. Subsequently, the Valuation Committee meets to ensure that actions taken by the Subcommittee were appropriate. The procedures state that, subject to the oversight of
| | |
| 32 | | MainStay High Yield Corporate Bond Fund |
the Board and unless otherwise noted, the responsibility for the day-to-day valuation of portfolio assets (including fair value measurements for the Fund’s assets and liabilities) rests with New York Life Investment Management LLC (“New York Life Investments” or the “Manager”), aided to whatever extent necessary by the Subadvisor (as defined in Note 3(A)).
To assess the appropriateness of security valuations, the Manager, the Subadvisor or the Fund’s third-party service provider, who is subject to oversight by the Manager, regularly compares prior day prices, prices on comparable securities and the sale prices to the prior and current day prices and challenges prices with changes exceeding certain tolerance levels with third-party pricing services or broker sources. For those securities valued through either a standardized fair valuation methodology or a fair valuation measurement, the Subcommittee deals in the first instance with such valuation and the Valuation Committee reviews and affirms, if appropriate, the reasonableness of the valuation based on such methodologies and measurements on a regular basis after considering information that is reasonably available and deemed relevant by the Valuation Committee. Any action taken by the Subcommittee with respect to the valuation of a portfolio security or other asset is submitted for review and ratification (if appropriate) to the Valuation Committee and the Board at the next regularly scheduled meeting.
“Fair value” is defined as the price the Fund would reasonably expect to receive upon selling an asset or liability in an orderly transaction to an independent buyer in the principal or most advantageous market for the asset or liability. Fair value measurements are determined within a framework that establishes a three-tier hierarchy which maximizes the use of observable market data and minimizes the use of unobservable inputs to establish a classification of fair value measurements for disclosure purposes. “Inputs” refer broadly to the assumptions that market participants would use in pricing the asset or liability, including assumptions about risk, such as the risk inherent in a particular valuation technique used to measure fair value using a pricing model and/or the risk inherent in the inputs for the valuation technique. Inputs may be observable or unobservable. Observable inputs reflect the assumptions market participants would use in pricing the asset or liability based on market data obtained from sources independent of the Fund. Unobservable inputs reflect the Fund’s own assumptions about the assumptions market participants would use in pricing the asset or liability based on the information available. The inputs or methodology used for valuing assets or liabilities may not be an indication of the risks associated with investing in those assets or liabilities. The three-tier hierarchy of inputs is summarized below.
| • | | Level 1—quoted prices in active markets for an identical asset or liability |
| • | | Level 2—other significant observable inputs (including quoted prices for a similar asset or liability in active markets, interest rates and yield curves, prepayment speeds, credit risk, etc.) |
| • | | Level 3—significant unobservable inputs (including the Fund’s own assumptions about the assumptions that market participants would use in measuring fair value of an asset or liability) |
The level of an asset or liability within the fair value hierarchy is based on the lowest level of an input, both individually and in the aggregate, that is significant to the fair value measurement. As of
October 31, 2017, the aggregate value by input level of the Fund’s assets and liabilities is included at the end of the Fund’s Portfolio of Investments.
The Fund may use third-party vendor evaluations, whose prices may be derived from one or more of the following standard inputs, among others:
| | |
• Benchmark yields | | • Reported trades |
• Broker/dealer quotes | | • Issuer spreads |
• Two-sided markets | | • Benchmark securities |
• Bids/offers | | • Reference data (corporate actions or material event notices) |
• Industry and economic events | | • Comparable bonds |
• Monthly payment information | | |
An asset or liability for which market values cannot be measured using the methodologies described above is valued by methods deemed reasonable in good faith by the Valuation Committee, following the procedures established by the Board, to represent fair value. Under these procedures, the Fund generally uses a market-based approach which may use related or comparable assets or liabilities, recent transactions, market multiples, book values and other relevant information. The Fund may also use an income-based valuation approach in which the anticipated future cash flows of the asset or liability are discounted to calculate fair value. Discounts may also be applied due to the nature and/or duration of any restrictions on the disposition of the asset or liability. Fair value represents a good faith approximation of the value of a security. Fair value determinations involve the consideration of a number of subjective factors, an analysis of applicable facts and circumstances and the exercise of judgment. As a result, it is possible that the fair value for a security determined in good faith in accordance with the Fund’s valuation procedures may differ from valuations for the same security determined by other funds using their own valuation procedures. Although the Fund’s valuation procedures are designed to value a security at the price the Fund may reasonably expect to receive upon the security’s sale in an orderly transaction, there can be no assurance that any fair value determination thereunder would, in fact, approximate the amount that the Fund would actually realize upon the sale of the security or the price at which the security would trade if a reliable market price were readily available. During the year ended October 31, 2017, there were no material changes to the fair value methodologies.
Securities which may be valued in this manner include, but are not limited to: (i) a security for which trading has been halted or suspended; (ii) a debt security that has recently gone into default and for which there is not a current market quotation; (iii) a security of an issuer that has entered into a restructuring; (iv) a security that has been de-listed from a national exchange; (v) a security for which the market price is not readily available from a third-party pricing source or, if so provided, does not, in the opinion of the Manager or Subadvisor reflect the security’s market value; (vi) a security subject to trading collars for which no or limited trading takes place; and (vii) a security whose principal market has been temporarily closed at a time when, under normal conditions, it would be open. Securities for which market quotations or observable inputs are not readily available are generally categorized as Level 3 in
Notes to Financial Statements (continued)
the hierarchy. As of October 31, 2017, securities that were fair valued in such a manner are shown in the Portfolio of Investments.
Equity securities and shares of exchange-traded funds (“ETFs”) are valued at the last quoted sales prices as of the close of regular trading on the relevant exchange on each valuation date. Securities that are not traded on the valuation date are valued at the mean of the last quoted bid and ask prices. Prices are normally taken from the principal market in which each security trades. Investments in mutual funds, including money market funds, are valued at their respective NAVs as of the close of the Exchange on the valuation date. These securities are generally categorized as Level 1 in the hierarchy.
Debt securities (other than convertible and municipal bonds) are valued at the evaluated bid prices (evaluated mean prices in the case of convertible and municipal bonds) supplied by a pricing agent or broker selected by the Manager, in consultation with the Subadvisor. Those values reflect broker/dealer supplied prices and electronic data processing techniques, if the evaluated bid or mean prices are deemed by the Manager, in consultation with the Subadvisor, to be representative of market values at the regular close of trading of the Exchange on each valuation date. Debt securities purchased on a delayed delivery basis are marked to market daily until settlement at the forward settlement date. Debt securities, including corporate bonds, U.S. Government & federal agency bonds, municipal bonds, foreign bonds, convertible bonds, asset-backed securities and mortgage-backed securities are generally categorized as Level 2 in the hierarchy.
Loan assignments, participations and commitments are valued at the average of bid quotations obtained from the engaged independent pricing service and are generally categorized as Level 2 in the hierarchy. Certain loan assignments, participations and commitments may be valued by utilizing significant unobservable inputs obtained from the pricing service and are generally categorized as Level 3 in the hierarchy.
Temporary cash investments acquired in excess of 60 days to maturity at the time of purchase are valued using the latest bid prices or using valuations based on a matrix system (which considers such factors as security prices, yields, maturities and ratings), both as furnished by independent pricing services. Other temporary cash investments which mature in 60 days or less at the time of purchase (“Short-Term Investments”) are valued using the amortized cost method of valuation, unless the use of such method would be inappropriate. The amortized cost method involves valuing a security at its cost on the date of purchase and thereafter assuming a constant amortization to maturity of the difference between such cost and the value on maturity date. Amortized cost approximates the current fair value of a security. Securities valued using the amortized cost method are not valued using quoted prices in an active market and are generally categorized as Level 2 in the hierarchy.
The information above is not intended to reflect an exhaustive list of the methodologies that may be used to value portfolio investments. The valuation procedures permit the use of a variety of valuation methodologies in connection with valuing portfolio investments. The methodology used for a specific type of investment may vary based on the market data available or other considerations. The methodologies summarized above may not represent the specific means by which portfolio investments are valued on any particular business day.
The valuation techniques and significant amounts of unobservable inputs used in the fair valuation measurement of the Fund’s Level 3 securities are outlined in the table below. A significant increase or decrease in any of those inputs in isolation would result in a significantly higher or lower fair value measurement.
| | | | | | | | | | | | |
Asset
Class | | Fair Value
at 10/31/17* | | | Valuation
Technique | | Unobservable
Inputs | | Range | |
Convertible Bond | | $ | 54,577,221 | | | Market Approach | | Estimated Enterprise Value | | $ | 835.7m–$973.8m | |
| | | 10,662 | | | Income Approach | | Liquidity Discount | | | 100 bps | |
| | | | | | | | Subordiation Discount | | | 150 bps | |
Corporate Bonds | | | 80,579,460 | | | Income Approach | | Estimated Yield | | | 18.26 | % |
| | | | | | | | Spread Adjustment | | | 5.28 | % |
Common Stocks | | | 1,551,935 | | | Income Approach | | Liquidity Discount | | | 20.00 | % |
| | | 12,042,828 | | | Market Approach | | EBITDA Multiple | | | 5.75x | |
| | | | | | | | Discount Rate | | | 10.00 | % |
| | | | | | | | Estimated Enterprise Value | | $ | 835.7m–$973.8m | |
| | | | | | | | Estimated Volatility | | | 25.00 | % |
| | | | | | | | | | | | |
| | $ | 148,762,106 | | | | | | | | | |
| | | | | | | | | | | | |
| * | The table above does not include certain Level 3 investments that were valued by brokers without adjustment. As of October 31, 2017, the value of these investments was $36,736,219. The inputs for these investments were not readily available or cannot be reasonably estimated. |
A portfolio security or other asset may be determined to be illiquid under procedures approved by the Board. Illiquidity of a security might prevent the sale of such security at a time when the Manager or Subadvisor might wish to sell, and these securities could have the effect of decreasing the overall level of the Fund’s liquidity. Further, the lack of an established secondary market may make it more difficult to value illiquid securities, requiring the Fund to rely on judgments that may be somewhat subjective in measuring value, which could vary materially from the amount that the Fund may realize upon disposition. Difficulty in selling illiquid securities may result in a loss or may be costly to the Fund. Under the supervision of the Board, the Manager or Subadvisor determines the liquidity of the Fund’s investments; in doing so, the Manager or Subadvisor may consider various factors, including (i) the frequency of trades and quotations; (ii) the number of dealers and prospective purchasers; (iii) dealer undertakings to make a market; and (iv) the nature of the security and the market in which it trades (e.g., the time needed to dispose of the security, the method of soliciting offers and the mechanics of transfer). Illiquid securities are often valued in accordance with methods deemed by the Board in good faith to be reasonable and appropriate to accurately reflect their fair value. The liquidity of the Fund’s investments, as shown in the Portfolio of Investments, was determined as of October 31, 2017 and can change at any time in response to, among other relevant factors, market conditions or events or developments with respect to an individual issuer or instrument. As of October 31, 2017, securities deemed to be illiquid under procedures approved by the Board are shown in the Portfolio of Investments.
| | |
| 34 | | MainStay High Yield Corporate Bond Fund |
(B) Income Taxes. The Fund’s policy is to comply with the requirements of the Internal Revenue Code of 1986, as amended (the “Internal Revenue Code”), applicable to regulated investment companies and to distribute all of its taxable income to the shareholders of the Fund within the allowable time limits. Therefore, no federal, state and local income tax provisions are required.
Management evaluates the Fund’s tax positions to determine if the tax positions taken meet the minimum recognition threshold in connection with accounting for uncertainties in income tax positions taken or expected to be taken for the purposes of measuring and recognizing tax liabilities in the financial statements. Recognition of tax benefits of an uncertain tax position is permitted only to the extent the position is “more likely than not” to be sustained assuming examination by taxing authorities. Management has analyzed the Fund’s tax positions taken on federal, state and local income tax returns for all open tax years (for up to three tax years) and has concluded that no provisions for federal, state and local income tax are required in the Fund’s financial statements. The Fund’s federal, state and local income tax and federal excise tax returns for tax years for which the applicable statutes of limitations have not expired are subject to examination by the Internal Revenue Service and state and local departments of revenue.
(C) Dividends and Distributions to Shareholders. Dividends and distributions are recorded on the ex-dividend date. The Fund intends to declare and pay dividends from net investment income, if any, at least monthly and distributions from net realized capital and currency gains, if any, at least annually. Unless the shareholder elects otherwise, all dividends and distributions are reinvested in the same class of shares of the Fund, at NAV. Dividends and distributions to shareholders are determined in accordance with federal income tax regulations and may differ from determinations using GAAP.
(D) Security Transactions and Investment Income. The Fund records security transactions on the trade date. Realized gains and losses on security transactions are determined using the identified cost method. Dividend income is recognized on the ex-dividend date, net of any foreign tax withheld at the source, and interest income is accrued as earned using the effective interest rate method. Discounts and premiums on securities purchased, other than Short-Term Investments, for the Fund are accreted and amortized, respectively, on the effective interest rate method over the life of the respective securities. Discounts and premiums on Short-Term Investments are accreted and amortized, respectively, on the straight-line method. The straight-line method approximates the effective interest method for Short-Term Investments. Income from payment-in-kind securities is accreted daily based on the effective interest method.
Investment income and realized and unrealized gains and losses on investments of the Fund are allocated pro rata to separate classes of shares based upon their relative net assets on the date the income is earned or realized and unrealized gains and losses are incurred.
The Fund may place a debt security on non-accrual status and reduce related interest income by ceasing current accruals and writing off all or a portion of any interest receivables when the collection of all or a portion of such interest has become doubtful. A debt security is removed from non-accrual status when the issuer resumes interest payments or when collectability of interest is reasonably assured.
(E) Expenses. Expenses of the Trust are allocated to the individual Funds in proportion to the net assets of the respective Funds when the expenses are incurred, except where direct allocations of expenses can be made. Expenses (other than transfer agent expenses and fees incurred under the shareholder services plans and/or the distribution plans further discussed in Note 3(B)) are allocated to separate classes of shares pro rata based upon their relative net assets on the date the expenses are incurred. The expenses borne by the Fund, including those of related parties to the Fund, are shown in the Statement of Operations.
Additionally, the Fund may invest in shares of ETFs or mutual funds, which are subject to management fees and other fees that may increase the costs of investing in ETFs or mutual funds versus the costs of owning the underlying securities directly. These indirect expenses of ETFs or mutual funds are not included in the amounts shown as expenses on the Fund’s Statement of Operations or in the expense ratios included in the financial highlights.
(F) Use of Estimates. In preparing financial statements in conformity with GAAP, management makes estimates and assumptions that affect the reported amounts and disclosures in the financial statements. Actual results could differ from those estimates.
(G) Repurchase Agreements. The Fund may enter into repurchase agreements (i.e., buy a security from another party with the agreement that it be sold back in the future) to earn income. The Fund may enter into repurchase agreements only with counterparties, usually financial institutions, that are deemed by the Manager or Subadvisor to be creditworthy, pursuant to guidelines established by the Board. During the term of any repurchase agreement, the Manager or Subadvisor will continue to monitor the creditworthiness of the counterparty. Under the 1940 Act, repurchase agreements are considered to be collateralized loans by the Fund to the counterparty secured by the securities transferred to the Fund.
Repurchase agreements are subject to counterparty risk, meaning the Fund could lose money by the counterparty’s failure to perform under the terms of the agreement. The Fund mitigates this risk by ensuring the repurchase agreement is collateralized by cash, U.S. government securities, fixed income securities and/or other securities. The collateral is held by the Fund’s custodian and valued daily on a mark to market basis to determine if the value, including accrued interest, exceeds the repurchase price. In the event of the counterparty’s default on the obligation to repurchase, the Fund has the right to liquidate the collateral and apply the proceeds in satisfaction of the obligation. Under certain circumstances, such as in the event of default or bankruptcy by the counterparty, realization and/or retention of the collateral may be limited or subject to delay, to legal proceedings and possible realized loss to the Fund. As of October 31, 2017, the Fund did not hold any repurchase agreements.
(H) Loan Assignments, Participations and Commitments. The Fund may invest in loan assignments and participations (“loans”). Commitments are agreements to make money available to a borrower in a specified amount, at a specified rate and within a specified time. The Fund records an investment when the borrower withdraws money on a commitment or when a funded loan is purchased (trade date) and records interest as earned. These loans pay interest at rates that are periodically reset by reference to a base lending rate plus a spread.
Notes to Financial Statements (continued)
These base lending rates are generally the prime rate offered by a designated U.S. bank or the London InterBank Offered Rate (“LIBOR”).
The loans in which the Fund may invest are generally readily marketable, but may be subject to some restrictions on resale. For example, the Fund may be contractually obligated to receive approval from the agent bank and/or borrower prior to the sale of these investments. If the Fund purchases an assignment from a lender, the Fund will generally have direct contractual rights against the borrower in favor of the lender. If the Fund purchases a participation interest either from a lender or a participant, the Fund typically will have established a direct contractual relationship with the seller of the participation interest, but not with the borrower. Consequently, the Fund is subject to the credit risk of the lender or participant who sold the participation interest to the Fund, in addition to the usual credit risk of the borrower. In the event that the borrower, selling participant or intermediate participants become insolvent or enter into bankruptcy, the Fund may incur certain costs and delays in realizing payment, or may suffer a loss of principal and/or interest.
Unfunded commitments represent the remaining obligation of the Fund to the borrower. At any point in time, up to the maturity date of the issue, the borrower may demand the unfunded portion. Unfunded amounts, if any, are marked to market and any unrealized gains or losses are recorded in the Statement of Assets and Liabilities. As of October 31, 2017, the Fund did not hold any unfunded commitments.
(I) Foreign Currency Transactions. The Fund’s books and records are maintained in U.S. dollars. Prices of securities denominated in foreign currency amounts are translated into U.S. dollars at the mean between the buying and selling rates last quoted by any major U.S. bank at the following dates:
| (i) | market value of investment securities, other assets and liabilities—at the valuation date; and |
| (ii) | purchases and sales of investment securities, income and expenses—at the date of such transactions. |
The assets and liabilities that are denominated in foreign currency amounts are presented at the exchange rates and market values at the close of the period. The realized and unrealized changes in net assets arising from fluctuations in exchange rates and market prices of securities are not separately presented.
Net realized gain (loss) on foreign currency transactions represents net gains and losses on foreign currency forward contracts, net currency gains or losses realized as a result of differences between the amounts of securities sale proceeds or purchase cost, dividends, interest and withholding taxes as recorded on the Fund’s books, and the U.S. dollar equivalent amount actually received or paid. Net currency gains or losses from valuing such foreign currency denominated assets and liabilities, other than investments at valuation date exchange rates, are reflected in unrealized foreign exchange gains or losses.
(J) Securities Lending. In order to realize additional income, the Fund may engage in securities lending, subject to the limitations set forth in the 1940 Act and relevant guidance by the staff of the Securities and Exchange Commission (“SEC”). In the event the Fund does engage in securities lending, the Fund will lend through its custodian, State Street Bank and Trust Company (“State Street”). State Street will manage the Fund’s collateral in accordance with the lending agreement
between the Fund and State Street, and indemnify the Fund against counterparty risk. The loans will be collateralized by U.S. Treasury or securities at least equal at all times to the market value of the securities loaned. The Fund may bear the risk of delay in recovery of, or loss of rights in, the securities loaned should the borrower of the securities experience financial difficulty. The Fund may also record a realized gain or loss on securities deemed sold due to a borrower’s inability to return securities on loan. The Fund bears the risk of any loss on investment of the collateral. The Fund will receive compensation for lending its securities in the form of fees or it will retain a portion of interest on the investment of any cash received as collateral. The Fund will also continue to receive interest and dividends on the securities loaned and any gain or loss in the market price of the securities loaned that may occur during the term of the loan will be for the account of the Fund. During the year ended October 31, 2017, the Fund did not have any portfolio securities on loan.
(K) Restricted Securities. Restricted securities, as disclosed in Note 5, are securities which have been purchased through a private offering and cannot be resold to the general public without prior registration under the Securities Act of 1933, as amended. Disposal of these securities may involve time-consuming negotiations and expenses, and it may be difficult to obtain a prompt sale at an acceptable price.
(L) Debt Securities Risk. The Fund primarily invests in high yield debt securities (commonly referred to as ‘‘junk bonds’’), which are considered speculative because they present a greater risk of loss, including default, than higher quality debt securities. These securities pay investors a premium—a higher interest rate or yield than investment grade debt securities—because of the increased risk of loss. These securities can also be subject to greater price volatility. In times of unusual or adverse market, economic or political conditions, these securities may experience higher than normal default rates.
The Fund may invest in foreign securities, which carry certain risks that are in addition to the usual risks inherent in domestic securities. These risks include those resulting from currency fluctuations, future adverse political or economic developments and possible imposition of currency exchange blockages or other foreign governmental laws or restrictions. These risks are likely to be greater in emerging markets than in developed markets. The ability of issuers of debt securities held by the Fund to meet their obligations may be affected by, among other things, economic or political developments in a specific country, industry or region.
The Fund may invest in loans which are usually rated below investment grade and are generally considered speculative because they present a greater risk of loss, including default, than higher rated debt securities. These investments pay investors a higher interest rate than investment grade debt securities because of the increased risk of loss. Although certain loans are collateralized, there is no guarantee that the value of the collateral will be sufficient to repay the loan. In a recession or serious credit event, the value of these investments could decline significantly. As a result of these and other events, the Fund’s NAVs could go down and you could lose money.
In addition, loans generally are subject to the extended settlement periods that may be longer than seven days. As a result, the Fund may be adversely affected by selling other investments at an unfavorable
| | |
| 36 | | MainStay High Yield Corporate Bond Fund |
time and/or under unfavorable conditions or engaging in borrowing transactions, such as borrowing against its credit facility, to raise cash to meet redemption obligations or pursue other investment opportunities.
In certain circumstances, loans may not be deemed to be securities. As a result, the Fund may not have the protection of anti-fraud provisions of the federal securities laws. In such cases, the Fund generally must rely on the contractual provisions in the loan agreement and common-law fraud protections under applicable state law.
(M) Indemnifications. Under the Trust’s organizational documents, its officers and trustees are indemnified against certain liabilities that may arise out of performance of their duties to the Trust. Additionally, in the normal course of business, the Fund enters into contracts with third-party service providers that contain a variety of representations and warranties and which may provide general indemnifications. The Fund’s maximum exposure under these arrangements is unknown, as this would involve future claims that may be made against the Fund that have not yet occurred. Based on experience, management is of the view that the risk of loss in connection with these potential indemnification obligations is remote. However, there can be no assurance that material liabilities related to such obligations will not arise in the future, which could adversely impact the Fund.
Note 3–Fees and Related Party Transactions
(A) Manager and Subadvisor. New York Life Investments, a registered investment adviser and an indirect, wholly-owned subsidiary of New York Life Insurance Company (“New York Life”), serves as the Fund’s Manager, pursuant to an Amended and Restated Management Agreement (“Management Agreement”). The Manager provides offices, conducts clerical, recordkeeping and bookkeeping services and keeps most of the financial and accounting records required to be maintained by the Fund. Except for the portion of salaries and expenses that are the responsibility of the Fund, the Manager pays the salaries and expenses of all personnel affiliated with the Fund and certain operational expenses of the Fund. The Fund reimburses New York Life Investments in an amount equal to a portion of the compensation of the Chief Compliance Officer attributable to the Fund. MacKay Shields LLC (“MacKay Shields” or the “Subadvisor”), a registered investment adviser and an indirect, wholly-owned subsidiary of New York Life, serves as Subadvisor to the Fund and is responsible for the day-to-day portfolio management of the Fund. Pursuant to the terms of an Amended and Restated Subadvisory Agreement (“Subadvisory Agreement”) between New York Life Investments and MacKay Shields, New York Life Investments pays for the services of the Subadvisor.
Under the Management Agreement, the Fund pays the Manager a monthly fee for the services performed and the facilities furnished at an annual rate of the Fund’s average daily net assets as follows: 0.60% up to $500 million; 0.55% from $500 million up to $5 billion; 0.525% from $5 billion up to $7 billion; 0.50% from $7 billion up to $10 billion; and 0.49% in excess of $10 billion, plus a fee for fund accounting services previously provided by New York Life Investments under a separate fund accounting agreement furnished at an annual rate of the Fund’s average daily net assets as follows: 0.05% up to $20 million; 0.0333% from $20 million to $100 million; and 0.01% in excess of $100 million. Prior to February 28, 2017, the Fund paid the Manager a monthly fee for
services performed and the facilities furnished at an annual rate of the Fund’s average daily net assets as follows: 0.60% up to $500 million; 0.55% from $500 million up to $5 billion; 0.525% from $5 billion up to $7 billion; and 0.50% in excess of $7 billion plus a fee for fund accounting services previously provided by New York Life Investments under a separate fund accounting agreement furnished at an annual rate of the Fund’s average daily net assets as follows: 0.05% up to $20 million; 0.0333% from $20 million to $100 million; and 0.01% in excess of $100 million. During the year ended October 31, 2017, the effective management fee rate was 0.54% inclusive of a fee for fund accounting services of 0.01% of the Fund’s average daily net assets.
During the year ended October 31, 2017, New York Life Investments earned fees from the Fund in the amount of $55,840,794.
State Street provides sub-administration and sub-accounting services to the Fund pursuant to an agreement with New York Life Investments. These services include calculating the daily NAVs of the Fund, maintaining the general ledger and sub-ledger accounts for the calculation of the Fund’s NAVs and assisting New York Life Investments in conducting various aspects of the Fund’s administrative operations. For providing these services to the Fund, State Street is compensated by New York Life Investments.
(B) Distribution, Service and Shareholder Service Fees. The Trust, on behalf of the Fund, has entered into a distribution agreement with NYLIFE Distributors LLC (the ‘‘Distributor’’), an indirect, wholly-owned subsidiary of New York Life. The Fund has adopted distribution plans (the “Plans”) in accordance with the provisions of Rule 12b-1 under the 1940 Act.
Pursuant to the Class A, Investor Class, Class T and Class R2 Plans, the Distributor receives a monthly distribution fee from the Class A, Investor Class, Class T and Class R2 shares at an annual rate of 0.25% of the average daily net assets of the Class A, Investor Class, Class T and Class R2 shares for distribution and/or service activities as designated by the Distributor. Pursuant to the Class B and Class C Plans, Class B and Class C shares pay the Distributor a monthly distribution fee at an annual rate of 0.75% of the average daily net assets of the Class B and Class C shares, along with a service fee at an annual rate of 0.25% of the average daily net assets of the Class B and Class C shares, for a total 12b-1 fee of 1.00%. Pursuant to the Class R3 Plan, the Distributor receives a monthly distribution and/or service fee from the Class R3 shares at an annual rate of 0.50% of the average daily net assets of the Class R3 shares. Class I, Class R1 and Class R6 shares are not subject to a distribution and/or service fee.
The Plans provide that the distribution and service fees are payable to the Distributor regardless of the amounts actually expended by the Distributor for distribution of the Fund’s shares and service activities.
In accordance with the Shareholder Services Plans for the Class R1, Class R2 and Class R3 shares, the Manager has agreed to provide, through its affiliates or independent third parties, various shareholder and administrative support services to shareholders of the Class R1, Class R2 and Class R3 shares. For its services, the Manager, its affiliates or independent third-party service providers are entitled to a shareholder service fee accrued daily and paid monthly at an annual rate of 0.10% of the average daily net assets of the Class R1, Class R2 and Class R3 shares. This is in addition to any fees paid under the Class R2 and Class R3 Plans.
Notes to Financial Statements (continued)
During the year ended October 31, 2017, shareholder service fees incurred by the Fund were as follows:
| | | | |
Class R1 | | $ | 50 | |
Class R2 | | | 10,358 | |
Class R3 | | | 260 | |
(C) Sales Charges. During the year ended October 31, 2017, the Fund was advised by the Distributor that the amount of initial sales charges retained on sales of Class A and Investor Class shares were $940,966 and $125,572, respectively.
During the year ended October 31, 2017, the Fund was also advised that the Distributor retained CDSCs on redemptions of Class A, Investor Class, Class B and Class C shares of $44,797, $382, $152,120 and $66,902, respectively.
(D) Transfer, Dividend Disbursing and Shareholder Servicing Agent. NYLIM Service Company LLC, an affiliate of New York Life Investments, is the Fund’s transfer, dividend disbursing and shareholder servicing agent pursuant to an agreement between NYLIM Service Company LLC and the Trust. NYLIM Service Company LLC has entered into an agreement with Boston Financial Data Services, Inc. (“BFDS”) pursuant to which BFDS performs certain transfer agent services on behalf of NYLIM Service Company LLC. During the year ended October 31, 2017, transfer agent expenses incurred by the Fund were as follows:
| | | | |
Class A | | $ | 4,957,194 | |
Investor Class | | | 515,070 | |
Class B | | | 228,737 | |
Class C | | | 1,312,485 | |
Class I | | | 7,267,281 | |
Class R1 | | | 70 | |
Class R2 | | | 14,205 | |
Class R3 | | | 354 | |
(E) Small Account Fee. Shareholders with small accounts adversely impact the cost of providing transfer agency services. In an effort to reduce total transfer agency expenses, the Fund has implemented a small account fee on certain types of accounts. Certain shareholders with an account balance of less than $1,000 are charged an annual per account fee of $20 (assessed semi-annually), the proceeds from which offset transfer agent fees as reflected in the Statement of Operations.
(F) Capital. As of October 31, 2017, New York Life and its affiliates beneficially held shares of the Fund with the values and percentages of net assets as follows:
| | | | | | | | |
Class I | | $ | 929,098 | | | | 0.0 | %‡ |
Class R1 | | | 34,777 | | | | 93.5 | |
Class R3 | | | 30,799 | | | | 7.9 | |
| ‡ | Less than one-tenth of a percent. |
Note 4–Federal Income Tax
As of October 31, 2017, the cost and unrealized appreciation (depreciation) of the Fund’s investment portfolio, including applicable
derivative contracts and other financial instruments, as determined on a federal income tax basis, were as follows:
| | | | | | | | | | | | | | | | |
| | | Federal
Tax Cost | | | Gross
Unrealized
Appreciation | | | Gross
Unrealized
Depreciation | | | Net
Unrealized
Appreciation/
(Depreciation) | |
Investments in Securities | | $ | 10,008,521,530 | | | $ | 440,118,520 | | | $ | (192,869,249 | ) | | $ | 247,249,271 | |
As of October 31, 2017, the components of accumulated gain (loss) on a tax basis were as follows:
| | | | | | | | | | | | | | | | |
Ordinary
Income | | Accumulated
Capital and Other Gain (Loss) | | | Other
Temporary
Differences | | | Unrealized
Appreciation
(Depreciation) | | | Total
Accumulated Gain (Loss) | |
| $— | | $ | (277,829,060) | | | $ | (11,628,088) | | | $ | 247,249,271 | | | $ | (42,207,877) | |
The difference between book-basis and tax-basis unrealized appreciation (depreciation) is primarily due to wash sales adjustments. The other temporary differences are primarily due to dividends payable and defaulted bond income accruals.
The following table discloses the current year reclassifications between undistributed net investment income (loss), accumulated net realized gain (loss) on investments and additional paid-in capital arising from permanent differences; net assets as of October 31, 2017 were not affected.
| | | | | | | | |
Undistributed Net Investment Income (Loss) | | Accumulated Net Realized Gain (Loss) on Investments | | | Additional Paid-In Capital | |
| $1,706,153 | | $ | (80,401,556 | ) | | $ | 78,695,403 | |
The reclassifications for the Fund are primarily due to merger-related tax adjustments.
As of October 31, 2017, for federal income tax purposes, capital loss carryforwards of $277,829,060 were available as shown in the table below, to the extent provided by the regulations to offset future realized gains of the Fund through the years indicated. To the extent that these capital loss carryforwards are used to offset future capital gains, it is probable that the capital gains so offset will not be distributed to shareholders. No capital gain distributions shall be made until any capital loss carryforwards have been fully utilized.
| | | | | | | | |
Capital Loss Available Through | | Short-Term Capital Loss Amounts (000’s) | | | Long-Term Capital Loss Amounts (000’s) | |
| Unlimited | | $ | 26,783 | | | $ | 251,046 | |
The Fund utilized $68,241,819 of capital loss carryforwards during the year ended October 31, 2017.
During the years ended October 31, 2017 and October 31, 2016, the tax character of distributions paid as reflected in the Statements of Changes in Net Assets was as follows:
| | | | | | | | |
| | | 2017 | | | 2016 | |
Distributions paid from: | | | | | | | | |
Ordinary Income | | $ | 553,107,576 | | | $ | 559,080,469 | |
Return of Capital | | | 89,467,651 | | | | 38,774,198 | |
Total | | $ | 642,575,227 | | | $ | 597,854,667 | |
| | |
| 38 | | MainStay High Yield Corporate Bond Fund |
Note 5–Restricted Securities
As of October 31, 2017, the Fund held the following restricted securities:
| | | | | | | | | | | | | | | | | | | | |
Security | | Date(s) of
Acquisition | | | Principal
Amount/
Shares | | | Cost | | | 10/31/17
Value | | | Percent of
Net Assets | |
Aleris International, Inc. | | | | | | | | | | | | | | | | | | | | |
Convertible Bond 6.00%, due 6/1/20 | | | 7/6/10 | | | $ | 11,797 | | | $ | 9,384 | | | $ | 10,662 | | | | 0.0 | %‡ |
Exide Technologies, Inc.
Common Stock | | | 4/30/15-9/29/17 | | | | 2,084,972 | | | | 53,289,038 | | | | 3,398,505 | | | | 0.0 | ‡ |
ION Media Networks, Inc.
Common Stock | | | 3/12/10-9/29/17 | | | | 2,287 | | | | 13,572 | | | | 1,551,935 | | | | 0.0 | ‡ |
Majestic Star Casino LLC
Membership Units Common Stock | | | 12/1/11 | | | | 446,020 | | | | 892,040 | | | | 423,719 | | | | 0.0 | ‡ |
Neenah Enterprises, Inc.
Common Stock | | | 7/29/10-9/29/17 | | | | 720,961 | | | | 6,114,571 | | | | 8,644,323 | | | | 0.1 | |
Neenah Foundry Co.
2016 Term Loan
7.772%-7.812%, due 4/26/19 | | | 12/8/16 | | | $ | 16,896,425 | | | | 16,840,968 | | | | 16,642,978 | | | | 0.2 | |
Sterling Entertainment Enterprises LLC
Corporate Bond
9.75%, due 12/15/19 | | | 12/21/12 | | | $ | 35,000,000 | | | | 35,000,000 | | | | 36,312,500 | | | | 0.3 | |
Total | | | | | | | | | | $ | 112,159,573 | | | $ | 66,984,622 | | | | 0.6 | % |
| ‡ | Less than one-tenth of a percent. |
Note 6–Custodian
State Street is the custodian of cash and securities held by the Fund. Custodial fees are charged to the Fund based on the Fund’s net assets and/or the market value of securities held by the Fund and the number of certain transactions incurred by the Fund.
Note 7–Line of Credit
The Fund and certain other funds managed by New York Life Investments, maintain a line of credit with a syndicate of banks in order to secure a source of funds for temporary purposes to meet unanticipated or excessive redemption requests.
Effective August 1, 2017, under the credit agreement (the “Credit Agreement”), the aggregate commitment amount is $600,000,000 with an additional uncommitted amount of $100,000,000. The commitment fee is an annual rate of 0.15% of the average commitment amount payable quarterly, regardless of usage, to State Street, who serves as the agent to the syndicate. The commitment fee is allocated among the Fund and certain other funds managed by New York Life Investments based upon their respective net assets and other factors. Interest on any revolving credit loan is charged based upon the Federal Funds Rate or the one-month LIBOR, whichever is higher. The Credit Agreement expires on July 31, 2018, although the Fund, certain other funds managed by New York Life Investments and the syndicate of banks may renew the Credit Agreement for an additional year on the same or different terms. Prior to August 1, 2017, the aggregate commitment amount and the commitment fee of the previous credit agreement were the same as those under the Credit Agreement, but Bank of New York Mellon served as agent to the syndicate. During the year ended October 31, 2017, there were no borrowings made or outstanding with
respect to the Fund under the Credit Agreement or the credit agreement for which Bank of New York Mellon served as agent.
Note 8–Interfund Lending Program
Pursuant to an exemptive order issued by the SEC, the Fund, along with certain other funds managed by New York Life Investments, may participate in an interfund lending program. The interfund lending program provides an alternative credit facility that permits the Fund and certain other funds managed by New York Life Investments to lend or borrow money for temporary purposes directly to or from one another subject to the conditions of the exemptive order. During the year ended October 31, 2017, there were no interfund loans made or outstanding with respect to the Fund.
Note 9–Purchases and Sales of Securities (in 000’s)
During the year ended October 31, 2017, purchases and sales of securities, other than short-term securities, were $4,144,610 and $4,319,011, respectively.
The Fund may purchase securities from or sell to other portfolios managed by the Subadvisor. These interportfolio transactions are primarily used for cash management purposes and are made pursuant to Rule 17a-7 under the 1940 Act. During the year ended October 31, 2017, such purchases were $4,982.
Notes to Financial Statements (continued)
Note 10–Capital Share Transactions
| | | | | | | | |
Class A | | Shares | | | Amount | |
Year ended October 31, 2017: | | | | | | | | |
Shares sold | | | 137,960,535 | | | $ | 796,510,493 | |
Shares issued in connection with the acquisition of MainStay High Yield Opportunities Fund | | | 10,796,682 | | | | 62,812,936 | |
Shares issued to shareholders in reinvestment of dividends
and distributions | | | 33,255,027 | | | | 191,827,227 | |
Shares redeemed | | | (185,358,822 | ) | | | (1,070,313,899 | ) |
| | | | |
Net increase (decrease) in shares outstanding before conversion | | | (3,346,578 | ) | | | (19,163,243 | ) |
Shares converted into Class A (See Note 1) | | | 27,937,559 | | | | 162,107,881 | |
Shares converted from Class A (See Note 1) | | | (4,923,114 | ) | | | (28,586,448 | ) |
| | | | |
Net increase (decrease) | | | 19,667,867 | | | $ | 114,358,190 | |
| | | | |
Year ended October 31, 2016: | | | | | | | | |
Shares sold | | | 130,915,748 | | | $ | 720,686,459 | |
Shares issued to shareholders in reinvestment of dividends
and distributions | | | 33,685,999 | | | | 184,730,015 | |
Shares redeemed | | | (153,877,032 | ) | | | (842,188,666 | ) |
| | | | |
Net increase (decrease) in shares outstanding before conversion | | | 10,724,715 | | | | 63,227,808 | |
Shares converted into Class A (See Note 1) | | | 6,586,070 | | | | 36,684,855 | |
Shares converted from Class A (See Note 1) | | | (2,417,783 | ) | | | (13,325,048 | ) |
| | | | |
Net increase (decrease) | | | 14,893,002 | | | $ | 86,587,615 | |
| | | | | | | | |
| | |
| | | | | | | | |
Investor Class | | Shares | | | Amount | |
Year ended October 31, 2017: | | | | | | | | |
Shares sold | | | 5,619,055 | | | $ | 32,742,492 | |
Shares issued in connection with the acquisition of MainStay High Yield Opportunities Fund | | | 883,418 | | | | 5,181,248 | |
Shares issued to shareholders in reinvestment of dividends
and distributions | | | 2,644,158 | | | | 15,376,930 | |
Shares redeemed | | | (5,651,793 | ) | | | (32,923,120 | ) |
| | | | |
Net increase (decrease) in shares outstanding before conversion | | | 3,494,838 | | | | 20,377,550 | |
Shares converted into Investor Class (See Note 1) | | | 2,275,619 | | | | 13,254,259 | |
Shares converted from Investor Class (See Note 1) | | | (26,698,350 | ) | | | (156,019,665 | ) |
| | | | |
Net increase (decrease) | | | (20,927,893 | ) | | $ | (122,387,856 | ) |
| | | | |
Year ended October 31, 2016: | | | | | | | | |
Shares sold | | | 5,564,916 | | | $ | 30,690,421 | |
Shares issued to shareholders in reinvestment of dividends
and distributions | | | 3,020,971 | | | | 16,697,863 | |
Shares redeemed | | | (6,767,282 | ) | | | (37,177,796 | ) |
| | | | |
Net increase (decrease) in shares outstanding before conversion | | | 1,818,605 | | | | 10,210,488 | |
Shares converted into Investor Class (See Note 1) | | | 3,236,349 | | | | 17,925,599 | |
Shares converted from Investor Class (See Note 1) | | | (5,624,893 | ) | | | (31,728,974 | ) |
| | | | |
Net increase (decrease) | | | (569,939 | ) | | $ | (3,592,887 | ) |
| | | | |
| | | | | | | | |
Class B | | Shares | | | Amount | |
Year ended October 31, 2017: | | | | | | | | |
Shares sold | | | 889,619 | | | $ | 5,102,460 | |
Shares issued to shareholders in reinvestment of dividends
and distributions | | | 1,005,592 | | | | 5,771,859 | |
Shares redeemed | | | (4,238,908 | ) | | | (24,373,758 | ) |
| | | | |
Net increase (decrease) in shares outstanding before conversion | | | (2,343,697 | ) | | | (13,499,439 | ) |
Shares converted into Class B (See Note 1) | | | 562 | | | | 3,201 | |
Shares converted from Class B (See Note 1) | | | (1,994,735 | ) | | | (11,476,196 | ) |
| | | | |
Net increase (decrease) | | | (4,337,870 | ) | | $ | (24,972,434 | ) |
| | | | |
Year ended October 31, 2016: | | | | | | | | |
Shares sold | | | 2,688,143 | | | $ | 14,680,378 | |
Shares issued to shareholders in reinvestment of dividends
and distributions | | | 1,205,109 | | | | 6,569,476 | |
Shares redeemed | | | (4,067,471 | ) | | | (22,072,134 | ) |
| | | | |
Net increase (decrease) in shares outstanding before conversion | | | (174,219 | ) | | | (822,280 | ) |
Shares converted from Class B (See Note 1) | | | (1,825,863 | ) | | | (9,965,188 | ) |
| | | | |
Net increase (decrease) | | | (2,000,082 | ) | | $ | (10,787,468 | ) |
| | | | |
| | |
| | | | | | | | |
Class C | | Shares | | | Amount | |
Year ended October 31, 2017: | | | | | | | | |
Shares sold | | | 13,097,649 | | | $ | 75,284,450 | |
Shares issued in connection with the acquisition of MainStay High Yield Opportunities Fund | | | 12,822,216 | | | | 74,236,783 | |
Shares issued to shareholders in reinvestment of dividends
and distributions | | | 5,581,771 | | | | 32,066,658 | |
Shares redeemed | | | (32,264,507 | ) | | | (185,641,594 | ) |
| | | | |
Net increase (decrease) in shares outstanding before conversion | | | (762,871 | ) | | | (4,053,703 | ) |
Shares converted from Class C (See Note 1) | | | (160,698 | ) | | | (922,248 | ) |
| | | | |
Net increase (decrease) | | | (923,569 | ) | | $ | (4,975,951 | ) |
| | | | | | | | |
Year ended October 31, 2016: | | | | | | | | |
Shares sold | | | 19,993,040 | | | $ | 109,180,450 | |
Shares issued to shareholders in reinvestment of dividends
and distributions | | | 5,440,054 | | | | 29,703,583 | |
Shares redeemed | | | (28,986,251 | ) | | | (157,020,782 | ) |
| | | | |
Net increase (decrease) in shares outstanding before conversion | | | (3,553,157 | ) | | | (18,136,749 | ) |
Shares converted from Class C (See Note 1) | | | (250,206 | ) | | | (1,309,730 | ) |
| | | | |
Net increase (decrease) | | | (3,803,363 | ) | | $ | (19,446,479 | ) |
| | | | | | | | |
| | |
| | | | | | | | |
| | |
| 40 | | MainStay High Yield Corporate Bond Fund |
| | | | | | | | |
Class I | | Shares | | | Amount | |
Year ended October 31, 2017: | | | | | | | | |
Shares sold (a) | | | 399,617,814 | | | $ | 2,309,616,788 | |
Shares issued in connection with the acquisition of MainStay High Yield Opportunities Fund | | | 30,051,743 | | | | 175,001,097 | |
Shares issued to shareholders in reinvestment of dividends
and distributions | | | 55,184,195 | | | | 318,761,441 | |
Shares redeemed | | | (709,292,405 | ) | | | (4,099,545,620 | ) |
| | | | |
Net increase (decrease) in shares outstanding before conversion | | | (224,438,653 | ) | | | (1,296,166,294 | ) |
Shares converted into Class I (See Note 1) | | | 3,985,779 | | | | 23,178,011 | |
| | | | |
Net increase (decrease) | | | (220,452,874 | ) | | $ | (1,272,988,283 | ) |
| | | | | | | | |
Year ended October 31, 2016: | | | | | | | | |
Shares sold | | | 423,497,847 | | | $ | 2,324,352,976 | |
Shares issued to shareholders in reinvestment of dividends
and distributions | | | 54,903,299 | | | | 301,284,721 | |
Shares redeemed | | | (422,665,098 | ) | | | (2,300,125,238 | ) |
| | | | |
Net increase (decrease) in shares outstanding before conversion | | | 55,736,048 | | | | 325,512,459 | |
Shares converted into Class I (See Note 1) | | | 307,287 | | | | 1,718,486 | |
| | | | |
Net increase (decrease) | | | 56,043,335 | | | $ | 327,230,945 | |
| | | | | | | | |
| (a) | Includes in-kind subscriptions in the amount of $11,683,015 during the year ended October 31, 2017. (See Note 11) |
| | | | | | | | |
| | |
| | | | | | | | |
Class R1 | | Shares | | | Amount | |
Year ended October 31, 2017: | | | | | | | | |
Shares sold | | | 599 | | | $ | 3,456 | |
Shares issued to shareholders in reinvestment of dividends
and distributions | | | 540 | | | | 3,110 | |
Shares redeemed | | | (4,902 | ) | | | (28,556 | ) |
| | | | |
Net increase (decrease) | | | (3,763 | ) | | $ | (21,990 | ) |
| | | | | | | | |
Year ended October 31, 2016: | | | | | | | | |
Shares sold | | | 2,945 | | | $ | 16,389 | |
Shares issued to shareholders in reinvestment of dividends
and distributions | | | 555 | | | | 3,049 | |
Shares redeemed | | | (336 | ) | | | (1,869 | ) |
| | | | |
Net increase (decrease) | | | 3,164 | | | $ | 17,569 | |
| | | | | | | | |
| | |
| | | | | | | | |
| | | | | | | | |
Class R2 | | Shares | | | Amount | |
Year ended October 31, 2017: | | | | | | | | |
Shares sold | | | 326,120 | | | $ | 1,884,122 | |
Shares issued to shareholders in reinvestment of dividends
and distributions | | | 81,384 | | | | 469,649 | |
Shares redeemed | | | (651,458 | ) | | | (3,769,543 | ) |
| | | | |
Net increase (decrease) in shares outstanding before conversion | | | (243,954 | ) | | | (1,415,772 | ) |
Shares converted from Class R2 (See Note 1) | | | (260 | ) | | | (1,507 | ) |
| | | | |
Net increase (decrease) | | | (244,214 | ) | | $ | (1,417,279 | ) |
| | | | | | | | |
Year ended October 31, 2016: | | | | | | | | |
Shares sold | | | 718,136 | | | $ | 3,974,621 | |
Shares issued to shareholders in reinvestment of dividends
and distributions | | | 75,552 | | | | 413,789 | |
Shares redeemed | | | (701,992 | ) | | | (3,758,039 | ) |
| | | | |
Net increase (decrease) | | | 91,696 | | | $ | 630,371 | |
| | | | | | | | |
Class R3 | | Shares | | | Amount | |
Year ended October 31, 2017: | | | | | | | | |
Shares sold | | | 83,301 | | | $ | 481,206 | |
Shares issued to shareholders in reinvestment of dividends
and distributions | | | 2,416 | | | | 13,944 | |
Shares redeemed | | | (28,201 | ) | | | (162,967 | ) |
| | | | |
Net increase (decrease) in shares outstanding before conversion | | | 57,516 | | | | 332,183 | |
Shares converted from Class R3 (See Note 1) | | | (12,048 | ) | | | (69,759 | ) |
| | | | |
Net increase (decrease) | | | 45,468 | | | $ | 262,424 | |
| | | | | | | | |
Period ended October 31, 2017 (b): | | | | | | | | |
Shares sold | | | 21,955 | | | $ | 120,612 | |
Shares issued to shareholders in reinvestment of dividends
and distributions | | | 606 | | | | 3,415 | |
| | | | |
Net increase (decrease) | | | 22,561 | | | $ | 124,027 | |
| | | | | | | | |
| (b) | Inception date was February 29, 2016. |
| | | | | | | | |
| | |
| | | | | | | | |
Class R6 | | Shares | | | Amount | |
Year ended October 31, 2017: | | | | | | | | |
Shares sold | | | 282,318,578 | | | $ | 1,632,862,432 | |
Shares issued to shareholders in reinvestment of dividends
and distributions | | | 3,784,191 | | | | 21,863,631 | |
Shares redeemed | | | (5,937,095 | ) | | | (34,358,222 | ) |
| | | | |
Net increase (decrease) in shares outstanding before conversion | | | 280,165,674 | | | | 1,620,367,841 | |
Shares converted from Class R6 (See Note 1) | | | (253,219 | ) | | | (1,467,529 | ) |
| | | | |
Net increase (decrease) | | | 279,912,455 | | | $ | 1,618,900,312 | |
| | | | | | | | |
Year ended October 31, 2016: | | | | | | | | |
Shares sold | | | 7,558,759 | | | $ | 41,981,723 | |
Shares issued to shareholders in reinvestment of dividends
and distributions | | | 372,597 | | | | 2,072,720 | |
Shares redeemed | | | (1,267,059 | ) | | | (6,999,447 | ) |
| | | | |
Net increase (decrease) | | | 6,664,297 | | | $ | 37,054,996 | |
| | | | | | | | |
Notes to Financial Statements (continued)
Note 11–In-Kind Transfer of Securities
During the year ended October 31, 2017, the Fund received shares of beneficial interest in exchange for securities. Cash and securities were transferred at their current value on the date of the transaction.
| | | | |
| Transaction Date | | Shares | | Value |
| 9/29/17 | | 2,014,313 | | $11,683,015 |
Note 12–Litigation
On December 23, 2014, Cynthia Ann Redus-Tarchis and others filed a complaint against New York Life Investments in the United States District Court for the District of New Jersey. The complaint was brought derivatively on behalf of the MainStay Large Cap Growth Fund, the MainStay High Yield Corporate Bond Fund and another fund previously managed by New York Life Investments and alleges that New York Life Investments violated Section 36(b) of the 1940 Act by charging excessive investment management fees. The plaintiffs seek monetary damages and other relief from New York Life Investments. New York Life Investments believes the case has no merit, and intends to vigorously defend the matter.
On May 6, 2015, a second amended complaint was filed which, among other things, added MainStay High Yield Opportunities Fund as an additional Fund on whose behalf the complaint was brought. New York Life Investments filed a motion to dismiss the second amended complaint. This motion was denied on October 28, 2015. New York Life Investments filed an answer to the second amended complaint on November 30, 2015. Discovery in the case has been concluded. New York Life Investments filed its motion for summary judgment on December 15, 2017.
Note 13–Fund Acquisitions
MainStay High Yield Opportunities Fund
At a meeting held on November 1-2, 2016, the Board approved an Agreement and Plan of Reorganization providing for the acquisition of the assets and liabilities of the MainStay High Yield Opportunities Fund, a series of MainStay Funds Trust, by the Fund, in exchange for shares of the Fund, followed by the complete liquidation of the MainStay High Yield Opportunities Fund (the “Reorganization”). The Reorganization was completed on February 17, 2017. The aggregate net assets of the Fund immediately before the acquisition were $10,459,740,548 and the combined net assets after the acquisition were $10,776,972,612.
The chart below shows a summary of net assets, shares outstanding, net unrealized appreciation/(depreciation), undistributed net investment income and accumulated net realized gains/(losses), before and after the reorganization.
| | | | | | | | | | | | |
| | | Before Reorganization | | | After
Reorganization | |
| | | MainStay
High Yield
Opportunities
Fund | | | MainStay
High Yield
Corporate
Bond Fund | | | MainStay
High Yield
Corporate
Bond Fund | |
Net Assets: | | | | | | | | | | | | |
Class A | | $ | 62,812,936 | | | $ | 3,593,566,219 | | | $ | 3,656,379,155 | |
Investor Class | | | 5,181,248 | | | | 288,079,044 | | | | 293,260,292 | |
Class B | | | — | | | | 130,694,661 | | | | 130,694,661 | |
Class C | | | 74,236,783 | | | | 671,406,491 | | | | 745,643,274 | |
Class I | | | 175,001,097 | | | | 5,700,715,046 | | | | 5,875,716,143 | |
Class R1 | | | — | | | | 62,081 | | | | 62,081 | |
Class R2 | | | — | | | | 10,841,706 | | | | 10,841,706 | |
Class R3 | | | — | | | | 222,918 | | | | 222,918 | |
Class R6 | | | — | | | | 64,152,382 | | | | 64,152,382 | |
Shares Outstanding: | | | | | | | | | | | | |
Class A | | | 5,800,751 | | | | 617,686,243 | | | | 628,482,926 | |
Investor Class | | | 480,906 | | | | 49,118,183 | | | | 50,001,601 | |
Class B | | | — | | | | 22,582,583 | | | | 22,582,583 | |
Class C | | | 6,885,751 | | | | 115,964,747 | | | | 128,786,963 | |
Class I | | | 16,123,153 | | | | 978,944,874 | | | | 1,008,996,752 | |
Class R1 | | | — | | | | 10,674 | | | | 10,674 | |
Class R2 | | | — | | | | 1,862,964 | | | | 1,862,964 | |
Class R3 | | | — | | | | 38,332 | | | | 38,332 | |
Class R6 | | | — | | | | 11,028,891 | | | | 11,028,891 | |
Net unrealized
appreciation/(depreciation) | | | 10,328,312 | | | | 276,337,007 | | | | 286,665,319 | |
Undistributed net investment income | | | 251,519 | | | | 1,327,073 | | | | 1,327,073 | |
Accumulated net realized gain/(loss) | | | (78,971,873 | ) | | | (248,958,072 | ) | | | (248,958,072 | ) |
Assuming the acquisition of MainStay High Yield Opportunities Fund had been completed on November 1, 2016, the beginning of the annual reporting period of the Fund, the Fund’s pro forma results of operations for the year ended October 31, 2017, are as follows:
| | | | |
Net investment income | | $ | 553,923,686 | |
Net gain on investments | | | 145,265,223 | |
Net increase in net assets resulting from operations | | $ | 699,188,909 | |
Because the combined investment portfolios have been managed as a single integrated portfolio since the acquisition was completed, it is not practicable to separate the amounts of revenue and earnings of the MainStay High Yield Opportunities Fund that have been included in the Fund’s Statement of Operations since February 17, 2017.
For financial reporting purposes, assets received and shares issued by the Fund were recorded at fair value; however, the cost basis of the investments received from MainStay High Yield Opportunities Fund, in the amount of $301,102,166, was carried forward to align ongoing reporting of the Fund’s realized and unrealized gains and losses with amounts distributable to shareholders for tax purposes. The Fund acquired capital loss carryovers of $78,386,195 (subject to future annual limitations).
| | |
| 42 | | MainStay High Yield Corporate Bond Fund |
Note 14–Subsequent Events
In connection with the preparation of the financial statements of the Fund as of and for the year ended October 31, 2017, events and transactions subsequent to October 31, 2017, through the date the financial statements were issued have been evaluated by the Fund’s management for possible adjustment and/or disclosure. No subsequent events requiring financial statement adjustment or disclosure have been identified.
Report of Independent Registered Public Accounting Firm
The Board of Trustees and Shareholders of
The MainStay Funds:
We have audited the accompanying statement of assets and liabilities, including the portfolio of investments, of MainStay High Yield Corporate Bond Fund (the “Fund”), one of the funds constituting The MainStay Funds, as of October 31, 2017, and the related statement of operations for the year then ended, the statements of changes in net assets for each of the years in the two-year period then ended, and the financial highlights for each of the years or periods in the five-year period then ended. These financial statements and financial highlights are the responsibility of the Fund’s management. Our responsibility is to express an opinion on these financial statements and financial highlights based on our audits.
We conducted our audits in accordance with the standards of the Public Company Accounting Oversight Board (United States). Those standards require that we plan and perform the audit to obtain reasonable assurance about whether the financial statements and financial highlights are free of material misstatement. An audit includes examining, on a test basis, evidence supporting the amounts and disclosures in the financial statements. Our procedures included confirmation of securities owned as of October 31, 2017, by correspondence with the custodian and brokers or by other appropriate auditing procedures where replies from brokers were not received. An audit also includes assessing the accounting principles used and significant estimates made by management, as well as evaluating the overall financial statement presentation. We believe that our audits provide a reasonable basis for our opinion.
In our opinion, the financial statements and financial highlights referred to above present fairly, in all material respects, the financial position of MainStay High Yield Corporate Bond Fund as of October 31, 2017, the results of its operations for the year then ended, the changes in its net assets for each of the years in the two-year period then ended, and the financial highlights for each of the years or periods in the five-year period then ended, in conformity with U.S. generally accepted accounting principles.

Philadelphia, Pennsylvania
December 21, 2017
| | |
| 44 | | MainStay High Yield Corporate Bond Fund |
Other Matters
(Unaudited)
At a meeting held on June 22, 2017, the Board approved submitting the following proposal (“Proposal”) to shareholders of the Funds at a special meeting held on October 23, 2017 (with any postponements or adjournments, “Special Meeting”):
To elect eight Trustees to the Board
On or about September 28, 2017, shareholders of record of the Funds as of the close of business on August 24, 2017 were sent a proxy statement containing information regarding the Proposal. The proxy statement also included information about the Special Meeting, at which shareholders of the Funds were asked to consider and approve the Proposal. In addition, the proxy statement included information about voting on the Proposal and options shareholders had to do so.
The Special Meeting was held on October 23, 2017, and the Proposal passed.
The results of the Special Meeting (all Funds and classes thereof voting together) were as follows:
Proposal—To elect eight Trustees to the Board:
Yie-Hsin Hung:
| | | | |
| Votes For | | Votes
Witheld | | Total |
| 2,644,056,263.750 | | 21,799,781.292 | | 2,665,856,045.042 |
David H. Chow:
| | | | |
| Votes For | | Votes
Witheld | | Total |
| 2,644,576,776.557 | | 21,279,268.485 | | 2,665,856,045.042 |
Susan B. Kerley:
| | | | |
| Votes For | | Votes
Witheld | | Total |
| 2,645,459,747.343 | | 20,396,297.699 | | 2,665,856,045.042 |
Alan R. Latshaw:
| | | | |
| Votes For | | Votes
Witheld | | Total |
| 2,644,443,039.401 | | 21,413,005.641 | | 2,665,856,045.042 |
Peter Meenan:
| | | | |
| Votes For | | Votes
Witheld | | Total |
| 2,640,156,421.578 | | 25,699,623.464 | | 2,665,856,045.042 |
Richard H. Nolan, Jr.:
| | | | |
| Votes For | | Votes
Witheld | | Total |
| 2,641,415,514.849 | | 24,440,530.193 | | 2,665,856,045.042 |
Jacques P. Perold:
| | | | |
| Votes For | | Votes
Witheld | | Total |
| 2,645,300,993.731 | | 20,555,051.311 | | 2,665,856,045.042 |
Richard S. Trutanic:
| | | | |
| Votes For | | Votes
Witheld | | Total |
| 2,641,761,336.311 | | 24,094,708.731 | | 2,665,856,045.042 |
Federal Income Tax Information
(Unaudited)
The Fund is required under the Internal Revenue Code to advise shareholders in a written statement as to the federal tax status of dividends paid by the Fund during such fiscal years.
For the fiscal year ended October 31, 2017, the Fund designated approximately $785,743 under the Internal Revenue Code as qualified dividend income eligible for reduced tax rates.
The dividends paid by the Fund during the fiscal year ended October 31, 2017 should be multiplied by the 0.18% to arrive at the amount eligible for the corporate dividend-received deduction.
In February 2018, shareholders will receive an IRS Form 1099-DIV or substitute Form 1099, which will show the federal tax status of the distributions received by shareholders in calendar year 2017. The amounts that will be reported on such 1099-DIV or substitute Form 1099 will be the amounts you are to use on your federal income tax return and will differ from the amounts which we must report for the Fund’s fiscal year end October 31, 2017.
Proxy Voting Policies and Procedures and Proxy Voting Record
A description of the policies and procedures that New York Life Investments uses to vote proxies related to the Fund’s securities is available without charge, upon request, (i) by visiting the MainStay Funds’ website at mainstayinvestments.com; and (ii) on the Securities and Exchange Commission’s (“SEC”) website at www.sec.gov.
The Fund is required to file with the SEC its proxy voting records for the Fund for the 12-month period ending June 30 on Form N-PX. The most recent Form N-PX or proxy voting record is available free of charge upon request by calling 800-MAINSTAY (624-6782); visiting the MainStay Funds’ website at mainstayinvestments.com; or on the SEC’s website at www.sec.gov.
Shareholder Reports and Quarterly Portfolio Disclosure
The Fund is required to file its complete schedule of portfolio holdings with the SEC for its first and third fiscal quarters on Form N-Q. The Fund’s Form N-Q is available without charge, on the SEC’s website at www.sec.gov or by calling MainStay Investments at 800-MAINSTAY (624-6782). You also can obtain and review copies of Form N-Q by visiting the SEC’s Public Reference Room in Washington, DC (information on the operation of the Public Reference Room may be obtained by calling 1-800-SEC-0330).
Board of Trustees and Officers (Unaudited)
The Trustees and officers of the Funds are listed below. The Board oversees the MainStay Group of Funds (which consists of The MainStay Funds and MainStay Funds Trust), MainStay VP Funds Trust, MainStay DefinedTerm Municipal Opportunities Fund, the Manager and the Subadvisors, and elects the officers of the Funds who are responsible for the day-to-day operations of the Funds. Information pertaining to the Trustees and officers is set forth below. Each Trustee serves until his or her successor is elected and qualified or until his or her resignation, death or removal. Under the Board’s retirement policy, unless an exception is made, a Trustee must tender his or her resignation by the
end of the calendar year during which he or she reaches the age of 75. Mr. Meenan reached the age of 75 during the calendar year 2016, and his term was extended for one additional year. Accordingly, Mr. Meenan is expected to serve until the end of calendar year 2017, at which time he intends to retire. Officers are elected annually by the Board. The business address of each Trustee and officer listed below is 51 Madison Avenue, New York, New York 10010. A majority of the Trustees are not “interested persons” (as defined by the 1940 Act and rules adopted by the SEC thereunder) of the Fund (“Independent Trustees”).
| | | | | | | | | | | | |
| | | | | Name and Date of Birth | | Term of Office, Position(s) Held and Length of Service | | Principal Occupation(s) During Past Five Years | | Number of
Portfolios in
the MainStay
Group of Funds
Overseen by
Trustee | | Other Directorships Held by Trustee |
| Interested Trustee | | | | Yie-Hsin Hung* 8/12/62 | | The MainStay Funds: Trustee since January 2017; MainStay Funds Trust: Trustee since January 2017. | | Senior Vice President of New York Life since joining in 2010, Member of the Executive Management Committee since January 1, 2017, Chief Executive Officer, New York Life Investment Management Holdings LLC & New York Life Investment Management LLC since May 2015. Senior Managing Director and Co-President of New York Life Investment Management LLC from January 2014 to May 2015. Previously held positions of increasing responsibility, including head of NYLIM International, Alternative Growth Businesses, and Institutional investments since joining New York Life in 2010. | | 82 | | None |
| | * | This Trustee is considered to be an “interested person” of the MainStay Group of Funds, MainStay VP Funds Trust and MainStay DefinedTerm Municipal Opportunities Fund, within the meaning of the 1940 Act because of her affiliation with New York Life Insurance Company, New York Life Investment Management LLC, Candriam Belgium, Candriam France S.A.S., Cornerstone Capital Management Holdings LLC, MacKay Shields LLC, NYL Investors LLC, NYLIFE Securities LLC and/or NYLIFE Distributors LLC, as described in detail above in the column entitled “Principal Occupation(s) During Past Five Years.” |
| | |
| 46 | | MainStay High Yield Corporate Bond Fund |
| | | | | | | | | | | | |
| | | | | Name and Date of Birth | | Term of Office, Position(s) Held and Length of Service | | Principal Occupation(s) During Past Five Years | | Number of
Portfolios in
the MainStay
Group of Funds
Overseen by
Trustee | | Other Directorships Held by Trustee |
| Independent Trustees | | | | David H. Chow 12/29/57 | | The MainStay Funds: Trustee since January 2016, Advisory Board Member (June 2015 to December 2015); MainStay Funds Trust: Trustee since January 2016, Advisory Board Member (June 2015 to December 2015). | | Founder and CEO, DanCourt Management, LLC (since 1999) | | 82 | | VanEck Vectors Group of Exchange-Traded Funds: Independent Chairman of the Board of Trustees since 2008 and Trustee since 2006 (57 portfolios); and
Berea College of Kentucky: Trustee since 2009. |
| | | | Susan B. Kerley 8/12/51 | | The MainStay Funds: Chairman since January 2017 and Trustee since 2007; MainStay Funds Trust: Chairman since January 2017 and Trustee since 1990.** | | President, Strategic Management Advisors LLC (since 1990) | | 82 | | Legg Mason Partners Funds: Trustee since 1991 (54 portfolios). |
| | | | Alan R. Latshaw 3/27/51 | | The MainStay Funds: Trustee and Audit Committee Financial Expert since 2006; MainStay Funds Trust: Trustee and Audit Committee Financial Expert since 2007.** | | Retired; Partner, Ernst & Young LLP (2002 to 2003); Partner, Arthur Andersen LLP (1989 to 2002); Consultant to the MainStay Funds Audit and Compliance Committee (2004 to 2006) | | 82 | | State Farm Associates Funds Trusts: Trustee since 2005 (4 portfolios);
State Farm Mutual Fund Trust: Trustee since 2005 (15 portfolios); and
State Farm Variable Product Trust: Trustee since 2005 (9 portfolios). |
| | | | Peter Meenan 12/5/41 | | The MainStay Funds: Trustee since 2007; MainStay Funds Trust: Trustee since 2002.** | | Retired; Independent Consultant (2004 to 2013); President and Chief Executive Officer, Babson—United, Inc. (financial services firm) (2000 to 2004); Independent Consultant (1999 to 2000); Head of Global Funds, Citicorp (1995 to 1999) | | 82 | | None |
| | | | Richard H. Nolan, Jr. 11/16/46 | | The MainStay Funds: Trustee since 2007; MainStay Funds Trust: Trustee since 2007.** | | Managing Director, ICC Capital Management (since 2004); President—Shields/Alliance, Alliance Capital Management (1994 to 2004) | | 82 | | None |
| | | | Jacques P. Perold 5/12/58 | | The MainStay Funds: Trustee since January 2016, Advisory Board Member (June 2015 to December 2015); MainStay Funds Trust: Trustee since January 2016, Advisory Board Member (June 2015 to December 2015). | | Retired; President, Fidelity Management & Research Company (2009 to 2014); Founder, President and Chief Executive Officer, Geode Capital Management, LCC (2001 to 2009) | | 82 | | Allstate Corporation: Director since 2015; MSCI, Inc. Director since March 2017 and
Boston University: Trustee since 2014. |
| | | | Richard S. Trutanic 2/13/52 | | The MainStay Funds: Trustee since 1994; MainStay Funds Trust: Trustee since 2007.** | | Chairman and Chief Executive Officer, Somerset & Company (financial advisory firm) (since 2004); Managing Director, The Carlyle Group (private investment firm) (2002 to 2004); Senior Managing Director, Partner and Board Member, Groupe Arnault S.A. (private investment firm) (1999 to 2002) | | 82 | | None |
| | ** | Includes prior service as a Director/Trustee of certain predecessor entities to MainStay Funds Trust. |
| | | | | | | | |
| | | | | Name and Date of Birth | | Position(s) Held and Length of Service | | Principal Occupation(s) During Past Five Years |
Officers of the Trust (Who are not Trustees)* | | | | Kirk C. Lehneis 6/29/74 | | President, The MainStay Funds, MainStay Funds Trust (since September 2017) | | Chief Operating Officer and Senior Managing Director (since 2016), New York Life Investment Management LLC; Chairman of the Board (since September 2017), NYLIFE Distributors LLC; Chairman of the Board, NYLIM Service Company LLC (since September 2017); President, MainStay DefinedTerm Municipal Opportunities Fund and MainStay VP Funds Trust (since September 2017); Senior Managing Director, Global Product Development (From March 2015—May 2016); Managing Director, Product Development (From March 2010—February 2015) |
| | | | Jack R. Benintende 5/12/64 | | Treasurer and Principal Financial and Accounting Officer, The MainStay Funds (since 2007), MainStay Funds Trust (since 2009) | | Managing Director, New York Life Investment Management LLC (since 2007); Treasurer and Principal Financial and Accounting Officer, MainStay DefinedTerm Municipal Opportunities Fund (since 2011) and MainStay VP Funds Trust (since 2007)**; and Assistant Treasurer, New York Life Investment Management Holdings LLC (2008 to 2012) |
| | | | Kevin M. Bopp 2/24/69 | | Vice President and Chief Compliance Officer, The MainStay Funds and MainStay Funds Trust (since 2014) | | Chief Compliance Officer, New York Life Investment Management LLC, IndexIQ ETF (since January 2016), Director and Associate General Counsel (2011 to 2014) and Vice President and Assistant General Counsel (2010 to 2011), New York Life Investment Management LLC; Vice President and ChiefCompliance Officer, MainStay VP Funds Trust, MainStay DefinedTerm Municipal Opportunities Fund (since 2014); Assistant Secretary, MainStay Funds, MainStay Funds Trust and MainStay VP Funds Trust (2010 to 2014)**, MainStay DefinedTerm Municipal Opportunities Fund (2011 to 2014) |
| | | | J. Kevin Gao 10/13/67 | | Secretary and Chief Legal Officer, The MainStay Funds and MainStay Funds Trust (since 2010) | | Managing Director and Associate General Counsel, New York Life Investment Management LLC (since 2010); Secretary and Chief Legal Officer, MainStay DefinedTerm Municipal Opportunities Fund (since 2011) and MainStay VP Funds Trust (since 2010)** |
| | | | Scott T. Harrington 2/8/59 | | Vice President—Administration, The MainStay Funds (since 2005), MainStay Funds Trust (since 2009) | | Director, New York Life Investment Management LLC (including predecessor advisory organizations) (since 2000); Member of the Board of Directors, New York Life Trust Company (since 2009); Vice President—Administration, MainStay DefinedTerm Municipal Opportunities Fund (since 2011) and MainStay VP Funds Trust (since 2005)** |
| | * | The officers listed above are considered to be “interested persons” of the MainStay Group of Funds, MainStay VP Funds Trust and MainStay Defined Term Municipal Opportunities Fund within the meaning of the 1940 Act because of their affiliation with the MainStay Group of Funds, New York Life Insurance Company and/or its affiliates, including New York Life Investment Management LLC, NYLIM Service Company LLC, NYLIFE Securities LLC and/or NYLIFE Distributors LLC, as described in detail in the column captioned “Principal Occupation(s) During Past Five Years.” Officers are elected annually by the Board. |
| | ** | Includes prior service as an officer of MainStay VP Series Fund, Inc., the predecessor to MainStay VP Funds Trust. |
| | |
| 48 | | MainStay High Yield Corporate Bond Fund |
This page intentionally left blank
This page intentionally left blank
MainStay Funds
Equity
U.S. Equity
MainStay Common Stock Fund
MainStay Cornerstone Growth Fund
MainStay Epoch U.S. All Cap Fund
MainStay Epoch U.S. Equity Yield Fund
MainStay Epoch U.S. Small Cap Fund
MainStay Large Cap Growth Fund
MainStay MAP Equity Fund
MainStay S&P 500 Index Fund
MainStay U.S. Equity Opportunities Fund
International/Global Equity
MainStay Candriam Emerging Markets Equity Fund
MainStay Emerging Markets Equity Fund
MainStay Epoch Capital Growth Fund
MainStay Epoch Global Choice Fund
MainStay Epoch Global Equity Yield Fund
MainStay Epoch International Choice Fund
MainStay Epoch International Small Cap Fund
MainStay International Equity Fund
MainStay International Opportunities Fund
Income
Taxable Bond
MainStay Emerging Markets Debt Fund
MainStay Floating Rate Fund
MainStay Government Fund
MainStay High Yield Corporate Bond Fund
MainStay Indexed Bond Fund
MainStay Short Duration High Yield Fund
MainStay Total Return Bond Fund
MainStay Unconstrained Bond Fund
Municipal/Tax Advantaged Bond
MainStay California Tax Free Opportunities Fund1
MainStay High Yield Municipal Bond Fund
MainStay New York Tax Free Opportunities Fund2
MainStay Tax Advantaged Short Term Bond Fund
MainStay Tax Free Bond Fund
Money Market
MainStay Money Market Fund
Mixed Asset
MainStay Balanced Fund
MainStay Convertible Fund
MainStay Income Builder Fund
Alternative
MainStay Absolute Return Multi-Strategy Fund
MainStay Cushing Energy Income Fund
MainStay Cushing MLP Premier Fund
MainStay Cushing Renaissance Advantage Fund
Asset Allocation/Target Date
MainStay Conservative Allocation Fund
MainStay Growth Allocation Fund
MainStay Moderate Allocation Fund
MainStay Moderate Growth Allocation Fund
MainStay Retirement 2010 Fund
MainStay Retirement 2020 Fund
MainStay Retirement 2030 Fund
MainStay Retirement 2040 Fund
MainStay Retirement 2050 Fund
MainStay Retirement 2060 Fund
Manager
New York Life Investment Management LLC
New York, New York
Subadvisors
Candriam Belgium S.A.3
Brussels, Belgium
Candriam France S.A.S.3
Paris, France
Cornerstone Capital Management Holdings LLC3
New York, New York
Cushing Asset Management, LP
Dallas, Texas
Epoch Investment Partners, Inc.
New York, New York
MacKay Shields LLC3
New York, New York
Markston International LLC
White Plains, New York
NYL Investors LLC3
New York, New York
Winslow Capital Management, LLC
Minneapolis, Minnesota
Legal Counsel
Dechert LLP
Washington, District of Columbia
Independent Registered Public Accounting Firm
KPMG LLP
Philadelphia, Pennsylvania
1. Class A and Class I shares of this Fund are registered for sale in AZ, CA, MI, NV, OR, TX, UT and WA. Class I shares are registered for sale in CO, FL, GA, HI, ID, MA, MD, NH, NJ and NY.
2. This Fund is registered for sale in CA, CT, DE, FL, MA, NJ, NY and VT.
3. An affiliate of New York Life Investment Management LLC.
Not part of the Annual Report
For more information
800-MAINSTAY (624-6782)
mainstayinvestments.com
MainStay Investments® is a registered service mark and name under which New York Life Investment Management LLC does business. MainStay Investments, an indirect subsidiary of New York Life Insurance Company, New York, NY 10010, provides investment advisory products and services. The MainStay Funds® are managed by New York Life Investment Management LLC and distributed by NYLIFE Distributors LLC, 30 Hudson Street, Jersey City, NJ 07302, a wholly owned subsidiary of New York Life Insurance Company. NYLIFE Distributors LLC is a Member FINRA/SIPC.
©2017 NYLIFE Distributors LLC. All rights reserved.
| | | | | | | | |
| Not FDIC/NCUA Insured | | Not a Deposit | | May Lose Value | | No Bank Guarantee | | Not Insured by Any Government Agency |
| | |
| 1717584 MS286-17 | | MSHY11-12/17 (NYLIM) NL212 |
MainStay Money Market Fund
Message from the President and Annual Report
October 31, 2017


This page intentionally left blank
Message from the President
The 12 months ended October 31, 2017, brought strong performance to equity markets in the United States and abroad.
According to FTSE-Russell data for the U.S. market, stocks at all capitalization levels earned solid double-digit overall returns during the reporting period. Total returns for stocks in general exceeded 20% at all capitalization levels. Growth stocks were particularly strong, outperforming value stocks for companies of all sizes except among microcaps, where value stocks outperformed growth stocks.
Several factors contributed to the strength of domestic and international stock markets during the reporting period. Following the U.S. presidential election in November 2016, many investors looked forward to business tax incentives and possible tax cuts for consumers that could stimulate economic growth. During the reporting period, corporate earnings reports remained strong; and growth in U.S. real gross domestic product remained positive, with a substantial advance during the second quarter of 2017. Developed international markets and emerging markets were also strong, boosted by positive macroeconomic data and growing confidence that Europe was well on its way to financial recovery. Despite wide variations among emerging markets, many saw strong appreciation in local-currency terms and benefited from a weaker U.S. dollar.
During the reporting period, the Federal Open Market Committee raised the federal funds target range three times—in December of 2016 and in March and June of 2017. These incremental increases raised the federal funds target range to 1.00% to 1.25% by the end of the reporting period. These tightening moves were followed by higher U.S. Treasury yields at all maturities, with the greatest increases at the short-end of the maturity spectrum.
As interest rates rise, bond prices tend to decline (and vice versa). As a result, some portions of the U.S. Treasury market recorded negative total returns during the reporting period. Agency securities posted small but positive total returns, as did
asset-backed and mortgage-backed securities. Other bond categories, particularly those with looser ties to U.S. interest rates, did considerably better. Emerging-market debt recorded solid single-digit returns; high-yield bonds were generally stronger; and convertible bonds, which are closely tied to the performance of underlying stocks, provided some of the strongest overall returns of any fixed-income sector during the reporting period.
At MainStay, we have always encouraged investors to diversify their investments and maintain a long-term perspective, even when markets are strong. Asset classes that perform well in one environment may perform differently in another; and in today’s ever-changing world, wide market swings are not unknown.
MainStay offers Funds with a wide array of investment objectives to help our shareholders pursue the appropriate diversification for their long-range financial goals. We also offer several investment boutiques, allowing our shareholders to choose the style—or mix of styles—that’s best suited to their investment needs. We believe that relatively few individual investors can match the level of professional experience and market insight that our portfolio managers provide.
The report that follows provides more detailed information on the specific markets, investment strategies and portfolio decisions that affected your MainStay Fund during the 12 months ended October 31, 2017. We encourage you to read the report carefully and use it to help you evaluate your progress toward your financial goals.
Sincerely,

Kirk C. Lehneis
President
The opinions expressed are as of the date of this report and are subject to change. There is no guarantee that any forecast made will come to pass. This material does not constitute investment advice and is not intended as an endorsement of any specific investment. Past performance is no guarantee of future results.
Not part of the Annual Report
Table of Contents
An investment in the Fund is not insured or guaranteed by the Federal Deposit Insurance Corporation or any other government agency. Although the Fund seeks to preserve the value of your investment at $1.00 per share, it is possible to lose money by investing in the Fund. The Fund’s sponsor has no legal obligation to provide financial support to the Fund, and you should not expect that the sponsor will provide financial support at any time. The Fund may impose a fee upon the sale of your shares or may temporarily suspend your ability to sell shares if the Fund’s liquidity falls below required minimums because of market conditions or other factors.
Investors should refer to the Fund’s Summary Prospectus and/or Prospectus and consider the Fund’s investment objectives, strategies, risks, charges and expenses carefully before investing. The Summary Prospectus and/or Prospectus contain this and other information about the Fund. You may obtain copies of the Fund’s Summary Prospectus, Prospectus and Statement of Additional Information free of charge, upon request, by calling toll-free 800-MAINSTAY (624-6782), by writing to NYLIFE Distributors LLC, Attn: MainStay Marketing Department, 30 Hudson Street, Jersey City, NJ 07302 or by sending an e-mail to MainStayShareholderServices@nylim.com. These documents are also available via the MainStay Funds’ website at mainstayinvestments.com/documents. Please read the Summary Prospectus and/or Prospectus carefully before investing.
Investment and Performance Comparison1 (Unaudited)
Performance data quoted represents past performance. Past performance is no guarantee of future results. Because of market volatility and other factors, current performance may be lower or higher than the figures shown. Investment return and principal value will fluctuate, and as a result, when shares are redeemed, they may be worth more or less than their original cost. The graph below depicts the historical performance of Class B2 shares of the Fund. Performance will vary from class to class based on differences in class-specific expenses. For performance information current to the most recent month-end, please call 800-MAINSTAY (624-6782) or visit mainstayinvestments.com.
An investment in the Fund is not insured or guaranteed by the Federal Deposit Insurance Corporation or any other government agency. Although the Fund seeks to preserve the value of your investment at $1.00 per share, it is possible to lose money by investing in the Fund.
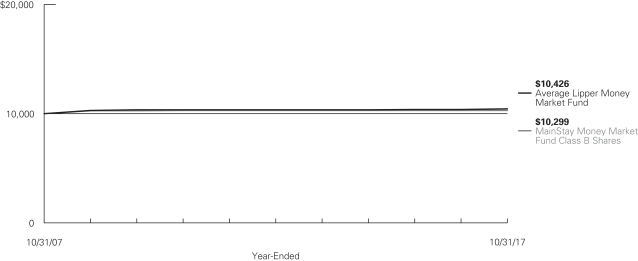
Average Annual Total Returns for the Year-Ended October 31, 2017
| | | | | | | | | | | | | | | | | | | | |
| Class | | Sales Charge | | Inception
Date | | One Year | | | Five Years | | | Ten Years
or Since
Inception | | | Gross Expense Ratio3 | |
| Class A Shares4 | | No Sales Charge | | 1/3/1995 | | | 0.35 | % | | | 0.08 | % | | | 0.32 | % | | | 0.57 | % |
| Investor Class Shares4 | | No Sales Charge | | 2/28/2008 | | | 0.20 | | | | 0.05 | | | | 0.17 | | | | 0.76 | |
| Class B Shares4 | | No Sales Charge | | 5/1/1986 | | | 0.20 | | | | 0.05 | | | | 0.29 | | | | 0.76 | |
| Class C Shares4 | | No Sales Charge | | 9/1/1998 | | | 0.20 | | | | 0.05 | | | | 0.29 | | | | 0.76 | |
| | | | | |
| | | | | | | | | | | | | | | | | | |
| 1. | The performance table and graph do not reflect the deduction of taxes that a shareholder would pay on distributions or Fund share redemptions. Total returns reflect changes in share price, and reinvestment of dividend and capital gain distributions. The graph assumes the initial investment amount shown above. Performance figures may reflect certain fee waivers and/or expense limitations, without which total returns would have been lower. For more information on share classes and current fee waivers and/or expense limitations (if any), please refer to the Notes to Financial Statements. |
| 2. | Class B shares are closed to all new purchases as well as additional investments by existing Class B shareholders. |
| 3. | The gross expense ratios presented reflect the Fund’s “Total Annual Fund Operating Expenses” from the most recent Prospectus and may differ from other expense ratios disclosed in this report. |
| 4. | As of October 31, 2017, MainStay Money Market Fund had an effective 7-day yield of 0.56% for Class A, and 0.24% for Investor Class, B and C shares. The 7-day current yield was 0.56% for Class A, and 0.24% for Investor Class, Class B and C shares. These yields reflect certain expense limitations. Had these expense limitations not been in effect, the effective 7-day yield would have been 0.56%, 0.28%, 0.28% and 0.28%, for Class A, Investor Class, Class B and C shares, respectively, and the 7-day current yield would have been 0.56%, 0.28%, 0.28% and 0.28%, for Class A, Investor Class, Class B and C shares, respectively. The current yield reflects the Fund’s earnings better than the Fund’s total return. |
The footnotes on the next page are an integral part of the table and graph and should be carefully read in conjunction with them.
| | | | | | | | | | | | |
| Benchmark Performance | | One
Year | | | Five Years | | | Ten Years
or Since
Inception | |
Average Lipper Money Market Fund5 | | | 0.52 | % | | | 0.14 | % | | | 0.42 | % |
Morningstar Prime Money Market Category Average6 | | | 0.52 | | | | 0.14 | | | | 0.43 | |
| 5. | The Average Lipper Money Market Fund is an equally weighted performance average adjusted for capital gains distributions and income dividends of all of the money market funds in the Lipper Universe. Lipper Inc., a wholly-owned subsidiary of Thomson Reuters, is an independent monitor of mutual fund performance. Results do not reflect any deduction of sales charges. Lipper averages are not class specific. Lipper returns are unaudited. Results are based on average total returns of similar funds with all dividend and capital gain distributions reinvested. |
| 6. | The Morningstar Prime Money Market Category Average is representative of funds that invest in short-term money market securities in order to provide a level of current income that is consistent with the preservation of capital. Results are based on average total returns of similar funds with all dividends and capital gain distributions reinvested. |
The footnotes on the preceding page are an integral part of the table and graph and should be carefully read in conjunction with them.
| | |
| 6 | | MainStay Money Market Fund |
Cost in Dollars of a $1,000 Investment in MainStay Money Market Fund (Unaudited)
The example below is intended to describe the fees and expenses borne by shareholders during the six-month period from May 1, 2017, to October 31, 2017, and the impact of those costs on your investment.
Example
As a shareholder of the Fund you incur two types of costs: (1) transaction costs, including exchange fees and sales charges (loads) on purchases (as applicable), and (2) ongoing costs, including management fees, distribution and/or service (12b-1) fees, and other Fund expenses (as applicable). This example is intended to help you understand your ongoing costs (in dollars) of investing in the Fund and to compare these costs with the ongoing costs of investing in other mutual funds. The example is based on an investment of $1,000 made at the beginning of the six-month period and held for the entire period from May 1, 2017, to October 31, 2017.
This example illustrates your Fund’s ongoing costs in two ways:
Actual Expenses
The second and third data columns in the table below provide information about actual account values and actual expenses. You may use the information in these columns, together with the amount you invested, to estimate the expenses that you paid during the six months ended October 31, 2017. Simply divide your account value by $1,000 (for example, an $8,600 account value divided by $1,000 = 8.6), then
multiply the result by the number under the heading entitled “Expenses Paid During Period” to estimate the expenses you paid on your account during this period.
Hypothetical Example for Comparison Purposes
The fourth and fifth data columns in the table below provide information about hypothetical account values and hypothetical expenses based on the Fund’s actual expense ratio and an assumed rate of return of 5% per year before expenses, which is not the Fund’s actual return. The hypothetical account values and expenses may not be used to estimate the actual ending account balances or expenses you paid for the six-month period shown. You may use this information to compare the ongoing costs of investing in the Fund with the ongoing costs of investing in other mutual funds. To do so, compare this 5% hypothetical example with the 5% hypothetical examples that appear in the shareholder reports of the other mutual funds.
Please note that the expenses shown in the table are meant to highlight your ongoing costs only and do not reflect any transactional costs, such as exchange fees or sales charges (loads). Therefore, the fourth and fifth data columns of the table are useful in comparing ongoing costs only and will not help you determine the relative total costs of owning different funds. In addition, if these transactional costs were included, your costs would have been higher.
| | | | | | | | | | | | | | | | | | | | | | | | |
| | | | | | | | | | | | | | | | | | | |
Share Class | | Beginning
Account
Value
5/1/17 | | | Ending Account
Value (Based
on Actual
Returns and
Expenses)
10/31/17 | | | Expenses
Paid
During
Period1 | | | Ending Account
Value (Based
on Hypothetical
5% Annualized
Return and
Actual Expenses)
10/31/17 | | | Expenses
Paid
During
Period1 | | | Net Expense
Ratio
During
Period2 | |
| | | | | | |
| Class A Shares | | $ | 1,000.00 | | | $ | 1,002.60 | | | $ | 2.98 | | | $ | 1,022.20 | | | $ | 3.01 | | | | 0.59 | % |
| | | | | | |
| Investor Class Shares | | $ | 1,000.00 | | | $ | 1,001.50 | | | $ | 3.99 | | | $ | 1,021.20 | | | $ | 4.02 | | | | 0.79 | % |
| | | | | | |
| Class B Shares | | $ | 1,000.00 | | | $ | 1,001.50 | | | $ | 4.04 | | | $ | 1,021.20 | | | $ | 4.08 | | | | 0.80 | % |
| | | | | | |
| Class C Shares | | $ | 1,000.00 | | | $ | 1,001.50 | | | $ | 4.04 | | | $ | 1,021.20 | | | $ | 4.08 | | | | 0.80 | % |
| 1. | Expenses are equal to the Fund’s annualized expense ratio of each class multiplied by the average account value over the period, divided by 365 and multiplied by 184 (to reflect the six-month period). The table above represents the actual expenses incurred during the six-month period. |
| 2. | Expenses are equal to the Fund’s annualized expense ratio to reflect the six-month period. |
Portfolio Composition as of October 31, 2017 (Unaudited)
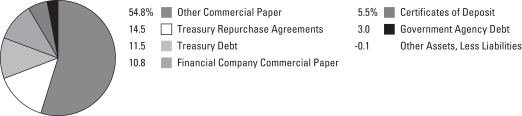
See Portfolio of Investments beginning on page 10 for specific holdings within these categories.
| | |
| 8 | | MainStay Money Market Fund |
Portfolio Management Discussion and Analysis (Unaudited)
Questions answered by portfolio managers Thomas J. Girard and David E. Clement, CFA, of NYL Investors LLC, the Fund’s Subadvisor.
How did MainStay Money Market Fund perform relative to its peers during the 12 months ended October 31, 2017?
As of October 31, 2017, MainStay Money Market Fund provided a 7-day current yield of 0.56% for Class A shares and 0.24% for Investor Class, Class B and Class C shares. As of the same date, the Fund provided a 7-day effective yield of 0.56% for Class A shares and 0.24% for all other share classes. For the 12 months ended October 31, 2017, Class A shares returned 0.35% and Investor Class, Class B and Class C shares each returned 0.20%. All share classes underperformed the 0.52% return of the Average Lipper Money Market Fund1 for the 12 months ended October 31, 2017. All share classes underperformed the 0.52% return of the Morningstar Prime Money Market Category Average2 for the 12 months ended October 31, 2017. Performance figures for the Fund reflect certain fee waivers and/or expense limitations without which total returns would have been lower.
What factors affected the Fund’s performance during the reporting period?
The Fund’s performance was negatively affected by its holdings in repurchase agreements. As short-term interest rates increased during the reporting period, repurchase agreements backed by U.S. Treasury securities became more expensive relative to other investments like commercial paper and certificates of deposit. As short-term interest rates continued to rise during the reporting period, the risk premium for longer maturities widened, as did the spread3 between U.S. Treasury-backed securities such as repurchase agreements and the securities of corporate borrowers.
What was the Fund’s duration4 during the reporting period?
The Fund’s duration was increased from 29 days to 36 days during the reporting period. This was done for two reasons. The first reason was to take advantage of the higher rates offered by securities with longer maturities. The second was to keep the Fund’s duration short enough to benefit from higher short-term rates as the Federal Reserve progressively raised the targeted federal funds range. During the reporting period, the Federal Reserve raised the targeted federal funds range by 25 basis
points in December 2016, by an additional 25 basis points in March 2017 and by another 25 basis points in June 2017.
What specific factors, risks or market forces prompted significant decisions for the Fund during the reporting period?
The primary factor that influenced the direction of the Fund was the Federal Reserve’s decision to progressively raise the federal funds target range, which affected the direction of short-term interest rates.
During the reporting period, which market segments were the strongest contributors to the Fund’s performance and which market segments were particularly weak?
During the reporting period, certificates of deposit were positive contributors to the Fund’s performance. (Contributions take weightings and total returns into account.) Certificates of deposit with floating-rate or fixed-rate coupons continued to offer attractive yields relative to other short-term investments. As interest rates rose during the reporting period, the yields on repurchase agreements lagged the yields on most other short-term investments.
Did the Fund make any significant purchases or sales during the reporting period?
The Fund made several significant purchases during the reporting period. Among these were National Rural Utility Cooperative Corporation floating-rate corporate notes due 5/12/2017 and Canadian Imperial Bank floating-rate certificates of deposit due 11/13/2018. These investments provided access to higher yields and allowed the Fund to participate in a rising rate environment. There were no significant sales during the reporting period.
How did the Fund’s asset-class weightings change during the reporting period?
As of October 31, 2017, the Fund increased its asset-class weighting in commercial paper. Over the same period, the Fund decreased its asset-class weighting in repurchase agreements.
| 1. | See footnote on page 6 for more information on the Average Lipper Money Market Fund. |
| 2. | See footnote on page 6 for more information on Morningstar Money Market Category Average. |
| 3. | The terms “spread” and “yield spread” may refer to the difference in yield between a security or type of security and comparable U.S. Treasury issues. The term may also refer to the difference in yield between two specific securities or types of securities at a given time. |
| 4. | Duration is a measure of the price sensitivity of a fixed-income investment to changes in interest rates. Duration is expressed as a number of days or years and is considered a more accurate sensitivity gauge than average maturity. |
The opinions expressed are those of the portfolio managers as of the date of this report and are subject to change. There is no guarantee that any forecasts will come to pass. This material does not constitute investment advice and is not intended as an endorsement of any specific investment.
Portfolio of Investments October 31, 2017
| | | | | | | | |
| | | Principal
Amount | | | Amortized
Cost | |
| Short-Term Investments 100.1% | |
Certificates of Deposit 5.5% | |
Bank of Montreal
1.459% (1-month USD-LIBOR-BBA + 0.22%), due 9/14/18 (a) | | $ | 5,000,000 | | | $ | 5,000,000 | |
Canadian Imperial Bank of Commerce
1.499% (1-month USD-LIBOR-BBA + 0.26%), due 11/13/18 (a) | | | 4,000,000 | | | | 4,000,000 | |
Royal Bank of Canada (a)
1.352% (1-month USD-LIBOR-BBA + 0.11%), due 3/28/18 | | | 4,000,000 | | | | 4,000,000 | |
1.499% (1-month USD-LIBOR-BBA + 0.26%), due 12/20/17 | | | 5,000,000 | | | | 5,000,000 | |
| | | | | | | | |
Total Certificates of Deposit
(Cost $18,000,000) | | | | 18,000,000 | |
| | | | | | | | |
|
Financial Company Commercial Paper 10.8% | |
Bank of Nova Scotia
1.496% (3-month USD-LIBOR-BBA + 0.14%), due 4/11/18 (b) | | | 4,000,000 | | | | 4,000,000 | |
Canadian Imperial Bank of Commerce
1.768% (1-month USD-LIBOR-BBA + 0.53%), due 1/19/18 (b) | | | 5,000,000 | | | | 5,000,000 | |
Commonwealth Bank of Australia
1.469% (1-month USD-LIBOR-BBA + 0.23%), due 4/16/18 (b) | | | 4,000,000 | | | | 4,000,000 | |
Massachusetts Mutual Life Insurance Co.
1.168%, due 11/13/17 (b)(c) | | | 5,000,000 | | | | 4,998,000 | |
National Rural Utilities Cooperative
Finance Corp.
1.208%, due 11/21/17 (c) | | | 5,000,000 | | | | 4,996,861 | |
Nationwide Life Insurance Co. (b)(c) | | | | | | | | |
1.185%, due 11/3/17 | | | 5,000,000 | | | | 4,999,667 | |
1.216%, due 11/27/17 | | | 2,500,000 | | | | 2,497,887 | |
Ontario Teachers’ Finance Trust
1.215%, due 11/3/17 (b)(c) | | | 5,000,000 | | | | 4,999,672 | |
| | | | | | | | |
Total Financial Company Commercial Paper
(Cost $35,492,087) | | | | 35,492,087 | |
| | | | | | | | |
|
Government Agency Debt 3.0% | |
Federal Agricultural Mortgage 1.00%, due 11/1/17 (c) | | | 10,000,000 | | | | 10,000,000 | |
| | | | | | | | |
Total Government Agency Debt
(Cost $10,000,000) | | | | 10,000,000 | |
| | | | | | | | |
|
Other Commercial Paper 54.8% | |
Alabama Power Co.
1.375%, due 11/3/17 (b)(c) | | | 5,000,000 | | | | 4,999,653 | |
| | | | | | | | |
| | | Principal
Amount | | | Amortized
Cost | |
Other Commercial Paper (continued) | |
American Honda Finance Corp. (c) | |
1.156%, due 12/6/17 | | $ | 3,000,000 | | | $ | 2,996,529 | |
1.162%, due 12/12/17 | | | 3,000,000 | | | | 2,995,900 | |
Apple, Inc.
1.119%, due 11/28/17 (b)(c) | | | 5,000,000 | | | | 4,995,688 | |
Army & Air Force Exchange Service
1.099%, due 11/6/17 (b)(c) | | | 5,000,000 | | | | 4,999,222 | |
Atmos Energy Corp.
1.191%, due 11/8/17 (b)(c) | | | 4,000,000 | | | | 3,999,082 | |
Bristol-Myers Squibb Co.
1.119%, due 11/29/17 (b)(c) | | | 2,500,000 | | | | 2,497,783 | |
Brown-forman Corp. (b)(c) | |
1.394%, due 11/21/17 | | | 2,500,000 | | | | 2,498,292 | |
1.395%, due 11/22/17 | | | 3,000,000 | | | | 2,997,830 | |
Canadian National Railway Co. (b)(c) | |
1.207%, due 11/20/17 | | | 5,000,000 | | | | 4,996,807 | |
1.225%, due 12/5/17 | | | 4,000,000 | | | | 3,995,429 | |
Caterpillar Financial Services Corp. (c) | |
1.343%, due 11/20/17 | | | 2,000,000 | | | | 1,998,681 | |
1.344%, due 11/21/17 | | | 5,000,000 | | | | 4,996,389 | |
1.515%, due 12/15/17 | | | 2,000,000 | | | | 1,996,896 | |
Cisco Systems, Inc.
1.132%, due 12/12/17 (b)(c) | | | 2,500,000 | | | | 2,496,612 | |
Cummins, Inc.
1.201%, due 11/16/17 (b)(c) | | | 5,000,000 | | | | 4,997,646 | |
Eli Lilly & Co.
1.092%, due 11/1/17 (b)(c) | | | 2,500,000 | | | | 2,500,000 | |
Estee Lauder Cos., Inc. (b)(c) | | | | | | | | |
1.182%, due 11/1/17 | | | 3,000,000 | | | | 3,000,000 | |
1.19%, due 11/7/17 | | | 3,000,000 | | | | 2,999,435 | |
1.207%, due 11/20/17 | | | 2,500,000 | | | | 2,498,496 | |
Exxon Mobil Corp.
1.091%, due 11/17/17 (c) | | | 5,000,000 | | | | 4,997,578 | |
Florida Power & Light Co. (c) | | | | | | | | |
1.481%, due 12/11/17 | | | 5,000,000 | | | | 4,992,444 | |
1.483%, due 12/13/17 | | | 4,000,000 | | | | 3,993,793 | |
Henkel of America, Inc.
1.219%, due 11/29/17 (b)(c) | | | 5,000,000 | | | | 4,995,294 | |
Hershey Co. (b)(c) | | | | | | | | |
1.129%, due 11/6/17 | | | 5,000,000 | | | | 4,999,215 | |
1.145%, due 11/22/17 | | | 4,000,000 | | | | 3,997,363 | |
Illinois Tool Works, Inc. (b)(c) | | | | | | | | |
1.182%, due 11/1/17 | | | 4,000,000 | | | | 4,000,000 | |
1.199%, due 11/14/17 | | | 5,000,000 | | | | 4,997,960 | |
International Business Machines Corp.
1.146%, due 12/26/17 (b)(c) | | | 2,125,000 | | | | 2,121,039 | |
John Deere Capital Corp.
1.22%, due 1/16/18 (b)(c) | | | 5,000,000 | | | | 4,986,700 | |
| † | Percentages indicated are based on Fund net assets. |
| | | | |
| 10 | | MainStay Money Market Fund | | The notes to the financial statements are an integral part of,
and should be read in conjunction with, the financial statements. |
| | | | | | | | |
| | | Principal
Amount | | | Amortized
Cost | |
| Short-Term Investments (continued) | |
Other Commercial Paper (continued) | |
Johnson & Johnson
1.104%, due 11/10/17 (c) | | $ | 5,000,000 | | | $ | 4,998,632 | |
Kimberly-Clark Corp.
1.198%, due 11/13/17 (b)(c) | | | 5,000,000 | | | | 4,998,167 | |
Merck & Co., Inc.
1.11%, due 11/15/17 (b)(c) | | | 3,000,000 | | | | 2,998,705 | |
NIKE, Inc.
1.115%, due 11/22/17 (b)(c) | | | 5,000,000 | | | | 4,996,733 | |
Novartis Finance Corp. (b)(c) | | | | | | | | |
1.092%, due 11/1/17 | | | 2,500,000 | | | | 2,500,000 | |
1.119%, due 11/29/17 | | | 6,000,000 | | | | 5,994,633 | |
PACCAR Financial Corp.
1.19%, due 11/7/17 (c) | | | 3,000,000 | | | | 2,999,435 | |
Procter & Gamble Co. (b)(c) | | | | | | | | |
1.11%, due 11/15/17 | | | 2,000,000 | | | | 1,999,106 | |
1.203%, due 1/19/18 | | | 5,000,000 | | | | 4,986,833 | |
United Parcel Service, Inc.
1.131%, due 11/8/17 (b)(c) | | | 5,000,000 | | | | 4,998,940 | |
UnitedHealth Group, Inc.
1.435%, due 11/3/17 (b)(c) | | | 5,000,000 | | | | 4,999,653 | |
Walt Disney Co.
1.241%, due 1/22/18 (b)(c) | | | 5,000,000 | | | | 4,986,333 | |
Washington Gas Light Co.
1.13%, due 11/7/17 (c) | | | 5,150,000 | | | | 5,148,970 | |
Wisconsin Gas LLC
1.434%, due 11/2/17 (c) | | | 5,000,000 | | | | 4,999,836 | |
Wisconsin Public Service
1.439%, due 11/6/17 (c) | | | 5,000,000 | | | | 4,999,139 | |
| | | | | | | | |
Total Other Commercial Paper
(Cost $180,142,871) | | | | | | | 180,142,871 | |
| | | | | | | | |
| | |
Treasury Debt 11.5% | | | | | | | | |
United States Treasury Bill
0.931%, due 11/2/17 (c) | | | 5,000,000 | | | | 4,999,864 | |
United States Treasury Notes | | | | | | | | |
0.625%, due 6/30/18 | | | 5,000,000 | | | | 4,981,190 | |
0.75%, due 4/30/18 | | | 5,000,000 | | | | 4,991,139 | |
0.75%, due 7/31/18 | | | 5,000,000 | | | | 4,980,041 | |
0.75%, due 8/31/18 | | | 3,000,000 | | | | 2,987,770 | |
0.875%, due 1/31/18 | | | 5,000,000 | | | | 5,000,000 | |
0.875%, due 3/31/18 | | | 5,000,000 | | | | 4,996,636 | |
0.875%, due 5/31/18 | | | 5,000,000 | | | | 4,991,555 | |
| | | | | | | | |
Total Treasury Debt
(Cost $37,928,195) | | | | | | | 37,928,195 | |
| | | | | | | | |
| | | | | | | | |
| | | Principal
Amount | | | Amortized
Cost | |
Treasury Repurchase Agreements 14.5% | |
Bank of America N.A.
1.05%, dated 10/31/17
due 11/1/17
Proceeds at Maturity $15,000,438 (Collateralized by a United States Treasury Note with a rate of 2.375% and a maturity date of 12/31/20, with a Principal Amount of $14,900,100 and a Market Value of $15,300,085) | | $ | 15,000,000 | | | $ | 15,000,000 | |
RBC Capital Markets
1.02%, dated 10/31/17
due 11/1/17
Proceeds at Maturity $15,000,425 (Collateralized by United States Treasury securities with rates between 2.00% and 3.875% and a maturity date of 4/30/24 and 8/15/40, with a Principal Amount of $13,620,400 and a Market Value of $15,300,043) | | | 15,000,000 | | | | 15,000,000 | |
TD Securities (U.S.A.) LLC
1.03%, dated 10/31/17
due 11/1/17
Proceeds at Maturity $17,689,506 (Collateralized by a United States Treasury Note with a rate of 1.75% and a maturity date of 9/30/22, with a Principal Amount of $18,235,000 and a Market Value of $18,042,787) | | | 17,689,000 | | | | 17,689,000 | |
| | | | | | | | |
Total Treasury Repurchase Agreements
(Cost $47,689,000) | | | | | | | 47,689,000 | |
| | | | | | | | |
Total Short-Term Investments
(Amortized Cost $329,252,153) (d) | | | 100.1 | % | | | 329,252,153 | |
Other Assets, Less Liabilities | | | (0.1 | ) | | | (411,448 | ) |
Net Assets | | | 100.0 | % | | $ | 328,840,705 | |
| (a) | Floating rate—Rate shown was the rate in effect as of October 31, 2017. |
| (b) | May be sold to institutional investors only under Rule 144A or securities offered pursuant to Section 4(a)(2) of the Securities Act of 1933, as amended. |
| (c) | Interest rate shown represents yield to maturity. |
| (d) | The amortized cost also represents the aggregate cost for federal income tax purposes. |
The following abbreviations are used in the preceding pages:
BBA—British Bankers’ Association
LIBOR—London InterBank Offered Rate
| | | | | | |
The notes to the financial statements are an integral part of,
and should be read in conjunction with, the financial statements. | | | | | 11 | |
Portfolio of Investments October 31, 2017 (continued)
The following is a summary of the fair valuations according to the inputs used as of October 31, 2017, for valuing the Fund’s assets.
Asset Valuation Inputs
| | | | | | | | | | | | | | | | |
Description | | Quoted
Prices in
Active
Markets for
Identical
Assets (Level 1) | | | Significant
Other
Observable
Inputs (Level 2) | | | Significant
Unobservable
Inputs (Level 3) | | | Total | |
| Investments in Securities (a) | | | | | | | | | | | | | | | | |
| Short-Term Investments | | | | | | | | | | | | | | | | |
Certificates of Deposit | | $ | — | | | $ | 18,000,000 | | | $ | — | | | $ | 18,000,000 | |
Financial Company Commercial Paper | | | — | | | | 35,492,087 | | | | — | | | | 35,492,087 | |
Government Agency Debt | | | — | | | | 10,000,000 | | | | — | | | | 10,000,000 | |
Other Commercial Paper | | | — | | | | 180,142,871 | | | | — | | | | 180,142,871 | |
Treasury Debt | | | — | | | | 37,928,195 | | | | — | | | | 37,928,195 | |
Treasury Repurchase Agreements | | | — | | | | 47,689,000 | | | | — | | | | 47,689,000 | |
| | | | | | | | | | | | | | | | |
| Total Investments in Securities | | $ | — | | | $ | 329,252,153 | | | $ | — | | | $ | 329,252,153 | |
| | | | | | | | | | | | | | | | |
| (a) | For a complete listing of investments and their industries, see the Portfolio of Investments. |
The Fund recognizes transfers between the levels as of the beginning of the period.
For the year ended October 31, 2017, the Fund did not have any transfers among levels. (See Note 2)
As of October 31, 2017, the Fund did not hold any investments with significant unobservable inputs (Level 3). (See Note 2)
| | | | |
| 12 | | MainStay Money Market Fund | | The notes to the financial statements are an integral part of,
and should be read in conjunction with, the financial statements. |
Statement of Assets and Liabilities as of October 31, 2017
| | | | |
| Assets | |
Investment in securities, at value
(amortized cost $281,563,153) | | $ | 281,563,153 | |
Repurchase agreements, at value
(amortized cost $47,689,000) | | | 47,689,000 | |
Cash | | | 599 | |
Receivables: | | | | |
Fund shares sold | | | 1,039,258 | |
Interest | | | 76,822 | |
Other assets | | | 35,906 | |
| | | | |
Total assets | | | 330,404,738 | |
| | | | |
| |
| Liabilities | | | | |
Payables: | | | | |
Fund shares redeemed | | | 1,346,629 | |
Manager (See Note 3) | | | 113,593 | |
Transfer agent (See Note 3) | | | 50,548 | |
Shareholder communication | | | 29,102 | |
Custodian | | | 11,592 | |
Professional fees | | | 4,669 | |
Trustees | | | 810 | |
Accrued expenses | | | 5,873 | |
Dividend payable | | | 1,217 | |
| | | | |
Total liabilities | | | 1,564,033 | |
| | | | |
Net assets | | $ | 328,840,705 | |
| | | | |
| |
| Composition of Net Assets | | | | |
Shares of beneficial interest outstanding (par value of $.01 per share) unlimited number of shares authorized | | $ | 3,288,918 | |
Additional paid-in capital | | | 325,551,994 | |
| | | | |
| | | 328,840,912 | |
Distributions in excess of net investment income | | | (74 | ) |
Accumulated net realized gain (loss) on investments | | | (133 | ) |
| | | | |
Net assets | | $ | 328,840,705 | |
| | | | |
| | | | |
Class A | | | | |
Net assets applicable to outstanding shares | | $ | 227,572,414 | |
| | | | |
Shares of beneficial interest outstanding | | | 227,603,070 | |
| | | | |
Net asset value and offering price per share outstanding | | $ | 1.00 | |
| | | | |
Investor Class | | | | |
Net assets applicable to outstanding shares | | $ | 27,086,784 | |
| | | | |
Shares of beneficial interest outstanding | | | 27,098,761 | |
| | | | |
Net asset value and offering price per share outstanding | | $ | 1.00 | |
| | | | |
Class B | | | | |
Net assets applicable to outstanding shares | | $ | 43,350,783 | |
| | | | |
Shares of beneficial interest outstanding | | | 43,356,656 | |
| | | | |
Net asset value and offering price per share outstanding | | $ | 1.00 | |
| | | | |
Class C | | | | |
Net assets applicable to outstanding shares | | $ | 30,830,724 | |
| | | | |
Shares of beneficial interest outstanding | | | 30,833,354 | |
| | | | |
Net asset value and offering price per share outstanding | | $ | 1.00 | |
| | | | |
| | | | | | |
The notes to the financial statements are an integral part of,
and should be read in conjunction with, the financial statements. | | | | | 13 | |
Statement of Operations for the year ended October 31, 2017
| | | | |
| Investment Income (Loss) | |
Income | | | | |
Interest | | $ | 3,230,020 | |
Other income | | | 1,904 | |
| | | | |
Total income | | | 3,231,924 | |
| | | | |
Expenses | | | | |
Manager (See Note 3) | | | 1,509,083 | |
Transfer agent (See Note 3) | | | 588,144 | |
Registration | | | 108,453 | |
Professional fees | | | 82,993 | |
Shareholder communication | | | 54,684 | |
Custodian | | | 37,352 | |
Trustees | | | 8,697 | |
Miscellaneous | | | 15,775 | |
| | | | |
Total expenses before waiver/reimbursement | | | 2,405,181 | |
Expense waiver/reimbursement from Manager (See Note 3) | | | (108,678 | ) |
| | | | |
Net expenses | | | 2,296,503 | |
| | | | |
Net investment income (loss) | | | 935,421 | |
| | | | |
|
| Realized and Unrealized Gain (Loss) on Investments | |
Net realized gain (loss) on investments | | | 50 | |
| | | | |
Net increase (decrease) in net assets resulting from operations | | $ | 935,471 | |
| | | | |
| | | | |
| 14 | | MainStay Money Market Fund | | The notes to the financial statements are an integral part of,
and should be read in conjunction with, the financial statements. |
Statements of Changes in Net Assets
for the years ended October 31, 2017 and October 31, 2016
| | | | | | | | |
| | | 2017 | | | 2016 | |
| Increase (Decrease) in Net Assets | |
Operations: | | | | | | | | |
Net investment income (loss) | | $ | 935,421 | | | $ | 95,970 | |
Net realized gain (loss) on investments | | | 50 | | | | 18 | |
| | | | |
Net increase (decrease) in net assets resulting from operations | | | 935,471 | | | | 95,988 | |
| | | | |
Dividends to shareholders: | | | | | | | | |
From net investment income: | | | | | | | | |
Class A | | | (726,645 | ) | | | (29,064 | ) |
Investor Class | | | (102,568 | ) | | | (6,807 | ) |
Class B | | | (89,200 | ) | | | (6,509 | ) |
Class C | | | (69,767 | ) | | | (5,285 | ) |
| | | | |
Total dividends to shareholders | | | (988,180 | ) | | | (47,665 | ) |
| | | | |
Capital share transactions: | | | | | | | | |
Net proceeds from sale of shares | | | 311,082,298 | | | | 492,903,915 | |
Net asset value of shares issued to shareholders in reinvestment of dividends | | | 902,460 | | | | 41,934 | |
Cost of shares redeemed | | | (362,582,051 | ) | | | (512,734,483 | ) |
| | | | |
Increase (decrease) in net assets derived from capital share transactions | | | (50,597,293 | ) | | | (19,788,634 | ) |
| | | | |
Net increase (decrease) in net assets | | | (50,650,002 | ) | | | (19,740,311 | ) |
| | |
| Net Assets | | | | | | | | |
Beginning of year | | | 379,490,707 | | | | 399,231,018 | |
| | | | |
End of year | | $ | 328,840,705 | | | $ | 379,490,707 | |
| | | | |
Undistributed (distributions in excess of) net investment income at end of year | | $ | (74 | ) | | $ | 52,436 | |
| | | | |
| | | | | | |
The notes to the financial statements are an integral part of,
and should be read in conjunction with, the financial statements. | | | | | 15 | |
Financial Highlights selected per share data and ratios
| | | | | | | | | | | | | | | | | | | | |
| | | Year ended October 31, | |
| Class A | | 2017 | | | 2016 | | | 2015 | | | 2014 | | | 2013 | |
Net asset value at beginning of year | | $ | 1.00 | | | $ | 1.00 | | | $ | 1.00 | | | $ | 1.00 | | | $ | 1.00 | |
| | | | | | | | | | | | | | | | | | | | |
Net investment income (loss) (a) | | | 0.00 | ‡ | | | 0.00 | ‡ | | | 0.00 | ‡ | | | 0.00 | ‡ | | | 0.00 | ‡ |
Net realized and unrealized gain (loss) on investments | | | 0.00 | ‡ | | | 0.00 | ‡ | | | (0.00 | )‡ | | | (0.00 | )‡ | | | 0.00 | ‡ |
| | | | | | | | | | | | | | | | | | | | |
Total from investment operations | | | 0.00 | ‡ | | | 0.00 | ‡ | | | 0.00 | ‡ | | | 0.00 | ‡ | | | 0.00 | ‡ |
| | | | | | | | | | | | | | | | | | | | |
| Less dividends: | | | | | | | | | | | | | | | | | | | | |
From net investment income | | | (0.00 | )‡ | | | (0.00 | )‡ | | | (0.00 | )‡ | | | (0.00 | )‡ | | | (0.00 | )‡ |
| | | | | | | | | | | | | | | | | | | | |
Net asset value at end of year | | $ | 1.00 | | | $ | 1.00 | | �� | $ | 1.00 | | | $ | 1.00 | | | $ | 1.00 | |
| | | | | | | | | | | | | | | | | | | | |
Total investment return (b) | | | 0.35 | % | | | 0.01 | % | | | 0.01 | % | | | 0.01 | % | | | 0.01 | % |
| Ratios (to average net assets)/Supplemental Data: | | | | | | | | | | | | | | | | | | | | |
Net investment income (loss) | | | 0.32 | % | | | 0.02 | % | | | 0.01 | % | | | 0.01 | % | | | 0.01 | % |
Net expenses | | | 0.59 | % | | | 0.43 | % | | | 0.13 | % | | | 0.11 | % | | | 0.15 | % |
Expenses (before waiver/reimbursement) | | | 0.60 | % | | | 0.64 | % | | | 0.64 | % | | | 0.64 | % | | | 0.65 | % |
Net assets at end of year (in 000’s) | | $ | 227,572 | | | $ | 226,181 | | | $ | 243,517 | | | $ | 230,330 | | | $ | 290,028 | |
| ‡ | Less than one cent per share. |
| (a) | Per share data based on average shares outstanding during the year. |
| (b) | Total investment return is calculated exclusive of sales charges and assumes the reinvestment of dividends and distributions. For periods of less than one year, total return is not annualized. |
| | | | | | | | | | | | | | | | | | | | |
| | | Year ended October 31, | |
| Investor Class | | 2017 | | | 2016 | | | 2015 | | | 2014 | | | 2013 | |
Net asset value at beginning of year | | $ | 1.00 | | | $ | 1.00 | | | $ | 1.00 | | | $ | 1.00 | | | $ | 1.00 | |
| | | | | | | | | | | | | | | | | | | | |
Net investment income (loss) (a) | | | 0.00 | ‡ | | | 0.00 | ‡ | | | 0.00 | ‡ | | | 0.00 | ‡ | | | 0.00 | ‡ |
Net realized and unrealized gain (loss) on investments | | | 0.00 | ‡ | | | 0.00 | ‡ | | | (0.00 | )‡ | | | (0.00 | )‡ | | | 0.00 | ‡ |
| | | | | | | | | | | | | | | | | | | | |
Total from investment operations | | | 0.00 | ‡ | | | 0.00 | ‡ | | | 0.00 | ‡ | | | 0.00 | ‡ | | | 0.00 | ‡ |
| | | | | | | | | | | | | | | | | | | | |
| Less dividends: | | | | | | | | | | | | | | | | | | | | |
From net investment income | | | (0.00 | )‡ | | | (0.00 | )‡ | | | (0.00 | )‡ | | | (0.00 | )‡ | | | (0.00 | )‡ |
| | | | | | | | | | | | | | | | | | | | |
Net asset value at end of year | | $ | 1.00 | | | $ | 1.00 | | | $ | 1.00 | | | $ | 1.00 | | | $ | 1.00 | |
| | | | | | | | | | | | | | | | | | | | |
Total investment return (b) | | | 0.20 | % | | | 0.01 | % | | | 0.01 | % | | | 0.01 | % | | | 0.01 | % |
| Ratios (to average net assets)/Supplemental Data: | | | | | | | | | | | | | | | | | | | | |
Net investment income (loss) | | | 0.18 | % | | | 0.02 | % | | | 0.01 | % | | | 0.01 | % | | | 0.01 | % |
Net expenses | | | 0.73 | % | | | 0.43 | % | | | 0.14 | % | | | 0.11 | % | | | 0.16 | % |
Expenses (before waiver/reimbursement) | | | 0.79 | % | | | 0.83 | % | | | 0.87 | % | | | 0.89 | % | | | 0.90 | % |
Net assets at end of year (in 000’s) | | $ | 27,087 | | | $ | 58,658 | | | $ | 56,512 | | | $ | 56,177 | | | $ | 58,774 | |
| ‡ | Less than one cent per share. |
| (a) | Per share data based on average shares outstanding during the year. |
| (b) | Total investment return is calculated exclusive of sales charges and assumes the reinvestment of dividends and distributions. For periods of less than one year, total return is not annualized. |
| | | | |
| 16 | | MainStay Money Market Fund | | The notes to the financial statements are an integral part of,
and should be read in conjunction with, the financial statements. |
Financial Highlights selected per share data and ratios
| | | | | | | | | | | | | | | | | | | | |
| | | Year ended October 31, | |
| Class B | | 2017 | | | 2016 | | | 2015 | | | 2014 | | | 2013 | |
Net asset value at beginning of year | | $ | 1.00 | | | $ | 1.00 | | | $ | 1.00 | | | $ | 1.00 | | | $ | 1.00 | |
| | | | | | | | | | | | | | | | | | | | |
Net investment income (loss) (a) | | | 0.00 | ‡ | | | 0.00 | ‡ | | | 0.00 | ‡ | | | 0.00 | ‡ | | | 0.00 | ‡ |
Net realized and unrealized gain (loss) on investments | | | 0.00 | ‡ | | | 0.00 | ‡ | | | (0.00 | )‡ | | | (0.00 | )‡ | | | 0.00 | ‡ |
| | | | | | | | | | | | | | | | | | | | |
Total from investment operations | | | 0.00 | ‡ | | | 0.00 | ‡ | | | 0.00 | ‡ | | | 0.00 | ‡ | | | 0.00 | ‡ |
| | | | | | | | | | | | | | | | | | | | |
| Less dividends: | | | | | | | | | | | | | | | | | | | | |
From net investment income | | | (0.00 | )‡ | | | (0.00 | )‡ | | | (0.00 | )‡ | | | (0.00 | )‡ | | | (0.00 | )‡ |
| | | | | | | | | | | | | | | | | | | | |
Net asset value at end of year | | $ | 1.00 | | | $ | 1.00 | | | $ | 1.00 | | | $ | 1.00 | | | $ | 1.00 | |
| | | | | | | | | | | | | | | | | | | | |
Total investment return (b) | | | 0.20 | % | | | 0.01 | % | | | 0.01 | % | | | 0.01 | % | | | 0.01 | % |
| Ratios (to average net assets)/Supplemental Data: | | | | | | | | | | | | | | | | | | | | |
Net investment income (loss) | | | 0.17 | % | | | 0.02 | % | | | 0.01 | % | | | 0.01 | % | | | 0.01 | % |
Net expenses | | | 0.73 | % | | | 0.43 | % | | | 0.14 | % | | | 0.11 | % | | | 0.16 | % |
Expenses (before waiver/reimbursement) | | | 0.79 | % | | | 0.83 | % | | | 0.87 | % | | | 0.89 | % | | | 0.90 | % |
Net assets at end of year (in 000’s) | | $ | 43,351 | | | $ | 53,341 | | | $ | 58,152 | | | $ | 63,581 | | | $ | 73,803 | |
| ‡ | Less than one cent per share. |
| (a) | Per share data based on average shares outstanding during the year. |
| (b) | Total investment return is calculated exclusive of sales charges and assumes the reinvestment of dividends and distributions. For periods of less than one year, total return is not annualized. |
| | | | | | | | | | | | | | | | | | | | |
| | | Year ended October 31, | |
| Class C | | 2017 | | | 2016 | | | 2015 | | | 2014 | | | 2013 | |
Net asset value at beginning of year | | $ | 1.00 | | | $ | 1.00 | | | $ | 1.00 | | | $ | 1.00 | | | $ | 1.00 | |
| | | | | | | | | | | | | | | | | | | | |
Net investment income (loss) (a) | | | 0.00 | ‡ | | | 0.00 | ‡ | | | 0.00 | ‡ | | | 0.00 | ‡ | | | 0.00 | ‡ |
Net realized and unrealized gain (loss) on investments | | | 0.00 | ‡ | | | 0.00 | ‡ | | | (0.00 | )‡ | | | (0.00 | )‡ | | | 0.00 | ‡ |
| | | | | | | | | | | | | | | | | | | | |
Total from investment operations | | | 0.00 | ‡ | | | 0.00 | ‡ | | | 0.00 | ‡ | | | 0.00 | ‡ | | | 0.00 | ‡ |
| | | | | | | | | | | | | | | | | | | | |
| Less dividends: | | | | | | | | | | | | | | | | | | | | |
From net investment income | | | (0.00 | )‡ | | | (0.00 | )‡ | | | (0.00 | )‡ | | | (0.00 | )‡ | | | (0.00 | )‡ |
| | | | | | | | | | | | | | | | | | | | |
Net asset value at end of year | | $ | 1.00 | | | $ | 1.00 | | | $ | 1.00 | | | $ | 1.00 | | | $ | 1.00 | |
| | | | | | | | | | | | | | | | | | | | |
Total investment return (b) | | | 0.20 | % | | | 0.01 | % | | | 0.01 | % | | | 0.01 | % | | | 0.01 | % |
| Ratios (to average net assets)/Supplemental Data: | | | | | | | | | | | | | | | | | | | | |
Net investment income (loss) | | | 0.17 | % | | | 0.02 | % | | | 0.01 | % | | | 0.01 | % | | | 0.01 | % |
Net expenses | | | 0.73 | % | | | 0.43 | % | | | 0.13 | % | | | 0.11 | % | | | 0.15 | % |
Expenses (before waiver/reimbursement) | | | 0.79 | % | | | 0.83 | % | | | 0.87 | % | | | 0.89 | % | | | 0.90 | % |
Net assets at end of year (in 000’s) | | $ | 30,831 | | | $ | 41,311 | | | $ | 41,050 | | | $ | 36,939 | | | $ | 33,254 | |
| ‡ | Less than one cent per share. |
| (a) | Per share data based on average shares outstanding during the year. |
| (b) | Total investment return is calculated exclusive of sales charges and assumes the reinvestment of dividends and distributions. For periods of less than one year, total return is not annualized. |
| | | | | | |
The notes to the financial statements are an integral part of,
and should be read in conjunction with, the financial statements. | | | | | 17 | |
Notes to Financial Statements
Note 1–Organization and Business
The MainStay Funds (the “Trust”) was organized on January 9, 1986, as a Massachusetts business trust and is governed by a Declaration of Trust. The Trust is registered under the Investment Company Act of 1940, as amended (the “1940 Act”), as an open-end management investment company, and is comprised of twelve funds (collectively referred to as the “Funds”). These financial statements and notes relate to the MainStay Money Market Fund (the “Fund”), a “diversified” fund, as that term is defined in the 1940 Act, as interpreted or modified by regulatory authorities having jurisdiction, from time to time.
The Fund currently has five classes of shares registered for sale. Class A shares commenced operations on January 3, 1995. Class B shares commenced operations on May 1, 1986. Class C shares commenced operations on September 1, 1998. Investor Class shares commenced operations on February 28, 2008. Class T shares were registered for sale effective as of February 28, 2017. As of October 31, 2017, Class T shares were not yet offered for sale.
Class A, Class I and Investor Class shares are offered at net asset value (“NAV”) without an initial sales charge. Class T shares are currently expected to be offered at NAV without an initial sales charge. Effective February 28, 2017, Class B shares of the MainStay Group of Funds were closed to all new purchases as well as additional investments by existing Class B shareholders. Existing Class B shareholders may continue to reinvest dividends and capital gains distributions, as well as exchange their Class B shares for Class B shares of other MainStay Group of Funds as permitted by the current exchange privileges. Class B shareholders continue to be subject to any applicable contingent deferred sales charge (“CDSC”) at the time of redemption. All other features of the Class B shares, including but not limited to the fees and expenses applicable to Class B shares, remain unchanged. Unless redeemed, Class B shareholders will remain in Class B shares of their respective fund until the Class B shares are converted to Class A or Investor Class shares pursuant to the applicable conversion schedule. Depending upon eligibility, Class B shares convert to either Class A or Investor Class shares at the end of the calendar quarter eight years after the date they were purchased. Additionally, as disclosed in the Fund’s prospectus, Investor Class shares may convert automatically to Class A shares and Class A shares may convert automatically to Investor Class shares. Under certain circumstances and as may be permitted by the Trust’s multiple class plan pursuant to Rule 18f-3 under the 1940 Act, specified share classes of the Fund may be converted to one or more other share classes of the Fund as disclosed in the capital share transactions within these Notes. The classes of shares have the same voting (except for issues that relate solely to one class), dividend, liquidation and other rights, and the same terms and conditions.
The Fund’s investment objective is to seek a high level of current income while preserving capital and maintaining liquidity.
Note 2–Significant Accounting Policies
The Fund is an investment company and accordingly follows the investment company accounting and reporting guidance of the Financial Accounting Standards Board (“FASB”) Accounting Standard Codification Topic 946 Financial Services—Investment Companies. The Fund prepares its financial statements in accordance with generally accepted
accounting principles (“GAAP”) in the United States of America and follows the significant accounting policies described below.
(A) Valuation of Shares. You could lose money by investing in the Fund. Although the Fund seeks to preserve the value of your investment at $1.00 per share by using the amortized cost method of valuation, it cannot guarantee it will do so. The Fund may impose a fee upon the sale of your shares or may temporarily suspend your ability to sell shares if the Fund’s liquidity falls below required minimums because of market conditions or other factors. An investment in the Fund is not insured or guaranteed by the Federal Deposit Insurance Corporation or any other government agency. The Fund’s sponsor has no legal obligation to provide financial support to the Fund, and you should not expect that the sponsor will provide financial support to the Fund at any time.
(B) Securities Valuation. Securities are valued using the amortized cost method of valuation, unless the use of such method would be inappropriate per the requirements of Rule 2a-7 under the 1940 Act. The amortized cost method involves valuing a security at its cost on the date of purchase and thereafter assuming a constant amortization to maturity of the difference between such cost and the value on maturity date. Amortized cost approximates the current fair value of a security.
The Board of Trustees of the Trust (the “Board”) adopted procedures establishing methodologies for the valuation of the Fund’s securities and other assets and delegated the responsibility for valuation determinations under those procedures to the Valuation Committee of the Trust (the “Valuation Committee”). The Board authorized the Valuation Committee to appoint a Valuation Subcommittee (the “Subcommittee”) to deal in the first instance with establishing the prices of securities for which market quotations are not readily available or the prices of which are not otherwise readily determinable under these procedures. The Subcommittee meets (in person, via electronic mail or via teleconference) on an as-needed basis. Subsequently, the Valuation Committee meets to ensure that actions taken by the Subcommittee were appropriate. The procedures state that, subject to the oversight of the Board and unless otherwise noted, the responsibility for the day-to-day valuation of portfolio assets (including fair value measurements for the Fund’s assets and liabilities) rests with New York Life Investment Management LLC (“New York Life Investments” or the “Manager”), aided to whatever extent necessary by the Subadvisor (as defined in Note 3(A)).
To assess the appropriateness of security valuations, the Manager, the Subadvisor or the Fund’s third-party service provider, who is subject to oversight by the Manager, regularly compares prior day prices, prices on comparable securities and the sale prices to the prior and current day prices and challenges prices with changes exceeding certain tolerance levels with third-party pricing services or broker sources. For those securities valued through either a standardized fair valuation methodology or a fair valuation measurement, the Subcommittee deals in the first instance with such valuation and the Valuation Committee reviews and affirms, if appropriate, the reasonableness of the valuation based on such methodologies and measurements on a regular basis after considering information that is reasonably available and deemed relevant by the Valuation Committee. Any action taken by the Subcommittee with respect to the valuation of a portfolio security or other asset is submitted for review and ratification (if appropriate) to the Valuation Committee and the Board at the next regularly scheduled meeting.
| | |
| 18 | | MainStay Money Market Fund |
“Fair value” is defined as the price the Fund would reasonably expect to receive upon selling an asset or liability in an orderly transaction to an independent buyer in the principal or most advantageous market for the asset or liability. Fair value measurements are determined within a framework that establishes a three-tier hierarchy which maximizes the use of observable market data and minimizes the use of unobservable inputs to establish a classification of fair value measurements for disclosure purposes. “Inputs” refer broadly to the assumptions that market participants would use in pricing the asset or liability, including assumptions about risk, such as the risk inherent in a particular valuation technique used to measure fair value using a pricing model and/or the risk inherent in the inputs for the valuation technique. Inputs may be observable or unobservable. Observable inputs reflect the assumptions market participants would use in pricing the asset or liability based on market data obtained from sources independent of the Fund. Unobservable inputs reflect the Fund’s own assumptions about the assumptions market participants would use in pricing the asset or liability based on the information available. The inputs or methodology used for valuing assets or liabilities may not be an indication of the risks associated with investing in those assets or liabilities. The three-tier hierarchy of inputs is summarized below.
| • | | Level 1—quoted prices in active markets for an identical asset or liability |
| • | | Level 2—other significant observable inputs (including quoted prices for a similar asset or liability in active markets, interest rates and yield curves, prepayment speeds, credit risk, etc.) |
| • | | Level 3—significant unobservable inputs (including the Fund’s own assumptions about the assumptions that market participants would use in measuring fair value of an asset or liability) |
Securities valued at amortized cost are not obtained from a quoted price in an active market and are generally categorized as Level 2 in the hierarchy. The level of an asset or liability within the fair value hierarchy is based on the lowest level of an input, both individually and in the aggregate, that is significant to the fair value measurement. As of October 31, 2017, the aggregate value by input level of the Fund’s assets and liabilities is included at the end of the Fund’s Portfolio of Investments.
The Fund may use third-party vendor evaluations, whose prices may be derived from one or more of the following standard inputs, among others:
| | |
• Benchmark yields | | • Reported trades |
• Broker/dealer quotes | | • Issuer spreads |
• Two-sided markets | | • Benchmark securities |
• Bids/offers | | • Reference data (corporate actions or material event notices) |
• Industry and economic events | | • Comparable bonds |
• Monthly payment information | | |
An asset or liability for which market values cannot be measured using the methodologies described above is valued by methods deemed reasonable in good faith by the Valuation Committee, following the procedures established by the Board, to represent fair value. Under these procedures, the Fund may utilize some of the following fair value
techniques: multi-dimensional relational pricing models and option adjusted spread pricing. During the year ended October 31, 2017, there were no material changes to the fair value methodologies.
Securities for which market quotations or observable inputs are not readily available are generally categorized as level 3 in the hierarchy. As of October 31, 2017, there were no securities held by the Fund that were fair valued in such a manner.
(C) Income Taxes. The Fund’s policy is to comply with the requirements of the Internal Revenue Code of 1986, as amended (the “Internal Revenue Code”), applicable to regulated investment companies and to distribute all of its taxable income to the shareholders of the Fund within the allowable time limits. Therefore, no federal, state and local income tax provisions are required.
Management evaluates the Fund’s tax positions to determine if the tax positions taken meet the minimum recognition threshold in connection with accounting for uncertainties in income tax positions taken or expected to be taken for the purposes of measuring and recognizing tax liabilities in the financial statements. Recognition of tax benefits of an uncertain tax position is permitted only to the extent the position is “more likely than not” to be sustained assuming examination by taxing authorities. Management has analyzed the Fund’s tax positions taken on federal, state and local income tax returns for all open tax years (for up to three tax years) and has concluded that no provisions for federal, state and local income tax are required in the Fund’s financial statements. The Fund’s federal, state and local income tax and federal excise tax returns for tax years for which the applicable statutes of limitations have not expired are subject to examination by the Internal Revenue Service and state and local departments of revenue.
(D) Dividends and Distributions to Shareholders. Dividends and distributions are recorded on the ex-dividend date. Dividends from net investment income, if any, are declared daily and paid monthly and distributions from net realized capital and currency gains, if any, are declared and paid at least annually. Unless the shareholder elects otherwise, all dividends and distributions are reinvested in the same class of shares of the Fund, at NAV. Dividends and distributions to shareholders are determined in accordance with federal income tax regulations and may differ from determinations using GAAP.
(E) Security Transactions and Investment Income. The Fund records security transactions on the trade date. Realized gains and losses on security transactions are determined using the identified cost method. Interest income is accrued daily and discounts and premiums on securities purchased for the Fund are accreted and amortized, respectively, on the straight-line method. The straight-line method approximates the effective interest method for short-term investments. Income from payment-in-kind securities, to the extent the Fund held any such securities during the year ended October 31, 2017, is recorded daily based on the effective interest method of accrual.
Investment income and realized and unrealized gains and losses on investments of the Fund are allocated pro rata to separate classes of shares based upon their relative net assets on the date the income is earned or realized and unrealized gains and losses are incurred.
(F) Expenses. Expenses of the Trust are allocated to the individual Funds in proportion to the net assets of the respective Funds when the
Notes to Financial Statements (continued)
expenses are incurred, except where direct allocations of expenses can be made. Expenses (other than transfer agent expenses) are allocated to separate classes of shares pro rata based upon their relative net assets on the date the expenses are incurred. The expenses borne by the Fund, including those of related parties to the Fund, are shown in the Statement of Operations.
(G) Use of Estimates. In preparing financial statements in conformity with GAAP, management makes estimates and assumptions that affect the reported amounts and disclosures in the financial statements. Actual results could differ from those estimates.
(H) Repurchase Agreements. The Fund may enter into repurchase agreements (i.e., buy a security from another party with the agreement that it be sold back in the future) to earn income. The Fund may enter into repurchase agreements only with counterparties, usually financial institutions, that are deemed by the Manager or Subadvisor to be creditworthy, pursuant to guidelines established by the Board. During the term of any repurchase agreement, the Manager or Subadvisor will continue to monitor the creditworthiness of the counterparty. Under the 1940 Act, repurchase agreements are considered to be collateralized loans by the Fund to the counterparty secured by the securities transferred to the Fund.
Repurchase agreements are subject to counterparty risk, meaning the Fund could lose money by the counterparty’s failure to perform under the terms of the agreement. The Fund mitigates this risk by ensuring the repurchase agreement is collateralized by cash, U.S. government securities, fixed income securities and/or other securities. The collateral is held by the Fund’s custodian and valued daily on a mark to market basis to determine if the value, including accrued interest, exceeds the repurchase price. In the event of the counterparty’s default on the obligation to repurchase, the Fund has the right to liquidate the collateral and apply the proceeds in satisfaction of the obligation. Under certain circumstances, such as in the event of default or bankruptcy by the counterparty, realization and/or retention of the collateral may be limited or subject to delay, to legal proceedings and possible realized loss to the Fund.
(I) Debt Securities. The Fund’s investments may include securities such as variable rate notes, floaters and mortgage-related and asset-backed securities. If expectations about changes in interest rates, or assessments of an issuer’s credit worthiness or market conditions are incorrect, these types of investments could lose money.
The Fund may also invest in U.S. dollar-denominated securities of foreign issuers, which carry certain risks in addition to the usual risks inherent in domestic instruments. These risks include those resulting from future adverse political or economic developments and possible imposition of foreign governmental laws or restrictions. The ability of issuers of debt securities held by the Fund to meet their obligations may be affected by economic or political developments in a specific country, industry or region.
(J) Indemnifications. Under the Trust’s organizational documents, its officers and trustees are indemnified against certain liabilities that may arise out of performance of their duties to the Trust. Additionally, in the normal course of business, the Fund enters into contracts with third-party service providers that contain a variety of representations and warranties and which may provide general indemnifications. The Fund’s
maximum exposure under these arrangements is unknown, as this would involve future claims that may be made against the Fund that have not yet occurred. Based on experience, management is of the view that the risk of loss in connection with these potential indemnification obligations is remote. However, there can be no assurance that material liabilities related to such obligations will not arise in the future, which could adversely impact the Fund.
Note 3–Fees and Related Party Transactions
(A) Manager and Subadvisor. New York Life Investments, a registered investment adviser and an indirect, wholly-owned subsidiary of New York Life Insurance Company (“New York Life”), serves as the Fund’s Manager, pursuant to an Amended and Restated Management Agreement (“Management Agreement”). The Manager provides offices, conducts clerical, recordkeeping and bookkeeping services, and keeps most of the financial and accounting records required to be maintained by the Fund. Except for the portion of salaries and expenses that are the responsibility of the Fund, the Manager pays the salaries and expenses of all personnel affiliated with the Fund and certain operational expenses of the Fund. The Fund reimburses New York Life Investments in an amount equal to a portion of the compensation of the Chief Compliance Officer attributable to the Fund. NYL Investors LLC (“NYL Investors” or the ‘‘Subadvisor’’), a registered investment adviser and a direct, wholly-owned subsidiary of New York Life, serves as Subadvisor to the Fund and is responsible for the day-to-day portfolio management of the Fund. Pursuant to the terms of a Subadvisory Agreement (“Subadvisory Agreement”) between New York Life Investments and NYL Investors, New York Life Investments pays for the services of the Subadvisor.
Under the Management Agreement, the Fund pays the Manager a monthly fee for the services performed and the facilities furnished at an annual rate of the Fund’s average daily net assets as follows: 0.40% up to $500 million; 0.35% from $500 million to $1 billion; and 0.30% in excess of $1 billion. During the year ended October 31, 2017, the effective management fee rate was 0.42% of the Fund’s average daily net assets, exclusive of any applicable waivers/reimbursements.
Prior to February 28, 2017, the Fund paid the Manager a monthly fee for services performed and the facilities furnished at an annual rate of the Fund’s average daily net assets as follows: 0.45% up to $500 million; 0.40% from $500 million to $1 billion; and 0.35% in excess of $1 billion, plus a fee for fund accounting services previously provided by New York Life Investments under a separate fund accounting agreement furnished at an annual rate of the Fund’s average daily net assets as follows: 0.05% up to $20 million; 0.0333% from $20 million to $100 million; and 0.01% in excess of $100 million.
New York Life Investments has contractually agreed to waive fees and/or reimburse expenses so that Total Annual Fund Operating Expenses (excluding taxes, interest, litigation, extraordinary expenses, brokerage and other transaction expenses relating to the purchase or sale of portfolio investments, and acquired (underlying) fund fees and expenses) do not exceed the following percentages of average daily net assets: Class A, 0.70%; Investor Class, 0.80%; Class B, 0.80%; and Class C, 0.80%. New York Life Investments will apply an equivalent waiver or reimbursement, in an equal number of basis points of the Class A shares waiver/reimbursement to Class T shares, This agreement will remain in effect until February 28, 2018, and shall renew
| | |
| 20 | | MainStay Money Market Fund |
automatically for one-year terms unless New York Life Investments provides written notice of termination prior to the start of the next term or upon approval by the Board
New York Life Investments may limit expenses of the Fund to the extent it deems appropriate to enhance the yield of the Fund, or a particular class of the Fund, during periods when expenses have a significant impact on the yield of the Fund, or a particular class of the Fund, as applicable, because of low interest rates. This expense limitation policy is voluntary and in addition to any contractual arrangements that may be in place with respect to the Fund and described in the Fund’s prospectus.
During the year ended October 31, 2017, New York Life Investments earned fees from the Fund in the amount of $1,509,083. Additionally, New York Life Investments reimbursed fees in the amount of $108,678, without which the Fund’s total returns would have been lower.
State Street provides sub-administration and sub-accounting services to the Fund pursuant to an agreement with New York Life Investments. These services include calculating the daily NAVs of the Fund, maintaining the general ledger and sub-ledger accounts for the calculation of the Fund’s respective NAVs, and assisting New York Life Investments in conducting various aspects of the Fund’s administrative operations. For providing these services to the Fund, State Street is compensated by New York Life Investments.
(B) Sales Charges. Although the Fund does not assess a CDSC upon redemption of Class B or Class C shares of the Fund, the applicable CDSC will be assessed when shares are redeemed from the Fund if the shareholder previously exchanged his or her investment into the Fund from another fund within the MainStay Group of Funds. During the year ended October 31, 2017, the Fund was advised that NYLIFE Distributors LLC (the “Distributor”), an indirect wholly owned subsidiary of New York Life, received from shareholders the proceeds from CDSCs of Class A, Investor Class, Class B and Class C of $31,667, $278, $55,475 and $23,394, respectively.
(C) Transfer, Dividend Disbursing and Shareholder Servicing Agent. NYLIM Service Company LLC, an affiliate of New York Life Investments, is the Fund’s transfer, dividend disbursing and shareholder servicing agent pursuant to an agreement between NYLIM Service Company LLC and the Trust. NYLIM Service Company LLC has entered into an agreement with Boston Financial Data Services, Inc. (“BFDS”) pursuant to which BFDS performs certain transfer agent services on behalf of NYLIM Service Company LLC. During the year ended October 31, 2017, transfer agent expenses incurred by the Fund were as follows:
| | | | |
Class A | | $ | 195,020 | |
Investor Class | | | 151,625 | |
Class B | | | 134,885 | |
Class C | | | 106,614 | |
(D) Small Account Fee. Shareholders with small accounts adversely impact the cost of providing transfer agency services. In an effort to reduce total transfer agency expenses, the Fund has implemented a small account fee on certain types of accounts. Certain shareholders with an account balance of less than $1,000 are charged an annual per account fee of $20 (assessed semi-annually), the
proceeds from which offset transfer agent fees as reflected in the Statement of Operations.
Note 4–Federal Income Tax
The amortized cost also represents the aggregate cost for federal income tax purposes.
As of October 31, 2017, the components of accumulated gain (loss) on a tax basis were as follows:
| | | | | | | | |
Ordinary
Income | | Accumulated
Capital and Other Gain (Loss) | | Other
Temporary
Differences | | Unrealized
Appreciation
(Depreciation) | | Total
Accumulated Gain (Loss) |
| $1,143 | | $(133) | | $(1,217) | | $— | | $(207) |
The other temporary differences are primarily due to dividends payable.
The following table discloses the current year reclassifications between undistributed net investment income (loss), accumulated net realized gain (loss) on investments, and additional paid-in capital arising from permanent differences; net assets as of October 31, 2017, were not affected.
| | | | |
Undistributed Net Investment Income (Loss) | | Accumulated Net Realized Gain (Loss) on Investments | | Additional Paid-In Capital |
| $249 | | $— | | $(249) |
The reclassifications for the Fund are primarily due to non-deductible expenses.
As of October 31, 2017, for federal income tax purposes, capital loss carryforwards of $133 were available as shown in the table below, to the extent provided by the regulations to offset future realized gains of the Fund through the years indicated. To the extent that these capital loss carryforwards are used to offset future capital gains, it is probable that the capital gains so offset will not be distributed to shareholders. No capital gain distributions shall be made until any capital loss carryforwards have been fully utilized.
| | | | |
Capital Loss Available Through | | Short-Term Capital Loss Amounts (000’s) | | Long-Term Capital Loss Amounts (000’s) |
| Unlimited | | $— (a) | | $— |
The Fund utilized $50 of capital loss carryforwards during the year ended October 31, 2017.
During the years ended October 31, 2017, and October 31, 2016, the tax character of distributions paid as reflected in the Statements of Changes in Net Assets was as follows:
| | | | | | | | |
| | | 2017 | | | 2016 | |
Distributions paid from: | | | | | | | | |
Ordinary Income | | $ | 988,180 | | | $ | 47,665 | |
Notes to Financial Statements (continued)
Note 5–Custodian
State Street is the custodian of cash and securities held by the Fund. Custodial fees are charged to the Fund based on the Fund’s net assets and/or the market value of securities held by the Fund and the number of certain transactions incurred by the Fund.
Note 6–Interfund Lending Program
Pursuant to an exemptive order issued by the SEC, the Fund, along with certain other funds managed by New York Life Investments, may participate in an interfund lending program. The interfund lending program provides an alternative credit facility that permits the Fund and certain other funds managed by New York Life Investments to lend or borrow money for temporary purposes directly to or from one another subject to the conditions of the exemptive order. During the year ended October 31, 2017, there were no interfund loans made or outstanding with respect to the Fund.
Note 7–Capital Share Transactions
| | | | |
Class A (at $1 per share) | | Shares | |
Year ended October 31, 2017: | | | | |
Shares sold | | | 230,832,054 | |
Shares issued to shareholders in reinvestment of dividends and distributions | | | 673,838 | |
Shares redeemed | | | (267,898,343 | ) |
| | | | |
Net increase (decrease) in shares outstanding before conversion | | | (36,392,451 | ) |
Shares converted into Class A (See Note 1) | | | 41,236,776 | |
Shares converted from Class A (See Note 1) | | | (3,420,770 | ) |
| | | | |
Net increase (decrease) | | | 1,423,555 | |
| | | | |
Year ended October 31, 2016: | | | | |
Shares sold | | | 369,603,010 | |
Shares issued to shareholders in reinvestment of dividends and distributions | | | 27,146 | |
Shares redeemed | | | (394,385,308 | ) |
| | | | |
Net increase (decrease) in shares outstanding before conversion | | | (24,755,152 | ) |
Shares converted into Class A (See Note 1) | | | 12,005,934 | |
Shares converted from Class A (See Note 1) | | | (4,616,215 | ) |
| | | | |
Net increase (decrease) | | | (17,365,433 | ) |
| | | | |
| |
| | | | |
| | | | |
Investor Class (at $1 per share) | | Shares | |
Year ended October 31, 2017: | | | | |
Shares sold | | | 40,171,786 | |
Shares issued to shareholders in reinvestment of dividends and distributions | | | 86,374 | |
Shares redeemed | | | (34,648,952 | ) |
| | | | |
Net increase (decrease) in shares outstanding before conversion | | | 5,609,208 | |
Shares converted into Investor Class (See Note 1) | | | 3,639,222 | |
Shares converted from Investor Class (See Note 1) | | | (40,811,279 | ) |
| | | | |
Net increase (decrease) | | | (31,562,849 | ) |
| | | | |
Year ended October 31, 2016: | | | | |
Shares sold | | | 47,185,103 | |
Shares issued to shareholders in reinvestment of dividends and distributions | | | 4,957 | |
Shares redeemed | | | (38,170,925 | ) |
| | | | |
Net increase (decrease) in shares outstanding before conversion | | | 9,019,135 | |
Shares converted into Investor Class (See Note 1) | | | 4,716,440 | |
Shares converted from Investor Class (See Note 1) | | | (11,597,361 | ) |
| | | | |
Net increase (decrease) | | | 2,138,214 | |
| | | | |
| |
| | | | |
Class B (at $1 per share) | | Shares | |
Year ended October 31, 2017: | | | | |
Shares sold | | | 6,687,777 | |
Shares issued to shareholders in reinvestment of dividends and distributions | | | 80,358 | |
Shares redeemed | | | (16,508,386 | ) |
| | | | |
Net increase (decrease) in shares outstanding before conversion | | | (9,740,251 | ) |
Shares converted from Class B (See Note 1) | | | (242,742 | ) |
| | | | |
Net increase (decrease) | | | (9,982,993 | ) |
| | | | |
Year ended October 31, 2016: | | | | |
Shares sold | | | 13,369,067 | |
Shares issued to shareholders in reinvestment of dividends and distributions | | | 5,210 | |
Shares redeemed | | | (17,683,537 | ) |
| | | | |
Net increase (decrease) in shares outstanding before conversion | | | (4,309,260 | ) |
Shares converted from Class B (See Note 1) | | | (508,789 | ) |
| | | | |
Net increase (decrease) | | | (4,818,049 | ) |
| | | | |
| |
| | | | |
| | |
| 22 | | MainStay Money Market Fund |
| | | | |
Class C (at $1 per share) | | Shares | |
Year ended October 31, 2017: | | | | |
Shares sold | | | 33,390,681 | |
Shares issued to shareholders in reinvestment of dividends and distributions | | | 61,890 | |
Shares redeemed | | | (43,526,370 | ) |
| | | | |
Net increase (decrease) in shares outstanding before conversion | | | (10,073,799 | ) |
Shares converted into Class C (See Note 1) | | | 13,726 | |
Shares converted from Class C (See Note 1) | | | (414,933 | ) |
| | | | |
Net increase (decrease) | | | (10,475,006 | ) |
| | | | |
Year ended October 31, 2016: | | | | |
Shares sold | | | 62,746,661 | |
Shares issued to shareholders in reinvestment of dividends and distributions | | | 4,621 | |
Shares redeemed | | | (62,494,713 | ) |
| | | | |
Net increase (decrease) in shares outstanding before conversion | | | 256,569 | |
Shares converted from Class C (See Note 1) | | | (9 | ) |
| | | | |
Net increase (decrease) | | | 256,560 | |
| | | | |
Note 8–Subsequent Events
In connection with the preparation of the financial statements of the Fund as of and for the year ended October 31, 2017, events and transactions subsequent to October 31, 2017, through the date the financial statements were issued have been evaluated by the Fund’s management for possible adjustment and/or disclosure. No subsequent events requiring financial statement adjustment or disclosure have been identified.
Report of Independent Registered Public Accounting Firm
The Board of Trustees and Shareholders of
The MainStay Funds:
We have audited the accompanying statement of assets and liabilities, including the portfolio of investments, of MainStay Money Market Fund (the “Fund”), one of the funds constituting The MainStay Funds, as of October 31, 2017, and the related statement of operations for the year then ended, the statements of changes in net assets for each of the years in the two-year period then ended, and the financial highlights for each of the years in the five-year period then ended. These financial statements and financial highlights are the responsibility of the Fund’s management. Our responsibility is to express an opinion on these financial statements and financial highlights based on our audits.
We conducted our audits in accordance with the standards of the Public Company Accounting Oversight Board (United States). Those standards require that we plan and perform the audit to obtain reasonable assurance about whether the financial statements and financial highlights are free of material misstatement. An audit includes examining, on a test basis, evidence supporting the amounts and disclosures in the financial statements. Our procedures included confirmation of securities owned as of October 31, 2017, by correspondence with the custodian and brokers or by other appropriate auditing procedures where replies from brokers were not received. An audit also includes assessing the accounting principles used and significant estimates made by management, as well as evaluating the overall financial statement presentation. We believe that our audits provide a reasonable basis for our opinion.
In our opinion, the financial statements and financial highlights referred to above present fairly, in all material respects, the financial position of MainStay Money Market Fund as of October 31, 2017, the results of its operations for the year then ended, the changes in its net assets for each of the years in the two-year period then ended, and the financial highlights for each of the years in the five-year period then ended, in conformity with U.S. generally accepted accounting principles.

Philadelphia, Pennsylvania
December 21, 2017
| | |
| 24 | | MainStay Money Market Fund |
Other Matters
(Unaudited)
At a meeting held on June 22, 2017, the Board approved submitting the following proposal (“Proposal”) to shareholders of the Funds at a special meeting held on October 23, 2017 (with any postponements or adjournments, “Special Meeting”):
To elect eight Trustees to the Board.
On or about September 28, 2017, shareholders of record of the Funds as of the close of business on August 24, 2017, were sent a proxy statement containing information regarding the Proposal. The proxy statement also included information about the Special Meeting, at which shareholders of the Funds were asked to consider and approve the Proposal. In addition, the proxy statement included information about voting on the Proposal and options shareholders had to do so.
The Special Meeting was held on October 23, 2017, and the Proposal passed.
The results of the Special Meeting (all Funds and classes thereof voting together) were as follows:
Proposal—To elect eight Trustees to the Board:
Yie-Hsin Hung:
| | | | |
Votes For | | Votes Witheld | | Total |
| 2,644,056,263.750 | | 21,799,781.292 | | 2,665,856,045.042 |
David H. Chow:
| | | | |
Votes For | | Votes Witheld | | Total |
| 2,644,576,776.557 | | 21,279,268.485 | | 2,665,856,045.042 |
Susan B. Kerley:
| | | | |
Votes For | | Votes Witheld | | Total |
| 2,645,459,747.343 | | 20,396,297.699 | | 2,665,856,045.042 |
Alan R. Latshaw:
| | | | |
Votes For | | Votes Witheld | | Total |
| 2,644,443,039.401 | | 21,413,005.641 | | 2,665,856,045.042 |
Peter Meenan:
| | | | |
Votes For | | Votes Witheld | | Total |
| 2,640,156,421.578 | | 25,699,623.464 | | 2,665,856,045.042 |
Richard H. Nolan, Jr.:
| | | | |
Votes For | | Votes Witheld | | Total |
| 2,641,415,514.849 | | 24,440,530.193 | | 2,665,856,045.042 |
Jacques P. Perold:
| | | | |
Votes For | | Votes Witheld | | Total |
| 2,645,300,993.731 | | 20,555,051.311 | | 2,665,856,045.042 |
Richard S. Trutanic:
| | | | |
Votes For | | Votes Witheld | | Total |
| 2,641,761,336.311 | | 24,094,708.731 | | 2,665,856,045.042 |
Federal Income Tax Information
(Unaudited)
In February 2018, shareholders will receive an IRS Form 1099-DIV or substitute Form 1099, which will show the federal tax status of the distributions received by shareholders in calendar year 2017. The amounts that will be reported on such 1099-DIV or substitute Form 1099 will be the amounts you are to use on your federal income tax return and will differ from the amounts which we must report for the Fund’s fiscal year end October 31, 2017.
Proxy Voting Policies and Procedures and Proxy Voting Record
A description of the policies and procedures that New York Life Investments uses to vote proxies related to the Fund’s securities is available without charge, upon request, (i) by visiting the MainStay Funds’ website at mainstayinvestments.com; and (ii) on the Securities and Exchange Commission’s (“SEC”) website at www.sec.gov.
The Fund is required to file with the SEC its proxy voting records for the Fund for the 12-month period ending June 30 on Form N-PX. The most recent Form N-PX or proxy voting record is available free of charge upon request by calling 800-MAINSTAY (624-6782); visiting the MainStay Funds’ website at mainstayinvestments.com; or on the SEC’s website at www.sec.gov.
Shareholder Reports and Quarterly Portfolio Disclosure
The Fund is required to file its complete schedule of portfolio holdings with the SEC for its first and third fiscal quarters on Form N-Q. The Fund’s Form N-Q is available without charge, on the SEC’s website at www.sec.gov or by calling MainStay Investments at 800-MAINSTAY (624-6782). You also can obtain and review copies of Form N-Q by visiting the SEC’s Public Reference Room in Washington, DC (information on the operation of the Public Reference Room may be obtained by calling 1-800-SEC-0330).
Board of Trustees and Officers (Unaudited)
The Trustees and officers of the Funds are listed below. The Board oversees the MainStay Group of Funds (which consists of The MainStay Funds and MainStay Funds Trust), MainStay VP Funds Trust, MainStay DefinedTerm Municipal Opportunities Fund, the Manager and the Subadvisors, and elects the officers of the Funds who are responsible for the day-to-day operations of the Funds. Information pertaining to the Trustees and officers is set forth below. Each Trustee serves until his or her successor is elected and qualified or until his or her resignation, death or removal. Under the Board’s retirement policy, unless an exception is made, a Trustee must tender his or her resignation by the
end of the calendar year during which he or she reaches the age of 75. Mr. Meenan reached the age of 75 during the calendar year 2016, and his term was extended for one additional year. Accordingly, Mr. Meenan is expected to serve until the end of calendar year 2017, at which time he intends to retire. Officers are elected annually by the Board. The business address of each Trustee and officer listed below is 51 Madison Avenue, New York, New York 10010. A majority of the Trustees are not “interested persons” (as defined by the 1940 Act and rules adopted by the SEC thereunder) of the Fund (“Independent Trustees”).
| | | | | | | | | | | | |
| | | | | Name and Date of Birth | | Term of Office, Position(s) Held and Length of Service | | Principal Occupation(s) During Past Five Years | | Number of
Portfolios in
the MainStay
Group of Funds
Overseen by
Trustee | | Other Directorships Held by Trustee |
| Interested Trustee | | | | Yie-Hsin Hung* 8/12/62 | | The MainStay Funds: Trustee since January 2017; MainStay Funds Trust: Trustee since January 2017. | | Senior Vice President of New York Life since joining in 2010, Member of the Executive Management Committee since January 1, 2017, Chief Executive Officer, New York Life Investment Management Holdings LLC & New York Life Investment Management LLC since May 2015. Senior Managing Director and Co-President of New York Life Investment Management LLC from January 2014 to May 2015. Previously held positions of increasing responsibility, including head of NYLIM International, Alternative Growth Businesses, and Institutional investments since joining New York Life in 2010. | | 82 | | None |
| | * | This Trustee is considered to be an “interested person” of the MainStay Group of Funds, MainStay VP Funds Trust and MainStay DefinedTerm Municipal Opportunities Fund, within the meaning of the 1940 Act because of her affiliation with New York Life Insurance Company, New York Life Investment Management LLC, Candriam Belgium, Candriam France S.A.S., Cornerstone Capital Management Holdings LLC, MacKay Shields LLC, NYL Investors LLC, NYLIFE Securities LLC and/or NYLIFE Distributors LLC, as described in detail above in the column entitled “Principal Occupation(s) During Past Five Years.” |
| | |
| 26 | | MainStay Money Market Fund |
| | | | | | | | | | | | |
| | | | | Name and Date of Birth | | Term of Office, Position(s) Held and Length of Service | | Principal Occupation(s) During Past Five Years | | Number of
Portfolios in
the MainStay
Group of Funds
Overseen by
Trustee | | Other Directorships Held by Trustee |
| Independent Trustees | | | | David H. Chow 12/29/57 | | The MainStay Funds: Trustee since January 2016, Advisory Board Member (June 2015 to December 2015); MainStay Funds Trust: Trustee since January 2016, Advisory Board Member (June 2015 to December 2015). | | Founder and CEO, DanCourt Management, LLC (since 1999) | | 82 | | VanEck Vectors Group of Exchange-Traded Funds: Independent Chairman of the Board of Trustees since 2008 and Trustee since 2006 (57 portfolios); and
Berea College of Kentucky: Trustee since 2009. |
| | | | Susan B. Kerley 8/12/51 | | The MainStay Funds: Chairman since January 2017 and Trustee since 2007; MainStay Funds Trust: Chairman since January 2017 and Trustee since 1990.** | | President, Strategic Management Advisors LLC (since 1990) | | 82 | | Legg Mason Partners Funds: Trustee since 1991 (54 portfolios). |
| | | | Alan R. Latshaw 3/27/51 | | The MainStay Funds: Trustee and Audit Committee Financial Expert since 2006; MainStay Funds Trust: Trustee and Audit Committee Financial Expert since 2007.** | | Retired; Partner, Ernst & Young LLP (2002 to 2003); Partner, Arthur Andersen LLP (1989 to 2002); Consultant to the MainStay Funds Audit and Compliance Committee (2004 to 2006) | | 82 | | State Farm Associates Funds Trusts: Trustee since 2005 (4 portfolios);
State Farm Mutual Fund Trust: Trustee since 2005 (15 portfolios); and
State Farm Variable Product Trust: Trustee since 2005 (9 portfolios). |
| | | | Peter Meenan 12/5/41 | | The MainStay Funds: Trustee since 2007; MainStay Funds Trust: Trustee since 2002.** | | Retired; Independent Consultant (2004 to 2013); President and Chief Executive Officer, Babson—United, Inc. (financial services firm) (2000 to 2004); Independent Consultant (1999 to 2000); Head of Global Funds, Citicorp (1995 to 1999) | | 82 | | None |
| | | | Richard H. Nolan, Jr. 11/16/46 | | The MainStay Funds: Trustee since 2007; MainStay Funds Trust: Trustee since 2007.** | | Managing Director, ICC Capital Management (since 2004); President—Shields/Alliance, Alliance Capital Management (1994 to 2004) | | 82 | | None |
| | | | Jacques P. Perold 5/12/58 | | The MainStay Funds: Trustee since January 2016, Advisory Board Member (June 2015 to December 2015); MainStay Funds Trust: Trustee since January 2016, Advisory Board Member (June 2015 to December 2015). | | Retired; President, Fidelity Management & Research Company (2009 to 2014); Founder, President and Chief Executive Officer, Geode Capital Management, LCC (2001 to 2009) | | 82 | | Allstate Corporation: Director since 2015; MSCI, Inc. Director since March 2017 and
Boston University: Trustee since 2014. |
| | | | Richard S. Trutanic 2/13/52 | | The MainStay Funds: Trustee since 1994; MainStay Funds Trust: Trustee since 2007.** | | Chairman and Chief Executive Officer, Somerset & Company (financial advisory firm) (since 2004); Managing Director, The Carlyle Group (private investment firm) (2002 to 2004); Senior Managing Director, Partner and Board Member, Groupe Arnault S.A. (private investment firm) (1999 to 2002) | | 82 | | None |
| | ** | Includes prior service as a Director/Trustee of certain predecessor entities to MainStay Funds Trust. |
| | | | | | | | |
| | | | | Name and Date of Birth | | Position(s) Held and Length of Service | | Principal Occupation(s) During Past Five Years |
Officers of the Trust (Who are not Trustees)* | | | | Kirk C. Lehneis 6/29/74 | | President, The MainStay Funds, MainStay Funds Trust (since September 2017) | | Chief Operating Officer and Senior Managing Director (since 2016), New York Life Investment Management LLC; Chairman of the Board (since September 2017), NYLIFE Distributors LLC; Chairman of the Board, NYLIM Service Company LLC (since September 2017); President, MainStay DefinedTerm Municipal Opportunities Fund and MainStay VP Funds Trust (since September 2017); Senior Managing Director, Global Product Development (From March 2015—May 2016); Managing Director, Product Development (From March 2010—February 2015) |
| | | | Jack R. Benintende 5/12/64 | | Treasurer and Principal Financial and Accounting Officer, The MainStay Funds (since 2007), MainStay Funds Trust (since 2009) | | Managing Director, New York Life Investment Management LLC (since 2007); Treasurer and Principal Financial and Accounting Officer, MainStay DefinedTerm Municipal Opportunities Fund (since 2011) and MainStay VP Funds Trust (since 2007)**; and Assistant Treasurer, New York Life Investment Management Holdings LLC (2008 to 2012) |
| | | | Kevin M. Bopp 2/24/69 | | Vice President and Chief Compliance Officer, The MainStay Funds and MainStay Funds Trust (since 2014) | | Chief Compliance Officer, New York Life Investment Management LLC, IndexIQ ETF (since January 2016), Director and Associate General Counsel (2011 to 2014) and Vice President and Assistant General Counsel (2010 to 2011), New York Life Investment Management LLC; Vice President and ChiefCompliance Officer, MainStay VP Funds Trust, MainStay DefinedTerm Municipal Opportunities Fund (since 2014); Assistant Secretary, MainStay Funds, MainStay Funds Trust and MainStay VP Funds Trust (2010 to 2014)**, MainStay DefinedTerm Municipal Opportunities Fund (2011 to 2014) |
| | | | J. Kevin Gao 10/13/67 | | Secretary and Chief Legal Officer, The MainStay Funds and MainStay Funds Trust (since 2010) | | Managing Director and Associate General Counsel, New York Life Investment Management LLC (since 2010); Secretary and Chief Legal Officer, MainStay DefinedTerm Municipal Opportunities Fund (since 2011) and MainStay VP Funds Trust (since 2010)** |
| | | | Scott T. Harrington 2/8/59 | | Vice President—Administration, The MainStay Funds (since 2005), MainStay Funds Trust (since 2009) | | Director, New York Life Investment Management LLC (including predecessor advisory organizations) (since 2000); Member of the Board of Directors, New York Life Trust Company (since 2009); Vice President—Administration, MainStay DefinedTerm Municipal Opportunities Fund (since 2011) and MainStay VP Funds Trust (since 2005)** |
| | * | The officers listed above are considered to be “interested persons” of the MainStay Group of Funds, MainStay VP Funds Trust and MainStay Defined Term Municipal Opportunities Fund within the meaning of the 1940 Act because of their affiliation with the MainStay Group of Funds, New York Life Insurance Company and/or its affiliates, including New York Life Investment Management LLC, NYLIM Service Company LLC, NYLIFE Securities LLC and/or NYLIFE Distributors LLC, as described in detail in the column captioned “Principal Occupation(s) During Past Five Years.” Officers are elected annually by the Board. |
| | ** | Includes prior service as an officer of MainStay VP Series Fund, Inc., the predecessor to MainStay VP Funds Trust. |
| | |
| 28 | | MainStay Money Market Fund |
This page intentionally left blank
This page intentionally left blank
MainStay Funds
Equity
U.S. Equity
MainStay Common Stock Fund
MainStay Cornerstone Growth Fund
MainStay Epoch U.S. All Cap Fund
MainStay Epoch U.S. Equity Yield Fund
MainStay Epoch U.S. Small Cap Fund
MainStay Large Cap Growth Fund
MainStay MAP Equity Fund
MainStay S&P 500 Index Fund
MainStay U.S. Equity Opportunities Fund
International/Global Equity
MainStay Candriam Emerging Markets Equity Fund
MainStay Emerging Markets Equity Fund
MainStay Epoch Capital Growth Fund
MainStay Epoch Global Choice Fund
MainStay Epoch Global Equity Yield Fund
MainStay Epoch International Choice Fund
MainStay Epoch International Small Cap Fund
MainStay International Equity Fund
MainStay International Opportunities Fund
Income
Taxable Bond
MainStay Emerging Markets Debt Fund
MainStay Floating Rate Fund
MainStay Government Fund
MainStay High Yield Corporate Bond Fund
MainStay Indexed Bond Fund
MainStay Short Duration High Yield Fund
MainStay Total Return Bond Fund
MainStay Unconstrained Bond Fund
Municipal/Tax Advantaged Bond
MainStay California Tax Free Opportunities Fund1
MainStay High Yield Municipal Bond Fund
MainStay New York Tax Free Opportunities Fund2
MainStay Tax Advantaged Short Term Bond Fund
MainStay Tax Free Bond Fund
Money Market
MainStay Money Market Fund
Mixed Asset
MainStay Balanced Fund
MainStay Convertible Fund
MainStay Income Builder Fund
Alternative
MainStay Absolute Return Multi-Strategy Fund
MainStay Cushing Energy Income Fund
MainStay Cushing MLP Premier Fund
MainStay Cushing Renaissance Advantage Fund
Asset Allocation/Target Date
MainStay Conservative Allocation Fund
MainStay Growth Allocation Fund
MainStay Moderate Allocation Fund
MainStay Moderate Growth Allocation Fund
MainStay Retirement 2010 Fund
MainStay Retirement 2020 Fund
MainStay Retirement 2030 Fund
MainStay Retirement 2040 Fund
MainStay Retirement 2050 Fund
MainStay Retirement 2060 Fund
Manager
New York Life Investment Management LLC
New York, New York
Subadvisors
Candriam Belgium S.A.3
Brussels, Belgium
Candriam France S.A.S.3
Paris, France
Cornerstone Capital Management Holdings LLC3
New York, New York
Cushing Asset Management, LP
Dallas, Texas
Epoch Investment Partners, Inc.
New York, New York
MacKay Shields LLC3
New York, New York
Markston International LLC
White Plains, New York
NYL Investors LLC3
New York, New York
Winslow Capital Management, LLC
Minneapolis, Minnesota
Legal Counsel
Dechert LLP
Washington, District of Columbia
Independent Registered Public Accounting Firm
KPMG LLP
Philadelphia, Pennsylvania
1. Class A and Class I shares of this Fund are registered for sale in AZ, CA, MI, NV, OR, TX, UT and WA. Class I shares are registered for sale in CO, FL, GA, HI, ID, MA, MD, NH, NJ and NY.
2. This Fund is registered for sale in CA, CT, DE, FL, MA, NJ, NY and VT.
3. An affiliate of New York Life Investment Management LLC.
Not part of the Annual Report
For more information
800-MAINSTAY (624-6782)
mainstayinvestments.com
MainStay Investments® is a registered service mark and name under which New York Life Investment Management LLC does business. MainStay Investments, an indirect subsidiary of New York Life Insurance Company, New York, NY 10010, provides investment advisory products and services. The MainStay Funds® are managed by New York Life Investment Management LLC and distributed by NYLIFE Distributors LLC, 30 Hudson Street, Jersey City, NJ 07302, a wholly owned subsidiary of New York Life Insurance Company. NYLIFE Distributors LLC is a Member FINRA/SIPC.
©2017 NYLIFE Distributors LLC. All rights reserved.
| | | | | | | | |
| Not FDIC/NCUA Insured | | Not a Deposit | | May Lose Value | | No Bank Guarantee | | Not Insured by Any Government Agency |
| | |
| 1715987 MS286-17 | | MSMM11-12/17 (NYLIM) NL214 |
MainStay Tax Free Bond Fund
Message from the President and Annual Report
October 31, 2017


This page intentionally left blank
Message from the President
The 12 months ended October 31, 2017, brought strong performance to equity markets in the United States and abroad.
According to FTSE-Russell data for the U.S. market, stocks at all capitalization levels earned solid double-digit overall returns during the reporting period. Total returns for stocks in general exceeded 20% at all capitalization levels. Growth stocks were particularly strong, outperforming value stocks for companies of all sizes except among microcaps, where value stocks outperformed growth stocks.
Several factors contributed to the strength of domestic and international stock markets during the reporting period. Following the U.S. presidential election in November 2016, many investors looked forward to business tax incentives and possible tax cuts for consumers that could stimulate economic growth. During the reporting period, corporate earnings reports remained strong; and growth in U.S. real gross domestic product remained positive, with a substantial advance during the second quarter of 2017. Developed international markets and emerging markets were also strong, boosted by positive macroeconomic data and growing confidence that Europe was well on its way to financial recovery. Despite wide variations among emerging markets, many saw strong appreciation in local-currency terms and benefited from a weaker U.S. dollar.
During the reporting period, the Federal Open Market Committee raised the federal funds target range three times—in December of 2016 and in March and June of 2017. These incremental increases raised the federal funds target range to 1.00% to 1.25% by the end of the reporting period. These tightening moves were followed by higher U.S. Treasury yields at all maturities, with the greatest increases at the short-end of the maturity spectrum.
As interest rates rise, bond prices tend to decline (and vice versa). As a result, some portions of the U.S. Treasury market recorded negative total returns during the reporting period. Agency securities posted small but positive total returns, as did
asset-backed and mortgage-backed securities. Other bond categories, particularly those with looser ties to U.S. interest rates, did considerably better. Emerging-market debt recorded solid single-digit returns; high-yield bonds were generally stronger; and convertible bonds, which are closely tied to the performance of underlying stocks, provided some of the strongest overall returns of any fixed-income sector during the reporting period.
At MainStay, we have always encouraged investors to diversify their investments and maintain a long-term perspective, even when markets are strong. Asset classes that perform well in one environment may perform differently in another; and in today’s ever-changing world, wide market swings are not unknown.
MainStay offers Funds with a wide array of investment objectives to help our shareholders pursue the appropriate diversification for their long-range financial goals. We also offer several investment boutiques, allowing our shareholders to choose the style—or mix of styles—that’s best suited to their investment needs. We believe that relatively few individual investors can match the level of professional experience and market insight that our portfolio managers provide.
The report that follows provides more detailed information on the specific markets, investment strategies and portfolio decisions that affected your MainStay Fund during the 12 months ended October 31, 2017. We encourage you to read the report carefully and use it to help you evaluate your progress toward your financial goals.
Sincerely,

Kirk C. Lehneis
President
The opinions expressed are as of the date of this report and are subject to change. There is no guarantee that any forecast made will come to pass. This material does not constitute investment advice and is not intended as an endorsement of any specific investment. Past performance is no guarantee of future results.
Not part of the Annual Report
Table of Contents
Investors should refer to the Fund’s Summary Prospectus and/or Prospectus and consider the Fund’s investment objectives, strategies, risks, charges and expenses carefully before investing. The Summary Prospectus and/or Prospectus contain this and other information about the Fund. You may obtain copies of the Fund’s Summary Prospectus, Prospectus and Statement of Additional Information free of charge, upon request, by calling toll-free 800-MAINSTAY (624-6782), by writing to NYLIFE Distributors LLC, Attn: MainStay Marketing Department, 30 Hudson Street, Jersey City, NJ 07302 or by sending an e-mail to MainStayShareholderServices@nylim.com. These documents are also available via the MainStay Funds’ website at mainstayinvestments.com/documents. Please read the Summary Prospectus and/or Prospectus carefully before investing.
Investment and Performance Comparison1 (Unaudited)
Performance data quoted represents past performance. Past performance is no guarantee of future results. Because of market volatility and other factors, current performance may be lower or higher than the figures shown. Investment return and principal value will fluctuate, and as a result, when shares are redeemed, they may be worth more or less than their original cost. The graph below depicts the historical performance of Class B shares2 of the Fund. Performance will vary from class to class based on differences in class-specific expenses and sales charges. For performance information current to the most recent month-end, please call 800-MAINSTAY (624-6782) or visit mainstayinvestments.com.
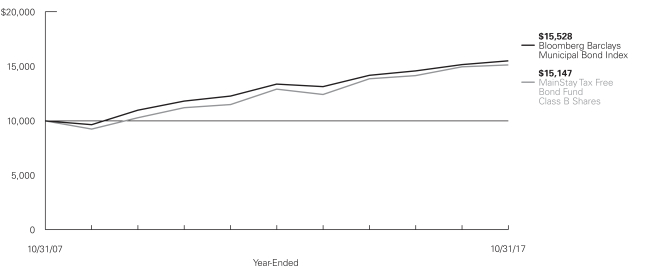
Average Annual Total Returns for the Year-Ended October 31, 2017
| | | | | | | | | | | | | | | | | | | | | | | | |
| Class | | Sales Charge | | | | Inception
Date | | | One Year | | | Five
Years | | | Ten Years or Since
Inception | | | Gross Expense Ratio3 | |
| Class A Shares | | Maximum 4.5% Initial Sales Charge | | With sales charges Excluding sales charges | |
| 1/3/1995
|
| |
| –3.07
1.50 | %
| |
| 2.56
3.50 | %
| |
| 4.09
4.57 | %
| |
| 0.80
0.80 | %
|
| Investor Class Shares | | Maximum 4.5% Initial Sales Charge | | With sales charges Excluding sales charges | |
| 2/28/2008
|
| |
| –3.14
1.43 |
| |
| 2.54
3.49 |
| |
| 4.53
5.03 |
| |
| 0.79
0.79 |
|
| Class B Shares2 | | Maximum 5% CDSC
if Redeemed Within the First Six Years of Purchase | | With sales charges Excluding sales charges | |
| 5/1/1986
|
| |
| –3.75
1.17 |
| |
| 2.87
3.23 |
| |
| 4.24
4.24 |
| |
| 1.04
1.04 |
|
| Class C Shares | | Maximum 1% CDSC
if Redeemed Within One Year of Purchase | | With sales charges Excluding sales charges | |
| 9/1/1998
|
| |
| 0.28
1.27 |
| |
| 3.23
3.23 |
| |
| 4.25
4.25 |
| |
| 1.04
1.04 |
|
| Class I Shares | | No Sales Charge | | | | | 12/21/2009 | | | | 1.75 | | | | 3.76 | | | | 5.46 | | | | 0.55 | |
| 1. | The performance table and graph do not reflect the deduction of taxes that a shareholder would pay on distributions or Fund share redemptions. Total returns reflect maximum applicable sales charges as indicated in the table above, if any, changes in share price, and reinvestment of dividend and capital gain distributions. The graph assumes the initial investment amount shown above and reflects the deduction of all sales charges that would have applied for the period of investment. Performance figures may reflect certain fee waivers and/or expense limitations, without which total returns may have |
| | been lower. For more information on share classes and current fee waivers and/or expense limitations (if any), please refer to the Notes to Financial Statements. |
| 2. | Class B shares are closed to all new purchases as well as additional investments by existing Class B shareholders. |
| 3. | The gross expense ratios presented reflect the Fund’s “Total Annual Fund Operating Expenses” from the most recent Prospectus and may differ from other expense ratios disclosed in this report. |
The footnotes on the next page are an integral part of the table and graph and should be carefully read in conjunction with them.
| | | | | | | | | | | | |
| Benchmark Performance | | One
Year | | | Five
Years | | | Ten Years
or Since
Inception | |
Bloomberg Barclays Municipal Bond Index4 | | | 2.19 | % | | | 3.00 | % | | | 4.50 | % |
Morningstar Muni National Long Category Average5 | | | 1.67 | | | | 2.88 | | | | 4.10 | |
| 4. | The Bloomberg Barclays Municipal Bond Index is the Fund’s primary broad-based securities market index for comparison purposes. The Bloomberg Barclays Municipal Bond Index is considered representative of the broad-based market for investment-grade, tax-exempt bonds with a maturity of at least one year. Bonds subject to the alternative minimum tax or with floating or zero coupons are excluded. Results assume reinvestment of all dividends and capital gains. An investment cannot be made directly in an index. |
| 5. | The Morningstar Muni National Long Category Average is representative of funds that invest in bonds issued by various state and local governments to fund public projects. The income from these bonds is generally free from federal taxes. These portfolios have durations of more than 7.0 years. Results are based on average total returns of similar funds with all dividends and capital gain distributions reinvested. |
The footnotes on the preceding page are an integral part of the table and graph and should be carefully read in conjunction with them.
| | |
| 6 | | MainStay Tax Free Bond Fund |
Cost in Dollars of a $1,000 Investment in MainStay Tax Free Bond Fund (Unaudited)
The example below is intended to describe the fees and expenses borne by shareholders during the six-month period from May 1, 2017, to October 31, 2017, and the impact of those costs on your investment.
Example
As a shareholder of the Fund you incur two types of costs: (1) transaction costs, including exchange fees and sales charges (loads) on purchases (as applicable), and (2) ongoing costs, including management fees, distribution and/or service (12b-1) fees, and other Fund expenses (as applicable). This example is intended to help you understand your ongoing costs (in dollars) of investing in the Fund and to compare these costs with the ongoing costs of investing in other mutual funds. The example is based on an investment of $1,000 made at the beginning of the six-month period and held for the entire period from May 1, 2017, to October 31, 2017.
This example illustrates your Fund’s ongoing costs in two ways:
Actual Expenses
The second and third data columns in the table below provide information about actual account values and actual expenses. You may use the information in these columns, together with the amount you invested, to estimate the expenses that you paid during the six months ended October 31, 2017. Simply divide your account value by $1,000 (for example, an $8,600 account value divided by $1,000 = 8.6), then
multiply the result by the number under the heading entitled “Expenses Paid During Period” to estimate the expenses you paid on your account during this period.
Hypothetical Example for Comparison Purposes
The fourth and fifth data columns in the table below provide information about hypothetical account values and hypothetical expenses based on the Fund’s actual expense ratio and an assumed rate of return of 5% per year before expenses, which is not the Fund’s actual return. The hypothetical account values and expenses may not be used to estimate the actual ending account balances or expenses you paid for the six-month period shown. You may use this information to compare the ongoing costs of investing in the Fund with the ongoing costs of investing in other mutual funds. To do so, compare this 5% hypothetical example with the 5% hypothetical examples that appear in the shareholder reports of the other mutual funds.
Please note that the expenses shown in the table are meant to highlight your ongoing costs only and do not reflect any transactional costs, such as exchange fees or sales charges (loads). Therefore, the fourth and fifth data columns of the table are useful in comparing ongoing costs only and will not help you determine the relative total costs of owning different funds. In addition, if these transactional costs were included, your costs would have been higher.
| | | | | | | | | | | | | | | | | | | | | | |
| | | | | | | | | | | | | | | | | | |
| Share Class | | Beginning
Account
Value
5/1/17 | | | Ending Account
Value (Based
on Actual
Returns and
Expenses)
10/31/17 | | | Expenses
Paid
During
Period1 | | | Ending Account
Value (Based on Hypothetical
5% Annualized
Return and
Actual Expenses)
10/31/17 | | | Expenses
Paid
During
Period1 | | | Net Expense
Ratio
During
Period2 |
| | | | | | |
| Class A Shares | | $ | 1,000.00 | | | $ | 1,028.20 | | | $ | 4.14 | | | $ | 1,021.10 | | | $ | 4.13 | | | 0.81% |
| | | | | | |
| Investor Class Shares | | $ | 1,000.00 | | | $ | 1,028.20 | | | $ | 4.04 | | | $ | 1,021.20 | | | $ | 4.02 | | | 0.79% |
| | | | | | |
| Class B Shares | | $ | 1,000.00 | | | $ | 1,026.00 | | | $ | 5.31 | | | $ | 1,020.00 | | | $ | 5.30 | | | 1.04% |
| | | | | | |
| Class C Shares | | $ | 1,000.00 | | | $ | 1,027.00 | | | $ | 5.31 | | | $ | 1,020.00 | | | $ | 5.30 | | | 1.04% |
| | | | | | |
| Class I Shares | | $ | 1,000.00 | | | $ | 1,029.50 | | | $ | 2.86 | | | $ | 1,022.40 | | | $ | 2.85 | | | 0.56% |
| 1. | Expenses are equal to the Fund’s annualized expense ratio of each class multiplied by the average account value over the period, divided by 365 and multiplied by 184 (to reflect the six-month period). The table above represents the actual expenses incurred during the six-month period. |
| 2. | Expenses are equal to the Fund’s annualized expense ratio to reflect the six-month period. |
Portfolio Composition as of October 31, 2017 (Unaudited)
| | | | |
| New York | | | 21.0 | % |
| Illinois | | | 13.8 | |
| California | | | 10.0 | |
| Puerto Rico | | | 7.4 | |
| Texas | | | 6.1 | |
| South Carolina | | | 4.1 | |
| New Jersey | | | 3.7 | |
| Michigan | | | 3.1 | |
| Pennsylvania | | | 3.0 | |
| Connecticut | | | 2.3 | |
| Ohio | | | 2.1 | |
| Arkansas | | | 1.8 | |
| U.S. Virgin Islands | | | 1.7 | |
| Colorado | | | 1.5 | |
| Guam | | | 1.5 | |
| Florida | | | 1.3 | |
| Massachusetts | | | 1.3 | |
| Missouri | | | 1.3 | |
| Nebraska | | | 1.3 | |
| Rhode Island | | | 1.3 | |
| District of Columbia | | | 1.0 | |
| Oklahoma | | | 1.0 | |
| Tennessee | | | 0.9 | |
| Virginia | | | 0.9 | |
| North Carolina | | | 0.8 | |
| | | | |
| Washington | | | 0.7 | % |
| Alabama | | | 0.6 | |
| Indiana | | | 0.6 | |
| Iowa | | | 0.5 | |
| Kansas | | | 0.5 | |
| Louisiana | | | 0.5 | |
| Montana | | | 0.4 | |
| New Hampshire | | | 0.3 | |
| Minnesota | | | 0.2 | |
| Mississippi | | | 0.2 | |
| North Dakota | | | 0.2 | |
| Wisconsin | | | 0.2 | |
| Alaska | | | 0.1 | |
| Hawaii | | | 0.1 | |
| Kentucky | | | 0.1 | |
| Maryland | | | 0.1 | |
| New Mexico | | | 0.1 | |
| South Dakota | | | 0.1 | |
| Arizona | | | 0.0 | ‡ |
| Utah | | | 0.0 | ‡ |
| Wyoming | | | 0.0 | ‡ |
| Other Assets, Less Liabilities | | | 0.3 | |
| | | | |
| | | 100.0 | % |
| | | | |
See Portfolio of Investments beginning on page 11 for specific holdings within these categories.
| ‡ | Less than one-tenth of a percent. |
Top Ten Issuers Held as of October 31, 2017 (excluding short-term investment) (Unaudited)
| 1. | New York City Transitional Finance Authority, Future Tax Secured, Revenue Bonds, 0.95%–5.00%, due 11/1/22–8/1/45 |
| 2. | South Carolina Public Service Authority, Revenue Bonds, 5.00%, due 12/1/29–12/1/56 |
| 3. | Puerto Rico Highway & Transportation Authority, Revenue Bonds, 5.25%–5.50%, due 7/1/21–7/1/41 (Insured) |
| 4. | New York State Dormitory Authority, Sales Tax, Revenue Bonds, 5.00%, due 3/15/40–3/15/44 |
| 5. | City of New York NY, Unlimited General Obligation, 0.92%–5.25%, due 8/1/24–4/1/36 |
| 6. | State of Illinois, Unlimited General Obligation, 4.00%–5.00%, due 11/1/18–6/1/41 |
| 7. | North Texas Tollway Authority, Revenue Bonds, 5.00%–6.00%, due 1/1/34–9/1/41 |
| 8. | Commonwealth of Puerto Rico, Public Improvement, Unlimited General Obligation, (zero coupon)–6.00%, due 7/1/19–7/1/37 (Insured) |
| 9. | New York State Energy Research & Development Authority, Niagara Mohawk Power Corp., Revenue Bonds, 3.03%–3.104%, due 12/1/25–7/1/29 |
| 10. | City of Chicago IL, Wastewater Transmission, Revenue Bonds, 5.00%–5.25%, due 1/1/28–1/1/47 |
| | |
| 8 | | MainStay Tax Free Bond Fund |
Portfolio Management Discussion and Analysis (Unaudited)
Questions answered by portfolio managers John Loffredo, CFA, Robert DiMella, CFA, Michael Petty, David Dowden, Scott Sprauer and Frances Lewis of MacKay Shields LLC, the Fund’s Subadvisor.
How did MainStay Tax Free Bond Fund perform relative to its primary benchmark and peers during the 12 months ended October 31, 2017?
Excluding all sales charges, MainStay Tax Free Bond Fund returned 1.50% for Class A shares, 1.43% for Investor Class shares, 1.17% for Class B shares and 1.27% for Class C shares for the 12 months ended October 31, 2017. Over the same period, Class I shares returned 1.75%. For the 12 months ended October 31, 2017, all share classes underperformed the 2.19% return of the Bloomberg Barclays Municipal Bond Index,1 which is the Fund’s broad-based securities-market index. Over the same period, Class I shares outperformed—and all other share classes underperformed—the 1.67% return of the Morningstar Muni National Long Category Average.2 See page 5 for Fund returns with applicable sales charges.
What factors affected the Fund’s relative performance during the reporting period?
The Fund’s performance relative to the Bloomberg Barclays Municipal Bond Index was hurt by overweight positions in insured Puerto Rico bonds and issues from the U.S. Virgin Islands. These bonds were negatively affected by Hurricanes Maria and Irma. The Fund’s yield curve3 positioning benefited from an underweight position relative to the Bloomberg Barclays Municipal Bond Index at the front end of the curve, as the Federal Reserve raised the federal funds target range three times during the reporting period. The Fund’s overweight position relative to the Index in the 20- to 30-year portion of the yield curve also benefited relative performance. An overweight position in the intermediate portion of the yield curve, however, detracted from relative performance. The Fund’s performance relative to the Bloomberg Barclay’s Municipal Bond Index was helped by an overweight position in State of Illinois securities as investor sentiment improved after the state enacted a budget following a multiyear impasse. Security selection in the State of California also contributed positively to the Fund’s relative performance. (Contributions take weightings and total returns into account.)
What was the Fund’s duration4 strategy during the reporting period?
During the reporting period, the Fund’s duration was targeted to remain in a neutral range relative to the bonds in which the
Fund can invest, as outlined in the prospectus. This target typically places the Fund’s duration within plus or minus 10% of the benchmark’s duration. As of October 31, 2017, the Fund’s modified duration to worst5 was 4.51 years.
What specific factors, risks or market forces prompted significant decisions for the Fund during the reporting period?
The municipal market experienced a significant dislocation at the beginning of the reporting period. Redemptions, which were already weighing on the municipal market, escalated after the November 2016 U.S. presidential election. The municipal market took the cue from the U.S. Treasury market, with higher rates warranted by fears that a stronger economy could spur higher inflation and the potential for an increasing deficit. We believed that investors also worried about potential changes in the tax code, causing tax-exempt bonds to underperform most of their taxable counterparts. In particular, credit spreads6 in the municipal market widened. While the Fund experienced a significant drawdown in November 2016, our cash reserves insulated us from selling into a difficult market. In fact, we were able to buy bonds in the primary and the secondary marketplace while most of our competitors were selling. After reducing the Fund’s average maturity and increasing its credit quality during the prior six-month period, we reversed course during the fourth quarter of 2016 and began extending maturities and buying lower-rated investment-grade securities. This strategy benefited the Fund for the remainder of the reporting period.
During the reporting period, which sectors were the strongest positive contributors to the Fund’s performance and which sectors were particularly weak?
The most substantial positive contribution to the Fund’s performance during the reporting period came from security selection within the local general obligation bond sector. The Fund’s exposure to the special tax sector detracted from performance. This was mainly the result of certain bonds in the U.S. Virgin Islands and insured Puerto Rico bonds in the special tax sector being affected by natural disasters. The Fund’s exposure to the hospital sector also detracted slightly from the Fund’s performance during the reporting period.
| 1. | See footnote on page 6 for more information on the Bloomberg Barclays Municipal Bond Index. |
| 2. | See footnote on page 6 for more information on the Morningstar Muni National Long Category Average. |
| 3. | The yield curve is a line that plots the yields of various securities of similar quality—typically U.S. Treasury issues—across a range of maturities. The U.S. Treasury yield curve serves as a benchmark for other debt and is used in economic forecasting. |
| 4. | Duration is a measure of the price sensitivity of a fixed-income investment to changes in interest rates. Duration is expressed as a number of years and is considered a more accurate sensitivity gauge than average maturity. |
| 5. | Modified duration is inversely related to the approximate percentage change in price for a given change in yield. Duration to worst is the duration of a bond computed using the bond’s nearest call date or maturity, whichever comes first. This measure ignores future cash flow fluctuations due to embedded optionality. |
| 6. | The terms “spread” and “yield spread” may refer to the difference in yield between a security or type of security and comparable U.S. Treasury issues. The terms may also refer to the difference in yield between two specific securities or types of securities at a given time. The term “credit spread” typically refers to the difference in yield between corporate or municipal bonds (or a specific category of these bonds) and comparable U.S. Treasury issues. |
How did the Fund’s sector weightings change during the reporting period?
During the latter half of the reporting period, the Fund increased its exposure to pre-refunded bonds as the expected number of Federal Reserve rate hikes was lower than it had been during the first half of the reporting period. The Fund slightly reduced its exposure to the special tax sector during the reporting period. The Fund increased its allocation to variable-rate demand notes during the second half of the reporting period, along with its exposure to insured securities. On a state level, the Fund increased its exposure to New York, while it reduced exposure to California and the U.S. Virgin Islands.
How was the Fund positioned at the end of the reporting period?
As of October 31, 2017, the Fund continued to hold an overweight position relative to the Bloomberg Barclays Municipal Bond Index in bonds with maturities of 15 years or longer. As of the end of the reporting period, the Fund held an underweight exposure relative to the benchmark in higher-rated bonds, specifically AAA7 and AA+ bonds, and held an overweight position in securities rated BBB.8 As of the same date, the Fund maintained a defensive duration position in relation to the benchmark by approximately a half-year. This was achieved using differing coupon structures and an increase in the Fund’s cash position, which is held primarily in variable-rate demand notes.
| 7. | An obligation rated ‘AAA’ has the highest rating assigned by Standard & Poor’s (“S&P”), and in the opinion of S&P, the obligor’s capacity to meet its financial commitment on the obligation is extremely strong. An obligation rated ‘AA’ by S&P is deemed by S&P to differ from the highest-rated obligations only to a small degree. In the opinion of S&P, the obligor’s capacity to meet its financial commitment on the obligation is very strong. Ratings from ‘AA’ to ‘CCC may be modified by the addition of a plus (+) or minus (–) sign to show relative standing within the major rating categories. When applied to Fund holdings, ratings are based solely on the creditworthiness of the bonds in the portfolio and are not meant to represent the security or safety of the Fund. |
| 8. | An obligation rated ‘BBB’ by S&P is deemed by S&P to exhibit adequate protection parameters. In the opinion of S&P, however, adverse economic conditions or changing circumstances are more likely to lead to a weakened capacity of the obligor to meet its financial commitment on the obligation. When applied to Fund holdings, ratings are based solely on the creditworthiness of the bonds in the portfolio and are not meant to represent the security or safety of the Fund. |
The opinions expressed are those of the portfolio managers as of the date of this report and are subject to change. There is no guarantee that any forecasts will come to pass. This material does not constitute investment advice and is not intended as an endorsement of any specific investment.
| | |
| 10 | | MainStay Tax Free Bond Fund |
Portfolio of Investments October 31, 2017
| | | | | | | | |
| | | Principal
Amount | | | Value | |
Long-Term Bonds 99.7%† Municipal Bonds 99.7% | | | | | | | | |
Alabama 0.6% | | | | | | | | |
City of Birmingham AL, Unlimited General Obligation
Series A
5.00%, due 3/1/43 | | $ | 4,150,000 | | | $ | 4,660,243 | |
Houston County Health Care Authority, Southeast Alabama Medical, Revenue Bonds | | | | | | | | |
5.00%, due 10/1/25 | | | 1,000,000 | | | | 1,149,790 | |
5.00%, due 10/1/30 | | | 3,700,000 | | | | 4,170,307 | |
University of South Alabama, Revenue Bonds | | | | | | | | |
Insured: AGM
4.00%, due 11/1/35 | | | 2,000,000 | | | | 2,124,220 | |
Insured: AGM
5.00%, due 11/1/29 | | | 1,110,000 | | | | 1,312,719 | |
Insured: AGM
5.00%, due 11/1/30 | | | 2,000,000 | | | | 2,356,520 | |
| | | | | | | | |
| | | | | | | 15,773,799 | |
| | | | | | | | |
Alaska 0.1% | | | | | | | | |
Alaska Industrial Development & Export Authority, FairBanks Community Hospital, Revenue Bonds
5.00%, due 4/1/32 | | | 3,550,000 | | | | 3,916,218 | |
| | | | | | | | |
| | |
Arizona 0.0%‡ | | | | | | | | |
Arizona Health Facilities Authority, Phoenix Children’s Hospital, Revenue Bonds Series A
5.00%, due 2/1/42 | | | 1,000,000 | | | | 1,064,770 | |
| | | | | | | | |
| | |
Arkansas 1.8% | | | | | | | | |
City of Fort Smith AR, Water & Sewer, Revenue Bonds | | | | | | | | |
Insured: BAM
5.00%, due 10/1/27 | | | 1,945,000 | | | | 2,343,414 | |
Insured: BAM
5.00%, due 10/1/28 | | | 1,535,000 | | | | 1,834,494 | |
Insured: BAM
5.00%, due 10/1/29 | | | 1,075,000 | | | | 1,277,186 | |
Insured: BAM
5.00%, due 10/1/31 | | | 2,335,000 | | | | 2,749,789 | |
County of Pulaski AR, Arkansas Children’s Hospital, Revenue Bonds | | | | | | | | |
5.00%, due 3/1/34 | | | 2,000,000 | | | | 2,322,140 | |
5.00%, due 3/1/35 | | | 1,550,000 | | | | 1,794,435 | |
| | | | | | | | |
| | | Principal
Amount | | | Value | |
Arkansas (continued) | | | | | | | | |
Pulaski County Special School District, Limited General Obligation
4.00%, due 2/1/48 | | $ | 15,500,000 | | | $ | 16,048,390 | |
Springdale Public Facilities Board, Arkansas Children’s Northwest, Revenue Bonds
5.00%, due 3/1/34 | | | 2,890,000 | | | | 3,370,203 | |
Springdale School District No. 50, Limited General Obligation | | | | | | | | |
4.00%, due 6/1/36 | | | 2,500,000 | | | | 2,656,850 | |
4.00%, due 6/1/40 | | | 11,000,000 | | | | 11,578,050 | |
University of Arkansas, UALR Campus, Revenue Bonds | | | | | | | | |
5.00%, due 10/1/29 | | | 1,315,000 | | | | 1,575,041 | |
5.00%, due 10/1/30 | | | 1,110,000 | | | | 1,321,688 | |
5.00%, due 10/1/31 | | | 1,205,000 | | | | 1,429,540 | |
| | | | | | | | |
| | | | | | | 50,301,220 | |
| | | | | | | | |
California 10.0% | | | | | | | | |
Anaheim City School District, Election 2010, Unlimited General Obligation
Insured: AGM
6.25%, due 8/1/40 | | | 4,700,000 | | | | 5,559,442 | |
Anaheim Public Financing Authority, Public Improvements Project, Revenue Bonds | | | | | | | | |
Series C, Insured: AGM
(zero coupon), due 9/1/31 | | | 11,990,000 | | | | 7,399,988 | |
Series A-1, Insured: NATL-RE
4.75%, due 9/1/33 | | | 15,675,000 | | | | 15,723,279 | |
Antelope Valley Community College District, Election 2016, Unlimited General Obligation
Series A
4.50%, due 8/1/38 | | | 15,000,000 | | | | 16,638,300 | |
California Educational Facilities Authority, Loma Linda University, Revenue Bonds Series A
5.00%, due 4/1/42 | | | 390,000 | | | | 443,266 | |
California Educational Facilities Authority, San Francisco University, Revenue Bonds
6.125%, due 10/1/30 | | | 1,525,000 | | | | 1,808,726 | |
California Health Facilities Financing Authority, Dignity Health, Revenue Bonds
Series A
6.00%, due 7/1/34 | | | 3,000,000 | | | | 3,244,260 | |
| † | Percentages indicated are based on Fund net assets. |
| ¨ | | Among the Fund’s 10 largest issuers held, as of October 31, 2017, excluding short-term investment. May be subject to change daily. (Unaudited) |
| | | | | | |
The notes to the financial statements are an integral part of,
and should be read in conjunction with, the financial statements. | | | | | 11 | |
Portfolio of Investments October 31, 2017 (continued)
| | | | | | | | |
| | | Principal
Amount | | | Value | |
| Municipal Bonds (continued) | | | | | | | | |
California (continued) | | | | | | | | |
California Health Facilities Financing Authority, Providence St. Joseph Health, Revenue Bonds
Series A
4.00%, due 10/1/35 | | $ | 1,230,000 | | | $ | 1,301,943 | |
California Health Facilities Financing Authority, Sutter Health, Revenue Bonds | | | | | | | | |
Series A
5.00%, due 11/15/34 | | | 5,000,000 | | | | 5,837,550 | |
Series A
5.00%, due 11/15/41 | | | 5,000,000 | | | | 5,747,800 | |
California Municipal Finance Authority, Community Medical Centers, Revenue Bonds
Series A
5.00%, due 2/1/47 | | | 7,250,000 | | | | 8,109,633 | |
California School Facilities Financing Authority, Azusa Unified School District, Revenue Bonds
Insured: AGM
(zero coupon), due 8/1/49 | | | 16,000,000 | | | | 3,756,000 | |
California State Public Works Board, Various Capital Project, Revenue Bonds | | | | | | | | |
Series G-1
5.75%, due 10/1/30 | | | 1,400,000 | | | | 1,525,454 | |
Series I-1
6.625%, due 11/1/34 | | | 175,000 | | | | 174,734 | |
California Statewide Communities Development Authority, Aspire Public Schools, Revenue Bonds
6.375%, due 7/1/45 | | | 780,000 | | | | 828,758 | |
California Statewide Communities Development Authority, Cottage Health Obligation Group, Revenue Bonds 5.25%, due 11/1/30 | | | 1,475,000 | | | | 1,611,157 | |
Ceres Unified School District, Election 2008, Unlimited General Obligation Series A
(zero coupon), due 8/1/37 | | | 4,150,000 | | | | 1,173,869 | |
City of Escondido CA, Unlimited General Obligation
5.00%, due 9/1/36 | | | 5,000,000 | | | | 5,825,800 | |
City of Long Beach CA, Airport System, Revenue Bonds
Series A
5.00%, due 6/1/30 | | | 5,000,000 | | | | 5,418,750 | |
City of Tulare CA, Sewer, Revenue Bonds Insured: AGM
4.00%, due 11/15/41 | | | 5,500,000 | | | | 5,749,975 | |
| | | | | | | | |
| | | Principal
Amount | | | Value | |
California (continued) | | | | | | | | |
Coachella Valley Unified School District, Election 2005, Unlimited General Obligation
Series F, Insured: BAM
5.00%, due 8/1/46 | | $ | 12,385,000 | | | $ | 14,216,122 | |
Coast Community College District, Election 2012, Unlimited General Obligation Series D
4.50%, due 8/1/39 | | | 24,500,000 | | | | 27,651,190 | |
Colton Joint Unified School District, Unlimited General Obligation | | | | | | | | |
Series B, Insured: BAM 4.00%, due 8/1/30 | | | 3,495,000 | | | | 3,858,235 | |
Series B, Insured: BAM 4.00%, due 8/1/31 | | | 2,500,000 | | | | 2,741,400 | |
Firebaugh-Las Deltas Unified School District, Election 2016, Unlimited General Obligation
Series A, Insured: AGM
5.25%, due 8/1/41 | | | 3,000,000 | | | | 3,608,850 | |
Fontana Public Finance Authority, Revenue Bonds
Series A, Insured: BAM
5.00%, due 9/1/32 | | | 2,640,000 | | | | 3,050,177 | |
Fontana Unified School District, Unlimited General Obligation | | | | | | | | |
Series C
(zero coupon), due 8/1/35 | | | 14,800,000 | | | | 6,497,052 | |
Series C
(zero coupon), due 8/1/36 | | | 15,500,000 | | | | 6,308,810 | |
Fresno Unified School District, Election 2001, Unlimited General Obligation | | | | | | | | |
Series G
(zero coupon), due 8/1/32 | | | 6,000,000 | | | | 2,672,940 | |
Series G
(zero coupon), due 8/1/33 | | | 10,000,000 | | | | 4,136,000 | |
Series G
(zero coupon), due 8/1/41 | | | 23,485,000 | | | | 5,507,467 | |
Golden State Tobacco Securitization Corp., Asset-Backed, Revenue Bonds Series A, Insured: AGM
5.00%, due 6/1/40 | | | 5,410,000 | | | | 6,221,717 | |
Lennox School District, Election 2016, Unlimited General Obligation
Insured: AGM
5.25%, due 8/1/42 | | | 5,000,000 | | | | 5,960,250 | |
Live Oak Elementary School District, Certificates of Participation
Insured: AGM
5.00%, due 8/1/39 | | | 3,205,000 | | | | 3,681,520 | |
| | | | |
| 12 | | MainStay Tax Free Bond Fund | | The notes to the financial statements are an integral part of,
and should be read in conjunction with, the financial statements. |
| | | | | | | | |
| | | Principal
Amount | | | Value | |
| Municipal Bonds (continued) | | | | | | | | |
California (continued) | | | | | | | | |
Oakland Unified School District, Alameda County, Unlimited General Obligation | | | | | | | | |
Insured: AGM
5.00%, due 8/1/27 | | $ | 1,160,000 | | | $ | 1,411,360 | |
Insured: AGM
5.00%, due 8/1/28 | | | 1,755,000 | | | | 2,117,092 | |
Insured: AGM
5.00%, due 8/1/29 | | | 2,535,000 | | | | 3,033,989 | |
Oceanside Unified School District, Unrefunded Election 2008, Unlimited General Obligation
Series B, Insured: AGM
(zero coupon), due 8/1/49 | | | 560,000 | | | | 72,038 | |
Paramount Unified School District, Unlimited General Obligation
Insured: BAM
(zero coupon), due 8/1/43 | | | 25,000,000 | | | | 5,894,000 | |
Pomona Unified School District, Election 2008, Unlimited General Obligation
Series E, Insured: AGM
5.00%, due 8/1/30 | | | 3,285,000 | | | | 3,741,878 | |
Regents of the University of California Medical Center, Revenue Bonds
Series B-1
0.80%, due 5/15/32 (a) | | | 3,400,000 | | | | 3,400,000 | |
Riverside County Redevelopment Successor Agency, Jurupa Valley Project, Tax Allocation | | | | | | | | |
Series B, Insured: BAM
5.00%, due 10/1/28 | | | 2,510,000 | | | | 2,999,751 | |
Series B, Insured: BAM
5.00%, due 10/1/29 | | | 875,000 | | | | 1,041,548 | |
Series B, Insured: BAM
5.00%, due 10/1/30 | | | 2,645,000 | | | | 3,133,743 | |
Riverside County Transportation Commission, Limited Tax, Revenue Bonds
Series A
5.25%, due 6/1/30 | | | 3,000,000 | | | | 3,543,660 | |
San Bernardino City Unified School District, Election 2012, Unlimited General Obligation
Series A, Insured: AGM
5.00%, due 8/1/30 | | | 1,000,000 | | | | 1,157,370 | |
San Diego Public Facilities Financing Authority, Capital Improvement Projects, Revenue Bonds
Series A
5.00%, due 10/15/44 | | | 3,000,000 | | | | 3,439,950 | |
| | | | | | | | |
| | | Principal
Amount | | | Value | |
California (continued) | | | | | | | | |
San Lorenzo Unified School District, Election 2008, Unlimited General Obligation
Series B
6.00%, due 8/1/41 | | $ | 4,535,000 | | | $ | 5,259,602 | |
San Marcos School Financing Authority, Revenue Bonds | | | | | | | | |
Insured: AGM
5.00%, due 8/15/33 | | | 500,000 | | | | 594,040 | |
Insured: AGM
5.00%, due 8/15/34 | | | 1,000,000 | | | | 1,182,440 | |
Insured: AGM
5.00%, due 8/15/35 | | | 1,000,000 | | | | 1,177,760 | |
Insured: AGM
5.00%, due 8/15/36 | | | 1,100,000 | | | | 1,290,421 | |
Insured: AGM
5.25%, due 8/15/40 | | | 2,000,000 | | | | 2,401,640 | |
Santa Clara County Financing Authority, Revenue Bonds
Series Q
4.00%, due 5/15/33 | | | 5,000,000 | | | | 5,369,900 | |
Santa Clara Valley Transportation Authority, Revenue Bonds
Series A
5.00%, due 4/1/35 | | | 3,900,000 | | | | 4,576,182 | |
Simi Valley Unified School District, Election 2016, Unlimited General Obligation | | | | | | | | |
Series A
5.00%, due 8/1/38 | | | 1,000,000 | | | | 1,184,620 | |
Series A
5.00%, due 8/1/39 | | | 1,000,000 | | | | 1,181,810 | |
Series A
5.00%, due 8/1/40 | | | 1,195,000 | | | | 1,408,917 | |
Solano County Conmunity College District, Election 2012, Unlimited General Obligation
Series C
5.25%, due 8/1/42 | | | 5,000,000 | | | | 6,076,500 | |
Southern California Public Power Authority, Apex Power Project, Revenue Bonds
Series A
5.00%, due 7/1/33 | | | 4,500,000 | | | | 5,301,315 | |
Southwestern Community College District, Election 2008, Unlimited General Obligation
Series C
(zero coupon), due 8/1/46 | | | 13,000,000 | | | | 4,352,530 | |
| | | | | | |
The notes to the financial statements are an integral part of,
and should be read in conjunction with, the financial statements. | | | | | 13 | |
Portfolio of Investments October 31, 2017 (continued)
| | | | | | | | |
| | | Principal
Amount | | | Value | |
| Municipal Bonds (continued) | | | | | | | | |
California (continued) | | | | | | | | |
State of California, Unlimited General Obligation | | | | | | | | |
6.00%, due 11/1/35 | | $ | 2,500,000 | | | $ | 2,743,425 | |
6.25%, due 11/1/34 | | | 4,000,000 | | | | 4,412,560 | |
Tahoe-Truckee Unified School District, Unlimited General Obligation
Series B
5.00%, due 8/1/41 | | | 2,200,000 | | | | 2,569,402 | |
Twin Rivers Unified School District, Prerefunded, Unlimited General Obligation
Insured: AGM
(zero coupon), due 8/1/32 | | | 230,000 | | | | 155,544 | |
Twin Rivers Unified School District, Unrefunded Election 2006, Unlimited General Obligation
Insured: AGM
(zero coupon), due 8/1/32 | | | 5,120,000 | | | | 3,141,376 | |
Westminster School District, Election 2008, Unlimited General Obligation Series B, Insured: BAM
(zero coupon), due 8/1/48 | | | 13,900,000 | | | | 2,221,081 | |
| | | | | | | | |
| | | | | | | 285,577,858 | |
| | | | | | | | |
Colorado 1.5% | | | | | | | | |
Colorado Health Facilities Authority, Evangelical Lutheran Good Samaritan, Revenue Bonds
5.625%, due 6/1/43 | | | 1,180,000 | | | | 1,339,984 | |
Denver Convention Center Hotel Authority, Revenue Bonds | | | | | | | | |
5.00%, due 12/1/30 | | | 1,305,000 | | | | 1,513,343 | |
5.00%, due 12/1/31 | | | 1,395,000 | | | | 1,608,114 | |
5.00%, due 12/1/32 | | | 2,500,000 | | | | 2,866,975 | |
5.00%, due 12/1/36 | | | 1,000,000 | | | | 1,131,590 | |
Rampart Range Metropolitan District No. 1, Revenue Bonds
Insured: AGM
5.00%, due 12/1/42 | | | 9,500,000 | | | | 10,901,440 | |
Regional Transportation District, Certificates of Participation
Series A
4.50%, due 6/1/44 | | | 19,920,000 | | | | 21,433,920 | |
Vista Ridge Metropolitan District, Unlimited General Obligation
Series A, Insured: BAM
5.00%, due 12/1/31 | | | 1,250,000 | | | | 1,433,488 | |
| | | | | | | | |
| | | | | | | 42,228,854 | |
| | | | | | | | |
| | | | | | | | |
| | | Principal
Amount | | | Value | |
Connecticut 2.3% | | | | | | | | |
City of Hartford CT, Unlimited General Obligation | | | | | | | | |
Series A
5.00%, due 4/1/28 | | $ | 2,500,000 | | | $ | 2,375,025 | |
Series C, Insured: AGM
5.00%, due 7/15/32 | | | 7,470,000 | | | | 8,110,104 | |
Series C, Insured: AGM
5.00%, due 7/15/34 | | | 2,500,000 | | | | 2,691,650 | |
City of Hartford CT, Unrefunded, Unlimited General Obligation | | | | | | | | |
Series A
5.00%, due 4/1/29 | | | 895,000 | | | | 850,259 | |
Series A, Insured: AGM
5.00%, due 4/1/32 | | | 195,000 | | | | 209,752 | |
Connecticut State Health & Educational Facility Authority, Quinnipiac University, Revenue Bonds
Series L
5.00%, due 7/1/32 | | | 10,425,000 | | | | 12,020,025 | |
Connecticut State Health & Educational Facility Authority, Yale University, Revenue Bonds
0.72%, due 7/1/36 (a) | | | 550,000 | | | | 550,000 | |
State of Connecticut Special Tax, Transportation Infrastructure, Revenue Bonds | | | | | | | | |
Series A
5.00%, due 9/1/30 | | | 5,000,000 | | | | 5,692,700 | |
Series A, Insured: BAM
5.00%, due 9/1/31 | | | 14,470,000 | | | | 16,907,761 | |
Series A
5.00%, due 9/1/33 | | | 13,000,000 | | | | 14,905,540 | |
| | | | | | | | |
| | | | | | | 64,312,816 | |
| | | | | | | | |
District of Columbia 1.0% | | | | | | | | |
District of Columbia, Friendship Public Charter School, Inc., Revenue Bonds | | | | | | | | |
5.00%, due 6/1/32 | | | 1,125,000 | | | | 1,235,587 | |
5.00%, due 6/1/42 | | | 5,500,000 | | | | 5,938,350 | |
District of Columbia, Gallery Place Project, Tax Allocation
5.00%, due 6/1/27 | | | 525,000 | | | | 584,346 | |
District of Columbia, KIPP Charter School, Revenue Bonds | | | | | | | | |
6.00%, due 7/1/43 | | | 1,000,000 | | | | 1,143,950 | |
6.00%, due 7/1/48 | | | 1,575,000 | | | | 1,797,343 | |
| | | | |
| 14 | | MainStay Tax Free Bond Fund | | The notes to the financial statements are an integral part of,
and should be read in conjunction with, the financial statements. |
| | | | | | | | |
| | | Principal
Amount | | | Value | |
| Municipal Bonds (continued) | | | | | | | | |
District of Columbia (continued) | | | | | | | | |
Metropolitan Washington Airports Authority Dulles Toll Road, Revenue Bonds | | | | | | | | |
Series B
(zero coupon), due 10/1/44 | | $ | 7,140,000 | | | $ | 8,610,983 | |
Series C, Insured: AGC
6.50%, due 10/1/41 | | | 8,000,000 | | | | 10,364,480 | |
| | | | | | | | |
| | | | | | | 29,675,039 | |
| | | | | | | | |
Florida 1.3% | | | | | | | | |
City of Miami Beach FL Parking, Revenue Bonds | | | | | | | | |
Insured: BAM
5.00%, due 9/1/34 | | | 1,000,000 | | | | 1,159,790 | |
Insured: BAM
5.00%, due 9/1/35 | | | 1,990,000 | | | | 2,303,425 | |
Insured: BAM
5.00%, due 9/1/40 | | | 2,500,000 | | | | 2,865,325 | |
City of Orlando FL, Prerefunded Third Lien, Tourist Development Tax, Revenue Bonds
Insured: AGC
5.50%, due 11/1/38 | | | 9,280,000 | | | | 9,280,000 | |
City of Orlando FL, Unrefunded Third Lien, Tourist Development Tax, Revenue Bonds
Insured: AGC
5.50%, due 11/1/38 | | | 4,720,000 | | | | 4,734,963 | |
County of Miami-Dade FL Aviation, Miami International Airport, Revenue Bonds,
Insured: AGM (b) | | | 10,000,000 | | | | 10,365,315 | |
County of Miami-Dade FL Aviation, Revenue Bonds
5.00%, due 10/1/31 | | | 750,000 | | | | 884,535 | |
County of Miami-Dade FL, Jackson Health System, Revenue Bonds
Series A, Insured: BAM
5.00%, due 6/1/33 | | | 3,375,000 | | | | 3,830,254 | |
Orange County Health Facilities Authority, Presbyterian Retirement Communities, Revenue Bonds
5.00%, due 8/1/31 | | | 1,500,000 | | | | 1,683,225 | |
Pinellas County Health Facilities Authority, BayCare Health System, Revenue Bonds
0.93%, due 11/1/38 (a) | | | 1,000,000 | | | | 1,000,000 | |
| | | | | | | | |
| | | | | | | 38,106,832 | |
| | | | | | | | |
Guam 1.5% | | | | | | | | |
Antonio B Won Pat International Airport Authority, Revenue Bonds
Series C, Insured: AGM
6.125%, due 10/1/43 (b) | | | 5,000,000 | | | | 5,879,300 | |
| | | | | | | | |
| | | Principal
Amount | | | Value | |
Guam (continued) | | | | | | | | |
Guam Government, Waterworks Authority, Revenue Bonds | | | | | | | | |
5.00%, due 7/1/36 | | $ | 1,750,000 | | | $ | 1,902,355 | |
5.00%, due 1/1/46 | | | 2,500,000 | | | | 2,679,500 | |
Guam Power Authority, Revenue Bonds | | | | | | | | |
Series A, Insured: AGM
5.00%, due 10/1/30 | | | 5,610,000 | | | | 6,232,654 | |
Series A, Insured: AGM
5.00%, due 10/1/44 | | | 655,000 | | | | 722,033 | |
Territory of Guam, Revenue Bonds | | | | | | | | |
Series D
5.00%, due 11/15/35 | | | 8,350,000 | | | | 8,932,496 | |
Series A
5.125%, due 1/1/42 | | | 3,085,000 | | | | 3,236,042 | |
Series A
5.25%, due 1/1/36 | | | 2,000,000 | | | | 2,126,440 | |
Series A
6.50%, due 11/1/40 | | | 2,700,000 | | | | 3,096,603 | |
Territory of Guam, Section 30, Revenue Bonds | | | | | | | | |
Series A
5.00%, due 12/1/27 | | | 2,265,000 | | | | 2,648,011 | |
Series A
5.00%, due 12/1/32 | | | 1,250,000 | | | | 1,415,112 | |
Series A
5.00%, due 12/1/34 | | | 2,290,000 | | | | 2,569,563 | |
Series A
5.00%, due 12/1/36 | | | 1,000,000 | | | | 1,114,640 | |
| | | | | | | | |
| | | | | | | 42,554,749 | |
| | | | | | | | |
Hawaii 0.1% | | | | | | | | |
State of Hawaii Department of Budget & Finance, Hawaiian Electric Co., Revenue Bonds
6.50%, due 7/1/39 | | | 3,000,000 | | | | 3,244,950 | |
| | | | | | | | |
| | |
Illinois 13.8% | | | | | | | | |
Carol Stream Park District, Unlimited General Obligation
Insured: BAM
5.00%, due 1/1/37 | | | 3,995,000 | | | | 4,538,600 | |
Chicago Board of Education, School Reform, Unlimited General Obligation Series A, Insured: NATL-RE (zero coupon), due 12/1/26 | | | 19,995,000 | | | | 14,105,073 | |
Chicago Board of Education, Special Tax 6.00%, due 4/1/46 | | | 19,485,000 | | | | 22,883,963 | |
Chicago Board of Education, Unlimited General Obligation | | | | | | | | |
Series C, Insured: AGM
5.00%, due 12/1/32 | | | 16,000,000 | | | | 16,464,640 | |
Series A, Insured: AGM
5.50%, due 12/1/39 | | | 11,455,000 | | | | 12,630,627 | |
| | | | | | |
The notes to the financial statements are an integral part of,
and should be read in conjunction with, the financial statements. | | | | | 15 | |
Portfolio of Investments October 31, 2017 (continued)
| | | | | | | | |
| | | Principal
Amount | | | Value | |
| Municipal Bonds (continued) | | | | | | | | |
Illinois (continued) | | | | | | | | |
Chicago O’Hare International Airport, Prerefunded Third Lien, Revenue Bonds Series A
5.625%, due 1/1/35 | | $ | 1,815,000 | | | $ | 2,057,520 | |
Chicago O’Hare International Airport, Unrefunded Third Lien, Revenue Bonds Series A
5.625%, due 1/1/35 | | | 435,000 | | | | 487,222 | |
Chicago Park District, Limited General Obligation | | | | | | | | |
Series A
5.00%, due 1/1/28 | | | 1,000,000 | | | | 1,146,170 | |
Series A
5.00%, due 1/1/29 | | | 750,000 | | | | 851,475 | |
Series A
5.00%, due 1/1/31 | | | 1,000,000 | | | | 1,119,230 | |
Series A 5.00%, due 1/1/35 | | | 2,000,000 | | | | 2,202,400 | |
Chicago Transit Authority, Second Lien, Revenue Bonds | | | | | | | | |
5.00%, due 12/1/46 | | | 10,000,000 | | | | 10,826,100 | |
5.00%, due 12/1/51 | | | 6,750,000 | | | | 7,318,350 | |
City of Chicago IL Motor Fuel Tax, Revenue Bonds
Insured: AGM
5.00%, due 1/1/33 | | | 4,725,000 | | | | 5,118,167 | |
City of Chicago IL, Unlimited General Obligation | | | | | | | | |
Series A, Insured: AGM
5.00%, due 1/1/26 | | | 10,000,000 | | | | 10,588,200 | |
Series A
6.00%, due 1/1/38 | | | 19,050,000 | | | | 21,853,398 | |
Series A, Insured: BAM
6.00%, due 1/1/38 | | | 6,000,000 | | | | 7,411,680 | |
¨City of Chicago IL, Wastewater Transmission, Revenue Bonds | | | | | | | | |
5.00%, due 1/1/28 | | | 1,000,000 | | | | 1,115,920 | |
Series B, Insured: AGM
5.00%, due 1/1/30 | | | 7,585,000 | | | | 8,785,705 | |
5.00%, due 1/1/33 | | | 2,000,000 | | | | 2,178,840 | |
5.00%, due 1/1/39 | | | 8,420,000 | | | | 9,080,549 | |
5.00%, due 1/1/44 | | | 14,840,000 | | | | 15,860,102 | |
Series A
5.00%, due 1/1/47 | | | 2,675,000 | | | | 2,921,314 | |
Series A, Insured: AGM 5.25%, due 1/1/42 | | | 4,000,000 | | | | 4,585,080 | |
City of Chicago IL, Wastewater, Revenue Bonds | | | | | | | | |
5.00%, due 11/1/27 | | | 1,000,000 | | | | 1,136,200 | |
5.00%, due 11/1/29 | | | 1,700,000 | | | | 1,913,163 | |
Insured: AGM
5.25%, due 11/1/33 | | | 4,535,000 | | | | 5,359,100 | |
| | | | | | | | |
| | | Principal
Amount | | | Value | |
Illinois (continued) | | | | | | | | |
City of Chicago IL, Wastewater, Revenue Bonds (continued) | | | | | | | | |
Insured: AGM
5.25%, due 11/1/34 | | $ | 1,785,000 | | | $ | 2,099,321 | |
Insured: AGM
5.25%, due 11/1/35 | | | 3,025,000 | | | | 3,554,829 | |
City of Country Club Hills IL, Unlimited General Obligation
Insured: BAM
4.50%, due 12/1/31 | | | 455,000 | | | | 492,142 | |
Cook County Community College District No. 508, City College of Chicago, Unlimited General Obligation
Insured: BAM
5.50%, due 12/1/38 | | | 5,000,000 | | | | 5,598,500 | |
Cook County Community High School District No. 212 Leyden, Revenue Bonds | | | | | | | | |
Series C, Insured: BAM
5.00%, due 12/1/30 | | | 3,370,000 | | | | 3,824,579 | |
Series C, Insured: BAM
5.00%, due 12/1/31 | | | 2,610,000 | | | | 2,958,487 | |
County of Cook IL, Unlimited General Obligation
Series A, Insured: AGM
5.00%, due 11/15/26 | | | 8,350,000 | | | | 9,893,998 | |
Illinois Finance Authority, Memorial Health System, Revenue Bonds
0.92%, due 10/1/22 (a) | | | 4,240,000 | | | | 4,240,000 | |
Illinois Finance Authority, Rehab Institute of Chicago, Revenue Bonds
Series A
6.00%, due 7/1/43 | | | 9,600,000 | | | | 10,812,384 | |
Illinois Finance Authority, University of Chicago Medical Center, Revenue Bonds (a) | | | | | | | | |
Series E-1
0.88%, due 8/1/43 | | | 13,100,000 | | | | 13,100,000 | |
Series B
0.88%, due 8/1/44 | | | 1,500,000 | | | | 1,500,000 | |
Illinois Sports Facilities Authority, Revenue Bonds
Insured: AGM
5.25%, due 6/15/31 | | | 5,000,000 | | | | 5,562,750 | |
Madison County Community Unit School, District No. 7 Edwardsville, Unlimited General Obligation | | | | | | | | |
Insured: BAM
4.00%, due 12/1/18 | | | 1,240,000 | | | | 1,271,868 | |
Insured: BAM
4.00%, due 12/1/19 | | | 2,475,000 | | | | 2,588,380 | |
Insured: BAM
4.00%, due 12/1/20 | | | 2,085,000 | | | | 2,217,085 | |
| | | | |
| 16 | | MainStay Tax Free Bond Fund | | The notes to the financial statements are an integral part of,
and should be read in conjunction with, the financial statements. |
| | | | | | | | |
| | | Principal
Amount | | | Value | |
| Municipal Bonds (continued) | | | | | | | | |
Illinois (continued) | | | | | | | | |
Metropolitan Pier & Exposition Authority, Capital Appreciation, Revenue Bonds
Series A, Insured: AGM
(zero coupon), due 6/15/30 | | $ | 14,250,000 | | | $ | 8,938,740 | |
Metropolitan Pier & Exposition Authority, Capital Appreciation-McCormick, Revenue Bonds
Series A, Insured: NATL-RE
(zero coupon), due 6/15/36 | | | 53,190,000 | | | | 24,486,548 | |
Public Building Commission of Chicago, Chicago Transit Authority, Revenue Bonds
Insured: AMBAC
5.25%, due 3/1/29 | | | 580,000 | | | | 664,883 | |
Rock Island County, Public Building Commission, Revenue Bonds | | | | | | | | |
Insured: AGM
5.00%, due 12/1/31 | | | 500,000 | | | | 576,815 | |
Insured: AGM
5.00%, due 12/1/36 | | | 2,645,000 | | | | 2,986,417 | |
Southern Illinois University, Housing & Auxiliary Facilities System, Revenue Bonds | | | | | | | | |
Series B, Insured: BAM
5.00%, due 4/1/26 | | | 1,175,000 | | | | 1,347,455 | |
Series B, Insured: BAM
5.00%, due 4/1/29 | | | 1,620,000 | | | | 1,826,501 | |
Series B, Insured: BAM
5.00%, due 4/1/30 | | | 1,000,000 | | | | 1,121,460 | |
¨State of Illinois, Unlimited General Obligation | | | | | | | | |
Insured: BAM
4.00%, due 6/1/41 | | | 12,600,000 | | | | 12,773,628 | |
5.00%, due 11/1/18 | | | 30,000,000 | | | | 30,979,500 | |
Insured: AGM
5.00%, due 1/1/19 | | | 9,000,000 | | | | 9,349,110 | |
United City of Yorkville, Special Tax
Insured: AGM
5.00%, due 3/1/32 | | | 3,790,000 | | | | 4,309,003 | |
Village of Bellwood IL, Unlimited General Obligation
Insured: AGM
5.00%, due 12/1/29 | | | 1,500,000 | | | | 1,723,095 | |
Village of Crestwood IL, Alternative Revenue Source, Unlimited General Obligation | | | | | | | | |
Series B, Insured: BAM
5.00%, due 12/15/29 | | | 750,000 | | | | 841,732 | |
Series B, Insured: BAM
5.00%, due 12/15/30 | | | 850,000 | | | | 952,943 | |
Series B, Insured: BAM
5.00%, due 12/15/31 | | | 955,000 | | | | 1,068,387 | |
| | | | | | | | |
| | | Principal
Amount | | | Value | |
Illinois (continued) | | | | | | | | |
Village of Oswego IL, Unlimited General Obligation
5.00%, due 12/15/33 | | $ | 7,670,000 | | | $ | 8,936,087 | |
Village of Rosemont IL, Corporate Purpose Bond, Unlimited General Obligation | | | | | | | | |
Series A, Insured: AGM
5.00%, due 12/1/40 | | | 8,090,000 | | | | 9,006,840 | |
Series A, Insured: AGM
5.00%, due 12/1/46 | | | 6,500,000 | | | | 7,188,740 | |
| | | | | | | | |
| | | | | | | 393,330,995 | |
| | | | | | | | |
Indiana 0.6% | | | | | | | | |
Indiana Finance Authority, Duke Energy Indiana Project A-4, Revenue Bonds
0.89%, due 12/1/39 (a) | | | 7,000,000 | | | | 7,000,000 | |
Indiana Finance Authority, Educational Facilities-Butler University, Revenue Bonds | | | | | | | | |
Series B
5.00%, due 2/1/24 | | | 2,100,000 | | | | 2,359,791 | |
Series A
5.00%, due 2/1/25 | | | 2,215,000 | | | | 2,473,668 | |
Series B
5.00%, due 2/1/25 | | | 2,210,000 | | | | 2,468,084 | |
Series B
5.00%, due 2/1/26 | | | 2,320,000 | | | | 2,571,998 | |
Indianapolis Local Public Improvement Bond Bank, Unrefunded-Waterworks Project, Revenue Bonds
Series A, Insured: AGC
5.50%, due 1/1/38 | | | 885,000 | | | | 928,099 | |
| | | | | | | | |
| | | | | | | 17,801,640 | |
| | | | | | | | |
Iowa 0.5% | | | | | | | | |
City of Coralville IA, Certificates of Participation | | | | | | | | |
Series E
4.00%, due 6/1/21 | | | 545,000 | | | | 577,820 | |
Series E
4.00%, due 6/1/22 | | | 1,405,000 | | | | 1,498,165 | |
Series E
4.00%, due 6/1/23 | | | 1,320,000 | | | | 1,409,021 | |
City of Hills IA, Mercy Hospital Project, Revenue Bonds
0.98%, due 8/1/35 (a) | | | 12,080,000 | | | | 12,080,000 | |
| | | | | | | | |
| | | | | | | 15,565,006 | |
| | | | | | | | |
Kansas 0.5% | | | | | | | | |
City of Hutchinson KS, Hutchinson Regional Medical Center, Inc., Revenue Bonds | | | | | | | | |
5.00%, due 12/1/26 | | | 565,000 | | | | 644,100 | |
5.00%, due 12/1/28 | | | 410,000 | | | | 460,869 | |
| | | | | | |
The notes to the financial statements are an integral part of,
and should be read in conjunction with, the financial statements. | | | | | 17 | |
Portfolio of Investments October 31, 2017 (continued)
| | | | | | | | |
| | | Principal
Amount | | | Value | |
| Municipal Bonds (continued) | | | | | | | | |
Kansas (continued) | | | | | | | | |
City of Hutchinson KS, Hutchinson Regional Medical Center, Inc., Revenue Bonds (continued) | | | | | | | | |
5.00%, due 12/1/30 | | $ | 500,000 | | | $ | 555,025 | |
5.00%, due 12/1/36 | | | 1,150,000 | | | | 1,245,921 | |
University of Kansas Hospital Authority, KU Health System, Revenue Bonds | | | | | | | | |
5.00%, due 9/1/33 | | | 2,500,000 | | | | 2,873,425 | |
5.00%, due 9/1/34 | | | 5,000,000 | | | | 5,728,000 | |
5.00%, due 9/1/35 | | | 2,800,000 | | | | 3,199,196 | |
| | | | | | | | |
| | | | | | | 14,706,536 | |
| | | | | | | | |
Kentucky 0.1% | | | | | | | | |
City of Ashland KY, King’s Daughters Medical Center Project, Revenue Bonds | | | | | | | | |
Series A
4.00%, due 2/1/21 | | | 1,070,000 | | | | 1,137,977 | |
Series A
5.00%, due 2/1/23 | | | 1,525,000 | | | | 1,731,409 | |
| | | | | | | | |
| | | | | | | 2,869,386 | |
| | | | | | | | |
Louisiana 0.5% | | | | | | | | |
City of Shreveport LA, Water & Sewer, Revenue Bonds
Series B, Insured: AGM
4.00%, due 12/1/41 | | | 2,750,000 | | | | 2,858,762 | |
Jefferson Parish, Louisiana Hospital Service District No. 1, West Jefferson Medical Center, Revenue Bonds
Series A, Insured: AGM
6.00%, due 1/1/39 | | | 3,695,000 | | | | 4,231,514 | |
Louisiana Local Government Environmental Facilities & Community Development Authority, McNeese State University Student Parking Co., Revenue Bonds | | | | | | | | |
Insured: AGM
4.00%, due 3/1/22 | | | 335,000 | | | | 367,472 | |
Insured: AGM
4.00%, due 3/1/23 | | | 350,000 | | | | 377,079 | |
Louisiana Public Facilities Authority, Loyola University, Revenue Bonds
5.25%, due 10/1/30 | | | 2,930,000 | | | | 3,371,434 | |
Louisiana Public Facilities Authority, Prerefunded-Ochsner Clinic Foundation Project, Revenue Bonds
5.00%, due 5/15/34 | | | 20,000 | | | | 24,793 | |
Louisiana Public Facilities Authority, Unrefunded-Ochsner Clinic Foundation Project, Revenue Bonds
5.00%, due 5/15/34 | | | 2,010,000 | | | | 2,279,963 | |
| | | | | | | | |
| | | Principal
Amount | | | Value | |
Louisiana (continued) | | | | | | | | |
Louisiana Stadium & Exposition District, Revenue Bonds
Series A
5.00%, due 7/1/30 | | $ | 1,485,000 | | | $ | 1,697,593 | |
| | | | | | | | |
| | | | | | | 15,208,610 | |
| | | | | | | | |
Maryland 0.1% | | | | | | | | |
Maryland Health & Higher Educational Facilities Authority, Peninsula Regional Medical Center, Revenue Bonds
5.00%, due 7/1/39 | | | 3,600,000 | | | | 3,950,316 | |
| | | | | | | | |
| | |
Massachusetts 1.3% | | | | | | | | |
Massachusetts Development Finance Agency, UMass Boston Student Housing Project, Revenue Bonds | | | | | | | | |
5.00%, due 10/1/30 | | | 1,200,000 | | | | 1,359,372 | |
5.00%, due 10/1/31 | | | 1,200,000 | | | | 1,353,432 | |
5.00%, due 10/1/32 | | | 1,240,000 | | | | 1,391,429 | |
5.00%, due 10/1/33 | | | 1,500,000 | | | | 1,675,845 | |
5.00%, due 10/1/34 | | | 2,170,000 | | | | 2,415,579 | |
Massachusetts Development Finance Agency, WGBH Educational Foundation, Revenue Bonds | | | | | | | | |
4.00%, due 1/1/32 | | | 1,645,000 | | | | 1,777,455 | |
4.00%, due 1/1/33 | | | 1,000,000 | | | | 1,072,610 | |
Massachusetts Educational Financing Authority, Revenue Bonds | | | | | | | | |
Series B
5.70%, due 1/1/31 (b) | | | 1,315,000 | | | | 1,381,736 | |
Series I
6.00%, due 1/1/28 | | | 1,520,000 | | | | 1,606,838 | |
Massachusetts State Development Finance Agency, Prerefunded-Suffolk University, Revenue Bonds | | | | | | | | |
Series A
6.00%, due 7/1/24 | | | 1,285,000 | | | | 1,387,839 | |
Series A
6.25%, due 7/1/30 | | | 4,090,000 | | | | 4,434,133 | |
Massachusetts State Development Finance Agency, Unrefunded-Suffolk University, Revenue Bonds | | | | | | | | |
Series A
6.00%, due 7/1/24 | | | 715,000 | | | | 767,781 | |
Series A 6.25%, due 7/1/30 | | | 2,310,000 | | | | 2,484,035 | |
Massachusetts State Water Resources Authority, Revenue Bonds
Series C
0.89%, due 8/1/20 (a) | | | 11,620,000 | | | | 11,620,000 | |
| | | | |
| 18 | | MainStay Tax Free Bond Fund | | The notes to the financial statements are an integral part of,
and should be read in conjunction with, the financial statements. |
| | | | | | | | |
| | | Principal
Amount | | | Value | |
| Municipal Bonds (continued) | | | | | | | | |
Massachusetts (continued) | | | | | | | | |
Metropolitan Boston Transit Parking Corp., Revenue Bonds
5.25%, due 7/1/36 | | $ | 2,000,000 | | | $ | 2,264,060 | |
| | | | | | | | |
| | | | | | | 36,992,144 | |
| | | | | | | | |
Michigan 3.1% | | | | | | | | |
City of Detroit MI, Sewage Disposal System, Senior Lien, Revenue Bonds | | | | | | | | |
Series A, Insured: NATL-RE
5.25%, due 7/1/20 | | | 2,000,000 | | | | 2,006,960 | |
Series A
5.25%, due 7/1/39 | | | 14,150,000 | | | | 15,701,123 | |
Series C-1, Insured: AGM
7.00%, due 7/1/27 | | | 5,000,000 | | | | 5,464,900 | |
City of Detroit MI, Water Supply System, Senior Lien, Revenue Bonds | | | | | | | | |
Series A
5.25%, due 7/1/41 | | | 5,000,000 | | | | 5,443,600 | |
Series A
5.75%, due 7/1/37 | | | 5,550,000 | | | | 6,200,238 | |
County of Wayne MI, Capital Improvement, Limited General Obligation
Series A, Insured: AGM
5.00%, due 2/1/38 | | | 2,500,000 | | | | 2,517,600 | |
Detroit City School District, Improvement School Building & Site, Unlimited General Obligation | | | | | | | | |
Series A, Insured: Q-SBLF
5.00%, due 5/1/26 | | | 750,000 | | | | 841,500 | |
Series A, Insured: Q-SBLF
5.00%, due 5/1/27 | | | 7,500,000 | | | | 8,387,700 | |
Series A, Insured: Q-SBLF
5.00%, due 5/1/29 | | | 3,620,000 | | | | 4,022,218 | |
Series A, Insured: Q-SBLF
5.00%, due 5/1/33 | | | 4,535,000 | | | | 4,998,205 | |
Lincoln Consolidated School District, Unlimited General Obligation | | | | | | | | |
Series A, Insured: AGM
5.00%, due 5/1/28 | | | 2,030,000 | | | | 2,440,446 | |
Series A, Insured: AGM
5.00%, due 5/1/30 | | | 1,455,000 | | | | 1,728,234 | |
Series A, Insured: AGM
5.00%, due 5/1/40 | | | 1,500,000 | | | | 1,707,870 | |
Livonia Public School District, Unlimited General Obligation
Insured: AGM
5.00%, due 5/1/40 | | | 2,115,000 | | | | 2,391,240 | |
Michigan Finance Authority, Great Lakes Water, Revenue Bonds | | | | | | | | |
Series C-7, Insured: NATL-RE
5.00%, due 7/1/32 | | | 2,500,000 | | | | 2,810,050 | |
| | | | | | | | |
| | | Principal
Amount | | | Value | |
Michigan (continued) | | | | | | | | |
Michigan Finance Authority, Great Lakes Water, Revenue Bonds (continued) | | | | | | | | |
Series C-3, Insured: AGM
5.00%, due 7/1/33 | | $ | 3,000,000 | | | $ | 3,386,910 | |
Series C-1
5.00%, due 7/1/44 | | | 2,500,000 | | | | 2,721,675 | |
Michigan Finance Authority, Local Government Loan Program, Revenue Bonds | | | | | | | | |
Series D2, Insured: AGM
5.00%, due 7/1/28 | | | 500,000 | | | | 572,640 | |
Series D-1
5.00%, due 7/1/33 | | | 500,000 | | | | 565,800 | |
Series D-1
5.00%, due 7/1/34 | | | 500,000 | | | | 563,615 | |
Series D1, Insured: AGM
5.00%, due 7/1/35 | | | 2,000,000 | | | | 2,246,320 | |
Series D6, Insured: NATL-RE
5.00%, due 7/1/36 | | | 7,400,000 | | | | 8,208,820 | |
Saginaw City School District, Unlimited General Obligation | | | | | | | | |
Insured: Q-SBLF
5.00%, due 5/1/29 | | | 260,000 | | | | 301,922 | |
Insured: Q-SBLF
5.00%, due 5/1/30 | | | 350,000 | | | | 403,865 | |
Insured: Q-SBLF
5.00%, due 5/1/31 | | | 750,000 | | | | 862,380 | |
Insured: Q-SBLF
5.00%, due 5/1/34 | | | 250,000 | | | | 281,073 | |
Insured: Q-SBLF
5.00%, due 5/1/35 | | | 350,000 | | | | 392,676 | |
Insured: Q-SBLF
5.00%, due 5/1/36 | | | 425,000 | | | | 475,486 | |
| | | | | | | | |
| | | | | | | 87,645,066 | |
| | | | | | | | |
Minnesota 0.2% | | | | | | | | |
Housing & Redevelopment Authority of The City of St. Paul Minnesota, Fairview Health Services, Revenue Bonds
4.00%, due 11/15/37 | | | 1,000,000 | | | | 1,051,520 | |
Saint Paul MN, Housing & Redevelopment Authority Health Care, Allina Health System, Revenue Bonds
5.00%, due 11/15/22 | | | 5,000,000 | | | | 5,007,350 | |
| | | | | | | | |
| | | | | | | 6,058,870 | |
| | | | | | | | |
Mississippi 0.2% | | | | | | | | |
Mississippi Business Finance Corp., Gulf Power Co., Revenue Bonds
0.99%, due 11/1/42 (a)(b) | | | 5,900,000 | | | | 5,900,000 | |
| | | | | | | | |
| | | | | | |
The notes to the financial statements are an integral part of,
and should be read in conjunction with, the financial statements. | | | | | 19 | |
Portfolio of Investments October 31, 2017 (continued)
| | | | | | | | |
| | | Principal
Amount | | | Value | |
| Municipal Bonds (continued) | | | | | | | | |
Missouri 1.3% | | | | | | | | |
City of Kansas MO, Improvement Downtown Arena Project, Revenue Bonds
Series E
5.00%, due 4/1/40 | | $ | 10,055,000 | | | $ | 11,454,254 | |
Health & Educational Facilities Authority of the State of Missouri, Kansas City Art Institute, Revenue Bonds
0.94%, due 12/1/35 (a) | | | 1,640,000 | | | | 1,640,000 | |
Health & Educational Facilities Authority of the State of Missouri, SSM Health Care, Revenue Bonds
Series A
5.00%, due 6/1/30 | | | 4,000,000 | | | | 4,578,000 | |
Health & Educational Facilities Authority of the State of Missouri, St. Louis University, Revenue Bonds
Series B-1
0.90%, due 10/1/35 (a) | | | 14,040,000 | | | | 14,040,000 | |
Health & Educational Facilities Authority of the State of Missouri, St. Lukes Health System, Inc., Revenue Bonds
5.00%, due 11/15/30 | | | 5,000,000 | | | | 5,825,550 | |
Joplin Industrial Development Authority, Freeman Health System, Revenue Bonds
5.00%, due 2/15/35 | | | 605,000 | | | | 661,852 | |
| | | | | | | | |
| | | | | | | 38,199,656 | |
| | | | | | | | |
Montana 0.4% | | | | | | | | |
Missoula County Elementary School District No. 1 School Building, Unlimited General Obligation | | | | | | | | |
4.00%, due 7/1/30 | | | 495,000 | | | | 555,217 | |
4.00%, due 7/1/31 | | | 345,000 | | | | 384,157 | |
4.00%, due 7/1/32 | | | 360,000 | | | | 397,951 | |
4.00%, due 7/1/33 | | | 555,000 | | | | 608,569 | |
Missoula High School District No. 1 School Building, Unlimited General Obligation | | | | | | | | |
4.00%, due 7/1/30 | | | 585,000 | | | | 656,165 | |
4.00%, due 7/1/31 | | | 335,000 | | | | 373,023 | |
4.00%, due 7/1/33 | | | 350,000 | | | | 383,782 | |
4.00%, due 7/1/34 | | | 370,000 | | | | 403,426 | |
4.00%, due 7/1/35 | | | 515,000 | | | | 559,264 | |
Montana Facilities Finance Authority, Revenue Bonds | | | | | | | | |
5.00%, due 2/15/30 | | | 1,790,000 | | | | 2,093,441 | |
5.00%, due 2/15/31 | | | 1,500,000 | | | | 1,743,165 | |
5.00%, due 2/15/32 | | | 775,000 | | | | 895,861 | |
5.00%, due 2/15/33 | | | 1,320,000 | | | | 1,518,950 | |
5.00%, due 2/15/34 | | | 1,200,000 | | | | 1,375,632 | |
| | | | | | | | |
| | | | | | | 11,948,603 | |
| | | | | | | | |
| | | | | | | | |
| | | Principal
Amount | | | Value | |
Nebraska 1.3% | | | | | | | | |
Central Plains Energy, Project No. 3, Revenue Bonds | | | | | | | | |
5.00%, due 9/1/32 | | $ | 5,190,000 | | | $ | 5,729,501 | |
5.00%, due 9/1/42 | | | 13,260,000 | | | | 14,443,720 | |
5.25%, due 9/1/37 | | | 15,535,000 | | | | 17,183,574 | |
| | | | | | | | |
| | | | | | | 37,356,795 | |
| | | | | | | | |
New Hampshire 0.3% | | | | | | | | |
City of Manchester NH, General Airport, Revenue Bonds
Series A, Insured: AGM
5.00%, due 1/1/26 | | | 1,800,000 | | | | 1,988,856 | |
New Hampshire Health & Education Facilities Authority, Southern University, Revenue Bonds | | | | | | | | |
5.00%, due 1/1/31 | | | 905,000 | | | | 1,059,456 | |
5.00%, due 1/1/32 | | | 950,000 | | | | 1,107,586 | |
5.00%, due 1/1/33 | | | 1,000,000 | | | | 1,161,110 | |
5.00%, due 1/1/34 | | | 1,050,000 | | | | 1,214,189 | |
5.00%, due 1/1/35 | | | 1,100,000 | | | | 1,268,542 | |
| | | | | | | | |
| | | | | | | 7,799,739 | |
| | | | | | | | |
New Jersey 3.7% | | | | | | | | |
Atlantic County Improvement Authority, Stockton University-Atlantic City, Revenue Bonds | | | | | | | | |
Series A, Insured: AGM
5.00%, due 7/1/31 | | | 2,670,000 | | | | 3,123,499 | |
Series A, Insured: AGM
5.00%, due 7/1/32 | | | 1,305,000 | | | | 1,519,007 | |
Series A, Insured: AGM
5.00%, due 7/1/33 | | | 1,395,000 | | | | 1,616,805 | |
Series A, Insured: AGM
5.00%, due 7/1/34 | | | 1,855,000 | | | | 2,140,726 | |
City of Atlantic City NJ, Unlimited General Obligation | | | | | | | | |
Series B, Insured: AGM
4.00%, due 3/1/42 | | | 6,020,000 | | | | 6,180,313 | |
Series B, Insured: AGM
5.00%, due 3/1/32 | | | 2,750,000 | | | | 3,170,420 | |
Series A, Insured: BAM
5.00%, due 3/1/42 | | | 1,250,000 | | | | 1,401,275 | |
New Brunswick Parking Authority, Revenue Bonds | | | | | | | | |
Series A, Insured: BAM
5.00%, due 9/1/28 | | | 5,880,000 | | | | 7,058,764 | |
Series A, Insured: BAM
5.00%, due 9/1/29 | | | 2,370,000 | | | | 2,828,500 | |
Series A, Insured: BAM
5.00%, due 9/1/30 | | | 4,605,000 | | | | 5,467,839 | |
Series A, Insured: BAM
5.00%, due 9/1/31 | | | 6,780,000 | | | | 8,009,350 | |
| | | | |
| 20 | | MainStay Tax Free Bond Fund | | The notes to the financial statements are an integral part of,
and should be read in conjunction with, the financial statements. |
| | | | | | | | |
| | | Principal
Amount | | | Value | |
| Municipal Bonds (continued) | | | | | | | | |
New Jersey (continued) | | | | | | | | |
New Jersey Building Authority, Unrefunded, Revenue Bonds | | | | | | | | |
Series A, Insured: BAM
5.00%, due 6/15/25 | | $ | 2,015,000 | | | $ | 2,341,208 | |
Series A, Insured: BAM
5.00%, due 6/15/28 | | | 1,805,000 | | | | 2,062,610 | |
New Jersey Economic Development Authority, MSU Student Housing Project, Revenue Bonds
5.375%, due 6/1/25 | | | 4,500,000 | | | | 4,836,465 | |
New Jersey Economic Development Authority, Revenue Bonds (b) | | | | | | | | |
5.00%, due 1/1/28 | | | 1,000,000 | | | | 1,126,130 | |
5.50%, due 1/1/26 | | | 1,000,000 | | | | 1,164,140 | |
New Jersey Educational Facilities Authority, Stockton University, Revenue Bonds | | | | | | | | |
Series A, Insured: BAM
5.00%, due 7/1/29 | | | 1,500,000 | | | | 1,772,505 | |
Series A, Insured: BAM
5.00%, due 7/1/30 | | | 5,000,000 | | | | 5,874,500 | |
Series A, Insured: BAM
5.00%, due 7/1/31 | | | 3,000,000 | | | | 3,491,970 | |
New Jersey Health Care Facilities Financing Authority, Hackensack Meridian Health, Inc., Revenue Bonds Series A
5.00%, due 7/1/38 | | | 10,000,000 | | | | 11,630,200 | |
New Jersey Health Care Facilities Financing Authority, Hackensack University Medical Center, Revenue Bonds
Insured: AGC
5.25%, due 1/1/31 | | | 1,510,000 | | | | 1,520,510 | |
New Jersey Higher Education Student Assistance Authority, Student Loan, Revenue Bonds
Series A, Insured: AGC
6.125%, due 6/1/30 (b) | | | 2,110,000 | | | | 2,153,149 | |
New Jersey Transportation Trust Fund Authority, Revenue Bonds
Series C, Insured: AGM
(zero coupon), due 12/15/34 | | | 30,000,000 | | | | 15,305,400 | |
New Jersey Turnpike Authority, Revenue Bonds
Series E
5.00%, due 1/1/45 | | | 4,000,000 | | | | 4,509,360 | |
Newark Housing Authority, Revenue Bonds | | | | | | | | |
Insured: AGM
4.00%, due 12/1/27 | | | 500,000 | | | | 541,960 | |
| | | | | | | | |
| | | Principal
Amount | | | Value | |
New Jersey (continued) | | | | | | | | |
Newark Housing Authority, Revenue Bonds (continued) | | | | | | | | |
Insured: AGM
4.00%, due 12/1/29 | | $ | 250,000 | | | $ | 267,275 | |
Insured: AGM
4.00%, due 12/1/30 | | | 250,000 | | | | 265,850 | |
Insured: AGM
4.00%, due 12/1/31 | | | 225,000 | | | | 238,171 | |
Insured: AGM
5.00%, due 12/1/28 | | | 750,000 | | | | 880,162 | |
Insured: AGM
5.00%, due 12/1/38 | | | 1,740,000 | | | | 1,990,978 | |
| | | | | | | | |
| | | | | | | 104,489,041 | |
| | | | | | | | |
New Mexico 0.1% | | | | | | | | |
City of Farmington NM, Revenue Bonds
Series C
5.90%, due 6/1/40 | | | 2,000,000 | | | | 2,178,820 | |
| | | | | | | | |
| | |
New York 21.0% | | | | | | | | |
Build NYC Resource Corp., Royal Charter Properties, Revenue Bonds | | | | | | | | |
Insured: AGM
5.00%, due 12/15/19 | | | 975,000 | | | | 1,047,394 | |
Insured: AGM
5.00%, due 12/15/20 | | | 1,025,000 | | | | 1,131,600 | |
Insured: AGM
5.00%, due 12/15/21 | | | 1,075,000 | | | | 1,214,621 | |
Insured: AGM
5.00%, due 12/15/22 | | | 740,000 | | | | 852,561 | |
¨City of New York NY, Unlimited General Obligation | | | | | | | | |
Series I, Subseries I-4
0.92%, due 4/1/36 (a) | | | 11,400,000 | | | | 11,400,000 | |
Subseries J-6
0.94%, due 8/1/24 (a) | | | 1,075,000 | | | | 1,075,000 | |
Subseries H-5
0.95%, due 3/1/34 (a) | | | 9,240,000 | | | | 9,240,000 | |
5.25%, due 10/1/32 | | | 26,400,000 | | | | 32,661,024 | |
County of Nassau NY, Limited General Obligation | | | | | | | | |
Series C
5.00%, due 4/1/32 | | | 4,135,000 | | | | 4,843,077 | |
Series C
5.00%, due 4/1/37 | | | 6,625,000 | | | | 7,630,277 | |
Series C
5.00%, due 4/1/38 | | | 6,965,000 | | | | 8,005,014 | |
Long Island Power Authority, Electric System, Revenue Bonds
Series A, Insured: BAM
5.00%, due 9/1/44 | | | 10,000,000 | | | | 11,292,400 | |
| | | | | | |
The notes to the financial statements are an integral part of,
and should be read in conjunction with, the financial statements. | | | | | 21 | |
Portfolio of Investments October 31, 2017 (continued)
| | | | | | | | |
| | | Principal
Amount | | | Value | |
| Municipal Bonds (continued) | | | | | | | | |
New York (continued) | | | | | | | | |
Long Island Power Authority, Revenue Bonds | | | | | | | | |
Series A, Insured: BAM
5.00%, due 9/1/39 | | $ | 10,000,000 | | | $ | 11,345,500 | |
Series A
5.00%, due 9/1/44 | | | 3,470,000 | | | | 3,925,368 | |
Series B
5.00%, due 9/1/45 | | | 8,970,000 | | | | 10,199,966 | |
Metropolitan Transportation Authority, Green, Revenue Bonds
Series B-1
5.00%, due 11/15/36 | | | 4,500,000 | | | | 5,332,860 | |
Metropolitan Transportation Authority, Revenue Bonds (a) | | | | | | | | |
Series A-1
0.92%, due 11/1/31 | | | 11,530,000 | | | | 11,530,000 | |
Subseries D-2
0.94%, due 11/1/35 | | | 19,400,000 | | | | 19,400,000 | |
New York City Transitional Finance Authority, Building Aid, Revenue Bonds | | | | | | | | |
Series S-1
5.00%, due 7/15/33 | | | 6,060,000 | | | | 7,105,047 | |
Series S-2
5.00%, due 7/15/34 | | | 5,000,000 | | | | 5,893,700 | |
Series S-1
5.00%, due 7/15/36 | | | 10,000,000 | | | | 11,595,300 | |
Series S-1
5.00%, due 7/15/43 | | | 11,880,000 | | | | 13,642,398 | |
¨New York City Transitional Finance Authority, Future Tax Secured, Revenue Bonds | | | | | | | | |
Series 2A
0.95%, due 11/1/22 (a) | | | 6,630,000 | | | | 6,630,000 | |
Subseries F-1
5.00%, due 5/1/32 | | | 4,000,000 | | | | 4,799,560 | |
Series B-1
5.00%, due 8/1/32 | | | 10,000,000 | | | | 11,767,000 | |
5.00%, due 5/1/33 | | | 10,000,000 | | | | 11,810,900 | |
Series B-1
5.00%, due 8/1/34 | | | 5,000,000 | | | | 5,970,100 | |
Series A-2
5.00%, due 8/1/34 | | | 7,795,000 | | | | 9,307,386 | |
Series A1
5.00%, due 8/1/36 | | | 5,100,000 | | | | 5,977,098 | |
Series E-1
5.00%, due 2/1/41 | | | 2,500,000 | | | | 2,874,300 | |
5.00%, due 8/1/45 | | | 25,000,000 | | | | 29,197,500 | |
| | | | | | | | |
| | | Principal
Amount | | | Value | |
New York (continued) | | | | | | | | |
New York Counties Tobacco Trust VI, Tobacco Settlement Pass Through, Revenue Bonds
Series A-2B
5.00%, due 6/1/45 | | $ | 4,255,000 | | | $ | 4,482,217 | |
New York Liberty Development Corp., Bank of America, Revenue Bonds
Class 2
6.375%, due 7/15/49 | | | 5,000,000 | | | | 5,377,900 | |
New York Liberty Development Corp., Revenue Bonds
5.00%, due 12/15/41 | | | 12,315,000 | | | | 13,841,321 | |
New York Liberty Development Corp., World Trade Center, Revenue Bonds | | | | | | | | |
5.00%, due 11/15/31 | | | 5,000,000 | | | | 5,645,150 | |
5.75%, due 11/15/51 | | | 18,990,000 | | | | 21,913,321 | |
New York State Dormitory Authority, New York University, Revenue Bonds
Series A
5.00%, due 7/1/35 | | | 6,610,000 | | | | 7,695,692 | |
New York State Dormitory Authority, Revenue Bonds
Series E
5.00%, due 3/15/34 | | | 4,190,000 | | | | 4,990,039 | |
¨New York State Dormitory Authority, Sales Tax, Revenue Bonds | | | | | | | | |
5.00%, due 3/15/40 | | | 22,000,000 | | | | 25,825,140 | |
5.00%, due 3/15/41 | | | 20,000,000 | | | | 23,441,600 | |
5.00%, due 3/15/44 | | | 5,000,000 | | | | 5,842,500 | |
New York State Dormitory Authority, State Personal Income Tax, Revenue Bonds
5.00%, due 2/15/38 | | | 13,490,000 | | | | 15,887,982 | |
New York State Dormitory Authority, University Facilities, Revenue Bonds | | | | | | | | |
Series A
5.00%, due 7/1/36 | | | 1,000,000 | | | | 1,178,610 | |
Series A
5.00%, due 7/1/38 | | | 1,000,000 | | | | 1,174,000 | |
¨New York State Energy Research & Development Authority, Niagara Mohawk Power Corp., Revenue Bonds (a) | | | | | | | | |
Insured: AMBAC
3.03%, due 12/1/25 | | | 10,760,000 | | | | 10,760,000 | |
Insured: AMBAC
3.05%, due 12/1/25 | | | 25,190,000 | | | | 25,190,000 | |
Insured: XLCA
3.104%, due 7/1/29 | | | 10,390,000 | | | | 10,390,000 | |
| | | | |
| 22 | | MainStay Tax Free Bond Fund | | The notes to the financial statements are an integral part of,
and should be read in conjunction with, the financial statements. |
| | | | | | | | |
| | | Principal
Amount | | | Value | |
| Municipal Bonds (continued) | | | | | | | | |
New York (continued) | | | | | | | | |
New York State Housing Finance Agency, 505 West 37th Street, Revenue Bonds (a) | | | | | | | | |
Series A
0.95%, due 5/1/42 | | $ | 15,400,000 | | | $ | 15,400,000 | |
Series B
0.95%, due 5/1/42 | | | 20,000,000 | | | | 20,000,000 | |
New York State Urban Development Corp., Personal Income Tax, Revenue Bonds
Series A
5.00%, due 3/15/30 | | | 12,350,000 | | | | 14,750,593 | |
New York Transportation Development Corp., LaGuardia Airport Terminal B Redevelopment Project, Revenue Bonds (b) | | | | | | | | |
Insured: AGM
4.00%, due 7/1/31 | | | 10,925,000 | | | | 11,566,516 | |
Series A, Insured: AGM
4.00%, due 7/1/35 | | | 6,500,000 | | | | 6,777,875 | |
Series A, Insured: AGM
4.00%, due 7/1/36 | | | 16,240,000 | | | | 16,894,797 | |
Rensselaer City School District, Certificates of Participation | | | | | | | | |
Insured: AGM
5.00%, due 6/1/22 | | | 1,590,000 | | | | 1,814,985 | |
Insured: AGM
5.00%, due 6/1/24 | | | 1,750,000 | | | | 2,076,918 | |
Insured: AGM
5.00%, due 6/1/26 | | | 1,060,000 | | | | 1,289,055 | |
Insured: AGM
5.00%, due 6/1/27 | | | 1,000,000 | | | | 1,197,090 | |
Insured: AGM
5.00%, due 6/1/30 | | | 1,880,000 | | | | 2,182,605 | |
Insured: AGM
5.00%, due 6/1/32 | | | 2,000,000 | | | | 2,289,180 | |
Syracuse Industrial Development Agency, Carousel Center Project, Revenue Bonds (b) | | | | | | | | |
5.00%, due 1/1/29 | | | 1,615,000 | | | | 1,876,469 | |
5.00%, due 1/1/30 | | | 2,100,000 | | | | 2,425,059 | |
Triborough Bridge & Tunnel Authority, Revenue Bonds | | | | | | | | |
Subseries B-2
0.88%, due 1/1/32 (a) | | | 7,600,000 | | | | 7,600,000 | |
Series F
0.93%, due 11/1/32 (a) | | | 3,000,000 | | | | 3,000,000 | |
Series B
5.00%, due 11/15/35 | | | 8,560,000 | | | | 10,309,236 | |
Series B
5.00%, due 11/15/38 | | | 3,600,000 | | | | 4,298,688 | |
| | | | | | | | |
| | | Principal
Amount | | | Value | |
New York (continued) | | | | | | | | |
TSASC, Inc., Revenue Bonds | | | | | | | | |
Series A
5.00%, due 6/1/32 | | $ | 2,000,000 | | | $ | 2,284,340 | |
Series A
5.00%, due 6/1/34 | | | 5,000,000 | | | | 5,631,900 | |
Series A
5.00%, due 6/1/35 | | | 2,865,000 | | | | 3,214,645 | |
| | | | | | | | |
| | | | | | | 599,212,374 | |
| | | | | | | | |
North Carolina 0.8% | | | | | | | | |
Charlotte-Mecklenburg Hospital Authority, Carolinas REMK, Revenue Bonds
Series E, Insured: AGM
0.92%, due 1/15/44 (a) | | | 20,000,000 | | | | 20,000,000 | |
North Carolina Medical Care Commission, North Carolina Baptist Hospital, Revenue Bonds
5.25%, due 6/1/25 | | | 1,000,000 | | | | 1,101,960 | |
North Carolina Turnpike Authority, Revenue Bonds
Series A, Insured: AGC
5.75%, due 1/1/39 | | | 3,000,000 | | | | 3,161,190 | |
| | | | | | | | |
| | | | | | | 24,263,150 | |
| | | | | | | | |
North Dakota 0.2% | | | | | | | | |
City of Grand Forks ND, Altru Health System, Revenue Bonds
5.00%, due 12/1/35 | | | 4,050,000 | | | | 4,329,896 | |
| | | | | | | | |
| | |
Ohio 2.1% | | | | | | | | |
American Municipal Power, Inc., Prairie, Revenue Bonds
Series A, Insured: BAM
5.25%, due 2/15/30 | | | 15,000,000 | | | | 17,085,150 | |
City of Cleveland OH, Airport System, Revenue Bonds
Series A, Insured: AGM
5.00%, due 1/1/30 | | | 3,000,000 | | | | 3,304,740 | |
City of Cleveland OH, Income Tax, Revenue Bonds
Series A-2
5.00%, due 10/1/37 | | | 1,500,000 | | | | 1,724,505 | |
Clermont County Port Authority, W. Clermont Local School District Project, Revenue Bonds | | | | | | | | |
Insured: BAM
5.00%, due 12/1/31 | | | 650,000 | | | | 763,022 | |
Insured: BAM
5.00%, due 12/1/32 | | | 2,200,000 | | | | 2,572,064 | |
Insured: BAM
5.00%, due 12/1/33 | | | 1,335,000 | | | | 1,554,447 | |
Cleveland-Cuyahoga County Port Authority, Revenue Bonds
6.00%, due 11/15/25 | | | 1,980,000 | | | | 2,247,894 | |
| | | | | | |
The notes to the financial statements are an integral part of,
and should be read in conjunction with, the financial statements. | | | | | 23 | |
Portfolio of Investments October 31, 2017 (continued)
| | | | | | | | |
| | | Principal
Amount | | | Value | |
| Municipal Bonds (continued) | | | | | | | | |
Ohio (continued) | | | | | | | | |
County of Hamilton OH, Christ Hospital Project, Revenue Bonds
5.50%, due 6/1/42 | | $ | 2,000,000 | | | $ | 2,272,960 | |
County of Montgomery OH, Premier Health-Miami Valley Hospital, Revenue Bonds
Series E
0.90%, due 11/15/45 (a) | | | 15,000,000 | | | | 15,000,000 | |
North Olmsted City School District, Unlimited General Obligation
Series A
5.00%, due 12/1/40 | | | 7,250,000 | | | | 8,157,483 | |
Ohio Higher Educational Facilities Commission, Cleveland Clinic Health System, Revenue Bonds
Series B-2
0.93%, due 1/1/39 (a) | | | 4,100,000 | | | | 4,100,000 | |
| | | | | | | | |
| | | | | | | 58,782,265 | |
| | | | | | | | |
Oklahoma 1.0% | | | | | | | | |
Garfield County Educational Facilities Authority, Enid Public Schools Project, Revenue Bonds | | | | | | | | |
Series A
5.00%, due 9/1/26 | | | 1,800,000 | | | | 2,181,528 | |
Series A
5.00%, due 9/1/27 | | | 3,780,000 | | | | 4,514,605 | |
Series A
5.00%, due 9/1/28 | | | 5,000,000 | | | | 5,928,200 | |
Series A
5.00%, due 9/1/29 | | | 4,620,000 | | | | 5,449,752 | |
Lincoln County Educational Facilities Authority, Stroud Public Schools Project, Revenue Bonds | | | | | | | | |
5.00%, due 9/1/28 | | | 3,200,000 | | | | 3,720,096 | |
5.00%, due 9/1/29 | | | 2,370,000 | | | | 2,739,199 | |
Oklahoma State Municipal Power Authority, Revenue Bonds | | | | | | | | |
Series A
5.00%, due 1/1/29 | | | 250,000 | | | | 297,108 | |
Series A
5.00%, due 1/1/30 | | | 900,000 | | | | 1,063,008 | |
Series A
5.00%, due 1/1/32 | | | 805,000 | | | | 937,889 | |
Series A
5.00%, due 1/1/34 | | | 650,000 | | | | 750,100 | |
Tulsa Airports Improvement Trust, Revenue Bonds
Series D, Insured: BAM
5.00%, due 6/1/28 | | | 500,000 | | | | 530,910 | |
| | | | | | | | |
| | | | | | | 28,112,395 | |
| | | | | | | | |
| | | | | | | | |
| | | Principal
Amount | | | Value | |
Pennsylvania 3.0% | | | | | | | | |
City of Philadelphia PA, Unlimited General Obligation
6.50%, due 8/1/41 | | $ | 5,125,000 | | | $ | 5,855,261 | |
County of Lancaster PA, Unlimited General Obligation | | | | | | | | |
Series A, Insured: BAM
4.00%, due 5/1/30 | | | 500,000 | | | | 539,865 | |
Series A, Insured: BAM
4.00%, due 5/1/31 | | | 420,000 | | | | 451,546 | |
Insured: AGM
5.00%, due 11/1/27 | | | 1,390,000 | | | | 1,659,243 | |
Lancaster County Hospital Authority, Masonic Homes Project, Revenue Bonds
Series D
0.88%, due 7/1/34 (a) | | | 10,025,000 | | | | 10,025,000 | |
Pennsylvania Higher Educational Facilities Authority, Revenue Bonds
Series AT-1, Insured: BAM
5.00%, due 6/15/26 | | | 4,270,000 | | | | 5,200,219 | |
Pennsylvania Turnpike Commission, Revenue Bonds | | | | | | | | |
Series C
5.00%, due 12/1/43 | | | 10,125,000 | | | | 11,446,819 | |
Series B
5.75%, due 6/1/39 | | | 4,000,000 | | | | 4,286,040 | |
Philadelphia Gas Works Co., 1998 General Ordinance, Revenue Bonds | | | | | | | | |
Series 14T
5.00%, due 10/1/31 | | | 2,300,000 | | | | 2,698,636 | |
Series 14T
5.00%, due 10/1/32 | | | 1,280,000 | | | | 1,496,346 | |
State Public School Building Authority, Philadelphia Community College, Revenue Bonds
Series A, Insured: BAM
5.00%, due 6/15/28 | | | 5,505,000 | | | | 6,500,304 | |
State Public School Building Authority, Philadelphia School District, Revenue Bonds
Series A, Insured: AGM
5.00%, due 6/1/31 | | | 30,000,000 | | | | 34,124,100 | |
| | | | | | | | |
| | | | | | | 84,283,379 | |
| | | | | | | | |
Puerto Rico 7.4% | | | | | | | | |
¨Commonwealth of Puerto Rico, Public Improvement, Unlimited General Obligation | | | | | | | | |
Insured: NATL-RE
(zero coupon), due 7/1/19 | | | 25,000 | | | | 23,349 | |
Series A, Insured: AGM
4.00%, due 7/1/22 | | | 715,000 | | | | 736,672 | |
| | | | |
| 24 | | MainStay Tax Free Bond Fund | | The notes to the financial statements are an integral part of,
and should be read in conjunction with, the financial statements. |
| | | | | | | | |
| | | Principal
Amount | | | Value | |
| Municipal Bonds (continued) | | | | | | | | |
Puerto Rico (continued) | | | | | | | | |
¨Commonwealth of Puerto Rico, Public Improvement, Unlimited General Obligation (continued) | | | | | | | | |
Series A, Insured: AGC
5.00%, due 7/1/26 | | $ | 545,000 | | | $ | 548,166 | |
Series A, Insured: AGC
5.00%, due 7/1/27 | | | 500,000 | | | | 502,700 | |
Series A-4, Insured: AGM
5.00%, due 7/1/31 | | | 5,170,000 | | | | 5,403,684 | |
Series A, Insured: AGM
5.00%, due 7/1/35 | | | 28,270,000 | | | | 28,867,628 | |
Insured: AGM
5.25%, due 7/1/20 | | | 1,380,000 | | | | 1,457,777 | |
Series A, Insured: NATL-RE
5.25%, due 7/1/21 | | | 440,000 | | | | 441,514 | |
Series A, Insured: AGM
5.25%, due 7/1/24 | | | 1,220,000 | | | | 1,307,950 | |
Series C, Insured: AGM
5.375%, due 7/1/28 | | | 700,000 | | | | 711,914 | |
Series A, Insured: NATL-RE
5.50%, due 7/1/19 | | | 550,000 | | | | 565,801 | |
Series A, Insured: NATL-RE
5.50%, due 7/1/20 | | | 4,600,000 | | | | 4,778,342 | |
Series C, Insured: AGM
5.75%, due 7/1/37 | | | 1,020,000 | | | | 1,040,298 | |
Series C-7, Insured: NATL-RE
6.00%, due 7/1/27 | | | 2,240,000 | | | | 2,279,178 | |
Commonwealth of Puerto Rico, Unrefunded, Unlimited General Obligation | | | | | | | | |
Series A, Insured: AGC
5.00%, due 7/1/34 | | | 280,000 | | | | 280,899 | |
Insured: AGC
5.25%, due 7/1/32 | | | 500,000 | | | | 503,840 | |
Puerto Rico Commonwealth, Aqueduct & Sewer Authority, Revenue Bonds | | | | | | | | |
Series A, Insured: AGC
5.00%, due 7/1/28 | | | 4,020,000 | | | | 4,045,165 | |
Series A, Insured: AGC
5.125%, due 7/1/47 | | | 14,410,000 | | | | 14,502,944 | |
Series A, Insured: AGC
6.125%, due 7/1/24 | | | 870,000 | | | | 951,580 | |
Puerto Rico Convention Center District Authority, Revenue Bonds
Series A, Insured: AGC
4.50%, due 7/1/36 | | | 4,675,000 | | | | 4,668,876 | |
Puerto Rico Electric Power Authority, Revenue Bonds | | | | | | | | |
Series DDD, Insured: AGM 3.625%, due 7/1/23 | | | 3,090,000 | | | | 3,090,803 | |
| | | | | | | | |
| | | Principal
Amount | | | Value | |
Puerto Rico (continued) | | | | | | | | |
Puerto Rico Electric Power Authority, Revenue Bonds (continued) | | | | | | | | |
Series UU, Insured: AGC
4.25%, due 7/1/27 | | $ | 2,240,000 | | | $ | 2,240,918 | |
Series UU, Insured: NATL-RE
4.50%, due 7/1/18 | | | 2,865,000 | | | | 2,885,972 | |
Series NN, Insured: NATL-RE 4.75%, due 7/1/33 | | | 1,140,000 | | | | 1,025,419 | |
Series TT, Insured: AGM
5.00%, due 7/1/18 | | | 380,000 | | | | 384,423 | |
Series RR, Insured: NATL-RE
5.00%, due 7/1/21 | | | 1,135,000 | | | | 1,137,145 | |
Series RR, Insured: NATL-RE
5.00%, due 7/1/22 | | | 1,270,000 | | | | 1,272,235 | |
Series UU, Insured: AGM
5.00%, due 7/1/23 | | | 2,280,000 | | | | 2,304,647 | |
Series PP, Insured: NATL-RE
5.00%, due 7/1/23 | | | 1,105,000 | | | | 1,105,088 | |
Series SS, Insured: NATL-RE
5.00%, due 7/1/23 | | | 825,000 | | | | 825,066 | |
Series UU, Insured: AGM
5.00%, due 7/1/24 | | | 4,415,000 | | | | 4,455,353 | |
Series PP, Insured: NATL-RE
5.00%, due 7/1/24 | | | 2,915,000 | | | | 2,898,501 | |
Series UU, Insured: AGC
5.00%, due 7/1/26 | | | 580,000 | | | | 583,370 | |
Series TT, Insured: AGM
5.00%, due 7/1/27 | | | 500,000 | | | | 502,700 | |
Series RR, Insured: AGC
5.00%, due 7/1/28 | | | 1,170,000 | | | | 1,175,827 | |
Series SS, Insured: AGM
5.00%, due 7/1/30 | | | 355,000 | | | | 356,477 | |
Series VV, Insured: NATL-RE
5.25%, due 7/1/26 | | | 1,740,000 | | | | 1,704,347 | |
Series VV, Insured: NATL-RE
5.25%, due 7/1/29 | | | 1,015,000 | | | | 977,222 | |
Series VV, Insured: NATL-RE
5.25%, due 7/1/32 | | | 2,000,000 | | | | 1,907,380 | |
Series VV, Insured: NATL-RE
5.25%, due 7/1/34 | | | 535,000 | | | | 506,522 | |
Series VV, Insured: NATL-RE
5.25%, due 7/1/35 | | | 595,000 | | | | 559,264 | |
¨Puerto Rico Highway & Transportation Authority, Revenue Bonds | | | | | | | | |
Series L, Insured: NATL-RE
5.25%, due 7/1/24 | | | 1,830,000 | | | | 1,875,677 | |
Series N, Insured: NATL-RE
5.25%, due 7/1/32 | | | 5,525,000 | | | | 5,320,022 | |
Series CC, Insured: AGM
5.25%, due 7/1/33 | | | 1,105,000 | | | | 1,215,831 | |
| | | | | | |
The notes to the financial statements are an integral part of,
and should be read in conjunction with, the financial statements. | | | | | 25 | |
Portfolio of Investments October 31, 2017 (continued)
| | | | | | | | |
| | | Principal
Amount | | | Value | |
| Municipal Bonds (continued) | | | | | | | | |
Puerto Rico (continued) | | | | | | | | |
¨Puerto Rico Highway & Transportation Authority, Revenue Bonds (continued) | | | | | | | | |
Series N, Insured: NATL-RE
5.25%, due 7/1/33 | | $ | 5,030,000 | | | $ | 4,804,656 | |
Series N, Insured: AGC
5.25%, due 7/1/34 | | | 4,175,000 | | | | 4,580,434 | |
Series CC, Insured: AGM
5.25%, due 7/1/36 | | | 1,800,000 | | | | 1,963,746 | |
Series N, Insured: AGC
5.25%, due 7/1/36 | | | 17,880,000 | | | | 19,505,292 | |
Series N, Insured: AGM
5.25%, due 7/1/36 | | | 520,000 | | | | 567,268 | |
Series N, Insured: AGC
5.25%, due 7/1/39 | | | 75,000 | | | | 81,942 | |
Series L, Insured: AGC
5.25%, due 7/1/41 | | | 2,355,000 | | | | 2,577,241 | |
Series E, Insured: AGM
5.50%, due 7/1/21 | | | 670,000 | | | | 723,325 | |
Series N, Insured: AGM
5.50%, due 7/1/26 | | | 405,000 | | | | 453,244 | |
Series N, Insured: AGC, AGM
5.50%, due 7/1/29 | | | 10,230,000 | | | | 11,511,614 | |
Series CC, Insured: AGC
5.50%, due 7/1/31 | | | 1,445,000 | | | | 1,626,290 | |
Puerto Rico Highway & Transportation Authority, Unrefunded, Revenue Bonds | | | | | | | | |
Series D, Insured: AGM
5.00%, due 7/1/27 | | | 2,240,000 | | | | 2,252,096 | |
Series J, Insured: NATL-RE
5.00%, due 7/1/29 | | | 650,000 | | | | 626,574 | |
Puerto Rico Municipal Finance Agency, Revenue Bonds | | | | | | | | |
Series A, Insured: AGM
4.75%, due 8/1/22 | | | 820,000 | | | | 826,642 | |
Series A, Insured: AGM
5.00%, due 8/1/21 | | | 145,000 | | | | 147,053 | |
Series A, Insured: AGM
5.00%, due 8/1/27 | | | 290,000 | | | | 291,566 | |
Series A, Insured: AGM
5.00%, due 8/1/30 | | | 1,720,000 | | | | 1,727,155 | |
Series C, Insured: AGM
5.25%, due 8/1/19 | | | 965,000 | | | | 1,003,658 | |
Series C, Insured: AGC
5.25%, due 8/1/20 | | | 210,000 | | | | 222,191 | |
Series C, Insured: AGC
5.25%, due 8/1/23 | | | 315,000 | | | | 344,588 | |
Puerto Rico Public Buildings Authority, Government Facilities, Revenue Bonds | | | | | | | | |
Series F, Insured: NATL-RE
5.25%, due 7/1/23 | | | 265,000 | | | | 273,085 | |
| | | | | | | | |
| | | Principal
Amount | | | Value | |
Puerto Rico (continued) | | | | | | | | |
Puerto Rico Public Buildings Authority, Government Facilities, Revenue Bonds (continued) | | | | | | | | |
Series K, Insured: AGM
5.25%, due 7/1/27 | | $ | 1,150,000 | | | $ | 1,183,143 | |
Series M-3, Insured: NATL-RE
6.00%, due 7/1/26 | | | 300,000 | | | | 305,319 | |
Series M-3, Insured: NATL-RE
6.00%, due 7/1/27 | | | 7,465,000 | | | | 7,595,563 | |
Puerto Rico Sales Tax Financing Corp., Revenue Bonds | | | | | | | | |
Series A, Insured: NATL-RE (zero coupon), due 8/1/42 | | | 25,000,000 | | | | 5,442,500 | |
Series A, Insured: NATL-RE (zero coupon), due 8/1/45 | | | 59,580,000 | | | | 11,037,195 | |
Series A, Insured: AMBAC (zero coupon), due 8/1/54 | | | 700,000 | | | | 122,871 | |
Series A, Insured: AGM
5.00%, due 8/1/40 | | | 7,305,000 | | | | 7,475,864 | |
Series C, Insured: AGM
5.125%, due 8/1/42 | | | 6,595,000 | | | | 6,837,960 | |
| | | | | | | | |
| | | | | | | 210,038,561 | |
| | | | | | | | |
Rhode Island 1.3% | | | | | | | | |
Providence Public Buildings Authority, Revenue Bonds
Series A, Insured: AGM
5.875%, due 6/15/26 | | | 1,565,000 | | | | 1,737,479 | |
Rhode Island Health & Educational Building Corp., Hospital Financing-Lifespan Obligated Group, Revenue Bonds
5.00%, due 5/15/26 | | | 5,000,000 | | | | 5,838,250 | |
Rhode Island Health & Educational Building Corp., Revenue Bonds
Series G, Insured: AGM
5.00%, due 5/15/42 | | | 6,115,000 | | | | 7,007,973 | |
Tobacco Settlement Financing Corp., Revenue Bonds
Series A
5.00%, due 6/1/35 | | | 20,000,000 | | | | 21,594,600 | |
| | | | | | | | |
| | | | | | | 36,178,302 | |
| | | | | | | | |
South Carolina 4.1% | | | | | | | | |
Piedmont Municipal Power Agency, Revenue Bonds
Series C, Insured: AGC
5.75%, due 1/1/34 | | | 10,345,000 | | | | 11,736,092 | |
| | | | |
| 26 | | MainStay Tax Free Bond Fund | | The notes to the financial statements are an integral part of,
and should be read in conjunction with, the financial statements. |
| | | | | | | | |
| | | Principal
Amount | | | Value | |
| Municipal Bonds (continued) | | | | | | | | |
South Carolina (continued) | | | | | | | | |
South Carolina Jobs-Economic Development Authority, Palmetto Health, Revenue Bonds | | | | | | | | |
Series A
5.00%, due 8/1/19 | | $ | 420,000 | | | $ | 442,331 | |
Series A
5.25%, due 8/1/30 | | | 3,755,000 | | | | 4,108,533 | |
¨South Carolina Public Service Authority, Revenue Bonds | | | | | | | | |
Series C
5.00%, due 12/1/29 | | | 5,000,000 | | | | 5,719,200 | |
Series A 5.00%, due 12/1/32 | | | 10,000,000 | | | | 11,519,300 | |
Series C
5.00%, due 12/1/46 | | | 5,165,000 | | | | 5,701,540 | |
Series A
5.00%, due 12/1/49 | | | 4,050,000 | | | | 4,436,613 | |
Series A
5.00%, due 12/1/50 | | | 33,900,000 | | | | 37,544,589 | |
Series B
5.00%, due 12/1/56 | | | 2,500,000 | | | | 2,787,425 | |
South Carolina Public Service Authority, Santee Cooper Project, Revenue Bonds | | | | | | | | |
Series A
5.00%, due 12/1/25 | | | 6,445,000 | | | | 7,124,239 | |
Series D
5.00%, due 12/1/26 | | | 2,595,000 | | | | 2,882,396 | |
Series C
5.00%, due 12/1/36 | | | 3,310,000 | | | | 3,578,243 | |
South Carolina Transportation Infrastructure Bank, Revenue Bonds
5.00%, due 10/1/38 | | | 15,130,000 | | | | 17,623,273 | |
Sumter Two School Facilities Inc., Sumter School District Project, Revenue Bonds
Insured: BAM
5.00%, due 12/1/27 | | | 1,100,000 | | | | 1,281,676 | |
| | | | | | | | |
| | | | | | | 116,485,450 | |
| | | | | | | | |
South Dakota 0.1% | | | | | | | | |
Harrisburg School District No. 41-2, Unlimited General Obligation
5.00%, due 7/15/33 | | | 1,370,000 | | | | 1,471,695 | |
| | | | | | | | |
| | |
Tennessee 0.9% | | | | | | | | |
Johnson City Health & Educational Facilities Board, Mountain States Health Alliance, Revenue Bonds | | | | | | | | |
Series A
6.00%, due 7/1/38 | | | 3,605,000 | | | | 3,882,621 | |
| | | | | | | | |
| | | Principal
Amount | | | Value | |
Tennessee (continued) | | | | | | | | |
Johnson City Health & Educational Facilities Board, Mountain States Health Alliance, Revenue Bonds (continued) | | | | | | | | |
Series A
6.50%, due 7/1/38 | | $ | 6,500,000 | | | $ | 7,123,415 | |
Shelby County Health Educational & Housing Facilities Board, Methodist Le Bonheur Healthcare, Revenue Bonds
Series A, Insured: AGM
0.92%, due 6/1/42 (a) | | | 14,485,000 | | | | 14,485,000 | |
| | | | | | | | |
| | | | | | | 25,491,036 | |
| | | | | | | | |
Texas 6.1% | | | | | | | | |
Central Texas Turnpike System, Revenue Bonds | | | | | | | | |
Series C
5.00%, due 8/15/34 | | | 5,000,000 | | | | 5,639,100 | |
Series B
5.00%, due 8/15/37 | | | 1,445,000 | | | | 1,632,547 | |
City of Donna TX, Tax & Toll Bridge, Limited General Obligation Insured: BAM
5.00%, due 2/15/30 | | | 1,035,000 | | | | 1,192,413 | |
City of Houston TX, Unrefunded, Revenue Bonds
Series B
5.00%, due 9/1/31 | | | 285,000 | | | | 285,872 | |
Harris County Cultural Education Facilities Finance Corp., Houston Methodist Hospital, Revenue Bonds
0.92%, due 12/1/27 (a) | | | 21,600,000 | | | | 21,600,000 | |
Harris County Cultural Education Facilities Finance Corp., Memorial Hermann Health System, Revenue Bonds
5.00%, due 7/1/38 | | | 4,280,000 | | | | 4,838,797 | |
Harris County Health Facilities Development Corp., Houston Methodist Hospital, Revenue Bonds
0.92%, due 12/1/41 (a) | | | 17,000,000 | | | | 17,000,000 | |
Harris County-Houston Sports Authority Cap Appreciation, Senior Lien, Revenue Bonds
Series A, Insured: AGM
(zero coupon), due 11/15/40 | | | 17,115,000 | | | | 5,705,799 | |
Houston Higher Education Finance Corp., Prerefunded-Cosmos Foundation, Inc., Revenue Bonds
Series S
6.50%, due 5/15/31 | | | 565,000 | | | | 664,282 | |
North Harris County Regional Water Authority, Senior Lien, Revenue Bonds Insured: BAM
5.00%, due 12/15/32 | | | 3,215,000 | | | | 3,650,182 | |
| | | | | | |
The notes to the financial statements are an integral part of,
and should be read in conjunction with, the financial statements. | | | | | 27 | |
Portfolio of Investments October 31, 2017 (continued)
| | | | | | | | |
| | | Principal
Amount | | | Value | |
| Municipal Bonds (continued) | | | | | | | | |
Texas (continued) | | | | | | | | |
¨North Texas Tollway Authority, Revenue Bonds | | | | | | | | |
Series A
5.00%, due 1/1/34 | | $ | 1,400,000 | | | $ | 1,599,598 | |
Series A
5.00%, due 1/1/35 | | | 2,950,000 | | | | 3,368,516 | |
Series A, Insured: BAM
5.00%, due 1/1/38 | | | 9,500,000 | | | | 10,814,705 | |
Series B
5.00%, due 1/1/40 | | | 22,140,000 | | | | 24,919,456 | |
Series A
5.50%, due 9/1/41 | | | 6,695,000 | | | | 7,693,559 | |
Series A
6.00%, due 9/1/41 | | | 3,500,000 | | | | 4,086,950 | |
Tarrant County Cultural Education Facilities Finance Corp., Buckner Retirement Services, Revenue Bonds | | | | | | | | |
Series A
5.00%, due 11/15/23 | | | 1,245,000 | | | | 1,456,364 | |
Series A
5.00%, due 11/15/24 | | | 1,305,000 | | | | 1,544,781 | |
Series A
5.00%, due 11/15/25 | | | 1,370,000 | | | | 1,614,668 | |
Series A
5.00%, due 11/15/26 | | | 1,440,000 | | | | 1,716,710 | |
Texas Municipal Gas Acquisition & Supply Corp. III, Revenue Bonds | | | | | | | | |
5.00%, due 12/15/30 | | | 17,100,000 | | | | 19,211,850 | |
5.00%, due 12/15/31 | | | 4,575,000 | | | | 5,123,634 | |
Texas Private Activity Bond Surface Transportation Corp., Senior Lien, LBJ Infrastructure, Revenue Bonds | | | | | | | | |
7.00%, due 6/30/40 | | | 5,000,000 | | | | 5,647,350 | |
7.50%, due 6/30/32 | | | 4,095,000 | | | | 4,713,754 | |
7.50%, due 6/30/33 | | | 5,500,000 | | | | 6,323,240 | |
Texas Private Activity Bond Surface Transportation Corp., Senior Lien, NTE Mobility, Revenue Bonds
6.875%, due 12/31/39 | | | 7,965,000 | | | | 8,838,601 | |
Texas Public Finance Authority, Financing System-Texas Southern University, Revenue Bonds | | | | | | | | |
Insured: BAM
4.00%, due 5/1/31 | | | 1,000,000 | | | | 1,062,940 | |
Insured: BAM
4.00%, due 5/1/32 | | | 1,295,000 | | | | 1,368,582 | |
Viridian Municipal Management District, Unlimited General Obligation
Insured: BAM
6.00%, due 12/1/32 | | | 500,000 | | | | 623,565 | |
| | | | | | | | |
| | | | | | | 173,937,815 | |
| | | | | | | | |
| | | | | | | | |
| | | Principal
Amount | | | Value | |
U.S. Virgin Islands 1.7% | | | | | | | | |
Virgin Islands Public Finance Authority, Matching Fund Loan, Revenue Bonds | | | | | | | | |
Series A
5.00%, due 10/1/32 | | $ | 5,100,000 | | | $ | 3,009,000 | |
Series A
6.625%, due 10/1/29 | | | 6,960,000 | | | | 4,219,500 | |
Series A
6.75%, due 10/1/37 | | | 5,000,000 | | | | 3,006,250 | |
Virgin Islands Public Finance Authority, Revenue Bonds | | | | | | | | |
5.00%, due 9/1/30 (c) | | | 5,000,000 | | | | 5,463,000 | |
Series C
5.00%, due 10/1/30 | | | 18,500,000 | | | | 11,100,000 | |
Series A, Insured: AGM
5.00%, due 10/1/32 | | | 15,655,000 | | | | 16,594,613 | |
Series C, Insured: AGM
5.00%, due 10/1/39 | | | 5,800,000 | | | | 6,150,726 | |
| | | | | | | | |
| | | | | | | 49,543,089 | |
| | | | | | | | |
Utah 0.0%‡ | | | | | | | | |
City of Herriman UT, Special Assessment, Towne Centre Assessment Area
5.00%, due 11/1/29 | | | 55,000 | | | | 60,141 | |
| | | | | | | | |
| | |
Virginia 0.9% | | | | | | | | |
Chesapeake Bay Bridge & Tunnel District, Revenue Bonds
Insured: AGM
5.00%, due 7/1/41 | | | 14,250,000 | | | | 16,339,477 | |
Virginia Commonwealth Transportation Board, Revenue Bonds
4.00%, due 5/15/38 | | | 8,580,000 | | | | 9,220,583 | |
| | | | | | | | |
| | | | | | | 25,560,060 | |
| | | | | | | | |
Washington 0.7% | | | | | | | | |
Washington Health Care Facilities Authority, Multicare Health System, Revenue Bonds
Series D
0.91%, due 8/15/41 (a) | | | 19,550,000 | | | | 19,550,000 | |
| | | | | | | | |
| | |
Wisconsin 0.2% | | | | | | | | |
Wisconsin Center District, Junior Dedicated, Revenue Bonds | | | | | | | | |
Series A
5.00%, due 12/15/31 | | | 3,665,000 | | | | 3,956,148 | |
Series A
5.00%, due 12/15/32 | | | 2,850,000 | | | | 3,065,260 | |
| | | | | | | | |
| | | | | | | 7,021,408 | |
| | | | | | | | |
| | | | |
| 28 | | MainStay Tax Free Bond Fund | | The notes to the financial statements are an integral part of,
and should be read in conjunction with, the financial statements. |
| | | | | | | | |
| | | Principal
Amount | | | Value | |
| Municipal Bonds (continued) | | | | | | | | |
Wyoming 0.0%‡ | | | | | | | | |
West Park Hospital District, Revenue Bonds
Series A
6.375%, due 6/1/26 | | $ | 1,000,000 | | | $ | 1,107,650 | |
| | | | | | | | |
Total Municipal Bonds
(Cost $2,812,855,803) | | | | | | | 2,844,186,994 | |
| | | | | | | | |
Total Investments
(Cost $2,812,855,803) | | | 99.7 | % | | | 2,844,186,994 | |
Other Assets, Less Liabilities | | | 0.3 | | | | 8,840,161 | |
Net Assets | | | 100.0 | % | | $ | 2,853,027,155 | |
| ‡ | Less than one-tenth of a percent. |
| (a) | Variable rate securities that may be tendered back to the issuer at any time prior to maturity at par. Rate shown is the rate in effect as of October 31, 2017. |
| (b) | Interest on these securities was subject to alternative minimum tax. |
| (c) | May be sold to institutional investors only under Rule 144A or securities offered pursuant to Section 4(a)(2) of the Securities Act of 1933, as amended. |
As of October 31, 2017, the Fund held the following futures contracts1:
| | | | | | | | | | | | | | | | | | | | |
Type | | Number of
Contracts
(Short) | | | Expiration
Date | | | Value at
Trade Date | | | Current
Notional
Amount | | | Unrealized
Appreciation
(Depreciation)2 | |
| 10-Year United States Treasury Note | | | (3,426 | ) | | | December 2017 | | | $ | (433,132,694 | ) | | $ | (428,035,875 | ) | | $ | 5,096,819 | |
| | | | | | | | | | | | | | | | | | | | |
| 1. | As of October 31, 2017, cash in the amount of $3,597,300 was on deposit with a broker or futures commission merchant for futures transactions. |
| 2. | Represents the difference between the value of the contracts at the time they were opened and the value as of October 31, 2017. |
The following abbreviations are used in the preceding pages:
AGC—Assured Guaranty Corp.
AGM—Assured Guaranty Municipal Corp.
AMBAC—Ambac Assurance Corp.
BAM—Build America Mutual Assurance Co.
NATL-RE—National Public Finance Guarantee Corp.
Q-SBLF—Qualified School Board Loan Fund
The following is a summary of the fair valuations according to the inputs used as of October 31, 2017, for valuing the Fund’s assets and liabilities.
Asset Valuation Inputs
| | | | | | | | | | | | | | | | |
Description | | Quoted
Prices in
Active
Markets for
Identical
Assets (Level 1) | | | Significant
Other
Observable
Inputs (Level 2) | | | Significant
Unobservable
Inputs (Level 3) | | | Total | |
| Investments in Securities (a) | | | | | | | | | | | | | | | | |
Municipal Bonds | | $ | — | | | $ | 2,844,186,994 | | | $ | — | | | $ | 2,844,186,994 | |
| | | | | | | | | | | | | | | | |
| Total Investments in Securities | | | — | | | | 2,844,186,994 | | | | — | | | | 2,844,186,994 | |
| | | | | | | | | | | | | | | | |
| Other Financial Instruments | | | | | | | | | | | | | | | | |
Futures Contracts (b) | | | 5,096,819 | | | | — | | | | — | | | | 5,096,819 | |
| | | | | | | | | | | | | | | | |
| Total Investments in Securities and Other Financial Instruments | | $ | 5,096,819 | | | $ | 2,844,186,994 | | | $ | — | | | $ | 2,849,283,813 | |
| | | | | | | | | | | | | | | | |
| (a) | For a complete listing of investments and their industries, see the Portfolio of Investments. |
| (b) | The value listed for these securities reflects unrealized appreciation (depreciation) as shown on the Portfolio of Investments. |
The Fund recognizes transfers between the levels as of the beginning of the period.
For the year ended October 31, 2017, the Fund did not have any transfers among levels. (See Note 2)
As of October 31, 2017, the Fund did not hold any investments with significant unobservable inputs (Level 3). (See Note 2)
| | | | | | |
The notes to the financial statements are an integral part of,
and should be read in conjunction with, the financial statements. | | | | | 29 | |
Statement of Assets and Liabilities as of October 31, 2017
| | | | |
| Assets | |
Investment in securities, at value
(identified cost $2,812,855,803) | | $ | 2,844,186,994 | |
Cash | | | 9,976,569 | |
Cash collateral on deposit at broker for futures contracts | | | 3,597,300 | |
Receivables: | | | | |
Interest | | | 31,912,191 | |
Fund shares sold | | | 8,641,188 | |
Variation margin on futures contracts | | | 267,656 | |
Other assets | | | 88,247 | |
| | | | |
Total assets | | | 2,898,670,145 | |
| | | | |
| |
| Liabilities | | | | |
Payables: | | | | |
Investment securities purchased | | | 37,118,019 | |
Fund shares redeemed | | | 4,968,421 | |
Manager (See Note 3) | | | 1,018,350 | |
NYLIFE Distributors (See Note 3) | | | 440,128 | |
Transfer agent (See Note 3) | | | 224,666 | |
Shareholder communication | | | 136,593 | |
Professional fees | | | 29,149 | |
Trustees | | | 6,905 | |
Custodian | | | 5,895 | |
Accrued expenses | | | 14,441 | |
Dividend payable | | | 1,680,423 | |
| | | | |
Total liabilities | | | 45,642,990 | |
| | | | |
Net assets | | $ | 2,853,027,155 | |
| | | | |
| |
| Composition of Net Assets | | | | |
Shares of beneficial interest outstanding (par value of $.01 per share) unlimited number of shares authorized | | $ | 2,847,814 | |
Additional paid-in capital | | | 2,843,264,808 | |
| | | | |
| | | 2,846,112,622 | |
Distributions in excess of net investment income | | | (590,357 | ) |
Accumulated net realized gain (loss) on investments and futures transactions | | | (28,923,120 | ) |
Net unrealized appreciation (depreciation) on investments and futures contracts | | | 36,428,010 | |
| | | | |
Net assets | | $ | 2,853,027,155 | |
| | | | |
| | | | |
Class A | | | | |
Net assets applicable to outstanding shares | | $ | 1,564,954,950 | |
| | | | |
Shares of beneficial interest outstanding | | | 156,229,833 | |
| | | | |
Net asset value per share outstanding | | $ | 10.02 | |
Maximum sales charge (4.50% of offering price) | | | 0.47 | |
| | | | |
Maximum offering price per share outstanding | | $ | 10.49 | |
| | | | |
Investor Class | | | | |
Net assets applicable to outstanding shares | | $ | 10,215,513 | |
| | | | |
Shares of beneficial interest outstanding | | | 1,015,454 | |
| | | | |
Net asset value per share outstanding | | $ | 10.06 | |
Maximum sales charge (4.50% of offering price) | | | 0.47 | |
| | | | |
Maximum offering price per share outstanding | | $ | 10.53 | |
| | | | |
Class B | | | | |
Net assets applicable to outstanding shares | | $ | 17,067,625 | |
| | | | |
Shares of beneficial interest outstanding | | | 1,704,325 | |
| | | | |
Net asset value and offering price per share outstanding | | $ | 10.01 | |
| | | | |
Class C | | | | |
Net assets applicable to outstanding shares | | $ | 241,526,318 | |
| | | | |
Shares of beneficial interest outstanding | | | 24,104,740 | |
| | | | |
Net asset value and offering price per share outstanding | | $ | 10.02 | |
| | | | |
Class I | | | | |
Net assets applicable to outstanding shares | | $ | 1,019,262,749 | |
| | | | |
Shares of beneficial interest outstanding | | | 101,727,024 | |
| | | | |
Net asset value and offering price per share outstanding | | $ | 10.02 | |
| | | | |
| | | | |
| 30 | | MainStay Tax Free Bond Fund | | The notes to the financial statements are an integral part of,
and should be read in conjunction with, the financial statements. |
Statement of Operations for the year ended October 31, 2017
| | | | |
| Investment Income (Loss) | |
Income | | | | |
Interest | | $ | 97,715,880 | |
Other income | | | 2,650 | |
| | | | |
Total income | | | 97,718,530 | |
| | | | |
Expenses | | | | |
Manager (See Note 3) | | | 10,760,389 | |
Distribution/Service—Class A (See Note 3) | | | 3,358,023 | |
Distribution/Service—Investor Class (See Note 3) | | | 38,452 | |
Distribution/Service—Class B (See Note 3) | | | 92,938 | |
Distribution/Service—Class C (See Note 3) | | | 1,256,318 | |
Transfer agent (See Note 3) | | | 2,574,437 | |
Registration | | | 270,104 | |
Shareholder communication | | | 209,381 | |
Professional fees | | | 160,490 | |
Trustees | | | 62,459 | |
Custodian | | | 13,321 | |
Miscellaneous | | | 90,167 | |
| | | | |
Total expenses | | | 18,886,479 | |
| | | | |
Net investment income (loss) | | | 78,832,051 | |
| | | | |
|
| Realized and Unrealized Gain (Loss) on Investments and Futures Contracts | |
Net realized gain (loss) on: | | | | |
Investment transactions | | | (3,195,394 | ) |
Futures transactions | | | (107,337 | ) |
| | | | |
Net realized gain (loss) on investments and futures transactions | | | (3,302,731 | ) |
| | | | |
Net change in unrealized appreciation (depreciation) on: | | | | |
Investments | | | (35,958,421 | ) |
Futures contracts | | | 2,253,770 | |
| | | | |
Net change in unrealized appreciation (depreciation) on investments and futures contracts | | | (33,704,651 | ) |
| | | | |
Net realized and unrealized gain (loss) on investments and futures transactions | | | (37,007,382 | ) |
| | | | |
Net increase (decrease) in net assets resulting from operations | | $ | 41,824,669 | |
| | | | |
| | | | | | |
The notes to the financial statements are an integral part of,
and should be read in conjunction with, the financial statements. | | | | | 31 | |
Statements of Changes in Net Assets
for the years ended October 31, 2017 and October 31, 2016
| | | | | | | | |
| | | 2017 | | | 2016 | |
| Increase (Decrease) in Net Assets | |
Operations: | | | | | | | | |
Net investment income (loss) | | $ | 78,832,051 | | | $ | 60,957,004 | |
Net realized gain (loss) on investments and futures transactions | | | (3,302,731 | ) | | | 11,584,969 | |
Net change in unrealized appreciation (depreciation) on investments and futures contracts | | | (33,704,651 | ) | | | 20,765,756 | |
| | | | |
Net increase (decrease) in net assets resulting from operations | | | 41,824,669 | | | | 93,307,729 | |
| | | | |
Dividends to shareholders: | | | | | | | | |
From net investment income: | | | | | | | | |
Class A | | | (40,986,410 | ) | | | (29,941,632 | ) |
Investor Class | | | (477,109 | ) | | | (523,544 | ) |
Class B | | | (529,314 | ) | | | (513,958 | ) |
Class C | | | (7,154,854 | ) | | | (6,517,375 | ) |
Class I | | | (29,684,366 | ) | | | (23,448,205 | ) |
| | | | |
Total dividends to shareholders | | | (78,832,053 | ) | | | (60,944,714 | ) |
| | | | |
Capital share transactions: | | | | | | | | |
Net proceeds from sale of shares | | | 1,493,056,476 | | | | 1,340,967,616 | |
Net asset value of shares issued to shareholders in reinvestment of dividends | | | 57,536,646 | | | | 40,908,955 | |
Cost of shares redeemed | | | (1,116,800,081 | ) | | | (450,743,183 | ) |
| | | | |
Increase (decrease) in net assets derived from capital share transactions | | | 433,793,041 | | | | 931,133,388 | |
| | | | |
Net increase (decrease) in net assets | | | 396,785,657 | | | | 963,496,403 | |
|
| Net Assets | |
Beginning of year | | | 2,456,241,498 | | | | 1,492,745,095 | |
| | | | |
End of year | | $ | 2,853,027,155 | | | $ | 2,456,241,498 | |
| | | | |
Distributions in excess of net investment income at end of year | | $ | (590,357 | ) | | $ | (590,355 | ) |
| | | | |
| | | | |
| 32 | | MainStay Tax Free Bond Fund | | The notes to the financial statements are an integral part of,
and should be read in conjunction with, the financial statements. |
Financial Highlights selected per share data and ratios
| | | | | | | | | | | | | | | | | | | | |
| | | Year ended October 31, | |
| Class A | | 2017 | | | 2016 | | | 2015 | | | 2014 | | | 2013 | |
Net asset value at beginning of year | | $ | 10.18 | | | $ | 9.93 | | | $ | 10.03 | | | $ | 9.33 | | | $ | 10.04 | |
| | | | | | | | | | | | | | | | | | | | |
Net investment income (loss) | | | 0.31 | | | | 0.32 | | | | 0.35 | | | | 0.39 | | | | 0.38 | |
Net realized and unrealized gain (loss) on investments | | | (0.16 | ) | | | 0.25 | | | | (0.10 | ) | | | 0.70 | | | | (0.72 | ) |
| | | | | | | | | | | | | | | | | | | | |
Total from investment operations | | | 0.15 | | | | 0.57 | | | | 0.25 | | | | 1.09 | | | | (0.34 | ) |
| | | | | | | | | | | | | | | | | | | | |
| Less dividends: | | | | | | | | | | | | | | | | | | | | |
From net investment income | | | (0.31 | ) | | | (0.32 | ) | | | (0.35 | ) | | | (0.39 | ) | | | (0.37 | ) |
| | | | | | | | | | | | | | | | | | | | |
Net asset value at end of year | | $ | 10.02 | | | $ | 10.18 | | | $ | 9.93 | | | $ | 10.03 | | | $ | 9.33 | |
| | | | | | | | | | | | | | | | | | | | |
Total investment return (a) | | | 1.50 | % | | | 5.73 | % | | | 2.58 | % | | | 11.86 | % | | | (3.52 | %) |
| Ratios (to average net assets)/Supplemental Data: | | | | | | | | | | | | | | | | | | | | |
Net investment income (loss) | | | 3.05 | % | | | 3.04 | % | | | 3.51 | % | | | 3.99 | % | | | 3.72 | % |
Net expenses | | | 0.81 | % | | | 0.80 | % | | | 0.81 | % | | | 0.78 | % | | | 0.78 | % |
Expenses (before waiver/reimbursement) | | | 0.81 | % | | | 0.80 | % | | | 0.82 | % | | | 0.83 | % | | | 0.83 | % |
Portfolio turnover rate | | | 62 | % | | | 47 | % | | | 46 | % | | | 68 | % | | | 111 | % |
Net assets at end of year (in 000’s) | | $ | 1,564,955 | | | $ | 1,248,065 | | | $ | 761,278 | | | $ | 427,586 | | | $ | 417,984 | |
| (a) | Total investment return is calculated exclusive of sales charges and assumes the reinvestment of dividends and distributions. For periods of less than one year, total return is not annualized. |
| | | | | | | | | | | | | | | | | | | | |
| | | Year ended October 31, | |
| Investor Class | | 2017 | | | 2016 | | | 2015 | | | 2014 | | | 2013 | |
Net asset value at beginning of year | | $ | 10.23 | | | $ | 9.97 | | | $ | 10.08 | | | $ | 9.38 | | | $ | 10.08 | |
| | | | | | | | | | | | | | | | | | | | |
Net investment income (loss) | | | 0.31 | | | | 0.32 | | | | 0.35 | | | | 0.39 | | | | 0.36 | |
Net realized and unrealized gain (loss) on investments | | | (0.17 | ) | | | 0.26 | | | | (0.11 | ) | | | 0.69 | | | | (0.70 | ) |
| | | | | | | | | | | | | | | | | | | | |
Total from investment operations | | | 0.14 | | | | 0.58 | | | | 0.24 | | | | 1.08 | | | | (0.34 | ) |
| | | | | | | | | | | | | | | | | | | | |
| Less dividends: | | | | | | | | | | | | | | | | | | | | |
From net investment income | | | (0.31 | ) | | | (0.32 | ) | | | (0.35 | ) | | | (0.38 | ) | | | (0.36 | ) |
| | | | | | | | | | | | | | | | | | | | |
Net asset value at end of year | | $ | 10.06 | | | $ | 10.23 | | | $ | 9.97 | | | $ | 10.08 | | | $ | 9.38 | |
| | | | | | | | | | | | | | | | | | | | |
Total investment return (a) | | | 1.43 | % | | | 5.83 | % | | | 2.47 | % | | | 11.76 | % | | | (3.45 | %) |
| Ratios (to average net assets)/Supplemental Data: | | | | | | | | | | | | | | | | | | | | |
Net investment income (loss) | | | 3.10 | % | | | 3.11 | % | | | 3.54 | % | | | 3.94 | % | | | 3.67 | % |
Net expenses | | | 0.79 | % | | | 0.79 | % | | | 0.82 | % | | | 0.84 | % | | | 0.84 | % |
Expenses (before waiver/reimbursement) | | | 0.79 | % | | | 0.79 | % | | | 0.83 | % | | | 0.89 | % | | | 0.89 | % |
Portfolio turnover rate | | | 62 | % | | | 47 | % | | | 46 | % | | | 68 | % | | | 111 | % |
Net assets at end of year (in 000’s) | | $ | 10,216 | | | $ | 16,344 | | | $ | 17,259 | | | $ | 18,264 | | | $ | 19,094 | |
| (a) | Total investment return is calculated exclusive of sales charges and assumes the reinvestment of dividends and distributions. For periods of less than one year, total return is not annualized. |
| | | | | | |
The notes to the financial statements are an integral part of,
and should be read in conjunction with, the financial statements. | | | | | 33 | |
Financial Highlights selected per share data and ratios
| | | | | | | | | | | | | | | | | | | | |
| | | Year ended October 31, | |
| Class B | | 2017 | | | 2016 | | | 2015 | | | 2014 | | | 2013 | |
Net asset value at beginning of year | | $ | 10.18 | | | $ | 9.92 | | | $ | 10.03 | | | $ | 9.33 | | | $ | 10.03 | |
| | | | | | | | | | | | | | | | | | | | |
Net investment income (loss) | | | 0.28 | | | | 0.29 | | | | 0.33 | | | | 0.35 | | | | 0.34 | |
Net realized and unrealized gain (loss) on investments | | | (0.17 | ) | | | 0.26 | | | | (0.11 | ) | | | 0.71 | | | | (0.70 | ) |
| | | | | | | | | | | | | | | | | | | | |
Total from investment operations | | | 0.11 | | | | 0.55 | | | | 0.22 | | | | 1.06 | | | | (0.36 | ) |
| | | | | | | | | | | | | | | | | | | | |
| Less dividends: | | | | | | | | | | | | | | | | | | | | |
From net investment income | | | (0.28 | ) | | | (0.29 | ) | | | (0.33 | ) | | | (0.36 | ) | | | (0.34 | ) |
| | | | | | | | | | | | | | | | | | | | |
Net asset value at end of year | | $ | 10.01 | | | $ | 10.18 | | | $ | 9.92 | | | $ | 10.03 | | | $ | 9.33 | |
| | | | | | | | | | | | | | | | | | | | |
Total investment return (a) | | | 1.17 | % | | | 5.58 | % | | | 2.21 | % | | | 11.52 | % | | | (3.73 | %) |
| Ratios (to average net assets)/Supplemental Data: | | | | | | | | | | | | | | | | | | | | |
Net investment income (loss) | | | 2.85 | % | | | 2.84 | % | | | 3.28 | % | | | 3.69 | % | | | 3.41 | % |
Net expenses | | | 1.04 | % | | | 1.04 | % | | | 1.07 | % | | | 1.09 | % | | | 1.09 | % |
Expenses (before waiver/reimbursement) | | | 1.04 | % | | | 1.04 | % | | | 1.08 | % | | | 1.14 | % | | | 1.14 | % |
Portfolio turnover rate | | | 62 | % | | | 47 | % | | | 46 | % | | | 68 | % | | | 111 | % |
Net assets at end of year (in 000’s) | | $ | 17,068 | | | $ | 19,318 | | | $ | 16,806 | | | $ | 12,439 | | | $ | 12,459 | |
| (a) | Total investment return is calculated exclusive of sales charges and assumes the reinvestment of dividends and distributions. For periods of less than one year, total return is not annualized. |
| | | | | | | | | | | | | | | | | | | | |
| | | Year ended October 31, | |
| Class C | | 2017 | | | 2016 | | | 2015 | | | 2014 | | | 2013 | |
Net asset value at beginning of year | | $ | 10.18 | | | $ | 9.93 | | | $ | 10.03 | | | $ | 9.34 | | | $ | 10.04 | |
| | | | | | | | | | | | | | | | | | | | |
Net investment income (loss) | | | 0.28 | | | | 0.29 | | | | 0.33 | | | | 0.36 | | | | 0.35 | |
Net realized and unrealized gain (loss) on investments | | | (0.16 | ) | | | 0.25 | | | | (0.10 | ) | | | 0.69 | | | | (0.71 | ) |
| | | | | | | | | | | | | | | | | | | | |
Total from investment operations | | | 0.12 | | | | 0.54 | | | | 0.23 | | | | 1.05 | | | | (0.36 | ) |
| | | | | | | | | | | | | | | | | | | | |
| Less dividends: | | | | | | | | | | | | | | | | | | | | |
From net investment income | | | (0.28 | ) | | | (0.29 | ) | | | (0.33 | ) | | | (0.36 | ) | | | (0.34 | ) |
| | | | | | | | | | | | | | | | | | | | |
Net asset value at end of year | | $ | 10.02 | | | $ | 10.18 | | | $ | 9.93 | | | $ | 10.03 | | | $ | 9.34 | |
| | | | | | | | | | | | | | | | | | | | |
Total investment return (a) | | | 1.27 | % | | | 5.48 | % | | | 2.31 | % | | | 11.40 | % | | | (3.72 | %) |
| Ratios (to average net assets)/Supplemental Data: | | | | | | | | | | | | | | | | | | | | |
Net investment income (loss) | | | 2.85 | % | | | 2.81 | % | | | 3.28 | % | | | 3.68 | % | | | 3.42 | % |
Net expenses | | | 1.04 | % | | | 1.04 | % | | | 1.07 | % | | | 1.09 | % | | | 1.09 | % |
Expenses (before waiver/reimbursement) | | | 1.04 | % | | | 1.04 | % | | | 1.08 | % | | | 1.14 | % | | | 1.14 | % |
Portfolio turnover rate | | | 62 | % | | | 47 | % | | | 46 | % | | | 68 | % | | | 111 | % |
Net assets at end of year (in 000’s) | | $ | 241,526 | | | $ | 273,386 | | | $ | 183,509 | | | $ | 154,863 | | | $ | 150,244 | |
| (a) | Total investment return is calculated exclusive of sales charges and assumes the reinvestment of dividends and distributions. For periods of less than one year, total return is not annualized. |
| | | | |
| 34 | | MainStay Tax Free Bond Fund | | The notes to the financial statements are an integral part of,
and should be read in conjunction with, the financial statements. |
Financial Highlights selected per share data and ratios
| | | | | | | | | | | | | | | | | | | | |
| | | Year ended October 31, | |
| Class I | | 2017 | | | 2016 | | | 2015 | | | 2014 | | | 2013 | |
Net asset value at beginning of year | | $ | 10.18 | | | $ | 9.93 | | | $ | 10.03 | | | $ | 9.34 | | | $ | 10.04 | |
| | | | | | | | | | | | | | | | | | | | |
Net investment income (loss) | | | 0.33 | | | | 0.34 | | | | 0.38 | | | | 0.41 | | | | 0.40 | |
Net realized and unrealized gain (loss) on investments | | | (0.16 | ) | | | 0.25 | | | | (0.10 | ) | | | 0.69 | | | | (0.71 | ) |
| | | | | | | | | | | | | | | | | | | | |
Total from investment operations | | | 0.17 | | | | 0.59 | | | | 0.28 | | | | 1.10 | | | | (0.31 | ) |
| | | | | | | | | | | | | | | | | | | | |
| Less dividends: | | | | | | | | | | | | | | | | | | | | |
From net investment income | | | (0.33 | ) | | | (0.34 | ) | | | (0.38 | ) | | | (0.41 | ) | | | (0.39 | ) |
| | | | | | | | | | | | | | | | | | | | |
Net asset value at end of year | | $ | 10.02 | | | $ | 10.18 | | | $ | 9.93 | | | $ | 10.03 | | | $ | 9.34 | |
| | | | | | | | | | | | | | | | | | | | |
Total investment return (a) | | | 1.75 | % | | | 5.99 | % | | | 2.83 | % | | | 12.02 | % | | | (3.18 | %) |
| Ratios (to average net assets)/Supplemental Data: | | | | | | | | | | | | | | | | | | | | |
Net investment income (loss) | | | 3.31 | % | | | 3.29 | % | | | 3.78 | % | | | 4.21 | % | | | 4.00 | % |
Net expenses | | | 0.56 | % | | | 0.55 | % | | | 0.56 | % | | | 0.53 | % | | | 0.54 | % |
Expenses (before waiver/reimbursement) | | | 0.56 | % | | | 0.55 | % | | | 0.57 | % | | | 0.58 | % | | | 0.59 | % |
Portfolio turnover rate | | | 62 | % | | | 47 | % | | | 46 | % | | | 68 | % | | | 111 | % |
Net assets at end of year (in 000’s) | | $ | 1,019,263 | | | $ | 899,128 | | | $ | 513,893 | | | $ | 314,005 | | | $ | 236,531 | |
| (a) | Total investment return is calculated exclusive of sales charges and assumes the reinvestment of dividends and distributions. Class I shares are not subject to sales charges. For periods of less than one year, total return is not annualized. |
| | | | | | |
The notes to the financial statements are an integral part of,
and should be read in conjunction with, the financial statements. | | | | | 35 | |
Notes to Financial Statements
Note 1–Organization and Business
The MainStay Funds (the “Trust”) was organized on January 9, 1986, as a Massachusetts business trust and is governed by a Declaration of Trust. The Trust is registered under the Investment Company Act of 1940, as amended (the “1940 Act”), as an open-end management investment company, and is comprised of twelve funds (collectively referred to as the “Funds”). These financial statements and notes relate to the MainStay Tax Free Bond Fund (the “Fund”), a “diversified” fund, as that term is defined in the 1940 Act, as interpreted or modified by regulatory authorities having jurisdiction, from time to time.
The Fund currently has seven classes of shares registered for sale. Class A shares commenced operations on January 3, 1995. Class B shares commenced operations on May 1, 1986. Class C shares commenced operations on September 1, 1998. Investor Class shares commenced operations on February 28, 2008. Class I shares commenced operations on December 21, 2009. Class R6 and Class T shares were registered for sale effective as of February 28, 2017. As of October 31, 2017, Class R6 and Class T shares were not yet offered for sale. Effective February 28, 2017, Class B shares of the MainStay Group of Funds were closed to all new purchases as well as additional investments by existing Class B shareholders. Existing Class B shareholders may continue to reinvest dividends and capital gains distributions, as well as exchange their Class B shares for Class B shares of other MainStay Group of Funds as permitted by the current exchange privileges. Class B shareholders continue to be subject to any applicable contingent deferred sales charge (“CDSC”) at the time of redemption. All other features of the Class B shares, including but not limited to the fees and expenses applicable to Class B shares, remain unchanged. Unless redeemed, Class B shareholders will remain in Class B shares of their respective fund until the Class B shares are converted to Class A or Investor Class shares pursuant to the applicable conversion schedule.
Class A and Investor Class shares are offered at net asset value (“NAV”) per share plus an initial sales charge. No initial sales charge applies to investments of $250,000 or more (and certain other qualified purchases) in Class A and Investor Class shares. Effective August 1, 2017, a CDSC of 1.00% may be imposed on certain redemptions of Class A and Investor Class shares made within 18 months of the date of purchase on shares that were purchased without an initial sales charge. For purchases of Class A and Investor Class shares made from January 1, 2017, through July 31, 2017, a CDSC of 1.00% may be imposed on certain redemptions of such shares made within 24 months of the date of purchase on shares that were purchased without an initial sales charge. For purchases of Class A and Investor Class shares made prior to January 1, 2017, a CDSC of 1.00% may be imposed on certain redemptions made within one year of the date of purchase on shares that were purchased without an initial sales charge. Class C shares are offered at NAV without an initial sales charge, although a 1.00% CDSC may be imposed on certain redemptions made within one year of the date of purchase of Class C shares. When Class B shares were offered, they were offered at NAV without an initial sales charge, although a CDSC that declines depending on the number of years a shareholder has held its Class B shares may be imposed on redemptions made within six years of the date of purchase of such shares. Class I shares are offered at NAV and are not subject to a sales charge. Class T shares are currently expected to be offered at NAV plus an initial sales charge. Class R6 shares are currently expected to be offered at NAV and to not
be subject to a sales charge. Depending upon eligibility, Class B shares convert to either Class A or Investor Class shares at the end of the calendar quarter eight years after the date they were purchased. Additionally, as disclosed in the Fund’s prospectus, Class A shares may convert automatically to Investor Class shares and Investor Class shares may convert automatically to Class A shares. Under certain circumstances and as may be permitted by the Trust’s multiple class plan pursuant to Rule 18f-3 under the 1940 Act, specified share classes of the Fund may be converted to one or more other share classes of the Fund as disclosed in the capital share transactions within these Notes. The classes of shares have the same voting (except for issues that relate solely to one class), dividend, liquidation and other rights, and the same terms and conditions, except that under distribution plans pursuant to Rule 12b-1 under the 1940 Act, Class B and Class C shares are subject to higher distribution and/or service fees than Class A, Investor Class and Class T shares. Class I and Class R6 shares are not subject to a distribution and/or service fee.
The Fund’s investment objective is to seek current income exempt from regular federal income tax.
Note 2–Significant Accounting Policies
The Fund is an investment company and accordingly follows the investment company accounting and reporting guidance of the Financial Accounting Standards Board (“FASB”) Accounting Standard Codification Topic 946 Financial Services—Investment Companies. The Fund prepares its financial statements in accordance with generally accepted accounting principles (“GAAP”) in the United States of America and follows the significant accounting policies described below.
(A) Securities Valuation. Investments are usually valued as of the close of regular trading on the New York Stock Exchange (the “Exchange”) (usually 4:00 p.m. Eastern time) on each day the Fund is open for business (“valuation date”).
The Board of Trustees of the Trust (the “Board”) adopted procedures establishing methodologies for the valuation of the Fund’s securities and other assets and delegated the responsibility for valuation determinations under those procedures to the Valuation Committee of the Trust (the “Valuation Committee”). The Board authorized the Valuation Committee to appoint a Valuation Subcommittee (the “Subcommittee”) to deal in the first instance with establishing the prices of securities for which market quotations are not readily available or the prices of which are not otherwise readily determinable under these procedures. The Subcommittee meets (in person, via electronic mail or via teleconference) on an as-needed basis. Subsequently, the Valuation Committee meets to ensure that actions taken by the Subcommittee were appropriate. The procedures state that, subject to the oversight of the Board and unless otherwise noted, the responsibility for the day-to-day valuation of portfolio assets (including fair value measurements for the Fund’s assets and liabilities) rests with New York Life Investment Management LLC (“New York Life Investments” or the “Manager”), aided to whatever extent necessary by the Subadvisor (as defined in Note 3(A)).
To assess the appropriateness of security valuations, the Manager, the Subadvisor or the Fund’s third-party service provider, who is subject to oversight by the Manager, regularly compares prior day prices, prices
| | |
| 36 | | MainStay Tax Free Bond Fund |
on comparable securities and the sale prices to the prior and current day prices and challenges prices with changes exceeding certain tolerance levels with third-party pricing services or broker sources. For those securities valued through either a standardized fair valuation methodology or a fair valuation measurement, the Subcommittee deals in the first instance with such valuation and the Valuation Committee reviews and affirms, if appropriate, the reasonableness of the valuation based on such methodologies and measurements on a regular basis after considering information that is reasonably available and deemed relevant by the Valuation Committee. Any action taken by the Subcommittee with respect to the valuation of a portfolio security or other asset is submitted for review and ratification (if appropriate) to the Valuation Committee and the Board at the next regularly scheduled meeting.
“Fair value” is defined as the price the Fund would reasonably expect to receive upon selling an asset or liability in an orderly transaction to an independent buyer in the principal or most advantageous market for the asset or liability. Fair value measurements are determined within a framework that establishes a three-tier hierarchy which maximizes the use of observable market data and minimizes the use of unobservable inputs to establish a classification of fair value measurements for disclosure purposes. “Inputs” refer broadly to the assumptions that market participants would use in pricing the asset or liability, including assumptions about risk, such as the risk inherent in a particular valuation technique used to measure fair value using a pricing model and/or the risk inherent in the inputs for the valuation technique. Inputs may be observable or unobservable. Observable inputs reflect the assumptions market participants would use in pricing the asset or liability based on market data obtained from sources independent of the Fund. Unobservable inputs reflect the Fund’s own assumptions about the assumptions market participants would use in pricing the asset or liability based on the information available. The inputs or methodology used for valuing assets or liabilities may not be an indication of the risks associated with investing in those assets or liabilities. The three-tier hierarchy of inputs is summarized below.
| • | | Level 1—quoted prices in active markets for an identical asset or liability |
| • | | Level 2—other significant observable inputs (including quoted prices for a similar asset or liability in active markets, interest rates and yield curves, prepayment speeds, credit risk, etc.) |
| • | | Level 3—significant unobservable inputs (including the Fund’s own assumptions about the assumptions that market participants would use in measuring fair value of an asset or liability) |
The level of an asset or liability within the fair value hierarchy is based on the lowest level of an input, both individually and in the aggregate, that is significant to the fair value measurement. As of October 31, 2017, the aggregate value by input level of the Fund’s assets and liabilities is included at the end of the Fund’s Portfolio of Investments.
The Fund may use third-party vendor evaluations, whose prices may be derived from one or more of the following standard inputs, among others:
| | |
• Benchmark yields | | • Reported trades |
• Broker/dealer quotes | | • Issuer spreads |
• Two-sided markets | | • Benchmark securities |
• Bids/offers | | • Reference data (corporate actions or material event notices) |
• Industry and economic events | | • Comparable bonds |
• Monthly payment information | | |
An asset or liability for which market values cannot be measured using the methodologies described above is valued by methods deemed reasonable in good faith by the Valuation Committee, following the procedures established by the Board, to represent fair value. Under these procedures, the Fund generally uses a market-based approach which may use related or comparable assets or liabilities, recent transactions, market multiples, book values and other relevant information. The Fund may also use an income-based valuation approach in which the anticipated future cash flows of the asset or liability are discounted to calculate fair value. Discounts may also be applied due to the nature and/or duration of any restrictions on the disposition of the asset or liability. Fair value represents a good faith approximation of the value of a security. Fair value determinations involve the consideration of a number of subjective factors, an analysis of applicable facts and circumstances and the exercise of judgment. As a result, it is possible that the fair value for a security determined in good faith in accordance with the Fund’s valuation procedures may differ from valuations for the same security determined by other funds using their own valuation procedures. Although the Fund’s valuation procedures are designed to value a security at the price the Fund may reasonably expect to receive upon the security’s sale in an orderly transaction, there can be no assurance that any fair value determination thereunder would, in fact, approximate the amount that the Fund would actually realize upon the sale of the security or the price at which the security would trade if a reliable market price were readily available. During the year ended October 31, 2017, there were no material changes to the fair value methodologies.
Securities which may be valued in this manner include, but are not limited to: (i) a security for which trading has been halted or suspended; (ii) a debt security that has recently gone into default and for which there is not a current market quotation; (iii) a security of an issuer that has entered into a restructuring; (iv) a security that has been de-listed from a national exchange; (v) a security for which the market price is not readily available from a third-party pricing source or, if so provided, does not, in the opinion of the Manager or Subadvisor, reflect the security’s market value; (vi) a security subject to trading collars for which no or limited trading takes place; and (vii) a security whose principal market has been temporarily closed at a time when, under normal conditions, it would be open. Securities for which market quotations or observable inputs are not readily available are generally categorized as Level 3 in the hierarchy. As of October 31, 2017, there were no securities held by the Fund that were fair valued in such a manner.
Futures contracts are valued at the last posted settlement price on the market where such futures are primarily traded. Investments in mutual
Notes to Financial Statements (continued)
funds, including money market funds, are valued at their respective NAVs as of the close of the Exchange on the valuation date. These securities are generally categorized as Level 1 in the hierarchy.
Municipal debt securities are valued at the evaluated mean prices supplied by a pricing agent or broker selected by the Manager, in consultation with the Subadvisor. Those values reflect broker/dealer supplied prices and electronic data processing techniques, if the evaluated bid or mean prices are deemed by the Manager, in consultation with the Subadvisor, to be representative of market values, at the regular close of trading of the Exchange on each valuation date. Debt securities purchased on a delayed delivery basis are marked to market daily until settlement at the forward settlement date. Municipal debt securities are generally categorized as Level 2 in the hierarchy.
Temporary cash investments acquired in excess of 60 days to maturity at the time of purchase are valued using the latest bid prices or using valuations based on a matrix system (which considers such factors as security prices, yields, maturities and ratings), both as furnished by independent pricing services. Other temporary cash investments which mature in 60 days or less at the time of purchase (“Short-Term Investments”) are valued using the amortized cost method of valuation, unless the use of such method would be inappropriate. The amortized cost method involves valuing a security at its cost on the date of purchase and thereafter assuming a constant amortization to maturity of the difference between such cost and the value on maturity date. Amortized cost approximates the current fair value of a security. Securities valued using the amortized cost method are not valued using quoted prices in an active market and are generally categorized as Level 2 in the hierarchy.
The information above is not intended to reflect an exhaustive list of the methodologies that may be used to value portfolio investments. The valuation procedures permit the use of a variety of valuation methodologies in connection with valuing portfolio investments. The methodology used for a specific type of investment may vary based on the market data available or other considerations. The methodologies summarized above may not represent the specific means by which portfolio investments are valued on any particular business day.
A portfolio security or other asset may be determined to be illiquid under procedures approved by the Board. Illiquidity of a security might prevent the sale of such security at a time when the Manager or Subadvisor might wish to sell, and these securities could have the effect of decreasing the overall level of the Fund’s liquidity. Further, the lack of an established secondary market may make it more difficult to value illiquid securities, requiring the Fund to rely on judgments that may be somewhat subjective in measuring value, which could vary materially from the amount that the Fund may realize upon disposition. Difficulty in selling illiquid securities may result in a loss or may be costly to the Fund. Under the supervision of the Board, the Manager or Subadvisor determines the liquidity of the Fund’s investments; in doing so, the Manager or Subadvisor may consider various factors, including: (i) the frequency of trades and quotations; (ii) the number of dealers and prospective purchasers; (iii) dealer undertakings to make a market; and (iv) the nature of the security and the market in which it trades (e.g., the time needed to dispose of the security, the method of soliciting offers and the mechanics of transfer). Illiquid securities are often valued in accordance with methods deemed by the Board in good faith to be
reasonable and appropriate to accurately reflect their fair value. The liquidity of the Fund’s investments, as shown in the Portfolio of Investments, was determined as of October 31, 2017 and can change at any time in response to, among other relevant factors, market conditions or events or developments with respect to an individual issuer or instrument.
(B) Income Taxes. The Fund’s policy is to comply with the requirements of the Internal Revenue Code of 1986, as amended (the “Internal Revenue Code”), applicable to regulated investment companies and to distribute all of its taxable income to the shareholders of the Fund within the allowable time limits. Therefore, no federal, state and local income tax provisions are required.
Management evaluates the Fund’s tax positions to determine if the tax positions taken meet the minimum recognition threshold in connection with accounting for uncertainties in income tax positions taken or expected to be taken for the purposes of measuring and recognizing tax liabilities in the financial statements. Recognition of tax benefits of an uncertain tax position is permitted only to the extent the position is “more likely than not” to be sustained assuming examination by taxing authorities. Management has analyzed the Fund’s tax positions taken on federal, state and local income tax returns for all open tax years (for up to three tax years) and has concluded that no provisions for federal, state and local income tax are required in the Fund’s financial statements. The Fund’s federal, state and local income tax and federal excise tax returns for tax years for which the applicable statutes of limitations have not expired are subject to examination by the Internal Revenue Service and state and local departments of revenue.
(C) Dividends and Distributions to Shareholders. Dividends and distributions are recorded on the ex-dividend date. The Fund intends to declare dividends from net investment income, if any, daily and intends to pay them at least monthly and declares and pays distributions from net realized capital gains, if any, at least annually. Unless the shareholder elects otherwise, all dividends and distributions are reinvested in the same class of shares of the Fund, at NAV. Dividends and distributions to shareholders are determined in accordance with federal income tax regulations and may differ from determinations using GAAP.
(D) Security Transactions and Investment Income. The Fund records security transactions on the trade date. Realized gains and losses on security transactions are determined using the identified cost method. Interest income is accrued as earned using the effective interest rate method. Discounts and premiums on securities purchased, other than Short-Term Investments, for the Fund are accreted and amortized, respectively, on the effective interest rate method over the life of the respective securities. Discounts and premiums on Short-Term Investments are accreted and amortized, respectively, on the straight-line method. The straight-line method approximates the effective interest method for Short-Term Investments.
Investment income and realized and unrealized gains and losses on investments of the Fund are allocated pro rata to separate classes of shares based upon their relative net assets on the date the income is earned or realized and unrealized gains and losses are incurred.
The Fund may place a debt security on non-accrual status and reduce related interest income by ceasing current accruals and writing off all or
| | |
| 38 | | MainStay Tax Free Bond Fund |
a portion of any interest receivables when the collection of all or a portion of such interest has become doubtful. A debt security is removed from non-accrual status when the issuer resumes interest payments or when collectability of interest is reasonably assured.
(E) Expenses. Expenses of the Trust are allocated to the individual Funds in proportion to the net assets of the respective Funds when the expenses are incurred, except where direct allocations of expenses can be made. Expenses (other than transfer agent expenses and fees incurred under the shareholder services plans and/or the distribution plans further discussed in Note 3(B)) are allocated to separate classes of shares pro rata based upon their relative net assets on the date the expenses are incurred. The expenses borne by the Fund, including those of related parties to the Fund, are shown in the Statement of Operations.
(F) Use of Estimates. In preparing financial statements in conformity with GAAP, management makes estimates and assumptions that affect the reported amounts and disclosures in the financial statements. Actual results could differ from those estimates.
(G) Futures Contracts. A futures contract is an agreement to purchase or sell a specified quantity of an underlying instrument at a specified future date and price, or to make or receive a cash payment based on the value of a financial instrument (e.g., interest rate, security or securities index). The Fund is subject to risks such as market price risk and/or interest rate risk in the normal course of investing in these transactions. Upon entering into a futures contract, the Fund is required to pledge to the broker or futures commission merchant an amount of cash and/or U.S. government securities equal to a certain percentage of the collateral amount, known as the “initial margin.” During the period the futures contract is open, changes in the value of the contract are recognized as unrealized appreciation or depreciation by marking to market such contract on a daily basis to reflect the market value of the contract at the end of each day’s trading. The Fund agrees to receive from or pay to the broker or futures commission merchant an amount of cash equal to the daily fluctuation in the value of the contract. Such receipts or payments are known as “variation margin.” When the futures contract is closed, the Fund records a realized gain or loss equal to the difference between the proceeds from (or cost of) the closing transaction and the Fund’s basis in the contract.
The use of futures contracts involves, to varying degrees, elements of market risk in excess of the amount recognized in the Statement of Assets and Liabilities. The contract or notional amounts and variation margin reflect the extent of the Fund’s involvement in open futures positions. There are several risks associated with the use of futures contracts as hedging techniques. There can be no assurance that a liquid market will exist at the time when the Fund seeks to close out a futures contract. If no liquid market exists, the Fund would remain obligated to meet margin requirements until the position is closed. Futures may involve a small initial investment relative to the risk assumed, which could result in losses greater than if they had not been used. Futures may be more volatile than direct investments in the instrument underlying the futures and may not correlate to the underlying instrument, causing a given hedge not to achieve its objectives. The Fund’s activities in futures contracts have minimal counterparty risk as they are conducted through regulated exchanges that guarantee the futures against default by the counterparty. In the event of a bankruptcy or
insolvency of a futures commission merchant that holds margin on behalf of the Fund, the Fund may not be entitled to the return of the entire margin owed to the Fund, potentially resulting in a loss. The Fund’s investment in futures contracts and other derivatives may increase the volatility of the Fund’s NAVs and may result in a loss to the Fund. As of October 31, 2017, all open futures contracts are shown in the Portfolio of Investments.
(H) Securities Lending. In order to realize additional income, the Fund may engage in securities lending, subject to the limitations set forth in the 1940 Act and relevant guidance by the staff of the Securities and Exchange Commission (“SEC”). In the event the Fund does engage in securities lending, the Fund will lend through its custodian, State Street Bank and Trust Company (“State Street”). State Street will manage the Fund’s collateral in accordance with the lending agreement between the Fund and State Street, and indemnify the Fund against counterparty risk. The loans will be collateralized by U.S. Treasury securities at least equal at all times to the market value of the securities loaned. The Fund may bear the risk of delay in recovery of, or loss of rights in, the securities loaned should the borrower of the securities experience financial difficulty. The Fund may also record a realized gain or loss on securities deemed sold due to a borrower’s inability to return securities on loan. The Fund bears the risk of any loss on investment of the collateral. The Fund will receive compensation for lending its securities in the form of fees or it will retain a portion of interest on the investment of any cash received as collateral. The Fund will also continue to receive interest and dividends on the securities loaned and any gain or loss in the market price of the securities loaned that may occur during the term of the loan will be for the account of the Fund. During the year ended October 31, 2017, the Fund did not have any portfolio securities on loan.
(I) Municipal Bond Risk. The Fund may invest more heavily in municipal bonds from certain cities, states or regions than others, which may increase the Fund’s exposure to losses resulting from economic, political, or regulatory occurrences impacting these particular cities, states or regions. In addition, many state and municipal governments that issue securities are under significant economic and financial stress and may not be able to satisfy their obligations. The Fund may invest a substantial amount of its assets in municipal bonds whose interest is paid solely from revenues of similar projects, such as tobacco settlement bonds. If the Fund concentrates its investments in this manner, it assumes the legal and economic risks relating to such projects and this may have a significant impact on the Fund’s investment performance.
Certain of the issuers in which the Fund may invest have recently experienced, or may experience, significant financial difficulties and repeated credit rating downgrades. On May 3, 2017, the Commonwealth of Puerto Rico began proceedings to seek bankruptcy-type protections from approximately $74 billion in debt and approximately $48 billion in unfunded pension obligations. Puerto Rico’s debt restructuring of $122 billion is significantly larger than the previous largest U.S. public bankruptcy, which covered approximately $18 billion of debt for the city of Detroit. Puerto Rico’s debt restructuring process and other economic factors or developments could occur rapidly and may significantly affect the value of municipal securities of Puerto Rico. The Fund’s vulnerability to potential losses associated with such developments may be reduced through investing in municipal securities that feature credit enhancements (such as bond insurance). The bond insurance provider pays both
Notes to Financial Statements (continued)
principal and interest when due to the bond holder. The magnitude of Puerto Rico’s debt restructuring or other adverse economic developments could pose significant strains on the ability of municipal securities insurers to meet all future claims. As of October 31, 2017, 100% of the Puerto Rico municipal securities held by the Fund were insured.
(J) Indemnifications. Under the Trust’s organizational documents, its officers and trustees are indemnified against certain liabilities that may arise out of performance of their duties to the Trust. Additionally, in the normal course of business, the Fund enters into contracts with third-party service providers that contain a variety of representations and warranties and which may provide general indemnifications. The Fund’s maximum exposure under these arrangements is unknown, as this would involve future claims that may be made against the Fund that have not yet occurred. Based on experience, management is of the view that the risk of loss in connection with these potential indemnification obligations is remote. However, there can be no assurance that material liabilities related to such obligations will not arise in the future, which could adversely impact the Fund.
(K) Quantitative Disclosure of Derivative Holdings. The following tables show additional disclosures related to the Fund’s derivative and hedging activities, including how such activities are accounted for and their effect on the Fund’s financial positions, performance and cash flows. The Fund entered into futures contracts to help manage the duration and yield curve positioning of the portfolio. These derivatives are not accounted for as hedging instruments.
Fair value of derivative instruments as of October 31, 2017:
Asset Derivatives
| | | | | | | | | | |
| | | Statement of Assets and Liabilities Location | | Interest
Rate
Contracts
Risk | | | Total | |
Futures Contracts | | Net Assets—Net unrealized appreciation on investments and futures contracts (a) | | $ | 5,096,819 | | | $ | 5,096,819 | |
| | | | | | |
Total Fair Value | | | | $ | 5,096,819 | | | $ | 5,096,819 | |
| | | | | | |
| (a) | Includes cumulative appreciation (depreciation) of futures contracts as reported in the Portfolio of Investments. Only current day’s variation margin is reported within the Statement of Assets and Liabilities. |
The effect of derivative instruments on the Statement of Operations for the year ended October 31, 2017:
Realized Gain (Loss)
| | | | | | | | | | |
| | | Statement of
Operations
Location | | Interest Rate
Contracts
Risk | | | Total | |
Futures Contracts | | Net realized gain (loss) on futures transactions | | $ | (107,337 | ) | | $ | (107,337 | ) |
| | | | | | |
Total Realized Gain (Loss) | | | | $ | (107,337 | ) | | $ | (107,337 | ) |
| | | | | | |
Change in Unrealized Appreciation (Depreciation)
| | | | | | | | | | |
| | | Statement of
Operations
Location | | Interest Rate
Contracts
Risk | | | Total | |
Futures Contracts | | Net change in unrealized appreciation (depreciation) on futures contracts | | $ | 2,253,770 | | | $ | 2,253,770 | |
| | | | | | |
Total Change in Unrealized Appreciation (Depreciation) | | | | $ | 2,253,770 | | | $ | 2,253,770 | |
| | | | | | |
Average Notional Amount
| | | | | | |
| | | Interest Rate Contracts Risk | | Total | |
Futures Contracts Short | | $(515,983,206) | | $ | (515,983,206 | ) |
| | | |
Note 3–Fees and Related Party Transactions
(A) Manager and Subadvisor. New York Life Investments, a registered investment adviser and an indirect, wholly-owned subsidiary of New York Life Insurance Company (“New York Life”), serves as the Fund’s Manager, pursuant to an Amended and Restated Management Agreement (“Management Agreement”). The Manager provides offices, conducts clerical, recordkeeping and bookkeeping services and keeps most of the financial and accounting records required to be maintained by the Fund. Except for the portion of salaries and expenses that are the responsibility of the Fund, the Manager pays the salaries and expenses of all personnel affiliated with the Fund and certain operational expenses of the Fund. The Fund reimburses New York Life Investments in an amount equal to a portion of the compensation of the Chief Compliance Officer attributable to the Fund. MacKay Shields LLC (“MacKay Shields” or the “Subadvisor”), a registered investment adviser and an indirect, wholly-owned subsidiary of New York Life, serves as Subadvisor to the Fund and is responsible for the day-to-day portfolio management of the Fund. Pursuant to the terms of an Amended and Restated Subadvisory Agreement (“Subadvisory Agreement”) between New York Life Investments and MacKay Shields, New York Life Investments pays for the services of the Subadvisor.
Under the Management Agreement, the Fund pays the Manager a monthly fee for the services performed and the facilities furnished at an annual rate of the Fund’s average daily net assets as follows: 0.45% up to $500 million; 0.425% from $500 million to $1 billion; and 0.40% in excess of $1 billion, plus a fee for fund accounting services, previously provided by New York Life Investments under a separate fund accounting agreement, furnished at an annual rate of the Fund’s average daily net assets as follows: 0.05% up to $20 million; 0.0333% from $20 million to $100 million; and 0.01% in excess of $100 million.
During the year ended October 31, 2017, the effective management fee rate (exclusive of any applicable waivers/reimbursements) was 0.43% inclusive of a fee for fund accounting services of 0.01% of the Fund’s average daily net assets.
| | |
| 40 | | MainStay Tax Free Bond Fund |
New York Life Investments has contractually agreed to waive fees and/or reimburse expenses so that Total Annual Fund Operating Expenses (excluding taxes, interest, litigation, extraordinary expenses, brokerage and other transaction expenses relating to the purchase or sale of portfolio investments and acquired (underlying) fund fees and expenses) for Class A shares do not exceed 0.82% of its average daily net assets. New York Life Investments will apply an equivalent waiver or reimbursement, in an equal number of basis points, to the other share classes of the Fund, except for Class R6. This agreement will remain in effect until February 28, 2018, and shall renew automatically for one year terms unless New York Life Investments provides written notice of termination prior to the start of the next term or upon approval by the Board.
During the year ended October 31, 2017, New York Life Investments earned fees from the Fund in the amount of $10,760,389.
State Street provides sub-administration and sub-accounting services to the Fund pursuant to an agreement with New York Life Investments. These services include calculating the daily NAVs of the Fund, maintaining the general ledger and sub-ledger accounts for the calculation of the Fund’s NAVs and assisting New York Life Investments in conducting various aspects of the Fund’s administrative operations. For providing these services to the Fund, State Street is compensated by New York Life Investments.
(B) Distribution and Service Fees. The Trust, on behalf of the Fund, has entered into a distribution agreement with NYLIFE Distributors LLC (the “Distributor”), an indirect, wholly-owned subsidiary of New York Life. The Fund has adopted distribution plans (the “Plans”) in accordance with the provisions of Rule 12b-1 under the 1940 Act.
Pursuant to the Class A, Investor and Class T Class Plans, the Distributor receives a monthly distribution fee from the Class A, Investor Class and Class T shares at an annual rate of 0.25% of the average daily net assets of the Class A, Investor Class and Class T shares for distribution and/or service activities as designated by the Distributor. Pursuant to the Class B and Class C Plans, Class B and Class C shares pay the Distributor a monthly distribution fee at an annual rate of 0.25% of the average daily net assets of the Class B and Class C shares along with a service fee at an annual rate of 0.25% of the average daily net assets of the Class B and Class C shares, for a total 12b-1 fee of 0.50%. Class I shares are not subject to a distribution and/or service fee.
The Plans provide that the distribution and service fees are payable to the Distributor regardless of the amounts actually expended by the Distributor for distribution of the Fund’s shares and service activities.
(C) Sales Charges. During the year ended October 31, 2017, the Fund was advised by the Distributor that the amount of initial sales charges retained on sales of Class A and Investor Class shares were $47,981 and $6,946, respectively.
During the year ended October 31, 2017, the Fund was also advised that the Distributor retained CDSCs on redemptions of Class A, Class B and Class C shares of $252,416, $30,638 and $58,782, respectively.
(D) Transfer, Dividend Disbursing and Shareholder Servicing Agent. NYLIM Service Company LLC, an affiliate of New York Life Investments, is the Fund’s transfer, dividend disbursing and shareholder servicing agent pursuant to an agreement between NYLIM
Service Company LLC and the Trust. NYLIM Service Company LLC has entered into an agreement with Boston Financial Data Services, Inc. (“BFDS”) pursuant to which BFDS performs certain transfer agent services on behalf of NYLIM Service Company LLC. During the year ended October 31, 2017, transfer agent expenses incurred by the Fund were as follows:
| | | | |
Class A | | $ | 1,401,181 | |
Investor Class | | | 12,765 | |
Class B | | | 15,427 | |
Class C | | | 208,367 | |
Class I | | | 936,697 | |
(E) Small Account Fee. Shareholders with small accounts adversely impact the cost of providing transfer agency services. In an effort to reduce total transfer agency expenses, the Fund has implemented a small account fee on certain types of accounts. Certain shareholders with an account balance of less than $1,000 are charged an annual per account fee of $20 (assessed semi-annually), the proceeds from which offset transfer agent fees as reflected in the Statement of Operations.
Note 4–Federal Income Tax
As of October 31, 2017, the cost and unrealized appreciation (depreciation) of the Fund’s investment portfolio, including applicable derivative contracts and other financial instruments, as determined on a federal income tax basis, were as follows:
| | | | | | | | | | | | | | | | |
| | | Federal
Tax Cost | | | Gross
Unrealized
Appreciation | | | Gross
Unrealized
Depreciation | | | Net
Unrealized
Appreciation/
(Depreciation) | |
Investments in Securities | | $ | 2,812,951,209 | | | $ | 64,559,647 | | | $ | (33,323,862 | ) | | $ | 31,235,785 | |
As of October 31, 2017, the components of accumulated gain (loss) on a tax basis were as follows:
| | | | | | | | | | |
Ordinary
Income | | Undistributed
Tax Exempt
Income | | Accumulated
Capital and Other Gain (Loss) | | Other
Temporary
Differences | | Unrealized
Appreciation
(Depreciation) | | Total
Accumulated Gain (Loss) |
| $— | | $1,090,066 | | $(23,730,895) | | $(1,680,423) | | $31,235,785 | | $6,914,533 |
The difference between book-basis and tax-basis unrealized appreciation (depreciation) is primarily due to wash sale adjustments and mark to market of futures contracts. The other temporary differences are primarily due to dividends payable.
The following table discloses the current year reclassifications between undistributed net investment income (loss), accumulated net realized gain (loss) on investments, and additional paid-in capital arising from
Notes to Financial Statements (continued)
permanent differences; net assets as of October 31, 2017 were not affected.
| | | | |
Undistributed Net Investment Income (Loss) | | Accumulated Net Realized Gain (Loss) on Investments | | Additional Paid-In Capital |
| $— | | $3,951,552 | | $(3,951,552) |
The reclassifications for the Fund are primarily due to expiration of capital loss carryforwards.
Under the Regulated Investment Company Modernization Act of 2010, the Fund is permitted to carry forward capital losses incurred in taxable years beginning after December 22, 2010, for an unlimited period. However, any losses incurred during those future years will be required to be utilized prior to the losses incurred in pre-enactment tax years. As a result of this ordering rule, pre-enactment capital loss carryforwards may be more likely to expire unused. Additionally, post-enactment capital losses that are carried forward will retain their character as either short-term or long-term capital losses rather than being considered all short-term as under previous law.
As of October 31, 2017, for federal income tax purposes, capital loss carryforwards of $23,730,895 were available as shown in the table below, to the extent provided by the regulations to offset future realized gains of the Fund through the years indicated. To the extent that these capital loss carryforwards are used to offset future capital gains, it is probable that the capital gains so offset will not be distributed to shareholders. No capital gain distributions shall be made until any capital loss carryforwards have been fully utilized or expired.
| | | | | | | | |
Capital Loss Available Through | | Short-Term Capital Loss Amounts (000’s) | | | Long-Term Capital Loss Amounts (000’s) | |
| 2019 | | $ | 2,136 | | | $ | — | |
| Unlimited | | | 21,595 | | | | — | |
| Total | | $ | 23,731 | | | $ | — | |
The Fund had $3,951,552 of capital loss carryforward that expired during the year ended October 31, 2017.
During the years ended October 31, 2017 and October��31, 2016, the tax character of distributions paid as reflected in the Statements of Changes in Net Assets was as follows:
| | | | | | | | |
| | | 2017 | | | 2016 | |
Distributions paid from: | |
Ordinary Income | | $ | 360,676 | | | $ | 407,328 | |
Exempt Interest Dividends | | | 78,471,377 | | | | 60,537,386 | |
Total | | $ | 78,832,053 | | | $ | 60,944,714 | |
Note 5–Custodian
State Street is the custodian of cash and securities held by the Fund. Custodial fees are charged to the Fund based on the Fund’s net assets and/or the market value of securities held by the Fund and the number of certain transactions incurred by the Fund.
Note 6–Line of Credit
The Fund and certain other funds managed by New York Life Investments, maintain a line of credit with a syndicate of banks in order to secure a source of funds for temporary purposes to meet unanticipated or excessive redemption requests.
Effective August 1, 2017, under the credit agreement (the “Credit Agreement”), the aggregate commitment amount is $600,000,000 with an additional uncommitted amount of $100,000,000. The commitment fee is an annual rate of 0.15% of the average commitment amount payable quarterly, regardless of usage, to State Street, who serves as the agent to the syndicate. The commitment fee is allocated among the Fund and certain other funds managed by New York Life Investments based upon their respective net assets and other factors. Interest on any revolving credit loan is charged based upon the Federal Funds Rate or the one-month LIBOR, whichever is higher. The Credit Agreement expires on July 31, 2018, although the Fund, certain other funds managed by New York Life Investments and the syndicate of banks may renew the Credit Agreement for an additional year on the same or different terms. Prior to August 1, 2017, the aggregate commitment amount and commitment fee of the previous credit agreement were the same as those under the Credit Agreement, but Bank of New York Mellon served as agent to the syndicate. During the year ended October 31, 2017, there were no borrowings made or outstanding with respect to the Fund under the Credit Agreement or the credit agreement for which Bank of New York Mellon served as agent.
Note 7–Interfund Lending Program
Pursuant to an exemptive order issued by the SEC, the Fund, along with certain other funds managed by New York Life Investments, may participate in an interfund lending program. The interfund lending program provides an alternative credit facility that permits the Fund and certain other funds managed by New York Life Investments to lend or borrow money for temporary purposes directly to or from one another subject to the conditions of the exemptive order. During the year ended October 31, 2017, there were no interfund loans made or outstanding with respect to the Fund.
Note 8–Purchases and Sales of Securities (in 000’s)
During the year ended October 31, 2017, purchases and sales of securities, other than short-term securities, were $1,973,057 and $1,559,945, respectively.
The Fund may purchase securities from or sell to other funds managed by the Subadvisor. These interportfolio transactions are primarily used for cash management purposes and are made pursuant to Rule 17a-7 of the 1940 Act. During the year ended October 31, 2017, such purchases were $2,951.
| | |
| 42 | | MainStay Tax Free Bond Fund |
Note 9–Capital Share Transactions
| | | | | | | | |
Class A | | Shares | | | Amount | |
Year ended October 31, 2017: | | | | | | | | |
Shares sold | | | 93,905,339 | | | $ | 927,816,118 | |
Shares issued to shareholders in reinvestment of dividends and distributions | | | 3,579,232 | | | | 35,533,565 | |
Shares redeemed | | | (62,891,318 | ) | | | (620,153,547 | ) |
| | | | | | | | |
Net increase (decrease) in shares outstanding before conversion | | | 34,593,253 | | | | 343,196,136 | |
Shares converted into Class A (See Note 1) | | | 763,453 | | | | 7,658,645 | |
Shares converted from Class A (See Note 1) | | | (1,712,364 | ) | | | (16,828,308 | ) |
| | | | | | | | |
Net increase (decrease) | | | 33,644,342 | | | $ | 334,026,473 | |
| | | | | | | | |
Year ended October 31, 2016: | | | | | | | | |
Shares sold | | | 70,104,399 | | | $ | 718,773,459 | |
Shares issued to shareholders in reinvestment of dividends and distributions | | | 2,323,481 | | | | 23,781,700 | |
Shares redeemed | | | (26,748,385 | ) | | | (273,435,455 | ) |
| | | | | | | | |
Net increase (decrease) in shares outstanding before conversion | | | 45,679,495 | | | | 469,119,704 | |
Shares converted into Class A (See Note 1) | | | 389,062 | | | | 3,980,913 | |
Shares converted from Class A (See Note 1) | | | (178,665 | ) | | | (1,844,440 | ) |
| | | | | | | | |
Net increase (decrease) | | | 45,889,892 | | | $ | 471,256,177 | |
| | | | | | | | |
| | |
| | | | | | | | |
Investor Class | | Shares | | | Amount | |
Year ended October 31, 2017: | | | | | | | | |
Shares sold | | | 196,152 | | | $ | 1,957,547 | |
Shares issued to shareholders in reinvestment of dividends and distributions | | | 42,322 | | | | 421,396 | |
Shares redeemed | | | (171,826 | ) | | | (1,712,187 | ) |
| | | | | | | | |
Net increase (decrease) in shares outstanding before conversion | | | 66,648 | | | | 666,756 | |
Shares converted into Investor Class (See Note 1) | | | 93,929 | | | | 931,126 | |
Shares converted from Investor Class (See Note 1) | | | (743,260 | ) | | | (7,495,883 | ) |
| | | | | | | | |
Net increase (decrease) | | | (582,683 | ) | | $ | (5,898,001 | ) |
| | | | | | | | |
Year ended October 31, 2016: | | | | | | | | |
Shares sold | | | 298,750 | | | $ | 3,069,918 | |
Shares issued to shareholders in reinvestment of dividends and distributions | | | 45,201 | | | | 463,700 | |
Shares redeemed | | | (167,244 | ) | | | (1,712,234 | ) |
| | | | | | | | |
Net increase (decrease) in shares outstanding before conversion | | | 176,707 | | | | 1,821,384 | |
Shares converted into Investor Class (See Note 1) | | | 64,521 | | | | 663,592 | |
Shares converted from Investor Class (See Note 1) | | | (373,924 | ) | | | (3,842,733 | ) |
| | | | | | | | |
Net increase (decrease) | | | (132,696 | ) | | $ | (1,357,757 | ) |
| | | | | | | | |
| | |
| | | | | | | | |
| | | | | | | | |
Class B | | Shares | | | Amount | |
Year ended October 31, 2017: | | | | | | | | |
Shares sold | | | 165,734 | | | $ | 1,630,271 | |
Shares issued to shareholders in reinvestment of dividends and distributions | | | 48,735 | | | | 483,079 | |
Shares redeemed | | | (377,160 | ) | | | (3,748,282 | ) |
| | | | | | | | |
Net increase (decrease) in shares outstanding before conversion | | | (162,691 | ) | | | (1,634,932 | ) |
Shares converted from Class B (See Note 1) | | | (30,900 | ) | | | (304,987 | ) |
| | | | | | | | |
Net increase (decrease) | | | (193,591 | ) | | $ | (1,939,919 | ) |
| | | | | | | | |
Year ended October 31, 2016: | | | | | | | | |
Shares sold | | | 630,080 | | | $ | 6,448,957 | |
Shares issued to shareholders in reinvestment of dividends and distributions | | | 45,024 | | | | 459,842 | |
Shares redeemed | | | (446,357 | ) | | | (4,581,911 | ) |
| | | | | | | | |
Net increase (decrease) in shares outstanding before conversion | | | 228,747 | | | | 2,326,888 | |
Shares converted from Class B (See Note 1) | | | (24,509 | ) | | | (250,623 | ) |
| | | | | | | | |
Net increase (decrease) | | | 204,238 | | | $ | 2,076,265 | |
| | | | | | | | |
| | |
| | | | | | | | |
Class C | | Shares | | | Amount | |
Year ended October 31, 2017: | | | | | | | | |
Shares sold | | | 4,227,857 | | | $ | 41,961,057 | |
Shares issued to shareholders in reinvestment of dividends and distributions | | | 534,813 | | | | 5,304,569 | |
Shares redeemed | | | (7,501,945 | ) | | | (74,279,922 | ) |
| | | | | | | | |
Net increase (decrease) | | | (2,739,275 | ) | | $ | (27,014,296 | ) |
| | | | | | | | |
Year ended October 31, 2016: | | | | | | | | |
Shares sold | | | 10,920,726 | | | $ | 111,687,557 | |
Shares issued to shareholders in reinvestment of dividends and distributions | | | 452,436 | | | | 4,629,198 | |
Shares redeemed | | | (3,007,809 | ) | | | (30,750,636 | ) |
| | | | | | | | |
Net increase (decrease) in shares outstanding before conversion | | | 8,365,353 | | | | 85,566,119 | |
Shares converted from Class C (See Note 1) | | | (3,327 | ) | | | (34,435 | ) |
| | | | | | | | |
Net increase (decrease) | | | 8,362,026 | | | $ | 85,531,684 | |
| | | | | | | | |
| | |
| | | | | | | | |
Notes to Financial Statements (continued)
| | | | | | | | |
Class I | | Shares | | | Amount | |
Year ended October 31, 2017: | | | | | | | | |
Shares sold | | | 52,446,921 | | | $ | 519,691,483 | |
Shares issued to shareholders in reinvestment of dividends and distributions | | | 1,590,436 | | | | 15,794,037 | |
Shares redeemed | | | (42,229,809 | ) | | | (416,906,143 | ) |
| | | | | | | | |
Net increase (decrease) in shares outstanding before conversion | | | 11,807,548 | | | | 118,579,377 | |
Shares converted into Class I (See Note 1) | | | 1,632,319 | | | | 16,039,407 | |
| | | | | | | | |
Net increase (decrease) | | | 13,439,867 | | | $ | 134,618,784 | |
| | | | | | | | |
Year ended October 31, 2016 : | | | | | | | | |
Shares sold | | | 48,954,715 | | | $ | 500,987,725 | |
Shares issued to shareholders in reinvestment of dividends and distributions | | | 1,130,288 | | | | 11,574,515 | |
Shares redeemed | | | (13,682,575 | ) | | | (140,262,947 | ) |
| | | | | | | | |
Net increase (decrease) in shares outstanding before conversion | | | 36,402,428 | | | | 372,299,293 | |
Shares converted into Class I (See Note 1) | | | 128,216 | | | | 1,327,726 | |
| | | | | | | | |
Net increase (decrease) | | | 36,530,644 | | | $ | 373,627,019 | |
| | | | | | | | |
Note 10–Subsequent Events
In connection with the preparation of the financial statements of the Fund as of and for the year ended October 31, 2017, events and transactions subsequent to October 31, 2017, through the date the financial statements were issued have been evaluated by the Fund’s management for possible adjustment and/or disclosure. No subsequent events requiring financial statement adjustment or disclosure have been identified.
| | |
| 44 | | MainStay Tax Free Bond Fund |
Report of Independent Registered Public Accounting Firm
The Board of Trustees and Shareholders of
The MainStay Funds:
We have audited the accompanying statement of assets and liabilities, including the portfolio of investments, of MainStay Tax Free Bond Fund (the “Fund”), one of the funds constituting The MainStay Funds, as of October 31, 2017, and the related statement of operations for the year then ended, the statements of changes in net assets for each of the years in the two-year period then ended, and the financial highlights for each of the years in the five-year period then ended. These financial statements and financial highlights are the responsibility of the Fund’s management. Our responsibility is to express an opinion on these financial statements and financial highlights based on our audits.
We conducted our audits in accordance with the standards of the Public Company Accounting Oversight Board (United States). Those standards require that we plan and perform the audit to obtain reasonable assurance about whether the financial statements and financial highlights are free of material misstatement. An audit includes examining, on a test basis, evidence supporting the amounts and disclosures in the financial statements. Our procedures included confirmation of securities owned as of October 31, 2017, by correspondence with the custodian and brokers or by other appropriate auditing procedures where replies from brokers were not received. An audit also includes assessing the accounting principles used and significant estimates made by management, as well as evaluating the overall financial statement presentation. We believe that our audits provide a reasonable basis for our opinion.
In our opinion, the financial statements and financial highlights referred to above present fairly, in all material respects, the financial position of MainStay Tax Free Bond Fund as of October 31, 2017, the results of its operations for the year then ended, the changes in its net assets for each of the years in the two-year period then ended, and the financial highlights for each of the years in the five-year period then ended, in conformity with U.S. generally accepted accounting principles.

Philadelphia, Pennsylvania
December 21, 2017
Other Matters
(Unaudited)
At a meeting held on June 22, 2017, the Board approved submitting the following proposal (“Proposal”) to shareholders of the Funds at a special meeting held on October 23, 2017 (with any postponements or adjournments, “Special Meeting”):
To elect eight Trustees to the Board.
On or about September 28, 2017, shareholders of record of the Funds as of the close of business on August 24, 2017 were sent a proxy statement containing information regarding the Proposal. The proxy statement also included information about the Special Meeting, at which shareholders of the Funds were asked to consider and approve the Proposal. In addition, the proxy statement included information about voting on the Proposal and options shareholders had to do so.
The Special Meeting was held on October 23, 2017, and the Proposal passed.
The results of the Special Meeting (all Funds and classes thereof voting together) were as follows:
Proposal—To elect eight Trustees to the Board:
Yie-Hsin Hung:
| | | | | | | | |
Votes
For | | Votes
Witheld | | | Total | |
| 2,644,056,263.750 | | | 21,799,781.292 | | | | 2,665,856,045.042 | |
David H. Chow:
| | | | | | | | |
Votes
For | | Votes
Witheld | | | Total | |
| 2,644,576,776.557 | | | 21,279,268.485 | | | | 2,665,856,045.042 | |
Susan B. Kerley:
| | | | | | | | |
Votes
For | | Votes
Witheld | | | Total | |
| 2,645,459,747.343 | | | 20,396,297.699 | | | | 2,665,856,045.042 | |
Alan R. Latshaw:
| | | | | | | | |
Votes
For | | Votes
Witheld | | | Total | |
| 2,644,443,039.401 | | | 21,413,005.641 | | | | 2,665,856,045.042 | |
Peter Meenan:
| | | | | | | | |
Votes
For | | Votes
Witheld | | | Total | |
| 2,640,156,421.578 | | | 25,699,623.464 | | | | 2,665,856,045.042 | |
Richard H. Nolan, Jr.:
| | | | | | | | |
Votes
For | | Votes
Witheld | | | Total | |
| 2,641,415,514.849 | | | 24,440,530.193 | | | | 2,665,856,045.042 | |
Jacques P. Perold:
| | | | | | | | |
Votes
For | | Votes
Witheld | | | Total | |
| 2,645,300,993.731 | | | 20,555,051.311 | | | | 2,665,856,045.042 | |
Richard S. Trutanic:
| | | | | | | | |
Votes
For | | Votes
Witheld | | | Total | |
| 2,641,761,336.311 | | | 24,094,708.731 | | | | 2,665,856,045.042 | |
Federal Income Tax Information
(Unaudited)
The Fund is required under the Internal Revenue Code to advise shareholders in a written statement as to the federal tax status of dividends paid by the Fund during such fiscal years.
For individual federal income tax purposes, the Fund designated 99.5% of the ordinary income dividends paid during the fiscal year ended October 31, 2017 as attributable to interest income from tax exempt municipal bonds. Such dividends are currently exempt from federal income taxes under Section 103 (a) of the Internal Revenue Code.
In February 2018, shareholders will receive an IRS Form 1099-DIV or substitute Form 1099, which will show the federal tax status of the distributions received by shareholders in calendar year 2017. The amounts that will be reported on such 1099-DIV or substitute Form 1099 will be the amounts you are to use on your federal income tax return and will differ from the amounts which we must report for the Fund’s fiscal year end October 31, 2017.
Proxy Voting Policies and Procedures and Proxy Voting Record
A description of the policies and procedures that New York Life Investments uses to vote proxies related to the Fund’s securities is available without charge, upon request, (i) by visiting the MainStay Funds’ website at mainstayinvestments.com; and (ii) on the Securities and Exchange Commission’s (“SEC”) website at www.sec.gov.
The Fund is required to file with the SEC its proxy voting records for the Fund for the 12-month period ending June 30 on Form N-PX. The most recent Form N-PX or proxy voting record is available free of charge upon request by calling 800-MAINSTAY (624-6782); visiting the MainStay Funds’ website at mainstayinvestments.com; or on the SEC’s website at www.sec.gov.
Shareholder Reports and Quarterly Portfolio Disclosure
The Fund is required to file its complete schedule of portfolio holdings with the SEC for its first and third fiscal quarters on Form N-Q. The Fund’s Form N-Q is available without charge, on the SEC’s website at www.sec.gov or by calling MainStay Investments at 800-MAINSTAY (624-6782). You also can obtain and review copies of Form N-Q by visiting the SEC’s Public Reference Room in Washington, DC (information on the operation of the Public Reference Room may be obtained by calling 1-800-SEC-0330).
| | |
| 46 | | MainStay Tax Free Bond Fund |
Board of Trustees and Officers (Unaudited)
The Trustees and officers of the Funds are listed below. The Board oversees the MainStay Group of Funds (which consists of The MainStay Funds and MainStay Funds Trust), MainStay VP Funds Trust, MainStay DefinedTerm Municipal Opportunities Fund, the Manager and the Subadvisors, and elects the officers of the Funds who are responsible for the day-to-day operations of the Funds. Information pertaining to the Trustees and officers is set forth below. Each Trustee serves until his or her successor is elected and qualified or until his or her resignation, death or removal. Under the Board’s retirement policy, unless an exception is made, a Trustee must tender his or her resignation by the
end of the calendar year during which he or she reaches the age of 75. Mr. Meenan reached the age of 75 during the calendar year 2016, and his term was extended for one additional year. Accordingly, Mr. Meenan is expected to serve until the end of calendar year 2017, at which time he intends to retire. Officers are elected annually by the Board. The business address of each Trustee and officer listed below is 51 Madison Avenue, New York, New York 10010. A majority of the Trustees are not “interested persons” (as defined by the 1940 Act and rules adopted by the SEC thereunder) of the Fund (“Independent Trustees”).
| | | | | | | | | | | | |
| | | | | Name and Date of Birth | | Term of Office, Position(s) Held and Length of Service | | Principal Occupation(s) During Past Five Years | | Number of
Portfolios in
the MainStay
Group of Funds
Overseen by
Trustee | | Other Directorships Held by Trustee |
| Interested Trustee | | | | Yie-Hsin Hung* 8/12/62 | | The MainStay Funds: Trustee since January 2017; MainStay Funds Trust: Trustee since January 2017. | | Senior Vice President of New York Life since joining in 2010, Member of the Executive Management Committee since January 1, 2017, Chief Executive Officer, New York Life Investment Management Holdings LLC & New York Life Investment Management LLC since May 2015. Senior Managing Director and Co-President of New York Life Investment Management LLC from January 2014 to May 2015. Previously held positions of increasing responsibility, including head of NYLIM International, Alternative Growth Businesses, and Institutional investments since joining New York Life in 2010. | | 82 | | None |
| | * | This Trustee is considered to be an “interested person” of the MainStay Group of Funds, MainStay VP Funds Trust and MainStay DefinedTerm Municipal Opportunities Fund, within the meaning of the 1940 Act because of her affiliation with New York Life Insurance Company, New York Life Investment Management LLC, Candriam Belgium, Candriam France S.A.S., Cornerstone Capital Management Holdings LLC, MacKay Shields LLC, NYL Investors LLC, NYLIFE Securities LLC and/or NYLIFE Distributors LLC, as described in detail above in the column entitled “Principal Occupation(s) During Past Five Years.” |
| | | | | | | | | | | | |
| | | | | Name and Date of Birth | | Term of Office, Position(s) Held and Length of Service | | Principal Occupation(s) During Past Five Years | | Number of
Portfolios in
the MainStay
Group of Funds
Overseen by
Trustee | | Other Directorships Held by Trustee |
| Independent Trustees | | | | David H. Chow 12/29/57 | | The MainStay Funds: Trustee since January 2016, Advisory Board Member (June 2015 to December 2015); MainStay Funds Trust: Trustee since January 2016, Advisory Board Member (June 2015 to December 2015). | | Founder and CEO, DanCourt Management, LLC (since 1999) | | 82 | | VanEck Vectors Group of Exchange-Traded Funds: Independent Chairman of the Board of Trustees since 2008 and Trustee since 2006 (57 portfolios); and
Berea College of Kentucky: Trustee since 2009. |
| | | | Susan B. Kerley 8/12/51 | | The MainStay Funds: Chairman since January 2017 and Trustee since 2007; MainStay Funds Trust: Chairman since January 2017 and Trustee since 1990.** | | President, Strategic Management Advisors LLC (since 1990) | | 82 | | Legg Mason Partners Funds: Trustee since 1991 (54 portfolios). |
| | | | Alan R. Latshaw 3/27/51 | | The MainStay Funds: Trustee and Audit Committee Financial Expert since 2006; MainStay Funds Trust: Trustee and Audit Committee Financial Expert since 2007.** | | Retired; Partner, Ernst & Young LLP (2002 to 2003); Partner, Arthur Andersen LLP (1989 to 2002); Consultant to the MainStay Funds Audit and Compliance Committee (2004 to 2006) | | 82 | | State Farm Associates Funds Trusts: Trustee since 2005 (4 portfolios);
State Farm Mutual Fund Trust: Trustee since 2005 (15 portfolios); and
State Farm Variable Product Trust: Trustee since 2005 (9 portfolios). |
| | | | Peter Meenan 12/5/41 | | The MainStay Funds: Trustee since 2007; MainStay Funds Trust: Trustee since 2002.** | | Retired; Independent Consultant (2004 to 2013); President and Chief Executive Officer, Babson—United, Inc. (financial services firm) (2000 to 2004); Independent Consultant (1999 to 2000); Head of Global Funds, Citicorp (1995 to 1999) | | 82 | | None |
| | | | Richard H. Nolan, Jr. 11/16/46 | | The MainStay Funds: Trustee since 2007; MainStay Funds Trust: Trustee since 2007.** | | Managing Director, ICC Capital Management (since 2004); President—Shields/Alliance, Alliance Capital Management (1994 to 2004) | | 82 | | None |
| | | | Jacques P. Perold 5/12/58 | | The MainStay Funds: Trustee since January 2016, Advisory Board Member (June 2015 to December 2015); MainStay Funds Trust: Trustee since January 2016, Advisory Board Member (June 2015 to December 2015). | | Retired; President, Fidelity Management & Research Company (2009 to 2014); Founder, President and Chief Executive Officer, Geode Capital Management, LCC (2001 to 2009) | | 82 | | Allstate Corporation: Director since 2015; MSCI, Inc. Director since March 2017 and
Boston University: Trustee since 2014. |
| | | | Richard S. Trutanic 2/13/52 | | The MainStay Funds: Trustee since 1994; MainStay Funds Trust: Trustee since 2007.** | | Chairman and Chief Executive Officer, Somerset & Company (financial advisory firm) (since 2004); Managing Director, The Carlyle Group (private investment firm) (2002 to 2004); Senior Managing Director, Partner and Board Member, Groupe Arnault S.A. (private investment firm) (1999 to 2002) | | 82 | | None |
| | ** | Includes prior service as a Director/Trustee of certain predecessor entities to MainStay Funds Trust. |
| | |
| 48 | | MainStay Tax Free Bond Fund |
| | | | | | | | |
| | | | | Name and Date of Birth | | Position(s) Held and Length of Service | | Principal Occupation(s) During Past Five Years |
Officers of the Trust (Who are not Trustees)* | | | | Kirk C. Lehneis 6/29/74 | | President, The MainStay Funds, MainStay Funds Trust (since September 2017) | | Chief Operating Officer and Senior Managing Director (since 2016), New York Life Investment Management LLC; Chairman of the Board (since September 2017), NYLIFE Distributors LLC; Chairman of the Board, NYLIM Service Company LLC (since September 2017); President, MainStay DefinedTerm Municipal Opportunities Fund and MainStay VP Funds Trust (since September 2017); Senior Managing Director, Global Product Development (From March 2015—May 2016); Managing Director, Product Development (From March 2010—February 2015) |
| | | | Jack R. Benintende 5/12/64 | | Treasurer and Principal Financial and Accounting Officer, The MainStay Funds (since 2007), MainStay Funds Trust (since 2009) | | Managing Director, New York Life Investment Management LLC (since 2007); Treasurer and Principal Financial and Accounting Officer, MainStay DefinedTerm Municipal Opportunities Fund (since 2011) and MainStay VP Funds Trust (since 2007)**; and Assistant Treasurer, New York Life Investment Management Holdings LLC (2008 to 2012) |
| | | | Kevin M. Bopp 2/24/69 | | Vice President and Chief Compliance Officer, The MainStay Funds and MainStay Funds Trust (since 2014) | | Chief Compliance Officer, New York Life Investment Management LLC, IndexIQ ETF (since January 2016), Director and Associate General Counsel (2011 to 2014) and Vice President and Assistant General Counsel (2010 to 2011), New York Life Investment Management LLC; Vice President and ChiefCompliance Officer, MainStay VP Funds Trust, MainStay DefinedTerm Municipal Opportunities Fund (since 2014); Assistant Secretary, MainStay Funds, MainStay Funds Trust and MainStay VP Funds Trust (2010 to 2014)**, MainStay DefinedTerm Municipal Opportunities Fund (2011 to 2014) |
| | | | J. Kevin Gao 10/13/67 | | Secretary and Chief Legal Officer, The MainStay Funds and MainStay Funds Trust (since 2010) | | Managing Director and Associate General Counsel, New York Life Investment Management LLC (since 2010); Secretary and Chief Legal Officer, MainStay DefinedTerm Municipal Opportunities Fund (since 2011) and MainStay VP Funds Trust (since 2010)** |
| | | | Scott T. Harrington 2/8/59 | | Vice President—Administration, The MainStay Funds (since 2005), MainStay Funds Trust (since 2009) | | Director, New York Life Investment Management LLC (including predecessor advisory organizations) (since 2000); Member of the Board of Directors, New York Life Trust Company (since 2009); Vice President—Administration, MainStay DefinedTerm Municipal Opportunities Fund (since 2011) and MainStay VP Funds Trust (since 2005)** |
| | * | The officers listed above are considered to be “interested persons” of the MainStay Group of Funds, MainStay VP Funds Trust and MainStay Defined Term Municipal Opportunities Fund within the meaning of the 1940 Act because of their affiliation with the MainStay Group of Funds, New York Life Insurance Company and/or its affiliates, including New York Life Investment Management LLC, NYLIM Service Company LLC, NYLIFE Securities LLC and/or NYLIFE Distributors LLC, as described in detail in the column captioned “Principal Occupation(s) During Past Five Years.” Officers are elected annually by the Board. |
| | ** | Includes prior service as an officer of MainStay VP Series Fund, Inc., the predecessor to MainStay VP Funds Trust. |
This page intentionally left blank
MainStay Funds
Equity
U.S. Equity
MainStay Common Stock Fund
MainStay Cornerstone Growth Fund
MainStay Epoch U.S. All Cap Fund
MainStay Epoch U.S. Equity Yield Fund
MainStay Epoch U.S. Small Cap Fund
MainStay Large Cap Growth Fund
MainStay MAP Equity Fund
MainStay S&P 500 Index Fund
MainStay U.S. Equity Opportunities Fund
International/Global Equity
MainStay Candriam Emerging Markets Equity Fund
MainStay Emerging Markets Equity Fund
MainStay Epoch Capital Growth Fund
MainStay Epoch Global Choice Fund
MainStay Epoch Global Equity Yield Fund
MainStay Epoch International Choice Fund
MainStay Epoch International Small Cap Fund
MainStay International Equity Fund
MainStay International Opportunities Fund
Income
Taxable Bond
MainStay Emerging Markets Debt Fund
MainStay Floating Rate Fund
MainStay Government Fund
MainStay High Yield Corporate Bond Fund
MainStay Indexed Bond Fund
MainStay Short Duration High Yield Fund
MainStay Total Return Bond Fund
MainStay Unconstrained Bond Fund
Municipal/Tax Advantaged Bond
MainStay California Tax Free Opportunities Fund1
MainStay High Yield Municipal Bond Fund
MainStay New York Tax Free Opportunities Fund2
MainStay Tax Advantaged Short Term Bond Fund
MainStay Tax Free Bond Fund
Money Market
MainStay Money Market Fund
Mixed Asset
MainStay Balanced Fund
MainStay Convertible Fund
MainStay Income Builder Fund
Alternative
MainStay Absolute Return Multi-Strategy Fund
MainStay Cushing Energy Income Fund
MainStay Cushing MLP Premier Fund
MainStay Cushing Renaissance Advantage Fund
Asset Allocation/Target Date
MainStay Conservative Allocation Fund
MainStay Growth Allocation Fund
MainStay Moderate Allocation Fund
MainStay Moderate Growth Allocation Fund
MainStay Retirement 2010 Fund
MainStay Retirement 2020 Fund
MainStay Retirement 2030 Fund
MainStay Retirement 2040 Fund
MainStay Retirement 2050 Fund
MainStay Retirement 2060 Fund
Manager
New York Life Investment Management LLC
New York, New York
Subadvisors
Candriam Belgium S.A.3
Brussels, Belgium
Candriam France S.A.S.3
Paris, France
Cornerstone Capital Management Holdings LLC3
New York, New York
Cushing Asset Management, LP
Dallas, Texas
Epoch Investment Partners, Inc.
New York, New York
MacKay Shields LLC3
New York, New York
Markston International LLC
White Plains, New York
NYL Investors LLC3
New York, New York
Winslow Capital Management, LLC
Minneapolis, Minnesota
Legal Counsel
Dechert LLP
Washington, District of Columbia
Independent Registered Public Accounting Firm
KPMG LLP
Philadelphia, Pennsylvania
1. Class A and Class I shares of this Fund are registered for sale in AZ, CA, MI, NV, OR, TX, UT and WA. Class I shares are registered for sale in CO, FL, GA, HI, ID, MA, MD, NH, NJ and NY.
2. This Fund is registered for sale in CA, CT, DE, FL, MA, NJ, NY and VT.
3. An affiliate of New York Life Investment Management LLC.
Not part of the Annual Report
For more information
800-MAINSTAY (624-6782)
mainstayinvestments.com
MainStay Investments® is a registered service mark and name under which New York Life Investment Management LLC does business. MainStay Investments, an indirect subsidiary of New York Life Insurance Company, New York, NY 10010, provides investment advisory products and services. The MainStay Funds® are managed by New York Life Investment Management LLC and distributed by NYLIFE Distributors LLC, 30 Hudson Street, Jersey City, NJ 07302, a wholly owned subsidiary of New York Life Insurance Company. NYLIFE Distributors LLC is a Member FINRA/SIPC.
©2017 NYLIFE Distributors LLC. All rights reserved.
| | | | | | | | |
| Not FDIC/NCUA Insured | | Not a Deposit | | May Lose Value | | No Bank Guarantee | | Not Insured by Any Government Agency |
| | |
| 1716275 MS286-17 | | MST11-12/17 (NYLIM) NL215 |
MainStay Convertible Fund
Message from the President and Annual Report
October 31, 2017


This page intentionally left blank
Message from the President
The 12 months ended October 31, 2017, brought strong performance to equity markets in the United States and abroad.
According to FTSE-Russell data for the U.S. market, stocks at all capitalization levels earned solid double-digit overall returns during the reporting period. Total returns for stocks in general exceeded 20% at all capitalization levels. Growth stocks were particularly strong, outperforming value stocks for companies of all sizes except among microcaps, where value stocks outperformed growth stocks.
Several factors contributed to the strength of domestic and international stock markets during the reporting period. Following the U.S. presidential election in November 2016, many investors looked forward to business tax incentives and possible tax cuts for consumers that could stimulate economic growth. During the reporting period, corporate earnings reports remained strong; and growth in U.S. real gross domestic product remained positive, with a substantial advance during the second quarter of 2017. Developed international markets and emerging markets were also strong, boosted by positive macroeconomic data and growing confidence that Europe was well on its way to financial recovery. Despite wide variations among emerging markets, many saw strong appreciation in local-currency terms and benefited from a weaker U.S. dollar.
During the reporting period, the Federal Open Market Committee raised the federal funds target range three times—in December of 2016 and in March and June of 2017. These incremental increases raised the federal funds target range to 1.00% to 1.25% by the end of the reporting period. These tightening moves were followed by higher U.S. Treasury yields at all maturities, with the greatest increases at the short-end of the maturity spectrum.
As interest rates rise, bond prices tend to decline (and vice versa). As a result, some portions of the U.S. Treasury market recorded negative total returns during the reporting period. Agency securities posted small but positive total returns, as did
asset-backed and mortgage-backed securities. Other bond categories, particularly those with looser ties to U.S. interest rates, did considerably better. Emerging-market debt recorded solid single-digit returns; high-yield bonds were generally stronger; and convertible bonds, which are closely tied to the performance of underlying stocks, provided some of the strongest overall returns of any fixed-income sector during the reporting period.
At MainStay, we have always encouraged investors to diversify their investments and maintain a long-term perspective, even when markets are strong. Asset classes that perform well in one environment may perform differently in another; and in today’s ever-changing world, wide market swings are not unknown.
MainStay offers Funds with a wide array of investment objectives to help our shareholders pursue the appropriate diversification for their long-range financial goals. We also offer several investment boutiques, allowing our shareholders to choose the style—or mix of styles—that’s best suited to their investment needs. We believe that relatively few individual investors can match the level of professional experience and market insight that our portfolio managers provide.
The report that follows provides more detailed information on the specific markets, investment strategies and portfolio decisions that affected your MainStay Fund during the 12 months ended October 31, 2017. We encourage you to read the report carefully and use it to help you evaluate your progress toward your financial goals.
Sincerely,

Kirk C. Lehneis
President
The opinions expressed are as of the date of this report and are subject to change. There is no guarantee that any forecast made will come to pass. This material does not constitute investment advice and is not intended as an endorsement of any specific investment. Past performance is no guarantee of future results.
Not part of the Annual Report
Table of Contents
Investors should refer to the Fund’s Summary Prospectus and/or Prospectus and consider the Fund’s investment objectives, strategies, risks, charges and expenses carefully before investing. The Summary Prospectus and/or Prospectus contain this and other information about the Fund. You may obtain copies of the Fund’s Summary Prospectus, Prospectus and Statement of Additional Information free of charge, upon request, by calling toll-free 800-MAINSTAY (624-6782), by writing to NYLIFE Distributors LLC, Attn: MainStay Marketing Department, 30 Hudson Street, Jersey City, NJ 07302 or by sending an e-mail to MainStayShareholderServices@nylim.com. These documents are also available via the MainStay Funds’ website at mainstayinvestments.com/documents. Please read the Summary Prospectus and/or Prospectus carefully before investing.
Investment and Performance Comparison1 (Unaudited)
Performance data quoted represents past performance. Past performance is no guarantee of future results. Because of market volatility and other factors, current performance may be lower or higher than the figures shown. Investment return and principal value will fluctuate, and as a result, when shares are redeemed, they may be worth more or less than their original cost. The graph below depicts the historical performance of Class B shares2 of the Fund. Performance will vary from class to class based on differences in class-specific expenses and sales charges. For performance information current to the most recent month-end, please call 800-MAINSTAY (624-6782) or visit mainstayinvestments.com.
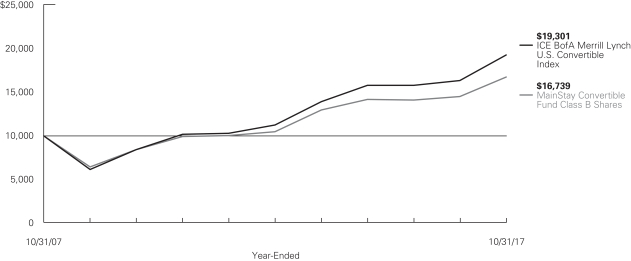
Average Annual Total Returns for the Year-Ended October 31, 2017
| | | | | | | | | | | | | | | | | | | | | | | | |
| Class | | Sales Charge | | | | Inception
Date | | | One
Year | | | Five
Years | | | Ten Years
or Since
Inception | | | Gross
Expense
Ratio3 | |
| Class A Shares | | Maximum 5.5% Initial Sales Charge | | With sales charges Excluding sales charges | | | 1/3/1995 | | |
| 9.90
16.30 | %
| |
| 9.57
10.82 | %
| |
| 5.67
6.27 | %
| |
| 1.01
1.01 | %
|
| Investor Class Shares | | Maximum 5.5% Initial Sales Charge | | With sales charges Excluding sales charges | | | 2/28/2008 | | |
| 9.72
16.11 |
| |
| 9.37
10.62 |
| |
| 6.25
6.87 |
| |
| 1.18
1.18 |
|
| Class B Shares2 | | Maximum 5% CDSC if Redeemed Within the First Six Years of Purchase | | With sales charges Excluding sales charges | | | 5/1/1986 | | |
| 10.21
15.21 |
| |
| 9.51
9.79 |
| |
| 5.29
5.29 |
| |
| 1.93
1.93 |
|
| Class C Shares | | Maximum 1% CDSC
if Redeemed Within One Year of Purchase | | With sales charges Excluding sales charges | | | 9/1/1998 | | |
| 14.23
15.23 |
| |
| 9.80
9.80 |
| |
| 5.29
5.29 |
| |
| 1.93
1.93 |
|
| Class I Shares | | No Sales Charge | | | | | 11/28/2008 | | | | 16.69 | | | | 11.12 | | | | 13.39 | | | | 0.76 | % |
| 1. | The performance table and graph do not reflect the deduction of taxes that a shareholder would pay on distributions or Fund share redemptions. Total returns reflect maximum applicable sales charges as indicated in the table above if any changes in share price, and reinvestment of dividend and capital gain distributions. The graph assumes the initial investment amount shown above and reflects the deduction of all sales charges that would have applied for the period of investment. Performance figures may reflect certain fee waivers and/or expense limitations, without which total returns may have |
| | been lower. For more information on share classes and current fee waivers and/or expense limitations (if any), please refer to the Notes to Financial Statements. |
| 2. | Class B shares are closed to all new purchases as well as additional investments by existing Class B shareholders. |
| 3. | The gross expense ratios presented reflect the Fund’s “Total Annual Fund Operating Expenses” from the most recent Prospectus and may differ from other expense ratios disclosed in this report. |
The footnotes on the next page are an integral part of the table and graph and should be carefully read in conjunction with them.
| | | | | | | | | | | | |
| Benchmark Performance | | One
Year | | | Five
Years | | | Ten Years
or Since
Inception | |
ICE BofA Merrill Lynch U.S. Convertible Index4 | | | 18.09 | % | | | 11.41 | % | | | 6.80 | % |
Morningstar Convertibles Category Average5 | | | 15.29 | | | | 9.02 | | | | 5.20 | |
| 4. | The ICE BofA Merrill Lynch U.S. Convertible Index is the Fund’s primary broad-based securities market index for comparison purposes. The ICE BofA Merrill Lynch U.S. Convertible Index is a market-capitalization weighted index of domestic corporate convertible securities. In order to be included in this Index, bonds and preferred stocks must be convertible only to common stock. Results assume reinvestment of all income and capital gains. An investment cannot be made directly in an index. |
| 5. | The Morningstar Convertibles Category Average is representative of funds that are designed to offer some of the capital-appreciation potential of stock portfolios while also supplying some of the safety and yield of bond portfolios. Results are based on average total returns of similar funds with all dividends and capital gain distributions reinvested. |
The footnotes on the preceding page are an integral part of the table and graph and should be carefully read in conjunction with them.
| | |
| 6 | | MainStay Convertible Fund |
Cost in Dollars of a $1,000 Investment in MainStay Convertible Fund (Unaudited)
The example below is intended to describe the fees and expenses borne by shareholders during the six-month period from May 1, 2017, to October 31, 2017, and the impact of those costs on your investment.
Example
As a shareholder of the Fund you incur two types of costs: (1) transaction costs, including exchange fees and sales charges (loads) on purchases (as applicable), and (2) ongoing costs, including management fees, distribution and/or service (12b-1) fees, and other Fund expenses (as applicable). This example is intended to help you understand your ongoing costs (in dollars) of investing in the Fund and to compare these costs with the ongoing costs of investing in other mutual funds. The example is based on an investment of $1,000 made at the beginning of the six-month period and held for the entire period from May 1, 2017, to October 31, 2017.
This example illustrates your Fund’s ongoing costs in two ways:
Actual Expenses
The second and third data columns in the table below provide information about actual account values and actual expenses. You may use the information in these columns, together with the amount you invested, to estimate the expenses that you paid during the six months ended October 31, 2017. Simply divide your account value by $1,000 (for example, an $8,600 account value divided by $1,000 = 8.6), then
multiply the result by the number under the heading entitled “Expenses Paid During Period” to estimate the expenses you paid on your account during this period.
Hypothetical Example for Comparison Purposes
The fourth and fifth data columns in the table below provide information about hypothetical account values and hypothetical expenses based on the Fund’s actual expense ratio and an assumed rate of return of 5% per year before expenses, which is not the Fund’s actual return. The hypothetical account values and expenses may not be used to estimate the actual ending account balances or expenses you paid for the six-month period shown. You may use this information to compare the ongoing costs of investing in the Fund with the ongoing costs of investing in other mutual funds. To do so, compare this 5% hypothetical example with the 5% hypothetical examples that appear in the shareholder reports of the other mutual funds.
Please note that the expenses shown in the table are meant to highlight your ongoing costs only and do not reflect any transactional costs, such as exchange fees or sales charges (loads). Therefore, the fourth and fifth data columns of the table are useful in comparing ongoing costs only and will not help you determine the relative total costs of owning different funds. In addition, if these transactional costs were included, your costs would have been higher.
| | | | | | | | | | | | | | | | | | | | | | |
| | | | | | | | | | | | | | | | | | |
| Share Class | | Beginning
Account
Value
5/1/17 | | | Ending Account
Value (Based
on Actual
Returns and
Expenses)
10/31/17 | | | Expenses
Paid
During
Period1 | | | Ending Account
Value (Based
on Hypothetical
5% Annualized
Return and
Actual Expenses)
10/31/17 | | | Expenses
Paid
During
Period1 | | | Net Expense
Ratio
During
Period2 |
| | | | | | |
| Class A Shares | | $ | 1,000.00 | | | $ | 1,047.40 | | | $ | 5.06 | | | $ | 1,020.30 | | | $ | 4.99 | | | 0.98% |
| | | | | | |
| Investor Class Shares | | $ | 1,000.00 | | | $ | 1,047.10 | | | $ | 5.88 | | | $ | 1,019.50 | | | $ | 5.80 | | | 1.14% |
| | | | | | |
| Class B Shares | | $ | 1,000.00 | | | $ | 1,042.70 | | | $ | 9.73 | | | $ | 1,015.70 | | | $ | 9.60 | | | 1.89% |
| | | | | | |
| Class C Shares | | $ | 1,000.00 | | | $ | 1,042.80 | | | $ | 9.73 | | | $ | 1,015.70 | | | $ | 9.60 | | | 1.89% |
| | | | | | |
| Class I Shares | | $ | 1,000.00 | | | $ | 1,049.70 | | | $ | 3.15 | | | $ | 1,022.10 | | | $ | 3.11 | | | 0.61% |
| 1. | Expenses are equal to the Fund’s annualized expense ratio of each class multiplied by the average account value over the period, divided by 365 and multiplied by 184 (to reflect the six-month period). The table above represents the actual expenses incurred during the six-month period. |
| 2. | Expenses are equal to the Fund’s annualized expense ratio to reflect the six-month period. |
Portfolio Composition as of October 31, 2017 (Unaudited)
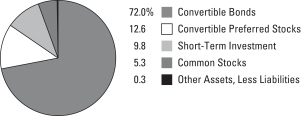
See Portfolio of Investments beginning on page 11 for specific holdings within these categories.
Top Ten Holdings or Issuers Held as of October 31, 2017 (excluding short-term investment) (Unaudited)
| 1. | Microchip Technology, Inc., 1.625%, due 2/15/25–2/15/27 |
| 2. | Priceline Group, Inc., 0.35%–1.00%, due 3/15/18–6/15/20 |
| 3. | DISH Network Corp., 3.375%, due 8/15/26 |
| 4. | Lam Research Corp., 1.25%, due 5/15/18 |
| 5. | Danaher Corp., (zero coupon), due 1/22/21 |
| 7. | Weatherford International, Ltd., 5.875%, due 7/1/21 |
| 8. | Liberty Media Corp., 1.00%–1.375%, due 1/30/23–10/15/23 |
| 9. | Air Lease Corp., 3.875%, due 12/1/18 |
| 10. | Lumentum Holdings, Inc., 0.25%, due 3/15/24 |
| | |
| 8 | | MainStay Convertible Fund |
Portfolio Management Discussion and Analysis (Unaudited)
Questions answered by portfolio manager Edward Silverstein, CFA, of MacKay Shields LLC, the Fund’s Subadvisor.
How did MainStay Convertible Fund perform relative to its primary benchmark and peers during the 12 months ended October 31, 2017?
Excluding all sales charges, MainStay Convertible Fund returned 16.30% for Class A shares, 16.11% for Investor Class shares, 15.21% for Class B shares and 15.23% for Class C shares for the 12 months ended October 31, 2017. Over the same period, Class I shares returned 16.69%. During the reporting period, all share classes underperformed the 18.09% return of the ICE BofA Merrill Lynch U.S. Convertible Index,1 which is the Fund’s broad-based securities-market index. During the 12 months ended October 31, 2017, Class A, Investor Class and Class I shares outperformed—and Class B and Class C shares underperformed—the 15.29% return of the Morningstar Convertibles Category Average.2 See page 5 for Fund returns with applicable sales charges.
What factors affected the Fund’s relative performance during the reporting period?
The Fund’s performance lagged that of the ICE BofA Merrill Lynch U.S. Convertible Index during the reporting period but performed roughly in line with its Morningstar peers. The Fund’s performance relative to the ICE BofA Merrill Lynch U.S. Convertible Index was aided by several large outperformers, such as XPO Logistics, Lam Research, Microchip Technology and Teleflex. This positive performance, however, was offset by several poor performers in the health care and energy sectors, such as Teva Pharmaceutical, Depomed, AMAG Pharmaceuticals and Southwestern Energy.
What was the Fund’s duration3 during the reporting period?
Convertible bond prices tend to vary with changes in the price of the underlying equity security rather than with changes in interest rates. For this reason, duration does not guide our investment decisions regarding the Fund’s convertible security holdings. At the end of the reporting period, the effective duration of the Fund was 3.53 years.
During the reporting period, which sectors and securities were the strongest contributors to the Fund’s absolute performance and which were particularly weak?
The strongest contributions to absolute performance came from the information technology and transportation sectors. (Contributions take weightings and total returns into account.) The Fund had large gains in several information technology-related holdings. Convertible bonds of semiconductor chip
developers Lam Research and Microchip Technology were the Fund’s second- and third-best performers, respectively, in terms of dollars earned. Semiconductor companies generally reported better-than-expected sales and earnings because most of their end markets, including autos, gaming and emerging technologies (e.g. self-driving automobiles), remained strong during the reporting period. In the transportation sector, convertible bonds of logistics and trucking company XPO Logistics were the Fund’s best-performing holding during the reporting period. In addition, convertible bonds of Air Lease were a significant contributor to absolute performance. XPO Logistics was a standout performer after the company’s financial results allayed investor fears that the company was making too many acquisitions and taking on too much debt. Quarterly results released during the reporting period showed that the company was generating free cash flow, paying down debt and selling operations that were less desirable.
The biggest detractors from the Fund’s absolute performance came from the health care and energy sectors. Convertible securities of several health care–related companies were poor performers during the reporting period because of earnings misses. Convertible preferred shares of Teva Pharmaceutical and convertible bonds of specialty pharmaceutical companies Depomed and AMAG Pharmaceuticals were the Fund’s worst-performing securities during the reporting period. Teva Pharmaceutical declined after it was forced to lower earnings estimates for the year and the company fired its chief executive officer. Depomed’s value declined as it, too, missed earnings projections, as doctors were reluctant to prescribe its largest-selling product, which is an opioid that patients could potentially abuse. AMAG Pharmaceuticals declined after the company told investors that a product in development failed to meet expectations, news that was likely to affect the company’s future sales and profits. Convertible holdings of most of the Fund’s energy-related positions declined during the reporting period. This was largely correlated with the decline in the price of crude oil during the reporting period, as most energy companies suffer when crude oil prices decline. Synthetic convertible bonds of Schlumberger Ltd., convertible preferred shares of energy producer Southwestern Energy, and convertible bonds of energy services companies Helix Energy and Ensco were noteworthy detractors from the Fund’s absolute performance.
Did the Fund make any significant purchases or sales during the reporting period?
During the reporting period, noteworthy purchases included convertible bonds of satellite television provider DISH Networks. We believed that there could be material upside if the company
| 1. | See footnote on page 6 for more information on the ICE BofA Merrill Lynch U.S. Convertible Index. |
| 2. | See footnote on page 6 for more information on the Morningstar Convertibles Category Average. |
| 3. | Duration is a measure of the price sensitivity of a fixed-income investment to changes in interest rates. Duration is expressed as a number of years and is considered a more accurate sensitivity gauge than average maturity. |
could realize value for Dish Network’s wireless spectrum assets. We initiated a position in convertible bonds of Latin American e-commerce company MercadoLibre, as the company has increased sales and free cash flow at a rapid rate. We also increased the Fund’s position in convertible bonds of multinational oil and natural gas service company Weatherford International. We believed that the company’s new chief executive officer could streamline the company and better organize its disparate divisions. In addition, we believed that rising oil prices could provide a tailwind.
Meaningful sales during the reporting period included post-acute health care service provider HealthSouth. The company unexpectedly called its convertible bonds and converted them into cash and common shares during the reporting period. The common shares were sold from the Fund. Convertible preferred shares of food products company Tyson Foods matured in August 2017 and were converted into common shares of the issuer. The Fund later sold the common shares. Convertible bonds of Teleflex, a specialty medical device company, matured at the end of August 2017 and were converted into a combination of cash and common stock during the reporting period. The Fund continues to hold a position in the common shares of Teleflex.
How did the Fund’s sector weightings change during the reporting period?
During the reporting period, the Fund decreased its weighting in the consumer staples sector, which was primarily the result of
the conversion and sale of the Fund’s Tyson Food convertible preferred position. The Fund decreased its weighting in the health care sector as a result of the sale of poor performers such as AMAG Pharmaceuticals and Depomed and the maturity of the Fund’s Teleflex convertible bonds. The Fund decreased its weighting in the energy sector with the maturity of the Schlumberger synthetic convertible notes. The Fund increased its weighting in the financial sector, largely through the purchase of LendingTree convertible bonds and the purchase of convertible preferred securities of Bank of America and Wells Fargo. The Fund increased its weighting in the information technology sector, which was largely the result of market appreciation.
How was the Fund positioned at the end of the reporting period?
As of October 31, 2017, the Fund held overweight positions relative to the ICE BofA Merrill Lynch U.S. Convertible Index in the energy, industrial and information technology sectors. As of the same date, the Fund held underweight positions relative to the Index in the financials, utilities and consumer discretionary sectors. As of October 31, 2017, the Fund held neutrally weighted positions in the consumer staples, health care, materials and telecommunication services sectors.
The opinions expressed are those of the portfolio manager as of the date of this report and are subject to change. There is no guarantee that any forecasts will come to pass. This material does not constitute investment advice and is not intended as an endorsement of any specific investment.
| | |
| 10 | | MainStay Convertible Fund |
Portfolio of Investments October 31, 2017
| | | | | | | | |
| | | Principal
Amount | | | Value | |
Convertible Securities 84.6%† Convertible Bonds 72.0% | |
Auto Manufacturers 0.9% | |
Wabash National Corp.
3.375%, due 5/1/18 | | $ | 5,555,000 | | | $ | 10,814,891 | |
| | | | | | | | |
|
Biotechnology 3.9% | |
BioMarin Pharmaceutical, Inc.
0.75%, due 10/15/18 | | | 15,698,000 | | | | 16,630,069 | |
Illumina, Inc.
(zero coupon), due 6/15/19 | | | 4,300,000 | | | | 4,614,438 | |
0.50%, due 6/15/21 | | | 6,977,000 | | | | 8,045,353 | |
Intercept Pharmaceuticals, Inc.
3.25%, due 7/1/23 | | | 6,684,000 | | | | 5,251,117 | |
Ionis Pharmaceuticals, Inc.
1.00%, due 11/15/21 | | | 10,659,000 | | | | 12,024,684 | |
| | | | | | | | |
| | | | | | | 46,565,661 | |
| | | | | | | | |
Commercial Services 3.4% | |
Carriage Services, Inc.
2.75%, due 3/15/21 | | | 6,573,000 | | | | 8,298,412 | |
LendingTree, Inc.
0.625%, due 6/1/22 (a) | | | 7,865,000 | | | | 11,168,300 | |
Macquarie Infrastructure Corp.
2.875%, due 7/15/19 | | | 20,595,000 | | | | 21,753,469 | |
| | | | | | | | |
| | | | | | | 41,220,181 | |
| | | | | | | | |
Computers 1.9% | |
¨Lumentum Holdings, Inc.
0.25%, due 3/15/24 (a) | | | 17,615,000 | | | | 22,415,087 | |
| | | | | | | | |
| | |
Diversified Financial Services 3.2% | | | | | | | | |
¨Air Lease Corp.
3.875%, due 12/1/18 | | | 15,781,000 | | | | 24,135,067 | |
Blackhawk Network Holdings, Inc.
1.50%, due 1/15/22 | | | 13,870,000 | | | | 13,930,681 | |
| | | | | | | | |
| | | | | | | 38,065,748 | |
| | | | | | | | |
Health Care—Products 4.5% | |
¨Danaher Corp.
(zero coupon), due 1/22/21 | | | 8,558,000 | | | | 30,188,345 | |
Hologic, Inc.
2.00%, due 3/1/42 (b) | | | 14,453,000 | | | | 17,993,985 | |
NuVasive, Inc.
2.25%, due 3/15/21 | | | 4,938,000 | | | | 5,740,425 | |
| | | | | | | | |
| | | | | | | 53,922,755 | |
| | | | | | | | |
Health Care—Services 2.8% | |
Anthem, Inc.
2.75%, due 10/15/42 | | | 7,160,000 | | | | 20,513,400 | |
| | | | | | | | |
| | | Principal
Amount | | | Value | |
Health Care—Services (continued) | |
Molina Healthcare, Inc.
1.625%, due 8/15/44 | | $ | 10,151,000 | | | $ | 12,580,896 | |
| | | | | | | | |
| | | | | | | 33,094,296 | |
| | | | | | | | |
Internet 8.7% | |
IAC FinanceCo, Inc.
0.875%, due 10/1/22 (a) | | | 14,542,000 | | | | 15,732,626 | |
Liberty Expedia Holdings, Inc.
1.00%, due 6/30/47 (a) | | | 11,074,000 | | | | 11,350,850 | |
MercadoLibre, Inc.
2.25%, due 7/1/19 | | | 4,485,000 | | | | 8,740,144 | |
¨Priceline Group, Inc. | | | | | | | | |
0.35%, due 6/15/20 | | | 7,782,000 | | | | 11,595,180 | |
1.00%, due 3/15/18 | | | 12,338,000 | | | | 24,907,337 | |
Proofpoint, Inc.
0.75%, due 6/15/20 | | | 8,653,000 | | | | 11,189,411 | |
Twitter, Inc.
0.25%, due 9/15/19 | | | 9,161,000 | | | | 8,702,950 | |
VeriSign, Inc.
4.702%, due 8/15/37 | | | 582,000 | | | | 1,831,481 | |
Zillow Group, Inc.
2.00%, due 12/1/21 (a) | | | 10,139,000 | | | | 11,165,574 | |
| | | | | | | | |
| | | | | | | 105,215,553 | |
| | | | | | | | |
Machinery—Diversified 0.9% | |
Chart Industries, Inc.
2.00%, due 8/1/18 | | | 11,153,000 | | | | 11,187,853 | |
| | | | | | | | |
|
Media 4.6% | |
¨DISH Network Corp.
3.375%, due 8/15/26 | | | 28,598,000 | | | | 30,903,714 | |
¨Liberty Media Corp-Liberty Formula One
1.00%, due 1/30/23 (a) | | | 9,441,000 | | | | 11,305,598 | |
¨Liberty Media Corp.
1.375%, due 10/15/23 | | | 11,345,000 | | | | 13,658,245 | |
| | | | | | | | |
| | | | | | | 55,867,557 | |
| | | | | | | | |
Oil & Gas 1.8% | |
Ensco Jersey Finance, Ltd.
3.00%, due 1/31/24 (a) | | | 8,306,000 | | | | 7,039,335 | |
Oasis Petroleum, Inc.
2.625%, due 9/15/23 | | | 13,092,000 | | | | 14,450,295 | |
| | | | | | | | |
| | | | | | | 21,489,630 | |
| | | | | | | | |
Oil & Gas Services 3.8% | |
Helix Energy Solutions Group, Inc.
4.25%, due 5/1/22 | | | 13,111,000 | | | | 12,742,253 | |
Newpark Resources, Inc.
4.00%, due 12/1/21 (a) | | | 6,326,000 | | | | 7,701,905 | |
¨Weatherford International, Ltd.
5.875%, due 7/1/21 | | | 25,561,000 | | | | 25,848,561 | |
| | | | | | | | |
| | | | | | | 46,292,719 | |
| | | | | | | | |
| † | Percentages indicated are based on Fund net assets. |
| ¨ | | Among the Fund’s 10 largest holdings or issuers held, as of October 31, 2017, excluding short-term investment. May be subject to change daily. (Unaudited) |
| | | | | | |
The notes to the financial statements are an integral part of,
and should be read in conjunction with, the financial statements. | | | | | 11 | |
Portfolio of Investments October 31, 2017 (continued)
| | | | | | | | |
| | | Principal
Amount | | | Value | |
| Convertible Bonds (continued) | |
Pharmaceuticals 1.1% | |
Neurocrine Biosciences, Inc.
2.25%, due 5/15/24 (a) | | $ | 1,906,000 | | | $ | 2,188,326 | |
Pacira Pharmaceuticals, Inc.
2.375%, due 4/1/22 (a) | | | 5,218,000 | | | | 4,856,002 | |
Radius Health, Inc.
3.00%, due 9/1/24 | | | 660,000 | | | | 603,075 | |
Teva Pharmaceutical Finance Co. LLC
0.25%, due 2/1/26 | | | 5,832,000 | | | | 5,150,385 | |
| | | | | | | | |
| | | | | | | 12,797,788 | |
| | | | | | | | |
Semiconductors 15.0% | |
Advanced Micro Devices, Inc.
2.125%, due 9/1/26 | | | 6,558,000 | | | | 10,353,443 | |
Inphi Corp.
1.125%, due 12/1/20 | | | 14,512,000 | | | | 18,049,300 | |
¨Lam Research Corp.
1.25%, due 5/15/18 | | | 8,824,000 | | | | 30,536,555 | |
¨Microchip Technology, Inc. | | | | | | | | |
1.625%, due 2/15/25 | | | 17,553,000 | | | | 32,352,373 | |
1.625%, due 2/15/27 (a) | | | 7,129,000 | | | | 9,013,729 | |
Micron Technology, Inc.
3.00%, due 11/15/43 | | | 12,588,000 | | | | 19,574,340 | |
NXP Semiconductors N.V.
1.00%, due 12/1/19 | | | 15,332,000 | | | | 18,963,768 | |
ON Semiconductor Corp.
1.00%, due 12/1/20 | | | 12,331,000 | | | | 15,960,938 | |
Rambus, Inc.
1.125%, due 8/15/18 | | | 7,638,000 | | | | 9,600,011 | |
Silicon Laboratories, Inc.
1.375%, due 3/1/22 (a) | | | 13,815,000 | | | | 16,629,806 | |
| | | | | | | | |
| | | | | | | 181,034,263 | |
| | | | | | | | |
Software 11.4% | |
Citrix Systems, Inc.
0.50%, due 4/15/19 | | | 8,035,000 | | | | 9,873,006 | |
HubSpot, Inc.
0.25%, due 6/1/22 (a) | | | 5,736,000 | | | | 6,481,680 | |
NICE Systems, Inc.
1.25%, due 1/15/24 (a) | | | 15,655,000 | | | | 18,091,309 | |
Nuance Communications, Inc.
1.25%, due 4/1/25 (a) | | | 11,278,000 | | | | 10,636,564 | |
RealPage, Inc.
1.50%, due 11/15/22 (a) | | | 10,067,000 | | | | 12,401,286 | |
Red Hat, Inc.
0.25%, due 10/1/19 | | | 12,045,000 | | | | 20,032,341 | |
Salesforce.com, Inc.
0.25%, due 4/1/18 | | | 9,409,000 | | | | 14,478,099 | |
ServiceNow, Inc.
(zero coupon), due 11/1/18 | | | 8,423,000 | | | | 14,466,503 | |
| | | | | | | | |
| | | Principal
Amount | | | Value | |
Software (continued) | |
Verint Systems, Inc.
1.50%, due 6/1/21 | | $ | 17,084,000 | | | $ | 16,817,062 | |
Workday, Inc.
0.25%, due 10/1/22 (a) | | | 13,226,000 | | | | 13,399,591 | |
| | | | | | | | |
| | | | | | | 136,677,441 | |
| | | | | | | | |
Telecommunications 2.0% | |
Finisar Corp.
0.50%, due 12/15/36 (a) | | | 9,521,000 | | | | 9,116,357 | |
Viavi Solutions, Inc.
1.00%, due 3/1/24 (a) | | | 14,679,000 | | | | 14,743,221 | |
| | | | | | | | |
| | | | | | | 23,859,578 | |
| | | | | | | | |
Transportation 2.1% | |
Atlas Air Worldwide Holdings, Inc.
2.25%, due 6/1/22 | | | 14,597,000 | | | | 17,060,244 | |
Echo Global Logistics, Inc.
2.50%, due 5/1/20 | | | 8,755,000 | | | | 8,711,225 | |
| | | | | | | | |
| | | | 25,771,469 | |
| | | | | | | | |
Total Convertible Bonds
(Cost $753,112,667) | | | | 866,292,470 | |
| | | | | | | | |
| | |
| | | | | | | | |
| | |
| | | Shares | | | | |
| Convertible Preferred Stocks 12.6% | |
Banks 2.6% | |
¨Bank of America Corp.
Series L
7.25% | | | 12,072 | | | | 15,656,901 | |
Wells Fargo & Co.
Series L
7.50% | | | 11,552 | | | | 15,133,120 | |
| | | | | | | | |
| | | | | | | 30,790,021 | |
| | | | | | | | |
Chemicals 1.2% | |
A. Schulman, Inc.
6.00% | | | 14,423 | | | | 13,849,830 | |
| | | | | | | | |
|
Food 0.9% | |
Post Holdings, Inc.
3.75% | | | 60,463 | | | | 10,684,114 | |
| | | | | | | | |
|
Hand & Machine Tools 1.0% | |
Stanley Black & Decker, Inc.
5.375% | | | 105,261 | | | | 12,449,218 | |
| | | | | | | | |
|
Health Care—Products 0.8% | |
Becton Dickinson & Co.
Series A
6.125% | | | 159,841 | | | | 9,074,174 | |
| | | | | | | | |
| | | | |
| 12 | | MainStay Convertible Fund | | The notes to the financial statements are an integral part of,
and should be read in conjunction with, the financial statements. |
| | | | | | | | |
| | |
Shares | | | Value | |
| Convertible Preferred Stocks (continued) | |
Oil & Gas 1.5% | |
Hess Corp.
8.00% | | | 293,774 | | | $ | 16,216,325 | |
Southwestern Energy Co.
Series B
6.25% | | | 184,819 | | | | 2,352,746 | |
| | | | | | | | |
| | | | | | | 18,569,071 | |
| | | | | | | | |
Pharmaceuticals 1.4% | |
Allergan PLC
Series A
5.50% | | | 16,171 | | | | 10,409,111 | |
Teva Pharmaceutical Industries, Ltd.
7.00% | | | 22,694 | | | | 6,456,443 | |
| | | | | | | | |
| | | | | | | 16,865,554 | |
| | | | | | | | |
Real Estate Investment Trusts 2.5% | |
American Tower Corp.
5.50% | | | 140,488 | | | | 17,725,371 | |
Crown Castle International Corp.
6.875% | | | 8,856 | | | | 9,740,803 | |
Welltower, Inc.
Series I
6.50% | | | 47,800 | | | | 2,931,574 | |
| | | | | | | | |
| | | | | | | 30,397,748 | |
| | | | | | | | |
Telecommunications 0.7% | |
T-Mobile U.S., Inc.
5.50% | | | 85,219 | | | | 8,249,199 | |
| | | | | | | | |
Total Convertible Preferred Stocks
(Cost $163,598,721) | | | | | | | 150,928,929 | |
| | | | | | | | |
Total Convertible Securities
(Cost $916,711,388) | | | | | | | 1,017,221,399 | |
| | | | | | | | |
|
| Common Stocks 5.3% | |
Aerospace & Defense 0.5% | |
United Technologies Corp. | | | 53,105 | | | | 6,359,855 | |
| | | | | | | | |
|
Air Freight & Logistics 1.4% | |
XPO Logistics, Inc. (c) | | | 246,898 | | | | 17,122,376 | |
| | | | | | | | |
|
Airlines 1.0% | |
Delta Air Lines, Inc. | | | 227,309 | | | | 11,372,269 | |
| | | | | | | | |
|
Banks 0.9% | |
¨Bank of America Corp. | | | 398,621 | | | | 10,918,229 | |
| | | | | | | | |
|
Energy Equipment & Services 0.5% | |
Baker Hughes, a GE Co. | | | 51,357 | | | | 1,614,151 | |
Halliburton Co. | | | 113,326 | | | | 4,843,553 | |
| | | | | | | | |
| | | | | | | 6,457,704 | |
| | | | | | | | |
| | | | | | | | |
| | |
Shares | | | Value | |
Health Care Equipment & Supplies 1.0% | |
Teleflex, Inc. | | | 49,763 | | | $ | 11,792,836 | |
| | | | | | | | |
Total Common Stocks
(Cost $44,723,115) | | | | | | | 64,023,269 | |
| | | | | | | | |
| | |
| | | | | | | | |
| | | Principal
Amount | | | | |
| Short-Term Investment 9.8% | |
Repurchase Agreement 9.8% | |
Fixed Income Clearing Corp.
0.34%, dated 10/31/17
due 11/1/17
Proceeds at Maturity $117,463,089 (Collateralized by a United States Treasury Note with a rate of 2.125% and a maturity date of 12/31/22, with a Principal Amount of $118,445,000 and a Market Value of $119,813,395) | | $ | 117,461,980 | | | | 117,461,980 | |
| | | | | | | | |
Total Short-Term Investment
(Cost $117,461,980) | | | | | | | 117,461,980 | |
| | | | | | | | |
Total Investments
(Cost $1,078,896,483) | | | 99.7 | % | | | 1,198,706,648 | |
Other Assets, Less Liabilities | | | 0.3 | | | | 4,074,209 | |
Net Assets | | | 100.0 | % | | $ | 1,202,780,857 | |
| (a) | May be sold to institutional investors only under Rule 144A or securities offered pursuant to Section 4(a)(2) of the Securities Act of 1933, as amended. |
| (b) | Step coupon—Rate shown was the rate in effect as of October 31, 2017. |
| (c) | Non-income producing security. |
| | | | | | |
The notes to the financial statements are an integral part of,
and should be read in conjunction with, the financial statements. | | | | | 13 | |
Portfolio of Investments October 31, 2017 (continued)
The following is a summary of the fair valuations according to the inputs used as of October 31, 2017, for valuing the Fund’s assets.
Asset Valuation Inputs
| | | | | | | | | | | | | | | | |
Description | | Quoted
Prices in
Active
Markets for
Identical
Assets (Level 1) | | | Significant
Other
Observable
Inputs (Level 2) | | | Significant
Unobservable
Inputs (Level 3) | | | Total | |
| Investments in Securities (a) | | | | | | | | | | | | | | | | |
| Convertible Securities | | | | | | | | | | | | | | | | |
Convertible Bonds | | $ | — | | | $ | 866,292,470 | | | $ | — | | | $ | 866,292,470 | |
Convertible Preferred Stocks (b) | | | 126,394,985 | | | | 24,533,944 | | | | — | | | | 150,928,929 | |
| | | | | | | | | | | | | | | | |
| Total Convertible Securities | | | 126,394,985 | | | | 890,826,414 | | | | — | | | | 1,017,221,399 | |
| | | | | | | | | | | | | | | | |
| Common Stocks | | | 64,023,269 | | | | — | | | | — | | | | 64,023,269 | |
| Short-Term Investment | | | | | | | | | | | | | | | | |
Repurchase Agreement | | | — | | | | 117,461,980 | | | | — | | | | 117,461,980 | |
| | | | | | | | | | | | | | | | |
| Total Investments in Securities | | $ | 190,418,254 | | | $ | 1,008,288,394 | | | $ | — | | | $ | 1,198,706,648 | |
| | | | | | | | | | | | | | | | |
| (a) | For a complete listing of investments and their industries, see the Portfolio of Investments. |
| (b) | The level 2 securities valued at $13,849,830 and $10,684,114 are held in Chemicals and Food, respectively, within the Convertible Preferred Stocks section of the Portfolio of Investments. |
The Fund recognizes transfers between the levels as of the beginning of the period.
For the year ended October 31, 2017, the Fund did not have any transfers among levels. (See Note 2)
As of October 31, 2017, the Fund did not hold any investments with significant unobservable inputs (Level 3). (See Note 2)
| | | | |
| 14 | | MainStay Convertible Fund | | The notes to the financial statements are an integral part of,
and should be read in conjunction with, the financial statements. |
Statement of Assets and Liabilities as of October 31, 2017
| | | | |
| Assets | |
Investment in securities, at value (identified cost $1,078,896,483) | | $ | 1,198,706,648 | |
Receivables: | | | | |
Dividends and interest | | | 4,696,727 | |
Fund shares sold | | | 1,590,657 | |
Other assets | | | 45,768 | |
| | | | |
Total assets | | | 1,205,039,800 | |
| | | | |
| |
| Liabilities | | | | |
Payables: | | | | |
Fund shares redeemed | | | 1,316,638 | |
Manager (See Note 3) | | | 500,860 | |
NYLIFE Distributors (See Note 3) | | | 200,191 | |
Transfer agent (See Note 3) | | | 136,895 | |
Shareholder communication | | | 72,464 | |
Professional fees | | | 16,697 | |
Trustees | | | 2,918 | |
Custodian | | | 2,056 | |
Accrued expenses | | | 10,224 | |
| | | | |
Total liabilities | | | 2,258,943 | |
| | | | |
Net assets | | $ | 1,202,780,857 | |
| | | | |
| |
| Composition of Net Assets | | | | |
Shares of beneficial interest outstanding (par value of $.01 per share) unlimited number of shares authorized | | $ | 677,261 | |
Additional paid-in capital | | | 1,025,761,278 | |
| | | | |
| | | 1,026,438,539 | |
Distributions in excess of net investment income | | | (8,121,831 | ) |
Accumulated net realized gain (loss) on investments | | | 64,653,984 | |
Net unrealized appreciation (depreciation) on investments | | | 119,810,165 | |
| | | | |
Net assets | | $ | 1,202,780,857 | |
| | | | |
| | | | |
Class A | | | | |
Net assets applicable to outstanding shares | | $ | 482,340,856 | |
| | | | |
Shares of beneficial interest outstanding | | | 27,170,953 | |
| | | | |
Net asset value per share outstanding | | $ | 17.75 | |
Maximum sales charge (5.50% of offering price) | | | 1.03 | |
| | | | |
Maximum offering price per share outstanding | | $ | 18.78 | |
| | | | |
Investor Class | | | | |
Net assets applicable to outstanding shares | | $ | 56,289,407 | |
| | | | |
Shares of beneficial interest outstanding | | | 3,171,876 | |
| | | | |
Net asset value per share outstanding | | $ | 17.75 | |
Maximum sales charge (5.50% of offering price) | | | 1.03 | |
| | | | |
Maximum offering price per share outstanding | | $ | 18.78 | |
| | | | |
Class B | | | | |
Net assets applicable to outstanding shares | | $ | 19,289,576 | |
| | | | |
Shares of beneficial interest outstanding | | | 1,091,512 | |
| | | | |
Net asset value and offering price per share outstanding | | $ | 17.67 | |
| | | | |
Class C | | | | |
Net assets applicable to outstanding shares | | $ | 82,334,568 | |
| | | | |
Shares of beneficial interest outstanding | | | 4,664,343 | |
| | | | |
Net asset value and offering price per share outstanding | | $ | 17.65 | |
| | | | |
Class I | | | | |
Net assets applicable to outstanding shares | | $ | 562,526,450 | |
| | | | |
Shares of beneficial interest outstanding | | | 31,627,397 | |
| | | | |
Net asset value and offering price per share outstanding | | $ | 17.79 | |
| | | | |
| | | | | | |
The notes to the financial statements are an integral part of,
and should be read in conjunction with, the financial statements. | | | | | 15 | |
Statement of Operations for the year ended October 31, 2017
| | | | |
| Investment Income (Loss) | |
Income | | | | |
Interest | | $ | 11,973,050 | |
Dividends (a) | | | 9,789,261 | |
Other income | | | 1,096 | |
| | | | |
Total income | | | 21,763,407 | |
| | | | |
Expenses | | | | |
Manager (See Note 3) | | | 6,045,617 | |
Distribution/Service—Class A (See Note 3) | | | 1,063,904 | |
Distribution/Service—Investor Class (See Note 3) | | | 201,069 | |
Distribution/Service—Class B (See Note 3) | | | 210,993 | |
Distribution/Service—Class C (See Note 3) | | | 818,828 | |
Transfer agent (See Note 3) | | | 1,509,562 | |
Shareholder communication | | | 135,180 | |
Registration | | | 111,838 | |
Professional fees | | | 108,576 | |
Trustees | | | 25,624 | |
Custodian | | | 4,990 | |
Miscellaneous | | | 49,124 | |
| | | | |
Total expenses before waiver/reimbursement | | | 10,285,305 | |
Expense waiver/reimbursement from Manager (See Note 3) | | | (481,608 | ) |
| | | | |
Net expenses | | | 9,803,697 | |
| | | | |
Net investment income (loss) | | | 11,959,710 | |
| | | | |
|
| Realized and Unrealized Gain (Loss) on Investments | |
Net realized gain (loss) on investments | | | 67,286,271 | |
Net change in unrealized appreciation (depreciation) on investments | | | 66,696,846 | |
| | | | |
Net realized and unrealized gain (loss) on investments | | | 133,983,117 | |
| | | | |
Net increase (decrease) in net assets resulting from operations | | $ | 145,942,827 | |
| | | | |
| (a) | Dividends recorded net of foreign withholding taxes in the amount of $224,802. |
| | | | |
| 16 | | MainStay Convertible Fund | | The notes to the financial statements are an integral part of,
and should be read in conjunction with, the financial statements. |
Statements of Changes in Net Assets
for the years ended October 31, 2017 and October 31, 2016
| | | | | | | | |
| | | 2017 | | | 2016 | |
| Increase (Decrease) in Net Assets | |
Operations: | | | | | | | | |
Net investment income (loss) | | $ | 11,959,710 | | | $ | 10,115,737 | |
Net realized gain (loss) on investments | | | 67,286,271 | | | | 15,873,363 | |
Net change in unrealized appreciation (depreciation) on investments | | | 66,696,846 | | | | (1,095,460 | ) |
| | | | |
Net increase (decrease) in net assets resulting from operations | | | 145,942,827 | | | | 24,893,640 | |
| | | | |
Dividends and distributions to shareholders: | | | | | | | | |
From net investment income: | | | | | | | | |
Class A | | | (5,915,050 | ) | | | (15,680,249 | ) |
Investor Class | | | (959,734 | ) | | | (3,095,349 | ) |
Class B | | | (111,244 | ) | | | (783,197 | ) |
Class C | | | (412,759 | ) | | | (2,765,653 | ) |
Class I | | | (6,945,027 | ) | | | (11,214,166 | ) |
| | | | |
| | | (14,343,814 | ) | | | (33,538,614 | ) |
| | | | |
From net realized gain on investments: | | | | | | | | |
Class A | | | (6,089,507 | ) | | | (17,162,761 | ) |
Investor Class | | | (1,306,245 | ) | | | (3,477,638 | ) |
Class B | | | (339,058 | ) | | | (1,106,480 | ) |
Class C | | | (1,228,067 | ) | | | (3,897,027 | ) |
Class I | | | (4,515,780 | ) | | | (11,748,242 | ) |
| | | | |
| | | (13,478,657 | ) | | | (37,392,148 | ) |
| | | | |
Total dividends and distributions to shareholders | | | (27,822,471 | ) | | | (70,930,762 | ) |
| | | | |
Capital share transactions: | | | | | | | | |
Net proceeds from sale of shares | | | 540,443,512 | | | | 173,063,368 | |
Net asset value of shares issued to shareholders in reinvestment of dividends and distributions | | | 23,898,379 | | | | 60,533,955 | |
Cost of shares redeemed | | | (278,484,613 | ) | | | (295,260,583 | ) |
| | | | |
Increase (decrease) in net assets derived from capital share transactions | | | 285,857,278 | | | | (61,663,260 | ) |
| | | | |
Net increase (decrease) in net assets | | | 403,977,634 | | | | (107,700,382 | ) |
|
| Net Assets | |
Beginning of year | | | 798,803,223 | | | | 906,503,605 | |
| | | | |
End of year | | $ | 1,202,780,857 | | | $ | 798,803,223 | |
| | | | |
Distributions in excess of net investment income at end of year | | $ | (8,121,831 | ) | | $ | (8,358,126 | ) |
| | | | |
| | | | | | |
The notes to the financial statements are an integral part of,
and should be read in conjunction with, the financial statements. | | | | | 17 | |
Financial Highlights selected per share data and ratios
| | | | | | | | | | | | | | | | | | | | |
| | | Year ended October 31, | |
| Class A | | 2017 | | | 2016 | | | 2015 | | | 2014 | | | 2013 | |
Net asset value at beginning of year | | $ | 15.72 | | | $ | 16.51 | | | $ | 18.33 | | | $ | 17.33 | | | $ | 14.79 | |
| | | | | | | | | | | | | | | | | | | | |
Net investment income (loss) (a) | | | 0.19 | | | | 0.20 | | | | 0.11 | | | | 0.15 | | | | 0.18 | |
Net realized and unrealized gain (loss) on investments | | | 2.34 | | | | 0.35 | | | | (0.00 | )‡ | | | 1.59 | | | | 3.29 | |
| | | | | | | | | | | | | | | | | | | | |
Total from investment operations | | | 2.53 | | | | 0.55 | | | | 0.11 | | | | 1.74 | | | | 3.47 | |
| | | | | | | | | | | | | | | | | | | | |
| Less dividends and distributions: | | | | | | | | | | | | | | | | | | | | |
From net investment income | | | (0.24 | ) | | | (0.64 | ) | | | (0.47 | ) | | | (0.51 | ) | | | (0.31 | ) |
From net realized gain on investments | | | (0.26 | ) | | | (0.70 | ) | | | (1.46 | ) | | | (0.23 | ) | | | (0.62 | ) |
| | | | | | | | | | | | | | | | | | | | |
Total dividends and distributions | | | (0.50 | ) | | | (1.34 | ) | | | (1.93 | ) | | | (0.74 | ) | | | (0.93 | ) |
| | | | | | | | | | | | | | | | | | | | |
Net asset value at end of year | | $ | 17.75 | | | $ | 15.72 | | | $ | 16.51 | | | $ | 18.33 | | | $ | 17.33 | |
| | | | | | | | | | | | | | | | | | | | |
Total investment return (b) | | | 16.30 | % | | | 3.71 | % | | | 0.58 | % | | | 10.42 | % | | | 24.78 | % |
| Ratios (to average net assets)/Supplemental Data: | | | | | | | | | | | | | | | | | | | | |
Net investment income (loss) | | | 1.12 | % | | | 1.31 | % | | | 0.62 | % | | | 0.86 | % | | | 1.13 | % |
Net expenses | | | 0.98 | % | | | 1.01 | % | | | 0.99 | % | | | 0.97 | % | | | 0.99 | % |
Expenses (before waiver/reimbursement) | | | 0.99 | % | | | 1.01 | % | | | 0.99 | % | | | 0.97 | % | | | 0.99 | % |
Portfolio turnover rate | | | 38 | % | | | 24 | % | | | 60 | % | | | 59 | % | | | 77 | % |
Net assets at end of year (in 000’s) | | $ | 482,341 | | | $ | 368,583 | | | $ | 408,067 | | | $ | 384,987 | | | $ | 391,577 | |
| ‡ | Less than one cent per share. |
| (a) | Per share data based on average shares outstanding during the year. |
| (b) | Total investment return is calculated exclusive of sales charges and assumes the reinvestment of dividends and distributions. For periods of less than one year, total return is not annualized. |
| | | | | | | | | | | | | | | | | | | | |
| | | Year ended October 31, | |
| Investor Class | | 2017 | | | 2016 | | | 2015 | | | 2014 | | | 2013 | |
Net asset value at beginning of year | | $ | 15.72 | | | $ | 16.50 | | | $ | 18.33 | | | $ | 17.32 | | | $ | 14.79 | |
| | | | | | | | | | | | | | | | | | | | |
Net investment income (loss) (a) | | | 0.16 | | | | 0.18 | | | | 0.08 | | | | 0.12 | | | | 0.15 | |
Net realized and unrealized gain (loss) on investments | | | 2.34 | | | | 0.36 | | | | (0.01 | ) | | | 1.60 | | | | 3.28 | |
| | | | | | | | | | | | | | | | | | | | |
Total from investment operations | | | 2.50 | | | | 0.54 | | | | 0.07 | | | | 1.72 | | | | 3.43 | |
| | | | | | | | | | | | | | | | | | | | |
| Less dividends and distributions: | | | | | | | | | | | | | | | | | | | | |
From net investment income | | | (0.21 | ) | | | (0.62 | ) | | | (0.44 | ) | | | (0.48 | ) | | | (0.28 | ) |
From net realized gain on investments | | | (0.26 | ) | | | (0.70 | ) | | | (1.46 | ) | | | (0.23 | ) | | | (0.62 | ) |
| | | | | | | | | | | | | | | | | | | | |
Total dividends and distributions | | | (0.47 | ) | | | (1.32 | ) | | | (1.90 | ) | | | (0.71 | ) | | | (0.90 | ) |
| | | | | | | | | | | | | | | | | | | | |
Net asset value at end of year | | $ | 17.75 | | | $ | 15.72 | | | $ | 16.50 | | | $ | 18.33 | | | $ | 17.32 | |
| | | | | | | | | | | | | | | | | | | | |
Total investment return (b) | | | 16.11 | % | | | 3.60 | % | | | 0.40 | % | | | 10.21 | % | | | 24.42 | % |
| Ratios (to average net assets)/Supplemental Data: | | | | | | | | | | | | | | | | | | | | |
Net investment income (loss) | | | 0.95 | % | | | 1.14 | % | | | 0.45 | % | | | 0.67 | % | | | 0.93 | % |
Net expenses | | | 1.14 | % | | | 1.18 | % | | | 1.15 | % | | | 1.16 | % | | | 1.22 | % |
Expenses (before waiver/reimbursement) | | | 1.15 | % | | | 1.18 | % | | | 1.15 | % | | | 1.16 | % | | | 1.22 | % |
Portfolio turnover rate | | | 38 | % | | | 24 | % | | | 60 | % | | | 59 | % | | | 77 | % |
Net assets at end of year (in 000’s) | | $ | 56,289 | | | $ | 79,430 | | | $ | 82,052 | | | $ | 85,850 | | | $ | 86,136 | |
| (a) | Per share data based on average shares outstanding during the year. |
| (b) | Total investment return is calculated exclusive of sales charges and assumes the reinvestment of dividends and distributions. For periods of less than one year, total return is not annualized. |
| | | | |
| 18 | | MainStay Convertible Fund | | The notes to the financial statements are an integral part of,
and should be read in conjunction with, the financial statements. |
Financial Highlights selected per share data and ratios
| | | | | | | | | | | | | | | | | | | | |
| | | Year ended October 31, | |
| Class B | | 2017 | | | 2016 | | | 2015 | | | 2014 | | | 2013 | |
Net asset value at beginning of year | | $ | 15.66 | | | $ | 16.45 | | | $ | 18.30 | | | $ | 17.37 | | | $ | 14.84 | |
| | | | | | | | | | | | | | | | | | | | |
Net investment income (loss) (a) | | | 0.04 | | | | 0.06 | | | | (0.05 | ) | | | (0.01 | ) | | | 0.03 | |
Net realized and unrealized gain (loss) on investments | | | 2.32 | | | | 0.35 | | | | 0.01 | | | | 1.59 | | | | 3.29 | |
| | | | | | | | | | | | | | | | | | | | |
Total from investment operations | | | 2.36 | | | | 0.41 | | | | (0.04 | ) | | | 1.58 | | | | 3.32 | |
| | | | | | | | | | | | | | | | | | | | |
| Less dividends and distributions: | | | | | | | | | | | | | | | | | | | | |
From net investment income | | | (0.09 | ) | | | (0.50 | ) | | | (0.35 | ) | | | (0.42 | ) | | | (0.17 | ) |
From net realized gain on investments | | | (0.26 | ) | | | (0.70 | ) | | | (1.46 | ) | | | (0.23 | ) | | | (0.62 | ) |
| | | | | | | | | | | | | | | | | | | | |
Total dividends and distributions | | | (0.35 | ) | | | (1.20 | ) | | | (1.81 | ) | | | (0.65 | ) | | | (0.79 | ) |
| | | | | | | | | | | | | | | | | | | | |
Net asset value at end of year | | $ | 17.67 | | | $ | 15.66 | | | $ | 16.45 | | | $ | 18.30 | | | $ | 17.37 | |
| | | | | | | | | | | | | | | | | | | | |
Total investment return (b) | | | 15.21 | % | | | 2.83 | % | | | (0.36 | %) | | | 9.41 | % | | | 23.50 | % |
| Ratios (to average net assets)/Supplemental Data: | | | | | | | | | | | | | | | | | | | | |
Net investment income (loss) | | | 0.21 | % | | | 0.39 | % | | | (0.30 | %) | | | (0.08 | %) | | | 0.19 | % |
Net expenses | | | 1.89 | % | | | 1.93 | % | | | 1.90 | % | | | 1.91 | % | | | 1.97 | % |
Expenses (before waiver/reimbursement) | | | 1.90 | % | | | 1.93 | % | | | 1.90 | % | | | 1.91 | % | | | 1.97 | % |
Portfolio turnover rate | | | 38 | % | | | 24 | % | | | 60 | % | | | 59 | % | | | 77 | % |
Net assets at end of year (in 000’s) | | $ | 19,290 | | | $ | 21,436 | | | $ | 26,537 | | | $ | 29,765 | | | $ | 32,629 | |
| (a) | Per share data based on average shares outstanding during the year. |
| (b) | Total investment return is calculated exclusive of sales charges and assumes the reinvestment of dividends and distributions. For periods of less than one year, total return is not annualized. |
| | | | | | | | | | | | | | | | | | | | |
| | | Year ended October 31, | |
| Class C | | 2017 | | | 2016 | | | 2015 | | | 2014 | | | 2013 | |
Net asset value at beginning of year | | $ | 15.64 | | | $ | 16.43 | | | $ | 18.29 | | | $ | 17.36 | | | $ | 14.82 | |
| | | | | | | | | | | | | | | | | | | | |
Net investment income (loss) (a) | | | 0.04 | | | | 0.06 | | | | (0.05 | ) | | | (0.01 | ) | | | 0.03 | |
Net realized and unrealized gain (loss) on investments | | | 2.32 | | | | 0.35 | | | | (0.00 | )‡ | | | 1.59 | | | | 3.30 | |
| | | | | | | | | | | | | | | | | | | | |
Total from investment operations | | | 2.36 | | | | 0.41 | | | | (0.05 | ) | | | 1.58 | | | | 3.33 | |
| | | | | | | | | | | | | | | | | | | | |
| Less dividends and distributions: | | | | | | | | | | | | | | | | | | | | |
From net investment income | | | (0.09 | ) | | | (0.50 | ) | | | (0.35 | ) | | | (0.42 | ) | | | (0.17 | ) |
From net realized gain on investments | | | (0.26 | ) | | | (0.70 | ) | | | (1.46 | ) | | | (0.23 | ) | | | (0.62 | ) |
| | | | | | | | | | | | | | | | | | | | |
Total dividends and distributions | | | (0.35 | ) | | | (1.20 | ) | | | (1.81 | ) | | | (0.65 | ) | | | (0.79 | ) |
| | | | | | | | | | | | | | | | | | | | |
Net asset value at end of year | | $ | 17.65 | | | $ | 15.64 | | | $ | 16.43 | | | $ | 18.29 | | | $ | 17.36 | |
| | | | | | | | | | | | | | | | | | | | |
Total investment return (b) | | | 15.23 | % | | | 2.77 | % | | | (0.30 | %) | | | 9.35 | % | | | 23.60 | % |
| Ratios (to average net assets)/Supplemental Data: | | | | | | | | | | | | | | | | | | | | |
Net investment income (loss) | | | 0.21 | % | | | 0.39 | % | | | (0.30 | %) | | | (0.08 | %) | | | 0.19 | % |
Net expenses | | | 1.89 | % | | | 1.93 | % | | | 1.90 | % | | | 1.91 | % | | | 1.97 | % |
Expenses (before waiver/reimbursement) | | | 1.90 | % | | | 1.93 | % | | | 1.90 | % | | | 1.91 | % | | | 1.97 | % |
Portfolio turnover rate | | | 38 | % | | | 24 | % | | | 60 | % | | | 59 | % | | | 77 | % |
Net assets at end of year (in 000’s) | | $ | 82,335 | | | $ | 76,501 | | | $ | 91,833 | | | $ | 92,118 | | | $ | 78,135 | |
| ‡ | Less than one cent per share. |
| (a) | Per share data based on average shares outstanding during the year. |
| (b) | Total investment return is calculated exclusive of sales charges and assumes the reinvestment of dividends and distributions. For periods of less than one year, total return is not annualized. |
| | | | | | |
The notes to the financial statements are an integral part of,
and should be read in conjunction with, the financial statements. | | | | | 19 | |
Financial Highlights selected per share data and ratios
| | | | | | | | | | | | | | | | | | | | |
| | | Year ended October 31, | |
| Class I | | 2017 | | | 2016 | | | 2015 | | | 2014 | | | 2013 | |
Net asset value at beginning of year | | $ | 15.75 | | | $ | 16.54 | | | $ | 18.36 | | | $ | 17.35 | | | $ | 14.81 | |
| | | | | | | | | | | | | | | | | | | | |
Net investment income (loss) (a) | | | 0.25 | | | | 0.24 | | | | 0.15 | | | | 0.20 | | | | 0.22 | |
Net realized and unrealized gain (loss) on investments | | | 2.34 | | | | 0.35 | | | | (0.00 | )‡ | | | 1.60 | | | | 3.29 | |
| | | | | | | | | | | | | | | | | | | | |
Total from investment operations | | | 2.59 | | | | 0.59 | | | | 0.15 | | | | 1.80 | | | | 3.51 | |
| | | | | | | | | | | | | | | | | | | | |
| Less dividends and distributions: | | | | | | | | | | | | | | | | | | | | |
From net investment income | | | (0.29 | ) | | | (0.68 | ) | | | (0.51 | ) | | | (0.56 | ) | | | (0.35 | ) |
From net realized gain on investments | | | (0.26 | ) | | | (0.70 | ) | | | (1.46 | ) | | | (0.23 | ) | | | (0.62 | ) |
| | | | | | | | | | | | | | | | | | | | |
Total dividends and distributions | | | (0.55 | ) | | | (1.38 | ) | | | (1.97 | ) | | | (0.79 | ) | | | (0.97 | ) |
| | | | | | | | | | | | | | | | | | | | |
Net asset value at end of year | | $ | 17.79 | | | $ | 15.75 | | | $ | 16.54 | | | $ | 18.36 | | | $ | 17.35 | |
| | | | | | | | | | | | | | | | | | | | |
Total investment return (b) | | | 16.69 | % | | | 3.96 | % | | | 0.84 | % | | | 10.74 | % | | | 25.05 | % |
| Ratios (to average net assets)/Supplemental Data: | | | | | | | | | | | | | | | | | | | | |
Net investment income (loss) | | | 1.45 | % | | | 1.56 | % | | | 0.87 | % | | | 1.11 | % | | | 1.37 | % |
Net expenses | | | 0.64 | % | | | 0.76 | % | | | 0.74 | % | | | 0.72 | % | | | 0.74 | % |
Expenses (before waiver/reimbursement) | | | 0.74 | % | | | 0.76 | % | | | 0.74 | % | | | 0.72 | % | | | 0.74 | % |
Portfolio turnover rate | | | 38 | % | | | 24 | % | | | 60 | % | | | 59 | % | | | 77 | % |
Net assets at end of year (in 000’s) | | $ | 562,526 | | | $ | 252,852 | | | $ | 298,015 | | | $ | 313,955 | | | $ | 258,279 | |
| ‡ | Less than one cent per share. |
| (a) | Per share data based on average shares outstanding during the year. |
| (b) | Total investment return is calculated exclusive of sales charges and assumes the reinvestment of dividends and distributions. Class I shares are not subject to sales charges. For periods of less than one year, total return is not annualized. |
| | | | |
| 20 | | MainStay Convertible Fund | | The notes to the financial statements are an integral part of,
and should be read in conjunction with, the financial statements. |
Notes to Financial Statements
Note 1–Organization and Business
The MainStay Funds (the “Trust”) was organized on January 9, 1986, as a Massachusetts business trust and is governed by a Declaration of Trust. The Trust is registered under the Investment Company Act of 1940, as amended (the “1940 Act”), as an open-end management investment company, and is comprised of twelve funds (collectively referred to as the “Funds”). These financial statements and notes relate to the MainStay Convertible Fund (the “Fund”), a “diversified” fund, as that term is defined in the 1940 Act, as interpreted or modified by regulatory authorities having jurisdiction, from time to time.
The Fund currently has seven classes of shares registered for sale. Class A shares commenced operations on January 3, 1995. Class B shares commenced operations on May 1, 1986. Class C shares commenced operations on September 1, 1998. Investor Class shares commenced operations on February 28, 2008. Class I shares commenced operations on November 28, 2008. Class R6 and Class T shares were registered for sale effective as of February 28, 2017. As of October 31, 2017, Class R6 and Class T shares were not yet offered for sale. Effective February 28, 2017, Class B shares of the MainStay Group of Funds were closed to all new purchases as well as additional investments by existing Class B shareholders. Existing Class B shareholders may continue to reinvest dividends and capital gains distributions, as well as exchange their Class B shares for Class B shares of other MainStay Group of Funds as permitted by the current exchange privileges. Class B shareholders continue to be subject to any applicable contingent deferred sales charge (“CDSC”) at the time of redemption. All other features of the Class B shares, including but not limited to the fees and expenses applicable to Class B shares, remain unchanged. Unless redeemed, Class B shareholders will remain in Class B shares of their respective fund until the Class B shares are converted to Class A or Investor Class shares pursuant to the applicable conversion schedule.
Class A and Investor Class shares are offered at net asset value (“NAV”) per share plus an initial sales charge. No initial sales charge applies to investments of $1 million or more (and certain other qualified purchases) in Class A and Investor Class shares. Effective August 1, 2017, a CDSC of 1.00% may be imposed on certain redemptions of Class A and Investor Class shares made within 18 months of the date of purchase on shares that were purchased without an initial sales charge. For purchases of Class A and Investor Class shares made from January 1, 2017, through July 31, 2017, a CDSC of 1.00% may be imposed on certain redemptions of such shares made within 24 months of the date of purchase on shares that were purchased without an initial sales charge. For purchases of Class A and Investor Class shares made prior to January 1, 2017, a CDSC of 1.00% may be imposed on certain redemptions of such shares made within one year of the date of purchase on shares that were purchased without an initial sales charge. Class C shares are offered at NAV without an initial sales charge, although a 1.00% CDSC may be imposed on certain redemptions of such shares made within one year of the date of purchase of Class C shares. When Class B shares were offered, they were offered at NAV without an initial sales charge, although a CDSC that declines depending on the number of years a shareholder has held its Class B shares may be imposed on certain redemptions of such shares made within six years of the date of purchase of such shares. Class T shares
are currently expected to be offered at NAV per share plus an initial sales charge. Class I shares are offered at NAV and are not subject to a sales charge. Class R6 shares are currently expected to be offered at NAV and to not be subject to a sales charge. Depending upon eligibility, Class B shares convert to either Class A or Investor Class shares at the end of the calendar quarter eight years after the date they were purchased. Additionally, as disclosed in the Fund’s prospectus, Class A shares may convert automatically to Investor Class shares and Investor Class shares may convert automatically to Class A shares. Under certain circumstances and as may be permitted by the Trust’s multiple class plan pursuant to Rule 18f-3 under the 1940 Act, specified share classes of the Fund may be converted to one or more other share classes of the Fund as disclosed in the capital share transactions within these Notes. The classes of shares have the same voting (except for issues that relate solely to one class), dividend, liquidation and other rights, and the same terms and conditions, except that under distribution plans pursuant to Rule 12b-1 under the 1940 Act, Class B and Class C shares are subject to higher distribution and/or service fees than Class A, Investor Class and Class T shares. Class I and Class R6 shares are not subject to a distribution and/or service fee.
The Fund’s investment objective is to seek capital appreciation together with current income.
Note 2–Significant Accounting Policies
The Fund is an investment company and accordingly follows the investment company accounting and reporting guidance of the Financial Accounting Standards Board (“FASB”) Accounting Standard Codification Topic 946 Financial Services—Investment Companies. The Fund prepares its financial statements in accordance with generally accepted accounting principles (“GAAP”) in the United States of America and follows the significant accounting policies described below.
(A) Securities Valuation. Investments are usually valued as of the close of regular trading on the New York Stock Exchange (the “Exchange”) (usually 4:00 p.m. Eastern time) on each day the Fund is open for business (“valuation date”).
The Board of Trustees of the Trust (the “Board”) adopted procedures establishing methodologies for the valuation of the Fund’s securities and other assets and delegated the responsibility for valuation determinations under those procedures to the Valuation Committee of the Trust (the “Valuation Committee”). The Board authorized the Valuation Committee to appoint a Valuation Subcommittee (the “Subcommittee”) to deal in the first instance with establishing the prices of securities for which market quotations are not readily available or the prices of which are not otherwise readily determinable under these procedures. The Subcommittee meets (in person, via electronic mail or via teleconference) on an as-needed basis. Subsequently, the Valuation Committee meets to ensure that actions taken by the Subcommittee were appropriate. The procedures state that, subject to the oversight of the Board and unless otherwise noted, the responsibility for the day-to-day valuation of portfolio assets (including fair value measurements for the Fund’s assets and liabilities) rests with New York Life Investment Management LLC (“New York Life Investments” or the “Manager”), aided to whatever extent necessary by the Subadvisor (as defined in Note 3(A)).
Notes to Financial Statements (continued)
To assess the appropriateness of security valuations, the Manager, the Subadvisor or the Fund’s third-party service provider, who is subject to oversight by the Manager, regularly compares prior day prices, prices on comparable securities and the sale prices to the prior and current day prices and challenges prices with changes exceeding certain tolerance levels with third-party pricing services or broker sources. For those securities valued through either a standardized fair valuation methodology or a fair valuation measurement, the Subcommittee deals in the first instance with such valuation and the Valuation Committee reviews and affirms, if appropriate, the reasonableness of the valuation based on such methodologies and measurements on a regular basis after considering information that is reasonably available and deemed relevant by the Valuation Committee. Any action taken by the Subcommittee with respect to the valuation of a portfolio security or other asset is submitted for review and ratification (if appropriate) to the Valuation Committee and the Board at the next regularly scheduled meeting.
“Fair value” is defined as the price the Fund would reasonably expect to receive upon selling an asset or liability in an orderly transaction to an independent buyer in the principal or most advantageous market for the asset or liability. Fair value measurements are determined within a framework that establishes a three-tier hierarchy which maximizes the use of observable market data and minimizes the use of unobservable inputs to establish a classification of fair value measurements for disclosure purposes. “Inputs” refer broadly to the assumptions that market participants would use in pricing the asset or liability, including assumptions about risk, such as the risk inherent in a particular valuation technique used to measure fair value using a pricing model and/or the risk inherent in the inputs for the valuation technique. Inputs may be observable or unobservable. Observable inputs reflect the assumptions market participants would use in pricing the asset or liability based on market data obtained from sources independent of the Fund. Unobservable inputs reflect the Fund’s own assumptions about the assumptions market participants would use in pricing the asset or liability based on the information available. The inputs or methodology used for valuing assets or liabilities may not be an indication of the risks associated with investing in those assets or liabilities. The three-tier hierarchy of inputs is summarized below.
| • | | Level 1—quoted prices in active markets for an identical asset or liability |
| • | | Level 2—other significant observable inputs (including quoted prices for a similar asset or liability in active markets, interest rates and yield curves, prepayment speeds, credit risk, etc.) |
| • | | Level 3—significant unobservable inputs (including the Fund’s own assumptions about the assumptions that market participants would use in measuring fair value of an asset or liability) |
The level of an asset or liability within the fair value hierarchy is based on the lowest level of an input, both individually and in the aggregate, that is significant to the fair value measurement. As of October 31, 2017, the aggregate value by input level of the Fund’s assets and liabilities is included at the end of the Fund’s Portfolio of Investments.
The Fund may use third-party vendor evaluations, whose prices may be derived from one or more of the following standard inputs, among others:
| | |
• Benchmark yields | | • Reported trades |
• Broker/dealer quotes | | • Issuer spreads |
• Two-sided markets | | • Benchmark securities |
• Bids/offers | | • Reference data (corporate actions or material event notices) |
• Industry and economic events | | • Comparable bonds |
• Monthly payment information | | |
An asset or liability for which market values cannot be measured using the methodologies described above is valued by methods deemed reasonable in good faith by the Valuation Committee, following the procedures established by the Board, to represent fair value. Under these procedures, the Fund generally uses a market-based approach which may use related or comparable assets or liabilities, recent transactions, market multiples, book values and other relevant information. The Fund may also use an income-based valuation approach in which the anticipated future cash flows of the asset or liability are discounted to calculate fair value. Discounts may also be applied due to the nature and/or duration of any restrictions on the disposition of the asset or liability. Fair value represents a good faith approximation of the value of a security. Fair value determinations involve the consideration of a number of subjective factors, an analysis of applicable facts and circumstances and the exercise of judgment. As a result, it is possible that the fair value for a security determined in good faith in accordance with the Fund’s valuation procedures may differ from valuations for the same security determined by other funds using their own valuation procedures. Although the Fund’s valuation procedures are designed to value a security at the price the Fund may reasonably expect to receive upon the security’s sale in an orderly transaction, there can be no assurance that any fair value determination thereunder would, in fact, approximate the amount that the Fund would actually realize upon the sale of the security or the price at which the security would trade if a reliable market price were readily available. During the year ended October 31, 2017, there were no material changes to the fair value methodologies.
Securities which may be valued in this manner include, but are not limited to: (i) a security for which trading has been halted or suspended; (ii) a debt security that has recently gone into default and for which there is not a current market quotation; (iii) a security of an issuer that has entered into a restructuring; (iv) a security that has been de-listed from a national exchange; (v) a security for which the market price is not readily available from a third-party pricing source or, if so provided, does not, in the opinion of the Manager or Subadvisor reflect the security’s market value; (vi) a security subject to trading collars for which no or limited trading takes place; and (vii) a security whose principal market has been temporarily closed at a time when, under normal conditions, it would be open. Securities for which market quotations or observable inputs are not readily available are generally categorized as Level 3 in the hierarchy. As of October 31, 2017, there were no securities held by the Fund that were fair valued in such a manner.
Equity securities are valued at the last quoted sales prices as of the close of regular trading on the relevant exchange on each valuation
| | |
| 22 | | MainStay Convertible Fund |
date. Securities that are not traded on the valuation date are valued at the mean of the last quoted bid and ask prices. Prices are normally taken from the principal market in which each security trades. Investments in mutual funds, including money market funds, are valued at their respective NAVs as of the close of the Exchange on the valuation date. These securities are generally categorized as Level 1 in the hierarchy.
Debt securities (other than convertible and municipal bonds) are valued at the evaluated bid prices (evaluated mean prices in the case of convertible and municipal bonds) supplied by a pricing agent or brokers selected by the Manager, in consultation with the Subadvisor. Those values reflect broker/dealer supplied prices and electronic data processing techniques, if the evaluated bid or mean prices are deemed by the Manager, in consultation with the Subadvisor, to be representative of market values at the regular close of trading of the Exchange on each valuation date. Debt securities purchased on a delayed delivery basis are marked to market daily until settlement at the forward settlement date. Debt securities, including corporate bonds, U.S. government & federal agency bonds, municipal bonds, foreign bonds, convertible bonds, asset-backed securities and mortgage-backed securities are generally categorized as Level 2 in the hierarchy.
Temporary cash investments acquired in excess of 60 days to maturity at the time of purchase are valued using the latest bid prices or using valuations based on a matrix system (which considers such factors as security prices, yields, maturities and ratings), both as furnished by independent pricing services. Other temporary cash investments which mature in 60 days or less at the time of purchase (“Short-Term Investments”) are valued using the amortized cost method of valuation, unless the use of such method would be inappropriate. The amortized cost method involves valuing a security at its cost on the date of purchase and thereafter assuming a constant amortization to maturity of the difference between such cost and the value on maturity date. Amortized cost approximates the current fair value of a security. Securities valued using the amortized cost method are not valued using quoted prices in an active market and are generally categorized as Level 2 in the hierarchy.
The information above is not intended to reflect an exhaustive list of the methodologies that may be used to value portfolio investments. The valuation procedures permit the use of a variety of valuation methodologies in connection with valuing portfolio investments. The methodology used for a specific type of investment may vary based on the market data available or other considerations. The methodologies summarized above may not represent the specific means by which portfolio investments are valued on any particular business day.
(B) Income Taxes. The Fund’s policy is to comply with the requirements of the Internal Revenue Code of 1986, as amended (the “Internal Revenue Code”), applicable to regulated investment companies and to distribute all of its taxable income to the shareholders of the Fund within the allowable time limits. Therefore, no federal, state and local income tax provisions are required.
Management evaluates the Fund’s tax positions to determine if the tax positions taken meet the minimum recognition threshold in connection with accounting for uncertainties in income tax positions taken or expected to be taken for the purposes of measuring and recognizing tax
liabilities in the financial statements. Recognition of tax benefits of an uncertain tax position is permitted only to the extent the position is “more likely than not” to be sustained assuming examination by taxing authorities. Management has analyzed the Fund’s tax positions taken on federal, state and local income tax returns for all open tax years (for up to three tax years) and has concluded that no provisions for federal, state and local income tax are required in the Fund’s financial statements. The Fund’s federal, state and local income tax and federal excise tax returns for tax years for which the applicable statutes of limitations have not expired are subject to examination by the Internal Revenue Service and state and local departments of revenue.
(C) Dividends and Distributions to Shareholders. Dividends and distributions are recorded on the ex-dividend date. The Fund intends to declare and pay dividends from net investment income, if any, at least quarterly and distributions from net realized capital and currency gains, if any, at least annually. Unless the shareholder elects otherwise, all dividends and distributions are reinvested in the same class of shares of the Fund, at NAV. Dividends and distributions to shareholders are determined in accordance with federal income tax regulations and may differ from determinations using GAAP.
(D) Security Transactions and Investment Income. The Fund records security transactions on the trade date. Realized gains and losses on security transactions are determined using the identified cost method. Dividend income is recognized on the ex-dividend date, net of any foreign tax withheld at the source, and interest income is accrued as earned using the effective interest rate method. Discounts and premiums on securities purchased, other than Short-Term Investments, for the Fund are accreted and amortized, respectively, on the effective interest rate method over the life of the respective securities. Discounts and premiums on Short-Term Investments are accreted and amortized, respectively, on the straight-line method. The straight-line method approximates the effective interest method for Short-Term Investments.
Investment income and realized and unrealized gains and losses on investments of the Fund are allocated pro rata to separate classes of shares based upon their relative net assets on the date the income is earned or realized and unrealized gains and losses are incurred.
The Fund may place a debt security on non-accrual status and reduce related interest income by ceasing current accruals and writing off all or a portion of any interest receivables when the collection of all or a portion of such interest has become doubtful. A debt security is removed from non-accrual status when the issuer resumes interest payments or when collectability of interest is reasonably assured.
(E) Expenses. Expenses of the Trust are allocated to the individual Funds in proportion to the net assets of the respective Funds when the expenses are incurred, except where direct allocations of expenses can be made. Expenses (other than transfer agent expenses and fees incurred under the shareholder services plans and/or the distribution plans further discussed in Note 3(B)) are allocated to separate classes of shares pro rata based upon their relative net assets on the date the expenses are incurred. The expenses borne by the Fund, including those of related parties to the Fund, are shown in the Statement of Operations.
(F) Use of Estimates. In preparing financial statements in conformity with GAAP, management makes estimates and assumptions that
Notes to Financial Statements (continued)
affect the reported amounts and disclosures in the financial statements. Actual results could differ from those estimates.
(G) Repurchase Agreements. The Fund may enter into repurchase agreements (i.e., buy a security from another party with the agreement that it be sold back in the future) to earn income. The Fund may enter into repurchase agreements only with counterparties, usually financial institutions, that are deemed by the Manager or Subadvisor to be creditworthy, pursuant to guidelines established by the Board. During the term of any repurchase agreement, the Manager or Subadvisor will continue to monitor the creditworthiness of the counterparty. Under the 1940 Act, repurchase agreements are considered to be collateralized loans by the Fund to the counterparty secured by the securities transferred to the Fund.
Repurchase agreements are subject to counterparty risk, meaning the Fund could lose money by the counterparty’s failure to perform under the terms of the agreement. The Fund mitigates this risk by ensuring the repurchase agreement is collateralized by cash, U.S. government securities, fixed income securities and/or other securities. The collateral is held by the Fund’s custodian and valued daily on a mark to market basis to determine if the value, including accrued interest, exceeds the repurchase price. In the event of the counterparty’s default on the obligation to repurchase, the Fund has the right to liquidate the collateral and apply the proceeds in satisfaction of the obligation. Under certain circumstances, such as in the event of default or bankruptcy by the counterparty, realization and/or retention of the collateral may be limited or subject to delay, to legal proceedings and possible realized loss to the Fund.
(H) Securities Lending. In order to realize additional income, the Fund may engage in securities lending, subject to the limitations set forth in the 1940 Act and relevant guidance by the staff of the Securities and Exchange Commission (“SEC”). In the event the Fund does engage in securities lending, the Fund will lend through its custodian, State Street Bank and Trust Company (“State Street”). State Street will manage the Fund’s collateral in accordance with the lending agreement between the Fund and State Street, and indemnify the Fund against counterparty risk. The loans will be collateralized by U.S. Treasury securities at least equal at all times to the market value of the securities loaned. The Fund may bear the risk of delay in recovery of, or loss of rights in, the securities loaned should the borrower of the securities experience financial difficulty. The Fund may also record a realized gain or loss on securities deemed sold due to a borrower’s inability to return securities on loan. The Fund bears the risk of any loss on investment of the collateral. The Fund will receive compensation for lending its securities in the form of fees or it will retain a portion of interest on the investment of any cash received as collateral. The Fund will also continue to receive interest and dividends on the securities loaned and any gain or loss in the market price of the securities loaned that may occur during the term of the loan will be for the account of the Fund. During the year ended October 31, 2017, the Fund did not have any portfolio securities on loan.
(I) Convertible Securities Risk. Convertible securities may be subordinate to other securities. In part, the total return for a convertible security depends upon the performance of the underlying stock into which it can be converted. Also, issuers of convertible securities are often not as strong financially as those issuing securities with higher
credit ratings, are more likely to encounter financial difficulties and typically are more vulnerable to changes in the economy, such as a recession or a sustained period of rising interest rates, which could affect their ability to make interest and principal payments.
(J) Indemnifications. Under the Trust’s organizational documents, its officers and trustees are indemnified against certain liabilities that may arise out of performance of their duties to the Trust. Additionally, in the normal course of business, the Fund enters into contracts with third-party service providers that contain a variety of representations and warranties and which may provide general indemnifications. The Fund’s maximum exposure under these arrangements is unknown, as this would involve future claims that may be made against the Fund that have not yet occurred. Based on experience, management is of the view that the risk of loss in connection with these potential indemnification obligations is remote. However, there can be no assurance that material liabilities related to such obligations will not arise in the future, which could adversely impact the Fund.
Note 3–Fees and Related Party Transactions
(A) Manager and Subadvisor. New York Life Investments, a registered investment adviser and an indirect, wholly-owned subsidiary of New York Life Insurance Company (“New York Life”), serves as the Fund’s Manager, pursuant to an Amended and Restated Management Agreement (“Management Agreement”). The Manager provides offices, conducts clerical, recordkeeping and bookkeeping services and keeps most of the financial and accounting records required to be maintained by the Fund. Except for the portion of salaries and expenses that are the responsibility of the Fund, the Manager pays the salaries and expenses of all personnel affiliated with the Fund and certain operational expenses of the Fund. The Fund reimburses New York Life Investments in an amount equal to a portion of the compensation of the Chief Compliance Officer attributable to the Fund. MacKay Shields LLC (“MacKay Shields” or the “Subadvisor”), a registered investment adviser and an indirect, wholly-owned subsidiary of New York Life, serves as Subadvisor to the Fund and is responsible for the day-to-day portfolio management of the Fund. Pursuant to the terms of a Subadvisory Agreement (“Subadvisory Agreement”) between New York Life Investments and MacKay Shields, New York Life Investments pays for the services of the Subadvisor.
Under the Management Agreement, the Fund pays the Manager a monthly fee for the services performed and the facilities furnished at an annual rate of the Fund’s average daily net assets as follows: 0.60% up to $500 million; 0.55% from $500 million to $1 billion; and 0.50% in excess of $1 billion, plus a fee for fund accounting services, previously provided by New York Life Investments under a separate fund accounting agreement, furnished at an annual rate of the Fund’s average daily net assets as follows: 0.05% up to $20 million; 0.0333% from $20 million to $100 million; and 0.01% in excess of $100 million. During the year ended October 31, 2017, the effective management fee rate (exclusive of any applicable waivers/reimbursements) was 0.58%, inclusive of a fee for fund accounting services of 0.01% of the Fund’s average daily net assets.
Effective February 28, 2017, New York Life Investments has contractually agreed to waive fees and/or reimburse expenses (excluding taxes, interest, litigation, extraordinary expenses, brokerage and other transaction expenses relating to the purchase or sale of portfolio
| | |
| 24 | | MainStay Convertible Fund |
investments and acquired (underlying) fund fees and expenses) of Class I shares so that Total Annual Fund Operating Expenses of Class I shares do not exceed 0.61% of the Fund’s average daily net assets. This agreement will remain in effect until February 28, 2018, and shall renew automatically for one-year terms unless New York Life Investments provides written notice of termination prior to the start of the next term or upon approval by the Board.
During the year ended October 31, 2017, New York Life Investments earned fees from the Fund in the amount of $6,045,617 and waived its fees or reimbursed expenses in the amount of $481,608.
State Street provides sub-administration and sub-accounting services to the Fund pursuant to an agreement with New York Life Investments. These services include calculating the daily NAVs of the Fund, maintaining the general ledger and sub-ledger accounts for the calculation of the Fund’s NAVs and assisting New York Life Investments in conducting various aspects of the Fund’s administrative operations. For providing these services to the Fund, State Street is compensated by New York Life Investments.
(B) Distribution and Service Fees. The Trust, on behalf of the Fund, has entered into a distribution agreement with NYLIFE Distributors LLC (the “Distributor”), an indirect, wholly-owned subsidiary of New York Life. The Fund has adopted distribution plans (the “Plans”) in accordance with the provisions of Rule 12b-1 under the 1940 Act.
Pursuant to the Class A, Investor Class and Class T Plans, the Distributor receives a monthly distribution fee from the Class A, Investor Class and Class T shares at an annual rate of 0.25% of the average daily net assets of the Class A, Investor Class and Class T shares for distribution and/or service activities as designated by the Distributor. Pursuant to the Class B and Class C Plans, Class B and Class C shares pay the Distributor a monthly distribution fee at an annual rate of 0.75% of the average daily net assets of the Class B and Class C shares along with a service fee at an annual rate of 0.25% of the average daily net assets of the Class B and Class C shares, for a total 12b-1 fee of 1.00%. Class I and Class R6 shares are not subject to a distribution and/or service fee.
The Plans provide that the distribution and service fees are payable to the Distributor regardless of the amounts actually expended by the Distributor for distribution of the Fund’s shares and service activities.
(C) Sales Charges. During the year ended October 31, 2017, the Fund was advised by the Distributor that the amount of initial sales charges retained on sales of Class A and Investor Class shares were $115,447 and $31,106, respectively.
During the year ended October 31, 2017, the Fund was also advised that the Distributor retained CDSCs on redemptions of Class A, Class B and Class C shares of $10,593, $110, $25,272 and $8,180, respectively.
(D) Transfer, Dividend Disbursing and Shareholder Servicing Agent. NYLIM Service Company LLC, an affiliate of New York Life Investments, is the Fund’s transfer, dividend disbursing and shareholder servicing agent pursuant to an agreement between NYLIM Service Company LLC and the Trust. NYLIM Service Company LLC has entered into an agreement with Boston Financial Data Services, Inc. (“BFDS”) pursuant to which BFDS performs certain transfer agent services on behalf of NYLIM Service Company LLC. During the year
ended October 31, 2017, transfer agent expenses incurred by the Fund were as follows:
| | | | |
Class A | | $ | 498,695 | |
Investor Class | | | 221,180 | |
Class B | | | 58,221 | |
Class C | | | 226,202 | |
Class I | | | 505,264 | |
(E) Small Account Fee. Shareholders with small accounts adversely impact the cost of providing transfer agency services. In an effort to reduce total transfer agency expenses, the Fund has implemented a small account fee on certain types of accounts. Certain shareholders with an account balance of less than $1,000 are charged an annual per account fee of $20 (assessed semi-annually), the proceeds from which offset transfer agent fees as reflected in the Statement of Operations.
Note 4–Federal Income Tax
Tax cost of investments includes adjustments to net unrealized appreciation (depreciation) which may not necessarily be final tax cost basis adjustments, but more closely approximate the tax basis unrealized gains and losses that may be realized and distributed to shareholders.
| | | | | | | | | | | | | | | | |
| | | Federal Tax
Cost | | | Gross
Unrealized
Appreciation | | | Gross
Unrealized
Depreciation | | | Net
Unrealized
Appreciation/
(Depreciation) | |
Investments in Securities | | $ | 1,092,616,517 | | | $ | 153,744,259 | | | $ | (47,654,128 | ) | | $ | 106,090,131 | |
As of October 31, 2017, the components of accumulated gain (loss) on a tax basis were as follows:
| | | | | | | | |
Ordinary
Income | | Accumulated
Capital and
Other Gain
(Loss) | | Other
Temporary
Differences | | Unrealized
Appreciation
(Depreciation) | | Total
Accumulated Gain (Loss) |
| $9,235,567 | | $61,016,620 | | $— | | $106,090,131 | | $176,342,318 |
The difference between book-basis and tax-basis unrealized appreciation (depreciation) is primarily due to deemed dividends and Contingent Payment Debt Instruments (CPDI).
The following table discloses the current year reclassifications between undistributed net investment income (loss), accumulated net realized gain (loss) on investments and additional paid-in capital arising from permanent differences; net assets as of October 31, 2017 were not affected.
| | | | | | | | |
Undistributed Net Investment Income (Loss) | | Accumulated Net Realized Gain (Loss) on Investments | | | Additional Paid-In Capital | |
| $2,620,399 | | $ | (2,620,399 | ) | | $ | — | |
The reclassifications for the Fund are primarily due to deemed dividends adjustment.
Notes to Financial Statements (continued)
During the years ended October 31, 2017 and October 31, 2016, the tax character of distributions paid as reflected in the Statements of Changes in Net Assets was as follows:
| | | | | | | | |
| | | 2017 | | | 2016 | |
Distributions paid from: | | | | | | | | |
Ordinary Income | | $ | 14,271,729 | | | $ | 41,495,561 | |
Long-Term Capital Gain | | | 13,550,742 | | | | 29,435,201 | |
Total | | $ | 27,822,471 | | | $ | 70,930,762 | |
Note 5–Custodian
State Street is the custodian of cash and securities held by the Fund. Custodial fees are charged to the Fund based on the Fund’s net assets and/or the market value of securities held by the Fund and the number of certain transactions incurred by the Fund.
Note 6–Line of Credit
The Fund and certain other funds managed by New York Life Investments, maintain a line of credit with a syndicate of banks in order to secure a source of funds for temporary purposes to meet unanticipated or excessive redemption requests.
Effective August 1, 2017, under the credit agreement (the “Credit Agreement”), the aggregate commitment amount is $600,000,000 with an additional uncommitted amount of $100,000,000. The commitment fee is an annual rate of 0.15% of the average commitment amount payable quarterly, regardless of usage, to State Street, who serves as the agent to the syndicate. The commitment fee is allocated among the Fund and certain other funds managed by New York Life Investments based upon their respective net assets and other factors. Interest on any revolving credit loan is charged based upon the Federal Funds Rate or the one-month LIBOR, whichever is higher. The Credit Agreement expires on July 31, 2018, although the Fund, certain other funds managed by New York Life Investments and the syndicate of banks may renew the Credit Agreement for an additional year on the same or different terms. Prior to August 1, 2017, the aggregate commitment amount and commitment fee of the previous credit agreement were the same as those under the Credit Agreement, but Bank of New York Mellon served as agent to the syndicate. During the year ended October 31, 2017, there were no borrowings made or outstanding with respect to the Fund under the Credit Agreement or the credit agreement for which Bank of New York Mellon served as agent.
Note 7–Interfund Lending Program
Pursuant to an exemptive order issued by the SEC, the Fund, along with certain other funds managed by New York Life Investments, may participate in an interfund lending program. The interfund lending program provides an alternative credit facility that permits the Fund and certain other funds managed by New York Life Investments to lend or borrow money for temporary purposes directly to or from one another subject to the conditions of the exemptive order. During the year ended October 31, 2017, there were no interfund loans made or outstanding with respect to the Fund.
Note 8–Purchases and Sales of Securities (in 000’s)
During the year ended October 31, 2017, purchases and sales of securities, other than short-term securities, were $531,713 and $352,883, respectively.
Note 9–Capital Share Transactions
| | | | | | | | |
Class A | | Shares | | | Amount | |
Year ended October 31, 2017: | | | | | | | | |
Shares sold | | | 7,047,066 | | | $ | 119,088,807 | |
Shares issued to shareholders in reinvestment of dividends and distributions | | | 693,680 | | | | 11,565,480 | |
Shares redeemed | | | (5,380,336 | ) | | | (90,991,876 | ) |
| | | | |
Net increase (decrease) in shares outstanding before conversion | | | 2,360,410 | | | | 39,662,411 | |
Shares converted into Class A (See Note 1) | | | 2,256,234 | | | | 39,055,267 | |
Shares converted from Class A (See Note 1) | | | (886,885 | ) | | | (15,116,071 | ) |
| | | | | | | | |
Net increase (decrease) | | | 3,729,759 | | | $ | 63,601,607 | |
| | | | | | | | |
Year ended October 31, 2016: | | | | | | | | |
Shares sold | | | 3,284,280 | | | $ | 50,403,497 | |
Shares issued to shareholders in reinvestment of dividends and distributions | | | 2,082,474 | | | | 31,629,994 | |
Shares redeemed | | | (6,883,719 | ) | | | (104,854,396 | ) |
| | | | | | | | |
Net increase (decrease) in shares outstanding before conversion | | | (1,516,965 | ) | | | (22,820,905 | ) |
Shares converted into Class A (See Note 1) | | | 396,841 | | | | 6,120,797 | |
Shares converted from Class A (See Note 1) | | | (154,110 | ) | | | (2,355,927 | ) |
| | | | | | | | |
Net increase (decrease) | | | (1,274,234 | ) | | $ | (19,056,035 | ) |
| | | | | | | | |
| | |
| | | | | | | | |
Investor Class | | Shares | | | Amount | |
Year ended October 31, 2017: | | | | | | | | |
Shares sold | | | 517,721 | | | $ | 8,778,329 | |
Shares issued to shareholders in reinvestment of dividends and distributions | | | 135,820 | | | | 2,252,806 | |
Shares redeemed | | | (506,890 | ) | | | (8,576,771 | ) |
| | | | | | | | |
Net increase (decrease) in shares outstanding before conversion | | | 146,651 | | | | 2,454,364 | |
Shares converted into Investor Class (See Note 1) | | | 188,275 | | | | 3,200,427 | |
Shares converted from Investor Class (See Note 1) | | | (2,216,858 | ) | | | (38,363,861 | ) |
| | | | | | | | |
Net increase (decrease) | | | (1,881,932 | ) | | $ | (32,709,070 | ) |
| | | | | | | | |
Year ended October 31, 2016: | | | | | | | | |
Shares sold | | | 327,950 | | | $ | 5,043,298 | |
Shares issued to shareholders in reinvestment of dividends and distributions | | | 430,056 | | | | 6,531,000 | |
Shares redeemed | | | (586,510 | ) | | | (8,999,265 | ) |
| | | | | | | | |
Net increase (decrease) in shares outstanding before conversion | | | 171,496 | | | | 2,575,033 | |
Shares converted into Investor Class (See Note 1) | | | 255,273 | | | | 3,925,439 | |
Shares converted from Investor Class (See Note 1) | | | (344,452 | ) | | | (5,327,822 | ) |
| | | | | | | | |
Net increase (decrease) | | | 82,317 | | | $ | 1,172,650 | |
| | | | | | | | |
| | |
| 26 | | MainStay Convertible Fund |
| | | | | | | | |
Class B | | Shares | | | Amount | |
Year ended October 31, 2017: | | | | | | | | |
Shares sold | | | 123,659 | | | $ | 2,058,626 | |
Shares issued to shareholders in reinvestment of dividends and distributions | | | 24,550 | | | | 403,492 | |
Shares redeemed | | | (274,643 | ) | | | (4,623,932 | ) |
| | | | | | | | |
Net increase (decrease) in shares outstanding before conversion | | | (126,434 | ) | | | (2,161,814 | ) |
Shares converted from Class B (See Note 1) | | | (151,045 | ) | | | (2,562,426 | ) |
| | | | | | | | |
Net increase (decrease) | | | (277,479 | ) | | $ | (4,724,240 | ) |
| | | | | | | | |
Year ended October 31, 2016: | | | | | | | | |
Shares sold | | | 128,418 | | | $ | 1,958,707 | |
Shares issued to shareholders in reinvestment of dividends and distributions | | | 110,154 | | | | 1,666,215 | |
Shares redeemed | | | (305,286 | ) | | | (4,642,547 | ) |
| | | | | | | | |
Net increase (decrease) in shares outstanding before conversion | | | (66,714 | ) | | | (1,017,625 | ) |
Shares converted from Class B (See Note 1) | | | (177,956 | ) | | | (2,732,887 | ) |
| | | | | | | | |
Net increase (decrease) | | | (244,670 | ) | | $ | (3,750,512 | ) |
| | | | | | | | |
| | |
| | | | | | | | |
Class C | | Shares | | | Amount | |
Year ended October 31, 2017: | | | | | | | | |
Shares sold | | | 1,179,483 | | | $ | 19,833,250 | |
Shares issued to shareholders in reinvestment of dividends and distributions | | | 81,268 | | | | 1,334,519 | |
Shares redeemed | | | (1,487,251 | ) | | | (24,998,988 | ) |
| | | | | | | | |
Net increase (decrease) in shares outstanding before conversion | | | (226,500 | ) | | | (3,831,219 | ) |
Shares converted from Class C (See Note 1) | | | (706 | ) | | | (11,550 | ) |
| | | | | | | | |
Net increase (decrease) | | | (227,206 | ) | | $ | (3,842,769 | ) |
| | | | | | | | |
Year ended October 31, 2016: | | | | | | | | |
Shares sold | | | 705,686 | | | $ | 10,787,840 | |
Shares issued to shareholders in reinvestment of dividends and distributions | | | 345,750 | | | | 5,223,109 | |
Shares redeemed | | | (1,744,065 | ) | | | (26,501,422 | ) |
| | | | | | | | |
Net increase (decrease) in shares outstanding before conversion | | | (692,629 | ) | | | (10,490,473 | ) |
Shares converted from Class C (See Note 1) | | | (6,021 | ) | | | (84,656 | ) |
| | | | | | | | |
Net increase (decrease) | | | (698,650 | ) | | $ | (10,575,129 | ) |
| | | | | | | | |
| | |
| | | | | | | | |
| | | | | | | | |
Class I | | Shares | | | Amount | |
Year ended October 31, 2017: | | | | | | | | |
Shares sold | | | 23,037,821 | | | $ | 390,684,500 | |
Shares issued to shareholders in reinvestment of dividends and distributions | | | 495,163 | | | | 8,342,082 | |
Shares redeemed | | | (8,767,214 | ) | | | (149,293,046 | ) |
| | | | | | | | |
Net increase (decrease) in shares outstanding before conversion | | | 14,765,770 | | | | 249,733,536 | |
Shares converted into Class I (See Note 1) | | | 807,465 | | | | 13,798,214 | |
| | | | | | | | |
Net increase (decrease) | | | 15,573,235 | | | $ | 263,531,750 | |
| | | | | | | | |
Year ended October 31, 2016: | | | | | | | | |
Shares sold | | | 6,838,634 | | | $ | 104,870,026 | |
Shares issued to shareholders in reinvestment of dividends and distributions | | | 1,017,672 | | | | 15,483,637 | |
Shares redeemed | | | (9,853,762 | ) | | | (150,262,953 | ) |
| | | | | | | | |
Net increase (decrease) in shares outstanding before conversion | | | (1,997,456 | ) | | | (29,909,290 | ) |
Shares converted into Class I (See Note 1) | | | 29,411 | | | | 455,056 | |
| | | | | | | | |
Net increase (decrease) | | | (1,968,045 | ) | | $ | (29,454,234 | ) |
| | | | | | | | |
Note 10–Subsequent Events
In connection with the preparation of the financial statements of the Fund as of and for the year ended October 31, 2017, events and transactions subsequent to October 31, 2017, through the date the financial statements were issued have been evaluated by the Fund’s management for possible adjustment and/or disclosure. No subsequent events requiring financial statement adjustment or disclosure have been identified.
Report of Independent Registered Public Accounting Firm
The Board of Trustees and Shareholders of
The MainStay Funds:
We have audited the accompanying statement of assets and liabilities, including the portfolio of investments, of MainStay Convertible Fund (the “Fund”), one of the funds constituting The MainStay Funds, as of October 31, 2017, and the related statement of operations for the year then ended, the statements of changes in net assets for each of the years in the two-year period then ended, and the financial highlights for each of the years in the five-year period then ended. These financial statements and financial highlights are the responsibility of the Fund’s management. Our responsibility is to express an opinion on these financial statements and financial highlights based on our audits.
We conducted our audits in accordance with the standards of the Public Company Accounting Oversight Board (United States). Those standards require that we plan and perform the audit to obtain reasonable assurance about whether the financial statements and financial highlights are free of material misstatement. An audit includes examining, on a test basis, evidence supporting the amounts and disclosures in the financial statements. Our procedures included confirmation of securities owned as of October 31, 2017 by correspondence with the custodian and brokers or by other appropriate auditing procedures where replies from brokers were not received. An audit also includes assessing the accounting principles used and significant estimates made by management, as well as evaluating the overall financial statement presentation. We believe that our audits provide a reasonable basis for our opinion.
In our opinion, the financial statements and financial highlights referred to above present fairly, in all material respects, the financial position of MainStay Convertible Fund as of October 31, 2017, the results of its operations for the year then ended, the changes in its net assets for each of the years in the two-year period then ended, and the financial highlights for each of the years in the five-year period then ended, in conformity with U.S. generally accepted accounting principles.

Philadelphia, Pennsylvania
December 21, 2017
| | |
| 28 | | MainStay Convertible Fund |
Other Matters
(Unaudited)
At a meeting held on June 22, 2017, the Board approved submitting the following proposal (“Proposal”) to shareholders of the Funds at a special meeting held on October 23, 2017 (with any postponements or adjournments, “Special Meeting”):
To elect eight Trustees to the Board.
On or about September 28, 2017, shareholders of record of the Funds as of the close of business on August 24, 2017 were sent a proxy statement containing information regarding the Proposal. The proxy statement also included information about the Special Meeting, at which shareholders of the Funds were asked to consider and approve the Proposal. In addition, the proxy statement included information about voting on the Proposal and options shareholders had to do so.
The Special Meeting was held on October 23, 2017, and the Proposal passed.
The results of the Special Meeting (all Funds and classes thereof voting together) were as follows:
Proposal—To elect eight Trustees to the Board:
Yie-Hsin Hung:
| | | | |
Votes
For | | Votes
Witheld | | Total |
| 2,644,056,263.750 | | 21,799,781.292 | | 2,665,856,045.042 |
David H. Chow:
| | | | |
Votes
For | | Votes
Witheld | | Total |
| 2,644,576,776.557 | | 21,279,268.485 | | 2,665,856,045.042 |
Susan B. Kerley:
| | | | |
Votes
For | | Votes
Witheld | | Total |
| 2,645,459,747.343 | | 20,396,297.699 | | 2,665,856,045.042 |
Alan R. Latshaw:
| | | | |
Votes
For | | Votes
Witheld | | Total |
| 2,644,443,039.401 | | 21,413,005.641 | | 2,665,856,045.042 |
Peter Meenan:
| | | | |
Votes
For | | Votes
Witheld | | Total |
| 2,640,156,421.578 | | 25,699,623.464 | | 2,665,856,045.042 |
Richard H. Nolan, Jr.:
| | | | |
Votes
For | | Votes
Witheld | | Total |
| 2,641,415,514.849 | | 24,440,530.193 | | 2,665,856,045.042 |
Jacques P. Perold:
| | | | |
Votes
For | | Votes
Witheld | | Total |
| 2,645,300,993.731 | | 20,555,051.311 | | 2,665,856,045.042 |
Richard S. Trutanic:
| | | | |
Votes
For | | Votes
Witheld | | Total |
| 2,641,761,336.311 | | 24,094,708.731 | | 2,665,856,045.042 |
Federal Income Tax Information
(Unaudited)
The Fund is required under the Internal Revenue Code to advise shareholders in a written statement as to the federal tax status of dividends paid by the Fund during such fiscal years.
For the fiscal year ended October 31, 2017, the Fund designated approximately $4,525,734 under the Internal Revenue Code as qualified dividend income eligible for reduced tax rates.
The dividends paid by the Fund during the fiscal year ended October 31, 2017 should be multiplied by the 38.56% to arrive at the amount eligible for the corporate dividend-received deduction.
In February 2018, shareholders will receive an IRS Form 1099-DIV or substitute Form 1099, which will show the federal tax status of the distributions received by shareholders in calendar year 2017. The amounts that will be reported on such 1099-DIV or substitute Form 1099 will be the amounts you are to use on your federal income tax return and will differ from the amounts which we must report for the Fund’s fiscal year end October 31, 2017.
Proxy Voting Policies and Procedures and Proxy Voting Record
A description of the policies and procedures that New York Life Investments uses to vote proxies related to the Fund’s securities is available without charge, upon request, (i) by visiting the MainStay Funds’ website at mainstayinvestments.com; and (ii) on the Securities and Exchange Commission’s (“SEC”) website at www.sec.gov.
The Fund is required to file with the SEC its proxy voting records for the Fund for the 12-month period ending June 30 on Form N-PX. The most recent Form N-PX or proxy voting record is available free of charge upon request by calling 800-MAINSTAY (624-6782); visiting the MainStay Funds’ website at mainstayinvestments.com; or on the SEC’s website at www.sec.gov.
Shareholder Reports and Quarterly Portfolio Disclosure
The Fund is required to file its complete schedule of portfolio holdings with the SEC for its first and third fiscal quarters on Form N-Q. The Fund’s Form N-Q is available without charge, on the SEC’s website at www.sec.gov or by calling MainStay Investments at 800-MAINSTAY (624-6782). You also can obtain and review copies of Form N-Q by visiting the SEC’s Public Reference Room in Washington, DC (information on the operation of the Public Reference Room may be obtained by calling 1-800-SEC-0330).
Board of Trustees and Officers (Unaudited)
The Trustees and officers of the Funds are listed below. The Board oversees the MainStay Group of Funds (which consists of The MainStay Funds and MainStay Funds Trust), MainStay VP Funds Trust, MainStay DefinedTerm Municipal Opportunities Fund, the Manager and the Subadvisors, and elects the officers of the Funds who are responsible for the day-to-day operations of the Funds. Information pertaining to the Trustees and officers is set forth below. Each Trustee serves until his or her successor is elected and qualified or until his or her resignation, death or removal. Under the Board’s retirement policy, unless an exception is made, a Trustee must tender his or her resignation by the
end of the calendar year during which he or she reaches the age of 75. Mr. Meenan reached the age of 75 during the calendar year 2016, and his term was extended for one additional year. Accordingly, Mr. Meenan is expected to serve until the end of calendar year 2017, at which time he intends to retire. Officers are elected annually by the Board. The business address of each Trustee and officer listed below is 51 Madison Avenue, New York, New York 10010. A majority of the Trustees are not “interested persons” (as defined by the 1940 Act and rules adopted by the SEC thereunder) of the Fund (“Independent Trustees”).
| | | | | | | | | | | | |
| | | | | Name and Date of Birth | | Term of Office, Position(s) Held and Length of Service | | Principal Occupation(s) During Past Five Years | | Number of
Portfolios in
the MainStay
Group of Funds
Overseen by
Trustee | | Other Directorships Held by Trustee |
| Interested Trustee | | | | Yie-Hsin Hung* 8/12/62 | | The MainStay Funds: Trustee since January 2017; MainStay Funds Trust: Trustee since January 2017. | | Senior Vice President of New York Life since joining in 2010, Member of the Executive Management Committee since January 1, 2017, Chief Executive Officer, New York Life Investment Management Holdings LLC & New York Life Investment Management LLC since May 2015. Senior Managing Director and Co-President of New York Life Investment Management LLC from January 2014 to May 2015. Previously held positions of increasing responsibility, including head of NYLIM International, Alternative Growth Businesses, and Institutional investments since joining New York Life in 2010. | | 82 | | None |
| | * | This Trustee is considered to be an “interested person” of the MainStay Group of Funds, MainStay VP Funds Trust and MainStay DefinedTerm Municipal Opportunities Fund, within the meaning of the 1940 Act because of her affiliation with New York Life Insurance Company, New York Life Investment Management LLC, Candriam Belgium, Candriam France S.A.S., Cornerstone Capital Management Holdings LLC, MacKay Shields LLC, NYL Investors LLC, NYLIFE Securities LLC and/or NYLIFE Distributors LLC, as described in detail above in the column entitled “Principal Occupation(s) During Past Five Years.” |
| | |
| 30 | | MainStay Convertible Fund |
| | | | | | | | | | | | |
| | | | | Name and Date of Birth | | Term of Office, Position(s) Held and Length of Service | | Principal Occupation(s) During Past Five Years | | Number of
Portfolios in
the MainStay
Group of Funds
Overseen by
Trustee | | Other Directorships Held by Trustee |
| Independent Trustees | | | | David H. Chow 12/29/57 | | The MainStay Funds: Trustee since January 2016, Advisory Board Member (June 2015 to December 2015); MainStay Funds Trust: Trustee since January 2016, Advisory Board Member (June 2015 to December 2015). | | Founder and CEO, DanCourt Management, LLC (since 1999) | | 82 | | VanEck Vectors Group of Exchange-Traded Funds: Independent Chairman of the Board of Trustees since 2008 and Trustee since 2006 (57 portfolios); and
Berea College of Kentucky: Trustee since 2009. |
| | | | Susan B. Kerley 8/12/51 | | The MainStay Funds: Chairman since January 2017 and Trustee since 2007; MainStay Funds Trust: Chairman since January 2017 and Trustee since 1990.** | | President, Strategic Management Advisors LLC (since 1990) | | 82 | | Legg Mason Partners Funds: Trustee since 1991 (54 portfolios). |
| | | | Alan R. Latshaw 3/27/51 | | The MainStay Funds: Trustee and Audit Committee Financial Expert since 2006; MainStay Funds Trust: Trustee and Audit Committee Financial Expert since 2007.** | | Retired; Partner, Ernst & Young LLP (2002 to 2003); Partner, Arthur Andersen LLP (1989 to 2002); Consultant to the MainStay Funds Audit and Compliance Committee (2004 to 2006) | | 82 | | State Farm Associates Funds Trusts: Trustee since 2005 (4 portfolios);
State Farm Mutual Fund Trust: Trustee since 2005 (15 portfolios); and
State Farm Variable Product Trust: Trustee since 2005 (9 portfolios). |
| | | | Peter Meenan 12/5/41 | | The MainStay Funds: Trustee since 2007; MainStay Funds Trust: Trustee since 2002.** | | Retired; Independent Consultant (2004 to 2013); President and Chief Executive Officer, Babson—United, Inc. (financial services firm) (2000 to 2004); Independent Consultant (1999 to 2000); Head of Global Funds, Citicorp (1995 to 1999) | | 82 | | None |
| | | | Richard H. Nolan, Jr. 11/16/46 | | The MainStay Funds: Trustee since 2007; MainStay Funds Trust: Trustee since 2007.** | | Managing Director, ICC Capital Management (since 2004); President—Shields/Alliance, Alliance Capital Management (1994 to 2004) | | 82 | | None |
| | | | Jacques P. Perold 5/12/58 | | The MainStay Funds: Trustee since January 2016, Advisory Board Member (June 2015 to December 2015); MainStay Funds Trust: Trustee since January 2016, Advisory Board Member (June 2015 to December 2015). | | Retired; President, Fidelity Management & Research Company (2009 to 2014); Founder, President and Chief Executive Officer, Geode Capital Management, LCC (2001 to 2009) | | 82 | | Allstate Corporation: Director since 2015; MSCI, Inc. Director since March 2017 and
Boston University: Trustee since 2014. |
| | | | Richard S. Trutanic 2/13/52 | | The MainStay Funds: Trustee since 1994; MainStay Funds Trust: Trustee since 2007.** | | Chairman and Chief Executive Officer, Somerset & Company (financial advisory firm) (since 2004); Managing Director, The Carlyle Group (private investment firm) (2002 to 2004); Senior Managing Director, Partner and Board Member, Groupe Arnault S.A. (private investment firm) (1999 to 2002) | | 82 | | None |
| | ** | Includes prior service as a Director/Trustee of certain predecessor entities to MainStay Funds Trust. |
| | | | | | | | |
| | | | | Name and Date of Birth | | Position(s) Held and Length of Service | | Principal Occupation(s) During Past Five Years |
Officers of the Trust (Who are not Trustees)* | | | | Kirk C. Lehneis 6/29/74 | | President, The MainStay Funds, MainStay Funds Trust (since September 2017) | | Chief Operating Officer and Senior Managing Director (since 2016), New York Life Investment Management LLC; Chairman of the Board (since September 2017), NYLIFE Distributors LLC; Chairman of the Board, NYLIM Service Company LLC (since September 2017); President, MainStay DefinedTerm Municipal Opportunities Fund and MainStay VP Funds Trust (since September 2017); Senior Managing Director, Global Product Development (From March 2015—May 2016); Managing Director, Product Development (From March 2010—February 2015) |
| | | | Jack R. Benintende 5/12/64 | | Treasurer and Principal Financial and Accounting Officer, The MainStay Funds (since 2007), MainStay Funds Trust (since 2009) | | Managing Director, New York Life Investment Management LLC (since 2007); Treasurer and Principal Financial and Accounting Officer, MainStay DefinedTerm Municipal Opportunities Fund (since 2011) and MainStay VP Funds Trust (since 2007)**; and Assistant Treasurer, New York Life Investment Management Holdings LLC (2008 to 2012) |
| | | | Kevin M. Bopp 2/24/69 | | Vice President and Chief Compliance Officer, The MainStay Funds and MainStay Funds Trust (since 2014) | | Chief Compliance Officer, New York Life Investment Management LLC, IndexIQ ETF (since January 2016), Director and Associate General Counsel (2011 to 2014) and Vice President and Assistant General Counsel (2010 to 2011), New York Life Investment Management LLC; Vice President and ChiefCompliance Officer, MainStay VP Funds Trust, MainStay DefinedTerm Municipal Opportunities Fund (since 2014); Assistant Secretary, MainStay Funds, MainStay Funds Trust and MainStay VP Funds Trust (2010 to 2014)**, MainStay DefinedTerm Municipal Opportunities Fund (2011 to 2014) |
| | | | J. Kevin Gao 10/13/67 | | Secretary and Chief Legal Officer, The MainStay Funds and MainStay Funds Trust (since 2010) | | Managing Director and Associate General Counsel, New York Life Investment Management LLC (since 2010); Secretary and Chief Legal Officer, MainStay DefinedTerm Municipal Opportunities Fund (since 2011) and MainStay VP Funds Trust (since 2010)** |
| | | | Scott T. Harrington 2/8/59 | | Vice President—Administration, The MainStay Funds (since 2005), MainStay Funds Trust (since 2009) | | Director, New York Life Investment Management LLC (including predecessor advisory organizations) (since 2000); Member of the Board of Directors, New York Life Trust Company (since 2009); Vice President—Administration, MainStay DefinedTerm Municipal Opportunities Fund (since 2011) and MainStay VP Funds Trust (since 2005)** |
| | * | The officers listed above are considered to be “interested persons” of the MainStay Group of Funds, MainStay VP Funds Trust and MainStay Defined Term Municipal Opportunities Fund within the meaning of the 1940 Act because of their affiliation with the MainStay Group of Funds, New York Life Insurance Company and/or its affiliates, including New York Life Investment Management LLC, NYLIM Service Company LLC, NYLIFE Securities LLC and/or NYLIFE Distributors LLC, as described in detail in the column captioned “Principal Occupation(s) During Past Five Years.” Officers are elected annually by the Board. |
| | ** | Includes prior service as an officer of MainStay VP Series Fund, Inc., the predecessor to MainStay VP Funds Trust. |
| | |
| 32 | | MainStay Convertible Fund |
This page intentionally left blank
This page intentionally left blank
MainStay Funds
Equity
U.S. Equity
MainStay Common Stock Fund
MainStay Cornerstone Growth Fund
MainStay Epoch U.S. All Cap Fund
MainStay Epoch U.S. Equity Yield Fund
MainStay Epoch U.S. Small Cap Fund
MainStay Large Cap Growth Fund
MainStay MAP Equity Fund
MainStay S&P 500 Index Fund
MainStay U.S. Equity Opportunities Fund
International/Global Equity
MainStay Candriam Emerging Markets Equity Fund
MainStay Emerging Markets Equity Fund
MainStay Epoch Capital Growth Fund
MainStay Epoch Global Choice Fund
MainStay Epoch Global Equity Yield Fund
MainStay Epoch International Choice Fund
MainStay Epoch International Small Cap Fund
MainStay International Equity Fund
MainStay International Opportunities Fund
Income
Taxable Bond
MainStay Emerging Markets Debt Fund
MainStay Floating Rate Fund
MainStay Government Fund
MainStay High Yield Corporate Bond Fund
MainStay Indexed Bond Fund
MainStay Short Duration High Yield Fund
MainStay Total Return Bond Fund
MainStay Unconstrained Bond Fund
Municipal/Tax Advantaged Bond
MainStay California Tax Free Opportunities Fund1
MainStay High Yield Municipal Bond Fund
MainStay New York Tax Free Opportunities Fund2
MainStay Tax Advantaged Short Term Bond Fund
MainStay Tax Free Bond Fund
Money Market
MainStay Money Market Fund
Mixed Asset
MainStay Balanced Fund
MainStay Convertible Fund
MainStay Income Builder Fund
Alternative
MainStay Absolute Return Multi-Strategy Fund
MainStay Cushing Energy Income Fund
MainStay Cushing MLP Premier Fund
MainStay Cushing Renaissance Advantage Fund
Asset Allocation/Target Date
MainStay Conservative Allocation Fund
MainStay Growth Allocation Fund
MainStay Moderate Allocation Fund
MainStay Moderate Growth Allocation Fund
MainStay Retirement 2010 Fund
MainStay Retirement 2020 Fund
MainStay Retirement 2030 Fund
MainStay Retirement 2040 Fund
MainStay Retirement 2050 Fund
MainStay Retirement 2060 Fund
Manager
New York Life Investment Management LLC
New York, New York
Subadvisors
Candriam Belgium S.A.3
Brussels, Belgium
Candriam France S.A.S.3
Paris, France
Cornerstone Capital Management Holdings LLC3
New York, New York
Cushing Asset Management, LP
Dallas, Texas
Epoch Investment Partners, Inc.
New York, New York
MacKay Shields LLC3
New York, New York
Markston International LLC
White Plains, New York
NYL Investors LLC3
New York, New York
Winslow Capital Management, LLC
Minneapolis, Minnesota
Legal Counsel
Dechert LLP
Washington, District of Columbia
Independent Registered Public Accounting Firm
KPMG LLP
Philadelphia, Pennsylvania
1. Class A and Class I shares of this Fund are registered for sale in AZ, CA, MI, NV, OR, TX, UT and WA. Class I shares are registered for sale in CO, FL, GA, HI, ID, MA, MD, NH, NJ and NY.
2. This Fund is registered for sale in CA, CT, DE, FL, MA, NJ, NY and VT.
3. An affiliate of New York Life Investment Management LLC.
Not part of the Annual Report
For more information
800-MAINSTAY (624-6782)
mainstayinvestments.com
MainStay Investments® is a registered service mark and name under which New York Life Investment Management LLC does business. MainStay Investments, an indirect subsidiary of New York Life Insurance Company, New York, NY 10010, provides investment advisory products and services. The MainStay Funds® are managed by New York Life Investment Management LLC and distributed by NYLIFE Distributors LLC, 30 Hudson Street, Jersey City, NJ 07302, a wholly owned subsidiary of New York Life Insurance Company. NYLIFE Distributors LLC is a Member FINRA/SIPC.
©2017 NYLIFE Distributors LLC. All rights reserved.
| | | | | | | | |
| Not FDIC/NCUA Insured | | Not a Deposit | | May Lose Value | | No Bank Guarantee | | Not Insured by Any Government Agency |
| | |
| 1716013 MS286-17 | | MSC11-12/17 (NYLIM) NL210 |
MainStay Income Builder Fund
Message from the President and Annual Report
October 31, 2017


This page intentionally left blank
Message from the President
The 12 months ended October 31, 2017, brought strong performance to equity markets in the United States and abroad.
According to FTSE-Russell data for the U.S. market, stocks at all capitalization levels earned solid double-digit overall returns during the reporting period. Total returns for stocks in general exceeded 20% at all capitalization levels. Growth stocks were particularly strong, outperforming value stocks for companies of all sizes except among microcaps, where value stocks outperformed growth stocks.
Several factors contributed to the strength of domestic and international stock markets during the reporting period. Following the U.S. presidential election in November 2016, many investors looked forward to business tax incentives and possible tax cuts for consumers that could stimulate economic growth. During the reporting period, corporate earnings reports remained strong; and growth in U.S. real gross domestic product remained positive, with a substantial advance during the second quarter of 2017. Developed international markets and emerging markets were also strong, boosted by positive macroeconomic data and growing confidence that Europe was well on its way to financial recovery. Despite wide variations among emerging markets, many saw strong appreciation in local-currency terms and benefited from a weaker U.S. dollar.
During the reporting period, the Federal Open Market Committee raised the federal funds target range three times—in December of 2016 and in March and June of 2017. These incremental increases raised the federal funds target range to 1.00% to 1.25% by the end of the reporting period. These tightening moves were followed by higher U.S. Treasury yields at all maturities, with the greatest increases at the short-end of the maturity spectrum.
As interest rates rise, bond prices tend to decline (and vice versa). As a result, some portions of the U.S. Treasury market recorded negative total returns during the reporting period. Agency securities posted small but positive total returns, as did
asset-backed and mortgage-backed securities. Other bond categories, particularly those with looser ties to U.S. interest rates, did considerably better. Emerging-market debt recorded solid single-digit returns; high-yield bonds were generally stronger; and convertible bonds, which are closely tied to the performance of underlying stocks, provided some of the strongest overall returns of any fixed-income sector during the reporting period.
At MainStay, we have always encouraged investors to diversify their investments and maintain a long-term perspective, even when markets are strong. Asset classes that perform well in one environment may perform differently in another; and in today’s ever-changing world, wide market swings are not unknown.
MainStay offers Funds with a wide array of investment objectives to help our shareholders pursue the appropriate diversification for their long-range financial goals. We also offer several investment boutiques, allowing our shareholders to choose the style—or mix of styles—that’s best suited to their investment needs. We believe that relatively few individual investors can match the level of professional experience and market insight that our portfolio managers provide.
The report that follows provides more detailed information on the specific markets, investment strategies and portfolio decisions that affected your MainStay Fund during the 12 months ended October 31, 2017. We encourage you to read the report carefully and use it to help you evaluate your progress toward your financial goals.
Sincerely,

Kirk C. Lehneis
President
The opinions expressed are as of the date of this report and are subject to change. There is no guarantee that any forecast made will come to pass. This material does not constitute investment advice and is not intended as an endorsement of any specific investment. Past performance is no guarantee of future results.
Not part of the Annual Report
Table of Contents
Investors should refer to the Fund’s Summary Prospectus and/or Prospectus and consider the Fund’s investment objectives, strategies, risks, charges and expenses carefully before investing. The Summary Prospectus and/or Prospectus contain this and other information about the Fund. You may obtain copies of the Fund’s Summary Prospectus, Prospectus and Statement of Additional Information free of charge, upon request, by calling toll-free 800-MAINSTAY (624-6782), by writing to NYLIFE Distributors LLC, Attn: MainStay Marketing Department, 30 Hudson Street, Jersey City, NJ 07302 or by sending an e-mail to MainStayShareholderServices@nylim.com. These documents are also available via the MainStay Funds’ website at mainstayinvestments.com/documents. Please read the Summary Prospectus and/or Prospectus carefully before investing.
Investment and Performance Comparison1 (Unaudited)
Performance data quoted represents past performance. Past performance is no guarantee of future results. Because of market volatility and other factors, current performance may be lower or higher than the figures shown. Investment return and principal value will fluctuate, and as a result, when shares are redeemed, they may be worth more or less than their original cost. The graph below depicts the historical performance of Class B shares2 of the Fund. Performance will vary from class to class based on differences in class-specific expenses and sales charges. For performance information current to the most recent month-end, please call 800-MAINSTAY (624-6782) or visit mainstayinvestments.com.
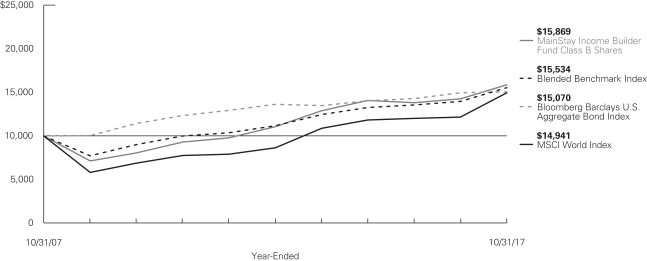
Average Annual Total Returns for the Year-Ended October 31, 2017
| | | | | | | | | | | | | | | | | | | | | | |
| Class | | Sales Charge | | | | Inception Date | | One Year | | | Five Years or Since Inception | | | Ten Years or Since Inception | | | Gross
Expense
Ratio3 | |
| Class A Shares | | Maximum 5.5% Initial Sales Charge | | With sales charges
Excluding sales charges | | 1/3/1995 | |
| 6.13
12.30 | %
| |
| 7.29
8.51 | %
| |
| 5.15
5.75 | %
| |
| 1.02
1.02 | %
|
| Investor Class Shares | | Maximum 5.5% Initial Sales Charge | | With sales charges
Excluding sales charges | | 2/28/2008 | |
| 6.02
12.19 |
| |
| 7.11
8.32 |
| |
| 5.86
6.48 |
| |
| 1.16
1.16 |
|
| Class B Shares2 | | Maximum 5% CDSC
if Redeemed Within the First Six Years of Purchase | | With sales charges Excluding sales charges | | 12/29/1987 | |
| 6.27
11.27 |
| |
| 7.21
7.51 |
| |
| 4.73
4.73 |
| |
| 1.91
1.91 |
|
| Class C Shares | | Maximum 1% CDSC
if Redeemed Within One Year of Purchase | | With sales charges
Excluding sales charges | | 9/1/1998 | |
| 10.35
11.35 |
| |
| 7.51
7.51 |
| |
| 4.73
4.73 |
| |
| 1.91
1.91 |
|
| Class I Shares | | No Sales Charge | | | | 1/2/2004 | | | 12.60 | | | | 8.80 | | | | 6.04 | | | | 0.77 | |
| Class R2 Shares | | No Sales Charge | | | | 2/27/2015 | | | 12.20 | | | | 4.36 | | | | N/A | | | | 1.12 | |
| Class R3 Shares | | No Sales Charge | | | | 2/29/2016 | | | 11.89 | | | | 12.88 | | | | N/A | | | | 1.36 | |
| 1. | The performance table and graph do not reflect the deduction of taxes that a shareholder would pay on distributions or Fund share redemptions. Total returns reflect maximum applicable sales charges as indicated in the table above, if any, changes in share price, and reinvestment of dividend and capital gain distributions. The graph assumes the initial investment amount shown above and reflects the deduction of all sales charges that would have applied for the period of investment. Performance figures may reflect certain fee waivers and/or expense limitations, without which total returns may have |
| | been lower. For more information on share classes and current fee waivers and/or expense limitations (if any), please refer to the Notes to Financial Statements. |
| 2. | Class B shares are closed to all new purchases as well as additional investments by existing Class B shareholders. |
| 3. | The gross expense ratios presented reflect the Fund’s “Total Annual Fund Operating Expenses” from the most recent Prospectus and may differ from other expense ratios disclosed in this report. |
The footnotes on the next page are an integral part of the table and graph and should be carefully read in conjunction with them.
| | | | | | | | | | | | |
| Benchmark Performance | | One
Year | | | Five Years
or Since
Inception | | | Ten Years
or Since
Inception | |
MSCI World Index4 | | | 22.77 | % | | | 11.56 | % | | | 4.10 | % |
Bloomberg Barclays U.S. Aggregate Bond Index5 | | | 0.90 | | | | 2.04 | | | | 4.19 | |
Blended Benchmark Index6 | | | 11.37 | | | | 6.83 | | | | 4.50 | |
Morningstar World Allocation Category Average7 | | | 13.60 | | | | 6.04 | | | | 3.72 | |
| 4. | The MSCI World Index is the Fund’s primary broad-based securities market index for comparison purposes. The MSCI World Index is a free float-adjusted market capitalization weighted index that is designed to measure the equity market performance of developed markets. Results assume reinvestment of all dividends and capital gains. An investment cannot be made directly in an index. |
| 5. | The Fund has selected the Bloomberg Barclays U.S. Aggregate Bond Index as a secondary benchmark. The Bloomberg Barclays U.S. Aggregate Bond Index is a broad-based benchmark that measures the investment grade, U.S. dollar-denominated, fixed-rate taxable bond market, including Treasurys, government-related and corporate securities, mortgage-backed securities (agency fixed-rate and hybrid adjustable rate mortgage pass-throughs), asset-backed securities, and commercial mortgage-backed securities. Results assume reinvestment of all dividends and capital gains. An investment cannot be made directly in an index. |
| 6. | The Fund has selected the Blended Benchmark Index as an additional benchmark. The Blended Benchmark Index consists of the MSCI World Index and the Bloomberg Barclays U.S. Aggregate Bond Index weighted 50%/50%, respectively. Results assume reinvestment of all dividends and capital gains. An investment cannot be made directly in an index. |
| 7. | The Morningstar World Allocation Category Average is representative of funds that seek to provide both capital appreciation and income by investing in three major areas: stocks, bonds, and cash. While these portfolios do explore the whole world, most of them focus on the U.S., Canada, Japan, and the larger markets in Europe. It is rare for such portfolios to invest more than 10% of their assets in emerging markets. These portfolios typically have at least 10% of assets in bonds, less than 70% of assets in stocks, and at least 40% of assets in non-U.S. stocks or bonds. Results are based on average total returns of similar funds with all dividends and capital gain distributions reinvested. |
The footnotes on the preceding page are an integral part of the table and graph and should be carefully read in conjunction with them.
| | |
| 6 | | MainStay Income Builder Fund |
Cost in Dollars of a $1,000 Investment in MainStay Income Builder Fund (Unaudited)
The example below is intended to describe the fees and expenses borne by shareholders during the six-month period from May 1, 2017, to October 31, 2017, and the impact of those costs on your investment.
Example
As a shareholder of the Fund you incur two types of costs: (1) transaction costs, including exchange fees and sales charges (loads) on purchases (as applicable), and (2) ongoing costs, including management fees, distribution and/or service (12b-1) fees, and other Fund expenses (as applicable). This example is intended to help you understand your ongoing costs (in dollars) of investing in the Fund and to compare these costs with the ongoing costs of investing in other mutual funds. The example is based on an investment of $1,000 made at the beginning of the six-month period and held for the entire period from May 1, 2017, to October 31, 2017.
This example illustrates your Fund’s ongoing costs in two ways:
Actual Expenses
The second and third data columns in the table below provide information about actual account values and actual expenses. You may use the information in these columns, together with the amount you invested, to estimate the expenses that you paid during the six months ended October 31, 2017. Simply divide your account value by $1,000 (for example, an $8,600 account value divided by $1,000 = 8.6), then
multiply the result by the number under the heading entitled “Expenses Paid During Period” to estimate the expenses you paid on your account during this period.
Hypothetical Example for Comparison Purposes
The fourth and fifth data columns in the table below provide information about hypothetical account values and hypothetical expenses based on the Fund’s actual expense ratio and an assumed rate of return of 5% per year before expenses, which is not the Fund’s actual return. The hypothetical account values and expenses may not be used to estimate the actual ending account balances or expenses you paid for the six-month period shown. You may use this information to compare the ongoing costs of investing in the Fund with the ongoing costs of investing in other mutual funds. To do so, compare this 5% hypothetical example with the 5% hypothetical examples that appear in the shareholder reports of the other mutual funds.
Please note that the expenses shown in the table are meant to highlight your ongoing costs only and do not reflect any transactional costs, such as exchange fees or sales charges (loads). Therefore, the fourth and fifth data columns of the table are useful in comparing ongoing costs only and will not help you determine the relative total costs of owning different funds. In addition, if these transactional costs were included, your costs would have been higher.
| | | | | | | | | | | | | | | | | | | | | | |
| | | | | | | | | | | | | | | | | | |
| Share Class | | Beginning
Account
Value
5/1/17 | | | Ending Account
Value (Based
on Actual
Returns and
Expenses)
10/31/17 | | | Expenses
Paid
During
Period1 | | | Ending Account
Value (Based
on Hypothetical
5% Annualized
Return and
Actual Expenses)
10/31/17 | | | Expenses
Paid
During
Period1 | | | Net Expense
Ratio
During
Period2 |
| | | | | | |
| Class A Shares | | $ | 1,000.00 | | | $ | 1,053.80 | | | $ | 5.23 | | | $ | 1,020.10 | | | $ | 5.14 | | | 1.01% |
| | | | | | |
| Investor Class Shares | | $ | 1,000.00 | | | $ | 1,053.60 | | | $ | 5.90 | | | $ | 1,019.50 | | | $ | 5.80 | | | 1.14% |
| | | | | | |
| Class B Shares | | $ | 1,000.00 | | | $ | 1,048.80 | | | $ | 9.81 | | | $ | 1,015.60 | | | $ | 9.65 | | | 1.89% |
| | | | | | |
| Class C Shares | | $ | 1,000.00 | | | $ | 1,049.40 | | | $ | 9.76 | | | $ | 1,015.70 | | | $ | 9.60 | | | 1.89% |
| | | | | | |
| Class I Shares | | $ | 1,000.00 | | | $ | 1,055.20 | | | $ | 3.94 | | | $ | 1,021.40 | | | $ | 3.87 | | | 0.76% |
| | | | | | |
| Class R2 Shares | | $ | 1,000.00 | | | $ | 1,053.30 | | | $ | 5.74 | | | $ | 1,019.60 | | | $ | 5.65 | | | 1.11% |
| | | | | | |
| Class R3 Shares | | $ | 1,000.00 | | | $ | 1,052.00 | | | $ | 7.03 | | | $ | 1,018.30 | | | $ | 6.92 | | | 1.36% |
| 1. | Expenses are equal to the Fund’s annualized expense ratio of each class multiplied by the average account value over the period, divided by 365 and multiplied by 184 (to reflect the six-month period). The table above represents the actual expenses incurred during the six-month period. |
| 2. | Expenses are equal to the Fund’s annualized expense ratio to reflect the six-month period. |
Portfolio Composition as of October 31, 2017 (Unaudited)
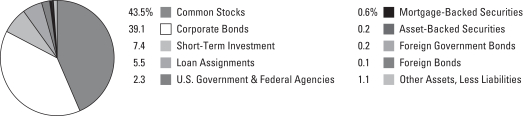
See Portfolio of Investments beginning on page 13 for specific holdings within these categories.
Top Ten Holdings or Issuers Held as of October 31, 2017 (excluding short-term investment) (Unaudited)
| 1. | United States Treasury Notes, 1.25%, due 10/31/21–7/31/23 |
| 2. | Goldman Sachs Group, Inc., 2.905%–7.50%, due 2/15/19–10/31/38 |
| 4. | Verizon Communications, Inc. |
| 5. | British American Tobacco PLC |
| 6. | Philip Morris International, Inc. |
| | |
| 8 | | MainStay Income Builder Fund |
Portfolio Management Discussion and Analysis (Unaudited)
Questions answered by portfolio managers Dan Roberts, PhD, Michael Kimble, CFA, and Louis N. Cohen, CFA, of MacKay Shields LLC (“MacKay Shields”), the Subadvisor for the fixed-income portion of the Fund, and William Priest, CFA, Michael Welhoelter, CFA, John Tobin, PhD, CFA, and Kera Van Valen, CFA, of Epoch Investment Partners, Inc. (“Epoch”), the Subadvisor for the equity portion of the Fund.
How did MainStay Income Builder Fund perform relative to its benchmarks and peers during the 12 months ended October 31, 2017?
Excluding all sales charges, MainStay Income Builder Fund returned 12.30% for Class A shares, 12.19% for Investor Class shares, 11.27% for Class B shares and 11.35% for Class C shares for the 12 months ended October 31, 2017. Over the same period, Class I shares returned 12.60%, Class R2 shares returned 12.20% and Class R3 shares returned 11.89%. For the 12 months ended October 31, 2017, all share classes underperformed the 22.77% return of the MSCI World Index,1 which is the Fund’s primary benchmark, and outperformed the 0.90% return of the Bloomberg Barclays U.S. Aggregate Bond Index,1 which is a secondary benchmark for the Fund. For the 12 months ended October 31, 2017, all share classes except Class B and Class C shares outperformed the 11.37% return of the Blended Benchmark Index,1 which is an additional benchmark for the Fund. Over the same period, all share classes underperformed the 13.60% return of the Morningstar World Allocation Category Average.2 See page 5 for Fund returns with applicable sales charges.
Were there any changes to the Fund since the semiannual report?
Effective October 31, 2017, Eric Sappenfield no longer served as a portfolio manager of the Fund. Michael Welhoelter, William Priest, Kera Van Valen and John M. Tobin continued to serve as portfolio managers of the Fund for the portion of the Fund subadvised by Epoch. Dan Roberts, Michael Kimble and Louis N. Cohen also continued to serve as portfolio managers of the Fund for the portion of the Fund subadvised by MacKay Shields. For more information on this change see the prospectus supplement dated August 17, 2017.
During the reporting period, how was the Fund’s performance materially affected by investments in derivatives?
During the reporting period, the fixed-income portion of the Fund used S&P 500® futures, and to a lesser extent Euro Stoxx 50 and Nikkei 225 futures, to enhance the Fund’s equity beta.3 The futures added to the Fund’s returns.
What factors affected the relative performance of the equity portion of the Fund during the reporting period?
The equity portion of the Fund held positions in a diversified group of companies that continued to grow free cash flow and
remained committed to consistently returning cash to shareholders through a combination of cash dividends, share buybacks and debt reduction. Although the strategy of the equity portion of the Fund performed as expected, this portion of the Fund lagged the MSCI World Index as stocks initially advanced sharply following the U.S. presidential election in November 2016 and were further boosted by the continued efforts of central bankers to stimulate economic growth. In 2017, the stock market continued to press forward on hopes of reforms under the Trump administration while simultaneously shrugging off geopolitical risks that were present across Europe. Elections across Europe ultimately proved uneventful; and a strengthening global economy, as evidenced by stronger corporate earnings and economic growth indicators out of Europe, the United States and Japan, provided support for equity markets into the third quarter. As a result, many economically sensitive sectors, most notably financials and information technology, significantly outperformed their defensive counterparts.
From a relative perspective, the underperformance of the equity portion of the Fund was driven primarily by sector allocations in this portion of the Fund. These allocations were an outcome of Epoch’s bottom-up fundamental investment process. Financials and technology, which were the best-performing sectors of the market during the reporting period, were among the largest detractors from relative performance. In particular, the equity portion of the Fund had lower exposure to banks, which hurt relative performance as banks advanced on higher bond yields and the promise of less regulation under the Trump administration. An overweight position in traditional yield-oriented sectors including telecommunication services, utilities and consumer staples also hurt relative performance in the equity portion of the Fund, as these sectors lagged the MSCI World Index.
Which sectors were the strongest contributors to relative performance in the equity portion of the Fund and which sectors were particularly weak?
In the equity portion of the Fund, the strongest-contributing sectors to performance relative to the MSCI World Index were energy, consumer discretionary and industrials. (Contributions take weightings and total returns into account.) This was largely due to stock selection within those sectors.
The weakest contributing sectors to performance relative to the Index in the equity portion of the Fund were information technology, telecommunications services and financials. The
| 1. | See footnote on page 6 for more information on this index. |
| 2. | See footnote on page 6 for more information on the Morningstar World Allocation Category Average. |
| 3. | Beta is a measure of volatility in relation to the market as a whole. A beta higher than 1 indicates that a security or portfolio will tend to exhibit higher volatility than the market. A beta lower than 1 indicates that a security or portfolio will tend to exhibit lower volatility than the market. |
equity portion of the Fund had underweight positions relative to the MSCI World Index in information technology and financials, both of which had large gains, and an overweight position in telecommunication services, which lagged the Index.
During the reporting period, which individual stocks made the strongest contributions to absolute performance in the equity portion of the Fund and which stocks detracted the most?
AbbVie, Allianz and McDonalds were among the stocks that provided the strongest contributions to absolute performance in the equity portion of the Fund during the reporting period. AbbVie is a global pharmaceutical company. The company’s share price was helped by continued positive momentum for the franchise drug Humira, encouraging acceptance of the blood cancer drug Imbruvica and favorable new pipeline developments, all as reflected in recent favorable quarterly earnings reports. In addition, the company was recently able to successfully repel a challenge to one of the patents protecting the Humira franchise. Historically, the company has paid an attractive, growing dividend that has been well-covered by free cash flow, and the company has also regularly repurchased shares. Shares of Allianz, a diversified insurance company, traded steadily higher along with other financials following the U.S. election, with additional support provided by the Federal Reserve’s multiple increases in the federal funds target range. Shares have been further boosted by consistently strong earnings results and management’s continued commitment to initiate a new share repurchase program. In the past, the company has had a transparent capital allocation policy; has paid an attractive, growing dividend that has been well-supported by earnings; and has held a strong regulatory capital position. McDonald’s is an operator and franchisor of McDonald’s restaurants, which serve a locally relevant menu of food and drinks in over 100 countries. During the reporting period, shares continued to benefit from investments in digital engagement, delivery, and the expansion of targeted initiatives. The company remained committed to rewarding shareholders through dividends and share buybacks.
In the equity portion of the Fund, QUALCOMM, Imperial Brands and Regal Entertainment Group detracted the most from absolute returns. QUALCOMM is a market leader in next-generation wireless technologies. Shares declined because of a royalty dispute with Apple. The company remained focused on closing its pending acquisition of industrial and automotive focused NXP Semiconductor, which we believe could diversify and improve cash flow growth. QUALCOMM has paid a growing dividend that
has remained covered even without Apple payments. The company also has an ongoing share repurchase program. Imperial Brands is a global tobacco manufacturer. Shares were under pressure (along with shares of the company’s tobacco peers) when the FDA commented on a desire to potentially reduce nicotine levels to non-addictive levels. While we believe that this is unlikely in the near term, shares were affected because Imperial Brands has modest exposure to U.S. regulations. Shares were further pressured as investors became concerned about the company’s growth opportunities without a strong position in next-generation products. Management has continued to strengthen the brand portfolio through brand migrations and SKU4 reductions and has remained committed to returning cash to shareholders through an attractive and growing dividend. Debt reduction is also expected to be a priority for cash over the next few years. Regal Entertainment operates a chain of movie theaters in the United States under the Regal Cinemas, Edwards Theaters and United Artists brands. With over 7,000 screens, the company is the largest theater circuit in the United States. Shares declined on lower-than-expected box-office results as several high-profile films underperformed. Persistent rumors regarding how soon viewers could watch new releases at home also hurt the stock’s performance. During the reporting period, the company continued to return cash through its attractive, steady dividend, and the company announced a share repurchase program.
Did the equity portion of the Fund make any significant purchases or sales during the reporting period?
The equity portion of the Fund made several purchases during the reporting period, including a position in energy partnership Magellan Midstream Partners and insurance company MetLife. Magellan’s cash flows are driven by mostly fee-based income, and growth is driven by the demand for new and expanded energy infrastructures that are tied to rising U.S. shale oil production. Magellan has consistently returned cash to shareholders through an attractive and growing partnership distribution. MetLife is one of the world’s largest insurance companies. We believe that growth for MetLife will reflect U.S. market expansion and dynamic opportunities to offer insurance and financial products in developing regions outside the United States. In our opinion, the company is well capitalized and is committed to rewarding shareholders with an attractive and growing dividend, debt reduction and share repurchases.
The equity portion of the Fund made several sales during the reporting period. The equity portion of the Fund closed its positions in Automatic Data Processing and Waste Management
| 4. | SKU is a shortened form of “stock keeping unit,” a measure of the number of distinguishable brands and brand variations that a company maintains. |
| | |
| 10 | | MainStay Income Builder Fund |
to enhance the overall yield of the equity portion of the Fund. Automatic Data Processing is a global provider of cloud-based human capital management solutions. Waste Management is the leading provider of comprehensive waste management services in North America. In addition, the equity portion of the Fund exited its position in Telstra, the dominant fixed and mobile line provider in Australia, because of concerns about the sustainability of the company’s dividend. TPG Telecom purchased spectrum in Australia and announced its intention to invest in building out a fourth wireless network in the country. This, coupled with management’s capital allocation review, led us to question whether the dividend could continue long term. Telstra has subsequently chosen to rebase the company’s dividend.
How did sector weightings in the equity portion of the Fund change during the reporting period?
There were no meaningful changes in sector weightings in the equity portion of the Fund during the reporting period.
How was the equity portion of the Fund positioned at the end of the reporting period?
As of October 31, 2017, the equity portion of the Fund had substantially overweight positions in the utilities and telecommunication services sectors. This positioning reflected the areas where Epoch’s screening process and its fundamental research were finding companies that best fit the goals of the equity portion of the Fund: to achieve an attractive absolute return, with the bulk of that return coming from cash dividends, share buybacks and debt reduction. As of the same date, the equity portion of the Fund had a substantially underweight position in the information technology sector. Many companies in this sector either do not pay dividends or their dividend payout is modest. We did, however, begin to see more technology companies return capital to shareholders than we had seen in the past.
What was the duration5 strategy of the fixed-income portion of the Fund during the reporting period?
As of October 31, 2017, the duration of the fixed-income portion of the Fund was 5.4 years, which was 0.6 years shorter than the 6.0-year duration of the Bloomberg Barclays U.S. Aggregate Bond Index as of the same date.
What specific factors, risks or market forces prompted significant decisions for the fixed-income portion of the Fund during the reporting period?
Throughout the reporting period the fixed-income portion of the Fund promoted credit risk as the principal driver of performance. We expected credit (investment-grade corporate bonds, high-yield corporate bonds and bank loans) to have returns superior to those of more rate-sensitive securities, such as U.S. Treasury securities and government-backed debt as investors pursued higher yields and a spread6 cushion in credit. Though we continued to believe that credit spreads could tighten modestly, the fixed-income portion of the Fund reduced its exposure to high-yield credits in favor of investment-grade credits as spreads continue to tighten.
During the reporting period, we also selectively and rather moderately, added to the weighting in markets in the fixed-income portion of the Fund, with a focus on quasi-sovereigns in stable regimes such as Mexico and on hard-currency corporates that could provide a margin of safety.
Although we believe that valuations generally remained fair across the credit sectors, in our opinion, greater vigilance may be needed as we navigate the late stages of the current economic cycle.
Which sectors were the strongest contributors to the absolute performance of the fixed-income portion of the Fund, and which sectors were particularly weak?
During the reporting period, the high-yield sector was the biggest contributor to the absolute performance of the fixed-income portion of the Fund. An overweight position in investment-grade credits and emerging-market exposure also contributed to absolute performance. Within credit in the fixed-income portion of the Fund, financial services, basic industry and technology were the top-performing sectors while retail lagged the overall market.
The fixed-income portion of the Fund combined an overweight position in credit with underweight positions in sectors that were more interest-rate sensitive, such as U.S. Treasury securities and mortgage-backed securities. These sectors were negatively affected by higher interest rates, so the underweight positions helped the performance of the fixed-income portion of the Fund.
| 5. | Duration is a measure of the price sensitivity of a fixed-income investment to changes in interest rates. Duration is expressed as a number of years and is considered a more accurate sensitivity gauge than average maturity. |
| 6. | The terms “spread” and “yield spread” may refer to the difference in yield between a security or type of security and comparable U.S. Treasury issues. The terms may also refer to the difference in yield between two specific securities or types of securities at a given time. |
Did the fixed-income portion of the Fund make any significant purchases or sales during the reporting period?
From a sector perspective, as credit spreads narrowed during the reporting period the fixed-income portion of the Fund trimmed its weighting in high-yield corporate bonds and added to its position in investment-grade corporates. To a lesser degree, the fixed-income portion of the Fund increased its weighting in emerging-market securities.
During the reporting period, the fixed-income portion of the Fund purchased bonds in Mexico-based chemical and petrochemical company Mexichem and bonds of storage and information management company Iron Mountain. Both positions were new issues with coupons that we found attractive and believed would be consistent cash generators.
During the reporting period, the fixed-income portion of the Fund sold its positions in kidney dialysis center operator Fresenius Medical Care and in aircraft leasing company Aviation Capital Group. These positions were sold as we identified better opportunities to deploy the assets of the fixed-income portion of the Fund.
How did the sector weightings change in the fixed-income portion of the Fund during the reporting period?
As previously noted, the fixed-income portion of the Fund trimmed its high-yield holdings in favor of investment-grade corporate bonds. The fixed-income portion of the Fund increased its position in emerging-market debt.
In the fixed-income portion of the Fund, exposure to commercial mortgage-backed securities decline when we elected not to recycle paydowns back to the sector.
How was the Fund positioned at the end of the reporting period?
As of October 31, 2017, the fixed-income portion of the Fund held overweight positions relative to the Bloomberg Barclays U.S. Aggregate Bond Index in high-yield and investment-grade credit. Offsetting these overweight positions, the fixed-income portion of the Fund held underweight positions in U.S. Treasury securities, agency debentures, mortgage-backed securities and asset-backed securities as of October 31, 2017.
The opinions expressed are those of the portfolio managers as of the date of this report and are subject to change. There is no guarantee that any forecasts made will come to pass. This material does not constitute investment advice and is not intended as an endorsement of any specific investment.
| | |
| 12 | | MainStay Income Builder Fund |
Portfolio of Investments October 31, 2017
| | | | | | | | |
| | | Principal
Amount | | | Value | |
Long-Term Bonds 48.0%† Asset-Backed Securities 0.2% | | | | | | | | |
Home Equity 0.2% | | | | | | | | |
Ameriquest Mortgage Securities, Inc. Series 2003-8, Class AF5
5.14%, due 10/25/33 (a) | | $ | 27,349 | | | $ | 27,462 | |
Carrington Mortgage Loan Trust Series 2006-NC4, Class A5
1.298% (1-month USD-LIBOR-BBA + 0.06%), due 10/25/36 (b) | | | 37,001 | | | | 36,887 | |
Chase Funding Trust
Series 2002-2, Class 1A5
6.333%, due 4/25/32 (a) | | | 96,408 | | | | 98,510 | |
Countrywide Asset-Backed Certificates Series 2003-5, Class AF5
5.263%, due 2/25/34 (a) | | | 458,733 | | | | 472,683 | |
Equity One Mortgage Pass-Through Trust Series 2003-3, Class AF4
5.495%, due 12/25/33 (a) | | | 209,738 | | | | 207,524 | |
HSI Asset Securitization Corp. Trust Series 2007-NC1, Class A1
1.338% (1-month USD-LIBOR-BBA + 0.10%), due 4/25/37 (b) | | | 2,725 | | | | 1,907 | |
JPMorgan Mortgage Acquisition Trust Series 2007-HE1, Class AF1
1.338% (1-month USD-LIBOR-BBA + 0.10%), due 3/25/47 (b) | | | 480,192 | | | | 319,348 | |
MASTR Asset-Backed Securities Trust Series 2006-HE4, Class A1
1.288% (1-month USD-LIBOR-BBA + 0.05%), due 11/25/36 (b) | | | 645,530 | | | | 320,704 | |
Saxon Asset Securities Trust
Series 2003-1, Class AF5
4.772%, due 6/25/33 (a) | | | 83,816 | | | | 83,434 | |
Soundview Home Loan Trust
Series 2006-EQ2, Class A2
1.348% (1-month USD-LIBOR-BBA + 0.11%), due 1/25/37 (b) | | | 942,743 | | | | 684,251 | |
Specialty Underwriting & Residential Finance Trust
Series 2006-BC4, Class A2B
1.348% (1-month USD-LIBOR-BBA + 0.11%), due 9/25/37 (b) | | | 689,193 | | | | 332,016 | |
Terwin Mortgage Trust
Series 2005-14HE, Class AF2 4.849%, due 8/25/36 (a) | | | 24,112 | | | | 24,239 | |
| | | | | | | | |
| | | | | | | 2,608,965 | |
| | | | | | | | |
| | | | | | | | |
| | | Principal
Amount | | | Value | |
Student Loans 0.0% ‡ | | | | | | | | |
KeyCorp Student Loan Trust
Series 2000-A, Class A2
1.637% (3-month USD-LIBOR-BBA +
0.32%), due 5/25/29 (b) | | $ | 286,492 | | | $ | 284,949 | |
| | | | | | | | |
Total Asset-Backed Securities
(Cost $3,436,560) | | | | | | | 2,893,914 | |
| | | | | | | | |
| | |
| Corporate Bonds 39.1% | | | | | | | | |
Advertising 0.0% ‡ | | | | | | | | |
Lamar Media Corp.
5.375%, due 1/15/24 | | | 625,000 | | | | 656,250 | |
| | | | | | | | |
| | |
Aerospace & Defense 0.3% | | | | | | | | |
KLX, Inc.
5.875%, due 12/1/22 (c) | | | 3,485,000 | | | | 3,646,181 | |
Triumph Group, Inc.
4.875%, due 4/1/21 | | | 1,205,000 | | | | 1,192,950 | |
| | | | | | | | |
| | | | | | | 4,839,131 | |
| | | | | | | | |
Agriculture 0.2% | | | | | | | | |
¨Philip Morris International, Inc.
1.625%, due 2/21/19 | | | 3,550,000 | | | | 3,542,604 | |
Reynolds American, Inc.
8.125%, due 6/23/19 (United Kingdom) | | | 255,000 | | | | 279,558 | |
| | | | | | | | |
| | | | | | | 3,822,162 | |
| | | | | | | | |
Airlines 0.8% | | | | | | | | |
American Airlines Group, Inc.
4.625%, due 3/1/20 (c) | | | 3,700,000 | | | | 3,820,250 | |
American Airlines, Inc. | | | | | | | | |
Series 2016-2, Class AA, Pass
Through Trust
3.20%, due 12/15/29 | | | 662,320 | | | | 661,525 | |
Series 2017-2, Class AA, Pass
Through Trust
3.35%, due 4/15/31 | | | 1,000,000 | | | | 1,005,000 | |
Series 2015-2, Class AA, Pass
Through Trust
3.60%, due 3/22/29 | | | 3,251,425 | | | | 3,365,062 | |
Series 2016-2, Class AA, Pass
Through Trust
3.65%, due 12/15/29 | | | 233,760 | | | | 239,326 | |
Continental Airlines, Inc. | | | | | | | | |
Series 2009-2, Class 2, Class
Through Trust
7.25%, due 5/10/21 | | | 1,451,420 | | | | 1,578,420 | |
Series 2003-ERJ-1
7.875%, due 1/2/20 | | | 200,538 | | | | 203,747 | |
| † | Percentages indicated are based on Fund net assets. |
| ¨ | | Among the Fund’s 10 largest holdings or issuers held, as of October 31, 2017, excluding short-term investment. May be subject to change daily. (Unaudited) |
| | | | | | |
The notes to the financial statements are an integral part of,
and should be read in conjunction with, the financial statements. | | | | | 13 | |
Portfolio of Investments October 31, 2017 (continued)
| | | | | | | | |
| | | Principal
Amount | | | Value | |
| Corporate Bonds (continued) | | | | | |
Airlines (continued) | | | | | | | | |
U.S. Airways Group, Inc. | | | | | | | | |
Series 2012-1, Class A
5.90%, due 4/1/26 | | $ | 1,784,435 | | | $ | 2,008,667 | |
Series 2010-1, Class A, Pass Through Trust
6.25%, due 10/22/24 | | | 870,549 | | | | 972,839 | |
United Airlines, Inc.
Series 2007-1, Pass Through Trust 6.636%, due 1/2/24 | | | 1,535,843 | | | | 1,670,229 | |
| | | | | | | | |
| | | | 15,525,065 | |
| | | | | | | | |
Apparel 0.2% | | | | | | | | |
Hanesbrands, Inc.
4.625%, due 5/15/24 (c) | | | 3,575,000 | | | | 3,673,313 | |
| | | | | | | | |
| | |
Auto Manufacturers 1.0% | | | | | | | | |
Ford Motor Co. | | | | | | | | |
6.625%, due 10/1/28 | | | 1,500,000 | | | | 1,817,976 | |
7.45%, due 7/16/31 | | | 450,000 | | | | 584,507 | |
8.90%, due 1/15/32 | | | 215,000 | | | | 297,067 | |
Ford Motor Credit Co. LLC
5.875%, due 8/2/21 | | | 350,000 | | | | 390,168 | |
General Motors Financial Co., Inc. | | | | | | | | |
3.15%, due 6/30/22 | | | 900,000 | | | | 909,457 | |
3.20%, due 7/13/20 | | | 1,800,000 | | | | 1,840,475 | |
3.25%, due 5/15/18 | | | 325,000 | | | | 327,502 | |
3.45%, due 4/10/22 | | | 3,800,000 | | | | 3,884,878 | |
4.20%, due 3/1/21 | | | 2,585,000 | | | | 2,714,349 | |
Toyota Motor Credit Corp.
2.90%, due 4/17/24 | | | 4,600,000 | | | | 4,689,322 | |
| | | | | | | | |
| | | | 17,455,701 | |
| | | | | | | | |
Auto Parts & Equipment 0.4% | | | | | | | | |
Goodyear Tire & Rubber Co.
5.125%, due 11/15/23 | | | 2,540,000 | | | | 2,616,200 | |
Schaeffler Finance B.V.
4.75%, due 5/15/23 (Germany) (c) | | | 3,345,000 | | | | 3,441,169 | |
Tenneco, Inc.
5.00%, due 7/15/26 | | | 1,660,000 | | | | 1,705,152 | |
| | | | | | | | |
| | | | 7,762,521 | |
| | | | | | | | |
Banks 7.1% | | | | | | | | |
Bank of America Corp. | | | | | | | | |
3.50%, due 4/19/26 | | | 415,000 | | | | 422,452 | |
3.705% (3-month USD-LIBOR-BBA + 1.512%), due 4/24/28 (b) | | | 2,895,000 | | | | 2,959,843 | |
5.125%, due 6/17/19 (d)(e) | | | 575,000 | | | | 588,656 | |
5.625%, due 7/1/20 | | | 645,000 | | | | 699,926 | |
5.875%, due 2/7/42 | | | 500,000 | | | | 644,746 | |
6.11%, due 1/29/37 | | | 1,505,000 | | | | 1,892,474 | |
6.30%, due 3/10/26 (d)(e) | | | 2,085,000 | | | | 2,375,399 | |
| | | | | | | | |
| | | Principal
Amount | | | Value | |
Banks (continued) | | | | | | | | |
Bank of America Corp. (continued) | | | | | | | | |
7.625%, due 6/1/19 | | $ | 1,015,000 | | | $ | 1,100,891 | |
8.57%, due 11/15/24 | | | 485,000 | | | | 624,047 | |
Bank of New York Mellon Corp.
4.625%, due 9/20/26 (d)(e) | | | 3,275,000 | | | | 3,369,156 | |
Barclays PLC (United Kingdom) | | | | | | | | |
2.75%, due 11/8/19 | | | 936,000 | | | | 944,920 | |
4.836%, due 5/9/28 | | | 3,430,000 | | | | 3,578,060 | |
4.95%, due 1/10/47 | | | 870,000 | | | | 958,028 | |
5.20%, due 5/12/26 | | | 1,590,000 | | | | 1,705,382 | |
BB&T Corp. | | | | | | | | |
2.15%, due 2/1/21 | | | 2,315,000 | | | | 2,310,920 | |
2.75%, due 4/1/22 | | | 4,100,000 | | | | 4,153,602 | |
Capital One Financial Corp.
4.20%, due 10/29/25 | | | 435,000 | | | | 448,506 | |
Citibank N.A.
2.125%, due 10/20/20 | | | 4,590,000 | | | | 4,576,760 | |
Citigroup, Inc. | | | | | | | | |
3.668% (3-month USD-LIBOR-BBA + 1.39%), due 7/24/28 (b) | | | 1,180,000 | | | | 1,192,717 | |
4.05%, due 7/30/22 | | | 105,000 | | | | 110,172 | |
5.30%, due 5/6/44 | | | 1,200,000 | | | | 1,407,273 | |
6.625%, due 6/15/32 | | | 770,000 | | | | 985,819 | |
6.875%, due 6/1/25 | | | 1,715,000 | | | | 2,081,161 | |
Citizens Bank N.A.
2.55%, due 5/13/21 | | | 1,050,000 | | | | 1,054,320 | |
Citizens Financial Group, Inc.
4.30%, due 12/3/25 | | | 3,405,000 | | | | 3,560,600 | |
Discover Bank
8.70%, due 11/18/19 | | | 1,064,000 | | | | 1,183,718 | |
¨Goldman Sachs Group, Inc. | | | | | | | | |
2.905% (3-month USD-LIBOR-BBA + 0.99%), due 7/24/23 (b) | | | 880,000 | | | | 876,163 | |
2.908% (3-month USD-LIBOR-BBA + 1.053%), due 6/5/23 (b) | | | 800,000 | | | | 798,479 | |
3.50%, due 11/16/26 | | | 1,085,000 | | | | 1,086,524 | |
3.625%, due 1/22/23 | | | 3,045,000 | | | | 3,149,592 | |
3.85%, due 1/26/27 | | | 4,385,000 | | | | 4,486,643 | |
4.017% (3-month USD-LIBOR-BBA + 1.373%), due 10/31/38 (b) | | | 2,310,000 | | | | 2,327,967 | |
5.00%, due 11/10/22 (d)(e) | | | 3,110,000 | | | | 3,113,887 | |
5.25%, due 7/27/21 | | | 805,000 | | | | 881,911 | |
6.75%, due 10/1/37 | | | 829,000 | | | | 1,094,453 | |
7.50%, due 2/15/19 | | | 2,100,000 | | | | 2,244,418 | |
Huntington Bancshares, Inc.
3.15%, due 3/14/21 | | | 3,535,000 | | | | 3,621,003 | |
JPMorgan Chase & Co. | | | | | | | | |
3.54% (3-month USD-LIBOR-BBA + 1.38%), due 5/1/28 (b) | | | 2,970,000 | | | | 2,999,354 | |
5.15%, due 5/01/23 (d)(e) | | | 2,080,000 | | | | 2,188,680 | |
6.40%, due 5/15/38 | | | 820,000 | | | | 1,103,126 | |
| | | | |
| 14 | | MainStay Income Builder Fund | | The notes to the financial statements are an integral part of,
and should be read in conjunction with, the financial statements. |
| | | | | | | | |
| | | Principal
Amount | | | Value | |
| Corporate Bonds (continued) | | | | | |
Banks (continued) | | | | | | | | |
Kreditanstalt fuer Wiederaufbau
1.50%, due 2/6/19 (Germany) | | $ | 8,170,000 | | | $ | 8,151,252 | |
Lloyds Banking Group PLC (United Kingdom) | | | | | | | | |
4.582%, due 12/10/25 | | | 863,000 | | | | 910,158 | |
4.65%, due 3/24/26 | | | 1,605,000 | | | | 1,703,868 | |
Morgan Stanley | | | | | | | | |
2.375%, due 7/23/19 | | | 1,750,000 | | | | 1,757,399 | |
3.591% (3-month USD-LIBOR-BBA + 1.34%), due 7/22/28 (b) | | | 1,360,000 | | | | 1,368,990 | |
3.875%, due 1/27/26 | | | 465,000 | | | | 485,129 | |
4.875%, due 11/1/22 | | | 1,125,000 | | | | 1,218,244 | |
5.00%, due 11/24/25 | | | 2,855,000 | | | | 3,114,273 | |
5.45%, due 7/15/19 (d)(e) | | | 2,310,000 | | | | 2,395,470 | |
6.375%, due 7/24/42 | | | 170,000 | | | | 230,869 | |
PNC Bank N.A. | | | | | | | | |
1.70%, due 12/7/18 | | | 3,100,000 | | | | 3,098,616 | |
2.55%, due 12/9/21 | | | 2,185,000 | | | | 2,198,953 | |
Royal Bank of Scotland Group PLC (United Kingdom) | | | | | | | | |
6.00%, due 12/19/23 | | | 190,000 | | | | 211,695 | |
6.125%, due 12/15/22 | | | 1,530,000 | | | | 1,701,813 | |
Santander Holdings USA, Inc. | | | | | | | | |
2.65%, due 4/17/20 | | | 3,875,000 | | | | 3,899,623 | |
4.40%, due 7/13/27 (c) | | | 600,000 | | | | 616,146 | |
Santander UK Group Holdings PLC (United Kingdom) | | | | | | | | |
3.571%, due 1/10/23 | | | 2,230,000 | | | | 2,276,956 | |
3.823% (3-month USD-LIBOR-BBA + 1.40%), due 11/3/28 (b) | | | 1,640,000 | | | | 1,650,943 | |
State Street Corp.
2.55%, due 8/18/20 | | | 2,605,000 | | | | 2,651,884 | |
Toronto-Dominion Bank
1.80%, due 7/13/21 (Canada) | | | 4,295,000 | | | | 4,220,331 | |
U.S. Bank N.A.
2.00%, due 1/24/20 | | | 4,050,000 | | | | 4,054,317 | |
Wachovia Corp. | | | | | | | | |
5.50%, due 8/1/35 | | | 315,000 | | | | 372,255 | |
5.75%, due 2/1/18 | | | 1,000,000 | | | | 1,010,202 | |
Wells Fargo & Co. | | | | | | | | |
3.584% (3-month USD-LIBOR-BBA + 1.31%), due 5/22/28 (b) | | | 2,615,000 | | | | 2,639,929 | |
4.90%, due 11/17/45 | | | 55,000 | | | | 61,041 | |
5.375%, due 11/2/43 | | | 690,000 | | | | 810,919 | |
Wells Fargo Bank N.A.
5.85%, due 2/1/37 | | | 140,000 | | | | 175,325 | |
Wells Fargo Capital X
5.95%, due 12/1/86 | | | 715,000 | | | | 804,375 | |
| | | | | | | | |
| | | | 128,692,723 | |
| | | | | | | | |
| | | | | | | | |
| | | Principal
Amount | | | Value | |
Beverages 1.3% | | | | | | | | |
Anheuser-Busch InBev Finance, Inc.
3.65%, due 2/1/26 (Belgium) | | $ | 5,725,000 | | | $ | 5,907,510 | |
Coca-Cola Co.
1.375%, due 5/30/19 | | | 3,845,000 | | | | 3,830,107 | |
Constellation Brands, Inc.
4.25%, due 5/1/23 | | | 2,100,000 | | | | 2,244,648 | |
Molson Coors Brewing Co.
3.00%, due 7/15/26 | | | 2,000,000 | | | | 1,947,759 | |
PepsiCo, Inc. | | | | | | | | |
1.35%, due 10/4/19 | | | 2,225,000 | | | | 2,208,830 | |
1.55%, due 5/2/19 | | | 1,650,000 | | | | 1,645,996 | |
2.375%, due 10/6/26 | | | 2,225,000 | | | | 2,129,466 | |
3.00%, due 10/15/27 | | | 3,000,000 | | | | 2,985,833 | |
| | | | | | | | |
| | | | 22,900,149 | |
| | | | | | | | |
Biotechnology 0.4% | | | | | | | | |
Biogen, Inc.
3.625%, due 9/15/22 | | | 3,480,000 | | | | 3,642,566 | |
Celgene Corp.
3.625%, due 5/15/24 | | | 3,600,000 | | | | 3,713,630 | |
| | | | | | | | |
| | | | 7,356,196 | |
| | | | | | | | |
Building Materials 0.6% | | | | | | | | |
Fortune Brands Home & Security, Inc.
4.00%, due 6/15/25 | | | 4,420,000 | | | | 4,610,182 | |
Johnson Controls International PLC
4.50%, due 2/15/47 | | | 1,305,000 | | | | 1,371,870 | |
Masco Corp.
4.375%, due 4/1/26 | | | 1,575,000 | | | | 1,674,713 | |
Standard Industries, Inc.
5.375%, due 11/15/24 (c) | | | 2,940,000 | | | | 3,101,406 | |
| | | | | | | | |
| | | | 10,758,171 | |
| | | | | | | | |
Chemicals 0.9% | | | | | | | | |
Air Liquide Finance S.A. (France) (c) | | | | | | | | |
1.375%, due 9/27/19 | | | 2,535,000 | | | | 2,503,959 | |
1.75%, due 9/27/21 | | | 1,725,000 | | | | 1,684,328 | |
Ashland LLC
4.75%, due 8/15/22 | | | 1,890,000 | | | | 1,994,328 | |
Braskem Netherlands Finance B.V.
4.50%, due 1/10/28 (Brazil) (c) | | | 4,275,000 | | | | 4,254,908 | |
Dow Chemical Co. | | | | | | | | |
4.125%, due 11/15/21 | | | 1,605,000 | | | | 1,701,599 | |
8.55%, due 5/15/19 | | | 75,000 | | | | 82,355 | |
Mexichem S.A.B. de C.V.
4.00%, due 10/4/27 (Mexico) (c) | | | 1,800,000 | | | | 1,799,100 | |
WR Grace & Co-Conn
5.125%, due 10/1/21 (c) | | | 1,885,000 | | | | 2,026,375 | |
| | | | | | | | |
| | | | | | | 16,046,952 | |
| | | | | | | | |
| | | | | | |
The notes to the financial statements are an integral part of,
and should be read in conjunction with, the financial statements. | | | | | 15 | |
Portfolio of Investments October 31, 2017 (continued)
| | | | | | | | |
| | | Principal
Amount | | | Value | |
| Corporate Bonds (continued) | | | | | |
Commercial Services 0.4% | | | | | |
Herc Rentals, Inc.
7.75%, due 6/1/24 (c) | | $ | 1,694,000 | | | $ | 1,859,165 | |
Service Corp. International
5.375%, due 1/15/22 | | | 3,600,000 | | | | 3,699,000 | |
United Rentals North America, Inc. 4.625%, due 7/15/23 | | | 965,000 | | | | 1,006,012 | |
| | | | | | | | |
| | | | | | | 6,564,177 | |
| | | | | | | | |
Computers 0.6% | | | | | |
Apple, Inc. | | | | | | | | |
1.55%, due 2/8/19 | | | 860,000 | | | | 859,324 | |
1.55%, due 8/4/21 | | | 1,500,000 | | | | 1,468,735 | |
3.20%, due 5/11/27 | | | 900,000 | | | | 913,486 | |
3.35%, due 2/9/27 | | | 3,480,000 | | | | 3,570,882 | |
3.85%, due 8/4/46 | | | 1,090,000 | | | | 1,102,373 | |
International Business Machines Corp. 7.00%, due 10/30/25 | | | 2,050,000 | | | | 2,631,270 | |
| | | | | | | | |
| | | | | | | 10,546,070 | |
| | | | | | | | |
Cosmetics & Personal Care 0.2% | | | | | |
Unilever Capital Corp.
1.80%, due 5/5/20 (United Kingdom) | | | 3,100,000 | | | | 3,092,419 | |
| | | | | | | | |
| | |
Diversified Financial Services 1.7% | | | | | | | | |
AerCap Ireland Capital DAC / AerCap Global Aviation Trust
4.625%, due 10/30/20 (Ireland) | | | 4,265,000 | | | | 4,530,443 | |
Air Lease Corp. | | | | | | | | |
2.125%, due 1/15/20 | | | 1,950,000 | | | | 1,947,865 | |
4.25%, due 9/15/24 | | | 1,185,000 | | | | 1,257,506 | |
Bear Stearns Cos. LLC
7.25%, due 2/1/18 | | | 910,000 | | | | 922,411 | |
CIT Group, Inc. | | | | | | | | |
3.875%, due 2/19/19 | | | 1,740,000 | | | | 1,766,100 | |
5.00%, due 8/15/22 | | | 968,000 | | | | 1,040,600 | |
Discover Financial Services
3.85%, due 11/21/22 | | | 1,491,000 | | | | 1,538,199 | |
GE Capital International Funding Co. 2.342%, due 11/15/20 | | | 6,500,000 | | | | 6,532,175 | |
International Lease Finance Corp. | | | | | | | | |
5.875%, due 4/1/19 | | | 1,255,000 | | | | 1,319,790 | |
6.25%, due 5/15/19 | | | 1,074,000 | | | | 1,138,889 | |
OneMain Financial Holdings LLC
7.25%, due 12/15/21 (c) | | | 1,465,000 | | | | 1,523,600 | |
Peachtree Corners Funding Trust
3.976%, due 2/15/25 (c) | | | 940,000 | | | | 958,407 | |
Springleaf Finance Corp. | | | | | | | | |
5.25%, due 12/15/19 | | | 700,000 | | | | 722,750 | |
6.00%, due 6/1/20 | | | 475,000 | | | | 498,156 | |
| | | | | | | | |
| | | Principal
Amount | | | Value | |
Diversified Financial Services (continued) | |
Synchrony Financial
4.25%, due 8/15/24 | | $ | 5,000,000 | | | $ | 5,203,529 | |
| | | | | | | | |
| | | | | | | 30,900,420 | |
| | | | | | | | |
Electric 1.5% | | | | | |
AEP Transmission Co. LLC
3.10%, due 12/1/26 | | | 2,350,000 | | | | 2,349,277 | |
CMS Energy Corp. | | | | | | | | |
3.875%, due 3/1/24 | | | 1,540,000 | | | | 1,618,880 | |
5.05%, due 3/15/22 | | | 1,220,000 | | | | 1,339,888 | |
6.25%, due 2/1/20 | | | 1,225,000 | | | | 1,330,324 | |
Consolidated Edison, Inc.
2.00%, due 3/15/20 | | | 1,205,000 | | | | 1,205,149 | |
FirstEnergy Transmission LLC
5.45%, due 7/15/44 (c) | | | 2,555,000 | | | | 2,955,352 | |
Great Plains Energy, Inc.
5.292%, due 6/15/22 (a) | | | 1,130,000 | | | | 1,238,317 | |
MidAmerican Energy Co. | | | | | | | | |
3.95%, due 8/1/47 | | | 835,000 | | | | 881,167 | |
4.40%, due 10/15/44 | | | 2,200,000 | | | | 2,468,625 | |
Pacific Gas & Electric Co.
1.518% (3-month USD-LIBOR-BBA + 0.20%), due 11/30/17 (b) | | | 3,100,000 | | | | 3,099,989 | |
PECO Energy Co.
4.80%, due 10/15/43 | | | 1,195,000 | | | | 1,371,569 | |
Potomac Electric Power Co.
4.15%, due 3/15/43 | | | 1,735,000 | | | | 1,853,852 | |
¨PPL Electric Utilities Corp.
3.95%, due 6/1/47 | | | 2,200,000 | | | | 2,314,407 | |
Public Service Electric & Gas Co.
3.00%, due 5/15/27 | | | 2,235,000 | | | | 2,236,764 | |
Puget Energy, Inc.
5.625%, due 7/15/22 | | | 815,000 | | | | 911,246 | |
WEC Energy Group, Inc.
3.428% (3-month USD-LIBOR-BBA + 2.113%), due 5/15/67 (b) | | | 1,095,000 | | | | 1,054,157 | |
| | | | | | | | |
| | | | | | | 28,228,963 | |
| | | | | | | | |
Electronics 0.3% | | | | | |
Honeywell International, Inc.
1.40%, due 10/30/19 | | | 4,970,000 | | | | 4,942,020 | |
| | | | | | | | |
| | |
Environmental Controls 0.3% | | | | | | | | |
Republic Services, Inc.
4.75%, due 5/15/23 | | | 1,615,000 | | | | 1,778,871 | |
Waste Management, Inc. | | | | | | | | |
2.40%, due 5/15/23 | | | 2,275,000 | | | | 2,235,875 | |
3.15%, due 11/15/27 | | | 1,080,000 | | | | 1,080,175 | |
| | | | | | | | |
| | | | | | | 5,094,921 | |
| | | | | | | | |
| | | | |
| 16 | | MainStay Income Builder Fund | | The notes to the financial statements are an integral part of,
and should be read in conjunction with, the financial statements. |
| | | | | | | | |
| | | Principal
Amount | | | Value | |
| Corporate Bonds (continued) | | | | | |
Food 1.8% | | | | | | | | |
J.M. Smucker Co.
1.75%, due 3/15/18 | | $ | 3,500,000 | | | $ | 3,502,984 | |
Kerry Group Financial Services
3.20%, due 4/9/23 (Ireland) (c) | | | 2,899,000 | | | | 2,893,681 | |
Kraft Heinz Foods Co. | | | | | | | | |
3.00%, due 6/1/26 | | | 1,000,000 | | | | 966,258 | |
4.875%, due 2/15/25 (c) | | | 2,123,000 | | | | 2,270,654 | |
5.00%, due 6/4/42 | | | 1,600,000 | | | | 1,706,899 | |
Kroger Co.
1.50%, due 9/30/19 | | | 2,555,000 | | | | 2,527,681 | |
Mondelez International Holdings Netherlands B.V. (Netherlands) (c) | | | | | | | | |
1.625%, due 10/28/19 | | | 2,790,000 | | | | 2,762,276 | |
2.00%, due 10/28/21 | | | 3,050,000 | | | | 2,993,024 | |
Smithfield Foods, Inc. (c) | | | | | | | | |
2.70%, due 1/31/20 | | | 1,690,000 | | | | 1,694,716 | |
3.35%, due 2/1/22 | | | 1,575,000 | | | | 1,595,373 | |
Sysco Corp.
3.25%, due 7/15/27 | | | 1,735,000 | | | | 1,733,235 | |
Tyson Foods, Inc.
3.95%, due 8/15/24 | | | 4,235,000 | | | | 4,464,284 | |
Whole Foods Market, Inc.
5.20%, due 12/3/25 | | | 3,375,000 | | | | 3,875,817 | |
| | | | | | | | |
| | | | | | | 32,986,882 | |
| | | | | | | | |
Gas 0.3% | | | | | | | | |
AmeriGas Partners, L.P. / AmeriGas Finance Corp. | | | | | | | | |
5.50%, due 5/20/25 | | | 735,000 | | | | 751,537 | |
5.625%, due 5/20/24 | | | 1,140,000 | | | | 1,201,275 | |
5.75%, due 5/20/27 | | | 520,000 | | | | 531,050 | |
NiSource Finance Corp.
3.49%, due 5/15/27 | | | 3,670,000 | | | | 3,720,393 | |
| | | | | | | | |
| | | | | | | 6,204,255 | |
| | | | | | | | |
Health Care—Products 1.1% | | | | | | | | |
Baxter International, Inc.
3.50%, due 8/15/46 | | | 4,330,000 | | | | 3,932,020 | |
Becton Dickinson & Co.
3.70%, due 6/6/27 | | | 4,380,000 | | | | 4,412,201 | |
Boston Scientific Corp.
2.85%, due 5/15/20 | | | 3,740,000 | | | | 3,794,132 | |
Medtronic Global Holdings SCA
1.70%, due 3/28/19 | | | 3,090,000 | | | | 3,086,805 | |
Stryker Corp.
2.625%, due 3/15/21 | | | 3,395,000 | | | | 3,427,041 | |
Thermo Fisher Scientific, Inc.
3.00%, due 4/15/23 | | | 1,425,000 | | | | 1,442,341 | |
| | | | | | | | |
| | | | | | | 20,094,540 | |
| | | | | | | | |
| | | | | | | | |
| | | Principal
Amount | | | Value | |
Health Care—Services 0.2% | | | | | | | | |
Cigna Corp.
4.375%, due 12/15/20 | | $ | 270,000 | | | $ | 286,301 | |
Laboratory Corp. of America Holdings
2.50%, due 11/1/18 | | | 3,510,000 | | | | 3,530,783 | |
| | | | | | | | |
| | | | | | | 3,817,084 | |
| | | | | | | | |
Home Builders 0.8% | | | | | | | | |
CalAtlantic Group, Inc. | | | | | | | | |
5.875%, due 11/15/24 | | | 1,345,000 | | | | 1,497,153 | |
8.375%, due 5/15/18 | | | 2,000,000 | | | | 2,065,000 | |
Lennar Corp. | | | | | | | | |
4.50%, due 6/15/19 | | | 2,400,000 | | | | 2,466,000 | |
4.50%, due 11/15/19 | | | 750,000 | | | | 773,438 | |
MDC Holdings, Inc.
5.625%, due 2/1/20 | | | 2,750,000 | | | | 2,952,813 | |
Toll Brothers Finance Corp.
5.875%, due 2/15/22 | | | 1,340,000 | | | | 1,485,725 | |
TRI Pointe Group, Inc. / TRI Pointe Homes, Inc. | | | | | | | | |
4.375%, due 6/15/19 | | | 1,000,000 | | | | 1,026,250 | |
5.875%, due 6/15/24 | | | 2,935,000 | | | | 3,177,137 | |
| | | | | | | | |
| | | | | | | 15,443,516 | |
| | | | | | | | |
Housewares 0.3% | | | | | | | | |
Newell Brands, Inc.
3.85%, due 4/1/23 | | | 5,750,000 | | | | 6,032,510 | |
| | | | | | | | |
| | |
Insurance 2.4% | | | | | | | | |
Alterra Finance LLC
6.25%, due 9/30/20 | | | 200,000 | | | | 219,919 | |
Berkshire Hathaway Finance Corp.
1.45%, due 3/7/18 | | | 3,515,000 | | | | 3,514,769 | |
Chubb Corp.
3.609% (3-month USD-LIBOR-BBA + 2.25%), due 3/29/67 (b) | | | 1,660,000 | | | | 1,651,700 | |
Jackson National Life Global Funding
2.20%, due 1/30/20 (c) | | | 3,580,000 | | | | 3,586,099 | |
Liberty Mutual Group, Inc. (c) | | | | | | | | |
4.25%, due 6/15/23 | | | 850,000 | | | | 903,920 | |
6.50%, due 3/15/35 | | | 220,000 | | | | 279,384 | |
7.80%, due 3/7/87 | | | 1,760,000 | | | | 2,230,800 | |
10.75% (3-month USD-LIBOR-BBA + 7.12%), due 6/15/88 (b) | | | 750,000 | | | | 1,245,000 | |
Lincoln National Corp.
3.625%, due 12/12/26 | | | 3,400,000 | | | | 3,460,861 | |
Markel Corp.
5.00%, due 4/5/46 | | | 2,350,000 | | | | 2,629,353 | |
MassMutual Global Funding II (c) | | | | | | | | |
2.10%, due 8/2/18 | | | 1,200,000 | | | | 1,204,259 | |
2.50%, due 10/17/22 | | | 3,347,000 | | | | 3,337,617 | |
Metropolitan Life Global Funding I
1.75%, due 9/19/19 (c) | | | 2,250,000 | | | | 2,241,390 | |
| | | | | | |
The notes to the financial statements are an integral part of,
and should be read in conjunction with, the financial statements. | | | | | 17 | |
Portfolio of Investments October 31, 2017 (continued)
| | | | | | | | |
| | | Principal
Amount | | | Value | |
| Corporate Bonds (continued) | | | | | |
Insurance (continued) | | | | | | | | |
Oil Insurance, Ltd.
4.317% (3-month USD-LIBOR-BBA + 2.982%), due 12/01/17 (b)(c)(d) | | $ | 1,320,000 | | | $ | 1,257,300 | |
Pricoa Global Funding I
2.55%, due 11/24/20 (c) | | | 2,135,000 | | | | 2,159,417 | |
Principal Life Global Funding II
2.375%, due 11/21/21 (c) | | | 4,070,000 | | | | 4,057,801 | |
Protective Life Corp.
8.45%, due 10/15/39 | | | 1,640,000 | | | | 2,437,157 | |
Provident Cos., Inc.
7.25%, due 3/15/28 | | | 2,115,000 | | | | 2,676,045 | |
Prudential Financial, Inc.
5.625% (3-month USD-LIBOR-BBA + 3.92%), due 6/15/43 (b) | | | 1,760,000 | | | | 1,912,240 | |
Voya Financial, Inc.
3.65%, due 6/15/26 | | | 690,000 | | | | 695,968 | |
XLIT, Ltd.
4.45%, due 3/31/25 | | | 2,615,000 | | | | 2,670,457 | |
| | | | | | | | |
| | | | | | | 44,371,456 | |
| | | | | | | | |
Internet 0.8% | | | | | | | | |
Amazon.com, Inc. | | | | | | | | |
3.30%, due 12/5/21 | | | 2,185,000 | | | | 2,274,774 | |
3.875%, due 8/22/37 (c) | | | 1,590,000 | | | | 1,648,148 | |
eBay, Inc.
3.80%, due 3/9/22 | | | 3,840,000 | | | | 4,019,450 | |
Match Group, Inc.
6.375%, due 6/1/24 | | | 3,995,000 | | | | 4,339,569 | |
Priceline Group, Inc.
3.60%, due 6/1/26 | | | 2,225,000 | | | | 2,274,188 | |
| | | | | | | | |
| | | | | | | 14,556,129 | |
| | | | | | | | |
Iron & Steel 0.2% | | | | | | | | |
ArcelorMittal
7.50%, due 10/15/39 (Luxembourg) | | | 2,300,000 | | | | 2,872,125 | |
| | | | | | | | |
| | |
Lodging 0.9% | | | | | | | | |
Choice Hotels International, Inc.
5.75%, due 7/1/22 | | | 3,260,000 | | | | 3,610,450 | |
Hilton Domestic Operating Co., Inc.
4.25%, due 9/1/24 | | | 2,390,000 | | | | 2,440,787 | |
Marriott International, Inc. | | | | | | | | |
2.30%, due 1/15/22 | | | 2,450,000 | | | | 2,421,703 | |
6.75%, due 5/15/18 | | | 265,000 | | | | 272,000 | |
7.15%, due 12/1/19 | | | 1,900,000 | | | | 2,088,784 | |
MGM Resorts International | | | | | | | | |
6.75%, due 10/1/20 | | | 2,390,000 | | | | 2,629,000 | |
8.625%, due 2/1/19 | | | 80,000 | | | | 85,700 | |
Wyndham Worldwide Corp.
4.15%, due 4/1/24 | | | 1,765,000 | | | | 1,788,989 | |
| | | | | | | | |
| | | Principal
Amount | | | Value | |
Lodging (continued) | | | | | | | | |
Wynn Las Vegas LLC / Wynn Las Vegas Capital Corp.
5.50%, due 3/1/25 (c) | | $ | 1,850,000 | | | $ | 1,944,812 | |
| | | | | | | | |
| | | | | | | 17,282,225 | |
| | | | | | | | |
Machinery—Diversified 0.3% | | | | | | | | |
CNH Industrial Capital LLC
4.875%, due 4/1/21 | | | 3,945,000 | | | | 4,207,737 | |
Zebra Technologies Corp.
7.25%, due 10/15/22 | | | 430,000 | | | | 454,188 | |
| | | | | | | | |
| | | | | | | 4,661,925 | |
| | | | | | | | |
Media 1.2% | | | | | | | | |
21st Century Fox America, Inc.
6.65%, due 11/15/37 | | | 1,710,000 | | | | 2,267,496 | |
DISH DBS Corp.
5.875%, due 7/15/22 | | | 2,050,000 | | | | 2,061,542 | |
Grupo Televisa S.A.B.
6.125%, due 1/31/46 (Mexico) | | | 3,930,000 | | | | 4,555,769 | |
NBC Universal Media LLC
5.15%, due 4/30/20 | | | 160,000 | | | | 172,312 | |
Sky PLC
3.75%, due 9/16/24 (United Kingdom) (c) | | | 2,620,000 | | | | 2,698,050 | |
Time Warner Cable LLC
7.30%, due 7/1/38 | | | 1,350,000 | | | | 1,691,552 | |
Time Warner Cos., Inc.
6.95%, due 1/15/28 | | | 1,000,000 | | | | 1,243,491 | |
Time Warner Entertainment Co., L.P. | | | | | | | | |
8.375%, due 3/15/23 | | | 800,000 | | | | 993,116 | |
8.375%, due 7/15/33 | | | 1,000,000 | | | | 1,360,963 | |
Time Warner, Inc.
3.60%, due 7/15/25 | | | 2,500,000 | | | | 2,491,524 | |
UPCB Finance IV, Ltd.
5.375%, due 1/15/25 (Netherlands) (c) | | | 2,050,000 | | | | 2,096,125 | |
| | | | | | | | |
| | | | | | | 21,631,940 | |
| | | | | | | | |
Metal Fabricate & Hardware 0.3% | | | | | | | | |
Precision Castparts Corp. | | | | | | | | |
3.25%, due 6/15/25 | | | 4,040,000 | | | | 4,132,692 | |
3.90%, due 1/15/43 | | | 835,000 | | | | 846,490 | |
| | | | | | | | |
| | | | | | | 4,979,182 | |
| | | | | | | | |
Mining 0.4% | | | | | | | | |
Anglo American Capital PLC
4.875%, due 5/14/25 (United Kingdom) (c) | | | 1,295,000 | | | | 1,383,170 | |
FMG Resources (August 2006) Pty, Ltd.
9.75%, due 3/1/22 (Australia) (c) | | | 3,185,000 | | | | 3,559,238 | |
Southern Copper Corp.
5.875%, due 4/23/45 (Peru) | | | 2,035,000 | | | | 2,378,846 | |
| | | | | | | | |
| | | | | | | 7,321,254 | |
| | | | | | | | |
| | | | |
| 18 | | MainStay Income Builder Fund | | The notes to the financial statements are an integral part of,
and should be read in conjunction with, the financial statements. |
| | | | | | | | |
| | | Principal
Amount | | | Value | |
| Corporate Bonds (continued) | | | | | |
Miscellaneous—Manufacturing 0.5% | | | | | | | | |
Amsted Industries, Inc.
5.00%, due 3/15/22 (c) | | $ | 3,785,000 | | | $ | 3,908,013 | |
Siemens Financieringsmaatschappij N.V.
2.70%, due 3/16/22 (Germany) (c) | | | 2,130,000 | | | | 2,159,981 | |
Textron Financial Corp.
3.05% (3-month USD-LIBOR-BBA + 1.735%), due 2/15/67 (b)(c) | | | 3,540,000 | | | | 3,079,800 | |
| | | | | | | | |
| | | | | | | 9,147,794 | |
| | | | | | | | |
Oil & Gas 1.1% | | | | | | | | |
Andeavor
5.125%, due 12/15/26 (c) | | | 1,260,000 | | | | 1,396,037 | |
Cenovus Energy, Inc.
4.25%, due 4/15/27 (Canada) (c) | | | 955,000 | | | | 958,255 | |
Chevron Corp.
1.686%, due 2/28/19 | | | 2,000,000 | | | | 1,999,675 | |
ConocoPhillips Co.
2.875%, due 11/15/21 | | | 3,050,000 | | | | 3,100,939 | |
Petrobras Global Finance B.V.
7.375%, due 1/17/27 (Brazil) | | | 4,120,000 | | | | 4,575,260 | |
Petroleos Mexicanos
6.75%, due 9/21/47 (Mexico) (c) | | | 5,470,000 | | | | 5,637,929 | |
Valero Energy Corp.
6.125%, due 2/1/20 | | | 2,385,000 | | | | 2,586,187 | |
| | | | | | | | |
| | | | | | | 20,254,282 | |
| | | | | | | | |
Packaging & Containers 0.5% | | | | | | | | |
Ball Corp.
5.00%, due 3/15/22 | | | 3,700,000 | | | | 3,996,000 | |
Crown Americas LLC / Crown Americas Capital Corp. IV
4.50%, due 1/15/23 | | | 1,400,000 | | | | 1,457,540 | |
Reynolds Group Issuer, Inc. / Reynolds Group Issuer LLC
5.75%, due 10/15/20 (New Zealand) | | | 2,000,000 | | | | 2,035,020 | |
Sealed Air Corp. (c) | | | | | | | | |
4.875%, due 12/1/22 | | | 475,000 | | | | 503,500 | |
5.50%, due 9/15/25 | | | 1,900,000 | | | | 2,094,750 | |
| | | | | | | | |
| | | | | | | 10,086,810 | |
| | | | | | | | |
Pharmaceuticals 0.9% | | | | | | | | |
Allergan Funding SCS
3.45%, due 3/15/22 | | | 4,050,000 | | | | 4,158,758 | |
Eli Lilly & Co.
3.10%, due 5/15/27 | | | 2,210,000 | | | | 2,233,547 | |
Johnson & Johnson
2.25%, due 3/3/22 | | | 3,570,000 | | | | 3,584,677 | |
Novartis Capital Corp.
1.80%, due 2/14/20 (Switzerland) | | | 4,115,000 | | | | 4,113,080 | |
Valeant Pharmaceuticals International, Inc. 5.50%, due 11/1/25 (c) | | | 2,290,000 | | | | 2,341,525 | |
| | | | | | | | |
| | | | | | | 16,431,587 | |
| | | | | | | | |
| | | | | | | | |
| | | Principal
Amount | | | Value | |
Pipelines 0.8% | | | | | | | | |
Andeavor Logistics, L.P. / Tesoro Logistics Finance Corp. | | | | | | | | |
5.50%, due 10/15/19 | | $ | 1,845,000 | | | $ | 1,941,862 | |
5.875%, due 10/1/20 | | | 1,725,000 | | | | 1,755,188 | |
Columbia Pipeline Group, Inc.
3.30%, due 6/1/20 | | | 2,995,000 | | | | 3,068,013 | |
MPLX, L.P. | | | | | | | | |
4.875%, due 6/1/25 | | | 100,000 | | | | 108,309 | |
5.50%, due 2/15/23 | | | 1,975,000 | | | | 2,033,657 | |
Southern Natural Gas Co. LLC
4.80%, due 3/15/47 (c) | | | 880,000 | | | | 956,450 | |
Spectra Energy Partners, L.P.
4.75%, due 3/15/24 | | | 1,740,000 | | | | 1,901,468 | |
Targa Resources Partners, L.P. / Targa Resources Partners Finance Corp. 5.25%, due 5/1/23 | | | 2,120,000 | | | | 2,180,950 | |
| | | | | | | | |
| | | | | | | 13,945,897 | |
| | | | | | | | |
Real Estate Investment Trusts 0.9% | | | | | | | | |
American Tower Corp.
3.375%, due 10/15/26 | | | 2,945,000 | | | | 2,909,283 | |
CoreCivic, Inc.
4.625%, due 5/1/23 | | | 810,000 | | | | 828,225 | |
Crown Castle International Corp. | | | | | | | | |
3.40%, due 2/15/21 | | | 2,080,000 | | | | 2,138,017 | |
5.25%, due 1/15/23 | | | 3,510,000 | | | | 3,884,842 | |
Digital Realty Trust, L.P. | | | | | | | | |
2.75%, due 2/1/23 | | | 140,000 | | | | 139,759 | |
3.70%, due 8/15/27 | | | 500,000 | | | | 506,517 | |
Essex Portfolio, L.P.
3.375%, due 4/15/26 | | | 1,490,000 | | | | 1,480,114 | |
Iron Mountain, Inc. | | | | | | | | |
4.875%, due 9/15/27 (c) | | | 1,400,000 | | | | 1,417,934 | |
5.75%, due 8/15/24 | | | 1,775,000 | | | | 1,819,375 | |
UDR, Inc.
3.50%, due 7/1/27 | | | 2,000,000 | | | | 1,995,589 | |
| | | | | | | | |
| | | | | | | 17,119,655 | |
| | | | | | | | |
Retail 1.8% | | | | | | | | |
Alimentation Couche-Tard, Inc. (Canada) (c) | | | | | | | | |
3.55%, due 7/26/27 | | | 4,435,000 | | | | 4,449,974 | |
4.50%, due 7/26/47 | | | 1,950,000 | | | | 2,003,622 | |
AutoZone, Inc.
3.75%, due 6/1/27 | | | 1,500,000 | | | | 1,521,159 | |
Brinker International, Inc.
2.60%, due 5/15/18 | | | 1,885,000 | | | | 1,885,000 | |
CK Hutchison International (17) II, Ltd. 3.25%, due 9/29/27 (c) | | | 2,620,000 | | | | 2,586,608 | |
CVS Health Corp.
4.00%, due 12/5/23 | | | 3,725,000 | | | | 3,935,360 | |
| | | | | | |
The notes to the financial statements are an integral part of,
and should be read in conjunction with, the financial statements. | | | | | 19 | |
Portfolio of Investments October 31, 2017 (continued)
| | | | | | | | |
| | | Principal
Amount | | | Value | |
| Corporate Bonds (continued) | | | | | |
Retail (continued) | | | | | | | | |
CVS Pass-Through Trust
5.789%, due 1/10/26 (c)(f) | | $ | 177,138 | | | $ | 193,195 | |
Home Depot, Inc.
2.125%, due 9/15/26 | | | 1,955,000 | | | | 1,838,111 | |
McDonald’s Corp.
3.70%, due 2/15/42 | | | 965,000 | | | | 925,006 | |
QVC, Inc.
4.85%, due 4/1/24 | | | 2,660,000 | | | | 2,797,965 | |
Starbucks Corp.
2.45%, due 6/15/26 | | | 2,220,000 | | | | 2,138,336 | |
Suburban Propane Partners, L.P. / Suburban Energy Finance Corp.
5.50%, due 6/1/24 | | | 1,545,000 | | | | 1,537,275 | |
TJX Cos., Inc.
2.25%, due 9/15/26 | | | 6,450,000 | | | | 6,034,018 | |
Wal-Mart Stores, Inc.
6.75%, due 10/15/23 | | | 314,000 | | | | 384,672 | |
| | | | | | | | |
| | | | | | | 32,230,301 | |
| | | | | | | | |
Semiconductors 0.7% | | | | | | | | |
NXP B.V. / NXP Funding LLC (Netherlands) (c) | | | | | | | | |
4.625%, due 6/15/22 | | | 1,610,000 | | | | 1,724,712 | |
4.625%, due 6/1/23 | | | 3,850,000 | | | | 4,148,375 | |
Qorvo, Inc.
7.00%, due 12/1/25 | | | 3,740,000 | | | | 4,260,047 | |
Sensata Technologies B.V.
5.00%, due 10/1/25 (Netherlands) (c) | | | 2,990,000 | | | | 3,169,400 | |
| | | | | | | | |
| | | | | | | 13,302,534 | |
| | | | | | | | |
Software 0.5% | | | | | | | | |
Microsoft Corp. | | | | | | | | |
1.85%, due 2/6/20 | | | 2,615,000 | | | | 2,616,557 | |
3.70%, due 8/8/46 | | | 2,060,000 | | | | 2,068,252 | |
MSCI, Inc.
5.75%, due 8/15/25 (c) | | | 3,610,000 | | | | 3,898,800 | |
PTC, Inc.
6.00%, due 5/15/24 | | | 1,415,000 | | | | 1,535,204 | |
| | | | | | | | |
| | | | | | | 10,118,813 | |
| | | | | | | | |
Telecommunications 1.9% | | | | | | | | |
¨AT&T, Inc. | | | | | | | | |
3.60%, due 2/17/23 | | | 3,800,000 | | | | 3,934,636 | |
4.90%, due 8/14/37 | | | 3,730,000 | | | | 3,722,076 | |
Cisco Systems, Inc.
2.45%, due 6/15/20 | | | 2,000,000 | | | | 2,027,308 | |
CommScope Technologies LLC
6.00%, due 6/15/25 (c) | | | 850,000 | | | | 897,813 | |
CommScope, Inc.
5.00%, due 6/15/21 (c) | | | 3,090,000 | | | | 3,151,800 | |
| | | | | | | | |
| | | Principal
Amount | | | Value | |
Telecommunications (continued) | | | | | | | | |
Hughes Satellite Systems Corp. | | | | | | | | |
6.50%, due 6/15/19 | | | $ 990,000 | | | $ | 1,048,163 | |
7.625%, due 6/15/21 | | | 460,000 | | | | 514,050 | |
Rogers Communications, Inc.
5.45%, due 10/1/43 (Canada) | | | 380,000 | | | | 455,211 | |
Sprint Spectrum Co. LLC / Sprint Spectrum Co. II LLC / Sprint Spectrum Co. III LLC
3.36%, due 3/20/23 (c) | | | 5,350,000 | | | | 5,427,575 | |
T-Mobile USA, Inc.
6.125%, due 1/15/22 | | | 3,515,000 | | | | 3,655,600 | |
Telecom Italia Capital S.A.
7.721%, due 6/4/38 (Italy) | | | 315,000 | | | | 407,531 | |
Telefonica Emisiones SAU (Spain) | | | | | | | | |
4.57%, due 4/27/23 | | | 2,552,000 | | | | 2,770,124 | |
5.213%, due 3/8/47 | | | 1,735,000 | | | | 1,910,415 | |
5.462%, due 2/16/21 | | | 395,000 | | | | 431,848 | |
¨Verizon Communications, Inc. | | | | | | | | |
4.125%, due 3/16/27 | | | 995,000 | | | | 1,038,316 | |
5.15%, due 9/15/23 | | | 2,325,000 | | | | 2,605,847 | |
| | | | | | | | |
| | | | | | | 33,998,313 | |
| | | | | | | | |
Textiles 0.2% | | | | | | | | |
Cintas Corp. No
2 3.70%, due 4/1/27 | | | 4,335,000 | | | | 4,518,442 | |
| | | | | | | | |
| | |
Transportation 0.1% | | | | | | | | |
XPO Logistics, Inc.
6.50%, due 6/15/22 (c) | | | 1,015,000 | | | | 1,064,837 | |
| | | | | | | | |
Total Corporate Bonds
(Cost $695,597,210) | | | | | | | 713,331,612 | |
| | | | | | | | |
| |
| Foreign Bonds 0.1% | | | | | |
Barclays Bank PLC Series Reg S
10.00%, due 5/21/21 | | | GBP 1,186,000 | | | | 1,992,516 | |
| | | | | | | | |
Total Foreign Bonds
(Cost $1,946,689) | | | | | | | 1,992,516 | |
| | | | | | | | |
| |
| Foreign Government Bonds 0.2% | | | | | |
Sovereign 0.2% | | | | | | | | |
Portugal Government International Bond 5.125%, due 10/15/24 (Portugal) (c) | | | $ 4,000,000 | | | | 4,234,560 | |
| | | | | | | | |
Total Foreign Government Bonds
(Cost $4,096,898) | | | | | | | 4,234,560 | |
| | | | | | | | |
| |
| Loan Assignments 5.5% (b) | | | | | |
Advertising 0.1% | | | | | | | | |
Outfront Media Capital LLC
2017 Term Loan B
3.489% (1-month USD-LIBOR-BBA + 2.25%), due 3/18/24 | | | 2,200,000 | | | | 2,213,750 | |
| | | | | | | | |
| | | | |
| 20 | | MainStay Income Builder Fund | | The notes to the financial statements are an integral part of,
and should be read in conjunction with, the financial statements. |
| | | | | | | | |
| | | Principal
Amount | | | Value | |
| Loan Assignments (continued) | | | | | |
Building Materials 0.3% | | | | | | | | |
Builders FirstSource, Inc.
2017 Term Loan B
4.333% (3-month USD-LIBOR-BBA + 3.00%), due 2/29/24 | | $ | 1,786,432 | | | $ | 1,791,270 | |
Forterra Finance LLC
2017 Term Loan B
4.242% (1-month USD-LIBOR-BBA + 3.00%), due 10/25/23 | | | 2,085,282 | | | | 1,740,092 | |
Quikrete Holdings, Inc.
2016 1st Lien Term Loan
3.992% (1-month USD-LIBOR-BBA + 2.75%), due 11/15/23 | | | 2,476,287 | | | | 2,477,835 | |
| | | | | | | | |
| | | | | | | 6,009,197 | |
| | | | | | | | |
Chemicals 0.1% | | | | | | | | |
Axalta Coating Systems U.S. Holdings, Inc. Term Loan
3.333% (3-month USD-LIBOR-BBA + 2.00%), due 6/1/24 | | | 2,493,750 | | | | 2,505,700 | |
| | | | | | | | |
| | |
Commercial Services 0.4% | | | | | | | | |
Allied Universal Holdco LLC
2015 Term Loan
5.083% (3-month USD-LIBOR-BBA + 3.75%), due 7/28/22 | | | 2,537,124 | | | | 2,526,704 | |
Global Payments, Inc.
Term Loan B2
3.242% (1-month USD-LIBOR-BBA + 2.00%), due 4/21/23 | | | 1,333,300 | | | | 1,336,448 | |
U.S. Security Associates Holdings, Inc. 2016 Term Loan
5.333% (3-month USD-LIBOR-BBA + 4.00%), due 7/14/23 | | | 3,960,075 | | | | 3,989,775 | |
| | | | | | | | |
| | | | | | | 7,852,927 | |
| | | | | | | | |
Computers 0.1% | | | | | | | | |
Tempo Acquisition LLC
Term Loan
4.242% (1-month USD-LIBOR-BBA + 3.00%), due 5/1/24 | | | 2,443,875 | | | | 2,449,476 | |
| | | | | | | | |
| | |
Containers, Packaging & Glass 0.6% | | | | | | | | |
Berry Plastics Group, Inc.
Term Loan M
3.488% (1-month USD-LIBOR-BBA + 2.25%), due 10/1/22 | | | 2,624,690 | | | | 2,631,797 | |
Term Loan M
3.492% (1-month USD-LIBOR-BBA +
2.25%), due 10/1/22 | | | 4,070,865 | | | | 4,081,889 | |
| | | | | | | | |
| | | Principal
Amount | | | Value | |
BWAY Holding Co., Inc.
2017 Term Loan B
4.522% (2-month USD-LIBOR-BBA +
3.25%), due 4/3/24 | | $ | 7,088 | | | $ | 7,106 | |
2017 Term Loan B
4.599% (3-month USD-LIBOR-BBA +
3.25%), due 4/3/24 | | | 2,820,825 | | | | 2,827,876 | |
Reynolds Group Holdings, Inc.
2017 Term Loan
3.992% (1-month USD-LIBOR-BBA + 2.75%), due 2/5/23 | | | 866,266 | | | | 870,858 | |
| | | | | | | | |
| | | | | | | 10,419,526 | |
| | | | | | | | |
Electrical Components & Equipment 0.1% | |
Electro Rent Corp.
1st Lien Term Loan
6.272% (2-month USD-LIBOR-BBA + 5.00%), due 1/19/24 (g) | | | 2,094,175 | | | | 2,120,352 | |
| | | | | | | | |
| | |
Entertainment 0.2% | | | | | | | | |
Regal Cinemas Corp.
2017 Term Loan
3.242% (1-month USD-LIBOR-BBA + 2.00%), due 4/1/22 | | | 3,532,272 | | | | 3,527,366 | |
| | | | | | | | |
| | |
Environmental Controls 0.4% | | | | | | | | |
Advanced Disposal Services, Inc.
Term Loan B3
3.953% (1-week USD-LIBOR-BBA + 2.75%), due 11/10/23 | | | 3,488,604 | | | | 3,516,224 | |
GFL Environmental, Inc.
Term Loan B
4.083% (3-month USD-LIBOR-BBA + 2.75%), due 9/29/23 (Canada) | | | 3,465,000 | | | | 3,475,828 | |
| | | | | | | | |
| | | | | | | 6,992,052 | |
| | | | | | | | |
Food & Staples Retailing 0.3% | | | | | | | | |
U.S. Foods, Inc.
2016 Term Loan B
4.00% (1-month USD-LIBOR-BBA + 2.75%), due 6/27/23 | | | 5,248,563 | | | | 5,286,877 | |
| | | | | | | | |
| | |
Health Care—Products 0.3% | | | | | | | | |
Ortho-Clinical Diagnostics S.A.
Term Loan B
5.083% (3-month USD-LIBOR-BBA + 3.75%), due 6/30/21 | | | 2,268,788 | | | | 2,275,263 | |
Sterigenics-Nordion Holdings LLC
2017 Term Loan B
4.242% (1-month USD-LIBOR-BBA + 3.00%), due 5/15/22 | | | 3,034,750 | | | | 3,038,543 | |
| | | | | | | | |
| | | | | | | 5,313,806 | |
| | | | | | | | |
| | | | | | |
The notes to the financial statements are an integral part of,
and should be read in conjunction with, the financial statements. | | | | | 21 | |
Portfolio of Investments October 31, 2017 (continued)
| | | | | | | | |
| | | Principal
Amount | | | Value | |
| Loan Assignments (continued) | | | | | |
Health Care—Services 0.2% | | | | | | | | |
MPH Acquisition Holdings LLC
2016 Term Loan B
4.333% (3-month USD-LIBOR-BBA + 3.00%), due 6/7/23 | | $ | 4,046,037 | | | $ | 4,074,360 | |
| | | | | | | | |
| |
Healthcare, Education & Childcare 0.3% | | | | | |
ExamWorks Group, Inc.
2017 Term Loan
4.492% (1-month USD-LIBOR-BBA + 3.25%), due 7/27/23 | | | 3,623,469 | | | | 3,643,851 | |
U.S. Renal Care, Inc.
2015 2nd Lien Term Loan
9.333% (3-month USD-LIBOR-BBA + 8.00%), due 12/31/23 | | | 1,700,000 | | | | 1,649,000 | |
| | | | | | | | |
| | | | | | | 5,292,851 | |
| | | | | | | | |
Hotels, Motels, Inns & Gaming 0.1% | | | | | | | | |
Scientific Games International, Inc.
2017 Term Loan B4
4.492% (1-month USD-LIBOR-BBA +
3.25%), due 8/14/24 | | | 390,219 | | | | 394,487 | |
2017 Term Loan B4
4.522% (2-month USD-LIBOR-BBA +
3.25%), due 8/14/24 | | | 1,439,781 | | | | 1,455,530 | |
| | | | | | | | |
| | |
Household Products & Wares 0.5% | | | | | | | | |
KIK Custom Products, Inc.
2015 Term Loan B
5.74% (1-month USD-LIBOR-BBA + 4.50%), due 8/26/22 (Canada) | | | 7,110,294 | | | | 7,183,175 | |
Prestige Brands, Inc.
Term Loan B5
3.992% (1-month USD-LIBOR-BBA + 2.75%), due 1/26/24 | | | 2,053,569 | | | | 2,063,516 | |
| | | | | | | | |
| | | | | | | 9,246,691 | |
| | | | | | | | |
Iron & Steel 0.4% | |
Signode Industrial Group U.S., Inc. (g)
Term Loan B
3.992%, (1-month USD-LIBOR-BBA +
2.75%), due 5/4/21 | | | 3,400,735 | | | | 3,426,241 | |
Term Loan B
4.082%, (3-month USD-LIBOR-BBA +
2.75%), due 5/4/21 | | | 3,063,726 | | | | 3,086,703 | |
| | | | | | | | |
| | |
Media 0.3% | | | | | | | | |
Nielsen Finance LLC
Term Loan B4
3.238% (1-month USD-LIBOR-BBA + 2.00%), due 10/4/23 | | | 885,550 | | | | 888,770 | |
| | | | | | | | |
| | | Principal
Amount | | | Value | |
Media (continued) | | | | | | | | |
Virgin Media Bristol LLC
Term Loan I
3.989% (1-month USD-LIBOR-BBA + 2.75%), due 1/31/25 | | $ | 3,650,000 | | | $ | 3,663,118 | |
| | | | | | | | |
| | | | | | | 4,551,888 | |
| | | | | | | | |
Software 0.1% | |
First Data Corp.
2017 Term Loan
3.738% (1-month USD-LIBOR-BBA + 2.50%), due 4/26/24 | | | 2,490,979 | | | | 2,502,769 | |
| | | | | | | | |
| | |
Telecommunications 0.6% | | | | | | | | |
Level 3 Financing, Inc.
2017 Term Loan B
3.489% (1-month USD-LIBOR-BBA + 2.25%), due 2/22/24 | | | 10,000,000 | | | | 10,025,000 | |
| | | | | | | | |
| | |
Transportation 0.1% | | | | | | | | |
XPO Logistics, Inc.
2017 Term Loan B
3.599% (3-month USD-LIBOR-BBA + 2.25%), due 11/1/21 | | | 1,575,000 | | | | 1,582,525 | |
| | | | | | | | |
Total Loan Assignments
(Cost $99,970,229) | | | | | | | 100,330,074 | |
| | | | | | | | |
|
| Mortgage-Backed Securities 0.6% | |
Commercial Mortgage Loans
(Collateralized Mortgage Obligations) 0.1% | |
Bayview Commercial Asset Trust
Series 2006-4A, Class A1
1.468% (1-month LIBOR + 0.23%), due 12/25/36 (b)(c) | | | 130,928 | | | | 125,119 | |
Citigroup Commercial Mortgage Trust Series 2008-C7, Class A4
6.227%, due 12/10/49 (h) | | | 5,301 | | | | 5,297 | |
Four Times Square Trust
Series 2006-4TS, Class A
5.401%, due 12/13/28 (c) | | | 842,540 | | | | 912,169 | |
| | | | | | | | |
| | | | | | | 1,042,585 | |
| | | | | | | | |
Residential Mortgages (Collateralized Mortgage Obligations) 0.5% | |
Japan Finance Organization for Municipalities
Series Reg S
1.375%, due 2/5/18 (Japan) | | | 8,780,000 | | | | 8,764,100 | |
Mortgage Equity Conversion Asset Trust Series 2007-FF2, Class A
1.70% (1-year Treasury Constant Maturity Rate + 0.47%),
due 2/25/42 (b)(c)(f)(g)(i) | | | 444,497 | | | | 378,967 | |
| | | | | | | | |
| | | | | | | 9,143,067 | |
| | | | | | | | |
Total Mortgage-Backed Securities
(Cost $10,201,204) | | | | 10,185,652 | |
| | | | | | | | |
| | | | |
| 22 | | MainStay Income Builder Fund | | The notes to the financial statements are an integral part of,
and should be read in conjunction with, the financial statements. |
| | | | | | | | |
| | | Principal
Amount | | | Value | |
| U.S. Government & Federal Agencies 2.3% | |
Federal Home Loan Mortgage Corporation
(Mortgage Pass-Through Securities) 0.0% ‡ | |
6.50%, due 2/1/27 | | $ | 23 | | | $ | 25 | |
6.50%, due 5/1/29 | | | 24,828 | | | | 27,535 | |
6.50%, due 6/1/29 | | | 6,343 | | | | 7,035 | |
6.50%, due 7/1/29 | | | 25,591 | | | | 28,381 | |
6.50%, due 8/1/29 | | | 8,311 | | | | 9,217 | |
6.50%, due 9/1/29 | | | 600 | | | | 665 | |
6.50%, due 6/1/32 | | | 2,670 | | | | 2,994 | |
6.50%, due 1/1/37 | | | 2,129 | | | | 2,391 | |
7.00%, due 9/1/26 | | | 4,121 | | | | 4,470 | |
7.00%, due 7/1/32 | | | 9,906 | | | | 11,240 | |
7.50%, due 5/1/32 | | | 4,533 | | | | 4,823 | |
| | | | | | | | |
| | | | | | | 98,776 | |
| | | | | | | | |
Federal National Mortgage Association
(Mortgage Pass-Through Securities) 0.2% | |
(zero coupon), due 10/9/19 | | | 2,700,000 | | | | 2,603,601 | |
4.50%, due 7/1/20 | | | 797 | | | | 814 | |
4.50%, due 3/1/21 | | | 1,742 | | | | 1,771 | |
6.00%, due 4/1/19 | | | 217 | | | | 243 | |
7.00%, due 10/1/37 | | | 502 | | | | 589 | |
7.00%, due 11/1/37 | | | 15,769 | | | | 17,782 | |
| | | | | | | | |
| | | | | | | 2,624,800 | |
| | | | | | | | |
Government National Mortgage Association
(Mortgage Pass-Through Securities) 0.0% ‡ | |
5.00%, due 12/15/37 | | | 1,536 | | | | 1,667 | |
5.50%, due 9/15/35 | | | 6,579 | | | | 7,298 | |
6.50%, due 4/15/29 | | | 13 | | | | 14 | |
6.50%, due 8/15/29 | | | 9 | | | | 10 | |
6.50%, due 10/15/31 | | | 2,231 | | | | 2,589 | |
7.00%, due 12/15/25 | | | 3,215 | | | | 3,243 | |
7.00%, due 11/15/27 | | | 6,608 | | | | 7,075 | |
7.00%, due 12/15/27 | | | 31,000 | | | | 33,447 | |
7.00%, due 6/15/28 | | | 3,712 | | | | 3,794 | |
7.50%, due 6/15/26 | | | 290 | | | | 315 | |
7.50%, due 10/15/30 | | | 15,708 | | | | 16,285 | |
8.00%, due 10/15/26 | | | 3,251 | | | | 3,512 | |
8.50%, due 11/15/26 | | | 17,929 | | | | 18,167 | |
| | | | | | | | |
| | | | | | | 97,416 | |
| | | | | | | | |
United States Treasury Bonds 0.5% | |
3.00%, due 2/15/47 | | | 2,855,000 | | | | 2,926,486 | |
3.75%, due 11/15/43 | | | 5,715,000 | | | | 6,678,067 | |
| | | | | | | | |
| | | | | | | 9,604,553 | |
| | | | | | | | |
¨United States Treasury Notes 1.6% | | | | | | | | |
1.25%, due 10/31/21 | | | 5,395,000 | | | | 5,261,179 | |
1.25%, due 7/31/23 | | | 25,125,000 | | | | 23,950,210 | |
| | | | | | | | |
| | | | | | | 29,211,389 | |
| | | | | | | | |
Total U.S. Government & Federal Agencies
(Cost $41,601,675) | | | | 41,636,934 | |
| | | | | | | | |
Total Long-Term Bonds
(Cost $856,850,465) | | | | 874,605,262 | |
| | | | | | | | |
| | | | | | | | |
| | |
Shares | | | Value | |
| Common Stocks 43.5% | |
Aerospace & Defense 0.8% | |
BAE Systems PLC (United Kingdom) | | | 1,210,230 | | | $ | 9,539,723 | |
Lockheed Martin Corp. | | | 18,009 | | | | 5,549,653 | |
| | | | | | | | |
| | | | | | | 15,089,376 | |
| | | | | | | | |
Air Freight & Logistics 1.0% | |
Deutsche Post A.G., Registered (Germany) | | | 238,659 | | | | 10,931,031 | |
United Parcel Service, Inc., Class B | | | 69,709 | | | | 8,192,899 | |
| | | | | | | | |
| | | | | | | 19,123,930 | |
| | | | | | | | |
Auto Components 0.4% | |
Cie Generale des Etablissements Michelin (France) | | | 53,720 | | | | 7,771,904 | |
| | | | | | | | |
| | |
Automobiles 0.5% | | | | | | | | |
Daimler A.G., Registered Shares (Germany) | | | 118,485 | | | | 9,839,246 | |
| | | | | | | | |
| | |
Banks 2.0% | | | | | | | | |
Commonwealth Bank of Australia (Australia) | | | 95,234 | | | | 5,658,243 | |
People’s United Financial, Inc. | | | 279,055 | | | | 5,207,166 | |
Royal Bank of Canada (Canada) | | | 77,830 | | | | 6,085,352 | |
Svenska Handelsbanken A.B., Class A (Sweden) | | | 451,212 | | | | 6,467,714 | |
Wells Fargo & Co. | | | 98,445 | | | | 5,526,703 | |
Westpac Banking Corp. (Australia) | | | 315,612 | | | | 7,968,853 | |
| | | | | | | | |
| | | | | | | 36,914,031 | |
| | | | | | | | |
Beverages 0.8% | |
Coca-Cola Co. | | | 98,700 | | | | 4,538,226 | |
Diageo PLC (United Kingdom) | | | 133,307 | | | | 4,553,770 | |
PepsiCo., Inc. | | | 44,410 | | | | 4,895,314 | |
| | | | | | | | |
| | | | | | | 13,987,310 | |
| | | | | | | | |
Biotechnology 0.5% | |
AbbVie, Inc. | | | 94,061 | | | | 8,489,005 | |
| | | | | | | | |
| | |
Capital Markets 0.7% | | | | | | | | |
BlackRock, Inc. | | | 10,117 | | | | 4,763,387 | |
CME Group, Inc. | | | 34,241 | | | | 4,696,838 | |
Singapore Exchange, Ltd. (Singapore) | | | 764,286 | | | | 4,300,546 | |
| | | | | | | | |
| | | | | | | 13,760,771 | |
| | | | | | | | |
Chemicals 1.3% | |
Agrium, Inc. (Canada) | | | 46,745 | | | | 5,091,465 | |
BASF S.E. (Germany) | | | 90,880 | | | | 9,910,756 | |
DowDuPont, Inc. | | | 127,340 | | | | 9,207,956 | |
| | | | | | | | |
| | | | | | | 24,210,177 | |
| | | | | | | | |
Communications Equipment 0.5% | |
Cisco Systems, Inc. | | | 251,150 | | | | 8,576,772 | |
| | | | | | | | |
| | | | | | |
The notes to the financial statements are an integral part of,
and should be read in conjunction with, the financial statements. | | | | | 23 | |
Portfolio of Investments October 31, 2017 (continued)
| | | | | | | | |
| | |
Shares | | | Value | |
| Common Stocks (continued) | |
Construction & Engineering 0.4% | | | | | | | | |
Vinci S.A. (France) | | | 71,435 | | | $ | 6,993,887 | |
| | | | | | | | |
|
Diversified Telecommunication Services 4.2% | |
¨AT&T, Inc. | | | 364,263 | | | | 12,257,450 | |
¨BCE, Inc. (Canada) | | | 324,146 | | | | 14,967,349 | |
CenturyLink, Inc. | | | 199,180 | | | | 3,782,428 | |
Deutsche Telekom A.G., Registered (Germany) | | | 563,885 | | | | 10,272,996 | |
Singapore Telecommunications, Ltd. (Singapore) | | | 1,742,215 | | | | 4,793,892 | |
Swisscom A.G., Registered (Switzerland) | | | 19,463 | | | | 9,832,458 | |
TELUS Corp. (Canada) | | | 181,291 | | | | 6,565,317 | |
¨Verizon Communications, Inc. | | | 278,046 | | | | 13,310,062 | |
| | | | | | | | |
| | | | | | | 75,781,952 | |
| | | | | | | | |
Electric Utilities 4.2% | |
American Electric Power Co., Inc. | | | 85,967 | | | | 6,396,805 | |
Duke Energy Corp. | | | 155,333 | | | | 13,717,457 | |
Entergy Corp. | | | 113,538 | | | | 9,793,788 | |
¨PPL Corp. | | | 359,190 | | | | 13,491,176 | |
Red Electrica Corp. S.A. (Spain) | | | 366,746 | | | | 8,121,146 | |
Southern Co. | | | 119,645 | | | | 6,245,469 | |
SSE PLC (United Kingdom) | | | 337,115 | | | | 6,187,757 | |
Terna Rete Elettrica Nazionale S.p.A. (Italy) | | | 2,174,570 | | | | 13,121,182 | |
| | | | | | | | |
| | | | | | | 77,074,780 | |
| | | | | | | | |
Electrical Equipment 0.7% | |
Eaton Corp. PLC | | | 86,835 | | | | 6,948,537 | |
Emerson Electric Co. | | | 98,120 | | | | 6,324,815 | |
| | | | | | | | |
| | | | | | | 13,273,352 | |
| | | | | | | | |
Equity Real Estate Investment Trusts 2.1% | |
Iron Mountain, Inc. | | | 223,600 | | | | 8,944,000 | |
Public Storage | | | 22,667 | | | | 4,697,736 | |
Unibail-Rodamco S.E. (France) | | | 45,905 | | | | 11,488,549 | |
Welltower, Inc. | | | 191,060 | | | | 12,793,377 | |
| | | | | | | | |
| | | | | | | 37,923,662 | |
| | | | | | | | |
Food Products 0.9% | |
Nestle S.A., Registered (Switzerland) | | | 105,302 | | | | 8,855,649 | |
Orkla ASA (Norway) | | | 702,970 | | | | 6,880,809 | |
| | | | | | | | |
| | | | | | | 15,736,458 | |
| | | | | | | | |
Gas Utilities 0.3% | |
Gas Natural SDG S.A. (Spain) | | | 245,080 | | | | 5,244,292 | |
| | | | | | | | |
|
Health Care Providers & Services 0.2% | |
Sonic Healthcare, Ltd. (Australia) | | | 268,020 | | | | 4,465,660 | |
| | | | | | | | |
| | |
Hotels, Restaurants & Leisure 0.4% | | | | | | | | |
McDonald’s Corp. | | | 39,083 | | | | 6,523,344 | |
| | | | | | | | |
| | | | | | | | |
| | |
Shares | | | Value | |
Household Products 0.7% | | | | | | | | |
Kimberly-Clark Corp. | | | 59,215 | | | $ | 6,662,280 | |
Procter & Gamble Co. | | | 66,795 | | | | 5,767,080 | |
| | | | | | | | |
| | | | | | | 12,429,360 | |
| | | | | | | | |
Industrial Conglomerates 0.3% | |
Siemens A.G., Registered (Germany) | | | 42,119 | | | | 6,010,131 | |
| | | | | | | | |
| | |
Insurance 3.0% | | | | | | | | |
Allianz S.E., Registered (Germany) | | | 46,757 | | | | 10,857,571 | |
Arthur J. Gallagher & Co. | | | 82,740 | | | | 5,239,924 | |
AXA S.A. (France) | | | 456,075 | | | | 13,775,539 | |
MetLife, Inc. | | | 100,806 | | | | 5,401,186 | |
Muenchener Rueckversicherungs-Gesellschaft A.G., Registered (Germany) | | | 60,303 | | | | 13,490,345 | |
SCOR S.E. (France) | | | 147,516 | | | | 6,125,021 | |
| | | | | | | | |
| | | | | | | 54,889,586 | |
| | | | | | | | |
Media 0.7% | |
ION Media Networks, Inc. (f)(g)(i)(j)(k) | | | 12 | | | | 8,143 | |
Regal Entertainment Group, Class A | | | 261,800 | | | | 4,280,430 | |
Sky PLC (United Kingdom) (k) | | | 637,139 | | | | 7,979,819 | |
| | | | | | | | |
| | | | | | | 12,268,392 | |
| | | | | | | | |
Multi-Utilities 2.2% | |
Ameren Corp. | | | 150,844 | | | | 9,350,820 | |
Dominion Energy, Inc. | | | 130,461 | | | | 10,585,605 | |
National Grid PLC (United Kingdom) | | | 953,297 | | | | 11,471,060 | |
WEC Energy Group, Inc. | | | 140,488 | | | | 9,467,486 | |
| | | | | | | | |
| | | | | | | 40,874,971 | |
| | | | | | | | |
Oil, Gas & Consumable Fuels 4.2% | |
Enterprise Products Partners, L.P. | | | 298,767 | | | | 7,319,792 | |
Exxon Mobil Corp. | | | 105,690 | | | | 8,809,262 | |
Magellan Midstream Partners, L.P. | | | 70,275 | | | | 4,828,595 | |
Occidental Petroleum Corp. | | | 134,130 | | | | 8,660,774 | |
Pembina Pipeline Corp. (Canada) | | | 29,405 | | | | 972,113 | |
Royal Dutch Shell PLC, Sponsored ADR (Netherlands) | | | 220,407 | | | | 13,892,253 | |
Snam S.p.A. (Italy) | | | 1,809,356 | | | | 9,244,054 | |
Statoil ASA (Norway) | | | 449,480 | | | | 9,101,860 | |
¨TOTAL S.A. (France) | | | 256,905 | | | | 14,325,368 | |
| | | | | | | | |
| | | | | | | 77,154,071 | |
| | | | | | | | |
Personal Products 0.5% | |
Unilever PLC (United Kingdom) | | | 151,560 | | | | 8,594,265 | |
| | | | | | | | |
| | |
Pharmaceuticals 3.7% | | | | | | | | |
AstraZeneca PLC, Sponsored ADR (United Kingdom) | | | 304,290 | | | | 10,498,005 | |
GlaxoSmithKline PLC (United Kingdom) | | | 650,510 | | | | 11,728,459 | |
Johnson & Johnson | | | 42,955 | | | | 5,988,357 | |
Merck & Co., Inc. | | | 95,509 | | | | 5,261,591 | |
Novartis A.G., Registered (Switzerland) | | | 100,531 | | | | 8,283,113 | |
| | | | |
| 24 | | MainStay Income Builder Fund | | The notes to the financial statements are an integral part of,
and should be read in conjunction with, the financial statements. |
| | | | | | | | |
| | |
Shares | | | Value | |
| Common Stocks (continued) | |
Pharmaceuticals (continued) | | | | | | | | |
Pfizer, Inc. | | | 299,086 | | | $ | 10,485,955 | |
Roche Holding A.G. (Switzerland) | | | 33,108 | | | | 7,649,370 | |
Sanofi (France) | | | 71,145 | | | | 6,736,764 | |
| | | | | | | | |
| | | | | | | 66,631,614 | |
| | | | | | | | |
Semiconductors & Semiconductor Equipment 1.6% | |
Intel Corp. | | | 131,848 | | | | 5,997,765 | |
QUALCOMM, Inc. | | | 186,428 | | | | 9,509,692 | |
Taiwan Semiconductor Manufacturing Co., Ltd., Sponsored ADR (Taiwan) | | | 138,738 | | | | 5,872,780 | |
Texas Instruments, Inc. | | | 84,184 | | | | 8,139,751 | |
| | | | | | | | |
| | | | | | | 29,519,988 | |
| | | | | | | | |
Software 0.3% | |
Microsoft Corp. | | | 61,573 | | | | 5,121,642 | |
| | | | | | | | |
| | |
Tobacco 3.0% | | | | | | | | |
Altria Group, Inc. | | | 200,064 | | | | 12,848,110 | |
¨British American Tobacco PLC (United Kingdom) | | | 167,830 | | | | 10,857,625 | |
¨British American Tobacco PLC, Sponsored ADR (United Kingdom) | | | 79,835 | | | | 5,141,374 | |
Imperial Brands PLC (United Kingdom) | | | 333,976 | | | | 13,619,824 | |
¨Philip Morris International, Inc. | | | 117,903 | | | | 12,337,370 | |
| | | | | | | | |
| | | | | | | 54,804,303 | |
| | | | | | | | |
Wireless Telecommunication Services 1.4% | |
Rogers Communications, Inc.,
Class B (Canada) | | | 187,159 | | | | 9,711,203 | |
¨Vodafone Group PLC (United Kingdom) | | | 5,235,334 | | | | 14,991,334 | |
| | | | | | | | |
| | | | 24,702,537 | |
| | | | | | | | |
Total Common Stocks
(Cost $707,418,494) | | | | 793,780,769 | |
| | | | | | | | |
| | |
| | | | | | | | |
| | | | | | | | |
| | | Principal
Amount | | | Value | |
| Short-Term Investment 7.4% | | | | | | | | |
Repurchase Agreement 7.4% | | | | | | | | |
Fixed Income Clearing Corp.
0.34%, dated 10/31/17
due 11/1/17
Proceeds at Maturity $134,860,197 (Collateralized by a United States Treasury Note with rates between 1.75% and 2.125% and maturity dates between 12/31/22 and 1/31/23, with a Principal Amount of $138,285,000 and a Market Value of $137,562,301) | | $ | 134,858,923 | | | $ | 134,858,923 | |
| | | | | | | | |
Total Short-Term Investment
(Cost $134,858,923) | | | | | | | 134,858,923 | |
| | | | | | | | |
Total Investments
(Cost $1,699,127,882) | | | 98.9 | % | | | 1,803,244,954 | |
Other Assets, Less Liabilities | | | 1.1 | | | | 19,818,718 | |
Net Assets | | | 100.0 | % | | $ | 1,823,063,672 | |
| ‡ | Less than one-tenth of a percent. |
| (a) | Step coupon—Rate shown was the rate in effect as of October 31, 2017. |
| (b) | Floating rate—Rate shown was the rate in effect as of October 31, 2017. |
| (c) | May be sold to institutional investors only under Rule 144A or securities offered pursuant to Section 4(a)(2) of the Securities Act of 1933, as amended. |
| (d) | Securities are perpetual and, thus, do not have a predetermined maturity date. The date shown, if applicable, reflects the next call date. |
| (e) | Fixed to floating rate—Rate shown was the rate in effect as of October 31, 2017. |
| (f) | Fair valued security—Represents fair value as measured in good faith under procedures approved by the Board of Trustees. As of October 31, 2017, the total market value of fair valued securities was $580,305, which represented less than one-tenth of a percent of the Fund’s net assets. |
| (g) | Security in which significant unobservable inputs (Level 3) were used in determining fair value. |
| (h) | Collateral strip rate—A bond whose interest was based on the weighted net interest rate of the collateral. The coupon rate adjusts periodically based on a predetermined schedule. Rate shown was the rate in effect as of October 31, 2017. |
| (i) | Illiquid security—As of October 31, 2017, the total market value of these securities deemed illiquid under procedures approved by the Board of Trustees was $387,110, which represented less than one-tenth of a percent of the Fund’s net assets. (Unaudited) |
| (k) | Non-income producing security. |
| | | | | | |
The notes to the financial statements are an integral part of,
and should be read in conjunction with, the financial statements. | | | | | 25 | |
Portfolio of Investments October 31, 2017 (continued)
As of October 31, 2017, the Fund held the following foreign currency forward contracts:
| | | | | | | | | | | | | | | | | | | | | | |
Foreign Currency Buy Contracts | | Settlement
Date | | | Counterparty | | Contract Amount
Purchased | | | Contract
Amount Sold | | | Unrealized
Appreciation
(Depreciation) | |
Canadian Dollar vs. U.S. Dollar | | | 11/1/17 | | | JPMorgan Chase Bank | | | CAD | | | | 23,109,000 | | | $ | 18,040,784 | | | $ | (128,219 | ) |
Euro vs. U.S. Dollar | | | 11/1/17 | | | JPMorgan Chase Bank | | | EUR | | | | 90,810,000 | | | | 107,286,428 | | | | (1,506,445 | ) |
Pound Sterling vs. U.S. Dollar | | | 11/1/17 | | | JPMorgan Chase Bank | | | GBP | | | | 38,762,000 | | | | 51,367,402 | | | | 114,348 | |
| | | | | | |
| | | | | | | | | | | | | | | | | | | | | | |
Foreign Currency Sales Contracts | | | | | | | Contract
Amount
Sold | | | Contract
Amount
Purchased | | | | |
Canadian Dollar vs. U.S. Dollar | | | 11/1/17 | | | JPMorgan Chase Bank | | | CAD | | | | 23,109,000 | | | | 18,494,598 | | | | 582,033 | |
Canadian Dollar vs. U.S. Dollar | | | 2/1/18 | | | JPMorgan Chase Bank | | | | | | | 24,210,000 | | | | 18,914,860 | | | | 130,673 | |
Euro vs. U.S. Dollar | | | 11/1/17 | | | JPMorgan Chase Bank | | | EUR | | | | 90,810,000 | | | | 106,202,295 | | | | 422,312 | |
Euro vs. U.S. Dollar | | | 2/1/18 | | | JPMorgan Chase Bank | | | | | | | 83,638,000 | | | | 99,334,594 | | | | 1,382,704 | |
Pound Sterling vs. U.S. Dollar | | | 11/1/17 | | | JPMorgan Chase Bank | | | GBP | | | | 38,762,000 | | | | 50,733,644 | | | | (748,107 | ) |
Pound Sterling vs. U.S. Dollar | | | 2/1/18 | | | JPMorgan Chase Bank | | | | | | | 39,085,000 | | | | 51,946,623 | | | | (115,731 | ) |
Net unrealized appreciation (depreciation) on foreign currency forward contracts | | | | | | | | | | | $ | 133,568 | |
As of October 31, 2017, the Fund held the following futures contracts1:
| | | | | | | | | | | | | | | | | | | | |
Type | | Number of
Contracts
Long
(Short) | | | Expiration
Date | | | Value at
Trade Date | | | Current
Notional
Amount | | | Unrealized
Appreciation
(Depreciation)2 | |
| 2-Year United States Treasury Note | | | (338 | ) | | | December 2017 | | | $ | (73,081,207 | ) | | $ | (72,791,469 | ) | | $ | 289,738 | |
| 5-Year United States Treasury Note | | | 1,086 | | | | December 2017 | | | | 128,549,112 | | | | 127,265,625 | | | | (1,283,487 | ) |
| 10-Year United States Treasury Note | | | (173 | ) | | | December 2017 | | | | (21,908,497 | ) | | | (21,614,188 | ) | | | 294,309 | |
| S&P 500 Index Mini | | | 1,480 | | | | December 2017 | | | | 182,957,082 | | | | 190,379,800 | | | | 7,422,718 | |
| Euro Stoxx 50 | | | 1,965 | | | | December 2017 | | | | 78,213,423 | | | | 84,186,819 | | | | 5,973,396 | |
| Nikkei 225 | | | 595 | | | | December 2017 | | | | 51,165,955 | | | | 58,110,681 | | | | 6,944,726 | |
| United States Treasury Bond | | | 436 | | | | December 2017 | | | | 67,765,278 | | | | 66,476,375 | | | | (1,288,903 | ) |
| | | | | | | | | | | | | | | | | | | | |
| | | | | | | | | | $ | 413,661,146 | | | $ | 432,013,643 | | | $ | 18,352,497 | |
| | | | | | | | | | | | | | | | | | | | |
| 1. | As of October 31, 2017, cash in the amount of $16,679,522 was on deposit with a broker or futures commission merchant for futures transactions. |
| 2. | Represents the difference between the value of the contracts at the time they were opened and the value as of October 31, 2017. |
The following abbreviations are used in the preceding pages:
ADR—American Depositary Receipt
BBA—British Bankers’ Association
CAD —Canadian Dollar
EUR —Euro
GBP—British Pound Sterling
LIBOR—London InterBank Offered Rate
| | | | |
| 26 | | MainStay Income Builder Fund | | The notes to the financial statements are an integral part of,
and should be read in conjunction with, the financial statements. |
The following is a summary of the fair valuations according to the inputs used as of October 31, 2017, for valuing the Fund’s assets and liabilities.
Asset Valuation Inputs
| | | | | | | | | | | | | | | | |
Description | | Quoted
Prices in
Active
Markets for
Identical
Assets (Level 1) | | | Significant
Other
Observable
Inputs (Level 2) | | | Significant
Unobservable
Inputs (Level 3) | | | Total | |
| Investments in Securities (a) | | | | | | | | | | | | | | | | |
| Long-Term Bonds | | | | | | | | | | | | | | | | |
Asset-Backed Securities | | $ | — | | | $ | 2,893,914 | | | $ | — | | | $ | 2,893,914 | |
Corporate Bonds | | | — | | | | 713,331,612 | | | | — | | | | 713,331,612 | |
Foreign Bonds | | | — | | | | 1,992,516 | | | | — | | | | 1,992,516 | |
Foreign Government Bonds | | | — | | | | 4,234,560 | | | | — | | | | 4,234,560 | |
Loan Assignments (b) | | | — | | | | 91,696,778 | | | | 8,633,296 | | | | 100,330,074 | |
Mortgage-Backed Securities (c) | | | — | | | | 9,806,685 | | | | 378,967 | | | | 10,185,652 | |
U.S. Government & Federal Agencies | | | — | | | | 41,636,934 | | | | — | | | | 41,636,934 | |
| | | | | | | | | | | | | | | | |
| Total Long-Term Bonds | | | — | | | | 865,592,999 | | | | 9,012,263 | | | | 874,605,262 | |
| | | | | | | | | | | | | | | | |
| Common Stocks (d) | | | 793,772,626 | | | | — | | | | 8,143 | | | | 793,780,769 | |
| Short-Term Investment | | | | | | | | | | | | | | | | |
Repurchase Agreement | | | — | | | | 134,858,923 | | | | — | | | | 134,858,923 | |
| | | | | | | | | | | | | | | | |
| Total Investments in Securities | | | 793,772,626 | | | | 1,000,451,922 | | | | 9,020,406 | | | | 1,803,244,954 | |
| | | | | | | | | | | | | | | | |
| Other Financial Instruments | | | | | | | | | | | | | | | | |
Foreign Currency Forward Contracts (e) | | | — | | | | 2,632,070 | | | | — | | | | 2,632,070 | |
Futures Contracts (e) | | | 20,924,887 | | | | — | | | | — | | | | 20,924,887 | |
| | | | | | | | | | | | | | | | |
| Total Other Financial Instruments | | | 20,924,887 | | | | 2,632,070 | | | | — | | | | 23,556,957 | |
| | | | | | | | | | | | | | | | |
| Total Investments in Securities and Other Financial Instruments | | $ | 814,697,513 | | | $ | 1,003,083,992 | | | $ | 9,020,406 | | | $ | 1,826,801,911 | |
| | | | | | | | | | | | | | | | |
Liability Valuation Inputs
| | | | | | | | | | | | | | | | |
Description | | Quoted
Prices in
Active
Markets for
Identical
Assets (Level 1) | | | Significant
Other
Observable
Inputs (Level 2) | | | Significant
Unobservable
Inputs (Level 3) | | | Total | |
| Other Financial Instruments | | | | | | | | | | | | | | | | |
Foreign Currency Forward Contracts (e) | | $ | — | | | $ | (2,498,502 | ) | | $ | — | | | $ | (2,498,502 | ) |
Futures Contracts (e) | | | (2,572,390 | ) | | | — | | | | — | | | | (2,572,390 | ) |
| | | | | | | | | | | | | | | | |
| Total Other Financial Instruments | | $ | (2,572,390 | ) | | $ | (2,498,502 | ) | | $ | — | | | $ | (5,070,892 | ) |
| | | | | | | | | | | | | | | | |
| (a) | For a complete listing of investments and their industries, see the Portfolio of Investments. |
| (b) | The Level 3 securities valued at $ 6,512,944 and $ 2,120,352 are held in Iron & Steel and Electrical Components & Equipment within the Loan Assignments section of the Portfolio of Investments respectively. |
| (c) | The Level 3 security valued at $378,967 is held in Residential Mortgages (Collateralized Mortgage Obligations) within the Mortgage-Backed Securities section of the Portfolio of Investments. |
| (d) | The Level 3 security valued at $8,143 is held in Media within the Common Stocks section of the Portfolio of Investments. |
| (e) | The value listed for these securities reflects unrealized appreciation (depreciation) as shown on the Portfolio of Investments. |
The Fund recognizes transfers between the levels as of the beginning of the period.
As of October 31, 2017, a loan assignment with a market value of $7,418,383 transferred from Level 2 to Level 3. The transfer occurred as a result of utilizing significant unobservable inputs. As of October 31, 2016, the fair value obtained for this loan assignment, from an independent pricing service, utilized significant observable inputs.
| | | | | | |
The notes to the financial statements are an integral part of,
and should be read in conjunction with, the financial statements. | | | | | 27 | |
Portfolio of Investments October 31, 2017 (continued)
As of October 31, 2017, a loan assignment with a market value of $1,623,500 transferred from Level 3 to Level 2. The transfer occurred as a result of utilizing significant observable inputs. As of October 31, 2016, the fair value obtained for these securities, as determined based on information provided by an independent pricing source, utilized significant unobservable inputs.
The following is a reconciliation of investments in which significant unobservable inputs (Level 3) were used in determining value:
| | | | | | | | | | | | | | | | | | | | | | | | | | | | | | | | | | | | | | | | |
Investments in Securities | | Balance
as of
October 31,
2016 | | | Accrued
Discounts
(Premiums) | | | Realized
Gain
(Loss) | | | Change in
Unrealized
Appreciation
(Depreciation) | | | Purchases | | | Sales (a) | | | Transfers
in to
Level 3 | | | Transfers
out of
Level 3 | | | Balance
as of
October 31,
2017 | | | Change in
Unrealized
Appreciation
(Depreciation)
from
Investments
Still Held at
October 31,
2017 (b) | |
| Long-Term Bonds | | | | | | | | | | | | | | | | | | | | | | | | | | | | | | | | | | | | | | | | |
Loan Assignments | | | | | | | | | | | | | | | | | | | | | | | | | | | | | | | | | | | | | | | | |
Electrical Components & Equipment | | $ | — | | | $ | 3,060 | | | $ | 226 | | | $ | 54,541 | | | $ | 2,078,350 | | | $ | (15,825 | ) | | $ | — | | | $ | — | | | $ | 2,120,352 | | | $ | 54,541 | |
Iron & Steel | | | — | | | | 3,285 | | | | 1,822 | | | | 75,974 | | | | — | | | | (986,520 | ) | | | 7,418,383 | | | | — | | | | 6,512,944 | | | | 75,974 | |
Healthcare, Education & Childcare | | | 1,623,500 | | | | | | | | — | | | | | | | | — | | | | — | | | | — | | | | (1,623,500 | ) | | | — | | | | — | |
Mortgage-Backed Securities | | | | | | | | | | | | | | | | | | | | | | | | | | | | | | | | | | | | | | | | |
Residential Mortgages (Collateralized Mortgage Obligations) | | | 422,378 | | | | — | | | | — | | | | 9,007 | | | | — | | | | (52,418 | ) | | | — | | | | — | | | | 378,967 | | | | 1,144 | |
| Common Stocks | | | | | | | | | | | | | | | | | | | | | | | | | | | | | | | | | | | | | | | | |
Media | | | 6,425 | | | | — | | | | — | | | | 1,718 | | | | — | | | | — | | | | — | | | | — | | | | 8,143 | | | | 1,718 | |
| | | | | | | | | | | | | | | | | | | | | | | | | | | | | | | | | | | | | | | | |
| Total | | $ | 2,052,303 | | | $ | 6,345 | | | $ | 2,048 | | | $ | 141,240 | | | $ | 2,078,350 | | | $ | (1,054,763 | ) | | $ | 7,418,383 | | | $ | (1,623,500 | ) | | $ | 9,020,406 | | | $ | 133,377 | |
| | | | | | | | | | | | | | | | | | | | | | | | | | | | | | | | | | | | | | | | |
| (a) | Sales include principal reductions. |
| (b) | Included in “Net change in unrealized appreciation (depreciation) on investments” in the Statement of Operations. |
| | | | |
| 28 | | MainStay Income Builder Fund | | The notes to the financial statements are an integral part of,
and should be read in conjunction with, the financial statements. |
Statement of Assets and Liabilities as of October 31, 2017
| | | | |
| Assets | |
Investment in securities, at value (identified cost $1,699,127,882) | | $ | 1,803,244,954 | |
Cash denominated in foreign currencies (identified cost $29,366) | | | 29,328 | |
Cash collateral on deposit at broker for futures contracts | | | 16,679,522 | |
Receivables: | | | | |
Dividends and interest | | | 9,640,100 | |
Fund shares sold | | | 4,249,309 | |
Investment securities sold | | | 3,717,323 | |
Variation margin on futures contracts | | | 1,664,753 | |
Other assets | | | 53,545 | |
Unrealized appreciation on foreign currency forward contracts | | | 2,632,070 | |
| | | | |
Total assets | | | 1,841,910,904 | |
| | | | |
| |
| Liabilities | | | | |
Payables: | | | | |
Investment securities purchased | | | 12,440,498 | |
Fund shares redeemed | | | 1,827,547 | |
Manager (See Note 3) | | | 938,846 | |
NYLIFE Distributors (See Note 3) | | | 417,861 | |
Transfer agent (See Note 3) | | | 182,570 | |
Shareholder communication | | | 136,227 | |
Professional fees | | | 25,618 | |
Custodian | | | 8,477 | |
Trustees | | | 4,408 | |
Accrued expenses | | | 34,780 | |
Interest expense and fees payable | | | 89,420 | |
Dividend payable | | | 242,478 | |
Unrealized depreciation on foreign currency forward contracts | | | 2,498,502 | |
| | | | |
Total liabilities | | | 18,847,232 | |
| | | | |
Net assets | | $ | 1,823,063,672 | |
| | | | |
| |
| Composition of Net Assets | | | | |
Shares of beneficial interest outstanding (par value of $.01 per share) unlimited number of shares authorized | | $ | 908,621 | |
Additional paid-in capital | | | 1,670,630,391 | |
| | | | |
| | | 1,671,539,012 | |
Undistributed net investment income | | | 4,266,539 | |
Accumulated net realized gain (loss) on investments, unfunded commitments, futures transactions and foreign currency transactions | | | 24,672,660 | |
Net unrealized appreciation (depreciation) on investments and futures contracts | | | 122,469,569 | |
Net unrealized appreciation (depreciation) on translation of other assets and liabilities in foreign currencies and foreign currency forward contracts | | | 115,892 | |
| | | | |
Net assets | | $ | 1,823,063,672 | |
| | | | |
| | | | |
Class A | | | | |
Net assets applicable to outstanding shares | | $ | 652,332,503 | |
| | | | |
Shares of beneficial interest outstanding | | | 32,660,776 | |
| | | | |
Net asset value per share outstanding | | $ | 19.97 | |
Maximum sales charge (5.50% of offering price) | | | 1.16 | |
| | | | |
Maximum offering price per share outstanding | | $ | 21.13 | |
| | | | |
Investor Class | | | | |
Net assets applicable to outstanding shares | | $ | 93,999,911 | |
| | | | |
Shares of beneficial interest outstanding | | | 4,702,987 | |
| | | | |
Net asset value per share outstanding | | $ | 19.99 | |
Maximum sales charge (5.50% of offering price) | | | 1.16 | |
| | | | |
Maximum offering price per share outstanding | | $ | 21.15 | |
| | | | |
Class B | | | | |
Net assets applicable to outstanding shares | | $ | 39,474,690 | |
| | | | |
Shares of beneficial interest outstanding | | | 1,963,551 | |
| | | | |
Net asset value and offering price per share outstanding | | $ | 20.10 | |
| | | | |
Class C | | | | |
Net assets applicable to outstanding shares | | $ | 266,591,788 | |
| | | | |
Shares of beneficial interest outstanding | | | 13,284,696 | |
| | | | |
Net asset value and offering price per share outstanding | | $ | 20.07 | |
| | | | |
Class I | | | | |
Net assets applicable to outstanding shares | | $ | 766,054,109 | |
| | | | |
Shares of beneficial interest outstanding | | | 38,019,121 | |
| | | | |
Net asset value and offering price per share outstanding | | $ | 20.15 | |
| | | | |
Class R2 | | | | |
Net assets applicable to outstanding shares | | $ | 4,409,222 | |
| | | | |
Shares of beneficial interest outstanding | | | 220,912 | |
| | | | |
Net asset value and offering price per share outstanding | | $ | 19.96 | |
| | | | |
Class R3 | | | | |
Net assets applicable to outstanding shares | | $ | 201,449 | |
| | | | |
Shares of beneficial interest outstanding | | | 10,087 | |
| | | | |
Net asset value and offering price per share outstanding | | $ | 19.97 | |
| | | | |
| | | | | | |
The notes to the financial statements are an integral part of,
and should be read in conjunction with, the financial statements. | | | | | 29 | |
Statement of Operations for the year ended October 31, 2017
| | | | |
| Investment Income (Loss) | |
Income | | | | |
Interest (a) | | $ | 31,778,370 | |
Dividends (b) | | | 28,023,150 | |
Other income | | | 1,782 | |
| | | | |
Total income | | | 59,803,302 | |
| | | | |
Expenses | | | | |
Manager (See Note 3) | | | 10,369,982 | |
Distribution/Service—Class A (See Note 3) | | | 1,451,636 | |
Distribution/Service—Investor Class (See Note 3) | | | 368,106 | |
Distribution/Service—Class B (See Note 3) | | | 413,699 | |
Distribution/Service—Class C (See Note 3) | | | 2,593,690 | |
Distribution/Service—Class R2 (See Note 3) | | | 7,803 | |
Distribution/Service—Class R3 (See Note 3) | | | 640 | |
Transfer agent (See Note 3) | | | 2,204,706 | |
Shareholder communication | | | 253,944 | |
Registration | | | 163,308 | |
Professional fees | | | 148,409 | |
Interest expense | | | 107,496 | |
Custodian | | | 65,340 | |
Trustees | | | 41,483 | |
Shareholder service (See Note 3) | | | 3,249 | |
Miscellaneous | | | 86,640 | |
| | | | |
Total expenses | | | 18,280,131 | |
| | | | |
Net investment income (loss) | | | 41,523,171 | |
| | | | |
|
| Realized and Unrealized Gain (Loss) on Investments, Futures Contracts and Foreign Currency Transactions | |
Net realized gain (loss) on: | | | | |
Investment transactions | | | 36,727,881 | |
Futures transactions | | | 40,236,682 | |
Unfunded commitments | | | 245 | |
Foreign currency forward transactions | | | (3,966,100 | ) |
Foreign currency transactions | | | 362,833 | |
| | | | |
Net realized gain (loss) on investments, futures transactions and foreign currency transactions | | | 73,361,541 | |
| | | | |
Net change in unrealized appreciation (depreciation) on: | | | | |
Investments | | | 59,853,822 | |
Futures contracts | | | 24,070,976 | |
Unfunded commitments | | | (668 | ) |
Foreign currency forward contracts | | | (4,476,821 | ) |
Translation of other assets and liabilities in foreign currencies | | | 460,321 | |
| | | | |
Net change in unrealized appreciation (depreciation) on investments, unfunded commitments, futures contracts and foreign currency transactions | | | 79,907,630 | |
| | | | |
Net realized and unrealized gain (loss) on investments, unfunded commitments, futures transactions and foreign currency transactions | | | 153,269,171 | |
| | | | |
Net increase (decrease) in net assets resulting from operations | | $ | 194,792,342 | |
| | | | |
| (a) | Interest recorded net of foreign withholding taxes in the amount of $2,884. |
| (b) | Dividends recorded net of foreign withholding taxes in the amount of $1,719,078. |
| | | | |
| 30 | | MainStay Income Builder Fund | | The notes to the financial statements are an integral part of,
and should be read in conjunction with, the financial statements. |
Statements of Changes in Net Assets
for the years ended October 31, 2017 and October 31, 2016
| | | | | | | | |
| | | 2017 | | | 2016 | |
| Increase (Decrease) in Net Assets | |
Operations: | | | | | | | | |
Net investment income (loss) | | $ | 41,523,171 | | | $ | 47,145,888 | |
Net realized gain (loss) on investments, futures transactions and foreign currency transactions | | | 73,361,541 | | | | (22,993,779 | ) |
Net change in unrealized appreciation (depreciation) on investments, unfunded commitments, futures contracts and foreign currency transactions | | | 79,907,630 | | | | 29,111,470 | |
| | | | |
Net increase (decrease) in net assets resulting from operations | | | 194,792,342 | | | | 53,263,579 | |
| | | | |
Dividends and distributions to shareholders: | | | | | | | | |
From net investment income: | | | | | | | | |
Class A | | | (16,659,348 | ) | | | (18,845,332 | ) |
Investor Class | | | (4,037,985 | ) | | | (4,941,822 | ) |
Class B | | | (791,063 | ) | | | (1,008,072 | ) |
Class C | | | (4,923,638 | ) | | | (5,780,002 | ) |
Class I | | | (20,353,145 | ) | | | (18,612,750 | ) |
Class R2 | | | (86,627 | ) | | | (9,899 | ) |
Class R3 | | | (3,011 | ) | | | (767 | ) |
| | | | |
| | | (46,854,817 | ) | | | (49,198,644 | ) |
| | | | |
From net realized gain on investments: | | | | | | | | |
Class A | | | — | | | | (18,546,003 | ) |
Investor Class | | | — | | | | (4,978,803 | ) |
Class B | | | — | | | | (1,339,617 | ) |
Class C | | | — | | | | (7,349,774 | ) |
Class I | | | — | | | | (15,949,233 | ) |
Class R2 | | | — | | | | (6,680 | ) |
| | | | |
| | | — | | | | (48,170,110 | ) |
| | | | |
Total dividends and distributions to shareholders | | | (46,854,817 | ) | | | (97,368,754 | ) |
| | | | |
Capital share transactions: | | | | | | | | |
Net proceeds from sale of shares | | | 458,777,858 | | | | 482,452,593 | |
Net asset value of shares issued to shareholders in reinvestment of dividends and distributions | | | 41,265,270 | | | | 88,232,030 | |
Cost of shares redeemed | | | (392,215,949 | ) | | | (495,069,609 | ) |
| | | | |
Increase (decrease) in net assets derived from capital share transactions | | | 107,827,179 | | | | 75,615,014 | |
| | | | |
Net increase (decrease) in net assets | | | 255,764,704 | | | | 31,509,839 | |
| | | | | | | | |
| | | 2017 | | | 2016 | |
| Net Assets | | | | | | | | |
Beginning of year | | $ | 1,567,298,968 | | | $ | 1,535,789,129 | |
| | | | |
End of year | | $ | 1,823,063,672 | | | $ | 1,567,298,968 | |
| | | | |
Undistributed net investment income at end of year | | $ | 4,266,539 | | | $ | 8,674,281 | |
| | | | |
| | | | | | |
The notes to the financial statements are an integral part of,
and should be read in conjunction with, the financial statements. | | | | | 31 | |
Financial Highlights selected per share data and ratios
| | | | | | | | | | | | | | | | | | | | |
| | | Year ended October 31, | |
| Class A | | 2017 | | | 2016 | | | 2015 | | | 2014 | | | 2013 | |
Net asset value at beginning of year | | $ | 18.30 | | | $ | 18.79 | | | $ | 20.51 | | | $ | 19.83 | | | $ | 17.46 | |
| | | | | | | | | | | | | | | | | | | | |
Net investment income (loss) (a) | | | 0.48 | | | | 0.58 | | | | 0.68 | | | | 0.82 | | | | 0.69 | |
Net realized and unrealized gain (loss) on investments | | | 1.83 | | | | (0.17 | ) | | | (0.98 | ) | | | 0.96 | | | | 2.43 | |
Net realized and unrealized gain (loss) on foreign currency transactions | | | (0.09 | ) | | | 0.30 | | | | 0.15 | | | | 0.14 | | | | (0.06 | ) |
| | | | | | | | | | | | | | | | | | | | |
Total from investment operations | | | 2.22 | | | | 0.71 | | | | (0.15 | ) | | | 1.92 | | | | 3.06 | |
| | | | | | | | | | | | | | | | | | | | |
| Less dividends and distributions: | | | | | | | | | | | | | | | | | | | | |
From net investment income | | | (0.55 | ) | | | (0.61 | ) | | | (0.70 | ) | | | (0.72 | ) | | | (0.69 | ) |
From net realized gain on investments | | | — | | | | (0.59 | ) | | | (0.87 | ) | | | (0.52 | ) | | | — | |
| | | | | | | | | | | | | | | | | | | | |
Total dividends and distributions | | | (0.55 | ) | | | (1.20 | ) | | | (1.57 | ) | | | (1.24 | ) | | | (0.69 | ) |
| | | | | | | | | | | | | | | | | | | | |
Net asset value at end of year | | $ | 19.97 | | | $ | 18.30 | | | $ | 18.79 | | | $ | 20.51 | | | $ | 19.83 | |
| | | | | | | | | | | | | | | | | | | | |
Total investment return (b) | | | 12.30 | % | | | 4.08 | % | | | (0.81 | %) | | | 10.08 | % | | | 17.90 | % |
| Ratios (to average net assets)/Supplemental Data: | | | | | | | | | | | | | | | | | | | | |
Net investment income (loss) | | | 2.52 | % | | | 3.21 | % | | | 3.49 | % | | | 4.06 | % | | | 3.71 | % |
Net expenses | | | 1.01 | % | | | 1.02 | % | | | 1.02 | % | | | 1.01 | % | | | 1.04 | % |
Portfolio turnover rate | | | 29 | % | | | 27 | % | | | 30 | % | | | 15 | % | | | 31 | % |
Net assets at end of year (in 000’s) | | $ | 652,333 | | | $ | 574,390 | | | $ | 581,920 | | | $ | 497,591 | | | $ | 397,101 | |
| (a) | Per share data based on average shares outstanding during the year. |
| (b) | Total investment return is calculated exclusive of sales charges and assumes the reinvestment of dividends and distributions. For periods of less than one year, total return is not annualized. |
| | | | | | | | | | | | | | | | | | | | |
| | | Year ended October 31, | |
| Investor Class | | 2017 | | | 2016 | | | 2015 | | | 2014 | | | 2013 | |
Net asset value at beginning of year | | $ | 18.31 | | | $ | 18.80 | | | $ | 20.52 | | | $ | 19.84 | | | $ | 17.46 | |
| | | | | | | | | | | | | | | | | | | | |
Net investment income (loss) (a) | | | 0.47 | | | | 0.56 | | | | 0.65 | | | | 0.78 | | | | 0.64 | |
Net realized and unrealized gain (loss) on investments | | | 1.82 | | | | (0.16 | ) | | | (0.99 | ) | | | 0.95 | | | | 2.44 | |
Net realized and unrealized gain (loss) on foreign currency transactions | | | (0.09 | ) | | | 0.28 | | | | 0.15 | | | | 0.14 | | | | (0.06 | ) |
| | | | | | | | | | | | | | | | | | | | |
Total from investment operations | | | 2.20 | | | | 0.68 | | | | (0.19 | ) | | | 1.87 | | | | 3.02 | |
| | | | | | | | | | | | | | | | | | | | |
| Less dividends and distributions: | | | | | | | | | | | | | | | | | | | | |
From net investment income | | | (0.52 | ) | | | (0.58 | ) | | | (0.66 | ) | | | (0.67 | ) | | | (0.64 | ) |
From net realized gain on investments | | | — | | | | (0.59 | ) | | | (0.87 | ) | | | (0.52 | ) | | | — | |
| | | | | | | | | | | | | | | | | | | | |
Total dividends and distributions | | | (0.52 | ) | | | (1.17 | ) | | | (1.53 | ) | | | (1.19 | ) | | | (0.64 | ) |
| | | | | | | | | | | | | | | | | | | | |
Net asset value at end of year | | $ | 19.99 | | | $ | 18.31 | | | $ | 18.80 | | | $ | 20.52 | | | $ | 19.84 | |
| | | | | | | | | | | | | | | | | | | | |
Total investment return (b) | | | 12.19 | % | | | 3.93 | % | | | (0.97 | %) | | | 9.83 | % | | | 17.62 | % |
| Ratios (to average net assets)/Supplemental Data: | | | | | | | | | | | | | | | | | | | | |
Net investment income (loss) | | | 2.45 | % | | | 3.09 | % | | | 3.34 | % | | | 3.89 | % | | | 3.46 | % |
Net expenses | | | 1.14 | % | | | 1.16 | % | | | 1.18 | % | | | 1.23 | % | | | 1.32 | % |
Portfolio turnover rate | | | 29 | % | | | 27 | % | | | 30 | % | | | 15 | % | | | 31 | % |
Net assets at end of year (in 000’s) | | $ | 94,000 | | | $ | 153,137 | | | $ | 159,798 | | | $ | 165,088 | | | $ | 168,097 | |
| (a) | Per share data based on average shares outstanding during the year. |
| (b) | Total investment return is calculated exclusive of sales charges and assumes the reinvestment of dividends and distributions. For periods of less than one year, total return is not annualized. |
| | | | |
| 32 | | MainStay Income Builder Fund | | The notes to the financial statements are an integral part of,
and should be read in conjunction with, the financial statements. |
Financial Highlights selected per share data and ratios
| | | | | | | | | | | | | | | | | | | | |
| | | Year ended October 31, | |
| Class B | | 2017 | | | 2016 | | | 2015 | | | 2014 | | | 2013 | |
Net asset value at beginning of year | | $ | 18.40 | | | $ | 18.89 | | | $ | 20.61 | | | $ | 19.93 | | | $ | 17.54 | |
| | | | | | | | | | | | | | | | | | | | |
Net investment income (loss) (a) | | | 0.32 | | | | 0.42 | | | | 0.51 | | | | 0.63 | | | | 0.51 | |
Net realized and unrealized gain (loss) on investments | | | 1.83 | | | | (0.17 | ) | | | (0.99 | ) | | | 0.96 | | | | 2.44 | |
Net realized and unrealized gain (loss) on foreign currency transactions | | | (0.09 | ) | | | 0.30 | | | | 0.15 | | | | 0.14 | | | | (0.06 | ) |
| | | | | | | | | | | | | | | | | | | | |
Total from investment operations | | | 2.06 | | | | 0.55 | | | | (0.33 | ) | | | 1.73 | | | | 2.89 | |
| | | | | | | | | | | | | | | | | | | | |
| Less dividends and distributions: | | | | | | | | | | | | | | | | | | | | |
From net investment income | | | (0.36 | ) | | | (0.45 | ) | | | (0.52 | ) | | | (0.53 | ) | | | (0.50 | ) |
From net realized gain on investments | | | — | | | | (0.59 | ) | | | (0.87 | ) | | | (0.52 | ) | | | — | |
| | | | | | | | | | | | | | | | | | | | |
Total dividends and distributions | | | (0.36 | ) | | | (1.04 | ) | | | (1.39 | ) | | | (1.05 | ) | | | (0.50 | ) |
| | | | | | | | | | | | | | | | | | | | |
Net asset value at end of year | | $ | 20.10 | | | $ | 18.40 | | | $ | 18.89 | | | $ | 20.61 | | | $ | 19.93 | |
| | | | | | | | | | | | | | | | | | | | |
Total investment return (b) | | | 11.27 | % | | | 3.20 | % | | | (1.70 | %) | | | 8.99 | % | | | 16.74 | % |
| Ratios (to average net assets)/Supplemental Data: | | | | | | | | | | | | | | | | | | | | |
Net investment income (loss) | | | 1.67 | % | | | 2.34 | % | | | 2.60 | % | | | 3.14 | % | | | 2.73 | % |
Net expenses | | | 1.89 | % | | | 1.91 | % | | | 1.93 | % | | | 1.98 | % | | | 2.07 | % |
Portfolio turnover rate | | | 29 | % | | | 27 | % | | | 30 | % | | | 15 | % | | | 31 | % |
Net assets at end of year (in 000’s) | | $ | 39,475 | | | $ | 42,253 | | | $ | 44,441 | | | $ | 49,283 | | | $ | 51,138 | |
| (a) | Per share data based on average shares outstanding during the year. |
| (b) | Total investment return is calculated exclusive of sales charges and assumes the reinvestment of dividends and distributions. For periods of less than one year, total return is not annualized. |
| | | | | | | | | | | | | | | | | | | | |
| | | Year ended October 31, | |
| Class C | | 2017 | | | 2016 | | | 2015 | | | 2014 | | | 2013 | |
Net asset value at beginning of year | | $ | 18.37 | | | $ | 18.86 | | | $ | 20.58 | | | $ | 19.90 | | | $ | 17.52 | |
| | | | | | | | | | | | | | | | | | | | |
Net investment income (loss) (a) | | | 0.32 | | | | 0.42 | | | | 0.50 | | | | 0.60 | | | | 0.49 | |
Net realized and unrealized gain (loss) on investments | | | 1.83 | | | | (0.17 | ) | | | (0.98 | ) | | | 0.98 | | | | 2.45 | |
Net realized and unrealized gain (loss) on foreign currency transactions | | | (0.09 | ) | | | 0.30 | | | | 0.15 | | | | 0.15 | | | | (0.06 | ) |
| | | | | | | | | | | | | | | | | | | | |
Total from investment operations | | | 2.06 | | | | 0.55 | | | | (0.33 | ) | | | 1.73 | | | | 2.88 | |
| | | | | | | | | | | | | | | | | | | | |
| Less dividends and distributions: | | | | | | | | | | | | | | | | | | | | |
From net investment income | | | (0.36 | ) | | | (0.45 | ) | | | (0.52 | ) | | | (0.53 | ) | | | (0.50 | ) |
From net realized gain on investments | | | — | | | | (0.59 | ) | | | (0.87 | ) | | | (0.52 | ) | | | — | |
| | | | | | | | | | | | | | | | | | | | |
Total dividends and distributions | | | (0.36 | ) | | | (1.04 | ) | | | (1.39 | ) | | | (1.05 | ) | | | (0.50 | ) |
| | | | | | | | | | | | | | | | | | | | |
Net asset value at end of year | | $ | 20.07 | | | $ | 18.37 | | | $ | 18.86 | | | $ | 20.58 | | | $ | 19.90 | |
| | | | | | | | | | | | | | | | | | | | |
Total investment return (b) | | | 11.35 | % | | | 3.15 | % | | | (1.70 | %) | | | 9.01 | % | | | 16.70 | % |
| Ratios (to average net assets)/Supplemental Data: | | | | | | | | | | | | | | | | | | | | |
Net investment income (loss) | | | 1.65 | % | | | 2.32 | % | | | 2.58 | % | | | 3.00 | % | | | 2.61 | % |
Net expenses | | | 1.89 | % | | | 1.91 | % | | | 1.93 | % | | | 1.98 | % | | | 2.07 | % |
Portfolio turnover rate | | | 29 | % | | | 27 | % | | | 30 | % | | | 15 | % | | | 31 | % |
Net assets at end of year (in 000’s) | | $ | 266,592 | | | $ | 254,312 | | | $ | 235,811 | | | $ | 131,023 | | | $ | 55,889 | |
| (a) | Per share data based on average shares outstanding during the year. |
| (b) | Total investment return is calculated exclusive of sales charges and assumes the reinvestment of dividends and distributions. For periods of less than one year, total return is not annualized. |
| | | | | | |
The notes to the financial statements are an integral part of,
and should be read in conjunction with, the financial statements. | | | | | 33 | |
Financial Highlights selected per share data and ratios
| | | | | | | | | | | | | | | | | | | | |
| | | Year ended October 31, | |
| Class I | | 2017 | | | 2016 | | | 2015 | | | 2014 | | | 2013 | |
Net asset value at beginning of year | | $ | 18.46 | | | $ | 18.95 | | | $ | 20.66 | | | $ | 19.97 | | | $ | 17.57 | |
| | | | | | | | | | | | | | | | | | | | |
Net investment income (loss) (a) | | | 0.54 | | | | 0.63 | | | | 0.73 | | | | 0.87 | | | | 0.74 | |
Net realized and unrealized gain (loss) on investments | | | 1.84 | | | | (0.16 | ) | | | (0.98 | ) | | | 0.96 | | | | 2.46 | |
Net realized and unrealized gain (loss) on foreign currency transactions | | | (0.09 | ) | | | 0.28 | | | | 0.15 | | | | 0.15 | | | | (0.06 | ) |
| | | | | | | | | | | | | | | | | | | | |
Total from investment operations | | | 2.29 | | | | 0.75 | | | | (0.10 | ) | | | 1.98 | | | | 3.14 | |
| | | | | | | | | | | | | | | | | | | | |
| Less dividends and distributions: | | | | | | | | | | | | | | | | | | | | |
From net investment income | | | (0.60 | ) | | | (0.65 | ) | | | (0.74 | ) | | | (0.77 | ) | | | (0.74 | ) |
From net realized gain on investments | | | — | | | | (0.59 | ) | | | (0.87 | ) | | | (0.52 | ) | | | — | |
| | | | | | | | | | | | | | | | | | | | |
Total dividends and distributions | | | (0.60 | ) | | | (1.24 | ) | | | (1.61 | ) | | | (1.29 | ) | | | (0.74 | ) |
| | | | | | | | | | | | | | | | | | | | |
Net asset value at end of year | | $ | 20.15 | | | $ | 18.46 | | | $ | 18.95 | | | $ | 20.66 | | | $ | 19.97 | |
| | | | | | | | | | | | | | | | | | | | |
Total investment return (b) | | | 12.60 | % | | | 4.30 | % | | | (0.51 | %) | | | 10.33 | % | | | 18.25 | % |
| Ratios (to average net assets)/Supplemental Data: | | | | | | | | | | | | | | | | | | | | |
Net investment income (loss) | | | 2.77 | % | | | 3.44 | % | | | 3.75 | % | | | 4.29 | % | | | 3.97 | % |
Net expenses | | | 0.76 | % | | | 0.77 | % | | | 0.77 | % | | | 0.76 | % | | | 0.79 | % |
Portfolio turnover rate | | | 29 | % | | | 27 | % | | | 30 | % | | | 15 | % | | | 31 | % |
Net assets at end of year (in 000’s) | | $ | 766,054 | | | $ | 542,330 | | | $ | 513,629 | | | $ | 430,408 | | | $ | 286,425 | |
| (a) | Per share data based on average shares outstanding during the year. |
| (b) | Total investment return is calculated exclusive of sales charges and assumes the reinvestment of dividends and distributions. Class I shares are not subject to sales charges. For periods of less than one year, total return is not annualized. |
| | | | | | | | | | | | |
| | | Year ended October 31, | | | February 27,
2015 **
through
October 31, | |
| Class R2 | | 2017 | | | 2016 | | | 2015 | |
Net asset value at beginning of period | | $ | 18.29 | | | $ | 18.78 | | | $ | 20.08 | |
| | | | | | | | | | | | |
Net investment income (loss) (a) | | | 0.46 | | | | 0.55 | | | | 0.36 | |
Net realized and unrealized gain (loss) on investments | | | 1.83 | | | | (0.19 | ) | | | (1.35 | ) |
Net realized and unrealized gain (loss) on foreign currency transactions | | | (0.09 | ) | | | 0.33 | | | | 0.20 | |
| | | | | | | | | | | | |
Total from investment operations | | | 2.20 | | | | 0.69 | | | | (0.79 | ) |
| | | | | | | | | | | | |
| Less dividends and distributions: | | | | | | | | | | | | |
From net investment income | | | (0.53 | ) | | | (0.59 | ) | | | (0.51 | ) |
From net realized gain on investments | | | — | | | | (0.59 | ) | | | — | |
| | | | | | | | | | | | |
Total dividends and distributions | | | (0.53 | ) | | | (1.18 | ) | | | (0.51 | ) |
| | | | | | | | | | | | |
Net asset value at end of period | | $ | 19.96 | | | $ | 18.29 | | | $ | 18.78 | |
| | | | | | | | | | | | |
Total investment return (b) | | | 12.20 | % | | | 3.99 | % | | | (3.92 | %) |
| Ratios (to average net assets)/Supplemental Data: | | | | | | | | | | | | |
Net investment income (loss) | | | 2.36 | % | | | 3.03 | % | | | 2.90 | % †† |
Net expenses | | | 1.11 | % | | | 1.12 | % | | | 1.12 | % †† |
Portfolio turnover rate | | | 29 | % | | | 27 | % | | | 30 | % |
Net assets at end of period (in 000’s) | | $ | 4,409 | | | $ | 838 | | | $ | 190 | |
| (a) | Per share data based on average shares outstanding during the period. |
| (b) | Total investment return is calculated exclusive of sales charges and assumes the reinvestment of dividends and distributions. Class R2 shares are not subject to sales charges. For periods of less than one year, total return is not annualized. |
| | | | |
| 34 | | MainStay Income Builder Fund | | The notes to the financial statements are an integral part of,
and should be read in conjunction with, the financial statements. |
Financial Highlights selected per share data and ratios
| | | | | | | | |
| Class R3 | | Year ended
October 31,
2017 | | | February 29,
2016 **
through
October 31,
2016 | |
Net asset value at beginning of period | | $ | 18.30 | | | $ | 17.10 | |
| | | | | | | | |
Net investment income (loss) (a) | | | 0.42 | | | | 0.35 | |
Net realized and unrealized gain (loss) on investments | | | 1.82 | | | | (1.69 | ) |
Net realized and unrealized gain (loss) on foreign currency transactions | | | (0.09 | ) | | | 2.95 | |
| | | | | | | | |
Total from investment operations | | | 2.15 | | | | 1.61 | |
| | | | | | | | |
| Less dividends: | | | | | | | | |
From net investment income | | | (0.48 | ) | | | (0.41 | ) |
| | | | | | | | |
Net asset value at end of period | | $ | 19.97 | | | $ | 18.30 | |
| | | | | | | | |
Total investment return (b) | | | 11.89 | % | | | 9.42 | % |
| Ratios (to average net assets)/Supplemental Data: | | | | | | | | |
Net investment income (loss) | | | 2.16 | % | | | 2.81 | %†† |
Net expenses | | | 1.36 | % | | | 1.36 | %†† |
Portfolio turnover rate | | | 29 | % | | | 27 | % |
Net assets at end of period (in 000’s) | | $ | 201 | | | $ | 39 | |
| (a) | Per share data based on average shares outstanding during the period. |
| (b) | Total investment return is calculated exclusive of sales charges and assumes the reinvestment of dividends and distributions. Class R3 shares are not subject to sales charges. For periods of less than one year, total return is not annualized. |
| | | | | | |
The notes to the financial statements are an integral part of,
and should be read in conjunction with, the financial statements. | | | | | 35 | |
Notes to Financial Statements
Note 1–Organization and Business
The MainStay Funds (the “Trust”) was organized on January 9, 1986, as a Massachusetts business trust and is governed by a Declaration of Trust. The Trust is registered under the Investment Company Act of 1940, as amended (the “1940 Act”), as an open-end management investment company, and is comprised of twelve funds (collectively referred to as the “Funds”). These financial statements and notes relate to the MainStay Income Builder Fund (the “Fund”), a “diversified” fund, as that term is defined in the 1940 Act, as interpreted or modified by regulatory authorities having jurisdiction, from time to time.
The Fund currently has nine classes of shares registered for sale. Class A shares commenced operations on January 3, 1995. Class B shares commenced operations on December 29, 1987. Class C shares commenced operations on September 1, 1998. Class I shares commenced operations on January 2, 2004. Investor Class shares commenced operations on February 28, 2008. Class R2 shares commenced operations on February 27, 2015. Class R3 shares commenced operations on February 29, 2016. Class R6 and Class T shares were registered for sale effective as of February 28, 2017. As of October 31, 2017, Class R6 and Class T shares were not yet offered for sale.
Effective February 28, 2017, Class B shares of the MainStay Group of Funds were closed to all new purchases as well as additional investments by existing Class B shareholders. Existing Class B shareholders may continue to reinvest dividends and capital gains distributions, as well as exchange their Class B shares for Class B shares of other MainStay Group of Funds as permitted by the current exchange privileges. Class B shareholders continue to be subject to any applicable contingent deferred sales charge (“CDSC”) at the time of redemption. All other features of the Class B shares, including but not limited to the fees and expenses applicable to Class B shares, remain unchanged. Unless redeemed, Class B shareholders will remain in Class B shares of their respective fund until the Class B shares are converted to Class A or Investor Class shares pursuant to the applicable conversion schedule.
Class A and Investor Class shares are offered at net asset value (“NAV”) per share plus an initial sales charge. No initial sales charge applies to investments of $1 million or more (and certain other qualified purchases) in Class A and Investor Class shares. Effective August 1, 2017, a CDSC of 1.00% may be imposed on certain redemptions of Class A and Investor Class shares made within 18 months of the date of purchase on shares that were purchased without an initial sales charge. For purchases of Class A and Investor Class shares made from January 1, 2017, through July 31, 2017, a CDSC of 1.00% may be imposed on certain redemptions of such shares made within 24 months of the date of purchase on shares that were purchased without an initial sales charge. For purchases of Class A and Investor Class shares made prior to January 1, 2017, a CDSC of 1.00% may be imposed on certain redemptions of such shares made within one year of the date of purchase on shares that were purchased without an initial sales charge. Class C shares are offered at NAV without an initial sales charge, although a 1.00% CDSC may be imposed on certain redemptions of such shares made within one year of the date of purchase of Class C shares. When Class B shares were offered, they were offered at NAV without an initial sales charge, although a CDSC that declines depending on the number of years a shareholder has held its Class B shares may be imposed on certain redemptions of such shares made
within six years of the date of purchase of such shares. Class T shares are currently expected to be offered at NAV per share plus an initial sales charge. Class I, Class R2 and Class R3 shares are offered at NAV and are not subject to a sales charge. Class R6 shares are currently expected to be offered at NAV and to not be subject to a sales charge. Depending upon eligibility, Class B shares convert to either Class A or Investor Class shares at the end of the calendar quarter eight years after the date they were purchased. Additionally, as disclosed in the Fund’s prospectus, Class A shares may convert automatically to Investor Class shares and Investor Class shares may convert automatically to Class A shares. Under certain circumstances and as may be permitted by the Trust’s multiple class plan pursuant to Rule 18f-3 under the 1940 Act, specified share classes of the Fund may be converted to one or more other share classes of the Fund as disclosed in the capital share transactions within these Notes. The classes of shares have the same voting (except for issues that relate solely to one class), dividend, liquidation and other rights, and the same terms and conditions, except that under distribution plans pursuant to Rule 12b-1 under the 1940 Act, Class B and Class C shares are subject to higher distribution and/or service fees than Class A, Investor Class, Class T, Class R2 and Class R3 shares. Class I and Class R6 shares are not subject to a distribution and/or service fee. Class R2 and Class R3 shares are subject to a shareholder service fee, which is in addition to fees paid under the distribution plans for Class R2 and Class R3 shares.
The Fund’s investment objective is to seek current income consistent with reasonable opportunity for future growth of capital and income.
Note 2–Significant Accounting Policies
The Fund is an investment company and accordingly follows the investment company accounting and reporting guidance of the Financial Accounting Standards Board (“FASB”) Accounting Standard Codification Topic 946 Financial Services—Investment Companies. The Fund prepares its financial statements in accordance with generally accepted accounting principles (“GAAP”) in the United States of America and follows the significant accounting policies described below.
(A) Securities Valuation. Investments are usually valued as of the close of regular trading on the New York Stock Exchange (the “Exchange”) (usually 4:00 p.m. Eastern time) on each day the Fund is open for business (“valuation date”).
The Board of Trustees of the Trust (the “Board”) adopted procedures establishing methodologies for the valuation of the Fund’s securities and other assets and delegated the responsibility for valuation determinations under those procedures to the Valuation Committee of the Trust (the “Valuation Committee”). The Board authorized the Valuation Committee to appoint a Valuation Subcommittee (the “Subcommittee”) to deal in the first instance with establishing the prices of securities for which market quotations are not readily available or the prices of which are not otherwise readily determinable under these procedures. The Subcommittee meets (in person, via electronic mail or via teleconference) on an as-needed basis. Subsequently, the Valuation Committee meets to ensure that actions taken by the Subcommittee were appropriate. The procedures state that, subject to the oversight of the Board and unless otherwise noted, the responsibility for the day-to-day valuation of portfolio assets (including fair value measurements for the Fund’s assets and liabilities) rests with New York Life Investment
| | |
| 36 | | MainStay Income Builder Fund |
Management LLC (“New York Life Investments” or the “Manager”), aided to whatever extent necessary by the Subadvisors (as defined in Note 3(A)).
To assess the appropriateness of security valuations, the Manager, the Subadvisors or the Fund’s third-party service provider, who is subject to oversight by the Manager, regularly compares prior day prices, prices on comparable securities and the sale prices to the prior and current day prices and challenges prices with changes exceeding certain tolerance levels with third-party pricing services or broker sources. For those securities valued through either a standardized fair valuation methodology or a fair valuation measurement, the Subcommittee deals in the first instance with such valuation and the Valuation Committee reviews and affirms, if appropriate, the reasonableness of the valuation based on such methodologies and measurements on a regular basis after considering information that is reasonably available and deemed relevant by the Valuation Committee. Any action taken by the Subcommittee with respect to the valuation of a portfolio security or other asset is submitted for review and ratification (if appropriate) to the Valuation Committee and the Board at the next regularly scheduled meeting.
“Fair value” is defined as the price the Fund would reasonably expect to receive upon selling an asset or liability in an orderly transaction to an independent buyer in the principal or most advantageous market for the asset or liability. Fair value measurements are determined within a framework that establishes a three-tier hierarchy which maximizes the use of observable market data and minimizes the use of unobservable inputs to establish a classification of fair value measurements for disclosure purposes. “Inputs” refer broadly to the assumptions that market participants would use in pricing the asset or liability, including assumptions about risk, such as the risk inherent in a particular valuation technique used to measure fair value using a pricing model and/or the risk inherent in the inputs for the valuation technique. Inputs may be observable or unobservable. Observable inputs reflect the assumptions market participants would use in pricing the asset or liability based on market data obtained from sources independent of the Fund. Unobservable inputs reflect the Fund’s own assumptions about the assumptions market participants would use in pricing the asset or liability based on the information available. The inputs or methodology used for valuing assets or liabilities may not be an indication of the risks associated with investing in those assets or liabilities. The three-tier hierarchy of inputs is summarized below.
| • | | Level 1—quoted prices in active markets for an identical asset or liability |
| • | | Level 2—other significant observable inputs (including quoted prices for a similar asset or liability in active markets, interest rates and yield curves, prepayment speeds, credit risk, etc.) |
| • | | Level 3—significant unobservable inputs (including the Fund’s own assumptions about the assumptions that market participants would use in measuring fair value of an asset or liability) |
The level of an asset or liability within the fair value hierarchy is based on the lowest level of an input, both individually and in the aggregate, that is significant to the fair value measurement. As of October 31, 2017, the aggregate value by input level of the Fund’s assets and liabilities is included at the end of the Fund’s Portfolio of Investments.
The Fund may use third-party vendor evaluations, whose prices may be derived from one or more of the following standard inputs, among others:
| | |
• Benchmark yields | | • Reported trades |
• Broker/dealer quotes | | • Issuer spreads |
• Two-sided markets | | • Benchmark securities |
• Bids/offers | | • Reference data (corporate actions or material event notices) |
• Industry and economic events | | • Comparable bonds |
• Monthly payment information | | |
An asset or liability for which market values cannot be measured using the methodologies described above is valued by methods deemed reasonable in good faith by the Valuation Committee, following the procedures established by the Board, to represent fair value. Under these procedures, the Fund generally uses a market-based approach which may use related or comparable assets or liabilities, recent transactions, market multiples, book values and other relevant information. The Fund may also use an income-based valuation approach in which the anticipated future cash flows of the asset or liability are discounted to calculate fair value. Discounts may also be applied due to the nature and/or duration of any restrictions on the disposition of the asset or liability. Fair value represents a good faith approximation of the value of a security. Fair value determinations involve the consideration of a number of subjective factors, an analysis of applicable facts and circumstances and the exercise of judgment. As a result, it is possible that the fair value for a security determined in good faith in accordance with the Fund’s valuation procedures may differ from valuations for the same security determined by other funds using their own valuation procedures. Although the Fund’s valuation procedures are designed to value a security at the price the Fund may reasonably expect to receive upon the security’s sale in an orderly transaction, there can be no assurance that any fair value determination thereunder would, in fact, approximate the amount that the Fund would actually realize upon the sale of the security or the price at which the security would trade if a reliable market price were readily available. During the year ended October 31, 2017, there were no material changes to the fair value methodologies.
Securities which may be valued in this manner include, but are not limited to: (i) a security for which trading has been halted or suspended; (ii) a debt security that has recently gone into default and for which there is not a current market quotation; (iii) a security of an issuer that has entered into a restructuring; (iv) a security that has been de-listed from a national exchange; (v) a security for which the market price is not readily available from a third-party pricing source or, if so provided, does not, in the opinion of the Manager or Subadvisors reflect the security’s market value; (vi) a security subject to trading collars for which no or limited trading takes place; and (vii) a security whose principal market has been temporarily closed at a time when, under normal conditions, it would be open. Securities for which market quotations or observable inputs are not readily available are generally categorized as Level 3 in the hierarchy. As of October 31, 2017, securities that were fair valued in such a manner are shown in the Portfolio of Investments.
Certain securities held by the Fund may principally trade in foreign markets. Events may occur between the time the foreign markets close
Notes to Financial Statements (continued)
and the time at which the Fund’s NAVs are calculated. These events may include, but are not limited to, situations relating to a single issuer in a market sector, significant fluctuations in U.S. or foreign markets, natural disasters, armed conflicts, governmental actions or other developments not tied directly to the securities markets. Should the Manager or Subadvisors conclude that such events may have affected the accuracy of the last price of such securities reported on the local foreign market, the Subcommittee may, pursuant to procedures adopted by the Board, adjust the value of the local price to reflect the estimated impact on the price of such securities as a result of such events. In this instance, securities are generally categorized as Level 3 in the hierarchy. Additionally, certain foreign equity securities are also fair valued whenever the movement of a particular index exceeds certain thresholds. In such cases, the securities are fair valued by applying factors provided by a third-party vendor in accordance with valuation procedures adopted by the Board and are generally categorized as Level 2 in the hierarchy. As of October 31, 2017, no foreign equity securities held by the Fund were fair valued in such a manner.
Equity securities are valued at the last quoted sales prices as of the close of regular trading on the relevant exchange on each valuation date. Securities that are not traded on the valuation date are valued at the mean of the last quoted bid and ask prices. Prices are normally taken from the principal market in which each security trades. Futures contracts are valued at the last posted settlement price on the market where such futures are primarily traded. These securities are generally categorized as Level 1 in the hierarchy.
Debt securities (other than convertible and municipal bonds) are valued at the evaluated bid prices (evaluated mean prices in the case of convertible and municipal bonds) supplied by a pricing agent or brokers selected by the Manager, in consultation with the Subadvisors. Those values reflect broker/dealer supplied prices and electronic data processing techniques, if the evaluated bid or mean prices are deemed by the Manager, in consultation with the Subadvisors to be representative of market values at the regular close of trading of the Exchange on each valuation date. Debt securities purchased on a delayed delivery basis are marked to market daily until settlement at the forward settlement date. Debt securities, including corporate bonds, U.S. government & federal agency bonds, municipal bonds, foreign bonds, convertible bonds, asset-backed securities and mortgage-backed securities are generally categorized as Level 2 in the hierarchy.
Foreign currency forward contracts are valued at their fair market values measured on the basis of the mean between the last current bid and ask prices based on dealer or exchange quotations and are generally categorized as Level 2 in the hierarchy.
Loan assignments, participations and commitments are valued at the average of bid quotations obtained from the engaged independent pricing service and are generally categorized as Level 2 in the hierarchy. Certain loan assignments, participations and commitments may be valued by utilizing significant unobservable inputs obtained from the pricing service and are generally categorized as Level 3 in the hierarchy. As of October 31, 2017, securities that were fair valued in such a manner are shown in the Portfolio of Investments.
Temporary cash investments acquired in excess of 60 days to maturity at the time of purchase are valued using the latest bid prices or using
valuations based on a matrix system (which considers such factors as security prices, yields, maturities and ratings), both as furnished by independent pricing services. Other temporary cash investments which mature in 60 days or less at the time of purchase (“Short-Term Investments”) are valued using the amortized cost method of valuation, unless the use of such method would be inappropriate. The amortized cost method involves valuing a security at its cost on the date of purchase and thereafter assuming a constant amortization to maturity of the difference between such cost and the value on maturity date. Amortized cost approximates the current fair value of a security. Securities valued using the amortized cost method are not valued using quoted prices in an active market and are generally categorized as Level 2 in the hierarchy.
The information above is not intended to reflect an exhaustive list of the methodologies that may be used to value portfolio investments. The valuation procedures permit the use of a variety of valuation methodologies in connection with valuing portfolio investments. The methodology used for a specific type of investment may vary based on the market data available or other considerations. The methodologies summarized above may not represent the specific means by which portfolio investments are valued on any particular business day.
A portfolio security or other asset may be determined to be illiquid under procedures approved by the Board. Illiquidity of a security might prevent the sale of such security at a time when the Manager or Subadvisors might wish to sell, and these securities could have the effect of decreasing the overall level of the Fund’s liquidity. Further, the lack of an established secondary market may make it more difficult to value illiquid securities, requiring the Fund to rely on judgments that may be somewhat subjective in measuring value, which could vary materially from the amount that the Fund may realize upon disposition. Difficulty in selling illiquid securities may result in a loss or may be costly to the Fund. Under the supervision of the Board, the Manager or Subadvisors determine the liquidity of the Fund’s investments; in doing so, the Manager or Subadvisors may consider various factors, including: (i) the frequency of trades and quotations; (ii) the number of dealers and prospective purchasers; (iii) dealer undertakings to make a market; and (iv) the nature of the security and the market in which it trades (e.g., the time needed to dispose of the security, the method of soliciting offers and the mechanics of transfer). Illiquid securities are often valued in accordance with methods deemed by the Board in good faith to be reasonable and appropriate to accurately reflect their fair value. The liquidity of the Fund’s investments, as shown in the Portfolio of Investments, was determined as of October 31, 2017 and can change at any time in response to, among other relevant factors, market conditions or events or developments with respect to an individual issuer or instrument.
(B) Income Taxes. The Fund’s policy is to comply with the requirements of the Internal Revenue Code of 1986, as amended (the “Internal Revenue Code”), applicable to regulated investment companies and to distribute all of its taxable income to the shareholders of the Fund within the allowable time limits. Therefore, no federal, state and local income tax provisions are required.
Management evaluates the Fund’s tax positions to determine if the tax positions taken meet the minimum recognition threshold in connection with accounting for uncertainties in income tax positions taken or
| | |
| 38 | | MainStay Income Builder Fund |
expected to be taken for the purposes of measuring and recognizing tax liabilities in the financial statements. Recognition of tax benefits of an uncertain tax position is permitted only to the extent the position is “more likely than not” to be sustained assuming examination by taxing authorities. Management has analyzed the Fund’s tax positions taken on federal, state and local income tax returns for all open tax years (for up to three tax years) and has concluded that no provisions for federal, state and local income tax are required in the Fund’s financial statements. The Fund’s federal, state and local income tax and federal excise tax returns for tax years for which the applicable statutes of limitations have not expired are subject to examination by the Internal Revenue Service and state and local departments of revenue.
(C) Foreign Taxes. The Fund may be subject to foreign taxes on income and other transaction-based taxes imposed by certain countries in which it invests. A portion of the taxes on gains on investments or currency purchases/repatriation may be reclaimable. The Fund will accrue such taxes and reclaims as applicable, based upon its current interpretation of tax rules and regulations that exist in the markets in which it invests.
The Fund may be subject to taxation on realized capital gains, repatriation proceeds and other transaction-based taxes imposed by certain countries in which it invests. The Fund will accrue such taxes as applicable based upon its current interpretation of tax rules and regulations that exist in the market in which it invests. Capital gains taxes relating to positions still held are reflected as a liability on the Statement of Assets and Liabilities, as well as an adjustment to the Fund’s net unrealized appreciation (depreciation). Taxes related to capital gains realized, if any, are reflected as part of net realized gain (loss) in the Statement of Operations. Changes in tax liabilities related to capital gains taxes on unrealized investment gains if any, are reflected as part of the change in net unrealized appreciation (depreciation) on investments in the Statement of Operations. Transaction-based charges are generally assessed as a percentage of the transaction amount.
(D) Dividends and Distributions to Shareholders. Dividends and distributions are recorded on the ex-dividend date. The Fund intends to declare and pay dividends from net investment income, if any, at least monthly and distributions from net realized capital and currency gains, if any, at least annually. Unless the shareholder elects otherwise, all dividends and distributions are reinvested in the same class of shares of the Fund, at NAV. Dividends and distributions to shareholders are determined in accordance with federal income tax regulations and may differ from determinations using GAAP.
(E) Security Transactions and Investment Income. The Fund records security transactions on the trade date. Realized gains and losses on security transactions are determined using the identified cost method. Dividend income is recognized on the ex-dividend date; net of any foreign tax withheld at the source, and interest income is accrued as earned using the effective interest rate method and includes any realized gains and losses from repayments of principal on mortgage-backed securities. Discounts and premiums on securities purchased, other than Short-Term Investments, for the Fund are accreted and amortized, respectively, on the effective interest rate method over the life of the respective securities. Discounts and premiums on Short-Term Investments are accreted and amortized, respectively, on the straight-
line method. The straight-line method approximates the effective interest method for Short-Term Investments.
Income from payment-in-kind securities, to the extent the Fund held any such securities during the year ended October 31, 2017, is accreted daily based on the effective interest method.
Investment income and realized and unrealized gains and losses on investments of the Fund are allocated pro rata to separate classes of shares based upon their relative net assets on the date the income is earned or realized and unrealized gains and losses are incurred.
The Fund may place a debt security on non-accrual status and reduce related interest income by ceasing current accruals and writing off all or a portion of any interest receivables when the collection of all or a portion of such interest has become doubtful. A debt security is removed from non-accrual status when the issuer resumes interest payments or when collectability of interest is reasonably assured.
(F) Expenses. Expenses of the Trust are allocated to the individual Funds in proportion to the net assets of the respective Funds when the expenses are incurred, except where direct allocations of expenses can be made. Expenses (other than transfer agent expenses and fees incurred under the shareholder services plans and/or the distribution plans further discussed in Note 3(B)) are allocated to separate classes of shares pro rata based upon their relative net assets on the date the expenses are incurred. The expenses borne by the Fund, including those of related parties to the Fund, are shown in the Statement of Operations.
(G) Use of Estimates. In preparing financial statements in conformity with GAAP, management makes estimates and assumptions that affect the reported amounts and disclosures in the financial statements. Actual results could differ from those estimates.
(H) Repurchase Agreements. The Fund may enter into repurchase agreements (i.e., buy a security from another party with the agreement that it be sold back in the future) to earn income. The Fund may enter into repurchase agreements only with counterparties, usually financial institutions, that are deemed by the Manager or Subadvisors to be creditworthy, pursuant to guidelines established by the Board. During the term of any repurchase agreement, the Manager or Subadvisors will continue to monitor the creditworthiness of the counterparty. Under the 1940 Act, repurchase agreements are considered to be collateralized loans by the Fund to the counterparty secured by the securities transferred to the Fund.
Repurchase agreements are subject to counterparty risk, meaning the Fund could lose money by the counterparty’s failure to perform under the terms of the agreement. The Fund mitigates this risk by ensuring the repurchase agreement is collateralized by cash, U.S. government securities, fixed income securities and/or other securities. The collateral is held by the Fund’s custodian and valued daily on a mark to market basis to determine if the value, including accrued interest, exceeds the repurchase price. In the event of the counterparty’s default on the obligation to repurchase, the Fund has the right to liquidate the collateral and apply the proceeds in satisfaction of the obligation. Under certain circumstances, such as in the event of default or bankruptcy by the counterparty, realization and/or retention of the collateral may be limited or subject to delay, to legal proceedings and possible realized loss to the Fund.
Notes to Financial Statements (continued)
(I) Loan Assignments, Participations and Commitments. The Fund may invest in loan assignments and participations (“loans”). Commitments are agreements to make money available to a borrower in a specified amount, at a specified rate and within a specified time. The Fund records an investment when the borrower withdraws money on a commitment or when a funded loan is purchased (trade date) and records interest as earned. These loans pay interest at rates that are periodically reset by reference to a base lending rate plus a spread. These base lending rates are generally the prime rate offered by a designated U.S. bank or the London InterBank Offered Rate (“LIBOR”).
The loans in which the Fund may invest are generally readily marketable, but may be subject to some restrictions on resale. For example, the Fund may be contractually obligated to receive approval from the agent bank and/or borrower prior to the sale of these investments. If the Fund purchases an assignment from a lender, the Fund will generally have direct contractual rights against the borrower in favor of the lender. If the Fund purchases a participation interest either from a lender or a participant, the Fund typically will have established a direct contractual relationship with the seller of the participation interest, but not with the borrower. Consequently, the Fund is subject to the credit risk of the lender or participant who sold the participation interest to the Fund, in addition to the usual credit risk of the borrower. In the event that the borrower, selling participant or intermediate participants become insolvent or enter into bankruptcy, the Fund may incur certain costs and delays in realizing payment, or may suffer a loss of principal and/or interest.
Unfunded commitments represent the remaining obligation of the Fund to the borrower. At any point in time, up to the maturity date of the issue, the borrower may demand the unfunded portion. Unfunded amounts, if any, are marked to market and any unrealized gains or losses are recorded in the Statement of Assets and Liabilities. As of October 31, 2017, the Fund did not hold any unfunded commitments.
(J) Futures Contracts. A futures contract is an agreement to purchase or sell a specified quantity of an underlying instrument at a specified future date and price, or to make or receive a cash payment based on the value of a financial instrument (e.g., foreign currency, interest rate, security or securities index). The Fund is subject to risks such as market price risk and/or interest rate risk in the normal course of investing in these transactions. Upon entering into a futures contract, the Fund is required to pledge to the broker or futures commission merchant an amount of cash and/or U.S. government securities equal to a certain percentage of the collateral amount, known as the “initial margin.” During the period the futures contract is open, changes in the value of the contract are recognized as unrealized appreciation or depreciation by marking to market such contract on a daily basis to reflect the market value of the contract at the end of each day’s trading. The Fund agrees to receive from or pay to the broker or futures commission merchant an amount of cash equal to the daily fluctuation in the value of the contract. Such receipts or payments are known as “variation margin.” When the futures contract is closed, the Fund records a realized gain or loss equal to the difference between the proceeds from (or cost of) the closing transaction and the Fund’s basis in the contract.
The use of futures contracts involves, to varying degrees, elements of market risk in excess of the amount recognized in the Statement of
Assets and Liabilities. The contract or notional amounts and variation margin reflect the extent of the Fund’s involvement in open futures positions. There are several risks associated with the use of futures contracts as hedging techniques. There can be no assurance that a liquid market will exist at the time when the Fund seeks to close out a futures contract. If no liquid market exists, the Fund would remain obligated to meet margin requirements until the position is closed. Futures may involve a small initial investment relative to the risk assumed, which could result in losses greater than if they had not been used. Futures may be more volatile than direct investments in the instrument underlying the futures and may not correlate to the underlying instrument, causing a given hedge not to achieve its objectives. The Fund’s activities in futures contracts have minimal counterparty risk as they are conducted through regulated exchanges that guarantee the futures against default by the counterparty. In the event of a bankruptcy or insolvency of a futures commission merchant that holds margin on behalf of the Fund, the Fund may not be entitled to the return of the entire margin owed to the Fund, potentially resulting in a loss. The Fund may invest in futures contracts in order to hedge against anticipated changes in interest rates that might otherwise have an adverse effect upon the value of the Fund’s securities. The Fund may also use equity index futures contracts to increase the equity sensitivity to the Fund. The Fund’s investment in futures contracts and other derivatives may increase the volatility of the Fund’s NAVs and may result in a loss to the Fund. As of October 31, 2017, all open futures contracts are shown in the Portfolio of Investments.
(K) Foreign Currency Forward Contracts. The Fund may enter into foreign currency forward contracts, which are agreements to buy or sell foreign currencies on a specified future date at a specified rate. The Fund is subject to foreign currency exchange rate risk in the normal course of investing in these transactions. During the period the forward contract is open, changes in the value of the contract are recognized as unrealized appreciation or depreciation by marking to market such contract on a daily basis to reflect the market value of the contract at the end of each day’s trading. Cash movement occurs on settlement date. When the forward contract is closed, the Fund records a realized gain or loss equal to the difference between the proceeds from (or cost of) the closing transaction and the Fund’s basis in the contract. The Fund may purchase and sell foreign currency forward contracts for purposes of seeking to enhance portfolio returns and manage portfolio risk more efficiently. Foreign currency forward contracts may also be used to gain exposure to a particular currency or to hedge against the risk of loss due to changing currency exchange rates. Foreign currency forward contracts to purchase or sell a foreign currency may also be used in anticipation of future purchases or sales of securities denominated in foreign currency, even if the specific investments have not yet been selected.
The use of foreign currency forward contracts involves, to varying degrees, elements of risk in excess of the amount recognized in the Statement of Assets and Liabilities, including counterparty risk, market risk and illiquidity risk. Counterparty risk is heightened for these instruments because foreign currency forward contracts are not exchange-traded and therefore no clearinghouse or exchange stands ready to meet the obligations under such contracts. Thus, the Fund faces the risk that its counterparties under such contracts may not perform their obligations. Market risk is the risk that the value of a foreign currency
| | |
| 40 | | MainStay Income Builder Fund |
forward contract will depreciate due to unfavorable changes in exchange rates. Illiquidity risk arises because the secondary market for foreign currency forward contracts may have less liquidity relative to markets for other securities and financial instruments. Risks also arise from the possible movements in the foreign exchange rates underlying these instruments. While the Fund may enter into forward contracts to reduce currency exchange risks, changes in currency exchange rates may result in poorer overall performance for the Fund than if it had not engaged in such transactions. Exchange rate movements can be large, depending on the currency, and can last for extended periods of time, affecting the value of the Fund’s assets. Moreover, there may be an imperfect correlation between the Fund’s holdings of securities denominated in a particular currency and forward contracts entered into by the Fund. Such imperfect correlation may prevent the Fund from achieving the intended hedge or expose the Fund to the risk of currency exchange loss. The unrealized appreciation (depreciation) on forward contracts also reflects the Fund’s exposure at the valuation date to credit loss in the event of a counterparty’s failure to perform its obligations. As of October 31, 2017, all open foreign currency forward contracts are shown in the Portfolio of Investments.
(L) Foreign Currency Transactions. The Fund’s books and records are maintained in U.S. dollars. Prices of securities denominated in foreign currency amounts are translated into U.S. dollars at the mean between the buying and selling rates last quoted by any major U.S. bank at the following dates:
| (i) | market value of investment securities, other assets and liabilities—at the valuation date; and |
| (ii) | purchases and sales of investment securities, income and expenses—at the date of such transactions. |
The assets and liabilities that are denominated in foreign currency amounts are presented at the exchange rates and market values at the close of the period. The realized and unrealized changes in net assets arising from fluctuations in exchange rates and market prices of securities are not separately presented.
Net realized gain (loss) on foreign currency transactions represents net gains and losses on foreign currency forward contracts, net currency gains or losses realized as a result of differences between the amounts of securities sale proceeds or purchase cost, dividends, interest and withholding taxes as recorded on the Fund’s books, and the U.S. dollar equivalent amount actually received or paid. Net currency gains or losses from valuing such foreign currency denominated assets and liabilities, other than investments at valuation date exchange rates, are reflected in unrealized foreign exchange gains or losses.
(M) Securities Lending. In order to realize additional income, the Fund may engage in securities lending, subject to the limitations set forth in the 1940 Act and relevant guidance by the staff of the Securities and Exchange Commission (“SEC”). In the event the Fund does engage in securities lending, the Fund will lend through its custodian, State Street Bank and Trust Company (“State Street”). State Street will manage the Fund’s collateral in accordance with the lending agreement between the Fund and State Street, and indemnify the Fund against counterparty risk. The loans will be collateralized by U.S. Treasury securities at least equal at all times to the market value of the securities loaned. The Fund may bear the risk of delay in recovery of, or loss of
rights in, the securities loaned should the borrower of the securities experience financial difficulty. The Fund may also record a realized gain or loss on securities deemed sold due to a borrower’s inability to return securities on loan. The Fund bears the risk of any loss on investment of the collateral. The Fund will receive compensation for lending its securities in the form of fees or it will retain a portion of interest on the investment of any cash received as collateral. The Fund will also continue to receive interest and dividends on the securities loaned and any gain or loss in the market price of the securities loaned that may occur during the term of the loan will be for the account of the Fund. During the year ended October 31, 2017, the Fund did not have any portfolio securities on loan.
(N) Restricted Securities. Restricted securities, as disclosed in Note 5, are securities which have been purchased through a private offering and cannot be resold to the general public without prior registration under the Securities Act of 1933, as amended. Disposal of these securities may involve time-consuming negotiations and expenses, and it may be difficult to obtain a prompt sale at an acceptable price.
(O) Debt and Foreign Securities Risk. The Fund may invest in high-yield debt securities (sometimes called “junk bonds”), which are generally considered speculative because they present a greater risk of loss, including default, than higher quality debt securities. These securities pay investors a premium—a higher interest rate or yield than investment grade debt securities—because of the increased risk of loss. These securities can also be subject to greater price volatility. In times of unusual or adverse market, economic or political conditions, these securities may experience higher than normal default rates.
The Fund may invest in foreign securities, which carry certain risks that are in addition to the usual risks inherent in domestic securities. These risks include those resulting from currency fluctuations, future adverse political or economic developments and possible imposition of currency exchange blockages or other foreign governmental laws or restrictions. These risks are likely to be greater in emerging markets than in developed markets. The ability of issuers of securities held by the Fund to meet their obligations may be affected by, among other things, economic or political developments in a specific country, industry or region.
The Fund may invest in loans which are usually rated below investment grade and are generally considered speculative because they present a greater risk of loss, including default, than higher rated debt securities. These investments pay investors a higher interest rate than investment grade debt securities because of the increased risk of loss. Although certain loans are collateralized, there is no guarantee that the value of the collateral will be sufficient to repay the loan. In a recession or serious credit event, the value of these investments could decline significantly. As a result, the Fund’s NAVs could go down and you could lose money.
In addition, loans generally are subject to extended settlement periods that may be longer than seven days. As a result, the Fund may be adversely affected by selling other investments at an unfavorable time and/or under unfavorable conditions or engaging in borrowing transactions, such as borrowing against its credit facility, to raise cash to meet redemption obligations or pursue other investment opportunities.
Notes to Financial Statements (continued)
In certain circumstances, loans may not be deemed to be securities. As a result, the Fund may not have the protection of anti-fraud provisions of
the federal securities laws. In such cases, the Fund generally must rely on the contractual provisions in the loan agreement and common-law fraud protections under applicable state law.
(P) Indemnifications. Under the Trust’s organizational documents, its officers and trustees are indemnified against certain liabilities that may arise out of performance of their duties to the Trust. Additionally, in the normal course of business, the Fund enters into contracts with third-party service providers that contain a variety of representations and warranties and which may provide general indemnifications. The Fund’s maximum exposure under these arrangements is unknown, as this would involve future claims that may be made against the Fund that have not yet occurred. Based on experience, management is of the view that the risk of loss in connection with these potential indemnification obligations is remote. However, there can be no assurance that material
liabilities related to such obligations will not arise in the future, which could adversely impact the Fund.
(Q) Quantitative Disclosure of Derivative Holdings. The following tables show additional disclosures related to the Fund’s derivative and hedging activities, including how such activities are accounted for and their effect on the Fund’s financial positions, performance and cash flows. The Fund entered into Treasury futures contracts in order to hedge against anticipated changes in interest rates that might otherwise have an adverse effect upon the value of the Fund’s securities. The Fund also entered into domestic and foreign equity index futures contracts to increase the equity sensitivity to the Fund. Foreign currency forward contracts were used to gain exposure to a particular currency or to hedge against the risk of loss due to changing currency exchange rates. These derivatives are not accounted for as hedging instruments.
Fair value of derivative instruments as of October 31, 2017:
Asset Derivatives
| | | | | | | | | | | | | | | | | | |
| | | Statement of Assets and Liabilities Location | | Foreign
Exchange
Contracts
Risk | | | Equity
Contracts
Risk | | | Interest
Rate
Contracts
Risk | | | Total | |
Futures Contracts | | Net Assets—Net unrealized appreciation on investments and futures contracts (a) | | $ | — | | | $ | 20,340,840 | | | $ | 584,047 | | | $ | 20,924,887 | |
Forward Contracts | | Unrealized appreciation on foreign currency forward contracts | | | 2,632,070 | | | | — | | | | — | | | | 2,632,070 | |
| | | | | | |
Total Fair Value | | | | $ | 2,632,070 | | | $ | 20,340,840 | | | $ | 584,047 | | | $ | 23,556,957 | |
| | | | | | |
Liability Derivatives
| | | | | | | | | | | | | | | | | | |
| | | Statement of Assets and Liabilities Location | | Foreign
Exchange
Contracts
Risk | | | Equity
Contracts
Risk | | | Interest
Rate
Contracts
Risk | | | Total | |
Futures Contracts | | Net Assets—Net unrealized depreciation on investments and futures contracts (a) | | $ | — | | | $ | — | | | $ | (2,572,390 | ) | | $ | (2,572,390 | ) |
Forward Contracts | | Unrealized depreciation on foreign currency forward contracts | | | (2,498,502 | ) | | | — | | | | — | | | | (2,498,502 | ) |
| | | | | | |
Total Fair Value | | | | $ | (2,498,502 | ) | | $ | | | | $ | (2,572,390 | ) | | $ | (5,070,892 | ) |
| | | | | | |
| (a) | Includes cumulative appreciation (depreciation) of futures contracts as reported in the Portfolio of Investments. Only current day’s variation margin is reported within the Statement of Assets and Liabilities. |
The effect of derivative instruments on the Statement of Operations for the year ended October 31, 2017:
Realized Gain (Loss)
| | | | | | | | | | | | | | | | | | |
| | | Statement of Operations Location | | Foreign
Exchange
Contracts
Risk | | | Equity
Contracts
Risk | | | Interest
Rate
Contracts
Risk | | | Total | |
Futures Contracts | | Net realized gain (loss) on futures transactions | | $ | — | | | $ | 40,585,339 | | | $ | (348,657 | ) | | $ | 40,236,682 | |
Forward Contracts | | Net realized gain (loss) on foreign currency transactions | | | (3,966,100 | ) | | | — | | | | — | | | | (3,966,100 | ) |
| | | | | | |
Total Realized Gain (Loss) | | | | $ | (3,966,100 | ) | | $ | 40,585,339 | | | $ | (348,657 | ) | | $ | 36,270,582 | |
| | | | | | |
| | |
| 42 | | MainStay Income Builder Fund |
Change in Unrealized Appreciation (Depreciation)
| | | | | | | | | | | | | | | | | | |
| | | Statement of Operations Location | | Foreign
Exchange
Contracts
Risk | | | Equity
Contracts
Risk | | | Interest Rate
Contracts
Risk | | | Total | |
Futures Contracts | | Net change in unrealized appreciation (depreciation) on futures contracts | | $ | — | | | $ | 23,127,129 | | | $ | 943,847 | | | $ | 24,070,976 | |
Forward Contracts | | Net change in unrealized appreciation (depreciation) on translation of other assets and liabilities in foreign currencies andforeign currency forward contracts | | | (4,476,821 | ) | | | — | | | | — | | | | (4,476,821 | ) |
| | | | | | |
Total Change in Unrealized Appreciation (Depreciation) | | | | $ | (4,476,821 | ) | | $ | 23,127,129 | | | $ | 943,847 | | | $ | 19,594,155 | |
| | | | | | |
Average Notional Amount
| | | | | | | | | | | | | | | | |
| | | Foreign
Exchange
Contracts Risk | | | Equity
Contracts
Risk | | | Interest Rate
Contracts
Risk | | | Total | |
Futures Contracts Long | | $ | — | | | $ | 303,756,022 | | | $ | 188,379,416 | | | $ | 492,135,438 | |
Futures Contracts Short (a) | | $ | — | | | $ | — | | | $ | (78,481,676 | ) | | $ | (78,481,676 | ) |
Forward Contracts Long | | $ | 60,312,815 | | | $ | — | | | $ | — | | | $ | 60,312,815 | |
Forward Contracts Short | | $ | (220,278,510 | ) | | $ | — | | | $ | — | | | $ | (220,278,510 | ) |
| | | | |
| (a) | Positions were open nine months during the reporting period. |
Note 3–Fees and Related Party Transactions
(A) Manager and Subadvisors. New York Life Investments, a registered investment adviser and an indirect, wholly-owned subsidiary of New York Life Insurance Company (“New York Life”), serves as the Fund’s Manager, pursuant to an Amended and Restated Management Agreement (“Management Agreement”). The Manager provides offices, conducts clerical, recordkeeping and bookkeeping services and keeps most of the financial and accounting records required to be maintained by the Fund. Except for the portion of salaries and expenses that are the responsibility of the Fund, the Manager pays the salaries and expenses of all personnel affiliated with the Fund and certain operational expenses of the Fund. The Fund reimburses New York Life Investments in an amount equal to a portion of the compensation of the Chief Compliance Officer attributable to the Fund. MacKay Shields LLC (“MacKay Shields” or “Subadvisor”), a registered investment adviser and an indirect, wholly-owned subsidiary of New York Life, serves as a Subadvisor, pursuant to the terms of the Amended and Restated Subadvisory Agreement (“Subadvisory Agreement”) between New York Life Investments and MacKay Shields, is responsible for the overall asset allocation decisions of the Fund and is responsible for the day-to-day portfolio management of the fixed-income portion of the Fund. Epoch Investment Partners, Inc. (“Epoch” or “Subadvisor” and, together with MacKay Shields, the “Subadvisors”), a registered investment advisor, also serves as a Subadvisor pursuant to the terms of an Amended and Restated Subadvisory Agreement between New York Life Investments and Epoch and is responsible for the day-to-day portfolio management of the equity portion of the Fund. New York Life Investments pays for the services of the Subadvisors.
Under the Management Agreement, the Fund pays the Manager a monthly fee for the services performed and the facilities furnished at an
annual rate of the Fund’s average daily net assets as follows: 0.64% up to $500 million; 0.60% from $500 million to $1 billion; and 0.575% in excess of $1 billion, plus a fee for fund accounting services previously provided by New York Life Investments under a separate fund accounting agreement furnished at an annual rate of the Fund’s average daily net assets as follows: 0.05% up to $20 million; 0.0333% from $20 million to $100 million; and 0.01% in excess of $100 million. During the year ended October 31, 2017, the effective management fee rate was 0.61%, inclusive of a fee for fund accounting services of 0.01% of the Fund’s average daily net assets.
During the year ended October 31, 2017, New York Life Investments earned fees from the Fund in the amount of $10,369,982.
State Street provides sub-administration and sub-accounting services to the Fund pursuant to an agreement with New York Life Investments. These services include calculating the daily NAVs of the Fund, maintaining the general ledger and sub-ledger accounts for the calculation of the Fund’s NAVs and assisting New York Life Investments in conducting various aspects of the Fund’s administrative operations. For providing these services to the Fund, State Street is compensated by New York Life Investments.
(B) Distribution, Service and Shareholder Service Fees. The Trust, on behalf of the Fund, has entered into a distribution agreement with NYLIFE Distributors LLC (the “Distributor”), an indirect, wholly-owned subsidiary of New York Life. The Fund has adopted distribution plans (the “Plans”) in accordance with the provisions of Rule 12b-1 under the 1940 Act.
Pursuant to the Class A, Investor Class, Class T and Class R2 Plans, the Distributor receives a monthly distribution fee from the Class A, Investor Class, Class T and Class R2 shares at an annual rate of 0.25% of the
Notes to Financial Statements (continued)
average daily net assets of the Class A, Investor Class, Class T and Class R2 shares for distribution and/or service activities as designated by the Distributor. Pursuant to the Class B and Class C Plans, Class B and Class C shares pay the Distributor a monthly distribution fee at an annual rate of 0.75% of the average daily net assets of the Class B and Class C shares, along with a service fee at an annual rate of 0.25% of the average daily net assets of the Class B and Class C shares, for a total 12b-1 fee of 1.00%. Pursuant to the Class R3 Plan, the Distributor receives a monthly distribution and/or service fee from the Class R3 shares at an annual rate of 0.50% of the average daily net assets of the Class R3 shares. Class I and Class R6 shares are not subject to a distribution and/or service fee.
The Plans provide that the distribution and service fees are payable to the Distributor regardless of the amounts actually expended by the Distributor for distribution of the Fund’s shares and service activities.
In accordance with the Shareholder Services Plan for the Class R2 and Class R3 shares, the Manager has agreed to provide, through its affiliates or independent third parties, various shareholder and administrative support services to shareholders of the Class R2 and Class R3 shares. For its services, the Manager, its affiliates or independent third-party service providers are entitled to a shareholder service fee accrued daily and paid monthly at an annual rate of 0.10% of the average daily net assets of the Class R2 and Class R3 shares. This is in addition to any fees paid under the Class R2 and Class R3 Plans.
During the year ended October 31, 2017, shareholder service fees incurred by the Fund were as follows:
| | | | |
Class R2 | | $ | 3,121 | |
Class R3 | | | 128 | |
(C) Sales Charges. During the year ended October 31, 2017, the Fund was advised by the Distributor that the amount of initial sales charges retained on sales of Class A and Investor Class shares were $167,839 and $44,359, respectively.
During the year ended October 31, 2017, the Fund was also advised that the Distributor retained CDSCs on redemptions of Class A, Class B and Class C shares of $7,203, $62,433 and $37,746, respectively.
(D) Transfer, Dividend Disbursing and Shareholder Servicing Agent. NYLIM Service Company LLC, an affiliate of New York Life Investments, is the Fund’s transfer, dividend disbursing and shareholder servicing agent pursuant to an agreement between NYLIM Service Company LLC and the Trust. NYLIM Service Company LLC has entered into an agreement with Boston Financial Data Services, Inc. (“BFDS”) pursuant to which BFDS performs certain transfer agent services on behalf of NYLIM Service Company LLC. During the year ended October 31, 2017, transfer agent expenses incurred by the Fund were as follows:
| | | | |
Class A | | $ | 550,973 | |
Investor Class | | | 336,942 | |
Class B | | | 94,917 | |
Class C | | | 595,146 | |
Class I | | | 623,689 | |
Class R2 | | | 2,919 | |
Class R3 | | | 120 | |
(E) Small Account Fee. Shareholders with small accounts adversely impact the cost of providing transfer agency services. In an effort to reduce total transfer agency expenses, the Fund has implemented a small account fee on certain types of accounts. Certain shareholders with an account balance of less than $1,000 are charged an annual per account fee of $20 (assessed semi-annually), the proceeds from which offset transfer agent fees as reflected in the Statement of Operations.
(F) Capital. As of October 31, 2017, New York Life and its affiliates beneficially held shares of the Fund with the values and percentages of net assets as follows:
| | | | | | | | |
Class I | | $ | 106,652,238 | | | | 13.9 | % |
Class R2 | | | 28,027 | | | | 0.6 | |
Class R3 | | | 30,609 | | | | 15.2 | |
Note 4–Federal Income Tax
As of October 31, 2017, the cost and unrealized appreciation (depreciation) of the Fund’s investment portfolio, including applicable derivative contracts and other financial instruments, as determined on a federal income tax basis, were as follows:
| | | | | | | | | | | | | | | | |
| | | Federal Tax
Cost | | | Gross
Unrealized
Appreciation | | | Gross
Unrealized
Depreciation | | | Net
Unrealized
Appreciation/
(Depreciation) | |
Investments in Securities | | $ | 1,700,272,324 | | | $ | 130,195,297 | | | $ | (27,218,382 | ) | | $ | 102,976,915 | |
As of October 31, 2017, the components of accumulated gain (loss) on a tax basis were as follows:
| | | | | | | | |
Ordinary
Income | | Accumulated
Capital and Other Gain (Loss) | | Other
Temporary
Differences | | Unrealized
Appreciation
(Depreciation) | | Total
Accumulated Gain (Loss) |
| $13,318,538 | | $35,334,618 | | $(242,478) | | $103,113,982 | | $151,524,660 |
The difference between book-basis and tax-basis unrealized appreciation (depreciation) is primarily due to wash sale adjustments and mark to market of futures contracts. The other temporary differences are primarily due to dividends payable.
The Fund utilized $48,543,763 of capital loss carryforwards during the year ended October 31, 2017.
The following table discloses the current year reclassifications between undistributed net investment income (loss), accumulated net realized gain (loss) on investments and additional paid-in capital arising from permanent differences; net assets as of October 31, 2017 were not affected.
| | | | |
Undistributed Net Investment Income (Loss) | | Accumulated Net Realized Gain (Loss) on Investments | | Additional Paid-In Capital |
| $923,904 | | $(923,904) | | $— |
The reclassifications for the Fund are primarily due to foreign currency gain (loss).
| | |
| 44 | | MainStay Income Builder Fund |
During the years ended October 31, 2017 and October 31, 2016, the tax character of distributions paid as reflected in the Statements of Changes in Net Assets was as follows:
| | | | | | | | |
| | | 2017 | | | 2016 | |
Distributions paid from: | | | | | | | | |
Ordinary Income | | $ | 46,854,817 | | | $ | 49,199,426 | |
Long-Term Capital Gain | | | — | | | | 48,169,328 | |
Total | | $ | 46,854,817 | | | $ | 97,368,754 | |
Note 5–Restricted Securities
As of October 31, 2017, the Fund held the following restricted security:
| | | | | | | | | | | | | | | | | | | | |
Security | | Date of
Acquisition | | | Shares | | | Cost | | | 10/31/17
Value | | | Percent of
Net Assets | |
ION Media Networks, Inc. | | | | | | | | | | | | | | | | | | | | |
Common Stock | | | 3/11/14 | | | | 12 | | | $ | 1 | | | $ | 8,143 | | | | 0.0%‡ | |
| ‡ | Less than one-tenth of a percent. |
Note 6–Custodian
State Street is the custodian of cash and securities held by the Fund. Custodial fees are charged to the Fund based on the Fund’s net assets and/or the market value of securities held by the Fund and the number of certain transactions incurred by the Fund.
Note 7–Line of Credit
The Fund and certain other funds managed by New York Life Investments, maintain a line of credit with a syndicate of banks in order to secure a source of funds for temporary purposes to meet unanticipated or excessive redemption requests.
Effective August 1, 2017, under the credit agreement (the “Credit Agreement”), the aggregate commitment amount is $600,000,000 with an additional uncommitted amount of $100,000,000. The commitment fee is an annual rate of 0.15% of the average commitment amount payable quarterly, regardless of usage, to State Street, who serves as the agent to the syndicate. The commitment fee is allocated among the Fund and certain other funds managed by New York Life Investments based upon their respective net assets and other factors. Interest on any revolving credit loan is charged based upon the Federal Funds Rate or the one-month LIBOR, whichever is higher. The Credit Agreement expires on July 31, 2018, although the Fund, certain other funds managed by New York Life Investments and the syndicate of banks may renew the Credit Agreement for an additional year on the same or different terms. Prior to August 1, 2017, the aggregate commitment amount and the commitment fee of the previous credit agreement were the same as those under the Credit Agreement, but Bank of New York Mellon served as agent to the syndicate. During the year ended October 31, 2017, there were no borrowings made or outstanding with respect to the Fund under the Credit Agreement or the credit agreement for which Bank of New York Mellon served as agent.
Note 8–Interfund Lending Program
Pursuant to an exemptive order issued by the SEC, the Fund, along with certain other funds managed by New York Life Investments, may
participate in an interfund lending program. The interfund lending program provides an alternative credit facility that permits the Fund and certain other funds managed by New York Life Investments to lend or borrow money for temporary purposes directly to or from one another subject to the conditions of the exemptive order. During the year ended October 31, 2017, there were no interfund loans made or outstanding with respect to the Fund.
Note 9–Purchases and Sales of Securities (in 000’s)
During the year ended October 31, 2017, purchases and sales of U.S. Government securities were $60,738 and $45,944, respectively. Purchases and sales of securities, other than U.S. Government securities and short-term securities, were $496,249 and $406,253, respectively.
Note 10–Capital Share Transactions
| | | | | | | | |
Class A | | Shares | | | Amount | |
Year ended October 31, 2017: | | | | | | | | |
Shares sold | | | 5,445,293 | | | $ | 103,835,754 | |
Shares issued to shareholders in reinvestment of dividends and distributions | | | 806,758 | | | | 15,419,170 | |
Shares redeemed | | | (6,516,965 | ) | | | (124,496,614 | ) |
| | | | |
Net increase (decrease) in shares outstanding before conversion | | | (264,914 | ) | | | (5,241,690 | ) |
Shares converted into Class A (See Note 1) | | | 3,943,157 | | | | 77,461,468 | |
Shares converted from Class A (See Note 1) | | | (2,402,635 | ) | | | (45,034,019 | ) |
| | | | |
Net increase (decrease) | | | 1,275,608 | | | $ | 27,185,759 | |
| | | | |
Year ended October 31, 2016: | | | | | | | | |
Shares sold | | | 7,841,617 | | | $ | 142,036,049 | |
Shares issued to shareholders in reinvestment of dividends and distributions | | | 1,961,889 | | | | 34,764,982 | |
Shares redeemed | | | (9,816,306 | ) | | | (174,240,150 | ) |
| | | | |
Net increase (decrease) in shares outstanding before conversion | | | (12,800 | ) | | | 2,560,881 | |
Shares converted into Class A (See Note 1) | | | 770,848 | | | | 13,985,721 | |
Shares converted from Class A (See Note 1) | | | (334,784 | ) | | | (6,143,586 | ) |
| | | | |
Net increase (decrease) | | | 423,264 | | | $ | 10,403,016 | |
| | | | |
Notes to Financial Statements (continued)
| | | | | | | | |
Investor Class | | Shares | | | Amount | |
Year ended October 31, 2017: | | | | | | | | |
Shares sold | | | 561,270 | | | $ | 10,722,478 | |
Shares issued to shareholders in reinvestment of dividends and distributions | | | 210,412 | | | | 4,014,072 | |
Shares redeemed | | | (836,015 | ) | | | (15,946,984 | ) |
| | | | |
Net increase (decrease) in shares outstanding before conversion | | | (64,333 | ) | | | (1,210,434 | ) |
Shares converted into Investor Class (See Note 1) | | | 256,990 | | | | 4,920,385 | |
Shares converted from Investor Class (See Note 1) | | | (3,853,417 | ) | | | (75,785,243 | ) |
| | | | |
Net increase (decrease) | | | (3,660,760 | ) | | $ | (72,075,292 | ) |
| | | | |
Year ended October 31, 2016: | | | | | | | | |
Shares sold | | | 494,203 | | | $ | 8,903,534 | |
Shares issued to shareholders in reinvestment of dividends and distributions | | | 556,615 | | | | 9,868,926 | |
Shares redeemed | | | (859,909 | ) | | | (15,490,433 | ) |
| | | | |
Net increase (decrease) in shares outstanding before conversion | | | 190,909 | | | | 3,282,027 | |
Shares converted into Investor Class (See Note 1) | | | 342,484 | | | | 6,227,403 | |
Shares converted from Investor Class (See Note 1) | | | (668,460 | ) | | | (12,156,033 | ) |
| | | | |
Net increase (decrease) | | | (135,067 | ) | | $ | (2,646,603 | ) |
| | | | |
| | |
| | | | | | | | |
Class B | | Shares | | | Amount | |
Year ended October 31, 2017: | | | | | | | | |
Shares sold | | | 178,134 | | | $ | 3,338,656 | |
Shares issued to shareholders in reinvestment of dividends and distributions | | | 36,233 | | | | 695,672 | |
Shares redeemed | | | (284,695 | ) | | | (5,465,607 | ) |
| | | | |
Net increase (decrease) in shares outstanding before conversion | | | (70,328 | ) | | | (1,431,279 | ) |
Shares converted from Class B (See Note 1) | | | (261,858 | ) | | | (5,030,161 | ) |
| | | | |
Net increase (decrease) | | | (332,186 | ) | | $ | (6,461,440 | ) |
| | | | |
Year ended October 31, 2016: | | | | | | | | |
Shares sold | | | 458,845 | | | $ | 8,357,411 | |
Shares issued to shareholders in reinvestment of dividends and distributions | | | 120,201 | | | | 2,138,960 | |
Shares redeemed | | | (331,239 | ) | | | (5,985,764 | ) |
| | | | |
Net increase (decrease) in shares outstanding before conversion | | | 247,807 | | | | 4,510,607 | |
Shares converted from Class B (See Note 1) | | | (304,298 | ) | | | (5,518,950 | ) |
| | | | |
Net increase (decrease) | | | (56,491 | ) | | $ | (1,008,343 | ) |
| | | | |
| | | | | | | | |
Class C | | Shares | | | Amount | |
Year ended October 31, 2017: | | | | | | | | |
Shares sold | | | 3,255,990 | | | $ | 62,351,105 | |
Shares issued to shareholders in reinvestment of dividends and distributions | | | 214,045 | | | | 4,107,924 | |
Shares redeemed | | | (4,026,686 | ) | | | (77,004,231 | ) |
| | | | |
Net increase (decrease) in shares outstanding before conversion | | | (556,651 | ) | | | (10,545,202 | ) |
Shares converted from Class C (See Note 1) | | | (1,336 | ) | | | (25,920 | ) |
| | | | |
Net increase (decrease) | | | (557,987 | ) | | $ | (10,571,122 | ) |
| | | | |
Year ended October 31, 2016: | | | | | | | | |
Shares sold | | | 5,044,698 | | | $ | 91,363,749 | |
Shares issued to shareholders in reinvestment of dividends and distributions | | | 608,097 | | | | 10,807,452 | |
Shares redeemed | | | (4,294,052 | ) | | | (77,182,470 | ) |
| | | | |
Net increase (decrease) in shares outstanding before conversion | | | 1,358,743 | | | | 24,988,731 | |
Shares converted from Class C (See Note 1) | | | (17,464 | ) | | | (313,665 | ) |
| | | | |
Net increase (decrease) | | | 1,341,279 | | | $ | 24,675,066 | |
| | | | |
| | |
| | | | | | | | |
Class I | | Shares | | | Amount | |
Year ended October 31, 2017: | | | | | | | | |
Shares sold | | | 14,212,267 | | | $ | 274,097,860 | |
Shares issued to shareholders in reinvestment of dividends and distributions | | | 879,241 | | | | 16,984,704 | |
Shares redeemed | | | (8,753,443 | ) | | | (168,302,487 | ) |
| | | | |
Net increase (decrease) in shares outstanding before conversion | | | 6,338,065 | | | | 122,780,077 | |
Shares converted into Class I (See Note 1) | | | 2,303,694 | | | | 43,510,391 | |
| | | | |
Net increase (decrease) | | | 8,641,759 | | | $ | 166,290,468 | |
| | | | |
Year ended October 31, 2016: | | | | | | | | |
Shares sold | | | 12,617,583 | | | $ | 231,090,238 | |
Shares issued to shareholders in reinvestment of dividends and distributions | | | 1,712,441 | | | | 30,646,033 | |
Shares redeemed | | | (12,272,978 | ) | | | (222,155,199 | ) |
| | | | |
Net increase (decrease) in shares outstanding before conversion | | | 2,057,046 | | | | 39,581,072 | |
Shares converted into Class I (See Note 1) | | | 211,252 | | | | 3,919,110 | |
| | | | |
Net increase (decrease) | | | 2,268,298 | | | $ | 43,500,182 | |
| | | | |
| | |
| 46 | | MainStay Income Builder Fund |
| | | | | | | | |
Class R2 | | Shares | | | Amount | |
Year ended October 31, 2017: | | | | | | | | |
Shares sold | | | 225,540 | | | $ | 4,278,601 | |
Shares issued to shareholders in reinvestment of dividends and distributions | | | 2,226 | | | | 42,495 | |
Shares redeemed | | | (51,821 | ) | | | (995,471 | ) |
| | | | |
Net increase (decrease) in shares outstanding before conversion | | | 175,945 | | | | 3,325,625 | |
Shares converted from Class R2 (See Note 1) | | | (862 | ) | | | (16,901 | ) |
| | | | |
Net increase (decrease) | | | 175,083 | | | $ | 3,308,724 | |
| | | | |
Year ended October 31, 2016: | | | | | | | | |
Shares sold | | | 36,303 | | | $ | 664,922 | |
Shares issued to shareholders in reinvestment of dividends and distributions | | | 273 | | | | 4,910 | |
Shares redeemed | | | (851 | ) | | | (15,593 | ) |
| | | | |
Net increase (decrease) | | | 35,725 | | | $ | 654,239 | |
| | | | |
| | |
| | | | | | | | |
Class R3 | | Shares | | | Amount | |
Year ended October 31, 2017: | | | | | | | | |
Shares sold | | | 8,110 | | | $ | 153,404 | |
Shares issued to shareholders in reinvestment of dividends and distributions | | | 64 | | | | 1,233 | |
Shares redeemed | | | (241 | ) | | | (4,555 | ) |
| | | | |
Net increase (decrease) | | | 7,933 | | | $ | 150,082 | |
| | | | |
Period ended October 31, 2016 (a): | | | | | | | | |
Shares sold | | | 2,112 | | | $ | 36,690 | |
Shares issued to shareholders in reinvestment of dividends and distributions | | | 42 | | | | 767 | |
| | | | |
Net increase (decrease) | | | 2,154 | | | $ | 37,457 | |
| | | | |
| (a) | Inception date was February 29, 2016. |
Note 11–Subsequent Events
In connection with the preparation of the financial statements of the Fund as of and for the year ended October 31, 2017, events and transactions subsequent to October 31, 2017, through the date the financial statements were issued have been evaluated by the Fund’s management for possible adjustment and/or disclosure. No subsequent events requiring financial statement adjustment or disclosure have been identified.
Report of Independent Registered Public Accounting Firm
The Board of Trustees and Shareholders of
The MainStay Funds:
We have audited the accompanying statement of assets and liabilities, including the portfolio of investments, of MainStay Income Builder Fund (the “Fund”), one of the funds constituting The MainStay Funds, as of October 31, 2017, and the related statement of operations for the year then ended, the statements of changes in net assets for each of the years in the two-year period then ended, and the financial highlights for each of the years or periods in the five-year period then ended. These financial statements and financial highlights are the responsibility of the Fund’s management. Our responsibility is to express an opinion on these financial statements and financial highlights based on our audits.
We conducted our audits in accordance with the standards of the Public Company Accounting Oversight Board (United States). Those standards require that we plan and perform the audit to obtain reasonable assurance about whether the financial statements and financial highlights are free of material misstatement. An audit includes examining, on a test basis, evidence supporting the amounts and disclosures in the financial statements. Our procedures included confirmation of securities owned as of October 31, 2017, by correspondence with the custodian and brokers or by other appropriate auditing procedures where replies from brokers were not received. An audit also includes assessing the accounting principles used and significant estimates made by management, as well as evaluating the overall financial statement presentation. We believe that our audits provide a reasonable basis for our opinion.
In our opinion, the financial statements and financial highlights referred to above present fairly, in all material respects, the financial position of MainStay Income Builder Fund as of October 31, 2017, the results of its operations for the year then ended, the changes in its net assets for each of the years in the two-year period then ended, and the financial highlights for each of the years or the periods in the five-year period then ended, in conformity with U.S. generally accepted accounting principles.

Philadelphia, Pennsylvania
December 21, 2017
| | |
| 48 | | MainStay Income Builder Fund |
Other Matters
(Unaudited)
At a meeting held on June 22, 2017, the Board approved submitting the following proposal (“Proposal”) to shareholders of the Funds at a special meeting held on October 23, 2017 (with any postponements or adjournments, “Special Meeting”):
To elect eight Trustees to the Board.
On or about September 28, 2017, shareholders of record of the Funds as of the close of business on August 24, 2017 were sent a proxy statement containing information regarding the Proposal. The proxy statement also included information about the Special Meeting, at which shareholders of the Funds were asked to consider and approve the Proposal. In addition, the proxy statement included information about voting on the Proposal and options shareholders had to do so.
The Special Meeting was held on October 23, 2017, and the Proposal passed.
The results of the Special Meeting (all Funds and classes thereof voting together) were as follows:
Proposal—To elect eight Trustees to the Board:
Yie-Hsin Hung:
| | | | |
Votes For | | Votes Witheld | | Total |
| 2,644,056,263.750 | | 21,799,781.292 | | 2,665,856,045.042 |
David H. Chow:
| | | | |
Votes For | | Votes Witheld | | Total |
| 2,644,576,776.557 | | 21,279,268.485 | | 2,665,856,045.042 |
Susan B. Kerley:
| | | | |
Votes For | | Votes Witheld | | Total |
| 2,645,459,747.343 | | 20,396,297.699 | | 2,665,856,045.042 |
Alan R. Latshaw:
| | | | |
Votes For | | Votes Witheld | | Total |
| 2,644,443,039.401 | | 21,413,005.641 | | 2,665,856,045.042 |
Peter Meenan:
| | | | |
Votes For | | Votes Witheld | | Total |
| 2,640,156,421.578 | | 25,699,623.464 | | 2,665,856,045.042 |
Richard H. Nolan, Jr.:
| | | | |
Votes For | | Votes Witheld | | Total |
| 2,641,415,514.849 | | 24,440,530.193 | | 2,665,856,045.042 |
Jacques P. Perold:
| | | | |
Votes For | | Votes Witheld | | Total |
| 2,645,300,993.731 | | 20,555,051.311 | | 2,665,856,045.042 |
Richard S. Trutanic:
| | | | |
Votes For | | Votes Witheld | | Total |
| 2,641,761,336.311 | | 24,094,708.731 | | 2,665,856,045.042 |
Federal Income Tax Information
(Unaudited)
The Fund is required under the Internal Revenue Code to advise shareholders in a written statement as to the federal tax status of dividends paid by the Fund during such fiscal years.
For the fiscal year ended October 31, 2017, the Fund designated approximately $25,811,629 under the Internal Revenue Code as qualified dividend income eligible for reduced tax rates.
The dividends paid by the Fund during the fiscal year ended October 31, 2017 should be multiplied by the 21.80% to arrive at the amount eligible for the corporate dividend-received deduction.
In February 2018, shareholders will receive an IRS Form 1099-DIV or substitute Form 1099, which will show the federal tax status of the distributions received by shareholders in calendar year 2017. The amounts that will be reported on such 1099-DIV or substitute Form 1099 will be the amounts you are to use on your federal income tax return and will differ from the amounts which we must report for the Fund’s fiscal year end October 31, 2017.
Proxy Voting Policies and Procedures and Proxy Voting Record
A description of the policies and procedures that New York Life Investments uses to vote proxies related to the Fund’s securities is available without charge, upon request, (i) by visiting the MainStay Funds’ website at mainstayinvestments.com; and (ii) on the Securities and Exchange Commission’s (“SEC”) website at www.sec.gov.
The Fund is required to file with the SEC its proxy voting records for the Fund for the 12-month period ending June 30 on Form N-PX. The most recent Form N-PX or proxy voting record is available free of charge upon request by calling 800-MAINSTAY (624-6782); visiting the MainStay Funds’ website at mainstayinvestments.com; or on the SEC’s website at www.sec.gov.
Shareholder Reports and Quarterly Portfolio Disclosure
The Fund is required to file its complete schedule of portfolio holdings with the SEC for its first and third fiscal quarters on Form N-Q. The Fund’s Form N-Q is available without charge, on the SEC’s website at www.sec.gov or by calling MainStay Investments at 800-MAINSTAY (624-6782). You also can obtain and review copies of Form N-Q by visiting the SEC’s Public Reference Room in Washington, DC (information on the operation of the Public Reference Room may be obtained by calling 1-800-SEC-0330).
Board of Trustees and Officers (Unaudited)
The Trustees and officers of the Funds are listed below. The Board oversees the MainStay Group of Funds (which consists of The MainStay Funds and MainStay Funds Trust), MainStay VP Funds Trust, MainStay DefinedTerm Municipal Opportunities Fund, the Manager and the Subadvisors, and elects the officers of the Funds who are responsible for the day-to-day operations of the Funds. Information pertaining to the Trustees and officers is set forth below. Each Trustee serves until his or her successor is elected and qualified or until his or her resignation, death or removal. Under the Board’s retirement policy, unless an exception is made, a Trustee must tender his or her resignation by the
end of the calendar year during which he or she reaches the age of 75. Mr. Meenan reached the age of 75 during the calendar year 2016, and his term was extended for one additional year. Accordingly, Mr. Meenan is expected to serve until the end of calendar year 2017, at which time he intends to retire. Officers are elected annually by the Board. The business address of each Trustee and officer listed below is 51 Madison Avenue, New York, New York 10010. A majority of the Trustees are not “interested persons” (as defined by the 1940 Act and rules adopted by the SEC thereunder) of the Fund (“Independent Trustees”).
| | | | | | | | | | | | |
| | | | | Name and Date of Birth | | Term of Office, Position(s) Held and Length of Service | | Principal Occupation(s) During Past Five Years | | Number of
Portfolios in
the MainStay
Group of Funds
Overseen by
Trustee | | Other Directorships Held by Trustee |
| Interested Trustee | | | | Yie-Hsin Hung* 8/12/62 | | The MainStay Funds: Trustee since January 2017; MainStay Funds Trust: Trustee since January 2017. | | Senior Vice President of New York Life since joining in 2010, Member of the Executive Management Committee since January 1, 2017, Chief Executive Officer, New York Life Investment Management Holdings LLC & New York Life Investment Management LLC since May 2015. Senior Managing Director and Co-President of New York Life Investment Management LLC from January 2014 to May 2015. Previously held positions of increasing responsibility, including head of NYLIM International, Alternative Growth Businesses, and Institutional investments since joining New York Life in 2010. | | 82 | | None |
| | * | This Trustee is considered to be an “interested person” of the MainStay Group of Funds, MainStay VP Funds Trust and MainStay DefinedTerm Municipal Opportunities Fund, within the meaning of the 1940 Act because of her affiliation with New York Life Insurance Company, New York Life Investment Management LLC, Candriam Belgium, Candriam France S.A.S., Cornerstone Capital Management Holdings LLC, MacKay Shields LLC, NYL Investors LLC, NYLIFE Securities LLC and/or NYLIFE Distributors LLC, as described in detail above in the column entitled “Principal Occupation(s) During Past Five Years.” |
| | |
| 50 | | MainStay Income Builder Fund |
| | | | | | | | | | | | |
| | | | | Name and Date of Birth | | Term of Office, Position(s) Held and Length of Service | | Principal Occupation(s) During Past Five Years | | Number of
Portfolios in
the MainStay
Group of Funds
Overseen by
Trustee | | Other Directorships Held by Trustee |
| Independent Trustees | | | | David H. Chow 12/29/57 | | The MainStay Funds: Trustee since January 2016, Advisory Board Member (June 2015 to December 2015); MainStay Funds Trust: Trustee since January 2016, Advisory Board Member (June 2015 to December 2015). | | Founder and CEO, DanCourt Management, LLC (since 1999) | | 82 | | VanEck Vectors Group of Exchange-Traded Funds: Independent Chairman of the Board of Trustees since 2008 and Trustee since 2006 (57 portfolios); and
Berea College of Kentucky: Trustee since 2009. |
| | | | Susan B. Kerley 8/12/51 | | The MainStay Funds: Chairman since January 2017 and Trustee since 2007; MainStay Funds Trust: Chairman since January 2017 and Trustee since 1990.** | | President, Strategic Management Advisors LLC (since 1990) | | 82 | | Legg Mason Partners Funds: Trustee since 1991 (54 portfolios). |
| | | | Alan R. Latshaw 3/27/51 | | The MainStay Funds: Trustee and Audit Committee Financial Expert since 2006; MainStay Funds Trust: Trustee and Audit Committee Financial Expert since 2007.** | | Retired; Partner, Ernst & Young LLP (2002 to 2003); Partner, Arthur Andersen LLP (1989 to 2002); Consultant to the MainStay Funds Audit and Compliance Committee (2004 to 2006) | | 82 | | State Farm Associates Funds Trusts: Trustee since 2005 (4 portfolios);
State Farm Mutual Fund Trust: Trustee since 2005 (15 portfolios); and
State Farm Variable Product Trust: Trustee since 2005 (9 portfolios). |
| | | | Peter Meenan 12/5/41 | | The MainStay Funds: Trustee since 2007; MainStay Funds Trust: Trustee since 2002.** | | Retired; Independent Consultant (2004 to 2013); President and Chief Executive Officer, Babson—United, Inc. (financial services firm) (2000 to 2004); Independent Consultant (1999 to 2000); Head of Global Funds, Citicorp (1995 to 1999) | | 82 | | None |
| | | | Richard H. Nolan, Jr. 11/16/46 | | The MainStay Funds: Trustee since 2007; MainStay Funds Trust: Trustee since 2007.** | | Managing Director, ICC Capital Management (since 2004); President—Shields/Alliance, Alliance Capital Management (1994 to 2004) | | 82 | | None |
| | | | Jacques P. Perold 5/12/58 | | The MainStay Funds: Trustee since January 2016, Advisory Board Member (June 2015 to December 2015); MainStay Funds Trust: Trustee since January 2016, Advisory Board Member (June 2015 to December 2015). | | Retired; President, Fidelity Management & Research Company (2009 to 2014); Founder, President and Chief Executive Officer, Geode Capital Management, LCC (2001 to 2009) | | 82 | | Allstate Corporation: Director since 2015; MSCI, Inc. Director since March 2017 and
Boston University: Trustee since 2014. |
| | | | Richard S. Trutanic 2/13/52 | | The MainStay Funds: Trustee since 1994; MainStay Funds Trust: Trustee since 2007.** | | Chairman and Chief Executive Officer, Somerset & Company (financial advisory firm) (since 2004); Managing Director, The Carlyle Group (private investment firm) (2002 to 2004); Senior Managing Director, Partner and Board Member, Groupe Arnault S.A. (private investment firm) (1999 to 2002) | | 82 | | None |
| | ** | Includes prior service as a Director/Trustee of certain predecessor entities to MainStay Funds Trust. |
| | | | | | | | |
| | | | | Name and Date of Birth | | Position(s) Held and Length of Service | | Principal Occupation(s) During Past Five Years |
Officers of the Trust (Who are not Trustees)* | | | | Kirk C. Lehneis 6/29/74 | | President, The MainStay Funds, MainStay Funds Trust (since September 2017) | | Chief Operating Officer and Senior Managing Director (since 2016), New York Life Investment Management LLC; Chairman of the Board (since September 2017), NYLIFE Distributors LLC; Chairman of the Board, NYLIM Service Company LLC (since September 2017); President, MainStay DefinedTerm Municipal Opportunities Fund and MainStay VP Funds Trust (since September 2017); Senior Managing Director, Global Product Development (From March 2015—May 2016); Managing Director, Product Development (From March 2010—February 2015) |
| | | | Jack R. Benintende 5/12/64 | | Treasurer and Principal Financial and Accounting Officer, The MainStay Funds (since 2007), MainStay Funds Trust (since 2009) | | Managing Director, New York Life Investment Management LLC (since 2007); Treasurer and Principal Financial and Accounting Officer, MainStay DefinedTerm Municipal Opportunities Fund (since 2011) and MainStay VP Funds Trust (since 2007)**; and Assistant Treasurer, New York Life Investment Management Holdings LLC (2008 to 2012) |
| | | | Kevin M. Bopp 2/24/69 | | Vice President and Chief Compliance Officer, The MainStay Funds and MainStay Funds Trust (since 2014) | | Chief Compliance Officer, New York Life Investment Management LLC, IndexIQ ETF (since January 2016), Director and Associate General Counsel (2011 to 2014) and Vice President and Assistant General Counsel (2010 to 2011), New York Life Investment Management LLC; Vice President and ChiefCompliance Officer, MainStay VP Funds Trust, MainStay DefinedTerm Municipal Opportunities Fund (since 2014); Assistant Secretary, MainStay Funds, MainStay Funds Trust and MainStay VP Funds Trust (2010 to 2014)**, MainStay DefinedTerm Municipal Opportunities Fund (2011 to 2014) |
| | | | J. Kevin Gao 10/13/67 | | Secretary and Chief Legal Officer, The MainStay Funds and MainStay Funds Trust (since 2010) | | Managing Director and Associate General Counsel, New York Life Investment Management LLC (since 2010); Secretary and Chief Legal Officer, MainStay DefinedTerm Municipal Opportunities Fund (since 2011) and MainStay VP Funds Trust (since 2010)** |
| | | | Scott T. Harrington 2/8/59 | | Vice President—Administration, The MainStay Funds (since 2005), MainStay Funds Trust (since 2009) | | Director, New York Life Investment Management LLC (including predecessor advisory organizations) (since 2000); Member of the Board of Directors, New York Life Trust Company (since 2009); Vice President—Administration, MainStay DefinedTerm Municipal Opportunities Fund (since 2011) and MainStay VP Funds Trust (since 2005)** |
| | * | The officers listed above are considered to be “interested persons” of the MainStay Group of Funds, MainStay VP Funds Trust and MainStay Defined Term Municipal Opportunities Fund within the meaning of the 1940 Act because of their affiliation with the MainStay Group of Funds, New York Life Insurance Company and/or its affiliates, including New York Life Investment Management LLC, NYLIM Service Company LLC, NYLIFE Securities LLC and/or NYLIFE Distributors LLC, as described in detail in the column captioned “Principal Occupation(s) During Past Five Years.” Officers are elected annually by the Board. |
| | ** | Includes prior service as an officer of MainStay VP Series Fund, Inc., the predecessor to MainStay VP Funds Trust. |
| | |
| 52 | | MainStay Income Builder Fund |
This page intentionally left blank
This page intentionally left blank
MainStay Funds
Equity
U.S. Equity
MainStay Common Stock Fund
MainStay Cornerstone Growth Fund
MainStay Epoch U.S. All Cap Fund
MainStay Epoch U.S. Equity Yield Fund
MainStay Epoch U.S. Small Cap Fund
MainStay Large Cap Growth Fund
MainStay MAP Equity Fund
MainStay S&P 500 Index Fund
MainStay U.S. Equity Opportunities Fund
International/Global Equity
MainStay Candriam Emerging Markets Equity Fund
MainStay Emerging Markets Equity Fund
MainStay Epoch Capital Growth Fund
MainStay Epoch Global Choice Fund
MainStay Epoch Global Equity Yield Fund
MainStay Epoch International Choice Fund
MainStay Epoch International Small Cap Fund
MainStay International Equity Fund
MainStay International Opportunities Fund
Income
Taxable Bond
MainStay Emerging Markets Debt Fund
MainStay Floating Rate Fund
MainStay Government Fund
MainStay High Yield Corporate Bond Fund
MainStay Indexed Bond Fund
MainStay Short Duration High Yield Fund
MainStay Total Return Bond Fund
MainStay Unconstrained Bond Fund
Municipal/Tax Advantaged Bond
MainStay California Tax Free Opportunities Fund1
MainStay High Yield Municipal Bond Fund
MainStay New York Tax Free Opportunities Fund2
MainStay Tax Advantaged Short Term Bond Fund
MainStay Tax Free Bond Fund
Money Market
MainStay Money Market Fund
Mixed Asset
MainStay Balanced Fund
MainStay Convertible Fund
MainStay Income Builder Fund
Alternative
MainStay Absolute Return Multi-Strategy Fund
MainStay Cushing Energy Income Fund
MainStay Cushing MLP Premier Fund
MainStay Cushing Renaissance Advantage Fund
Asset Allocation/Target Date
MainStay Conservative Allocation Fund
MainStay Growth Allocation Fund
MainStay Moderate Allocation Fund
MainStay Moderate Growth Allocation Fund
MainStay Retirement 2010 Fund
MainStay Retirement 2020 Fund
MainStay Retirement 2030 Fund
MainStay Retirement 2040 Fund
MainStay Retirement 2050 Fund
MainStay Retirement 2060 Fund
Manager
New York Life Investment Management LLC
New York, New York
Subadvisors
Candriam Belgium S.A.3
Brussels, Belgium
Candriam France S.A.S.3
Paris, France
Cornerstone Capital Management Holdings LLC3
New York, New York
Cushing Asset Management, LP
Dallas, Texas
Epoch Investment Partners, Inc.
New York, New York
MacKay Shields LLC3
New York, New York
Markston International LLC
White Plains, New York
NYL Investors LLC3
New York, New York
Winslow Capital Management, LLC
Minneapolis, Minnesota
Legal Counsel
Dechert LLP
Washington, District of Columbia
Independent Registered Public Accounting Firm
KPMG LLP
Philadelphia, Pennsylvania
1. Class A and Class I shares of this Fund are registered for sale in AZ, CA, MI, NV, OR, TX, UT and WA. Class I shares are registered for sale in CO, FL, GA, HI, ID, MA, MD, NH, NJ and NY.
2. This Fund is registered for sale in CA, CT, DE, FL, MA, NJ, NY and VT.
3. An affiliate of New York Life Investment Management LLC.
Not part of the Annual Report
For more information
800-MAINSTAY (624-6782)
mainstayinvestments.com
MainStay Investments® is a registered service mark and name under which New York Life Investment Management LLC does business. MainStay Investments, an indirect subsidiary of New York Life Insurance Company, New York, NY 10010, provides investment advisory products and services. The MainStay Funds® are managed by New York Life Investment Management LLC and distributed by NYLIFE Distributors LLC, 30 Hudson Street, Jersey City, NJ 07302, a wholly owned subsidiary of New York Life Insurance Company. NYLIFE Distributors LLC is a Member FINRA/SIPC.
©2017 NYLIFE Distributors LLC. All rights reserved.
| | | | | | | | |
| Not FDIC/NCUA Insured | | Not a Deposit | | May Lose Value | | No Bank Guarantee | | Not Insured by Any Government Agency |
| | |
| 1717042 MS286-17 | | MSIB11-12/17 (NYLIM) NL216 |
MainStay Emerging Markets Debt Fund
(Formerly known as MainStay Global High Income Fund)
Message from the President and Annual Report
October 31, 2017


This page intentionally left blank
Message from the President
The 12 months ended October 31, 2017, brought strong performance to equity markets in the United States and abroad.
According to FTSE-Russell data for the U.S. market, stocks at all capitalization levels earned solid double-digit overall returns during the reporting period. Total returns for stocks in general exceeded 20% at all capitalization levels. Growth stocks were particularly strong, outperforming value stocks for companies of all sizes except among microcaps, where value stocks outperformed growth stocks.
Several factors contributed to the strength of domestic and international stock markets during the reporting period. Following the U.S. presidential election in November 2016, many investors looked forward to business tax incentives and possible tax cuts for consumers that could stimulate economic growth. During the reporting period, corporate earnings reports remained strong; and growth in U.S. real gross domestic product remained positive, with a substantial advance during the second quarter of 2017. Developed international markets and emerging markets were also strong, boosted by positive macroeconomic data and growing confidence that Europe was well on its way to financial recovery. Despite wide variations among emerging markets, many saw strong appreciation in local-currency terms and benefited from a weaker U.S. dollar.
During the reporting period, the Federal Open Market Committee raised the federal funds target range three times—in December of 2016 and in March and June of 2017. These incremental increases raised the federal funds target range to 1.00% to 1.25% by the end of the reporting period. These tightening moves were followed by higher U.S. Treasury yields at all maturities, with the greatest increases at the short-end of the maturity spectrum.
As interest rates rise, bond prices tend to decline (and vice versa). As a result, some portions of the U.S. Treasury market recorded negative total returns during the reporting period. Agency securities posted small but positive total returns, as did
asset-backed and mortgage-backed securities. Other bond categories, particularly those with looser ties to U.S. interest rates, did considerably better. Emerging-market debt recorded solid single-digit returns; high-yield bonds were generally stronger; and convertible bonds, which are closely tied to the performance of underlying stocks, provided some of the strongest overall returns of any fixed-income sector during the reporting period.
At MainStay, we have always encouraged investors to diversify their investments and maintain a long-term perspective, even when markets are strong. Asset classes that perform well in one environment may perform differently in another; and in today’s ever-changing world, wide market swings are not unknown.
MainStay offers Funds with a wide array of investment objectives to help our shareholders pursue the appropriate diversification for their long-range financial goals. We also offer several investment boutiques, allowing our shareholders to choose the style—or mix of styles—that’s best suited to their investment needs. We believe that relatively few individual investors can match the level of professional experience and market insight that our portfolio managers provide.
The report that follows provides more detailed information on the specific markets, investment strategies and portfolio decisions that affected your MainStay Fund during the 12 months ended October 31, 2017. We encourage you to read the report carefully and use it to help you evaluate your progress toward your financial goals.
Sincerely,

Kirk C. Lehneis
President
The opinions expressed are as of the date of this report and are subject to change. There is no guarantee that any forecast made will come to pass. This material does not constitute investment advice and is not intended as an endorsement of any specific investment. Past performance is no guarantee of future results.
Not part of the Annual Report
Table of Contents
Investors should refer to the Fund’s Summary Prospectus and/or Prospectus and consider the Fund’s investment objectives, strategies, risks, charges and expenses carefully before investing. The Summary Prospectus and/or Prospectus contain this and other information about the Fund. You may obtain copies of the Fund’s Summary Prospectus, Prospectus and Statement of Additional Information free of charge, upon request, by calling toll-free 800-MAINSTAY (624-6782), by writing to NYLIFE Distributors LLC, Attn: MainStay Marketing Department, 30 Hudson Street, Jersey City, NJ 07302 or by sending an e-mail to MainStayShareholderServices@nylim.com. These documents are also available via the MainStay Funds’ website at mainstayinvestments.com/documents. Please read the Summary Prospectus and/or Prospectus carefully before investing.
Investment and Performance Comparison1 (Unaudited)
Performance data quoted represents past performance. Past performance is no guarantee of future results. Because of market volatility and other factors, current performance may be lower or higher than the figures shown. Investment return and principal value will fluctuate, and as a result, when shares are redeemed, they may be worth more or less than their original cost. The graph below depicts the historical performance of Class B shares2 of the Fund. Performance will vary from class to class based on differences in class-specific expenses and sales charges. For performance information current to the most recent month-end, please call 800-MAINSTAY (624-6782) or visit mainstayinvestments.com.
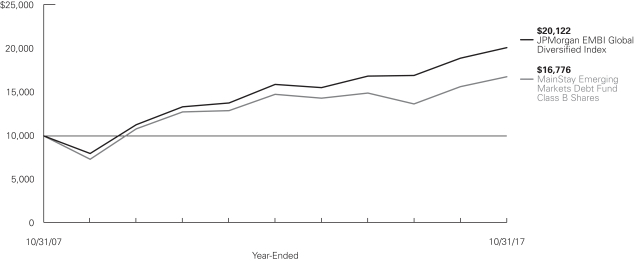
Average Annual Total Returns for the Year-Ended October 31, 2017
| | | | | | | | | | | | | | | | | | | | | | | | |
| Class | | Sales Charge | | | | Inception
Date | | | One Year | | | Five
Years | | | Ten Years or Since Inception | | | Gross
Expense
Ratio3 | |
| Class A Shares | | Maximum 4.5% Initial Sales Charge | | With sales charges Excluding sales charges | |
| 6/1/1998
|
| |
| 3.31
8.18 | %
| |
| 2.57
3.52 | %
| |
| 5.77
6.25 | %
| |
| 1.23
1.23 | %
|
| Investor Class Shares | | Maximum 4.5% Initial Sales Charge | | With sales charges Excluding sales charges | | | 2/28/2008 | | |
| 3.13
7.99 |
| |
| 2.38
3.33 |
| |
| 5.91
6.42 |
| |
| 1.43
1.43 |
|
| Class B Shares2 | | Maximum 5% CDSC if Redeemed Within the First Six Years of Purchase | | With sales charges Excluding sales charges | | | 6/1/1998 | | |
| 2.20
7.20 |
| |
| 2.26
2.58 |
| |
| 5.31
5.31 |
| |
| 2.18
2.18 |
|
| Class C Shares | | Maximum 1% CDSC if Redeemed Within One Year of Purchase | | With sales charges Excluding sales charges | | | 9/1/1998 | | |
| 6.19
7.19 |
| |
| 2.57
2.57 |
| |
| 5.31
5.31 |
| |
| 2.18
2.18 |
|
| Class I Shares | | No Sales Charge | | | | | 8/31/2007 | | | | 8.54 | | | | 3.79 | | | | 6.53 | | | | 0.98 | |
| 1. | The performance table and graph do not reflect the deduction of taxes that a shareholder would pay on distributions or Fund share redemptions. Total returns reflect maximum applicable sales charges as indicated in the table above, if any, changes in share price, and reinvestment of dividend and capital gain distributions. The graph assumes the initial investment amount shown above and reflects the deduction of all sales charges that would have applied for the period of investment. Performance figures may reflect certain fee waivers and/or expense limitations, without which total returns may have |
| | been lower. For more information on share classes and current fee waivers and/or expense limitations (if any), please refer to the Notes to Financial Statements. |
| 2. | Class B shares are closed to all new purchases as well as additional investments by existing Class B shareholders. |
| 3. | The gross expense ratios presented reflect the Fund’s “Total Annual Fund Operating Expenses” from the most recent Prospectus and may differ from other expense ratios disclosed in this report. |
The footnotes on the next page are an integral part of the table and graph and should be carefully read in conjunction with them.
| | | | | | | | | | | | |
| Benchmark Performance | | One
Year | | | Five
Years | | | Ten Years
or Since
Inception | |
JPMorgan EMBI Global Diversified Index4 | | | 6.32 | % | | | 4.81 | % | | | 7.24 | % |
Morningstar Emerging Markets Bond Category Average5 | | | 6.90 | | | | 3.21 | | | | 6.14 | |
| 4. | The JPMorgan EMBI Global Diversified Index is the Fund’s primary broad-based securities market index for comparison purposes. The JPMorgan EMBI Global Diversified Index is a market-capitalization weighted, total return index tracking the traded market for U.S. dollar-denominated Brady Bonds, Eurobonds, traded loans and local market debt instruments issued by sovereign and quasi-sovereign entities. Results assume reinvestment of all dividends and capital gains. An investment cannot be made directly in an index. |
| 5. | The Morningstar Emerging Markets Bond Category Average is representative of funds that invest more than 65% of their assets in foreign bonds from developing countries. The largest portion of the emerging-markets bond market comes from Latin America, followed by Eastern Europe. Africa, the Middle East, and Asia make up the rest. Results are based on average total returns of similar funds with all dividends and capital gain distributions reinvested. |
The footnotes on the preceding page are an integral part of the table and graph and should be carefully read in conjunction with them.
| | |
| 6 | | MainStay Emerging Markets Debt Fund |
Cost in Dollars of a $1,000 Investment in MainStay Emerging Markets Debt Fund (Unaudited)
The example below is intended to describe the fees and expenses borne by shareholders during the six-month period from May 1, 2017, to October 31, 2017, and the impact of those costs on your investment.
Example
As a shareholder of the Fund you incur two types of costs: (1) transaction costs, including exchange fees and sales charges (loads) on purchases (as applicable), and (2) ongoing costs, including management fees, distribution and/or service (12b-1) fees, and other Fund expenses (as applicable). This example is intended to help you understand your ongoing costs (in dollars) of investing in the Fund and to compare these costs with the ongoing costs of investing in other mutual funds. The example is based on an investment of $1,000 made at the beginning of the six-month period and held for the entire period from May 1, 2017, to October 31, 2017.
This example illustrates your Fund’s ongoing costs in two ways:
Actual Expenses
The second and third data columns in the table below provide information about actual account values and actual expenses. You may use the information in these columns, together with the amount you invested, to estimate the expenses that you paid during the six months ended October 31, 2017. Simply divide your account value by $1,000 (for example, an $8,600 account value divided by $1,000 = 8.6), then
multiply the result by the number under the heading entitled “Expenses Paid During Period” to estimate the expenses you paid on your account during this period.
Hypothetical Example for Comparison Purposes
The fourth and fifth data columns in the table below provide information about hypothetical account values and hypothetical expenses based on the Fund’s actual expense ratio and an assumed rate of return of 5% per year before expenses, which is not the Fund’s actual return. The hypothetical account values and expenses may not be used to estimate the actual ending account balances or expenses you paid for the six-month period shown. You may use this information to compare the ongoing costs of investing in the Fund with the ongoing costs of investing in other mutual funds. To do so, compare this 5% hypothetical example with the 5% hypothetical examples that appear in the shareholder reports of the other mutual funds.
Please note that the expenses shown in the table are meant to highlight your ongoing costs only and do not reflect any transactional costs, such as exchange fees or sales charges (loads). Therefore, the fourth and fifth data columns of the table are useful in comparing ongoing costs only and will not help you determine the relative total costs of owning different funds. In addition, if these transactional costs were included, your costs would have been higher.
| | | | | | | | | | | | | | | | | | | | | | |
| | | | | | | | | | | | | | | | | | |
| Share Class | | Beginning
Account
Value
5/1/17 | | | Ending Account
Value (Based
on Actual
Returns and
Expenses)
10/31/17 | | | Expenses
Paid
During
Period1 | | | Ending Account
Value (Based
on Hypothetical
5% Annualized
Return and
Actual Expenses)
10/31/17 | | | Expenses
Paid
During
Period1 | | | Net Expense
Ratio
During
Period2 |
| | | | | | |
| Class A Shares | | $ | 1,000.00 | | | $ | 1,046.90 | | | $ | 6.19 | | | $ | 1,019.20 | | | $ | 6.11 | | | 1.20% |
| | | | | | |
| Investor Class Shares | | $ | 1,000.00 | | | $ | 1,045.30 | | | $ | 7.27 | | | $ | 1,018.10 | | | $ | 7.17 | | | 1.41% |
| | | | | | |
| Class B Shares | | $ | 1,000.00 | | | $ | 1,042.70 | | | $ | 11.12 | | | $ | 1,014.30 | | | $ | 10.97 | | | 2.16% |
| | | | | | |
| Class C Shares | | $ | 1,000.00 | | | $ | 1,042.60 | | | $ | 11.12 | | | $ | 1,014.30 | | | $ | 10.97 | | | 2.16% |
| | | | | | |
| Class I Shares | | $ | 1,000.00 | | | $ | 1,049.10 | | | $ | 4.96 | | | $ | 1,020.40 | | | $ | 4.89 | | | 0.96% |
| 1. | Expenses are equal to the Fund’s annualized expense ratio of each class multiplied by the average account value over the period, divided by 365 and multiplied by 184 (to reflect the six-month period). The table above represents the actual expenses incurred during the six-month period. |
| 2. | Expenses are equal to the Fund’s annualized expense ratio to reflect the six-month period. |
Country Composition as of October 31, 2017 (Unaudited)
| | | | |
| Brazil | | | 9.2 | % |
| Mexico | | | 8.2 | |
| Russia | | | 6.3 | |
| Indonesia | | | 5.7 | |
| China | | | 4.3 | |
| Peru | | | 3.8 | |
| India | | | 3.7 | |
| Saudi Arabia | | | 3.3 | |
| Turkey | | | 3.3 | |
| Croatia | | | 3.2 | |
| Dominican Republic | | | 2.9 | |
| Argentina | | | 2.7 | |
| Costa Rica | | | 2.7 | |
| Kazakhstan | | | 2.7 | |
| Hungary | | | 2.5 | |
| Paraguay | | | 2.5 | |
| Venezuela | | | 2.5 | |
| El Salvador | | | 2.3 | |
| Uruguay | | | 2.3 | |
| Ukraine | | | 2.2 | |
| Ivory Coast | | | 1.8 | |
| United States | | | 1.8 | |
| | | | |
| Guatemala | | | 1.6 | % |
| Netherlands | | | 1.5 | |
| Pakistan | | | 1.5 | |
| United Arab Emirates | | | 1.5 | |
| Ghana | | | 1.4 | |
| Sri Lanka | | | 1.2 | |
| Vietnam | | | 1.2 | |
| Nigeria | | | 1.1 | |
| Oman | | | 1.1 | |
| Portugal | | | 1.1 | |
| South Africa | | | 1.1 | |
| Malaysia | | | 0.8 | |
| Senegal | | | 0.8 | |
| Gabon | | | 0.7 | |
| United Republic of Cameroon | | | 0.6 | |
| Kenya | | | 0.6 | |
| Hong Kong | | | 0.5 | |
| Israel | | | 0.4 | |
| Other Assets, Less Liabilities | | | 1.4 | |
| | | | |
| | | 100.0 | % |
| | | | |
See Portfolio of Investments beginning on page 11 for specific holdings within these categories.
Top Ten Issuers Held as of October 31, 2017 (excluding short-term investment) (Unaudited)
| 1. | Pertamina Persero PT, 5.625%, due 5/20/43 |
| 2. | Petrobras Global Finance B.V., 6.85%–8.75%, due 5/23/26–6/5/2115 |
| 3. | Petroleos Mexicanos, 5.625%–6.75%, due 1/23/46–9/21/47 |
| 4. | Croatia Government International Bond, 6.00%–6.375%, due 3/24/21–1/26/24 |
| 5. | Dominican Republic International Bond, 5.95%, due 1/25/27 |
| 6. | KazMunayGas National Co. JSC, 5.75%, due 4/30/43 |
| 7. | Turkey Government International Bond, 6.625%–7.375%, due 2/5/25–2/17/45 |
| 8. | Hungary Government International Bond, 7.625%, due 3/29/41 |
| 9. | Paraguay Government International Bond, 6.10%, due 8/11/44 |
| 10. | El Salvador Government International Bond, 7.75%, due 1/24/23 |
| | |
| 8 | | MainStay Emerging Markets Debt Fund |
Portfolio Management Discussion and Analysis (Unaudited)
Questions answered by portfolio managers Dan Roberts, PhD, Michael Kimble, CFA, and Jakob Bak, PhD, CFA, of MacKay Shields LLC, the Fund’s Subadvisor.
How did MainStay Emerging Markets Debt Fund perform relative to its primary benchmark and peers during the 12 months ended October 31, 2017?
Excluding all sales charges, MainStay Emerging Markets Debt Fund returned 8.18% for Class A shares, 7.99% for Investor Class shares, 7.20% for Class B shares and 7.19% for Class C shares for the 12 months ended October 31, 2017. Over the same period, the Fund’s Class I shares returned 8.54%. For the 12 months ended October 31, 2017, all share classes outperformed the 6.32% return of the JPMorgan EMBI Global Diversified Index,1 which is the Fund’s broad-based securities-market index. Over the same period, all share classes also outperformed the 6.90% return of the Morningstar Emerging Markets Bond Category Average.2 See page 5 for Fund returns with applicable sales charges.
What factors affected the Fund’s relative performance during the reporting period?
We believe that emerging-market debt and other “risk” assets, such as U.S. stocks and investment-grade and non-investment-grade credit, benefited from investor optimism about an improving global economic backdrop, the proposed U.S. tax plan, buoyant job growth in the United States and an increase in oil prices. By the end of the reporting period, Brent crude oil rallied to levels last seen in July of 2015, a positive for the commodity-heavy emerging-market producers.
The Fund’s outperformance relative to the JPMorgan EMBI Global Diversified Index resulted primarily from the Fund’s overweight position in credit, as credit spreads3 tightened during the reporting period. Negative (or very low) yields in developed markets provided strength for emerging-market debt, which rallied significantly during the reporting period. Idiosyncratic risk in emerging markets remained high, as evidenced by political volatility in Turkey and Venezuela and corruption scandals in Brazil. Nevertheless, ratings trends and relatively low default rates were positive for emerging-market debt.
What was the Fund’s duration4 strategy during the reporting period?
The Fund ended the reporting period with a longer duration than that of its benchmark. As of October 31, 2017, the Fund’s duration was 7.5 years, compared to the 6.8-year duration of the JPMorgan EMBI Global Diversified Index.
What specific factors, risks or market forces prompted significant decisions for the Fund during the reporting period?
Throughout the reporting period, we promoted credit risk as a primary driver of performance. We expected corporate bonds and quasi-sovereigns to perform well because we believed that the low interest-rate environment was likely to spark healthy demand for higher-yielding products. For this reason, we maintained a high beta5 in the Fund. We also added slightly to the Fund’s duration during the reporting period because we believed that yields were unlikely to increase significantly in the immediate future.
We remained highly selective in our emerging-market debt holdings. The Fund had an overweight position in bonds rated BB,6 with a focus on corporate bonds of larger companies with stronger liquidity and better opportunities to access the bond market when open for issuance.
During the reporting period, which market segments were the strongest positive contributors to the Fund’s performance and which market segments were particularly weak?
Long exposure to corporate credit was the strongest positive contributor to the Fund’s performance during the reporting period. (Contributions take weightings and total returns into account.) Within credit, the strongest performers were positions within the basic industry and energy sectors from Brazil, Russia and Mexico. While credit in general outperformed sovereigns, the government bonds of Russia, Uruguay and Ghana performed well for the Fund. In addition, the Fund’s exposure to local currency bonds—especially in Russia, Brazil and Mexico—performed well as earlier sell-offs proved excessive.
| 1. | See footnote on page 6 for more information on the JPMorgan EMBI Global Diversified Index. |
| 2. | See footnote on page 6 for more information on the Morningstar Emerging Markets Bond Category Average. |
| 3. | The terms “spread” and “yield spread” may refer to the difference in yield between a security or type of security and comparable U.S. Treasury issues. The term may also refer to the difference in yield between two specific securities or types of securities at a given time. The term “credit spread” typically refers to the difference in yield between corporate or municipal bonds (or a specific category of these bonds) and comparable U.S. Treasury issues. |
| 4. | Duration is a measure of the price sensitivity of a fixed-income investment to changes in interest rates. Duration is expressed as a number of years and is considered a more accurate sensitivity gauge than average maturity. |
| 5. | Beta is a measure of volatility in relation to the market as a whole. A beta higher than 1 indicates that a security or portfolio will tend to exhibit higher volatility than the market. A beta lower than 1 indicates that a security or portfolio will tend to exhibit lower volatility than the market. |
| 6. | An obligation rated ‘BB’ by Standard & Poor’s (“S&P”) is deemed by S&P to be less vulnerable to nonpayment than other speculative issues. In the opinion of S&P, however, the obligor faces major ongoing uncertainties or exposure to adverse business, financial or economic conditions which could lead to the obligor’s inadequate capacity to meet its financial commitment on the obligation. When applied to Fund holdings, ratings are based solely on the creditworthiness of the bonds in the portfolio and are not meant to represent the security or safety of the Fund. |
During the reporting period, the weakest contribution to the Fund’s performance came from high-duration bonds with low-beta exposure. The one exception was Venezuelan bonds, which were a drag on performance despite having very high beta exposure.
Did the Fund make any significant purchases or sales during the reporting period?
Most of the Fund’s trades were made to adjust the Fund’s risk and duration profiles. Often this was done by swapping shorter-maturity bonds with longer-dated ones from the same issuer. Examples included the City of Buenos Aires, Petrobras, Dominican Republic, Sri Lanka, Bharti Airtel, Peru, Uruguay, Vietnam and a Russian firm, Mettaloinvest.
The Fund reduced its allocations to Belarus, Georgia, Kazakhstan, Sri Lanka, Panama, Peru and Venezuela. In most cases, this was simply because valuations had increased beyond what we believed to be fair value—although in Venezuela, we worried about the country’s political situation. The Fund increased its allocations to Argentina, Brazil, Oman, Portugal, Ivory Coast and China. The Fund added a long Saudi Arabian bond when it was first issued.
How did the Fund’s sector and country weightings change during the reporting period?
During the reporting period, we kept the sovereign weighting fairly constant at about 51% of the Fund’s assets and put some of the Fund’s cash holdings to work to increase the Fund’s weighting in corporate bonds. From a country perspective, we increased the Fund’s weightings in Mexico, Brazil and China, while decreasing its weightings in Russia, Venezuela and Indonesia.
How was the Fund positioned at the end of the reporting period?
As of October 31, 2017, the Fund held an overweight position relative to the JPMorgan EMBI Global Diversified Index in credit. As of the same date, the Fund held overweight allocations relative to the Index in Brazil, Mexico and Russia. As of October 31, 2017, the Fund had a slightly overweight position in Latin America, coupled with slightly underweight positions in Africa and Europe.
The opinions expressed are those of the portfolio managers as of the date of this report and are subject to change. There is no guarantee that any forecasts made will come to pass. This material does not constitute investment advice and is not intended as an endorsement of any specific investment.
| | |
| 10 | | MainStay Emerging Markets Debt Fund |
Portfolio of Investments October 31, 2017
| | | | | | | | |
| | | Principal
Amount | | | Value | |
Long-Term Bonds 96.8%† Corporate Bonds 45.9% | |
Argentina 0.6% | | | | | | | | |
Cablevision S.A.
6.50%, due 6/15/21 (a) | | $ | 1,000,000 | | | $ | 1,070,200 | |
| | | | | | | | |
| | |
Brazil 7.5% | | | | | | | | |
Braskem Netherlands Finance B.V.
4.50%, due 1/10/28 (a) | | | 2,000,000 | | | | 1,990,600 | |
Minerva Luxembourg S.A.
6.50%, due 9/20/26 (a) | | | 1,375,000 | | | | 1,425,875 | |
¨Petrobras Global Finance B.V. | | | | | | | | |
6.85%, due 6/5/2115 | | | 1,000,000 | | | | 957,500 | |
7.375%, due 1/17/27 | | | 3,000,000 | | | | 3,331,500 | |
8.75%, due 5/23/26 | | | 2,000,000 | | | | 2,422,500 | |
Rumo (Luxembourg) S.A.R.L.
7.375%, due 2/9/24 (a) | | | 1,500,000 | | | | 1,634,250 | |
Vale Overseas, Ltd.
6.875%, due 11/21/36 | | | 1,800,000 | | | | 2,144,790 | |
| | | | | | | | |
| | | | | | | 13,907,015 | |
| | | | | | | | |
China 4.3% | | | | | | | | |
Alibaba Group Holding, Ltd.
4.50%, due 11/28/34 | | | 2,000,000 | | | | 2,222,990 | |
JD.com, Inc.
3.875%, due 4/29/26 | | | 1,500,000 | | | | 1,529,283 | |
Proven Glory Capital, Ltd.
Series Reg S
4.00%, due 2/21/27 | | | 1,000,000 | | | | 1,026,280 | |
Proven Honour Capital, Ltd.
Series Reg S
4.125%, due 5/19/25 | | | 1,500,000 | | | | 1,561,385 | |
Tencent Holdings, Ltd.
Series Reg S
3.80%, due 2/11/25 | | | 1,500,000 | | | | 1,573,533 | |
| | | | | | | | |
| | | | | | | 7,913,471 | |
| | | | | | | | |
Hong Kong 0.5% | | | | | | | | |
Melco Resorts Finance, Ltd.
4.875%, due 6/6/25 (a) | | | 1,000,000 | | | | 1,009,110 | |
| | | | | | | | |
| | |
India 3.7% | | | | | | | | |
Bharti Airtel, Ltd.
Series Reg S
4.375%, due 6/10/25 | | | 2,000,000 | | | | 2,046,724 | |
Glenmark Pharmaceuticals, Ltd.
Series Reg S
4.50%, due 8/2/21 | | | 1,000,000 | | | | 1,008,137 | |
Reliance Holding USA, Inc.
5.40%, due 2/14/22 (a) | | | 1,000,000 | | | | 1,098,691 | |
| | | | | | | | |
| | | Principal
Amount | | | Value | |
India (continued) | |
Tata Motors, Ltd.
Series Reg S
5.75%, due 10/30/24 | | $ | 1,500,000 | | | $ | 1,639,734 | |
Vedanta Resources PLC
6.125%, due 8/9/24 (a) | | | 1,000,000 | | | | 1,020,251 | |
| | | | | | | | |
| | | | | | | 6,813,537 | |
| | | | | | | | |
Indonesia 4.8% | | | | | | | | |
Listrindo Capital B.V.
4.95%, due 9/14/26 (a) | | | 1,500,000 | | | | 1,518,750 | |
¨Pertamina Persero PT
5.625%, due 5/20/43 (a) | | | 6,700,000 | | | | 7,339,575 | |
| | | | | | | | |
| | | | | | | 8,858,325 | |
| | | | | | | | |
Israel 0.4% | | | | | | | | |
Delek & Avner Tamar Bond, Ltd.
5.412%, due 12/30/25 (a) | | | 800,000 | | | | 811,720 | |
| | | | | | | | |
| | |
Kazakhstan 2.7% | | | | | | | | |
¨KazMunayGas National Co. JSC
5.75%, due 4/30/43 (a) | | | 5,000,000 | | | | 5,078,000 | |
| | | | | | | | |
| | |
Malaysia 0.8% | | | | | | | | |
Gohl Capital, Ltd.
Series Reg S
4.25%, due 1/24/27 | | | 1,500,000 | | | | 1,557,641 | |
| | | | | | | | |
| | |
Mexico 7.4% | | | | | | | | |
Banco Nacional de Comercio Exterior SNC 3.80% (5-year Treasury Constant Maturity Rate + 3.00%),
due 8/11/26 (a)(b) | | | 2,000,000 | | | | 1,990,000 | |
Cemex Finance LLC
6.00%, due 4/1/24 (a) | | | 2,000,000 | | | | 2,115,000 | |
Comision Federal de Electricidad
4.875%, due 1/15/24 (a) | | | 2,000,000 | | | | 2,137,500 | |
Grupo Televisa S.A.B.
4.625%, due 1/30/26 | | | 1,500,000 | | | | 1,592,408 | |
¨Petroleos Mexicanos | | | | | | | | |
5.625%, due 1/23/46 | | | 5,000,000 | | | | 4,533,250 | |
6.75%, due 9/21/47 (a) | | | 1,385,000 | | | | 1,427,519 | |
| | | | | | | | |
| | | | | | | 13,795,677 | |
| | | | | | | | |
Netherlands 1.5% | | | | | | | | |
GTH Finance B.V.
Series Reg S
7.25%, due 4/26/23 | | | 1,500,000 | | | | 1,698,510 | |
Samvardhana Motherson Automotive Systems Group B.V.
Series Reg S
4.875%, due 12/16/21 | | | 1,000,000 | | | | 1,046,556 | |
| | | | | | | | |
| | | | | | | 2,745,066 | |
| | | | | | | | |
| † | Percentages indicated are based on Fund net assets. |
| ¨ | | Among the Fund’s 10 largest issuers held, as of October 31, 2017, excluding short-term investment. May be subject to change daily. (Unaudited) |
| | | | | | |
The notes to the financial statements are an integral part of,
and should be read in conjunction with, the financial statements. | | | | | 11 | |
Portfolio of Investments October 31, 2017 (continued)
| | | | | | | | |
| | | Principal
Amount | | | Value | |
| Corporate Bonds (continued) | |
Oman 1.1% | | | | | | | | |
OmGrid Funding, Ltd.
5.196%, due 5/16/27 (a) | | $ | 2,000,000 | | | $ | 2,004,056 | |
| | | | | | | | |
| | |
Peru 1.8% | | | | | | | | |
Banco de Credito del
4.25%, due 4/1/23 (a) | | | 1,000,000 | | | | 1,061,250 | |
Southern Copper Corp.
5.875%, due 4/23/45 | | | 2,000,000 | | | | 2,337,932 | |
| | | | | | | | |
| | | | | | | 3,399,182 | |
| | | | | | | | |
Russia 3.1% | |
Gazprom OAO Via Gaz Capital S.A.
Series Reg S
8.625%, due 4/28/34 | | | 1,500,000 | | | | 2,024,082 | |
Metalloinvest Finance DAC
4.85%, due 5/2/24 (a) | | | 2,000,000 | | | | 2,034,856 | |
MMC Norilsk Nickel OJSC via MMC Finance DAC
6.625%, due 10/14/22 (a) | | | 1,500,000 | | | | 1,685,655 | |
| | | | | | | | |
| | | | | | | 5,744,593 | |
| | | | | | | | |
Saudi Arabia 1.1% | |
Saudi Electricity Global Sukuk Co. 3 4.00%, due 4/8/24 (a) | | | 2,000,000 | | | | 2,076,968 | |
| | | | | | | | |
| | |
South Africa 1.1% | | | | | | | | |
Eskom Holdings SOC, Ltd.
7.125%, due 2/11/25 (a) | | | 2,000,000 | | | | 2,046,532 | |
| | | | | | | | |
| | |
Turkey 0.8% | | | | | | | | |
Arcelik A.S.
5.00%, due 4/3/23 (a) | | | 1,500,000 | | | | 1,532,082 | |
| | | | | | | | |
| | |
United Arab Emirates 1.5% | | | | | | | | |
Abu Dhabi National Energy Co. PJSC 3.625%, due 1/12/23 (a) | | | 2,750,000 | | | | 2,784,617 | |
| | | | | | | | |
| | |
Venezuela 1.2% | | | | | | | | |
Petroleos de Venezuela S.A.
Series Reg S
12.75%, due 2/17/22 | | | 5,000,000 | | | | 2,262,500 | |
| | | | | | | | |
Total Corporate Bonds
(Cost $83,385,194) | | | | | | | 85,410,292 | |
| | | | | | | | |
|
| Foreign Government Bonds 50.9% | |
Argentina 2.1% | | | | | | | | |
City of Buenos Aires Argentina
Series Reg S
7.50%, due 6/1/27 | | | 2,000,000 | | | | 2,234,260 | |
| | | | | | | | |
| | | Principal
Amount | | | Value | |
Argentina (continued) | | | | | | | | |
Provincia de Buenos Aires
9.125%, due 3/16/24 (a) | | $ | 1,500,000 | | | $ | 1,747,500 | |
| | | | | | | | |
| | | | 3,981,760 | |
| | | | | | | | |
Brazil 1.7% | |
Brazil Notas do Tesouro Nacional
Series F
10.00%, due 1/1/27 | | BRL | 10,000,000 | | | | 3,185,587 | |
| | | | | | | | |
|
Costa Rica 2.7% | |
Costa Rica Government
International Bond
7.158%, due 3/12/45 (a) | | $ | 2,000,000 | | | | 2,125,000 | |
Instituto Costarricense de Electricidad
6.375%, due 5/15/43 (a) | | | 3,000,000 | | | | 2,819,910 | |
| | | | | | | | |
| | | | 4,944,910 | |
| | | | | | | | |
Croatia 3.2% | | | | | | | | |
¨Croatia Government International Bond | |
Series Reg S
6.00%, due 1/26/24 | | | 3,250,000 | | | | 3,700,937 | |
6.375%, due 3/24/21 (a) | | | 2,000,000 | | | | 2,207,500 | |
| | | | | | | | |
| | | | 5,908,437 | |
| | | | | | | | |
Dominican Republic 2.9% | | | | | | | | |
¨Dominican Republic International Bond Series Reg S
5.95%, due 1/25/27 | | | 5,000,000 | | | | 5,382,500 | |
| | | | | | | | |
| | |
El Salvador 2.3% | | | | | | | | |
¨El Salvador Government
International Bond
7.75%, due 1/24/23 (a) | | | 4,000,000 | | | | 4,310,000 | |
| | | | | | | | |
| | |
Gabon 0.7% | | | | | | | | |
Gabon Government International Bond 6.375%, due 12/12/24 (a) | | | 1,296,000 | | | | 1,270,287 | |
| | | | | | | | |
| | |
Ghana 1.4% | | | | | | | | |
Ghana Government International Bond
10.75%, due 10/14/30 (a) | | | 2,000,000 | | | | 2,664,800 | |
| | | | | | | | |
| | |
Guatemala 1.6% | | | | | | | | |
Guatemala Government Bond
4.50%, due 5/3/26 (a) | | | 3,000,000 | | | | 3,022,590 | |
| | | | | | | | |
| | |
Hungary 2.5% | | | | | | | | |
¨Hungary Government International Bond
7.625%, due 3/29/41 | | | 3,000,000 | | | | 4,626,000 | |
| | | | | | | | |
| | |
Indonesia 0.9% | | | | | | | | |
Indonesia Government International Bond
5.125%, due 1/15/45 (a) | | | 1,500,000 | | | | 1,664,507 | |
| | | | | | | | |
| | | | |
| 12 | | MainStay Emerging Markets Debt Fund | | The notes to the financial statements are an integral part of,
and should be read in conjunction with, the financial statements. |
| | | | | | | | |
| | | Principal
Amount | | | Value | |
| Foreign Government Bonds (continued) | |
Ivory Coast 1.8% | | | | | | | | |
Ivory Coast Government International Bond | | | | | | | | |
Series Reg S | | | | | | | | |
5.75%, due 12/31/32 (c) | | $ | 1,417,585 | | | $ | 1,397,625 | |
6.125%, due 6/15/33 (a) | | | 2,000,000 | | | | 1,972,200 | |
| | | | | | | | |
| | | | 3,369,825 | |
| | | | | | | | |
Kenya 0.6% | | | | | | | | |
Kenya Government International Bond
6.875%, due 6/24/24 (a) | | | 1,000,000 | | | | 1,039,200 | |
| | | | | | | | |
| | |
Mexico 0.8% | | | | | | | | |
Mexican Bonos
7.75%, due 11/13/42 | | MXN | 27,500,000 | | | | 1,464,381 | |
| | | | | | | | |
| | |
Nigeria 1.1% | | | | | | | | |
Nigeria Government International Bond Series Reg S
6.75%, due 1/28/21 | | $ | 2,000,000 | | | | 2,125,640 | |
| | | | | | | | |
| | |
Pakistan 1.5% | | | | | | | | |
Pakistan Government
International Bond
8.25%, due 9/30/25 (a) | | | 2,500,000 | | | | 2,804,928 | |
| | | | | | | | |
| | |
Paraguay 2.5% | | | | | | | | |
¨Paraguay Government International Bond
6.10%, due 8/11/44 (a) | | | 4,000,000 | | | | 4,570,000 | |
| | | | | | | | |
| | |
Peru 2.0% | | | | | | | | |
Peruvian Government International Bond
6.55%, due 3/14/37 | | | 2,800,000 | | | | 3,766,000 | |
| | | | | | | | |
| | |
Portugal 1.1% | | | | | | | | |
Portugal Government
International Bond
Series Reg S
5.125%, due 10/15/24 | | | 2,000,000 | | | | 2,117,280 | |
| | | | | | | | |
| | |
Russia 3.2% | | | | | | | | |
Russian Federal Bond-OFZ | | | | | | | | |
7.00%, due 1/25/23 | | RUB | 115,000,000 | | | | 1,940,881 | |
7.70%, due 3/23/33 | | | 120,000,000 | | | | 2,057,113 | |
Russian Federation
Series Reg S
4.75%, due 5/27/26 | | $ | 1,800,000 | | | | 1,900,008 | |
| | | | | | | | |
| | | | | | | 5,898,002 | |
| | | | | | | | |
| | | | | | | | |
| | | Principal
Amount | | | Value | |
Saudi Arabia 2.2% | | | | | | | | |
Saudi Government International Bond (a) | | | | | | | | |
4.50%, due 10/26/46 | | $ | 2,000,000 | | | $ | 2,003,496 | |
4.625%, due 10/4/47 | | | 2,000,000 | | | | 2,046,952 | |
| | | | | | | | |
| | | | | | | 4,050,448 | |
| | | | | | | | |
Senegal 0.8% | | | | | | | | |
Senegal Government International Bond
8.75%, due 5/13/21 (a) | | | 1,250,000 | | | | 1,446,425 | |
| | | | | | | | |
| | |
Sri Lanka 1.2% | | | | | | | | |
Sri Lanka Government International Bond Series Reg S
6.825%, due 7/18/26 | | | 2,000,000 | | | | 2,217,696 | |
| | | | | | | | |
| | |
Turkey 2.5% | | | | | | | | |
¨Turkey Government International Bond | | | | | | | | |
6.625%, due 2/17/45 | | | 2,000,000 | | | | 2,136,048 | |
7.375%, due 2/5/25 | | | 2,225,000 | | | | 2,550,687 | |
| | | | | | | | |
| | | | | | | 4,686,735 | |
| | | | | | | | |
Ukraine 2.2% | | | | | | | | |
Ukraine Government International Bond Series Reg S
7.75%, due 9/1/26 | | | 4,000,000 | | | | 4,124,240 | |
| | | | | | | | |
| | |
United Republic of Cameroon 0.6% | | | | | | | | |
Republic of Cameroon International Bond 9.50%, due 11/19/25 (a) | | | 1,000,000 | | | | 1,185,160 | |
| | | | | | | | |
| | |
Uruguay 2.3% | | | | | | | | |
Uruguay Government International Bond | | | | | | | | |
5.10%, due 6/18/50 | | | 2,000,000 | | | | 2,145,000 | |
7.625%, due 3/21/36 | | | 1,500,000 | | | | 2,118,750 | |
| | | | | | | | |
| | | | | | | 4,263,750 | |
| | | | | | | | |
Venezuela 1.3% | | | | | | | | |
Venezuela Government International Bond Series Reg S
9.25%, due 5/7/28 | | | 7,095,000 | | | | 2,341,350 | |
| | | | | | | | |
| | |
Vietnam 1.2% | | | | | | | | |
Vietnam Government International Bond Series Reg S
4.80%, due 11/19/24 | | | 2,000,000 | | | | 2,145,508 | |
| | | | | | | | |
Total Foreign Government Bonds
(Cost $91,343,285) | | | | | | | 94,577,946 | |
| | | | | | | | |
Total Long-Term Bonds
(Cost $174,728,479) | | | | | | | 179,988,238 | |
| | | | | | | | |
| | | | | | |
The notes to the financial statements are an integral part of,
and should be read in conjunction with, the financial statements. | | | | | 13 | |
Portfolio of Investments October 31, 2017 (continued)
| | | | | | | | |
| | | Principal
Amount | | | Value | |
| Short-Term Investment 1.8% | | | | | | | | |
Repurchase Agreement 1.8% | | | | | | | | |
Fixed Income Clearing Corp.
0.34%, dated 10/31/17
due 11/1/17
Proceeds at Maturity $3,340,536 (Collateralized by a United States Treasury Note with a rate of 1.625% and a maturity date of 4/30/23, with a Principal Amount of $3,490,000 and a Market Value of $3,407,929) | | $ | 3,340,505 | | | $ | 3,340,505 | |
| | | | | | | | |
Total Short-Term Investment
(Cost $3,340,505) | | | | | | | 3,340,505 | |
| | | | | | | | |
Total Investments
(Cost $178,068,984) | | | 98.6 | % | | | 183,328,743 | |
Other Assets, Less Liabilities | | | 1.4 | | | | 2,520,964 | |
Net Assets | | | 100.0 | % | | $ | 185,849,707 | |
| (a) | May be sold to institutional investors only under Rule 144A or securities offered pursuant to Section 4(a)(2) of the Securities Act of 1933, as amended. |
| (b) | Floating rate—Rate shown was the rate in effect as of October 31, 2017. |
| (c) | Step coupon—Rate shown was the rate in effect as of October 31, 2017. |
| The | following abbreviations are used in the preceding pages: |
As of October 31, 2017, the Fund held the following foreign currency forward contracts:
| | | | | | | | | | | | | | | | | | | | | | |
Foreign Currency Buy Contracts | | Settlement
Date | | | Counterparty | | Contract
Amount
Purchased | | | Contract
Amount
Sold | | | Unrealized
Appreciation
(Depreciation) | |
Turkish Lira vs. U.S. Dollar | | | 11/1/17 | | | JPMorgan Chase Bank N.A. | | | TRY | | | | 3,800,000 | | | $ | 1,045,697 | | | $ | (43,997 | ) |
| | | | | | |
| | | | | | | | | | | | | | | | | | | | | | |
Foreign Currency Sales Contracts | | | | | | | Contract
Amount
Sold | | | Contract
Amount
Purchased | | | | |
Turkish Lira vs. U.S. Dollar | | | 11/1/17 | | | JPMorgan Chase Bank N.A. | | | TRY | | | | 3,800,000 | | | $ | 1,012,534 | | | | 10,834 | |
Net unrealized appreciation (depreciation) on foreign currency forward contracts | | | $ | (33,163 | ) |
The following is a summary of the fair valuations according to the inputs used as of October 31, 2017, for valuing the Fund’s assets and liabilities.
Asset Valuation Inputs
| | | | | | | | | | | | | | | | |
Description | | Quoted
Prices in
Active
Markets for
Identical
Assets (Level 1) | | | Significant
Other
Observable
Inputs (Level 2) | | | Significant
Unobservable
Inputs (Level 3) | | | Total | |
| Investments in Securities (a) | | | | | | | | | | | | | | | | |
| Long-Term Bonds | | | | | | | | | | | | | | | | |
Corporate Bonds | | $ | — | | | $ | 85,410,292 | | | $ | — | | | $ | 85,410,292 | |
Foreign Government Bonds | | | — | | | | 94,577,946 | | | | — | | | | 94,577,946 | |
| | | | | | | | | | | | | | | | |
| Total Long-Term Bonds | | | — | | | | 179,988,238 | | | | — | | | | 179,988,238 | |
| | | | | | | | | | | | | | | | |
| Short-Term Investment | | | | | | | | | | | | | | | | |
Repurchase Agreement | | | — | | | | 3,340,505 | | | | — | | | | 3,340,505 | |
| | | | | | | | | | | | | | | | |
| Total Investments in Securities | | | — | | | | 183,328,743 | | | | — | | | | 183,328,743 | |
| | | | | | | | | | | | | | | | |
| Other Financial Instruments | | | | | | | | | | | | | | | | |
Foreign Currency Forward Contracts (b) | | | — | | | | 10,834 | | | | — | | | | 10,834 | |
| | | | | | | | | | | | | | | | |
| Total Investments in Securities and Other Financial Instruments | | $ | — | | | $ | 183,339,577 | | | $ | — | | | $ | 183,339,577 | |
| | | | | | | | | | | | | | | | |
| | | | |
| 14 | | MainStay Emerging Markets Debt Fund | | The notes to the financial statements are an integral part of,
and should be read in conjunction with, the financial statements. |
Liability Valuation Inputs
| | | | | | | | | | | | | | | | |
Description | | Quoted
Prices in
Active
Markets for
Identical
Assets (Level 1) | | | Significant
Other
Observable
Inputs (Level 2) | | | Significant
Unobservable
Inputs (Level 3) | | | Total | |
| Other Financial Instruments | | | | | | | | | | | | | | | | |
Foreign Currency Forward Contracts (b) | | $ | — | | | $ | (43,997 | ) | | $ | — | | | $ | (43,997 | ) |
| | | | | | | | | | | | | | | | |
| (a) | For a complete listing of investments and their industries, see the Portfolio of Investments. |
| (b) | The value listed for these securities reflects unrealized appreciation (depreciation) as shown on the Portfolio of Investments. |
The Fund recognizes transfers between the levels as of the beginning of the period.
For the year ended October 31, 2017, the Fund did not have any transfers among levels. (See Note 2)
As of October 31, 2017, the Fund did not hold any investments with significant unobservable inputs (Level 3). (See Note 2)
| | | | | | |
The notes to the financial statements are an integral part of,
and should be read in conjunction with, the financial statements. | | | | | 15 | |
Statement of Assets and Liabilities as of October 31, 2017
| | | | |
| Assets | | | | |
Investment in securities, at value (identified cost $178,068,984) | | $ | 183,328,743 | |
Cash denominated in foreign currencies (identified cost $222,602) | | | 227,918 | |
Receivables: | | | | |
Interest | | | 2,731,687 | |
Fund shares sold | | | 77,531 | |
Other assets | | | 33,746 | |
Unrealized appreciation on foreign currency forward contracts | | | 10,834 | |
| | | | |
Total assets | | | 186,410,459 | |
| | | | |
| |
| Liabilities | | | | |
Payables: | | | | |
Fund shares redeemed | | | 236,051 | |
Manager (See Note 3) | | | 116,355 | |
NYLIFE Distributors (See Note 3) | | | 56,966 | |
Transfer agent (See Note 3) | | | 28,481 | |
Shareholder communication | | | 21,878 | |
Professional fees | | | 8,601 | |
Custodian | | | 1,084 | |
Trustees | | | 468 | |
Accrued expenses | | | 5,672 | |
Dividend payable | | | 41,199 | |
Unrealized depreciation on foreign currency forward contracts | | | 43,997 | |
| | | | |
Total liabilities | | | 560,752 | |
| | | | |
Net assets | | $ | 185,849,707 | |
| | | | |
| |
| Composition of Net Assets | | | | |
Shares of beneficial interest outstanding (par value of $.01 per share) unlimited number of shares authorized | | $ | 171,143 | |
Additional paid-in capital | | | 189,757,522 | |
| | | | |
| | | 189,928,665 | |
Distributions in excess of net investment income | | | (41,199 | ) |
Accumulated net realized gain (loss) on investments and foreign currency transactions | | | (9,157,901 | ) |
Net unrealized appreciation (depreciation) on investments | | | 5,259,759 | |
Net unrealized appreciation (depreciation) on translation of other assets and liabilities in foreign currencies and foreign currency forward contracts | | | (139,617 | ) |
| | | | |
Net assets | | $ | 185,849,707 | |
| | | | |
| | | | |
Class A | | | | |
Net assets applicable to outstanding shares | | $ | 110,237,610 | |
| | | | |
Shares of beneficial interest outstanding | | | 10,129,736 | |
| | | | |
Net asset value per share outstanding | | $ | 10.88 | |
Maximum sales charge (4.50% of offering price) | | | 0.51 | |
| | | | |
Maximum offering price per share outstanding | | $ | 11.39 | |
| | | | |
Investor Class | | | | |
Net assets applicable to outstanding shares | | $ | 18,613,353 | |
| | | | |
Shares of beneficial interest outstanding | | | 1,694,744 | |
| | | | |
Net asset value per share outstanding | | $ | 10.98 | |
Maximum sales charge (4.50% of offering price) | | | 0.52 | |
| | | | |
Maximum offering price per share outstanding | | $ | 11.50 | |
| | | | |
Class B | | | | |
Net assets applicable to outstanding shares | | $ | 6,012,076 | |
| | | | |
Shares of beneficial interest outstanding | | | 562,660 | |
| | | | |
Net asset value and offering price per share outstanding | | $ | 10.69 | |
| | | | |
Class C | | | | |
Net assets applicable to outstanding shares | | $ | 28,270,152 | |
| | | | |
Shares of beneficial interest outstanding | | | 2,642,184 | |
| | | | |
Net asset value and offering price per share outstanding | | $ | 10.70 | |
| | | | |
Class I | | | | |
Net assets applicable to outstanding shares | | $ | 22,716,516 | |
| | | | |
Shares of beneficial interest outstanding | | | 2,084,957 | |
| | | | |
Net asset value and offering price per share outstanding | | $ | 10.90 | |
| | | | |
| | | | |
| 16 | | MainStay Emerging Markets Debt Fund | | The notes to the financial statements are an integral part of,
and should be read in conjunction with, the financial statements. |
Statement of Operations for the year ended October 31, 2017
| | | | |
| Investment Income (Loss) | |
Income | | | | |
Interest | | $ | 11,302,491 | |
Other income | | | 185 | |
| | | | |
Total income | | | 11,302,676 | |
| | | | |
Expenses | | | | |
Manager (See Note 3) | | | 1,308,228 | |
Distribution/Service—Class A (See Note 3) | | | 257,119 | |
Distribution/Service—Investor Class (See Note 3) | | | 62,789 | |
Distribution/Service—Class B (See Note 3) | | | 67,013 | |
Distribution/Service—Class C (See Note 3) | | | 308,728 | |
Transfer agent (See Note 3) | | | 344,404 | |
Registration | | | 86,562 | |
Professional fees | | | 71,788 | |
Shareholder communication | | | 40,442 | |
Custodian | | | 8,785 | |
Trustees | | | 4,361 | |
Miscellaneous | | | 13,864 | |
| | | | |
Total expenses | | | 2,574,083 | |
| | | | |
Net investment income (loss) | | | 8,728,593 | |
| | | | |
|
| Realized and Unrealized Gain (Loss) on Investments and Foreign Currency Transactions | |
Net realized gain (loss) on: | | | | |
Investment transactions | | | (1,136,498 | ) |
Foreign currency forward transactions | | | 231,962 | |
Foreign currency transactions | | | (62,396 | ) |
| | | | |
Net realized gain (loss) on investments and foreign currency transactions | | | (966,932 | ) |
| | | | |
Net change in unrealized appreciation (depreciation) on: | | | | |
Investments | | | 5,511,224 | |
Foreign currency forward contracts | | | (127,768 | ) |
Translation of other assets and liabilities in foreign currencies | | | (113,102 | ) |
| | | | |
Net change in unrealized appreciation (depreciation) on investments and foreign currency transactions | | | 5,270,354 | |
| | | | |
Net realized and unrealized gain (loss) on investments and foreign currency transactions | | | 4,303,422 | |
| | | | |
Net increase (decrease) in net assets resulting from operations | | $ | 13,032,015 | |
| | | | |
| | | | | | |
The notes to the financial statements are an integral part of,
and should be read in conjunction with, the financial statements. | | | | | 17 | |
Statements of Changes in Net Assets
for the years ended October 31, 2017 and October 31, 2016
| | | | | | | | |
| | | 2017 | | | 2016 | |
| Increase (Decrease) in Net Assets | |
Operations: | | | | | | | | |
Net investment income (loss) | | $ | 8,728,593 | | | $ | 10,169,036 | |
Net realized gain (loss) on investments and foreign currency transactions | | | (966,932 | ) | | | (4,852,435 | ) |
Net change in unrealized appreciation (depreciation) on investments and foreign currency transactions | | | 5,270,354 | | | | 20,862,473 | |
| | | | |
Net increase (decrease) in net assets resulting from operations | | | 13,032,015 | | | | 26,179,074 | |
| | | | |
Dividends and distributions to shareholders: | | | | | | | | |
From net investment income: | | | | | | | | |
Class A | | | (3,566,533 | ) | | | (3,052,218 | ) |
Investor Class | | | (810,566 | ) | | | (720,130 | ) |
Class B | | | (187,544 | ) | | | (159,726 | ) |
Class C | | | (864,275 | ) | | | (761,686 | ) |
Class I | | | (522,156 | ) | | | (461,915 | ) |
| | | | |
| | | (5,951,074 | ) | | | (5,155,675 | ) |
| | | | |
Return of capital: | | | | | | | | |
Class A | | | (1,043,496 | ) | | | (2,444,690 | ) |
Investor Class | | | (237,155 | ) | | | (614,458 | ) |
Class B | | | (54,872 | ) | | | (178,909 | ) |
Class C | | | (252,869 | ) | | | (856,147 | ) |
Class I | | | (152,773 | ) | | | (323,340 | ) |
| | | | |
| | | (1,741,165 | ) | | | (4,417,544 | ) |
| | | | |
Total dividends and distributions to shareholders | | | (7,692,239 | ) | | | (9,573,219 | ) |
| | | | |
Capital share transactions: | | | | | | | | |
Net proceeds from sale of shares | | | 43,693,093 | | | | 57,677,054 | |
Net asset value of shares issued to shareholders in reinvestment of dividends and distributions | | | 6,890,905 | | | | 8,162,955 | |
Cost of shares redeemed | | | (69,102,669 | ) | | | (69,864,186 | ) |
| | | | |
Increase (decrease) in net assets derived from capital share transactions | | | (18,518,671 | ) | | | (4,024,177 | ) |
| | | | |
Net increase (decrease) in net assets | | | (13,178,895 | ) | | | 12,581,678 | |
| | |
| Net Assets | | | | | | | | |
Beginning of year | | | 199,028,602 | | | | 186,446,924 | |
| | | | |
End of year | | $ | 185,849,707 | | | $ | 199,028,602 | |
| | | | |
Distributions in excess of net investment income at end of year | | $ | (41,199 | ) | | $ | (87,026 | ) |
| | | | |
| | | | |
| 18 | | MainStay Emerging Markets Debt Fund | | The notes to the financial statements are an integral part of,
and should be read in conjunction with, the financial statements. |
Financial Highlights selected per share data and ratios
| | | | | | | | | | | | | | | | | | | | |
| | | Year ended October 31, | |
| Class A | | 2017 | | | 2016 | | | 2015 | | | 2014 | | | 2013 | |
Net asset value at beginning of year | | $ | 10.52 | | | $ | 9.60 | | | $ | 11.38 | | | $ | 11.52 | | | $ | 12.62 | |
| | | | | | | | | | | | | | | | | | | | |
Net investment income (loss) (a) | | | 0.53 | | | | 0.57 | | | | 0.62 | | | | 0.68 | | | | 0.68 | |
Net realized and unrealized gain (loss) on investments | | | 0.31 | | | | 0.87 | | | | (1.51 | ) | | | (0.14 | ) | | | (0.93 | ) |
Net realized and unrealized gain (loss) on foreign currency transactions | | | (0.01 | ) | | | 0.01 | | | | 0.02 | | | | (0.00 | )‡ | | | 0.01 | |
| | | | | | | | | | | | | | | | | | | | |
Total from investment operations | | | 0.83 | | | | 1.45 | | | | (0.87 | ) | | | 0.54 | | | | (0.24 | ) |
| | | | | | | | | | | | | | | | | | | | |
| Less dividends and distributions: | | | | | | | | | | | | | | | | | | | | |
From net investment income | | | (0.36 | ) | | | (0.29 | ) | | | (0.63 | ) | | | (0.65 | ) | | | (0.86 | ) |
From net realized gain on investments | | | — | | | | — | | | | (0.22 | ) | | | (0.03 | ) | | | — | |
Return of capital | | | (0.11 | ) | | | (0.24 | ) | | | (0.06 | ) | | | — | | | | — | |
| | | | | | | | | | | | | | | | | | | | |
Total dividends and distributions | | | (0.47 | ) | | | (0.53 | ) | | | (0.91 | ) | | | (0.68 | ) | | | (0.86 | ) |
| | | | | | | | | | | | | | | | | | | | |
Net asset value at end of year | | $ | 10.88 | | | $ | 10.52 | | | $ | 9.60 | | | $ | 11.38 | | | $ | 11.52 | |
| | | | | | | | | | | | | | | | | | | | |
Total investment return (b) | | | 8.18 | % | | | 15.63 | % | | | (7.54 | %) | | | 4.85 | % | | | (1.98 | %) |
| Ratios (to average net assets)/Supplemental Data: | | | | | | | | | | | | | | | | | | | | |
Net investment income (loss) | | | 5.04 | % | | | 5.70 | %(c) | | | 6.18 | % | | | 5.88 | % | | | 5.58 | % |
Net expenses | | | 1.22 | % | | | 1.22 | %(d) | | | 1.23 | % | | | 1.17 | % | | | 1.16 | % |
Portfolio turnover rate | | | 37 | % | | | 38 | % | | | 19 | % | | | 20 | % | | | 36 | % |
Net assets at end of year (in 000’s) | | $ | 110,238 | | | $ | 109,657 | | | $ | 98,573 | | | $ | 132,654 | | | $ | 152,832 | |
| ‡ | Less than one cent per share. |
| (a) | Per share data based on average shares outstanding during the year. |
| (b) | Total investment return is calculated exclusive of sales charges and assumes the reinvestment of dividends and distributions. For periods of less than one year, total return is not annualized. |
| (c) | Without the custody fee reimbursement, net investment income (loss) would have been 5.69%. |
| (d) | Without the custody fee reimbursement, net expenses would have been 1.23%. |
| | | | | | | | | | | | | | | | | | | | |
| | | Year ended October 31, | |
| Investor Class | | 2017 | | | 2016 | | | 2015 | | | 2014 | | | 2013 | |
Net asset value at beginning of year | | $ | 10.61 | | | $ | 9.68 | | | $ | 11.46 | | | $ | 11.60 | | | $ | 12.71 | |
| | | | | | | | | | | | | | | | | | | | |
Net investment income (loss) (a) | | | 0.52 | | | | 0.55 | | | | 0.61 | | | | 0.66 | | | | 0.67 | |
Net realized and unrealized gain (loss) on investments | | | 0.31 | | | | 0.88 | | | | (1.52 | ) | | | (0.14 | ) | | | (0.94 | ) |
Net realized and unrealized gain (loss) on foreign currency transactions | | | (0.01 | ) | | | 0.01 | | | | 0.02 | | | | (0.00 | )‡ | | | 0.01 | |
| | | | | | | | | | | | | | | | | | | | |
Total from investment operations | | | 0.82 | | | | 1.44 | | | | (0.89 | ) | | | 0.52 | | | | (0.26 | ) |
| | | | | | | | | | | | | | | | | | | | |
| Less dividends and distributions: | | | | | | | | | | | | | | | | | | | | |
From net investment income | | | (0.35 | ) | | | (0.27 | ) | | | (0.61 | ) | | | (0.63 | ) | | | (0.85 | ) |
From net realized gain on investments | | | — | | | | — | | | | (0.22 | ) | | | (0.03 | ) | | | — | |
Return of capital | | | (0.10 | ) | | | (0.24 | ) | | | (0.06 | ) | | | — | | | | — | |
| | | | | | | | | | | | | | | | | | | | |
Total dividends and distributions | | | (0.45 | ) | | | (0.51 | ) | | | (0.89 | ) | | | (0.66 | ) | | | (0.85 | ) |
| | | | | | | | | | | | | | | | | | | | |
Net asset value at end of year | | $ | 10.98 | | | $ | 10.61 | | | $ | 9.68 | | | $ | 11.46 | | | $ | 11.60 | |
| | | | | | | | | | | | | | | | | | | | |
Total investment return (b) | | | 7.99 | % | | | 15.38 | % | | | (7.66 | %) | | | 4.64 | % | | | (2.18 | %) |
| Ratios (to average net assets)/Supplemental Data: | | | | | | | | | | | | | | | | | | | | |
Net investment income (loss) | | | 4.86 | % | | | 5.50 | %(c) | | | 6.01 | % | | | 5.71 | % | | | 5.49 | % |
Net expenses | | | 1.42 | % | | | 1.42 | %(d) | | | 1.41 | % | | | 1.34 | % | | | 1.30 | % |
Portfolio turnover rate | | | 37 | % | | | 38 | % | | | 19 | % | | | 20 | % | | | 36 | % |
Net assets at end of year (in 000’s) | | $ | 18,613 | | | $ | 32,318 | | | $ | 25,130 | | | $ | 27,033 | | | $ | 27,918 | |
| ‡ | Less than one cent per share. |
| (a) | Per share data based on average shares outstanding during the year. |
| (b) | Total investment return is calculated exclusive of sales charges and assumes the reinvestment of dividends and distributions. For periods of less than one year, total return is not annualized. |
| (c) | Without the custody fee reimbursement, net investment income (loss) would have been 5.49%. |
| (d) | Without the custody fee reimbursement, net expenses would have been 1.43%. |
| | | | | | |
The notes to the financial statements are an integral part of,
and should be read in conjunction with, the financial statements. | | | | | 19 | |
Financial Highlights selected per share data and ratios
| | | | | | | | | | | | | | | | | | | | |
| | | Year ended October 31, | |
| Class B | | 2017 | | | 2016 | | | 2015 | | | 2014 | | | 2013 | |
Net asset value at beginning of year | | $ | 10.34 | | | $ | 9.44 | | | $ | 11.20 | | | $ | 11.35 | | | $ | 12.45 | |
| | | | | | | | | | | | | | | | | | | | |
Net investment income (loss) (a) | | | 0.43 | | | | 0.47 | | | | 0.52 | | | | 0.56 | | | | 0.56 | |
Net realized and unrealized gain (loss) on investments | | | 0.30 | | | | 0.86 | | | | (1.48 | ) | | | (0.13 | ) | | | (0.91 | ) |
Net realized and unrealized gain (loss) on foreign currency transactions | | | (0.01 | ) | | | 0.01 | | | | 0.02 | | | | (0.00 | )‡ | | | 0.01 | |
| | | | | | | | | | | | | | | | | | | | |
Total from investment operations | | | 0.72 | | | | 1.34 | | | | (0.94 | ) | | | 0.43 | | | | (0.34 | ) |
| | | | | | | | | | | | | | | | | | | | |
| Less dividends and distributions: | | | | | | | | | | | | | | | | | | | | |
From net investment income | | | (0.29 | ) | | | (0.20 | ) | | | (0.54 | ) | | | (0.55 | ) | | | (0.76 | ) |
From net realized gain on investments | | | — | | | | — | | | | (0.22 | ) | | | (0.03 | ) | | | — | |
Return of capital | | | (0.08 | ) | | | (0.24 | ) | | | (0.06 | ) | | | — | | | | — | |
| | | | | | | | | | | | | | | | | | | | |
Total dividends and distributions | | | (0.37 | ) | | | (0.44 | ) | | | (0.82 | ) | | | (0.58 | ) | | | (0.76 | ) |
| | | | | | | | | | | | | | | | | | | | |
Net asset value at end of year | | $ | 10.69 | | | $ | 10.34 | | | $ | 9.44 | | | $ | 11.20 | | | $ | 11.35 | |
| | | | | | | | | | | | | | | | | | | | |
Total investment return (b) | | | 7.20 | % | | | 14.60 | % | | | (8.36 | %) | | | 3.87 | % | | | (2.89 | %) |
| Ratios (to average net assets)/Supplemental Data: | | | | | | | | | | | | | | | | | | | | |
Net investment income (loss) | | | 4.11 | % | | | 4.78 | %(c) | | | 5.24 | % | | | 4.97 | % | | | 4.70 | % |
Net expenses | | | 2.17 | % | | | 2.17 | %(d) | | | 2.16 | % | | | 2.09 | % | | | 2.05 | % |
Portfolio turnover rate | | | 37 | % | | | 38 | % | | | 19 | % | | | 20 | % | | | 36 | % |
Net assets at end of year (in 000’s) | | $ | 6,012 | | | $ | 7,506 | | | $ | 8,111 | | | $ | 12,109 | | | $ | 15,290 | |
| ‡ | Less than one cent per share. |
| (a) | Per share data based on average shares outstanding during the year. |
| (b) | Total investment return is calculated exclusive of sales charges and assumes the reinvestment of dividends and distributions. For periods of less than one year, total return is not annualized. |
| (c) | Without the custody fee reimbursement, net investment income (loss) would have been 4.77%. |
| (d) | Without the custody fee reimbursement, net expenses would have been 2.18%. |
| | | | | | | | | | | | | | | | | | | | |
| | | Year ended October 31, | |
| Class C | | 2017 | | | 2016 | | | 2015 | | | 2014 | | | 2013 | |
Net asset value at beginning of year | | $ | 10.35 | | | $ | 9.45 | | | $ | 11.22 | | | $ | 11.37 | | | $ | 12.46 | |
| | | | | | | | | | | | | | | | | | | | |
Net investment income (loss) (a) | | | 0.43 | | | | 0.47 | | | | 0.52 | | | | 0.56 | | | | 0.56 | |
Net realized and unrealized gain (loss) on investments | | | 0.29 | | | | 0.86 | | | | (1.49 | ) | | | (0.13 | ) | | | (0.90 | ) |
Net realized and unrealized gain (loss) on foreign currency transactions | | | (0.00 | )‡ | | | 0.01 | | | | 0.02 | | | | (0.00 | )‡ | | | 0.01 | |
| | | | | | | | | | | | | | | | | | | | |
Total from investment operations | | | 0.72 | | | | 1.34 | | | | (0.95 | ) | | | 0.43 | | | | (0.33 | ) |
| | | | | | | | | | | | | | | | | | | | |
| Less dividends and distributions: | | | | | | | | | | | | | | | | | | | | |
From net investment income | | | (0.29 | ) | | | (0.20 | ) | | | (0.54 | ) | | | (0.55 | ) | | | (0.76 | ) |
From net realized gain on investments | | | — | | | | — | | | | (0.22 | ) | | | (0.03 | ) | | | — | |
Return of capital | | | (0.08 | ) | | | (0.24 | ) | | | (0.06 | ) | | | — | | | | — | |
| | | | | | | | | | | | | | | | | | | | |
Total dividends and distributions | | | (0.37 | ) | | | (0.44 | ) | | | (0.82 | ) | | | (0.58 | ) | | | (0.76 | ) |
| | | | | | | | | | | | | | | | | | | | |
Net asset value at end of year | | $ | 10.70 | | | $ | 10.35 | | | $ | 9.45 | | | $ | 11.22 | | | $ | 11.37 | |
| | | | | | | | | | | | | | | | | | | | |
Total investment return (b) | | | 7.19 | % | | | 14.58 | % | | | (8.43 | %) | | | 3.87 | % | | | (2.80 | %) |
| Ratios (to average net assets)/Supplemental Data: | | | | | | | | | | | | | | | | | | | | |
Net investment income (loss) | | | 4.11 | % | | | 4.77 | %(c) | | | 5.24 | % | | | 4.97 | % | | | 4.69 | % |
Net expenses | | | 2.17 | % | | | 2.17 | %(d) | | | 2.16 | % | | | 2.09 | % | | | 2.05 | % |
Portfolio turnover rate | | | 37 | % | | | 38 | % | | | 19 | % | | | 20 | % | | | 36 | % |
Net assets at end of year (in 000’s) | | $ | 28,270 | | | $ | 35,789 | | | $ | 37,808 | | | $ | 56,199 | | | $ | 68,629 | |
| ‡ | Less than one cent per share. |
| (a) | Per share data based on average shares outstanding during the year. |
| (b) | Total investment return is calculated exclusive of sales charges and assumes the reinvestment of dividends and distributions. For periods of less than one year, total return is not annualized. |
| (c) | Without the custody fee reimbursement, net investment income (loss) would have been 4.76%. |
| (d) | Without the custody fee reimbursement, net expenses would have been 2.18%. |
| | | | |
| 20 | | MainStay Emerging Markets Debt Fund | | The notes to the financial statements are an integral part of,
and should be read in conjunction with, the financial statements. |
Financial Highlights selected per share data and ratios
| | | | | | | | | | | | | | | | | | | | |
| | | Year ended October 31, | |
| Class I | | 2017 | | | 2016 | | | 2015 | | | 2014 | | | 2013 | |
Net asset value at beginning of year | | $ | 10.53 | | | $ | 9.61 | | | $ | 11.39 | | | $ | 11.53 | | | $ | 12.63 | |
| | | | | | | | | | | | | | | | | | | | |
Net investment income (loss) (a) | | | 0.56 | | | | 0.59 | | | | 0.65 | | | | 0.71 | | | | 0.71 | |
Net realized and unrealized gain (loss) on investments | | | 0.32 | | | | 0.88 | | | | (1.52 | ) | | | (0.14 | ) | | | (0.93 | ) |
Net realized and unrealized gain (loss) on foreign currency transactions | | | (0.01 | ) | | | 0.01 | | | | 0.02 | | | | (0.00 | )‡ | | | 0.01 | |
| | | | | | | | | | | | | | | | | | | | |
Total from investment operations | | | 0.87 | | | | 1.48 | | | | (0.85 | ) | | | 0.57 | | | | (0.21 | ) |
| | | | | | | | | | | | | | | | | | | | |
| Less dividends and distributions: | | | | | | | | | | | | | | | | | | | | |
From net investment income | | | (0.39 | ) | | | (0.32 | ) | | | (0.65 | ) | | | (0.68 | ) | | | (0.89 | ) |
From net realized gain on investments | | | — | | | | — | | | | (0.22 | ) | | | (0.03 | ) | | | — | |
Return of capital | | | (0.11 | ) | | | (0.24 | ) | | | (0.06 | ) | | | — | | | | — | |
| | | | | | | | | | | | | | | | | | | | |
Total dividends and distributions | | | (0.50 | ) | | | (0.56 | ) | | | (0.93 | ) | | | (0.71 | ) | | | (0.89 | ) |
| | | | | | | | | | | | | | | | | | | | |
Net asset value at end of year | | $ | 10.90 | | | $ | 10.53 | | | $ | 9.61 | | | $ | 11.39 | | | $ | 11.53 | |
| | | | | | | | | | | | | | | | | | | | |
Total investment return (b) | | | 8.54 | % | | | 15.90 | % | | | (7.30 | %) | | | 5.11 | % | | | (1.73 | %) |
| Ratios (to average net assets)/Supplemental Data: | | | | | | | | | | | | | | | | | | | | |
Net investment income (loss) | | | 5.22 | % | | | 5.96 | %(c) | | | 6.38 | % | | | 6.13 | % | | | 5.86 | % |
Net expenses | | | 0.97 | % | | | 0.97 | %(d) | | | 0.98 | % | | | 0.92 | % | | | 0.91 | % |
Portfolio turnover rate | | | 37 | % | | | 38 | % | | | 19 | % | | | 20 | % | | | 36 | % |
Net assets at end of year (in 000’s) | | $ | 22,717 | | | $ | 13,759 | | | $ | 16,825 | | | $ | 41,174 | | | $ | 43,678 | |
| ‡ | Less than one cent per share. |
| (a) | Per share data based on average shares outstanding during the year. |
| (b) | Total investment return is calculated exclusive of sales charges and assumes the reinvestment of dividends and distributions. Class I shares are not subject to sales charges. For periods of less than one year, total return is not annualized. |
| (c) | Without the custody fee reimbursement, net investment income (loss) would have been 5.95%. |
| (d) | Without the custody fee reimbursement, net expenses would have been 0.98%. |
| | | | | | |
The notes to the financial statements are an integral part of,
and should be read in conjunction with, the financial statements. | | | | | 21 | |
Notes to Financial Statements
Note 1–Organization and Business
The MainStay Funds (the “Trust”) was organized on January 9, 1986, as a Massachusetts business trust, and is governed by a Declaration of Trust. The Trust is registered under the Investment Company Act of 1940, as amended (the “1940 Act”), as an open-end management investment company, and is comprised of twelve funds (collectively referred to as the “Funds”). These financial statements and notes relate to the MainStay Emerging Markets Debt Fund (formerly known as MainStay Global High Income Fund (the “Fund”), a “diversified fund” as that term is defined in the 1940 Act as interpreted or modified by regulatory authorities having jurisdiction, from time to time.
The Fund currently has seven classes of shares registered for sale. Class A and Class B shares commenced operations on June 1, 1998. Class C shares commenced operations on September 1, 1998. Class I shares commenced operations on August 31, 2007. Investor Class shares commenced operations on February 28, 2008. Class R6 and Class T shares were registered for sale effective as of February 28, 2017. As of the year ended October 31, 2017, Class R6 and Class T shares were not yet offered for sale. Effective February 28, 2017, Class B shares of the MainStay Group of Funds were closed to all new purchases as well as additional investments by existing Class B shareholders. Existing Class B shareholders may continue to reinvest dividends and capital gains distributions, as well as exchange their Class B shares for Class B shares of other MainStay Group of Funds as permitted by the current exchange privileges. Class B shareholders continue to be subject to any applicable contingent deferred sales charge (“CDSC”) at the time of redemption. All other features of the Class B shares, including but not limited to the fees and expenses applicable to Class B shares, remain unchanged. Unless redeemed, Class B shareholders will remain in Class B shares of their respective fund until the Class B shares are converted to Class A or Investor Class shares pursuant to the applicable conversion schedule.
Class A and Investor Class shares are offered at net asset value (“NAV”) per share plus an initial sales charge. No initial sales charge applies to investments of $1 million or more (and certain other qualified purchases) in Class A and Investor Class shares. Effective August 1, 2017, a CDSC of 1.00% may be imposed on certain redemptions of Class A and Investor Class shares made within 18 months of the date of purchase on shares that were purchased without an initial sales charge. For purchases of Class A and Investor Class shares made from January 1, 2017, through July 31, 2017, a CDSC of 1.00% may be imposed on certain redemptions of such shares made within 24 months of the date of purchase on shares that were purchased without an initial sales charge. For purchases of Class A and Investor Class shares made prior to January 1, 2017, a CDSC of 1.00% may be imposed on certain redemptions of such shares made within one year of the date of purchase on shares that were purchased without an initial sales charge. Class C shares are offered at NAV without an initial sales charge, although a 1.00% CDSC may be imposed on redemptions made within one year of the date of purchase of Class C shares. When Class B shares were offered, they were offered at NAV without an initial sales charge, although a CDSC that declines depending on the number of years a shareholder has held its Class B shares may be imposed on redemptions made within six years of the date of purchase of such shares. Class T shares are currently expected to be offered at NAV plus
an initial sales charge. Class I shares are offered at NAV and are not subject to a sales charge. Class R6 shares are currently expected to be offered at NAV and to not be subject to a sales charge. Depending upon eligibility, Class B shares convert to either Class A or Investor Class shares at the end of the calendar quarter eight years after the date they were purchased. Additionally, as disclosed in the Fund’s prospectus, Class A shares may convert automatically to Investor Class shares and Investor Class shares may convert automatically to Class A shares. Under certain circumstances and as may be permitted by the Trust’s multiple class plan pursuant to Rule 18f-3 under the 1940 Act, specified share classes of the Fund may be converted to one or more other share classes of the Fund as disclosed in the capital share transactions within these Notes. The classes of shares have the same voting (except for issues that relate solely to one class), dividend, liquidation and other rights, and the same terms and conditions, except that under distribution plans pursuant to Rule 12b-1 under the 1940 Act, Class B and Class C shares are subject to higher distribution and/or service fees than Class A, Investor Class and Class T shares. Class I and Class R6 shares are not subject to a distribution and/or service fee.
The Fund’s investment objective is to seek maximum current income by investing in high-yield debt securities of non-U.S. issuers. Capital appreciation is a secondary objective.
Note 2–Significant Accounting Policies
The Fund is an investment company and accordingly follows the investment company accounting and reporting guidance of the Financial Accounting Standards Board (“FASB”) Accounting Standard Codification Topic 946 Financial Services—Investment Companies. The Fund prepares its financial statements in accordance with generally accepted accounting principles (“GAAP”) in the United States of America and follows the significant accounting policies described below.
(A) Securities Valuation. Investments are usually valued as of the close of regular trading on the New York Stock Exchange (the “Exchange”) (usually 4:00 p.m. Eastern time) on each day the Fund is open for business (“valuation date”).
The Board of Trustees of the Trust (the “Board”) adopted procedures establishing methodologies for the valuation of the Fund’s securities and other assets and delegated the responsibility for valuation determinations under those procedures to the Valuation Committee of the Trust (the “Valuation Committee”). The Board authorized the Valuation Committee to appoint a Valuation Subcommittee (the “Subcommittee”) to deal in the first instance with establishing the prices of securities for which market quotations are not readily available or the prices of which are not otherwise readily determinable under these procedures. The Subcommittee meets (in person, via electronic mail or via teleconference) on an as-needed basis. Subsequently, the Valuation Committee meets to ensure that actions taken by the Subcommittee were appropriate. The procedures state that, subject to the oversight of the Board and unless otherwise noted, the responsibility for the day-to-day valuation of portfolio assets (including fair value measurements for the Fund’s assets and liabilities) rests with New York Life Investment Management LLC (“New York Life Investments” or the “Manager”), aided to whatever extent necessary by the Subadvisor (as defined in Note 3(A)).
| | |
| 22 | | MainStay Emerging Markets Debt Fund |
To assess the appropriateness of security valuations, the Manager, the Subadvisor or the Fund’s third-party service provider, who is subject to oversight by the Manager, regularly compares prior day prices, prices on comparable securities and the sale prices to the prior and current day prices and challenges prices with changes exceeding certain tolerance levels with third-party pricing services or broker sources. For those securities valued through either a standardized fair valuation methodology or a fair valuation measurement, the Subcommittee deals in the first instance with such valuation and the Valuation Committee reviews and affirms, if appropriate, the reasonableness of the valuation based on such methodologies and measurements on a regular basis after considering information that is reasonably available and deemed relevant by the Valuation Committee. Any action taken by the Subcommittee with respect to the valuation of a portfolio security or other asset is submitted for review and ratification (if appropriate) to the Valuation Committee and the Board at the next regularly scheduled meeting.
“Fair value” is defined as the price the Fund would reasonably expect to receive upon selling an asset or liability in an orderly transaction to an independent buyer in the principal or most advantageous market for the asset or liability. Fair value measurements are determined within a framework that establishes a three-tier hierarchy which maximizes the use of observable market data and minimizes the use of unobservable inputs to establish a classification of fair value measurements for disclosure purposes. “Inputs” refer broadly to the assumptions that market participants would use in pricing the asset or liability, including assumptions about risk, such as the risk inherent in a particular valuation technique used to measure fair value using a pricing model and/or the risk inherent in the inputs for the valuation technique. Inputs may be observable or unobservable. Observable inputs reflect the assumptions market participants would use in pricing the asset or liability based on market data obtained from sources independent of the Fund. Unobservable inputs reflect the Fund’s own assumptions about the assumptions market participants would use in pricing the asset or liability based on the information available. The inputs or methodology used for valuing assets or liabilities may not be an indication of the risks associated with investing in those assets or liabilities. The three-tier hierarchy of inputs is summarized below.
| • | | Level 1—quoted prices in active markets for an identical asset or liability |
| • | | Level 2—other significant observable inputs (including quoted prices for a similar asset or liability in active markets, interest rates and yield curves, prepayment speeds, credit risk, etc.) |
| • | | Level 3—significant unobservable inputs (including the Fund’s own assumptions about the assumptions that market participants would use in measuring fair value of an asset or liability) |
The level of an asset or liability within the fair value hierarchy is based on the lowest level of an input, both individually and in the aggregate, that is significant to the fair value measurement. As of October 31, 2017, the aggregate value by input level of the Fund’s assets and liabilities is included at the end of the Fund’s Portfolio of Investments.
The Fund may use third-party vendor evaluations, whose prices may be derived from one or more of the following standard inputs, among others:
| | |
• Benchmark yields | | • Reported trades |
• Broker/dealer quotes | | • Issuer spreads |
• Two-sided markets | | • Benchmark securities |
• Bids/offers | | • Reference data (corporate actions or material event notices) |
• Industry and economic events | | • Comparable bonds |
• Monthly payment information | | |
An asset or liability for which market values cannot be measured using the methodologies described above is valued by methods deemed reasonable in good faith by the Valuation Committee, following the procedures established by the Board, to represent fair value. Under these procedures, the Fund generally uses a market-based approach which may use related or comparable assets or liabilities, recent transactions, market multiples, book values and other relevant information. The Fund may also use an income-based valuation approach in which the anticipated future cash flows of the asset or liability are discounted to calculate fair value. Discounts may also be applied due to the nature and/or duration of any restrictions on the disposition of the asset or liability. Fair value represents a good faith approximation of the value of a security. Fair value determinations involve the consideration of a number of subjective factors, an analysis of applicable facts and circumstances and the exercise of judgment. As a result, it is possible that the fair value for a security determined in good faith in accordance with the Fund’s valuation procedures may differ from valuations for the same security determined by other funds using their own valuation procedures. Although the Fund’s valuation procedures are designed to value a security at the price the Fund may reasonably expect to receive upon the security’s sale in an orderly transaction, there can be no assurance that any fair value determination thereunder would, in fact, approximate the amount that the Fund would actually realize upon the sale of the security or the price at which the security would trade if a reliable market price were readily available. During the year ended October 31, 2017, there were no material changes to the fair value methodologies.
Securities which may be valued in this manner include, but are not limited to: (i) a security for which trading has been halted or suspended; (ii) a debt security that has recently gone into default and for which there is not a current market quotation; (iii) a security of an issuer that has entered into a restructuring; (iv) a security that has been de-listed from a national exchange; (v) a security for which the market price is not readily available from a third-party pricing source or, if so provided, does not, in the opinion of the Manager or Subadvisor, reflect the security’s market value; (vi) a security subject to trading collars for which no or limited trading takes place; and (vii) a security whose principal market has been temporarily closed at a time when, under normal conditions, it would be open. Securities for which market quotations or observable inputs are not readily available are generally categorized as Level 3 in the hierarchy. As of October 31, 2017, there were no securities held by the Fund that were fair valued in such a manner.
Futures contracts are valued at the last posted settlement price on the market where such futures are primarily traded. Investments in mutual
Notes to Financial Statements (continued)
funds, including money market funds, are valued at their respective NAVs as of the close of the Exchange on the valuation date. These securities are generally categorized as Level 1 in the hierarchy.
Debt securities (other than convertible and municipal bonds) are valued at the evaluated bid prices (evaluated mean prices in the case of convertible and municipal bonds) supplied by a pricing agent or broker selected by the Manager, in consultation with the Subadvisor. Those values reflect broker/dealer supplied prices and electronic data processing techniques, if the evaluated bid or mean prices are deemed by the Manager, in consultation with the Subadvisor, to be representative of market values at the regular close of trading of the Exchange on each valuation date. Debt securities purchased on a delayed delivery basis are marked to market daily until settlement at the forward settlement date. Debt securities, including corporate bonds, U.S. Government & federal agency bonds, municipal bonds, foreign bonds, convertible bonds, asset-backed securities and mortgage-backed securities are generally categorized as Level 2 in the hierarchy.
Temporary cash investments acquired in excess of 60 days to maturity at the time of purchase are valued using the latest bid prices or using valuations based on a matrix system (which considers such factors as security prices, yields, maturities and ratings), both as furnished by independent pricing services. Other temporary cash investments which mature in 60 days or less at the time of purchase (“Short-Term Investments”) are valued using the amortized cost method of valuation, unless the use of such method would be inappropriate. The amortized cost method involves valuing a security at its cost on the date of purchase and thereafter assuming a constant amortization to maturity of the difference between such cost and the value on maturity date. Amortized cost approximates the current fair value of a security. Securities valued using the amortized cost method are not valued using quoted prices in an active market and are generally categorized as Level 2 in the hierarchy.
Foreign currency forward contracts are valued at their fair market values measured on the basis of the mean between the last current bid and ask prices based on dealer or exchange quotations and are generally categorized as Level 2 in the hierarchy.
The information above is not intended to reflect an exhaustive list of the methodologies that may be used to value portfolio investments. The valuation procedures permit the use of a variety of valuation methodologies in connection with valuing portfolio investments. The methodology used for a specific type of investment may vary based on the market data available or other considerations. The methodologies summarized above may not represent the specific means by which portfolio investments are valued on any particular business day.
(B) Income Taxes. The Fund’s policy is to comply with the requirements of the Internal Revenue Code of 1986, as amended (the “Internal Revenue Code”), applicable to regulated investment companies and to distribute all of its taxable income to the shareholders of the Fund within the allowable time limits. Therefore, no federal, state and local income tax provisions are required.
Management evaluates the Fund’s tax positions to determine if the tax positions taken meet the minimum recognition threshold in connection with accounting for uncertainties in income tax positions taken or expected to be taken for the purposes of measuring and recognizing tax
liabilities in the financial statements. Recognition of tax benefits of an uncertain tax position is permitted only to the extent the position is “more likely than not” to be sustained assuming examination by taxing authorities. Management has analyzed the Fund’s tax positions taken on federal, state and local income tax returns for all open tax years (for up to three tax years) and has concluded that no provisions for federal, state and local income tax are required in the Fund’s financial statements. The Fund’s federal, state and local income tax and federal excise tax returns for tax years for which the applicable statutes of limitations have not expired are subject to examination by the Internal Revenue Service and state and local departments of revenue.
(C) Foreign Taxes. The Fund may be subject to foreign taxes on income and other transaction-based taxes imposed by certain countries in which it invests. A portion of the taxes on gains on investments or currency purchases/repatriation may be reclaimable. The Fund will accrue such taxes and reclaims as applicable, based upon its current interpretation of tax rules and regulations that exist in the markets in which it invests.
(D) Dividends and Distributions to Shareholders. Dividends and distributions are recorded on the ex-dividend date. The Fund intends to declare and pay dividends from net investment income, if any, at least monthly and distributions from net realized capital and currency gains, if any, at least annually. Unless the shareholder elects otherwise, all dividends and distributions are reinvested in the same class of shares of the Fund, at NAV. Dividends and distributions to shareholders are determined in accordance with federal income tax regulations and may differ from determinations using GAAP.
(E) Security Transactions and Investment Income. The Fund records security transactions on the trade date. Realized gains and losses on security transactions are determined using the identified cost method. Interest income is accrued as earned using the effective interest rate method. Discounts and premiums on securities purchased, other than Short-Term Investments, for the Fund are accreted and amortized, respectively, on the effective interest rate method over the life of the respective securities. Discounts and premiums on Short-Term Investments are accreted and amortized, respectively, on the straight-line method. The straight-line method approximates the effective interest method for Short-Term Investments. Income from payment-in-kind securities, to the extent the Fund held any such securities during the year ended October 31, 2017, is accreted daily based on the effective interest method.
Investment income and realized and unrealized gains and losses on investments of the Fund are allocated pro rata to separate classes of shares based upon their relative net assets on the date the income is earned or realized and unrealized gains and losses are incurred.
The Fund may place a debt security on non-accrual status and reduce related interest income by ceasing current accruals and writing off all or a portion of any interest receivables when the collection of all or a portion of such interest has become doubtful. A debt security is removed from non-accrual status when the issuer resumes interest payments or when collectability of interest is reasonably assured.
(F) Expenses. Expenses of the Trust are allocated to the individual Funds in proportion to the net assets of the respective Funds when the expenses are incurred, except where direct allocations of expenses can
| | |
| 24 | | MainStay Emerging Markets Debt Fund |
be made. Expenses (other than transfer agent expenses and fees incurred under the shareholder services plans and/or the distribution plans further discussed in Note 3(B)) are allocated to separate classes of shares pro rata based upon their relative net assets on the date the expenses are incurred. The expenses borne by the Fund, including those of related parties to the Fund, are shown in the Statement of Operations.
(G) Use of Estimates. In preparing financial statements in conformity with GAAP, management makes estimates and assumptions that affect the reported amounts and disclosures in the financial statements. Actual results could differ from those estimates.
(H) Repurchase Agreements. The Fund may enter into repurchase agreements (i.e., buy a security from another party with the agreement that it be sold back in the future) to earn income. The Fund may enter into repurchase agreements only with counterparties, usually financial institutions, that are deemed by the Manager or Subadvisor to be creditworthy, pursuant to guidelines established by the Board. During the term of any repurchase agreement, the Manager or Subadvisor will continue to monitor the creditworthiness of the counterparty. Under the 1940 Act, repurchase agreements are considered to be collateralized loans by the Fund to the counterparty secured by the securities transferred to the Fund.
Repurchase agreements are subject to counterparty risk, meaning the Fund could lose money by the counterparty’s failure to perform under the terms of the agreement. The Fund mitigates this risk by ensuring the repurchase agreement is collateralized by cash, U.S. government securities, fixed income securities and/or other securities. The collateral is held by the Fund’s custodian and valued daily on a mark to market basis to determine if the value, including accrued interest, exceeds the repurchase price. In the event of the counterparty’s default on the obligation to repurchase, the Fund has the right to liquidate the collateral and apply the proceeds in satisfaction of the obligation. Under certain circumstances, such as in the event of default or bankruptcy by the counterparty, realization and/or retention of the collateral may be limited or subject to delay, to legal proceedings and possible realized loss to the Fund.
(I) Futures Contracts. A futures contract is an agreement to purchase or sell a specified quantity of an underlying instrument at a specified future date and price, or to make or receive a cash payment based on the value of a financial instrument (e.g., foreign currency, interest rate, security or securities index). The Fund is subject to risks such as market price risk and/or interest rate risk in the normal course of investing in these transactions. Upon entering into a futures contract, the Fund is required to pledge to the broker or futures commission merchant an amount of cash and/or U.S. government securities equal to a certain percentage of the collateral amount, known as the “initial margin.” During the period the futures contract is open, changes in the value of the contract are recognized as unrealized appreciation or depreciation by marking to market such contract on a daily basis to reflect the market value of the contract at the end of each day’s trading. The Fund agrees to receive from or pay to the broker or futures commission merchant an amount of cash equal to the daily fluctuation in the value of the contract. Such receipts or payments are known as “variation margin.” When the futures contract is closed, the Fund records a realized gain or loss equal to the difference between the
proceeds from (or cost of) the closing transaction and the Fund’s basis in the contract.
The use of futures contracts involves, to varying degrees, elements of market risk in excess of the amount recognized in the Statement of Assets and Liabilities. The contract or notional amounts and variation margin reflect the extent of the Fund’s involvement in open futures positions. There are several risks associated with the use of futures contracts as hedging techniques. There can be no assurance that a liquid market will exist at the time when the Fund seeks to close out a futures contract. If no liquid market exists, the Fund would remain obligated to meet margin requirements until the position is closed. Futures may involve a small initial investment relative to the risk assumed, which could result in losses greater than if they had not been used. Futures may be more volatile than direct investments in the instrument underlying the futures and may not correlate to the underlying instrument, causing a given hedge not to achieve its objectives. The Fund’s activities in futures contracts have minimal counterparty risk as they are conducted through regulated exchanges that guarantee the futures against default by the counterparty. In the event of a bankruptcy or insolvency of a futures commission merchant that holds margin on behalf of the Fund, the Fund may not be entitled to the return of the entire margin owed to the Fund, potentially resulting in a loss. The Fund’s investment in futures contracts and other derivatives may increase the volatility of the Fund’s NAVs and may result in a loss to the Fund. As of October 31, 2017, the Fund did not hold any futures contracts.
(J) Foreign Currency Forward Contracts. The Fund may enter into foreign currency forward contracts, which are agreements to buy or sell foreign currencies on a specified future date at a specified rate. The Fund is subject to foreign currency exchange rate risk in the normal course of investing in these transactions. During the period the forward contract is open, changes in the value of the contract are recognized as unrealized appreciation or depreciation by marking to market such contract on a daily basis to reflect the market value of the contract at the end of each day’s trading. The delivery of foreign currency occurs on settlement date. When the forward contract is closed, the Fund records a realized gain or loss equal to the difference between the proceeds from (or cost of) the closing transaction and the Fund’s basis in the contract. The Fund may purchase and sell foreign currency forward contracts for purposes of seeking to enhance portfolio returns and manage portfolio risk more efficiently. Foreign currency forward contracts may also be used to gain exposure to a particular currency or to hedge against the risk of loss due to changing currency exchange rates. Foreign currency forward contracts to purchase or sell a foreign currency may also be used in anticipation of future purchases or sales of securities denominated in foreign currency, even if the specific investments have not yet been selected.
The use of foreign currency forward contracts involves, to varying degrees, elements of risk in excess of the amount recognized in the Statement of Assets and Liabilities, including counterparty risk, market risk and illiquidity risk. Counterparty risk is heightened for these instruments because foreign currency forward contracts are not exchange-traded and therefore no clearinghouse or exchange stands ready to meet the obligations under such contracts. Thus, the Fund faces the risk that its counterparties under such contracts may not perform their
Notes to Financial Statements (continued)
obligations. Market risk is the risk that the value of a foreign currency forward contract will depreciate due to unfavorable changes in exchange rates. Illiquidity risk arises because the secondary market for foreign currency forward contracts may have less liquidity relative to markets for other securities and financial instruments. Risks also arise from the possible movements in the foreign exchange rates underlying these instruments. While the Fund may enter into forward contracts to reduce currency exchange risks, changes in currency exchange rates may result in poorer overall performance for the Fund than if it had not engaged in such transactions. Exchange rate movements can be large, depending on the currency, and can last for extended periods of time, affecting the value of the Fund’s assets. Moreover, there may be an imperfect correlation between the Fund’s holdings of securities denominated in a particular currency and forward contracts entered into by the Fund. Such imperfect correlation may prevent the Fund from achieving the intended hedge or expose the Fund to the risk of currency exchange loss. The unrealized appreciation (depreciation) on forward contracts also reflects the Fund’s exposure at the valuation date to credit loss in the event of a counterparty’s failure to perform its obligations.
(K) Foreign Currency Transactions. The Fund’s books and records are maintained in U.S. dollars. Prices of securities denominated in foreign currency amounts are translated into U.S. dollars at the mean between the buying and selling rates last quoted by any major U.S. bank at the following dates:
| (i) | market value of investment securities, other assets and liabilities—at the valuation date; and |
| (ii) | purchases and sales of investment securities, income and expenses—at the date of such transactions. |
The assets and liabilities that are denominated in foreign currency amounts are presented at the exchange rates and market values at the close of the period. The realized and unrealized changes in net assets arising from fluctuations in exchange rates and market prices of securities are not separately presented.
Net realized gain or loss on foreign currency transactions represents net gains and losses on foreign currency forward contracts, net currency gains or losses realized as a result of differences between the amounts of securities sale proceeds or purchase cost, dividends, interest and withholding taxes as recorded on the Fund’s books, and the U.S. dollar equivalent amount actually received or paid. Net currency gains or losses from valuing such foreign currency denominated assets and liabilities, other than investments at valuation date exchange rates, are reflected in unrealized foreign exchange gains or losses.
(L) Securities Lending. In order to realize additional income, the Fund may engage in securities lending, subject to the limitations set forth in the 1940 Act and relevant guidance by the staff of the Securities and Exchange Commission (“SEC”). In the event the Fund does engage in securities lending, the Fund will lend through its custodian, State Street Bank and Trust Company (“State Street”). State Street will manage the Fund’s collateral in accordance with the lending agreement between the Fund and State Street, and indemnify the Fund against counterparty risk. The loans will be collateralized by U.S. Treasury securities at least equal at all times to the market value of the securities loaned. The Fund may bear the risk of delay in recovery of, or loss of rights in, the securities loaned should the borrower of the securities
experience financial difficulty. The Fund may also record a realized gain or loss on securities deemed sold due to a borrower’s inability to return securities on loan. The Fund bears the risk of any loss on investment of the collateral. The Fund will receive compensation for lending its securities in the form of fees or it will retain a portion of interest on the investment of any cash received as collateral. The Fund will also continue to receive interest and dividends on the securities loaned and any gain or loss in the market price of the securities loaned that may occur during the term of the loan will be for the account of the Fund. During the year ended October 31, 2017, the Fund did not have any portfolio securities on loan.
(M) High Yield and General Debt Securities Risk. The Fund’s principal investments include high yield debt securities (commonly referred to as ‘‘junk bonds’’), which are considered speculative because they present a greater risk of loss, including default, than higher quality debt securities. These securities pay investors a premium—a higher interest rate or yield than investment grade debt securities—because of the increased risk of loss. These securities can also be subject to greater price volatility. In times of unusual or adverse market economic or political conditions, these securities may experience higher than normal default rates.
(N) Foreign Securities Risk. The Fund may invest in foreign securities, which carry certain risks that are in addition to the usual risks inherent in domestic securities. These risks include those resulting from currency fluctuations, future adverse political or economic developments and possible imposition of currency exchange blockages or other foreign governmental laws or restrictions. These risks are likely to be greater in emerging markets than in developed markets. The ability of issuers of debt securities held by the Fund to meet their obligations may be affected by, among other things, economic or political developments in a specific country, industry or region.
(O) Indemnifications. Under the Trust’s organizational documents, its officers and trustees are indemnified against certain liabilities that may arise out of performance of their duties to the Trust. Additionally, in the normal course of business, the Fund enters into contracts with third-party service providers that contain a variety of representations and warranties and which may provide general indemnifications. The Fund’s maximum exposure under these arrangements is unknown, as this would involve future claims that may be made against the Fund that have not yet occurred. Based on experience, management is of the view that the risk of loss in connection with these potential indemnification obligations is remote. However, there can be no assurance that material liabilities related to such obligations will not arise in the future, which could adversely impact the Fund.
(P) Quantitative Disclosure of Derivative Holdings. The following tables show additional disclosures related to the Fund’s derivative and hedging activities, including how such activities are accounted for and their effect on the Fund’s financial positions, performance and cash flows. The Fund entered into futures contracts to help manage the duration and yield curve positioning of the portfolio while minimizing the exposure to wider bid/ask spreads in traditional bonds. The Fund also entered into foreign currency forward contracts to hedge against the risk of loss due to changing currency exchange rates. These derivatives are not accounted for as hedging instruments.
| | |
| 26 | | MainStay Emerging Markets Debt Fund |
Fair value of derivative instruments as of October 31, 2017:
Asset Derivatives
| | | | | | | | | | |
| | | Statement of
Assets and
Liabilities
Location | | Foreign
Exchange
Contracts
Risk | | | Total | |
Forward Contracts | | Unrealized appreciation on foreign currency forward contracts | | $ | 10,834 | | | $ | 10,834 | |
| | | | | | |
Total Fair Value | | | | $ | 10,834 | | | $ | 10,834 | |
| | | | | | |
Liability Derivatives
| | | | | | | | | | |
| | | Statement of
Assets and
Liabilities
Location | | Foreign
Exchange
Contracts
Risk | | | Total | |
Forward Contracts | | Unrealized depreciation on foreign currency forward contracts | | $ | (43,997 | ) | | $ | (43,997 | ) |
| | | | | | |
Total Fair Value | | | | $ | (43,997 | ) | | $ | (43,997 | ) |
| | | | | | |
The effect of derivative instruments on the Statement of Operations for the year ended October 31, 2017:
Realized Gain (Loss)
| | | | | | | | | | |
| | | Statement of
Operations
Location | | Foreign
Exchange
Contracts
Risk | | | Total | |
Forward Contracts | | Net realized gain (loss) on foreign currency transactions | | $ | 231,962 | | | $ | 231,962 | |
| | | | | | |
Total Realized Gain (Loss) | | | | $ | 231,962 | | | $ | 231,962 | |
| | | | | | |
Change in Unrealized Appreciation (Depreciation)
| | | | | | | | | | |
| | | Statement of
Operations
Location | | Foreign
Exchange
Contracts
Risk | | | Total | |
Forward Contracts | | Net change in unrealized appreciation (depreciation) on translation of other assets and liabilities in foreign currencies and foreign currency forward contracts | | $ | (127,768 | ) | | $ | (127,768 | ) |
| | | | | | |
Total Change in Unrealized Appreciation (Depreciation) | | $ | (127,768 | ) | | $ | (127,768 | ) |
| | | | | | |
Average Notional Amount
| | | | | | | | |
| | | Foreign
Exchange
Contracts
Risk | | | Total | |
Forward Contracts Long | | $ | 1,816,660 | | | $ | 1,816,660 | |
Forward Contracts Short | | $ | (1,194,817 | ) | | $ | (1,194,817 | ) |
| | | | | | | | |
Note 3–Fees and Related Party Transactions
(A) Manager and Subadvisor. New York Life Investments, a registered investment adviser and an indirect, wholly-owned subsidiary of New York Life Insurance Company (“New York Life”), serves as the Fund’s Manager, pursuant to an Amended and Restated Management Agreement (“Management Agreement”). The Manager provides offices, conducts clerical, recordkeeping and bookkeeping services and keeps most of the financial and accounting records required to be maintained by the Fund. Except for the portion of salaries and expenses that are the responsibility of the Fund, the Manager pays the salaries and expenses of all personnel affiliated with the Fund and certain operational expenses of the Fund. The Fund reimburses New York Life Investments in an amount equal to a portion of the compensation of the Chief Compliance Officer attributable to the Fund. MacKay Shields LLC (‘‘MacKay Shields” or the “Subadvisor’’), a registered investment adviser and an indirect, wholly-owned subsidiary of New York Life, serves as Subadvisor to the Fund and is responsible for the day-to-day portfolio management of the Fund. Pursuant to the terms of a Subadvisory Agreement (“Subadvisory Agreement”) between New York Life Investments and MacKay Shields, New York Life Investments pays for the services of the Subadvisor.
Under the Management Agreement, the Fund pays the Manager a monthly fee for the services performed and the facilities furnished at an annual rate of the Fund’s average daily net assets as follows: 0.70% to $500 million and 0.65% in excess of $500 million, plus a fee for fund accounting services previously provided by New York Life Investments under a separate fund accounting agreement furnished at an annual rate of the Fund’s average net assets as follows: 0.05% up to $20 million; 0.0333% from $20 million to $100 million; and 0.01% in excess of $100 million. During the year ended October 31, 2017, the effective management fee rate was 0.73% inclusive of a fee for fund accounting services of 0.03% of the Fund’s average daily net assets.
During the year ended October 31, 2017, New York Life Investments earned fees from the Fund in the amount of $1,308,228.
State Street provides sub-administration and sub-accounting services to the Fund pursuant to an agreement with New York Life Investments. These services include calculating the daily NAVs of the Fund, maintaining the general ledger and sub-ledger accounts for the calculation of the Fund’s NAVs and assisting New York Life Investments in conducting various aspects of the Fund’s administrative operations. For providing these services to the Fund, State Street is compensated by New York Life Investments.
(B) Distribution and Service Fees. The Trust, on behalf of the Fund, has entered into a distribution agreement with NYLIFE Distributors LLC (the “Distributor”), an indirect, wholly-owned subsidiary of New York Life. The Fund has adopted distribution plans (the “Plans”) in accordance with the provisions of Rule 12b-1 under the 1940 Act.
Notes to Financial Statements (continued)
Pursuant to the Class A, Investor Class and Class T Plans, the Distributor receives a monthly distribution fee from the Class A, Investor Class and Class T shares at an annual rate of 0.25% of the average daily net assets of the Class A, Investor Class and Class T shares for distribution and/or service activities as designated by the Distributor. Pursuant to the Class B and Class C Plans, Class B and Class C shares pay the Distributor a monthly distribution fee at an annual rate of 0.75% of the average daily net assets of the Class B and Class C shares, along with a service fee at an annual rate of 0.25% of the average daily net assets of the Class B and Class C shares, for a total 12b-1 fee of 1.00%. Class I and Class R6 shares are not subject to a distribution and/or service fee.
The Plans provide that the distribution and service fees are payable to the Distributor regardless of the amounts actually expended by the Distributor for distribution of the Fund’s shares and service activities.
(C) Sales Charges. During the year ended October 31, 2017, the Fund was advised by the Distributor that the amount of initial sales charges retained on sales of Class A and Investor Class shares were $18,262 and $6,423, respectively.
During the year ended October 31, 2017, the Fund was also advised that the Distributor retained CDSCs on redemptions of Class A, Investor Class, Class B and Class C shares of $1,185, $5, $7,814 and $2,589, respectively.
(D) Transfer, Dividend Disbursing and Shareholder Servicing Agent. NYLIM Service Company LLC, an affiliate of New York Life Investments, is the Fund’s transfer, dividend disbursing and shareholder servicing agent pursuant to an agreement between NYLIM Service Company LLC and the Trust. NYLIM Service Company LLC has entered into an agreement with Boston Financial Data Services, Inc. (“BFDS”) pursuant to which BFDS performs certain transfer agent services on behalf of NYLIM Service Company LLC. During the year ended October 31, 2017, transfer agent expenses incurred by the Fund were as follows:
| | | | |
Class A | | $ | 125,728 | |
Investor Class | | | 80,421 | |
Class B | | | 21,483 | |
Class C | | | 99,039 | |
Class I | | | 17,733 | |
(E) Small Account Fee. Shareholders with small accounts adversely impact the cost of providing transfer agency services. In an effort to reduce total transfer agency expenses, the Fund has implemented a small account fee on certain types of accounts. Certain shareholders with an account balance of less than $1,000 are charged an annual per account fee of $20 (assessed semi-annually), the proceeds from which offset transfer agent fees as reflected in the Statement of Operations.
(F) Capital. As of October 31, 2017, New York Life and its affiliates beneficially held shares of the Fund with the values and percentages of net assets as follows:
Note 4–Federal Income Tax
As of October 31, 2017, the cost and unrealized appreciation (depreciation) of the Fund’s investment portfolio, including applicable derivative contracts and other financial instruments, as determined on a federal income tax basis, were as follows:
| | | | | | | | |
| | | Federal
Tax Cost | | Gross
Unrealized
Appreciation | | Gross
Unrealized
Depreciation | | Net
Unrealized
Appreciation/
(Depreciation) |
Investments in
Securities | | $178,068,984 | | $11,439,065 | | $(6,179,306) | | $5,259,759 |
As of October 31, 2017, the components of accumulated gain (loss) on a tax basis were as follows:
| | | | | | | | |
Ordinary
Income | | Accumulated
Capital and Other Gain (Loss) | | Other
Temporary
Differences | | Unrealized
Appreciation
(Depreciation) | | Total
Accumulated Gain (Loss) |
| $ — | | $(9,191,064) | | $(41,199) | | $5,153,305 | | $(4,078,958) |
The difference between book-basis and tax-basis unrealized appreciation (depreciation) is primarily due to mark to market of forward contracts.
The following table discloses the current year reclassifications between undistributed net investment income (loss), accumulated net realized gain (loss) on investments and additional paid-in capital arising from permanent differences; net assets as of October 31, 2017 were not affected.
| | | | | | | | |
Undistributed Net Investment Income (Loss) | | Accumulated Net Realized Gain (Loss) on Investments | | | Additional Paid-In Capital | |
| $(2,731,692) | | $ | 2,731,692 | | | $ | — | |
The reclassifications for the Fund are primarily due to foreign currency gain (loss).
As of October 31, 2017, for federal income tax purposes, capital loss carryforwards of $9,191,064 were available as shown in the table below, to the extent provided by the regulations to offset future realized gains of the Fund through the years indicated. To the extent that these capital loss carryforwards are used to offset future capital gains, it is probable that the capital gains so offset will not be distributed to shareholders. No capital gain distributions shall be made until any capital loss carryforwards have been fully utilized or expired.
| | | | | | | | |
Capital Loss Available Through | | Short-Term Capital Loss Amounts (000’s) | | | Long-Term Capital Loss Amounts (000’s) | |
| Unlimited | | $ | 409 | | | $ | 8,782 | |
The Fund utilized $1,731,597 of capital loss carryforwards during the year ended October 31, 2017.
| | |
| 28 | | MainStay Emerging Markets Debt Fund |
During the years ended October 31, 2017 and October 31, 2016, the tax character of distributions paid as reflected in the Statements of Changes in Net Assets was as follows:
| | | | | | | | |
| | | 2017 | | | 2016 | |
Distributions paid from: | | | | | | | | |
Ordinary Income | | $ | 5,951,074 | | | $ | 5,155,675 | |
Return of Capital | | | 1,741,165 | | | | 4,417,544 | |
Total | | $ | 7,692,239 | | | $ | 9,573,219 | |
Note 5–Custodian
State Street is the custodian of cash and securities held by the Fund. Custodial fees are charged to the Fund based on the Fund’s net assets and/or the market value of securities held by the Fund and the number of certain transactions incurred by the Fund.
Note 6–Line of Credit
The Fund and certain other funds managed by New York Life Investments, maintain a line of credit with a syndicate of banks in order to secure a source of funds for temporary purposes to meet unanticipated or excessive redemption requests.
Effective August 1, 2017, under the credit agreement (the “Credit Agreement”), the aggregate commitment amount is $600,000,000 with an additional uncommitted amount of $100,000,000. The commitment fee is an annual rate of 0.15% of the average commitment amount payable quarterly, regardless of usage, to State Street, who serves as the agent to the syndicate. The commitment fee is allocated among the Fund and certain other funds managed by New York Life Investments based upon their respective net assets and other factors. Interest on any revolving credit loan is charged based upon the Federal Funds Rate or the one-month LIBOR, whichever is higher. The Credit Agreement expires on July 31, 2018, although the Fund, certain other funds managed by New York Life Investments and the syndicate of banks may renew the Credit Agreement for an additional year on the same or different terms. Prior to August 1, 2017, the aggregate commitment amount and commitment fee of the previous credit agreement were the same under the Credit Agreement, but Bank of New York Mellon served as agent to the syndicate. During the year ended October 31, 2017, there were no borrowings made or outstanding with respect to the Fund under the Credit Agreement or the credit agreement for which Bank of New York Mellon served as agent.
Note 7–Interfund Lending Program
Pursuant to an exemptive order issued by the SEC, the Fund, along with certain other funds managed by New York Life Investments, may participate in an interfund lending program. The interfund lending program provides an alternative credit facility that permits the Fund and certain other funds managed by New York Life Investments to lend or borrow money for temporary purposes directly to or from one another subject to the conditions of the exemptive order. During the year ended October 31, 2017, there were no interfund loans made or outstanding with respect to the Fund.
Note 8–Purchases and Sales of Securities (in 000’s)
During the year ended October 31, 2017, purchases and sales of securities, other than short-term securities, were $64,992 and $80,182, respectively.
Note 9–Capital Share Transactions
| | | | | | | | |
Class A | | Shares | | | Amount | |
Year ended October 31, 2017: | | | | | | | | |
Shares sold | | | 1,720,190 | | | $ | 18,241,855 | |
Shares issued to shareholders in reinvestment of dividends and distributions | | | 391,795 | | | | 4,118,552 | |
Shares redeemed | | | (3,187,906 | ) | | | (33,535,669 | ) |
| | | | | | | | |
Net increase (decrease) in shares outstanding before conversion | | | (1,075,921 | ) | | | (11,175,262 | ) |
Shares converted into Class A (See Note 1) | | | 845,728 | | | | 9,165,350 | |
Shares converted from Class A (See Note 1) | | | (65,390 | ) | | | (688,356 | ) |
| | | | | | | | |
Net increase (decrease) | | | (295,583 | ) | | $ | (2,698,268 | ) |
| | | | | | | | |
Year ended October 31, 2016: | | | | | | | | |
Shares sold | | | 3,503,620 | | | $ | 35,621,956 | |
Shares issued to shareholders in reinvestment of dividends and distributions | | | 481,703 | | | | 4,776,515 | |
Shares redeemed | | | (4,050,073 | ) | | | (40,976,204 | ) |
| | | | | | | | |
Net increase (decrease) in shares outstanding before conversion | | | (64,750 | ) | | | (577,733 | ) |
Shares converted into Class A (See Note 1) | | | 279,282 | | | | 2,834,047 | |
Shares converted from Class A (See Note 1) | | | (57,052 | ) | | | (572,828 | ) |
| | | | | | | | |
Net increase (decrease) | | | 157,480 | | | $ | 1,683,486 | |
| | | | | | | | |
| | |
| | | | | | | | |
Investor Class | | Shares | | | Amount | |
Year ended October 31, 2017: | | | | | | | | |
Shares sold | | | 206,404 | | | $ | 2,189,642 | |
Shares issued to shareholders in reinvestment of dividends and distributions | | | 97,225 | | | | 1,028,872 | |
Shares redeemed | | | (926,723 | ) | | | (9,604,953 | ) |
| | | | | | | | |
Net increase (decrease) in shares outstanding before conversion | | | (623,094 | ) | | | (6,386,439 | ) |
Shares converted into Investor Class (See Note 1) | | | 101,894 | | | | 1,087,744 | |
Shares converted from Investor Class (See Note 1) | | | (829,412 | ) | | | (9,072,093 | ) |
| | | | | | | | |
Net increase (decrease) | | | (1,350,612 | ) | | $ | (14,370,788 | ) |
| | | | | | | | |
Year ended October 31, 2016: | | | | | | | | |
Shares sold | | | 855,021 | | | $ | 9,110,002 | |
Shares issued to shareholders in reinvestment of dividends and distributions | | | 130,823 | | | | 1,308,977 | |
Shares redeemed | | | (389,117 | ) | | | (3,894,045 | ) |
| | | | | | | | |
Net increase (decrease) in shares outstanding before conversion | | | 596,727 | | | | 6,524,934 | |
Shares converted into Investor Class (See Note 1) | | | 123,330 | | | | 1,238,250 | |
Shares converted from Investor Class (See Note 1) | | | (270,240 | ) | | | (2,767,491 | ) |
| | | | | | | | |
Net increase (decrease) | | | 449,817 | | | $ | 4,995,693 | |
| | | | | | | | |
Notes to Financial Statements (continued)
| | | | | | | | |
Class B | | Shares | | | Amount | |
Year ended October 31, 2017: | | | | | | | | |
Shares sold | | | 38,191 | | | $ | 390,440 | |
Shares issued to shareholders in reinvestment of dividends and distributions | | | 21,259 | | | | 218,872 | |
Shares redeemed | | | (150,945 | ) | | | (1,558,335 | ) |
| | | | | | | | |
Net increase (decrease) in shares outstanding before conversion | | | (91,495 | ) | | | (949,023 | ) |
Shares converted from Class B (See Note 1) | | | (72,105 | ) | | | (749,331 | ) |
| | | | | | | | |
Net increase (decrease) | | | (163,600 | ) | | $ | (1,698,354 | ) |
| | | | | | | | |
Year ended October 31, 2016: | | | | | | | | |
Shares sold | | | 98,628 | | | $ | 964,043 | |
Shares issued to shareholders in reinvestment of dividends and distributions | | | 31,332 | | | | 304,370 | |
Shares redeemed | | | (186,521 | ) | | | (1,794,524 | ) |
| | | | | | | | |
Net increase (decrease) in shares outstanding before conversion | | | (56,561 | ) | | | (526,111 | ) |
Shares converted from Class B (See Note 1) | | | (76,204 | ) | | | (739,652 | ) |
| | | | | | | | |
Net increase (decrease) | | | (132,765 | ) | | $ | (1,265,763 | ) |
| | | | | | | | |
| | |
| | | | | | | | |
Class C | | Shares | | | Amount | |
Year ended October 31, 2017: | | | | | | | | |
Shares sold | | | 234,518 | | | $ | 2,424,850 | |
Shares issued to shareholders in reinvestment of dividends and distributions | | | 94,874 | | | | 978,127 | |
Shares redeemed | | | (1,144,331 | ) | | | (11,808,340 | ) |
| | | | | | | | |
Net increase (decrease) in shares outstanding before conversion | | | (814,939 | ) | | | (8,405,363 | ) |
Shares converted from Class C (See Note 1) | | | (1,261 | ) | | | (13,330 | ) |
| | | | | | | | |
Net increase (decrease) | | | (816,200 | ) | | $ | (8,418,693 | ) |
| | | | | | | | |
Year ended October 31, 2016: | | | | | | | | |
Shares sold | | | 519,985 | | | $ | 5,052,581 | |
Shares issued to shareholders in reinvestment of dividends and distributions | | | 137,661 | | | | 1,340,368 | |
Shares redeemed | | | (1,198,526 | ) | | | (11,609,014 | ) |
| | | | | | | | |
Net increase (decrease) | | | (540,880 | ) | | $ | (5,216,065 | ) |
| | | | | | | | |
| | |
| | | | | | | | |
| | | | | | | | |
Class I | | Shares | | | Amount | |
Year ended October 31, 2017: | | | | | | | | |
Shares sold | | | 1,896,970 | | | $ | 20,446,306 | |
Shares issued to shareholders in reinvestment of dividends and distributions | | | 51,546 | | | | 546,482 | |
Shares redeemed | | | (1,196,200 | ) | | | (12,595,372 | ) |
| | | | | | | | |
Net increase (decrease) in shares outstanding before conversion | | | 752,316 | | | | 8,397,416 | |
Shares converted into Class I (See Note 1) | | | 25,884 | | | | 270,016 | |
| | | | | | | | |
Net increase (decrease) | | | 778,200 | | | $ | 8,667,432 | |
| | | | | | | | |
Year ended October 31, 2016: | | | | | | | | |
Shares sold | | | 685,551 | | | $ | 6,928,472 | |
Shares issued to shareholders in reinvestment of dividends and distributions | | | 43,563 | | | | 432,725 | |
Shares redeemed | | | (1,174,000 | ) | | | (11,590,399 | ) |
| | | | | | | | |
Net increase (decrease) in shares outstanding before conversion | | | (444,886 | ) | | | (4,229,202 | ) |
Shares converted into Class I (See Note 1) | | | 764 | | | | 7,674 | |
| | | | | | | | |
Net increase (decrease) | | | (444,122 | ) | | $ | (4,221,528 | ) |
| | | | | | | | |
Note 10–Subsequent Events
In connection with the preparation of the financial statements of the Fund as of and for the year ended October 31, 2017, events and transactions subsequent to October 31, 2017, through the date the financial statements were issued have been evaluated by the Fund’s management for possible adjustment and/or disclosure. No subsequent events requiring financial statement adjustment or disclosure have been identified.
| | |
| 30 | | MainStay Emerging Markets Debt Fund |
Report of Independent Registered Public Accounting Firm
The Board of Trustees and Shareholders of
The MainStay Funds:
We have audited the accompanying statement of assets and liabilities, including the portfolio of investments, of MainStay Emerging Markets Debt Fund (formerly, MainStay Global High Income Fund) (the “Fund”), one of the funds constituting The MainStay Funds, as of October 31, 2017, and the related statement of operations for the year then ended, the statements of changes in net assets for each of the years in the two-year period then ended, and the financial highlights for each of the years in the five-year period then ended. These financial statements and financial highlights are the responsibility of the Fund’s management. Our responsibility is to express an opinion on these financial statements and financial highlights based on our audits.
We conducted our audits in accordance with the standards of the Public Company Accounting Oversight Board (United States). Those standards require that we plan and perform the audit to obtain reasonable assurance about whether the financial statements and financial highlights are free of material misstatement. An audit includes examining, on a test basis, evidence supporting the amounts and disclosures in the financial statements. Our procedures included confirmation of securities owned as of October 31, 2017, by correspondence with the custodian and brokers or by other appropriate auditing procedures where replies from brokers were not received. An audit also includes assessing the accounting principles used and significant estimates made by management, as well as evaluating the overall financial statement presentation. We believe that our audits provide a reasonable basis for our opinion.
In our opinion, the financial statements and financial highlights referred to above present fairly, in all material respects, the financial position of MainStay Emerging Markets Debt Fund as of October 31, 2017, the results of its operations for the year then ended, the changes in its net assets for each of the years in the two-year period then ended, and the financial highlights for each of the years in the five-year period then ended, in conformity with U.S. generally accepted accounting principles.

Philadelphia, Pennsylvania
December 21, 2017
Other Matters
(Unaudited)
At a meeting held on June 22, 2017, the Board approved submitting the following proposal (“Proposal”) to shareholders of the Funds at a special meeting held on October 23, 2017 (with any postponements or adjournments, “Special Meeting”):
To elect eight Trustees to the Board
On or about September 28, 2017, shareholders of record of the Funds as of the close of business on August 24, 2017 were sent a proxy statement containing information regarding the Proposal. The proxy statement also included information about the Special Meeting, at which shareholders of the Funds were asked to consider and approve the Proposal. In addition, the proxy statement included information about voting on the Proposal and options shareholders had to do so.
The Special Meeting was held on October 23, 2017, and the Proposal passed.
The results of the Special Meeting (all Funds and classes thereof voting together) were as follows:
Proposal—To elect eight Trustees to the Board:
Yie-Hsin Hung:
| | | | |
Votes
For | | Votes
Witheld | | Total |
| 2,644,056,263.750 | | 21,799,781.292 | | 2,665,856,045.042 |
David H. Chow:
| | | | |
Votes
For | | Votes
Witheld | | Total |
| 2,644,576,776.557 | | 21,279,268.485 | | 2,665,856,045.042 |
Susan B. Kerley:
| | | | |
Votes
For | | Votes
Witheld | | Total |
| 2,645,459,747.343 | | 20,396,297.699 | | 2,665,856,045.042 |
Alan R. Latshaw:
| | | | |
Votes
For | | Votes
Witheld | | Total |
| 2,644,443,039.401 | | 21,413,005.641 | | 2,665,856,045.042 |
Peter Meenan:
| | | | |
Votes
For | | Votes
Witheld | | Total |
| 2,640,156,421.578 | | 25,699,623.464 | | 2,665,856,045.042 |
Richard H. Nolan, Jr.:
| | | | |
Votes
For | | Votes
Witheld | | Total |
| 2,641,415,514.849 | | 24,440,530.193 | | 2,665,856,045.042 |
Jacques P. Perold:
| | | | |
Votes
For | | Votes
Witheld | | Total |
| 2,645,300,993.731 | | 20,555,051.311 | | 2,665,856,045.042 |
Richard S. Trutanic:
| | | | |
Votes
For | | Votes
Witheld | | Total |
| 2,641,761,336.311 | | 24,094,708.731 | | 2,665,856,045.042 |
Federal Income Tax Information
(Unaudited)
The Fund is required under the Internal Revenue Code to advise shareholders in a written statement as to the federal tax status of dividends paid by the Fund during such fiscal years.
In February 2018, shareholders will receive an IRS Form 1099-DIV or substitute Form 1099, which will show the federal tax status of the distributions received by shareholders in calendar year 2017. The amounts that will be reported on such 1099-DIV or substitute Form 1099 will be the amounts you are to use on your federal income tax return and will differ from the amounts which we must report for the Fund’s fiscal year end October 31, 2017.
Proxy Voting Policies and Procedures and Proxy Voting Record
A description of the policies and procedures that New York Life Investments uses to vote proxies related to the Fund’s securities is available without charge, upon request, (i) by visiting the MainStay Funds’ website at mainstayinvestments.com; and (ii) on the Securities and Exchange Commission’s (“SEC”) website at www.sec.gov.
The Fund is required to file with the SEC its proxy voting records for the Fund for the 12-month period ending June 30 on Form N-PX. The most recent Form N-PX or proxy voting record is available free of charge upon request by calling 800-MAINSTAY (624-6782); visiting the MainStay Funds’ website at mainstayinvestments.com; or on the SEC’s website at www.sec.gov.
Shareholder Reports and Quarterly Portfolio Disclosure
The Fund is required to file its complete schedule of portfolio holdings with the SEC for its first and third fiscal quarters on Form N-Q. The Fund’s Form N-Q is available without charge, on the SEC’s website at www.sec.gov or by calling MainStay Investments at 800-MAINSTAY (624-6782). You also can obtain and review copies of Form N-Q by visiting the SEC’s Public Reference Room in Washington, DC (information on the operation of the Public Reference Room may be obtained by calling 1-800-SEC-0330).
| | |
| 32 | | MainStay Emerging Markets Debt Fund |
Board of Trustees and Officers (Unaudited)
The Trustees and officers of the Funds are listed below. The Board oversees the MainStay Group of Funds (which consists of The MainStay Funds and MainStay Funds Trust), MainStay VP Funds Trust, MainStay DefinedTerm Municipal Opportunities Fund, the Manager and the Subadvisors, and elects the officers of the Funds who are responsible for the day-to-day operations of the Funds. Information pertaining to the Trustees and officers is set forth below. Each Trustee serves until his or her successor is elected and qualified or until his or her resignation, death or removal. Under the Board’s retirement policy, unless an exception is made, a Trustee must tender his or her resignation by the
end of the calendar year during which he or she reaches the age of 75. Mr. Meenan reached the age of 75 during the calendar year 2016, and his term was extended for one additional year. Accordingly, Mr. Meenan is expected to serve until the end of calendar year 2017, at which time he intends to retire. Officers are elected annually by the Board. The business address of each Trustee and officer listed below is 51 Madison Avenue, New York, New York 10010. A majority of the Trustees are not “interested persons” (as defined by the 1940 Act and rules adopted by the SEC thereunder) of the Fund (“Independent Trustees”).
| | | | | | | | | | | | |
| | | | | Name and Date of Birth | | Term of Office, Position(s) Held and Length of Service | | Principal Occupation(s) During Past Five Years | | Number of
Portfolios in
the MainStay
Group of Funds
Overseen by
Trustee | | Other Directorships Held by Trustee |
| Interested Trustee | | | | Yie-Hsin Hung* 8/12/62 | | The MainStay Funds: Trustee since January 2017; MainStay Funds Trust: Trustee since January 2017. | | Senior Vice President of New York Life since joining in 2010, Member of the Executive Management Committee since January 1, 2017, Chief Executive Officer, New York Life Investment Management Holdings LLC & New York Life Investment Management LLC since May 2015. Senior Managing Director and Co-President of New York Life Investment Management LLC from January 2014 to May 2015. Previously held positions of increasing responsibility, including head of NYLIM International, Alternative Growth Businesses, and Institutional investments since joining New York Life in 2010. | | 82 | | None |
| | * | This Trustee is considered to be an “interested person” of the MainStay Group of Funds, MainStay VP Funds Trust and MainStay DefinedTerm Municipal Opportunities Fund, within the meaning of the 1940 Act because of her affiliation with New York Life Insurance Company, New York Life Investment Management LLC, Candriam Belgium, Candriam France S.A.S., Cornerstone Capital Management Holdings LLC, MacKay Shields LLC, NYL Investors LLC, NYLIFE Securities LLC and/or NYLIFE Distributors LLC, as described in detail above in the column entitled “Principal Occupation(s) During Past Five Years.” |
| | | | | | | | | | | | |
| | | | | Name and Date of Birth | | Term of Office, Position(s) Held and Length of Service | | Principal Occupation(s) During Past Five Years | | Number of
Portfolios in
the MainStay
Group of Funds
Overseen by
Trustee | | Other Directorships Held by Trustee |
| Independent Trustees | | | | David H. Chow 12/29/57 | | The MainStay Funds: Trustee since January 2016, Advisory Board Member (June 2015 to December 2015); MainStay Funds Trust: Trustee since January 2016, Advisory Board Member (June 2015 to December 2015). | | Founder and CEO, DanCourt Management, LLC (since 1999) | | 82 | | VanEck Vectors Group of Exchange-Traded Funds: Independent Chairman of the Board of Trustees since 2008 and Trustee since 2006 (57 portfolios); and
Berea College of Kentucky: Trustee since 2009. |
| | | | Susan B. Kerley 8/12/51 | | The MainStay Funds: Chairman since January 2017 and Trustee since 2007; MainStay Funds Trust: Chairman since January 2017 and Trustee since 1990.** | | President, Strategic Management Advisors LLC (since 1990) | | 82 | | Legg Mason Partners Funds: Trustee since 1991 (54 portfolios). |
| | | | Alan R. Latshaw 3/27/51 | | The MainStay Funds: Trustee and Audit Committee Financial Expert since 2006; MainStay Funds Trust: Trustee and Audit Committee Financial Expert since 2007.** | | Retired; Partner, Ernst & Young LLP (2002 to 2003); Partner, Arthur Andersen LLP (1989 to 2002); Consultant to the MainStay Funds Audit and Compliance Committee (2004 to 2006) | | 82 | | State Farm Associates Funds Trusts: Trustee since 2005 (4 portfolios);
State Farm Mutual Fund Trust: Trustee since 2005 (15 portfolios); and
State Farm Variable Product Trust: Trustee since 2005 (9 portfolios). |
| | | | Peter Meenan 12/5/41 | | The MainStay Funds: Trustee since 2007; MainStay Funds Trust: Trustee since 2002.** | | Retired; Independent Consultant (2004 to 2013); President and Chief Executive Officer, Babson—United, Inc. (financial services firm) (2000 to 2004); Independent Consultant (1999 to 2000); Head of Global Funds, Citicorp (1995 to 1999) | | 82 | | None |
| | | | Richard H. Nolan, Jr. 11/16/46 | | The MainStay Funds: Trustee since 2007; MainStay Funds Trust: Trustee since 2007.** | | Managing Director, ICC Capital Management (since 2004); President—Shields/Alliance, Alliance Capital Management (1994 to 2004) | | 82 | | None |
| | | | Jacques P. Perold 5/12/58 | | The MainStay Funds: Trustee since January 2016, Advisory Board Member (June 2015 to December 2015); MainStay Funds Trust: Trustee since January 2016, Advisory Board Member (June 2015 to December 2015). | | Retired; President, Fidelity Management & Research Company (2009 to 2014); Founder, President and Chief Executive Officer, Geode Capital Management, LCC (2001 to 2009) | | 82 | | Allstate Corporation: Director since 2015; MSCI, Inc. Director since March 2017 and
Boston University: Trustee since 2014. |
| | | | Richard S. Trutanic 2/13/52 | | The MainStay Funds: Trustee since 1994; MainStay Funds Trust: Trustee since 2007.** | | Chairman and Chief Executive Officer, Somerset & Company (financial advisory firm) (since 2004); Managing Director, The Carlyle Group (private investment firm) (2002 to 2004); Senior Managing Director, Partner and Board Member, Groupe Arnault S.A. (private investment firm) (1999 to 2002) | | 82 | | None |
| | ** | Includes prior service as a Director/Trustee of certain predecessor entities to MainStay Funds Trust. |
| | |
| 34 | | MainStay Emerging Markets Debt Fund |
| | | | | | | | |
| | | | | Name and Date of Birth | | Position(s) Held and Length of Service | | Principal Occupation(s) During Past Five Years |
Officers of the Trust (Who are not Trustees)* | | | | Kirk C. Lehneis 6/29/74 | | President, The MainStay Funds, MainStay Funds Trust (since September 2017) | | Chief Operating Officer and Senior Managing Director (since 2016), New York Life Investment Management LLC; Chairman of the Board (since September 2017), NYLIFE Distributors LLC; Chairman of the Board, NYLIM Service Company LLC (since September 2017); President, MainStay DefinedTerm Municipal Opportunities Fund and MainStay VP Funds Trust (since September 2017); Senior Managing Director, Global Product Development (From March 2015—May 2016); Managing Director, Product Development (From March 2010—February 2015) |
| | | | Jack R. Benintende 5/12/64 | | Treasurer and Principal Financial and Accounting Officer, The MainStay Funds (since 2007), MainStay Funds Trust (since 2009) | | Managing Director, New York Life Investment Management LLC (since 2007); Treasurer and Principal Financial and Accounting Officer, MainStay DefinedTerm Municipal Opportunities Fund (since 2011) and MainStay VP Funds Trust (since 2007)**; and Assistant Treasurer, New York Life Investment Management Holdings LLC (2008 to 2012) |
| | | | Kevin M. Bopp 2/24/69 | | Vice President and Chief Compliance Officer, The MainStay Funds and MainStay Funds Trust (since 2014) | | Chief Compliance Officer, New York Life Investment Management LLC, IndexIQ ETF (since January 2016), Director and Associate General Counsel (2011 to 2014) and Vice President and Assistant General Counsel (2010 to 2011), New York Life Investment Management LLC; Vice President and ChiefCompliance Officer, MainStay VP Funds Trust, MainStay DefinedTerm Municipal Opportunities Fund (since 2014); Assistant Secretary, MainStay Funds, MainStay Funds Trust and MainStay VP Funds Trust (2010 to 2014)**, MainStay DefinedTerm Municipal Opportunities Fund (2011 to 2014) |
| | | | J. Kevin Gao 10/13/67 | | Secretary and Chief Legal Officer, The MainStay Funds and MainStay Funds Trust (since 2010) | | Managing Director and Associate General Counsel, New York Life Investment Management LLC (since 2010); Secretary and Chief Legal Officer, MainStay DefinedTerm Municipal Opportunities Fund (since 2011) and MainStay VP Funds Trust (since 2010)** |
| | | | Scott T. Harrington 2/8/59 | | Vice President—Administration, The MainStay Funds (since 2005), MainStay Funds Trust (since 2009) | | Director, New York Life Investment Management LLC (including predecessor advisory organizations) (since 2000); Member of the Board of Directors, New York Life Trust Company (since 2009); Vice President—Administration, MainStay DefinedTerm Municipal Opportunities Fund (since 2011) and MainStay VP Funds Trust (since 2005)** |
| | * | The officers listed above are considered to be “interested persons” of the MainStay Group of Funds, MainStay VP Funds Trust and MainStay Defined Term Municipal Opportunities Fund within the meaning of the 1940 Act because of their affiliation with the MainStay Group of Funds, New York Life Insurance Company and/or its affiliates, including New York Life Investment Management LLC, NYLIM Service Company LLC, NYLIFE Securities LLC and/or NYLIFE Distributors LLC, as described in detail in the column captioned “Principal Occupation(s) During Past Five Years.” Officers are elected annually by the Board. |
| | ** | Includes prior service as an officer of MainStay VP Series Fund, Inc., the predecessor to MainStay VP Funds Trust. |
This page intentionally left blank
This page intentionally left blank
This page intentionally left blank
MainStay Funds
Equity
U.S. Equity
MainStay Common Stock Fund
MainStay Cornerstone Growth Fund
MainStay Epoch U.S. All Cap Fund
MainStay Epoch U.S. Equity Yield Fund
MainStay Epoch U.S. Small Cap Fund
MainStay Large Cap Growth Fund
MainStay MAP Equity Fund
MainStay S&P 500 Index Fund
MainStay U.S. Equity Opportunities Fund
International/Global Equity
MainStay Candriam Emerging Markets Equity Fund
MainStay Emerging Markets Equity Fund
MainStay Epoch Capital Growth Fund
MainStay Epoch Global Choice Fund
MainStay Epoch Global Equity Yield Fund
MainStay Epoch International Choice Fund
MainStay Epoch International Small Cap Fund
MainStay International Equity Fund
MainStay International Opportunities Fund
Income
Taxable Bond
MainStay Emerging Markets Debt Fund
MainStay Floating Rate Fund
MainStay Government Fund
MainStay High Yield Corporate Bond Fund
MainStay Indexed Bond Fund
MainStay Short Duration High Yield Fund
MainStay Total Return Bond Fund
MainStay Unconstrained Bond Fund
Municipal/Tax Advantaged Bond
MainStay California Tax Free Opportunities Fund1
MainStay High Yield Municipal Bond Fund
MainStay New York Tax Free Opportunities Fund2
MainStay Tax Advantaged Short Term Bond Fund
MainStay Tax Free Bond Fund
Money Market
MainStay Money Market Fund
Mixed Asset
MainStay Balanced Fund
MainStay Convertible Fund
MainStay Income Builder Fund
Alternative
MainStay Absolute Return Multi-Strategy Fund
MainStay Cushing Energy Income Fund
MainStay Cushing MLP Premier Fund
MainStay Cushing Renaissance Advantage Fund
Asset Allocation/Target Date
MainStay Conservative Allocation Fund
MainStay Growth Allocation Fund
MainStay Moderate Allocation Fund
MainStay Moderate Growth Allocation Fund
MainStay Retirement 2010 Fund
MainStay Retirement 2020 Fund
MainStay Retirement 2030 Fund
MainStay Retirement 2040 Fund
MainStay Retirement 2050 Fund
MainStay Retirement 2060 Fund
Manager
New York Life Investment Management LLC
New York, New York
Subadvisors
Candriam Belgium S.A.3
Brussels, Belgium
Candriam France S.A.S.3
Paris, France
Cornerstone Capital Management Holdings LLC3
New York, New York
Cushing Asset Management, LP
Dallas, Texas
Epoch Investment Partners, Inc.
New York, New York
MacKay Shields LLC3
New York, New York
Markston International LLC
White Plains, New York
NYL Investors LLC3
New York, New York
Winslow Capital Management, LLC
Minneapolis, Minnesota
Legal Counsel
Dechert LLP
Washington, District of Columbia
Independent Registered Public Accounting Firm
KPMG LLP
Philadelphia, Pennsylvania
1. Class A and Class I shares of this Fund are registered for sale in AZ, CA, MI, NV, OR, TX, UT and WA. Class I shares are registered for sale in CO, FL, GA, HI, ID, MA, MD, NH, NJ and NY.
2. This Fund is registered for sale in CA, CT, DE, FL, MA, NJ, NY and VT.
3. An affiliate of New York Life Investment Management LLC.
Not part of the Annual Report
For more information
800-MAINSTAY (624-6782)
mainstayinvestments.com
MainStay Investments® is a registered service mark and name under which New York Life Investment Management LLC does business. MainStay Investments, an indirect subsidiary of New York Life Insurance Company, New York, NY 10010, provides investment advisory products and services. The MainStay Funds® are managed by New York Life Investment Management LLC and distributed by NYLIFE Distributors LLC, 30 Hudson Street, Jersey City, NJ 07302, a wholly owned subsidiary of New York Life Insurance Company. NYLIFE Distributors LLC is a Member FINRA/SIPC.
©2017 NYLIFE Distributors LLC. All rights reserved.
| | | | | | | | |
| Not FDIC/NCUA Insured | | Not a Deposit | | May Lose Value | | No Bank Guarantee | | Not Insured by Any Government Agency |
| | |
| 1717391 MS286-17 | | MSEMD11-12/17 (NYLIM) NL218 |
MainStay International Equity Fund
Message from the President and Annual Report
October 31, 2017


This page intentionally left blank
Message from the President
The 12 months ended October 31, 2017, brought strong performance to equity markets in the United States and abroad.
According to FTSE-Russell data for the U.S. market, stocks at all capitalization levels earned solid double-digit overall returns during the reporting period. Total returns for stocks in general exceeded 20% at all capitalization levels. Growth stocks were particularly strong, outperforming value stocks for companies of all sizes except among microcaps, where value stocks outperformed growth stocks.
Several factors contributed to the strength of domestic and international stock markets during the reporting period. Following the U.S. presidential election in November 2016, many investors looked forward to business tax incentives and possible tax cuts for consumers that could stimulate economic growth. During the reporting period, corporate earnings reports remained strong; and growth in U.S. real gross domestic product remained positive, with a substantial advance during the second quarter of 2017. Developed international markets and emerging markets were also strong, boosted by positive macroeconomic data and growing confidence that Europe was well on its way to financial recovery. Despite wide variations among emerging markets, many saw strong appreciation in local-currency terms and benefited from a weaker U.S. dollar.
During the reporting period, the Federal Open Market Committee raised the federal funds target range three times—in December of 2016 and in March and June of 2017. These incremental increases raised the federal funds target range to 1.00% to 1.25% by the end of the reporting period. These tightening moves were followed by higher U.S. Treasury yields at all maturities, with the greatest increases at the short-end of the maturity spectrum.
As interest rates rise, bond prices tend to decline (and vice versa). As a result, some portions of the U.S. Treasury market recorded negative total returns during the reporting period. Agency securities posted small but positive total returns, as did
asset-backed and mortgage-backed securities. Other bond categories, particularly those with looser ties to U.S. interest rates, did considerably better. Emerging-market debt recorded solid single-digit returns; high-yield bonds were generally stronger; and convertible bonds, which are closely tied to the performance of underlying stocks, provided some of the strongest overall returns of any fixed-income sector during the reporting period.
At MainStay, we have always encouraged investors to diversify their investments and maintain a long-term perspective, even when markets are strong. Asset classes that perform well in one environment may perform differently in another; and in today’s ever-changing world, wide market swings are not unknown.
MainStay offers Funds with a wide array of investment objectives to help our shareholders pursue the appropriate diversification for their long-range financial goals. We also offer several investment boutiques, allowing our shareholders to choose the style—or mix of styles—that’s best suited to their investment needs. We believe that relatively few individual investors can match the level of professional experience and market insight that our portfolio managers provide.
The report that follows provides more detailed information on the specific markets, investment strategies and portfolio decisions that affected your MainStay Fund during the 12 months ended October 31, 2017. We encourage you to read the report carefully and use it to help you evaluate your progress toward your financial goals.
Sincerely,

Kirk C. Lehneis
President
The opinions expressed are as of the date of this report and are subject to change. There is no guarantee that any forecast made will come to pass. This material does not constitute investment advice and is not intended as an endorsement of any specific investment. Past performance is no guarantee of future results.
Not part of the Annual Report
Table of Contents
Investors should refer to the Fund’s Summary Prospectus and/or Prospectus and consider the Fund’s investment objectives, strategies, risks, charges and expenses carefully before investing. The Summary Prospectus and/or Prospectus contain this and other information about the Fund. You may obtain copies of the Fund’s Summary Prospectus, Prospectus and Statement of Additional Information free of charge, upon request, by calling toll-free 800-MAINSTAY (624-6782), by writing to NYLIFE Distributors LLC, Attn: MainStay Marketing Department, 30 Hudson Street, Jersey City, NJ 07302 or by sending an e-mail to MainStayShareholderServices@nylim.com. These documents are also available via the MainStay Funds’ website at mainstayinvestments.com/documents. Please read the Summary Prospectus and/or Prospectus carefully before investing.
Investment and Performance Comparison1 (Unaudited)
Performance data quoted represents past performance. Past performance is no guarantee of future results. Because of market volatility and other factors, current performance may be lower or higher than the figures shown. Investment return and principal value will fluctuate, and as a result, when shares are redeemed, they may be worth more or less than their original cost. The graph below depicts the historical performance of Class B shares2 of the Fund. Performance will vary from class to class based on differences in class-specific expenses and sales charges. For performance information current to the most recent month-end, please call 800-MAINSTAY (624-6782) or visit mainstayinvestments.com.

Average Annual Total Returns for the Year-Ended October 31, 2017
| | | | | | | | | | | | | | | | | | | | | | | | |
| Class | | Sales Charge | | | | Inception
Date | | | One Year | | | Five
Years | | | Ten Years
or Since
Inception | | | Gross
Expense
Ratio3 | |
| Class A Shares | | Maximum 5.5% Initial Sales Charge | | With sales charges Excluding sales charges | | | 1/3/1995 | | |
| 14.90
21.59 | %
| |
| 6.23
7.44 | %
| |
| 1.44
2.01 | %
| |
| 1.33
1.33 | %
|
| Investor Class Shares | | Maximum 5.5% Initial Sales Charge | | With sales charges Excluding sales charges | | | 2/28/2008 | | |
| 14.48
21.15 |
| |
| 5.87
7.07 |
| |
| 2.25
2.85 |
| |
| 1.70
1.70 |
|
| Class B Shares2 | | Maximum 5% CDSC
if Redeemed Within the
First Six Years of Purchase | | With sales charges Excluding sales charges | | | 9/13/1994 | | |
| 15.25
20.25 |
| |
| 5.94
6.26 |
| |
| 0.92
0.92 |
| |
| 2.45
2.45 |
|
| Class C Shares | | Maximum 1% CDSC if Redeemed Within One Year of Purchase | | With sales charges Excluding sales charges | | | 9/1/1998 | | |
| 19.33
20.33 |
| |
| 6.28
6.28 |
| |
| 0.93
0.93 |
| |
| 2.45
2.45 |
|
| Class I Shares | | No Sales Charge | | | | | 1/2/2004 | | | | 21.94 | | | | 7.72 | | | | 2.29 | | | | 1.08 | |
| Class R1 Shares | | No Sales Charge | | | | | 1/2/2004 | | | | 21.78 | | | | 7.61 | | | | 2.19 | | | | 1.18 | |
| Class R2 Shares | | No Sales Charge | | | | | 1/2/2004 | | | | 21.55 | | | | 7.35 | | | | 1.94 | | | | 1.42 | |
| Class R3 Shares | | No Sales Charge | | | | | 4/28/2006 | | | | 21.21 | | | | 7.08 | | | | 1.68 | | | | 1.68 | |
| 1. | The performance table and graph do not reflect the deduction of taxes that a shareholder would pay on distributions or Fund share redemptions. Total returns reflect maximum applicable sales charges as indicated in the table above, if any, changes in share price, and reinvestment of dividend and capital gain distributions. The graph assumes the initial investment amount shown above and reflects the deduction of all sales charges that would have applied for the period of investment. Performance figures may reflect certain fee waivers and/or expense limitations, without which total returns may have |
| | been lower. For more information on share classes and current fee waivers and/or expense limitations (if any), please refer to the Notes to Financial Statements. |
| 2. | Class B shares are closed to all new purchases as well as additional investments by existing Class B shareholders. |
| 3. | The gross expense ratios presented reflect the Fund’s “Total Annual Fund Operating Expenses” from the most recent Prospectus and may differ from other expense ratios disclosed in this report. |
The footnotes on the next page are an integral part of the table and graph and should be carefully read in conjunction with them.
| | | | | | | | | | | | |
| Benchmark Performance | | One
Year | | | Five
Years | | | Ten Years
or Since
Inception | |
MSCI ACWI® Ex U.S. Index4 | | | 23.64 | % | | | 7.29 | % | | | 0.92 | % |
MSCI EAFE® Index5 | | | 23.44 | | | | 8.53 | | | | 1.10 | |
Morningstar Foreign Large Growth Category Average6 | | | 25.00 | | | | 9.13 | | | | 1.90 | |
| 4. | The Fund has selected the MSCI ACWI® Ex U.S. Index as its primary broad-based securities market index. The MSCI ACWI® Ex U.S. Index is a free float-adjusted market capitalization weighted index that is designed to measure the equity market performance of developed and emerging markets, excluding the U.S. Results assume reinvestment of all income and capital gains. An investment cannot be made directly in an index. |
| 5. | The MSCI EAFE® Index is the Fund’s secondary benchmark. The MSCI EAFE® Index consists of international stocks representing the developed world outside of North America. Results assume reinvestment of all income and capital gains. An investment cannot be made directly in an index. |
| 6. | The Morningstar Foreign Large Growth Category Average is representative of funds that focus on high-priced growth stocks, mainly outside of the United States. Most of these portfolios divide their assets among a dozen or more developed markets, including Japan, Britain, France, and Germany. These portfolios primarily invest in stocks that have market caps in the top 70% of each economically integrated market and will have less than 20% of assets invested in U.S. stocks. Results are based on average total returns of similar funds with all dividends and capital gain distributions reinvested. |
The footnotes on the preceding page are an integral part of the table and graph and should be carefully read in conjunction with them.
| | |
| 6 | | MainStay International Equity Fund |
Cost in Dollars of a $1,000 Investment in MainStay International Equity Fund (Unaudited)
The example below is intended to describe the fees and expenses borne by shareholders during the six-month period from May 1, 2017, to October 31, 2017, and the impact of those costs on your investment.
Example
As a shareholder of the Fund you incur two types of costs: (1) transaction costs, including exchange fees and sales charges (loads) on purchases (as applicable), and (2) ongoing costs, including management fees, distribution and/or service (12b-1) fees, and other Fund expenses (as applicable). This example is intended to help you understand your ongoing costs (in dollars) of investing in the Fund and to compare these costs with the ongoing costs of investing in other mutual funds. The example is based on an investment of $1,000 made at the beginning of the six-month period and held for the entire period from May 1, 2017, to October 31, 2017.
This example illustrates your Fund’s ongoing costs in two ways:
Actual Expenses
The second and third data columns in the table below provide information about actual account values and actual expenses. You may use the information in these columns, together with the amount you invested, to estimate the expenses that you paid during the six months ended October 31, 2017. Simply divide your account value by $1,000 (for example, an $8,600 account value divided by $1,000 = 8.6), then
multiply the result by the number under the heading entitled “Expenses Paid During Period” to estimate the expenses you paid on your account during this period.
Hypothetical Example for Comparison Purposes
The fourth and fifth data columns in the table below provide information about hypothetical account values and hypothetical expenses based on the Fund’s actual expense ratio and an assumed rate of return of 5% per year before expenses, which is not the Fund’s actual return. The hypothetical account values and expenses may not be used to estimate the actual ending account balances or expenses you paid for the six-month period shown. You may use this information to compare the ongoing costs of investing in the Fund with the ongoing costs of investing in other mutual funds. To do so, compare this 5% hypothetical example with the 5% hypothetical examples that appear in the shareholder reports of the other mutual funds.
Please note that the expenses shown in the table are meant to highlight your ongoing costs only and do not reflect any transactional costs, such as exchange fees or sales charges (loads). Therefore, the fourth and fifth data columns of the table are useful in comparing ongoing costs only and will not help you determine the relative total costs of owning different funds. In addition, if these transactional costs were included, your costs would have been higher.
| | | | | | | | | | | | | | | | | | | | | | |
| | | | | | | | | | | | | | | | | | |
| Share Class | | Beginning
Account
Value
5/1/17 | | | Ending Account
Value (Based
on Actual
Returns and
Expenses)
10/31/17 | | | Expenses
Paid
During
Period1 | | | Ending Account
Value (Based
on Hypothetical
5% Annualized
Return and
Actual Expenses)
10/31/17 | | | Expenses
Paid
During
Period1 | | | Net Expense
Ratio
During
Period2 |
| | | | | | |
| Class A Shares | | $ | 1,000.00 | | | $ | 1,109.80 | | | $ | 7.02 | | | $ | 1,018.60 | | | $ | 6.72 | | | 1.32% |
| | | | | | |
| Investor Class Shares | | $ | 1,000.00 | | | $ | 1,108.30 | | | $ | 8.82 | | | $ | 1,016.80 | | | $ | 8.44 | | | 1.66% |
| | | | | | |
| Class B Shares | | $ | 1,000.00 | | | $ | 1,103.90 | | | $ | 12.83 | | | $ | 1,013.00 | | | $ | 12.28 | | | 2.42% |
| | | | | | |
| Class C Shares | | $ | 1,000.00 | | | $ | 1,104.70 | | | $ | 12.84 | | | $ | 1,013.00 | | | $ | 12.28 | | | 2.42% |
| | | | | | |
| Class I Shares | | $ | 1,000.00 | | | $ | 1,112.00 | | | $ | 5.70 | | | $ | 1,019.80 | | | $ | 5.45 | | | 1.07% |
| | | | | | |
| Class R1 Shares | | $ | 1,000.00 | | | $ | 1,111.30 | | | $ | 6.23 | | | $ | 1,019.30 | | | $ | 5.95 | | | 1.17% |
| | | | | | |
| Class R2 Shares | | $ | 1,000.00 | | | $ | 1,110.10 | | | $ | 7.55 | | | $ | 1,018.00 | | | $ | 7.22 | | | 1.42% |
| | | | | | |
| Class R3 Shares | | $ | 1,000.00 | | | $ | 1,108.90 | | | $ | 8.88 | | | $ | 1,016.80 | | | $ | 8.49 | | | 1.67% |
| 1. | Expenses are equal to the Fund’s annualized expense ratio of each class multiplied by the average account value over the period, divided by 365 and multiplied by 184 (to reflect the six-month period). The table above represents the actual expenses incurred during the six-month period. |
| 2. | Expenses are equal to the Fund’s annualized expense ratio to reflect the six-month period. |
Country Composition as of October 31, 2017 (Unaudited)
| | | | |
| United Kingdom | | | 16.2 | % |
| United States | | | 11.9 | |
| Japan | | | 11.3 | |
| Germany | | | 11.0 | |
| Switzerland | | | 5.2 | |
| Netherlands | | | 4.4 | |
| Belgium | | | 3.9 | |
| Canada | | | 3.9 | |
| India | | | 3.4 | |
| Sweden | | | 3.1 | |
| Israel | | | 2.9 | |
| China | | | 2.5 | |
| | | | |
| Taiwan | | | 2.2 | % |
| Italy | | | 2.1 | |
| Spain | | | 2.1 | |
| Australia | | | 2.0 | |
| Brazil | | | 1.9 | |
| Thailand | | | 1.9 | |
| Jordan | | | 1.8 | |
| Denmark | | | 1.7 | |
| Ireland | | | 1.7 | |
| Mexico | | | 0.8 | |
| Other Assets, Less Liabilities | | | 2.1 | |
| | | | |
| | | 100.0 | % |
| | | | |
See Portfolio of Investments beginning on page 11 for specific holdings within these categories.
Top Ten Holdings as of October 31, 2017 (excluding short-term investment) (Unaudited)
| 2. | Fresenius Medical Care A.G. & Co. KGaA |
| 4. | United Internet A.G., Registered |
| | |
| 8 | | MainStay International Equity Fund |
Portfolio Management Discussion and Analysis (Unaudited)
Questions answered by portfolio managers Carlos Garcia-Tunon, CFA, Ian Murdoch and Lawrence Rosenberg of Cornerstone Capital Management Holdings LLC, the Fund’s Subadvisor.
How did MainStay International Equity Fund perform relative to its benchmarks and peers during the 12 months ended October 31, 2017?
Excluding all sales charges, MainStay International Equity Fund returned 21.59% for Class A shares, 21.15% for Investor Class shares, 20.25% for Class B shares and 20.33% for Class C shares for the 12 months ended October 31, 2017. Over the same period, the Fund’s Class I shares returned 21.94%, Class R1 shares returned 21.78%, Class R2 shares returned 21.55% and Class R3 shares returned 21.21%. For the 12 months ended October 31, 2017, all share classes underperformed the 23.64% return of the MSCI ACWI® Ex U.S. Index,1 which is the Fund’s primary benchmark; the 23.44% return of the MSCI EAFE® Index,1 which is the Fund’s secondary benchmark; and the 25.00% return of the Morningstar Foreign Large Growth Category Average.2 See page 5 for Fund returns with applicable sales charges.
Were there any changes to the Fund since the semiannual report?
Effective August 1, 2017, Ian Murdoch and Lawrence Rosenberg were added as portfolio managers of the Fund and Edward Ramos was removed as a portfolio manager of the Fund. Carlos Garcia-Tunon continued to serve as a portfolio manager of the Fund. For more information about these changes see the prospectus supplement dated August 1, 2017.
What factors affected the Fund’s relative performance during the reporting period?
The Fund’s performance relative to the MSCI ACWI® Ex U.S. Index suffered from negative contributions from country allocation and stock selection on a sector basis, partially offset by contributions from stock selection on a country basis and sector allocation. (Contributions take weightings and total returns into account.) The negative effect from country allocation was driven primarily by overweight allocations relative to the MSCI ACWI® Ex U.S. Index in Ireland and Israel, coupled with an underweight position in France. Stock selection on a sector basis was negative in information technology, health care and consumer staples. The positive effect of stock selection on a country basis was driven by notable strength in Israel, Switzerland and Germany. The positive effect from sector allocation was mainly driven by an overweight allocation relative to the MSCI ACWI® Ex U.S. Index in the information technology sector. Underweight positions relative to the Index in the telecommunication services and consumer staples sectors also contributed positively to the Fund’s relative performance.
During the reporting period, which sectors were the strongest contributors to the Fund’s relative performance and which sectors were particularly weak?
The sectors that made the strongest positive contributions to the Fund’s performance relative to the MSCI ACWI® Ex U.S. Index were information technology, real estate and consumer discretionary. Information technology benefited from favorable allocation, partially offset by a negative contribution from stock selection. Real estate benefited from both positive stock selection and a positive allocation effect. Consumer discretionary benefited from positive stock selection, with the allocation effect being very modestly negative. The Fund held overweight positions in the information technology and consumer discretionary sectors, of which information technology outperformed the MSCI ACWI® Ex U.S. Index and consumer discretionary underperformed. The Fund held an underweight position in the real estate sector, which underperformed the MSCI ACWI® Ex U.S. Index.
The sectors that made the weakest contributions to the Fund’s performance relative to the MSCI ACWI® Ex U.S. Index were health care, materials and consumer staples. All three sectors suffered from unfavorable stock selection effects, with sector allocation being negative for health care and materials and positive for consumer staples. The Fund held an overweight position relative to the MSCI ACWI® Ex U.S. Index in the health care sector, which underperformed the Index, and underweight positions in the materials and consumer staples sectors, of which the materials sector outperformed the Index and the consumer staples sector underperformed.
During the reporting period, which individual stocks made the strongest contributions to the Fund’s absolute performance and which stocks detracted the most?
The stocks that made the strongest positive contributions to the Fund’s absolute performance during the reporting period were Swiss connectivity and sensor solutions manufacturer TE Connectivity, U.K.-domiciled global life insurer Prudential PLC and Japanese online apparel shopping site operator Start Today. Each of these stocks contributed positively to absolute performance on continued strong growth and strategy execution.
The most significant detractors from the Fund’s absolute performance were Japanese provider of clinical test reagents and related equipment Sysmex, Indian generic pharmaceutical company Lupin Limited and Chinese biopharmaceutical company China Biologic Products. Sysmex underperformed following sluggish business trends, notably in China. Shares of Lupin declined on higher generic pricing pressure owing to a more
| 1. | See footnote on page 6 for more information on this index. |
| 2. | See footnote on page 6 for more information on Morningstar Foreign Large Growth Category Average. |
efficient Food and Drug Administration (FDA) approval process and channel consolidation in the United States. China Biologic Products suffered from increased industry competition, which hurt the company’s sales and profit growth.
Did the Fund make any significant purchases or sales during the reporting period?
Notable purchases during the reporting period included German Internet payments and processing company Wirecard, Japanese corporate fringe-benefits outsourcer Relo Group and Canadian software holding company Constellation Software. Notable sales during the reporting period included Sysmex, China Biologic Products and Irish private label over-the-counter pharmaceutical company Perrigo.
How did the Fund’s sector weightings change during the reporting period?
During the reporting period, the Fund increased its exposure to the financials and information technology sectors. Over the same period, the Fund reduced its exposure to the health care, consumer staples and utilities sectors.
How was the Fund positioned at the end of the reporting period?
As of October 31, 2017, the Fund held overweight positions relative to the MSCI ACWI® Ex U.S. Index in the information technology, health care and consumer discretionary sectors. As of the same date, the Fund held underweight positions in the financials, energy and materials sectors.
The opinions expressed are those of the portfolio managers as of the date of this report and are subject to change. There is no guarantee that any forecasts will come to pass. This material does not constitute investment advice and is not intended as an endorsement of any specific investment.
| | |
| 10 | | MainStay International Equity Fund |
Portfolio of Investments October 31, 2017
| | | | | | | | |
| | | Shares | | | Value | |
| Common Stocks 97.7%† | |
Australia 2.0% | |
Corporate Travel Management, Ltd. (Hotels, Restaurants & Leisure) | | | 188,212 | | | $ | 3,462,914 | |
Gateway Lifestyle (Real Estate Management & Development) | | | 1,694,883 | | | | 2,555,442 | |
| | | | | | | | |
| | | | | | | 6,018,356 | |
| | | | | | | | |
Belgium 3.9% | |
Ontex Group N.V. (Personal Products) | | | 188,865 | | | | 6,642,879 | |
UCB S.A. (Pharmaceuticals) | | | 70,426 | | | | 5,126,410 | |
| | | | | | | | |
| | | | | | | 11,769,289 | |
| | | | | | | | |
Brazil 1.9% | |
Cielo S.A. (IT Services) | | | 839,640 | | | | 5,744,243 | |
| | | | | | | | |
|
Canada 3.9% | |
Bank of Nova Scotia (Banks) | | | 70,900 | | | | 4,576,817 | |
Constellation Software, Inc. (Software) | | | 12,500 | | | | 7,111,658 | |
| | | | | | | | |
| | | | | | | 11,688,475 | |
| | | | | | | | |
China 2.5% | |
51job, Inc., ADR (Professional Services) (a) | | | 47,256 | | | | 2,925,147 | |
NetEase, Inc., ADR (Internet Software & Services) | | | 16,798 | | | | 4,735,692 | |
| | | | | | | | |
| | | | | | | 7,660,839 | |
| | | | | | | | |
Denmark 1.7% | |
Novo Nordisk A/S, Class B (Pharmaceuticals) | | | 104,733 | | | | 5,210,214 | |
| | | | | | | | |
|
Germany 11.0% | |
¨Fresenius Medical Care A.G. & Co. KGaA (Health Care Providers & Services) | | | 112,825 | | | | 10,910,833 | |
Scout24 A.G. (Internet Software & Services) (b) | | | 99,769 | | | | 3,993,177 | |
¨United Internet A.G., Registered (Internet Software & Services) | | | 150,515 | | | | 9,522,027 | |
¨Wirecard A.G. (IT Services) | | | 92,152 | | | | 9,075,868 | |
| | | | | | | | |
| | | | | | | 33,501,905 | |
| | | | | | | | |
India 3.4% | |
Housing Development Finance Corp., Ltd. (Thrifts & Mortgage Finance) | | | 203,411 | | | | 5,341,752 | |
Yes Bank, Ltd. (Banks) | | | 1,022,950 | | | | 4,968,563 | |
| | | | | | | | |
| | | | | | | 10,310,315 | |
| | | | | | | | |
Ireland 1.7% | |
Paddy Power Betfair PLC (Hotels, Restaurants & Leisure) | | | 50,517 | | | | 5,166,565 | |
| | | | | | | | |
|
Israel 2.9% | |
Check Point Software Technologies, Ltd. (Software) (a) | | | 73,623 | | | | 8,666,163 | |
| | | | | | | | |
| | | | | | | | |
| | | Shares | | | Value | |
Italy 2.1% | |
Banca IFIS S.p.A. (Diversified Financial Services) | | | 52,274 | | | $ | 2,850,324 | |
De’Longhi S.p.A. (Household Durables) | | | 108,637 | | | | 3,562,263 | |
| | | | | | | | |
| | | | | | | 6,412,587 | |
| | | | | | | | |
Japan 11.3% | |
CyberAgent, Inc. (Media) | | | 255,300 | | | | 7,858,493 | |
Relo Group, Inc. (Real Estate Management & Development) | | | 337,600 | | | | 8,331,257 | |
¨Start Today Co., Ltd. (Internet & Direct Marketing Retail) | | | 322,896 | | | | 8,774,888 | |
¨Tsuruha Holdings, Inc. (Food & Staples Retailing) | | | 75,488 | | | | 9,314,425 | |
| | | | | | | | |
| | | | | | | 34,279,063 | |
| | | | | | | | |
Jordan 1.8% | |
Hikma Pharmaceuticals PLC (Pharmaceuticals) | | | 360,075 | | | | 5,566,639 | |
| | | | | | | | |
|
Mexico 0.8% | |
Banregio Grupo Financiero S.A.B. de C.V. (Banks) | | | 456,087 | | | | 2,432,718 | |
| | | | | | | | |
|
Netherlands 4.4% | |
GrandVision N.V. (Specialty Retail) (b) | | | 179,032 | | | | 4,469,127 | |
IMCD Group N.V. (Trading Companies & Distributors) | | | 59,352 | | | | 3,733,352 | |
Koninklijke Philips N.V. (Health Care Equipment & Supplies) | | | 128,880 | | | | 5,247,647 | |
| | | | | | | | |
| | | | | | | 13,450,126 | |
| | | | | | | | |
Spain 2.1% | |
Grifols S.A. (Biotechnology) | | | 207,224 | | | | 6,487,216 | |
| | | | | | | | |
|
Sweden 3.1% | |
¨Hexagon AB, Class B (Electronic Equipment, Instruments & Components) | | | 182,716 | | | | 9,369,716 | |
| | | | | | | | |
|
Switzerland 5.2% | |
DKSH Holding A.G. (Professional Services) | | | 34,040 | | | | 2,854,153 | |
¨TE Connectivity, Ltd. (Electronic Equipment, Instruments & Components) | | | 113,252 | | | | 10,302,535 | |
Tecan Group A.G., Registered (Life Sciences Tools & Services) | | | 11,974 | | | | 2,532,465 | |
| | | | | | | | |
| | | | | | | 15,689,153 | |
| | | | | | | | |
Taiwan 2.2% | |
Taiwan Semiconductor Manufacturing Co., Ltd., Sponsored ADR (Semiconductors & Semiconductor Equipment) | | | 159,306 | | | | 6,743,423 | |
| | | | | | | | |
| † | Percentages indicated are based on Fund net assets. |
| ¨ | | Among the Fund's 10 largest holdings, as of October 31, 2017, excluding short-term investment. May be subject to change daily. (Unaudited) |
| | | | | | |
The notes to the financial statements are an integral part of,
and should be read in conjunction with, the financial statements. | | | | | 11 | |
Portfolio of Investments October 31, 2017 (continued)
| | | | | | | | |
| | | Shares | | | Value | |
| Common Stocks (continued) | |
Thailand 1.9% | |
Kasikornbank PCL (Banks) | | | 854,344 | | | $ | 5,863,649 | |
| | | | | | | | |
|
United Kingdom 16.2% | |
Big Yellow Group PLC (Equity Real Estate Investment Trusts) | | | 202,713 | | | | 2,093,289 | |
BTG PLC (Pharmaceuticals) (a) | | | 507,001 | | | | 5,077,235 | |
¨Experian PLC (Professional Services) | | | 412,696 | | | | 8,693,218 | |
HomeServe PLC (Commercial Services & Supplies) | | | 289,180 | | | | 3,287,677 | |
Johnson Matthey PLC (Chemicals) | | | 193,518 | | | | 8,689,878 | |
¨Prudential PLC (Insurance) | | | 520,801 | | | | 12,810,318 | |
Telit Communications PLC (Communications Equipment) | | | 54,800 | | | | 125,004 | |
Whitbread PLC (Hotels, Restaurants & Leisure) | | | 171,771 | | | | 8,425,124 | |
| | | | | | | | |
| | | | | | | 49,201,743 | |
| | | | | | | | |
United States 11.7% | |
Accenture PLC, Class A (IT Services) | | | 55,835 | | | | 7,948,670 | |
ICON PLC (Life Sciences Tools & Services) (a) | | | 52,886 | | | | 6,286,030 | |
¨LivaNova PLC (Health Care Equipment & Supplies) (a) | | | 119,301 | | | | 8,816,344 | |
Samsonite International S.A. (Textiles, Apparel & Luxury Goods) | | | 1,517,400 | | | | 6,340,816 | |
Shire PLC (Biotechnology) | | | 123,095 | | | | 6,083,412 | |
| | | | | | | | |
| | | | | | | 35,475,272 | |
| | | | | | | | |
Total Common Stocks
(Cost $239,231,272) | | | | | | | 296,707,669 | |
| | | | | | | | |
| | | | | | | | |
| | | Principal
Amount | | | Value | |
| Short-Term Investment 0.2% | |
Repurchase Agreement 0.2% | | | | | | | | |
United States 0.2% | |
Fixed Income Clearing Corp.
0.34%, dated 10/31/17
due 11/1/17
Proceeds at Maturity $607,883 (Collateralized by a United States Treasury Note with a rate of 1.625% and a maturity date of 4/30/23, with a Principal Amount of $635,000 and a Market Value of $620,067) (Capital Markets) | | $ | 607,878 | | | $ | 607,878 | |
| | | | | | | | |
Total Short-Term Investment (Cost $607,878) | | | | | | | 607,878 | |
| | | | | | | | |
Total Investments
(Cost $239,839,150) | | | 97.9 | % | | | 297,315,547 | |
Other Assets, Less Liabilities | | | 2.1 | | | | 6,312,718 | |
Net Assets | | | 100.0 | % | | $ | 303,628,265 | |
| (a) | Non-income producing security. |
| (b) | May be sold to institutional investors only under Rule 144A or securities offered pursuant to Section 4(a)(2) of the Securities Act of 1933, as amended. |
The following abbreviation is used in the preceding pages:
ADR—American Depositary Receipt
The following is a summary of the fair valuations according to the inputs used as of October 31, 2017, for valuing the Fund’s assets.
Asset Valuation Inputs
| | | | | | | | | | | | | | | | |
Description | | Quoted
Prices in
Active
Markets for
Identical
Assets
(Level 1) | | | Significant
Other
Observable
Inputs (Level 2) | | | Significant
Unobservable
Inputs (Level 3) | | | Total | |
| Investments in Securities (a) | | | | | | | | | | | | | | | | |
| Common Stocks | | $ | 296,707,669 | | | $ | — | | | $ | — | | | $ | 296,707,669 | |
| Short-Term Investment | | | | | | | | | | | | | | | | |
Repurchase Agreement | | | — | | | | 607,878 | | | | — | | | | 607,878 | |
| | | | | | | | | | | | | | | | |
| Total Investments in Securities | | $ | 296,707,669 | | | $ | 607,878 | | | $ | — | | | $ | 297,315,547 | |
| | | | | | | | | | | | | | | | |
| (a) | For a complete listing of investments and their industries, see the Portfolio of Investments. |
The Fund recognizes transfers between the levels as of the beginning of the period.
For the year ended October 31, 2017, the Fund did not have any transfers among levels. (See Note 2)
As of October 31, 2017, the Fund did not hold any investments with significant unobservable inputs (Level 3). (See Note 2)
| | | | |
| 12 | | MainStay International Equity Fund | | The notes to the financial statements are an integral part of,
and should be read in conjunction with, the financial statements. |
The table below sets forth the diversification of MainStay International Equity Fund investments by industry.
Industry Diversification (Unaudited)
| | | | | | | | |
| | | Value | | | Percent † | |
Banks | | $ | 17,841,747 | | | | 5.9 | % |
Biotechnology | | | 12,570,628 | | | | 4.1 | |
Capital Markets | | | 607,878 | | | | 0.2 | |
Chemicals | | | 8,689,878 | | | | 2.9 | |
Commercial Services & Supplies | | | 3,287,677 | | | | 1.1 | |
Communications Equipment | | | 125,004 | | | | 0.0 | ‡ |
Diversified Financial Services | | | 2,850,324 | | | | 0.9 | |
Electronic Equipment, Instruments & Components | | | 19,672,251 | | | | 6.5 | |
Equity Real Estate Investment Trusts | | | 2,093,289 | | | | 0.7 | |
Food & Staples Retailing | | | 9,314,425 | | | | 3.1 | |
Health Care Equipment & Supplies | | | 14,063,991 | | | | 4.6 | |
Health Care Providers & Services | | | 10,910,833 | | | | 3.6 | |
Hotels, Restaurants & Leisure | | | 17,054,603 | | | | 5.6 | |
Household Durables | | | 3,562,263 | | | | 1.2 | |
Insurance | | | 12,810,318 | | | | 4.2 | |
Internet & Direct Marketing Retail | | | 8,774,888 | | | | 2.9 | |
Internet Software & Services | | | 18,250,896 | | | | 6.0 | |
IT Services | | | 22,768,781 | | | | 7.5 | |
Life Sciences Tools & Services | | | 8,818,495 | | | | 2.9 | |
Media | | | 7,858,493 | | | | 2.6 | |
Personal Products | | | 6,642,879 | | | | 2.2 | |
Pharmaceuticals | | | 20,980,498 | | | | 6.9 | |
Professional Services | | | 14,472,518 | | | | 4.8 | |
Real Estate Management & Development | | | 10,886,699 | | | | 3.6 | |
Semiconductors & Semiconductor Equipment | | | 6,743,423 | | | | 2.2 | |
Software | | | 15,777,821 | | | | 5.2 | |
Specialty Retail | | | 4,469,127 | | | | 1.5 | |
Textiles, Apparel & Luxury Goods | | | 6,340,816 | | | | 2.1 | |
Thrifts & Mortgage Finance | | | 5,341,752 | | | | 1.7 | |
Trading Companies & Distributors | | | 3,733,352 | | | | 1.2 | |
| | | | | | | | |
| | | 297,315,547 | | | | 97.9 | |
Other Assets, Less Liabilities | | | 6,312,718 | | | | 2.1 | |
| | | | | | | | |
Net Assets | | $ | 303,628,265 | | | | 100.0 | % |
| | | | | | | | |
| † | Percentages indicated are based on Fund net assets. |
| ‡ | Less than one-tenth of a percent. |
| | | | | | |
The notes to the financial statements are an integral part of,
and should be read in conjunction with, the financial statements. | | | | | 13 | |
Statement of Assets and Liabilities as of October 31, 2017
| | | | |
| Assets | | | | |
Investment in securities, at value (identified cost $239,839,150) | | $ | 297,315,547 | |
Cash denominated in foreign currencies
(identified cost $6,700,884) | | | 6,577,431 | |
Receivables: | | | | |
Dividends and interest | | | 388,951 | |
Fund shares sold | | | 97,384 | |
Investment securities sold | | | 25,570 | |
Other assets | | | 28,496 | |
| �� | | | |
Total assets | | | 304,433,379 | |
| | | | |
| |
| Liabilities | | | | |
Payables: | | | | |
Foreign capital gains tax (See Note 2(C)) | | | 240,602 | |
Manager (See Note 3) | | | 229,583 | |
Fund shares redeemed | | | 222,768 | |
Transfer agent (See Note 3) | | | 31,563 | |
NYLIFE Distributors (See Note 3) | | | 29,371 | |
Shareholder communication | | | 25,965 | |
Professional fees | | | 9,103 | |
Custodian | | | 8,703 | |
Trustees | | | 748 | |
Investment securities purchased | | | 91 | |
Accrued expenses | | | 6,617 | |
| | | | |
Total liabilities | | | 805,114 | |
| | | | |
Net assets | | $ | 303,628,265 | |
| | | | |
| |
| Composition of Net Assets | | | | |
Shares of beneficial interest outstanding (par value of $.01 per share) unlimited number of shares authorized | | $ | 185,774 | |
Additional paid-in capital | | | 282,832,647 | |
| | | | |
| | | 283,018,421 | |
Distributions in excess of net investment income | | | (391,642 | ) |
Accumulated net realized gain (loss) on investments and foreign currency transactions (a) | | | (36,108,712 | ) |
Net unrealized appreciation (depreciation) on investments (b) | | | 57,235,795 | |
Net unrealized appreciation (depreciation) on translation of other assets and liabilities in foreign currencies | | | (125,597 | ) |
| | | | |
Net assets | | $ | 303,628,265 | |
| | | | |
| | | | |
Class A | | | | |
Net assets applicable to outstanding shares | | $ | 54,553,418 | |
| | | | |
Shares of beneficial interest outstanding | | | 3,329,850 | |
| | | | |
Net asset value per share outstanding | | $ | 16.38 | |
Maximum sales charge (5.50% of offering price) | | | 0.95 | |
| | | | |
Maximum offering price per share outstanding | | $ | 17.33 | |
| | | | |
Investor Class | | | | |
Net assets applicable to outstanding shares | | $ | 25,029,000 | |
| | | | |
Shares of beneficial interest outstanding | | | 1,538,378 | |
| | | | |
Net asset value per share outstanding | | $ | 16.27 | |
Maximum sales charge (5.50% of offering price) | | | 0.95 | |
| | | | |
Maximum offering price per share outstanding | | $ | 17.22 | |
| | | | |
Class B | | | | |
Net assets applicable to outstanding shares | | $ | 6,210,223 | |
| | | | |
Shares of beneficial interest outstanding | | | 426,713 | |
| | | | |
Net asset value and offering price per share outstanding | | $ | 14.55 | |
| | | | |
Class C | | | | |
Net assets applicable to outstanding shares | | $ | 7,563,583 | |
| | | | |
Shares of beneficial interest outstanding | | | 519,622 | |
| | | | |
Net asset value and offering price per share outstanding | | $ | 14.56 | |
| | | | |
Class I | | | | |
Net assets applicable to outstanding shares | | $ | 205,009,444 | |
| | | | |
Shares of beneficial interest outstanding | | | 12,441,227 | |
| | | | |
Net asset value and offering price per share outstanding | | $ | 16.48 | |
| | | | |
Class R1 | | | | |
Net assets applicable to outstanding shares | | $ | 2,615,575 | |
| | | | |
Shares of beneficial interest outstanding | | | 159,661 | |
| | | | |
Net asset value and offering price per share outstanding | | $ | 16.38 | |
| | | | |
Class R2 | | | | |
Net assets applicable to outstanding shares | | $ | 1,200,964 | |
| | | | |
Shares of beneficial interest outstanding | | | 73,120 | |
| | | | |
Net asset value and offering price per share outstanding | | $ | 16.42 | |
| | | | |
Class R3 | | | | |
Net assets applicable to outstanding shares | | $ | 1,446,058 | |
| | | | |
Shares of beneficial interest outstanding | | | 88,790 | |
| | | | |
Net asset value and offering price per share outstanding | | $ | 16.29 | |
| | | | |
| (a) | Realized gain (loss) on security transactions recorded net of foreign capital gains tax. |
| (b) | Unrealized appreciation (depreciation) on investments recorded net of foreign capital gains tax in the amount of $240,602. |
| | | | |
| 14 | | MainStay International Equity Fund | | The notes to the financial statements are an integral part of,
and should be read in conjunction with, the financial statements. |
Statement of Operations for the year ended October 31, 2017
| | | | |
| Investment Income (Loss) | |
Income | | | | |
Dividends (a) | | $ | 3,949,888 | |
Interest | | | 754 | |
Other income | | | 295 | |
| | | | |
Total income | | | 3,950,937 | |
| | | | |
Expenses | | | | |
Manager (See Note 3) | | | 2,515,380 | |
Transfer agent (See Note 3) | | | 372,258 | |
Distribution/Service—Class A (See Note 3) | | | 105,206 | |
Distribution/Service—Investor Class (See Note 3) | | | 78,210 | |
Distribution/Service—Class B (See Note 3) | | | 63,717 | |
Distribution/Service—Class C (See Note 3) | | | 72,109 | |
Distribution/Service—Class R2 (See Note 3) | | | 2,886 | |
Distribution/Service—Class R3 (See Note 3) | | | 6,400 | |
Registration | | | 106,219 | |
Custodian | | | 84,603 | |
Professional fees | | | 77,187 | |
Shareholder communication | | | 44,784 | |
Trustees | | | 6,926 | |
Shareholder service (See Note 3) | | | 4,926 | |
Miscellaneous | | | 34,112 | |
| | | | |
Total expenses | | | 3,574,923 | |
| | | | |
Net investment income (loss) | | | 376,014 | |
| | | | |
|
| Realized and Unrealized Gain (Loss) on Investments and Foreign Currency Transactions | |
Net realized gain (loss) on: | | | | |
Investment transactions | | | 23,471,074 | |
Foreign currency transactions | | | 269,724 | |
| | | | |
Net realized gain (loss) on investments and foreign currency transactions | | | 23,740,798 | |
| | | | |
Net change in unrealized appreciation (depreciation) on: | | | | |
Investments (b) | | | 32,009,899 | |
Translation of other assets and liabilities in foreign currencies | | | (100,154 | ) |
| | | | |
Net change in unrealized appreciation (depreciation) on investments and foreign currency transactions | | | 31,909,745 | |
| | | | |
Net realized and unrealized gain (loss) on investments and foreign currency transactions | | | 55,650,543 | |
| | | | |
Net increase (decrease) in net assets resulting from operations | | $ | 56,026,557 | |
| | | | |
| (a) | Dividends recorded net of foreign withholding taxes in the amount of $287,271. |
| (b) | Net change in unrealized appreciation (depreciation) on investments recorded net of change in foreign capital gains tax in the amount of $16,733. |
| | | | | | |
The notes to the financial statements are an integral part of,
and should be read in conjunction with, the financial statements. | | | | | 15 | |
Statements of Changes in Net Assets
for the years ended October 31, 2017 and October 31, 2016
| | | | | | | | |
| | | 2017 | | | 2016 | |
| Increase (Decrease) in Net Assets | |
Operations: | | | | | | | | |
Net investment income (loss) | | $ | 376,014 | | | $ | 1,112,367 | |
Net realized gain (loss) on investments and foreign currency transactions | | | 23,740,798 | | | | 17,018,979 | |
Net change in unrealized appreciation (depreciation) on investments and foreign currency transactions | | | 31,909,745 | | | | (16,498,874 | ) |
| | | | |
Net increase (decrease) in net assets resulting from operations | | | 56,026,557 | | | | 1,632,472 | |
| | | | |
Dividends to shareholders: | | | | | | | | |
From net investment income: | | | | | | | | |
Class A | | | (109,089 | ) | | | (21,107 | ) |
Class I | | | (939,444 | ) | | | (653,743 | ) |
Class R1 | | | (10,000 | ) | | | (5,305 | ) |
Class R2 | | | (1,310 | ) | | | — | |
| | | | |
Total dividends to shareholders | | | (1,059,843 | ) | | | (680,155 | ) |
| | | | |
Capital share transactions: | | | | | | | | |
Net proceeds from sale of shares | | | 38,670,309 | | | | 38,503,958 | |
Net asset value of shares issued to shareholders in reinvestment of dividends | | | 1,054,329 | | | | 677,340 | |
Cost of shares redeemed | | | (63,024,436 | ) | | | (94,035,967 | ) |
| | | | |
Increase (decrease) in net assets derived from capital share transactions | | | (23,299,798 | ) | | | (54,854,669 | ) |
| | | | |
Net increase (decrease) in net assets | | | 31,666,916 | | | | (53,902,352 | ) |
|
| Net Assets | |
Beginning of year | | | 271,961,349 | | | | 325,863,701 | |
| | | | |
End of year | | $ | 303,628,265 | | | $ | 271,961,349 | |
| | | | |
Distributions in excess of net investment income at end of year | | $ | (391,642 | ) | | $ | (508,194 | ) |
| | | | |
| | | | |
| 16 | | MainStay International Equity Fund | | The notes to the financial statements are an integral part of,
and should be read in conjunction with, the financial statements. |
Financial Highlights selected per share data and ratios
| | | | | | | | | | | | | | | | | | | | |
| | | Year ended October 31, | |
| Class A | | 2017 | | | 2016 | | | 2015 | | | 2014 | | | 2013 | |
Net asset value at beginning of year | | $ | 13.51 | | | $ | 13.51 | | | $ | 13.11 | | | $ | 13.37 | | | $ | 11.68 | |
| | | | | | | | | | | | | | | | | | | | |
Net investment income (loss) (a) | | | 0.00 | ‡ | | | 0.04 | | | | 0.03 | | | | 0.07 | | | | 0.05 | |
Net realized and unrealized gain (loss) on investments | | | 2.90 | | | | (0.04 | ) | | | 0.49 | | | | (0.26 | ) | | | 1.75 | |
Net realized and unrealized gain (loss) on foreign currency transactions | | | 0.01 | | | | 0.01 | | | | (0.03 | ) | | | (0.04 | ) | | | (0.01 | ) |
| | | | | | | | | | | | | | | | | | | | |
Total from investment operations | | | 2.91 | | | | 0.01 | | | | 0.49 | | | | (0.23 | ) | | | 1.79 | |
| | | | | | | | | | | | | | | | | | | | |
| Less dividends: | | | | | | | | | | | | | | | | | | | | |
From net investment income | | | (0.04 | ) | | | (0.01 | ) | | | (0.09 | ) | | | (0.03 | ) | | | (0.10 | ) |
| | | | | | | | | | | | | | | | | | | | |
Net asset value at end of year | | $ | 16.38 | | | $ | 13.51 | | | $ | 13.51 | | | $ | 13.11 | | | $ | 13.37 | |
| | | | | | | | | | | | | | | | | | | | |
Total investment return (b) | | | 21.59 | % | | | 0.05 | % | | | 3.78 | % | | | (1.76 | %) | | | 15.43 | % |
| Ratios (to average net assets)/Supplemental Data: | | | | | | | | | | | | | | | | | | | | |
Net investment income (loss) | | | 0.01 | % | | | 0.28 | %(c) | | | 0.20 | % | | | 0.51 | % | | | 0.38 | % |
Net expenses | | | 1.34 | % | | | 1.32 | %(d) | | | 1.33 | % | | | 1.34 | % | | | 1.40 | % |
Portfolio turnover rate | | | 45 | % | | | 33 | % | | | 42 | % | | | 37 | % | | | 29 | % |
Net assets at end of year (in 000’s) | | $ | 54,553 | | | $ | 41,891 | | | $ | 43,405 | | | $ | 45,882 | | | $ | 57,948 | |
| ‡ | Less than one cent per share. |
| (a) | Per share data based on average shares outstanding during the year. |
| (b) | Total investment return is calculated exclusive of sales charges and assumes the reinvestment of dividends and distributions. For periods of less than one year, total return is not annualized. |
| (c) | Without the custody fee reimbursement, net investment income (loss) would have been 0.27%. |
| (d) | Without the custody fee reimbursement, net expenses would have been 1.33%. |
| | | | | | | | | | | | | | | | | | | | |
| | | Year ended October 31, | |
| Investor Class | | 2017 | | | 2016 | | | 2015 | | | 2014 | | | 2013 | |
Net asset value at beginning of year | | $ | 13.43 | | | $ | 13.47 | | | $ | 13.07 | | | $ | 13.35 | | | $ | 11.66 | |
| | | | | | | | | | | | | | | | | | | | |
Net investment income (loss) (a) | | | (0.04 | ) | | | (0.01 | ) | | | (0.02 | ) | | | 0.03 | | | | 0.01 | |
Net realized and unrealized gain (loss) on investments | | | 2.87 | | | | (0.04 | ) | | | 0.50 | | | | (0.27 | ) | | | 1.75 | |
Net realized and unrealized gain (loss) on foreign currency transactions | | | 0.01 | | | | 0.01 | | | | (0.03 | ) | | | (0.04 | ) | | | (0.01 | ) |
| | | | | | | | | | | | | | | | | | | | |
Total from investment operations | | | 2.84 | | | | (0.04 | ) | | | 0.45 | | | | (0.28 | ) | | | 1.75 | |
| | | | | | | | | | | | | | | | | | | | |
| Less dividends: | | | | | | | | | | | | | | | | | | | | |
From net investment income | | | — | | | | — | | | | (0.05 | ) | | | — | | | | (0.06 | ) |
| | | | | | | | | | | | | | | | | | | | |
Net asset value at end of year | | $ | 16.27 | | | $ | 13.43 | | | $ | 13.47 | | | $ | 13.07 | | | $ | 13.35 | |
| | | | | | | | | | | | | | | | | | | | |
Total investment return (b) | | | 21.15 | % | | | (0.30 | %) | | | 3.43 | % | | | (2.10 | %) | | | 15.07 | % |
| Ratios (to average net assets)/Supplemental Data: | | | | | | | | | | | | | | | | | | | | |
Net investment income (loss) | | | (0.26 | %) | | | (0.11 | %)(c) | | | (0.14 | %) | | | 0.19 | % | | | 0.05 | % |
Net expenses | | | 1.69 | % | | | 1.69 | % (d) | | | 1.68 | % | | | 1.67 | % | | | 1.72 | % |
Portfolio turnover rate | | | 45 | % | | | 33 | % | | | 42 | % | | | 37 | % | | | 29 | % |
Net assets at end of year (in 000’s) | | $ | 25,029 | | | $ | 31,523 | | | $ | 34,329 | | | $ | 34,377 | | | $ | 37,457 | |
| (a) | Per share data based on average shares outstanding during the year. |
| (b) | Total investment return is calculated exclusive of sales charges and assumes the reinvestment of dividends and distributions. For periods of less than one year, total return is not annualized. |
| (c) | Without the custody fee reimbursement, net investment income (loss) would have been (0.12)%. |
| (d) | Without the custody fee reimbursement, net expenses would have been 1.70%. |
| | | | | | |
The notes to the financial statements are an integral part of,
and should be read in conjunction with, the financial statements. | | | | | 17 | |
Financial Highlights selected per share data and ratios
| | | | | | | | | | | | | | | | | | | | |
| | | Year ended October 31, | |
| Class B | | 2017 | | | 2016 | | | 2015 | | | 2014 | | | 2013 | |
Net asset value at beginning of year | | $ | 12.10 | | | $ | 12.23 | | | $ | 11.91 | | | $ | 12.26 | | | $ | 10.73 | |
| | | | | | | | | | | | | | | | | | | | |
Net investment income (loss) (a) | | | (0.14 | ) | | | (0.10 | ) | | | (0.11 | ) | | | (0.07 | ) | | | (0.08 | ) |
Net realized and unrealized gain (loss) on investments | | | 2.58 | | | | (0.04 | ) | | | 0.46 | | | | (0.24 | ) | | | 1.62 | |
Net realized and unrealized gain (loss) on foreign currency transactions | | | 0.01 | | | | 0.01 | | | | (0.03 | ) | | | (0.04 | ) | | | (0.01 | ) |
| | | | | | | | | | | | | | | | | | | | |
Total from investment operations | | | 2.45 | | | | (0.13 | ) | | | 0.32 | | | | (0.35 | ) | | | 1.53 | |
| | | | | | | | | | | | | | | | | | | | |
Net asset value at end of year | | $ | 14.55 | | | $ | 12.10 | | | $ | 12.23 | | | $ | 11.91 | | | $ | 12.26 | |
| | | | | | | | | | | | | | | | | | | | |
Total investment return (b) | | | 20.25 | % | | | (1.06 | %) | | | 2.69 | % | | | (2.85 | %) | | | 14.26 | % (c) |
| Ratios (to average net assets)/Supplemental Data: | | | | | | | | | | | | | | | | | | | | |
Net investment income (loss) | | | (1.05 | %) | | | (0.86 | %)(d) | | | (0.91 | %) | | | (0.57 | %) | | | (0.73 | %) |
Net expenses | | | 2.44 | % | | | 2.44 | % (e) | | | 2.43 | % | | | 2.42 | % | | | 2.47 | % |
Portfolio turnover rate | | | 45 | % | | | 33 | % | | | 42 | % | | | 37 | % | | | 29 | % |
Net assets at end of year (in 000’s) | | $ | 6,210 | | | $ | 6,991 | | | $ | 8,982 | | | $ | 11,058 | | | $ | 13,981 | |
| (a) | Per share data based on average shares outstanding during the year. |
| (b) | Total investment return is calculated exclusive of sales charges and assumes the reinvestment of dividends and distributions. For periods of less than one year, total return is not annualized. |
| (c) | Total investment return may reflect adjustments to conform to generally accepted accounting principles. |
| (d) | Without the custody fee reimbursement, net investment income (loss) would have been (0.87)%. |
| (e) | Without the custody fee reimbursement, net expenses would have been 2.45%. |
| | | | | | | | | | | | | | | | | | | | |
| | | Year ended October 31, | |
| Class C | | 2017 | | | 2016 | | | 2015 | | | 2014 | | | 2013 | |
Net asset value at beginning of year | | $ | 12.10 | | | $ | 12.23 | | | $ | 11.92 | | | $ | 12.26 | | | $ | 10.74 | |
| | | | | | | | | | | | | | | | | | | | |
Net investment income (loss) (a) | | | (0.14 | ) | | | (0.10 | ) | | | (0.11 | ) | | | (0.07 | ) | | | (0.08 | ) |
Net realized and unrealized gain (loss) on investments | | | 2.59 | | | | (0.04 | ) | | | 0.45 | | | | (0.24 | ) | | | 1.61 | |
Net realized and unrealized gain (loss) on foreign currency transactions | | | 0.01 | | | | 0.01 | | | | (0.03 | ) | | | (0.03 | ) | | | (0.01 | ) |
| | | | | | | | | | | | | | | | | | | | |
Total from investment operations | | | 2.46 | | | | (0.13 | ) | | | 0.31 | | | | (0.34 | ) | | | 1.52 | |
| | | | | | | | | | | | | | | | | | | | |
Net asset value at end of year | | $ | 14.56 | | | $ | 12.10 | | | $ | 12.23 | | | $ | 11.92 | | | $ | 12.26 | |
| | | | | | | | | | | | | | | | | | | | |
Total investment return (b) | | | 20.33 | % | | | (1.06 | %) | | | 2.60 | % | | | (2.77 | %) | | | 14.15 | % |
| Ratios (to average net assets)/Supplemental Data: | | | | | | | | | | | | | | | | | | | | |
Net investment income (loss) | | | (1.05 | %) | | | (0.84 | %)(c) | | | (0.90 | %) | | | (0.57 | %) | | | (0.71 | %) |
Net expenses | | | 2.44 | % | | | 2.44 | % (d) | | | 2.43 | % | | | 2.42 | % | | | 2.47 | % |
Portfolio turnover rate | | | 45 | % | | | 33 | % | | | 42 | % | | | 37 | % | | | 29 | % |
Net assets at end of year (in 000’s) | | $ | 7,564 | | | $ | 7,850 | | | $ | 8,292 | | | $ | 8,383 | | | $ | 10,088 | |
| (a) | Per share data based on average shares outstanding during the year. |
| (b) | Total investment return is calculated exclusive of sales charges and assumes the reinvestment of dividends and distributions. For periods of less than one year, total return is not annualized. |
| (c) | Without the custody fee reimbursement, net investment income (loss) would have been (0.85)%. |
| (d) | Without the custody fee reimbursement, net expenses would have been 2.45%. |
| | | | |
| 18 | | MainStay International Equity Fund | | The notes to the financial statements are an integral part of,
and should be read in conjunction with, the financial statements. |
Financial Highlights selected per share data and ratios
| | | | | | | | | | | | | | | | | | | | |
| | | Year ended October 31, | |
| Class I | | 2017 | | | 2016 | | | 2015 | | | 2014 | | | 2013 | |
Net asset value at beginning of year | | $ | 13.59 | | | $ | 13.59 | | | $ | 13.19 | | | $ | 13.45 | | | $ | 11.75 | |
| | | | | | | | | | | | | | | | | | | | |
Net investment income (loss) (a) | | | 0.05 | | | | 0.07 | | | | 0.06 | | | | 0.11 | | | | 0.08 | |
Net realized and unrealized gain (loss) on investments | | | 2.90 | | | | (0.04 | ) | | | 0.50 | | | | (0.27 | ) | | | 1.76 | |
Net realized and unrealized gain (loss) on foreign currency transactions | | | 0.01 | | | | 0.01 | | | | (0.03 | ) | | | (0.04 | ) | | | (0.01 | ) |
| | | | | | | | | | | | | | | | | | | | |
Total from investment operations | | | 2.96 | | | | 0.04 | | | | 0.53 | | | | (0.20 | ) | | | 1.83 | |
| | | | | | | | | | | | | | | | | | | | |
| Less dividends: | | | | | | | | | | | | | | | | | | | | |
From net investment income | | | (0.07 | ) | | | (0.04 | ) | | | (0.13 | ) | | | (0.06 | ) | | | (0.13 | ) |
| | | | | | | | | | | | | | | | | | | | |
Net asset value at end of year | | $ | 16.48 | | | $ | 13.59 | | | $ | 13.59 | | | $ | 13.19 | | | $ | 13.45 | |
| | | | | | | | | | | | | | | | | | | | |
Total investment return (b) | | | 21.94 | % | | | 0.29 | % | | | 4.04 | % | | | (1.49 | %) | | | 15.72 | % |
Net investment income (loss) | | | 0.31 | % | | | 0.54 | %(c) | | | 0.46 | % | | | 0.79 | % | | | 0.62 | % |
Net expenses | | | 1.09 | % | | | 1.07 | %(d) | | | 1.08 | % | | | 1.09 | % | | | 1.14 | % |
Portfolio turnover rate | | | 45 | % | | | 33 | % | | | 42 | % | | | 37 | % | | | 29 | % |
Net assets at end of year (in 000’s) | | $ | 205,009 | | | $ | 179,274 | | | $ | 224,307 | | | $ | 223,797 | | | $ | 202,289 | |
| (a) | Per share data based on average shares outstanding during the year. |
| (b) | Total investment return is calculated exclusive of sales charges and assumes the reinvestment of dividends and distributions. Class I shares are not subject to sales charges. For periods of less than one year, total return is not annualized. |
| (c) | Without the custody fee reimbursement, net investment income (loss) would have been 0.53%. |
| (d) | Without the custody fee reimbursement, net expenses would have been 1.08%. |
| | | | | | | | | | | | | | | | | | | | |
| | | Year ended October 31, | |
| Class R1 | | 2017 | | | 2016 | | | 2015 | | | 2014 | | | 2013 | |
Net asset value at beginning of year | | $ | 13.51 | | | $ | 13.51 | | | $ | 13.11 | | | $ | 13.37 | | | $ | 11.67 | |
| | | | | | | | | | | | | | | | | | | | |
Net investment income (loss) (a) | | | 0.03 | | | | 0.06 | | | | 0.04 | | | | 0.09 | | | | 0.06 | |
Net realized and unrealized gain (loss) on investments | | | 2.89 | | | | (0.05 | ) | | | 0.50 | | | | (0.27 | ) | | | 1.76 | |
Net realized and unrealized gain (loss) on foreign currency transactions | | | 0.01 | | | | 0.01 | | | | (0.03 | ) | | | (0.04 | ) | | | (0.01 | ) |
| | | | | | | | | | | | | | | | | | | | |
Total from investment operations | | | 2.93 | | | | 0.02 | | | | 0.51 | | | | (0.22 | ) | | | 1.81 | |
| | | | | | | | | | | | | | | | | | | | |
| Less dividends: | | | | | | | | | | | | | | | | | | | | |
From net investment income | | | (0.06 | ) | | | (0.02 | ) | | | (0.11 | ) | | | (0.04 | ) | | | (0.11 | ) |
| | | | | | | | | | | | | | | | | | | | |
Net asset value at end of year | | $ | 16.38 | | | $ | 13.51 | | | $ | 13.51 | | | $ | 13.11 | | | $ | 13.37 | |
| | | | | | | | | | | | | | | | | | | | |
Total investment return (b) | | | 21.78 | % | | | 0.18 | % | | | 3.95 | % | | | (1.63 | %) | | | 15.68 | % |
| Ratios (to average net assets)/Supplemental Data: | | | | | | | | | | | | | | | | | | | | |
Net investment income (loss) | | | 0.21 | % | | | 0.41 | %(c) | | | 0.33 | % | | | 0.66 | % | | | 0.49 | % |
Net expenses | | | 1.19 | % | | | 1.17 | %(d) | | | 1.18 | % | | | 1.19 | % | | | 1.25 | % |
Portfolio turnover rate | | | 45 | % | | | 33 | % | | | 42 | % | | | 37 | % | | | 29 | % |
Net assets at end of year (in 000’s) | | $ | 2,616 | | | $ | 2,478 | | | $ | 3,032 | | | $ | 3,597 | | | $ | 4,003 | |
| (a) | Per share data based on average shares outstanding during the year. |
| (b) | Total investment return is calculated exclusive of sales charges and assumes the reinvestment of dividends and distributions. Class R1 shares are not subject to sales charges. For periods of less than one year, total return is not annualized. |
| (c) | Without the custody fee reimbursement, net investment income (loss) would have been 0.40%. |
| (d) | Without the custody fee reimbursement, net expenses would have been 1.18%. |
| | | | | | |
The notes to the financial statements are an integral part of,
and should be read in conjunction with, the financial statements. | | | | | 19 | |
Financial Highlights selected per share data and ratios
| | | | | | | | | | | | | | | | | | | | |
| | | Year ended October 31, | |
| Class R2 | | 2017 | | | 2016 | | | 2015 | | | 2014 | | | 2013 | |
Net asset value at beginning of year | | $ | 13.54 | | | $ | 13.54 | | | $ | 13.14 | | | $ | 13.40 | | | $ | 11.70 | |
| | | | | | | | | | | | | | | | | | | | |
Net investment income (loss) (a) | | | 0.01 | | | | 0.01 | | | | 0.01 | | | | 0.05 | | | | 0.03 | |
Net realized and unrealized gain (loss) on investments | | | 2.88 | | | | (0.01 | ) | | | 0.50 | | | | (0.26 | ) | | | 1.76 | |
Net realized and unrealized gain (loss) on foreign currency transactions | | | 0.01 | | | | 0.00 | ‡ | | | (0.03 | ) | | | (0.04 | ) | | | (0.01 | ) |
| | | | | | | | | | | | | | | | | | | | |
Total from investment operations | | | 2.90 | | | | 0.00 | ‡ | | | 0.48 | | | | (0.25 | ) | | | 1.78 | |
| | | | | | | | | | | | | | | | | | | | |
| Less dividends: | | | | | | | | | | | | | | | | | | | | |
From net investment income | | | (0.02 | ) | | | — | | | | (0.08 | ) | | | (0.01 | ) | | | (0.08 | ) |
| | | | | | | | | | | | | | | | | | | | |
Net asset value at end of year | | $ | 16.42 | | | $ | 13.54 | | | $ | 13.54 | | | $ | 13.14 | | | $ | 13.40 | |
| | | | | | | | | | | | | | | | | | | | |
Total investment return (b) | | | 21.55 | %(c) | | | (0.07 | %) | | | 3.73 | % | | | (1.88 | %) | | | 15.34 | % |
| Ratios (to average net assets)/Supplemental Data: | | | | | | | | | | | | | | | | | | | | |
Net investment income (loss) | | | 0.06 | % | | | 0.08 | % | | | 0.11 | % | | | 0.36 | % | | | 0.26 | % |
Net expenses | | | 1.44 | % | | | 1.42 | % | | | 1.43 | % | | | 1.44 | % | | | 1.49 | % |
Portfolio turnover rate | | | 45 | % | | | 33 | % | | | 42 | % | | | 37 | % | | | 29 | % |
Net assets at end of year (in 000’s) | | $ | 1,201 | | | $ | 847 | | | $ | 2,313 | | | $ | 3,509 | | | $ | 8,487 | |
| ‡ | Less than one cent per share. |
| (a) | Per share data based on average shares outstanding during the year. |
| (b) | Total investment return is calculated exclusive of sales charges and assumes the reinvestment of dividends and distributions. Class R2 shares are not subject to sales charges. For periods of less than one year, total return is not annualized. |
| (c) | Total investment return may reflect adjustments to conform to generally accepted accounting principles. |
| | | | | | | | | | | | | | | | | | | | |
| | | Year ended October 31, | |
| Class R3 | | 2017 | | | 2016 | | | 2015 | | | 2014 | | | 2013 | |
Net asset value at beginning of year | | $ | 13.44 | | | $ | 13.48 | | | $ | 13.07 | | | $ | 13.35 | | | $ | 11.64 | |
| | | | | | | | | | | | | | | | | | | | |
Net investment income (loss) (a) | | | (0.04 | ) | | | (0.01 | ) | | | (0.02 | ) | | | 0.02 | | | | (0.01 | ) |
Net realized and unrealized gain (loss) on investments | | | 2.88 | | | | (0.04 | ) | | | 0.50 | | | | (0.26 | ) | | | 1.76 | |
Net realized and unrealized gain (loss) on foreign currency transactions | | | 0.01 | | | | 0.01 | | | | (0.03 | ) | | | (0.04 | ) | | | (0.01 | ) |
| | | | | | | | | | | | | | | | | | | | |
Total from investment operations | | | 2.85 | | | | (0.04 | ) | | | 0.45 | | | | (0.28 | ) | | | 1.74 | |
| | | | | | | | | | | | | | | | | | | | |
| Less dividends: | | | | | | | | | | | | | | | | | | | | |
From net investment income | | | — | | | | — | | | | (0.04 | ) | | | — | | | | (0.03 | ) |
| | | | | | | | | | | | | | | | | | | | |
Net asset value at end of year | | $ | 16.29 | | | $ | 13.44 | | | $ | 13.48 | | | $ | 13.07 | | | $ | 13.35 | |
| | | | | | | | | | | | | | | | | | | | |
Total investment return (b) | | | 21.21 | % | | | (0.30 | %) | | | 3.44 | % | | | (2.10 | %) | | | 15.02 | % |
| Ratios (to average net assets)/Supplemental Data: | | | | | | | | | | | | | | | | | | | | |
Net investment income (loss) | | | (0.27 | %) | | | (0.11 | %)(c) | | | (0.15 | %) | | | 0.17 | % | | | (0.05 | %) |
Net expenses | | | 1.69 | % | | | 1.67 | % (d) | | | 1.68 | % | | | 1.69 | % | | | 1.74 | % |
Portfolio turnover rate | | | 45 | % | | | 33 | % | | | 42 | % | | | 37 | % | | | 29 | % |
Net assets at end of year (in 000’s) | | $ | 1,446 | | | $ | 1,108 | | | $ | 1,204 | | | $ | 1,291 | | | $ | 1,365 | |
| (a) | Per share data based on average shares outstanding during the year. |
| (b) | Total investment return is calculated exclusive of sales charges and assumes the reinvestment of dividends and distributions. Class R3 shares are not subject to sales charges. For periods of less than one year, total return is not annualized. |
| (c) | Without the custody fee reimbursement, net investment income (loss) would have been (0.12)%. |
| (d) | Without the custody fee reimbursement, net expenses would have been 1.68%. |
| | | | |
| 20 | | MainStay International Equity Fund | | The notes to the financial statements are an integral part of,
and should be read in conjunction with, the financial statements. |
Notes to Financial Statements
Note 1–Organization and Business
The MainStay Funds (the “Trust”) was organized on January 9, 1986, as a Massachusetts business trust and is governed by a Declaration of Trust. The Trust is registered under the Investment Company Act of 1940, as amended (the “1940 Act”), as an open-end management investment company, and is comprised of twelve funds (collectively referred to as the “Funds”). These financial statements and notes relate to the MainStay International Equity Fund (the “Fund”), a “diversified” fund, as that term is defined in the 1940 Act, as interpreted or modified by regulatory authorities having jurisdiction, from time to time.
The Fund currently has ten classes of shares registered for sale. Class A shares commenced operations on January 3, 1995. Class B shares commenced operations on September 13, 1994. Class C shares commenced operations on September 1, 1998. Class I, Class R1 and Class R2 shares commenced operations on January 2, 2004. Class R3 shares commenced operations on April 28, 2006. Investor Class shares commenced operations on February 28, 2008. Class R6 and Class T shares of the Fund were registered for sale effective as of February 28, 2017. As of October 31, 2017, Class R6 and Class T shares were not yet offered for sale. Effective February 28, 2017, Class B shares of the MainStay Group of Funds were closed to all new purchases as well as additional investments by existing Class B shareholders. Existing Class B shareholders may continue to reinvest dividends and capital gains distributions, as well as exchange their Class B shares for Class B shares of other MainStay Group of Funds as permitted by the current exchange privileges. Class B shareholders continue to be subject to any applicable contingent deferred sales charge (“CDSC”) at the time of redemption. All other features of the Class B shares, including but not limited to the fees and expenses applicable to Class B shares, remain unchanged. Unless redeemed, Class B shareholders will remain in Class B shares of their respective fund until the Class B shares are converted to Class A or Investor Class shares pursuant to the applicable conversion schedule.
Class A and Investor Class shares are offered at net asset value (“NAV”) per share plus an initial sales charge. No initial sales charge applies to investments of $1 million or more (and certain other qualified purchases) in Class A and Investor Class shares. Effective August 1, 2017, a CDSC of 1.00% may be imposed on certain redemptions of Class A and Investor Class shares made within 18 months of the date of purchase on shares that were purchased without an initial sales charge. For purchases of Class A and Investor Class shares made from January 1, 2017, through July 31, 2017, a CDSC of 1.00% may be imposed on certain redemptions of such shares made within 24 months of the date of purchase on shares that were purchased without an initial sales charge. For purchases of Class A and Investor Class shares made prior to January 1, 2017, a CDSC of 1.00% may be imposed on certain redemptions of such shares made within one year of the date of purchase on shares that were purchased without an initial sales charge. Class C shares are offered at NAV without an initial sales charge, although a 1.00% CDSC may be imposed on certain redemptions of such shares made within one year of the date of purchase of Class C shares. When Class B shares were offered, they were offered at NAV without an initial sales charge, although a CDSC that declines depending on the number of years a shareholder has held its Class B shares may be imposed on certain redemptions of such shares made within six years of the date of purchase of such shares. Class T shares
are currently expected to be offered at NAV per share plus an initial sales charge. Class I, Class R1, Class R2 and Class R3 shares are offered at NAV and are not subject to a sales charge. Class R6 shares are currently expected to be offered at NAV and to not be subject to a sales charge. Depending upon eligibility, Class B shares convert to either Class A or Investor Class shares at the end of the calendar quarter eight years after the date they were purchased. Additionally, as disclosed in the Fund’s prospectus, Class A shares may convert automatically to Investor Class shares and Investor Class shares may convert automatically to Class A shares. Under certain circumstances and as may be permitted by the Trust’s multiple class plan pursuant to Rule 18f-3 under the 1940 Act, specified share classes of the Fund may be converted to one or more other share classes of the Fund as disclosed in the capital share transactions within these Notes. The classes of shares have the same voting (except for issues that relate solely to one class), dividend, liquidation and other rights, and the same terms and conditions, except that under distribution plans pursuant to Rule 12b-1 under the 1940 Act, Class B and Class C shares are subject to higher distribution and/or service fees than Class A, Investor Class, Class T, Class R2 and Class R3 shares. Class I, Class R1 and Class R6 shares are not subject to a distribution and/or service fee. Class R1, Class R2 and Class R3 shares are subject to a shareholder service fee, which is in addition to fees paid under the distribution plans for Class R2 and Class R3 shares.
The Fund’s investment objective is to seek long-term growth of capital.
Note 2–Significant Accounting Policies
The Fund is an investment company and accordingly follows the investment company accounting and reporting guidance of the Financial Accounting Standards Board (“FASB”) Accounting Standard Codification Topic 946 Financial Services—Investment Companies. The Fund prepares its financial statements in accordance with generally accepted accounting principles (“GAAP”) in the United States of America and follows the significant accounting policies described below.
(A) Securities Valuation. Investments are usually valued as of the close of regular trading on the New York Stock Exchange (the “Exchange”) (usually 4:00 p.m. Eastern time) on each day the Fund is open for business (“valuation date”).
The Board of Trustees of the Trust (the “Board”) adopted procedures establishing methodologies for the valuation of the Fund’s securities and other assets and delegated the responsibility for valuation determinations under those procedures to the Valuation Committee of the Trust (the “Valuation Committee”). The Board authorized the Valuation Committee to appoint a Valuation Subcommittee (the “Subcommittee”) to deal in the first instance with establishing the prices of securities for which market quotations are not readily available or the prices of which are not otherwise readily determinable under these procedures. The Subcommittee meets (in person, via electronic mail or via teleconference) on an as-needed basis. Subsequently, the Valuation Committee meets to ensure that actions taken by the Subcommittee were appropriate. The procedures state that, subject to the oversight of the Board and unless otherwise noted, the responsibility for the day-to-day valuation of portfolio assets (including fair value measurements for the Fund’s assets and liabilities) rests with New York Life Investment Management LLC (“New York Life Investments” or the “Manager”),
Notes to Financial Statements (continued)
aided to whatever extent necessary by the Subadvisor (as defined in Note 3(A)).
To assess the appropriateness of security valuations, the Manager, the Subadvisor or the Fund’s third-party service provider, who is subject to oversight by the Manager, regularly compares prior day prices, prices on comparable securities and the sale prices to the prior and current day prices and challenges prices with changes exceeding certain tolerance levels with third-party pricing services or broker sources. For those securities valued through either a standardized fair valuation methodology or a fair valuation measurement, the Subcommittee deals in the first instance with such valuation and the Valuation Committee reviews and affirms, if appropriate, the reasonableness of the valuation based on such methodologies and measurements on a regular basis after considering information that is reasonably available and deemed relevant by the Valuation Committee. Any action taken by the Subcommittee with respect to the valuation of a portfolio security or other asset is submitted for review and ratification (if appropriate) to the Valuation Committee and the Board at the next regularly scheduled meeting.
“Fair value” is defined as the price the Fund would reasonably expect to receive upon selling an asset or liability in an orderly transaction to an independent buyer in the principal or most advantageous market for the asset or liability. Fair value measurements are determined within a framework that establishes a three-tier hierarchy which maximizes the use of observable market data and minimizes the use of unobservable inputs to establish a classification of fair value measurements for disclosure purposes. “Inputs” refer broadly to the assumptions that market participants would use in pricing the asset or liability, including assumptions about risk, such as the risk inherent in a particular valuation technique used to measure fair value using a pricing model and/or the risk inherent in the inputs for the valuation technique. Inputs may be observable or unobservable. Observable inputs reflect the assumptions market participants would use in pricing the asset or liability based on market data obtained from sources independent of the Fund. Unobservable inputs reflect the Fund’s own assumptions about the assumptions market participants would use in pricing the asset or liability based on the information available. The inputs or methodology used for valuing assets or liabilities may not be an indication of the risks associated with investing in those assets or liabilities. The three-tier hierarchy of inputs is summarized below.
| • | | Level 1—quoted prices in active markets for an identical asset or liability |
| • | | Level 2—other significant observable inputs (including quoted prices for a similar asset or liability in active markets, interest rates and yield curves, prepayment speeds, credit risk, etc.) |
| • | | Level 3—significant unobservable inputs (including the Fund’s own assumptions about the assumptions that market participants would use in measuring fair value of an asset or liability) |
The level of an asset or liability within the fair value hierarchy is based on the lowest level of an input, both individually and in the aggregate, that is significant to the fair value measurement. As of October 31, 2017, the aggregate value by input level of the Fund’s assets and liabilities is included at the end of the Fund’s Portfolio of Investments.
The Fund may use third-party vendor evaluations, whose prices may be derived from one or more of the following standard inputs, among others:
| | |
• Broker/dealer quotes | | • Benchmark securities |
• Two-sided markets | | • Reference data (corporate actions or material event notices) |
• Bids/offers | | • Monthly payment information |
• Industry and economic events | | • Reported trades |
An asset or liability for which market values cannot be measured using the methodologies described above is valued by methods deemed reasonable in good faith by the Valuation Committee, following the procedures established by the Board, to represent fair value. Under these procedures, the Fund generally uses a market-based approach which may use related or comparable assets or liabilities, recent transactions, market multiples, book values and other relevant information. The Fund may also use an income-based valuation approach in which the anticipated future cash flows of the asset or liability are discounted to calculate fair value. Discounts may also be applied due to the nature and/or duration of any restrictions on the disposition of the asset or liability. Fair value represents a good faith approximation of the value of a security. Fair value determinations involve the consideration of a number of subjective factors, an analysis of applicable facts and circumstances and the exercise of judgment. As a result, it is possible that the fair value for a security determined in good faith in accordance with the Fund’s valuation procedures may differ from valuations for the same security determined by other funds using their own valuation procedures. Although the Fund’s valuation procedures are designed to value a security at the price the Fund may reasonably expect to receive upon the security’s sale in an orderly transaction, there can be no assurance that any fair value determination thereunder would, in fact, approximate the amount that the Fund would actually realize upon the sale of the security or the price at which the security would trade if a reliable market price were readily available. During the year ended October 31, 2017, there were no material changes to the fair value methodologies.
Securities which may be valued in this manner include, but are not limited to: (i) a security for which trading has been halted or suspended; (ii) a debt security that has recently gone into default and for which there is not a current market quotation; (iii) a security of an issuer that has entered into a restructuring; (iv) a security that has been de-listed from a national exchange; (v) a security for which the market price is not readily available from a third-party pricing source or, if so provided, does not, in the opinion of the Manager or Subadvisor, reflect the security’s market value; (vi) a security subject to trading collars for which no or limited trading takes place; and (vii) a security whose principal market has been temporarily closed at a time when, under normal conditions, it would be open. Securities for which market quotations or observable inputs are not readily available are generally categorized as Level 3 in the hierarchy. As of October 31, 2017, there were no securities held by the Fund that were fair valued in such a manner.
Certain securities held by the Fund may principally trade in foreign markets. Events may occur between the time the foreign markets close and the time at which the Fund’s NAVs are calculated. These events may include, but are not limited to, situations relating to a single issuer
| | |
| 22 | | MainStay International Equity Fund |
in a market sector, significant fluctuations in U.S. or foreign markets, natural disasters, armed conflicts, governmental actions or other developments not tied directly to the securities markets. Should the Manager or Subadvisor conclude that such events may have affected the accuracy of the last price of such securities reported on the local foreign market, the Subcommittee may, pursuant to procedures adopted by the Board, adjust the value of the local price to reflect the estimated impact on the price of such securities as a result of such events. In this instance, securities are generally categorized as Level 3 in the hierarchy. Additionally, certain foreign equity securities are also fair valued whenever the movement of a particular index exceeds certain thresholds. In such cases, the securities are fair valued by applying factors provided by a third-party vendor in accordance with valuation procedures adopted by the Board and are generally categorized as Level 2 in the hierarchy. As of October 31, 2017, no foreign equity securities held by the Fund were fair valued in such a manner.
Equity securities are valued at the last quoted sales prices as of the close of regular trading on the relevant exchange on each valuation date. Securities that are not traded on the valuation date are valued at the mean of the last quoted bid and ask prices. Prices are normally taken from the principal market in which each security trades. Investments in mutual funds, including money market funds, are valued at their respective NAVs as of the close of the Exchange on the valuation date. These securities are generally categorized as Level 1 in the hierarchy.
Temporary cash investments acquired in excess of 60 days to maturity at the time of purchase are valued using the latest bid prices or using valuations based on a matrix system (which considers such factors as security prices, yields, maturities and ratings), both as furnished by independent pricing services. Other temporary cash investments which mature in 60 days or less at the time of purchase (“Short-Term Investments”) are valued using the amortized cost method of valuation, unless the use of such method would be inappropriate. The amortized cost method involves valuing a security at its cost on the date of purchase and thereafter assuming a constant amortization to maturity of the difference between such cost and the value on maturity date. Amortized cost approximates the current fair value of a security. Securities valued using the amortized cost method are not valued using quoted prices in an active market and are generally categorized as Level 2 in the hierarchy.
The information above is not intended to reflect an exhaustive list of the methodologies that may be used to value portfolio investments. The valuation procedures permit the use of a variety of valuation methodologies in connection with valuing portfolio investments. The methodology used for a specific type of investment may vary based on the market data available or other considerations. The methodologies summarized above may not represent the specific means by which portfolio investments are valued on any particular business day.
A portfolio security or other asset may be determined to be illiquid under procedures approved by the Board. Illiquidity of a security might prevent the sale of such security at a time when the Manager or Subadvisor might wish to sell, and these securities could have the effect of decreasing the overall level of the Fund’s liquidity. Further, the lack of an established secondary market may make it more difficult to value illiquid securities, requiring the Fund to rely on judgments that may be
somewhat subjective in measuring value, which could vary materially from the amount that the Fund may realize upon disposition. Difficulty in selling illiquid securities may result in a loss or may be costly to the Fund. Under the supervision of the Board, the Manager or Subadvisor determines the liquidity of the Fund’s investments; in doing so, the Manager or Subadvisor may consider various factors, including (i) the frequency of trades and quotations; (ii) the number of dealers and prospective purchasers; (iii) dealer undertakings to make a market; and (iv) the nature of the security and the market in which it trades (e.g., the time needed to dispose of the security, the method of soliciting offers and the mechanics of transfer). Illiquid securities are often valued in accordance with methods deemed by the Board in good faith to be reasonable and appropriate to accurately reflect their fair value. The liquidity of the Fund’s investments, as shown in the Portfolio of Investments, was determined as of October 31, 2017 and can change at any time in response to, among other relevant factors, market conditions or events or developments with respect to an individual issuer or instrument. As of October 31, 2017, the Fund did not hold any securities deemed to be illiquid under procedures approved by the Board.
(B) Income Taxes. The Fund’s policy is to comply with the requirements of the Internal Revenue Code of 1986, as amended (the “Internal Revenue Code”), applicable to regulated investment companies and to distribute all of its taxable income to the shareholders of the Fund within the allowable time limits. Therefore, no federal, state and local income tax provisions are required.
Management evaluates the Fund’s tax positions to determine if the tax positions taken meet the minimum recognition threshold in connection with accounting for uncertainties in income tax positions taken or expected to be taken for the purposes of measuring and recognizing tax liabilities in the financial statements. Recognition of tax benefits of an uncertain tax position is permitted only to the extent the position is “more likely than not” to be sustained assuming examination by taxing authorities. Management has analyzed the Fund’s tax positions taken on federal, state and local income tax returns for all open tax years (for up to three tax years) and has concluded that no provisions for federal, state and local income tax are required in the Fund’s financial statements. The Fund’s federal, state and local income tax and federal excise tax returns for tax years for which the applicable statutes of limitations have not expired are subject to examination by the Internal Revenue Service and state and local departments of revenue.
(C) Foreign Taxes. The Fund may be subject to foreign taxes on income and other transaction-based taxes imposed by certain countries in which it invests. A portion of the taxes on gains on investments or currency purchases/repatriation may be reclaimable. The Fund will accrue such taxes and reclaims as applicable, based upon its current interpretation of tax rules and regulations that exist in the markets in which it invests.
The Fund may be subject to taxation on realized capital gains, repatriation proceeds and other transaction-based taxes imposed by certain countries in which it invests. The Fund will accrue such taxes as applicable based upon its current interpretation of tax rules and regulations that exist in the market in which it invests. Capital gains taxes relating to positions still held are reflected as a liability on the Statement of Assets and Liabilities, as well as an adjustment to the Fund’s net unrealized appreciation (depreciation). Taxes related to capital gains realized during
Notes to Financial Statements (continued)
the year ended October 31, 2017, if any, are reflected as part of net realized gain (loss) in the Statement of Operations. Changes in tax liabilities related to capital gains taxes on unrealized investment gains, if any, are reflected as part of the change in net unrealized appreciation (depreciation) on investments in the Statement of Operations. Transaction-based charges are generally assessed as a percentage of the transaction amount.
(D) Dividends and Distributions to Shareholders. Dividends and distributions are recorded on the ex-dividend date. The Fund intends to declare and pay dividends from net investment income and distributions from net realized capital and currency gains, if any, at least annually. Unless the shareholder elects otherwise, all dividends and distributions are reinvested in the same class of shares of the Fund, at NAV. Dividends and distributions to shareholders are determined in accordance with federal income tax regulations and may differ from determinations using GAAP.
(E) Security Transactions and Investment Income. The Fund records security transactions on the trade date. Realized gains and losses on security transactions are determined using the identified cost method. Dividend income is recognized on the ex-dividend date, net of any foreign tax withheld at the source, and interest income is accrued as earned using the effective interest rate method. Discounts and premiums on Short-Term Investments are accreted and amortized, respectively, on the straight-line method. The straight-line method approximates the effective interest method for Short-Term Investments.
Investment income and realized and unrealized gains and losses on investments of the Fund are allocated pro rata to separate classes of shares based upon their relative net assets on the date the income is earned or realized and unrealized gains and losses are incurred.
(F) Expenses. Expenses of the Trust are allocated to the individual Funds in proportion to the net assets of the respective Funds when the expenses are incurred, except where direct allocations of expenses can be made. Expenses (other than transfer agent expenses and fees incurred under the shareholder services plans and/or the distribution plans further discussed in Note 3(B)) are allocated to separate classes of shares pro rata based upon their relative net assets on the date the expenses are incurred. The expenses borne by the Fund, including those of related parties to the Fund, are shown in the Statement of Operations.
(G) Use of Estimates. In preparing financial statements in conformity with GAAP, management makes estimates and assumptions that affect the reported amounts and disclosures in the financial statements. Actual results could differ from those estimates.
(H) Repurchase Agreements. The Fund may enter into repurchase agreements (i.e., buy a security from another party with the agreement that it be sold back in the future) to earn income. The Fund may enter into repurchase agreements only with counterparties, usually financial institutions, that are deemed by the Manager or Subadvisor to be creditworthy, pursuant to guidelines established by the Board. During the term of any repurchase agreement, the Manager or Subadvisor will continue to monitor the creditworthiness of the counterparty. Under the 1940 Act, repurchase agreements are considered to be collateralized loans by the Fund to the counterparty secured by the securities transferred to the Fund.
Repurchase agreements are subject to counterparty risk, meaning the Fund could lose money by the counterparty’s failure to perform under the terms of the agreement. The Fund mitigates this risk by ensuring the repurchase agreement is collateralized by cash, U.S. government securities, fixed income securities and/or other securities. The collateral is held by the Fund’s custodian and valued daily on a mark to market basis to determine if the value, including accrued interest, exceeds the repurchase price. In the event of the counterparty’s default on the obligation to repurchase, the Fund has the right to liquidate the collateral and apply the proceeds in satisfaction of the obligation. Under certain circumstances, such as in the event of default or bankruptcy by the counterparty, realization and/or retention of the collateral may be limited or subject to delay, to legal proceedings and possible realized loss to the Fund.
(I) Securities Lending. In order to realize additional income, the Fund may engage in securities lending, subject to the limitations set forth in the 1940 Act and relevant guidance by the staff of the Securities and Exchange Commission (“SEC”). In the event the Fund does engage in securities lending, the Fund will lend through its custodian, State Street Bank and Trust Company (“State Street”). State Street will manage the Fund’s collateral in accordance with the lending agreement between the Fund and State Street, and indemnify the Fund against counterparty risk. The loans will be collateralized by U.S. Treasury securities at least equal at all times to the market value of the securities loaned. The Fund may bear the risk of delay in recovery of, or loss of rights in, the securities loaned should the borrower of the securities experience financial difficulty. The Fund may also record a realized gain or loss on securities deemed sold due to a borrower’s inability to return securities on loan. The Fund bears the risk of any loss on investment of the collateral. The Fund will receive compensation for lending its securities in the form of fees or it will retain a portion of interest on the investment of any cash received as collateral. The Fund will also continue to receive interest and dividends on the securities loaned and any gain or loss in the market price of the securities loaned that may occur during the term of the loan will be for the account of the Fund. During the year ended October 31, 2017, the Fund did not have any portfolio securities on loan.
(J) Foreign Currency Transactions. The Fund’s books and records are maintained in U.S. dollars. Prices of securities denominated in foreign currency amounts are translated into U.S. dollars at the mean between the buying and selling rates last quoted by any major U.S. bank at the following dates:
| (i) | market value of investment securities, other assets and liabilities—at the valuation date; and |
| (ii) | purchases and sales of investment securities, income and expenses—at the date of such transactions. |
The assets and liabilities that are denominated in foreign currency amounts are presented at the exchange rates and market values at the close of the period. The realized and unrealized changes in net assets arising from fluctuations in exchange rates and market prices of securities are not separately presented.
Net realized gain (loss) on foreign currency transactions represents net gains and losses on foreign currency forward contracts, net currency gains or losses realized as a result of differences between the amounts
| | |
| 24 | | MainStay International Equity Fund |
of securities sale proceeds or purchase cost, dividends, interest and withholding taxes as recorded on the Fund’s books, and the U.S. dollar equivalent amount actually received or paid. Net currency gains or losses from valuing such foreign currency denominated assets and liabilities, other than investments at valuation date exchange rates, are reflected in unrealized foreign exchange gains or losses.
(K) Foreign Securities Risk. The Fund invests in foreign securities, which carry certain risks that are in addition to the usual risks inherent in domestic securities. These risks include those resulting from currency fluctuations, future adverse political or economic developments and possible imposition of currency exchange blockages or other foreign governmental laws or restrictions. These risks are likely to be greater in emerging markets than in developed markets. The ability of issuers of securities held by the Fund to meet their obligations may be affected by, among other things, economic or political developments in a specific country, industry or region.
(L) Indemnifications. Under the Trust’s organizational documents, its officers and trustees are indemnified against certain liabilities that may arise out of performance of their duties to the Trust. Additionally, in the normal course of business, the Fund enters into contracts with third-party service providers that contain a variety of representations and warranties and which may provide general indemnifications. The Fund’s maximum exposure under these arrangements is unknown, as this would involve future claims that may be made against the Fund that have not yet occurred. Based on experience, management is of the view that the risk of loss in connection with these potential indemnification obligations is remote. However, there can be no assurance that material liabilities related to such obligations will not arise in the future, which could adversely impact the Fund.
Note 3–Fees and Related Party Transactions
(A) Manager and Subadvisor. New York Life Investments, a registered investment adviser and an indirect, wholly-owned subsidiary of New York Life Insurance Company (“New York Life”), serves as the Fund’s Manager, pursuant to an Amended and Restated Management Agreement (“Management Agreement”). The Manager provides offices, conducts clerical, recordkeeping and bookkeeping services and keeps most of the financial and accounting records required to be maintained by the Fund. Except for the portion of salaries and expenses that are the responsibility of the Fund, the Manager pays the salaries and expenses of all personnel affiliated with the Fund and certain operational expenses of the Fund. The Fund reimburses New York Life Investments in an amount equal to a portion of the compensation of the Chief Compliance Officer attributable to the Fund. Cornerstone Capital Management Holdings LLC (“Cornerstone Holdings” or “Subadvisor”), a registered investment adviser and an indirect, wholly-owned subsidiary of New York Life, serves as Subadvisor to the Fund and is responsible for the day-to-day portfolio management of the Fund. Pursuant to the terms of an Amended and Restated Subadvisory Agreement (“Subadvisory Agreement”) between New York Life Investments and Cornerstone Holdings, New York Life Investments pays for the services of the Subadvisor.
Under the Management Agreement, the Fund pays the Manager a monthly fee for the services performed and the facilities furnished at an annual rate of the Fund’s average daily net assets as follows: 0.89% up to $500 million; and 0.85% in excess of $500 million.
During the year ended October 31, 2017, the effective management fee rate (exclusive of any applicable waivers/reimbursements) was 0.89%.
New York Life Investments has voluntarily agreed to waive fees and/or reimburse expenses so that Total Annual Fund Operating Expenses (excluding taxes, interest, litigation, extraordinary expenses, brokerage and other transaction expenses relating to the purchase or sale of portfolio investments and acquired (underlying) fund fees and expenses) of a class do not exceed the following percentages of average daily net assets: Investor Class, 1.85%; Class B, 2.60%; and Class C, 2.60%. These voluntary waivers or reimbursements may be discontinued at any time.
During the year ended October 31, 2017, New York Life Investments earned fees from the Fund in the amount of $2,515,380.
State Street provides sub-administration and sub-accounting services to the Fund pursuant to an agreement with New York Life Investments. These services include calculating the daily NAVs of the Fund, maintaining the general ledger and sub-ledger accounts for the calculation of the Fund’s NAVs and assisting New York Life Investments in conducting various aspects of the Fund’s administrative operations. For providing these services to the Fund, State Street is compensated by New York Life Investments.
(B) Distribution, Service and Shareholder Service Fees. The Trust, on behalf of the Fund, has entered into a distribution agreement with NYLIFE Distributors LLC (the “Distributor”), an indirect, wholly-owned subsidiary of New York Life. The Fund has adopted distribution plans (the “Plans”) in accordance with the provisions of Rule 12b-1 under the 1940 Act.
Pursuant to the Class A, Investor Class, Class T and Class R2 Plans, the Distributor receives a monthly distribution fee from the Class A, Investor Class, Class T and Class R2 shares at an annual rate of 0.25% of the average daily net assets of the Class A, Investor Class, Class T and Class R2 shares for distribution and/or service activities as designated by the Distributor. Pursuant to the Class B and Class C Plans, Class B and Class C shares pay the Distributor a monthly distribution fee at an annual rate of 0.75% of the average daily net assets of the Class B and Class C shares, along with a service fee at an annual rate of 0.25% of the average daily net assets of the Class B and Class C shares, for a total 12b-1 fee of 1.00%. Pursuant to the Class R3 Plan, the Distributor receives a monthly distribution and/or service fee from the Class R3 shares at an annual rate of 0.50% of the average daily net assets of the Class R3 shares. Class I, Class R1 and Class R6 shares are not subject to a distribution and/or service fee.
The Plans provide that the distribution and service fees are payable to the Distributor regardless of the amounts actually expended by the Distributor for distribution of the Fund’s shares and service activities.
In accordance with the Shareholder Services Plans for the Class R1, Class R2 and Class R3 shares, the Manager has agreed to provide, through its affiliates or independent third parties, various shareholder and administrative support services to shareholders of the Class R1, Class R2 and Class R3 shares. For its services, the Manager, its affiliates or independent third-party service providers are entitled to a shareholder service fee accrued daily and paid monthly at an annual rate of 0.10% of the average daily net assets of the Class R1, Class R2
Notes to Financial Statements (continued)
and Class R3 shares. This is in addition to any fees paid under the Class R2 and Class R3 Plans.
During the year ended October 31, 2017, shareholder service fees incurred by the Fund were as follows:
| | | | |
Class R1 | | $ | 2,492 | |
Class R2 | | | 1,154 | |
Class R3 | | | 1,280 | |
(C) Sales Charges. During the year ended October 31, 2017, the Fund was advised by the Distributor that the amount of initial sales charges retained on sales of Class A and Investor Class shares were $6,150 and $9,884, respectively.
During the year ended October 31, 2017, the Fund was also advised that the Distributor retained CDSCs on redemptions of Class A, Investor Class, Class B and Class C shares of $1,395, $19, $14,813 and $623, respectively.
(D) Transfer, Dividend Disbursing and Shareholder Servicing Agent. NYLIM Service Company LLC, an affiliate of New York Life Investments, is the Fund’s transfer, dividend disbursing and shareholder servicing agent pursuant to an agreement between NYLIM Service Company LLC and the Trust. NYLIM Service Company LLC has entered into an agreement with Boston Financial Data Services, Inc. (“BFDS”) pursuant to which BFDS performs certain transfer agent services on behalf of NYLIM Service Company LLC. During the year ended October 31, 2017, transfer agent expenses incurred by the Fund were as follows:
| | | | |
Class A | | $ | 31,926 | |
Investor Class | | | 133,372 | |
Class B | | | 27,318 | |
Class C | | | 30,910 | |
Class I | | | 144,992 | |
Class R1 | | | 1,897 | |
Class R2 | | | 869 | |
Class R3 | | | 974 | |
(E) Small Account Fee. Shareholders with small accounts adversely impact the cost of providing transfer agency services. In an effort to reduce total transfer agency expenses, the Fund has implemented a small account fee on certain types of accounts. Certain shareholders with an account balance of less than $1,000 are charged an annual per account fee of $20 (assessed semi-annually), the proceeds from which offset transfer agent fees as reflected in the Statement of Operations.
(F) Capital. As of October 31, 2017, New York Life and its affiliates beneficially held shares of the Fund with values and percentages of net assets as follows:
| | | | | | | | |
Class I | | $ | 86,766,206 | | | | 42.3 | % |
Note 4–Federal Income Tax
As of October 31, 2017, the cost and unrealized appreciation (depreciation) of the Fund’s investment portfolio, including applicable
derivative contracts and other financial instruments, as determined on a federal income tax basis, were as follows:
| | | | | | | | |
| | | Federal
Tax Cost | | Gross
Unrealized
Appreciation | | Gross
Unrealized
Depreciation | | Net
Unrealized
Appreciation/
(Depreciation) |
Investments in Securities | | $242,734,735 | | $61,169,582 | | $(6,588,770) | | $54,580,812 |
As of October 31, 2017, the components of accumulated gain (loss) on a tax basis were as follows:
| | | | | | | | |
Ordinary
Income | | Accumulated
Capital and Other Gain (Loss) | | Other
Temporary
Differences | | Unrealized
Appreciation
(Depreciation) | | Total
Accumulated Gain (Loss) |
| $1,997,998 | | $(35,592,840) | | $(9,927) | | $54,214,613 | | $20,609,844 |
The difference between book-basis and tax-basis unrealized appreciation (depreciation) is primarily due to wash sale adjustments and Passive Foreign Investment Company (PFIC) adjustments. The other temporary differences are primarily due to foreign taxes payable.
The following table discloses the current year reclassifications between undistributed net investment income (loss), accumulated net realized gain (loss) on investments and additional paid-in capital arising from permanent differences; net assets as of October 31, 2017 were not affected.
| | | | |
Undistributed Net Investment Income (Loss) | | Accumulated Net Realized Gain (Loss) on Investments | | Additional Paid-In Capital |
| $800,381 | | $7,400,653 | | $(8,201,034) |
The reclassifications for the Fund are primarily due to foreign currency transactions, PFIC adjustments and expiration of capital loss carryforwards.
Under the Regulated Investment Company Modernization Act of 2010, the Fund is permitted to carry forward capital losses incurred in taxable years beginning after December 22, 2010, for an unlimited period. However, any losses incurred during those future years will be required to be utilized prior to the losses incurred in pre-enactment tax years. As a result of this ordering rule, pre-enactment capital loss carryforwards may be more likely to expire unused. Additionally, post-enactment capital losses that are carried forward will retain their character as either short-term or long-term capital losses rather than being considered all short-term as under previous law.
As of October 31, 2017, for federal income tax purposes, capital loss carryforwards of $35,592,840 were available as shown in the table below, to the extent provided by the regulations to offset future realized gains of the Fund through the years indicated. To the extent that these capital loss carryforwards are used to offset future capital gains, it is probable that the capital gains so offset will not be distributed to shareholders. No capital gain distributions shall be made until any capital loss carryforwards have been fully utilized or expired.
| | |
| 26 | | MainStay International Equity Fund |
| | | | | | | | |
Capital Loss
Available Through | | Short-Term Capital Loss
Amounts (000’s) | | | Long-Term Capital Loss Amounts (000’s) | |
| 2019 | | $ | 35,593 | | | $ | — | |
The Fund utilized $23,084,755 of capital loss carryforwards during the year ended October 31, 2017. The Fund had $8,201,034 of capital loss carryforward that expired during the year ended October 31, 2017.
During the years ended October 31, 2017 and October 31, 2016, the tax character of distributions paid as reflected in the Statements of Changes in Net Assets was as follows:
| | | | | | | | |
| | | 2017 | | | 2016 | |
Distributions paid from: | | | | | | | | |
Ordinary Income | | $ | 1,059,843 | | | $ | 680,155 | |
Note 5–Custodian
State Street is the custodian of cash and securities held by the Fund. Custodial fees are charged to the Fund based on the Fund’s net assets and/or the market value of securities held by the Fund and the number of certain transactions incurred by the Fund.
Note 6–Line of Credit
The Fund and certain other funds managed by New York Life Investments, maintain a line of credit with a syndicate of banks in order to secure a source of funds for temporary purposes to meet unanticipated or excessive redemption requests.
Effective August 1, 2017, under the credit agreement (the “Credit Agreement”), the aggregate commitment amount is $600,000,000 with an additional uncommitted amount of $100,000,000. The commitment fee is an annual rate of 0.15% of the average commitment amount payable quarterly, regardless of usage, to State Street, who serves as the agent to the syndicate. The commitment fee is allocated among the Fund and certain other funds managed by New York Life Investments based upon their respective net assets and other factors. Interest on any revolving credit loan is charged based upon the Federal Funds Rate or the one-month LIBOR, whichever is higher. The Credit Agreement expires on July 31, 2018, although the Fund, certain other funds managed by New York Life Investments and the syndicate of banks may renew the Credit Agreement for an additional year on the same or different terms. Prior to August 1, 2017, the aggregate commitment amount and commitment fee of the previous credit agreement were the same as those under the Credit Agreement, but Bank of New York Mellon served as agent to the syndicate. During the year ended October 31, 2017, there were no borrowings made or outstanding with respect to the Fund under the Credit Agreement or the credit agreement for which Bank of New York Mellon served as agent.
Note 7–Interfund Lending Program
Pursuant to an exemptive order issued by the SEC, the Fund, along with certain other funds managed by New York Life Investments, may participate in an interfund lending program. The interfund lending program provides an alternative credit facility that permits the Fund and certain other funds managed by New York Life Investments to lend or borrow money for temporary purposes directly to or from one another subject to
the conditions of the exemptive order. During the year ended October 31, 2017, there were no interfund loans made or outstanding with respect to the Fund.
Note 8–Purchases and Sales of Securities (in 000’s)
During the year ended October 31, 2017, purchases and sales of securities, other than short-term securities, were $124,509 and $144,173, respectively.
Note 9–Capital Share Transactions
| | | | | | | | |
Class A | | Shares | | | Amount | |
Year ended October 31, 2017: | | | | | | | | |
Shares sold | | | 345,562 | | | $ | 5,153,486 | |
Shares issued to shareholders in reinvestment of dividends and distributions | | | 8,386 | | | | 106,672 | |
Shares redeemed | | | (877,615 | ) | | | (12,554,676 | ) |
| | | | |
Net increase (decrease) in shares outstanding before conversion | | | (523,667 | ) | | | (7,294,518 | ) |
Shares converted into Class A (See Note 1) | | | 787,104 | | | | 12,465,344 | |
Shares converted from Class A (See Note 1) | | | (33,750 | ) | | | (483,068 | ) |
| | | | |
Net increase (decrease) | | | 229,687 | | | $ | 4,687,758 | |
| | | | |
Year ended October 31, 2016: | | | | | | | | |
Shares sold | | | 682,885 | | | $ | 9,152,419 | |
Shares issued to shareholders in reinvestment of dividends and distributions | | | 1,533 | | | | 20,613 | |
Shares redeemed | | | (905,522 | ) | | | (12,201,735 | ) |
| | | | |
Net increase (decrease) in shares outstanding before conversion | | | (221,104 | ) | | | (3,028,703 | ) |
Shares converted into Class A (See Note 1) | | | 124,559 | | | | 1,701,280 | |
Shares converted from Class A (See Note 1) | | | (16,464 | ) | | | (217,568 | ) |
| | | | |
Net increase (decrease) | | | (113,009 | ) | | $ | (1,544,991 | ) |
| | | | |
| | |
| | | | | | | | |
Investor Class | | Shares | | | Amount | |
Year ended October 31, 2017: | | | | | | | | |
Shares sold | | | 173,615 | | | $ | 2,541,116 | |
Shares redeemed | | | (274,294 | ) | | | (3,908,999 | ) |
| | | | |
Net increase (decrease) in shares outstanding before conversion | | | (100,679 | ) | | | (1,367,883 | ) |
Shares converted into Investor Class
(See Note 1) | | | 77,754 | | | | 1,116,985 | |
Shares converted from Investor Class
(See Note 1) | | | (786,293 | ) | | | (12,378,871 | ) |
| | | | |
Net increase (decrease) | | | (809,218 | ) | | $ | (12,629,769 | ) |
| | | | |
Year ended October 31, 2016: | | | | | | | | |
Shares sold | | | 120,057 | | | $ | 1,600,542 | |
Shares redeemed | | | (308,815 | ) | | | (4,142,432 | ) |
| | | | |
Net increase (decrease) in shares outstanding before conversion | | | (188,758 | ) | | | (2,541,890 | ) |
Shares converted into Investor Class
(See Note 1) | | | 100,778 | | | | 1,352,914 | |
Shares converted from Investor Class
(See Note 1) | | | (113,873 | ) | | | (1,551,578 | ) |
| | | | |
Net increase (decrease) | | | (201,853 | ) | | $ | (2,740,554 | ) |
| | | | |
|
| |
Notes to Financial Statements (continued)
| | | | | | | | |
Class B | | Shares | | | Amount | |
Year ended October 31, 2017: | | | | | | | | |
Shares sold | | | 38,477 | | | $ | 482,874 | |
Shares redeemed | | | (115,580 | ) | | | (1,470,403 | ) |
| | | | |
Net increase (decrease) in shares outstanding before conversion | | | (77,103 | ) | | | (987,529 | ) |
Shares converted from Class B (See Note 1) | | | (73,733 | ) | | | (945,459 | ) |
| | | | |
Net increase (decrease) | | | (150,836 | ) | | $ | (1,932,988 | ) |
| | | | |
Year ended October 31, 2016: | | | | | | | | |
Shares sold | | | 87,362 | | | $ | 1,061,625 | |
Shares redeemed | | | (138,782 | ) | | | (1,685,117 | ) |
| | | | |
Net increase (decrease) in shares outstanding before conversion | | | (51,420 | ) | | | (623,492 | ) |
Shares converted from Class B (See Note 1) | | | (105,505 | ) | | | (1,285,048 | ) |
| | | | |
Net increase (decrease) | | | (156,925 | ) | | $ | (1,908,540 | ) |
| | | | |
|
| |
Class C | | Shares | | | Amount | |
Year ended October 31, 2017: | | | | | | | | |
Shares sold | | | 100,333 | | | $ | 1,293,338 | |
Shares redeemed | | | (229,189 | ) | | | (2,877,871 | ) |
| | | | |
Net increase (decrease) | | | (128,856 | ) | | $ | (1,584,533 | ) |
| | | | |
Year ended October 31, 2016: | | | | | | | | |
Shares sold | | | 166,359 | | | $ | 1,959,543 | |
Shares redeemed | | | (195,770 | ) | | | (2,387,072 | ) |
| | | | |
Net increase (decrease) | | | (29,411 | ) | | $ | (427,529 | ) |
| | | | |
|
| |
Class I | | Shares | | | Amount | |
Year ended October 31, 2017: | | | | | | | | |
Shares sold | | | 1,946,659 | | | $ | 27,785,220 | |
Shares issued to shareholders in reinvestment of dividends and distributions | | | 73,427 | | | | 936,926 | |
Shares redeemed | | | (2,782,401 | ) | | | (40,635,078 | ) |
| | | | |
Net increase (decrease) in shares outstanding before conversion | | | (762,315 | ) | | | (11,912,932 | ) |
Shares converted into Class I (See Note 1) | | | 16,255 | | | | 225,069 | |
| | | | |
Net increase (decrease) | | | (746,060 | ) | | $ | (11,687,863 | ) |
| | | | |
Year ended October 31, 2016: | | | | | | | | |
Shares sold | | | 1,821,203 | | | $ | 24,276,645 | |
Shares issued to shareholders in reinvestment of dividends and distributions | | | 48,253 | | | | 651,422 | |
Shares redeemed | | | (5,189,521 | ) | | | (71,048,636 | ) |
| | | | | | | | |
Net increase (decrease) | | | (3,320,065 | ) | | $ | (46,120,569 | ) |
| | | | |
|
| |
Class R1 | | Shares | | | Amount | |
Year ended October 31, 2017: | | | | | | | | |
Shares sold | | | 8,744 | | | $ | 131,452 | |
Shares issued to shareholders in reinvestment of dividends and distributions | | | 787 | | | | 10,000 | |
Shares redeemed | | | (33,216 | ) | | | (486,548 | ) |
| | | | |
Net increase (decrease) | | | (23,685 | ) | | $ | (345,096 | ) |
| | | | |
Year ended October 31, 2016: | | | | | | | | |
Shares sold | | | 4,825 | | | $ | 65,501 | |
Shares issued to shareholders in reinvestment of dividends and distributions | | | 395 | | | | 5,305 | |
Shares redeemed | | | (46,398 | ) | | | (630,744 | ) |
| | | | |
Net increase (decrease) | | | (41,178 | ) | | $ | (559,938 | ) |
| | | | |
|
| |
| | | | | | | | |
Class R2 | | Shares | | | Amount | |
Year ended October 31, 2017: | | | | | | | | |
Shares sold | | | 56,641 | | | $ | 797,268 | |
Shares issued to shareholders in reinvestment of dividends and distributions | | | 57 | | | | 731 | |
Shares redeemed | | | (46,136 | ) | | | (680,328 | ) |
| | | | |
Net increase (decrease) | | | 10,562 | | | $ | 117,671 | |
| | | | |
Year ended October 31, 2016: | | | | | | | | |
Shares sold | | | 12,594 | | | $ | 168,776 | |
Shares redeemed | | | (120,810 | ) | | | (1,618,498 | ) |
| | | | |
Net increase (decrease) | | | (108,216 | ) | | $ | (1,449,722 | ) |
| | | | |
|
| |
Class R3 | | Shares | | | Amount | |
Year ended October 31, 2017: | | | | | | | | |
Shares sold | | | 34,475 | | | $ | 485,555 | |
Shares redeemed | | | (28,104 | ) | | | (410,533 | ) |
| | | | |
Net increase (decrease) | | | 6,371 | | | $ | 75,022 | |
| | | | |
Year ended October 31, 2016: | | | | | | | | |
Shares sold | | | 16,664 | | | $ | 218,907 | |
Shares redeemed | | | (23,564 | ) | | | (321,733 | ) |
| | | | |
Net increase (decrease) | | | (6,900 | ) | | $ | (102,826 | ) |
| | | | |
Note 10–Subsequent Events
In connection with the preparation of the financial statements of the Fund as of and for the year ended October 31, 2017, events and transactions subsequent to October 31, 2017, through the date the financial statements were issued have been evaluated by the Fund’s management for possible adjustment and/or disclosure. No subsequent events requiring financial statement adjustment or disclosure have been identified other than the following:
At meetings held September 25-27, 2017, the Board approved the assumption by MacKay Shields LLC (“MacKay Shields”) of the subadvisory agreement between Cornerstone Holdings and New York Life Investments with respect to the Fund, effective January 1, 2018. As a result, under the supervision of New York Life Investments, MacKay Shields, which is also a wholly-owned, fully autonomous subsidiary of New York Life, will be responsible for the management of the day-to-day investment operations of the Fund. There will be no change in the management fees paid to New York Life Investments by the Fund or in the subadvisory fees paid by New York Life Investments with respect to the Fund.
Effective January 1, 2018, the portfolio managers from Cornerstone Holdings who manage the day-to-day investment operations of the Fund will transition from Cornerstone Holdings to MacKay Shields. The transition of the portfolio managers from Cornerstone Holdings to MacKay Shields will not impact the investment strategies or risks of the Fund. For more information, please see the supplement to the Prospectus and Statement of Additional Information dated September 28, 2017.
| | |
| 28 | | MainStay International Equity Fund |
Report of Independent Registered Public Accounting Firm
The Board of Trustees and Shareholders of
The MainStay Funds:
We have audited the accompanying statement of assets and liabilities, including the portfolio of investments, of MainStay International Equity Fund (the “Fund”), one of the funds constituting The MainStay Funds, as of October 31, 2017, and the related statement of operations for the year then ended, the statements of changes in net assets for each of the years in the two-year period then ended, and the financial highlights for each of the years in the five-year period then ended. These financial statements and financial highlights are the responsibility of the Fund’s management. Our responsibility is to express an opinion on these financial statements and financial highlights based on our audits.
We conducted our audits in accordance with the standards of the Public Company Accounting Oversight Board (United States). Those standards require that we plan and perform the audit to obtain reasonable assurance about whether the financial statements and financial highlights are free of material misstatement. An audit includes examining, on a test basis, evidence supporting the amounts and disclosures in the financial statements. Our procedures included confirmation of securities owned as of October 31, 2017, by correspondence with the custodian and brokers or by other appropriate auditing procedures where replies from brokers were not received. An audit also includes assessing the accounting principles used and significant estimates made by management, as well as evaluating the overall financial statement presentation. We believe that our audits provide a reasonable basis for our opinion.
In our opinion, the financial statements and financial highlights referred to above present fairly, in all material respects, the financial position of MainStay International Equity Fund as of October 31, 2017, the results of its operations for the year then ended, the changes in its net assets for each of the years in the two-year period then ended, and the financial highlights for each of the years in the five-year period then ended, in conformity with U.S. generally accepted accounting principles.

Philadelphia, Pennsylvania
December 21, 2017
Other Matters
(Unaudited)
At a meeting held on June 22, 2017, the Board approved submitting the following proposal (“Proposal”) to shareholders of the Funds at a special meeting held on October 23, 2017 (with any postponements or adjournments, “Special Meeting”):
To elect eight Trustees to the Board.
On or about September 28, 2017, shareholders of record of the Funds as of the close of business on August 24, 2017 were sent a proxy statement containing information regarding the Proposal. The proxy statement also included information about the Special Meeting, at which shareholders of the Funds were asked to consider and approve the Proposal. In addition, the proxy statement included information about voting on the Proposal and options shareholders had to do so.
The Special Meeting was held on October 23, 2017, and the Proposal passed.
The results of the Special Meeting (all Funds and classes thereof voting together) were as follows:
Proposal—To elect eight Trustees to the Board:
Yie-Hsin Hung:
| | | | | | | | |
Votes
For | | Votes
Witheld | | | Total | |
| 2,644,056,263.750 | | | 21,799,781.292 | | | | 2,665,856,045.042 | |
David H. Chow:
| | | | | | | | |
Votes
For | | Votes
Witheld | | | Total | |
| 2,644,576,776.557 | | | 21,279,268.485 | | | | 2,665,856,045.042 | |
Susan B. Kerley:
| | | | | | | | |
Votes
For | | Votes
Witheld | | | Total | |
| 2,645,459,747.343 | | | 20,396,297.699 | | | | 2,665,856,045.042 | |
Alan R. Latshaw:
| | | | | | | | |
Votes
For | | Votes
Witheld | | | Total | |
| 2,644,443,039.401 | | | 21,413,005.641 | | | | 2,665,856,045.042 | |
Peter Meenan:
| | | | | | | | |
Votes
For | | Votes
Witheld | | | Total | |
| 2,640,156,421.578 | | | 25,699,623.464 | | | | 2,665,856,045.042 | |
Richard H. Nolan, Jr.:
| | | | | | | | |
Votes
For | | Votes
Witheld | | | Total | |
| 2,641,415,514.849 | | | 24,440,530.193 | | | | 2,665,856,045.042 | |
Jacques P. Perold:
| | | | | | | | |
Votes
For | | Votes
Witheld | | | Total | |
| 2,645,300,993.731 | | | 20,555,051.311 | | | | 2,665,856,045.042 | |
Richard S. Trutanic:
| | | | | | | | |
Votes
For | | Votes
Witheld | | | Total | |
| 2,641,761,336.311 | | | 24,094,708.731 | | | | 2,665,856,045.042 | |
Federal Income Tax Information
(Unaudited)
The Fund is required under the Internal Revenue Code to advise shareholders in a written statement as to the federal tax status of dividends paid by the Fund during such fiscal years.
For the fiscal year ended October 31, 2017, the Fund designated approximately $1,345,473 under the Internal Revenue Code as qualified dividend income eligible for reduced tax rates.
In accordance with federal tax law, the Fund elected to provide each shareholder with their portion of the Fund’s foreign taxes paid and the income sourced from foreign countries. Accordingly, the Fund made the
following designations regarding its fiscal year ended October 31, 2017:
| • | | the total amount of taxes credited to foreign countries was $285,630. |
| • | | the total amount of income sourced from foreign countries was $4,237,158. |
In February 2018, shareholders will receive an IRS Form 1099-DIV or substitute Form 1099, which will show the federal tax status of the distributions received by shareholders in calendar year 2017. The amounts that will be reported on such 1099-DIV or substitute Form 1099 will be the amounts you are to use on your federal income tax return and will differ from the amounts which we must report for the Fund’s fiscal year end October 31, 2017.
Proxy Voting Policies and Procedures and Proxy Voting Record
A description of the policies and procedures that New York Life Investments uses to vote proxies related to the Fund’s securities is available without charge, upon request, (i) by visiting the MainStay Funds’ website at mainstayinvestments.com; and (ii) on the Securities and Exchange Commission’s (“SEC”) website at www.sec.gov.
The Fund is required to file with the SEC its proxy voting records for the Fund for the 12-month period ending June 30 on Form N-PX. The most recent Form N-PX or proxy voting record is available free of charge upon request by calling 800-MAINSTAY (624-6782); visiting the MainStay Funds’ website at mainstayinvestments.com; or on the SEC’s website at www.sec.gov.
Shareholder Reports and Quarterly Portfolio Disclosure
The Fund is required to file its complete schedule of portfolio holdings with the SEC for its first and third fiscal quarters on Form N-Q. The Fund’s Form N-Q is available without charge, on the SEC’s website at www.sec.gov or by calling MainStay Investments at 800-MAINSTAY (624-6782). You also can obtain and review copies of Form N-Q by visiting the SEC’s Public Reference Room in Washington, DC (information on the operation of the Public Reference Room may be obtained by calling 1-800-SEC-0330).
| | |
| 30 | | MainStay International Equity Fund |
Board of Trustees and Officers (Unaudited)
The Trustees and officers of the Funds are listed below. The Board oversees the MainStay Group of Funds (which consists of The MainStay Funds and MainStay Funds Trust), MainStay VP Funds Trust, MainStay DefinedTerm Municipal Opportunities Fund, the Manager and the Subadvisors, and elects the officers of the Funds who are responsible for the day-to-day operations of the Funds. Information pertaining to the Trustees and officers is set forth below. Each Trustee serves until his or her successor is elected and qualified or until his or her resignation, death or removal. Under the Board’s retirement policy, unless an exception is made, a Trustee must tender his or her resignation by the
end of the calendar year during which he or she reaches the age of 75. Mr. Meenan reached the age of 75 during the calendar year 2016, and his term was extended for one additional year. Accordingly, Mr. Meenan is expected to serve until the end of calendar year 2017, at which time he intends to retire. Officers are elected annually by the Board. The business address of each Trustee and officer listed below is 51 Madison Avenue, New York, New York 10010. A majority of the Trustees are not “interested persons” (as defined by the 1940 Act and rules adopted by the SEC thereunder) of the Fund (“Independent Trustees”).
| | | | | | | | | | | | |
| | | | | Name and Date of Birth | | Term of Office, Position(s) Held and Length of Service | | Principal Occupation(s) During Past Five Years | | Number of
Portfolios in
the MainStay
Group of Funds
Overseen by
Trustee | | Other Directorships Held by Trustee |
| Interested Trustee | | | | Yie-Hsin Hung* 8/12/62 | | The MainStay Funds: Trustee since January 2017; MainStay Funds Trust: Trustee since January 2017. | | Senior Vice President of New York Life since joining in 2010, Member of the Executive Management Committee since January 1, 2017, Chief Executive Officer, New York Life Investment Management Holdings LLC & New York Life Investment Management LLC since May 2015. Senior Managing Director and Co-President of New York Life Investment Management LLC from January 2014 to May 2015. Previously held positions of increasing responsibility, including head of NYLIM International, Alternative Growth Businesses, and Institutional investments since joining New York Life in 2010. | | 82 | | None |
| | * | This Trustee is considered to be an “interested person” of the MainStay Group of Funds, MainStay VP Funds Trust and MainStay DefinedTerm Municipal Opportunities Fund, within the meaning of the 1940 Act because of her affiliation with New York Life Insurance Company, New York Life Investment Management LLC, Candriam Belgium, Candriam France S.A.S., Cornerstone Capital Management Holdings LLC, MacKay Shields LLC, NYL Investors LLC, NYLIFE Securities LLC and/or NYLIFE Distributors LLC, as described in detail above in the column entitled “Principal Occupation(s) During Past Five Years.” |
| | | | | | | | | | | | |
| | | | | Name and Date of Birth | | Term of Office, Position(s) Held and Length of Service | | Principal Occupation(s) During Past Five Years | | Number of
Portfolios in
the MainStay
Group of Funds
Overseen by
Trustee | | Other Directorships Held by Trustee |
| Independent Trustees | | | | David H. Chow 12/29/57 | | The MainStay Funds: Trustee since January 2016, Advisory Board Member (June 2015 to December 2015); MainStay Funds Trust: Trustee since January 2016, Advisory Board Member (June 2015 to December 2015). | | Founder and CEO, DanCourt Management, LLC (since 1999) | | 82 | | VanEck Vectors Group of Exchange-Traded Funds: Independent Chairman of the Board of Trustees since 2008 and Trustee since 2006 (57 portfolios); and
Berea College of Kentucky: Trustee since 2009. |
| | | | Susan B. Kerley 8/12/51 | | The MainStay Funds: Chairman since January 2017 and Trustee since 2007; MainStay Funds Trust: Chairman since January 2017 and Trustee since 1990.** | | President, Strategic Management Advisors LLC (since 1990) | | 82 | | Legg Mason Partners Funds: Trustee since 1991 (54 portfolios). |
| | | | Alan R. Latshaw 3/27/51 | | The MainStay Funds: Trustee and Audit Committee Financial Expert since 2006; MainStay Funds Trust: Trustee and Audit Committee Financial Expert since 2007.** | | Retired; Partner, Ernst & Young LLP (2002 to 2003); Partner, Arthur Andersen LLP (1989 to 2002); Consultant to the MainStay Funds Audit and Compliance Committee (2004 to 2006) | | 82 | | State Farm Associates Funds Trusts: Trustee since 2005 (4 portfolios);
State Farm Mutual Fund Trust: Trustee since 2005 (15 portfolios); and
State Farm Variable Product Trust: Trustee since 2005 (9 portfolios). |
| | | | Peter Meenan 12/5/41 | | The MainStay Funds: Trustee since 2007; MainStay Funds Trust: Trustee since 2002.** | | Retired; Independent Consultant (2004 to 2013); President and Chief Executive Officer, Babson—United, Inc. (financial services firm) (2000 to 2004); Independent Consultant (1999 to 2000); Head of Global Funds, Citicorp (1995 to 1999) | | 82 | | None |
| | | | Richard H. Nolan, Jr. 11/16/46 | | The MainStay Funds: Trustee since 2007; MainStay Funds Trust: Trustee since 2007.** | | Managing Director, ICC Capital Management (since 2004); President—Shields/Alliance, Alliance Capital Management (1994 to 2004) | | 82 | | None |
| | | | Jacques P. Perold 5/12/58 | | The MainStay Funds: Trustee since January 2016, Advisory Board Member (June 2015 to December 2015); MainStay Funds Trust: Trustee since January 2016, Advisory Board Member (June 2015 to December 2015). | | Retired; President, Fidelity Management & Research Company (2009 to 2014); Founder, President and Chief Executive Officer, Geode Capital Management, LCC (2001 to 2009) | | 82 | | Allstate Corporation: Director since 2015; MSCI, Inc. Director since March 2017 and
Boston University: Trustee since 2014. |
| | | | Richard S. Trutanic 2/13/52 | | The MainStay Funds: Trustee since 1994; MainStay Funds Trust: Trustee since 2007.** | | Chairman and Chief Executive Officer, Somerset & Company (financial advisory firm) (since 2004); Managing Director, The Carlyle Group (private investment firm) (2002 to 2004); Senior Managing Director, Partner and Board Member, Groupe Arnault S.A. (private investment firm) (1999 to 2002) | | 82 | | None |
| | ** | Includes prior service as a Director/Trustee of certain predecessor entities to MainStay Funds Trust. |
| | |
| 32 | | MainStay International Equity Fund |
| | | | | | | | |
| | | | | Name and Date of Birth | | Position(s) Held and Length of Service | | Principal Occupation(s) During Past Five Years |
Officers of the Trust (Who are not Trustees)* | | | | Kirk C. Lehneis 6/29/74 | | President, The MainStay Funds, MainStay Funds Trust (since September 2017) | | Chief Operating Officer and Senior Managing Director (since 2016), New York Life Investment Management LLC; Chairman of the Board (since September 2017), NYLIFE Distributors LLC; Chairman of the Board, NYLIM Service Company LLC (since September 2017); President, MainStay DefinedTerm Municipal Opportunities Fund and MainStay VP Funds Trust (since September 2017); Senior Managing Director, Global Product Development (From March 2015—May 2016); Managing Director, Product Development (From March 2010—February 2015) |
| | | | Jack R. Benintende 5/12/64 | | Treasurer and Principal Financial and Accounting Officer, The MainStay Funds (since 2007), MainStay Funds Trust (since 2009) | | Managing Director, New York Life Investment Management LLC (since 2007); Treasurer and Principal Financial and Accounting Officer, MainStay DefinedTerm Municipal Opportunities Fund (since 2011) and MainStay VP Funds Trust (since 2007)**; and Assistant Treasurer, New York Life Investment Management Holdings LLC (2008 to 2012) |
| | | | Kevin M. Bopp 2/24/69 | | Vice President and Chief Compliance Officer, The MainStay Funds and MainStay Funds Trust (since 2014) | | Chief Compliance Officer, New York Life Investment Management LLC, IndexIQ ETF (since January 2016), Director and Associate General Counsel (2011 to 2014) and Vice President and Assistant General Counsel (2010 to 2011), New York Life Investment Management LLC; Vice President and ChiefCompliance Officer, MainStay VP Funds Trust, MainStay DefinedTerm Municipal Opportunities Fund (since 2014); Assistant Secretary, MainStay Funds, MainStay Funds Trust and MainStay VP Funds Trust (2010 to 2014)**, MainStay DefinedTerm Municipal Opportunities Fund (2011 to 2014) |
| | | | J. Kevin Gao 10/13/67 | | Secretary and Chief Legal Officer, The MainStay Funds and MainStay Funds Trust (since 2010) | | Managing Director and Associate General Counsel, New York Life Investment Management LLC (since 2010); Secretary and Chief Legal Officer, MainStay DefinedTerm Municipal Opportunities Fund (since 2011) and MainStay VP Funds Trust (since 2010)** |
| | | | Scott T. Harrington 2/8/59 | | Vice President—Administration, The MainStay Funds (since 2005), MainStay Funds Trust (since 2009) | | Director, New York Life Investment Management LLC (including predecessor advisory organizations) (since 2000); Member of the Board of Directors, New York Life Trust Company (since 2009); Vice President—Administration, MainStay DefinedTerm Municipal Opportunities Fund (since 2011) and MainStay VP Funds Trust (since 2005)** |
| | * | The officers listed above are considered to be “interested persons” of the MainStay Group of Funds, MainStay VP Funds Trust and MainStay Defined Term Municipal Opportunities Fund within the meaning of the 1940 Act because of their affiliation with the MainStay Group of Funds, New York Life Insurance Company and/or its affiliates, including New York Life Investment Management LLC, NYLIM Service Company LLC, NYLIFE Securities LLC and/or NYLIFE Distributors LLC, as described in detail in the column captioned “Principal Occupation(s) During Past Five Years.” Officers are elected annually by the Board. |
| | ** | Includes prior service as an officer of MainStay VP Series Fund, Inc., the predecessor to MainStay VP Funds Trust. |
This page intentionally left blank
MainStay Funds
Equity
U.S. Equity
MainStay Common Stock Fund
MainStay Cornerstone Growth Fund
MainStay Epoch U.S. All Cap Fund
MainStay Epoch U.S. Equity Yield Fund
MainStay Epoch U.S. Small Cap Fund
MainStay Large Cap Growth Fund
MainStay MAP Equity Fund
MainStay S&P 500 Index Fund
MainStay U.S. Equity Opportunities Fund
International/Global Equity
MainStay Candriam Emerging Markets Equity Fund
MainStay Emerging Markets Equity Fund
MainStay Epoch Capital Growth Fund
MainStay Epoch Global Choice Fund
MainStay Epoch Global Equity Yield Fund
MainStay Epoch International Choice Fund
MainStay Epoch International Small Cap Fund
MainStay International Equity Fund
MainStay International Opportunities Fund
Income
Taxable Bond
MainStay Emerging Markets Debt Fund
MainStay Floating Rate Fund
MainStay Government Fund
MainStay High Yield Corporate Bond Fund
MainStay Indexed Bond Fund
MainStay Short Duration High Yield Fund
MainStay Total Return Bond Fund
MainStay Unconstrained Bond Fund
Municipal/Tax Advantaged Bond
MainStay California Tax Free Opportunities Fund1
MainStay High Yield Municipal Bond Fund
MainStay New York Tax Free Opportunities Fund2
MainStay Tax Advantaged Short Term Bond Fund
MainStay Tax Free Bond Fund
Money Market
MainStay Money Market Fund
Mixed Asset
MainStay Balanced Fund
MainStay Convertible Fund
MainStay Income Builder Fund
Alternative
MainStay Absolute Return Multi-Strategy Fund
MainStay Cushing Energy Income Fund
MainStay Cushing MLP Premier Fund
MainStay Cushing Renaissance Advantage Fund
Asset Allocation/Target Date
MainStay Conservative Allocation Fund
MainStay Growth Allocation Fund
MainStay Moderate Allocation Fund
MainStay Moderate Growth Allocation Fund
MainStay Retirement 2010 Fund
MainStay Retirement 2020 Fund
MainStay Retirement 2030 Fund
MainStay Retirement 2040 Fund
MainStay Retirement 2050 Fund
MainStay Retirement 2060 Fund
Manager
New York Life Investment Management LLC
New York, New York
Subadvisors
Candriam Belgium S.A.3
Brussels, Belgium
Candriam France S.A.S.3
Paris, France
Cornerstone Capital Management Holdings LLC3
New York, New York
Cushing Asset Management, LP
Dallas, Texas
Epoch Investment Partners, Inc.
New York, New York
MacKay Shields LLC3
New York, New York
Markston International LLC
White Plains, New York
NYL Investors LLC3
New York, New York
Winslow Capital Management, LLC
Minneapolis, Minnesota
Legal Counsel
Dechert LLP
Washington, District of Columbia
Independent Registered Public Accounting Firm
KPMG LLP
Philadelphia, Pennsylvania
1. Class A and Class I shares of this Fund are registered for sale in AZ, CA, MI, NV, OR, TX, UT and WA. Class I shares are registered for sale in CO, FL, GA, HI, ID, MA, MD, NH, NJ and NY.
2. This Fund is registered for sale in CA, CT, DE, FL, MA, NJ, NY and VT.
3. An affiliate of New York Life Investment Management LLC.
Not part of the Annual Report
For more information
800-MAINSTAY (624-6782)
mainstayinvestments.com
MainStay Investments® is a registered service mark and name under which New York Life Investment Management LLC does business. MainStay Investments, an indirect subsidiary of New York Life Insurance Company, New York, NY 10010, provides investment advisory products and services. The MainStay Funds® are managed by New York Life Investment Management LLC and distributed by NYLIFE Distributors LLC, 30 Hudson Street, Jersey City, NJ 07302, a wholly owned subsidiary of New York Life Insurance Company. NYLIFE Distributors LLC is a Member FINRA/SIPC.
©2017 NYLIFE Distributors LLC. All rights reserved.
| | | | | | | | |
| Not FDIC/NCUA Insured | | Not a Deposit | | May Lose Value | | No Bank Guarantee | | Not Insured by Any Government Agency |
| | |
| 1715994 MS286-17 | | MSIE11-12/17 (NYLIM) NL213 |
MainStay Common Stock Fund
Message from the President and Annual Report
October 31, 2017


This page intentionally left blank
Message from the President
The 12 months ended October 31, 2017, brought strong performance to equity markets in the United States and abroad.
According to FTSE-Russell data for the U.S. market, stocks at all capitalization levels earned solid double-digit overall returns during the reporting period. Total returns for stocks in general exceeded 20% at all capitalization levels. Growth stocks were particularly strong, outperforming value stocks for companies of all sizes except among microcaps, where value stocks outperformed growth stocks.
Several factors contributed to the strength of domestic and international stock markets during the reporting period. Following the U.S. presidential election in November 2016, many investors looked forward to business tax incentives and possible tax cuts for consumers that could stimulate economic growth. During the reporting period, corporate earnings reports remained strong; and growth in U.S. real gross domestic product remained positive, with a substantial advance during the second quarter of 2017. Developed international markets and emerging markets were also strong, boosted by positive macroeconomic data and growing confidence that Europe was well on its way to financial recovery. Despite wide variations among emerging markets, many saw strong appreciation in local-currency terms and benefited from a weaker U.S. dollar.
During the reporting period, the Federal Open Market Committee raised the federal funds target range three times—in December of 2016 and in March and June of 2017. These incremental increases raised the federal funds target range to 1.00% to 1.25% by the end of the reporting period. These tightening moves were followed by higher U.S. Treasury yields at all maturities, with the greatest increases at the short-end of the maturity spectrum.
As interest rates rise, bond prices tend to decline (and vice versa). As a result, some portions of the U.S. Treasury market recorded negative total returns during the reporting period. Agency securities posted small but positive total returns, as did
asset-backed and mortgage-backed securities. Other bond categories, particularly those with looser ties to U.S. interest rates, did considerably better. Emerging-market debt recorded solid single-digit returns; high-yield bonds were generally stronger; and convertible bonds, which are closely tied to the performance of underlying stocks, provided some of the strongest overall returns of any fixed-income sector during the reporting period.
At MainStay, we have always encouraged investors to diversify their investments and maintain a long-term perspective, even when markets are strong. Asset classes that perform well in one environment may perform differently in another; and in today’s ever-changing world, wide market swings are not unknown.
MainStay offers Funds with a wide array of investment objectives to help our shareholders pursue the appropriate diversification for their long-range financial goals. We also offer several investment boutiques, allowing our shareholders to choose the style—or mix of styles—that’s best suited to their investment needs. We believe that relatively few individual investors can match the level of professional experience and market insight that our portfolio managers provide.
The report that follows provides more detailed information on the specific markets, investment strategies and portfolio decisions that affected your MainStay Fund during the 12 months ended October 31, 2017. We encourage you to read the report carefully and use it to help you evaluate your progress toward your financial goals.
Sincerely,

Kirk C. Lehneis
President
The opinions expressed are as of the date of this report and are subject to change. There is no guarantee that any forecast made will come to pass. This material does not constitute investment advice and is not intended as an endorsement of any specific investment. Past performance is no guarantee of future results.
Not part of the Annual Report
Table of Contents
Investors should refer to the Fund’s Summary Prospectus and/or Prospectus and consider the Fund’s investment objectives, strategies, risks, charges and expenses carefully before investing. The Summary Prospectus and/or Prospectus contain this and other information about the Fund. You may obtain copies of the Fund’s Summary Prospectus, Prospectus and Statement of Additional Information free of charge, upon request, by calling toll-free 800-MAINSTAY (624-6782), by writing to NYLIFE Distributors LLC, Attn: MainStay Marketing Department, 30 Hudson Street, Jersey City, NJ 07302 or by sending an e-mail to MainStayShareholderServices@nylim.com. These documents are also available via the MainStay Funds’ website at mainstayinvestments.com/documents. Please read the Summary Prospectus and/or Prospectus carefully before investing.
Investment and Performance Comparison1 (Unaudited)
Performance data quoted represents past performance. Past performance is no guarantee of future results. Because of market volatility and other factors, current performance may be lower or higher than the figures shown. Investment return and principal value will fluctuate, and as a result, when shares are redeemed, they may be worth more or less than their original cost. The graph below depicts the historical performance of Class B shares2 of the Fund. Performance will vary from class to class based on differences in class-specific expenses and sales charges. For performance information current to the most recent month-end, please call 800-MAINSTAY (624-6782) or visit mainstayinvestments.com.
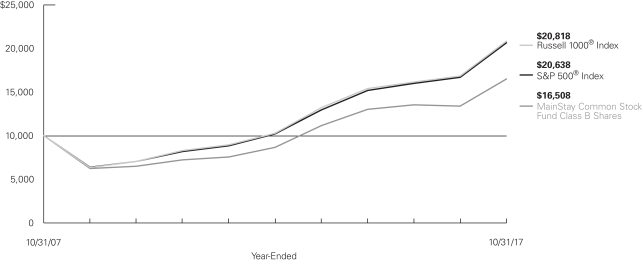
Average Annual Total Returns for the Year-Ended October 31, 2017
| | | | | | | | | | | | | | | | | | | | | | | | |
| Class | | Sales Charge | | | | Inception
Date | | | One
Year | | | Five Years
or Since
Inception | | | Ten Years
or Since
Inception | | | Gross
Expense
Ratio3 | |
| Class A Shares | | Maximum 5.5%
Initial Sales Charge | | With sales charges Excluding sales charges | |
| 6/1/1998
|
| |
| 17.74
24.59 | %
| |
| 13.73
15.03 | %
| |
| 5.74
6.34 | %
| |
| 0.98
0.98 | %
|
| Investor Class Shares | | Maximum 5.5%
Initial Sales Charge | | With sales charges Excluding sales charges | |
| 2/28/2008
|
| |
| 17.41
24.25 |
| |
| 13.40
14.69 |
| |
| 6.78
7.41 |
| |
| 1.23
1.23 |
|
| Class B Shares2 | | Maximum 5% CDSC
if Redeemed Within the
First Six Years of Purchase | | With sales charges Excluding sales charges | |
| 6/1/1998
|
| |
| 18.31
23.31 |
| |
| 13.61
13.84 |
| |
| 5.14
5.14 |
| |
| 1.98
1.98 |
|
| Class C Shares | | Maximum 1% CDSC
if Redeemed Within
One Year of Purchase | | With sales charges Excluding sales charges | |
| 9/1/1998
|
| |
| 22.33
23.33 |
| |
| 13.83
13.83 |
| |
| 5.13
5.13 |
| |
| 1.98
1.98 |
|
| Class I Shares | | No Sales Charge | | | | | 12/28/2004 | | | | 24.89 | | | | 15.31 | | | | 6.63 | | | | 0.73 | |
| Class R3 Shares | | No Sales Charge | | | | | 2/29/2016 | | | | 24.17 | | | | 19.14 | | | | N/A | | | | 1.34 | |
| 1. | The performance table and graph do not reflect the deduction of taxes that a shareholder would pay on distributions or Fund share redemptions. Total returns reflect maximum applicable sales charges as indicated in the table above, if any, changes in share price, and reinvestment of dividend and capital gain distributions. The graph assumes the initial investment amount shown above and reflects the deduction of all sales charges that would have applied for the period of investment. Performance figures may reflect certain fee waivers and/or expense limitations, without which total returns may have |
| | been lower. For more information on share classes and current fee waivers and/or expense limitations (if any), please refer to the Notes to Financial Statements. |
| 2. | Class B shares are closed to all new purchases as well as additional investments by existing Class B shareholders. |
| 3. | The gross expense ratios presented reflect the Fund’s “Total Annual Fund Operating Expenses” from the most recent Prospectus and may differ from other expense ratios disclosed in this report. |
The footnotes on the next page are an integral part of the table and graph and should be carefully read in conjunction with them.
| | | | | | | | | | | | |
| Benchmark Performance | | One
Year | | | Five Years
or Since
Inception | | | Ten Years
or Since
Inception | |
| S&P 500® Index4 | | | 23.63% | | | | 15.18 | % | | | 7.51 | % |
Russell 1000® Index5 | | | 23.67 | | | | 15.18 | | | | 7.61 | |
Morningstar Large Blend Category Average6 | | | 22.34 | | | | 13.70 | | | | 6.62 | |
| 4. | The S&P 500® Index is the Fund’s primary broad-based securities market index for comparison purposes. “S&P 500®” is a trademark of the McGraw-Hill Companies, Inc. The S&P 500® Index is widely regarded as the standard index for measuring large-cap U.S. stock market performance. Results assume reinvestment of all dividends and capital gains. An investment cannot be made directly in an index. |
| 5. | The Russell 1000® Index is the Fund’s secondary benchmark. The Russell 1000® Index measures the performance of the large-cap segment of the U.S. equity universe. It is a subset of the Russell 3000® Index and includes approximately 1,000 of the largest securities based on a combination of their market cap and current index membership. Results assume |
| | reinvestment of all dividends and capital gains. An investment cannot be made directly in an index. |
| 6. | The Morningstar Large Blend Category Average is representative of funds that represent the overall US stock market in size, growth rates and price. Stocks in the top 70% of the capitalization of the US equity market are defined as large cap. The blend style is assigned to portfolios where neither growth nor value characteristics predominate. These portfolios tend to invest across the spectrum of US industries, and owing to their broad exposure, the portfolios’ returns are often similar to those of the S&P 500 Index. Results are based on average total returns of similar funds with all dividends and capital gain distributions reinvested. |
The footnotes on the preceding page are an integral part of the table and graph and should be carefully read in conjunction with them.
| | |
| 6 | | MainStay Common Stock Fund |
Cost in Dollars of a $1,000 Investment in MainStay Common Stock Fund (Unaudited)
The example below is intended to describe the fees and expenses borne by shareholders during the six-month period from May 1, 2017, to October 31, 2017, and the impact of those costs on your investment.
Example
As a shareholder of the Fund you incur two types of costs: (1) transaction costs, including exchange fees and sales charges (loads) on purchases (as applicable), and (2) ongoing costs, including management fees, distribution and/or service (12b-1) fees, and other Fund expenses (as applicable). This example is intended to help you understand your ongoing costs (in dollars) of investing in the Fund and to compare these costs with the ongoing costs of investing in other mutual funds. The example is based on an investment of $1,000 made at the beginning of the six-month period and held for the entire period from May 1, 2017, to October 31, 2017.
This example illustrates your Fund’s ongoing costs in two ways:
Actual Expenses
The second and third data columns in the table below provide information about actual account values and actual expenses. You may use the information in these columns, together with the amount you invested, to estimate the expenses that you paid during the six months ended October 31, 2017. Simply divide your account value by $1,000 (for example, an $8,600 account value divided by $1,000 = 8.6), then
multiply the result by the number under the heading entitled “Expenses Paid During Period” to estimate the expenses you paid on your account during this period.
Hypothetical Example for Comparison Purposes
The fourth and fifth data columns in the table below provide information about hypothetical account values and hypothetical expenses based on the Fund’s actual expense ratio and an assumed rate of return of 5% per year before expenses, which is not the Fund’s actual return. The hypothetical account values and expenses may not be used to estimate the actual ending account balances or expenses you paid for the six-month period shown. You may use this information to compare the ongoing costs of investing in the Fund with the ongoing costs of investing in other mutual funds. To do so, compare this 5% hypothetical example with the 5% hypothetical examples that appear in the shareholder reports of the other mutual funds.
Please note that the expenses shown in the table are meant to highlight your ongoing costs only and do not reflect any transactional costs, such as exchange fees or sales charges (loads). Therefore, the fourth and fifth data columns of the table are useful in comparing ongoing costs only and will not help you determine the relative total costs of owning different funds. In addition, if these transactional costs were included, your costs would have been higher.
| | | | | | | | | | | | | | | | | | | | | | |
| | | | | | | | | | | | | | | | | | |
| Share Class | | Beginning Account Value 5/1/17 | | | Ending Account Value (Based on Actual Returns and Expenses) 10/31/17 | | | Expenses Paid During Period1 | | | Ending Account Value (Based on Hypothetical 5% Annualized Return and Actual Expenses) 10/31/17 | | | Expenses Paid During Period1 | | | Net Expense Ratio During Period2 |
| | | | | | |
| Class A Shares | | $ | 1,000.00 | | | $ | 1,105.80 | | | $ | 5.04 | | | $ | 1,020.40 | | | $ | 4.84 | | | 0.95% |
| | | | | | |
| Investor Class Shares | | $ | 1,000.00 | | | $ | 1,104.00 | | | $ | 6.42 | | | $ | 1,019.10 | | | $ | 6.16 | | | 1.21% |
| | | | | | |
| Class B Shares | | $ | 1,000.00 | | | $ | 1,099.90 | | | $ | 10.43 | | | $ | 1,015.30 | | | $ | 10.01 | | | 1.97% |
| | | | | | |
| Class C Shares | | $ | 1,000.00 | | | $ | 1,100.00 | | | $ | 10.43 | | | $ | 1,015.30 | | | $ | 10.01 | | | 1.97% |
| | | | | | |
| Class I Shares | | $ | 1,000.00 | | | $ | 1,106.80 | | | $ | 3.72 | | | $ | 1,021.70 | | | $ | 3.57 | | | 0.70% |
| | | | | | |
| Class R3 Shares | | $ | 1,000.00 | | | $ | 1,103.70 | | | $ | 6.89 | | | $ | 1,018.70 | | | $ | 6.61 | | | 1.30% |
| 1. | Expenses are equal to the Fund’s annualized expense ratio of each class multiplied by the average account value over the period, divided by 365 and multiplied by 184 (to reflect the six-month period). The table above represents the actual expenses incurred during the six-month period. |
| 2. | Expenses are equal to the Fund’s annualized expense ratio to reflect the six-month period. |
Industry Composition as of October 31, 2017 (Unaudited)
| | | | |
| Oil, Gas & Consumable Fuels | | | 6.7 | % |
| Software | | | 6.3 | |
| Health Care Providers & Services | | | 5.8 | |
| Semiconductors & Semiconductor Equipment | | | 5.4 | |
| Technology Hardware, Storage & Peripherals | | | 5.3 | |
| Banks | | | 5.1 | |
| IT Services | | | 4.4 | |
| Internet Software & Services | | | 4.3 | |
| Pharmaceuticals | | | 4.3 | |
| Hotels, Restaurants & Leisure | | | 3.7 | |
| Internet & Direct Marketing Retail | | | 3.3 | |
| Machinery | | | 3.2 | |
| Insurance | | | 3.1 | |
| Biotechnology | | | 2.8 | |
| Specialty Retail | | | 2.8 | |
| Chemicals | | | 2.5 | |
| Beverages | | | 2.4 | |
| Equity Real Estate Investment Trusts | | | 2.1 | |
| Capital Markets | | | 2.0 | |
| Food & Staples Retailing | | | 1.9 | |
| Diversified Financial Services | | | 1.7 | |
| Electric Utilities | | | 1.7 | |
| Aerospace & Defense | | | 1.6 | |
| Exchange-Traded Funds | | | 1.5 | |
| Metals & Mining | | | 1.3 | |
| Textiles, Apparel & Luxury Goods | | | 1.3 | |
| | | | |
| Tobacco | | | 1.3 | % |
| Health Care Equipment & Supplies | | | 1.2 | |
| Household Products | | | 1.2 | |
| Electronic Equipment, Instruments & Components | | | 1.1 | |
| Independent Power & Renewable Electricity Producers | | | 1.1 | |
| Diversified Telecommunication Services | | | 0.8 | |
| Food Products | | | 0.8 | |
| Media | | | 0.8 | |
| Household Durables | | | 0.7 | |
| Professional Services | | | 0.7 | |
| Consumer Finance | | | 0.6 | |
| Diversified Consumer Services | | | 0.6 | |
| Road & Rail | | | 0.6 | |
| Industrial Conglomerates | | | 0.5 | |
| Multiline Retail | | | 0.4 | |
| Leisure Products | | | 0.3 | |
| Trading Companies & Distributors | | | 0.3 | |
| Auto Components | | | 0.2 | |
| Building Products | | | 0.2 | |
| Communications Equipment | | | 0.2 | |
| Multi-Utilities | | | 0.0 | ‡ |
| Paper & Forest Products | | | 0.0 | ‡ |
| Other Assets, Less Liabilities | | | –0.1 | |
| | | | |
| | | 100.0 | % |
| | | | |
See Portfolio of Investments beginning on page 10 for specific holdings within these categories.
| ‡ | Less than one-tenth of a percent. |
Top Ten Holdings or Issuers as of October 31, 2017 (Unaudited)
| 8. | Facebook, Inc., Class A |
| 10. | Berkshire Hathaway, Inc., Class B |
| | |
| 8 | | MainStay Common Stock Fund |
Portfolio Management Discussion and Analysis (Unaudited)
Questions answered by Migene Kim, CFA, Andrew Ver Planck, CFA, and Mona Patni of Cornerstone Capital Management Holdings LLC, the Fund’s Subadvisor.
How did MainStay Common Stock Fund perform relative to its benchmarks and peers during the 12 months ended October 31, 2017?
Excluding all sales charges, MainStay Common Stock Fund returned 24.59% for Class A shares, 24.25% for Investor Class shares, 23.31% for Class B shares and 23.33% for Class C shares for the 12 months ended October 31, 2017. Over the same period, the Fund’s Class I shares returned 24.89% and Class R3 shares returned 24.17%. For the 12 months ended October 31, 2017, Class A, Investor Class, Class I and Class R3 shares outperformed—and Class B and Class C shares underperformed—the 23.63% return of the S&P 500® Index,1 which is the Fund’s primary benchmark, and the 23.67% return of the Russell 1000® Index,1 which is the Fund’s secondary benchmark. Over the same period, all share classes outperformed the 22.34% return of the Morningstar Large Blend Category Average.2 See page 5 for Fund returns with applicable sales charges.
What factors affected the Fund’s relative performance during the reporting period?
The Fund’s performance relative to the S&P 500® Index resulted primarily from stock selection. Allocation effects—the effects of being overweight or underweight relative to the benchmark in specific sectors as a result of the Fund’s bottom-up stock-selection process—contributed modestly to relative performance.
Which sectors were the strongest contributors to the Fund’s relative performance, and which sectors were particularly weak?
During the reporting period, the strongest positive sector contributions to the Fund’s performance relative to the S&P 500® Index came from industrials, health care and energy. (Contributions take weightings and total returns into account.) In these sectors, stock selection was the main driver of positive contributions to relative performance. An overweight position in the outperforming information technology sector also contributed modestly to the Fund’s relative performance.
The weakest sector contribution to the Fund’s relative performance came from materials, where stock selection detracted from the Fund’s relative performance. An underweight position relative to the S&P 500® Index in the outperforming financials sector also detracted from the Fund’s relative performance.
During the reporting period, which individual stocks made the strongest contributions to the Fund’s absolute performance and which stocks detracted the most?
During the reporting period, the strongest positive contributor to absolute performance was technology company Apple. Best
known for its iPhone, the company continued to deliver strong sales and earnings growth. Software company Microsoft was also among the strongest contributors, benefiting from strong earnings and revenue growth. Large diversified financial institution Bank of America was among the strongest contributors, supported by accelerating growth in the United States and by the likelihood of a rising interest-rate environment.
On an absolute basis, the Fund’s weakest performer was steel producer United States Steel, which suffered from oversupply concerns and slowing demand. Other commodities such as oil faced similar challenges, which affected offshore drilling contractor Transocean. Fertilizer company Mosaic was also a weaker performer because of a disappointing outlook for the company that included expectations of softer pricing and lower margins.
Did the Fund make any significant purchases or sales during the reporting period?
The Fund entered into new positions in industrial equipment company Caterpillar and technology software developer and hardware maker Oracle. The Fund established overweight positions relative to the S&P 500® Index in both of these securities. Strong earnings and cash flows were the main drivers behind the Caterpillar purchase. Oracle has displayed attractive earnings trends, and we believed that the stock was reasonably valued.
The Fund exited positions in insurer Aetna and integrated circuits maker QUALCOMM during the reporting period. The Fund exited Aetna because of its valuation, and it sold QUALCOMM because of deteriorating earnings trends.
How did the Fund’s sector weightings change during the reporting period?
During the reporting period, the Fund modestly increased its weightings relative to the S&P 500® Index in the consumer discretionary and energy sectors. Over the same period, the Fund modestly reduced its weightings relative to the benchmark in the telecommunication services and industrials sectors.
How was the Fund positioned at the end of the reporting period?
As of October 31, 2017, the Fund’s most substantially overweight sectors relative to the S&P 500® Index were information technology and consumer discretionary. As of the same date, the Fund held modestly underweight positions relative to the Index in the industrials and financials sectors.
| 1. | See footnote on page 6 for more information on this index. |
| 2. | See footnote on page 6 for more information on the Morningstar Large Blend Category Average. |
The opinions expressed are those of the portfolio managers as of the date of this report and are subject to change. There is no guarantee that any forecasts made will come to pass. This material does not constitute investment advice and is not intended as an endorsement of any specific investment.
Portfolio of Investments October 31, 2017
| | | | | | | | |
| | |
| | | Shares | | | Value | |
| Common Stocks 98.6%† | | | | | | | | |
Aerospace & Defense 1.6% | | | | | | | | |
Boeing Co. | | | 9,342 | | | $ | 2,410,049 | |
Lockheed Martin Corp. | | | 11 | | | | 3,390 | |
Textron, Inc. | | | 12,229 | | | | 644,957 | |
United Technologies Corp. | | | 475 | | | | 56,886 | |
| | | | | | | | |
| | | | | | | 3,115,282 | |
| | | | | | | | |
Auto Components 0.2% | |
Delphi Automotive PLC | | | 4,509 | | | | 448,104 | |
| | | | | | | | |
|
Banks 5.1% | |
Bank of America Corp. | | | 52,992 | | | | 1,451,451 | |
Citigroup, Inc. | | | 37,840 | | | | 2,781,240 | |
¨JPMorgan Chase & Co. | | | 42,126 | | | | 4,238,297 | |
Wells Fargo & Co. | | | 23,083 | | | | 1,295,879 | |
| | | | | | | | |
| | | | | | | 9,766,867 | |
| | | | | | | | |
Beverages 2.4% | |
Coca-Cola Co. | | | 43,932 | | | | 2,019,993 | |
PepsiCo., Inc. | | | 22,570 | | | | 2,487,891 | |
| | | | | | | | |
| | | | | | | 4,507,884 | |
| | | | | | | | |
Biotechnology 2.8% | |
AbbVie, Inc. | | | 25,349 | | | | 2,287,747 | |
Amgen, Inc. | | | 3,315 | | | | 580,854 | |
Gilead Sciences, Inc. | | | 25,602 | | | | 1,919,126 | |
United Therapeutics Corp. (a) | | | 4,526 | | | | 536,739 | |
| | | | | | | | |
| | | | | | | 5,324,466 | |
| | | | | | | | |
Building Products 0.2% | |
Johnson Controls International PLC | | | 7,871 | | | | 325,781 | |
| | | | | | | | |
|
Capital Markets 2.0% | |
Ameriprise Financial, Inc. | | | 9,243 | | | | 1,446,899 | |
Northern Trust Corp. | | | 7,214 | | | | 674,653 | |
S&P Global, Inc. | | | 1,127 | | | | 176,342 | |
State Street Corp. | | | 15,515 | | | | 1,427,380 | |
| | | | | | | | |
| | | | | | | 3,725,274 | |
| | | | | | | | |
Chemicals 2.5% | |
CF Industries Holdings, Inc. | | | 17,159 | | | | 651,699 | |
Chemours Co. | | | 22,320 | | | | 1,263,535 | |
DowDuPont, Inc. | | | 2,524 | | | | 182,510 | |
LyondellBasell Industries N.V., Class A | | | 12,317 | | | | 1,275,179 | |
Olin Corp. | | | 35,818 | | | | 1,308,432 | |
| | | | | | | | |
| | | | | | | 4,681,355 | |
| | | | | | | | |
Communications Equipment 0.2% | |
ARRIS International PLC (a) | | | 2,870 | | | | 81,795 | |
Cisco Systems, Inc. | | | 6,524 | | | | 222,795 | |
| | | | | | | | |
| | | | | | | 304,590 | |
| | | | | | | | |
| | | | | | | | |
| | |
| | | Shares | | | Value | |
Consumer Finance 0.6% | |
Synchrony Financial | | | 36,359 | | | $ | 1,186,031 | |
| | | | | | | | |
|
Diversified Consumer Services 0.6% | |
H&R Block, Inc. | | | 46,652 | | | | 1,154,170 | |
| | | | | | | | |
|
Diversified Financial Services 1.7% | |
¨Berkshire Hathaway, Inc., Class B (a) | | | 16,757 | | | | 3,132,554 | |
| | | | | | | | |
|
Diversified Telecommunication Services 0.8% | |
AT&T, Inc. | | | 31,840 | | | | 1,071,416 | |
Verizon Communications, Inc. | | | 9,625 | | | | 460,749 | |
| | | | | | | | |
| | | | | | | 1,532,165 | |
| | | | | | | | |
Electric Utilities 1.7% | |
American Electric Power Co., Inc. | | | 7,863 | | | | 585,086 | |
Duke Energy Corp. | | | 3,192 | | | | 281,885 | |
Edison International | | | 326 | | | | 26,064 | |
Exelon Corp. | | | 20,984 | | | | 843,767 | |
FirstEnergy Corp. | | | 10,957 | | | | 361,033 | |
NextEra Energy, Inc. | | | 4,884 | | | | 757,362 | |
PG&E Corp. | | | 5,612 | | | | 324,205 | |
Xcel Energy, Inc. | | | 1,965 | | | | 97,307 | |
| | | | | | | | |
| | | | | | | 3,276,709 | |
| | | | | | | | |
Electronic Equipment, Instruments & Components 1.1% | |
Jabil, Inc. | | | 33,945 | | | | 959,965 | |
Zebra Technologies Corp., Class A (a) | | | 9,301 | | | | 1,078,823 | |
| | | | | | | | |
| | | | | | | 2,038,788 | |
| | | | | | | | |
Equity Real Estate Investment Trusts 2.1% | |
American Tower Corp. | | | 10,629 | | | | 1,527,068 | |
HCP, Inc. | | | 9,571 | | | | 247,315 | |
Hospitality Properties Trust | | | 2,962 | | | | 84,654 | |
Host Hotels & Resorts, Inc. | | | 68,784 | | | | 1,345,415 | |
Public Storage | | | 1,634 | | | | 338,647 | |
SBA Communications Corp. (a) | | | 2,953 | | | | 464,153 | |
Welltower, Inc. | | | 615 | | | | 41,180 | |
| | | | | | | | |
| | | | | | | 4,048,432 | |
| | | | | | | | |
Food & Staples Retailing 1.9% | |
Costco Wholesale Corp. | | | 2,480 | | | | 399,478 | |
CVS Health Corp. | | | 12,096 | | | | 828,939 | |
Wal-Mart Stores, Inc. | | | 26,539 | | | | 2,317,120 | |
| | | | | | | | |
| | | | | | | 3,545,537 | |
| | | | | | | | |
Food Products 0.8% | |
Archer-Daniels-Midland Co. | | | 30,337 | | | | 1,239,873 | |
Tyson Foods, Inc., Class A | | | 2,612 | | | | 190,441 | |
| | | | | | | | |
| | | | | | | 1,430,314 | |
| | | | | | | | |
| † | Percentages indicated are based on Fund net assets. |
| ¨ | | Among the Fund’s 10 largest holdings, as of October 31, 2017. May be subject to change daily. (Unaudited) |
| | | | |
| 10 | | MainStay Common Stock Fund | | The notes to the financial statements are an integral part of,
and should be read in conjunction with, the financial statements. |
| | | | | | | | |
| | |
| | | Shares | | | Value | |
| Common Stocks (continued) | |
Health Care Equipment & Supplies 1.2% | |
Baxter International, Inc. | | | 22,607 | | | $ | 1,457,473 | |
Intuitive Surgical, Inc. (a) | | | 475 | | | | 178,296 | |
Masimo Corp. (a) | | | 6,155 | | | | 540,163 | |
Medtronic PLC | | | 2,363 | | | | 190,269 | |
| | | | | | | | |
| | | | | | | 2,366,201 | |
| | | | | | | | |
Health Care Providers & Services 5.8% | |
Anthem, Inc. | | | 8,355 | | | | 1,747,949 | |
Centene Corp. (a) | | | 14,012 | | | | 1,312,504 | |
Cigna Corp. | | | 8,394 | | | | 1,655,465 | |
Express Scripts Holding Co. (a) | | | 5,755 | | | | 352,724 | |
HealthSouth Corp. | | | 2,546 | | | | 117,472 | |
Humana, Inc. | | | 5,988 | | | | 1,529,036 | |
UnitedHealth Group, Inc. | | | 13,959 | | | | 2,934,461 | |
WellCare Health Plans, Inc. (a) | | | 6,701 | | | | 1,325,056 | |
| | | | | | | | |
| | | | | | | 10,974,667 | |
| | | | | | | | |
Hotels, Restaurants & Leisure 3.7% | |
Carnival Corp. | | | 21,045 | | | | 1,397,177 | |
Darden Restaurants, Inc. | | | 15,352 | | | | 1,263,009 | |
Marriott International, Inc., Class A | | | 4,292 | | | | 512,808 | |
Royal Caribbean Cruises, Ltd. | | | 11,079 | | | | 1,371,248 | |
Wyndham Worldwide Corp. | | | 8,394 | | | | 896,899 | |
Wynn Resorts, Ltd. | | | 8,883 | | | | 1,310,154 | |
Yum! Brands, Inc. | | | 2,836 | | | | 211,140 | |
| | | | | | | | |
| | | | | | | 6,962,435 | |
| | | | | | | | |
Household Durables 0.7% | |
NVR, Inc. (a) | | | 5 | | | | 16,407 | |
PulteGroup, Inc. | | | 41,118 | | | | 1,242,997 | |
| | | | | | | | |
| | | | | | | 1,259,404 | |
| | | | | | | | |
Household Products 1.2% | |
Procter & Gamble Co. | | | 26,806 | | | | 2,314,430 | |
| | | | | | | | |
|
Independent Power & Renewable Electricity Producers 1.1% | |
AES Corp. | | | 83,297 | | | | 885,447 | |
NRG Energy, Inc. | | | 51,821 | | | | 1,295,525 | |
| | | | | | | | |
| | | | | | | 2,180,972 | |
| | | | | | | | |
Industrial Conglomerates 0.5% | |
3M Co. | | | 1,223 | | | | 281,522 | |
General Electric Co. | | | 21,410 | | | | 431,626 | |
Honeywell International, Inc. | | | 1,047 | | | | 150,936 | |
| | | | | | | | |
| | | | | | | 864,084 | |
| | | | | | | | |
Insurance 3.1% | |
Aflac, Inc. | | | 15,175 | | | | 1,273,031 | |
Allstate Corp. | | | 13,025 | | | | 1,222,527 | |
Assurant, Inc. | | | 963 | | | | 96,926 | |
First American Financial Corp. | | | 15,364 | | | | 836,109 | |
Lincoln National Corp. | | | 9,298 | | | | 704,602 | |
MetLife, Inc. | | | 8,997 | | | | 482,059 | |
| | | | | | | | |
| | |
| | | Shares | | | Value | |
Insurance (continued) | |
Principal Financial Group, Inc. | | | 15 | | | $ | 988 | |
Progressive Corp. | | | 7,371 | | | | 358,599 | |
Prudential Financial, Inc. | | | 2,466 | | | | 272,394 | |
Travelers Cos., Inc. | | | 1,268 | | | | 167,947 | |
Unum Group | | | 154 | | | | 8,014 | |
XL Group, Ltd. | | | 9,118 | | | | 369,005 | |
| | | | | | | | |
| | | | | | | 5,792,201 | |
| | | | | | | | |
Internet & Direct Marketing Retail 3.3% | |
¨Amazon.com, Inc. (a) | | | 4,536 | | | | 5,013,550 | |
Expedia, Inc. | | | 9,096 | | | | 1,133,907 | |
Netflix, Inc. (a) | | | 286 | | | | 56,179 | |
Priceline Group, Inc. (a) | | | 29 | | | | 55,447 | |
| | | | | | | | |
| | | | | | | 6,259,083 | |
| | | | | | | | |
Internet Software & Services 4.3% | |
Akamai Technologies, Inc. (a) | | | 13,274 | | | | 693,567 | |
¨Alphabet, Inc. (a) | | | | | | | | |
Class A | | | 1,935 | | | | 1,998,932 | |
Class C | | | 1,918 | | | | 1,949,916 | |
¨Facebook, Inc., Class A (a) | | | 19,906 | | | | 3,584,274 | |
| | | | | | | | |
| | | | | | | 8,226,689 | |
| | | | | | | | |
IT Services 4.4% | |
Accenture PLC, Class A | | | 2,115 | | | | 301,091 | |
Alliance Data Systems Corp. | | | 5,614 | | | | 1,256,020 | |
International Business Machines Corp. | | | 15,115 | | | | 2,328,617 | |
Mastercard, Inc., Class A | | | 7,875 | | | | 1,171,564 | |
MAXIMUS, Inc. | | | 7,699 | | | | 511,445 | |
PayPal Holdings, Inc. (a) | | | 9,454 | | | | 685,982 | |
Total System Services, Inc. | | | 5,770 | | | | 415,728 | |
Visa, Inc., Class A | | | 15,455 | | | | 1,699,741 | |
| | | | | | | | |
| | | | | | | 8,370,188 | |
| | | | | | | | |
Leisure Products 0.3% | |
Polaris Industries, Inc. | | | 4,069 | | | | 481,892 | |
| | | | | | | | |
|
Machinery 3.2% | |
Caterpillar, Inc. | | | 14,158 | | | | 1,922,656 | |
Cummins, Inc. | | | 7,170 | | | | 1,268,230 | |
Oshkosh Corp. | | | 14,394 | | | | 1,317,915 | |
PACCAR, Inc. | | | 5,899 | | | | 423,135 | |
Terex Corp. | | | 12,965 | | | | 610,781 | |
Trinity Industries, Inc. | | | 15,265 | | | | 496,418 | |
| | | | | | | | |
| | | | | | | 6,039,135 | |
| | | | | | | | |
Media 0.8% | |
Comcast Corp., Class A | | | 38,379 | | | | 1,382,795 | |
Live Nation Entertainment, Inc. (a) | | | 3,634 | | | | 159,097 | |
Walt Disney Co. | | | 515 | | | | 50,372 | |
| | | | | | | | |
| | | | | | | 1,592,264 | |
| | | | | | | | |
| | | | | | |
The notes to the financial statements are an integral part of,
and should be read in conjunction with, the financial statements. | | | | | 11 | |
Portfolio of Investments October 31, 2017 (continued)
| | | | | | | | |
| | |
| | | Shares | | | Value | |
| Common Stocks (continued) | |
Metals & Mining 1.3% | |
Freeport-McMoRan, Inc. (a) | | | 92,874 | | | $ | 1,298,379 | |
Newmont Mining Corp. | | | 29,964 | | | | 1,083,498 | |
| | | | | | | | |
| | | | | | | 2,381,877 | |
| | | | | | | | |
Multi-Utilities 0.0%‡ | |
Consolidated Edison, Inc. | | | 147 | | | | 12,649 | |
| | | | | | | | |
|
Multiline Retail 0.4% | |
Nordstrom, Inc. | | | 15,105 | | | | 598,913 | |
Target Corp. | | | 3,146 | | | | 185,740 | |
| | | | | | | | |
| | | | | | | 784,653 | |
| | | | | | | | |
Oil, Gas & Consumable Fuels 6.7% | |
Andeavor | | | 7,335 | | | | 779,270 | |
Chevron Corp. | | | 24,715 | | | | 2,864,221 | |
¨Exxon Mobil Corp. | | | 50,151 | | | | 4,180,086 | |
HollyFrontier Corp. | | | 30,191 | | | | 1,115,558 | |
Marathon Petroleum Corp. | | | 24,773 | | | | 1,479,939 | |
ONEOK, Inc. | | | 13,000 | | | | 705,510 | |
Valero Energy Corp. | | | 19,828 | | | | 1,564,231 | |
| | | | | | | | |
| | | | | | | 12,688,815 | |
| | | | | | | | |
Paper & Forest Products 0.0%‡ | |
Louisiana-Pacific Corp. (a) | | | 1,282 | | | | 34,845 | |
| | | | | | | | |
| | |
Pharmaceuticals 4.3% | | | | | | | | |
Eli Lilly & Co. | | | 3,502 | | | | 286,954 | |
¨Johnson & Johnson | | | 30,751 | | | | 4,286,997 | |
Merck & Co., Inc. | | | 13,346 | | | | 735,231 | |
Mylan N.V. (a) | | | 3,456 | | | | 123,414 | |
Pfizer, Inc. | | | 75,736 | | | | 2,655,304 | |
| | | | | | | | |
| | | | | | | 8,087,900 | |
| | | | | | | | |
Professional Services 0.7% | |
Robert Half International, Inc. | | | 25,526 | | | | 1,321,481 | |
| | | | | | | | |
| | |
Road & Rail 0.6% | | | | | | | | |
Knight-Swift Transportation Holdings, Inc. (a) | | | 14,824 | | | | 614,455 | |
Ryder System, Inc. | | | 7,571 | | | | 613,856 | |
| | | | | | | | |
| | | | | | | 1,228,311 | |
| | | | | | | | |
Semiconductors & Semiconductor Equipment 5.4% | |
Applied Materials, Inc. | | | 10,949 | | | | 617,852 | |
Broadcom, Ltd. | | | 1,002 | | | | 264,438 | |
First Solar, Inc. (a) | | | 24,447 | | | | 1,340,185 | |
¨Intel Corp. | | | 70,269 | | | | 3,196,537 | |
Lam Research Corp. | | | 7,665 | | | | 1,598,689 | |
Micron Technology, Inc. (a) | | | 40,404 | | | | 1,790,301 | |
NVIDIA Corp. | | | 1,789 | | | | 369,983 | |
Qorvo, Inc. (a) | | | 14,309 | | | | 1,084,765 | |
| | | | | | | | |
| | | | | | | 10,262,750 | |
| | | | | | | | |
| | | | | | | | |
| | |
| | | Shares | | | Value | |
Software 6.3% | |
Adobe Systems, Inc. (a) | | | 522 | | | $ | 91,433 | |
CA, Inc. | | | 37,815 | | | | 1,224,450 | |
Electronic Arts, Inc. (a) | | | 12,254 | | | | 1,465,578 | |
¨Microsoft Corp. | | | 80,305 | | | | 6,679,770 | |
Oracle Corp. | | | 48,461 | | | | 2,466,665 | |
| | | | | | | | |
| | | | | | | 11,927,896 | |
| | | | | | | | |
Specialty Retail 2.8% | |
Best Buy Co., Inc. | | | 22,857 | | | | 1,279,535 | |
Gap, Inc. | | | 45,026 | | | | 1,170,226 | |
Home Depot, Inc. | | | 7,662 | | | | 1,270,206 | |
Lowe’s Cos., Inc. | | | 19,735 | | | | 1,577,813 | |
| | | | | | | | |
| | | | | | | 5,297,780 | |
| | | | | | | | |
Technology Hardware, Storage & Peripherals 5.3% | |
¨Apple, Inc. | | | 44,611 | | | | 7,541,043 | |
Hewlett Packard Enterprise Co. | | | 13,928 | | | | 193,878 | |
HP, Inc. | | | 43,450 | | | | 936,348 | |
Western Digital Corp. | | | 16,126 | | | | 1,439,568 | |
| | | | | | | | |
| | | | | | | 10,110,837 | |
| | | | | | | | |
Textiles, Apparel & Luxury Goods 1.3% | |
Michael Kors Holdings, Ltd. (a) | | | 26,506 | | | | 1,293,758 | |
Ralph Lauren Corp. | | | 6,909 | | | | 617,872 | |
Tapestry, Inc. | | | 15,067 | | | | 616,993 | |
| | | | | | | | |
| | | | | | | 2,528,623 | |
| | | | | | | | |
Tobacco 1.3% | |
Philip Morris International, Inc. | | | 23,453 | | | | 2,454,122 | |
| | | | | | | | |
| | |
Trading Companies & Distributors 0.3% | | | | | | | | |
United Rentals, Inc. (a) | | | 4,287 | | | | 606,525 | |
| | | | | | | | |
Total Common Stocks
(Cost $156,422,057) | | | | | | | 186,957,012 | |
| | | | | | | | |
| | |
| Exchange-Traded Funds 1.5% | | | | | | | | |
SPDR S&P 500 ETF Trust | | | 11,231 | | | | 2,888,052 | |
| | | | | | | | |
Total Exchange-Traded Funds
(Cost $2,861,337) | | | | | | | 2,888,052 | |
| | | | | | | | |
Total Investments
(Cost $159,283,394) | | | 100.1 | % | | | 189,845,064 | |
Other Assets, Less Liabilities | | | (0.1 | ) | | | (99,119 | ) |
Net Assets | | | 100.0 | % | | $ | 189,745,945 | |
| ‡ | Less than one-tenth of a percent. |
| (a) | Non-income producing security. |
The following abbreviations are used in the preceding pages:
ETF —Exchange-Traded Fund
SPDR —Standard & Poor’s Depositary Receipt
| | | | |
| 12 | | MainStay Common Stock Fund | | The notes to the financial statements are an integral part of,
and should be read in conjunction with, the financial statements. |
The following is a summary of the fair valuations according to the inputs used as of October 31, 2017, for valuing the Fund’s assets.
Asset Valuation Inputs
| | | | | | | | | | | | | | | | |
Description | | Quoted Prices in Active Markets for Identical Assets (Level 1) | | | Significant Other Observable Inputs (Level 2) | | | Significant Unobservable Inputs (Level 3) | | | Total | |
| Investments in Securities (a) | | | | | | | | | | | | | | | | |
| Common Stocks | | $ | 186,957,012 | | | $ | — | | | $ | — | | | $ | 186,957,012 | |
| Exchange-Traded Funds | | | 2,888,052 | | | | — | | | | — | | | | 2,888,052 | |
| | | | | | | | | | | | | | | | |
| Total Investments in Securities | | $ | 189,845,064 | | | $ | — | | | $ | — | | | $ | 189,845,064 | |
| | | | | | | | | | | | | | | | |
| (a) | For a complete listing of investments and their industries, see the Portfolio of Investments. |
The Fund recognizes transfers between the levels as of the beginning of the period.
For the year ended October 31, 2017, the Fund did not have any transfers among levels. (See Note 2)
As of October 31, 2017, the Fund did not hold any investments with significant unobservable inputs (Level 3). (See Note 2)
| | | | | | |
The notes to the financial statements are an integral part of,
and should be read in conjunction with, the financial statements. | | | | | 13 | |
Statement of Assets and Liabilities as of October 31, 2017
| | | | |
| Assets | |
Investment in securities, at value
(identified cost $159,283,394) | | $ | 189,845,064 | |
Cash | | | 93,396 | |
Receivables: | | | | |
Dividends and interest | | | 134,367 | |
Fund shares sold | | | 31,470 | |
Other assets | | | 30,085 | |
| | | | |
Total assets | | | 190,134,382 | |
| | | | |
| |
| Liabilities | | | | |
Payables: | | | | |
Fund shares redeemed | | | 213,478 | |
Manager (See Note 3) | | | 87,800 | |
NYLIFE Distributors (See Note 3) | | | 33,603 | |
Shareholder communication | | | 16,445 | |
Transfer agent (See Note 3) | | | 16,036 | |
Custodian | | | 7,878 | |
Professional fees | | | 6,725 | |
Trustees | | | 461 | |
Accrued expenses | | | 6,011 | |
| | | | |
Total liabilities | | | 388,437 | |
| | | | |
Net assets | | $ | 189,745,945 | |
| | | | |
| |
| Composition of Net Assets | | | | |
Shares of beneficial interest outstanding (par value of $.01 per share) unlimited number of shares authorized | | $ | 77,932 | |
Additional paid-in capital | | | 158,000,517 | |
| | | | |
| | | 158,078,449 | |
Undistributed net investment income | | | 1,518,583 | |
Accumulated net realized gain (loss) on investments | | | (412,757 | ) |
Net unrealized appreciation (depreciation) on investments | | | 30,561,670 | |
| | | | |
Net assets | | $ | 189,745,945 | |
| | | | |
| | | | |
Class A | | | | |
Net assets applicable to outstanding shares | | $ | 53,909,040 | |
| | | | |
Shares of beneficial interest outstanding | | | 2,195,026 | |
| | | | |
Net asset value per share outstanding | | $ | 24.56 | |
Maximum sales charge (5.50% of offering price) | | | 1.43 | |
| | | | |
Maximum offering price per share outstanding | | $ | 25.99 | |
| | | | |
Investor Class | | | | |
Net assets applicable to outstanding shares | | $ | 17,215,590 | |
| | | | |
Shares of beneficial interest outstanding | | | 701,816 | |
| | | | |
Net asset value per share outstanding | | $ | 24.53 | |
Maximum sales charge (5.50% of offering price) | | | 1.43 | |
| | | | |
Maximum offering price per share outstanding | | $ | 25.96 | |
| | | | |
Class B | | | | |
Net assets applicable to outstanding shares | | $ | 6,635,175 | |
| | | | |
Shares of beneficial interest outstanding | | | 295,381 | |
| | | | |
Net asset value and offering price per share outstanding | | $ | 22.46 | |
| | | | |
Class C | | | | |
Net assets applicable to outstanding shares | | $ | 15,459,338 | |
| | | | |
Shares of beneficial interest outstanding | | | 688,678 | |
| | | | |
Net asset value and offering price per share outstanding | | $ | 22.45 | |
| | | | |
Class I | | | | |
Net assets applicable to outstanding shares | | $ | 96,440,876 | |
| | | | |
Shares of beneficial interest outstanding | | | 3,908,827 | |
| | | | |
Net asset value and offering price per share outstanding | | $ | 24.67 | |
| | | | |
Class R3 | | | | |
Net assets applicable to outstanding shares | | $ | 85,926 | |
| | | | |
Shares of beneficial interest outstanding | | | 3,510 | |
| | | | |
Net asset value and offering price per share outstanding | | $ | 24.48 | |
| | | | |
| | | | |
| 14 | | MainStay Common Stock Fund | | The notes to the financial statements are an integral part of,
and should be read in conjunction with, the financial statements. |
Statement of Operations for the year ended October 31, 2017
| | | | |
| Investment Income (Loss) | |
Income | | | | |
Dividends | | $ | 3,744,043 | |
Other income | | | 195 | |
Interest | | | 70 | |
| | | | |
Total income | | | 3,744,308 | |
| | | | |
Expenses | | | | |
Manager (See Note 3) | | | 1,019,499 | |
Distribution/Service—Class A (See Note 3) | | | 110,222 | |
Distribution/Service—Investor Class (See Note 3) | | | 57,744 | |
Distribution/Service—Class B (See Note 3) | | | 67,384 | |
Distribution/Service—Class C (See Note 3) | | | 160,569 | |
Distribution/Service—Class R3 (See Note 3) | | | 184 | |
Transfer agent (See Note 3) | | | 190,555 | |
Registration | | | 106,489 | |
Professional fees | | | 55,286 | |
Shareholder communication | | | 30,039 | |
Custodian | | | 8,435 | |
Trustees | | | 4,542 | |
Shareholder service (See Note 3) | | | 37 | |
Miscellaneous | | | 15,312 | |
| | | | |
Total expenses | | | 1,826,297 | |
| | | | |
Net investment income (loss) | | | 1,918,011 | |
| | | | |
|
| Realized and Unrealized Gain (Loss) on Investments | |
Net realized gain (loss) on investments | | | 16,992,315 | |
Net change in unrealized appreciation (depreciation) on investments | | | 21,674,644 | |
| | | | |
Net realized and unrealized gain (loss) on investments | | | 38,666,959 | |
| | | | |
Net increase (decrease) in net assets resulting from operations | | $ | 40,584,970 | |
| | | | |
| | | | | | |
The notes to the financial statements are an integral part of,
and should be read in conjunction with, the financial statements. | | | | | 15 | |
Statements of Changes in Net Assets
for the years ended October 31, 2017 and October 31, 2016
| | | | | | | | |
| | | 2017 | | | 2016 | |
| Increase (Decrease) in Net Assets | |
Operations: | | | | | | | | |
Net investment income (loss) | | $ | 1,918,011 | | | $ | 2,346,788 | |
Net realized gain (loss) on investments | | | 16,992,315 | | | | 4,451,239 | |
Net change in unrealized appreciation (depreciation) on investments | | | 21,674,644 | | | | (6,715,636 | ) |
| | | | |
Net increase (decrease) in net assets resulting from operations | | | 40,584,970 | | | | 82,391 | |
| | | | |
Dividends to shareholders: | | | | | | | | |
From net investment income: | | | | | | | | |
Class A | | | (566,825 | ) | | | (546,900 | ) |
Investor Class | | | (220,201 | ) | | | (202,195 | ) |
Class B | | | (13,572 | ) | | | (12,079 | ) |
Class C | | | (33,607 | ) | | | (44,949 | ) |
Class I | | | (1,365,744 | ) | | | (1,194,013 | ) |
Class R3 | | | (287 | ) | | | — | |
| | | | |
Total dividends to shareholders | | | (2,200,236 | ) | | | (2,000,136 | ) |
| | | | |
Capital share transactions: | | | | | | | | |
Net proceeds from sale of shares | | | 24,691,224 | | | | 47,224,998 | |
Net asset value of shares issued to shareholders in reinvestment of dividends | | | 2,141,327 | | | | 1,936,763 | |
Cost of shares redeemed | | | (51,194,803 | ) | | | (71,596,871 | ) |
| | | | |
Increase (decrease) in net assets derived from capital share transactions | | | (24,362,252 | ) | | | (22,435,110 | ) |
| | | | |
Net increase (decrease) in net assets | | | 14,022,482 | | | | (24,352,855 | ) |
|
| Net Assets | |
Beginning of year | | | 175,723,463 | | | | 200,076,318 | |
| | | | |
End of year | | $ | 189,745,945 | | | $ | 175,723,463 | |
| | | | |
Undistributed net investment income at end of year | | $ | 1,518,583 | | | $ | 1,857,580 | |
| | | | |
| | | | |
| 16 | | MainStay Common Stock Fund | | The notes to the financial statements are an integral part of,
and should be read in conjunction with, the financial statements. |
Financial Highlights selected per share data and ratios
| | | | | | | | | | | | | | | | | | | | |
| | | Year ended October 31, | |
| Class A | | 2017 | | | 2016 | | | 2015 | | | 2014 | | | 2013 | |
Net asset value at beginning of year | | $ | 19.95 | | | $ | 20.20 | | | $ | 19.39 | | | $ | 16.59 | | | $ | 12.90 | |
| | | | | | | | | | | | | | | | | | | | |
Net investment income (loss) (a) | | | 0.23 | | | | 0.25 | | | | 0.20 | | | | 0.18 | | | | 0.16 | |
Net realized and unrealized gain (loss) on investments | | | 4.63 | | | | (0.28 | ) | | | 0.76 | | | | 2.83 | | | | 3.71 | |
| | | | | | | | | | | | | | | | | | | | |
Total from investment operations | | | 4.86 | | | | (0.03 | ) | | | 0.96 | | | | 3.01 | | | | 3.87 | |
| | | | | | | | | | | | | | | | | | | | |
| Less dividends: | | | | | | | | | | | | | | | | | | | | |
From net investment income | | | (0.25 | ) | | | (0.22 | ) | | | (0.15 | ) | | | (0.21 | ) | | | (0.18 | ) |
| | | | | | | | | | | | | | | | | | | | |
Net asset value at end of year | | $ | 24.56 | | | $ | 19.95 | | | $ | 20.20 | | | $ | 19.39 | | | $ | 16.59 | |
| | | | | | | | | | | | | | | | | | | | |
Total investment return (b) | | | 24.59 | % | | | (0.13 | %) | | | 4.95 | % | | | 18.30 | % | | | 30.35 | % |
| Ratios (to average net assets)/Supplemental Data: | | | | | | | | | | | | | | | | | | | | |
Net investment income (loss) | | | 1.05 | % | | | 1.29 | % (c) | | | 1.01 | % | | | 0.98 | % | | | 1.11 | % |
Net expenses | | | 0.96 | % | | | 0.95 | % (d) | | | 0.96 | % | | | 1.00 | % | | | 1.05 | % |
Portfolio turnover rate | | | 134 | % | | | 164 | % | | | 158 | % | | | 165 | % | | | 150 | % |
Net assets at end of year (in 000’s) | | $ | 53,909 | | | $ | 42,928 | | | $ | 52,985 | | | $ | 34,139 | | | $ | 19,011 | |
| (a) | Per share data based on average shares outstanding during the year. |
| (b) | Total investment return is calculated exclusive of sales charges and assumes the reinvestment of dividends and distributions. For periods of less than one year, total return is not annualized. |
| (c) | Without the custody fee reimbursement, net investment income (loss) would have been 1.28%. |
| (d) | Without the custody fee reimbursement, net expenses would have been 0.96%. |
| | | | | | | | | | | | | | | | | | | | |
| | | Year ended October 31, | |
| Investor Class | | 2017 | | | 2016 | | | 2015 | | | 2014 | | | 2013 | |
Net asset value at beginning of year | | $ | 19.93 | | | $ | 20.19 | | | $ | 19.38 | | | $ | 16.58 | | | $ | 12.89 | |
| | | | | | | | | | | | | | | | | | | | |
Net investment income (loss) (a) | | | 0.18 | | | | 0.21 | | | | 0.16 | | | | 0.13 | | | | 0.10 | |
Net realized and unrealized gain (loss) on investments | | | 4.62 | | | | (0.29 | ) | | | 0.76 | | | | 2.82 | | | | 3.70 | |
| | | | | | | | | | | | | | | | | | | | |
Total from investment operations | | | 4.80 | | | | (0.08 | ) | | | 0.92 | | | | 2.95 | | | | 3.80 | |
| | | | | | | | | | | | | | | | | | | | |
| Less dividends: | | | | | | | | | | | | | | | | | | | | |
From net investment income | | | (0.20 | ) | | | (0.18 | ) | | | (0.11 | ) | | | (0.15 | ) | | | (0.11 | ) |
| | | | | | | | | | | | | | | | | | | | |
Net asset value at end of year | | $ | 24.53 | | | $ | 19.93 | | | $ | 20.19 | | | $ | 19.38 | | | $ | 16.58 | |
| | | | | | | | | | | | | | | | | | | | |
Total investment return (b) | | | 24.25 | % | | | (0.39 | %) | | | 4.77 | % | | | 17.94 | % | | | 29.75 | % |
| Ratios (to average net assets)/Supplemental Data: | | | | | | | | | | | | | | | | | | | | |
Net investment income (loss) | | | 0.83 | % | | | 1.05 | % (c) | | | 0.82 | % | | | 0.71 | % | | | 0.72 | % |
Net expenses | | | 1.22 | % | | | 1.20 | % (d) | | | 1.17 | % | | | 1.28 | % | | | 1.46 | % |
Portfolio turnover rate | | | 134 | % | | | 164 | % | | | 158 | % | | | 165 | % | | | 150 | % |
Net assets at end of year (in 000’s) | | $ | 17,216 | | | $ | 21,880 | | | $ | 22,939 | | | $ | 20,856 | | | $ | 18,436 | |
| (a) | Per share data based on average shares outstanding during the year. |
| (b) | Total investment return is calculated exclusive of sales charges and assumes the reinvestment of dividends and distributions. For periods of less than one year, total return is not annualized. |
| (c) | Without the custody fee reimbursement, net investment income (loss) would have been 1.04%. |
| (d) | Without the custody fee reimbursement, net expenses would have been 1.21%. |
| | | | | | |
The notes to the financial statements are an integral part of,
and should be read in conjunction with, the financial statements. | | | | | 17 | |
Financial Highlights selected per share data and ratios
| | | | | | | | | | | | | | | | | | | | |
| | | Year ended October 31, | |
| Class B | | 2017 | | | 2016 | | | 2015 | | | 2014 | | | 2013 | |
Net asset value at beginning of year | | $ | 18.25 | | | $ | 18.49 | | | $ | 17.81 | | | $ | 15.27 | | | $ | 11.87 | |
| | | | | | | | | | | | | | | | | | | | |
Net investment income (loss) (a) | | | 0.01 | | | | 0.05 | | | | 0.02 | | | | (0.00 | )‡ | | | (0.00 | )‡ |
Net realized and unrealized gain (loss) on investments | | | 4.24 | | | | (0.26 | ) | | | 0.69 | | | | 2.59 | | | | 3.42 | |
| | | | | | | | | | | | | | | | | | | | |
Total from investment operations | | | 4.25 | | | | (0.21 | ) | | | 0.71 | | | | 2.59 | | | | 3.42 | |
| | | | | | | | | | | | | | | | | | | | |
| Less dividends: | | | | | | | | | | | | | | | | | | | | |
From net investment income | | | (0.04 | ) | | | (0.03 | ) | | | (0.03 | ) | | | (0.05 | ) | | | (0.02 | ) |
| | | | | | | | | | | | | | | | | | | | |
Net asset value at end of year | | $ | 22.46 | | | $ | 18.25 | | | $ | 18.49 | | | $ | 17.81 | | | $ | 15.27 | |
| | | | | | | | | | | | | | | | | | | | |
Total investment return (b) | | | 23.31 | % | | | (1.12 | %) | | | 4.01 | % | | | 17.00 | % | | | 28.87 | % |
| Ratios (to average net assets)/Supplemental Data: | | | | | | | | | | | | | | | | | | | | |
Net investment income (loss) | | | 0.06 | % | | | 0.30 | % (c) | | | 0.09 | % | | | (0.03 | %) | | | (0.03 | %) |
Net expenses | | | 1.97 | % | | | 1.95 | % (d) | | | 1.92 | % | | | 2.03 | % | | | 2.21 | % |
Portfolio turnover rate | | | 134 | % | | | 164 | % | | | 158 | % | | | 165 | % | | | 150 | % |
Net assets at end of year (in 000’s) | | $ | 6,635 | | | $ | 6,604 | | | $ | 6,816 | | | $ | 7,240 | | | $ | 6,760 | |
| ‡ | Less than one cent per share. |
| (a) | Per share data based on average shares outstanding during the year. |
| (b) | Total investment return is calculated exclusive of sales charges and assumes the reinvestment of dividends and distributions. For periods of less than one year, total return is not annualized. |
| (c) | Without the custody fee reimbursement, net investment income (loss) would have been 0.29%. |
| (d) | Without the custody fee reimbursement, net expenses would have been 1.96%. |
| | | | | | | | | | | | | | | | | | | | |
| | | Year ended October 31, | |
| Class C | | 2017 | | | 2016 | | | 2015 | | | 2014 | | | 2013 | |
Net asset value at beginning of year | | $ | 18.24 | | | $ | 18.48 | | | $ | 17.80 | | | $ | 15.26 | | | $ | 11.87 | |
| | | | | | | | | | | | | | | | | | | | |
Net investment income (loss) (a) | | | 0.01 | | | | 0.06 | | | | 0.01 | | | | (0.02 | ) | | | (0.01 | ) |
Net realized and unrealized gain (loss) on investments | | | 4.24 | | | | (0.27 | ) | | | 0.70 | | | | 2.61 | | | | 3.42 | |
| | | | | | | | | | | | | | | | | | | | |
Total from investment operations | | | 4.25 | | | | (0.21 | ) | | | 0.71 | | | | 2.59 | | | | 3.41 | |
| | | | | | | | | | | | | | | | | | | | |
| Less dividends: | | | | | | | | | | | | | | | | | | | | |
From net investment income | | | (0.04 | ) | | | (0.03 | ) | | | (0.03 | ) | | | (0.05 | ) | | | (0.02 | ) |
| | | | | | | | | | | | | | | | | | | | |
Net asset value at end of year | | $ | 22.45 | | | $ | 18.24 | | | $ | 18.48 | | | $ | 17.80 | | | $ | 15.26 | |
| | | | | | | | | | | | | | | | | | | | |
Total investment return (b) | | | 23.33 | % | | | (1.12 | %) | | | 4.01 | % | | | 17.01 | % | | | 28.78 | % |
| Ratios (to average net assets)/Supplemental Data: | | | | | | | | | | | | | | | | | | | | |
Net investment income (loss) | | | 0.06 | % | | | 0.34 | % (c) | | | 0.06 | % | | | (0.10 | %) | | | (0.10 | %) |
Net expenses | | | 1.97 | % | | | 1.95 | % (d) | | | 1.92 | % | | | 2.03 | % | | | 2.21 | % |
Portfolio turnover rate | | | 134 | % | | | 164 | % | | | 158 | % | | | 165 | % | | | 150 | % |
Net assets at end of year (in 000’s) | | $ | 15,459 | | | $ | 16,509 | | | $ | 25,775 | | | $ | 16,536 | | | $ | 3,441 | |
| (a) | Per share data based on average shares outstanding during the year. |
| (b) | Total investment return is calculated exclusive of sales charges and assumes the reinvestment of dividends and distributions. For periods of less than one year, total return is not annualized. |
| (c) | Without the custody fee reimbursement, net investment income (loss) would have been 0.33%. |
| (d) | Without the custody fee reimbursement, net expenses would have been 1.96%. |
| | | | |
| 18 | | MainStay Common Stock Fund | | The notes to the financial statements are an integral part of,
and should be read in conjunction with, the financial statements. |
Financial Highlights selected per share data and ratios
| | | | | | | | | | | | | | | | | | | | |
| | | Year ended October 31, | |
| Class I | | 2017 | | | 2016 | | | 2015 | | | 2014 | | | 2013 | |
Net asset value at beginning of year | | $ | 20.04 | | | $ | 20.29 | | | $ | 19.45 | | | $ | 16.64 | | | $ | 12.94 | |
| | | | | | | | | | | | | | | | | | | | |
Net investment income (loss) (a) | | | 0.29 | | | | 0.31 | | | | 0.26 | | | | 0.22 | | | | 0.20 | |
Net realized and unrealized gain (loss) on investments | | | 4.65 | | | | (0.29 | ) | | | 0.76 | | | | 2.83 | | | | 3.71 | |
| | | | | | | | | | | | | | | | | | | | |
Total from investment operations | | | 4.94 | | | | 0.02 | | | | 1.02 | | | | 3.05 | | | | 3.91 | |
| | | | | | | | | | | | | | | | | | | | |
| Less dividends: | | | | | | | | | | | | | | | | | | | | |
From net investment income | | | (0.31 | ) | | | (0.27 | ) | | | (0.18 | ) | | | (0.24 | ) | | | (0.21 | ) |
| | | | | | | | | | | | | | | | | | | | |
Net asset value at end of year | | $ | 24.67 | | | $ | 20.04 | | | $ | 20.29 | | | $ | 19.45 | | | $ | 16.64 | |
| | | | | | | | | | | | | | | | | | | | |
Total investment return (b) | | | 24.89 | % | | | 0.12 | % | | | 5.26 | % | | | 18.55 | % | | | 30.65 | % |
| Ratios (to average net assets)/Supplemental Data: | | | | | | | | | | | | | | | | | | | | |
Net investment income (loss) | | | 1.31 | % | | | 1.55 | %(c) | | | 1.30 | % | | | 1.24 | % | | | 1.40 | % |
Net expenses | | | 0.71 | % | | | 0.70 | %(d) | | | 0.71 | % | | | 0.75 | % | | | 0.80 | % |
Portfolio turnover rate | | | 134 | % | | | 164 | % | | | 158 | % | | | 165 | % | | | 150 | % |
Net assets at end of year (in 000’s) | | $ | 96,441 | | | $ | 87,774 | | | $ | 91,561 | | | $ | 108,343 | | | $ | 77,476 | |
| (a) | Per share data based on average shares outstanding during the year. |
| (b) | Total investment return is calculated exclusive of sales charges and assumes the reinvestment of dividends and distributions. Class I shares are not subject to sales charges. For periods of less than one year, total return is not annualized. |
| (c) | Without the custody fee reimbursement, net investment income (loss) would have been 1.54%. |
| (d) | Without the custody fee reimbursement, net expenses would have been 0.71%. |
| | | | | | | | |
| Class R3 | | Year ended
October 31,
2017 | | | February 29,
2016 **
through
October 31,
2016 | |
Net asset value at beginning of period | | $ | 19.90 | | | $ | 18.44 | |
| | | | | | | | |
Net investment income (loss) (a) | | | 0.13 | | | | 0.10 | |
Net realized and unrealized gain (loss) on investments | | | 4.65 | | | | 1.36 | |
| | | | | | | | |
Total from investment operations | | | 4.78 | | | | 1.46 | |
| | | | | | | | |
| Less dividends: | | | | | | | | |
From net investment income | | | (0.20 | ) | | | — | |
| | | | | | | | |
Net asset value at end of period | | $ | 24.48 | | | $ | 19.90 | |
| | | | | | | | |
Total investment return (b) | | | 24.17 | % | | | 7.92 | %(c) |
| Ratios (to average net assets)/Supplemental Data: | | | | | | | | |
Net investment income (loss) | | | 0.60 | % | | | 0.74 | %††(d) |
Net expenses | | | 1.31 | % | | | 1.31 | %††(e) |
Portfolio turnover rate | | | 134 | % | | | 164 | % |
Net assets at end of period (in 000’s) | | $ | 86 | | | $ | 29 | |
| (a) | Per share data based on average shares outstanding during the year. |
| (b) | Total investment return is calculated exclusive of sales charges and assumes the reinvestment of dividends and distributions. Class R3 shares are not subject to sales charges. For periods of less than one year, total return is not annualized. |
| (c) | Total investment return may reflect adjustments to conform to generally accepted accounting principles. |
| (d) | Without the custody fee reimbursement, net investment income (loss) would have been 0.73%. |
| (e) | Without the custody fee reimbursement, net expenses would have been 1.32%. |
| | | | | | |
The notes to the financial statements are an integral part of,
and should be read in conjunction with, the financial statements. | | | | | 19 | |
Notes to Financial Statements
Note 1–Organization and Business
The MainStay Funds (the “Trust”) was organized on January 9, 1986, as a Massachusetts business trust and is governed by a Declaration of Trust. The Trust is registered under the Investment Company Act of 1940, as amended (the “1940 Act”), as an open-end management investment company, and is comprised of twelve funds (collectively referred to as the “Funds”). These financial statements and notes relate to the MainStay Common Stock Fund (the “Fund”), a “diversified fund”, as that term is defined in the 1940 Act, as interpreted or modified by regulatory authorities having jurisdiction, from time to time.
The Fund currently has nine classes of shares registered for sale. Class A and Class B shares commenced operations on June 1, 1998. Class C shares commenced operations on September 1, 1998. Class I shares commenced operations on December 28, 2004. Class R2, Class R6 and Class T shares were registered for sale effective as of December 14, 2007 (for Class R2 shares) and February 28, 2017 (for Class R6 and Class T shares). As of October 31, 2017, Class R2, Class R6 and Class T shares were not yet offered for sale. Investor Class shares commenced operations on February 28, 2008. Class R3 shares commenced operations on February 29, 2016. Effective February 28, 2017, Class B shares of the MainStay Group of Funds were closed to all new purchases as well as additional investments by existing Class B shareholders. Existing Class B shareholders may continue to reinvest dividends and capital gains distributions, as well as exchange their Class B shares for Class B shares of other MainStay Group of Funds as permitted by the current exchange privileges. Class B shareholders continue to be subject to any applicable contingent deferred sales charge (“CDSC”) at the time of redemption. All other features of the Class B shares, including but not limited to the fees and expenses applicable to Class B shares, remain unchanged. Unless redeemed, Class B shareholders will remain in Class B shares of their respective fund until the Class B shares are converted to Class A or Investor Class shares pursuant to the applicable conversion schedule.
Class A and Investor Class shares are offered at net asset value (“NAV”) per share plus an initial sales charge. No initial sales charge applies to investments of $1 million or more (and certain other qualified purchases) in Class A and Investor Class shares. Effective August 1, 2017, a CDSC of 1.00% may be imposed on certain redemptions of Class A and Investor Class shares made within 18 months of the date of purchase on shares that were purchased without an initial sales charge. For purchases of Class A and Investor Class shares made from January 1, 2017, through July 31, 2017, a CDSC of 1.00% may be imposed on certain redemptions of such shares made within 24 months of the date of purchase on shares that were purchased without an initial sales charge. For purchases of Class A and Investor Class shares made prior to January 1, 2017, a CDSC of 1.00% may be imposed on redemptions of such shares made within one year of the date of purchase on shares that were purchased without an initial sales charge. Class C shares are offered at NAV without an initial sales charge, although a 1.00% CDSC may be imposed on certain redemptions of such shares made within one year of the date of purchase of Class C shares. When Class B shares were offered, they were offered at NAV without an initial sales charge, although a CDSC that declines depending on the number of years a shareholder has held its Class B shares may be imposed on redemptions made within six years of the date of purchase of such shares. Class T shares are currently expected
to be offered at NAV per share plus an initial sales charge. Class I and Class R3 shares are offered at NAV and are not subject to a sales charge. Class R2 and Class R6 shares are currently expected to be offered at NAV and to not be subject to a sales charge. Depending upon eligibility, Class B shares convert to either Class A or Investor Class shares at the end of the calendar quarter eight years after the date they were purchased. Additionally, as disclosed in the Funds’ prospectus, Class A shares may convert automatically to Investor Class shares and Investor Class shares may convert automatically to Class A shares. Under certain circumstances and as may be permitted by the Trust’s multiple class plan pursuant to Rule 18f-3 under the 1940 Act, specified share classes of the Fund may be converted to one or more other share classes of the Fund as disclosed in the capital share transactions within these Notes. The classes of shares have the same voting (except for issues that relate solely to one class), dividend, liquidation and other rights, and the same terms and conditions, except that under distribution plans pursuant to Rule 12b-1 under the 1940 Act, Class B and Class C shares are subject to higher distribution and/or service fees than Class A, Investor Class, Class T, Class R2 and Class R3 shares. Class I and Class R6 shares are not subject to a distribution and/or service fee. Class R2 and Class R3 shares are subject to a shareholder service fee, which is in addition to fees paid under the distribution plans for Class R2 and Class R3 shares.
The Fund’s investment objective is to seek long-term growth of capital.
Note 2–Significant Accounting Policies
The Fund is an investment company and accordingly follows the investment company accounting and reporting guidance of the Financial Accounting Standards Board (“FASB”) Accounting Standard Codification Topic 946 Financial Services—Investment Companies. The Fund prepares its financial statements in accordance with generally accepted accounting principles (“GAAP”) in the United States of America and follows the significant accounting policies described below.
(A) Securities Valuation. Investments are usually valued as of the close of regular trading on the New York Stock Exchange (the “Exchange”) (usually 4:00 p.m. Eastern time) on each day the Fund is open for business (“valuation date”).
The Board of Trustees of the Trust (the “Board”) adopted procedures establishing methodologies for the valuation of the Fund’s securities and other assets and delegated the responsibility for valuation determinations under those procedures to the Valuation Committee of the Trust (the “Valuation Committee”). The Board authorized the Valuation Committee to appoint a Valuation Subcommittee (the “Subcommittee”) to deal in the first instance with establishing the prices of securities for which market quotations are not readily available or the prices of which are not otherwise readily determinable under these procedures. The Subcommittee meets (in person, via electronic mail or via teleconference) on an as-needed basis. Subsequently, the Valuation Committee meets to ensure that actions taken by the Subcommittee were appropriate. The procedures state that, subject to the oversight of the Board and unless otherwise noted, the responsibility for the day-to-day valuation of portfolio assets (including fair value measurements for the Fund’s assets and liabilities) rests with New York Life Investment Management LLC (“New York Life Investments” or the “Manager”), aided to whatever extent necessary by the Subadvisor (as defined in Note 3(A)).
| | |
| 20 | | MainStay Common Stock Fund |
To assess the appropriateness of security valuations, the Manager, the Subadvisor or the Fund’s third-party service provider, who is subject to oversight by the Manager, regularly compares prior day prices, prices on comparable securities and the sale prices to the prior and current day prices and challenges prices with changes exceeding certain tolerance levels with third-party pricing services or broker sources. For those securities valued through either a standardized fair valuation methodology or a fair valuation measurement, the Subcommittee deals in the first instance with such valuation and the Valuation Committee reviews and affirms, if appropriate, the reasonableness of the valuation based on such methodologies and measurements on a regular basis after considering information that is reasonably available and deemed relevant by the Valuation Committee. Any action taken by the Subcommittee with respect to the valuation of a portfolio security or other asset is submitted for review and ratification (if appropriate) to the Valuation Committee and the Board at the next regularly scheduled meeting.
“Fair value” is defined as the price the Fund would reasonably expect to receive upon selling an asset or liability in an orderly transaction to an independent buyer in the principal or most advantageous market for the asset or liability. Fair value measurements are determined within a framework that establishes a three-tier hierarchy which maximizes the use of observable market data and minimizes the use of unobservable inputs to establish a classification of fair value measurements for disclosure purposes. “Inputs” refer broadly to the assumptions that market participants would use in pricing the asset or liability, including assumptions about risk, such as the risk inherent in a particular valuation technique used to measure fair value using a pricing model and/or the risk inherent in the inputs for the valuation technique. Inputs may be observable or unobservable. Observable inputs reflect the assumptions market participants would use in pricing the asset or liability based on market data obtained from sources independent of the Fund. Unobservable inputs reflect the Fund’s own assumptions about the assumptions market participants would use in pricing the asset or liability based on the information available. The inputs or methodology used for valuing assets or liabilities may not be an indication of the risks associated with investing in those assets or liabilities. The three-tier hierarchy of inputs is summarized below.
| • | | Level 1—quoted prices in active markets for an identical asset or liability |
| • | | Level 2—other significant observable inputs (including quoted prices for a similar asset or liability in active markets, interest rates and yield curves, prepayment speeds, credit risk, etc.) |
| • | | Level 3—significant unobservable inputs (including the Fund’s own assumptions about the assumptions that market participants would use in measuring fair value of an asset or liability) |
The level of an asset or liability within the fair value hierarchy is based on the lowest level of an input, both individually and in the aggregate, that is significant to the fair value measurement. As of October 31, 2017, the aggregate value by input level of the Fund’s assets and liabilities is included at the end of the Fund’s Portfolio of Investments.
The Fund may use third-party vendor evaluations, whose prices may be derived from one or more of the following standard inputs, among others:
| | |
• Broker/dealer quotes | | • Benchmark securities |
• Two-sided markets | | • Reference data (corporate actions or material event notices) |
• Bids/offers | | • Monthly payment information |
• Industry and economic events | | • Reported trades |
An asset or liability for which market values cannot be measured using the methodologies described above is valued by methods deemed reasonable in good faith by the Valuation Committee, following the procedures established by the Board, to represent fair value. Under these procedures, the Fund generally uses a market-based approach which may use related or comparable assets or liabilities, recent transactions, market multiples, book values and other relevant information. The Fund may also use an income-based valuation approach in which the anticipated future cash flows of the asset or liability are discounted to calculate fair value. Discounts may also be applied due to the nature and/or duration of any restrictions on the disposition of the asset or liability. Fair value represents a good faith approximation of the value of a security. Fair value determinations involve the consideration of a number of subjective factors, an analysis of applicable facts and circumstances and the exercise of judgment. As a result, it is possible that the fair value for a security determined in good faith in accordance with the Fund’s valuation procedures may differ from valuations for the same security determined by other funds using their own valuation procedures. Although the Fund’s valuation procedures are designed to value a security at the price the Fund may reasonably expect to receive upon the security’s sale in an orderly transaction, there can be no assurance that any fair value determination thereunder would, in fact, approximate the amount that the Fund would actually realize upon the sale of the security or the price at which the security would trade if a reliable market price were readily available. During the year ended October 31, 2017, there were no material changes to the fair value methodologies.
Securities which may be valued in this manner include, but are not limited to: (i) a security for which trading has been halted or suspended; (ii) a debt security that has recently gone into default and for which there is not a current market quotation; (iii) a security of an issuer that has entered into a restructuring; (iv) a security that has been de-listed from a national exchange; (v) a security for which the market price is not readily available from a third-party pricing source or, if so provided, does not, in the opinion of the Manager or Subadvisor, reflect the security’s market value; (vi) a security subject to trading collars for which no or limited trading takes place; and (vii) a security whose principal market has been temporarily closed at a time when, under normal conditions, it would be open. Securities for which market quotations or observable inputs are not readily available are generally categorized as Level 3 in the hierarchy. As of October 31, 2017, there were no securities held by the Fund that were fair valued in such a manner.
Equity securities and shares of exchange-traded funds (“ETFs”) are valued at the last quoted sales prices as of the close of regular trading on the relevant exchange on each valuation date. Securities that are not traded on the valuation date are valued at the mean of the last quoted
Notes to Financial Statements (continued)
bid and ask prices. Prices are normally taken from the principal market in which each security trades. Investments in mutual funds, including money market funds, are valued at their respective NAVs as of the close of the Exchange on the valuation date. These securities are generally categorized as Level 1 in the hierarchy.
Temporary cash investments acquired in excess of 60 days to maturity at the time of purchase are valued using the latest bid prices or using valuations based on a matrix system (which considers such factors as security prices, yields, maturities and ratings), both as furnished by independent pricing services. Other temporary cash investments which mature in 60 days or less at the time of purchase (“Short-Term Investments”) are valued using the amortized cost method of valuation, unless the use of such method would be inappropriate. The amortized cost method involves valuing a security at its cost on the date of purchase and thereafter assuming a constant amortization to maturity of the difference between such cost and the value on maturity date. Amortized cost approximates the current fair value of a security. Securities valued using the amortized cost method are not valued using quoted prices in an active market and are generally categorized as Level 2 in the hierarchy.
The information above is not intended to reflect an exhaustive list of the methodologies that may be used to value portfolio investments. The valuation procedures permit the use of a variety of valuation methodologies in connection with valuing portfolio investments. The methodology used for a specific type of investment may vary based on the market data available or other considerations. The methodologies summarized above may not represent the specific means by which portfolio investments are valued on any particular business day.
(B) Income Taxes. The Fund’s policy is to comply with the requirements of the Internal Revenue Code of 1986, as amended (the “Internal Revenue Code”), applicable to regulated investment companies and to distribute all of its taxable income to the shareholders of the Fund within the allowable time limits. Therefore, no federal, state and local income tax provisions are required.
Management evaluates the Fund’s tax positions to determine if the tax positions taken meet the minimum recognition threshold in connection with accounting for uncertainties in income tax positions taken or expected to be taken for the purposes of measuring and recognizing tax liabilities in the financial statements. Recognition of tax benefits of an uncertain tax position is permitted only to the extent the position is “more likely than not” to be sustained assuming examination by taxing authorities. Management has analyzed the Fund’s tax positions taken on federal, state and local income tax returns for all open tax years (for up to three tax years) and has concluded that no provisions for federal, state and local income tax are required in the Fund’s financial statements. The Fund’s federal, state and local income tax and federal excise tax returns for tax years for which the applicable statutes of limitations have not expired are subject to examination by the Internal Revenue Service and state and local departments of revenue.
(C) Dividends and Distributions to Shareholders. Dividends and distributions are recorded on the ex-dividend date. The Fund intends to declare and pay dividends from net investment income and distributions from net realized capital and currency gains, if any, at least annually. Unless the shareholder elects otherwise, all dividends and
distributions are reinvested in the same class of shares of the Fund, at NAV. Dividends and distributions to shareholders are determined in accordance with federal income tax regulations and may differ from determinations using GAAP.
(D) Security Transactions and Investment Income. The Fund records security transactions on the trade date. Realized gains and losses on security transactions are determined using the identified cost method. Dividend income is recognized on the ex-dividend date, net of any foreign tax withheld at the source, and interest income is accrued as earned using the effective interest rate method. Discounts and premiums on Short-Term Investments are accreted and amortized, respectively, on the straight-line method. The straight-line method approximates the effective interest method for Short-Term Investments.
Investment income and realized and unrealized gains and losses on investments of the Fund are allocated pro rata to separate classes of shares based upon their relative net assets on the date the income is earned or realized and unrealized gains and losses are incurred.
(E) Expenses. Expenses of the Trust are allocated to the individual Funds in proportion to the net assets of the respective Funds when the expenses are incurred, except where direct allocations of expenses can be made. Expenses (other than transfer agent expenses and fees incurred under the shareholder services plans and/or the distribution plans further discussed in Note 3(B)) are allocated to separate classes of shares pro rata based upon their relative net assets on the date the expenses are incurred. The expenses borne by the Fund, including those of related parties to the Fund, are shown in the Statement of Operations.
Additionally, the Fund may invest in shares of ETFs or mutual funds, which are subject to management fees and other fees that may increase the costs of investing in ETFs or mutual funds versus the costs of owning the underlying securities directly. These indirect expenses of ETFs or mutual funds are not included in the amounts shown as expenses on the Fund’s Statement of Operations or in the expense ratios included in the consolidated financial highlights.
(F) Use of Estimates. In preparing financial statements in conformity with GAAP, management makes estimates and assumptions that affect the reported amounts and disclosures in the financial statements. Actual results could differ from those estimates.
(G) Repurchase Agreements. The Fund may enter into repurchase agreements (i.e., buy a security from another party with the agreement that it be sold back in the future) to earn income. The Fund may enter into repurchase agreements only with counterparties, usually financial institutions, that are deemed by the Manager or Subadvisor to be creditworthy, pursuant to guidelines established by the Board. During the term of any repurchase agreement, the Manager or Subadvisor will continue to monitor the creditworthiness of the counterparty. Under the 1940 Act, repurchase agreements are considered to be collateralized loans by the Fund to the counterparty secured by the securities transferred to the Fund.
Repurchase agreements are subject to counterparty risk, meaning the Fund could lose money by the counterparty’s failure to perform under the terms of the agreement. The Fund mitigates this risk by ensuring the repurchase agreement is collateralized by cash, U.S. government
| | |
| 22 | | MainStay Common Stock Fund |
securities, fixed income securities and/or other securities. The collateral is held by the Fund’s custodian and valued daily on a mark to market basis to determine if the value, including accrued interest, exceeds the repurchase price. In the event of the counterparty’s default on the obligation to repurchase, the Fund has the right to liquidate the collateral and apply the proceeds in satisfaction of the obligation. Under certain circumstances, such as in the event of default or bankruptcy by the counterparty, realization and/or retention of the collateral may be limited or subject to delay, to legal proceedings and possible realized loss to the Fund.
(H) Securities Lending. In order to realize additional income, the Fund may engage in securities lending, subject to the limitations set forth in the 1940 Act and relevant guidance by the staff of the Securities and Exchange Commission (“SEC”). In the event the Fund does engage in securities lending, the Fund will lend through its custodian, State Street Bank and Trust Company (“State Street”). State Street will manage the Fund’s collateral in accordance with the lending agreement between the Fund and State Street, and indemnify the Fund against counterparty risk. The loans will be collateralized by U.S. Treasury securities at least equal at all times to the market value of the securities loaned. The Fund may bear the risk of delay in recovery of, or loss of rights in, the securities loaned should the borrower of the securities experience financial difficulty. The Fund may also record a realized gain or loss on securities deemed sold due to a borrower’s inability to return securities on loan. The Fund bears the risk of any loss on investment of the collateral. The Fund will receive compensation for lending its securities in the form of fees or it will retain a portion of interest on the investment of any cash received as collateral. The Fund will also continue to receive interest and dividends on the securities loaned and any gain or loss in the market price of the securities loaned that may occur during the term of the loan will be for the account of the Fund. During the year ended October 31, 2017, the Fund did not have any portfolio securities on loan.
(I) Indemnifications. Under the Trust’s organizational documents, its officers and trustees are indemnified against certain liabilities that may arise out of performance of their duties to the Trust. Additionally, in the normal course of business, the Fund enters into contracts with third-party service providers that contain a variety of representations and warranties and which may provide general indemnifications. The Fund’s maximum exposure under these arrangements is unknown, as this would involve future claims that may be made against the Fund that have not yet occurred. Based on experience, management is of the view that the risk of loss in connection with these potential indemnification obligations is remote. However, there can be no assurance that material liabilities related to such obligations will not arise in the future, which could adversely impact the Fund.
(J) Large Transaction Risks. From time to time, the Fund may receive large purchase or redemption orders from affiliated or unaffiliated mutual funds or other investors. Such large transactions could have adverse effects on the Fund’s performance if the Fund were required to sell securities or invest cash at times when it otherwise would not do so. This activity could also accelerate the realization of capital gains and increase the Fund’s transaction costs. The Fund has adopted procedures designed to mitigate the negative impacts of such large transactions, but there can be no assurance that these procedures will be effective.
Note 3–Fees and Related Party Transactions
(A) Manager and Subadvisor. New York Life Investments, a registered investment adviser and an indirect, wholly-owned subsidiary of New York Life Insurance Company (“New York Life”), serves as the Fund’s Manager, pursuant to an Amended and Restated Management Agreement (“Management Agreement”). The Manager provides offices, conducts clerical, recordkeeping and bookkeeping services and keeps most of the financial and accounting records required to be maintained by the Fund. Except for the portion of salaries and expenses that are the responsibility of the Fund, the Manager pays the salaries and expenses of all personnel affiliated with the Fund and certain operational expenses of the Fund. The Fund reimburses New York Life Investments in an amount equal to a portion of the compensation of the Chief Compliance Officer attributable to the Fund. Cornerstone Capital Management Holdings LLC (“Cornerstone Holdings” or “Subadvisor”), a registered investment adviser and an indirect, wholly-owned subsidiary of New York Life, serves as Subadvisor to the Fund and is responsible for the day-to-day portfolio management of the Fund. Pursuant to the terms of an Amended and Restated Subadvisory Agreement (“Subadvisory Agreement”) between New York Life Investments and Cornerstone Holdings, New York Life Investments pays for the services of the Subadvisor.
Under the Management Agreement, the Fund pays the Manager a monthly fee for the services performed and facilities furnished at an annual rate of the Fund’s average daily net assets as follows: 0.55% up to $500 million; 0.525% from $500 million to $1 billion; and 0.50% on assets in excess of $1 billion. During the year ended October 31, 2017, the effective management fee rate was 0.55%.
New York Life Investments has agreed to voluntarily waive fees and/or reimburse expenses so that Total Annual Fund Operating Expenses (excluding taxes, interest, litigation, extraordinary expenses, brokerage and other transaction expenses relating to the purchase and sale of portfolio investments, and acquired (underlying) fund fees and expenses) of a class do not exceed the following percentages of average daily net assets: Investor Class, 1.85%; Class B, 2.60%; and Class C, 2.60%. These voluntary waivers or reimbursements may be discontinued at any time without notice.
During the year ended October 31, 2017, New York Life Investments earned fees from the Fund in the amount of $1,019,499.
State Street provides sub-administration and sub-accounting services to the Fund pursuant to an agreement with New York Life Investments. These services include calculating the daily NAVs of the Fund, maintaining the general ledger and sub-ledger accounts for the calculation of the Fund’s NAVs and assisting New York Life Investments in conducting various aspects of the Fund’s administrative operations. For providing these services to the Fund, State Street is compensated by New York Life Investments.
(B) Distribution, Service and Shareholder Service Fees. The Trust, on behalf of the Fund, has entered into a distribution agreement with NYLIFE Distributors LLC (the “Distributor”), an indirect, wholly-owned subsidiary of New York Life. The Fund has adopted distribution plans (the “Plans”) in accordance with the provisions of Rule 12b-1 under the 1940 Act.
Notes to Financial Statements (continued)
Pursuant to the Class A, Investor Class, Class T and Class R2 Plans, the Distributor receives a monthly distribution fee from the Class A, Investor Class, Class T and Class R2 shares at an annual rate of 0.25% of the average daily net assets of the Class A, Investor Class, Class T and Class R2 shares for distribution and/or service activities as designated by the Distributor. Pursuant to the Class B and Class C Plans, Class B and Class C shares pay the Distributor a monthly distribution fee at an annual rate of 0.75% of the average daily net assets of the Class B and Class C shares, along with a service fee at an annual rate of 0.25% of the average daily net assets of the Class B and Class C shares, for a total 12b-1 fee of 1.00%. Pursuant to the Class R3 Plan, the Distributor receives a monthly distribution and/or service fee from the Class R3 shares at an annual rate of 0.50% of the average daily net assets of the Class R3 shares. Class I and Class R6 shares are not subject to a distribution and/or service fee.
The Plans provide that the distribution and service fees are payable to the Distributor regardless of the amounts actually expended by the Distributor for distribution of the Fund’s shares and service activities.
In accordance with the Shareholder Services Plan for the Class R2 and Class R3 shares, the Manager has agreed to provide, through its affiliates or independent third parties, various shareholder and administrative support services to shareholders of the Class R2 and Class R3 shares. For its services, the Manager, its affiliates or independent third-party service providers are entitled to a shareholder service fee accrued daily and paid monthly at an annual rate of 0.10% of the average daily net assets of the Class R2 and Class R3 shares. This is in addition to any fees paid under the Class R2 and Class R3 Plans.
During the year ended October 31, 2017, shareholder service fees incurred by the Fund were as follows:
(C) Sales Charges. During the year ended October 31, 2017, the Fund was advised by the Distributor that the amount of initial sales charges retained on sales of Class A and Investor Class shares were $9,655 and $12,047, respectively.
During the year ended October 31, 2017, the Fund was also advised that the Distributor retained CDSCs on redemptions of Class A, Class B and Class C shares of $858, $26,114 and $967, respectively.
(D) Transfer, Dividend Disbursing and Shareholder Servicing Agent. NYLIM Service Company LLC, an affiliate of New York Life Investments, is the Fund’s transfer, dividend disbursing and shareholder servicing agent pursuant to an agreement between NYLIM Service Company LLC and the Trust. NYLIM Service Company LLC has entered into an agreement with Boston Financial Data Services, Inc. (“BFDS”) pursuant to which BFDS performs certain transfer agent services on behalf of NYLIM Service Company LLC. During the year ended
October 31, 2017, transfer agent expenses incurred by the Fund were as follows:
| | | | |
Class A | | $ | 17,068 | |
Investor Class | | | 68,555 | |
Class B | | | 20,075 | |
Class C | | | 47,823 | |
Class I | | | 37,020 | |
Class R3 | | | 14 | |
(E) Small Account Fee. Shareholders with small accounts adversely impact the cost of providing transfer agency services. In an effort to reduce total transfer agency expenses, the Fund has implemented a small account fee on certain types of accounts. Certain shareholders with an account balance of less than $1,000 are charged an annual per account fee of $20 (assessed semi-annually), the proceeds from which offset transfer agent fees as reflected in the Statement of Operations.
(F) Capital. As of October 31, 2017, New York Life and its affiliates beneficially held shares of the Fund with the values and percentages of net assets as follows:
Note 4–Federal Income Tax
As of October 31, 2017, the cost and unrealized appreciation (depreciation) of the Fund’s investment portfolio, including applicable derivative contracts and other financial instruments, as determined on a federal income tax basis, were as follows:
| | | | | | | | |
| | | Federal Tax
Cost | | Gross
Unrealized
Appreciation | | Gross
Unrealized
Depreciation | | Net
Unrealized
Appreciation/
(Depreciation) |
Investments
in Securities | | $159,696,151 | | $31,809,376 | | $(1,660,463) | | $30,148,913 |
As of October 31, 2017, the components of accumulated gain (loss) on a tax basis were as follows:
| | | | | | | | |
Ordinary
Income | | Accumulated
Capital and Other Gain (Loss) | | Other
Temporary
Differences | | Unrealized
Appreciation
(Depreciation) | | Total
Accumulated Gain (Loss) |
| $1,518,583 | | $— | | $— | | $30,148,913 | | $31,667,496 |
The difference between book-basis and tax-basis unrealized appreciation (depreciation) is primarily due to wash sale adjustments.
The following table discloses the current year reclassifications between undistributed net investment income (loss), accumulated net realized gain (loss) on investments and additional paid-in capital arising from
| | |
| 24 | | MainStay Common Stock Fund |
permanent differences; net assets as of October 31, 2017 were not affected.
| | | | | | | | |
Undistributed Net Investment Income (Loss) | | Accumulated Net Realized Gain (Loss) on Investments | | | Additional Paid-In Capital | |
| $(56,772) | | $ | 12,744,080 | | | $ | (12,687,308 | ) |
The reclassifications for the Fund are primarily due to expiration of capital loss carry forwards.
The Fund utilized $16,382,773 of capital loss carryforwards during the year ended October 31, 2017. The Fund had $12,687,308 of capital loss carryforward that expired during the year ended October 31, 2017.
During the years ended October 31, 2017 and October 31, 2016, the tax character of distributions paid as reflected in the Statements of Changes in Net Assets was as follows:
| | | | | | | | |
| | | 2017 | | | 2016 | |
Distributions paid from: | | | | | | | | |
Ordinary Income | | $ | 2,200,236 | | | $ | 2,000,136 | |
Note 5–Custodian
State Street is the custodian of cash and securities held by the Fund. Custodial fees are charged to the Fund based on the Fund’s net assets and/or the market value of securities held by the Fund and the number of certain transactions incurred by the Fund.
Note 6–Line of Credit
The Fund and certain other funds managed by New York Life Investments, maintain a line of credit with a syndicate of banks in order to secure a source of funds for temporary purposes to meet unanticipated or excessive redemption requests.
Effective August 1, 2017, under the credit agreement (the “Credit Agreement”), the aggregate commitment amount is $600,000,000 with an additional uncommitted amount of $100,000,000. The commitment fee is an annual rate of 0.15% of the average commitment amount payable quarterly, regardless of usage, to State Street, who serves as the agent to the syndicate. The commitment fee is allocated among the Fund and certain other funds managed by New York Life Investments based upon their respective net assets and other factors. Interest on any revolving credit loan is charged based upon the Federal Funds Rate or the one-month LIBOR, whichever is higher. The Credit Agreement expires on July 31, 2018, although the Fund, certain other funds managed by New York Life Investments and the syndicate of banks may renew the Credit Agreement for an additional year on the same or different terms. Prior to August 1, 2017, the aggregate commitment amount and the commitment fee of the previous credit agreement were the same as those under the Credit Agreement, but Bank of New York Mellon served as agent to the syndicate. During the year ended October 31, 2017, there were no borrowings made or outstanding with respect to the Fund under the Credit Agreement or the credit agreement for which Bank of New York Mellon served as agent.
Note 7–Interfund Lending Program
Pursuant to an exemptive order issued by the SEC, the Fund, along with certain other funds managed by New York Life Investments, may participate in an interfund lending program. The interfund lending program provides an alternative credit facility that permits the Fund and certain other funds managed by New York Life Investments to lend or borrow money for temporary purposes directly to or from one another subject to the conditions of the exemptive order. During the year ended October 31, 2017, there were no interfund loans made or outstanding with respect to the Fund.
Note 8–Purchases and Sales of Securities (in 000’s)
During the year ended October 31, 2017, purchases and sales of securities, other than short-term securities, were $247,661 and $271,977, respectively.
Note 9–Capital Share Transactions
| | | | | | | | |
Class A | | Shares | | | Amount | |
Year ended October 31, 2017: | | | | | | | | |
Shares sold | | | 393,517 | | | $ | 8,513,051 | |
Shares issued to shareholders in reinvestment of dividends and distributions | | | 25,363 | | | | 534,139 | |
Shares redeemed | | | (717,930 | ) | | | (15,610,015 | ) |
| | | | | | | | |
Net increase (decrease) in shares outstanding before conversion | | | (299,050 | ) | | | (6,562,825 | ) |
Shares converted into Class A (See Note 1) | | | 456,429 | | | | 10,647,626 | |
Shares converted from Class A (See Note 1) | | | (113,732 | ) | | | (2,425,120 | ) |
| | | | | | | | |
Net increase (decrease) | | | 43,647 | | | $ | 1,659,681 | |
| | | | | | | | |
Year ended October 31, 2016: | | | | | | | | |
Shares sold | | | 1,251,418 | | | $ | 24,675,950 | |
Shares issued to shareholders in reinvestment of dividends and distributions | | | 26,849 | | | | 520,878 | |
Shares redeemed | | | (1,802,139 | ) | | | (36,048,711 | ) |
| | | | | | | | |
Net increase (decrease) in shares outstanding before conversion | | | (523,872 | ) | | | (10,851,883 | ) |
Shares converted into Class A (See Note 1) | | | 66,498 | | | | 1,308,332 | |
Shares converted from Class A (See Note 1) | | | (13,967 | ) | | | (280,865 | ) |
| | | | | | | | |
Net increase (decrease) | | | (471,341 | ) | | $ | (9,824,416 | ) |
| | | | | | | | |
| | |
| | | | | | | | |
Notes to Financial Statements (continued)
| | | | | | | | |
Investor Class | | Shares | | | Amount | |
Year ended October 31, 2017: | | | | | | | | |
Shares sold | | | 110,568 | | | $ | 2,444,395 | |
Shares issued to shareholders in reinvestment of dividends and distributions | | | 10,399 | | | | 219,211 | |
Shares redeemed | | | (116,386 | ) | | | (2,567,501 | ) |
| | | | | | | | |
Net increase (decrease) in shares outstanding before conversion | | | 4,581 | | | | 96,105 | |
Shares converted into Investor Class
(See Note 1) | | | 50,589 | | | | 1,124,737 | |
Shares converted from Investor Class
(See Note 1) | | | (451,184 | ) | | | (10,522,222 | ) |
| | | | | | | | |
Net increase (decrease) | | | (396,014 | ) | | $ | (9,301,380 | ) |
| | | | | | | | |
Year ended October 31, 2016: | | | | | | | | |
Shares sold | | | 122,624 | | | $ | 2,385,551 | |
Shares issued to shareholders in reinvestment of dividends and distributions | | | 10,373 | | | | 201,445 | |
Shares redeemed | | | (153,115 | ) | | | (3,008,109 | ) |
| | | | | | | | |
Net increase (decrease) in shares outstanding before conversion | | | (20,118 | ) | | | (421,113 | ) |
Shares converted into Investor Class (See Note 1) | | | 45,097 | | | | 893,686 | |
Shares converted from Investor Class (See Note 1) | | | (63,429 | ) | | | (1,248,269 | ) |
| | | | | | | | |
Net increase (decrease) | | | (38,450 | ) | | $ | (775,696 | ) |
| | | | | | | | |
| | |
| | | | | | | | |
Class B | | Shares | | | Amount | |
Year ended October 31, 2017: | | | | | | | | |
Shares sold | | | 42,927 | | | $ | 843,620 | |
Shares issued to shareholders in reinvestment of dividends and distributions | | | 670 | | | | 13,018 | |
Shares redeemed | | | (60,581 | ) | | | (1,223,993 | ) |
| | | | | | | | |
Net increase (decrease) in shares outstanding before conversion | | | (16,984 | ) | | | (367,355 | ) |
Shares converted from Class B (See Note 1) | | | (49,518 | ) | | | (1,012,159 | ) |
| | | | | | | | |
Net increase (decrease) | | | (66,502 | ) | | $ | (1,379,514 | ) |
| | | | | | | | |
Year ended October 31, 2016: | | | | | | | | |
Shares sold | | | 119,948 | | | $ | 2,140,730 | |
Shares issued to shareholders in reinvestment of dividends and distributions | | | 638 | | | | 11,415 | |
Shares redeemed | | | (88,530 | ) | | | (1,573,401 | ) |
| | | | | | | | |
Net increase (decrease) in shares outstanding before conversion | | | 32,056 | | | | 578,744 | |
Shares converted from Class B (See Note 1) | | | (38,808 | ) | | | (701,777 | ) |
| | | | | | | | |
Net increase (decrease) | | | (6,752 | ) | | $ | (123,033 | ) |
| | | | | | | | |
| | |
| | | | | | | | |
| | | | | | | | |
Class C | | Shares | | | Amount | |
Year ended October 31, 2017: | | | | | | | | |
Shares sold | | | 128,887 | | | $ | 2,555,519 | |
Shares issued to shareholders in reinvestment of dividends and distributions | | | 1,201 | | | | 23,317 | |
Shares redeemed | | | (346,562 | ) | | | (6,966,498 | ) |
| | | | | | | | |
Net increase (decrease) | | | (216,474 | ) | | $ | (4,387,662 | ) |
| | | | | | | | |
Year ended October 31, 2016: | | | | | | | | |
Shares sold | | | 219,476 | | | $ | 3,963,348 | |
Shares issued to shareholders in reinvestment of dividends and distributions | | | 1,795 | | | | 32,117 | |
Shares redeemed | | | (710,934 | ) | | | (12,699,832 | ) |
| | | | | | | | |
Net increase (decrease) | | | (489,663 | ) | | $ | (8,704,367 | ) |
| | | | | | | | |
| | |
| | | | | | | | |
Class I | | Shares | | | Amount | |
Year ended October 31, 2017: | | | | | | | | |
Shares sold | | | 469,078 | | | $ | 10,275,846 | |
Shares issued to shareholders in reinvestment of dividends and distributions | | | 64,045 | | | | 1,351,355 | |
Shares redeemed | | | (1,106,144 | ) | | | (24,817,068 | ) |
| | | | | | | | |
Net increase (decrease) in shares outstanding before conversion | | | (573,021 | ) | | | (13,189,867 | ) |
Shares converted into Class I (See Note 1) | | | 102,691 | | | | 2,187,138 | |
| | | | | | | | |
Net increase (decrease) | | | (470,330 | ) | | $ | (11,002,729 | ) |
| | | | | | | | |
Year ended October 31, 2016: | | | | | | | | |
Shares sold | | | 716,226 | | | $ | 14,032,867 | |
Shares issued to shareholders in reinvestment of dividends and distributions | | | 60,232 | | | | 1,170,908 | |
Shares redeemed | | | (910,950 | ) | | | (18,266,818 | ) |
| | | | | | | | |
Net increase (decrease) in shares outstanding before conversion | | | (134,492 | ) | | | (3,063,043 | ) |
Shares converted into Class I (See Note 1) | | | 1,423 | | | | 28,893 | |
| | | | | | | | |
Net increase (decrease) | | | (133,069 | ) | | $ | (3,034,150 | ) |
| | | | | | | | |
| | |
| | | | | | | | |
Class R3 | | Shares | | | Amount | |
Year ended October 31, 2017: | | | | | | | | |
Shares sold | | | 2,509 | | | $ | 58,793 | |
Shares issued to shareholders in reinvestment of dividends and distributions | | | 13 | | | | 287 | |
Shares redeemed | | | (445 | ) | | | (9,728 | ) |
| | | | | | | | |
Net increase (decrease) | | | 2,077 | | | $ | 49,352 | |
| | | | | | | | |
Year ended October 31, 2016 (a): | | | | | | | | |
Shares sold | | | 1,433 | | | $ | 26,552 | |
| | | | | | | | |
Net increase (decrease) | | | 1,433 | | | $ | 26,552 | |
| | | | | | | | |
|
(a) Inception date was February 29, 2016. | |
Note 10–Litigation
The Fund has been named as a defendant in the case entitled Kirschner v. FitzSimons, No. 12-2652 (S.D.N.Y.) (the “FitzSimons action”) as a result of its ownership of shares in the Tribune Company (“Tribune”) in 2007 when Tribune effected a leveraged buyout transaction (“LBO”) by which Tribune converted to a privately-held company. In its complaint, the plaintiff asserts claims against certain insiders, shareholders, professional advisers, and others involved in the LBO. Separately, the complaint also seeks to obtain from former Tribune shareholders,
| | |
| 26 | | MainStay Common Stock Fund |
including the Fund, any proceeds they received in connection with the LBO. The sole claim and cause of action brought against the Fund is for fraudulent conveyance pursuant to United States Bankruptcy Code Section 548(a)(1)(A).
In June 2011, certain Tribune creditors filed numerous additional actions asserting state law constructive fraudulent conveyance claims (the “SLCFC actions”) against specifically-named former Tribune shareholders and, in some cases, putative defendant classes comprised of former Tribune shareholders. One of the SLCFC actions, entitled Deutsche Bank Trust Co. Americas v. Blackrock Institutional Trust Co., No. 11-9319 (S.D.N.Y.) (the “Deutsche Bank action”), named the Fund as a defendant.
The FitzSimons action and Deutsche Bank action have been consolidated with the majority of the other Tribune LBO-related lawsuits in a multidistrict litigation proceeding entitled In re Tribune Co. Fraudulent Conveyance Litig., No. 11-md-2296 (S.D.N.Y.) (the “MDL Proceeding”).
On September 23, 2013, the District Court granted the defendants’ motion to dismiss the SLCFC actions, including the Deutsche Bank action, on the basis that the plaintiffs did not have standing to pursue their claims. On September 30, 2013, the plaintiffs in the SLCFC actions filed a notice of appeal to the United States Court of Appeals for the Second Circuit. On October 28, 2013, the defendants filed a joint notice of cross-appeal of that same order. On November 5, 2014, the Second Circuit Court of Appeals held an oral argument on appeal. On March 29, 2016, the United States Court of Appeals for the Second Circuit issued its opinion on the appeal of the SLCFC actions. The appeals court affirmed the district court’s dismissal of those lawsuits, but on different grounds than the district court. The appeals court held that while the plaintiffs have standing under the U.S. Bankruptcy Code, their claims were preempted by Section 546(e) of the Bankruptcy Code—the statutory safe harbor for settlement payments. On April 12, 2016, the plaintiffs in the SLCFC actions filed a petition seeking rehearing en banc before the appeals court. On July 22, 2016, the appeals court denied the petition. On September 9, 2016, the plaintiffs filed a petition for writ of certiorari in the U.S. Supreme Court challenging the Second Circuit’s decision that the safe harbor of Section 546(e) applied to their claims. Certain shareholder defendants filed a joint brief in opposition to the petition for certiorari on October 24, 2016. The plaintiffs filed a reply in support of the petition on November 4, 2016. The Supreme Court has not yet granted or denied the petition for certiorari.
On August 2, 2013, the plaintiff in the FitzSimons action filed a Fifth Amended Complaint. On May 23, 2014, the defendants filed motions to dismiss the FitzSimons action, including a global motion to dismiss Count I, which is the claim brought against former Tribune shareholders for intentional fraudulent conveyance under U.S. federal law. On January 6, 2017, the United States District Court for the Southern District of New York granted the shareholder defendants’ motion to dismiss the intentional fraudulent conveyance claim in the FitzSimons action. In dismissing the intentional fraudulent conveyance claim, the Court denied the plaintiff’s request to amend the complaint. The Court’s order
is not immediately appealable, but the plaintiff has asked the Court to direct entry of a final judgment in order to make the order immediately appealable. On February 23, 2017, the Court issued an order stating that it intends to permit an interlocutory appeal of the dismissal order, but will wait to do so until it has resolved outstanding motions to dismiss filed by other defendants. Accordingly, the timing of the appeal is uncertain.
On July 18, 2017, the plaintiff submitted a letter to the District Court seeking leave to amend its complaint to add a constructive fraudulent transfer claim. The shareholder defendants opposed that request.
On August 24, 2017, the Court denied the plaintiff’s request without prejudice to renewal of the request in the event of an intervening change in the law.
The value of the proceeds received by the Fund in connection with the LBO and the Fund’s cost basis in shares of Tribune was as follows:
| | | | | | | | |
Fund | | Proceeds | | | Cost Basis | |
MainStay Common Stock Fund | | $ | 751,774 | | | $ | 729,369 | |
At this stage of the proceedings, it would be difficult to assess with any reasonable certainty the probable outcome of the pending litigation or the effect, if any, on the Fund’s net asset value.
Note 11–Subsequent Events
In connection with the preparation of the financial statements of the Fund as of and for the year ended October 31, 2017, events and transactions subsequent to October 31, 2017, through the date the financial statements were issued have been evaluated by the Fund’s management for possible adjustment and/or disclosure. No subsequent events requiring financial statement adjustment or disclosure have been identified other than the following:
At meetings held September 25-27, 2017, the Board approved the assumption by MacKay Shields LLC (“MacKay Shields”) of the subadvisory agreement between Cornerstone Holdings and New York Life Investments with respect to the Fund, effective January 1, 2018. As a result, under the supervision of New York Life Investments, MacKay Shields, which is also a wholly-owned, fully autonomous subsidiary of New York Life, will be responsible for the management of the day-to-day investment operations of the Fund. There will be no change in the management fees paid to New York Life Investments by the Fund or in the subadvisory fees paid by New York Life Investments with respect to the Fund.
Effective January 1, 2018, the portfolio managers from Cornerstone Holdings who manage the day-to-day investment operations of the Fund will transition from Cornerstone Holdings to MacKay Shields. The transition of the portfolio managers from Cornerstone Holdings to MacKay Shields will not impact the investment strategies or risks of the Fund. For more information, please see the supplement to the Prospectus and Statement of Additional Information dated September 28, 2017.
Report of Independent Registered Public Accounting Firm
The Board of Trustees and Shareholders of
The MainStay Funds:
We have audited the accompanying statement of assets and liabilities, including the portfolio of investments, of MainStay Common Stock Fund (the “Fund”), one of the funds constituting The MainStay Funds, as of October 31, 2017, and the related statement of operations for the year then ended, the statements of changes in net assets for each of the years in the two-year period then ended, and the financial highlights for each of the years or periods in the five-year period then ended. These financial statements and financial highlights are the responsibility of the Fund’s management. Our responsibility is to express an opinion on these financial statements and financial highlights based on our audits.
We conducted our audits in accordance with the standards of the Public Company Accounting Oversight Board (United States). Those standards require that we plan and perform the audit to obtain reasonable assurance about whether the financial statements and financial highlights are free of material misstatement. An audit includes examining, on a test basis, evidence supporting the amounts and disclosures in the financial statements. Our procedures included confirmation of securities owned as of October 31, 2017, by correspondence with the custodian and brokers or by other appropriate auditing procedures where replies from brokers were not received. An audit also includes assessing the accounting principles used and significant estimates made by management, as well as evaluating the overall financial statement presentation. We believe that our audits provide a reasonable basis for our opinion.
In our opinion, the financial statements and financial highlights referred to above present fairly, in all material respects, the financial position of MainStay Common Stock Fund as of October 31, 2017, the results of its operations for the year then ended, the changes in its net assets for each of the years in the two-year period then ended, and the financial highlights for each of the years or periods in the five-year period then ended, in conformity with U.S. generally accepted accounting principles.

Philadelphia, Pennsylvania
December 21, 2017
| | |
| 28 | | MainStay Common Stock Fund |
Other Matters
(Unaudited)
At a meeting held on June 22, 2017, the Board approved submitting the following proposal (“Proposal”) to shareholders of the Funds at a special meeting held on October 23, 2017 (with any postponements or adjournments, “Special Meeting”):
To elect eight Trustees to the Board.
On or about September 28, 2017, shareholders of record of the Funds as of the close of business on August 24, 2017 were sent a proxy statement containing information regarding the Proposal. The proxy statement also included information about the Special Meeting, at which shareholders of the Funds were asked to consider and approve the Proposal. In addition, the proxy statement included information about voting on the Proposal and options shareholders had to do so.
The Special Meeting was held on October 23, 2017, and the Proposal passed.
The results of the Special Meeting (all Funds and classes thereof voting together) were as follows:
Proposal—To elect eight Trustees to the Board:
Yie-Hsin Hung:
| | | | | | | | |
Votes For | | Votes Witheld | | | Total | |
| 2,644,056,263.750 | | | 21,799,781.292 | | | | 2,665,856,045.042 | |
David H. Chow:
| | | | | | | | |
Votes For | | Votes Witheld | | | Total | |
| 2,644,576,776.557 | | | 21,279,268.485 | | | | 2,665,856,045.042 | |
Susan B. Kerley:
| | | | | | | | |
Votes For | | Votes Witheld | | | Total | |
| 2,645,459,747.343 | | | 20,396,297.699 | | | | 2,665,856,045.042 | |
Alan R. Latshaw:
| | | | | | | | |
Votes For | | Votes Witheld | | | Total | |
| 2,644,443,039.401 | | | 21,413,005.641 | | | | 2,665,856,045.042 | |
Peter Meenan:
| | | | | | | | |
Votes For | | Votes Witheld | | | Total | |
| 2,640,156,421.578 | | | 25,699,623.464 | | | | 2,665,856,045.042 | |
Richard H. Nolan, Jr.:
| | | | | | | | |
Votes For | | Votes Witheld | | | Total | |
| 2,641,415,514.849 | | | 24,440,530.193 | | | | 2,665,856,045.042 | |
Jacques P. Perold:
| | | | | | | | |
Votes For | | Votes Witheld | | | Total | |
| 2,645,300,993.731 | | | 20,555,051.311 | | | | 2,665,856,045.042 | |
Richard S. Trutanic:
| | | | | | | | |
Votes For | | Votes Witheld | | | Total | |
| 2,641,761,336.311 | | | 24,094,708.731 | | | | 2,665,856,045.042 | |
Federal Income Tax Information
(Unaudited)
The Fund is required under the Internal Revenue Code to advise shareholders in a written statement as to the federal tax status of dividends paid by the Fund during such fiscal years.
For the fiscal year ended October 31, 2017, the Fund designated approximately $2,200,236 under the Internal Revenue Code as qualified dividend income eligible for reduced tax rates.
The dividends paid by the Fund during the fiscal year ended October 31, 2017 should be multiplied by the 100.00% to arrive at the amount eligible for the corporate dividend-received deduction.
In February 2018, shareholders will receive an IRS Form 1099-DIV or substitute Form 1099, which will show the federal tax status of the distributions received by shareholders in calendar year 2017. The amounts that will be reported on such 1099-DIV or substitute Form 1099 will be the amounts you are to use on your federal income tax return and will differ from the amounts which we must report for the Fund’s fiscal year end October 31, 2017.
Proxy Voting Policies and Procedures and Proxy Voting Record
A description of the policies and procedures that New York Life Investments uses to vote proxies related to the Fund’s securities is available without charge, upon request, (i) by visiting the MainStay Funds’ website at mainstayinvestments.com; and (ii) on the Securities and Exchange Commission’s (“SEC”) website at www.sec.gov.
The Fund is required to file with the SEC its proxy voting records for the Fund for the 12-month period ending June 30 on Form N-PX. The most recent Form N-PX or proxy voting record is available free of charge upon request by calling 800-MAINSTAY (624-6782); visiting the MainStay Funds’ website at mainstayinvestments.com; or on the SEC’s website at www.sec.gov.
Shareholder Reports and Quarterly Portfolio Disclosure
The Fund is required to file its complete schedule of portfolio holdings with the SEC for its first and third fiscal quarters on Form N-Q. The Fund’s Form N-Q is available without charge, on the SEC’s website at www.sec.gov or by calling MainStay Investments at 800-MAINSTAY (624-6782). You also can obtain and review copies of Form N-Q by visiting the SEC’s Public Reference Room in Washington, DC (information on the operation of the Public Reference Room may be obtained by calling 1-800-SEC-0330).
Board of Trustees and Officers (Unaudited)
The Trustees and officers of the Funds are listed below. The Board oversees the MainStay Group of Funds (which consists of The MainStay Funds and MainStay Funds Trust), MainStay VP Funds Trust, MainStay DefinedTerm Municipal Opportunities Fund, the Manager and the Subadvisors, and elects the officers of the Funds who are responsible for the day-to-day operations of the Funds. Information pertaining to the Trustees and officers is set forth below. Each Trustee serves until his or her successor is elected and qualified or until his or her resignation, death or removal. Under the Board’s retirement policy, unless an exception is made, a Trustee must tender his or her resignation by the
end of the calendar year during which he or she reaches the age of 75. Mr. Meenan reached the age of 75 during the calendar year 2016, and his term was extended for one additional year. Accordingly, Mr. Meenan is expected to serve until the end of calendar year 2017, at which time he intends to retire. Officers are elected annually by the Board. The business address of each Trustee and officer listed below is 51 Madison Avenue, New York, New York 10010. A majority of the Trustees are not “interested persons” (as defined by the 1940 Act and rules adopted by the SEC thereunder) of the Fund (“Independent Trustees”).
| | | | | | | | | | | | |
| | | | | Name and Date of Birth | | Term of Office, Position(s) Held and Length of Service | | Principal Occupation(s) During Past Five Years | | Number of
Portfolios in
the MainStay
Group of Funds
Overseen by
Trustee | | Other Directorships Held by Trustee |
| Interested Trustee | | | | Yie-Hsin Hung* 8/12/62 | | The MainStay Funds: Trustee since January 2017; MainStay Funds Trust: Trustee since January 2017. | | Senior Vice President of New York Life since joining in 2010, Member of the Executive Management Committee since January 1, 2017, Chief Executive Officer, New York Life Investment Management Holdings LLC & New York Life Investment Management LLC since May 2015. Senior Managing Director and Co-President of New York Life Investment Management LLC from January 2014 to May 2015. Previously held positions of increasing responsibility, including head of NYLIM International, Alternative Growth Businesses, and Institutional investments since joining New York Life in 2010. | | 82 | | None |
| | * | This Trustee is considered to be an “interested person” of the MainStay Group of Funds, MainStay VP Funds Trust and MainStay DefinedTerm Municipal Opportunities Fund, within the meaning of the 1940 Act because of her affiliation with New York Life Insurance Company, New York Life Investment Management LLC, Candriam Belgium, Candriam France S.A.S., Cornerstone Capital Management Holdings LLC, MacKay Shields LLC, NYL Investors LLC, NYLIFE Securities LLC and/or NYLIFE Distributors LLC, as described in detail above in the column entitled “Principal Occupation(s) During Past Five Years.” |
| | |
| 30 | | MainStay Common Stock Fund |
| | | | | | | | | | | | |
| | | | | Name and Date of Birth | | Term of Office, Position(s) Held and Length of Service | | Principal Occupation(s) During Past Five Years | | Number of
Portfolios in
the MainStay
Group of Funds
Overseen by
Trustee | | Other Directorships Held by Trustee |
| Independent Trustees | | | | David H. Chow 12/29/57 | | The MainStay Funds: Trustee since January 2016, Advisory Board Member (June 2015 to December 2015); MainStay Funds Trust: Trustee since January 2016, Advisory Board Member (June 2015 to December 2015). | | Founder and CEO, DanCourt Management, LLC (since 1999) | | 82 | | VanEck Vectors Group of Exchange-Traded Funds: Independent Chairman of the Board of Trustees since 2008 and Trustee since 2006 (57 portfolios); and
Berea College of Kentucky: Trustee since 2009. |
| | | | Susan B. Kerley 8/12/51 | | The MainStay Funds: Chairman since January 2017 and Trustee since 2007; MainStay Funds Trust: Chairman since January 2017 and Trustee since 1990.** | | President, Strategic Management Advisors LLC (since 1990) | | 82 | | Legg Mason Partners Funds: Trustee since 1991 (54 portfolios). |
| | | | Alan R. Latshaw 3/27/51 | | The MainStay Funds: Trustee and Audit Committee Financial Expert since 2006; MainStay Funds Trust: Trustee and Audit Committee Financial Expert since 2007.** | | Retired; Partner, Ernst & Young LLP (2002 to 2003); Partner, Arthur Andersen LLP (1989 to 2002); Consultant to the MainStay Funds Audit and Compliance Committee (2004 to 2006) | | 82 | | State Farm Associates Funds Trusts: Trustee since 2005 (4 portfolios);
State Farm Mutual Fund Trust: Trustee since 2005 (15 portfolios); and
State Farm Variable Product Trust: Trustee since 2005 (9 portfolios). |
| | | | Peter Meenan 12/5/41 | | The MainStay Funds: Trustee since 2007; MainStay Funds Trust: Trustee since 2002.** | | Retired; Independent Consultant (2004 to 2013); President and Chief Executive Officer, Babson—United, Inc. (financial services firm) (2000 to 2004); Independent Consultant (1999 to 2000); Head of Global Funds, Citicorp (1995 to 1999) | | 82 | | None |
| | | | Richard H. Nolan, Jr. 11/16/46 | | The MainStay Funds: Trustee since 2007; MainStay Funds Trust: Trustee since 2007.** | | Managing Director, ICC Capital Management (since 2004); President—Shields/Alliance, Alliance Capital Management (1994 to 2004) | | 82 | | None |
| | | | Jacques P. Perold 5/12/58 | | The MainStay Funds: Trustee since January 2016, Advisory Board Member (June 2015 to December 2015); MainStay Funds Trust: Trustee since January 2016, Advisory Board Member (June 2015 to December 2015). | | Retired; President, Fidelity Management & Research Company (2009 to 2014); Founder, President and Chief Executive Officer, Geode Capital Management, LCC (2001 to 2009) | | 82 | | Allstate Corporation: Director since 2015; MSCI, Inc. Director since March 2017 and
Boston University: Trustee since 2014. |
| | | | Richard S. Trutanic 2/13/52 | | The MainStay Funds: Trustee since 1994; MainStay Funds Trust: Trustee since 2007.** | | Chairman and Chief Executive Officer, Somerset & Company (financial advisory firm) (since 2004); Managing Director, The Carlyle Group (private investment firm) (2002 to 2004); Senior Managing Director, Partner and Board Member, Groupe Arnault S.A. (private investment firm) (1999 to 2002) | | 82 | | None |
| | ** | Includes prior service as a Director/Trustee of certain predecessor entities to MainStay Funds Trust. |
| | | | | | | | |
| | | | | Name and Date of Birth | | Position(s) Held and Length of Service | | Principal Occupation(s) During Past Five Years |
Officers of the Trust (Who are not Trustees)* | | | | Kirk C. Lehneis 6/29/74 | | President, The MainStay Funds, MainStay Funds Trust (since September 2017) | | Chief Operating Officer and Senior Managing Director (since 2016), New York Life Investment Management LLC; Chairman of the Board (since September 2017), NYLIFE Distributors LLC; Chairman of the Board, NYLIM Service Company LLC (since September 2017); President, MainStay DefinedTerm Municipal Opportunities Fund and MainStay VP Funds Trust (since September 2017); Senior Managing Director, Global Product Development (From March 2015—May 2016); Managing Director, Product Development (From March 2010—February 2015) |
| | | | Jack R. Benintende 5/12/64 | | Treasurer and Principal Financial and Accounting Officer, The MainStay Funds (since 2007), MainStay Funds Trust (since 2009) | | Managing Director, New York Life Investment Management LLC (since 2007); Treasurer and Principal Financial and Accounting Officer, MainStay DefinedTerm Municipal Opportunities Fund (since 2011) and MainStay VP Funds Trust (since 2007)**; and Assistant Treasurer, New York Life Investment Management Holdings LLC (2008 to 2012) |
| | | | Kevin M. Bopp 2/24/69 | | Vice President and Chief Compliance Officer, The MainStay Funds and MainStay Funds Trust (since 2014) | | Chief Compliance Officer, New York Life Investment Management LLC, IndexIQ ETF (since January 2016), Director and Associate General Counsel (2011 to 2014) and Vice President and Assistant General Counsel (2010 to 2011), New York Life Investment Management LLC; Vice President and ChiefCompliance Officer, MainStay VP Funds Trust, MainStay DefinedTerm Municipal Opportunities Fund (since 2014); Assistant Secretary, MainStay Funds, MainStay Funds Trust and MainStay VP Funds Trust (2010 to 2014)**, MainStay DefinedTerm Municipal Opportunities Fund (2011 to 2014) |
| | | | J. Kevin Gao 10/13/67 | | Secretary and Chief Legal Officer, The MainStay Funds and MainStay Funds Trust (since 2010) | | Managing Director and Associate General Counsel, New York Life Investment Management LLC (since 2010); Secretary and Chief Legal Officer, MainStay DefinedTerm Municipal Opportunities Fund (since 2011) and MainStay VP Funds Trust (since 2010)** |
| | | | Scott T. Harrington 2/8/59 | | Vice President—Administration, The MainStay Funds (since 2005), MainStay Funds Trust (since 2009) | | Director, New York Life Investment Management LLC (including predecessor advisory organizations) (since 2000); Member of the Board of Directors, New York Life Trust Company (since 2009); Vice President—Administration, MainStay DefinedTerm Municipal Opportunities Fund (since 2011) and MainStay VP Funds Trust (since 2005)** |
| | * | The officers listed above are considered to be “interested persons” of the MainStay Group of Funds, MainStay VP Funds Trust and MainStay Defined Term Municipal Opportunities Fund within the meaning of the 1940 Act because of their affiliation with the MainStay Group of Funds, New York Life Insurance Company and/or its affiliates, including New York Life Investment Management LLC, NYLIM Service Company LLC, NYLIFE Securities LLC and/or NYLIFE Distributors LLC, as described in detail in the column captioned “Principal Occupation(s) During Past Five Years.” Officers are elected annually by the Board. |
| | ** | Includes prior service as an officer of MainStay VP Series Fund, Inc., the predecessor to MainStay VP Funds Trust. |
| | |
| 32 | | MainStay Common Stock Fund |
This page intentionally left blank
This page intentionally left blank
MainStay Funds
Equity
U.S. Equity
MainStay Common Stock Fund
MainStay Cornerstone Growth Fund
MainStay Epoch U.S. All Cap Fund
MainStay Epoch U.S. Equity Yield Fund
MainStay Epoch U.S. Small Cap Fund
MainStay Large Cap Growth Fund
MainStay MAP Equity Fund
MainStay S&P 500 Index Fund
MainStay U.S. Equity Opportunities Fund
International/Global Equity
MainStay Candriam Emerging Markets Equity Fund
MainStay Emerging Markets Equity Fund
MainStay Epoch Capital Growth Fund
MainStay Epoch Global Choice Fund
MainStay Epoch Global Equity Yield Fund
MainStay Epoch International Choice Fund
MainStay Epoch International Small Cap Fund
MainStay International Equity Fund
MainStay International Opportunities Fund
Income
Taxable Bond
MainStay Emerging Markets Debt Fund
MainStay Floating Rate Fund
MainStay Government Fund
MainStay High Yield Corporate Bond Fund
MainStay Indexed Bond Fund
MainStay Short Duration High Yield Fund
MainStay Total Return Bond Fund
MainStay Unconstrained Bond Fund
Municipal/Tax Advantaged Bond
MainStay California Tax Free Opportunities Fund1
MainStay High Yield Municipal Bond Fund
MainStay New York Tax Free Opportunities Fund2
MainStay Tax Advantaged Short Term Bond Fund
MainStay Tax Free Bond Fund
Money Market
MainStay Money Market Fund
Mixed Asset
MainStay Balanced Fund
MainStay Convertible Fund
MainStay Income Builder Fund
Alternative
MainStay Absolute Return Multi-Strategy Fund
MainStay Cushing Energy Income Fund
MainStay Cushing MLP Premier Fund
MainStay Cushing Renaissance Advantage Fund
Asset Allocation/Target Date
MainStay Conservative Allocation Fund
MainStay Growth Allocation Fund
MainStay Moderate Allocation Fund
MainStay Moderate Growth Allocation Fund
MainStay Retirement 2010 Fund
MainStay Retirement 2020 Fund
MainStay Retirement 2030 Fund
MainStay Retirement 2040 Fund
MainStay Retirement 2050 Fund
MainStay Retirement 2060 Fund
Manager
New York Life Investment Management LLC
New York, New York
Subadvisors
Candriam Belgium S.A.3
Brussels, Belgium
Candriam France S.A.S.3
Paris, France
Cornerstone Capital Management Holdings LLC3
New York, New York
Cushing Asset Management, LP
Dallas, Texas
Epoch Investment Partners, Inc.
New York, New York
MacKay Shields LLC3
New York, New York
Markston International LLC
White Plains, New York
NYL Investors LLC3
New York, New York
Winslow Capital Management, LLC
Minneapolis, Minnesota
Legal Counsel
Dechert LLP
Washington, District of Columbia
Independent Registered Public Accounting Firm
KPMG LLP
Philadelphia, Pennsylvania
1. Class A and Class I shares of this Fund are registered for sale in AZ, CA, MI, NV, OR, TX, UT and WA. Class I shares are registered for sale in CO, FL, GA, HI, ID, MA, MD, NH, NJ and NY.
2. This Fund is registered for sale in CA, CT, DE, FL, MA, NJ, NY and VT.
3. An affiliate of New York Life Investment Management LLC.
Not part of the Annual Report
For more information
800-MAINSTAY (624-6782)
mainstayinvestments.com
MainStay Investments® is a registered service mark and name under which New York Life Investment Management LLC does business. MainStay Investments, an indirect subsidiary of New York Life Insurance Company, New York, NY 10010, provides investment advisory products and services. The MainStay Funds® are managed by New York Life Investment Management LLC and distributed by NYLIFE Distributors LLC, 30 Hudson Street, Jersey City, NJ 07302, a wholly owned subsidiary of New York Life Insurance Company. NYLIFE Distributors LLC is a Member FINRA/SIPC.
©2017 NYLIFE Distributors LLC. All rights reserved.
| | | | | | | | |
| Not FDIC/NCUA Insured | | Not a Deposit | | May Lose Value | | No Bank Guarantee | | Not Insured by Any Government Agency |
| | |
| 1716826 MS286-17 | | MSCS11-12/17 (NYLIM) NL219 |
MainStay Large Cap Growth Fund
Message from the President and Annual Report
October 31, 2017


This page intentionally left blank
Message from the President
The 12 months ended October 31, 2017, brought strong performance to equity markets in the United States and abroad.
According to FTSE-Russell data for the U.S. market, stocks at all capitalization levels earned solid double-digit overall returns during the reporting period. Total returns for stocks in general exceeded 20% at all capitalization levels. Growth stocks were particularly strong, outperforming value stocks for companies of all sizes except among microcaps, where value stocks outperformed growth stocks.
Several factors contributed to the strength of domestic and international stock markets during the reporting period. Following the U.S. presidential election in November 2016, many investors looked forward to business tax incentives and possible tax cuts for consumers that could stimulate economic growth. During the reporting period, corporate earnings reports remained strong; and growth in U.S. real gross domestic product remained positive, with a substantial advance during the second quarter of 2017. Developed international markets and emerging markets were also strong, boosted by positive macroeconomic data and growing confidence that Europe was well on its way to financial recovery. Despite wide variations among emerging markets, many saw strong appreciation in local-currency terms and benefited from a weaker U.S. dollar.
During the reporting period, the Federal Open Market Committee raised the federal funds target range three times—in December of 2016 and in March and June of 2017. These incremental increases raised the federal funds target range to 1.00% to 1.25% by the end of the reporting period. These tightening moves were followed by higher U.S. Treasury yields at all maturities, with the greatest increases at the short-end of the maturity spectrum.
As interest rates rise, bond prices tend to decline (and vice versa). As a result, some portions of the U.S. Treasury market recorded negative total returns during the reporting period. Agency securities posted small but positive total returns, as did
asset-backed and mortgage-backed securities. Other bond categories, particularly those with looser ties to U.S. interest rates, did considerably better. Emerging-market debt recorded solid single-digit returns; high-yield bonds were generally stronger; and convertible bonds, which are closely tied to the performance of underlying stocks, provided some of the strongest overall returns of any fixed-income sector during the reporting period.
At MainStay, we have always encouraged investors to diversify their investments and maintain a long-term perspective, even when markets are strong. Asset classes that perform well in one environment may perform differently in another; and in today’s ever-changing world, wide market swings are not unknown.
MainStay offers Funds with a wide array of investment objectives to help our shareholders pursue the appropriate diversification for their long-range financial goals. We also offer several investment boutiques, allowing our shareholders to choose the style—or mix of styles—that’s best suited to their investment needs. We believe that relatively few individual investors can match the level of professional experience and market insight that our portfolio managers provide.
The report that follows provides more detailed information on the specific markets, investment strategies and portfolio decisions that affected your MainStay Fund during the 12 months ended October 31, 2017. We encourage you to read the report carefully and use it to help you evaluate your progress toward your financial goals.
Sincerely,

Kirk C. Lehneis
President
The opinions expressed are as of the date of this report and are subject to change. There is no guarantee that any forecast made will come to pass. This material does not constitute investment advice and is not intended as an endorsement of any specific investment. Past performance is no guarantee of future results.
Not part of the Annual Report
Table of Contents
Investors should refer to the Fund’s Summary Prospectus and/or Prospectus and consider the Fund’s investment objectives, strategies, risks, charges and expenses carefully before investing. The Summary Prospectus and/or Prospectus contain this and other information about the Fund. You may obtain copies of the Fund’s Summary Prospectus, Prospectus and Statement of Additional Information free of charge, upon request, by calling toll-free 800-MAINSTAY (624-6782), by writing to NYLIFE Distributors LLC, Attn: MainStay Marketing Department, 30 Hudson Street, Jersey City, NJ 07302 or by sending an e-mail to MainStayShareholderServices@nylim.com. These documents are also available via the MainStay Funds’ website at mainstayinvestments.com/documents. Please read the Summary Prospectus and/or Prospectus carefully before investing.
Investment and Performance Comparison1 (Unaudited)
Performance data quoted represents past performance. Past performance is no guarantee of future results. Because of market volatility and other factors, current performance may be lower or higher than the figures shown. Investment return and principal value will fluctuate, and as a result, when shares are redeemed, they may be worth more or less than their original cost. The graph below depicts the historical performance of Class A shares of the Fund. Performance will vary from class to class based on differences in class-specific expenses and sales charges. For performance information current to the most recent month-end, please call 800-MAINSTAY (624-6782) or visit mainstayinvestments.com.
(With sales charges)
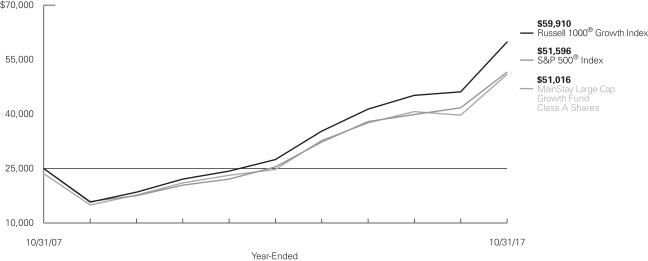
Average Annual Total Returns for the Year-Ended October 31, 2017
| | | | | | | | | | | | | | | | | | | | | | | | |
| Class | | Sales Charge | | | | Inception
Date | | | One
Year | | | Five Years
or Since
Inception | | | Ten Years
or Since
Inception | | | Gross
Expense
Ratio2 | |
| Class A Shares | | Maximum 5.5% Initial Sales Charge | | With sales charges Excluding sales charges | | | 7/1/1995 | | |
| 21.47
28.54 | %
| |
| 14.23
15.53 | %
| |
| 7.39
8.00 | %
| |
| 1.00
1.00 | %
|
| Investor Class Shares | | Maximum 5.5% Initial Sales Charge | | With sales charges Excluding sales charges | | | 2/28/2008 | | |
| 21.39
28.45 |
| |
| 14.18
15.48 |
| |
| 8.75
9.38 |
| |
| 1.06
1.06 |
|
| Class B Shares3 | | Maximum 5% CDSC if Redeemed Within the First Six Years of Purchase | | With sales charges Excluding sales charges | |
| 4/1/2005
|
| |
| 22.61
27.61 |
| |
| 14.38
14.62 |
| |
| 7.10
7.10 |
| |
| 1.81
1.81 |
|
| Class C Shares | | Maximum 1% CDSC if Redeemed Within One Year of Purchase | | With sales charges Excluding sales charges | |
| 4/1/2005
|
| |
| 26.51
27.51 |
| |
| 14.61
14.61 |
| |
| 7.10
7.10 |
| |
| 1.81
1.81 |
|
| Class I Shares | | No Sales Charge | | | | | 4/1/2005 | | | | 28.92 | | | | 15.82 | | | | 8.31 | | | | 0.75 | |
| Class R1 Shares | | No Sales Charge | | | | | 4/1/2005 | | | | 28.79 | | | | 15.72 | | | | 8.20 | | | | 0.85 | |
| Class R2 Shares | | No Sales Charge | | | | | 4/1/2005 | | | | 28.49 | | | | 15.41 | | | | 7.93 | | | | 1.10 | |
| Class R3 Shares | | No Sales Charge | | | | | 4/28/2006 | | | | 28.05 | | | | 15.13 | | | | 7.66 | | | | 1.35 | |
| Class R6 Shares | | No Sales Charge | | | | | 6/17/2013 | | | | 29.02 | | | | 14.49 | | | | N/A | | | | 0.63 | |
| 1. | The performance table and graph do not reflect the deduction of taxes that a shareholder would pay on distributions or Fund share redemptions. Total returns reflect maximum applicable sales charges as indicated in the table above, if any, changes in share price, and reinvestment of dividend and capital gain distributions. The graph assumes the initial investment amount shown above and reflects the deduction of all sales charges that would have applied for the period of investment. Performance figures may reflect certain fee waivers and/or expense limitations, without which total returns may have |
| | been lower. For more information on share classes and current fee waivers and/or expense limitations (if any), please refer to the Notes to Financial Statements. |
| 2. | The gross expense ratios presented reflect the Fund’s “Total Annual Fund Operating Expenses” from the most recent Prospectus and may differ from other expense ratios disclosed in this report. |
| 3. | Class B shares are closed to all new purchases as well as additional investments by existing Class B shareholders. |
The footnotes on the next page are an integral part of the table and graph and should be carefully read in conjunction with them.
| | | | | | | | | | | | |
| Benchmark Performance | | One Year | | | Five Years
or Since
Inception | | | Ten Years
or Since
Inception | |
Russell 1000® Growth Index4 | | | 29.71 | % | | | 16.83 | % | | | 9.13 | % |
S&P 500® Index5 | | | 23.63 | | | | 15.18 | | | | 7.51 | |
Morningstar Large Growth Category Average6 | | | 26.56 | | | | 15.09 | | | | 7.47 | |
| 4. | The Russell 1000® Growth Index is the Fund’s primary broad-based securities market index for comparison purposes. The Russell 1000® Growth Index measures the performance of the large-cap growth segment of the U.S. equity universe. It includes those Russell 1000® Index companies with higher price-to-book ratios and higher forecasted growth values. Results assume reinvestment of all dividends and capital gains. An investment cannot be made directly in an index. |
| 5. | The S&P 500® Index is the Fund’s secondary benchmark. “S&P 500®” is a trademark of The McGraw-Hill Companies, Inc. The S&P 500® Index is widely regarded as the standard index for measuring large-cap U.S. stock- |
| | market performance. Results assume reinvestment of all dividends and capital gains. An investment cannot be made directly in an index. |
| 6. | The Morningstar Large Growth Category Average is representative of funds that invest primarily in big U.S. companies that are projected to grow faster than other large-cap stocks. Stocks in the top 70% of the capitalization of the U.S. equity market are defined as large cap. Growth is defined based on fast growth and high valuations. Most of these portfolios focus on companies in rapidly expanding industries. Results are based on average total returns of similar funds with all dividends and capital gain distributions reinvested. |
The footnotes on the preceding page are an integral part of the table and graph and should be carefully read in conjunction with them.
| | |
| 6 | | MainStay Large Cap Growth Fund |
Cost in Dollars of a $1,000 Investment in MainStay Large Cap Growth Fund (Unaudited)
The example below is intended to describe the fees and expenses borne by shareholders during the six-month period from May 1, 2017, to October 31, 2017, and the impact of those costs on your investment.
Example
As a shareholder of the Fund you incur two types of costs: (1) transaction costs, including exchange fees and sales charges (loads) on purchases (as applicable), and (2) ongoing costs, including management fees, distribution and/or service (12b-1) fees, and other Fund expenses (as applicable). This example is intended to help you understand your ongoing costs (in dollars) of investing in the Fund and to compare these costs with the ongoing costs of investing in other mutual funds. The example is based on an investment of $1,000 made at the beginning of the six-month period and held for the entire period from May 1, 2017, to October 31, 2017.
This example illustrates your Fund’s ongoing costs in two ways:
Actual Expenses
The second and third data columns in the table below provide information about actual account values and actual expenses. You may use the information in these columns, together with the amount you invested, to estimate the expenses that you paid during the six months ended October 31, 2017. Simply divide your account value by $1,000 (for example, an $8,600 account value divided by $1,000 = 8.6), then
multiply the result by the number under the heading entitled “Expenses Paid During Period” to estimate the expenses you paid on your account during this period.
Hypothetical Example for Comparison Purposes
The fourth and fifth data columns in the table below provide information about hypothetical account values and hypothetical expenses based on the Fund’s actual expense ratio and an assumed rate of return of 5% per year before expenses, which is not the Fund’s actual return. The hypothetical account values and expenses may not be used to estimate the actual ending account balances or expenses you paid for the six-month period shown. You may use this information to compare the ongoing costs of investing in the Fund with the ongoing costs of investing in other mutual funds. To do so, compare this 5% hypothetical example with the 5% hypothetical examples that appear in the shareholder reports of the other mutual funds.
Please note that the expenses shown in the table are meant to highlight your ongoing costs only and do not reflect any transactional costs, such as exchange fees or sales charges (loads). Therefore, the fourth and fifth data columns of the table are useful in comparing ongoing costs only and will not help you determine the relative total costs of owning different funds. In addition, if these transactional costs were included, your costs would have been higher.
| | | | | | | | | | | | | | | | | | | | | | |
| | | | | | | | | | | | | | | | | | |
| Share Class | | Beginning
Account
Value
5/1/17 | | | Ending Account
Value (Based
on Actual
Returns and
Expenses)
10/31/17 | | | Expenses
Paid
During
Period1 | | | Ending Account
Value (Based
on Hypothetical
5% Annualized
Return and
Actual Expenses)
10/31/17 | | | Expenses
Paid
During
Period1 | | | Net Expense
Ratio
During
Period2 |
| | | | | | |
| Class A Shares | | $ | 1,000.00 | | | $ | 1,130.30 | | | $ | 5.26 | | | $ | 1,020.30 | | | $ | 4.99 | | | 0.98% |
| | | | | | |
| Investor Class Shares | | $ | 1,000.00 | | | $ | 1,129.40 | | | $ | 5.69 | | | $ | 1,019.90 | | | $ | 5.40 | | | 1.06% |
| | | | | | |
| Class B Shares | | $ | 1,000.00 | | | $ | 1,125.30 | | | $ | 9.75 | | | $ | 1,016.00 | | | $ | 9.25 | | | 1.82% |
| | | | | | |
| Class C Shares | | $ | 1,000.00 | | | $ | 1,125.60 | | | $ | 9.70 | | | $ | 1,016.10 | | | $ | 9.20 | | | 1.81% |
| | | | | | |
| Class I Shares | | $ | 1,000.00 | | | $ | 1,132.00 | | | $ | 3.92 | | | $ | 1,021.50 | | | $ | 3.72 | | | 0.73% |
| | | | | | |
| Class R1 Shares | | $ | 1,000.00 | | | $ | 1,131.70 | | | $ | 4.46 | | | $ | 1,021.00 | | | $ | 4.23 | | | 0.83% |
| | | | | | |
| Class R2 Shares | | $ | 1,000.00 | | | $ | 1,129.50 | | | $ | 5.80 | | | $ | 1,019.80 | | | $ | 5.50 | | | 1.08% |
| | | | | | |
| Class R3 Shares | | $ | 1,000.00 | | | $ | 1,128.00 | | | $ | 7.13 | | | $ | 1,018.50 | | | $ | 6.77 | | | 1.33% |
| | | | | | |
| Class R6 Shares | | $ | 1,000.00 | | | $ | 1,132.40 | | | $ | 3.39 | | | $ | 1,022.00 | | | $ | 3.21 | | | 0.63% |
| 1. | Expenses are equal to the Fund’s annualized expense ratio of each class multiplied by the average account value over the period, divided by 365 and multiplied by 184 (to reflect the six-month period). The table above represents the actual expenses incurred during the six-month period. |
| 2. | Expenses are equal to the Fund’s annualized expense ratio to reflect the six-month period. |
Industry Composition as of October 31, 2017 (Unaudited)
| | | | |
| Software | | | 15.3 | % |
| Internet Software & Services | | | 13.1 | |
| IT Services | | | 11.3 | |
| Internet & Direct Marketing Retail | | | 9.5 | |
| Semiconductors & Semiconductor Equipment | | | 5.9 | |
| Health Care Equipment & Supplies | | | 4.2 | |
| Aerospace & Defense | | | 3.4 | |
| Health Care Providers & Services | | | 3.4 | |
| Life Sciences Tools & Services | | | 3.4 | |
| Technology Hardware, Storage & Peripherals | | | 3.4 | |
| Pharmaceuticals | | | 3.1 | |
| Chemicals | | | 2.8 | |
| Capital Markets | | | 2.3 | |
| Equity Real Estate Investment Trusts | | | 2.0 | |
| Biotechnology | | | 1.9 | |
| | | | |
| Industrial Conglomerates | | | 1.8 | % |
| Media | | | 1.8 | |
| Specialty Retail | | | 1.7 | |
| Road & Rail | | | 1.6 | |
| Textiles, Apparel & Luxury Goods | | | 1.6 | |
| Air Freight & Logistics | | | 1.4 | |
| Hotels, Restaurants & Leisure | | | 1.2 | |
| Banks | | | 1.1 | |
| Machinery | | | 1.1 | |
| Automobiles | | | 1.0 | |
| Short-Term Investment | | | 0.4 | |
| Other Assets, Less Liabilities | | | 0.3 | |
| | | | |
| | | 100.0 | % |
| | | | |
See Portfolio of Investments beginning on page 11 for specific holdings within these categories.
Top Ten Holdings as of October 31, 2017 (excluding short-term investment) (Unaudited)
| 5. | Facebook, Inc., Class A |
| 8. | UnitedHealth Group, Inc. |
| 9. | Alibaba Group Holding, Ltd., Sponsored ADR |
| 10. | Mastercard, Inc., Class A |
| | |
| 8 | | MainStay Large Cap Growth Fund |
Portfolio Management Discussion and Analysis (Unaudited)
Questions answered by portfolio managers Justin H. Kelly, CFA, and Patrick M. Burton, CFA, of Winslow Capital Management, LLC, the Fund’s Subadvisor.
How did MainStay Large Cap Growth Fund perform relative to its benchmarks and peers during the 12 months ended October 31, 2017?
Excluding all sales charges, MainStay Large Cap Growth Fund returned 28.54% for Class A shares, 28.45% for Investor Class shares, 27.61% for Class B shares and 27.51% for Class C shares for the 12 months ended October 31, 2017. Over the same period, the Fund returned 28.92% for Class I shares, 28.79% for Class R1 shares, 28.49% for Class R2 shares, 28.05% for Class R3 shares and 29.02% for Class R6 shares. For the 12 months ended October 31, 2017, all share classes underperformed the 29.71% return of the Russell 1000® Growth Index,1 which is the Fund’s primary benchmark. Over the same period, all share classes outperformed the 23.63% return of the S&P 500® Index,1 which is the Fund’s secondary benchmark. For the 12 months ended October 31, 2017, all share classes outperformed the 26.56% return of the Morningstar Large Growth Category Average.2 See page 5 for Fund returns with applicable sales charges.
Were there any changes to the Fund during the reporting period?
Effective December 31, 2016, Clark Winslow no longer serves as a portfolio manager of the Fund. Justin Kelly and Patrick Burton will continue to serve as portfolio managers of the Fund.
What factors affected the Fund’s relative performance during the reporting period?
The Fund generated robust absolute performance, but lagged the return of the Russell 1000® Growth Index during the reporting period. The performance of many growth companies has been highly consistent with our modeling. We believed that the yield- and value-focused markets of 2016 led the valuations of many of the Fund’s high-growth companies to be as low on a relative basis as they had been in nearly 40 years. We positioned the Fund with overweight positions in these securities, which helped the Fund participate in the strong markets during the reporting period.
During the reporting period, which sectors were the strongest contributors to the Fund’s relative performance and which sectors were particularly weak?
The Fund’s performance relative to the Russell 1000® Growth Index benefited from our decision to underweight the consumer staples sector. (Contributions take weightings and total returns into account.) The structural headwinds facing the sector included shifting consumer tastes, which caused us to question many of the companies’ long-term competitive advantages,
growth rates and terminal values. With meaningful underperformance for the period, valuations have moderated and the sector’s forward price-earnings multiple was no longer excessive relative to 10-year averages. Fundamentals, however, had again weakened—most notably, we believe, as a result of reduced brand loyalty associated with online information discovery available to buyers. This trend may be accelerated by Amazon.com’s acquisition of Whole Foods. Performance for the Fund also benefited from an overweight position in the information technology sector, which was the best-performing and largest sector in the Russell 1000® Growth Index. We modeled many of the high-growth holdings in the sector as attractively valued. At the beginning of the reporting period, we positioned the Fund to benefit from strong anticipated earnings growth and a likely revaluation of these companies. The Fund also benefited from having an underweight position in the telecommunication services sector, where our model concluded that growth would be muted.
Stock selection in the health care sector was the largest detractor from the Fund’s relative performance during the reporting period, and certain Fund holdings have been sold. Stock selection in the consumer discretionary sector also detracted from relative performance as the sector’s return in the Russell 1000® Growth Index lagged the overall benchmark. Improving economic growth helped advance returns in the industrials sector, and the Fund’s underweight position relative to the Russell 1000® Growth Index and stock selection within the sector detracted from relative performance.
During the reporting period, which individual stocks made the strongest contributions to the Fund’s absolute performance and which stocks detracted the most?
During the reporting period, the strongest positive contributions to the Fund’s absolute performance came from third-party Chinese e-commerce giant Alibaba Group Holding, Israel-based technology company Mobileye and photolithography systems provider for the semiconductor industry ASML Holding. Alibaba Group Holding’s stock moved sharply higher during the last nine months of the reporting period, reflecting strong growth. During the third quarter of 2017, the company reported that its retail commerce and cloud businesses grew substantially, and both exceeded consensus expectations. Mobileye’s computer chips were leaders in semiautonomous driving, and the company was purchased for cash by Intel, resulting in a strong gain for the Fund. ASML Holding benefited from increased chip demand in many areas, including artificial intelligence, machine learning, virtual reality and autonomous driving.
| 1. | See footnote on page 6 for more information on this index. |
| 2. | See footnote on page 6 for more information on the Morningstar Large Growth Category Average. |
Among the Fund’s worst-performing stocks on an absolute basis during the reporting period were global provider of fuel cards for commercial fleets FLEETCOR Technologies, medical equipment company Dexcom and Internet travel agent Expedia. FLEETCOR Technologies detracted from results as the stock suffered from allegations of negative business practices. Dexcom, which makes continuous glucose monitoring devices, was hurt by news of a competitive entry from Abbott Labs. We model Abbott’s product as being priced and marketed aggressively, which changed our outlook for Dexcom, and the Fund sold its position in the stock. Expedia has been challenged recently because of hurricane and other natural-disaster-related travel disruptions, as well as the recent departure of the company’s chief executive officer.
Did the Fund make any significant purchases or sales during the reporting period?
The Fund’s largest new purchases during the reporting period were biopharmaceutical company Biogen and telecommunication services company Charter Communications. We purchased Biogen shares because we believed that revenue and earnings could rise above expectations with the launch of SPINRAZA®, a medicine for treating spinal muscular atrophy. Early data on the company’s Alzheimer’s treatments also looked promising. We purchased Charter Communications because we believed that the company was early in its rollout of new technology for recently acquired Time Warner Cable and Bright House Networks and that this could lead to stronger growth.
The Fund’s most significant sales during the reporting period included broadcasting and cable television company Comcast and American coffeehouse chain Starbucks. Comcast was sold because we were concerned about the company’s subscriber growth, and we preferred Charter Communications. We sold the Fund’s position in Starbucks because our models pointed to
slowing same-store sales growth and a continued high relative stock valuation.
How did the Fund’s sector weightings change during the reporting period?
During the reporting period, we increased the Fund’s weightings relative to the Russell 1000® Growth Index in the information technology and health care sectors. Over the same period, the largest decreases in sector weighting were in consumer discretionary and energy.
How was the Fund positioned at the end of the reporting period?
As of October 31, 2017, the Fund’s most substantially overweight positions relative to the Russell 1000® Growth Index were in the information technology and health care sectors. The Fund’s information technology holdings comprise leading business models across multiple technology industries in electronic payments, software as a service, Internet travel agencies, smart phones, and wireless communications. As with the information technology sector, we believe that health care is a heterogeneous sector where countervailing forces may benefit one industry over another for multiyear periods, creating opportunities for growth-stock selection. We continued to model attractive valuations in both sectors.
As of October 31, 2017, the Fund’s most substantially underweight sector positions relative to the Russell 1000® Growth Index were in consumer staples and industrials. In consumer staples, we model secular headwinds challenging future growth opportunities for many businesses. Although we note that global growth is accelerating in industrials, many securities in the sector have longer-term growth rates that are more muted than those that we model for other sectors.
The opinions expressed are those of the portfolio managers as of the date of this report and are subject to change. There is no guarantee that any forecast made will come to pass. This material does not constitute investment advice and is not intended as an endorsement of any specific investment.
| | |
| 10 | | MainStay Large Cap Growth Fund |
Portfolio of Investments October 31, 2017
| | | | | | | | |
| | |
| | | Shares | | | Value | |
| Common Stocks 99.3%† | | | | | | | | |
Aerospace & Defense 3.4% | | | | | | | | |
General Dynamics Corp. | | | 704,150 | | | $ | 142,928,368 | |
Northrop Grumman Corp. | | | 418,900 | | | | 123,797,517 | |
Raytheon Co. | | | 834,800 | | | | 150,430,960 | |
| | | | | | | | |
| | | | | | | 417,156,845 | |
| | | | | | | | |
Air Freight & Logistics 1.4% | | | | | | | | |
FedEx Corp. | | | 760,550 | | | | 171,739,796 | |
| | | | | | | | |
| | |
Automobiles 1.0% | | | | | | | | |
Ferrari N.V. | | | 1,057,700 | | | | 126,585,536 | |
| | | | | | | | |
| | |
Banks 1.1% | | | | | | | | |
JPMorgan Chase & Co. | | | 1,313,200 | | | | 132,121,052 | |
| | | | | | | | |
|
Biotechnology 1.9% | |
Biogen, Inc. (a) | | | 508,900 | | | | 158,603,774 | |
Celgene Corp. (a) | | | 772,420 | | | | 77,991,247 | |
| | | | | | | | |
| | | | | | | 236,595,021 | |
| | | | | | | | |
Capital Markets 2.3% | |
Intercontinental Exchange, Inc. | | | 2,210,400 | | | | 146,107,440 | |
Moody’s Corp. | | | 937,650 | | | | 133,530,737 | |
| | | | | | | | |
| | | | | | | 279,638,177 | |
| | | | | | | | |
Chemicals 2.8% | | | | | | | | |
Ecolab, Inc. | | | 1,206,150 | | | | 157,595,559 | |
Sherwin-Williams Co. | | | 458,675 | | | | 181,245,426 | |
| | | | | | | | |
| | | | | | | 338,840,985 | |
| | | | | | | | |
Equity Real Estate Investment Trusts 2.0% | |
American Tower Corp. | | | 1,669,650 | | | | 239,878,616 | |
| | | | | | | | |
|
Health Care Equipment & Supplies 4.2% | |
Align Technology, Inc. (a) | | | 141,000 | | | | 33,696,180 | |
Becton Dickinson & Co. | | | 805,150 | | | | 168,010,650 | |
Boston Scientific Corp. (a) | | | 7,427,300 | | | | 209,004,222 | |
Edwards Lifesciences Corp. (a) | | | 1,018,700 | | | | 104,141,701 | |
| | | | | | | | |
| | | | | | | 514,852,753 | |
| | | | | | | | |
Health Care Providers & Services 3.4% | |
Cigna Corp. | | | 253,600 | | | | 50,014,992 | |
¨UnitedHealth Group, Inc. | | | 1,729,050 | | | | 363,480,891 | |
| | | | | | | | |
| | | | | | | 413,495,883 | |
| | | | | | | | |
Hotels, Restaurants & Leisure 1.2% | | | | | | | | |
Hilton Worldwide Holdings, Inc. | | | 1,972,650 | | | | 142,583,142 | |
| | | | | | | | |
|
Industrial Conglomerates 1.8% | |
Honeywell International, Inc. | | | 1,521,150 | | | | 219,288,984 | |
| | | | | | | | |
| | | | | | | | |
| | |
| | | Shares | | | Value | |
Internet & Direct Marketing Retail 9.5% | |
¨Amazon.com, Inc. (a) | | | 552,640 | | | $ | 610,821,939 | |
Expedia, Inc. | | | 1,602,500 | | | | 199,767,650 | |
Netflix, Inc. (a) | | | 653,600 | | | | 128,386,648 | |
Priceline Group, Inc. (a) | | | 113,490 | | | | 216,988,341 | |
| | | | | | | | |
| | | | | | | 1,155,964,578 | |
| | | | | | | | |
Internet Software & Services 13.1% | | | | | | | | |
¨Alibaba Group Holding, Ltd.,
Sponsored ADR (a) | | | 1,758,750 | | | | 325,175,287 | |
¨Alphabet, Inc. (a) | |
Class A | | | 299,510 | | | | 309,405,810 | |
Class C | | | 327,731 | | | | 333,184,444 | |
CoStar Group, Inc. (a) | | | 456,610 | | | | 135,042,408 | |
¨Facebook, Inc., Class A (a) | | | 2,768,950 | | | | 498,577,137 | |
| | | | | | | | |
| | | | | | | 1,601,385,086 | |
| | | | | | | | |
IT Services 11.3% | | | | | | | | |
Automatic Data Processing, Inc. | | | 689,300 | | | | 80,138,018 | |
Fidelity National Information Services, Inc. | | | 1,396,350 | | | | 129,525,426 | |
Fiserv, Inc. (a) | | | 1,191,300 | | | | 154,189,959 | |
¨Mastercard, Inc., Class A | | | 1,856,850 | | | | 276,243,574 | |
PayPal Holdings, Inc. (a) | | | 2,899,650 | | | | 210,398,604 | |
¨Visa, Inc., Class A | | | 4,824,750 | | | | 530,626,005 | |
| | | | | | | | |
| | | | | | | 1,381,121,586 | |
| | | | | | | | |
Life Sciences Tools & Services 3.4% | | | | | | | | |
Illumina, Inc. (a) | | | 724,900 | | | | 148,742,231 | |
Thermo Fisher Scientific, Inc. | | | 1,342,850 | | | | 260,284,616 | |
| | | | | | | | |
| | | | | | | 409,026,847 | |
| | | | | | | | |
Machinery 1.1% | |
Fortive Corp. | | | 1,818,200 | | | | 131,383,132 | |
| | | | | | | | |
|
Media 1.8% | |
Charter Communications, Inc., Class A (a) | | | 659,000 | | | | 220,218,030 | |
| | | | | | | | |
| | |
Pharmaceuticals 3.1% | | | | | | | | |
Eli Lilly & Co. | | | 2,121,200 | | | | 173,811,128 | |
Zoetis, Inc. | | | 3,155,100 | | | | 201,358,482 | |
| | | | | | | | |
| | | | | | | 375,169,610 | |
| | | | | | | | |
Road & Rail 1.6% | | | | | | | | |
Union Pacific Corp. | | | 1,657,800 | | | | 191,956,662 | |
| | | | | | | | |
|
Semiconductors & Semiconductor Equipment 5.9% | |
ASML Holding N.V., Registered | | | 1,360,700 | | | | 245,946,525 | |
Broadcom, Ltd. | | | 778,400 | | | | 205,427,544 | |
NVIDIA Corp. | | | 751,600 | | | | 155,438,396 | |
Skyworks Solutions, Inc. | | | 1,027,950 | | | | 117,042,387 | |
| | | | | | | | |
| | | | | | | 723,854,852 | |
| | | | | | | | |
| † | Percentages indicated are based on Fund net assets. |
| ¨ | | Among the Fund’s 10 largest holdings, as of October 31, 2017, excluding short-term investment. May be subject to change daily. (Unaudited) |
| | | | | | |
The notes to the financial statements are an integral part of,
and should be read in conjunction with, the financial statements. | | | | | 11 | |
Portfolio of Investments October 31, 2017 (continued)
| | | | | | | | |
| | |
| | | Shares | | | Value | |
| Common Stocks (continued) | | | | | | | | |
Software 15.3% | | | | | | | | |
Adobe Systems, Inc. (a) | | | 1,078,700 | | | $ | 188,945,092 | |
Electronic Arts, Inc. (a) | | | 1,218,050 | | | | 145,678,780 | |
Intuit, Inc. | | | 1,004,150 | | | | 151,646,733 | |
¨Microsoft Corp. | | | 6,848,700 | | | | 569,674,866 | |
¨salesforce.com, Inc. (a) | | | 4,206,850 | | | | 430,529,029 | |
ServiceNow, Inc. (a) | | | 1,152,750 | | | | 145,673,017 | |
Splunk, Inc. (a) | | | 3,475,950 | | | | 233,931,435 | |
| | | | | | | | |
| | | | | | | 1,866,078,952 | |
| | | | | | | | |
Specialty Retail 1.7% | | | | | | | | |
Home Depot, Inc. | | | 1,212,100 | | | | 200,941,938 | |
| | | | | | | | |
|
Technology Hardware, Storage & Peripherals 3.4% | |
¨Apple, Inc. | | | 2,473,885 | | | | 418,185,520 | |
| | | | | | | | |
|
Textiles, Apparel & Luxury Goods 1.6% | |
NIKE, Inc., Class B | | | 3,433,400 | | | | 188,802,666 | |
| | | | | | | | |
Total Common Stocks
(Cost $6,923,557,119) | | | | | | | 12,096,866,249 | |
| | | | | | | | |
| | |
| | | | | | | | |
| | | | | | | | |
| | | Principal
Amount | | | Value | |
| Short-Term Investment 0.4% | | | | | | | | |
Repurchase Agreement 0.4% | | | | | | | | |
Fixed Income Clearing Corp.
0.34%, dated 10/31/17
due 11/1/17
Proceeds at Maturity $54,658,874 (Collateralized by United States Treasury Notes with rates between 1.625% and 1.75% maturity dates between 4/30/23 and 5/15/23, with a Principal Amount of $57,090,000 and a Market Value of $55,754,151) | | $ | 54,658,357 | | | $ | 54,658,357 | |
| | | | | | | | |
Total Short-Term Investment
(Cost $54,658,357) | | | | | | | 54,658,357 | |
| | | | | | | | |
Total Investments
(Cost $6,978,215,476) | | | 99.7 | % | | | 12,151,524,606 | |
| | | | | | | | |
Other Assets, Less Liabilities | | | 0.3 | | | | 31,186,497 | |
Net Assets | | | 100.0 | % | | $ | 12,182,711,103 | |
| (a) | Non-income producing security. |
The following abbreviation is used in the preceding pages:
ADR—American Depositary Receipt
The following is a summary of the fair valuations according to the inputs used as of October 31, 2017, for valuing the Fund’s assets.
Asset Valuation Inputs
| | | | | | | | | | | | | | | | |
Description | | Quoted
Prices in
Active
Markets for
Identical
Assets (Level 1) | | | Significant
Other
Observable
Inputs (Level 2) | | | Significant
Unobservable
Inputs (Level 3) | | | Total | |
| Investments in Securities (a) | | | | | | | | | | | | | | | | |
| Common Stocks | | $ | 12,096,866,249 | | | $ | — | | | $ | — | | | $ | 12,096,866,249 | |
| Short-Term Investment | | | | | | | | | | | | | | | | |
Repurchase Agreement | | | — | | | | 54,658,357 | | | | — | | | | 54,658,357 | |
| | | | | | | | | | | | | | | | |
| Total Investments in Securities | | $ | 12,096,866,249 | | | $ | 54,658,357 | | | $ | — | | | $ | 12,151,524,606 | |
| | | | | | | | | | | | | | | | |
| (a) | For a complete listing of investments and their industries, see the Portfolio of Investments. |
The Fund recognizes transfers between the levels as of the beginning of the period.
For the year ended October 31, 2017, the Fund did not have any transfers among levels. (See Note 2)
As of October 31, 2017, the Fund did not hold any investments with significant unobservable inputs (Level 3). (See Note 2)
| | | | |
| 12 | | MainStay Large Cap Growth Fund | | The notes to the financial statements are an integral part of,
and should be read in conjunction with, the financial statements. |
Statement of Assets and Liabilities as of October 31, 2017
| | | | |
| Assets | |
Investment in securities, at value
(identified cost $6,978,215,476) | | $ | 12,151,524,606 | |
Receivables: | | | | |
Investment securities sold | | | 71,097,275 | |
Fund shares sold | | | 7,920,638 | |
Dividends and interest | | | 1,693,227 | |
Other assets | | | 96,778 | |
| | | | |
Total assets | | | 12,232,332,524 | |
| | | | |
| |
| Liabilities | | | | |
Payables: | | | | |
Fund shares redeemed | | | 40,829,394 | |
Manager (See Note 3) | | | 6,530,216 | |
Transfer agent (See Note 3) | | | 872,667 | |
Shareholder communication | | | 638,909 | |
NYLIFE Distributors (See Note 3) | | | 544,033 | |
Professional fees | | | 101,340 | |
Trustees | | | 29,728 | |
Custodian | | | 7,705 | |
Accrued expenses | | | 67,429 | |
| | | | |
Total liabilities | | | 49,621,421 | |
| | | | |
Net assets | | $ | 12,182,711,103 | |
| | | | |
| |
| Composition of Net Assets | | | | |
Shares of beneficial interest outstanding (par value of $.01 per share) unlimited number of shares authorized | | $ | 11,178,871 | |
Additional paid-in capital | | | 5,310,080,831 | |
| | | | |
| | | 5,321,259,702 | |
Undistributed net investment income | | | 7,443,041 | |
Accumulated net realized gain (loss) on investments | | | 1,680,699,230 | |
Net unrealized appreciation (depreciation) on investments | | | 5,173,309,130 | |
| | | | |
Net assets | | $ | 12,182,711,103 | |
| | | | |
| | | | |
Class A | | | | |
Net assets applicable to outstanding shares | | $ | 960,123,285 | |
| | | | |
Shares of beneficial interest outstanding | | | 92,224,436 | |
| | | | |
Net asset value per share outstanding | | $ | 10.41 | |
Maximum sales charge (5.50% of offering price) | | | 0.61 | |
| | | | |
Maximum offering price per share outstanding | | $ | 11.02 | |
| | | | |
Investor Class | | | | |
Net assets applicable to outstanding shares | | $ | 108,077,612 | |
| | | | |
Shares of beneficial interest outstanding | | | 10,495,343 | |
| | | | |
Net asset value per share outstanding | | $ | 10.30 | |
Maximum sales charge (5.50% of offering price) | | | 0.60 | |
| | | | |
Maximum offering price per share outstanding | | $ | 10.90 | |
| | | | |
Class B | | | | |
Net assets applicable to outstanding shares | | $ | 31,792,723 | |
| | | | |
Shares of beneficial interest outstanding | | | 3,541,866 | |
| | | | |
Net asset value and offering price per share outstanding | | $ | 8.98 | |
| | | | |
Class C | | | | |
Net assets applicable to outstanding shares | | $ | 229,282,801 | |
| | | | |
Shares of beneficial interest outstanding | | | 25,586,190 | |
| | | | |
Net asset value and offering price per share outstanding | | $ | 8.96 | |
| | | | |
Class I | | | | |
Net assets applicable to outstanding shares | | $ | 6,752,753,687 | |
| | | | |
Shares of beneficial interest outstanding | | | 610,656,960 | |
| | | | |
Net asset value and offering price per share outstanding | | $ | 11.06 | |
| | | | |
Class R1 | | | | |
Net assets applicable to outstanding shares | | $ | 1,596,638,091 | |
| | | | |
Shares of beneficial interest outstanding | | | 147,475,523 | |
| | | | |
Net asset value and offering price per share outstanding | | $ | 10.83 | |
| | | | |
Class R2 | | | | |
Net assets applicable to outstanding shares | | $ | 303,191,774 | |
| | | | |
Shares of beneficial interest outstanding | | | 29,205,064 | |
| | | | |
Net asset value and offering price per share outstanding | | $ | 10.38 | |
| | | | |
Class R3 | | | | |
Net assets applicable to outstanding shares | | $ | 78,634,276 | |
| | | | |
Shares of beneficial interest outstanding | | | 7,893,530 | |
| | | | |
Net asset value and offering price per share outstanding | | $ | 9.96 | |
| | | | |
Class R6 | | | | |
Net assets applicable to outstanding shares | | $ | 2,122,216,854 | |
| | | | |
Shares of beneficial interest outstanding | | | 190,808,161 | |
| | | | |
Net asset value and offering price per share outstanding | | $ | 11.12 | |
| | | | |
| | | | | | |
The notes to the financial statements are an integral part of,
and should be read in conjunction with, the financial statements. | | | | | 13 | |
Statement of Operations for the year ended October 31, 2017
| | | | |
| Investment Income (Loss) | |
Income | | | | |
Dividends | | $ | 109,993,210 | |
Interest | | | 81,168 | |
Other income | | | 13,315 | |
| | | | |
Total income | | | 110,087,693 | |
| | | | |
Expenses | | | | |
Manager (See Note 3) | | | 78,797,184 | |
Transfer agent (See Note 3) | | | 13,310,198 | |
Distribution/Service—Class A (See Note 3) | | | 2,151,350 | |
Distribution/Service—Investor Class (See Note 3) | | | 403,958 | |
Distribution/Service—Class B (See Note 3) | | | 338,849 | |
Distribution/Service—Class C (See Note 3) | | | 2,531,191 | |
Distribution/Service—Class R2 (See Note 3) | | | 821,445 | |
Distribution/Service—Class R3 (See Note 3) | | | 400,032 | |
Shareholder service (See Note 3) | | | 2,029,905 | |
Shareholder communication | | | 974,753 | |
Professional fees | | | 530,297 | |
Trustees | | | 315,312 | |
Registration | | | 259,473 | |
Custodian | | | 53,355 | |
Miscellaneous | | | 435,430 | |
| | | | |
Total expenses before waiver/reimbursement | | | 103,352,732 | |
Expense waiver/reimbursement from Manager (See Note 3) | | | (484,857 | ) |
| | | | |
Net expenses | | | 102,867,875 | |
| | | | |
Net investment income (loss) | | | 7,219,818 | |
| | | | |
|
| Realized and Unrealized Gain (Loss) on Investments | |
Net realized gain (loss) on investments | | | 2,125,171,899 | |
Net change in unrealized appreciation (depreciation) on investments | | | 1,093,100,385 | |
| | | | |
Net realized and unrealized gain (loss) on investments | | | 3,218,272,284 | |
| | | | |
Net increase (decrease) in net assets resulting from operations | | $ | 3,225,492,102 | |
| | | | |
| | | | |
| 14 | | MainStay Large Cap Growth Fund | | The notes to the financial statements are an integral part of,
and should be read in conjunction with, the financial statements. |
Statements of Changes in Net Assets
for the years ended October 31, 2017 and October 31, 2016
| | | | | | | | |
| | | 2017 | | | 2016 | |
| Increase (Decrease) in Net Assets | |
Operations: | | | | | | | | |
Net investment income (loss) | | $ | 7,219,818 | | | $ | 8,225,492 | |
Net realized gain (loss) on investments | | | 2,125,171,899 | | | | 1,723,956,661 | |
Net change in unrealized appreciation (depreciation) on investments | | | 1,093,100,385 | | | | (2,190,510,484 | ) |
| | | | |
Net increase (decrease) in net assets resulting from operations | | | 3,225,492,102 | | | | (458,328,331 | ) |
| | | | |
Distributions to shareholders: | | | | | | | | |
From net realized gain on investments: | | | | | | | | |
Class A | | | (97,685,398 | ) | | | (142,419,821 | ) |
Investor Class | | | (19,306,165 | ) | | | (22,800,549 | ) |
Class B | | | (4,699,003 | ) | | | (6,317,895 | ) |
Class C | | | (37,641,042 | ) | | | (53,490,540 | ) |
Class I | | | (952,688,820 | ) | | | (1,353,826,295 | ) |
Class R1 | | | (180,061,866 | ) | | | (243,267,444 | ) |
Class R2 | | | (43,793,657 | ) | | | (77,201,297 | ) |
Class R3 | | | (10,344,534 | ) | | | (13,765,123 | ) |
Class R6 | | | (180,099,811 | ) | | | (148,689,366 | ) |
| | | | |
Total distributions to shareholders | | | (1,526,320,296 | ) | | | (2,061,778,330 | ) |
| | | | |
Capital share transactions: | | | | | | | | |
Net proceeds from sale of shares | | | 2,399,225,432 | | | | 3,454,173,773 | |
Net asset value of shares issued to shareholders in reinvestment of distributions | | | 1,231,556,918 | | | | 1,630,820,951 | |
Cost of shares redeemed | | | (7,343,872,524 | ) | | | (6,409,403,860 | ) |
| | | | |
Increase (decrease) in net assets derived from capital share transactions | | | (3,713,090,174 | ) | | | (1,324,409,136 | ) |
| | | | |
Net increase (decrease) in net assets | | | (2,013,918,368 | ) | | | (3,844,515,797 | ) |
|
| Net Assets | |
Beginning of year | | | 14,196,629,471 | | | | 18,041,145,268 | |
| | | | |
End of year | | $ | 12,182,711,103 | | | $ | 14,196,629,471 | |
| | | | |
Undistributed net investment income at end of year | | $ | 7,443,041 | | | $ | — | |
| | | | |
| | | | | | |
The notes to the financial statements are an integral part of,
and should be read in conjunction with, the financial statements. | | | | | 15 | |
Financial Highlights selected per share data and ratios
| | | | | | | | | | | | | | | | | | | | |
| | | Year ended October 31, | |
| Class A | | 2017 | | | 2016 | | | 2015 | | | 2014 | | | 2013 | |
Net asset value at beginning of year | | $ | 9.17 | | | $ | 10.68 | | | $ | 10.91 | | | $ | 9.98 | | | $ | 7.55 | |
| | | | | | | | | | | | | | | | | | | | |
Net investment income (loss) (a) | | | (0.01 | ) | | | (0.01 | ) | | | (0.02 | ) | | | (0.02 | ) | | | 0.01 | |
Net realized and unrealized gain (loss) on investments | | | 2.31 | | | | (0.23 | ) | | | 0.85 | | | | 1.45 | | | | 2.42 | |
| | | | | | | | | | | | | | | | | | | | |
Total from investment operations | | | 2.30 | | | | (0.24 | ) | | | 0.83 | | | | 1.43 | | | | 2.43 | |
| | | | | | | | | | | | | | | | | | | | |
| Less dividends and distributions: | | | | | | | | | | | | | | | | | | | | |
From net investment income | | | — | | | | — | | | | — | | | | — | | | | (0.00 | )‡ |
From net realized gain on investments | | | (1.06 | ) | | | (1.27 | ) | | | (1.06 | ) | | | (0.50 | ) | | | — | |
| | | | | | | | | | | | | | | | | | | | |
Total dividends and distributions | | | (1.06 | ) | | | (1.27 | ) | | | (1.06 | ) | | | (0.50 | ) | | | (0.00 | )‡ |
| | | | | | | | | | | | | | | | | | | | |
Net asset value at end of year | | $ | 10.41 | | | $ | 9.17 | | | $ | 10.68 | | | $ | 10.91 | | | $ | 9.98 | |
| | | | | | | | | | | | | | | | | | | | |
Total investment return (b) | | | 28.54 | % | | | (2.44 | %) | | | 8.10 | % | | | 14.95 | % | | | 32.09 | % |
| Ratios (to average net assets)/Supplemental Data: | | | | | | | | | | | | | | | | | | | | |
Net investment income (loss) | | | (0.15 | %) | | | (0.13 | %) | | | (0.23 | %) | | | (0.22 | %) | | | 0.17 | % |
Net expenses | | | 1.00 | % | | | 0.99 | % | | | 0.99 | % | | | 0.99 | % | | | 1.02 | % |
Expenses (before waiver/reimbursement) | | | 1.00 | % | | | 1.00 | % | | | 0.99 | % | | | 0.99 | % | | | 1.02 | % |
Portfolio turnover rate | | | 61 | % | | | 84 | % | | | 66 | % | | | 67 | % | | | 74 | % |
Net assets at end of year (in 000’s) | | $ | 960,123 | | | $ | 882,021 | | | $ | 1,202,852 | | | $ | 1,304,641 | | | $ | 1,615,768 | |
| ‡ | Less than one cent per share. |
| (a) | Per share data based on average shares outstanding during the year. |
| (b) | Total investment return is calculated exclusive of sales charges and assumes the reinvestment of dividends and distributions. For periods of less than one year, total return is not annualized. |
| | | | | | | | | | | | | | | | | | | | |
| | | Year ended October 31, | |
| Investor Class | | 2017 | | | 2016 | | | 2015 | | | 2014 | | | 2013 | |
Net asset value at beginning of year | | $ | 9.09 | | | $ | 10.61 | | | $ | 10.84 | | | $ | 9.93 | | | $ | 7.52 | |
| | | | | | | | | | | | | | | | | | | | |
Net investment income (loss) (a) | | | (0.02 | ) | | | (0.02 | ) | | | (0.03 | ) | | | (0.03 | ) | | | 0.01 | |
Net realized and unrealized gain (loss) on investments | | | 2.29 | | | | (0.23 | ) | | | 0.86 | | | | 1.44 | | | | 2.40 | |
| | | | | | | | | | | | | | | | | | | | |
Total from investment operations | | | 2.27 | | | | (0.25 | ) | | | 0.83 | | | | 1.41 | | | | 2.41 | |
| | | | | | | | | | | | | | | | | | | | |
| Less dividends and distributions: | | | | | | | | | | | | | | | | | | | | |
From net investment income | | | — | | | | — | | | | — | | | | — | | | | (0.00 | )‡ |
From net realized gain on investments | | | (1.06 | ) | | | (1.27 | ) | | | (1.06 | ) | | | (0.50 | ) | | | — | |
| | | | | | | | | | | | | | | | | | | | |
Total dividends and distributions | | | (1.06 | ) | | | (1.27 | ) | | | (1.06 | ) | | | (0.50 | ) | | | (0.00 | )‡ |
| | | | | | | | | | | | | | | | | | | | |
Net asset value at end of year | | $ | 10.30 | | | $ | 9.09 | | | $ | 10.61 | | | $ | 10.84 | | | $ | 9.93 | |
| | | | | | | | | | | | | | | | | | | | |
Total investment return (b) | | | 28.45 | % | | | (2.57 | %) | | | 8.16 | % | | | 14.82 | % | | | 32.13 | % |
| Ratios (to average net assets)/Supplemental Data: | | | | | | | | | | | | | | | | | | | | |
Net investment income (loss) | | | (0.19 | %) | | | (0.19 | %) | | | (0.28 | %) | | | (0.28 | %) | | | 0.09 | % |
Net expenses | | | 1.07 | % | | | 1.05 | % | | | 1.04 | % | | | 1.04 | % | | | 1.08 | % |
Expenses (before waiver/reimbursement) | | | 1.07 | % | | | 1.06 | % | | | 1.04 | % | | | 1.04 | % | | | 1.08 | % |
Portfolio turnover rate | | | 61 | % | | | 84 | % | | | 66 | % | | | 67 | % | | | 74 | % |
Net assets at end of year (in 000’s) | | $ | 108,078 | | | $ | 167,631 | | | $ | 180,154 | | | $ | 199,826 | | | $ | 211,111 | |
| ‡ | Less than one cent per share. |
| (a) | Per share data based on average shares outstanding during the year. |
| (b) | Total investment return is calculated exclusive of sales charges and assumes the reinvestment of dividends and distributions. For periods of less than one year, total return is not annualized. |
| | | | |
| 16 | | MainStay Large Cap Growth Fund | | The notes to the financial statements are an integral part of,
and should be read in conjunction with, the financial statements. |
Financial Highlights selected per share data and ratios
| | | | | | | | | | | | | | | | | | | | |
| | | Year ended October 31, | |
| Class B | | 2017 | | | 2016 | | | 2015 | | | 2014 | | | 2013 | |
Net asset value at beginning of year | | $ | 8.11 | | | $ | 9.67 | | | $ | 10.04 | | | $ | 9.29 | | | $ | 7.09 | |
| | | | | | | | | | | | | | | | | | | | |
Net investment income (loss) (a) | | | (0.08 | ) | | | (0.08 | ) | | | (0.10 | ) | | | (0.10 | ) | | | (0.05 | ) |
Net realized and unrealized gain (loss) on investments | | | 2.01 | | | | (0.21 | ) | | | 0.79 | | | | 1.35 | | | | 2.25 | |
| | | | | | | | | | | | | | | | | | | | |
Total from investment operations | | | 1.93 | | | | (0.29 | ) | | | 0.69 | | | | 1.25 | | | | 2.20 | |
| | | | | | | | | | | | | | | | | | | | |
| Less dividends and distributions: | | | | | | | | | | | | | | | | | | | | |
From net investment income | | | — | | | | — | | | | — | | | | — | | | | (0.00 | )‡ |
From net realized gain on investments | | | (1.06 | ) | | | (1.27 | ) | | | (1.06 | ) | | | (0.50 | ) | | | — | |
| | | | | | | | | | | | | | | | | | | | |
Total dividends and distributions | | | (1.06 | ) | | | (1.27 | ) | | | (1.06 | ) | | | (0.50 | ) | | | (0.00 | )‡ |
| | | | | | | | | | | | | | | | | | | | |
Net asset value at end of year | | $ | 8.98 | | | $ | 8.11 | | | $ | 9.67 | | | $ | 10.04 | | | $ | 9.29 | |
| | | | | | | | | | | | | | | | | | | | |
Total investment return (b) | | | 27.61 | % | | | (3.32 | %) | | | 7.34 | % | | | 14.08 | % | | | 30.93 | % |
| Ratios (to average net assets)/Supplemental Data: | | | | | | | | | | | | | | | | | | | | |
Net investment income (loss) | | | (0.96 | %) | | | (0.94 | %) | | | (1.03 | %) | | | (1.02 | %) | | | (0.65 | %) |
Net expenses | | | 1.82 | % | | | 1.80 | % | | | 1.79 | % | | | 1.79 | % | | | 1.83 | % |
Expenses (before waiver/reimbursement) | | | 1.82 | % | | | 1.81 | % | | | 1.79 | % | | | 1.79 | % | | | 1.83 | % |
Portfolio turnover rate | | | 61 | % | | | 84 | % | | | 66 | % | | | 67 | % | | | 74 | % |
Net assets at end of year (in 000’s) | | $ | 31,793 | | | $ | 36,549 | | | $ | 47,779 | | | $ | 52,737 | | | $ | 59,671 | |
| ‡ | Less than one cent per share. |
| (a) | Per share data based on average shares outstanding during the year. |
| (b) | Total investment return is calculated exclusive of sales charges and assumes the reinvestment of dividends and distributions. For periods of less than one year, total return is not annualized. |
| | | | | | | | | | | | | | | | | | | | |
| | | Year ended October 31, | |
| Class C | | 2017 | | | 2016 | | | 2015 | | | 2014 | | | 2013 | |
Net asset value at beginning of year | | $ | 8.10 | | | $ | 9.66 | | | $ | 10.03 | | | $ | 9.29 | | | $ | 7.09 | |
| | | | | | | | | | | | | | | | | | | | |
Net investment income (loss) (a) | | | (0.08 | ) | | | (0.08 | ) | | | (0.10 | ) | | | (0.10 | ) | | | (0.05 | ) |
Net realized and unrealized gain (loss) on investments | | | 2.00 | | | | (0.21 | ) | | | 0.79 | | | | 1.34 | | | | 2.25 | |
| | | | | | | | | | | | | | | | | | | | |
Total from investment operations | | | 1.92 | | | | (0.29 | ) | | | 0.69 | | | | 1.24 | | | | 2.20 | |
| | | | | | | | | | | | | | | | | | | | |
| Less dividends and distributions: | | | | | | | | | | | | | | | | | | | | |
From net investment income | | | — | | | | — | | | | — | | | | — | | | | (0.00 | )‡ |
From net realized gain on investments | | | (1.06 | ) | | | (1.27 | ) | | | (1.06 | ) | | | (0.50 | ) | | | — | |
| | | | | | | | | | | | | | | | | | | | |
Total dividends and distributions | | | (1.06 | ) | | | (1.27 | ) | | | (1.06 | ) | | | (0.50 | ) | | | (0.00 | )‡ |
| | | | | | | | | | | | | | | | | | | | |
Net asset value at end of year | | $ | 8.96 | | | $ | 8.10 | | | $ | 9.66 | | | $ | 10.03 | | | $ | 9.29 | |
| | | | | | | | | | | | | | | | | | | | |
Total investment return (b) | | | 27.51 | % | | | (3.31 | %) | | | 7.35 | % | | | 13.96 | % | | | 31.12 | % |
| Ratios (to average net assets)/Supplemental Data: | | | | | | | | | | | | | | | | | | | | |
Net investment income (loss) | | | (0.96 | %) | | | (0.94 | %) | | | (1.04 | %) | | | (1.02 | %) | | | (0.66 | %) |
Net expenses | | | 1.82 | % | | | 1.80 | % | | | 1.79 | % | | | 1.79 | % | | | 1.83 | % |
Expenses (before waiver/reimbursement) | | | 1.82 | % | | | 1.81 | % | | | 1.79 | % | | | 1.79 | % | | | 1.83 | % |
Portfolio turnover rate | | | 61 | % | | | 84 | % | | | 66 | % | | | 67 | % | | | 74 | % |
Net assets at end of year (in 000’s) | | $ | 229,283 | | | $ | 306,409 | | | $ | 408,078 | | | $ | 402,714 | | | $ | 403,968 | |
| ‡ | Less than one cent per share. |
| (a) | Per share data based on average shares outstanding during the year. |
| (b) | Total investment return is calculated exclusive of sales charges and assumes the reinvestment of dividends and distributions. For periods of less than one year, total return is not annualized. |
| | | | | | |
The notes to the financial statements are an integral part of,
and should be read in conjunction with, the financial statements. | | | | | 17 | |
Financial Highlights selected per share data and ratios
| | | | | | | | | | | | | | | | | | | | |
| | | Year ended October 31, | |
| Class I | | 2017 | | | 2016 | | | 2015 | | | 2014 | | | 2013 | |
Net asset value at beginning of year | | $ | 9.65 | | | $ | 11.15 | | | $ | 11.32 | | | $ | 10.31 | | | $ | 7.80 | |
| | | | | | | | | | | | | | | | | | | | |
Net investment income (loss) (a) | | | 0.01 | | | | 0.01 | | | | 0.00 | ‡ | | | 0.00 | ‡ | | | 0.03 | |
Net realized and unrealized gain (loss) on investments | | | 2.46 | | | | (0.24 | ) | | | 0.89 | | | | 1.51 | | | | 2.50 | |
| | | | | | | | | | | | | | | | | | | | |
Total from investment operations | | | 2.47 | | | | (0.23 | ) | | | 0.89 | | | | 1.51 | | | | 2.53 | |
| | | | | | | | | | | | | | | | | | | | |
| Less dividends and distributions: | | | | | | | | | | | | | | | | | | | | |
From net investment income | | | — | | | | — | | | | — | | | | — | | | | (0.02 | ) |
From net realized gain on investments | | | (1.06 | ) | | | (1.27 | ) | | | (1.06 | ) | | | (0.50 | ) | | | — | |
| | | | | | | | | | | | | | | | | | | | |
Total dividends and distributions | | | (1.06 | ) | | | (1.27 | ) | | | (1.06 | ) | | | (0.50 | ) | | | (0.02 | ) |
| | | | | | | | | | | | | | | | | | | | |
Net asset value at end of year | | $ | 11.06 | | | $ | 9.65 | | | $ | 11.15 | | | $ | 11.32 | | | $ | 10.31 | |
| | | | | | | | | | | | | | | | | | | | |
Total investment return (b) | | | 28.92 | % | | | (2.23 | %) | | | 8.36 | % | | | 15.26 | % | | | 32.41 | % |
| Ratios of net investment income (loss) to average net assets: | | | | | | | | | | | | | | | | | | | | |
| Ratios (to average net assets)/Supplemental Data: | | | | | | | | | | | | | | | | | | | | |
Net investment income (loss) | | | 0.12 | % | | | 0.12 | % | | | 0.02 | % | | | 0.02 | % | | | 0.38 | % |
Net expenses | | | 0.75 | % | | | 0.74 | % | | | 0.74 | % | | | 0.74 | % | | | 0.77 | % |
Expenses (before waiver/reimbursement) | | | 0.75 | % | | | 0.75 | % | | | 0.74 | % | | | 0.74 | % | | | 0.77 | % |
Portfolio turnover rate | | | 61 | % | | | 84 | % | | | 66 | % | | | 67 | % | | | 74 | % |
Net assets at end of year (in 000’s) | | $ | 6,752,754 | | | $ | 8,994,997 | | | $ | 12,150,253 | | | $ | 14,361,006 | | | $ | 13,254,459 | |
| ‡ | Less than one cent per share. |
| (a) | Per share data based on average shares outstanding during the year. |
| (b) | Total investment return is calculated exclusive of sales charges and assumes the reinvestment of dividends and distributions. Class I shares are not subject to sales charges. For periods of less than one year, total return is not annualized. |
| | | | | | | | | | | | | | | | | | | | |
| | | Year ended October 31, | |
| Class R1 | | 2017 | | | 2016 | | | 2015 | | | 2014 | | | 2013 | |
Net asset value at beginning of year | | $ | 9.48 | | | $ | 10.99 | | | $ | 11.17 | | | $ | 10.19 | | | $ | 7.72 | |
| | | | | | | | | | | | | | | | | | | | |
Net investment income (loss) (a) | | | 0.00 | ‡ | | | 0.00 | ‡ | | | (0.01 | ) | | | (0.01 | ) | | | 0.02 | |
Net realized and unrealized gain (loss) on investments | | | 2.41 | | | | (0.24 | ) | | | 0.89 | | | | 1.49 | | | | 2.47 | |
| | | | | | | | | | | | | | | | | | | | |
Total from investment operations | | | 2.41 | | | | (0.24 | ) | | | 0.88 | | | | 1.48 | | | | 2.49 | |
| | | | | | | | | | | | | | | | | | | | |
| Less dividends and distributions: | | | | | | | | | | | | | | | | | | | | |
From net investment income | | | — | | | | — | | | | — | | | | — | | | | (0.02 | ) |
From net realized gain on investments | | | (1.06 | ) | | | (1.27 | ) | | | (1.06 | ) | | | (0.50 | ) | | | — | |
| | | | | | | | | | | | | | | | | | | | |
Total dividends and distributions | | | (1.06 | ) | | | (1.27 | ) | | | (1.06 | ) | | | (0.50 | ) | | | (0.02 | ) |
| | | | | | | | | | | | | | | | | | | | |
Net asset value at end of year | | $ | 10.83 | | | $ | 9.48 | | | $ | 10.99 | | | $ | 11.17 | | | $ | 10.19 | |
| | | | | | | | | | | | | | | | | | | | |
Total investment return (b) | | | 28.79 | % | | | (2.37 | %) | | | 8.39 | % | | | 15.14 | % | | | 32.27 | % |
| Ratios (to average net assets)/Supplemental Data: | | | | | | | | | | | | | | | | | | | | |
Net investment income (loss) | | | 0.01 | % | | | 0.02 | % | | | (0.08 | %) | | | (0.08 | %) | | | 0.28 | % |
Net expenses | | | 0.85 | % | | | 0.84 | % | | | 0.84 | % | | | 0.84 | % | | | 0.87 | % |
Expenses (before waiver/reimbursement) | | | 0.85 | % | | | 0.85 | % | | | 0.84 | % | | | 0.84 | % | | | 0.87 | % |
Portfolio turnover rate | | | 61 | % | | | 84 | % | | | 66 | % | | | 67 | % | | | 74 | % |
Net assets at end of year (in 000’s) | | $ | 1,596,638 | | | $ | 1,636,560 | | | $ | 1,952,248 | | | $ | 2,225,940 | | | $ | 2,287,242 | |
| ‡ | Less than one cent per share. |
| (a) | Per share data based on average shares outstanding during the year. |
| (b) | Total investment return is calculated exclusive of sales charges and assumes the reinvestment of dividends and distributions. Class R1 shares are not subject to sales charges. For periods of less than one year, total return is not annualized. |
| | | | |
| 18 | | MainStay Large Cap Growth Fund | | The notes to the financial statements are an integral part of,
and should be read in conjunction with, the financial statements. |
Financial Highlights selected per share data and ratios
| | | | | | | | | | | | | | | | | | | | |
| | | Year ended October 31, | |
| Class R2 | | 2017 | | | 2016 | | | 2015 | | | 2014 | | | 2013 | |
Net asset value at beginning of year | | $ | 9.15 | | | $ | 10.68 | | | $ | 10.92 | | | $ | 9.99 | | | $ | 7.57 | |
| | | | | | | | | | | | | | | | | | | | |
Net investment income (loss) (a) | | | (0.02 | ) | | | (0.02 | ) | | | (0.03 | ) | | | (0.03 | ) | | | 0.00 | ‡ |
Net realized and unrealized gain (loss) on investments | | | 2.31 | | | | (0.24 | ) | | | 0.85 | | | | 1.46 | | | | 2.42 | |
| | | | | | | | | | | | | | | | | | | | |
Total from investment operations | | | 2.29 | | | | (0.26 | ) | | | 0.82 | | | | 1.43 | | | | 2.42 | |
| | | | | | | | | | | | | | | | | | | | |
| Less dividends and distributions: | | | | | | | | | | | | | | | | | | | | |
From net investment income | | | — | | | | — | | | | — | | | | — | | | | (0.00 | )‡ |
From net realized gain on investments | | | (1.06 | ) | | | (1.27 | ) | | | (1.06 | ) | | | (0.50 | ) | | | — | |
| | | | | | | | | | | | | | | | | | | | |
Total dividends and distributions | | | (1.06 | ) | | | (1.27 | ) | | | (1.06 | ) | | | (0.50 | ) | | | (0.00 | )‡ |
| | | | | | | | | | | | | | | | | | | | |
Net asset value at end of year | | $ | 10.38 | | | $ | 9.15 | | | $ | 10.68 | | | $ | 10.92 | | | $ | 9.99 | |
| | | | | | | | | | | | | | | | | | | | |
Total investment return (b) | | | 28.49 | % | | | (2.66 | %) | | | 8.00 | % | | | 14.93 | % | | | 31.88 | % |
| Ratios (to average net assets)/Supplemental Data: | | | | | | | | | | | | | | | | | | | | |
Net investment income (loss) | | | (0.24 | %) | | | (0.23 | %) | | | (0.32 | %) | | | (0.33 | %) | | | 0.03 | % |
Net expenses | | | 1.10 | % | | | 1.09 | % | | | 1.09 | % | | | 1.09 | % | | | 1.12 | % |
Expenses (before waiver/reimbursement) | | | 1.10 | % | | | 1.10 | % | | | 1.09 | % | | | 1.09 | % | | | 1.12 | % |
Portfolio turnover rate | | | 61 | % | | | 84 | % | | | 66 | % | | | 67 | % | | | 74 | % |
Net assets at end of year (in 000’s) | | $ | 303,192 | | | $ | 391,535 | | | $ | 674,630 | | | $ | 984,295 | | | $ | 1,014,655 | |
| ‡ | Less than one-tenth of a percent. |
| (a) | Per share data based on average shares outstanding during the year. |
| (b) | Total investment return is calculated exclusive of sales charges and assumes the reinvestment of dividends and distributions. Class R2 shares are not subject to sales charges. For periods of less than one year, total return is not annualized. |
| | | | | | | | | | | | | | | | | | | | |
| | | Year ended October 31, | |
| Class R3 | | 2017 | | | 2016 | | | 2015 | | | 2014 | | | 2013 | |
Net asset value at beginning of year | | $ | 8.85 | | | $ | 10.39 | | | $ | 10.67 | | | $ | 9.80 | | | $ | 7.45 | |
| | | | | | | | | | | | | | | | | | | | |
Net investment income (loss) (a) | | | (0.04 | ) | | | (0.04 | ) | | | (0.06 | ) | | | (0.06 | ) | | | (0.02 | ) |
Net realized and unrealized gain (loss) on investments | | | 2.21 | | | | (0.23 | ) | | | 0.84 | | | | 1.43 | | | | 2.37 | |
| | | | | | | | | | | | | | | | | | | | |
Total from investment operations | | | 2.17 | | | | (0.27 | ) | | | 0.78 | | | | 1.37 | | | | 2.35 | |
| | | | | | | | | | | | | | | | | | | | |
| Less dividends and distributions: | | | | | | | | | | | | | | | | | | | | |
From net investment income | | | — | | | | — | | | | — | | | | — | | | | (0.00 | )‡ |
From net realized gain on investments | | | (1.06 | ) | | | (1.27 | ) | | | (1.06 | ) | | | (0.50 | ) | | | — | |
| | | | | | | | | | | | | | | | | | | | |
Total dividends and distributions | | | (1.06 | ) | | | (1.27 | ) | | | (1.06 | ) | | | (0.50 | ) | | | (0.00 | )‡ |
| | | | | | | | | | | | | | | | | | | | |
Net asset value at end of year | | $ | 9.96 | | | $ | 8.85 | | | $ | 10.39 | | | $ | 10.67 | | | $ | 9.80 | |
| | | | | | | | | | | | | | | | | | | | |
Total investment return (b) | | | 28.05 | % | | | (2.83 | %) | | | 7.79 | % | | | 14.59 | % | | | 31.63 | % |
| Ratios (to average net assets)/Supplemental Data: | | | | | | | | | | | | | | | | | | | | |
Net investment income (loss) | | | (0.49 | %) | | | (0.48 | %) | | | (0.57 | %) | | | (0.57 | %) | | | (0.20 | %) |
Net expenses | | | 1.35 | % | | | 1.34 | % | | | 1.34 | % | | | 1.34 | % | | | 1.37 | % |
Expenses (before reimbursement/waiver) | | | 1.35 | % | | | 1.35 | % | | | 1.34 | % | | | 1.34 | % | | | 1.37 | % |
Portfolio turnover rate | | | 61 | % | | | 84 | % | | | 66 | % | | | 67 | % | | | 74 | % |
Net assets at end of year (in 000’s) | | $ | 78,634 | | | $ | 87,060 | | | $ | 114,118 | | | $ | 158,222 | | | $ | 219,158 | |
| ‡ | Less than one cent per share. |
| (a) | Per share data based on average shares outstanding during the year. |
| (b) | Total investment return is calculated exclusive of sales charges and assumes the reinvestment of dividends and distributions. Class R3 shares are not subject to sales charges. For periods of less than one year, total return is not annualized. |
| | | | | | |
The notes to the financial statements are an integral part of,
and should be read in conjunction with, the financial statements. | | | | | 19 | |
Financial Highlights selected per share data and ratios
| | | | | | | | | | | | | | | | | | | | |
| | | Year ended October 31, | | | June 17,
2013**
through October 31, | |
| Class R6 | | 2017 | | | 2016 | | | 2015 | | | 2014 | | | 2013 | |
Net asset value at beginning of period | | $ | 9.69 | | | $ | 11.18 | | | $ | 11.33 | | | $ | 10.31 | | | $ | 9.02 | |
| | | | | | | | | | | | | | | | | | | | |
Net investment income (loss) (a) | | | 0.02 | | | | 0.02 | | | | 0.01 | | | | 0.01 | | | | 0.00 | ‡ |
Net realized and unrealized gain (loss) on investments | | | 2.47 | | | | (0.24 | ) | | | 0.90 | | | | 1.51 | | | | 1.29 | |
| | | | | | | | | | | | | | | | | | | | |
Total from investment operations | | | 2.49 | | | | (0.22 | ) | | | 0.91 | | | | 1.52 | | | | 1.29 | |
| | | | | | | | | | | | | | | | | | | | |
| Less distributions: | | | | | | | | | | | | | | | | | | | | |
From net realized gain on investments | | | (1.06 | ) | | | (1.27 | ) | | | (1.06 | ) | | | (0.50 | ) | | | — | |
| | | | | | | | | | | | | | | | | | | | |
Net asset value at end of period | | $ | 11.12 | | | $ | 9.69 | | | $ | 11.18 | | | $ | 11.33 | | | $ | 10.31 | |
| | | | | | | | | | | | | | | | | | | | |
Total investment return (b) | | | 29.02 | % | | | (2.12 | %) | | | 8.55 | % | | | 15.36 | % | | | 14.30 | % |
| Ratios (to average net assets)/Supplemental Data: | | | | | | | | | | | | | | | | | | | | |
Net investment income (loss) | | | 0.21 | % | | | 0.23 | % | | | 0.11 | % | | | 0.10 | % | | | 0.04 | %†† |
Net expenses | | | 0.63 | % | | | 0.62 | % | | | 0.62 | % | | | 0.62 | % | | | 0.62 | %†† |
Expenses (before waiver/reimbursement) | | | 0.63 | % | | | 0.63 | % | | | 0.62 | % | | | 0.62 | % | | | 0.62 | %†† |
Portfolio turnover rate | | | 61 | % | | | 84 | % | | | 66 | % | | | 67 | % | | | 74 | % |
Net assets at end of period (in 000’s) | | $ | 2,122,217 | | | $ | 1,693,868 | | | $ | 1,311,034 | | | $ | 738,186 | | | $ | 147,625 | |
| ‡ | Less than one cent per share. |
| (a) | Per share data based on average shares outstanding during the period. |
| (b) | Total investment return is calculated exclusive of sales charges and assumes the reinvestment of dividends and distributions. Class R6 shares are not subject to sales charges. For periods of less than one year, total return is not annualized. |
| | | | |
| 20 | | MainStay Large Cap Growth Fund | | The notes to the financial statements are an integral part of,
and should be read in conjunction with, the financial statements. |
Notes to Financial Statements
Note 1–Organization and Business
The MainStay Funds (the “Trust”) was organized on January 9, 1986, as a Massachusetts business trust and is governed by a Declaration of Trust. The Trust is registered under the Investment Company Act of 1940, as amended (the “1940 Act”), as an open-end management investment company, and is comprised of twelve funds (collectively referred to as the “Funds”). These financial statements and notes relate to the MainStay Large Cap Growth Fund (the “Fund”), a “diversified” fund, as that term is defined in the 1940 Act, as interpreted or modified by regulatory authorities having jurisdiction, from time to time.
The Fund currently has ten classes of shares registered for sale. Class A shares commenced operations on July 1, 1995. Class B, Class C, Class I, Class R1 and Class R2 shares commenced operations on April 1, 2005. Class R3 shares commenced operations on April 28, 2006. Investor Class shares commenced operations on February 28, 2008. Class R6 shares commenced operations on June 17, 2013. Class T shares were registered for sale effective as of February 28, 2017. As of October 31, 2017, Class T shares were not yet offered for sale. Effective February 28, 2017, Class B shares of the MainStay Group of Funds were closed to all new purchases as well as additional investments by existing Class B shareholders. Existing Class B shareholders may continue to reinvest dividends and capital gains distributions, as well as exchange their Class B shares for Class B shares of other MainStay Group of Funds as permitted by the current exchange privileges. Class B shareholders continue to be subject to any applicable contingent deferred sales charge (“CDSC”) at the time of redemption. All other features of the Class B shares, including but not limited to the fees and expenses applicable to Class B shares, remain unchanged. Unless redeemed, Class B shareholders will remain in Class B shares of their respective fund until the Class B shares are converted to Class A or Investor Class shares pursuant to the applicable conversion schedule.
Class A and Investor Class shares are offered at net asset value (“NAV”) per share plus an initial sales charge. No initial sales charge applies to investments of $1 million or more (and certain other qualified purchases) in Class A and Investor Class shares. Effective August 1, 2017, a CDSC of 1.00% may be imposed on certain redemptions of Class A and Investor Class shares made within 18 months of the date of purchase on shares that were purchased without an initial sales charge. For purchases of Class A and Investor Class shares made from January 1, 2017, through July 31, 2017, a CDSC of 1.00% may be imposed on certain redemptions of such shares made within 24 months of the date of purchase on shares that were purchased without an initial sales charge. For purchases of Class A and Investor Class shares made prior to January 1, 2017, a CDSC of 1.00% may be imposed on certain redemptions of such shares made within one year of the date of purchase on shares that were purchased without an initial sales charge. Class C shares are offered at NAV without an initial sales charge, although a 1.00% CDSC may be imposed on certain redemptions of such shares made within one year of the date of purchase of Class C shares. When Class B shares were offered, they were offered at NAV without an initial sales charge, although a CDSC that declines depending on the number of years a shareholder has held its Class B shares may be imposed on certain redemptions of such shares made within six years of the date of purchase of such shares. Class T shares are currently expected to be offered at NAV per share plus an initial
sales charge. Class I, Class R1, Class R2, Class R3 and Class R6 shares are offered at NAV and are not subject to a sales charge. Depending upon eligibility, Class B shares convert to either Class A or Investor Class shares at the end of the calendar quarter eight years after the date they were purchased. Additionally, as disclosed in the Fund’s prospectus, Class A shares may convert automatically to Investor Class shares and Investor Class shares may convert automatically to Class A shares. Under certain circumstances and as may be permitted by the Trust’s multiple class plan pursuant to Rule 18f-3 under the 1940 Act, specified share classes of the Fund may be converted to one or more other share classes of the Fund as disclosed in the capital share transactions within these Notes. The classes of shares have the same voting (except for issues that relate solely to one class), dividend, liquidation and other rights, and the same terms and conditions, except that under distribution plans pursuant to Rule 12b-1 under the 1940 Act, Class B and Class C shares are subject to higher distribution and/or service fees than Class A, Investor Class, Class T, Class R2 and Class R3 shares. Class I, Class R1 and Class R6 shares are not subject to a distribution and/or service fee. Class R1, Class R2 and Class R3 shares are subject to a shareholder service fee, which is in addition to fees paid under the distribution plans for Class R2 and Class R3 shares.
The Fund’s investment objective is to seek long-term growth of capital.
Note 2–Significant Accounting Policies
The Fund is an investment company and accordingly follows the investment company accounting and reporting guidance of the Financial Accounting Standards Board (“FASB”) Accounting Standard Codification Topic 946 Financial Services—Investment Companies. The Fund prepares its financial statements in accordance with generally accepted accounting principles (“GAAP”) in the United States of America and follows the significant accounting policies described below.
(A) Securities Valuation. Investments are usually valued as of the close of regular trading on the New York Stock Exchange (the “Exchange”) (usually 4:00 p.m. Eastern time) on each day the Fund is open for business (“valuation date”).
The Board of Trustees of the Trust (the “Board”) adopted procedures establishing methodologies for the valuation of the Fund’s securities and other assets and delegated the responsibility for valuation determinations under those procedures to the Valuation Committee of the Trust (the “Valuation Committee”). The Board authorized the Valuation Committee to appoint a Valuation Subcommittee (the “Subcommittee”) to deal in the first instance with establishing the prices of securities for which market quotations are not readily available or the prices of which are not otherwise readily determinable under these procedures. The Subcommittee meets (in person, via electronic mail or via teleconference) on an as-needed basis. Subsequently, the Valuation Committee meets to ensure that actions taken by the Subcommittee were appropriate. The procedures state that, subject to the oversight of the Board and unless otherwise noted, the responsibility for the day-to-day valuation of portfolio assets (including fair value measurements for the Fund’s assets and liabilities) rests with New York Life Investment Management LLC (“New York Life Investments” or the “Manager”), aided to whatever extent necessary by the Subadvisor (as defined in Note 3(A)).
Notes to Financial Statements (continued)
To assess the appropriateness of security valuations, the Manager, the Subadvisor or the Fund’s third-party service provider, who is subject to oversight by the Manager, regularly compares prior day prices, prices on comparable securities and the sale prices to the prior and current day prices and challenges prices with changes exceeding certain tolerance levels with third-party pricing services or broker sources. For those securities valued through either a standardized fair valuation methodology or a fair valuation measurement, the Subcommittee deals in the first instance with such valuation and the Valuation Committee reviews and affirms, if appropriate, the reasonableness of the valuation based on such methodologies and measurements on a regular basis after considering information that is reasonably available and deemed relevant by the Valuation Committee. Any action taken by the Subcommittee with respect to the valuation of a portfolio security or other asset is submitted for review and ratification (if appropriate) to the Valuation Committee and the Board at the next regularly scheduled meeting.
“Fair value” is defined as the price the Fund would reasonably expect to receive upon selling an asset or liability in an orderly transaction to an independent buyer in the principal or most advantageous market for the asset or liability. Fair value measurements are determined within a framework that establishes a three-tier hierarchy which maximizes the use of observable market data and minimizes the use of unobservable inputs to establish a classification of fair value measurements for disclosure purposes. “Inputs” refer broadly to the assumptions that market participants would use in pricing the asset or liability, including assumptions about risk, such as the risk inherent in a particular valuation technique used to measure fair value using a pricing model and/or the risk inherent in the inputs for the valuation technique. Inputs may be observable or unobservable. Observable inputs reflect the assumptions market participants would use in pricing the asset or liability based on market data obtained from sources independent of the Fund. Unobservable inputs reflect the Fund’s own assumptions about the assumptions market participants would use in pricing the asset or liability based on the information available. The inputs or methodology used for valuing assets or liabilities may not be an indication of the risks associated with investing in those assets or liabilities. The three-tier hierarchy of inputs is summarized below.
| • | | Level 1—quoted prices in active markets for an identical asset or liability |
| • | | Level 2—other significant observable inputs (including quoted prices for a similar asset or liability in active markets, interest rates and yield curves, prepayment speeds, credit risk, etc.) |
| • | | Level 3—significant unobservable inputs (including the Fund’s own assumptions about the assumptions that market participants would use in measuring fair value of an asset or liability) |
The level of an asset or liability within the fair value hierarchy is based on the lowest level of an input, both individually and in the aggregate, that is significant to the fair value measurement. As of October 31, 2017, the aggregate value by input level of the Fund’s assets and liabilities is included at the end of the Fund’s Portfolio of Investments.
The Fund may use third-party vendor evaluations, whose prices may be derived from one or more of the following standard inputs, among others:
| | |
• Broker/dealer quotes | | • Benchmark securities |
• Two-sided markets | | • Reference data (corporate actions or material event notices) |
• Bids/offers | | • Monthly payment information |
• Industry and economic events | | • Reported trades |
An asset or liability for which market values cannot be measured using the methodologies described above is valued by methods deemed reasonable in good faith by the Valuation Committee, following the procedures established by the Board, to represent fair value. Under these procedures, the Fund generally uses a market-based approach which may use related or comparable assets or liabilities, recent transactions, market multiples, book values and other relevant information. The Fund may also use an income-based valuation approach in which the anticipated future cash flows of the asset or liability are discounted to calculate fair value. Discounts may also be applied due to the nature and/or duration of any restrictions on the disposition of the asset or liability. Fair value represents a good faith approximation of the value of a security. Fair value determinations involve the consideration of a number of subjective factors, an analysis of applicable facts and circumstances and the exercise of judgment. As a result, it is possible that the fair value for a security determined in good faith in accordance with the Fund’s valuation procedures may differ from valuations for the same security determined by other funds using their own valuation procedures. Although the Fund’s valuation procedures are designed to value a security at the price the Fund may reasonably expect to receive upon the security’s sale in an orderly transaction, there can be no assurance that any fair value determination thereunder would, in fact, approximate the amount that the Fund would actually realize upon the sale of the security or the price at which the security would trade if a reliable market price were readily available. During the year ended October 31, 2017, there were no material changes to the fair value methodologies.
Securities which may be valued in this manner include, but are not limited to: (i) a security for which trading has been halted or suspended; (ii) a debt security that has recently gone into default and for which there is not a current market quotation; (iii) a security of an issuer that has entered into a restructuring; (iv) a security that has been de-listed from a national exchange; (v) a security for which the market price is not readily available from a third-party pricing source or, if so provided, does not, in the opinion of the Manager or Subadvisor, reflect the security’s market value; (vi) a security subject to trading collars for which no or limited trading takes place; and (vii) a security whose principal market has been temporarily closed at a time when, under normal conditions, it would be open. Securities for which market quotations or observable inputs are not readily available are generally categorized as Level 3 in the hierarchy. As of October 31, 2017, there were no securities held by the Fund that were fair valued in such a manner.
Equity securities are valued at the last quoted sales prices as of the close of regular trading on the relevant exchange on each valuation date. Securities that are not traded on the valuation date are valued at the mean of the last quoted bid and ask prices. Prices are normally
| | |
| 22 | | MainStay Large Cap Growth Fund |
taken from the principal market in which each security trades. These securities are generally categorized as Level 1 in the hierarchy.
Temporary cash investments acquired in excess of 60 days to maturity at the time of purchase are valued using the latest bid prices or using valuations based on a matrix system (which considers such factors as security prices, yields, maturities and ratings), both as furnished by independent pricing services. Other temporary cash investments which mature in 60 days or less at the time of purchase (“Short-Term Investments”) are valued using the amortized cost method of valuation, unless the use of such method would be inappropriate. The amortized cost method involves valuing a security at its cost on the date of purchase and thereafter assuming a constant amortization to maturity of the difference between such cost and the value on maturity date. Amortized cost approximates the current fair value of a security. Securities valued using the amortized cost method are not valued using quoted prices in an active market and are generally categorized as Level 2 in the hierarchy.
The information above is not intended to reflect an exhaustive list of the methodologies that may be used to value portfolio investments. The valuation procedures permit the use of a variety of valuation methodologies in connection with valuing portfolio investments. The methodology used for a specific type of investment may vary based on the market data available or other considerations. The methodologies summarized above may not represent the specific means by which portfolio investments are valued on any particular business day.
(B) Income Taxes. The Fund’s policy is to comply with the requirements of the Internal Revenue Code of 1986, as amended (the “Internal Revenue Code”), applicable to regulated investment companies and to distribute all of its taxable income to the shareholders of the Fund within the allowable time limits. Therefore, no federal, state and local income tax provisions are required.
Management evaluates the Fund’s tax positions to determine if the tax positions taken meet the minimum recognition threshold in connection with accounting for uncertainties in income tax positions taken or expected to be taken for the purposes of measuring and recognizing tax liabilities in the financial statements. Recognition of tax benefits of an uncertain tax position is permitted only to the extent the position is “more likely than not” to be sustained assuming examination by taxing authorities. Management has analyzed the Fund’s tax positions taken on federal, state and local income tax returns for all open tax years (for up to three tax years) and has concluded that no provisions for federal, state and local income tax are required in the Fund’s financial statements. The Fund’s federal, state and local income tax and federal excise tax returns for tax years for which the applicable statutes of limitations have not expired are subject to examination by the Internal Revenue Service and state and local departments of revenue.
(C) Dividends and Distributions to Shareholders. Dividends and distributions are recorded on the ex-dividend date. The Fund intends to declare and pay dividends from net investment income and distributions from net realized capital and currency gains, if any, at least annually. Unless the shareholder elects otherwise, all dividends and distributions are reinvested in the same class of shares of the Fund, at NAV. Dividends and distributions to shareholders are determined in
accordance with federal income tax regulations and may differ from determinations using GAAP.
(D) Security Transactions and Investment Income. The Fund records security transactions on the trade date. Realized gains and losses on security transactions are determined using the identified cost method. Dividend income is recognized on the ex-dividend date, net of any foreign tax withheld at the source, and interest income is accrued as earned using the effective interest rate method. Discounts and premiums on Short-Term Investments are accreted and amortized, respectively, on the straight-line method. The straight-line method approximates the effective interest method for Short-Term Investments.
Investment income and realized and unrealized gains and losses on investments of the Fund are allocated pro rata to separate classes of shares based upon their relative net assets on the date the income is earned or realized and unrealized gains and losses are incurred.
(E) Expenses. Expenses of the Trust are allocated to the individual Funds in proportion to the net assets of the respective Funds when the expenses are incurred, except where direct allocations of expenses can be made. Expenses (other than transfer agent expenses and fees incurred under the shareholder services plans and/or the distribution plans further discussed in Note 3(B)) are allocated to separate classes of shares pro rata based upon their relative net assets on the date the expenses are incurred. The expenses borne by the Fund, including those of related parties to the Fund, are shown in the Statement of Operations.
(F) Use of Estimates. In preparing financial statements in conformity with GAAP, management makes estimates and assumptions that affect the reported amounts and disclosures in the financial statements. Actual results could differ from those estimates.
(G) Repurchase Agreements. The Fund may enter into repurchase agreements (i.e., buy a security from another party with the agreement that it be sold back in the future) to earn income. The Fund may enter into repurchase agreements only with counterparties, usually financial institutions, that are deemed by the Manager or Subadvisor to be creditworthy, pursuant to guidelines established by the Board. During the term of any repurchase agreement, the Manager or Subadvisor will continue to monitor the creditworthiness of the counterparty. Under the 1940 Act, repurchase agreements are considered to be collateralized loans by the Fund to the counterparty secured by the securities transferred to the Fund.
Repurchase agreements are subject to counterparty risk, meaning the Fund could lose money by the counterparty’s failure to perform under the terms of the agreement. The Fund mitigates this risk by ensuring the repurchase agreement is collateralized by cash, U.S. government securities, fixed income securities and/or other securities. The collateral is held by the Fund’s custodian and valued daily on a mark to market basis to determine if the value, including accrued interest, exceeds the repurchase price. In the event of the counterparty’s default on the obligation to repurchase, the Fund has the right to liquidate the collateral and apply the proceeds in satisfaction of the obligation. Under certain circumstances, such as in the event of default or bankruptcy by the counterparty, realization and/or retention of the collateral may be limited or subject to delay, to legal proceedings and possible realized loss to the Fund.
Notes to Financial Statements (continued)
(H) Securities Lending. In order to realize additional income, the Fund may engage in securities lending, subject to the limitations set forth in the 1940 Act and relevant guidance by the staff of the Securities and Exchange Commission (“SEC”). In the event the Fund does engage in securities lending, the Fund will lend through its custodian, State Street Bank and Trust Company (“State Street”). State Street will manage the Fund’s collateral in accordance with the lending agreement between the Fund and State Street, and indemnify the Fund against counterparty risk. The loans will be collateralized by U.S. Treasury securities at least equal at all times to the market value of the securities loaned. The Fund may bear the risk of delay in recovery of, or loss of rights in, the securities loaned should the borrower of the securities experience financial difficulty. The Fund may also record a realized gain or loss on securities deemed sold due to a borrower’s inability to return securities on loan. The Fund bears the risk of any loss on investment of the collateral. The Fund will receive compensation for lending its securities in the form of fees or it will retain a portion of interest on the investment of any cash received as collateral. The Fund will also continue to receive interest and dividends on the securities loaned and any gain or loss in the market price of the securities loaned that may occur during the term of the loan will be for the account of the Fund. During the year ended October 31, 2017, the Fund did not have any portfolio securities on loan.
(I) Indemnifications. Under the Trust’s organizational documents, its officers and trustees are indemnified against certain liabilities that may arise out of performance of their duties to the Trust. Additionally, in the normal course of business, the Fund enters into contracts with third-party service providers that contain a variety of representations and warranties and which may provide general indemnifications. The Fund’s maximum exposure under these arrangements is unknown, as this would involve future claims that may be made against the Fund that have not yet occurred. Based on experience, management is of the view that the risk of loss in connection with these potential indemnification obligations is remote. However, there can be no assurance that material liabilities related to such obligations will not arise in the future, which could adversely impact the Fund.
Note 3–Fees and Related Party Transactions
(A) Manager and Subadvisor. New York Life Investments, a registered investment adviser and an indirect, wholly-owned subsidiary of New York Life Insurance Company (“New York Life”), serves as the Fund’s Manager, pursuant to an Amended and Restated Management Agreement (“Management Agreement”). The Manager provides offices, conducts clerical, recordkeeping and bookkeeping services and keeps most of the financial and accounting records required to be maintained by the Fund. Except for the portion of salaries and expenses that are the responsibility of the Fund, the Manager pays the salaries and expenses of all personnel affiliated with the Fund and certain operational expenses of the Fund. The Fund reimburses New York Life Investments in an amount equal to a portion of the compensation of the Chief Compliance Officer attributable to the Fund. Winslow Capital Management, LLC. (“Winslow” or “Subadvisor”), a registered investment adviser, serves as Subadvisor to the Fund and is responsible for the day-to-day portfolio management of the Fund. Pursuant to the terms of a Subadvisory Agreement (“Subadvisory Agreement”) between New York Life
Investments and Winslow, New York Life Investments pays for the services of the Subadvisor.
Under the Management Agreement, the Fund pays the Manager a monthly fee for the services performed and the facilities furnished at an annual rate of the Fund’s average daily net assets as follows: 0.75% up to $500 million; 0.725% from $500 million to $750 million; 0.71% from $750 million to $1 billion; 0.70% from $1 billion to $2 billion; 0.66% from $2 billion to $3 billion; 0.61% from $3 billion to $7 billion; 0.585% from $7 billion to $9 billion; and 0.575% in excess of $9 billion. New York Life Investments has contractually agreed to waive a portion of its management fee so that the management fee does not exceed 0.55% of the Fund’s average daily net assets from $11 billion to $13 billion; and 0.525% of the Fund’s average daily net assets over $13 billion. This agreement will remain in effect until February 28, 2018, and shall renew automatically for one-year terms unless New York Life Investments provides written notice of termination prior to the start of the next term or upon approval by the Board.
New York Life Investments has contractually agreed to waive fees and/or reimburse expenses of Class I shares so that Total Annual Fund Operating Expenses (excluding taxes, interest, litigation, extraordinary expenses, brokerage and other transaction expenses relating to the purchase and sale of portfolio investments, and acquired (underlying) fund fees and expenses) of Class I shares do not exceed 0.88% of the Fund’s average daily net assets. This agreement will remain in effect until February 28, 2018, and shall renew automatically for one-year terms unless New York Life Investments provides written notice of termination prior to the start of the next term or upon approval of the Board.
Additionally, New York Life Investments has agreed to further voluntarily waive fees and/or reimburse the expenses of Class R1 shares so that Total Annual Fund Operating Expenses (excluding taxes, interest, litigation, extraordinary expenses, brokerage and other transaction expenses relating to the purchase and sale of portfolio investments, and acquired (underlying) fund fees and expenses) do not exceed 0.95% of its average daily net assets. This voluntary waiver or reimbursement may be discontinued at any time without notice.
During the year ended October 31, 2017, the effective management fee rate was 0.62%, exclusive of any applicable waivers/reimbursements.
During the year ended October 31, 2017, New York Life Investments earned fees from the Fund in the amount of $78,797,184 and waived its fees and/or reimbursed expenses in the amount of $484,857.
State Street provides sub-administration and sub-accounting services to the Fund pursuant to an agreement with New York Life Investments. These services include calculating the daily NAVs of the Fund, maintaining the general ledger and sub-ledger accounts for the calculation of the Fund’s NAVs and assisting New York Life Investments in conducting various aspects of the Fund’s administrative operations. For providing these services to the Fund, State Street is compensated by New York Life Investments.
(B) Distribution, Service and Shareholder Service Fees. The Trust, on behalf of the Fund, has entered into a distribution agreement with NYLIFE Distributors LLC (the “Distributor”), an indirect, wholly-owned subsidiary of New York Life. The Fund has adopted distribution
| | |
| 24 | | MainStay Large Cap Growth Fund |
plans (the “Plans”) in accordance with the provisions of Rule 12b-1 under the 1940 Act.
Pursuant to the Class A, Investor Class, Class T and Class R2 Plans, the Distributor receives a monthly distribution fee from the Class A, Investor Class, Class T and Class R2 shares at an annual rate of 0.25% of the average daily net assets of the Class A, Investor Class, Class T and Class R2 shares for distribution and/or service activities as designated by the Distributor. Pursuant to the Class B and Class C Plans, Class B and Class C shares pay the Distributor a monthly distribution fee at an annual rate of 0.75% of the average daily net assets of the Class B and Class C shares, along with a service fee at an annual rate of 0.25% of the average daily net assets of the Class B and Class C shares, for a total 12b-1 fee of 1.00%. Pursuant to the Class R3 Plan, the Distributor receives a monthly distribution and/or service fee from the Class R3 shares at an annual rate of 0.50% of the average daily net assets of the Class R3 shares. Class I, Class R1 and Class R6 shares are not subject to a distribution and/or service fee.
The Plans provide that the distribution and service fees are payable to the Distributor regardless of the amounts actually expended by the Distributor for distribution of the Fund’s shares and service activities.
In accordance with the Shareholder Services Plans for the Class R1, Class R2 and Class R3 shares, the Manager has agreed to provide, through its affiliates or independent third parties, various shareholder and administrative support services to shareholders of the Class R1, Class R2 and Class R3 shares. For its services, the Manager, its affiliates or independent third-party service providers are entitled to a shareholder service fee accrued daily and paid monthly at an annual rate of 0.10% of the average daily net assets of the Class R1, Class R2 and Class R3 shares. This is in addition to any fees paid under the Class R2 and Class R3 Plans.
During the year ended October 31, 2017, shareholder service fees incurred by the Fund were as follows:
| | | | |
Class R1 | | $ | 1,621,321 | |
Class R2 | | | 328,578 | |
Class R3 | | | 80,006 | |
(C) Sales Charges. During the year ended October 31, 2017, the Fund was advised by the Distributor that the amount of initial sales charges retained on sales of Class A and Investor Class shares were $68,485 and $47,848, respectively.
During the year ended October 31, 2017, the Fund was also advised that the Distributor retained CDSCs on redemptions of Class A, Investor Class, Class B and Class C shares of $16,310, $187, $62,152 and $11,281, respectively.
(D) Transfer, Dividend Disbursing and Shareholder Servicing Agent. NYLIM Service Company LLC, an affiliate of New York Life Investments, is the Fund’s transfer, dividend disbursing and shareholder servicing agent pursuant to an agreement between NYLIM Service Company LLC and the Trust. NYLIM Service Company LLC has entered into an agreement with Boston Financial Data Services, Inc. (“BFDS”) pursuant to which BFDS performs certain transfer agent services on behalf of NYLIM Service Company LLC. During the year ended
October 31, 2017, transfer agent expenses incurred by the Fund were as follows:
| | | | |
Class A | | $ | 1,010,501 | |
Investor Class | | | 303,378 | |
Class B | | | 63,752 | |
Class C | | | 477,544 | |
Class I | | | 9,042,854 | |
Class R1 | | | 1,923,934 | |
Class R2 | | | 393,242 | |
Class R3 | | | 94,993 | |
(E) Small Account Fee. Shareholders with small accounts adversely impact the cost of providing transfer agency services. In an effort to reduce total transfer agency expenses, the Fund has implemented a small account fee on certain types of accounts. Certain shareholders with an account balance of less than $1,000 are charged an annual per account fee of $20 (assessed semi-annually), the proceeds from which offset transfer agent fees as reflected in the Statement of Operations.
Note 4–Federal Income Tax
As of October 31, 2017, the cost and unrealized appreciation (depreciation) of the Fund’s investment portfolio, including applicable derivative contracts and other financial instruments, as determined on a federal income tax basis, were as follows:
| | | | | | | | |
| | | Federal
Tax Cost | | Gross
Unrealized
Appreciation | | Gross
Unrealized
Depreciation | | Net
Unrealized
Appreciation/
(Depreciation) |
Investments in
Securities | | $7,003,940,849 | | $5,196,524,427 | | $(48,940,670) | | $5,147,583,757 |
As of October 31, 2017, the components of accumulated gain (loss) on a tax basis were as follows:
| | | | | | | | |
Ordinary
Income | | Accumulated
Capital and Other Gain (Loss) | | Other
Temporary
Differences | | Unrealized
Appreciation
(Depreciation) | | Total
Accumulated Gain (Loss) |
| $205,318,562 | | $1,508,549,082 | | $— | | $5,147,583,757 | | $6,861,451,401 |
The difference between book-basis and tax-basis unrealized appreciation (depreciation) is primarily due to wash sale adjustments.
The following table discloses the current year reclassifications between undistributed net investment income (loss), accumulated net realized gain (loss) on investments, and additional paid-in capital arising from permanent differences; net assets as of October 31, 2017 were not affected.
| | | | | | | | |
Undistributed Net Investment Income (Loss) | | Accumulated Net Realized Gain (Loss) on Investments | | | Additional Paid-In Capital | |
| $223,223 | | $ | (402,580,480 | ) | | $ | 402,357,257 | |
Notes to Financial Statements (continued)
The reclassifications for the Fund are primarily due to equalization.
During the years ended October 31, 2017 and October 31, 2016, the tax character of distributions paid as reflected in the Statements of Changes in Net Assets was as follows:
| | | | | | | | |
| | | 2017 | | | 2016 | |
Distributions paid from: | | | | | | | | |
Long-Term Capital Gain | | $ | 1,526,320,296 | | | $ | 2,061,778,330 | |
Note 5–Custodian
State Street is the custodian of cash and securities held by the Fund. Custodial fees are charged to the Fund based on the Fund’s net assets and/or the market value of securities held by the Fund and the number of certain transactions incurred by the Fund.
Note 6–Line of Credit
The Fund and certain other funds managed by New York Life Investments, maintain a line of credit with a syndicate of banks in order to secure a source of funds for temporary purposes to meet unanticipated or excessive redemption requests.
Effective August 1, 2017, under the credit agreement (the “Credit Agreement”), the aggregate commitment amount is $600,000,000 with an additional uncommitted amount of $100,000,000. The commitment fee is an annual rate of 0.15% of the average commitment amount payable quarterly, regardless of usage, to State Street, who serves as the agent to the syndicate. The commitment fee is allocated among the Fund and certain other funds managed by New York Life Investments based upon their respective net assets and other factors. Interest on any revolving credit loan is charged based upon the Federal Funds Rate or the one-month LIBOR, whichever is higher. The Credit Agreement expires on July 31, 2018, although the Fund, certain other funds managed by New York Life Investments and the syndicate of banks may renew the Credit Agreement for an additional year on the same or different terms. Prior to August 1, 2017, the aggregate commitment amount and commitment fee of the previous credit agreement were the same as those under the Credit Agreement, but Bank of New York Mellon served as agent to the syndicate. During the year ended October 31, 2017, there were no borrowings made or outstanding with respect to the Fund under the Credit Agreement or the credit agreement for which Bank of New York Mellon served as agent.
Note 7–Interfund Lending Program
Pursuant to an exemptive order issued by the SEC, the Fund, along with certain other funds managed by New York Life Investments, may participate in an interfund lending program. The interfund lending program provides an alternative credit facility that permits the Fund and certain other funds managed by New York Life Investments to lend or borrow money for temporary purposes directly to or from one another subject to the conditions of the exemptive order. During the year ended October 31, 2017, there were no interfund loans made or outstanding with respect to the Fund.
Note 8–Purchases and Sales of Securities (in 000’s)
During the year ended October 31, 2017, purchases and sales of securities, other than short-term securities, were $7,672,420 and $12,798,677, respectively.
Note 9–Capital Share Transactions
| | | | | | | | |
Class A | | Shares | | | Amount | |
Year ended October 31, 2017: | | | | | | | | |
Shares sold | | | 15,446,601 | | | $ | 140,733,350 | |
Shares issued to shareholders in reinvestment of dividends and distributions | | | 10,359,228 | | | | 83,081,012 | |
Shares redeemed | | | (36,765,480 | ) | | | (333,076,055 | ) |
| | | | |
Net increase (decrease) in shares outstanding before conversion | | | (10,959,651 | ) | | | (109,261,693 | ) |
Shares converted into Class A
(See Note 1) | | | 7,863,468 | | | | 78,150,962 | |
Shares converted from Class A (See Note 1) | | | (882,285 | ) | | | (7,803,931 | ) |
| | | | |
Net increase (decrease) | | | (3,978,468 | ) | | $ | (38,914,662 | ) |
| | | | |
Year ended October 31, 2016: | | | | | | | | |
Shares sold | | | 19,646,050 | | | $ | 180,253,666 | |
Shares issued to shareholders in reinvestment of dividends and distributions | | | 13,179,543 | | | | 123,228,727 | |
Shares redeemed | | | (49,582,926 | ) | | | (450,652,369 | ) |
| | | | |
Net increase (decrease) in shares outstanding before conversion | | | (16,757,333 | ) | | | (147,169,976 | ) |
Shares converted into Class A (See Note 1) | | | 912,123 | | | | 8,373,746 | |
Shares converted from Class A
(See Note 1) | | | (540,607 | ) | | | (4,964,348 | ) |
| | | | |
Net increase (decrease) | | | (16,385,817 | ) | | $ | (143,760,578 | ) |
| | | | |
| | |
| | | | | | | | |
| | |
| 26 | | MainStay Large Cap Growth Fund |
| | | | | | | | |
Investor Class | | Shares | | | Amount | |
Year ended October 31, 2017: | | | | | | | | |
Shares sold | | | 1,884,557 | | | $ | 17,119,999 | |
Shares issued to shareholders in reinvestment of dividends and distributions | | | 2,417,746 | | | | 19,196,902 | |
Shares redeemed | | | (5,070,285 | ) | | | (45,794,027 | ) |
| | | | |
Net increase (decrease) in shares outstanding before conversion | | | (767,982 | ) | | | (9,477,126 | ) |
Shares converted into Investor Class
(See Note 1) | | | 612,058 | | | | 5,503,551 | |
Shares converted from Investor Class (See Note 1) | | | (7,793,359 | ) | | | (76,793,949 | ) |
| | | | |
Net increase (decrease) | | | (7,949,283 | ) | | $ | (80,767,524 | ) |
| | | | |
Year ended October 31, 2016: | | | | | | | | |
Shares sold | | | 3,054,848 | | | $ | 29,040,842 | |
Shares issued to shareholders in reinvestment of dividends and distributions | | | 2,443,289 | | | | 22,671,507 | |
Shares redeemed | | | (3,993,991 | ) | | | (36,160,957 | ) |
| | | | |
Net increase (decrease) in shares outstanding before conversion | | | 1,504,146 | | | | 15,551,392 | |
Shares converted into Investor Class
(See Note 1) | | | 729,663 | | | | 6,486,575 | |
Shares converted from Investor Class (See Note 1) | | | (775,431 | ) | | | (7,037,036 | ) |
| | | | |
Net increase (decrease) | | | 1,458,378 | | | $ | 15,000,931 | |
| | | | |
| | |
| | | | | | | | |
Class B | | Shares | | | Amount | |
Year ended October 31, 2017: | | | | | | | | |
Shares sold | | | 371,089 | | | $ | 2,812,224 | |
Shares issued to shareholders in reinvestment of dividends and distributions | | | 610,879 | | | | 4,251,717 | |
Shares redeemed | | | (1,218,915 | ) | | | (9,643,234 | ) |
| | | | |
Net increase (decrease) in shares outstanding before conversion | | | (236,947 | ) | | | (2,579,293 | ) |
Shares converted from Class B (See Note 1) | | | (727,212 | ) | | | (5,746,670 | ) |
| | | | |
Net increase (decrease) | | | (964,159 | ) | | $ | (8,325,963 | ) |
| | | | |
Year ended October 31, 2016: | | | | | | | | |
Shares sold | | | 890,898 | | | $ | 7,233,362 | |
Shares issued to shareholders in reinvestment of dividends and distributions | | | 659,856 | | | | 5,503,197 | |
Shares redeemed | | | (1,331,450 | ) | | | (10,681,689 | ) |
| | | | |
Net increase (decrease) in shares outstanding before conversion | | | 219,304 | | | | 2,054,870 | |
Shares converted from Class B (See Note 1) | | | (655,437 | ) | | | (5,255,731 | ) |
| | | | |
Net increase (decrease) | | | (436,133 | ) | | $ | (3,200,861 | ) |
| | | | |
| | |
| | | | | | | | |
| | | | | | | | |
Class C | | Shares | | | Amount | |
Year ended October 31, 2017: | | | | | | | | |
Shares sold | | | 4,144,043 | | | $ | 30,206,204 | |
Shares issued to shareholders in reinvestment of dividends and distributions | | | 2,605,366 | | | | 18,107,292 | |
Shares redeemed | | | (18,993,151 | ) | | | (148,598,246 | ) |
| | | | |
Net increase (decrease) in shares outstanding before conversion | | | (12,243,742 | ) | | | (100,284,750 | ) |
| | | | |
Net increase (decrease) | | | (12,243,742 | ) | | $ | (100,284,750 | ) |
| | | | |
Year ended October 31, 2016: | | | | | | | | |
Shares sold | | | 6,466,704 | | | | $53,327,639 | |
Shares issued to shareholders in reinvestment of dividends and distributions | | | 3,001,163 | | | | 24,969,681 | |
Shares redeemed | | | (13,880,349 | ) | | | (112,066,791 | ) |
| | | | |
Net increase (decrease) in shares outstanding before conversion | | | (4,412,482 | ) | | | (33,769,471 | ) |
Shares converted from Class C
(See Note 1) | | | (19,380 | ) | | | (187,794 | ) |
| | | | |
Net increase (decrease) | | | (4,431,862 | ) | | $ | (33,957,265 | ) |
| | | | |
| | |
| | | | | | | | |
Class I | | Shares | | | Amount | |
Year ended October 31, 2017: | | | | | | | | |
Shares sold | | | 144,324,904 | | | $ | 1,375,970,528 | |
Shares issued to shareholders in reinvestment of dividends and distributions | | | 83,715,425 | | | | 711,581,117 | |
Shares redeemed | | | (548,671,760 | ) | | | (5,264,114,395 | ) |
| | | | |
Net increase (decrease) in shares outstanding before conversion | | | (320,631,431 | ) | | | (3,176,562,750 | ) |
Shares converted into Class I
(See Note 1) | | | 723,030 | | | | 6,750,849 | |
Shares converted from Class I (See Note 1) | | | (1,561,675 | ) | | | (13,815,350 | ) |
| | | | |
Net increase (decrease) | | | (321,470,076 | ) | | $ | (3,183,627,251 | ) |
| | | | |
Year ended October 31, 2016: | | | | | | | | |
Shares sold | | | 191,040,579 | | | $ | 1,819,498,431 | |
Shares issued to shareholders in reinvestment of dividends and distributions | | | 101,900,227 | | | | 1,000,660,228 | |
Shares redeemed | | | (448,840,581 | ) | | | (4,303,660,859 | ) |
| | | | |
Net increase (decrease) in shares outstanding before conversion | | | (155,899,775 | ) | | | (1,483,502,200 | ) |
Shares converted into Class I
(See Note 1) | | | 59,930 | | | | 575,114 | |
Shares converted from Class I
(See Note 1) | | | (1,499,308 | ) | | | (14,935,248 | ) |
| | | | |
Net increase (decrease) | | | (157,339,153 | ) | | $ | (1,497,862,334 | ) |
| | | | |
Notes to Financial Statements (continued)
| | | | | | | | |
Class R1 | | Shares | | | Amount | |
Year ended October 31, 2017: | | | | | | | | |
Shares sold | | | 16,132,262 | | | $ | 153,665,919 | |
Shares issued to shareholders in reinvestment of dividends and distributions | | | 21,611,091 | | | | 180,020,387 | |
Shares redeemed | | | (62,925,774) | | | | (603,693,599) | |
| | | | |
Net increase (decrease) | | | (25,182,421) | | | $ | (270,007,293 | ) |
| | | | |
Year ended October 31, 2016: | | | | | | | | |
Shares sold | | | 39,644,707 | | | $ | 393,845,632 | |
Shares issued to shareholders in reinvestment of dividends and distributions | | | 25,181,545 | | | | 243,253,726 | |
Shares redeemed | | | (69,843,936) | | | | (657,384,425) | |
| | | | | | | | |
Net increase (decrease) in shares outstanding before conversion | | | (5,017,684) | | | | (20,285,067) | |
Shares converted from Class R1 (See Note 1) | | | (28,360) | | | | (272,130) | |
| | | | | | | | |
Net increase (decrease) | | | (5,046,044) | | | $ | (20,557,197 | ) |
| | | | | | | | |
| | |
| | | | | | | | |
Class R2 | | Shares | | | Amount | |
Year ended October 31, 2017: | | | | | | | | |
Shares sold | | | 7,846,870 | | | $ | 69,445,168 | |
Shares issued to shareholders in reinvestment of dividends and distributions | | | 3,348,441 | | | | 26,787,527 | |
Shares redeemed | | | (24,664,053) | | | | (220,343,413) | |
| | | | | | | | |
Net increase (decrease) in shares outstanding before conversion | | | (13,468,742) | | | | (124,110,718) | |
Shares converted from Class R2 (See Note 1) | | | (97,467) | | | | (792,409) | |
| | | | | | | | |
Net increase (decrease) | | | (13,566,209) | | | $ | (124,903,127 | ) |
| | | | | | | | |
Year ended October 31, 2016: | | | | | | | | |
Shares sold | | | 12,411,385 | | | $ | 113,556,899 | |
Shares issued to shareholders in reinvestment of dividends and distributions | | | 5,403,725 | | | | 50,524,831 | |
Shares redeemed | | | (38,220,678) | | | | (350,766,615) | |
| | | | | | | | |
Net increase (decrease) in shares outstanding before conversion | | | (20,405,568) | | | | (186,684,885) | |
Shares converted from Class R2 (See Note 1) | | | (1,720) | | | | (18,555) | |
| | | | | | | | |
Net increase (decrease) | | | (20,407,288) | | | | $(186,703,440) | |
| | | | | | | | |
| | |
| | | | | | | | |
| | | | | | | | |
Class R3 | | Shares | | | Amount | |
Year ended October 31, 2017: | | | | | | | | |
Shares sold | | | 1,561,683 | | | $ | 13,649,413 | |
Shares issued to shareholders in reinvestment of dividends and distributions | | | 1,215,950 | | | | 9,362,814 | |
Shares redeemed | | | (4,725,243) | | | | (40,638,685) | |
| | | | |
Net increase (decrease) | | | (1,947,610) | | | $ | (17,626,458 | ) |
| | | | |
Year ended October 31, 2016: | | | | | | | | |
Shares sold | | | 1,933,053 | | | $ | 16,989,537 | |
Shares issued to shareholders in reinvestment of dividends and distributions | | | 1,377,717 | | | | 12,468,332 | |
Shares redeemed | | | (4,449,259) | | | | (39,154,792) | |
| | | | | | | | |
Net increase (decrease) in shares outstanding before conversion | | | (1,138,489) | | | | (9,696,923) | |
Shares converted from Class R3
(See Note 1) | | | (8,312) | | | | (73,440) | |
| | | | | | | | |
Net increase (decrease) | | | (1,146,801) | | | $ | (9,770,363 | ) |
| | | | | | | | |
| | |
| | | | | | | | |
Class R6 | | Shares | | | Amount | |
Year ended October 31, 2017: | | | | | | | | |
Shares sold | | | 61,869,744 | | | $ | 595,622,627 | |
Shares issued to shareholders in reinvestment of dividends and distributions | | | 20,979,877 | | | | 179,168,150 | |
Shares redeemed | | | (68,492,947) | | | | (677,970,870) | |
| | | | | | | | |
Net increase (decrease) in shares outstanding before conversion | | | 14,356,674 | | | | 96,819,907 | |
Shares converted into Class R6
(See Note 1) | | | 1,638,521 | | | | 14,546,947 | |
| | | | | | | | |
Net increase (decrease) | | | 15,995,195 | | | $ | 111,366,854 | |
| | | | | | | | |
Year ended October 31, 2016: | | | | | | | | |
Shares sold | | | 85,459,078 | | | $ | 840,427,765 | |
Shares issued to shareholders in reinvestment of dividends
and distributions | | | 14,978,754 | | | | 147,540,722 | |
Shares redeemed | | | (44,612,772) | | | | (448,875,363) | |
| | | | | | | | |
Net increase (decrease) in shares outstanding before conversion | | | 55,825,060 | | | | 539,093,124 | |
Shares converted into Class R6
(See Note 1) | | | 1,730,198 | | | | 17,308,847 | |
| | | | | | | | |
Net increase (decrease) | | | 57,555,258 | | | $ | 556,401,971 | |
| | | | | | | | |
Note 10–Litigation
On December 23, 2014, Cynthia Ann Redus-Tarchis and others filed a complaint against New York Life Investments in the United States District Court for the District of New Jersey. The complaint was brought derivatively on behalf of the MainStay Large Cap Growth Fund, the MainStay High Yield Corporate Bond Fund and another fund previously managed by New York Life Investments and alleges that New York Life Investments violated Section 36(b) of the 1940 Act by charging excessive investment management fees. The plaintiffs seek monetary damages and other relief from New York Life Investments. New York Life Investments believes the case has no merit, and intends to vigorously defend the matter.
| | |
| 28 | | MainStay Large Cap Growth Fund |
Discovery in the case has been concluded. New York Life Investments filed its motion for summary judgment on December 15, 2017.
Note 11–Subsequent Events
In connection with the preparation of the financial statements of the Fund as of and for the year ended October 31, 2017, events and transactions subsequent to October 31, 2017, through the date the financial statements were issued have been evaluated by the Fund’s management for possible adjustment and/or disclosure. No subsequent events requiring financial statement adjustment or disclosure have been identified.
Report of Independent Registered Public Accounting Firm
The Board of Trustees and Shareholders of
The MainStay Funds:
We have audited the accompanying statement of assets and liabilities, including the portfolio of investments, of MainStay Large Cap Growth Fund (the “Fund”), one of the funds constituting The MainStay Funds, as of October 31, 2017, and the related statement of operations for the year then ended, the statements of changes in net assets for each of the years in the two-year period then ended, and the financial highlights for each of the years or periods in the five-year period then ended. These financial statements and financial highlights are the responsibility of the Fund’s management. Our responsibility is to express an opinion on these financial statements and financial highlights based on our audits.
We conducted our audits in accordance with the standards of the Public Company Accounting Oversight Board (United States). Those standards require that we plan and perform the audit to obtain reasonable assurance about whether the financial statements and financial highlights are free of material misstatement. An audit includes examining, on a test basis, evidence supporting the amounts and disclosures in the financial statements. Our procedures included confirmation of securities owned as of October 31, 2017, by correspondence with the custodian and brokers or by other appropriate auditing procedures where replies from brokers were not received. An audit also includes assessing the accounting principles used and significant estimates made by management, as well as evaluating the overall financial statement presentation. We believe that our audits provide a reasonable basis for our opinion.
In our opinion, the financial statements and financial highlights referred to above present fairly, in all material respects, the financial position of MainStay Large Cap Growth Fund as of October 31, 2017, and the results of its operations for the year then ended, the changes in its net assets for each of the years in the two-year period then ended, and the financial highlights for each of the years or periods in the five-year period then ended, in conformity with U.S. generally accepted accounting principles.

Philadelphia, Pennsylvania
December 21, 2017
| | |
| 30 | | MainStay Large Cap Growth Fund |
Other Matters
(Unaudited)
At a meeting held on June 22, 2017, the Board approved submitting the following proposal (“Proposal”) to shareholders of the Funds at a special meeting held on October 23, 2017 (with any postponements or adjournments, “Special Meeting”):
To elect eight Trustees to the Board
On or about September 28, 2017, shareholders of record of the Funds as of the close of business on August 24, 2017 were sent a proxy statement containing information regarding the Proposal. The proxy statement also included information about the Special Meeting, at which shareholders of the Funds were asked to consider and approve the Proposal. In addition, the proxy statement included information about voting on the Proposal and options shareholders had to do so.
The Special Meeting was held on October 23, 2017, and the Proposal passed.
The results of the Special Meeting (all Funds and classes thereof voting together) were as follows:
Proposal—To elect eight Trustees to the Board:
Yie-Hsin Hung:
| | | | |
Votes For | | Votes
Witheld | | Total |
| 2,644,056,263.750 | | 21,799,781.292 | | 2,665,856,045.042 |
David H. Chow:
| | | | |
Votes For | | Votes
Witheld | | Total |
| 2,644,576,776.557 | | 21,279,268.485 | | 2,665,856,045.042 |
Susan B. Kerley:
| | | | |
Votes For | | Votes
Witheld | | Total |
| 2,645,459,747.343 | | 20,396,297.699 | | 2,665,856,045.042 |
Alan R. Latshaw:
| | | | |
Votes For | | Votes
Witheld | | Total |
| 2,644,443,039.401 | | 21,413,005.641 | | 2,665,856,045.042 |
Peter Meenan:
| | | | |
Votes For | | Votes
Witheld | | Total |
| 2,640,156,421.578 | | 25,699,623.464 | | 2,665,856,045.042 |
Richard H. Nolan, Jr.:
| | | | |
Votes For | | Votes
Witheld | | Total |
| 2,641,415,514.849 | | 24,440,530.193 | | 2,665,856,045.042 |
Jacques P. Perold:
| | | | |
Votes For | | Votes
Witheld | | Total |
| 2,645,300,993.731 | | 20,555,051.311 | | 2,665,856,045.042 |
Richard S. Trutanic:
| | | | |
Votes For | | Votes
Witheld | | Total |
| 2,641,761,336.311 | | 24,094,708.731 | | 2,665,856,045.042 |
Federal Income Tax Information
(Unaudited)
The Fund is required under the Internal Revenue Code to advise shareholders in a written statement as to the federal tax status of dividends paid by the Fund during such fiscal years. Accordingly, the Fund paid $1,880,977,437 as long term capital gain distributions.
In February 2018, shareholders will receive an IRS Form 1099-DIV or substitute Form 1099, which will show the federal tax status of the distributions received by shareholders in calendar year 2017. The amounts that will be reported on such 1099-DIV or substitute Form 1099 will be the amounts you are to use on your federal income tax return and will differ from the amounts which we must report for the Fund’s fiscal year end October 31, 2017.
Proxy Voting Policies and Procedures and Proxy Voting Record
A description of the policies and procedures that New York Life Investments uses to vote proxies related to the Fund’s securities is available without charge, upon request, (i) by visiting the MainStay Funds’ website at mainstayinvestments.com; and (ii) on the Securities and Exchange Commission’s (“SEC”) website at www.sec.gov.
The Fund is required to file with the SEC its proxy voting records for the Fund for the 12-month period ending June 30 on Form N-PX. The most recent Form N-PX or proxy voting record is available free of charge upon request by calling 800-MAINSTAY (624-6782); visiting the MainStay Funds’ website at mainstayinvestments.com; or on the SEC’s website at www.sec.gov.
Shareholder Reports and Quarterly Portfolio Disclosure
The Fund is required to file its complete schedule of portfolio holdings with the SEC for its first and third fiscal quarters on Form N-Q. The Fund’s Form N-Q is available without charge, on the SEC’s website at www.sec.gov or by calling MainStay Investments at 800-MAINSTAY (624-6782). You also can obtain and review copies of Form N-Q by visiting the SEC’s Public Reference Room in Washington, DC (information on the operation of the Public Reference Room may be obtained by calling 1-800-SEC-0330).
Board of Trustees and Officers (Unaudited)
The Trustees and officers of the Funds are listed below. The Board oversees the MainStay Group of Funds (which consists of The MainStay Funds and MainStay Funds Trust), MainStay VP Funds Trust, MainStay DefinedTerm Municipal Opportunities Fund, the Manager and the Subadvisors, and elects the officers of the Funds who are responsible for the day-to-day operations of the Funds. Information pertaining to the Trustees and officers is set forth below. Each Trustee serves until his or her successor is elected and qualified or until his or her resignation, death or removal. Under the Board’s retirement policy, unless an exception is made, a Trustee must tender his or her resignation by the
end of the calendar year during which he or she reaches the age of 75. Mr. Meenan reached the age of 75 during the calendar year 2016, and his term was extended for one additional year. Accordingly, Mr. Meenan is expected to serve until the end of calendar year 2017, at which time he intends to retire. Officers are elected annually by the Board. The business address of each Trustee and officer listed below is 51 Madison Avenue, New York, New York 10010. A majority of the Trustees are not “interested persons” (as defined by the 1940 Act and rules adopted by the SEC thereunder) of the Fund (“Independent Trustees”).
| | | | | | | | | | | | |
| | | | | Name and Date of Birth | | Term of Office, Position(s) Held and Length of Service | | Principal Occupation(s) During Past Five Years | | Number of
Portfolios in
the MainStay
Group of Funds
Overseen by
Trustee | | Other Directorships Held by Trustee |
| Interested Trustee | | | | Yie-Hsin Hung* 8/12/62 | | The MainStay Funds: Trustee since January 2017; MainStay Funds Trust: Trustee since January 2017. | | Senior Vice President of New York Life since joining in 2010, Member of the Executive Management Committee since January 1, 2017, Chief Executive Officer, New York Life Investment Management Holdings LLC & New York Life Investment Management LLC since May 2015. Senior Managing Director and Co-President of New York Life Investment Management LLC from January 2014 to May 2015. Previously held positions of increasing responsibility, including head of NYLIM International, Alternative Growth Businesses, and Institutional investments since joining New York Life in 2010. | | 82 | | None |
| | * | This Trustee is considered to be an “interested person” of the MainStay Group of Funds, MainStay VP Funds Trust and MainStay DefinedTerm Municipal Opportunities Fund, within the meaning of the 1940 Act because of her affiliation with New York Life Insurance Company, New York Life Investment Management LLC, Candriam Belgium, Candriam France S.A.S., Cornerstone Capital Management Holdings LLC, MacKay Shields LLC, NYL Investors LLC, NYLIFE Securities LLC and/or NYLIFE Distributors LLC, as described in detail above in the column entitled “Principal Occupation(s) During Past Five Years.” |
| | |
| 32 | | MainStay Large Cap Growth Fund |
| | | | | | | | | | | | |
| | | | | Name and Date of Birth | | Term of Office, Position(s) Held and Length of Service | | Principal Occupation(s) During Past Five Years | | Number of
Portfolios in
the MainStay
Group of Funds
Overseen by
Trustee | | Other Directorships Held by Trustee |
| Independent Trustees | | | | David H. Chow 12/29/57 | | The MainStay Funds: Trustee since January 2016, Advisory Board Member (June 2015 to December 2015); MainStay Funds Trust: Trustee since January 2016, Advisory Board Member (June 2015 to December 2015). | | Founder and CEO, DanCourt Management, LLC (since 1999) | | 82 | | VanEck Vectors Group of Exchange-Traded Funds: Independent Chairman of the Board of Trustees since 2008 and Trustee since 2006 (57 portfolios); and
Berea College of Kentucky: Trustee since 2009. |
| | | | Susan B. Kerley 8/12/51 | | The MainStay Funds: Chairman since January 2017 and Trustee since 2007; MainStay Funds Trust: Chairman since January 2017 and Trustee since 1990.** | | President, Strategic Management Advisors LLC (since 1990) | | 82 | | Legg Mason Partners Funds: Trustee since 1991 (54 portfolios). |
| | | | Alan R. Latshaw 3/27/51 | | The MainStay Funds: Trustee and Audit Committee Financial Expert since 2006; MainStay Funds Trust: Trustee and Audit Committee Financial Expert since 2007.** | | Retired; Partner, Ernst & Young LLP (2002 to 2003); Partner, Arthur Andersen LLP (1989 to 2002); Consultant to the MainStay Funds Audit and Compliance Committee (2004 to 2006) | | 82 | | State Farm Associates Funds Trusts: Trustee since 2005 (4 portfolios);
State Farm Mutual Fund Trust: Trustee since 2005 (15 portfolios); and
State Farm Variable Product Trust: Trustee since 2005 (9 portfolios). |
| | | | Peter Meenan 12/5/41 | | The MainStay Funds: Trustee since 2007; MainStay Funds Trust: Trustee since 2002.** | | Retired; Independent Consultant (2004 to 2013); President and Chief Executive Officer, Babson—United, Inc. (financial services firm) (2000 to 2004); Independent Consultant (1999 to 2000); Head of Global Funds, Citicorp (1995 to 1999) | | 82 | | None |
| | | | Richard H. Nolan, Jr. 11/16/46 | | The MainStay Funds: Trustee since 2007; MainStay Funds Trust: Trustee since 2007.** | | Managing Director, ICC Capital Management (since 2004); President—Shields/Alliance, Alliance Capital Management (1994 to 2004) | | 82 | | None |
| | | | Jacques P. Perold 5/12/58 | | The MainStay Funds: Trustee since January 2016, Advisory Board Member (June 2015 to December 2015); MainStay Funds Trust: Trustee since January 2016, Advisory Board Member (June 2015 to December 2015). | | Retired; President, Fidelity Management & Research Company (2009 to 2014); Founder, President and Chief Executive Officer, Geode Capital Management, LCC (2001 to 2009) | | 82 | | Allstate Corporation: Director since 2015; MSCI, Inc. Director since March 2017 and
Boston University: Trustee since 2014. |
| | | | Richard S. Trutanic 2/13/52 | | The MainStay Funds: Trustee since 1994; MainStay Funds Trust: Trustee since 2007.** | | Chairman and Chief Executive Officer, Somerset & Company (financial advisory firm) (since 2004); Managing Director, The Carlyle Group (private investment firm) (2002 to 2004); Senior Managing Director, Partner and Board Member, Groupe Arnault S.A. (private investment firm) (1999 to 2002) | | 82 | | None |
| | ** | Includes prior service as a Director/Trustee of certain predecessor entities to MainStay Funds Trust. |
| | | | | | | | |
| | | | | Name and Date of Birth | | Position(s) Held and Length of Service | | Principal Occupation(s) During Past Five Years |
Officers of the Trust (Who are not Trustees)* | | | | Kirk C. Lehneis 6/29/74 | | President, The MainStay Funds, MainStay Funds Trust (since September 2017) | | Chief Operating Officer and Senior Managing Director (since 2016), New York Life Investment Management LLC; Chairman of the Board (since September 2017), NYLIFE Distributors LLC; Chairman of the Board, NYLIM Service Company LLC (since September 2017); President, MainStay DefinedTerm Municipal Opportunities Fund and MainStay VP Funds Trust (since September 2017); Senior Managing Director, Global Product Development (From March 2015—May 2016); Managing Director, Product Development (From March 2010—February 2015) |
| | | | Jack R. Benintende 5/12/64 | | Treasurer and Principal Financial and Accounting Officer, The MainStay Funds (since 2007), MainStay Funds Trust (since 2009) | | Managing Director, New York Life Investment Management LLC (since 2007); Treasurer and Principal Financial and Accounting Officer, MainStay DefinedTerm Municipal Opportunities Fund (since 2011) and MainStay VP Funds Trust (since 2007)**; and Assistant Treasurer, New York Life Investment Management Holdings LLC (2008 to 2012) |
| | | | Kevin M. Bopp 2/24/69 | | Vice President and Chief Compliance Officer, The MainStay Funds and MainStay Funds Trust (since 2014) | | Chief Compliance Officer, New York Life Investment Management LLC, IndexIQ ETF (since January 2016), Director and Associate General Counsel (2011 to 2014) and Vice President and Assistant General Counsel (2010 to 2011), New York Life Investment Management LLC; Vice President and ChiefCompliance Officer, MainStay VP Funds Trust, MainStay DefinedTerm Municipal Opportunities Fund (since 2014); Assistant Secretary, MainStay Funds, MainStay Funds Trust and MainStay VP Funds Trust (2010 to 2014)**, MainStay DefinedTerm Municipal Opportunities Fund (2011 to 2014) |
| | | | J. Kevin Gao 10/13/67 | | Secretary and Chief Legal Officer, The MainStay Funds and MainStay Funds Trust (since 2010) | | Managing Director and Associate General Counsel, New York Life Investment Management LLC (since 2010); Secretary and Chief Legal Officer, MainStay DefinedTerm Municipal Opportunities Fund (since 2011) and MainStay VP Funds Trust (since 2010)** |
| | | | Scott T. Harrington 2/8/59 | | Vice President—Administration, The MainStay Funds (since 2005), MainStay Funds Trust (since 2009) | | Director, New York Life Investment Management LLC (including predecessor advisory organizations) (since 2000); Member of the Board of Directors, New York Life Trust Company (since 2009); Vice President—Administration, MainStay DefinedTerm Municipal Opportunities Fund (since 2011) and MainStay VP Funds Trust (since 2005)** |
| | * | The officers listed above are considered to be “interested persons” of the MainStay Group of Funds, MainStay VP Funds Trust and MainStay Defined Term Municipal Opportunities Fund within the meaning of the 1940 Act because of their affiliation with the MainStay Group of Funds, New York Life Insurance Company and/or its affiliates, including New York Life Investment Management LLC, NYLIM Service Company LLC, NYLIFE Securities LLC and/or NYLIFE Distributors LLC, as described in detail in the column captioned “Principal Occupation(s) During Past Five Years.” Officers are elected annually by the Board. |
| | ** | Includes prior service as an officer of MainStay VP Series Fund, Inc., the predecessor to MainStay VP Funds Trust. |
| | |
| 34 | | MainStay Large Cap Growth Fund |
MainStay Funds
Equity
U.S. Equity
MainStay Common Stock Fund
MainStay Cornerstone Growth Fund
MainStay Epoch U.S. All Cap Fund
MainStay Epoch U.S. Equity Yield Fund
MainStay Epoch U.S. Small Cap Fund
MainStay Large Cap Growth Fund
MainStay MAP Equity Fund
MainStay S&P 500 Index Fund
MainStay U.S. Equity Opportunities Fund
International/Global Equity
MainStay Candriam Emerging Markets Equity Fund
MainStay Emerging Markets Equity Fund
MainStay Epoch Capital Growth Fund
MainStay Epoch Global Choice Fund
MainStay Epoch Global Equity Yield Fund
MainStay Epoch International Choice Fund
MainStay Epoch International Small Cap Fund
MainStay International Equity Fund
MainStay International Opportunities Fund
Income
Taxable Bond
MainStay Emerging Markets Debt Fund
MainStay Floating Rate Fund
MainStay Government Fund
MainStay High Yield Corporate Bond Fund
MainStay Indexed Bond Fund
MainStay Short Duration High Yield Fund
MainStay Total Return Bond Fund
MainStay Unconstrained Bond Fund
Municipal/Tax Advantaged Bond
MainStay California Tax Free Opportunities Fund1
MainStay High Yield Municipal Bond Fund
MainStay New York Tax Free Opportunities Fund2
MainStay Tax Advantaged Short Term Bond Fund
MainStay Tax Free Bond Fund
Money Market
MainStay Money Market Fund
Mixed Asset
MainStay Balanced Fund
MainStay Convertible Fund
MainStay Income Builder Fund
Alternative
MainStay Absolute Return Multi-Strategy Fund
MainStay Cushing Energy Income Fund
MainStay Cushing MLP Premier Fund
MainStay Cushing Renaissance Advantage Fund
Asset Allocation/Target Date
MainStay Conservative Allocation Fund
MainStay Growth Allocation Fund
MainStay Moderate Allocation Fund
MainStay Moderate Growth Allocation Fund
MainStay Retirement 2010 Fund
MainStay Retirement 2020 Fund
MainStay Retirement 2030 Fund
MainStay Retirement 2040 Fund
MainStay Retirement 2050 Fund
MainStay Retirement 2060 Fund
Manager
New York Life Investment Management LLC
New York, New York
Subadvisors
Candriam Belgium S.A.3
Brussels, Belgium
Candriam France S.A.S.3
Paris, France
Cornerstone Capital Management Holdings LLC3
New York, New York
Cushing Asset Management, LP
Dallas, Texas
Epoch Investment Partners, Inc.
New York, New York
MacKay Shields LLC3
New York, New York
Markston International LLC
White Plains, New York
NYL Investors LLC3
New York, New York
Winslow Capital Management, LLC
Minneapolis, Minnesota
Legal Counsel
Dechert LLP
Washington, District of Columbia
Independent Registered Public Accounting Firm
KPMG LLP
Philadelphia, Pennsylvania
1. Class A and Class I shares of this Fund are registered for sale in AZ, CA, MI, NV, OR, TX, UT and WA. Class I shares are registered for sale in CO, FL, GA, HI, ID, MA, MD, NH, NJ and NY.
2. This Fund is registered for sale in CA, CT, DE, FL, MA, NJ, NY and VT.
3. An affiliate of New York Life Investment Management LLC.
Not part of the Annual Report
For more information
800-MAINSTAY (624-6782)
mainstayinvestments.com
MainStay Investments® is a registered service mark and name under which New York Life Investment Management LLC does business. MainStay Investments, an indirect subsidiary of New York Life Insurance Company, New York, NY 10010, provides investment advisory products and services. The MainStay Funds® are managed by New York Life Investment Management LLC and distributed by NYLIFE Distributors LLC, 30 Hudson Street, Jersey City, NJ 07302, a wholly owned subsidiary of New York Life Insurance Company. NYLIFE Distributors LLC is a Member FINRA/SIPC.
©2017 NYLIFE Distributors LLC. All rights reserved.
| | | | | | | | |
| Not FDIC/NCUA Insured | | Not a Deposit | | May Lose Value | | No Bank Guarantee | | Not Insured by Any Government Agency |
| | |
| 1715995 MS286-17 | | MSLG11-12/17 (NYLIM) NL221 |
MainStay MAP Equity Fund
(Formerly known as MainStay MAP Fund)
Message from the President and Annual Report
October 31, 2017


This page intentionally left blank
Message from the President
The 12 months ended October 31, 2017, brought strong performance to equity markets in the United States and abroad.
According to FTSE-Russell data for the U.S. market, stocks at all capitalization levels earned solid double-digit overall returns during the reporting period. Total returns for stocks in general exceeded 20% at all capitalization levels. Growth stocks were particularly strong, outperforming value stocks for companies of all sizes except among microcaps, where value stocks outperformed growth stocks.
Several factors contributed to the strength of domestic and international stock markets during the reporting period. Following the U.S. presidential election in November 2016, many investors looked forward to business tax incentives and possible tax cuts for consumers that could stimulate economic growth. During the reporting period, corporate earnings reports remained strong; and growth in U.S. real gross domestic product remained positive, with a substantial advance during the second quarter of 2017. Developed international markets and emerging markets were also strong, boosted by positive macroeconomic data and growing confidence that Europe was well on its way to financial recovery. Despite wide variations among emerging markets, many saw strong appreciation in local-currency terms and benefited from a weaker U.S. dollar.
During the reporting period, the Federal Open Market Committee raised the federal funds target range three times—in December of 2016 and in March and June of 2017. These incremental increases raised the federal funds target range to 1.00% to 1.25% by the end of the reporting period. These tightening moves were followed by higher U.S. Treasury yields at all maturities, with the greatest increases at the short-end of the maturity spectrum.
As interest rates rise, bond prices tend to decline (and vice versa). As a result, some portions of the U.S. Treasury market recorded negative total returns during the reporting period. Agency securities posted small but positive total returns, as did
asset-backed and mortgage-backed securities. Other bond categories, particularly those with looser ties to U.S. interest rates, did considerably better. Emerging-market debt recorded solid single-digit returns; high-yield bonds were generally stronger; and convertible bonds, which are closely tied to the performance of underlying stocks, provided some of the strongest overall returns of any fixed-income sector during the reporting period.
At MainStay, we have always encouraged investors to diversify their investments and maintain a long-term perspective, even when markets are strong. Asset classes that perform well in one environment may perform differently in another; and in today’s ever-changing world, wide market swings are not unknown.
MainStay offers Funds with a wide array of investment objectives to help our shareholders pursue the appropriate diversification for their long-range financial goals. We also offer several investment boutiques, allowing our shareholders to choose the style—or mix of styles—that’s best suited to their investment needs. We believe that relatively few individual investors can match the level of professional experience and market insight that our portfolio managers provide.
The report that follows provides more detailed information on the specific markets, investment strategies and portfolio decisions that affected your MainStay Fund during the 12 months ended October 31, 2017. We encourage you to read the report carefully and use it to help you evaluate your progress toward your financial goals.
Sincerely,

Kirk C. Lehneis
President
The opinions expressed are as of the date of this report and are subject to change. There is no guarantee that any forecast made will come to pass. This material does not constitute investment advice and is not intended as an endorsement of any specific investment. Past performance is no guarantee of future results.
Not part of the Annual Report
Table of Contents
Investors should refer to the Fund’s Summary Prospectus and/or Prospectus and consider the Fund’s investment objectives, strategies, risks, charges and expenses carefully before investing. The Summary Prospectus and/or Prospectus contain this and other information about the Fund. You may obtain copies of the Fund’s Summary Prospectus, Prospectus and Statement of Additional Information free of charge, upon request, by calling toll-free 800-MAINSTAY (624-6782), by writing to NYLIFE Distributors LLC, Attn: MainStay Marketing Department, 30 Hudson Street, Jersey City, NJ 07302 or by sending an e-mail to MainStayShareholderServices@nylim.com. These documents are also available via the MainStay Funds’ website at mainstayinvestments.com/documents. Please read the Summary Prospectus and/or Prospectus carefully before investing.
Investment and Performance Comparison1 (Unaudited)
Performance data quoted represents past performance. Past performance is no guarantee of future results. Because of market volatility and other factors, current performance may be lower or higher than the figures shown. Investment return and principal value will fluctuate, and as a result, when shares are redeemed, they may be worth more or less than their original cost. The graph below depicts the historical performance of Class I shares of the Fund. Performance will vary from class to class based on differences in class-specific expenses and sales charges. For performance information current to the most recent month-end, please call 800-MAINSTAY (624-6782) or visit mainstayinvestments.com.
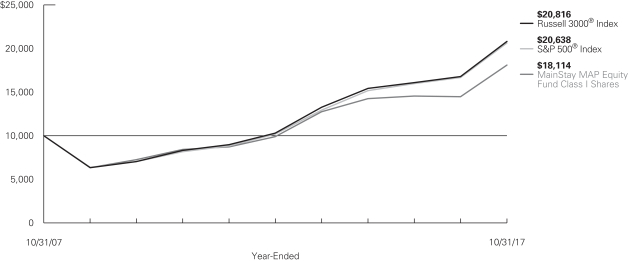
Average Annual Total Returns for the Year-Ended October 31, 2017
| | | | | | | | | | | | | | | | | | |
| Class | | Sales Charge | | | | Inception
Date | | | One Year | | Five Years | | Ten Years or Since Inception | | Gross
Expense
Ratio2 | |
| Class A Shares | | Maximum 5.5% Initial Sales Charge | | With sales charges Excluding sales charges | |
| 6/9/1999
|
| | 17.87%
24.73 | | 11.32%
12.59 | | 5.26%
5.85 | |
| 1.09
1.09 | %
|
| Investor Class Shares | | Maximum 5.5% Initial Sales Charge | | With sales charges Excluding sales charges | |
| 2/28/2008
|
| | 17.65
24.50 | | 11.13
12.39 | | 6.37
6.99 | |
| 1.29
1.29 |
|
| Class B Shares3 | | Maximum 5% CDSC if Redeemed Within the First Six Years of Purchase | | With sales charges Excluding sales charges | | | 6/9/1999 | | | 18.55
23.55 | | 11.29
11.55 | | 4.87
4.87 | |
| 2.04
2.04 |
|
| Class C Shares | | Maximum 1% CDSC if Redeemed Within One Year of Purchase | | With sales charges Excluding sales charges | |
| 6/9/1999
|
| | 22.55
23.55 | | 11.55
11.55 | | 4.87
4.87 | |
| 2.04
2.04 |
|
| Class I Shares | | No Sales Charge | | | | | 1/21/1971 | | | 25.01 | | 12.87 | | 6.12 | | | 0.84 | |
| Class R1 Shares | | No Sales Charge | | | | | 1/2/2004 | | | 24.92 | | 12.75 | | 6.00 | | | 0.94 | |
| Class R2 Shares | | No Sales Charge | | | | | 1/2/2004 | | | 24.60 | | 12.47 | | 5.75 | | | 1.20 | |
| Class R3 Shares | | No Sales Charge | | | | | 4/28/2006 | | | 24.29 | | 12.20 | | 5.49 | | | 1.44 | |
| 1. | The performance table and graph do not reflect the deduction of taxes that a shareholder would pay on distributions or Fund share redemptions. Total returns reflect maximum applicable sales charges as indicated in the table above, if any, changes in share price, and reinvestment of dividend and capital gain distributions. The graph assumes the initial investment amount shown above and reflects the deduction of all sales charges that would have applied for the period of investment. Performance figures may reflect certain fee waivers and/or expense limitations, without which total returns may have |
| | been lower. For more information on share classes and current fee waivers and/or expense limitations, if any, please refer to the Notes to Financial Statements. |
| 2. | The gross expense ratios presented reflect the Fund’s “Total Annual Fund Operating Expenses” from the most recent Prospectus and may differ from other expense ratios disclosed in this report. |
| 3. | Class B shares are closed to all new purchases as well as additional investments by existing Class B shareholders. |
The footnotes on the next page are an integral part of the table and graph and should be carefully read in conjunction with them.
| | | | | | | | | | | | |
| Benchmark Performance | | One Year | | | Five Years | | | Ten Years
or Since
Inception | |
Russell 3000® Index4 | | | 23.98 | % | | | 15.12 | % | | | 7.61 | % |
S&P 500® Index5 | | | 23.63 | | | | 15.18 | | | | 7.51 | |
Morningstar Large Blend Category Average6 | | | 22.34 | | | | 13.70 | | | | 6.62 | |
| 4. | The Russell 3000® Index is the Fund’s primary broad-based securities market index for comparison purposes. The Russell 3000® Index measures the performance of the largest 3,000 U.S. companies representing approximately 98% of the investable U.S. equity market. Results assume reinvestment of all dividends and capital gains. An investment cannot be made directly in an index. |
| 5. | The S&P 500® Index is the Fund’s secondary benchmark. “S&P 500®” is a trademark of The McGraw-Hill Companies, Inc. The S&P 500® Index is widely regarded as the standard index for measuring large-cap U.S. stock market performance. Results assume reinvestment of all dividends and capital gains. An investment cannot be made directly in an index. |
| 6. | The Morningstar Large Blend Category Average is representative of funds that represent the overall US stock market in size, growth rates and price. Stocks in the top 70% of the capitalization of the US equity market are defined as large cap. The blend style is assigned to portfolios where neither growth nor value characteristics predominate. These portfolios tend to invest across the spectrum of US industries, and owing to their broad exposure, the portfolios’ returns are often similar to those of the S&P 500 Index. Results are based on average total returns of similar funds with all dividends and capital gain distributions reinvested. |
The footnotes on the preceding page are an integral part of the table and graph and should be carefully read in conjunction with them.
| | |
| 6 | | MainStay MAP Equity Fund |
Cost in Dollars of a $1,000 Investment in MainStay MAP Equity Fund (Unaudited)
The example below is intended to describe the fees and expenses borne by shareholders during the six-month period from May 1, 2017, to October 31, 2017, and the impact of those costs on your investment.
Example
As a shareholder of the Fund you incur two types of costs: (1) transaction costs, including exchange fees and sales charges (loads) on purchases (as applicable), and (2) ongoing costs, including management fees, distribution and/or service (12b-1) fees, and other Fund expenses (as applicable). This example is intended to help you understand your ongoing costs (in dollars) of investing in the Fund and to compare these costs with the ongoing costs of investing in other mutual funds. The example is based on an investment of $1,000 made at the beginning of the six-month period and held for the entire period from May 1, 2017, to October 31, 2017.
This example illustrates your Fund’s ongoing costs in two ways:
Actual Expenses
The second and third data columns in the table below provide information about actual account values and actual expenses. You may use the information in these columns, together with the amount you invested, to estimate the expenses that you paid during the six months ended October 31, 2017. Simply divide your account value by $1,000 (for example, an $8,600 account value divided by $1,000 = 8.6), then
multiply the result by the number under the heading entitled “Expenses Paid During Period” to estimate the expenses you paid on your account during this period.
Hypothetical Example for Comparison Purposes
The fourth and fifth data columns in the table below provide information about hypothetical account values and hypothetical expenses based on the Fund’s actual expense ratio and an assumed rate of return of 5% per year before expenses, which is not the Fund’s actual return. The hypothetical account values and expenses may not be used to estimate the actual ending account balances or expenses you paid for the six-month period shown. You may use this information to compare the ongoing costs of investing in the Fund with the ongoing costs of investing in other mutual funds. To do so, compare this 5% hypothetical example with the 5% hypothetical examples that appear in the shareholder reports of the other mutual funds.
Please note that the expenses shown in the table are meant to highlight your ongoing costs only and do not reflect any transactional costs, such as exchange fees or sales charges (loads). Therefore, the fourth and fifth data columns of the table are useful in comparing ongoing costs only and will not help you determine the relative total costs of owning different funds. In addition, if these transactional costs were included, your costs would have been higher.
| | | | | | | | | | | | | | | | | | | | | | |
| | | | | | | | | | | | | | | | | | |
| Share Class | | Beginning
Account
Value
5/1/17 | | | Ending Account
Value (Based
on Actual
Returns and
Expenses)
10/31/17 | | | Expenses
Paid
During
Period1 | | | Ending Account
Value (Based
on Hypothetical
5% Annualized
Return and
Actual Expenses)
10/31/17 | | | Expenses
Paid
During
Period1 | | | Net Expense
Ratio
During
Period2 |
| | | | | | |
| Class A Shares | | $ | 1,000.00 | | | $ | 1,088.80 | | | $ | 5.74 | | | $ | 1,019.70 | | | $ | 5.55 | | | 1.09% |
| | | | | | |
| Investor Class Shares | | $ | 1,000.00 | | | $ | 1,087.60 | | | $ | 6.79 | | | $ | 1,018.70 | | | $ | 6.56 | | | 1.29% |
| | | | | | |
| Class B Shares | | $ | 1,000.00 | | | $ | 1,083.50 | | | $ | 10.77 | | | $ | 1,014.90 | | | $ | 10.41 | | | 2.05% |
| | | | | | |
| Class C Shares | | $ | 1,000.00 | | | $ | 1,083.50 | | | $ | 10.77 | | | $ | 1,014.90 | | | $ | 10.41 | | | 2.05% |
| | | | | | |
| Class I Shares | | $ | 1,000.00 | | | $ | 1,090.10 | | | $ | 4.43 | | | $ | 1,021.00 | | | $ | 4.28 | | | 0.84% |
| | | | | | |
| Class R1 Shares | | $ | 1,000.00 | | | $ | 1,089.50 | | | $ | 4.95 | | | $ | 1,020.50 | | | $ | 4.79 | | | 0.94% |
| | | | | | |
| Class R2 Shares | | $ | 1,000.00 | | | $ | 1,088.20 | | | $ | 6.26 | | | $ | 1,019.20 | | | $ | 6.06 | | | 1.19% |
| | | | | | |
| Class R3 Shares | | $ | 1,000.00 | | | $ | 1,087.00 | | | $ | 7.57 | | | $ | 1,017.90 | | | $ | 7.32 | | | 1.44% |
| 1. | Expenses are equal to the Fund’s annualized expense ratio of each class multiplied by the average account value over the period, divided by 365 and multiplied by 184 (to reflect the six-month period). The table above represents the actual expenses incurred during the six-month period. |
| 2. | Expenses are equal to the Fund’s annualized expense ratio to reflect the six-month period. |
Industry Composition as of October 31, 2017 (Unaudited)
| | | | |
| Media | | | 10.1 | % |
| Banks | | | 6.7 | |
| Technology Hardware, Storage & Peripherals | | | 6.3 | |
| Aerospace & Defense | | | 5.7 | |
| IT Services | | | 5.3 | |
| Insurance | | | 5.3 | |
| Software | | | 5.1 | |
| Internet Software & Services | | | 4.5 | |
| Capital Markets | | | 4.3 | |
| Oil, Gas & Consumable Fuels | | | 4.1 | |
| Health Care Providers & Services | | | 3.6 | |
| Pharmaceuticals | | | 3.3 | |
| Specialty Retail | | | 2.7 | |
| Biotechnology | | | 2.3 | |
| Chemicals | | | 2.3 | |
| Semiconductors & Semiconductor Equipment | | | 2.2 | |
| Beverages | | | 2.1 | |
| Consumer Finance | | | 2.1 | |
| Health Care Equipment & Supplies | | | 2.1 | |
| Road & Rail | | | 1.9 | |
| Electronic Equipment, Instruments & Components | | | 1.8 | |
| Food & Staples Retailing | | | 1.8 | |
| Building Products | | | 1.1 | |
| | | | |
| Electrical Equipment | | | 1.1 | % |
| Equity Real Estate Investment Trusts | | | 1.1 | |
| Machinery | | | 1.0 | |
| Household Products | | | 0.9 | |
| Internet & Direct Marketing Retail | | | 0.9 | |
| Construction & Engineering | | | 0.8 | |
| Hotels, Restaurants & Leisure | | | 0.8 | |
| Industrial Conglomerates | | | 0.7 | |
| Multiline Retail | | | 0.6 | |
| Communications Equipment | | | 0.5 | |
| Construction Materials | | | 0.5 | |
| Diversified Telecommunication Services | | | 0.5 | |
| Diversified Financial Services | | | 0.4 | |
| Distributors | | | 0.3 | |
| Electric Utilities | | | 0.3 | |
| Energy Equipment & Services | | | 0.3 | |
| Household Durables | | | 0.3 | |
| Tobacco | | | 0.3 | |
| Food Products | | | 0.2 | |
| Multi-Utilities | | | 0.2 | |
| Short-Term Investments | | | 1.4 | |
| Other Assets, Less Liabilities | | | 0.2 | |
| | | | |
| | | 100.0 | % |
| | | | |
See Portfolio of Investments beginning on page 13 for specific holdings within these categories.
Top Ten Holdings as of October 31, 2017 (excluding short-term investment) (Unaudited)
| | |
| 8 | | MainStay MAP Equity Fund |
Portfolio Management Discussion and Analysis (Unaudited)
Questions answered by portfolio managers Christopher Mullarkey and James Mulvey of Markston International LLC (“Markston”), a Subadvisor to the Fund; portfolio managers Thomas M. Cole, CFA, Andrew P. Starr, CFA, Matthew T. Swanson, CFA, and J. Christian Kirtley, CFA, of Institutional Capital LLC (“ICAP”), a Subadvisor to the Fund until January 9, 2017;1 and portfolio managers William Priest, CFA, Michael Welhoelter, CFA, David Pearl and J. Christian Kirtley, CFA, (formerly of ICAP) of Epoch Investment Partners, Inc. (“Epoch”), a Subadvisor to the Fund.
How did MainStay MAP Equity Fund perform relative to its benchmarks and peers during the 12 months ended October 31, 2017?
Excluding all sales charges, MainStay MAP Equity Fund returned 24.73% for Class A shares, 24.50% for Investor Class shares, and 23.55% for Class B and Class C shares for the 12 months ended October 31, 2017. Over the same period, Class I shares returned 25.01%, Class R1 shares returned 24.92%, Class R2 shares returned 24.60% and Class R3 shares returned 24.29%. For the 12 months ended October 31, 2017, all share classes except Class B and Class C shares outperformed the 23.98% return of the Russell 3000® Index,2 which is the Fund’s primary benchmark, and the 23.63% return of the S&P 500® Index,2 which is the Fund’s secondary benchmark. Over the same period, and all share classes outperformed the 22.34% return of the Morningstar Large Blend Category Average.3 See page 5 for Fund returns with applicable sales charges.
What factors affected the Fund’s relative performance during the reporting period?
Markston
During the reporting period, the portion of the Fund subadvised by Markston outperformed the Russell 3000® Index. This outperformance was largely driven by strong stock selection in the industrials and information technology sectors. An overweight position in the financials sector and an underweight position in the utilities sector also contributed positively to relative performance. (Contributions take weightings and total returns into account.)
ICAP
From November 1, 2016, through January 9, 2017—the last date on which ICAP served as a subadvisor to part of the Fund—the primary factors that affected performance relative to the S&P 500® Index in the portion of the Fund subadvised by ICAP were stock selection and the sector rotation that we believe resulted from investors’ expectations of increased inflation, which helped drive interest rates higher following the U.S. election.
Epoch
From January 9, 2017, through the end of the reporting period, the portion of the Fund subadvised by Epoch was positioned for an economic recovery, and sector exposure played a large role in relative performance. In the Epoch portion of the Fund, an overweight position relative to the Russell 3000® Index in
information technology and an underweight position in telecommunication services helped relative performance, as did stock selection among industrials. Stock selection among consumer discretionary companies was a negative factor in the Epoch portion of the Fund.
Which sectors were the strongest contributors to the Fund’s relative performance, and which sectors were particularly weak?
Markston
The top-performing sectors relative to the Russell 3000® Index in the portion of the Fund subadvised by Markston were industrials, information technology and energy. In each case, positive stock selection drove the bulk of the performance. The weakest contributors to relative performance in Markston’s portion of the Fund were the consumer staples and health care sectors and a modest cash position. Stock selection drove the bulk of the underperformance in consumer staples and health care. The Markston portion of the Fund held a modest cash position that detracted from relative performance in a rapidly rising market.
ICAP
During the portion of the reporting period in which ICAP subadvised part of the Fund, the strongest positive contributions relative to the S&P 500® Index in the ICAP portion of the Fund that invested in U.S. equities came from consumer discretionary, financials and utilities. Favorable stock selection was the primary driver in the consumer discretionary sector, while the ICAP portion of the Fund that invested in U.S. equities benefited from an underweight position in utilities and an overweight position in financials.
During the same portion of the reporting period in the ICAP portion of the Fund that invested in U.S. equities, the weakest-performing sectors that detracted the most from performance relative to the S&P 500® Index were materials and telecommunication services. Stock selection was the primary driver in the materials sector, while an underweight position relative to the S&P 500® Index in telecommunication services detracted from relative performance.
Over the same portion of the reporting period, the best-performing sectors on an absolute basis in the ICAP portion of the Fund that invested in global equities were financials, energy and information technology. During this portion of the reporting period, the weakest-performing sectors on an absolute basis in
| 1. | Effective January 9, 2017, ICAP was replaced by Epoch as a subadvisor of the Fund. |
| 2. | See footnote on page 6 for more information on this index. |
| 3. | See footnote on page 6 for more information on the Morningstar Large Blend Category Average. |
the global equity portion of the Fund subadvised by ICAP were consumer staples, telecommunication services and real estate.
Epoch
During the portion of the reporting period in which Epoch subadvised part of the Fund, the strongest-contributing sectors to performance relative to the Russell 3000® Index in the Epoch portion of the Fund were industrials and telecommunication services, followed by real estate, energy and financials. In the Epoch portion of the Fund, strength in the industrials sector was almost entirely the result of stock selection, whereas a lack of exposure to companies in the telecommunication services sector helped relative performance. The weakest sectors in the Epoch portion of the Fund were consumer discretionary and materials, because of stock selection. The Epoch portion of the Fund also held a small cash position that reduced returns in a rapidly rising market.
During the reporting period, which individual stocks made the strongest contributions to the Fund’s absolute performance and which stocks detracted the most?
Markston
During the reporting period, the stocks that contributed the most to absolute performance in the portion of the Fund subadvised by Markston were aerospace & defense company Boeing; health care providers & services company Aetna; and oil, gas & consumable fuels company Marathon Petroleum. Boeing outperformed the Russell 3000® Index after beating earnings expectations for multiple quarters and delivered strong free cash flow. These factors led to significant capital returns in the form of stepped-up share repurchase activity and sizable dividend increases. Aetna outperformed the Index following news reports that CVS Health was in discussions to acquire Aetna in a transaction that would value the company at more than $200 per share. Strong quarterly results also helped the stock during the reporting period. Marathon Petroleum outperformed the Russell 3000® Index after the company announced (and successfully began to execute) a strategic initiative to unlock value by accelerating asset dropdowns to its master limited partnership MPLX L.P. This has supported substantial capital returns to shareholders.
During the reporting period, the stocks that detracted the most from absolute performance in the portion of the Fund subadvised by Markston were medical device maker Medtronic, drug retailer CVS Health and pharmaceutical company Allergan. Allergan underperformed the Russell 3000® Index, as earnings guidance was lowered a few times during the reporting period. In addition, an unfavorable patent ruling on Restasis, the company’s second-best-selling drug, opened the door for
generic versions to enter the market sooner than expected. CVS Health underperformed the Index as the company lost three high-profile pharmacy benefit management relationships to rivals during the reporting period. The company also suffered from recent concerns that Amazon may use its purchase of Whole Foods to enter the pharmacy business. Medtronic underperformed the Russell 3000® Index after the company significantly reduced its diabetes growth guidance because of sensor supply constraints, as stronger-than-anticipated demand has temporarily outstripped Medtronic’s manufacturing capacity.
ICAP
During the portion of the reporting period in which ICAP subadvised part of the Fund, the stocks that made the strongest positive contributions to absolute performance in the ICAP portion of the Fund that invested in U.S. equities were all in the financials sector. M&T Bank, Wells Fargo, and Citigroup were strong performers as interest rates rose and, we believe, investors increasingly began to expect a more benign regulatory environment.
During the portion of the reporting period in which ICAP subadvised part of the Fund, substantial detractors from absolute performance in the ICAP portion of the Fund that invested in U.S. equities included drug retailer CVS Health, Mexican media company Grupo Televisa and wireless communications infrastructure company American Tower. CVS Health and Grupo Televisa lagged because of weaker-than-expected operating results and a diminished outlook. American Tower underperformed as defensive stocks were sold in favor of cyclical names. All of these detractors were sold during the portion of the reporting period in which ICAP subadvised part of the Fund.
During the same portion of the reporting period, the stocks that made the strongest positive contributions to absolute performance in the ICAP portion of the Fund that invested in global equities were all in the financials sector. M&T Bank, Royal Bank of Scotland and Julius Baer showed strong performance as interest rates rose and, we believe, as investors’ expectations for a more benign regulatory environment increased.
Primary detractors from absolute performance during the portion of the reporting period that ICAP invested in global equities included medical technology company LivaNova, Mexican media company Grupo Televisa and wireless communications infrastructure company American Tower. LivaNova’s sales growth was disappointing during the portion of the reporting period in which ICAP subadvised part of the Fund.
Epoch
During the portion of the reporting period in which Epoch subadvised part of the Fund a top contributor to absolute per-
| | |
| 10 | | MainStay MAP Equity Fund |
formance in the Epoch portion of the Fund was electronic device and phone company Apple, whose shares advanced after the company reported revenue and profits that exceeded expectations. Also within information technology in the Epoch portion of the Fund, Universal Display shares increased on strong revenue growth. Universal Display owns the royalty rights for organic light emitting diode technology that is still in the early stages of adoption in the handset, tablet, monitor and TV industries, and Epoch believed that the stock could benefit from years of above-average growth as the technology becomes more widespread.
During the portion of the reporting period in which Epoch subadvised part of the Fund, a detractor from performance in the Epoch portion of the Fund was automotive parts company Advance Auto Parts, which continued to struggle to integrate its acquisition of General Parts. As a result, the company missed expectations for revenue growth, margin improvement and cash generation for several quarters. A softening industry environment exacerbated these challenges. Upon review, Epoch came to believe that there was a substantial risk that the company would continue to struggle to achieve its growth and operating margin objectives. As a result, Epoch opted sell the position from the Epoch portion of the Fund. In the industrials sector, General Electric continued to report weakness in its oil & gas and transportation segments. While Epoch believed that this condition was temporary and that the acquisition of Alstom could increase organic industrial sales in the future, Epoch also believed that in the near term, the company could struggle to meet expectations for revenue growth and profits. For this reason, Epoch opted to also sell the position in General Electric from the Epoch portion of the Fund and sought to reinvest the proceeds in companies that Epoch believed had more attractive near-term risk/reward profiles.
Did the Fund make any significant purchases or sales during the reporting period?
Markston
During the reporting period, the two largest purchases in the portion of the Fund subadvised by Markston were payments technology company Visa and technology solutions provider to the global travel industry Sabre Corporation. Over the same period, agricultural chemicals company Monsanto and worldwide beverage company Coca-Cola were the two largest sales in the Markston portion of the Fund.
Markston purchased Visa and Sabre for the Markston portion of the Fund because shares of both companies exhibited a few attractive alpha3 generators, and in Markston’s view, the shares were inexpensive. In the Markston portion of the Fund, Monsanto was sold after Bayer AG made a bid for the company in what was the largest takeover of 2016. The position in Coca-Cola in the Markston portion of the Fund was sold because Markston believed that its portion of the Fund would achieve higher returns investing the proceeds into Visa.
ICAP
During the portion of the reporting period in which ICAP subadvised part of the Fund, a new position in Total, a large integrated oil & gas company, was initiated in the ICAP portion of the Fund that invested in U.S. equities. ICAP believed that the company’s free cash flow could improve significantly in the coming years from a combination of lower expenses and better growth in production volumes. The domestic equity portion of the Fund that ICAP subadvised also added a position in global payments technology company Visa. ICAP believed that the stock was attractively valued and that it represented a compelling long-term secular growth opportunity.
During the portion of the reporting period in which ICAP subadvised part of the Fund, the ICAP portion of the Fund sold positions in multiline industrial company Johnson Controls and air carrier Delta Air Lines in favor of stocks that ICAP believed had greater potential upside and were more attractive on a relative-valuation basis. During the portion of the reporting period in which ICAP subadvised part of the Fund, there were no significant purchases or sales in the ICAP portion of the Fund that invested in global equities.
Epoch
During the portion of the reporting period in which Epoch subadvised part of the Fund, the Epoch portion of the Fund made several purchases, including Bank of America, Johnson Controls and Morgan Stanley. In Epoch’s opinion, Bank of America has several ways it can reduce costs and expand margins, which could improve profitability. These include reducing bloated cost structures from prior acquisitions including credit cards and brokerage (MBNA and Merrill Lynch), transitioning the product mix of Merrill Lynch away from lower-margin brokerage to higher-margin asset management,
| 3. | Alpha measures the relationship between a stock’s (or a mutual fund’s) return and its beta over a three-year period. Often, alpha is viewed as the excess return (positive or negative) or the value added by the portfolio manager. Beta is a measure of volatility in relation to the market as a whole. A beta higher than 1 indicates that a security or portfolio will tend to exhibit higher volatility than the market. A beta lower than 1 indicates that a security or portfolio will tend to exhibit lower volatility than the market. |
reducing litigation costs associated with the U.S. fiscal crisis, and potential regulatory and tax reform under a new administration. Johnson Controls helps optimize energy and operational efficiencies of buildings, batteries for hybrid and electric vehicles, and interior systems for automobiles. Following the recently completed merger with Tyco, Epoch believed that Johnson Controls had an opportunity to realize significant cost synergies, which could lead to an increase in margins and profits. In addition, the company’s recent spin-off of its low-quality auto parts business could result in a business that’s more profitable and less cyclical. Morgan Stanley is a global financial services firm. The company has leading market shares in global investment banking and U.S. wealth management. Epoch believes that Morgan Stanley is well-positioned to benefit from continued economic growth. In recent years, Morgan Stanley has simplified its business model to focus on business lines that are less capital intensive and less volatile, such as wealth and investment management. The company is in a position to potentially return close to 100% of its annual cash generation to shareholders via shareholder yield.
During the portion of the reporting period in which Epoch subadvised part of the Fund, the Epoch portion of the Fund sold a number of stocks, among them integrated oil & gas company Royal Dutch Shell, industrial conglomerate Honeywell International, and health care equipment & supplies company Abbott Laboratories.
How did the Fund’s sector weightings change during the reporting period?
Markston
During the reporting period, the Markston portion of the Fund slightly increased overweight positions relative to the Russell 3000® Index in the financials and consumer discretionary sectors. Over the same period, the Markston portion of the Fund slightly decreased its exposure relative to the Russell 3000® Index in cash and in the consumer staples sector.
ICAP
During the portion of the reporting period in which ICAP subadvised part of the Fund, the ICAP portion of the Fund that invested in U.S. equities increased its exposure relative to the S&P 500® Index in the information technology and energy sectors. Over the same portion of the reporting period, the ICAP portion of the Fund that invested in U.S. equities decreased its sector weightings relative to the Index in industrials and financials.
Over the same portion of the reporting period, sector weights changed only to a small degree in the ICAP portion of the Fund that invested in global equities. This portion of the Fund modestly increased its weighting in the financials sector and modestly decreased its weighting in materials.
Epoch
During the portion of the reporting period in which Epoch subadvised part of the Fund, the most significant changes in sector weightings in the Epoch portion of the Fund were reductions in consumer staples and energy. Over the same portion of the reporting period, the Epoch portion of the Fund added significant exposure to the information technology sector.
How was the Fund positioned at the end of the reporting period?
Markston
As of October 31, 2017, the portion of the Fund subadvised by Markston remained overweight relative to the Russell 3000® Index in the consumer discretionary sector and slightly overweight in the financials sector. As of the same date, the Markston portion of the Fund remained underweight relative to the Russell 3000® Index in the utility sector and slightly underweight the health care sector.
ICAP
As of January 9, 2017—the last date on which ICAP served as a subadvisor to part of the Fund—the ICAP portion of the Fund that invested in U.S. equities was most significantly overweight relative to the S&P 500® Index in the consumer discretionary and financials sectors. As of the same date, the ICAP portion of the Fund that invested in U.S. equities was most significantly underweight relative to the same Index in the consumer staples and utilities sectors.
In the ICAP portion of the Fund that invested in global equities, the largest weightings as of January 9, 2017, were in the financials and information technology sectors. On the same date, the smallest weightings were in the utilities and energy sectors.
Epoch
As of October 31, 2017, the portion of the Fund subadvised by Epoch had a substantially overweight position relative to the Russell 3000® Index in information technology and financials. As of the same date, the Epoch portion of the Fund had substantially underweight positions relative to the Index in the real estate and energy sectors.
The opinions expressed are those of the portfolio managers as of the date of this report and are subject to change. There is no guarantee that any forecasts made will come to pass. This material does not constitute investment advice and is not intended as an endorsement of any specific investment.
| | |
| 12 | | MainStay MAP Equity Fund |
Portfolio of Investments October 31, 2017
| | | | | | | | |
| | |
| | | Shares | | | Value | |
| Common Stocks 98.3%† | |
Aerospace & Defense 5.7% | |
¨Boeing Co. | | | 131,902 | | | $ | 34,028,078 | |
Hexcel Corp. | | | 124,076 | | | | 7,530,173 | |
Northrop Grumman Corp. | | | 17,400 | | | | 5,142,222 | |
Raytheon Co. | | | 100,990 | | | | 18,198,398 | |
United Technologies Corp. | | | 49,970 | | | | 5,984,407 | |
| | | | | |
| | | | 70,883,278 | |
| | | | | |
Banks 6.7% | |
¨Bank of America Corp. | | | 1,104,734 | | | | 30,258,664 | |
Bank of The Ozarks, Inc. | | | 131,226 | | | | 6,117,756 | |
Citigroup, Inc. | | | 94,990 | | | | 6,981,765 | |
Citizens Financial Group, Inc. | | | 194,736 | | | | 7,401,915 | |
JPMorgan Chase & Co. | | | 108,066 | | | | 10,872,520 | |
Signature Bank (a) | | | 33,875 | | | | 4,404,089 | |
U.S. Bancorp | | | 123,823 | | | | 6,733,495 | |
Wells Fargo & Co. | | | 184,475 | | | | 10,356,427 | |
| | | | | |
| | | | 83,126,631 | |
| | | | | |
Beverages 2.1% | |
Coca-Cola Co. | | | 93,372 | | | | 4,293,245 | |
Molson Coors Brewing Co., Class B | | | 103,564 | | | | 8,375,221 | |
PepsiCo., Inc. | | | 117,110 | | | | 12,909,035 | |
| | | | | |
| | | | 25,577,501 | |
| | | | | |
Biotechnology 2.3% | |
¨AbbVie, Inc. | | | 233,433 | | | | 21,067,328 | |
Celgene Corp. (a) | | | 66,980 | | | | 6,762,971 | |
| | | | | | | | |
| | | | 27,830,299 | |
| | | | | |
Building Products 1.1% | |
Fortune Brands Home & Security, Inc. | | | 64,071 | | | | 4,232,530 | |
Johnson Controls International PLC | | | 234,132 | | | | 9,690,724 | |
| | | | | | | | |
| | | | 13,923,254 | |
| | | | | |
Capital Markets 4.3% | |
Ameriprise Financial, Inc. | | | 53,205 | | | | 8,328,711 | |
Bank of New York Mellon Corp. | | | 72,993 | | | | 3,755,490 | |
BlackRock, Inc. | | | 9,954 | | | | 4,686,642 | |
Goldman Sachs Group, Inc. | | | 27,732 | | | | 6,724,455 | |
Morgan Stanley | | | 326,340 | | | | 16,317,000 | |
State Street Corp. | | | 148,500 | | | | 13,662,000 | |
| | | | | | | | |
| | | | 53,474,298 | |
| | | | | |
Chemicals 2.3% | |
¨DowDuPont, Inc. | | | 335,239 | | | | 24,241,132 | |
Ecolab, Inc. | | | 36,592 | | | | 4,781,111 | |
| | | | | | | | |
| | | | 29,022,243 | |
| | | | | |
Communications Equipment 0.5% | |
F5 Networks, Inc. (a) | | | 56,009 | | | | 6,792,211 | |
| | | | | |
| | | | | | | | |
| | |
| | | Shares | | | Value | |
Construction & Engineering 0.8% | |
Jacobs Engineering Group, Inc. | | | 168,472 | | | $ | 9,806,755 | |
| | | | | | | | |
|
Construction Materials 0.5% | |
Martin Marietta Materials, Inc. | | | 29,792 | | | | 6,460,395 | |
| | | | | | | | |
|
Consumer Finance 2.1% | |
American Express Co. | | | 171,100 | | | | 16,343,472 | |
Discover Financial Services | | | 148,016 | | | | 9,847,505 | |
| | | | | | | | |
| | | | 26,190,977 | |
| | | | | |
Distributors 0.3% | |
Genuine Parts Co. | | | 44,022 | | | | 3,884,061 | |
| | | | | | | | |
|
Diversified Financial Services 0.4% | |
Berkshire Hathaway, Inc., Class B (a) | | | 28,719 | | | | 5,368,730 | |
| | | | | | | | |
|
Diversified Telecommunication Services 0.5% | |
AT&T, Inc. | | | 110,154 | | | | 3,706,682 | |
Verizon Communications, Inc. | | | 49,917 | | | | 2,389,527 | |
| | | | | | | | |
| | | | 6,096,209 | |
| | | | | |
Electric Utilities 0.3% | |
PPL Corp. | | | 98,420 | | | | 3,696,655 | |
| | | | | | | | |
|
Electrical Equipment 1.1% | |
AMETEK, Inc. | | | 78,862 | | | | 5,322,396 | |
Rockwell Automation, Inc. | | | 39,024 | | | | 7,836,800 | |
| | | | | | | | |
| | | | 13,159,196 | |
| | | | | |
Electronic Equipment, Instruments & Components 1.8% | |
Coherent, Inc. (a) | | | 19,347 | | | | 5,082,650 | |
TE Connectivity, Ltd. | | | 70,002 | | | | 6,368,082 | |
Universal Display Corp. | | | 69,609 | | | | 10,197,719 | |
| | | | | | | | |
| | | | 21,648,451 | |
| | | | | |
Energy Equipment & Services 0.3% | |
Schlumberger, Ltd. | | | 66,673 | | | | 4,267,072 | |
| | | | | | | | |
|
Equity Real Estate Investment Trusts 1.1% | |
HCP, Inc. | | | 185,434 | | | | 4,791,614 | |
UDR, Inc. | | | 237,791 | | | | 9,223,913 | |
| | | | | | | | |
| | | | 14,015,527 | |
| | | | | |
Food & Staples Retailing 1.8% | |
CVS Health Corp. | | | 186,754 | | | | 12,798,252 | |
Walgreens Boots Alliance, Inc. | | | 137,463 | | | | 9,109,673 | |
| | | | | | | | |
| | | | 21,907,925 | |
| | | | | |
Food Products 0.2% | |
Mondelez International, Inc., Class A | | | 65,601 | | | | 2,717,849 | |
| | | | | | | | |
| † | Percentages indicated are based on Fund net assets. |
| ¨ | | Among the Fund’s 10 largest holdings, as of October 31, 2017, excluding short-term investment. May be subject to change daily. (Unaudited) |
| | | | | | |
The notes to the financial statements are an integral part of,
and should be read in conjunction with, the financial statements. | | | | | 13 | |
Portfolio of Investments October 31, 2017 (continued)
| | | | | | | | |
| | |
| | | Shares | | | Value | |
| Common Stocks (continued) | |
Health Care Equipment & Supplies 2.1% | |
Abbott Laboratories | | | 70,260 | | | $ | 3,810,200 | |
Baxter International, Inc. | | | 21,490 | | | | 1,385,460 | |
Danaher Corp. | | | 66,875 | | | | 6,170,556 | |
Medtronic PLC | | | 181,457 | | | | 14,610,918 | |
| | | | | | | | |
| | | | 25,977,134 | |
| | | | | |
Health Care Providers & Services 3.6% | |
¨Aetna, Inc. | | | 157,805 | | | | 26,831,584 | |
Centene Corp. (a) | | | 54,946 | | | | 5,146,792 | |
UnitedHealth Group, Inc. | | | 61,547 | | | | 12,938,410 | |
| | | | | | | | |
| | | | 44,916,786 | |
| | | | | |
Hotels, Restaurants & Leisure 0.8% | |
Marriott International, Inc., Class A | | | 46,983 | | | | 5,613,529 | |
McDonald’s Corp. | | | 26,626 | | | | 4,444,146 | |
| | | | | | | | |
| | | | 10,057,675 | |
| | | | | |
Household Durables 0.3% | |
Whirlpool Corp. | | | 23,553 | | | | 3,861,043 | |
| | | | | | | | |
|
Household Products 0.9% | |
Procter & Gamble Co. | | | 123,023 | | | | 10,621,806 | |
| | | | | | | | |
|
Industrial Conglomerates 0.7% | |
General Electric Co. | | | 30,712 | | | | 619,154 | |
Honeywell International, Inc. | | | 55,859 | | | | 8,052,633 | |
| | | | | | | | |
| | | | 8,671,787 | |
| | | | | |
Insurance 5.3% | |
American International Group, Inc. | | | 270,649 | | | | 17,486,632 | |
Brighthouse Financial, Inc. (a) | | | 9,818 | | | | 610,483 | |
Chubb, Ltd. | | | 74,425 | | | | 11,224,779 | |
MetLife, Inc. | | | 276,557 | | | | 14,817,924 | |
Travelers Cos., Inc. | | | 105,190 | | | | 13,932,415 | |
W.R. Berkley Corp. | | | 59,972 | | | | 4,112,880 | |
Willis Towers Watson PLC | | | 22,782 | | | | 3,669,725 | |
| | | | | | | | |
| | | | 65,854,838 | |
| | | | | |
Internet��& Direct Marketing Retail 0.9% | |
Ctrip.com International, Ltd., ADR (a) | | | 9,935 | | | | 475,787 | |
Liberty Expedia Holdings, Inc., Class A (a) | | | 14,533 | | | | 669,971 | |
Liberty Interactive Corp. QVC Group, Class A (a) | | | 323,454 | | | | 7,348,875 | |
Liberty TripAdvisor Holdings, Inc., Class A (a) | | | 42,778 | | | | 462,003 | |
Liberty Ventures, Series A (a) | | | 28,471 | | | | 1,621,708 | |
| | | | | | | | |
| | | | 10,578,344 | |
| | | | | |
Internet Software & Services 4.5% | |
Alibaba Group Holding, Ltd., Sponsored ADR (a) | | | 9,545 | | | | 1,764,775 | |
| | | | | | | | |
| | |
| | | Shares | | | Value | |
Internet Software & Services (continued) | |
¨Alphabet, Inc. (a) | |
Class A | | | 11,276 | | | $ | 11,648,559 | |
Class C | | | 30,277 | | | | 30,780,809 | |
eBay, Inc. (a) | | | 159,640 | | | | 6,008,850 | |
VeriSign, Inc. (a) | | | 45,502 | | | | 4,892,375 | |
| | | | | | | | |
| | | | 55,095,368 | |
| | | | | |
IT Services 5.3% | |
Automatic Data Processing, Inc. | | | 73,026 | | | | 8,490,003 | |
First Data Corp., Class A (a) | | | 292,455 | | | | 5,208,624 | |
International Business Machines Corp. | | | 45,170 | | | | 6,958,890 | |
¨PayPal Holdings, Inc. (a) | | | 261,863 | | | | 19,000,779 | |
Sabre Corp. | | | 438,289 | | | | 8,572,933 | |
Visa, Inc., Class A | | | 153,681 | | | | 16,901,836 | |
| | | | | | | | |
| | | | 65,133,065 | |
| | | | | |
Machinery 1.0% | |
Caterpillar, Inc. | | | 29,381 | | | | 3,989,940 | |
Ingersoll-Rand PLC | | | 90,148 | | | | 7,987,113 | |
| | | | | | | | |
| | | | 11,977,053 | |
| | | | | |
Media 10.1% | |
Comcast Corp., Class A | | | 484,596 | | | | 17,459,994 | |
Liberty Broadband Corp. (a) | |
Class A | | | 18,137 | | | | 1,563,591 | |
Class C | | | 110,899 | | | | 9,680,374 | |
Liberty Global PLC LiLAC, Class A (a) | | | 70,864 | | | | 1,539,166 | |
Liberty Media Corp-Liberty Formula One (a) | |
Class C | | | 98,117 | | | | 3,742,183 | |
Class A | | | 28,753 | | | | 1,046,609 | |
¨Liberty SiriusXM Group (a) | |
Class A | | | 189,361 | | | | 7,898,247 | |
Class C | | | 502,937 | | | | 20,947,326 | |
Lions Gate Entertainment Corp., Class B (a) | | | 51,660 | | | | 1,428,916 | |
Live Nation Entertainment, Inc. (a) | | | 98,700 | | | | 4,321,086 | |
Madison Square Garden Co., Class A (a) | | | 46,490 | | | | 10,352,858 | |
MSG Networks, Inc., Class A (a) | | | 146,381 | | | | 2,539,710 | |
Time Warner, Inc. | | | 182,065 | | | | 17,895,169 | |
Twenty-First Century Fox, Inc., Class A | | | 397,069 | | | | 10,383,354 | |
Walt Disney Co. | | | 140,909 | | | | 13,782,309 | |
| | | | | | | | |
| | | | 124,580,892 | |
| | | | | |
Multi-Utilities 0.2% | |
Vectren Corp. | | | 44,653 | | | | 3,042,655 | |
| | | | | | | | |
|
Multiline Retail 0.6% | |
Dollar General Corp. | | | 85,311 | | | | 6,896,541 | |
| | | | | | | | |
|
Oil, Gas & Consumable Fuels 4.1% | |
Anadarko Petroleum Corp. | | | 129,454 | | | | 6,391,144 | |
Apache Corp. | | | 53,911 | | | | 2,230,298 | |
ConocoPhillips | | | 79,318 | | | | 4,057,116 | |
| | | | |
| 14 | | MainStay MAP Equity Fund | | The notes to the financial statements are an integral part of,
and should be read in conjunction with, the financial statements. |
| | | | | | | | |
| | |
| | | Shares | | | Value | |
| Common Stocks (continued) | |
Oil, Gas & Consumable Fuels (continued) | |
Enbridge, Inc. | | | 170,180 | | | $ | 6,545,123 | |
EOG Resources, Inc. | | | 33,208 | | | | 3,316,483 | |
Hess Corp. | | | 53,755 | | | | 2,373,821 | |
Marathon Petroleum Corp. | | | 205,404 | | | | 12,270,835 | |
Occidental Petroleum Corp. | | | 86,713 | | | | 5,599,058 | |
Phillips 66 | | | 59,112 | | | | 5,383,921 | |
Williams Cos., Inc. | | | 87,497 | | | | 2,493,664 | |
| | | | | | | | |
| | | | 50,661,463 | |
| | | | | |
Pharmaceuticals 3.2% | |
Allergan PLC | | | 89,807 | | | | 15,916,495 | |
Johnson & Johnson | | | 55,578 | | | | 7,748,129 | |
Merck & Co., Inc. | | | 85,950 | | | | 4,734,985 | |
Pfizer, Inc. | | | 306,550 | | | | 10,747,643 | |
| | | | | | | | |
| | | | 39,147,252 | |
| | | | | |
Road & Rail 1.9% | |
CSX Corp. | | | 151,208 | | | | 7,625,419 | |
Union Pacific Corp. | | | 135,936 | | | | 15,740,030 | |
| | | | | | | | |
| | | | 23,365,449 | |
| | | | | |
Semiconductors & Semiconductor Equipment 2.2% | |
Applied Materials, Inc. | | | 222,145 | | | | 12,535,642 | |
Cypress Semiconductor Corp. | | | 302,199 | | | | 4,792,876 | |
Intel Corp. | | | 78,126 | | | | 3,553,952 | |
Marvell Technology Group, Ltd. | | | 233,018 | | | | 4,303,843 | |
Texas Instruments, Inc. | | | 22,715 | | | | 2,196,313 | |
| | | | | | | | |
| | | | 27,382,626 | |
| | | | | |
Software 5.1% | |
¨Microsoft Corp. | | | 561,389 | | | | 46,696,337 | |
Oracle Corp. | | | 196,612 | | | | 10,007,551 | |
PTC, Inc. (a) | | | 100,401 | | | | 6,671,646 | |
| | | | | | | | |
| | | | 63,375,534 | |
| | | | | |
Specialty Retail 2.7% | |
Home Depot, Inc. | | | 108,184 | | | | 17,934,743 | |
Lowe’s Cos., Inc. | | | 135,413 | | | | 10,826,269 | |
TJX Cos., Inc. | | | 71,992 | | | | 5,025,042 | |
| | | | | | | | |
| | | | 33,786,054 | |
| | | | | |
Technology Hardware, Storage & Peripherals 6.3% | |
¨Apple, Inc. | | | 458,616 | | | | 77,524,449 | |
| | | | | |
|
Tobacco 0.3% | |
Philip Morris International, Inc. | | | 35,660 | | | | 3,731,462 | |
| | | | | |
Total Common Stocks
(Cost $774,321,778) | | | | 1,216,088,793 | |
| | | | | |
| | | | | | | | |
| | |
| | | Shares | | | Value | |
| Convertible Preferred Stocks 0.1% | |
Pharmaceuticals 0.1% | |
Allergan PLC 5.50% Series A | | | 2,020 | | | $ | 1,300,254 | |
| | | | | | | | |
Total Convertible Preferred Stocks
(Cost $1,586,506) | | | | 1,300,254 | |
| | | | | |
| | |
| | | | | | | | |
| | | Principal
Amount | | | | |
| Short-Term Investment 1.4% | |
Repurchase Agreement 1.4% | |
Fixed Income Clearing Corp.
0.34%, dated 10/31/17
due 11/1/17
Proceeds at Maturity $17,335,299 (Collateralized by a United States Treasury Note with a rate 1.750% and a maturity date 5/15/23, with a Principal Amount of $17,855,000 and a Market Value of $17,688,859) | | $ | 17,335,135 | | | | 17,335,135 | |
| | | | | | | | |
Total Short-Term Investment
(Cost $17,335,135) | | | | 17,335,135 | |
| | | | | |
Total Investments
(Cost $793,243,419) | | | 99.8 | % | | | 1,234,724,182 | |
Other Assets, Less Liabilities | | | 0.2 | | | | 2,817,007 | |
Net Assets | | | 100.0 | % | | $ | 1,237,541,189 | |
| (a) | Non-income producing security. |
The following abbreviation is used in the preceding pages:
ADR—American Depositary Receipt
| | | | | | |
The notes to the financial statements are an integral part of,
and should be read in conjunction with, the financial statements. | | | | | 15 | |
Portfolio of Investments October 31, 2017 (continued)
The following is a summary of the fair valuations according to the inputs used as of October 31, 2017, for valuing the Fund’s assets.
Asset Valuation Inputs
| | | | | | | | | | | | | | | | |
Description | | Quoted Prices in
Active Markets for
Identical
Assets (Level 1) | | | Significant
Other
Observable
Inputs (Level 2) | | | Significant
Unobservable
Inputs (Level 3) | | | Total | |
| Investments in Securities (a) | | | | | | | | | | | | | | | | |
| Common Stocks | | $ | 1,216,088,793 | | | $ | — | | | $ | — | | | $ | 1,216,088,793 | |
| Convertible Preferred Stocks | | | 1,300,254 | | | | — | | | | — | | | | 1,300,254 | |
| Short-Term Investment | | | | | | | | | | | | | | | | |
Repurchase Agreement | | | — | | | | 17,335,135 | | | | — | | | | 17,335,135 | |
| | | | | | | | | | | | | | | | |
| Total Investments in Securities | | $ | 1,217,389,047 | | | $ | 17,335,135 | | | $ | — | | | $ | 1,234,724,182 | |
| | | | | | | | | | | | | | | | |
| (a) | For a complete listing of investments and their industries, see the Portfolio of Investments. |
The Fund recognizes transfers between the levels as of the beginning of the period.
For the year ended October 31, 2017, the Fund did not have any transfers among levels. (See Note 2)
As of October 31, 2017, the Fund did not hold any investments with significant unobservable inputs (Level 3). (See Note 2)
| | | | |
| 16 | | MainStay MAP Equity Fund | | The notes to the financial statements are an integral part of,
and should be read in conjunction with, the financial statements. |
Statement of Assets and Liabilities as of October 31, 2017
| | | | |
| Assets | |
Investment in securities, at value
(identified cost $793,243,419) | | $ | 1,234,724,182 | |
Cash | | | 222,866 | |
Receivables: | | | | |
Investment securities sold | | | 3,670,541 | |
Dividends and interest | | | 1,281,527 | |
Fund shares sold | | | 183,125 | |
Other assets | | | 38,457 | |
| | | | |
Total assets | | | 1,240,120,698 | |
| | | | |
| |
| Liabilities | | | | |
Payables: | | | | |
Investment securities purchased | | | 871,624 | |
Manager (See Note 3) | | | 799,715 | |
Fund shares redeemed | | | 474,618 | |
NYLIFE Distributors (See Note 3) | | | 201,008 | |
Transfer agent (See Note 3) | | | 104,776 | |
Shareholder communication | | | 81,869 | |
Professional fees | | | 16,255 | |
Custodian | | | 7,959 | |
Trustees | | | 3,056 | |
Accrued expenses | | | 18,629 | |
| | | | |
Total liabilities | | | 2,579,509 | |
| | | | |
Net assets | | $ | 1,237,541,189 | |
| | | | |
| |
| Composition of Net Assets | | | | |
Shares of beneficial interest outstanding (par value of $.01 per share) unlimited number of shares authorized | | $ | 281,726 | |
Additional paid-in capital | | | 674,710,735 | |
| | | | |
| | | 674,992,461 | |
Undistributed net investment income | | | 6,389,436 | |
Accumulated net realized gain (loss) on investments and foreign currency transactions | | | 114,683,450 | |
Net unrealized appreciation (depreciation) on investments | | | 441,480,763 | |
Net unrealized appreciation (depreciation) on translation of other assets and liabilities in foreign currencies | | | (4,921 | ) |
| | | | |
Net assets | | $ | 1,237,541,189 | |
| | | | |
| | | | |
Class A | | | | |
Net assets applicable to outstanding shares | | $ | 389,581,675 | |
| | | | |
Shares of beneficial interest outstanding | | | 8,903,108 | |
| | | | |
Net asset value per share outstanding | | $ | 43.76 | |
Maximum sales charge (5.50% of offering price) | | | 2.55 | |
| | | | |
Maximum offering price per share outstanding | | $ | 46.31 | |
| | | | |
Investor Class | | | | |
Net assets applicable to outstanding shares | | $ | 90,927,893 | |
| | | | |
Shares of beneficial interest outstanding | | | 2,081,746 | |
| | | | |
Net asset value per share outstanding | | $ | 43.68 | |
Maximum sales charge (5.50% of offering price) | | | 2.54 | |
| | | | |
Maximum offering price per share outstanding | | $ | 46.22 | |
| | | | |
Class B | | | | |
Net assets applicable to outstanding shares | | $ | 35,841,399 | |
| | | | |
Shares of beneficial interest outstanding | | | 908,969 | |
| | | | |
Net asset value and offering price per share outstanding | | $ | 39.43 | |
| | | | |
Class C | |
Net assets applicable to outstanding shares | | $ | 79,665,477 | |
| | | | |
Shares of beneficial interest outstanding | | | 2,020,438 | |
| | | | |
Net asset value and offering price per share outstanding | | $ | 39.43 | |
| | | | |
Class I | | | | |
Net assets applicable to outstanding shares | | $ | 634,729,759 | |
| | | | |
Shares of beneficial interest outstanding | | | 14,103,822 | |
| | | | |
Net asset value and offering price per share outstanding | | $ | 45.00 | |
| | | | |
Class R1 | | | | |
Net assets applicable to outstanding shares | | $ | 3,207,965 | |
| | | | |
Shares of beneficial interest outstanding | | | 72,794 | |
| | | | |
Net asset value and offering price per share outstanding | | $ | 44.07 | |
| | | | |
Class R2 | | | | |
Net assets applicable to outstanding shares | | $ | 2,583,205 | |
| | | | |
Shares of beneficial interest outstanding | | | 58,801 | |
| | | | |
Net asset value and offering price per share outstanding | | $ | 43.93 | |
| | | | |
Class R3 | | | | |
Net assets applicable to outstanding shares | | $ | 1,003,816 | |
| | | | |
Shares of beneficial interest outstanding | | | 22,967 | |
| | | | |
Net asset value and offering price per share outstanding | | $ | 43.71 | |
| | | | |
| | | | | | |
The notes to the financial statements are an integral part of,
and should be read in conjunction with, the financial statements. | | | | | 17 | |
Statement of Operations for the year ended October 31, 2017
| | | | |
| Investment Income (Loss) | |
Income | | | | |
Dividends (a) | | $ | 21,927,617 | |
Interest | | | 24,958 | |
Other income | | | 1,360 | |
| | | | |
Total income | | | 21,953,935 | |
| | | | |
Expenses | | | | |
Manager (See Note 3) | | | 9,881,956 | |
Distribution/Service—Class A (See Note 3) | | | 788,632 | |
Distribution/Service—Investor Class (See Note 3) | | | 355,626 | |
Distribution/Service—Class B (See Note 3) | | | 388,302 | |
Distribution/Service—Class C (See Note 3) | | | 868,741 | |
Distribution/Service—Class R2 (See Note 3) | | | 7,527 | |
Distribution/Service—Class R3 (See Note 3) | | | 4,604 | |
Transfer agent (See Note 3) | | | 1,276,622 | |
Shareholder communication | | | 163,889 | |
Professional fees | | | 118,639 | |
Registration | | | 113,482 | |
Trustees | | | 31,991 | |
Custodian | | | 27,795 | |
Interest expense (See Note 6) | | | 9,815 | |
Shareholder service (See Note 3) | | | 6,821 | |
Miscellaneous | | | 67,735 | |
| | | | |
Total expenses | | | 14,112,177 | |
| | | | |
Net investment income (loss) | | | 7,841,758 | |
| | | | |
|
| Realized and Unrealized Gain (Loss) on Investments and Foreign Currency Transactions | |
Net realized gain (loss) on: | | | | |
Investment transactions | | | 153,776,700 | |
Foreign currency transactions | | | 53,044 | |
| | | | |
Net realized gain (loss) on investments and foreign currency transactions | | | 153,829,744 | |
| | | | |
Net change in unrealized appreciation (depreciation) on: | | | | |
Investments | | | 132,515,766 | |
Translation of other assets and liabilities in foreign currencies | | | 5,134 | |
| | | | |
Net change in unrealized appreciation (depreciation) on investments and foreign currency transactions | | | 132,520,900 | |
| | | | |
Net realized and unrealized gain (loss) on investments and foreign currency transactions | | | 286,350,644 | |
| | | | |
Net increase (decrease) in net assets resulting from operations | | $ | 294,192,402 | |
| | | | |
| (a) | Dividends recorded net of foreign withholding taxes in the amount of $167,112. |
| | | | |
| 18 | | MainStay MAP Equity Fund | | The notes to the financial statements are an integral part of,
and should be read in conjunction with, the financial statements. |
Statements of Changes in Net Assets
for the years ended October 31, 2017 and October 31, 2016
| | | | | | | | |
| | | 2017 | | | 2016 | |
| Increase (Decrease) in Net Assets | |
Operations: | | | | | | | | |
Net investment income (loss) | | $ | 7,841,758 | | | $ | 14,569,809 | |
Net realized gain (loss) on investments and foreign currency transactions | | | 153,829,744 | | | | 13,228,981 | |
Net change in unrealized appreciation (depreciation) on investments and foreign currency transactions | | | 132,520,900 | | | | (53,839,648 | ) |
| | | | |
Net increase (decrease) in net assets resulting from operations | | | 294,192,402 | | | | (26,040,858 | ) |
| | | | |
Dividends and distributions to shareholders: | | | | | | | | |
From net investment income: | | | | | | | | |
Class A | | | (3,734,528 | ) | | | (3,061,205 | ) |
Investor Class | | | (1,571,103 | ) | | | (1,189,702 | ) |
Class B | | | (170,343 | ) | | | (17,692 | ) |
Class C | | | (373,608 | ) | | | (46,546 | ) |
Class I | | | (11,063,508 | ) | | | (12,582,733 | ) |
Class R1 | | | (36,693 | ) | | | (38,388 | ) |
Class R2 | | | (41,865 | ) | | | (79,075 | ) |
Class R3 | | | (7,953 | ) | | | (5,958 | ) |
| | | | |
| | | (16,999,601 | ) | | | (17,021,299 | ) |
| | | | |
From net realized gain on investments: | | | | | | | | |
Class A | | | (3,062,641 | ) | | | (51,337,913 | ) |
Investor Class | | | (1,519,616 | ) | | | (23,271,135 | ) |
Class B | | | (493,374 | ) | | | (9,123,617 | ) |
Class C | | | (1,082,445 | ) | | | (20,855,020 | ) |
Class I | | | (7,599,967 | ) | | | (164,507,595 | ) |
Class R1 | | | (27,325 | ) | | | (559,032 | ) |
Class R2 | | | (37,835 | ) | | | (1,526,398 | ) |
Class R3 | | | (9,188 | ) | | | (175,776 | ) |
| | | | |
| | | (13,832,391 | ) | | | (271,356,486 | ) |
| | | | |
Total dividends and distributions to shareholders | | | (30,831,992 | ) | | | (288,377,785 | ) |
| | | | |
Capital share transactions: | | | | | | | | |
Net proceeds from sale of shares | | | 78,914,051 | | | | 109,406,231 | |
Net asset value of shares issued to shareholders in reinvestment of dividends and distributions | | | 30,117,489 | | | | 280,617,480 | |
Cost of shares redeemed | | | (508,018,962 | ) | | | (505,441,284 | ) |
| | | | |
Increase (decrease) in net assets derived from capital share transactions | | | (398,987,422 | ) | | | (115,417,573 | ) |
| | | | |
Net increase (decrease) in net assets | | | (135,627,012 | ) | | | (429,836,216 | ) |
| | | | | | | | |
| | | 2017 | | | 2016 | |
| Net Assets | |
Beginning of year | | | 1,373,168,201 | | | | 1,803,004,417 | |
| | | | |
End of year | | $ | 1,237,541,189 | | | $ | 1,373,168,201 | |
| | | | |
Undistributed net investment income at end of year | | $ | 6,389,436 | | | $ | 13,809,474 | |
| | | | |
| | | | | | |
The notes to the financial statements are an integral part of,
and should be read in conjunction with, the financial statements. | | | | | 19 | |
Financial Highlights selected per share data and ratios
| | | | | | | | | | | | | | | | | | | | |
| | | Year ended October 31, | |
| Class A | | 2017 | | | 2016 | | | 2015 | | | 2014 | | | 2013 | |
Net asset value at beginning of year | | $ | 35.92 | | | $ | 43.32 | | | $ | 46.81 | | | $ | 43.28 | | | $ | 34.07 | |
| | | | | | | | | | | | | | | | | | | | |
Net investment income (loss) (a) | | | 0.21 | | | | 0.33 | | | | 0.38 | | | | 0.67 | | | | 0.41 | |
Net realized and unrealized gain (loss) on investments | | | 8.50 | | | | (0.63 | ) | | | 0.50 | | | | 4.21 | | | | 9.19 | |
Net realized and unrealized gain (loss) on foreign currency transactions ‡ | | | 0.00 | | | | (0.00 | ) | | | (0.00 | ) | | | (0.00 | ) | | | (0.00 | ) |
| | | | | | | | | | | | | | | | | | | | |
Total from investment operations | | | 8.71 | | | | (0.30 | ) | | | 0.88 | | | | 4.88 | | | | 9.60 | |
| | | | | | | | | | | | | | | | | | | | |
| Less dividends and distributions: | | | | | | | | | | | | | | | | | | | | |
From net investment income | | | (0.48 | ) | | | (0.40 | ) | | | (0.67 | ) | | | (0.45 | ) | | | (0.39 | ) |
From net realized gain on investments | | | (0.39 | ) | | | (6.70 | ) | | | (3.70 | ) | | | (0.90 | ) | | | — | |
| | | | | | | | | | | | | | | | | | | | |
Total dividends and distributions | | | (0.87 | ) | | | (7.10 | ) | | | (4.37 | ) | | | (1.35 | ) | | | (0.39 | ) |
| | | | | | | | | | | | | | | | | | | | |
Net asset value at end of year | | $ | 43.76 | | | $ | 35.92 | | | $ | 43.32 | | | $ | 46.81 | | | $ | 43.28 | |
| | | | | | | | | | | | | | | | | | | | |
Total investment return (b) | | | 24.73 | % | | | (0.57 | %) | | | 1.80 | % | | | 11.55 | % | | | 28.47 | % |
| Ratios (to average net assets)/Supplemental Data: | | | | | | | | | | | | | | | | | | | | |
Net investment income (loss) | | | 0.52 | % | | | 0.92 | % | | | 0.85 | % | | | 1.49 | % | | | 1.07 | % |
Net expenses | | | 1.10 | %(c) | | | 1.09 | % (c) | | | 1.11 | % | | | 1.11 | % | | | 1.11 | % |
Portfolio turnover rate | | | 15 | % | | | 42 | % | | | 51 | % | | | 32 | % | | | 29 | % |
Net assets at end of year (in 000’s) | | $ | 389,582 | | | $ | 285,431 | | | $ | 336,812 | | | $ | 364,162 | | | $ | 356,657 | |
| ‡ | Less than one cent per share. |
| (a) | Per share data based on average shares outstanding during the year. |
| (b) | Total investment return is calculated exclusive of sales charges and assumes the reinvestment of dividends and distributions. For periods of less than one year, total return is not annualized. |
| (c) | Net of interest expense which is less than one-tenth of a percent. (See Note 6) |
| | | | | | | | | | | | | | | | | | | | |
| | | Year ended October 31, | |
| Investor Class | | 2017 | | | 2016 | | | 2015 | | | 2014 | | | 2013 | |
Net asset value at beginning of year | | $ | 35.85 | | | $ | 43.27 | | | $ | 46.77 | | | $ | 43.24 | | | $ | 34.04 | |
| | | | | | | | | | | | | | | | | | | | |
Net investment income (loss) (a) | | | 0.14 | | | | 0.25 | | | | 0.31 | | | | 0.60 | | | | 0.34 | |
Net realized and unrealized gain (loss) on investments | | | 8.49 | | | | (0.63 | ) | | | 0.50 | | | | 4.21 | | | | 9.18 | |
Net realized and unrealized gain (loss) on foreign currency transactions ‡ | | | 0.00 | | | | (0.00 | ) | | | (0.00 | ) | | | (0.00 | ) | | | (0.00 | ) |
| | | | | | | | | | | | | | | | | | | | |
Total from investment operations | | | 8.63 | | | | (0.38 | ) | | | 0.81 | | | | 4.81 | | | | 9.52 | |
| | | | | | | | | | | | | | | | | | | | |
| Less dividends and distributions: | | | | | | | | | | | | | | | | | | | | |
From net investment income | | | (0.41 | ) | | | (0.34 | ) | | | (0.61 | ) | | | (0.38 | ) | | | (0.32 | ) |
From net realized gain on investments | | | (0.39 | ) | | | (6.70 | ) | | | (3.70 | ) | | | (0.90 | ) | | | — | |
| | | | | | | | | | | | | | | | | | | | |
Total dividends and distributions | | | (0.80 | ) | | | (7.04 | ) | | | (4.31 | ) | | | (1.28 | ) | | | (0.32 | ) |
| | | | | | | | | | | | | | | | | | | | |
Net asset value at end of year | | $ | 43.68 | | | $ | 35.85 | | | $ | 43.27 | | | $ | 46.77 | | | $ | 43.24 | |
| | | | | | | | | | | | | | | | | | | | |
Total investment return (b) | | | 24.50 | % | | | (0.79 | %) | | | 1.63 | % | | | 11.38 | % | | | 28.26 | % |
| Ratios (to average net assets)/Supplemental Data: | | | | | | | | | | | | | | | | | | | | |
Net investment income (loss) | | | 0.36 | % | | | 0.71 | % | | | 0.71 | % | | | 1.34 | % | | | 0.88 | % |
Net expenses | | | 1.29 | %(c) | | | 1.29 | % (c) | | | 1.25 | % | | | 1.26 | % | | | 1.30 | % |
Portfolio turnover rate | | | 15 | % | | | 42 | % | | | 51 | % | | | 32 | % | | | 29 | % |
Net assets at end of year (in 000’s) | | $ | 90,928 | | | $ | 139,775 | | | $ | 151,582 | | | $ | 152,202 | | | $ | 144,892 | |
| ‡ | Less than one cent per share. |
| (a) | Per share data based on average shares outstanding during the year. |
| (b) | Total investment return is calculated exclusive of sales charges and assumes the reinvestment of dividends and distributions. For periods of less than one year, total return is not annualized. |
| (c) | Net of interest expense which is less than one-tenth of a percent. (See Note 6) |
| | | | |
| 20 | | MainStay MAP Equity Fund | | The notes to the financial statements are an integral part of,
and should be read in conjunction with, the financial statements. |
Financial Highlights selected per share data and ratios
| | | | | | | | | | | | | | | | | | | | |
| | | Year ended October 31, | |
| Class B | | 2017 | | | 2016 | | | 2015 | | | 2014 | | | 2013 | |
Net asset value at beginning of year | | $ | 32.42 | | | $ | 39.74 | | | $ | 43.25 | | | $ | 40.08 | | | $ | 31.55 | |
| | | | | | | | | | | | | | | | | | | | |
Net investment income (loss) (a) | | | (0.13 | ) | | | (0.01 | ) | | | (0.01 | ) | | | 0.26 | | | | 0.06 | |
Net realized and unrealized gain (loss) on investments | | | 7.67 | | | | (0.60 | ) | | | 0.48 | | | | 3.89 | | | | 8.54 | |
Net realized and unrealized gain (loss) on foreign currency transactions ‡ | | | 0.00 | | | | (0.00 | ) | | | (0.00 | ) | | | (0.00 | ) | | | (0.00 | ) |
| | | | | | | | | | | | | | | | | | | | |
Total from investment operations | | | 7.54 | | | | (0.61 | ) | | | 0.47 | | | | 4.15 | | | | 8.60 | |
| | | | | | | | | | | | | | | | | | | | |
| Less dividends and distributions: | | | | | | | | | | | | | | | | | | | | |
From net investment income | | | (0.14 | ) | | | (0.01 | ) | | | (0.28 | ) | | | (0.08 | ) | | | (0.07 | ) |
From net realized gain on investments | | | (0.39 | ) | | | (6.70 | ) | | | (3.70 | ) | | | (0.90 | ) | | | — | |
| | | | | | | | | | | | | | | | | | | | |
Total dividends and distributions | | | (0.53 | ) | | | (6.71 | ) | | | (3.98 | ) | | | (0.98 | ) | | | (0.07 | ) |
| | | | | | | | | | | | | | | | | | | | |
Net asset value at end of year | | $ | 39.43 | | | $ | 32.42 | | | $ | 39.74 | | | $ | 43.25 | | | $ | 40.08 | |
| | | | | | | | | | | | | | | | | | | | |
Total investment return (b) | | | 23.55 | % | | | (1.52 | %) | | | 0.89 | % | | | 10.55 | % | | | 27.30 | % |
| Ratios (to average net assets)/Supplemental Data: | | | | | | | | | | | | | | | | | | | | |
Net investment income (loss) | | | (0.37 | %) | | | (0.03 | %) | | | (0.03 | %) | | | 0.63 | % | | | 0.16 | % |
Net expenses | | | 2.05 | % (c) | | | 2.04 | % (c) | | | 2.00 | % | | | 2.01 | % | | | 2.05 | % |
Portfolio turnover rate | | | 15 | % | | | 42 | % | | | 51 | % | | | 32 | % | | | 29 | % |
Net assets at end of year (in 000’s) | | $ | 35,841 | | | $ | 40,977 | | | $ | 54,423 | | | $ | 71,195 | | | $ | 82,695 | |
| ‡ | Less than one cent per share. |
| (a) | Per share data based on average shares outstanding during the year. |
| (b) | Total investment return is calculated exclusive of sales charges and assumes the reinvestment of dividends and distributions. For periods of less than one year, total return is not annualized. |
| (c) | Net of interest expense which is less than one-tenth of a percent. (See Note 6) |
| | | | | | | | | | | | | | | | | | | | |
| | | Year ended October 31, | |
| Class C | | 2017 | | | 2016 | | | 2015 | | | 2014 | | | 2013 | |
Net asset value at beginning of year | | $ | 32.42 | | | $ | 39.73 | | | $ | 43.25 | | | $ | 40.08 | | | $ | 31.56 | |
| | | | | | | | | | | | | | | | | | | | |
Net investment income (loss) (a) | | | (0.13 | ) | | | (0.01 | ) | | | (0.02 | ) | | | 0.25 | | | | 0.05 | |
Net realized and unrealized gain (loss) on investments | | | 7.67 | | | | (0.59 | ) | | | 0.48 | | | | 3.90 | | | | 8.54 | |
Net realized and unrealized gain (loss) on foreign currency transactions ‡ | | | 0.00 | | | | (0.00 | ) | | | (0.00 | ) | | | (0.00 | ) | | | (0.00 | ) |
| | | | | | | | | | | | | | | | | | | | |
Total from investment operations | | | 7.54 | | | | (0.60 | ) | | | 0.46 | | | | 4.15 | | | | 8.59 | |
| | | | | | | | | | | | | | | | | | | | |
| Less dividends and distributions: | | | | | | | | | | | | | | | | | | | | |
From net investment income | | | (0.14 | ) | | | (0.01 | ) | | | (0.28 | ) | | | (0.08 | ) | | | (0.07 | ) |
From net realized gain on investments | | | (0.39 | ) | | | (6.70 | ) | | | (3.70 | ) | | | (0.90 | ) | | | — | |
| | | | | | | | | | | | | | | | | | | | |
Total dividends and distributions | | | (0.53 | ) | | | (6.71 | ) | | | (3.98 | ) | | | (0.98 | ) | | | (0.07 | ) |
| | | | | | | | | | | | | | | | | | | | |
Net asset value at end of year | | $ | 39.43 | | | $ | 32.42 | | | $ | 39.73 | | | $ | 43.25 | | | $ | 40.08 | |
| | | | | | | | | | | | | | | | | | | | |
Total investment return (b) | | | 23.55 | % | | | (1.52 | %) | | | 0.89 | % | | | 10.55 | % | | | 27.26 | % |
| Ratios (to average net assets)/Supplemental Data: | | | | | | | | | | | | | | | | | | | | |
Net investment income (loss) | | | (0.37 | %) | | | (0.03 | %) | | | (0.04 | %) | | | 0.60 | % | | | 0.14 | % |
Net expenses | | | 2.05 | % (c) | | | 2.04 | % (c) | | | 2.00 | % | | | 2.01 | % | | | 2.05 | % |
Portfolio turnover rate | | | 15 | % | | | 42 | % | | | 51 | % | | | 32 | % | | | 29 | % |
Net assets at end of year (in 000’s) | | $ | 79,665 | | | $ | 92,457 | | | $ | 125,642 | | | $ | 143,427 | | | $ | 141,628 | |
| ‡ | Less than one cent per share. |
| (a) | Per share data based on average shares outstanding during the year. |
| (b) | Total investment return is calculated exclusive of sales charges and assumes the reinvestment of dividends and distributions. For periods of less than one year, total return is not annualized. |
| (c) | Net of interest expense which is less than one-tenth of a percent. (See Note 6) |
| | | | | | |
The notes to the financial statements are an integral part of,
and should be read in conjunction with, the financial statements. | | | | | 21 | |
Financial Highlights selected per share data and ratios
| | | | | | | | | | | | | | | | | | | | |
| | | Year ended October 31, | |
| Class I | | 2017 | | | 2016 | | | 2015 | | | 2014 | | | 2013 | |
Net asset value at beginning of year | | $ | 36.92 | | | $ | 44.35 | | | $ | 47.82 | | | $ | 44.18 | | | $ | 34.77 | |
| | | | | | | | | | | | | | | | | | | | |
Net investment income (loss) (a) | | | 0.34 | | | | 0.43 | | | | 0.50 | | | | 0.80 | | | | 0.52 | |
Net realized and unrealized gain (loss) on investments | | | 8.70 | | | | (0.65 | ) | | | 0.52 | | | | 4.29 | | | | 9.37 | |
Net realized and unrealized gain (loss) on foreign currency transactions ‡ | | | 0.00 | | | | (0.00 | ) | | | (0.00 | ) | | | (0.00 | ) | | | (0.00 | ) |
| | | | | | | | | | | | | | | | | | | | |
Total from investment operations | | | 9.04 | | | | (0.22 | ) | | | 1.02 | | | | 5.09 | | | | 9.89 | |
| | | | | | | | | | | | | | | | | | | | |
| Less dividends and distributions: | | | | | | | | | | | | | | | | | | | | |
From net investment income | | | (0.57 | ) | | | (0.51 | ) | | | (0.79 | ) | | | (0.55 | ) | | | (0.48 | ) |
From net realized gain on investments | | | (0.39 | ) | | | (6.70 | ) | | | (3.70 | ) | | | (0.90 | ) | | | — | |
| | | | | | | | | | | | | | | | | | | | |
Total dividends and distributions | | | (0.96 | ) | | | (7.21 | ) | | | (4.49 | ) | | | (1.45 | ) | | | (0.48 | ) |
| | | | | | | | | | | | | | | | | | | | |
Net asset value at end of year | | $ | 45.00 | | | $ | 36.92 | | | $ | 44.35 | | | $ | 47.82 | | | $ | 44.18 | |
| | | | | | | | | | | | | | | | | | | | |
Total investment return (b) | | | 25.01 | % | | | (0.33 | %) | | | 2.06 | % | | | 11.82 | % | | | 28.79 | % |
| Ratios (to average net assets)/Supplemental Data: | | | | | | | | | | | | | | | | | | | | |
Net investment income (loss) | | | 0.84 | % | | | 1.17 | % | | | 1.10 | % | | | 1.76 | % | | | 1.33 | % |
Net expenses | | | 0.85 | %(c) | | | 0.84 | % (c) | | | 0.86 | % | | | 0.86 | % | | | 0.86 | % |
Portfolio turnover rate | | | 15 | % | | | 42 | % | | | 51 | % | | | 32 | % | | | 29 | % |
Net assets at end of year (in 000’s) | | $ | 634,730 | | | $ | 807,694 | | | $ | 1,119,884 | | | $ | 1,506,564 | | | $ | 1,417,814 | |
| ‡ | Less than one cent per share. |
| (a) | Per share data based on average shares outstanding during the year. |
| (b) | Total investment return is calculated exclusive of sales charges and assumes the reinvestment of dividends and distributions. Class I shares are not subject to sales charges. For periods of less than one year, total return is not annualized. |
| (c) | Net of interest expense which is less than one-tenth of a percent. (See Note 6) |
| | | | | | | | | | | | | | | | | | | | |
| | | Year ended October 31, | |
| Class R1 | | 2017 | | | 2016 | | | 2015 | | | 2014 | | | 2013 | |
Net asset value at beginning of year | | $ | 36.16 | | | $ | 43.57 | | | $ | 47.05 | | | $ | 43.49 | | | $ | 34.23 | |
| | | | | | | | | | | | | | | | | | | | |
Net investment income (loss) (a) | | | 0.27 | | | | 0.38 | | | | 0.45 | | | | 0.73 | | | | 0.54 | |
Net realized and unrealized gain (loss) on investments | | | 8.56 | | | | (0.63 | ) | | | 0.50 | | | | 4.24 | | | | 9.14 | |
Net realized and unrealized gain (loss) on foreign currency transactions ‡ | | | 0.00 | | | | (0.00 | ) | | | (0.00 | ) | | | (0.00 | ) | | | (0.00 | ) |
| | | | | | | | | | | | | | | | | | | | |
Total from investment operations | | | 8.83 | | | | (0.25 | ) | | | 0.95 | | | | 4.97 | | | | 9.68 | |
| | | | | | | | �� | | | | | | | | | | | | |
| Less dividends and distributions: | | | | | | | | | | | | | | | | | | | | |
From net investment income | | | (0.53 | ) | | | (0.46 | ) | | | (0.73 | ) | | | (0.51 | ) | | | (0.42 | ) |
From net realized gain on investments | | | (0.39 | ) | | | (6.70 | ) | | | (3.70 | ) | | | (0.90 | ) | | | — | |
| | | | | | | | | | | | | | | | | | | | |
Total dividends and distributions | | | (0.92 | ) | | | (7.16 | ) | | | (4.43 | ) | | | (1.41 | ) | | | (0.42 | ) |
| | | | | | | | | | | | | | | | | | | | |
Net asset value at end of year | | $ | 44.07 | | | $ | 36.16 | | | $ | 43.57 | | | $ | 47.05 | | | $ | 43.49 | |
| | | | | | | | | | | | | | | | | | | | |
Total investment return (b) | | | 24.92 | % | | | (0.43 | %) | | | 1.94 | % | | | 11.71 | % | | | 28.63 | % |
| Ratios (to average net assets)/Supplemental Data: | | | | | | | | | | | | | | | | | | | | |
Net investment income (loss) | | | 0.67 | % | | | 1.06 | % | | | 1.02 | % | | | 1.63 | % | | | 1.43 | % |
Net expenses | | | 0.95 | %(c) | | | 0.94 | % (c) | | | 0.96 | % | | | 0.96 | % | | | 0.96 | % |
Portfolio turnover rate | | | 15 | % | | | 42 | % | | | 51 | % | | | 32 | % | | | 29 | % |
Net assets at end of year (in 000’s) | | $ | 3,208 | | | $ | 2,500 | | | $ | 3,607 | | | $ | 7,368 | | | $ | 6,737 | |
| ‡ | Less than one cent per share. |
| (a) | Per share data based on average shares outstanding during the year. |
| (b) | Total investment return is calculated exclusive of sales charges and assumes the reinvestment of dividends and distributions. Class R1 shares are not subject to sales charges. For periods of less than one year, total return is not annualized. |
| (c) | Net of interest expense which is less than one-tenth of a percent. (See Note 6) |
| | | | |
| 22 | | MainStay MAP Equity Fund | | The notes to the financial statements are an integral part of,
and should be read in conjunction with, the financial statements. |
Financial Highlights selected per share data and ratios
| | | | | | | | | | | | | | | | | | | | |
| | | Year ended October 31, | |
| Class R2 | | 2017 | | | 2016 | | | 2015 | | | 2014 | | | 2013 | |
Net asset value at beginning of year | | $ | 36.05 | | | $ | 43.44 | | | $ | 46.92 | | | $ | 43.38 | | | $ | 34.12 | |
| | | | | | | | | | | | | | | | | | | | |
Net investment income (loss) (a) | | | 0.20 | | | | 0.29 | | | | 0.34 | | | | 0.63 | | | | 0.38 | |
Net realized and unrealized gain (loss) on investments | | | 8.50 | | | | (0.63 | ) | | | 0.49 | | | | 4.22 | | | | 9.21 | |
Net realized and unrealized gain (loss) on foreign currency transactions ‡ | | | 0.00 | | | | (0.00 | ) | | | (0.00 | ) | | | (0.00 | ) | | | (0.00 | ) |
| | | | | | | | | | | | | | | | | | | | |
Total from investment operations | | | 8.70 | | | | (0.34 | ) | | | 0.83 | | | | 4.85 | | | | 9.59 | |
| | | | | | | | | | | | | | | | | | | | |
| Less dividends and distributions: | | | | | | | | | | | | | | | | | | | | |
From net investment income | | | (0.43 | ) | | | (0.35 | ) | | | (0.61 | ) | | | (0.41 | ) | | | (0.33 | ) |
From net realized gain on investments | | | (0.39 | ) | | | (6.70 | ) | | | (3.70 | ) | | | (0.90 | ) | | | — | |
| | | | | | | | | | | | | | | | | | | | |
Total dividends and distributions | | | (0.82 | ) | | | (7.05 | ) | | | (4.31 | ) | | | (1.31 | ) | | | (0.33 | ) |
| | | | | | | | | | | | | | | | | | | | |
Net asset value at end of year | | $ | 43.93 | | | $ | 36.05 | | | $ | 43.44 | | | $ | 46.92 | | | $ | 43.38 | |
| | | | | | | | | | | | | | | | | | | | |
Total investment return (b) | | | 24.60 | % | | | (0.68 | %) | | | 1.68 | % | | | 11.43 | % | | | 28.36 | % |
| Ratios (to average net assets)/Supplemental Data: | | | | | | | | | | | | | | | | | | | | |
Net investment income (loss) | | | 0.51 | % | | | 0.80 | % | | | 0.76 | % | | | 1.42 | % | | | 0.98 | % |
Net expenses | | | 1.20 | %(c) | | | 1.20 | % (c) | | | 1.21 | % | | | 1.21 | % | | | 1.21 | % |
Portfolio turnover rate | | | 15 | % | | | 42 | % | | | 51 | % | | | 32 | % | | | 29 | % |
Net assets at end of year (in 000’s) | | $ | 2,583 | | | $ | 3,528 | | | $ | 9,993 | | | $ | 15,956 | | | $ | 20,140 | |
| ‡ | Less than one cent per share. |
| (a) | Per share data based on average shares outstanding during the year. |
| (b) | Total investment return is calculated exclusive of sales charges and assumes the reinvestment of dividends and distributions. Class R2 shares are not subject to sales charges. For periods of less than one year, total return is not annualized. |
| (c) | Net of interest expense which is less than one-tenth of a percent. (See Note 6) |
| | | | | | | | | | | | | | | | | | | | |
| | | Year ended October 31, | |
| Class R3 | | 2017 | | | 2016 | | | 2015 | | | 2014 | | | 2013 | |
Net asset value at beginning of year | | $ | 35.87 | | | $ | 43.22 | | | $ | 46.68 | | | $ | 43.16 | | | $ | 33.94 | |
| | | | | | | | | | | | | | | | | | | | |
Net investment income (loss) (a) | | | 0.07 | | | | 0.20 | | | | 0.22 | | | | 0.54 | | | | 0.29 | |
Net realized and unrealized gain (loss) on investments | | | 8.50 | | | | (0.62 | ) | | | 0.51 | | | | 4.17 | | | | 9.16 | |
Net realized and unrealized gain (loss) on foreign currency transactions ‡ | | | 0.00 | | | | (0.00 | ) | | | (0.00 | ) | | | (0.00 | ) | | | (0.00 | ) |
| | | | | | | | | | | | | | | | | | | | |
Total from investment operations | | | 8.57 | | | | (0.42 | ) | | | 0.73 | | | | 4.71 | | | | 9.45 | |
| | | | | | | | | | | | | | | | | | | | |
| Less dividends and distributions: | | | | | | | | | | | | | | | | | | | | |
From net investment income | | | (0.34 | ) | | | (0.23 | ) | | | (0.49 | ) | | | (0.29 | ) | | | (0.23 | ) |
From net realized gain on investments | | | (0.39 | ) | | | (6.70 | ) | | | (3.70 | ) | | | (0.90 | ) | | | — | |
| | | | | | | | | | | | | | | | | | | | |
Total dividends and distributions | | | (0.73 | ) | | | (6.93 | ) | | | (4.19 | ) | | | (1.19 | ) | | | (0.23 | ) |
| | | | | | | | | | | | | | | | | | | | |
Net asset value at end of year | | $ | 43.71 | | | $ | 35.87 | | | $ | 43.22 | | | $ | 46.68 | | | $ | 43.16 | |
| | | | | | | | | | | | | | | | | | | | |
Total investment return (b) | | | 24.29 | % | | | (0.91 | %) | | | 1.42 | % | | | 11.18 | % | | | 28.03 | % |
| Ratios (to average net assets)/Supplemental Data: | | | | | | | | | | | | | | | | | | | | |
Net investment income (loss) | | | 0.17 | % | | | 0.57 | % | | | 0.51 | % | | | 1.20 | % | | | 0.74 | % |
Net expenses | | | 1.45 | %(c) | | | 1.44 | % (c) | | | 1.46 | % | | | 1.46 | % | | | 1.46 | % |
Portfolio turnover rate | | | 15 | % | | | 42 | % | | | 51 | % | | | 32 | % | | | 29 | % |
Net assets at end of year (in 000’s) | | $ | 1,004 | | | $ | 806 | | | $ | 1,062 | | | $ | 1,400 | | | $ | 1,696 | |
| ‡ | Less than one cent per share. |
| (a) | Per share data based on average shares outstanding during the year. |
| (b) | Total investment return is calculated exclusive of sales charges and assumes the reinvestment of dividends and distributions. Class R3 shares are not subject to sales charges. For periods of less than one year, total return is not annualized. |
| (c) | Net of interest expense which is less than one-tenth of a percent. (See Note 6) |
| | | | | | |
The notes to the financial statements are an integral part of,
and should be read in conjunction with, the financial statements. | | | | | 23 | |
Notes to Financial Statements
Note 1–Organization and Business
The MainStay Funds (the “Trust”) was organized on January 9, 1986, as a Massachusetts business trust, and is governed by a Declaration of Trust. The Trust is registered under the Investment Company Act of 1940, as amended (the “1940 Act”), as an open-end management investment company, and is comprised of twelve funds (collectively referred to as the “Funds”). These financial statements and notes relate to the MainStay MAP Equity Fund (formerly known as MainStay MAP Fund) (the “Fund”) a “diversified” fund, as that term is defined in the 1940 Act, as interpreted or modified by regulatory authorities having jurisdiction, from time to time.
The Fund currently has ten classes of shares registered for sale. Class A, Class B and Class C shares commenced operations on June 9, 1999. Class I shares commenced operations in 1970 (under a former class designation) and were redesignated as Class I shares on June 9, 1999. Class R1 and Class R2 shares commenced operations on January 2, 2004. Class R3 shares commenced operations on April 28, 2006. Class R6 and Class T shares were registered for sale effective as of February 28, 2017. As of October 31, 2017, Class R6 and Class T shares were not yet offered for sale. Investor Class shares commenced operations on February 28, 2008. Effective February 28, 2017, Class B shares of the MainStay Group of Funds were closed to all new purchases as well as additional investments by existing Class B shareholders. Existing Class B shareholders may continue to reinvest dividends and capital gains distributions, as well as exchange their Class B shares for Class B shares of other MainStay Group of Funds as permitted by the current exchange privileges. Class B shareholders continue to be subject to any applicable contingent deferred sales charge (“CDSC”) at the time of redemption. All other features of the Class B shares, including but not limited to the fees and expenses applicable to Class B shares, remain unchanged. Unless redeemed, Class B shareholders will remain in Class B shares of their respective fund until the Class B shares are converted to Class A or Investor Class shares pursuant to the applicable conversion schedule.
Class A and Investor Class shares are offered at net asset value (“NAV”) per share plus an initial sales charge. No initial sales charge applies to investments of $1 million or more (and certain other qualified purchases) in Class A and Investor Class shares. Effective August 1, 2017, a CDSC of 1.00% may be imposed on certain redemptions of Class A and Investor Class shares made within 18 months of the date of purchase on shares that were purchased without an initial sales charge. For purchases of Class A and Investor Class shares made from January 1, 2017, through July 31, 2017, a CDSC of 1.00% may be imposed on certain redemptions of such shares made within 24 months of the date of purchase on shares that were purchased without an initial sales charge. For purchases of Class A and Investor Class shares made prior to January 1, 2017, a CDSC of 1.00% may be imposed on certain redemptions of such shares made within one year of the date of purchase on shares that were purchased without an initial sales charge. Class C shares are offered at NAV without an initial sales charge, although a 1.00% CDSC may be imposed on redemptions made within one year of the date of purchase of Class C shares. When Class B shares were offered, they were offered at NAV without an initial sales charge, although a CDSC that declines depending on the number of years a shareholder has held its Class B shares may be imposed on
redemptions made within six years of the date of purchase of such shares. Class T shares are currently expected to be offered at NAV plus an initial sales charge. Class I, Class R1, Class R2 and Class R3 shares are offered at NAV and are not subject to a sales charge. Class R6 shares are currently expected to be offered at NAV and to not be subject to a sales charge. Depending upon eligibility, Class B shares convert to either Class A or Investor Class shares at the end of the calendar quarter eight years after the date they were purchased. Additionally, as disclosed in the Fund’s prospectus, Class A shares may convert automatically to Investor Class shares and Investor Class shares may convert automatically to Class A shares. Under certain circumstances and as may be permitted by the Trust’s multiple class plan pursuant to Rule 18f-3 under the 1940 Act, specified share classes of the Fund may be converted to one or more other share classes of the Fund as disclosed in the capital share transactions within these Notes. The classes of shares have the same voting (except for issues that relate solely to one class), dividend, liquidation and other rights, and the same terms and conditions, except that under distribution plans pursuant to Rule 12b-1 under the 1940 Act, Class B and Class C shares are subject to higher distribution and/or service fees than Class A, Investor Class, Class T, Class R2 and Class R3 shares. Class I, Class R1 and Class R6 shares are not subject to a distribution and/or service fee. Class R1, Class R2 and Class R3 shares are subject to a shareholder service fee, which is in addition to fees paid under the distribution plans for Class R2 and Class R3 shares.
The Fund’s investment objective is to seek long-term appreciation of capital.
Note 2–Significant Accounting Policies
The Fund is an investment company and accordingly follows the investment company accounting and reporting guidance of the Financial Accounting Standards Board (“FASB”) Accounting Standard Codification Topic 946 Financial Services—Investment Companies. The Fund prepares its financial statements in accordance with generally accepted accounting principles (“GAAP”) in the United States of America and follows the significant accounting policies described below.
(A) Securities Valuation. Investments are usually valued as of the close of regular trading on the New York Stock Exchange (the “Exchange”) (usually 4:00 p.m. Eastern time) on each day the Fund is open for business (“valuation date”).
The Board of Trustees of the Trust (the “Board”) adopted procedures establishing methodologies for the valuation of the Fund’s securities and other assets and delegated the responsibility for valuation determinations under those procedures to the Valuation Committee of the Trust (the “Valuation Committee”). The Board authorized the Valuation Committee to appoint a Valuation Subcommittee (the “Subcommittee”) to deal in the first instance with establishing the prices of securities for which market quotations are not readily available or the prices of which are not otherwise readily determinable under these procedures. The Subcommittee meets (in person, via electronic mail or via teleconference) on an as-needed basis. Subsequently, the Valuation Committee meets to ensure that actions taken by the Subcommittee were appropriate. The procedures state that, subject to the oversight of the Board and unless otherwise noted, the responsibility for the day-to-day valuation of portfolio assets (including fair value measure-
| | |
| 24 | | MainStay MAP Equity Fund |
ments for the Fund’s assets and liabilities) rests with New York Life Investment Management LLC (“New York Life Investments” or the “Manager”), aided to whatever extent necessary by the Subadvisors (as defined in Note 3(A)).
To assess the appropriateness of security valuations, the Manager, the Subadvisors or the Fund’s third-party service provider, who is subject to oversight by the Manager, regularly compares prior day prices, prices on comparable securities and the sale prices to the prior and current day prices and challenges prices with changes exceeding certain tolerance levels with third-party pricing services or broker sources. For those securities valued through either a standardized fair valuation methodology or a fair valuation measurement, the Subcommittee deals in the first instance with such valuation and the Valuation Committee reviews and affirms, if appropriate, the reasonableness of the valuation based on such methodologies and measurements on a regular basis after considering information that is reasonably available and deemed relevant by the Valuation Committee. Any action taken by the Subcommittee with respect to the valuation of a portfolio security or other asset is submitted for review and ratification (if appropriate) to the Valuation Committee and the Board at the next regularly scheduled meeting.
“Fair value” is defined as the price the Fund would reasonably expect to receive upon selling an asset or liability in an orderly transaction to an independent buyer in the principal or most advantageous market for the asset or liability. Fair value measurements are determined within a framework that establishes a three-tier hierarchy which maximizes the use of observable market data and minimizes the use of unobservable inputs to establish a classification of fair value measurements for disclosure purposes. “Inputs” refer broadly to the assumptions that market participants would use in pricing the asset or liability, including assumptions about risk, such as the risk inherent in a particular valuation technique used to measure fair value using a pricing model and/or the risk inherent in the inputs for the valuation technique. Inputs may be observable or unobservable. Observable inputs reflect the assumptions market participants would use in pricing the asset or liability based on market data obtained from sources independent of the Fund. Unobservable inputs reflect the Fund’s own assumptions about the assumptions market participants would use in pricing the asset or liability based on the information available. The inputs or methodology used for valuing assets or liabilities may not be an indication of the risks associated with investing in those assets or liabilities. The three-tier hierarchy of inputs is summarized below.
| • | | Level 1—quoted prices in active markets for an identical asset or liability |
| • | | Level 2—other significant observable inputs (including quoted prices for a similar asset or liability in active markets, interest rates and yield curves, prepayment speeds, credit risk, etc.) |
| • | | Level 3—significant unobservable inputs (including the Fund’s own assumptions about the assumptions that market participants would use in measuring fair value of an asset or liability) |
The level of an asset or liability within the fair value hierarchy is based on the lowest level of an input, both individually and in the aggregate, that is significant to the fair value measurement. As of October 31, 2017, the aggregate value by input level of the Fund’s assets and liabilities is included at the end of the Fund’s Portfolio of Investments.
The Fund may use third-party vendor evaluations, whose prices may be derived from one or more of the following standard inputs, among others:
| | |
• Broker/dealer quotes | | • Benchmark securities |
• Two-sided markets | | • Reference data (corporate actions or material event notices) |
• Bids/offers | | • Monthly payment information |
• Industry and economic events | | • Reported trades |
An asset or liability for which market values cannot be measured using the methodologies described above is valued by methods deemed reasonable in good faith by the Valuation Committee, following the procedures established by the Board, to represent fair value. Under these procedures, the Fund generally uses a market-based approach which may use related or comparable assets or liabilities, recent transactions, market multiples, book values and other relevant information. The Fund may also use an income-based valuation approach in which the anticipated future cash flows of the asset or liability are discounted to calculate fair value. Discounts may also be applied due to the nature and/or duration of any restrictions on the disposition of the asset or liability. Fair value represents a good faith approximation of the value of a security. Fair value determinations involve the consideration of a number of subjective factors, an analysis of applicable facts and circumstances and the exercise of judgment. As a result, it is possible that the fair value for a security determined in good faith in accordance with the Fund’s valuation procedures may differ from valuations for the same security determined by other funds using their own valuation procedures. Although the Fund’s valuation procedures are designed to value a security at the price the Fund may reasonably expect to receive upon the security’s sale in an orderly transaction, there can be no assurance that any fair value determination thereunder would, in fact, approximate the amount that the Fund would actually realize upon the sale of the security or the price at which the security would trade if a reliable market price were readily available. During the year ended October 31, 2017, there were no material changes to the fair value methodologies.
Securities which may be valued in this manner include, but are not limited to: (i) a security for which trading has been halted or suspended; (ii) a debt security that has recently gone into default and for which there is not a current market quotation; (iii) a security of an issuer that has entered into a restructuring; (iv) a security that has been de-listed from a national exchange; (v) a security for which the market price is not readily available from a third-party pricing source or, if so provided, does not, in the opinion of the Manager or Subadvisors reflect the security’s market value; (vi) a security subject to trading collars for which no or limited trading takes place; and (vii) a security whose principal market has been temporarily closed at a time when, under normal conditions, it would be open. Securities for which market quotations or observable inputs are not readily available are generally categorized as Level 3 in the hierarchy. As of October 31, 2017, there were no securities held by the Fund that were fair valued in such a manner.
Certain securities held by the Fund may principally trade in foreign markets. Events may occur between the time the foreign markets close and the time at which the Fund’s NAVs are calculated. These events may include, but are not limited to, situations relating to a single issuer
Notes to Financial Statements (continued)
in a market sector, significant fluctuations in U.S. or foreign markets, natural disasters, armed conflicts, governmental actions or other developments not tied directly to the securities markets. Should the Manager or Subadvisors conclude that such events may have affected the accuracy of the last price of such securities reported on the local foreign market, the Subcommittee may, pursuant to procedures adopted by the Board, adjust the value of the local price to reflect the estimated impact on the price of such securities as a result of such events. In this instance, securities are generally categorized as Level 3 in the hierarchy. Additionally, certain foreign equity securities are also fair valued whenever the movement of a particular index exceeds certain thresholds. In such cases, the securities are fair valued by applying factors provided by a third-party vendor in accordance with valuation procedures adopted by the Board and are generally categorized as Level 2 in the hierarchy. As of October 31, 2017, no foreign equity securities held by the Fund were fair valued in such a manner.
Equity securities are valued at the last quoted sales prices as of the close of regular trading on the relevant exchange on each valuation date. Securities that are not traded on the valuation date are valued at the mean of the last quoted bid and ask prices. Prices are normally taken from the principal market in which each security trades. Investments in mutual funds, including money market funds, are valued at their respective NAVs as of the close of the Exchange on the valuation date. These securities are generally categorized as Level 1 in the hierarchy.
Temporary cash investments acquired in excess of 60 days to maturity at the time of purchase are valued using the latest bid prices or using valuations based on a matrix system (which considers such factors as security prices, yields, maturities and ratings), both as furnished by independent pricing services. Other temporary cash investments which mature in 60 days or less at the time of purchase (“Short-Term Investments”) are valued using the amortized cost method of valuation, unless the use of such method would be inappropriate. The amortized cost method involves valuing a security at its cost on the date of purchase and thereafter assuming a constant amortization to maturity of the difference between such cost and the value on maturity date. Amortized cost approximates the current fair value of a security. Securities valued using the amortized cost method are not valued using quoted prices in an active market and are generally categorized as Level 2 in the hierarchy.
The information above is not intended to reflect an exhaustive list of the methodologies that may be used to value portfolio investments. The valuation procedures permit the use of a variety of valuation methodologies in connection with valuing portfolio investments. The methodology used for a specific type of investment may vary based on the market data available or other considerations. The methodologies summarized above may not represent the specific means by which portfolio investments are valued on any particular business day.
(B) Income Taxes. The Fund’s policy is to comply with the requirements of the Internal Revenue Code of 1986, as amended (the “Internal Revenue Code”), applicable to regulated investment companies and to distribute all of its taxable income to the shareholders of the Fund within the allowable time limits. Therefore, no federal, state and local income tax provisions are required.
Management evaluates the Fund’s tax positions to determine if the tax positions taken meet the minimum recognition threshold in connection with accounting for uncertainties in income tax positions taken or expected to be taken for the purposes of measuring and recognizing tax liabilities in the financial statements. Recognition of tax benefits of an uncertain tax position is permitted only to the extent the position is “more likely than not” to be sustained assuming examination by taxing authorities. Management has analyzed the Fund’s tax positions taken on federal, state and local income tax returns for all open tax years (for up to three tax years) and has concluded that no provisions for federal, state and local income tax are required in the Fund’s financial statements. The Fund’s federal, state and local income tax and federal excise tax returns for tax years for which the applicable statutes of limitations have not expired are subject to examination by the Internal Revenue Service and state and local departments of revenue.
(C) Foreign Taxes. The Fund may be subject to foreign taxes on income and other transaction-based taxes imposed by certain countries in which it invests. A portion of the taxes on gains on investments or currency purchases/repatriation may be reclaimable. The Fund will accrue such taxes and reclaims as applicable, based upon its current interpretation of tax rules and regulations that exist in the markets in which it invests.
The Fund may be subject to taxation on realized capital gains, repatriation proceeds and other transaction-based taxes imposed by certain countries in which it invests. The Fund will accrue such taxes as applicable based upon its current interpretation of tax rules and regulations that exist in the market in which it invests. Capital gains taxes relating to positions still held are reflected as a liability on the Statement of Assets and Liabilities, as well as an adjustment to the Fund’s net unrealized appreciation (depreciation). Taxes related to capital gains realized during the year ended October 31, 2017, if any, are reflected as part of net realized gain (loss) in the Statement of Operations. Changes in tax liabilities related to capital gains taxes on unrealized investment gains, if any, are reflected as part of the change in net unrealized appreciation (depreciation) on investments in the Statement of Operations. Transaction-based charges are generally assessed as a percentage of the transaction amount.
(D) Dividends and Distributions to Shareholders. Dividends and distributions are recorded on the ex-dividend date. The Fund intends to declare and pay dividends from net investment income and distributions from net realized capital and currency gains, if any, at least annually. Unless the shareholder elects otherwise, all dividends and distributions are reinvested in the same class of shares of the Fund, at NAV. Dividends and distributions to shareholders are determined in accordance with federal income tax regulations and may differ from determinations using GAAP.
(E) Security Transactions and Investment Income. The Fund records security transactions on the trade date. Realized gains and losses on security transactions are determined using the identified cost method. Dividend income is recognized on the ex-dividend date, net of any foreign tax withheld at the source, and interest income is accrued as earned using the effective interest rate method. Discounts and premiums on Short-Term Investments are accreted and amortized, respectively, on the straight-line method. The straight-line method approximates the effective interest method for Short-Term Investments.
| | |
| 26 | | MainStay MAP Equity Fund |
Investment income and realized and unrealized gains and losses on investments of the Fund are allocated pro rata to separate classes of shares based upon their relative net assets on the date the income is earned or realized and unrealized gains and losses are incurred.
(F) Expenses. Expenses of the Trust are allocated to the individual Funds in proportion to the net assets of the respective Funds when the expenses are incurred, except where direct allocations of expenses can be made. Expenses (other than transfer agent expenses and fees incurred under the shareholder services plans and/or the distribution plans further discussed in Note 3(B)) are allocated to separate classes of shares pro rata based upon their relative net assets on the date the expenses are incurred. The expenses borne by the Fund, including those of related parties to the Fund, are shown in the Statement of Operations.
(G) Use of Estimates. In preparing financial statements in conformity with GAAP, management makes estimates and assumptions that affect the reported amounts and disclosures in the financial statements. Actual results could differ from those estimates.
(H) Repurchase Agreements. The Fund may enter into repurchase agreements (i.e., buy a security from another party with the agreement that it be sold back in the future) to earn income. The Fund may enter into repurchase agreements only with counterparties, usually financial institutions, that are deemed by the Manager or Subadvisors to be creditworthy, pursuant to guidelines established by the Board. During the term of any repurchase agreement, the Manager or Subadvisors will continue to monitor the creditworthiness of the counterparty. Under the 1940 Act, repurchase agreements are considered to be collateralized loans by the Fund to the counterparty secured by the securities transferred to the Fund.
Repurchase agreements are subject to counterparty risk, meaning the Fund could lose money by the counterparty’s failure to perform under the terms of the agreement. The Fund mitigates this risk by ensuring the repurchase agreement is collateralized by cash, U.S. government securities, fixed income securities and/or other securities. The collateral is held by the Fund’s custodian and valued daily on a mark to market basis to determine if the value, including accrued interest, exceeds the repurchase price. In the event of the counterparty’s default on the obligation to repurchase, the Fund has the right to liquidate the collateral and apply the proceeds in satisfaction of the obligation. Under certain circumstances, such as in the event of default or bankruptcy by the counterparty, realization and/or retention of the collateral may be limited or subject to delay, to legal proceedings and possible realized loss to the Fund.
(I) Rights and Warrants. Rights are certificates that permit the holder to purchase a certain number of shares, or a fractional share, of a new stock from the issuer at a specific price. Warrants are instruments that entitle the holder to buy an equity security at a specific price for a specific period of time. These investments can provide a greater potential for profit or loss than an equivalent investment in the underlying security. Prices of these investments do not necessarily move in tandem with the prices of the underlying securities.
There is risk involved in the purchase of rights and warrants in that these investments are speculative investments. The Fund could also lose the entire value of its investment in warrants if such warrants are
not exercised by the date of its expiration. The Fund is exposed to risk until the sale or exercise of each right or warrant is completed. As of October 31, 2017, the Fund did not hold any rights or warrants.
(J) Securities Lending. In order to realize additional income, the Fund may engage in securities lending, subject to the limitations set forth in the 1940 Act and relevant guidance by the staff of the Securities and Exchange Commission (“SEC”). In the event the Fund does engage in securities lending, the Fund will lend through its custodian, State Street Bank and Trust Company (“State Street”). State Street will manage the Fund’s collateral in accordance with the lending agreement between the Fund and State Street, and indemnify the Fund against counterparty risk. The loans will be collateralized by U.S. Treasury securities at least equal at all times to the market value of the securities loaned. The Fund may bear the risk of delay in recovery of, or loss of rights in, the securities loaned should the borrower of the securities experience financial difficulty. The Fund may also record a realized gain or loss on securities deemed sold due to a borrower’s inability to return securities on loan. The Fund bears the risk of any loss on investment of the collateral. The Fund will receive compensation for lending its securities in the form of fees or it will retain a portion of interest on the investment of any cash received as collateral. The Fund will also continue to receive interest and dividends on the securities loaned and any gain or loss in the market price of the securities loaned that may occur during the term of the loan will be for the account of the Fund. During the year ended October 31, 2017, the Fund did not have any portfolio securities on loan.
(K) Foreign Currency Transactions. The Fund’s books and records are maintained in U.S. dollars. Prices of securities denominated in foreign currency amounts are translated into U.S. dollars at the mean between the buying and selling rates last quoted by any major U.S. bank at the following dates:
| (i) | market value of investment securities, other assets and liabilities—at the valuation date; and |
| (ii) | purchases and sales of investment securities, income and expenses—at the date of such transactions. |
The assets and liabilities that are denominated in foreign currency amounts are presented at the exchange rates and market values at the close of the period. The realized and unrealized changes in net assets arising from fluctuations in exchange rates and market prices of securities are not separately presented.
Net realized gain (loss) on foreign currency transactions represents net gains and losses on foreign currency forward contracts, net currency gains or losses realized as a result of differences between the amounts of securities sale proceeds or purchase cost, dividends, interest and withholding taxes as recorded on the Fund’s books, and the U.S. dollar equivalent amount actually received or paid. Net currency gains or losses from valuing such foreign currency denominated assets and liabilities, other than investments at valuation date exchange rates, are reflected in unrealized foreign exchange gains or losses.
(L) Foreign Securities Risk. The Fund may invest in foreign securities, which carry certain risks that are in addition to the usual risks inherent in domestic securities. These risks include those resulting from currency fluctuations, future adverse political or economic developments and possible imposition of currency exchange blockages or other foreign
Notes to Financial Statements (continued)
governmental laws or restrictions. These risks are likely to be greater in emerging markets than in developed markets. The ability of issuers of debt securities held by the Fund to meet their obligations may be affected by, among other things, economic or political developments in a specific country, industry or region.
(M) Indemnifications. Under the Trust’s organizational documents, its officers and trustees are indemnified against certain liabilities that may arise out of performance of their duties to the Trust. Additionally, in the normal course of business, the Fund enters into contracts with third-party service providers that contain a variety of representations and warranties and which may provide general indemnifications. The Fund’s maximum exposure under these arrangements is unknown, as this would involve future claims that may be made against the Fund that have not yet occurred. Based on experience, management is of the view that the risk of loss in connection with these potential indemnification obligations is remote. However, there can be no assurance that material liabilities related to such obligations will not arise in the future, which could adversely impact the Fund.
Note 3–Fees and Related Party Transactions
(A) Manager and Subadvisors. New York Life Investments, a registered investment adviser and an indirect, wholly-owned subsidiary of New York Life Insurance Company (“New York Life”), serves as the Fund’s Manager, pursuant to an Amended and Restated Management Agreement (“Management Agreement”). The Manager provides offices, conducts clerical, recordkeeping and bookkeeping services and keeps most of the financial and accounting records required to be maintained by the Fund. Except for the portion of salaries and expenses that are the responsibility of the Fund, the Manager pays the salaries and expenses of all personnel affiliated with the Fund and certain operational expenses of the Fund. The Fund reimburses New York Life Investments in an amount equal to a portion of the compensation of the Chief Compliance Officer attributable to the Fund. Markston International LLC (“Markston” or “Subadvisor”) and Epoch Investment Parnters, Inc. (“Epoch” or “Subadvisor”), each registered investment advisers, serve as Subadvisors to the Fund and manage a portion of the Fund’s assets, as designated by New York Life Investments from time to time, subject to the oversight of New York Life Investments. Each Subadvisor is responsible for the day-to-day portfolio management of the Fund with respect to its allocated portion of the Fund’s assets. Pursuant to the terms of an Amended and Restated Subadvisory Agreement between New York Life Investments and Epoch, and pursuant to the terms of a Subadvisory Agreement between New York Life Investments and Markston (“Subadvisory Agreements”), New York Life Investments pays for the services of the Subadvisors.
Under the Management Agreement, the Fund pays the Manager a monthly fee for the services performed and the facilities furnished at an annual rate of the Fund’s the Fund’s average daily net assets as follows: 0.75% up to $1 billion; 0.70% from $1 billion to $3 billion; and 0.675% in excess of $3 billion, plus a fee for fund accounting services previously provided by New York Life Investments under a separate fund accounting agreement furnished at an annual rate of the Fund’s average daily net assets as follows: 0.05% up to $20 million; 0.0333% from $20 million to $100 million; and 0.01% in excess of $100 million.
During the year ended October 31, 2017, the effective management fee rate was 0.75% inclusive of a fee for fund accounting services of 0.01% of the Fund’s average daily net assets.
During the year ended October 31, 2017, New York Life Investments earned fees from the Fund in the amount of $9,881,956.
New York Life Investments reimbursed the Fund for transition costs of approximately $8,000 incurred, associated with the repositioning of the portion of the Fund previously subadvised by Institutional Capital LLC.
State Street provides sub-administration and sub-accounting services to the Fund pursuant to an agreement with New York Life Investments. These services include calculating the daily NAVs of the Fund, maintaining the general ledger and sub-ledger accounts for the calculation of the Fund’s NAVs and assisting New York Life Investments in conducting various aspects of the Fund’s administrative operations. For providing these services to the Fund, State Street is compensated by New York Life Investments.
(B) Distribution, Service and Shareholder Service Fees. The Trust, on behalf of the Fund, has entered into a distribution agreement with NYLIFE Distributors LLC (the “Distributor”), an indirect, wholly-owned subsidiary of New York Life. The Fund has adopted distribution plans (the “Plans”) in accordance with the provisions of Rule 12b-1 under the 1940 Act.
Pursuant to the Class A, Investor Class, Class T and Class R2 Plans, the Distributor receives a monthly distribution fee from the Class A, Investor Class, Class T and Class R2 shares at an annual rate of 0.25% of the average daily net assets of the Class A, Investor Class, Class T and Class R2 shares for distribution and/or service activities as designated by the Distributor. Pursuant to the Class B and Class C Plans, Class B and Class C shares pay the Distributor a monthly distribution fee at an annual rate of 0.75% of the average daily net assets of the Class B and Class C shares, along with a service fee at an annual rate of 0.25% of the average daily net assets of the Class B and Class C shares, for a total 12b-1 fee of 1.00%. Pursuant to the Class R3 Plan, the Distributor receives a monthly distribution and/or service fee from the Class R3 shares at an annual rate of 0.50% of the average daily net assets of the Class R3 shares. Class I, Class R1 and Class R6 shares are not subject to a distribution and/or service fee.
The Plans provide that the distribution and service fees are payable to the Distributor regardless of the amounts actually expended by the Distributor for distribution of the Fund’s shares and service activities.
In accordance with the Shareholder Services Plans for the Class R1, Class R2 and Class R3 shares, the Manager has agreed to provide, through its affiliates or independent third parties, various shareholder and administrative support services to shareholders of the Class R1, Class R2 and Class R3 shares. For its services, the Manager, its affiliates or independent third-party service providers are entitled to a shareholder service fee accrued daily and paid monthly at an annual rate of 0.10% of the average daily net assets of the Class R1, Class R2 and Class R3 shares. This is in addition to any fees paid under the Class R2 and Class R3 Plans.
| | |
| 28 | | MainStay MAP Equity Fund |
During the year ended October 31, 2017, shareholder service fees incurred by the Fund were as follows:
| | | | |
Class R1 | | $ | 2,889 | |
Class R2 | | | 3,011 | |
Class R3 | | | 921 | |
(C) Sales Charges. During the year ended October 31, 2017, the Fund was advised by the Distributor that the amount of initial sales charges retained on sales of Class A and Investor Class shares were $24,832 and $37,220, respectively.
During the year ended October 31, 2017, the Fund was also advised that the Distributor retained CDSCs on redemptions of Class A, Investor Class, Class B and Class C shares of $2,756, $3, $52,624 and $2,991, respectively.
(D) Transfer, Dividend Disbursing and Shareholder Servicing Agent. NYLIM Service Company LLC, an affiliate of New York Life Investments, is the Fund’s transfer, dividend disbursing and shareholder servicing agent pursuant to an agreement between NYLIM Service Company LLC and the Trust. NYLIM Service Company LLC has entered into an agreement with Boston Financial Data Services, Inc. (“BFDS”) pursuant to which BFDS performs certain transfer agent services on behalf of NYLIM Service Company LLC. During the year ended October 31, 2017, transfer agent expenses incurred by the Fund were as follows:
| | | | |
Class A | | $ | 178,005 | |
Investor Class | | | 360,192 | |
Class B | | | 99,022 | |
Class C | | | 221,594 | |
Class I | | | 413,929 | |
Class R1 | | | 1,631 | |
Class R2 | | | 1,728 | |
Class R3 | | | 521 | |
(E) Small Account Fee. Shareholders with small accounts adversely impact the cost of providing transfer agency services. In an effort to reduce total transfer agency expenses, the Fund has implemented a small account fee on certain types of accounts. Certain shareholders with an account balance of less than $1,000 are charged an annual per account fee of $20 (assessed semi-annually), the proceeds from which offset transfer agent fees as reflected in the Statement of Operations.
(F) Capital. As of October 31, 2017, New York Life and its affiliates beneficially held shares of the Fund with the values and percentages of net assets as follows:
Note 4–Federal Income Tax
As of October 31, 2017, the cost and unrealized appreciation (depreciation) of the Fund’s investment portfolio, including applicable
derivative contracts and other financial instruments, as determined on a federal income tax basis, were as follows:
| | | | | | | | | | | | | | | | |
| | | Federal
Tax Cost | | | Gross
Unrealized
Appreciation | | | Gross
Unrealized
Depreciation | | | Net
Unrealized
Appreciation/
(Depreciation) | |
Investments in Securities | | $ | 799,054,507 | | | $ | 461,306,628 | | | $ | (25,636,953 | ) | | $ | 435,669,675 | |
As of October 31, 2017, the components of accumulated gain (loss) on a tax basis were as follows:
| | | | | | | | | | | | | | | | |
Ordinary
Income | | Accumulated
Capital and Other Gain (Loss) | | | Other
Temporary
Differences | | | Unrealized
Appreciation
(Depreciation) | | | Total
Accumulated Gain (Loss) | |
$24,553,595 | | $ | 102,330,379 | | | $ | — | | | $ | 435,664,754 | | | $ | 562,548,728 | |
The difference between book-basis and tax-basis unrealized appreciation (depreciation) is primarily due to wash sale adjustments.
The following table discloses the current year reclassifications between undistributed net investment income (loss), accumulated net realized gain (loss) on investments and additional paid-in capital arising from permanent differences; net assets as of October 31, 2017 were not affected.
| | | | |
Undistributed
Net Investment
Income (Loss) | | Accumulated
Net Realized
Gain (Loss) on
Investments | | Additional
Paid-In
Capital |
| $1,737,805 | | $(26,830,084) | | $25,092,279 |
The reclassifications for the Fund are primarily due to equalization.
During the years ended October 31, 2017 and October 31, 2016, the tax character of distributions paid as reflected in the Statements of Changes in Net Assets was as follows:
| | | | | | | | |
| | | 2017 | | | 2016 | |
Distributions paid from: | | | | | | | | |
Ordinary Income | | $ | 16,999,601 | | | $ | 39,745,053 | |
Long-Term Capital Gain | | | 13,832,391 | | | | 248,632,732 | |
Total | | $ | 30,831,992 | | | $ | 288,377,785 | |
Note 5–Custodian
State Street is the custodian of cash and securities held by the Fund. Custodial fees are charged to the Fund based on the Fund’s net assets and/or the market value of securities held by the Fund and the number of certain transactions incurred by the Fund.
Note 6–Line of Credit
The Fund and certain other funds managed by New York Life Investments, maintain a line of credit with a syndicate of banks in order to secure a source of funds for temporary purposes to meet unanticipated or excessive redemption requests.
Notes to Financial Statements (continued)
Effective August 1, 2017, under the credit agreement (the “Credit Agreement”), the aggregate commitment amount is $600,000,000 with an additional uncommitted amount of $100,000,000. The commitment fee is an annual rate of 0.15% of the average commitment amount payable quarterly, regardless of usage, to State Street, who serves as the agent to the syndicate. The commitment fee is allocated among the Fund and certain other funds managed by New York Life Investments based upon their respective net assets and other factors. Interest on any revolving credit loan is charged based upon the Federal Funds Rate or the one month LIBOR, whichever is higher. The Credit Agreement expires on July 31, 2018, although the Fund, certain other funds managed by New York Life Investments and the syndicate of banks may renew the Credit Agreement for an additional year on the same or different terms. Prior to August 1, 2017, the aggregate commitment amount and commitment fee of the previous credit agreement were the same as those under the Credit Agreement, but Bank of New York Mellon served as agent to the syndicate.
During the year ended October 31, 2017, the Fund utilized the line of credit for 5 days, maintained an average daily balance of $51,024,333 at weighted average interest rate of 1.41% and incurred interest expense in the amount of $9,815. As of October 31, 2017, there were no borrowings outstanding with respect to the Fund under the Credit Agreement.
Note 7–Interfund Lending Program
Pursuant to an exemptive order issued by the SEC, the Fund, along with certain other funds managed by New York Life Investments, may participate in an interfund lending program. The interfund lending program provides an alternative credit facility that permits the Fund and certain other funds managed by New York Life Investments to lend or borrow money for temporary purposes directly to or from one another, subject to the conditions of the exemptive order. During the year ended October 31, 2017, there were no interfund loans made or outstanding with respect to the Fund.
Note 8–Purchases and Sales of Securities (in 000’s)
During the year ended October 31, 2017, purchases and sales of securities, other than short-term securities, were $190,766 and $757,578, respectively.
Note 9–Capital Share Transactions
| | | | | | | | |
Class A | | Shares | | | Amount | |
Year ended October 31, 2017: | | | | | | | | |
Shares sold | | | 533,831 | | | $ | 21,446,730 | |
Shares issued to shareholders in reinvestment of dividends and distributions | | | 179,775 | | | | 6,572,571 | |
Shares redeemed | | | (1,658,830 | ) | | | (65,914,254 | ) |
| | | | | | | | |
Net increase (decrease) in shares outstanding before conversion | | | (945,224 | ) | | | (37,894,953 | ) |
Shares converted into Class A (See Note 1) | | | 1,941,210 | | | | 81,575,433 | |
Shares converted from Class A (See Note 1) | | | (39,513 | ) | | | (1,570,975 | ) |
| | | | | | | | |
Net increase (decrease) | | | 956,473 | | | $ | 42,109,505 | |
| | | | | | | | |
Year ended October 31, 2016: | | | | | | | | |
Shares sold | | | 362,850 | | | $ | 12,838,848 | |
Shares issued to shareholders in reinvestment of dividends and distributions | | | 1,473,310 | | | | 52,494,049 | |
Shares redeemed | | | (1,857,101 | ) | | | (66,067,001 | ) |
| | | | | | | | |
Net increase (decrease) in shares outstanding before conversion | | | (20,941 | ) | | | (734,104 | ) |
Shares converted into Class A (See Note 1) | | | 239,631 | | | | 8,456,352 | |
Shares converted from Class A (See Note 1) | | | (46,690 | ) | | | (1,643,409 | ) |
| | | | | | | | |
Net increase (decrease) | | | 172,000 | | | $ | 6,078,839 | |
| | | | | | | | |
|
| |
Investor Class | | Shares | | | Amount | |
Year ended October 31, 2017: | | | | | | | | |
Shares sold | | | 191,132 | | | $ | 7,592,444 | |
Shares issued to shareholders in reinvestment of dividends and distributions | | | 84,356 | | | | 3,084,072 | |
Shares redeemed | | | (373,260 | ) | | | (14,795,519 | ) |
| | | | | | | | |
Net increase (decrease) in shares outstanding before conversion | | | (97,772 | ) | | | (4,119,003 | ) |
Shares converted into Investor Class (See Note 1) | | | 185,596 | | | | 7,378,715 | |
Shares converted from Investor Class (See Note 1) | | | (1,904,446 | ) | | | (80,010,269 | ) |
| | | | | | | | |
Net increase (decrease) | | | (1,816,622 | ) | | $ | (76,750,557 | ) |
| | | | | | | | |
Year ended October 31, 2016: | | | | | | | | |
Shares sold | | | 180,779 | | | $ | 6,371,079 | |
Shares issued to shareholders in reinvestment of dividends and distributions | | | 685,316 | | | | 24,417,822 | |
Shares redeemed | | | (499,592 | ) | | | (17,764,615 | ) |
| | | | | | | | |
Net increase (decrease) in shares outstanding before conversion | | | 366,503 | | | | 13,024,286 | |
Shares converted into Investor Class (See Note 1) | | | 228,134 | | | | 8,005,153 | |
Shares converted from Investor Class (See Note 1) | | | (199,147 | ) | | | (7,035,547 | ) |
| | | | | | | | |
Net increase (decrease) | | | 395,490 | | | $ | 13,993,892 | |
| | | | | | | | |
|
| |
| | |
| 30 | | MainStay MAP Equity Fund |
| | | | | | | | |
Class B | | Shares | | | Amount | |
Year ended October 31, 2017: | | | | | | | | |
Shares sold | | | 50,433 | | | $ | 1,761,431 | |
Shares issued to shareholders in reinvestment of dividends and distributions | | | 19,649 | | | | 652,938 | |
Shares redeemed | | | (206,700 | ) | | | (7,409,918 | ) |
| | | | | | | | |
Net increase (decrease) in shares outstanding before conversion | | | (136,618 | ) | | | (4,995,549 | ) |
Shares converted from Class B (See Note 1) | | | (218,348 | ) | | | (7,877,051 | ) |
| | | | | | | | |
Net increase (decrease) | | | (354,966 | ) | | $ | (12,872,600 | ) |
| | | | | | | | |
Year ended October 31, 2016: | | | | | | | | |
Shares sold | | | 141,309 | | | $ | 4,536,887 | |
Shares issued to shareholders in reinvestment of dividends and distributions | | | 275,209 | | | | 8,927,759 | |
Shares redeemed | | | (276,365 | ) | | | (8,916,909 | ) |
| | | | | | | | |
Net increase (decrease) in shares outstanding before conversion | | | 140,153 | | | | 4,547,737 | |
Shares converted from Class B (See Note 1) | | | (245,858 | ) | | | (7,821,715 | ) |
| | | | | | | | |
Net increase (decrease) | | | (105,705 | ) | | $ | (3,273,978 | ) |
| | | | | | | | |
|
| |
Class C | | Shares | | | Amount | |
Year ended October 31, 2017: | | | | | | | | |
Shares sold | | | 87,352 | | | $ | 3,096,595 | |
Shares issued to shareholders in reinvestment of dividends and distributions | | | 36,839 | | | | 1,224,153 | |
Shares redeemed | | | (955,543 | ) | | | (34,349,965 | ) |
| | | | | | | | |
Net increase (decrease) in shares outstanding before conversion | | | — | | | | — | |
Shares converted from Class C (See Note 1) | | | — | | | | — | |
| | | | | | | | |
Net increase (decrease) | | | (831,352 | ) | | $ | (30,029,217 | ) |
| | | | | | | | |
Year ended October 31, 2016: | | | | | | | | |
Shares sold | | | 186,119 | | | $ | 6,047,511 | |
Shares issued to shareholders in reinvestment of dividends and distributions | | | 526,965 | | | | 17,094,739 | |
Shares redeemed | | | (1,023,378 | ) | | | (32,804,609 | ) |
| | | | | | | | |
Net increase (decrease) in shares outstanding before conversion | | | (310,294 | ) | | | (9,662,359 | ) |
Shares converted from Class C (See Note 1) | | | (90 | ) | | | (2,648 | ) |
| | | | | | | | |
Net increase (decrease) | | | (310,384 | ) | | $ | (9,665,007 | ) |
| | | | | | | | |
|
| |
Class I | | Shares | | | Amount | |
Year ended October 31, 2017: | | | | | | | | |
Shares sold | | | 1,079,409 | | | $ | 43,953,110 | |
Shares issued to shareholders in reinvestment of dividends and distributions | | | 491,140 | | | | 18,427,571 | |
Shares redeemed | | | (9,358,125 | ) | | | (382,926,753 | ) |
| | | | | | | | |
Net increase (decrease) in shares outstanding before conversion | | | (7,787,576 | ) | | | (320,546,072 | ) |
Shares converted into Class I (See Note 1) | | | 12,366 | | | | 504,147 | |
| | | | | | | | |
Net increase (decrease) | | | (7,775,210 | ) | | $ | (320,041,925 | ) |
| | | | | | | | |
Year ended October 31, 2016: | | | | | | | | |
Shares sold | | | 2,153,901 | | | $ | 77,929,229 | |
Shares issued to shareholders in reinvestment of dividends and distributions | | | 4,802,003 | | | | 175,417,157 | |
Shares redeemed | | | (10,330,996 | ) | | | (371,051,100 | ) |
| | | | | | | | |
Net increase (decrease) in shares outstanding before conversion | | | (3,375,092 | ) | | | (117,704,714 | ) |
Shares converted into Class I (See Note 1) | | | 1,153 | | | | 41,814 | |
| | | | | | | | |
Net increase (decrease) | | | (3,373,939 | ) | | $ | (117,662,900 | ) |
| | | | | | | | |
| | | | | | | | |
Class R1 | | Shares | | | Amount | |
Year ended October 31, 2017: | | | | | | | | |
Shares sold | | | 12,345 | | | $ | 494,197 | |
Shares issued to shareholders in reinvestment of dividends and distributions | | | 1,741 | | | | 64,018 | |
Shares redeemed | | | (10,423 | ) | | | (415,386 | ) |
| | | | | | | | |
Net increase (decrease) | | | 3,663 | | | $ | 142,829 | |
| | | | | | | | |
Year ended October 31, 2016: | | | | | | | | |
Shares sold | | | 17,200 | | | $ | 614,851 | |
Shares issued to shareholders in reinvestment of dividends and distributions | | | 16,678 | | | | 597,420 | |
Shares redeemed | | | (47,520 | ) | | | (1,667,148 | ) |
| | | | | | | | |
Net increase (decrease) | | | (13,642 | ) | | $ | (454,877 | ) |
| | | | | | | | |
|
| |
Class R2 | | Shares | | | Amount | |
Year ended October 31, 2017: | | | | | | | | |
Shares sold | | | 9,745 | | | $ | 386,926 | |
Shares issued to shareholders in reinvestment of dividends and distributions | | | 2,062 | | | | 75,772 | |
Shares redeemed | | | (50,883 | ) | | | (2,025,153 | ) |
| | | | | | | | |
Net increase (decrease) | | | (39,076 | ) | | $ | (1,562,455 | ) |
| | | | | | | | |
Year ended October 31, 2016: | | | | | | | | |
Shares sold | | | 23,607 | | | $ | 846,159 | |
Shares issued to shareholders in reinvestment of dividends and distributions | | | 41,542 | | | | 1,486,800 | |
Shares redeemed | | | (197,299 | ) | | | (6,705,795 | ) |
| | | | | | | | |
Net increase (decrease) | | | (132,150 | ) | | $ | (4,372,836 | ) |
| | | | | | | | |
|
| |
Class R3 | | Shares | | | Amount | |
Year ended October 31, 2017: | | | | | | | | |
Shares sold | | | 4,617 | | | $ | 182,618 | |
Shares issued to shareholders in reinvestment of dividends and distributions | | | 448 | | | | 16,394 | |
Shares redeemed | | | (4,576 | ) | | | (182,014 | ) |
| | | | | | | | |
Net increase (decrease) | | | 489 | | | $ | 16,998 | |
| | | | | | | | |
Year ended October 31, 2016: | | | | | | | | |
Shares sold | | | 5,978 | | | $ | 221,667 | |
Shares issued to shareholders in reinvestment of dividends and distributions | | | 5,092 | | | | 181,734 | |
Shares redeemed | | | (13,173 | ) | | | (464,107 | ) |
| | | | | | | | |
Net increase (decrease) | | | (2,103 | ) | | $ | (60,706 | ) |
| | | | | | | | |
Note 10–Subsequent Events
In connection with the preparation of the financial statements of the Fund as of and for the year ended October 31, 2017, events and transactions subsequent to October 31, 2017, through the date the financial statements were issued have been evaluated by the Fund’s management for possible adjustment and/or disclosure. No subsequent events requiring financial statement adjustment or disclosure have been identified.
Report of Independent Registered Public Accounting Firm
The Board of Trustees and Shareholders of
The MainStay Funds:
We have audited the accompanying statement of assets and liabilities, including the portfolio of investments, of MainStay MAP Equity Fund (formerly, MainStay MAP Fund) (the “Fund”), one of the funds constituting The MainStay Funds, as of October 31, 2017, and the related statement of operations for the year then ended, the statements of changes in net assets for each of the years in the two-year period then ended, and the financial highlights for each of the years in the five-year period then ended. These financial statements and financial highlights are the responsibility of the Fund’s management. Our responsibility is to express an opinion on these financial statements and financial highlights based on our audits.
We conducted our audits in accordance with the standards of the Public Company Accounting Oversight Board (United States). Those standards require that we plan and perform the audit to obtain reasonable assurance about whether the financial statements and financial highlights are free of material misstatement. An audit includes examining, on a test basis, evidence supporting the amounts and disclosures in the financial statements. Our procedures included confirmation of securities owned as of October 31, 2017, by correspondence with the custodian and brokers or by other appropriate auditing procedures where replies from brokers were not received. An audit also includes assessing the accounting principles used and significant estimates made by management, as well as evaluating the overall financial statement presentation. We believe that our audits provide a reasonable basis for our opinion.
In our opinion, the financial statements and financial highlights referred to above present fairly, in all material respects, the financial position of MainStay MAP Equity Fund as of October 31, 2017, the results of its operations for the year then ended, the changes in its net assets for each of the years in the two-year period then ended, and the financial highlights for each of the years in the five-year period then ended, in conformity with U.S. generally accepted accounting principles.

Philadelphia, Pennsylvania
December 21, 2017
| | |
| 32 | | MainStay MAP Equity Fund |
Other Matters
(Unaudited)
At a meeting held on June 22, 2017, the Board approved submitting the following proposal (“Proposal”) to shareholders of the Funds at a special meeting held on October 23, 2017 (with any postponements or adjournments, “Special Meeting”):
To elect eight Trustees to the Board
On or about September 28, 2017, shareholders of record of the Funds as of the close of business on August 24, 2017 were sent a proxy statement containing information regarding the Proposal. The proxy statement also included information about the Special Meeting, at which shareholders of the Funds were asked to consider and approve the Proposal. In addition, the proxy statement included information about voting on the Proposal and options shareholders had to do so.
The Special Meeting was held on October 23, 2017, and the Proposal passed.
The results of the Special Meeting (all Funds and classes thereof voting together) were as follows:
Proposal—To elect eight Trustees to the Board:
Yie-Hsin Hung:
| | | | | | | | |
Votes
For | | Votes
Witheld | | | Total | |
| 2,644,056,263.750 | | | 21,799,781.292 | | | | 2,665,856,045.042 | |
David H. Chow:
| | | | | | | | |
Votes
For | | Votes
Witheld | | | Total | |
| 2,644,576,776.557 | | | 21,279,268.485 | | | | 2,665,856,045.042 | |
Susan B. Kerley:
| | | | | | | | |
Votes
For | | Votes
Witheld | | | Total | |
| 2,645,459,747.343 | | | 20,396,297.699 | | | | 2,665,856,045.042 | |
Alan R. Latshaw:
| | | | | | | | |
Votes
For | | Votes
Witheld | | | Total | |
| 2,644,443,039.401 | | | 21,413,005.641 | | | | 2,665,856,045.042 | |
Peter Meenan:
| | | | | | | | |
Votes
For | | Votes
Witheld | | | Total | |
| 2,640,156,421.578 | | | 25,699,623.464 | | | | 2,665,856,045.042 | |
Richard H. Nolan, Jr.:
| | | | | | | | |
Votes
For | | Votes
Witheld | | | Total | |
| 2,641,415,514.849 | | | 24,440,530.193 | | | | 2,665,856,045.042 | |
Jacques P. Perold:
| | | | | | | | |
Votes
For | | Votes
Witheld | | | Total | |
| 2,645,300,993.731 | | | 20,555,051.311 | | | | 2,665,856,045.042 | |
Richard S. Trutanic:
| | | | | | | | |
Votes
For | | Votes
Witheld | | | Total | |
| 2,641,761,336.311 | | | 24,094,708.731 | | | | 2,665,856,045.042 | |
Federal Income Tax Information
(Unaudited)
The Fund is required under the Internal Revenue Code to advise shareholders in a written statement as to the federal tax status of dividends paid by the Fund during such fiscal years. Accordingly, the Fund paid $35,119,212 as long term capital gain distributions.
For the fiscal year ended October 31, 2017, the Fund designated approximately $16,001,994 under the Internal Revenue Code as qualified dividend income eligible for reduced tax rates.
The dividends paid by the Fund during the fiscal year ended October 31, 2017 should be multiplied by the 93.87% to arrive at the amount eligible for the corporate dividend-received deduction.
In February 2018, shareholders will receive an IRS Form 1099-DIV or substitute Form 1099, which will show the federal tax status of the distributions received by shareholders in calendar year 2017. The amounts that will be reported on such 1099-DIV or substitute Form 1099 will be the amounts you are to use on your federal income tax return and will differ from the amounts which we must report for the Fund’s fiscal year end October 31, 2017.
Proxy Voting Policies and Procedures and Proxy Voting Record
A description of the policies and procedures that New York Life Investments uses to vote proxies related to the Fund’s securities is available without charge, upon request, (i) by visiting the MainStay Funds’ website at mainstayinvestments.com; and (ii) on the Securities and Exchange Commission’s (“SEC”) website at www.sec.gov.
The Fund is required to file with the SEC its proxy voting records for the Fund for the 12-month period ending June 30 on Form N-PX. The most recent Form N-PX or proxy voting record is available free of charge upon request by calling 800-MAINSTAY (624-6782); visiting the MainStay Funds’ website at mainstayinvestments.com; or on the SEC’s website at www.sec.gov.
Shareholder Reports and Quarterly Portfolio Disclosure
The Fund is required to file its complete schedule of portfolio holdings with the SEC for its first and third fiscal quarters on Form N-Q. The Fund’s Form N-Q is available without charge, on the SEC’s website at www.sec.gov or by calling MainStay Investments at 800-MAINSTAY (624-6782). You also can obtain and review copies of Form N-Q by visiting the SEC’s Public Reference Room in Washington, DC (information on the operation of the Public Reference Room may be obtained by calling 1-800-SEC-0330).
Board of Trustees and Officers (Unaudited)
The Trustees and officers of the Funds are listed below. The Board oversees the MainStay Group of Funds (which consists of The MainStay Funds and MainStay Funds Trust), MainStay VP Funds Trust, MainStay DefinedTerm Municipal Opportunities Fund, the Manager and the Subadvisors, and elects the officers of the Funds who are responsible for the day-to-day operations of the Funds. Information pertaining to the Trustees and officers is set forth below. Each Trustee serves until his or her successor is elected and qualified or until his or her resignation, death or removal. Under the Board’s retirement policy, unless an exception is made, a Trustee must tender his or her resignation by the
end of the calendar year during which he or she reaches the age of 75. Mr. Meenan reached the age of 75 during the calendar year 2016, and his term was extended for one additional year. Accordingly, Mr. Meenan is expected to serve until the end of calendar year 2017, at which time he intends to retire. Officers are elected annually by the Board. The business address of each Trustee and officer listed below is 51 Madison Avenue, New York, New York 10010. A majority of the Trustees are not “interested persons” (as defined by the 1940 Act and rules adopted by the SEC thereunder) of the Fund (“Independent Trustees”).
| | | | | | | | | | | | |
| | | | | Name and Date of Birth | | Term of Office, Position(s) Held and Length of Service | | Principal Occupation(s) During Past Five Years | | Number of
Portfolios in
the MainStay
Group of Funds
Overseen by
Trustee | | Other Directorships Held by Trustee |
| Interested Trustee | | | | Yie-Hsin Hung* 8/12/62 | | The MainStay Funds: Trustee since January 2017; MainStay Funds Trust: Trustee since January 2017. | | Senior Vice President of New York Life since joining in 2010, Member of the Executive Management Committee since January 1, 2017, Chief Executive Officer, New York Life Investment Management Holdings LLC & New York Life Investment Management LLC since May 2015. Senior Managing Director and Co-President of New York Life Investment Management LLC from January 2014 to May 2015. Previously held positions of increasing responsibility, including head of NYLIM International, Alternative Growth Businesses, and Institutional investments since joining New York Life in 2010. | | 82 | | None |
| | * | This Trustee is considered to be an “interested person” of the MainStay Group of Funds, MainStay VP Funds Trust and MainStay DefinedTerm Municipal Opportunities Fund, within the meaning of the 1940 Act because of her affiliation with New York Life Insurance Company, New York Life Investment Management LLC, Candriam Belgium, Candriam France S.A.S., Cornerstone Capital Management Holdings LLC, MacKay Shields LLC, NYL Investors LLC, NYLIFE Securities LLC and/or NYLIFE Distributors LLC, as described in detail above in the column entitled “Principal Occupation(s) During Past Five Years.” |
| | |
| 34 | | MainStay MAP Equity Fund |
| | | | | | | | | | | | |
| | | | | Name and Date of Birth | | Term of Office, Position(s) Held and Length of Service | | Principal Occupation(s) During Past Five Years | | Number of
Portfolios in
the MainStay
Group of Funds
Overseen by
Trustee | | Other Directorships Held by Trustee |
| Independent Trustees | | | | David H. Chow 12/29/57 | | The MainStay Funds: Trustee since January 2016, Advisory Board Member (June 2015 to December 2015); MainStay Funds Trust: Trustee since January 2016, Advisory Board Member (June 2015 to December 2015). | | Founder and CEO, DanCourt Management, LLC (since 1999) | | 82 | | VanEck Vectors Group of Exchange-Traded Funds: Independent Chairman of the Board of Trustees since 2008 and Trustee since 2006 (57 portfolios); and
Berea College of Kentucky: Trustee since 2009. |
| | | | Susan B. Kerley 8/12/51 | | The MainStay Funds: Chairman since January 2017 and Trustee since 2007; MainStay Funds Trust: Chairman since January 2017 and Trustee since 1990.** | | President, Strategic Management Advisors LLC (since 1990) | | 82 | | Legg Mason Partners Funds: Trustee since 1991 (54 portfolios). |
| | | | Alan R. Latshaw 3/27/51 | | The MainStay Funds: Trustee and Audit Committee Financial Expert since 2006; MainStay Funds Trust: Trustee and Audit Committee Financial Expert since 2007.** | | Retired; Partner, Ernst & Young LLP (2002 to 2003); Partner, Arthur Andersen LLP (1989 to 2002); Consultant to the MainStay Funds Audit and Compliance Committee (2004 to 2006) | | 82 | | State Farm Associates Funds Trusts: Trustee since 2005 (4 portfolios);
State Farm Mutual Fund Trust: Trustee since 2005 (15 portfolios); and
State Farm Variable Product Trust: Trustee since 2005 (9 portfolios). |
| | | | Peter Meenan 12/5/41 | | The MainStay Funds: Trustee since 2007; MainStay Funds Trust: Trustee since 2002.** | | Retired; Independent Consultant (2004 to 2013); President and Chief Executive Officer, Babson—United, Inc. (financial services firm) (2000 to 2004); Independent Consultant (1999 to 2000); Head of Global Funds, Citicorp (1995 to 1999) | | 82 | | None |
| | | | Richard H. Nolan, Jr. 11/16/46 | | The MainStay Funds: Trustee since 2007; MainStay Funds Trust: Trustee since 2007.** | | Managing Director, ICC Capital Management (since 2004); President—Shields/Alliance, Alliance Capital Management (1994 to 2004) | | 82 | | None |
| | | | Jacques P. Perold 5/12/58 | | The MainStay Funds: Trustee since January 2016, Advisory Board Member (June 2015 to December 2015); MainStay Funds Trust: Trustee since January 2016, Advisory Board Member (June 2015 to December 2015). | | Retired; President, Fidelity Management & Research Company (2009 to 2014); Founder, President and Chief Executive Officer, Geode Capital Management, LCC (2001 to 2009) | | 82 | | Allstate Corporation: Director since 2015; MSCI, Inc. Director since March 2017 and
Boston University: Trustee since 2014. |
| | | | Richard S. Trutanic 2/13/52 | | The MainStay Funds: Trustee since 1994; MainStay Funds Trust: Trustee since 2007.** | | Chairman and Chief Executive Officer, Somerset & Company (financial advisory firm) (since 2004); Managing Director, The Carlyle Group (private investment firm) (2002 to 2004); Senior Managing Director, Partner and Board Member, Groupe Arnault S.A. (private investment firm) (1999 to 2002) | | 82 | | None |
| | ** | Includes prior service as a Director/Trustee of certain predecessor entities to MainStay Funds Trust. |
| | | | | | | | |
| | | | | Name and Date of Birth | | Position(s) Held and Length of Service | | Principal Occupation(s) During Past Five Years |
Officers of the Trust (Who are not Trustees)* | | | | Kirk C. Lehneis 6/29/74 | | President, The MainStay Funds, MainStay Funds Trust (since September 2017) | | Chief Operating Officer and Senior Managing Director (since 2016), New York Life Investment Management LLC; Chairman of the Board (since September 2017), NYLIFE Distributors LLC; Chairman of the Board, NYLIM Service Company LLC (since September 2017); President, MainStay DefinedTerm Municipal Opportunities Fund and MainStay VP Funds Trust (since September 2017); Senior Managing Director, Global Product Development (From March 2015—May 2016); Managing Director, Product Development (From March 2010—February 2015) |
| | | | Jack R. Benintende 5/12/64 | | Treasurer and Principal Financial and Accounting Officer, The MainStay Funds (since 2007), MainStay Funds Trust (since 2009) | | Managing Director, New York Life Investment Management LLC (since 2007); Treasurer and Principal Financial and Accounting Officer, MainStay DefinedTerm Municipal Opportunities Fund (since 2011) and MainStay VP Funds Trust (since 2007)**; and Assistant Treasurer, New York Life Investment Management Holdings LLC (2008 to 2012) |
| | | | Kevin M. Bopp 2/24/69 | | Vice President and Chief Compliance Officer, The MainStay Funds and MainStay Funds Trust (since 2014) | | Chief Compliance Officer, New York Life Investment Management LLC, IndexIQ ETF (since January 2016), Director and Associate General Counsel (2011 to 2014) and Vice President and Assistant General Counsel (2010 to 2011), New York Life Investment Management LLC; Vice President and ChiefCompliance Officer, MainStay VP Funds Trust, MainStay DefinedTerm Municipal Opportunities Fund (since 2014); Assistant Secretary, MainStay Funds, MainStay Funds Trust and MainStay VP Funds Trust (2010 to 2014)**, MainStay DefinedTerm Municipal Opportunities Fund (2011 to 2014) |
| | | | J. Kevin Gao 10/13/67 | | Secretary and Chief Legal Officer, The MainStay Funds and MainStay Funds Trust (since 2010) | | Managing Director and Associate General Counsel, New York Life Investment Management LLC (since 2010); Secretary and Chief Legal Officer, MainStay DefinedTerm Municipal Opportunities Fund (since 2011) and MainStay VP Funds Trust (since 2010)** |
| | | | Scott T. Harrington 2/8/59 | | Vice President—Administration, The MainStay Funds (since 2005), MainStay Funds Trust (since 2009) | | Director, New York Life Investment Management LLC (including predecessor advisory organizations) (since 2000); Member of the Board of Directors, New York Life Trust Company (since 2009); Vice President—Administration, MainStay DefinedTerm Municipal Opportunities Fund (since 2011) and MainStay VP Funds Trust (since 2005)** |
| | * | The officers listed above are considered to be “interested persons” of the MainStay Group of Funds, MainStay VP Funds Trust and MainStay Defined Term Municipal Opportunities Fund within the meaning of the 1940 Act because of their affiliation with the MainStay Group of Funds, New York Life Insurance Company and/or its affiliates, including New York Life Investment Management LLC, NYLIM Service Company LLC, NYLIFE Securities LLC and/or NYLIFE Distributors LLC, as described in detail in the column captioned “Principal Occupation(s) During Past Five Years.” Officers are elected annually by the Board. |
| | ** | Includes prior service as an officer of MainStay VP Series Fund, Inc., the predecessor to MainStay VP Funds Trust. |
| | |
| 36 | | MainStay MAP Equity Fund |
This page intentionally left blank
This page intentionally left blank
MainStay Funds
Equity
U.S. Equity
MainStay Common Stock Fund
MainStay Cornerstone Growth Fund
MainStay Epoch U.S. All Cap Fund
MainStay Epoch U.S. Equity Yield Fund
MainStay Epoch U.S. Small Cap Fund
MainStay Large Cap Growth Fund
MainStay MAP Equity Fund
MainStay S&P 500 Index Fund
MainStay U.S. Equity Opportunities Fund
International/Global Equity
MainStay Candriam Emerging Markets Equity Fund
MainStay Emerging Markets Equity Fund
MainStay Epoch Capital Growth Fund
MainStay Epoch Global Choice Fund
MainStay Epoch Global Equity Yield Fund
MainStay Epoch International Choice Fund
MainStay Epoch International Small Cap Fund
MainStay International Equity Fund
MainStay International Opportunities Fund
Income
Taxable Bond
MainStay Emerging Markets Debt Fund
MainStay Floating Rate Fund
MainStay Government Fund
MainStay High Yield Corporate Bond Fund
MainStay Indexed Bond Fund
MainStay Short Duration High Yield Fund
MainStay Total Return Bond Fund
MainStay Unconstrained Bond Fund
Municipal/Tax Advantaged Bond
MainStay California Tax Free Opportunities Fund1
MainStay High Yield Municipal Bond Fund
MainStay New York Tax Free Opportunities Fund2
MainStay Tax Advantaged Short Term Bond Fund
MainStay Tax Free Bond Fund
Money Market
MainStay Money Market Fund
Mixed Asset
MainStay Balanced Fund
MainStay Convertible Fund
MainStay Income Builder Fund
Alternative
MainStay Absolute Return Multi-Strategy Fund
MainStay Cushing Energy Income Fund
MainStay Cushing MLP Premier Fund
MainStay Cushing Renaissance Advantage Fund
Asset Allocation/Target Date
MainStay Conservative Allocation Fund
MainStay Growth Allocation Fund
MainStay Moderate Allocation Fund
MainStay Moderate Growth Allocation Fund
MainStay Retirement 2010 Fund
MainStay Retirement 2020 Fund
MainStay Retirement 2030 Fund
MainStay Retirement 2040 Fund
MainStay Retirement 2050 Fund
MainStay Retirement 2060 Fund
Manager
New York Life Investment Management LLC
New York, New York
Subadvisors
Candriam Belgium S.A.3
Brussels, Belgium
Candriam France S.A.S.3
Paris, France
Cornerstone Capital Management Holdings LLC3
New York, New York
Cushing Asset Management, LP
Dallas, Texas
Epoch Investment Partners, Inc.
New York, New York
MacKay Shields LLC3
New York, New York
Markston International LLC
White Plains, New York
NYL Investors LLC3
New York, New York
Winslow Capital Management, LLC
Minneapolis, Minnesota
Legal Counsel
Dechert LLP
Washington, District of Columbia
Independent Registered Public Accounting Firm
KPMG LLP
Philadelphia, Pennsylvania
1. Class A and Class I shares of this Fund are registered for sale in AZ, CA, MI, NV, OR, TX, UT and WA. Class I shares are registered for sale in CO, FL, GA, HI, ID, MA, MD, NH, NJ and NY.
2. This Fund is registered for sale in CA, CT, DE, FL, MA, NJ, NY and VT.
3. An affiliate of New York Life Investment Management LLC.
Not part of the Annual Report
For more information
800-MAINSTAY (624-6782)
mainstayinvestments.com
MainStay Investments® is a registered service mark and name under which New York Life Investment Management LLC does business. MainStay Investments, an indirect subsidiary of New York Life Insurance Company, New York, NY 10010, provides investment advisory products and services. The MainStay Funds® are managed by New York Life Investment Management LLC and distributed by NYLIFE Distributors LLC, 30 Hudson Street, Jersey City, NJ 07302, a wholly owned subsidiary of New York Life Insurance Company. NYLIFE Distributors LLC is a Member FINRA/SIPC.
©2017 NYLIFE Distributors LLC. All rights reserved.
| | | | | | | | |
| Not FDIC/NCUA Insured | | Not a Deposit | | May Lose Value | | No Bank Guarantee | | Not Insured by Any Government Agency |
| | |
| 1717394 MS286-17 | | MSMP11-12/17 (NYLIM) NL220 |
As of the end of the period covered by this report, the Registrant has adopted a code of ethics (the “Code”) that applies to the Registrant’s principal executive officer (“PEO”) and principal financial officer (“PFO”). A copy of the Code is filed herewith. The Registrant did not grant any waivers, including implicit waivers, from any provisions of the Code to the PEO or PFO during the period covered by this report.
| Item 3. | Audit Committee Financial Expert. |
The Board of Trustees has determined that the Registrant has one audit committee financial expert serving on its Audit Committee. The Audit Committee financial expert is Alan R. Latshaw. Mr. Latshaw is “independent” within the meaning of that term under the Investment Company Act of 1940.
| Item 4. | Principal Accountant Fees and Services. |
The aggregate fees billed for the fiscal year ended October 31, 2017 for professional services rendered by KPMG for the audit of the Registrant’s annual financial statements or services that are normally provided by KPMG in connection with statutory and regulatory filings or engagements for that fiscal year were $739,900.
The aggregate fees billed for the fiscal year ended October 31, 2016 for professional services rendered by KPMG LLP (“KPMG”) for the audit of the Registrant’s annual financial statements or services that are normally provided by KPMG in connection with statutory and regulatory filings or engagements for that fiscal year were $690,100.
The aggregate fees billed for assurance and related services by KPMG that are reasonably related to the performance of the audit of the Registrant’s financial statements and are not reported under paragraph (a) of this Item were: (i) $2,500 for the fiscal year ended October 31, 2017, and (ii) $2,500 for the fiscal year ended October 31, 2016. These audit-related services include review of financial highlights for Registrant’s registration statements and issuance of consents to use the auditor’s reports.
The aggregate fees billed for professional services rendered by KPMG for tax compliance, tax advice, and tax planning were: (i) $0 during the fiscal year ended October 31, 2017, and (ii) $0 during the fiscal year ended October 31, 2016. These services primarily included preparation of federal, state and local income tax returns and excise tax returns, as well as services relating to excise tax distribution requirements.
The aggregate fees billed for products and services provided by KPMG, other than the services reported in paragraphs (a) through (c) of this Item were: (i) $0 during the fiscal year ended October 31, 2017, and (ii) $0 during the fiscal year ended October 31, 2016.
| (e) | Pre-Approval Policies and Procedures |
| | (1) | The Registrant’s Audit and Compliance Committee has adopted pre-approval policies and procedures (the “Procedures”) to govern the Committee’s pre-approval of (i) all audit services and permissible non-audit services to be provided to the Registrant by its independent accountant, and (ii) all permissible non-audit services to be provided by such independent accountant to the Registrant’s investment adviser and to any entity controlling, controlled by or under common control with the investment adviser that provides ongoing services to the Registrant (collectively, the “Service Affiliates”) if the services directly relate to the Registrant’s operations and financial reporting. In accordance with the Procedures, the Audit and Compliance Committee is responsible for the engagement of the independent accountant to certify the Registrant’s financial statements for each fiscal year. With respect to the pre-approval of non-audit services provided to the Registrant and its Service Affiliates, the Procedures provide that the Audit and Compliance Committee may annually pre-approve a list of the types of services that may be provided to the Registrant or its Service Affiliates, or the Audit and Compliance Committee may pre-approve such services on a project-by-project basis as they arise. Unless a type of service has received general pre-approval, it will require specific pre-approval by the Audit and Compliance Committee if it is to be provided by the independent accountant. The Procedures also permit the Audit and Compliance Committee to delegate authority to one or more of its members to pre-approve any proposed non-audit services that have not been previously pre-approved by the Audit and Compliance Committee, subject to the ratification by the full Audit and Compliance Committee no later than its next scheduled meeting. To date, the Audit and Compliance Committee has not delegated such authority. |
| | (2) | With respect to the services described in paragraphs (b) through (d) of this Item 4, no amount was approved by the Audit and Compliance Committee pursuant to paragraph (c)(7)(i)(C) of Rule 2-01 of Regulation S-X. |
(f) There were no hours expended on KPMG’s engagement to audit the Registrant’s financial statements for the most recent fiscal year attributable to work performed by persons other than KPMG’s full-time, permanent employees.
(g) All non-audit fees billed by KPMG for services rendered to the Registrant for the fiscal years ended October 31, 2017 and October 31, 2016 are disclosed in 4(b)-(d) above.
The aggregate non-audit fees billed by KPMG for services rendered to the Registrant’s investment adviser (not including any sub-adviser whose role is primarily portfolio management and is subcontracted with or overseen by another investment adviser), and any entity controlling, controlled by, or under common control with the adviser that provides ongoing services to the Registrant were approximately: (i) $0 for the fiscal year ended October 31, 2017, and (ii) $0 for the fiscal year ended October 31, 2016.
(h) The Registrant’s Audit and Compliance Committee has determined that the non-audit services rendered by KPMG for the fiscal year ended October 31, 2017 to the Registrant’s investment adviser and any entity controlling, controlled by, or under common control with the Registrant’s investment adviser that provides ongoing services to the Registrant that were not required to be pre-approved by the Audit and Compliance Committee because they did not relate directly to the operations and financial reporting of the registrant were compatible with maintaining the respective independence of KPMG during the relevant time period.
| Item 5. | Audit Committee of Listed Registrants |
Not applicable.
| Item 6. | Schedule of Investments |
The Schedule of Investments is included as part of Item 1 of this report.
| Item 7. | Disclosure of Proxy Voting Policies and Procedures for Closed-End Management Investment Companies. |
Not applicable.
| Item 8. | Portfolio Managers of Closed-End Management Investment Companies. |
Not applicable.
| Item 9. | Purchases of Equity Securities by Closed-End Management Investment Company and Affiliated Purchasers. |
Not Applicable.
| Item 10. | Submission of Matters to a Vote of Security Holders. |
Since the Registrant’s last response to this Item, there have been no material changes to the procedures by which shareholders may recommend nominees to the Registrant’s Board of Trustees.
| Item 11. | Controls and Procedures. |
(a) Based on an evaluation of the Registrant’s Disclosure Controls and Procedures (as defined in Rule 30a-3(c) under the Investment Company Act of 1940) (the “Disclosure Controls”), as of a date within 90 days prior to the filing date (the “Filing Date”) of this Form N-CSR (the “Report”), the Registrant’s principal executive officer and principal financial officer have concluded that the Disclosure Controls are reasonably designed to ensure that information required to be disclosed by the Registrant in the Report is recorded, processed, summarized and reported by the Filing Date, including ensuring that information required to be disclosed in the Report is accumulated and communicated to the Registrant’s management, including the Registrant’s principal executive officer and principal financial officer, as appropriate to allow timely decisions regarding required disclosure.
(b) There were no changes in the Registrant’s internal control over financial reporting (as defined in Rule 30a-3(d)) under the Investment Company Act of 1940 that occurred during the second fiscal quarter of the period covered by this report that has materially affected, or is reasonably likely to materially affect, the Registrant’s internal control over financial reporting.
Item 12. Exhibits.
| (a)(2) | Certifications of principal executive officer and principal financial officer as required by Rule 30a-2 under the Investment Company Act of 1940. |
| (b) | Certifications of principal executive officer and principal financial officer as required by Section 906 of the Sarbanes-Oxley Act of 2002. |
SIGNATURES
Pursuant to the requirements of the Securities Exchange Act of 1934 and the Investment Company Act of 1940, the Registrant has duly caused this Report to be signed on its behalf by the undersigned, thereunto duly authorized.
THE MAINSTAY FUNDS
| | |
By: | | /s/ Kirk C. Lehneis |
| | Kirk C. Lehneis |
| | President and Principal Executive Officer |
Date: January 5, 2018
Pursuant to the requirements of the Securities Exchange Act of 1934 and the Investment Company Act of 1940, this Report has been signed below by the following persons on behalf of the Registrant and in the capacities and on the dates indicated.
| | |
By: | | /s/ Kirk C. Lehneis |
| | Kirk C. Lehneis |
| | President and Principal Executive Officer |
Date: January 5, 2018
| | |
By: | | /s/ Jack R. Benintende |
| | Jack R. Benintende |
| | Treasurer and Principal Financial and Accounting Officer |
Date: January 5, 2018
EXHIBIT INDEX
| (a)(2) | Certifications of principal executive officer and principal financial officer as required by Rule 30a-2 under the Investment Company Act of 1940. |
| (b) | Certification of principal executive officer and principal financial officer as required by Section 906 of the Sarbanes-Oxley Act of 2002. |