UNITED STATES
SECURITIES AND EXCHANGE COMMISSION
Washington, D.C. 20549
Form N-CSR
CERTIFIED SHAREHOLDER REPORT OF REGISTERED MANAGEMENT
INVESTMENT COMPANIES
Investment Company Act File Number 811-04550
THE MAINSTAY FUNDS
(Exact name of Registrant as specified in charter)
51 Madison Avenue, New York, NY 10010
(Address of principal executive offices) (Zip code)
J. Kevin Gao, Esq.
30 Hudson Street
Jersey City, New Jersey 07302
(Name and address of agent for service)
Registrant’s telephone number, including area code: (212) 576-7000
Date of fiscal year end: October 31
Date of reporting period: October 31, 2016
FORM N-CSR
| Item 1. | Reports to Stockholders. |
MainStay Unconstrained Bond Fund
Message from the President and Annual Report
October 31, 2016


This Page Intentionally Left Blank
Message from the President
During the 12 months ended October 31, 2016, the U.S. stock and bond markets were somewhat volatile but generally ended the reporting period in positive territory. In the fall of 2015 and early 2016, the market appeared to be focused on China’s economic weakness and a prolonged decline in oil prices. Although energy-related companies felt the brunt of these setbacks, the stock market as a whole declined until mid-February, when oil prices began to rise and stocks began a relatively steady recovery.
In late June, the United Kingdom voted to leave the European Union in a referendum popularly known as “Brexit.” The news caused a temporary slump in stocks around the world. Although the British pound dropped in value following the vote, stocks generally recovered through the end of the reporting period. As the end of the reporting period approached, speculation about the upcoming U.S. presidential election heightened market volatility.
According to FTSE-Russell data, U.S. stocks as a whole tended to provide positive returns during the reporting period, with large-capitalization stocks generally outperforming stocks of smaller companies. Value stocks outpaced growth stocks at all capitalization levels, with the largest differences among small- to mid-cap stocks.
International and emerging-market stocks provided mixed performance. Rocked by Brexit, European stocks as a whole declined during the reporting period, while stocks in the Asia-Pacific region (with or without Japan) tended to provide positive returns. International stocks as a whole declined, while global stocks advanced slightly. Emerging-market stocks were considerably stronger, boosted by advances in India and Latin America and higher prices for oil, metals and other commodities.
Anticipation of a possible Federal Reserve rate hike led to volatility in the bond market, but the Federal Open Market Committee chose not to raise the federal funds target rate during the reporting period. Short-term U.S. Treasury yields rose during the reporting period, and longer-term U.S. Treasury yields declined. Overall, the U.S. bond market provided positive returns, with longer-term bonds generally outperforming shorter-term securities. High-yield bonds, particularly
longer-term issues, were strong performers. Municipal bonds generally provided positive single-digit total returns for the 12 months ended October 31, 2016.
Central banks around the world remained highly accommodative during the reporting period, particularly in light of Brexit. Shortly after the U.K. referendum, more than a third of all sovereign debt carried negative yields. As an asset class, emerging-market bonds provided double-digit positive returns during the reporting period, and world bonds as a whole provided positive single-digit positive returns.
At MainStay, we know that political, economic and market events may influence the performance of your Fund investments. While our portfolio managers often pay close attention to such events, their primary emphasis is seeking to invest for the long-term investment needs of our shareholders. With this in mind, they seek to pursue the investment objectives of their respective Funds using the principal investment strategies and investment processes outlined in the prospectus. By placing your assets in the care of our investment professionals, you gain access to their extensive market insight, strategic investment discipline and in-depth experience in risk-management over a wide range of market cycles.
The report that follows provides more detailed information about the market forces, portfolio strategies and individual securities that influenced the performance of your MainStay Fund during the 12 months ended October 31, 2016. We invite you to read the report carefully as part of your personal investment-review process.
We thank you for your business, and we look forward to a continuing relationship as you pursue your long-range financial goals.
Sincerely,

Stephen P. Fisher
President
The opinions expressed are as of the date of this report and are subject to change. There is no guarantee that any forecast made will come to pass. This material does not constitute investment advice and is not intended as an endorsement of any specific investment. Past performance is no guarantee of future results.
Not part of the Annual Report
Table of Contents
Investors should refer to the Fund’s Summary Prospectus and/or Prospectus and consider the Fund’s investment objectives, strategies, risks, charges and expenses carefully before investing. The Summary Prospectus and/or Prospectus contain this and other information about the Fund. You may obtain copies of the Fund’s Summary Prospectus, Prospectus and Statement of Additional Information free of charge, upon request, by calling toll-free 800-MAINSTAY (624-6782), by writing to NYLIFE Distributors LLC, Attn: MainStay Marketing Department, 30 Hudson Street, Jersey City, NJ 07302 or by sending an e-mail to MainStayShareholderServices@nylim.com. These documents are also available via the MainStay Funds’ website at mainstayinvestments.com/documents. Please read the Summary Prospectus and/or Prospectus carefully before investing.
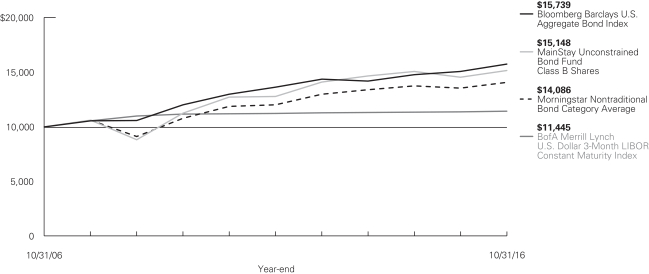
Investment and Performance Comparison1 (Unaudited)
Performance data quoted represents past performance. Past performance is no guarantee of future results. Because of market volatility and other factors, current performance may be lower or higher than the figures shown. Investment return and principal value will fluctuate, and as a result, when shares are redeemed, they may be worth more or less than their original cost. The graph below depicts the historical performance of Class B shares of the Fund. Performance will vary from class to class based on differences in class-specific expenses and sales charges. For performance information current to the most recent month-end, please call 800-MAINSTAY (624-6782) or visit mainstayinvestments.com.
(With sales charges)
Average Annual Total Returns for the Year Ended October 31, 2016
| | | | | | | | | | | | | | | | | | | | |
| Class | | Sales Charge | | | | One Year | | | Five Years | | | Ten Years | | | Gross
Expense
Ratio2 | |
| Class A Shares | | Maximum 4.5% Initial Sales Charge | | With sales charges Excluding sales charges | |
| 0.22
4.94 | %
| |
| 3.34
4.29 | %
| |
| 4.65
5.14 | %
| |
| 1.01
1.01 | %
|
| Investor Class Shares3 | | Maximum 4.5% Initial Sales Charge | | With sales charges Excluding sales charges | |
| 0.28
5.00 |
| |
| 3.25
4.20 |
| |
| 4.55
5.03 |
| |
| 1.03
1.03 |
|
| Class B Shares | | Maximum 5% CDSC
if Redeemed Within the First
Six Years of Purchase | | With sales charges Excluding sales charges | |
| –0.84
4.16 |
| |
| 3.08
3.43 |
| |
| 4.24
4.24 |
| |
| 1.78
1.78 |
|
| Class C Shares | | Maximum 1% CDSC if Redeemed Within
One Year of Purchase | | With sales charges Excluding sales charges | |
| 3.16
4.16 |
| |
| 3.43
3.43 |
| |
| 4.23
4.23 |
| |
| 1.78
1.78 |
|
| Class I Shares | | No Sales Charge | | | | | 5.32 | | | | 4.55 | | | | 5.43 | | | | 0.76 | |
| Class R2 Shares4 | | No Sales Charge | | | | | 4.84 | | | | 4.19 | | | | 5.03 | | | | 1.11 | |
| Class R3 Shares5 | | No Sales Charge | | | | | 4.58 | | | | 3.93 | | | | 4.77 | | | | 1.36 | |
| 1. | The performance table and graph do not reflect the deduction of taxes that a shareholder would pay on distributions or Fund share redemptions. Total returns reflect maximum applicable sales charges as indicated in the table above, if any, changes in share price, and reinvestment of dividend and capital gain distributions. The graph assumes the initial investment amount shown above and reflects the deduction of all sales charges that would have applied for the period of investment. Performance figures may reflect certain fee waivers and/or expense limitations, without which total returns may have been lower. For more information on share classes and current fee waivers and/or expense limitations (if any), please refer to the notes to the financial statements. |
| 2. | The gross expense ratios presented reflect the Fund’s “Total Annual Fund Operating Expenses” from the most recent Prospectus and may differ from other expense ratios disclosed in this report. |
| 3. | Performance figures for Investor Class shares, first offered on February 28, 2008, include the historical performance of Class A shares through February 27, 2008, adjusted for differences in certain fees and expenses. Unadjusted, the performance shown for the Investor Class shares would likely have been different. |
| 4. | Performance figures for Class R2 shares, first offered on February 28, 2014, include the historical performance of Class A shares through February 27, 2014, adjusted for differences in certain fees and expenses. Unadjusted, the performance shown for the Class R2 shares would likely have been different. |
| 5. | Performance figures for Class R3 shares, first offered on February 29, 2016, include the historical performance of Class A shares through February 28, 2016, adjusted for differences in certain fees and expenses. Unadjusted, the performance shown for the Class R3 shares would likely have been different. |
The footnotes on the next page are an integral part of the table and graph and should be carefully read in conjunction with them.
| | | | | | | | | | | | |
| Benchmark Performance | | One
Year | | | Five
Years | | | Ten
Years | |
Bloomberg Barclays U.S. Aggregate Bond Index6 | | | 4.37 | % | | | 2.90 | % | | | 4.64 | % |
BofA Merrill Lynch U.S. Dollar 3-Month LIBOR Constant Maturity Index7 | | | 0.54 | | | | 0.37 | | | | 1.36 | |
Morningstar Nontraditional Bond Category Average8 | | | 3.99 | | | | 2.63 | | | | 3.48 | |
| 6. | The Bloomberg Barclays U.S. Aggregate Bond Index is the Fund’s primary broad-based securities market index for comparison purposes. The Bloomberg Barclays U.S. Aggregate Bond Index is a broad-based benchmark that measures the investment grade, U.S. dollar-denominated, fixed-rate taxable bond market, including Treasurys, government-related and corporate securities, mortgage-backed securities (agency fixed-rate and hybrid adjustable rate mortgage pass-throughs), asset-backed securities, and commercial mortgage-backed securities. Results assume reinvestment of all dividends and capital gains. An investment cannot be made directly in an index. |
| 7. | The Fund has selected the BofA Merrill Lynch U.S. Dollar 3-Month LIBOR Constant Maturity Index as a secondary benchmark. The BofA Merrill Lynch U.S. Dollar 3-Month LIBOR Constant Maturity Index represents the London |
| | InterBank Offered Rate (“LIBOR”) with a constant 3-month average maturity. LIBOR is a composite of interest rates at which banks borrow from one another in the London market, and it is a widely used benchmark for short-term interest rates. An investment cannot be made directly in an index. |
| 8. | The Fund has selected the Morningstar nontraditional bond category average as an additional benchmark. The Morningstar Nontraditional Bond Category Average contains funds that pursue strategies divergent in one or more ways from conventional practice in the broader bond-fund universe. Morningstar category averages are equal-weighted returns based on constituents of the category at the end of the period. Results assume reinvestment of all dividends and capital gains. An investment cannot be made directly in an index. |
The footnotes on the preceding page are an integral part of the table and graph and should be carefully read in conjunction with them.
| | |
| 6 | | MainStay Unconstrained Bond Fund |
Cost in Dollars of a $1,000 Investment in MainStay Unconstrained Bond Fund (Unaudited)
The example below is intended to describe the fees and expenses borne by shareholders during the six-month period from May 1, 2016, to October 31, 2016, and the impact of those costs on your investment.
Example
As a shareholder of the Fund, you incur two types of costs: (1) transaction costs, including exchange fees and sales charges (loads) on purchases (as applicable), and (2) ongoing costs, including management fees, distribution and/or service (12b-1) fees, and other Fund expenses (as applicable). This example is intended to help you understand your ongoing costs (in dollars) of investing in the Fund and to compare these costs with the ongoing costs of investing in other mutual funds. The example is based on an investment of $1,000 made at the beginning of the six-month period and held for the entire period from May 1, 2016, to October 31, 2016.
This example illustrates your Fund’s ongoing costs in two ways:
Actual Expenses
The second and third data columns in the table below provide information about actual account values and actual expenses. You may use the information in these columns, together with the amount you invested, to estimate the expenses that you paid during the six months ended October 31, 2016. Simply divide your account value by $1,000 (for example, an $8,600 account value divided by $1,000 = 8.6), then
multiply the result by the number under the heading entitled “Expenses Paid During Period” to estimate the expenses you paid on your account during this period.
Hypothetical Example for Comparison Purposes
The fourth and fifth data columns in the table below provide information about hypothetical account values and hypothetical expenses based on the Fund’s actual expense ratio and an assumed rate of return of 5% per year before expenses, which is not the Fund’s actual return. The hypothetical account values and expenses may not be used to estimate the actual ending account balances or expenses you paid for the six-month period shown. You may use this information to compare the ongoing costs of investing in the Fund with the ongoing costs of investing in other Funds. To do so, compare this 5% hypothetical example with the 5% hypothetical examples that appear in the shareholder reports of the other Funds.
Please note that the expenses shown in the table are meant to highlight your ongoing costs only and do not reflect any transactional costs, such as exchange fees or sales charges (loads). Therefore, the fourth and fifth data columns of the table are useful in comparing ongoing costs only and will not help you determine the relative total costs of owning different funds. In addition, if these transactional costs were included, your costs would have been higher.
| | | | | | | | | | | | | | | | | | | | |
| | | | | | | | | | | | | | | | |
| Share Class | | Beginning
Account
Value
5/1/16 | | | Ending Account
Value (Based
on Actual
Returns and
Expenses)
10/31/16 | | | Expenses
Paid
During
Period1 | | | Ending Account
Value (Based
on Hypothetical
5% Annualized
Return and
Actual Expenses)
10/31/16 | | | Expenses
Paid
During
Period1 | |
| | | | | |
| Class A Shares | | $ | 1,000.00 | | | $ | 1,045.10 | | | $ | 5.91 | | | $ | 1,019.40 | | | $ | 5.84 | |
| | | | | |
| Investor Class Shares | | $ | 1,000.00 | | | $ | 1,044.60 | | | $ | 6.06 | | | $ | 1,019.20 | | | $ | 5.99 | |
| | | | | |
| Class B Shares | | $ | 1,000.00 | | | $ | 1,041.30 | | | $ | 9.90 | | | $ | 1,015.40 | | | $ | 9.78 | |
| | | | | |
| Class C Shares | | $ | 1,000.00 | | | $ | 1,041.30 | | | $ | 9.90 | | | $ | 1,015.40 | | | $ | 9.78 | |
| | | | | |
| Class I Shares | | $ | 1,000.00 | | | $ | 1,046.40 | | | $ | 4.63 | | | $ | 1,020.60 | | | $ | 4.57 | |
| | | | | |
| Class R2 Shares | | $ | 1,000.00 | | | $ | 1,044.70 | | | $ | 6.68 | | | $ | 1,018.60 | | | $ | 6.60 | |
| | | | | |
| Class R3 Shares | | $ | 1,000.00 | | | $ | 1,042.20 | | | $ | 7.24 | | | $ | 1,018.00 | | | $ | 7.15 | |
| 1. | Expenses are equal to the Fund’s annualized expense ratio of each class (1.15% for Class A, 1.18% for Investor Class, 1.93% for Class B and Class C, 0.90% for Class I and 1.30% for Class R2 and 1.50% for Class R3) multiplied by the average account value over the period, divided by 366 and multiplied by 184 (to reflect the six-month period). The table above represents the actual expenses incurred during the six-month period. |
Portfolio Composition as of October 31, 2016 (Unaudited)
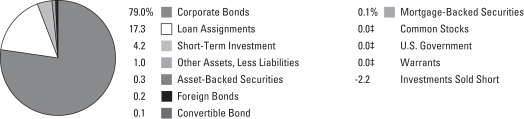
See Portfolio of Investments beginning on page 11 for specific holdings within these categories.
| ‡ | Less than one-tenth of a percent. |
Top Ten Holdings or Issuers Held as of October 31, 2016 (excluding short-term investment) (Unaudited)
| 1. | Bank of America Corp., 3.248%–8.57%,
due 6/1/19–12/29/49 |
| 2. | Morgan Stanley, 4.875%–5.45%, due 11/1/22–7/29/49 |
| 3. | USAGM HoldCo LLC, 4.75%–9.50%,
due 7/28/22–7/28/23 |
| 4. | Wells Fargo & Co., 4.65%–5.90%,
due 1/15/44–12/29/49 |
| 5. | Goldman Sachs Group, Inc. (The), 2.35%–3.625%, due 11/15/21–1/22/23 |
| 6. | Quikrete Holdings, Inc., 4.00%, due 9/28/20 |
| 7. | Tesoro Corp., 5.125%, due 4/1/24 |
| 8. | Liberty Mutual Group, Inc., 6.50%–10.75%,
due 3/15/35–6/15/88 |
| 9. | Lennar Corp., 4.50%, due 6/15/19–11/15/19 |
| 10. | Citigroup, Inc., 6.30%, due 12/29/49 |
| | |
| 8 | | MainStay Unconstrained Bond Fund |
Portfolio Management Discussion and Analysis (Unaudited)
Questions answered by portfolio managers Dan Roberts, PhD, Michael Kimble, CFA, Louis N. Cohen, CFA, and Taylor Wagenseil1 of MacKay Shields LLC, the Fund’s Subadvisor.
How did MainStay Unconstrained Bond Fund perform relative to its benchmarks and peers during the 12 months ended October 31, 2016?
Excluding all sales charges, MainStay Unconstrained Bond Fund returned 4.94% for Class A shares, 5.00% for Investor Class shares and 4.16% for Class B and Class C shares for the 12 months ended October 31, 2016. Over the same period, the Fund returned 5.32% for Class I shares, 4.84% for Class R2 shares and 4.58% for Class R3 shares.2 For the 12 months ended October 31, 2016, all share classes-except Class B and Class C shares-outperformed the 4.37% return of the Bloomberg Barclays U.S. Aggregate Bond Index,3 which is the Fund’s primary benchmark. Over the same period, all share classes outperformed the 0.54% return of the BofA Merrill Lynch U.S. Dollar 3-Month LIBOR Constant Maturity Index,3 which is the Fund’s secondary benchmark. For the 12 months ended October 31, 2016, all share classes outperformed the 3.99% return of the Morningstar Nontraditional Bond Category Average,4 which is an additional benchmark for the Fund. See page 5 for Fund returns with applicable sales charges.
What factors affected the Fund’s relative performance during the reporting period?
Throughout the reporting period, our strategy was to maintain overweight positions relative to the Bloomberg Barclays U.S. Aggregate Bond Index in spread product,5 including high-yield bonds, bank loans and investment-grade credit. Although this positioning fell out of favor at the beginning of the reporting period, credit rebounded strongly from mid-February to the end of the reporting period, moving up from a low point as oil prices rebounded and fears of a slowing U.S. economy diminished. This sharp correction in the credit markets, coupled with the Fund’s overweight position in credit compared to the benchmark, was the driving force behind the Fund’s performance relative to the Bloomberg Barclays U.S. Aggregate Bond Index. In a stressed market, investors typically seek safe harbors and the market generally demands more compensation for risk, creating an opportunity for defensively-postured funds to outperform as prices for riskier assets fall. Conditions like these were seen early in the reporting period, and they detracted from the Fund’s credit bias. In a market with an appetite for risk, the risk premium for spread product falls, leading to tighter spreads and higher prices for risk assets. Conditions like these were seen in the second half of the reporting period, and they were beneficial for the Fund’s credit bias.
What was the Fund’s duration6 strategy during the reporting period?
In order to reduce the Fund’s sensitivity to interest rates, the Fund’s duration was generally shorter than that of the Bloomberg Barclays U.S. Aggregate Bond Index throughout the reporting period. At the end of the reporting period, the Fund’s duration was approximately 1.4 years, which was shorter than the duration of the Bloomberg Barclays U.S. Aggregate Bond Index.
What specific factors, risks or market forces prompted significant decisions for the Fund during the reporting period?
Throughout the reporting period, a number of factors were considered in positioning the Fund. These factors included inconsistent economic data, global central-bank monetary policy, volatility in energy prices and the impact of the U.K.’s decision to leave the European Union (“Brexit”). Nevertheless, we did not make any significant shifts in the Fund’s positioning during the reporting period. We believed that corporate bonds (both investment grade and high yield) and bank loans warranted overweight positions in the Fund compared to government-related securities. This positioning reflected the current low-interest-rate environment, significant refinancing in the credit markets, generally improved balance sheet fundamentals and a more favorable supply/demand balance for corporate debt.
We did, however, slightly trim the Fund’s high-yield corporate bond position, and we slightly increased the Fund’s exposure to investment-grade bonds. Within the high-yield bond sector, we reduced the Fund’s position in energy. Although energy prices rose from their lows in February, prices remained well below their highs and defaults remained a concern.
During the reporting period, which market segments were the strongest positive contributors to the Fund’s performance and which market segments were particularly weak?
The Fund’s high-yield credit component was the largest contributor to the Fund’s performance during the reporting period, as lower-quality credits performed better than higher-quality credits. (Contributions take weightings and total returns into account.) Bank loans and investment-grade credit also
| 1. | Mr. Wagenseil served as a portfolio manager for the Fund until August 6, 2016. |
| 2. | See footnote on page 5 for more information on Class R3 shares. |
| 3. | See footnote on page 6 for more information on this index. |
| 4. | See footnote on page 6 for more information on the Morningstar Nontraditional Bond Category Average. |
| 5. | The terms “spread” and “yield spread” may refer to the difference in yield between a security or type of security and comparable U.S. Treasury issues. The terms may also refer to the difference in yield between two specific securities or types of securities at a given time. The term “spread product” refers to asset classes that typically trade at a spread to comparable U.S. Treasury securities. |
| 6. | Duration is a measure of the price sensitivity of a fixed-income investment to changes in interest rates. Duration is expressed as a number of years and is considered a more accurate sensitivity gauge than average maturity. |
contributed positively to the Fund’s performance but underperformed high-yield returns.
Within the Fund’s high-yield position, home builders, wireless communications and some commodity-related securities contributed positively to the Fund’s performance. Within the investment-grade credit market, the Fund’s financial holdings also contributed positively to results. Within high yield, the Fund’s energy positions were positive contributors during the reporting period, but the Fund’s underweight position in energy detracted from performance. The transportation sector also underperformed.
Did the Fund make any significant purchases or sales during the reporting period?
During the reporting period, the Fund initiated positions in wireless provider Sprint and consumer goods company Mondelez. Both positions were purchased as new issues and offered attractive yields for the Fund, and the Sprint bonds were secured by the company’s wireless spectrum. During the reporting period, the Fund sold bonds in energy companies Weatherford and Denbury Resources. The bonds of both companies rallied with the run-up in energy prices and were sold to promote risk reduction in the Fund.
How did the Fund’s sector weightings change during the reporting period?
During the reporting period, the Fund slightly trimmed its high-yield credit position and slightly increased its exposure to investment-grade credit. As previously noted, the Fund reduced its high-yield energy exposure.
How was the Fund positioned at the end of the reporting period?
As of October 31, 2016, the Fund maintained overweight positions relative to the Bloomberg Barclays U.S. Aggregate Bond Index in spread product, specifically in high-yield bonds and bank loans. The increased volatility experienced in the third quarter of 2015 created a wider disparity between spreads and defaults, increasing our conviction in the Fund’s overweight position in high-yield securities. As of the same date, the Fund held underweight positions relative to the Index in sectors that are more rate sensitive, such as U.S. Treasury securities and agency securities.
The opinions expressed are those of the portfolio managers as of the date of this report and are subject to change. There is no guarantee that any forecasts will come to pass. This material does not constitute investment advice and is not intended as an endorsement of any specific investment.
| | |
| 10 | | MainStay Unconstrained Bond Fund |
Portfolio of Investments October 31, 2016
| | | | | | | | |
| | | Principal
Amount | | | Value | |
Long-Term Bonds 97.0%† Asset-Backed Securities 0.3% | |
Home Equity 0.2% | |
Carrington Mortgage Loan Trust | | | | | | | | |
Series 2006-NC4, Class A5
0.585%, due 10/25/36 (a) | | $ | 182,602 | | | $ | 178,385 | |
Citigroup Mortgage Loan Trust | | | | | | | | |
Series 2007-AHL2, Class A3A
0.595%, due 5/25/37 (a) | | | 145,134 | | | | 105,472 | |
First NLC Trust | | | | | | | | |
Series 2007-1, Class A1
0.595%, due 8/25/37 (a)(b) | | | 374,075 | | | | 210,416 | |
GSAA Home Equity Trust | | | | | | | | |
Series 2006-14, Class A1
0.575%, due 9/25/36 (a) | | | 774,329 | | | | 393,262 | |
Home Equity Loan Trust | | | | | | | | |
Series 2007-FRE1, Class 2AV1 0.655%, due 4/25/37 (a) | | | 70,625 | | | | 68,940 | |
HSI Asset Securitization Corp. Trust | | | | | | | | |
Series 2007-NC1, Class A1
0.625%, due 4/25/37 (a) | | | 3,581 | | | | 2,560 | |
JPMorgan Mortgage Acquisition Trust | | | | | | | | |
Series 2007-HE1, Class AF1
0.625%, due 3/25/47 (a) | | | 144,050 | | | | 83,937 | |
MASTR Asset Backed Securities Trust | | | | | | | | |
Series 2006-HE4, Class A1
0.575%, due 11/25/36 (a) | | | 97,433 | | | | 45,852 | |
Morgan Stanley ABS Capital I, Inc. | | | | | | | | |
Series 2006-HE6, Class A2B
0.625%, due 9/25/36 (a) | | | 348,139 | | | | 171,513 | |
Series 2006-HE8, Class A2B
0.625%, due 10/25/36 (a) | | | 177,581 | | | | 100,869 | |
Series 2007-HE4, Class A2A
0.635%, due 2/25/37 (a) | | | 93,810 | | | | 44,260 | |
Series 2007-NC2, Class A2FP
0.675%, due 2/25/37 (a) | | | 355,511 | | | | 211,572 | |
Renaissance Home Equity Loan Trust | | | | | | | | |
Series 2007-2, Class AF1
5.893%, due 6/25/37 (c) | | | 892,902 | | | | 442,257 | |
Securitized Asset-Backed Receivables LLC Trust | | | | | | | | |
Series 2007-BR4, Class A2A
0.615%, due 5/25/37 (a) | | | 416,252 | | | | 255,510 | |
Soundview Home Equity Loan Trust | | | | | | | | |
Series 2007-OPT1, Class 2A1
0.605%, due 6/25/37 (a) | | | 363,627 | | | | 245,076 | |
Series 2006-EQ2, Class A2
0.635%, due 1/25/37 (a) | | | 226,258 | | | | 161,719 | |
| | | | | | | | |
| | | Principal
Amount | | | Value | |
Home Equity (continued) | |
Specialty Underwriting & Residential Finance Trust | | | | | | | | |
Series 2006-BC4, Class A2B
0.635%, due 9/25/37 (a) | | $ | 930,652 | | | $ | 468,031 | |
| | | | | | | | |
| | | | | | | 3,189,631 | |
| | | | | | | | |
Student Loans 0.1% | | | | | | | | |
KeyCorp Student Loan Trust | | | | | | | | |
Series 2000-A, Class A2
0.982%, due 5/25/29 (a) | | | 840,378 | | | | 809,545 | |
| | | | | | | | |
Total Asset-Backed Securities
(Cost $5,247,377) | | | | | | | 3,999,176 | |
| | | | | | | | |
| | |
| Convertible Bond 0.1% | | | | | | | | |
Transportation 0.1% | | | | | | | | |
Hornbeck Offshore Services, Inc.
1.50%, due 9/1/19 | | | 1,900,000 | | | | 1,202,938 | |
| | | | | | | | |
Total Convertible Bond
(Cost $2,079,837) | | | | | | | 1,202,938 | |
| | | | | | | | |
| | |
| Corporate Bonds 79.0% | | | | | | | | |
Advertising 0.2% | | | | | | | | |
Lamar Media Corp.
5.375%, due 1/15/24 | | | 2,695,000 | | | | 2,836,488 | |
| | | | | | | | |
| | |
Aerospace & Defense 1.5% | | | | | | | | |
KLX, Inc.
5.875%, due 12/1/22 (b) | | | 8,935,000 | | | | 9,093,149 | |
Moog, Inc.
5.25%, due 12/1/22 (b) | | | 5,505,000 | | | | 5,642,625 | |
Orbital ATK, Inc. | | | | | | | | |
5.25%, due 10/1/21 (d) | | | 2,250,000 | | | | 2,328,750 | |
5.50%, due 10/1/23 | | | 4,045,000 | | | | 4,206,800 | |
| | | | | | | | |
| | | | | | | 21,271,324 | |
| | | | | | | | |
Airlines 1.4% | | | | | | | | |
Continental Airlines, Inc. | | | | | | | | |
Series 2007-1, Class A
5.983%, due 10/19/23 | | | 2,934,806 | | | | 3,308,994 | |
Series 2003-ERJ1
7.875%, due 1/2/20 | | | 148,727 | | | | 155,141 | |
Series 2005-ERJ1
9.798%, due 10/1/22 | | | 405,716 | | | | 447,302 | |
Delta Air Lines, Inc. | | | | | | | | |
Series 2011-1, Class A,
Pass Through Trust
5.30%, due 10/15/20 | | | 847,990 | | | | 907,349 | |
| † | Percentages indicated are based on Fund net assets. |
| ¨ | | Among the Fund’s 10 largest holdings or issuers held, as of October 31, 2016, excluding short-term investment. May be subject to change daily. (Unaudited) |
| | | | | | |
The notes to the financial statements are an integral part of,
and should be read in conjunction with, the financial statements. | | | | | 11 | |
Portfolio of Investments October 31, 2016 (continued)
| | | | | | | | |
| | | Principal
Amount | | | Value | |
| Corporate Bonds (continued) | | | | | |
Airlines (continued) | | | | | | | | |
U.S. Airways Group, Inc. | | | | | | | | |
Series 2012-1, Class A,
Pass Through Trust
5.90%, due 4/1/26 | | $ | 2,237,004 | | | $ | 2,564,166 | |
Series 2010-1, Class A,
Pass Through Trust
6.25%, due 10/22/24 | | | 6,610,487 | | | | 7,486,376 | |
United Airlines, Inc. | | | | | | | | |
Series 2014-2, Class B,
Pass Through Trust
4.625%, due 3/3/24 | | | 5,592,644 | | | | 5,690,515 | |
| | | | | | | | |
| | | | | | | 20,559,843 | |
| | | | | | | | |
Auto Manufacturers 0.9% | | | | | | | | |
Ford Holdings LLC
9.30%, due 3/1/30 | | | 93,000 | | | | 131,959 | |
Ford Motor Co. | | | | | | | | |
7.45%, due 7/16/31 | | | 39,000 | | | | 51,243 | |
8.90%, due 1/15/32 | | | 3,009,000 | | | | 4,122,201 | |
Ford Motor Credit Co. LLC
8.00%, due 12/15/16 | | | 22,000 | | | | 22,170 | |
General Motors Financial Co., Inc.
3.45%, due 4/10/22 | | | 8,590,000 | | | | 8,685,770 | |
| | | | | | | | |
| | | | | | | 13,013,343 | |
| | | | | | | | |
Auto Parts & Equipment 2.6% | | | | | | | | |
Dana, Inc.
5.375%, due 9/15/21 | | | 8,575,000 | | | | 8,891,203 | |
Goodyear Tire & Rubber Co. (The) | | | | | | | | |
5.00%, due 5/31/26 | | | 2,000,000 | | | | 2,017,500 | |
7.00%, due 5/15/22 | | | 1,000,000 | | | | 1,051,250 | |
MPG Holdco I, Inc.
7.375%, due 10/15/22 | | | 7,910,000 | | | | 8,058,312 | |
Schaeffler Finance B.V.
4.75%, due 5/15/23 (b) | | | 6,490,000 | | | | 6,692,813 | |
ZF North America Capital, Inc.
4.50%, due 4/29/22 (b) | | | 9,440,000 | | | | 9,994,600 | |
| | | | | | | | |
| | | | | | | 36,705,678 | |
| | | | | | | | |
Banks 10.7% | | | | | | | | |
¨Bank of America Corp. | | | | | | | | |
3.248%, due 10/21/27 | | | 5,170,000 | | | | 5,171,934 | |
3.30%, due 1/11/23 | | | 510,000 | | | | 524,594 | |
4.25%, due 10/22/26 | | | 7,260,000 | | | | 7,628,155 | |
5.125%, due 12/29/49 (a) | | | 4,990,000 | | | | 4,919,142 | |
5.625%, due 7/1/20 | | | 1,720,000 | | | | 1,925,081 | |
6.11%, due 1/29/37 | | | 2,807,000 | | | | 3,407,611 | |
6.30%, due 12/29/49 (a) | | | 3,570,000 | | | | 3,895,405 | |
7.625%, due 6/1/19 | | | 420,000 | | | | 479,511 | |
8.57%, due 11/15/24 | | | 1,645,000 | | | | 2,113,248 | |
Bank of New York Mellon Corp. (The) 4.625%, due 12/29/49 (a) | | | 3,850,000 | | | | 3,758,755 | |
| | | | | | | | |
| | | Principal
Amount | | | Value | |
Banks (continued) | | | | | | | | |
Barclays Bank PLC
5.14%, due 10/14/20 | | $ | 8,037,000 | | | $ | 8,661,555 | |
Capital One Financial Corp. | | | | | | | | |
4.20%, due 10/29/25 | | | 800,000 | | | | 830,706 | |
5.55%, due 12/29/49 (a) | | | 4,375,000 | | | | 4,423,602 | |
¨Citigroup, Inc.
6.30%, due 12/29/49 (a) | | | 10,800,000 | | | | 11,056,500 | |
Citizens Financial Group, Inc.
4.15%, due 9/28/22 (b) | | | 2,270,000 | | | | 2,338,627 | |
¨Goldman Sachs Group, Inc. (The) | | | | | | | | |
2.35%, due 11/15/21 | | | 12,990,000 | | | | 12,911,099 | |
3.625%, due 1/22/23 | | | 7,257,000 | | | | 7,635,358 | |
JPMorgan Chase & Co.
6.125%, due 12/29/49 (a) | | | 7,595,000 | | | | 8,041,586 | |
¨Morgan Stanley | | | | | | | | |
4.875%, due 11/1/22 | | | 4,287,000 | | | | 4,708,669 | |
5.00%, due 11/24/25 | | | 2,465,000 | | | | 2,726,554 | |
5.45%, due 7/29/49 (a)(d) | | | 11,425,000 | | | | 11,454,705 | |
Royal Bank of Canada
2.50%, due 1/19/21 | | | 5,565,000 | | | | 5,708,238 | |
Royal Bank of Scotland Group PLC 5.125%, due 5/28/24 | | | 8,746,000 | | | | 8,658,977 | |
Toronto-Dominion Bank (The)
1.80%, due 7/13/21 | | | 6,995,000 | | | | 6,953,911 | |
US Bancorp
2.20%, due 4/25/19 | | | 3,410,000 | | | | 3,475,997 | |
US Bank N.A.
1.40%, due 4/26/19 | | | 3,730,000 | | | | 3,723,148 | |
¨Wells Fargo & Co. | | | | | | | | |
4.65%, due 11/4/44 | | | 825,000 | | | | 852,733 | |
5.606%, due 1/15/44 | | | 5,375,000 | | | | 6,302,746 | |
5.90%, due 12/29/49 (a) | | | 5,835,000 | | | | 6,104,869 | |
Wells Fargo Capital X
5.95%, due 12/1/86 | | | 1,490,000 | | | | 1,594,300 | |
| | | | | | | | |
| | | | | | | 151,987,316 | |
| | | | | | | | |
Beverages 0.9% | | | | | | | | |
Dr Pepper Snapple Group, Inc.
3.20%, due 11/15/21 | | | 4,768,000 | | | | 4,983,046 | |
PepsiCo Inc.
1.35%, due 10/4/19 | | | 7,170,000 | | | | 7,166,430 | |
| | | | | | | | |
| | | | | | | 12,149,476 | |
| | | | | | | | |
Building Materials 1.3% | | | | | | | | |
Masco Corp.
7.125%, due 3/15/20 | | | 2,250,000 | | | | 2,576,250 | |
Standard Industries, Inc.
5.375%, due 11/15/24 (b) | | | 8,400,000 | | | | 8,683,500 | |
USG Corp.
5.875%, due 11/1/21 (b) | | | 6,755,000 | | | | 7,075,862 | |
| | | | | | | | |
| | | | | | | 18,335,612 | |
| | | | | | | | |
| | | | |
| 12 | | MainStay Unconstrained Bond Fund | | The notes to the financial statements are an integral part of,
and should be read in conjunction with, the financial statements. |
| | | | | | | | |
| | | Principal
Amount | | | Value | |
| Corporate Bonds (continued) | | | | | |
Chemicals 1.8% | | | | | | | | |
Air Liquide Finance S.A. | | | | | | | | |
1.375%, due 9/27/19 (b) | | $ | 4,135,000 | | | $ | 4,111,228 | |
1.75%, due 9/27/21 (b) | | | 2,785,000 | | | | 2,749,639 | |
Ashland LLC
4.75%, due 8/15/22 | | | 2,970,000 | | | | 3,068,366 | |
Dow Chemical Co. (The)
8.55%, due 5/15/19 | | | 693,000 | | | | 807,476 | |
Huntsman International LLC | | | | | | | | |
5.125%, due 4/15/21 | | | EUR 3,275,000 | | | | 3,813,680 | |
5.125%, due 11/15/22 | | $ | 3,500,000 | | | | 3,622,500 | |
WR Grace & Co.
5.125%, due 10/1/21 (b) | | | 6,410,000 | | | | 6,826,650 | |
| | | | | | | | |
| | | | | | | 24,999,539 | |
| | | | | | | | |
Commercial Services 1.1% | | | | | | | | |
Hertz Corp. (The)
6.25%, due 10/15/22 | | | 3,865,000 | | | | 3,961,625 | |
Service Corporation International 5.375%, due 1/15/22 | | | 1,835,000 | | | | 1,903,813 | |
United Rentals North America, Inc. | | | | | | | | |
4.625%, due 7/15/23 | | | 4,710,000 | | | | 4,863,075 | |
5.75%, due 11/15/24 | | | 1,750,000 | | | | 1,815,625 | |
6.125%, due 6/15/23 (d) | | | 3,259,000 | | | | 3,405,655 | |
| | | | | | | | |
| | | | | | | 15,949,793 | |
| | | | | | | | |
Computers 0.6% | | | | | | | | |
NCR Corp. | | | | | | | | |
5.00%, due 7/15/22 | | | 5,215,000 | | | | 5,296,458 | |
6.375%, due 12/15/23 (d) | | | 3,350,000 | | | | 3,542,625 | |
| | | | | | | | |
| | | | | | | 8,839,083 | |
| | | | | | | | |
Diversified Financial Services 0.1% | | | | | |
Peachtree Corners Funding Trust 3.976%, due 2/15/25 (b) | | | 1,690,000 | | | | 1,696,118 | |
| | | | | | | | |
| | |
Electric 2.8% | | | | | | | | |
Calpine Corp.
5.75%, due 1/15/25 (d) | | | 4,760,000 | | | | 4,629,100 | |
CMS Energy Corp. | | | | | | | | |
3.875%, due 3/1/24 | | | 3,818,000 | | | | 4,096,466 | |
6.25%, due 2/1/20 | | | 1,980,000 | | | | 2,242,752 | |
FirstEnergy Transmission LLC
5.45%, due 7/15/44 (b) | | | 7,758,000 | | | | 8,559,805 | |
Great Plains Energy, Inc. | | | | | | | | |
4.85%, due 6/1/21 | | | 5,200,000 | | | | 5,674,781 | |
5.292%, due 6/15/22 (c) | | | 663,000 | | | | 734,831 | |
IPALCO Enterprises, Inc.
3.45%, due 7/15/20 | | | 8,560,000 | | | | 8,774,000 | |
WEC Energy Group, Inc.
6.25%, due 5/15/67 (a) | | | 5,495,000 | | | | 4,808,125 | |
| | | | | | | | |
| | | | | | | 39,519,860 | |
| | | | | | | | |
| | | | | | | | |
| | | Principal
Amount | | | Value | |
Electronics 0.6% | | | | | | | | |
Honeywell International, Inc.
1.40%, due 10/30/19 | | $ | 7,840,000 | | | $ | 7,830,757 | |
| | | | | | | | |
| | |
Engineering & Construction 0.5% | | | | | | | | |
SBA Communications Corp.
4.875%, due 7/15/22 | | | 6,561,000 | | | | 6,692,220 | |
| | | | | | | | |
| | |
Entertainment 0.5% | | | | | | | | |
Isle of Capri Casinos, Inc. | | | | | | | | |
5.875%, due 3/15/21 | | | 485,000 | | | | 504,400 | |
8.875%, due 6/15/20 (d) | | | 5,815,000 | | | | 6,156,631 | |
| | | | | | | | |
| | | | | | | 6,661,031 | |
| | | | | | | | |
Finance—Auto Loans 0.5% | | | | | | | | |
Ally Financial, Inc.
8.00%, due 11/1/31 | | | 5,610,000 | | | | 6,703,950 | |
| | | | | | | | |
| | |
Finance—Commercial 0.5% | | | | | | | | |
CIT Group, Inc. | | | | | | | | |
5.00%, due 8/1/23 | | | 2,000,000 | | | | 2,130,200 | |
6.625%, due 4/1/18 (b) | | | 5,100,000 | | | | 5,355,000 | |
| | | | | | | | |
| | | | | | | 7,485,200 | |
| | | | | | | | |
Finance—Consumer Loans 1.5% | | | | | | | | |
Navient Corp. | | | | | | | | |
5.00%, due 10/26/20 | | | 3,210,000 | | | | 3,169,875 | |
8.00%, due 3/25/20 | | | 1,846,000 | | | | 2,002,910 | |
OneMain Financial Holdings LLC
7.25%, due 12/15/21 (b) | | | 8,015,000 | | | | 8,295,525 | |
Springleaf Finance Corp. | | | | | | | | |
6.00%, due 6/1/20 | | | 3,100,000 | | | | 3,127,125 | |
7.75%, due 10/1/21 | | | 4,850,000 | | | | 5,053,215 | |
| | | | | | | | |
| | | | | | | 21,648,650 | |
| | | | | | | | |
Finance—Credit Card 0.2% | | | | | | | | |
Capital One Bank USA N.A.
3.375%, due 2/15/23 | | | 3,000,000 | | | | 3,064,332 | |
| | | | | | | | |
| |
Finance—Investment Banker/Broker 0.1% | | | | | |
Jefferies Group LLC
6.45%, due 6/8/27 | | | 1,100,000 | | | | 1,227,282 | |
| | | | | | | | |
| |
Finance—Leasing Companies 0.2% | | | | | |
Air Lease Corp.
2.125%, due 1/15/20 | | | 3,275,000 | | | | 3,270,386 | |
| | | | | | | | |
| | |
Food 2.9% | | | | | | | | |
J.M. Smucker Co. (The)
1.75%, due 3/15/18 | | | 5,645,000 | | | | 5,667,106 | |
Kerry Group Financial Services
3.20%, due 4/9/23 (b) | | | 4,595,000 | | | | 4,528,009 | |
| | | | | | |
The notes to the financial statements are an integral part of,
and should be read in conjunction with, the financial statements. | | | | | 13 | |
Portfolio of Investments October 31, 2016 (continued)
| | | | | | | | |
| | | Principal
Amount | | | Value | |
| Corporate Bonds (continued) | | | | | |
Food (continued) | | | | | | | | |
Kroger Co. (The)
1.50%, due 9/30/19 | | $ | 4,130,000 | | | $ | 4,107,905 | |
Mondelez International Holdings Netherlands B.V. | | | | | | | | |
1.625%, due 10/28/19 (b) | | | 4,500,000 | | | | 4,484,164 | |
2.00%, due 10/28/21 (b) | | | 4,885,000 | | | | 4,836,541 | |
Premier Foods Finance PLC
6.50%, due 3/15/21 (b) | | | GBP 4,500,000 | | | | 5,452,923 | |
TreeHouse Foods, Inc.
4.875%, due 3/15/22 (d) | | $ | 6,125,000 | | | | 6,354,687 | |
Tyson Foods, Inc.
3.95%, due 8/15/24 | | | 5,450,000 | | | | 5,784,734 | |
| | | | | | | | |
| | | | | | | 41,216,069 | |
| | | | | | | | |
Forest Products & Paper 0.4% | | | | | | | | |
Domtar Corp.
10.75%, due 6/1/17 | | | 308,000 | | | | 323,565 | |
Georgia-Pacific LLC
8.00%, due 1/15/24 | | | 2,945,000 | | | | 3,873,090 | |
International Paper Co.
7.30%, due 11/15/39 | | | 693,000 | | | | 911,057 | |
| | | | | | | | |
| | | | | | | 5,107,712 | |
| | | | | | | | |
Gas 0.2% | | | | | | | | |
AmeriGas Partners, L.P. / AmeriGas Finance Corp.
5.625%, due 5/20/24 | | | 2,708,000 | | | | 2,836,630 | |
| | | | | | | | |
| | |
Health Care—Products 0.9% | | | | | | | | |
Hologic, Inc.
5.25%, due 7/15/22 (b) | | | 8,195,000 | | | | 8,667,032 | |
Stryker Corp.
2.625%, due 3/15/21 | | | 2,179,000 | | | | 2,220,107 | |
Zimmer Biomet Holdings, Inc.
2.70%, due 4/1/20 | | | 1,895,000 | | | | 1,927,014 | |
| | | | | | | | |
| | | | | | | 12,814,153 | |
| | | | | | | | |
Health Care—Services 1.5% | | | | | | | | |
DaVita, Inc.
5.75%, due 8/15/22 (d) | | | 2,995,000 | | | | 3,069,935 | |
Fresenius Medical Care U.S. Finance II, Inc.
6.50%, due 9/15/18 (b) | | | 2,500,000 | | | | 2,693,750 | |
HCA, Inc.
5.00%, due 3/15/24 | | | 8,645,000 | | | | 9,003,767 | |
MPH Acquisition Holdings LLC
7.125%, due 6/1/24 (b) | | | 790,000 | | | | 845,221 | |
Tenet Healthcare Corp.
4.35%, due 6/15/20 (a) | | | 6,250,000 | | | | 6,296,875 | |
| | | | | | | | |
| | | | | | | 21,909,548 | |
| | | | | | | | |
| | | | | | | | |
| | | Principal
Amount | | | Value | |
Home Builders 5.2% | | | | | | | | |
Beazer Homes USA, Inc.
5.75%, due 6/15/19 | | $ | 3,206,000 | | | $ | 3,310,195 | |
CalAtlantic Group, Inc. | | | | | | | | |
6.25%, due 12/15/21 | | | 2,875,000 | | | | 3,166,094 | |
8.375%, due 1/15/21 | | | 4,560,000 | | | | 5,415,000 | |
D.R. Horton, Inc. | | | | | | | | |
3.75%, due 3/1/19 | | | 2,750,000 | | | | 2,832,500 | |
5.75%, due 8/15/23 | | | 4,250,000 | | | | 4,725,533 | |
KB Home | | | | | | | | |
7.25%, due 6/15/18 | | | 3,300,000 | | | | 3,498,000 | |
8.00%, due 3/15/20 | | | 2,250,000 | | | | 2,497,500 | |
¨Lennar Corp. | | | | | | | | |
4.50%, due 6/15/19 | | | 5,800,000 | | | | 6,075,500 | |
4.50%, due 11/15/19 | | | 4,740,000 | | | | 4,994,775 | |
MDC Holdings, Inc. | | | | | | | | |
5.50%, due 1/15/24 | | | 7,025,000 | | | | 7,393,812 | |
5.625%, due 2/1/20 | | | 1,608,000 | | | | 1,724,580 | |
Meritage Homes Corp.
7.00%, due 4/1/22 | | | 7,800,000 | | | | 8,704,800 | |
Shea Homes, L.P. / Shea Homes Funding Corp.
5.875%, due 4/1/23 (b) | | | 6,245,000 | | | | 6,135,713 | |
Toll Brothers Finance Corp.
5.875%, due 2/15/22 | | | 5,750,000 | | | | 6,339,375 | |
TRI Pointe Group, Inc. / TRI Pointe Homes, Inc.
5.875%, due 6/15/24 (d) | | | 6,950,000 | | | | 7,201,937 | |
| | | | | | | | |
| | | | | | | 74,015,314 | |
| | | | | | | | |
Household Products & Wares 0.4% | | | | | |
Spectrum Brands, Inc.
5.75%, due 7/15/25 (d) | | | 5,085,000 | | | | 5,504,513 | |
| | | | | | | | |
| | |
Insurance 4.9% | | | | | | | | |
Allstate Corp. (The)
6.50%, due 5/15/67 (a) | | | 8,525,000 | | | | 10,016,875 | |
Chubb Corp. (The)
6.375%, due 3/29/67 (a) | | | 9,873,000 | | | | 9,305,302 | |
Genworth Holdings, Inc. | | | | | | | | |
4.90%, due 8/15/23 | | | 4,475,000 | | | | 3,669,500 | |
7.20%, due 2/15/21 | | | 300,000 | | | | 278,250 | |
¨Liberty Mutual Group, Inc. | | | | | | | | |
6.50%, due 3/15/35 (b) | | | 870,000 | | | | 1,064,705 | |
7.80%, due 3/7/87 (b) | | | 7,453,000 | | | | 8,757,275 | |
10.75%, due 6/15/88 (a)(b) | | | 938,000 | | | | 1,418,725 | |
Lincoln National Corp.
3.162%, due 5/17/66 (a) | | | 3,537,000 | | | | 2,876,112 | |
Oil Insurance, Ltd.
3.82%, due 12/29/49 (a)(b) | | | 8,452,000 | | | | 6,719,340 | |
Pacific Life Insurance Co.
7.90%, due 12/30/23 (b) | | | 1,150,000 | | | | 1,414,495 | |
| | | | |
| 14 | | MainStay Unconstrained Bond Fund | | The notes to the financial statements are an integral part of,
and should be read in conjunction with, the financial statements. |
| | | | | | | | |
| | | Principal
Amount | | | Value | |
| Corporate Bonds (continued) | | | | | |
Insurance (continued) | | | | | | | | |
Protective Life Corp.
8.45%, due 10/15/39 | | $ | 3,621,000 | | | $ | 5,029,877 | |
Provident Cos., Inc.
7.25%, due 3/15/28 | | | 5,460,000 | | | | 6,737,787 | |
Validus Holdings, Ltd.
8.875%, due 1/26/40 | | | 5,383,000 | | | | 7,336,216 | |
Voya Financial, Inc.
3.65%, due 6/15/26 | | | 1,240,000 | | | | 1,231,572 | |
XLIT, Ltd.
6.50%, due 10/29/49 (a) | | | 4,116,000 | | | | 3,156,458 | |
| | | | | | | | |
| | | | | | | 69,012,489 | |
| | | | | | | | |
Internet 0.5% | | | | | | | | |
Priceline Group, Inc. (The)
3.60%, due 6/1/26 | | | 6,700,000 | | | | 6,946,647 | |
| | | | | | | | |
|
Investment Management/Advisory Services 0.6% | |
Scottish Widows PLC
Series Reg S
5.50%, due 6/16/23 | | | GBP 6,500,000 | | | | 8,389,559 | |
| | | | | | | | |
| | |
Iron & Steel 2.1% | | | | | | | | |
AK Steel Corp.
7.625%, due 10/1/21 | | $ | 9,410,000 | | | | 9,362,950 | |
ArcelorMittal
7.25%, due 2/25/22 | | | 5,425,000 | | | | 6,157,375 | |
Cliffs Natural Resources, Inc.
5.90%, due 3/15/20 | | | 1,140,000 | | | | 1,017,450 | |
Steel Dynamics, Inc.
5.25%, due 4/15/23 | | | 7,666,000 | | | | 7,934,310 | |
Vale Overseas, Ltd.
6.25%, due 8/10/26 | | | 4,330,000 | | | | 4,643,925 | |
| | | | | | | | |
| | | | | | | 29,116,010 | |
| | | | | | | | |
Leisure Time 0.6% | | | | | | | | |
NCL Corp., Ltd.
5.25%, due 11/15/19 (b) | | | 2,215,000 | | | | 2,248,225 | |
Royal Caribbean Cruises, Ltd.
7.25%, due 3/15/18 | | | 6,115,000 | | | | 6,543,050 | |
| | | | | | | | |
| | | | | | | 8,791,275 | |
| | | | | | | | |
Lodging 1.5% | | | | | | | | |
MGM Resorts International
6.00%, due 3/15/23 (d) | | | 7,600,000 | | | | 8,227,000 | |
Starwood Hotels & Resorts Worldwide LLC | | | | | | | | |
6.75%, due 5/15/18 | | | 946,000 | | | | 1,018,697 | |
7.15%, due 12/1/19 | | | 2,341,000 | | | | 2,674,396 | |
Wynn Las Vegas LLC / Wynn Las Vegas Capital Corp. | | | | | | | | |
5.375%, due 3/15/22 | | | 6,130,000 | | | | 6,290,913 | |
5.50%, due 3/1/25 (b) | | | 3,600,000 | | | | 3,609,000 | |
| | | | | | | | |
| | | | | | | 21,820,006 | |
| | | | | | | | |
| | | | | | | | |
| | | Principal
Amount | | | Value | |
Machinery—Diversified 0.6% | | | | | | | | |
Zebra Technologies Corp.
7.25%, due 10/15/22 | | $ | 8,520,000 | | | $ | 9,180,300 | |
| | | | | | | | |
| | |
Media 1.8% | | | | | | | | |
Clear Channel Worldwide Holdings, Inc. | | | | | | | | |
Series B
6.50%, due 11/15/22 | | | 2,615,000 | | | | 2,663,377 | |
Cox Communications, Inc.
6.95%, due 6/1/38 (b) | | | 2,241,000 | | | | 2,470,846 | |
CSC Holdings LLC | | | | | | | | |
5.50%, due 4/15/27 (b) | | | 1,885,000 | | | | 1,912,097 | |
6.625%, due 10/15/25 (b) | | | 150,000 | | | | 162,563 | |
DISH DBS Corp. | | | | | | | | |
4.25%, due 4/1/18 | | | 3,350,000 | | | | 3,429,562 | |
6.75%, due 6/1/21 (d) | | | 4,265,000 | | | | 4,582,231 | |
Sirius XM Radio, Inc.
5.375%, due 7/15/26 (b) | | | 4,230,000 | | | | 4,296,115 | |
Time Warner Entertainment Co., L.P.
8.375%, due 3/15/23 | | | 1,087,000 | | | | 1,404,601 | |
Virgin Media Secured Finance PLC
5.50%, due 1/15/25 (b) | | | 5,000,000 | | | | 5,125,000 | |
| | | | | | | | |
| | | | | | | 26,046,392 | |
| | | | | | | | |
Metal Fabricate & Hardware 0.2% | | | | | | | | |
Novelis Corp. | | | | | | | | |
5.875%, due 9/30/26 (b) | | | 1,970,000 | | | | 1,994,625 | |
6.25%, due 8/15/24 (b) | | | 940,000 | | | | 977,600 | |
| | | | | | | | |
| | | | | | | 2,972,225 | |
| | | | | | | | |
Mining 0.4% | | | | | | | | |
Aleris International, Inc.
7.875%, due 11/1/20 | | | 2,667,000 | | | | 2,667,000 | |
FMG Resources (August 2006) Pty, Ltd.
9.75%, due 3/1/22 (b) | | | 2,940,000 | | | | 3,410,400 | |
| | | | | | | | |
| | | | | | | 6,077,400 | |
| | | | | | | | |
Miscellaneous—Manufacturing 1.2% | | | | | |
Amsted Industries, Inc.
5.00%, due 3/15/22 (b) | | | 7,860,000 | | | | 7,879,650 | |
Gates Global LLC / Gates Global Co.
6.00%, due 7/15/22 (b) | | | 1,585,000 | | | | 1,497,825 | |
Textron Financial Corp.
6.00%, due 2/15/67 (a)(b) | | | 11,250,000 | | | | 8,128,125 | |
| | | | | | | | |
| | | | | | | 17,505,600 | |
| | | | | | | | |
Oil & Gas 4.2% | | | | | | | | |
Anadarko Petroleum Corp.
(zero coupon), due 10/10/36 | | | 19,735,000 | | | | 7,927,688 | |
CITGO Petroleum Corp.
6.25%, due 8/15/22 (b) | | | 9,000,000 | | | | 9,202,500 | |
Hilcorp Energy I, L.P. / Hilcorp Finance Co.
5.00%, due 12/1/24 (b) | | | 6,710,000 | | | | 6,542,250 | |
| | | | | | |
The notes to the financial statements are an integral part of,
and should be read in conjunction with, the financial statements. | | | | | 15 | |
Portfolio of Investments October 31, 2016 (continued)
| | | | | | | | |
| | | Principal
Amount | | | Value | |
| Corporate Bonds (continued) | | | | | |
Oil & Gas (continued) | | | | | | | | |
Murphy Oil USA, Inc.
6.00%, due 8/15/23 | | $ | 8,818,000 | | | $ | 9,280,945 | |
QEP Resources, Inc.
5.375%, due 10/1/22 | | | 3,350,000 | | | | 3,316,500 | |
SM Energy Co. | | | | | | | | |
5.00%, due 1/15/24 | | | 1,970,000 | | | | 1,832,100 | |
6.125%, due 11/15/22 | | | 5,385,000 | | | | 5,411,925 | |
Sunoco, L.P. / Sunoco Finance Corp.
6.375%, due 4/1/23 | | | 3,945,000 | | | | 4,033,762 | |
¨Tesoro Corp.
5.125%, due 4/1/24 | | | 11,050,000 | | | | 11,381,500 | |
| | | | | | | | |
| | | | | | | 58,929,170 | |
| | | | | | | | |
Oil & Gas Services 0.5% | | | | | | | | |
CGG S.A.
6.50%, due 6/1/21 | | | 6,150,000 | | | | 3,105,750 | |
PHI, Inc.
5.25%, due 3/15/19 (d) | | | 4,800,000 | | | | 4,620,000 | |
| | | | | | | | |
| | | | | | | 7,725,750 | |
| | | | | | | | |
Packaging & Containers 3.3% | | | | | | | | |
Albea Beauty Holdings S.A.
8.375%, due 11/1/19 (b) | | | 4,720,000 | | | | 4,908,800 | |
Ardagh Packaging Finance PLC / Ardagh Holdings USA, Inc. | | | | | | | | |
4.625%, due 5/15/23 (b) | | | 4,250,000 | | | | 4,292,500 | |
6.75%, due 1/31/21 (b) | | | 3,240,000 | | | | 3,337,200 | |
7.00%, due 11/15/20 (b) | | | 652,941 | | | | 672,529 | |
Crown European Holdings S.A.
4.00%, due 7/15/22 (b) | | | EUR 7,700,000 | | | | 9,255,681 | |
Kloeckner Pentaplast of America, Inc.
7.125%, due 11/1/20 (b) | | | 3,175,000 | | | | 3,650,912 | |
MeadWestvaco Corp.
7.375%, due 9/1/19 | | $ | 1,800,000 | | | | 2,051,129 | |
Owens-Brockway Glass Container, Inc.
5.00%, due 1/15/22 (b) | | | 5,555,000 | | | | 5,811,919 | |
Reynolds Group Issuer, Inc. | | | | | | | | |
5.125%, due 7/15/23 (b) | | | 2,115,000 | | | | 2,171,174 | |
5.75%, due 10/15/20 | | | 925,000 | | | | 949,309 | |
9.875%, due 8/15/19 | | | 1,183,000 | | | | 1,212,575 | |
Sealed Air Corp. | | | | | | | | |
4.875%, due 12/1/22 (b) | | | 5,070,000 | | | | 5,342,513 | |
5.50%, due 9/15/25 (b) | | | 3,315,000 | | | | 3,534,619 | |
| | | | | | | | |
| | | | | | | 47,190,860 | |
| | | | | | | | |
Pharmaceuticals 0.9% | | | | | | | | |
Endo Ltd. / Endo Finance LLC / Endo Finco, Inc.
6.00%, due 7/15/23 (b) | | | 3,865,000 | | | | 3,362,550 | |
Pfizer, Inc.
1.20%, due 6/1/18 | | | 9,540,000 | | | | 9,546,115 | |
| | | | | | | | |
| | | | | | | 12,908,665 | |
| | | | | | | | |
| | | | | | | | |
| | | Principal
Amount | | | Value | |
Pipelines 1.7% | | | | | | | | |
Holly Energy Partners, L.P. / Holly Energy Finance Corp.
6.50%, due 3/1/20 | | $ | 3,875,000 | | | $ | 3,981,562 | |
Kinder Morgan, Inc. | | | | | | | | |
5.625%, due 11/15/23 (b) | | | 2,449,000 | | | | 2,709,454 | |
7.75%, due 1/15/32 | | | 2,035,000 | | | | 2,488,610 | |
Plains All American Pipeline, L.P. / PAA Finance Corp.
4.70%, due 6/15/44 | | | 4,150,000 | | | | 3,825,262 | |
Targa Resources Partners, L.P. / Targa Resources Partners Finance Corp.
5.25%, due 5/1/23 | | | 3,725,000 | | | | 3,697,435 | |
Tesoro Logistics, L.P. / Tesoro Logistics Finance Corp. | | | | | | | | |
5.875%, due 10/1/20 | | | 3,810,000 | | | | 3,905,250 | |
6.125%, due 10/15/21 | | | 3,500,000 | | | | 3,661,875 | |
| | | | | | | | |
| | | | | | | 24,269,448 | |
| | | | | | | | |
Private Equity 0.4% | | | | | | | | |
Icahn Enterprises, L.P. / Icahn Enterprises Finance Corp.
6.00%, due 8/1/20 | | | 5,790,000 | | | | 5,688,675 | |
| | | | | | | | |
| |
Real Estate Investment Trusts 0.9% | | | | | |
Crown Castle International Corp.
5.25%, due 1/15/23 | | | 2,625,000 | | | | 2,933,201 | |
Host Hotels & Resorts, L.P.
3.75%, due 10/15/23 | | | 472,000 | | | | 475,228 | |
Iron Mountain Europe PLC
6.125%, due 9/15/22 (b) | | | GBP 3,475,000 | | | | 4,412,905 | |
Iron Mountain, Inc.
5.75%, due 8/15/24 | | $ | 4,125,000 | | | | 4,228,125 | |
Ventas Realty, L.P. / Ventas Capital Corp.
2.70%, due 4/1/20 | | | 1,000 | | | | 1,020 | |
| | | | | | | | |
| | | | | | | 12,050,479 | |
| | | | | | | | |
Retail 4.1% | | | | | | | | |
AmeriGas Finance LLC / AmeriGas Finance Corp.
7.00%, due 5/20/22 | | | 5,200,000 | | | | 5,473,000 | |
Brinker International, Inc.
2.60%, due 5/15/18 | | | 1,875,000 | | | | 1,883,203 | |
CVS Pass-Through Trust
5.789%, due 1/10/26 (b)(e) | | | 61,961 | | | | 69,646 | |
Dollar Tree, Inc.
5.75%, due 3/1/23 | | | 9,670,000 | | | | 10,298,550 | |
Macy’s Retail Holdings, Inc.
3.875%, due 1/15/22 | | | 585,000 | | | | 610,726 | |
QVC, Inc.
4.85%, due 4/1/24 | | | 6,500,000 | | | | 6,593,905 | |
| | | | |
| 16 | | MainStay Unconstrained Bond Fund | | The notes to the financial statements are an integral part of,
and should be read in conjunction with, the financial statements. |
| | | | | | | | |
| | | Principal
Amount | | | Value | |
| Corporate Bonds (continued) | | | | | |
Retail (continued) | | | | | | | | |
Signet UK Finance PLC
4.70%, due 6/15/24 | | $ | 10,160,000 | | | $ | 9,863,633 | |
Starbucks Corp.
2.45%, due 6/15/26 | | | 4,279,000 | | | | 4,283,527 | |
Suburban Propane Partners, L.P. / Suburban Energy Finance Corp.
5.50%, due 6/1/24 (d) | | | 8,550,000 | | | | 8,721,000 | |
TJX Cos., Inc. (The)
2.25%, due 9/15/26 | | | 10,505,000 | | | | 10,103,373 | |
| | | | | | | | |
| | | | | | | 57,900,563 | |
| | | | | | | | |
Semiconductors 1.3% | | | | | | | | |
NXP B.V. / NXP Funding LLC | | | | | | | | |
4.125%, due 6/1/21 (b) | | | 6,300,000 | | | | 6,725,250 | |
4.625%, due 6/15/22 (b) | | | 2,960,000 | | | | 3,226,400 | |
Sensata Technologies B.V.
5.00%, due 10/1/25 (b) | | | 8,700,000 | | | | 8,917,500 | |
| | | | | | | | |
| | | | | | | 18,869,150 | |
| | | | | | | | |
Software 0.8% | | | | | | | | |
First Data Corp. | | | | | | | | |
5.375%, due 8/15/23 (b) | | | 1,785,000 | | | | 1,847,475 | |
6.75%, due 11/1/20 (b) | | | 2,275,000 | | | | 2,354,625 | |
7.00%, due 12/1/23 (b) | | | 755,000 | | | | 790,863 | |
Microsoft Corp.
1.10%, due 8/8/19 | | | 6,040,000 | | | | 6,002,594 | |
| | | | | | | | |
| | | | | | | 10,995,557 | |
| | | | | | | | |
Telecommunications 3.7% | | | | | | | | |
CenturyLink, Inc.
5.80%, due 3/15/22 (d) | | | 8,000,000 | | | | 8,120,000 | |
CommScope, Inc.
5.00%, due 6/15/21 (b)(f) | | | 4,295,000 | | | | 4,391,637 | |
Hughes Satellite Systems Corp. | | | | | | | | |
5.25%, due 8/1/26 (b) | | | 1,510,000 | | | | 1,487,350 | |
6.50%, due 6/15/19 | | | 2,250,000 | | | | 2,455,313 | |
7.625%, due 6/15/21 | | | 1,035,000 | | | | 1,134,619 | |
Inmarsat Finance PLC
4.875%, due 5/15/22 (b) | | | 2,435,000 | | | | 2,296,449 | |
Sprint Capital Corp.
8.75%, due 3/15/32 (d) | | | 1,060,000 | | | | 1,075,900 | |
Sprint Communications, Inc.
7.00%, due 8/15/20 | | | 1,800,000 | | | | 1,872,000 | |
Sprint Corp. | | | | | | | | |
7.25%, due 9/15/21 | | | 4,000,000 | | | | 4,095,000 | |
7.875%, due 9/15/23 | | | 1,650,000 | | | | 1,633,500 | |
Sprint Spectrum Co. LLC / Sprint Spectrum Co. II LLC / Sprint Spectrum Co. III LLC
3.36%, due 3/20/23 (b) | | | 4,375,000 | | | | 4,385,937 | |
| | | | | | | | |
| | | Principal
Amount | | | Value | |
Telecommunications (continued) | | | | | | | | |
T-Mobile USA, Inc. | | | | | | | | |
6.00%, due 3/1/23 | | $ | 3,000,000 | | | $ | 3,157,500 | |
6.125%, due 1/15/22 | | | 4,525,000 | | | | 4,773,875 | |
Telefonica Emisiones SAU
5.462%, due 2/16/21 | | | 1,000 | | | | 1,126 | |
Verizon Communications, Inc.
5.15%, due 9/15/23 | | | 3,573,000 | | | | 4,087,012 | |
ViaSat, Inc.
6.875%, due 6/15/20 (d) | | | 7,340,000 | | | | 7,596,900 | |
| | | | | | | | |
| | | | | | | 52,564,118 | |
| | | | | | | | |
Transportation 0.8% | | | | | | | | |
Hapag-Lloyd A.G.
9.75%, due 10/15/17 (b) | | | 992,000 | | | | 987,040 | |
Hornbeck Offshore Services, Inc.
5.00%, due 3/1/21 | | | 15,000 | | | | 8,925 | |
XPO Logistics, Inc.
6.50%, due 6/15/22 (b) | | | 9,725,000 | | | | 10,114,000 | |
| | | | | | | | |
| | | | | | | 11,109,965 | |
| | | | | | | | |
Total Corporate Bonds
(Cost $1,117,798,786) | | | | | | | 1,121,911,523 | |
| | | | | | | | |
|
| Foreign Bonds 0.2% | |
Belgium 0.2% | | | | | | | | |
Belfius Financing Co.
1.086%, due 2/9/17 (a) | | | GBP 2,000,000 | | | | 2,435,664 | |
| | | | | | | | |
| | |
United Kingdom 0.0%‡ | | | | | | | | |
Barclays Bank PLC
Series Reg S
10.00%, due 5/21/21 | | | 449,000 | | | | 693,144 | |
| | | | | | | | |
Total Foreign Bonds
(Cost $3,994,769) | | | | | | | 3,128,808 | |
| | | | | | | | |
| |
| Loan Assignments 17.3% (g) | | | | | |
Advertising 1.8% | | | | | | | | |
Outfront Media Capital LLC | | | | | | | | |
Term Loan B
3.00%, due 2/1/21 | | $ | 8,117,500 | | | | 8,110,738 | |
¨USAGM HoldCo LLC | | | | | | | | |
2015 Term Loan
4.75%, due 7/28/22 | | | 8,684,375 | | | | 8,673,520 | |
2015 2nd Lien Term Loan
9.50%, due 7/28/23 | | | 8,750,000 | | | | 8,695,312 | |
| | | | | | | | |
| | | | | | | 25,479,570 | |
| | | | | | | | |
Auto Manufacturers 0.3% | | | | | | | | |
Navistar International Corp. | | | | | | | | |
Term Loan B
6.50%, due 8/7/20 | | | 4,447,556 | | | | 4,471,186 | |
| | | | | | | | |
| | | | | | |
The notes to the financial statements are an integral part of,
and should be read in conjunction with, the financial statements. | | | | | 17 | |
Portfolio of Investments October 31, 2016 (continued)
| | | | | | | | |
| | | Principal
Amount | | | Value | |
| Loan Assignments (continued) | | | | | |
Auto Parts & Equipment 1.1% | | | | | | | | |
Allison Transmission, Inc. | | | | | | | | |
New Term Loan B3
3.25%, due 9/23/22 | | $ | 4,152,196 | | | $ | 4,181,262 | |
MPG Holdco I, Inc. | | | | | | | | |
2015 Term Loan B
3.75%, due 10/20/21 | | | 1,052,464 | | | | 1,054,906 | |
TI Group Automotive Systems LLC | | | | | | | | |
2015 USD Term Loan
4.50%, due 6/30/22 | | | 10,964,250 | | | | 10,968,822 | |
| | | | | | | | |
| | | | | | | 16,204,990 | |
| | | | | | | | |
Building Materials 1.2% | | | | | | | | |
Forterra, Inc. | | | | | | | | |
Term Loan B
(zero coupon), due 10/18/23 | | | 5,080,000 | | | | 5,073,650 | |
¨Quikrete Holdings, Inc. | | | | | | | | |
1st Lien Term Loan
4.00%, due 9/28/20 | | | 11,686,979 | | | | 11,712,024 | |
| | | | | | | | |
| | | | | | | 16,785,674 | |
| | | | | | | | |
Chemicals 0.3% | | | | | | | | |
Axalta Coating Systems U.S. Holdings, Inc. | | | | | | | | |
USD Term Loan
3.75%, due 2/1/20 | | | 3,898,221 | | | | 3,923,669 | |
| | | | | | | | |
| | |
Commercial Services 1.2% | | | | | | | | |
KAR Auction Services, Inc. | | | | | | | | |
Term Loan B2
4.063%, due 3/11/21 | | | 8,719,156 | | | | 8,766,388 | |
Neff Rental LLC | | | | | | | | |
2nd Lien Term Loan
7.25%, due 6/9/21 | | | 8,810,928 | | | | 8,561,288 | |
| | | | | | | | |
| | | | | | | 17,327,676 | |
| | | | | | | | |
Containers, Packaging & Glass 0.7% | | | | | |
Milacron LLC | | | | | | | | |
Term Loan B
4.25%, due 9/28/20 | | | 6,602,740 | | | | 6,635,753 | |
Reynolds Group Holdings, Inc. | | | | | | | | |
2016 USD Term Loan
TBA, due 2/5/23 | | | 2,825,000 | | | | 2,830,458 | |
| | | | | | | | |
| | | | | | | 9,466,211 | |
| | | | | | | | |
Electric 0.1% | | | | | | | | |
Calpine Corp. | | | | | | | | |
Term Loan B5
3.59%, due 5/27/22 | | | 1,975,000 | | | | 1,977,469 | |
| | | | | | | | |
| | |
Entertainment 0.2% | | | | | | | | |
Mohegan Tribal Gaming Authority | | | | | | | | |
2016 Term Loan B
5.50%, due 9/28/23 | | | 3,000,000 | | | | 2,989,374 | |
| | | | | | | | |
| | | | | | | | |
| | | Principal
Amount | | | Value | |
Environmental Controls 0.4% | | | | | | | | |
GFL Environmental, Inc. | | | | | | | | |
USD Term Loan B
3.75%, due 9/23/23 | | $ | 6,000,000 | | | $ | 5,992,500 | |
| | | | | | | | |
| | |
Food Services 0.3% | | | | | | | | |
Aramark Services, Inc. | | | | | | | | |
USD Term Loan F
3.338%, due 2/24/21 | | | 4,882,331 | | | | 4,906,742 | |
| | | | | | | | |
| | |
Health Care—Products 0.6% | | | | | | | | |
Ortho-Clinical Diagnostics, Inc. | | | | | | | | |
Term Loan B
4.75%, due 6/30/21 | | | 7,348,135 | | | | 7,148,361 | |
Sterigenics-Nordion Holdings LLC | | | | | | | | |
2015 Term Loan B
4.25%, due 5/15/22 | | | 990,000 | | | | 987,525 | |
| | | | | | | | |
| | | | | | | 8,135,886 | |
| | | | | | | | |
Health Care—Services 1.4% | | | | | | | | |
AmSurg Corp. | | | | | | | | |
1st Lien Term Loan B
3.50%, due 7/16/21 | | | 6,880,461 | | | | 6,877,455 | |
Inventiv Health, Inc. | | | | | | | | |
2016 Term Loan B
(zero coupon), due 9/28/23 | | | 7,190,000 | | | | 7,186,146 | |
MPH Acquisition Holdings LLC | | | | | | | | |
2016 Term Loan B
5.00%, due 6/7/23 | | | 5,023,055 | | | | 5,079,564 | |
| | | | | | | | |
| | | | | | | 19,143,165 | |
| | | | | | | | |
Household Products & Wares 1.2% | | | | | | | | |
KIK Custom Products, Inc. | | | | | | | | |
2015 Term Loan B
6.00%, due 8/26/22 | | | 7,672,500 | | | | 7,643,728 | |
Prestige Brands, Inc. | | | | | | | | |
Term Loan B3
3.50%, due 9/3/21 | | | 8,913,863 | | | | 8,944,509 | |
| | | | | | | | |
| | | | | | | 16,588,237 | |
| | | | | | | | |
Iron & Steel 0.6% | | | | | | | | |
Signode Industrial Group U.S., Inc. | | | | | | | | |
USD Term Loan B
3.75%, due 5/1/21 | | | 8,126,473 | | | | 8,090,920 | |
| | | | | | | | |
| | |
Lodging 0.8% | | | | | | | | |
Boyd Gaming Corp. | | | | | | | | |
Term Loan B
4.00%, due 8/14/20 | | | 380,556 | | | | 382,323 | |
Hilton Worldwide Finance LLC | | | | | | | | |
Term Loan B1
3.50%, due 10/26/20 | | | 972,611 | | | | 975,564 | |
| | | | |
| 18 | | MainStay Unconstrained Bond Fund | | The notes to the financial statements are an integral part of,
and should be read in conjunction with, the financial statements. |
| | | | | | | | |
| | | Principal
Amount | | | Value | |
| Loan Assignments (continued) | | | | | |
Lodging (continued) | | | | | | | | |
Hilton Worldwide Finance, LLC | | | | | | | | |
Term Loan B2
3.034%, due 10/25/23 | | $ | 9,942,751 | | | $ | 9,990,685 | |
| | | | | | | | |
| | | | | | | 11,348,572 | |
| | | | | | | | |
Machinery—Construction & Mining 0.2% | | | | | |
Terex Corp. | | | | | | | | |
2014 USD Term Loan
3.588%, due 8/13/21 | | | 2,548,000 | | | | 2,535,260 | |
| | | | | | | | |
| | |
Machinery—Diversified 0.6% | | | | | | | | |
Husky Injection Molding Systems, Ltd. | | | | | | | | |
1st Lien Term Loan
4.25%, due 6/30/21 | | | 8,839,124 | | | | 8,829,304 | |
| | | | | | | | |
| | |
Media 0.9% | | | | | | | | |
Charter Communications Operating LLC | | | | | | | | |
Term Loan F
3.00%, due 1/4/21 | | | 8,788,449 | | | | 8,793,335 | |
Virgin Media Investment Holdings, Ltd. | | | | | | | | |
USD Term Loan F
3.50%, due 6/30/23 | | | 4,161,125 | | | | 4,174,994 | |
| | | | | | | | |
| | | | | | | 12,968,329 | |
| | | | | | | | |
Miscellaneous—Manufacturing 0.4% | | | | | |
Gates Global, Inc. | | | | | | | | |
Term Loan B
4.25%, due 7/6/21 | | | 5,606,660 | | | | 5,514,773 | |
| | | | | | | | |
| | |
Oil & Gas 0.3% | | | | | | | | |
CITGO Petroleum Corp. | | | | | | | | |
New Term Loan B
4.50%, due 7/29/21 | | | 4,281,188 | | | | 4,241,052 | |
| | | | | | | | |
| | |
Real Estate 0.3% | | | | | | | | |
Realogy Corp. | | | | | | | | |
2016 Term Loan B
3.75%, due 7/20/22 | | | 4,916,180 | | | | 4,944,857 | |
| | | | | | | | |
| | |
Retail 0.6% | | | | | | | | |
ADS Waste Holdings, Inc. | | | | | | | | |
Term Loan B2
3.75%, due 10/9/19 | | | 6,000,000 | | | | 6,002,502 | |
Pilot Travel Centers LLC | | | | | | | | |
2016 Term Loan B
3.284%, due 5/25/23 | | | 2,772,053 | | | | 2,787,069 | |
| | | | | | | | |
| | | | | | | 8,789,571 | |
| | | | | | | | |
| | | | | | | | |
| | | Principal
Amount | | | Value | |
Retail Stores 0.1% | | | | | | | | |
Dollar Tree, Inc. | | | | | | | | |
Term Loan B3
3.00%, due 7/6/22 | | $ | 722,727 | | | $ | 729,051 | |
| | | | | | | | |
| | |
Software 0.3% | | | | | | | | |
First Data Corp. | | | | | | | | |
Extended 2021 Term Loan
3.524%, due 3/24/21 | | | 4,016,556 | | | | 4,027,055 | |
| | | | | | | | |
| | |
Telecommunications 1.4% | | | | | | | | |
Intelsat Jackson Holdings S.A. | | | | | | | | |
Term Loan B2
3.75%, due 6/30/19 | | | 1,500,000 | | | | 1,432,032 | |
Level 3 Financing, Inc. | | | | | | | | |
2015 Term Loan B2
3.50%, due 5/31/22 | | | 9,000,000 | | | | 9,029,250 | |
SBA Senior Finance II LLC | | | | | | | | |
Term Loan B1
3.34%, due 3/24/21 | | | 8,834,014 | | | | 8,836,469 | |
| | | | | | | | |
| | | | | | | 19,297,751 | |
| | | | | | | | |
Total Loan Assignments
(Cost $244,475,153) | | | | | | | 244,708,844 | |
| | | | | | | | |
| |
| Mortgage-Backed Securities 0.1% | | | | | |
Commercial Mortgage Loans
(Collateralized Mortgage Obligations) 0.1% | |
Banc of America Commercial Mortgage Trust | | | | | | | | |
Series 2005-J, Class 1A1
3.095%, due 11/25/35 (h) | | | 174,702 | | | | 155,573 | |
Bayview Commercial Asset Trust | | | | | | | | |
Series 2006-4A, Class A1
0.764%, due 12/25/36 (a)(b) | | | 33,303 | | | | 28,706 | |
Wells Fargo Mortgage Backed Securities Trust | | | | | | | | |
Series 2006-AR10, Class 5A2
3.081%, due 7/25/36 (h) | | | 128,077 | | | | 125,709 | |
| | | | | | | | |
| | | | | | | 309,988 | |
| | | | | | | | |
Residential Mortgages (Collateralized Mortgage Obligations) 0.0%‡ | |
Deutsche Alt-A Securities, Inc.
Alternate Loan Trust | | | | | | | | |
Series 2005-5, Class 1A3
5.50%, due 11/25/35 (a) | | | 77,491 | | | | 73,287 | |
WaMu Mortgage Pass-Through Certificates | | | | | | | | |
Series 2006-AR14, Class 1A1
2.338%, due 11/25/36 (h) | | | 135,308 | | | | 119,919 | |
| | | | | | | | |
| | | | | | | 193,206 | |
| | | | | | | | |
Total Mortgage-Backed Securities
(Cost $491,594) | | | | | | | 503,194 | |
| | | | | | | | |
| | | | | | |
The notes to the financial statements are an integral part of,
and should be read in conjunction with, the financial statements. | | | | | 19 | |
Portfolio of Investments October 31, 2016 (continued)
| | | | | | | | |
| | | Principal
Amount | | | Value | |
| U.S. Government 0.0%‡ | | | | | |
United States Treasury Note 0.0% | |
2.125%, due 8/15/21 | | $ | 70,000 | | | $ | 72,540 | |
| | | | | | | | |
Total U.S. Government
(Cost $71,103) | | | | | | | 72,540 | |
| | | | | | | | |
Total Long-Term Bonds
(Cost $1,374,158,619) | | | | | | | 1,375,527,023 | |
| | | | | | | | |
| | |
| | | | | | | | |
| | |
Shares | | | | |
| Common Stocks 0.0%‡ | |
Auto Manufacturers 0.0%‡ | | | | | | | | |
General Motors Co. | | | 15,078 | | | | 476,465 | |
| | | | | | | | |
| | |
Media 0.0%‡ | | | | | | | | |
ION Media Networks, Inc. (e)(i)(j)(k) | | | 22 | | | | 11,778 | |
| | | | | | | | |
Total Common Stocks
(Cost $464,141) | | | | | | | 488,243 | |
| | | | | | | | |
| | |
| | | | | | | | |
| | | Number of
Warrants | | | | |
| Warrants 0.0%‡ | |
Auto Manufacturers 0.0%‡ | | | | | | | | |
General Motors Co. | | | | | | | | |
Strike Price $10.00
Expires 7/10/19 (i) | | | 20,476 | | | | 280,521 | |
| | | | | | | | |
Total Warrants
(Cost $322,281) | | | | | | | 280,521 | |
| | | | | | | | |
| | |
| | | | | | | | |
| | | Principal
Amount | | | | |
| Short-Term Investment 4.2% | |
Repurchase Agreement 4.2% | | | | | | | | |
Fixed Income Clearing Corp.
0.03%, dated 10/31/16
due 11/1/16
Proceeds at Maturity $59,942,790 (Collateralized by a United States Treasury Note with a rate of 1.00% and a maturity date of 9/15/18, with a Principal Amount of $60,915,000 and a Market Value of $61,143,431) | | $ | 59,942,740 | | | | 59,942,740 | |
| | | | | | | | |
Total Short-Term Investment
(Cost $59,942,740) | | | | | | | 59,942,740 | |
| | | | | | | | |
Total Investments, Before Investments Sold Short
(Cost $1,434,887,781) (l) | | | 101.2 | % | | | 1,436,238,527 | |
| | | | | | | | |
| | | | | | | | |
| | | Principal
Amount | | | Value | |
Long-Term Bonds Sold Short (2.2)% Corporate Bonds Sold Short (2.2%) | |
Household Products & Wares (0.3%) | | | | | |
ACCO Brands Corp.
6.75%, due 4/30/20 | | $ | (3,850,000 | ) | | $ | (4,052,125 | ) |
| | | | | | | | |
| | |
Oil & Gas (1.1%) | | | | | | | | |
Noble Energy, Inc. | | | | | | | | |
3.90%, due 11/15/24 | | | (12,115,000 | ) | | | (12,455,941 | ) |
4.15%, due 12/15/21 | | | (3,000,000 | ) | | | (3,182,373 | ) |
| | | | | | | | |
| | | | | | | (15,638,314 | ) |
| | | | | | | | |
Pharmaceuticals (0.8%) | | | | | | | | |
Mylan N.V.
5.25%, due 6/15/46 (b) | | | (11,350,000 | ) | | | (11,491,001 | ) |
| | | | | | | | |
Total Investments Sold Short
(Proceeds $29,358,916) | | | (2.2 | )% | | | (31,181,440 | ) |
| | | | | | | | |
Total Investments, Net of Investments Sold Short
(Cost $1,405,528,865) | | | 99.0 | | | | 1,405,057,087 | |
Other Assets, Less Liabilities | | | 1.0 | | | | 14,506,944 | |
Net Assets | | | 100.0 | % | | $ | 1,419,564,031 | |
| ‡ | Less than one-tenth of a percent. |
| (a) | Floating rate—Rate shown was the rate in effect as of October 31, 2016. |
| (b) | May be sold to institutional investors only under Rule 144A or securities offered pursuant to Section 4(a)(2) of the Securities Act of 1933, as amended. |
| (c) | Step coupon—Rate shown was the rate in effect as of October 31, 2016. |
| (d) | Security, or a portion thereof, was maintained in a segregated account at the Fund’s custodian as collateral for securities Sold Short (See Note 2(J)). |
| (e) | Fair valued security—Represents fair value as measured in good faith under procedures approved by the Board of Trustees. As of October 31, 2016, the total market value of these securities was $81,424, which represented less than one-tenth of a percent of the Fund’s net assets. |
| (f) | PIK (“Payment-in-Kind”)—issuer may pay interest or dividends with additional securities and/or in cash. |
| (g) | Floating Rate Loan—generally pays interest at rates which are periodically re-determined at a margin above the London InterBank Offered Rate or other short-term rates. The rate shown was the weighted average interest rate of all contracts within the floating rate loan facility as of October 31, 2016. |
| (h) | Collateral strip rate—A bond whose interest was based on the weighted net interest rate of the collateral. The coupon rate adjusts periodically based on a predetermined schedule. Rate shown was the rate in effect as of October 31, 2016. |
| (i) | Non-income producing security. |
| | | | |
| 20 | | MainStay Unconstrained Bond Fund | | The notes to the financial statements are an integral part of,
and should be read in conjunction with, the financial statements. |
| (k) | Illiquid security—As of October 31, 2016, the total market value of this security deemed illiquid under procedures approved by the Board of Trustees was $11,778, which represented less than one-tenth of a percent of the Fund’s net assets (Unaudited). |
| (l) | As of October 31, 2016, cost was $1,434,975,742 for federal income tax purposes and net unrealized appreciation was as follows: |
| | | | |
Gross unrealized appreciation | | $ | 28,684,801 | |
Gross unrealized depreciation | | | (27,422,016 | ) |
| | | | |
Net unrealized appreciation | | $ | 1,262,785 | |
| | | | |
As of October 31, 2016, the Fund held the following foreign currency forward contracts:
| | | | | | | | | | | | | | | | | | | | | | |
Foreign Currency Buy Contracts | | Expiration
Date | | | Counterparty | | Contract
Amount
Purchased | | | Contract
Amount
Sold | | | Unrealized
Appreciation
(Depreciation) | |
Euro vs. U.S. Dollar | | | 11/1/16 | | | JPMorgan Chase Bank N.A. | | | EUR | | | | 20,798,000 | | | $ | 22,870,035 | | | $ | (39,024 | ) |
Pound Sterling vs. U.S. Dollar | | | 11/1/16 | | | JPMorgan Chase Bank N.A. | | | GBP | | | | 21,751,000 | | | | 26,615,307 | | | | 7,933 | |
| | | | | | |
| | | | | | | | | | | | | | | | | | | | | | |
Foreign Currency Sales Contracts | | | | | | | Contract
Amount
Sold | | | Contract
Amount
Purchased | | | | |
Euro vs. U.S. Dollar | | | 11/1/16 | | | JPMorgan Chase Bank N.A. | | | EUR | | | | 20,798,000 | | | | 22,975,759 | | | | 144,748 | |
Euro vs. U.S. Dollar | | | 2/1/17 | | | JPMorgan Chase Bank N.A. | | | | | | | 15,675,000 | | | | 17,240,885 | | | | (39,708 | ) |
Pound Sterling vs. U.S. Dollar | | | 11/1/16 | | | JPMorgan Chase Bank N.A. | | | GBP | | | | 21,751,000 | | | | 28,734,094 | | | | 2,110,855 | |
Pound Sterling vs. U.S. Dollar | | | 2/1/17 | | | JPMorgan Chase Bank N.A. | | | | | | | 21,332,000 | | | | 26,149,491 | | | | (16,504 | ) |
Net unrealized appreciation (depreciation) on foreign currency forward contracts | | | | | | | | | | | $ | 2,168,300 | |
As of October 31, 2016, the Fund held the following futures contracts1:
| | | | | | | | | | | | | | | | |
Type | | Number of
Contracts
Long
(Short) | | | Expiration
Date | | | Notional
Amount | | | Unrealized
Appreciation
(Depreciation)2 | |
| 2-Year United States Treasury Note | | | (948 | ) | | | December 2016 | | | $ | (206,797,313 | ) | | $ | 149,638 | |
| 10-Year United States Treasury Note | | | 547 | | | | December 2016 | | | | 70,904,875 | | | | (232,002 | ) |
| Euro-Bund | | | (373 | ) | | | December 2016 | | | | (66,402,266 | ) | | | 1,246,587 | |
| United States Treasury Long Bond | | | (105 | ) | | | December 2016 | | | | (17,085,469 | ) | | | 229,860 | |
| | | | | | | | | | | | | | | | |
| | | | | | | | | | $ | (219,380,173 | ) | | $ | 1,394,083 | |
| | | | | | | | | | | | | | | | |
| 1. | As of October 31, 2016, cash in the amount of $1,674,228 was on deposit with a broker for futures transactions. |
| 2. | Represents the difference between the value of the contracts at the time they were opened and the value as of October 31, 2016. |
As of October 31, 2016, the Fund held the following centrally cleared interest rate swap agreements1:
| | | | | | | | | | | | | | | | | | | | | | | | | | | | |
Notional Amount | | Currency | | | Expiration
Date | | | Payments
made by Fund | | | Payments
Received by Fund | | | Upfront
Premiums
Received/
(Paid) | | | Value | | | Unrealized
Appreciation/ (Depreciation) | |
$125,000,000 | | | USD | | | | 4/29/2017 | | | | Fixed 0.786 | % | | | 3-Month USD-LIBOR | | | $ | — | | | $ | 96,520 | | | $ | 96,520 | |
$350,000,000 | | | USD | | | | 5/6/2017 | | | | Fixed 0.861 | % | | | 3-Month USD-LIBOR | | | | — | | | | 152,877 | | | | 152,877 | |
$273,000,000 | | | USD | | | | 7/8/2017 | | | | Fixed 0.877 | % | | | 3-Month USD-LIBOR | | | | — | | | | 156,732 | | | | 156,732 | |
$250,000,000 | | | USD | | | | 10/8/2017 | | | | Fixed 0.730 | % | | | 3-Month USD-LIBOR | | | | — | | | | 606,863 | | | | 606,863 | |
$250,000,000 | | | USD | | | | 10/16/2017 | | | | Fixed 0.695 | % | | | 3-Month USD-LIBOR | | | | — | | | | 706,298 | | | | 706,298 | |
$400,000,000 | | | USD | | | | 2/16/2018 | | | | Fixed 0.670 | % | | | 3-Month USD-LIBOR | | | | (32,442 | ) | | | 1,826,456 | | | | 1,794,014 | |
$725,000,000 | | | USD | | | | 7/22/2018 | | | | Fixed 0.937 | % | | | 3-Month USD-LIBOR | | | | (45,003 | ) | | | 1,559,098 | | | | 1,514,095 | |
| | | | $ | (77,445 | ) | | $ | 5,104,844 | | | $ | 5,027,399 | |
| | | | | | |
The notes to the financial statements are an integral part of,
and should be read in conjunction with, the financial statements. | | | | | 21 | |
Portfolio of Investments October 31, 2016 (continued)
Open OTC credit default swap agreements as of October 31, 2016 were as follows:
| | | | | | | | | | | | | | | | | | | | | | | | | | | | | | | | |
Reference Entity | | Counterparty | | | Termination
Date | | | Buy/Sell
Protection2 | | | Notional
Amount
(000)3 | | | (Pay)/
Receive
Fixed
Rate4 | | | Upfront
Premiums
Received/
(Paid) | | | Value | | | Unrealized
Appreciation/ (Depreciation)5 | |
Staples, Inc. 2.75%, 1/12/18 | | | Credit Suisse First Boston | | | | 6/20/2019 | | | | Buy | | | $ | 7,000 | | | | (1.00 | )% | | $ | (257,177 | ) | | $ | (7,855 | ) | | $ | (265,032 | ) |
| 1. | As of October 31, 2016, cash in the amount of $4,918,889 was on deposit with a broker for centrally cleared swap agreements. |
| 2. | Buy—Fund pays premium and buys credit protection. If a credit event occurs, as defined under the terms of that particular swap agreement, the Fund will either (i) receive from the seller of protection an amount equal to the notional amount of the swap and deliver the referenced obligation or underlying securities comprising the referenced index or (ii) receive a net settlement amount in the form of cash or securities equal to the notional amount of the swap less the recovery value of the referenced obligation or underlying securities comprising the referenced index. |
| | Sell—Fund receives premium and sells credit protection. If a credit event occurs, as defined under the terms of that particular swap agreement, the Fund will either (i) pay to the buyer of protection an amount equal to the notional amount of the swap and take delivery of the referenced obligation or underlying securities comprising the referenced index or (ii) pay a net settlement amount in the form of cash or securities equal to the notional amount of the swap less the recovery value of the referenced obligation or underlying securities comprising the referenced index. |
| 3. | The maximum potential amount the Fund could be required to pay as a seller of credit protection or receive as a buyer of credit protection if a credit event occurs as defined under the terms of that particular swap contract. |
| 4. | The annual fixed rate represents the interest received by the Fund (as a seller of protection) or paid by the Fund (as a buyer of protection) annually on the notional amount of the credit default swap contract. |
| 5. | Represents the difference between the value of the credit default swap contracts at the time they were opened and the value at October 31, 2016. |
The following abbreviations are used in the preceding pages:
EUR—Euro
GBP—British Pound Sterling
The following is a summary of the fair valuations according to the inputs used as of October 31, 2016, for valuing the Fund’s assets and liabilities.
Asset Valuation Inputs
| | | | | | | | | | | | | | | | |
Description | | Quoted
Prices in
Active
Markets for
Identical
Assets (Level 1) | | | Significant
Other
Observable
Inputs (Level 2) | | | Significant
Unobservable
Inputs (Level 3) | | | Total | |
| Investments in Securities (a) | | | | | | | | | | | | | | | | |
| Long-Term Bonds | | | | | | | | | | | | | | | | |
Asset-Backed Securities | | $ | — | | | $ | 3,999,176 | | | $ | — | | | $ | 3,999,176 | |
Convertible Bond | | | — | | | | 1,202,938 | | | | — | | | | 1,202,938 | |
Corporate Bonds | | | — | | | | 1,121,911,523 | | | | — | | | | 1,121,911,523 | |
Foreign Bonds | | | — | | | | 3,128,808 | | | | — | | | | 3,128,808 | |
Loan Assignments (b) | | | — | | | | 225,147,735 | | | | 19,561,109 | | | | 244,708,844 | |
Mortgage-Backed Securities | | | — | | | | 503,194 | | | | — | | | | 503,194 | |
U.S. Government | | | — | | | | 72,540 | | | | — | | | | 72,540 | |
| | | | | | | | | | | | | | | | |
| Total Long-Term Bonds | | | — | | | | 1,355,965,914 | | | | 19,561,109 | | | | 1,375,527,023 | |
| | | | | | | | | | | | | | | | |
| Common Stocks (c) | | | 476,465 | | | | — | | | | 11,778 | | | | 488,243 | |
| Warrants | | | 280,521 | | | | — | | | | — | | | | 280,521 | |
| Short-Term Investment | | | | | | | | | | | | | | | | |
Repurchase Agreement | | | — | | | | 59,942,740 | | | | — | | | | 59,942,740 | |
| | | | | | | | | | | | | | | | |
| Total Investments in Securities | | | 756,986 | | | | 1,415,908,654 | | | | 19,572,887 | | | | 1,436,238,527 | |
| | | | | | | | | | | | | | | | |
| Other Financial Instruments | | | | | | | | | | | | | | | | |
Foreign Currency Forward Contracts (d) | | | — | | | | 2,263,536 | | | | — | | | | 2,263,536 | |
Futures Contracts (d) | | | 1,626,085 | | | | — | | | | — | | | | 1,626,085 | |
Interest Rate Swap Contracts (d) | | | — | | | | 5,027,399 | | | | — | | | | 5,027,399 | |
| | | | | | | | | | | | | | | | |
| Total Other Financial Instruments | | | 1,626,085 | | | | 7,290,935 | | | | — | | | | 8,917,020 | |
| | | | | | | | | | | | | | | | |
| Total Investments in Securities and Other Financial Instruments | | $ | 2,383,071 | | | $ | 1,423,199,589 | | | $ | 19,572,887 | | | $ | 1,445,155,547 | |
| | | | | | | | | | | | | | | | |
| | | | |
| 22 | | MainStay Unconstrained Bond Fund | | The notes to the financial statements are an integral part of,
and should be read in conjunction with, the financial statements. |
Liability Valuation Inputs
| | | | | | | | | | | | | | | | |
Description | | Quoted
Prices in
Active
Markets for
Identical
Assets (Level 1) | | | Significant
Other
Observable
Inputs (Level 2) | | | Significant
Unobservable
Inputs (Level 3) | | | Total | |
| Long-Term Bonds Sold Short | | | | | | | | | | | | | | | | |
Corporate Bonds Sold Short | | $ | — | | | $ | (31,181,440 | ) | | $ | — | | | $ | (31,181,440 | ) |
| | | | | | | | | | | | | | | | |
| Total Long-Term Bonds Sold Short | | | — | | | | (31,181,440 | ) | | | — | | | | (31,181,440 | ) |
| | | | | | | | | | | | | | | | |
| Other Financial Instruments | | | | | | | | | | | | | | | | |
Foreign Currency Forward Contracts (d) | | | — | | | | (95,236 | ) | | | — | | | | (95,236 | ) |
Futures Contracts (d) | | | (232,002 | ) | | | — | | | | — | | | | (232,002 | ) |
Credit Default Swap Contracts (d) | | | — | | | | (265,032 | ) | | | — | | | | (265,032 | ) |
| | | | | | | | | | | | | | | | |
| Total Other Financial Instruments | | | (232,002 | ) | | | (360,268 | ) | | | — | | | | (592,270 | ) |
| | | | | | | | | | | | | | | | |
| Total Investments in Securities Sold Short and Other Financial Instruments | | $ | (232,002 | ) | | $ | (31,541,708 | ) | | $ | — | | | $ | (31,773,710 | ) |
| | | | | | | | | | | | | | | | |
| (a) | For a complete listing of investments and their industries, see the Portfolio of Investments. |
| (b) | Includes $8,673,520, $6,635,753, $987,525, $2,535,260 and $729,051 of Level 3 securities held in Advertising, Containers, Packaging & Glass, Health Care—Products, Machinery—Construction & Mining and Retail Stores, respectively, within the Loan Assignments section of the Portfolio of Investments. |
| (c) | The Level 3 security valued at $11,778 is held in Media within the Common Stocks section of the Portfolio of Investments. |
| (d) | The value listed for these securities reflects unrealized appreciation (depreciation) as shown on the Portfolio of Investments. |
The Fund recognizes transfers between the levels as of the beginning of the year.
As of October 31, 2016, securities with a market value of $17,147,226 transferred from Level 2 to Level 3. The transfer occurred as a result of
utilizing significant unobservable inputs. As of October 31, 2015, the fair value obtained for these securities, as determined based on information provided by an independent pricing source, utilized significant observable inputs. (See Note 2)
As of October 31, 2016, a security with a market value of $7,985,661 transferred from Level 3 to Level 2. The transfer occurred as a result of
utilizing significant observable inputs. As of October 31, 2015, the fair value obtained for these securities, as determined based on information provided by an independent pricing source, utilized significant unobservable inputs. (See Note 2)
The following is a reconciliation of investments in which significant unobservable inputs (Level 3) were used in determining value:
| | | | | | | | | | | | | | | | | | | | | | | | | | | | | | | | | | | | | | | | |
Investments in Securities | | Balance
as of
October 31,
2015 | | | Accrued
Discounts
(Premiums) | | | Realized
Gain
(Loss) | | | Change in
Unrealized
Apprecia-
tion
(Deprecia-
tion) | | | Purchases | | | Sales (a) | | | Transfers
in to
Level 3 | | | Transfers
out of
Level 3 | | | Balance
as of
October 31,
2016 | | | Change in
Unrealized
Appreciation
(Depreciation)
from
Investments
Still Held at
October 31,
2016 (b) | |
| Long-Term Bonds | | | | | | | | | | | | | | | | | | | | | | | | | | | | | | | | | | | | | | | | |
Loan Assignments | | | | | | | | | | | | | | | | | | | | | | | | | | | | | | | | | | | | | | | | |
Advertising | | $ | — | | | $ | 12,534 | | | $ | 572 | | | $ | 185,922 | | | $ | 570,805 | | | $ | (65,625 | ) | | $ | 7,969,312 | | | $ | — | | | $ | 8,673,520 | | | $ | 184,662 | |
Commercial Services | | | 7,985,661 | | | | — | | | | — | | | | — | | | | — | | | | — | | | | — | | | | (7,985,661 | ) | | | — | | | | — | |
Containers | | | — | | | | — | | | | — | | | | 24,760 | | | | — | | | | — | | | | 6,610,993 | | | | — | | | | 6,635,753 | | | | 24,760 | |
Health Care—Products | | | 990,000 | | | | 357 | | | | 21 | | | | 7,147 | | | | — | | | | (10,000 | ) | | | — | | | | — | | | | 987,525 | | | | 7,068 | |
Machinery—Construction & Mining | | | 897,500 | | | | 1,103 | | | | (155,653 | ) | | | 89,388 | | | | — | | | | (864,000 | ) | | | 2,566,922 | | | | — | | | | 2,535,260 | | | | (6,630 | ) |
Real Estate | | | 45,416 | | | | 488 | | | | 252 | | | | (281 | ) | | | — | | | | (45,875 | ) | | | — | | | | — | | | | — | | | | — | |
Retail | | | 2,810,500 | | | | 1,173 | | | | 33 | | | | (22,355 | ) | | | — | | | | (2,789,351 | ) | | | — | | | | — | | | | — | | | | — | |
Retail Stores | | | — | | | | (43 | ) | | | — | | | | 4,078 | | | | 725,016 | | | | — | | | | — | | | | — | | | | 729,051 | | | | 4,078 | |
| Common Stocks | | | | | | | | | | | | | | | | | | | | | | | | | | | | | | | | | | | | | | | | |
Media | | | 9,560 | | | | — | | | | — | | | | 2,218 | | | | — | | | | — | | | | — | | | | — | | | | 11,778 | | | | 2,218 | |
| | | | | | | | | | | | | | | | | | | | | | | | | | | | | | | | | | | | | | | | |
Total | | $ | 12,738,637 | | | $ | 15,612 | | | $ | (154,775 | ) | | $ | 290,877 | | | $ | 1,295,821 | | | $ | (3,774,851 | ) | | $ | 17,147,227 | | | $ | (7,985,661 | ) | | $ | 19,572,887 | | | $ | 216,156 | |
| | | | | | | | | | | | | | | | | | | | | | | | | | | | | | | | | | | | | | | | |
| (a) | Sales include principal reductions. |
| (b) | Included in “Net change in unrealized appreciation (depreciation) on investments” in the Statement of Operations. |
| | | | | | |
The notes to the financial statements are an integral part of,
and should be read in conjunction with, the financial statements. | | | | | 23 | |
Statement of Assets and Liabilities as of October 31, 2016
| | | | |
| Assets | |
Investment in securities, at value (identified cost $1,434,887,781) | | $ | 1,436,238,527 | |
Cash collateral on deposit at broker | | | 6,593,117 | |
Cash denominated in foreign currencies (identified cost $5,298,253) | | | 4,665,588 | |
Receivables: | | | | |
Investment securities sold | | | 18,195,179 | |
Dividends and interest | | | 14,869,748 | |
Fund shares sold | | | 2,145,716 | |
Premiums paid for OTC swap contracts | | | 257,177 | |
Other assets | | | 52,788 | |
Unrealized appreciation on foreign currency forward contracts | | | 2,263,536 | |
Variation margin on centrally cleared swaps | | | 46,919 | |
| | | | |
Total assets | | | 1,485,328,295 | |
| | | | |
| |
| Liabilities | | | | |
Investments sold short (proceeds $29,358,916) | | | 31,181,440 | |
Due to custodian | | | 356,240 | |
Payables: | | | | |
Investment securities purchased | | | 27,686,368 | |
Fund shares redeemed | | | 3,427,292 | |
Manager (See Note 3) | | | 685,411 | |
Interest on investments sold short | | | 500,663 | |
Transfer agent (See Note 3) | | | 393,535 | |
NYLIFE Distributors (See Note 3) | | | 300,343 | |
Broker fees and charges on short sales | | | 129,142 | |
Variation margin on futures contracts | | | 91,554 | |
Shareholder communication | | | 52,067 | |
Custodian | | | 32,533 | |
Professional fees | | | 26,564 | |
Trustees | | | 4,056 | |
Accrued expenses | | | 11,421 | |
Dividend payable | | | 525,367 | |
Unrealized depreciation on OTC swap contracts | | | 265,032 | |
Unrealized depreciation on foreign currency forward contracts | | | 95,236 | |
| | | | |
Total liabilities | | | 65,764,264 | |
| | | | |
Net assets | | $ | 1,419,564,031 | |
| | | | |
| |
| Composition of Net Assets | | | | |
Shares of beneficial interest outstanding (par value of $.01 per share) unlimited number of shares authorized | | $ | 1,611,986 | |
Additional paid-in capital | | | 1,594,072,739 | |
| | | | |
| | | 1,595,684,725 | |
Undistributed net investment income | | | 6,955,097 | |
Accumulated net realized gain (loss) on investments, investments sold short, futures transactions, swap transactions and foreign currency transactions | | | (190,283,177 | ) |
Net unrealized appreciation (depreciation) on investments, swap contracts and futures contracts | | | 7,507,196 | |
Net unrealized appreciation (depreciation) on investments sold short | | | (1,822,524 | ) |
Net unrealized appreciation (depreciation) on translation of other assets and liabilities in foreign currencies and foreign currency forward contracts | | | 1,522,714 | |
| | | | |
Net assets | | $ | 1,419,564,031 | |
| | | | |
| | | | |
Class A | | | | |
Net assets applicable to outstanding shares | | $ | 412,833,688 | |
| | | | |
Shares of beneficial interest outstanding | | | 46,867,205 | |
| | | | |
Net asset value per share outstanding | | $ | 8.81 | |
Maximum sales charge (4.50% of offering price) | | | 0.42 | |
| | | | |
Maximum offering price per share outstanding | | $ | 9.23 | |
| | | | |
Investor Class | | | | |
Net assets applicable to outstanding shares | | $ | 31,850,759 | |
| | | | |
Shares of beneficial interest outstanding | | | 3,588,507 | |
| | | | |
Net asset value per share outstanding | | $ | 8.88 | |
Maximum sales charge (4.50% of offering price) | | | 0.42 | |
| | | | |
Maximum offering price per share outstanding | | $ | 9.30 | |
| | | | |
Class B | | | | |
Net assets applicable to outstanding shares | | $ | 18,312,660 | |
| | | | |
Shares of beneficial interest outstanding | | | 2,088,934 | |
| | | | |
Net asset value and offering price per share outstanding | | $ | 8.77 | |
| | | | |
Class C | | | | |
Net assets applicable to outstanding shares | | $ | 220,513,496 | |
| | | | |
Shares of beneficial interest outstanding | | | 25,173,790 | |
| | | | |
Net asset value and offering price per share outstanding | | $ | 8.76 | |
| | | | |
Class I | | | | |
Net assets applicable to outstanding shares | | $ | 735,359,465 | |
| | | | |
Shares of beneficial interest outstanding | | | 83,401,399 | |
| | | | |
Net asset value and offering price per share outstanding | | $ | 8.82 | |
| | | | |
Class R2 | | | | |
Net assets applicable to outstanding shares | | $ | 662,166 | |
| | | | |
Shares of beneficial interest outstanding | | | 75,201 | |
| | | | |
Net asset value and offering price per share outstanding | | $ | 8.81 | |
| | | | |
Class R3 | | | | |
Net assets applicable to outstanding shares | | $ | 31,797 | |
| | | | |
Shares of beneficial interest outstanding | | | 3,608 | |
| | | | |
Net asset value and offering price per share outstanding | | $ | 8.81 | |
| | | | |
| | | | |
| 24 | | MainStay Unconstrained Bond Fund | | The notes to the financial statements are an integral part of,
and should be read in conjunction with, the financial statements. |
Statement of Operations for the year ended October 31, 2016
| | | | |
| Investment Income (Loss) | |
Income | | | | |
Interest | | $ | 84,848,149 | |
Dividends | | | 22,618 | |
| | | | |
Total income | | | 84,870,767 | |
| | | | |
Expenses | | | | |
Manager (See Note 3) | | | 9,086,349 | |
Distribution/Service—Class A (See Note 3) | | | 1,159,772 | |
Distribution/Service—Investor Class (See Note 3) | | | 78,496 | |
Distribution/Service—Class B (See Note 3) | | | 182,685 | |
Distribution/Service—Class C (See Note 3) | | | 2,548,686 | |
Distribution/Service—Class R2 (See Note 3) | | | 265 | |
Distribution/Service—Class R3 (See Note 3) | | | 96 | |
Transfer agent (See Note 3) | | | 2,573,746 | |
Interest on investments sold short | | | 1,770,366 | |
Broker fees and charges on short sales | | | 887,722 | |
Registration | | | 161,294 | |
Professional fees | | | 147,261 | |
Shareholder communication | | | 142,074 | |
Custodian | | | 63,962 | |
Trustees | | | 41,573 | |
Interest expense | | | 3,785 | |
Shareholder service (See Note 3) | | | 125 | |
Miscellaneous | | | 60,423 | |
| | | | |
Total expenses | | | 18,908,680 | |
Reimbursement from custodian (a) | | | (14,214 | ) |
| | | | |
Net expenses | | | 18,894,466 | |
| | | | |
Net investment income (loss) | | | 65,976,301 | |
| | | | |
|
| Realized and Unrealized Gain (Loss) on Investments, Futures Contracts, Swap Contracts and Foreign Currency Transactions | |
Net realized gain (loss) on: | | | | |
Investment transactions | | | (119,066,911 | ) |
Investments sold short | | | 1,812,897 | |
Futures transactions | | | (6,840,702 | ) |
Swap transactions | | | (7,316,233 | ) |
Foreign currency transactions | | | 4,703,437 | |
| | | | |
Net realized gain (loss) on investments, investments sold short, futures transactions, swap transactions and foreign currency transactions | | | (126,707,512 | ) |
| | | | |
Net change in unrealized appreciation (depreciation) on: | | | | |
Investments | | | 102,280,035 | |
Investments sold short | | | (2,959,919 | ) |
Futures contracts | | | 2,536,433 | |
Swap contracts | | | 8,941,982 | |
Translation of other assets and liabilities in foreign currencies and foreign currency forward contracts | | | 956,952 | |
| | | | |
Net change in unrealized appreciation (depreciation) on investments, investments sold short, futures contracts, swap contracts and foreign currency transactions | | | 111,755,483 | |
| | | | |
Net realized and unrealized gain (loss) on investments, investments sold short, futures transactions, swap transactions and foreign currency transactions | | | (14,952,029 | ) |
| | | | |
Net increase (decrease) in net assets resulting from operations | | $ | 51,024,272 | |
| | | | |
| (a) | Reimbursement from custodian represents a refund for overbilling of prior years’ custody out-of-pocket fees. |
| | | | | | |
The notes to the financial statements are an integral part of,
and should be read in conjunction with, the financial statements. | | | | | 25 | |
Statements of Changes in Net Assets
for the years ended October 31, 2016 and October 31, 2015
| | | | | | | | |
| | | 2016 | | | 2015 | |
| Increase (Decrease) in Net Assets | |
Operations: | | | | | | | | |
Net investment income (loss) | | $ | 65,976,301 | | | $ | 99,541,667 | |
Net realized gain (loss) on investments, investments sold short, futures transactions, swap transactions and foreign currency transactions | | | (126,707,512 | ) | | | (78,763,295 | ) |
Net change in unrealized appreciation (depreciation) on investments, investments sold short, futures contracts, swap contracts and foreign currency transactions | | | 111,755,483 | | | | (92,514,436 | ) |
| | | | |
Net increase (decrease) in net assets resulting from operations | | | 51,024,272 | | | | (71,736,064 | ) |
| | | | |
Dividends to shareholders: | | | | | | | | |
From net investment income: | | | | | | | | |
Class A | | | (17,448,500 | ) | | | (22,199,099 | ) |
Investor Class | | | (1,174,147 | ) | | | (1,079,074 | ) |
Class B | | | (553,640 | ) | | | (561,584 | ) |
Class C | | | (7,691,473 | ) | | | (9,024,905 | ) |
Class I | | | (34,272,357 | ) | | | (50,654,929 | ) |
Class R2 | | | (5,314 | ) | | | (7,479 | ) |
Class R3 | | | (626 | ) | | | — | |
| | | | |
Total dividends to shareholders | | | (61,146,057 | ) | | | (83,527,070 | ) |
| | | | |
Capital share transactions: | | | | | | | | |
Net proceeds from sale of shares | | | 289,363,678 | | | | 986,207,670 | |
Net asset value of shares issued to shareholders in reinvestment of dividends | | | 52,612,771 | | | | 70,622,476 | |
Cost of shares redeemed | | | (1,127,795,232 | ) | | | (1,243,315,257 | ) |
| | | | |
Increase (decrease) in net assets derived from capital share transactions | | | (785,818,783 | ) | | | (186,485,111 | ) |
| | | | |
Net increase (decrease) in net assets | | | (795,940,568 | ) | | | (341,748,245 | ) |
|
| Net Assets | |
Beginning of year | | | 2,215,504,599 | | | | 2,557,252,844 | |
| | | | |
End of year | | $ | 1,419,564,031 | | | $ | 2,215,504,599 | |
| | | | |
Undistributed net investment income at end of year | | $ | 6,955,097 | | | $ | 2,622,833 | |
| | | | |
| | | | |
| 26 | | MainStay Unconstrained Bond Fund | | The notes to the financial statements are an integral part of,
and should be read in conjunction with, the financial statements. |
Financial Highlights selected per share data and ratios
| | | | | | | | | | | | | | | | | | | | |
| | | Year ended October 31, | |
| Class A | | 2016 | | | 2015 | | | 2014 | | | 2013 | | | 2012 | |
Net asset value at beginning of year | | $ | 8.72 | | | $ | 9.27 | | | $ | 9.28 | | | $ | 9.22 | | | $ | 8.73 | |
| | | | | | | | | | | | | | | | | | | | |
Net investment income (loss) (a) | | | 0.35 | | | | 0.36 | | | | 0.36 | | | | 0.40 | | | | 0.45 | |
Net realized and unrealized gain (loss) on investments | | | 0.08 | | | | (0.63 | ) | | | (0.05 | ) | | | 0.06 | | | | 0.49 | |
Net realized and unrealized gain (loss) on foreign currency transactions | | | (0.02 | ) | | | 0.02 | | | | 0.01 | | | | (0.01 | ) | | | 0.01 | |
| | | | | | | | | | | | | | | | | | | | |
Total from investment operations | | | 0.41 | | | | (0.25 | ) | | | 0.32 | | | | 0.45 | | | | 0.95 | |
| | | | | | | | | | | | | | | | | | | | |
| Less dividends: | | | | | | | | | | | | | | | | | | | | |
From net investment income | | | (0.32 | ) | | | (0.30 | ) | | | (0.33 | ) | | | (0.39 | ) | | | (0.46 | ) |
| | | | | | | | | | | | | | | | | | | | |
Total dividends | | | (0.32 | ) | | | (0.30 | ) | | | — | | | | — | | | | — | |
| | | | | | | | | | | | | | | | | | | | |
Net asset value at end of year | | $ | 8.81 | | | $ | 8.72 | | | $ | 9.27 | | | $ | 9.28 | | | $ | 9.22 | |
| | | | | | | | | | | | | | | | | | | | |
Total investment return (b) | | | 4.94 | % | | | (2.70 | %) | | | 3.48 | % | | | 4.96 | % | | | 11.26 | % |
| Ratios (to average net assets)/Supplemental Data: | | | | | | | | | | | | | | | | | | | | |
Net investment income (loss) | | | 4.04 | % | | | 4.01 | % | | | 3.81 | % | | | 4.25 | % | | | 5.08 | % |
Net expenses (excluding short sale expenses) | | | 1.00 | % | | | 0.96 | % | | | 0.98 | % | | | 1.00 | % | | | 1.00 | % |
Expenses (including short sales expenses) | | | 1.16 | % | | | 1.01 | % | | | 1.04 | % | | | 1.12 | % | | | 1.33 | % |
Short sale expenses | | | 0.16 | % | | | 0.05 | % | | | 0.06 | % | | | 0.12 | % | | | 0.33 | % |
Portfolio turnover rate | | | 15 | % | | | 22 | % | | | 19 | % | | | 23 | % | | | 25 | % |
Net assets at end of year (in 000’s) | | $ | 412,834 | | | $ | 584,184 | | | $ | 675,552 | | | $ | 317,917 | | | $ | 192,009 | |
| (a) | Per share data based on average shares outstanding during the year. |
| (b) | Total investment return is calculated exclusive of sales charges and assumes the reinvestment of dividends and distributions. |
| | | | | | | | | | | | | | | | | | | | |
| | | Year ended October 31, | |
| Investor Class | | 2016 | | | 2015 | | | 2014 | | | 2013 | | | 2012 | |
Net asset value at beginning of year | | $ | 8.78 | | | $ | 9.33 | | | $ | 9.34 | | | $ | 9.28 | | | $ | 8.78 | |
| | | | | | | | | | | | | | | | | | | | |
Net investment income (loss) (a) | | | 0.35 | | | | 0.36 | | | | 0.36 | | | | 0.39 | | | | 0.44 | |
Net realized and unrealized gain (loss) on investments | | | 0.10 | | | | (0.63 | ) | | | (0.05 | ) | | | 0.06 | | | | 0.50 | |
Net realized and unrealized gain (loss) on foreign currency transactions | | | (0.03 | ) | | | 0.02 | | | | 0.01 | | | | (0.01 | ) | | | 0.01 | |
| | | | | | | | | | | | | | | | | | | | |
Total from investment operations | | | 0.42 | | | | (0.25 | ) | | | 0.32 | | | | 0.44 | | | | 0.95 | |
| | | | | | | | | | | | | | | | | | | | |
| Less dividends: | | | | | | | | | | | | | | | | | | | | |
From net investment income | | | (0.32 | ) | | | (0.30 | ) | | | (0.33 | ) | | | (0.38 | ) | | | (0.45 | ) |
| | | | | | | | | | | | | | | | | | | | |
Net asset value at end of year | | $ | 8.88 | | | $ | 8.78 | | | $ | 9.33 | | | $ | 9.34 | | | $ | 9.28 | |
| | | | | | | | | | | | | | | | | | | | |
Total investment return (b) | | | 5.00 | % | | | (2.70 | %) | | | 3.42 | % | | | 4.76 | % | | | 10.98 | % |
| Ratios (to average net assets)/Supplemental Data: | | | | | | | | | | | | | | | | | | | | |
Net investment income (loss) | | | 4.01 | % | | | 3.99 | % | | | 3.78 | % | | | 4.12 | % | | | 4.89 | % |
Net expenses (excluding short sale expenses) | | | 1.02 | % | | | 0.98 | % | | | 1.00 | % | | | 1.15 | % | | | 1.19 | % |
Expenses (including short sales expenses) | | | 1.18 | % | | | 1.03 | % | | | 1.06 | % | | | 1.27 | % | | | 1.52 | % |
Short sale expenses | | | 0.16 | % | | | 0.05 | % | | | 0.06 | % | | | 0.12 | % | | | 0.33 | % |
Portfolio turnover rate | | | 15 | % | | | 22 | % | | | 19 | % | | | 23 | % | | | 25 | % |
Net assets at end of year (in 000’s) | | $ | 31,851 | | | $ | 32,498 | | | $ | 31,690 | | | $ | 28,341 | | | $ | 24,551 | |
| (a) | Per share data based on average shares outstanding during the year. |
| (b) | Total investment return is calculated exclusive of sales charges and assumes the reinvestment of dividends and distributions. |
| | | | | | |
The notes to the financial statements are an integral part of,
and should be read in conjunction with, the financial statements. | | | | | 27 | |
Financial Highlights selected per share data and ratios
| | | | | | | | | | | | | | | | | | | | |
| | | Year ended October 31, | |
| Class B | | 2016 | | | 2015 | | | 2014 | | | 2013 | | | 2012 | |
Net asset value at beginning of year | | $ | 8.68 | | | $ | 9.23 | | | $ | 9.24 | | | $ | 9.18 | | | $ | 8.70 | |
| | | | | | | | | | | | | | | | | | | | |
Net investment income (loss) (a) | | | 0.28 | | | | 0.29 | | | | 0.28 | | | | 0.31 | | | | 0.37 | |
Net realized and unrealized gain (loss) on investments | | | 0.10 | | | | (0.62 | ) | | | (0.04 | ) | | | 0.07 | | | | 0.48 | |
Net realized and unrealized gain (loss) on foreign currency transactions | | | (0.03 | ) | | | 0.02 | | | | 0.01 | | | | (0.01 | ) | | | 0.01 | |
| | | | | | | | | | | | | | | | | | | | |
Total from investment operations | | | 0.35 | | | | (0.31 | ) | | | 0.25 | | | | 0.37 | | | | 0.86 | |
| | | | | | | | | | | | | | | | | | | | |
| Less dividends and distributions: | | | | | | | | | | | | | | | | | | | | |
From net investment income | | | (0.26 | ) | | | (0.24 | ) | | | (0.26 | ) | | | (0.31 | ) | | | (0.38 | ) |
| | | | | | | | | | | | | | | | | | | | |
Net asset value at end of year | | $ | 8.77 | | | $ | 8.68 | | | $ | 9.23 | | | $ | 9.24 | | | $ | 9.18 | |
| | | | | | | | | | | | | | | | | | | | |
Total investment return (b) | | | 4.16 | % | | | (3.45 | %) | | | 2.71 | % | | | 4.05 | % | | | 10.15 | % |
| Ratios (to average net assets)/Supplemental Data: | | | | | | | | | | | | | | | | | | | | |
Net investment income (loss) | | | 3.26 | % | | | 3.24 | % | | | 3.03 | % | | | 3.38 | % | | | 4.14 | % |
Net expenses (excluding short sale expenses) | | | 1.77 | % | | | 1.73 | % | | | 1.75 | % | | | 1.90 | % | | | 1.94 | % |
Expenses (including short sales expenses) | | | 1.93 | % | | | 1.78 | % | | | 1.81 | % | | | 2.02 | % | | | 2.27 | % |
Short sale expenses | | | 0.16 | % | | | 0.05 | % | | | 0.06 | % | | | 0.12 | % | | | 0.33 | % |
Portfolio turnover rate | | | 15 | % | | | 22 | % | | | 19 | % | | | 23 | % | | | 25 | % |
Net assets at end of year (in 000’s) | | $ | 18,313 | | | $ | 19,833 | | | $ | 22,460 | | | $ | 19,254 | | | $ | 17,591 | |
| (a) | Per share data based on average shares outstanding during the year. |
| (b) | Total investment return is calculated exclusive of sales charges and assumes the reinvestment of dividends and distributions. |
| | | | | | | | | | | | | | | | | | | | |
| | | Year ended October 31, | |
| Class C | | 2016 | | | 2015 | | | 2014 | | | 2013 | | | 2012 | |
Net asset value at beginning of year | | $ | 8.67 | | | $ | 9.22 | | | $ | 9.23 | | | $ | 9.18 | | | $ | 8.69 | |
| | | | | | | | | | | | | | | | | | | | |
Net investment income (loss) (a) | | | 0.28 | | | | 0.29 | | | | 0.28 | | | | 0.31 | | | | 0.37 | |
Net realized and unrealized gain (loss) on investments | | | 0.10 | | | | (0.62 | ) | | | (0.04 | ) | | | 0.06 | | | | 0.49 | |
Net realized and unrealized gain (loss) on foreign currency transactions | | | (0.03 | ) | | | 0.02 | | | | 0.01 | | | | (0.01 | ) | | | 0.01 | |
| | | | | | | | | | | | | | | | | | | | |
Total from investment operations | | | 0.35 | | | | (0.31 | ) | | | 0.25 | | | | 0.36 | | | | 0.87 | |
| | | | | | | | | | | | | | | | | | | | |
| Less dividends: | | | | | | | | | | | | | | | | | | | | |
From net investment income | | | (0.26 | ) | | | (0.24 | ) | | | (0.26 | ) | | | (0.31 | ) | | | (0.38 | ) |
| | | | | | | | | | | | | | | | | | | | |
Net asset value at end of year | | $ | 8.76 | | | $ | 8.67 | | | $ | 9.22 | | | $ | 9.23 | | | $ | 9.18 | |
| | | | | | | | | | | | | | | | | | | | |
Total investment return (b) | | | 4.16 | % | | | (3.46 | %) | | | 2.71 | % | | | 4.05 | % | | | 10.16 | % |
| Ratios (to average net assets)/Supplemental Data: | | | | | | | | | | | | | | | | | | | | |
Net investment income (loss) | | | 3.27 | % | | | 3.24 | % | | | 3.05 | % | | | 3.34 | % | | | 4.14 | % |
Net expenses (excluding short sale expenses) | | | 1.77 | % | | | 1.73 | % | | | 1.75 | % | | | 1.90 | % | | | 1.94 | % |
Expenses (including short sales expenses) | | | 1.93 | % | | | 1.78 | % | | | 1.81 | % | | | 2.02 | % | | | 2.27 | % |
Short sale expenses | | | 0.16 | % | | | 0.05 | % | | | 0.06 | % | | | 0.12 | % | | | 0.33 | % |
Portfolio turnover rate | | | 15 | % | | | 22 | % | | | 19 | % | | | 23 | % | | | 25 | % |
Net assets at end of year (in 000’s) | | $ | 220,513 | | | $ | 315,183 | | | $ | 345,900 | | | $ | 113,183 | | | $ | 59,159 | |
| (a) | Per share data based on average shares outstanding during the year. |
| (b) | Total investment return is calculated exclusive of sales charges and assumes the reinvestment of dividends and distributions. |
| | | | |
| 28 | | MainStay Unconstrained Bond Fund | | The notes to the financial statements are an integral part of,
and should be read in conjunction with, the financial statements. |
Financial Highlights selected per share data and ratios
| | | | | | | | | | | | | | | | | | | | |
| | | Year ended October 31, | |
| Class I | | 2016 | | | 2015 | | | 2014 | | | 2013 | | | 2012 | |
Net asset value at beginning of year | | $ | 8.72 | | | $ | 9.28 | | | $ | 9.29 | | | $ | 9.23 | | | $ | 8.73 | |
| | | | | | | | | | | | | | | | | | | | |
Net investment income (loss) (a) | | | 0.37 | | | | 0.38 | | | | 0.38 | | | | 0.41 | | | | 0.47 | |
Net realized and unrealized gain (loss) on investments | | | 0.11 | | | | (0.63 | ) | | | (0.05 | ) | | | 0.07 | | | | 0.51 | |
Net realized and unrealized gain (loss) on foreign currency transactions | | | (0.03 | ) | | | 0.02 | | | | 0.01 | | | | (0.01 | ) | | | 0.01 | |
| | | | | | | | | | | | | | | | | | | | |
Total from investment operations | | | 0.45 | | | | (0.23 | ) | | | 0.34 | | | | 0.47 | | | | 0.99 | |
| | | | | | | | | | | | | | | | | | | | |
| Less dividends: | | | | | | | | | | | | | | | | | | | | |
From net investment income | | | (0.35 | ) | | | (0.33 | ) | | | (0.35 | ) | | | (0.41 | ) | | | (0.49 | ) |
| | | | | | | | | | | | | | | | | | | | |
Net asset value at end of year | | $ | 8.82 | | | $ | 8.72 | | | $ | 9.28 | | | $ | 9.29 | | | $ | 9.23 | |
| | | | | | | | | | | | | | | | | | | | |
Total investment return (b) | | | 5.32 | % | | | (2.56 | %) | | | 3.73 | % | | | 5.32 | % | | | 11.41 | % |
| Ratios (to average net assets)/Supplemental Data: | | | | | | | | | | | | | | | | | | | | |
Net investment income (loss) | | | 4.30 | % | | | 4.25 | % | | | 4.08 | % | | | 4.45 | % | | | 5.32 | % |
Net expenses (excluding short sale expenses) | | | 0.75 | % | | | 0.71 | % | | | 0.73 | % | | | 0.75 | % | | | 0.76 | % |
Expenses (including short sales expenses) | | | 0.91 | % | | | 0.76 | % | | | 0.79 | % | | | 0.87 | % | | | 1.08 | % |
Short sale expenses | | | 0.16 | % | | | 0.05 | % | | | 0.06 | % | | | 0.12 | % | | | 0.32 | % |
Portfolio turnover rate | | | 15 | % | | | 22 | % | | | 19 | % | | | 23 | % | | | 25 | % |
Net assets at end of year (in 000’s) | | $ | 735,359 | | | $ | 1,263,695 | | | $ | 1,481,314 | | | $ | 294,560 | | | $ | 111,435 | |
| (a) | Per share data based on average shares outstanding during the year. |
| (b) | Total investment return is calculated exclusive of sales charges and assumes the reinvestment of dividends and distributions. Class I shares are not subject to sales charges. |
| | | | | | | | | | | | |
| | | Year ended October 31, | | | February 28,
2014**
through
October 31, | |
| Class R2 | | 2016 | | | 2015 | | | 2014 | |
Net asset value at beginning of period | | $ | 8.72 | | | $ | 9.27 | | | $ | 9.39 | |
| | | | | | | | | | | | |
Net investment income (loss) (a) | | | 0.34 | | | | 0.35 | | | | 0.23 | |
Net realized and unrealized gain (loss) on investments | | | 0.10 | | | | (0.63 | ) | | | (0.16 | ) |
Net realized and unrealized gain (loss) on foreign currency transactions | | | (0.03 | ) | | | 0.02 | | | | 0.02 | |
| | | | | | | | | | | | |
Total from investment operations | | | 0.41 | | | | (0.26 | ) | | | 0.09 | |
| | | | | | | | | | | | |
| Less dividends: | | | | | | | | | | | | |
From net investment income | | | (0.32 | ) | | | (0.29 | ) | | | (0.21 | ) |
| | | | | | | | | | | | |
Net asset value at end of period | | $ | 8.81 | | | $ | 8.72 | | | $ | 9.27 | |
| | | | | | | | | | | | |
Total investment return (b) | | | 4.84 | % | | | (2.81 | %) | | | 0.99 | %(c) |
| Ratios (to average net assets)/Supplemental Data: | | | | | | | | | | | | |
Net investment income (loss) | | | 3.97 | % | | | 3.87 | % | | | 3.78 | %†† |
Net expenses (excluding short sale expenses) | | | 1.12 | % | | | 1.06 | % | | | 1.08 | %†† |
Expenses (including short sales expenses) | | | 1.28 | % | | | 1.11 | % | | | 1.14 | %†† |
Short sale expenses | | | 0.16 | % | | | 0.05 | % | | | 0.06 | %†† |
Portfolio turnover rate | | | 15 | % | | | 22 | % | | | 19 | % |
Net assets at end of period (in 000’s) | | $ | 662 | | | $ | 112 | | | $ | 336 | |
| (a) | Per share data based on average shares outstanding during the period. |
| (b) | Total investment return is calculated exclusive of sales charges and assumes the reinvestment of dividends and distributions. Class R2 shares are not subject to sales charges. |
| (c) | Total investment return is not annualized. |
| | | | | | |
The notes to the financial statements are an integral part of,
and should be read in conjunction with, the financial statements. | | | | | 29 | |
Financial Highlights selected per share data and ratios
| | | | |
| Class R3 | | February 29,
2016**
through
October 31,
2016 | |
Net asset value at beginning of period | | $ | 8.20 | |
| | | | |
Net investment income (loss) (a) | | | 0.21 | |
Net realized and unrealized gain (loss) on investments | | | 0.86 | |
Net realized and unrealized gain (loss) on foreign currency transactions | | | (0.27 | ) |
| | | | |
Total from investment operations | | | 0.80 | |
| | | | |
| Less dividends: | | | | |
From net investment income | | | (0.19 | ) |
| | | | |
Net asset value at end of period | | $ | 8.81 | |
| | | | |
Total investment return (b)(c) | | | 9.77 | % |
| Ratios (to average net assets)/Supplemental Data: | | | | |
Net investment income (loss) | | | 3.32 | %†† |
Net expenses (excluding short sale expenses) | | | 1.34 | %†† |
Expenses (before reimbursement/waiver) | | | 1.50 | %†† |
Short sale expenses | | | 0.16 | % |
Portfolio turnover rate | | | 15 | % |
Net assets at end of period (in 000’s) | | $ | 32 | |
| (a) | Per share data based on average shares outstanding during the period. |
| (b) | Total investment return is calculated exclusive of sales charges and assumes the reinvestment of dividends and distributions. Class R3 shares are not subject to sales charges. |
| (c) | Total investment return is not annualized. |
| | | | |
| 30 | | MainStay Unconstrained Bond Fund | | The notes to the financial statements are an integral part of,
and should be read in conjunction with, the financial statements. |
Notes to Financial Statements
Note 1–Organization and Business
The MainStay Funds (the “Trust”) was organized on January 9, 1986, as a Massachusetts business trust. The Trust is registered under the Investment Company Act of 1940, as amended (the “1940 Act”), as an open-end management investment company, and is comprised of twelve funds (collectively referred to as the “Funds”). These financial statements and notes relate to the MainStay Unconstrained Bond Fund, (the “Fund”), a “diversified” fund, as that term is defined in the 1940 Act, as interpreted or modified by regulatory authorities having jurisdiction, from time to time.
The Fund currently offers seven classes of shares. Class A and Class B shares commenced operations on February 28, 1997. Class C shares commenced operations on September 1, 1998. Class I shares commenced operations on January 2, 2004. Investor Class shares commenced operations on February 28, 2008. Class R2 shares commenced operations on February 28, 2014. Class R3 shares commenced operations on February 29, 2016. Class A and Investor Class shares are offered at net asset value (“NAV”) per share plus an initial sales charge. No initial sales charge applies to investments of $1 million or more (and certain other qualified purchases) in Class A and Investor Class shares, but a contingent deferred sales charge (“CDSC”) of 1.00% may be imposed on certain redemptions of such shares made within one year of the date of purchase on shares that were purchased without an initial sales charge made before January 1, 2017. Effective January 1, 2017, a CDSC of 1.00% may be imposed on certain redemptions of Class A and Investor Class shares made within 24 months of the date of purchase of such shares that were made without an initial sales charge. Class B and Class C shares are offered at NAV without an initial sales charge, although a CDSC that declines depending on the number of years a shareholder has held its Class B shares may be imposed on redemptions made within six years of the date of purchase of such shares and a 1.00% CDSC may be imposed on redemptions made within one year of the date of purchase of Class C shares. Class I and Class R2 shares are offered at NAV and are not subject to a sales charge. Depending upon eligibility, Class B shares convert to either Class A or Investor Class shares at the end of the calendar quarter eight years after the date they were purchased. Additionally, depending upon eligibility, Class A shares may convert to Investor Class shares and Investor Class shares may convert to Class A shares. Under certain circumstances and as may be permitted by the Trust’s multiple class plan under Rule 18f-3 of the 1940 Act, an exchange/conversion may be made from specified share classes of the Fund to one or more other share classes of the Fund as disclosed in the capital share transactions within these notes. The six classes of shares have the same voting (except for issues that relate solely to one class), dividend, liquidation and other rights, and the same terms and conditions, except that Class B and Class C shares are subject to higher distribution and/or service fee rates than Class A, Investor Class and Class R2 shares under a distribution plan pursuant to Rule 12b-1 under the 1940 Act. Class I shares are not subject to a distribution and/or service fee. Class R2 shares are subject to a shareholder service fee. This is in addition to any fees paid under a distribution plan, where applicable.
The Fund’s investment objective is to seek total return by investing primarily in domestic and foreign debt securities.
Note 2–Significant Accounting Policies
The Fund is an investment company and accordingly follows the investment company accounting and reporting guidance of the Financial Accounting Standards Board (“FASB”) Accounting Standard Codification Topic 946 Financial Services—Investment Companies. The Fund prepares its financial statements in accordance with generally accepted accounting principles (“GAAP”) in the United States of America and follows the significant accounting policies described below.
(A) Securities Valuation. Investments are usually valued as of the close of regular trading on the New York Stock Exchange (the “Exchange”) (usually 4:00 p.m. Eastern time) on each day the Fund is open for business (“valuation date”).
The Board of Trustees (the “Board”) adopted procedures establishing methodologies for the valuation of the Fund’s securities and other assets and delegated the responsibility for valuation determinations under those procedures to the Valuation Committee of the Trust (the “Valuation Committee”). The Board authorized the Valuation Committee to appoint a Valuation Sub-Committee (the “Sub-Committee”) to deal in the first instance with establishing the prices of securities for which market quotations are not readily available or the prices of which are not otherwise readily determinable under these procedures. The Sub-Committee meets (in person, via electronic mail or via teleconference) on an as-needed basis. Subsequently, the Valuation Committee meets to ensure that actions taken by the Sub-Committee were appropriate. The procedures recognize that, subject to the oversight of the Board and unless otherwise noted, the responsibility for the day-to-day valuation of portfolio assets (including fair value measurements for the Fund’s assets and liabilities) rests with New York Life Investment Management LLC (“New York Life Investments” or the “Manager”), aided to whatever extent necessary by the Subadvisor (as defined in Note 3(A)) to the Fund.
To assess the appropriateness of security valuations, the Manager, Subadvisor or the Fund’s third party service provider, who is subject to oversight by the Manager, regularly compares prior day prices, prices on comparable securities, and the sale prices to the prior and current day prices and challenges prices with changes exceeding certain tolerance levels with third party pricing services or broker sources. For those securities valued through either a standardized fair valuation methodology or a fair valuation measurement, the Sub-Committee deals in the first instance with such valuation and the Valuation Committee reviews and affirms, if appropriate, the reasonableness of the valuation based on such methodologies and measurements on a regular basis after considering all relevant information that is reasonably available. Any action taken by the Sub-Committee with respect to the valuation of a portfolio security or other asset is submitted by the Valuation Committee to the Board for its review and ratification, if appropriate, at its next regularly scheduled meeting.
“Fair value” is defined as the price the Fund would reasonably expect to receive upon selling an asset or liability in an orderly transaction to an independent buyer in the principal or most advantageous market for the asset or liability. Fair value measurements are determined within a framework that establishes a three-tier hierarchy which maximizes the use of observable market data and minimizes the use of unobservable inputs to establish a classification of fair value measurements for disclosure purposes. “Inputs” refer broadly to the assumptions that market
Notes to Financial Statements (continued)
participants would use in pricing the asset or liability, including assumptions about risk, such as the risk inherent in a particular valuation technique used to measure fair value using a pricing model and/or the risk inherent in the inputs for the valuation technique. Inputs may be observable or unobservable. Observable inputs reflect the assumptions market participants would use in pricing the asset or liability based on market data obtained from sources independent of the Fund. Unobservable inputs reflect the Fund’s own assumptions about the assumptions market participants would use in pricing the asset or liability based on the information available. The inputs or methodology used for valuing assets or liabilities may not be an indication of the risks associated with investing in those assets or liabilities. The three-tier hierarchy of inputs is summarized below.
| • | | Level 1—quoted prices in active markets for an identical asset or liability |
| • | | Level 2—other significant observable inputs (including quoted prices for a similar asset or liability in active markets, interest rates and yield curves, prepayment speeds, credit risk, etc.) |
| • | | Level 3—significant unobservable inputs (including the Fund’s own assumptions about the assumptions that market participants would use in measuring fair value of an asset or liability) |
The level of an asset or liability within the fair value hierarchy is based on the lowest level of an input, both individually and in the aggregate, that is significant to the fair value measurement. As of October 31, 2016, the aggregate value by input level of the Fund’s assets and liabilities is included at the end of the Fund’s Portfolio of Investments.
The Fund may use third party vendor evaluations, whose prices may be derived from one or more of the following standard inputs, among others:
| | |
• Benchmark yields | | • Reported trades |
• Broker/dealer quotes | | • Issuer spreads |
• Two-sided markets | | • Benchmark securities |
• Bids/offers | | • Reference data (corporate actions or material event notices) |
• Industry and economic events | | • Comparable bonds |
• Equity and credit default swap curves | | • Monthly payment information |
An asset or liability for which market values cannot be measured using the methodologies described above is valued by methods deemed reasonable in good faith by the Valuation Committee, following the procedures established by the Board, to represent fair value. Under these procedures, the Fund generally uses a market-based approach which may use related or comparable assets or liabilities, recent transactions, market multiples, book values, and other relevant information. The Fund may also use an income-based valuation approach in which the anticipated future cash flows of the asset or liability are discounted to calculate fair value. Discounts may also be applied due to the nature and/or duration of any restrictions on the disposition of the asset or liability. Fair value represents a good faith approximation of the value of a security. Fair value determinations involve the consideration of a number of subjective factors, an analysis of applicable facts and circumstances and the exercise of judgment. As a result, it is possible that the fair value for a security determined in good faith in accordance with the Fund’s valuation procedures may differ from valuations for the
same security determined by other funds using their own valuation procedures. Although the Fund’s valuation procedures are designed to value a security at the price the Fund may reasonably expect to receive upon its sale in an orderly transaction, there can be no assurance that any fair value determination thereunder would, in fact, approximate the amount that the Fund would actually realize upon the sale of the security or the price at which the security would trade if a reliable market price were readily available. During the year ended October 31, 2016, there were no material changes to the fair value methodologies.
Equity and non-equity securities which may be valued in this manner include, but are not limited to: (i) a security for which trading has been halted or suspended; (ii) a debt security that has recently gone into default and for which there is not a current market quotation; (iii) a security of an issuer that has entered into a restructuring; (iv) a security that has been de-listed from a national exchange; (v) a security for which the market price is not readily available from a third party pricing source or, if so provided, does not, in the opinion of the Manager or Subadvisor reflect the security’s market value; (vi) a security subject to trading collars for which no or limited trading takes place; and (vii) a security whose principal market has been temporarily closed at a time when, under normal conditions, it would be open. Securities for which market quotations or observable inputs are not readily available are generally categorized as Level 3 in the hierarchy. As of October 31, 2016, securities that were fair valued in such a manner are shown in the Portfolio of Investments.
Equity securities and shares of Exchange-Traded Funds (“ETFs”) are valued at the last quoted sales prices as of the close of regular trading on the relevant exchange on each valuation date. Securities that are not traded on the valuation date are valued at the mean of the last quoted bid and ask prices. Prices are normally taken from the principal market in which each security trades. Futures contracts are valued at the last posted settlement price on the market where such futures are primarily traded. Options contracts are valued at the last posted settlement price on the market where such options are primarily traded. Investments in mutual funds, including money market funds, are valued at their respective NAVs as of the close of the Exchange on the valuation date. These securities are generally categorized as Level 1 in the hierarchy.
Debt securities (other than convertible and municipal bonds) are valued at the evaluated bid prices (evaluated mean prices in the case of convertible and municipal bonds) supplied by a pricing agent or brokers selected by the Manager, in consultation with the Subadvisor. Those values reflect broker/dealer supplied prices and electronic data processing techniques, if the evaluated bid or mean prices are deemed by the Manager, in consultation with the Subadvisor, to be representative of market values, at the regular close of trading of the Exchange on each valuation date. Debt securities purchased on a delayed delivery basis are marked to market daily until settlement at the forward settlement date. Debt securities, including corporate bonds, U.S. government & federal agency bonds, municipal bonds, foreign bonds, convertible bonds, asset-backed securities and mortgage-backed securities are generally categorized as Level 2 in the hierarchy.
Temporary cash investments acquired in excess of 60 days to maturity at the time of purchase are valued using the latest bid prices or using valuations based on a matrix system (which considers such factors as security prices, yields, maturities, and ratings), both as furnished by independent pricing services. Other temporary cash investments which
| | |
| 32 | | MainStay Unconstrained Bond Fund |
mature in 60 days or less at the time of purchase (“Short-Term Investments”) are valued using the amortized cost method of valuation, unless the use of such method would be inappropriate. The amortized cost method involves valuing a security at its cost on the date of purchase and thereafter assuming a constant amortization to maturity of the difference between such cost and the value on maturity date. Amortized cost approximates the current fair value of a security. Securities valued using the amortized cost method are not valued using quoted prices in an active market and are generally categorized as Level 2 in the hierarchy.
Foreign currency forward contracts are valued at their fair market values measured on the basis of the mean between the last current bid and ask prices based on dealer or exchange quotations and are generally categorized as Level 2 in the hierarchy.
Loan assignments, participations and commitments are valued at the average of bid quotations obtained from the engaged independent pricing service and are generally categorized as Level 2 in the hierarchy. Certain loan assignments, participations and commitments may be valued by utilizing significant unobservable inputs obtained from the pricing service and are generally categorized as Level 3 in the hierarchy. As of October 31, 2016, the Fund held Level 3 securities with a value of $19,572,887 that were valued by utilizing significant unobservable inputs.
Swaps are marked to market daily based upon quotations from pricing agents, brokers, or market makers. These securities are generally categorized as Level 2 in the hierarchy.
The information above is not intended to reflect an exhaustive list of the methodologies that may be used to value portfolio investments. The valuation procedures permit the use of a variety of valuation methodologies in connection with valuing portfolio investments. The methodology used for a specific type of investment may vary based on the market data available or other considerations. The methodologies summarized above may not represent the specific means by which portfolio investments are valued on any particular business day.
A Fund security or other asset may be determined to be illiquid under procedures approved by the Board. Illiquidity of a security might prevent the sale of such security at a time when the Manager or Subadvisor might wish to sell, and these securities could have the effect of decreasing the overall level of the Fund’s liquidity. Further, the lack of an established secondary market may make it more difficult to value illiquid securities, requiring the Fund to rely on judgments that may be somewhat subjective in measuring value, which could vary materially from the amount that the Fund could realize upon disposition. Difficulty in selling illiquid securities may result in a loss or may be costly to the Fund. Under the supervision of the Board, the Manager or Subadvisor determines the liquidity of the Fund’s investments; in doing so, the Manager or Subadvisor may consider various factors, including (i) the frequency of trades and quotations, (ii) the number of dealers and prospective purchasers, (iii) dealer undertakings to make a market, and (iv) the nature of the security and the market in which it trades (e.g., the time needed to dispose of the security, the method of soliciting offers and the mechanics of transfer). Illiquid securities are often valued in accordance with methods deemed by the Board in good faith to be reasonable and appropriate to accurately reflect their fair value. The liquidity of the Fund’s investments, as shown in the Portfolio of
Investments, was determined as of October 31, 2016 and can change at any time in response to, among other relevant factors, market conditions or events or developments with respect to an individual issuer or instrument.
(B) Income Taxes. The Fund’s policy is to comply with the requirements of the Internal Revenue Code of 1986, as amended (the “Internal Revenue Code”), applicable to regulated investment companies and to distribute all of its taxable income to the shareholders of the Fund within the allowable time limits. Therefore, no federal, state and local income tax provisions are required.
Management evaluates the Fund’s tax positions to determine if the tax positions taken meet the minimum recognition threshold in connection with accounting for uncertainties in income tax positions taken or expected to be taken for the purposes of measuring and recognizing tax liabilities in the financial statements. Recognition of tax benefits of an uncertain tax position is permitted only to the extent the position is “more likely than not” to be sustained assuming examination by taxing authorities. Management has analyzed the Fund’s tax positions taken on federal, state and local income tax returns for all open tax years (for up to three tax years), and has concluded that no provisions for federal, state and local income tax are required in the Fund’s financial statements. The Fund’s federal, state and local income and federal excise tax returns for tax years for which the applicable statutes of limitations have not expired are subject to examination by the Internal Revenue Service and state and local departments of revenue.
(C) Foreign Taxes. The Fund may be subject to foreign taxes on income and other transaction-based taxes imposed by certain countries in which it invests. A portion of the taxes on gains on investments or currency purchases/repatriation may be recoverable. The Fund will accrue such taxes and recoveries as applicable, based upon its current interpretation of tax rules and regulations that exist in the markets in which it invests.
(D) Dividends and Distributions to Shareholders. Dividends and distributions are recorded on the ex-dividend date. The Fund intends to declare and pay dividends from net investment income, if any, at least monthly and distributions from net realized capital and currency gains, if any, at least annually. Unless the shareholder elects otherwise, all dividends and distributions are reinvested in the same class of shares of the Fund, at NAV. Dividends and distributions to shareholders are determined in accordance with federal income tax regulations and may differ from GAAP.
(E) Security Transactions and Investment Income. The Fund records security transactions on the trade date. Realized gains and losses on security transactions are determined using the identified cost method. Dividend income is recognized on the ex-dividend date; net of any foreign tax withheld at the source, and interest income is accrued as earned using the effective interest rate method and includes any realized gains and losses from repayments of principal on mortgage-backed securities. Discounts and premiums on securities purchased, other than Short-Term Investments, for the Fund are accreted and amortized, respectively, on the effective interest rate method over the life of the respective securities. Discounts and premiums on Short-Term Investments are accreted and amortized, respectively, on the straight-line method. The straight-line method approximates the effective
Notes to Financial Statements (continued)
interest method for short-term investments. Income from payment-in-kind securities is accreted daily based on the effective interest method.
Investment income and realized and unrealized gains and losses on investments of the Fund are allocated to separate classes of shares pro rata based upon their relative net assets on the date the income is earned or realized and unrealized gains and losses are incurred.
The Fund may place a debt security on non-accrual status and reduce related interest income by ceasing current accruals and writing off all or a portion of any interest receivables when the collection of all or a portion of such interest has become doubtful. A debt security is removed from non-accrual status when the issuer resumes interest payments or when collectability of interest is reasonably assured.
(F) Expenses. Expenses of the Trust are allocated to the individual Funds in proportion to the net assets of the respective Funds when the expenses are incurred, except where direct allocations of expenses can be made. Expenses (other than transfer agent expenses and fees incurred under the shareholder services plans and/or the distribution plans further discussed in Note 3(B)) are allocated to separate classes of shares pro rata based upon their relative net assets on the date the expenses are incurred. The expenses borne by the Fund, including those of related parties to the Fund, are shown in the Statement of Operations.
(G) Use of Estimates. In preparing financial statements in conformity with GAAP, management makes estimates and assumptions that affect the reported amounts and disclosures in the financial statements. Actual results could differ from those estimates.
(H) Repurchase Agreements. The Fund may enter into repurchase agreements to earn income. The Fund may enter into repurchase agreements only with financial institutions that are deemed by the Manager or Subadvisor to be creditworthy, pursuant to guidelines established by the Board. During the term of any repurchase agreement, the Manager or Subadvisor will continue to monitor the creditworthiness of the seller. Under the 1940 Act, repurchase agreements are considered to be collateralized loans by the Fund to the seller secured by the securities transferred to the Fund.
When the Fund enters into repurchase agreements, the Fund’s custodian takes possession of the collateral pledged for investments in the repurchase agreement. The underlying collateral is valued daily on a mark to market basis to determine if the value, including accrued interest, exceeds the repurchase price. In the event of the seller’s default on the obligation to repurchase, the Fund has the right to liquidate the collateral and apply the proceeds in satisfaction of the obligation. Under certain circumstances, such as in the event of default or bankruptcy by the counterparty to the agreement, realization and/or retention of the collateral may be subject to legal proceedings and possible realized loss to the Fund.
(I) Futures Contracts. A futures contract is an agreement to purchase or sell a specified quantity of an underlying instrument at a specified future date and price, or to make or receive a cash payment based on the value of a financial instrument (e.g., foreign currency, interest rate, security, or securities index). The Fund is subject to risks such as market price risk and/or interest rate risk in the normal course of investing in these transactions. Upon entering into a futures contract, the
Fund is required to pledge to the broker or futures commission merchant an amount of cash and/or U.S. Government securities equal to a certain percentage of the collateral amount, known as the “initial margin.” During the period the futures contract is open, changes in the value of the contract are recognized as unrealized appreciation or depreciation by marking to market such contract on a daily basis to reflect the market value of the contract at the end of each day’s trading. The Fund agrees to receive from or pay to the broker or futures commission merchant an amount of cash equal to the daily fluctuation in the value of the contract. Such receipts or payments are known as ‘‘variation margin.’’ When the futures contract is closed, the Fund records a realized gain or loss equal to the difference between the proceeds from (or cost of) the closing transaction and the Fund’s basis in the contract.
The use of futures contracts involves, to varying degrees, elements of market risk in excess of the amount recognized in the Statement of Assets and Liabilities. The contract or notional amounts and variation margin reflect the extent of the Fund’s involvement in open futures positions. There are several risks associated with the use of futures contracts as hedging techniques. There can be no assurance that a liquid market will exist at the time when the Fund seeks to close out a futures contract. If no liquid market exists, the Fund would remain obligated to meet margin requirements until the position is closed. Futures may involve a small initial investment relative to the risk assumed, which could result in losses greater than if they had not been used. Futures may be more volatile than direct investments in the instrument underlying the futures, and may not correlate to the underlying instrument, causing a given hedge not to achieve its objectives. The Fund’s activities in futures contracts have minimal counterparty risk as they are conducted through regulated exchanges that guarantee the futures against default by the counterparty. In the event of a bankruptcy or insolvency of a futures commission merchant that holds margin on behalf of the Fund, the Fund may not be entitled to the return of the entire margin owed to the Fund, potentially resulting in a loss. The Fund may invest in futures contracts to help manage the duration and yield curve of the portfolio while minimizing the exposure to wider bid/ask spreads in traditional bonds. The Fund’s investment in futures contracts and other derivatives may increase the volatility of the Fund’s NAV and may result in a loss to the Fund.
(J) Loan Assignments, Participations and Commitments. The Fund may invest in loan assignments and participations (“loans”). Commitments are agreements to make money available to a borrower in a specified amount, at a specified rate and within a specified time. The Fund records an investment when the borrower withdraws money on a commitment or when a funded loan is purchased (trade date) and records interest as earned. These loans pay interest at rates that are periodically reset by reference to a base lending rate plus a spread. These base lending rates are generally the prime rate offered by a designated U.S. bank or the London InterBank Offered Rate.
The loans in which the Fund may invest are generally readily marketable, but may be subject to some restrictions on resale. For example, the Fund may be contractually obligated to receive approval from the agent bank and/or borrower prior to the sale of these investments. If the Fund purchases an assignment from a lender, the Fund will generally have direct contractual rights against the borrower in favor of the lender.
| | |
| 34 | | MainStay Unconstrained Bond Fund |
If the Fund purchases a participation interest either from a lender or a participant, the Fund typically will have established a direct contractual relationship with the seller of the participation interest, but not with the borrower. Consequently, the Fund is subject to the credit risk of the lender or participant who sold the participation interest to the Fund, in addition to the usual credit risk of the borrower. In the event that the borrower, selling participant or intermediate participants become insolvent or enters into bankruptcy, the Fund may incur certain costs and delays in realizing payment, or may suffer a loss of principal and/or interest.
Unfunded commitments represent the remaining obligation of the Fund to the borrower. At any point in time, up to the maturity date of the issue, the borrower may demand the unfunded portion. Unfunded amounts, if any, are marked to market and any unrealized gains or losses are recorded in the Statement of Assets and Liabilities. As of October 31, 2016, the Fund did not hold any unfunded commitments.
(K) Swap Contracts. The Fund may enter into credit default, interest rate, equity, index and currency exchange rate contracts (“swaps”). In a typical swap transaction, two parties agree to exchange the future returns (or differentials in rates of future returns) earned or realized at periodic intervals on a particular investment or instrument based on a notional principal amount. Generally, the Fund will enter into a swap on a net basis, which means that the two payment streams under the swap are netted, with the Fund receiving or paying (as the case may be) only the net amount of the two payment streams. Therefore, the Fund’s current obligation under a swap generally will be equal to the net amount to be paid or received under the swap, based on the relative value of notional positions attributable to each counterparty to the swap. The payments may be adjusted for transaction costs, interest payments, the amount of interest paid on the investment or instrument or other factors. Collateral, in the form of cash or securities, may be required to be held in segregated accounts with the custodian bank or broker in accordance with the terms of the swap. Swap agreements are privately negotiated in the over the counter market (“OTC swaps”) and may be executed in a multilateral or other trade facilities platform, such as a registered commodities exchange (“centrally cleared swaps”).
Certain standardized swaps, including certain credit default and interest rate swaps, are subject to mandatory clearing, and more types of standardized swaps are expected to be subject to mandatory clearing and exchange-trading, in the future. The counterparty risk for exchange-traded and cleared derivatives is expected to be generally lower than for uncleared derivatives, but cleared contracts are not risk-free. In a cleared derivative transaction, the Fund typically enters into the transaction with a financial institution counterparty, and performance of the transaction is effectively guaranteed by a central clearinghouse, thereby reducing or eliminating the Fund’s exposure to the credit risk of its original counterparty. The Fund will be required to post specified levels of margin with the clearinghouse or at the instruction of the clearinghouse; the margin required by a clearinghouse may be greater than the margin the Fund would be required to post in an uncleared transaction. As of October 31, 2016, all swap positions outstanding are shown in the Portfolio of Investments.
Swaps are marked to market daily based upon quotations from pricing agents, brokers, or market makers and the change in value, if any, is recorded as unrealized appreciation or depreciation. Any payments
made or received upon entering into a swap would be amortized or accreted over the life of the swap and recorded as a realized gain or loss. Early termination of a swap is recorded as a realized gain or loss. Daily changes in valuation of centrally cleared swaps, if any, are recorded as a receivable or payable for the change in value as appropriate (“variation margin”) on the Statement of Assets and Liabilities.
The Fund bears the risk of loss of the amount expected to be received under a swap in the event of the default or bankruptcy of the swap counterparty. The Fund may be able to eliminate its exposure under a swap either by assignment or other disposition, or by entering into an offsetting swap with the same party or a similar credit-worthy party. Swaps are not actively traded on financial markets. Entering into swaps involves elements of credit, market, and documentation risk in excess of the amounts recognized on the Statement of Assets and Liabilities. Such risks involve the possibilities that there will be no liquid market for these swaps, that the counterparty to the swaps may default on its obligation to perform or disagree as to the meaning of the contractual terms in the swaps and that there may be unfavorable changes in interest rates, the price of the index or the security underlying these transactions.
Interest Rate Swaps: An interest rate swap is an agreement between two parties where one stream of future interest payments is exchanged for another based on a specified principal amount. Interest rate swaps often exchange a fixed payment for a floating payment that is linked to an interest rate (most often the London InterBank Offered Rate (“LIBOR”)). The Fund will typically use interest rate swaps to limit, or manage, its exposure to fluctuations in interest rates, or to obtain a marginally lower interest rate than it would have been able to get without the swap.
Credit Default Swaps: The Fund may enter into credit default swaps to simulate long and short bond positions or to take an active long or short position with respect to the likelihood of a default or credit event by the issuer of the underlying reference obligation. The types of reference obligations underlying the swaps that may be entered into by the Fund include debt obligations of a single issuer of corporate or sovereign debt, a basket of obligations of different issuers or a credit index. A credit index is an equally-weighted credit default swap index that is designed to track a representative segment of the credit default swap market (e.g., investment grade, high volatility, below investment grade or emerging markets) and provides an investor with exposure to specific “baskets” of issuers of certain debt instruments. Index credit default swaps have standardized terms including a fixed spread and standard maturity dates. The composition of the obligations within a particular index changes periodically. Credit default swaps involve one party, the protection buyer, making a stream of payments to another party, the protection seller, in exchange for the right to receive a contingent payment if there is a credit event related to the underlying reference obligation. In the event that the reference obligation matures prior to the termination date of the contract, a similar security will be substituted for the duration of the contract term. Credit events are defined under individual swap agreements and generally include bankruptcy, failure to pay, restructuring, repudiation/moratorium, obligation acceleration and obligation default. Selling protection effectively adds leverage to a portfolio up to the notional amount of the swap agreement. Potential liabilities under these contracts may be reduced by: the auction rates of the underlying reference obligations; upfront payments received at the
Notes to Financial Statements (continued)
inception of a swap; and net amounts received from credit default swaps purchased with the identical reference obligation.
(L) Foreign Currency Forward Contracts. The Fund may enter into foreign currency forward contracts, which are agreements to buy or sell foreign currencies on a specified future date at a specified rate. The Fund is subject to foreign currency exchange rate risk in the normal course of investing in these transactions. During the period the forward contract is open, changes in the value of the contract are recognized as unrealized appreciation or depreciation by marking to market such contract on a daily basis to reflect the market value of the contract at the end of each day’s trading. Cash movement occurs on settlement date. When the forward contract is closed, the Fund records a realized gain or loss equal to the difference between the proceeds from (or cost of) the closing transaction and the Fund’s basis in the contract. The Fund may purchase and sell foreign currency forward contracts for purposes of seeking to enhance portfolio returns and manage portfolio risk more efficiently. Foreign currency forward contracts may also be used to gain exposure to a particular currency or to hedge against the risk of loss due to changing currency exchange rates. Foreign currency forward contracts to purchase or sell a foreign currency may also be used in anticipation of future purchases or sales of securities denominated in foreign currency, even if the specific investments have not yet been selected.
The use of foreign currency forward contracts involves, to varying degrees, elements of risk in excess of the amount recognized in the Statement of Assets and Liabilities, including counterparty risk, market risk, and illiquidity risk. Counterparty risk is heightened for these instruments because foreign currency forward contracts are not exchange-traded and therefore no clearinghouse or exchange stands ready to meet the obligations under such contracts. Thus, the Fund faces the risk that its counterparties under such contracts may not perform their obligations. Market risk is the risk that the value of a foreign currency forward contract will depreciate due to unfavorable changes in exchange rates. Illiquidity risk arises because the secondary market for foreign currency forward contracts may have less liquidity relative to markets for other securities and financial instruments. Risks also arise from the possible movements in the foreign exchange rates underlying these instruments. While the Fund may enter into forward contracts to reduce currency exchange risks, changes in currency exchange rates may result in poorer overall performance for the Fund than if it had not engaged in such transactions. Exchange rate movements can be large, depending on the currency, and can last for extended periods of time, affecting the value of the Fund’s assets. Moreover, there may be an imperfect correlation between the Fund’s holdings of securities denominated in a particular currency and the forward contracts entered into by the Fund. Such imperfect correlation may prevent the Fund from achieving the intended hedge or expose the Fund to the risk of currency exchange loss. The unrealized appreciation (depreciation) on forward contracts also reflects the Fund’s exposure at the valuation date to credit loss in the event of a counterparty’s failure to perform its obligations.
(M) Foreign Currency Transactions. The Fund’s books and records are maintained in U.S. dollars. Prices of securities denominated in foreign currency amounts are translated into U.S. dollars at the mean
between the buying and selling rates last quoted by any major U.S. bank at the following dates:
| (i) | market value of investment securities, other assets and liabilities—at the valuation date; and |
| (ii) | purchases and sales of investment securities, income and expenses—at the date of such transactions. |
The assets and liabilities that are denominated in foreign currency amounts are presented at the exchange rates and market values at the close of the period. The realized and unrealized changes in net assets arising from fluctuations in exchange rates and market prices of securities are not separately presented.
Net realized gain (loss) on foreign currency transactions represents net gains and losses on foreign currency forward contracts, net currency gains or losses realized as a result of differences between the amounts of securities sale proceeds or purchase cost, dividends, interest and withholding taxes as recorded on the Fund’s books, and the U.S. dollar equivalent amount actually received or paid. Net currency gains or losses from valuing such foreign currency denominated assets and liabilities, other than investments at valuation date exchange rates, are reflected in unrealized foreign exchange gains or losses.
(N) Rights and Warrants. Rights are certificates that permit the holder to purchase a certain number of shares, or a fractional share, of a new stock from the issuer at a specific price. Warrants are instruments that entitle the holder to buy an equity security at a specific price for a specific period of time. These investments can provide a greater potential for profit or loss than an equivalent investment in the underlying security. Prices of these investments do not necessarily move in tandem with the prices of the underlying securities.
There is risk involved in the purchase of rights and warrants in that these investments are speculative investments. The Fund could also lose the entire value of its investment in warrants if such warrants are not exercised by the date of its expiration. The Fund is exposed to risk until the sale or exercise of each right or warrant is completed. As of October 31, 2016, the Fund did not hold any rights.
(O) Securities Sold Short. The Fund engages in sales of securities it does not own (“short sales”) as part of its investment strategy. When the Fund enters into a short sale, it must segregate or maintain with a broker the cash proceeds from the security sold short or other securities as collateral for its obligation to deliver the security upon conclusion of the sale. During the period a short position is open, depending on the nature and type of security, a short position is reflected as a liability and is marked to market in accordance with the valuation methodologies previously detailed (See Note 2(A)). Liabilities for securities sold short are closed out by purchasing the applicable securities for delivery to the counterparty broker. A gain, limited to the price at which the Fund sold the security short, or a loss, unlimited as to dollar amount, will be recognized upon termination of a short sale if the market price on the date the short position is closed out is less or greater, respectively, than the proceeds originally received. Any such gain or loss may be offset, completely or in part, by the change in the value of the hedged investments. Interest on short positions held is accrued daily, while dividends declared on short positions existing on the record date are recorded on the ex-dividend date as a dividend expense in the Statement of
| | |
| 36 | | MainStay Unconstrained Bond Fund |
Operations. Broker fees and other expenses related to securities sold short are disclosed in the Statement of Operations. Short sales involve risk of loss in excess of the related amounts reflected in the Statement of Assets and Liabilities.
(P) Securities Lending. In order to realize additional income, the Fund may engage in securities lending, subject to the limitations set forth in the 1940 Act and relevant guidance by the staff of the Securities and Exchange Commission (“SEC”). In the event the Fund does engage in securities lending, the Fund will lend through its custodian, State Street Bank and Trust Company (“State Street”). State Street will manage the Fund’s cash collateral in accordance with the lending agreement between the Fund and State Street, and indemnify the Fund against counterparty risk. The loans will be collateralized by cash or securities at least equal at all times to the market value of the securities loaned. Collateral will consist of U.S. government securities, cash equivalents or irrevocable letters of credit. The Fund may bear the risk of delay in recovery of, or loss of rights in, the securities loaned should the borrower of the securities experience financial difficulty. The Fund may also record a realized gain or loss on securities deemed sold due to a borrower’s inability to return securities on loan. The Fund bears the risk of any loss on investment of the collateral. The Fund will receive compensation for lending its securities in the form of fees or it will retain a portion of interest on the investment of any cash received as collateral. The Fund will also continue to receive interest and dividends on the securities loaned and any gain or loss in the market price of the securities loaned that may occur during the term of the loan will be for the account of the Fund. During the year ended October 31, 2016, the Fund did not have any portfolio securities on loan.
(Q) Restricted Securities. Restricted securities, as disclosed in Note 5, are securities which have been purchased through a private offering and cannot be resold to the general public without prior registration under the Securities Act of 1933, as amended. Disposal of these securities may involve time-consuming negotiations and expenses, and it may be difficult to obtain a prompt sale at an acceptable price.
(R) Securities Risk. The Fund’s principal investments include high-yield debt securities (commonly referred to as ‘‘junk bonds’’), which are considered speculative because they present a greater risk of loss, including default, than higher quality debt securities. These securities pay investors a premium—a higher interest rate or yield than investment grade debt securities—because of the increased risk of loss. These securities can also be subject to greater price volatility. In times of unusual or adverse market, economic or political conditions, these securities may experience higher than normal default rates.
The Fund may invest in foreign securities, which carry certain risks that are in addition to the usual risks inherent in domestic securities. These risks include those resulting from currency fluctuations, future adverse political or economic developments and possible imposition of currency exchange blockages or other foreign governmental laws or restrictions. These risks are likely to be greater in emerging markets than in developed markets. The ability of issuers of debt securities held by the Fund to meet their obligations may be affected by economic or political developments in a specific country, industry or region.
(S) Counterparty Credit Risk. In order to better define its contractual rights and to secure rights that will help the Fund mitigate its
counterparty risk, the Fund may enter into an International Swaps and Derivatives Association, Inc. Master Agreement (“ISDA Master Agreement”) or similar agreement with its counterparties. An ISDA Master Agreement is a bilateral agreement between the Fund and a counterparty that governs certain OTC derivatives and typically contains collateral posting terms and netting provisions. Under an ISDA Master Agreement, the Fund may, under certain circumstances, offset with the counterparty certain derivative financial instruments’ payables and/or receivables with collateral held and/or posted and create one single net payment. The provisions of the ISDA Master Agreement typically permit a single net payment in the event of default including the bankruptcy or insolvency of the counterparty. Bankruptcy or insolvency laws of a particular jurisdiction may restrict or prohibit the right of offset in bankruptcy, insolvency or other events. In addition, certain ISDA Master Agreements may contain provisions for early termination of OTC derivative transactions in the event the net assets of the Fund decline below specific levels or if the Fund fails to meet the terms of its ISDA Master Agreements. The result would cause the Fund to accelerate payment of any net liability owed to the counterparty. For financial reporting purposes, the Fund does not offset derivative assets and derivative liabilities that are subject to netting arrangements, if any, in the Statement of Assets and Liabilities.
(T) Indemnifications. Under the Trust’s organizational documents, its officers and trustees are indemnified against certain liabilities that may arise out of performance of their duties to the Trust. Additionally, in the normal course of business, the Fund enters into contracts with third-party service providers that contain a variety of representations and warranties and which may provide general indemnifications. The Fund’s maximum exposure under these arrangements is unknown, as this would involve future claims that may be made against the Fund that have not yet occurred. Based on experience, management is of the view that the risk of loss in connection with these potential indemnification obligations is remote. However, there can be no assurance that material liabilities related to such obligations will not arise in the future, which could adversely impact the Fund.
(U) Quantitative Disclosure of Derivative Holdings. The following tables show additional disclosures related to the Fund’s derivative and hedging activities, including how such activities are accounted for and their effect on the Fund’s financial positions, performance and cash flows. The Fund invested in futures contracts to help manage the duration and yield curve of the portfolio while minimizing the exposure to wider bid/ask spreads in traditional bonds. The Fund invested in interest rate and credit default swap contracts in order to obtain a desired return at a lower cost to the Fund, rather than directly investing in an instrument yielding that desired return or to hedge against credit and interest rate risk. The Fund also invested in foreign currency forward contracts to gain exposure to a particular currency or to hedge against the risk of loss due to changing currency exchange rates. These derivatives are not accounted for as hedging instruments.
Notes to Financial Statements (continued)
Fair value of derivative instruments as of October 31, 2016:
Asset Derivatives
| | | | | | | | | | | | | | | | | | |
| | | Statement of
Assets and Liabilities
Location | | Credit
Contracts
Risk | | | Foreign
Exchange
Contracts
Risk | | | Interest
Rate
Contracts
Risk | | | Total | |
Futures Contracts | | Net Assets—Net unrealized
appreciation (depreciation) on investments and futures contracts (a) | | $ | — | | | $ | — | | | $ | 1,626,085 | | | $ | 1,626,085 | |
Swap Contracts | | Net Assets—Net unrealized
appreciation (depreciation) on investments and futures contracts (b) | | | — | | | | — | | | | 5,027,399 | | | | 5,027,399 | |
Foreign Currency Forward Contracts | | Unrealized appreciation on foreign currency forward contracts | | | — | | | | 2,263,536 | | | | — | | | | 2,263,536 | |
| | | | | | |
Total Fair Value | | | | $ | — | | | $ | 2,263,536 | | | $ | 6,653,484 | | | $ | 8,917,020 | |
| | | | | | |
Liability Derivatives
| | | | | | | | | | | | | | | | | | |
| | | Statement of
Assets and Liabilities
Location | | Credit
Contracts
Risk | | | Foreign
Exchange
Contracts
Risk | | | Interest
Rate
Contracts
Risk | | | Total | |
Futures Contracts | | Net Assets—Net unrealized
appreciation (depreciation) on investments and futures contracts (a) | | $ | — | | | $ | — | | | $ | (232,002 | ) | | $ | (232,002 | ) |
Swap Contracts | | Net Assets—Net unrealized
appreciation (depreciation) on investments and futures contracts (b) | | | (265,032 | ) | | | — | | | | — | | | | (265,032 | ) |
Foreign Currency Forward Contracts | | Unrealized depreciation on foreign currency forward contracts | | | — | | | | (95,236 | ) | | | — | | | | (95,236 | ) |
| | | | | | |
Total Fair Value | | | | $ | (265,032 | ) | | $ | (95,236 | ) | | $ | (232,002 | ) | | $ | (592,270 | ) |
| | | | | | |
| (a) | Includes cumulative appreciation (depreciation) of futures contracts as reported in the Portfolio of Investments. Only current day’s variation margin is reported within the Statement of Assets and Liabilities. |
| (b) | Includes cumulative appreciation (depreciation) of centrally cleared swap agreements as reported in the Portfolio of Investments. Only current day’s variation margin of centrally cleared swaps is reported within the Statement of Assets and Liabilities. |
The effect of derivative instruments on the Statement of Operations for the year ended October 31, 2016:
Realized Gain (Loss)
| | | | | | | | | | | | | | | | | | |
| | | Statement of
Operations Location | | Credit
Contracts
Risk | | | Foreign
Exchange
Contracts
Risk | | | Interest
Rate
Contracts
Risk | | | Total | |
Futures Contracts | | Net realized gain (loss) on
futures transactions | | $ | — | | | $ | — | | | $ | (6,840,702 | ) | | $ | (6,840,702 | ) |
Swap Contracts | | Net realized gain (loss) on
swap transactions | | | (371,300 | ) | | | — | | | | (6,944,933 | ) | | | (7,316,233 | ) |
Foreign Currency Forward Contracts | | Net realized gain (loss) on foreign
currency transactions | | | — | | | | 5,254,618 | | | | — | | | | 5,254,618 | |
| | | | | | |
Total Realized Gain (Loss) | | | | $ | (371,300 | ) | | $ | 5,254,618 | | | $ | (13,785,635 | ) | | $ | (8,902,317 | ) |
| | | | | | |
| | |
| 38 | | MainStay Unconstrained Bond Fund |
Change in Unrealized Appreciation (Depreciation)
| | | | | | | | | | | | | | | | | | |
| | | Statement of
Operations
Location | | Credit
Contracts
Risk | | | Foreign
Exchange
Contracts
Risk | | | Interest
Rate
Contracts
Risk | | | Total | |
Futures Contracts | | Net change in unrealized appreciation (depreciation) on futures contracts | | $ | — | | | $ | — | | | $ | 2,536,433 | | | $ | 2,536,433 | |
Swap Contracts | | Net change in unrealized appreciation (depreciation) on swap contracts | | | 797,252 | | | | — | | | | 8,144,730 | | | | 8,941,982 | |
Foreign Currency Forward Contracts | | Net change in unrealized appreciation (depreciation) on translation of other assets and liabilities in foreign currencies and foreign currency forward contracts | | | — | | | | 956,952 | | | | — | | | | 956,952 | |
| | | | | | |
Total Change in Unrealized Appreciation (Depreciation) | | | | $ | 797,252 | | | $ | 956,952 | | | $ | 10,681,163 | | | $ | 12,435,367 | |
| | | | | | |
Average Notional Amount
| | | | | | | | | | | | | | | | |
| | | Credit
Contracts
Risk | | | Foreign
Exchange
Contracts
Risk | | | Interest Rate Contracts Risk | | | Total | |
Futures Contracts Short | | $ | — | | | $ | — | | | $ | (230,754,730 | ) | | $ | (230,754,730 | ) |
Swap Contracts | | $ | 19,207,580 | | | $ | — | | | $ | 2,877,166,667 | | | $ | 2,896,374,247 | |
Foreign Currency Forward Contracts Long (a) | | $ | — | | | $ | 18,618,696 | | | $ | — | | | $ | 18,618,696 | |
Foreign Currency Forward Contracts Short (b) | | $ | — | | | $ | (68,920,560 | ) | | $ | — | | | $ | (68,920,560 | ) |
| | | | | | | | | | | | | | | | |
| (a) | Positions were open nine months during the reporting period. |
| (b) | Positions were open eleven months during the reporting period. |
Note 3–Fees and Related Party Transactions
(A) Manager and Subadvisor. New York Life Investments, a registered investment adviser and an indirect, wholly-owned subsidiary of New York Life Insurance Company (“New York Life”), serves as the Fund’s Manager, pursuant to an Amended and Restated Management Agreement (“Management Agreement”). The Manager provides offices, conducts clerical, recordkeeping and bookkeeping services, and keeps most of the financial and accounting records required to be maintained by the Fund. Except for the portion of salaries and expenses that are the responsibility of the Fund, the Manager pays the salaries and expenses of all personnel affiliated with the Fund and certain operational expenses of the Fund. The Fund reimburses New York Life Investments in an amount equal to a portion of the compensation of the Chief Compliance Officer of the Fund. MacKay Shields LLC (‘‘MacKay Shields” or the “Subadvisor’’), a registered investment adviser and an indirect, wholly-owned subsidiary of New York Life, serves as Subadvisor to the Fund and is responsible for the day-to-day portfolio management of the Fund. Pursuant to the terms of the Amended and Restated Subadvisory Agreement (“Subadvisory Agreement”) between New York Life Investments and MacKay Shields, New York Life Investments pays for the services of the Subadvisor.
Under the Management Agreement, the Fund pays the Manager a monthly fee for services performed and facilities furnished at an annual rate of the Fund’s average daily net assets as follows: 0.60% up to $500 million; 0.55% from $500 million to $1 billion; 0.50% from $1 billion to $5 billion; and 0.475% in excess of $5 billion, plus a fee for fund accounting services previously provided by New York Life
Investments under a separate fund accounting agreement furnished at an annual rate of the Fund’s average daily net assets as follows: 0.05% up to $20 million; 0.0333% from $20 million to $100 million; and 0.01% in excess of $100 million. During the year ended October 31, 2016, the effective management fee rate was 0.56%, inclusive of a fee for fund accounting services of 0.01% of the Fund’s average daily net assets.
During the year ended October 31, 2016, New York Life Investments earned fees from the Fund in the amount of $9,086,349.
State Street provides sub-administration and sub-accounting services to the Fund pursuant to an agreement with New York Life Investments. These services include calculating the daily NAVs of the Fund, maintaining the general ledger and sub-ledger accounts for the calculation of the Fund’s NAVs, and assisting New York Life Investments in conducting various aspects of the Fund’s administrative operations. For providing these services to the Fund, State Street is compensated by New York Life Investments.
(B) Distribution, Service and Shareholder Service Fees. The Trust, on behalf of the Fund, has entered into a distribution agreement with NYLIFE Distributors LLC (the ‘‘Distributor’’), an indirect, wholly-owned subsidiary of New York Life. The Fund has adopted distribution plans (the ‘‘Plans’’) in accordance with the provisions of Rule 12b-1 under the 1940 Act.
Pursuant to the Class A, Investor Class and Class R2 Plans, the Distributor receives a monthly distribution fee from the Class A, Investor Class and Class R2 shares at an annual rate of 0.25% of the average daily net
Notes to Financial Statements (continued)
assets of the Class A, Investor Class and Class R2 shares for distribution and/or service activities as designated by the Distributor. Pursuant to the Class B and Class C Plans, Class B and Class C shares pay the Distributor a monthly distribution fee at an annual rate of 0.75% of the average daily net assets of the Class B and Class C shares, along with a service fee at an annual rate of 0.25% of the average daily net assets of the Class B and Class C shares, for a total 12b-1 fee of 1.00%. Pursuant to the Class R3 Plan, the Distributor receives a monthly distribution and/or service fee from the Class R3 shares at an annual rate of 0.50% of the average daily net assets of the Class R3 shares. Class I shares are not subject to a distribution and/or service fee.
The Plans provide that the distribution and service fees are payable to the Distributor regardless of the amounts actually expended by the Distributor for distribution of the Fund’s shares and service activities.
In accordance with the Shareholder Services Plan for the Class R2 shares, the Manager has agreed to provide, through its affiliates or independent third parties, various shareholder and administrative support services to shareholders of the Class R2 shares. For its services, the Manager, its affiliates or independent third party service providers are entitled to a Shareholder Service Fee accrued daily and paid monthly at an annual rate of 0.10% of the average daily net assets of the Class R2 shares. This is in addition to any fees paid under a distribution plan, where applicable.
(C) Sales Charges. During the year ended October 31, 2016, the Fund was advised by the Distributor that the amount of initial sales charges retained on sales of Class A and Investor Class shares were $40,862 and $12,925, respectively. During the year ended October 31, 2016, the Fund was also advised that the Distributor retained CDSCs on redemptions of Class A, Investor Class, Class B and Class C shares of $8,321, $3, $30,715 and $29,673, respectively.
(D) Transfer, Dividend Disbursing and Shareholder Servicing Agent. NYLIM Service Company LLC, an affiliate of New York Life Investments, is the Fund’s transfer, dividend disbursing and shareholder servicing agent pursuant to an agreement between NYLIM Service Company LLC and the Trust. NYLIM Service Company LLC has entered into an agreement with Boston Financial Data Services, Inc. (“BFDS”) pursuant to which BFDS performs certain transfer agent services on behalf of NYLIM Service Company LLC. During the year ended October 31, 2016, transfer agent expenses incurred by the Fund were as follows:
| | | | |
Class A | | $ | 712,206 | |
Investor Class | | | 55,197 | |
Class B | | | 32,133 | |
Class C | | | 448,788 | |
Class I | | | 1,325,234 | |
Class R2 | | | 159 | |
Class R3 | | | 29 | |
(E) Small Account Fee. Shareholders with small accounts adversely impact the cost of providing transfer agency services. In an effort to reduce total transfer agency expenses, the Fund has implemented a small account fee on certain types of accounts. Certain
shareholders with an account balance of less than $1,000 are charged an annual per account fee of $20 (assessed semi-annually), the proceeds from which offset transfer agent fees as reflected in the Statement of Operations.
(F) Capital. As of October 31, 2016, New York Life and its affiliates beneficially held shares of the Fund with values and percentages of net assets as follows:
| | | | | | | | |
Class A | | $ | 11,697,406 | | | | 2.8 | % |
Class R3 | | | 27,442 | | | | 86.3 | |
Note 4–Federal Income Tax
As of October 31, 2016, the components of accumulated gain (loss) on a tax basis were as follows:
| | | | | | | | | | | | | | |
Ordinary
Income | | Accumulated
Capital and
Other Gain
(Loss) | | Other
Temporary
Differences | | | Unrealized
Appreciation
(Depreciation) | | | Total
Accumulated
Gain (Loss) | |
$9,470,400 | | $(188,887,801) | | $ | (525,367 | ) | | $ | 3,822,074 | | | $ | (176,120,694 | ) |
The difference between book-basis and tax-basis unrealized appreciation (depreciation) is primarily due to wash sale adjustments, mark to market of futures contracts, mark to market of foreign forward contracts, and swap adjustments. The other temporary differences are primarily due to dividends payable.
The following table discloses the current year reclassifications between undistributed net investment income (loss), accumulated net realized gain (loss) on investments, and additional paid-in capital arising from permanent differences; net assets as of October 31, 2016 were not affected.
| | | | | | | | | | |
Undistributed
Net Investment
Income (Loss) | | | Accumulated Net Realized Gain (Loss) on
Investments | | | Additional
Paid-In Capital | |
| $ | (497,980 | ) | | $ | 497,980 | | | $ | — | |
The reclassifications for the Fund are primarily due foreign currency gain (loss), swap adjustments, deemed dividends, and defaulted bonds.
Under the Regulated Investment Company Modernization Act of 2010, the Fund is permitted to carry forward capital losses incurred in taxable years beginning after December 22, 2010, for an unlimited period. However, any losses incurred during those future years will be required to be utilized prior to the losses incurred in pre-enactment tax years. As a result of this ordering rule, pre-enactment capital loss carryforwards may be more likely to expire unused. Additionally, post-enactment capital losses that are carried forward will retain their character as either short-term or long-term capital losses rather than being considered all short-term as under previous law.
As of October 31, 2016, for federal income tax purposes, capital loss carryforwards of $188,830,788 were available as shown in the table below, to the extent provided by the regulations to offset future realized gains of the Fund through the years indicated. To the extent that these capital loss carryforwards are used to offset future capital gains, it is probable that the capital gains so offset will not be distributed to
| | |
| 40 | | MainStay Unconstrained Bond Fund |
shareholders. No capital gain distributions shall be made until any capital loss carryforwards have been fully utilized or expired.
| | | | | | | | |
Capital Loss
Available Through | | Short-Term
Capital Loss
Amounts (000’s) | | | Long-Term
Capital Loss
Amounts (000’s) | |
| 2017 | | $ | 473 | | | $ | — | |
| Unlimited | | | 26,816 | | | | 161,541 | |
| Total | | $ | 27,289 | | | $ | 161,541 | |
During the years ended October 31, 2016 and October 31, 2015, the tax character of distributions paid as reflected in the Statements of Changes in Net Assets was as follows:
| | | | | | | | |
| | | 2016 | | | 2015 | |
Distributions paid from: | | | | | | | | |
Ordinary Income | | $ | 61,146,057 | | | $ | 83,527,070 | |
Note 5–Restricted Securities
As of October 31, 2016, the Fund held the following restricted security:
| | | | | | | | | | | | | | | | | | | | |
Security | | Date of
Acquisition | | | Number of
Shares | | | Cost | | | 10/31/16 Value | | | Percent of
Net Assets | |
ION Media Networks, Inc.
Common Stock | | | 3/11/14 | | | | 22 | | | $ | 34 | | | $ | 11,778 | | | | 0.0 | ‡ |
| ‡ | Less than one-tenth of a percent. |
Note 6–Custodian
State Street is the custodian of cash and securities held by the Fund. Custodial fees are charged to the Fund based on the Fund’s net assets and/or the market value of securities held by the Fund and the number of certain transactions incurred by the Fund.
Note 7–Line of Credit
The Fund and certain other funds managed by New York Life Investments, maintain a line of credit with a syndicate of banks in order to secure a source of funds for temporary purposes to meet unanticipated or excessive redemption requests.
Effective August 2, 2016, under an amended and restated credit agreement (the “Credit Agreement”), the aggregate commitment amount is $600,000,000 with an additional uncommitted amount of $100,000,000. The commitment fee is an annual rate of 0.15% of the average commitment amount payable quarterly, regardless of usage, to Bank of New York Mellon, who serves as the agent to the syndicate. The commitment fee is allocated among the Fund and certain affiliated funds based upon their respective net assets and other factors. Interest on any revolving credit loan is charged based upon the Federal Funds Advances Rate or the one month London InterBank Offered Rate, whichever is higher. The Credit Agreement expires on August 1, 2017, although the Fund, certain affiliated funds and the syndicate of banks may renew the Credit Agreement for an additional year on the same or different terms. Prior to August 2, 2016, the aggregate commitment amount was $600,000,000 with an additional uncommitted amount of $100,000,000, and the commitment fee was at an annual rate of 0.10% of the average commitment amount. During the year ended October 31, 2016, there were no borrowings made or outstanding with respect to the Fund under the Credit Agreement.
Note 8–Interfund Lending Program
Pursuant to an exemptive order issued by the SEC, the Fund, along with certain other funds managed by New York Life Investments, may participate in an interfund lending program. The interfund lending program
provides an alternate credit facility that permits the Fund and certain other funds managed by New York Life Investments to lend or borrow money for temporary purposes directly to or from one another, subject to the conditions of the exemptive order. During the year ended October 31, 2016, there were no interfund loans made or outstanding with respect to the Fund.
Note 9–Purchases and Sales of Securities (in 000’s)
During the year ended October 31, 2016, purchases and sales of securities, other than short-term securities, were $237,193 and $903,955, respectively.
Note 10–Capital Share Transactions
| | | | | | | | |
Class A | | Shares | | | Amount | |
Year ended October 31, 2016: | | | | | | | | |
Shares sold | | | 9,689,567 | | | $ | 82,882,860 | |
Shares issued to shareholders in reinvestment of dividends and distributions | | | 1,776,445 | | | | 15,146,253 | |
Shares redeemed | | | (31,183,466 | ) | | | (265,172,868 | ) |
| | | | |
Net increase (decrease) in shares outstanding before conversion | | | (19,717,454 | ) | | | (167,143,755 | ) |
Shares converted into Class A (See Note 1) | | | 338,252 | | | | 2,910,604 | |
Shares converted from Class A (See Note 1) | | | (779,019 | ) | | | (6,726,023 | ) |
| | | | | | | | |
Net increase (decrease) | | | (20,158,221 | ) | | $ | (170,959,174 | ) |
| | | | | | | | |
Year ended October 31, 2015: | | | | | | | | |
Shares sold | | | 28,450,020 | | | $ | 258,407,016 | |
Shares issued to shareholders in reinvestment of dividends and distributions | | | 2,174,176 | | | | 19,530,531 | |
Shares redeemed | | | (36,415,497 | ) | | | (326,787,137 | ) |
| | | | | | | | |
Net increase (decrease) in shares outstanding before conversion | | | (5,791,301 | ) | | | (48,849,590 | ) |
Shares converted into Class A (See Note 1) | | | 193,550 | | | | 1,750,177 | |
Shares converted from Class A (See Note 1) | | | (273,131 | ) | | | (2,423,227 | ) |
| | | | | | | | |
Net increase (decrease) | | | (5,870,882 | ) | | $ | (49,522,640 | ) |
| | | | | | | | |
Notes to Financial Statements (continued)
| | | | | | | | |
Investor Class | | Shares | | | Amount | |
Year ended October 31, 2016: | | | | | | | | |
Shares sold | | | 402,584 | | | $ | 3,472,246 | |
Shares issued to shareholders in reinvestment of dividends and distributions | | | 132,076 | | | | 1,136,141 | |
Shares redeemed | | | (570,340 | ) | | | (4,903,575 | ) |
| | | | | | | | |
Net increase (decrease) in shares outstanding before conversion | | | (35,680 | ) | | | (295,188 | ) |
Shares converted into Investor Class (See Note 1) | | | 237,630 | | | | 2,063,359 | |
Shares converted from Investor Class (See Note 1) | | | (314,544 | ) | | | (2,729,075 | ) |
| | | | | | | | |
Net increase (decrease) | | | (112,594 | ) | | $ | (960,604 | ) |
| | | | | | | | |
Year ended October 31, 2015: | | | | | | | | |
Shares sold | | | 670,786 | | | $ | 6,136,874 | |
Shares issued to shareholders in reinvestment of dividends and distributions | | | 115,763 | | | | 1,046,718 | |
Shares redeemed | | | (658,661 | ) | | | (5,981,986 | ) |
| | | | �� | | | | |
Net increase (decrease) in shares outstanding before conversion | | | 127,888 | | | | 1,201,606 | |
Shares converted into Investor Class (See Note 1) | | | 351,284 | | | | 3,153,845 | |
Shares converted from Investor Class (See Note 1) | | | (173,263 | ) | | | (1,578,782 | ) |
| | | | | | | | |
Net increase (decrease) | | | 305,909 | | | $ | 2,776,669 | |
| | | | | | | | |
| | |
| | | | | | | | |
Class B | | Shares | | | Amount | |
Year ended October 31, 2016: | | | | | | | | |
Shares sold | | | 257,316 | | | $ | 2,217,439 | |
Shares issued to shareholders in reinvestment of dividends and distributions | | | 55,629 | | | | 472,172 | |
Shares redeemed | | | (407,095 | ) | | | (3,461,954 | ) |
| | | | | | | | |
Net increase (decrease) in shares outstanding before conversion | | | (94,150 | ) | | | (772,343 | ) |
Shares converted from Class B (See Note 1) | | | (102,988 | ) | | | (877,313 | ) |
| | | | | | | | |
Net increase (decrease) | | | (197,138 | ) | | $ | (1,649,656 | ) |
| | | | | | | | |
Year ended October 31, 2015: | | | | | | | | |
Shares sold | | | 353,620 | | | $ | 3,182,670 | |
Shares issued to shareholders in reinvestment of dividends and distributions | | | 53,569 | | | | 479,142 | |
Shares redeemed | | | (455,330 | ) | | | (4,088,289 | ) |
| | | | | | | | |
Net increase (decrease) in shares outstanding before conversion | | | (48,141 | ) | | | (426,477 | ) |
Shares converted from Class B (See Note 1) | | | (100,199 | ) | | | (902,013 | ) |
| | | | | | | | |
Net increase (decrease) | | | (148,340 | ) | | $ | (1,328,490 | ) |
| | | | | | | | |
| | |
| | | | | | | | |
| | | | | | | | |
Class C | | Shares | | | Amount | |
Year ended October 31, 2016: | | | | | | | | |
Shares sold | | | 3,156,329 | | | $ | 26,785,970 | |
Shares issued to shareholders in reinvestment of dividends and distributions | | | 722,783 | | | | 6,125,064 | |
Shares redeemed | | | (15,059,753 | ) | | | (127,522,835 | ) |
| | | | | | | | |
Net increase (decrease) in shares outstanding before conversion | | | (11,180,641 | ) | | | (94,611,801 | ) |
Shares converted from Class C (See Note 1) | | | (1,045 | ) | | | (8,594 | ) |
| | | | | | | | |
Net increase (decrease) | | | (11,181,686 | ) | | $ | (94,620,395 | ) |
| | | | | | | | |
Year ended October 31, 2015: | | | | | | | | |
Shares sold | | | 10,867,149 | | | $ | 98,101,445 | |
Shares issued to shareholders in reinvestment of dividends and distributions | | | 789,891 | | | | 7,057,406 | |
Shares redeemed | | | (12,819,125 | ) | | | (114,653,445 | ) |
| | | | | | | | |
Net increase (decrease) | | | (1,162,085 | ) | | $ | (9,494,594 | ) |
| | | | | | | | |
| | |
| | | | | | | | |
Class I | | Shares | | | Amount | |
Year ended October 31, 2016: | | | | | | | | |
Shares sold | | | 20,252,896 | | | $ | 173,334,533 | |
Shares issued to shareholders in reinvestment of dividends and distributions | | | 3,482,882 | | | | 29,727,201 | |
Shares redeemed | | | (85,800,191 | ) | | | (726,642,179 | ) |
| | | | | | | | |
Net increase (decrease) in shares outstanding before conversion | | | (62,064,413 | ) | | | (523,580,445 | ) |
Shares converted into Class I (See Note 1) | | | 621,620 | | | | 5,366,742 | |
| | | | | | | | |
Net increase (decrease) | | | (61,442,793 | ) | | $ | (518,213,703 | ) |
| | | | | | | | |
Year ended October 31, 2015: | | | | | | | | |
Shares sold | | | 68,304,110 | | | $ | 620,273,431 | |
Shares issued to shareholders in reinvestment of dividends and distributions | | | 4,727,262 | | | | 42,501,199 | |
Shares redeemed | | | (87,873,504 | ) | | | (791,484,328 | ) |
| | | | | | | | |
Net increase (decrease) | | | (14,842,132 | ) | | $ | (128,709,698 | ) |
| | | | | | | | |
| | |
| | | | | | | | |
Class R2 | | Shares | | | Amount | |
Year ended October 31, 2016: | | | | | | | | |
Shares sold | | | 72,683 | | | $ | 641,451 | |
Shares issued to shareholders in reinvestment of dividends and distributions | | | 616 | | | | 5,314 | |
Shares redeemed | | | (10,934 | ) | | | (91,821 | ) |
| | | | | | | | |
Net increase (decrease) | | | 62,365 | | | $ | 554,944 | |
| | | | | | | | |
Period ended October 31, 2015: | | | | | | | | |
Shares sold | | | 11,624 | | | $ | 106,234 | |
Shares issued to shareholders in reinvestment of dividends and distributions | | | 828 | | | | 7,480 | |
Shares redeemed | | | (35,876 | ) | | | (320,072 | ) |
| | | | | | | | |
Net increase (decrease) | | | (23,424 | ) | | $ | (206,358 | ) |
| | | | | | | | |
| | |
| | | | | | | | |
Class R3 | | Shares | | | Amount | |
Period ended October 31, 2016 (a): | | | | | | | | |
Shares sold | | | 3,536 | | | $ | 29,179 | |
Shares issued to shareholders in reinvestment of dividends and distributions | | | 72 | | | | 626 | |
| | | | | | | | |
Net increase (decrease) | | | 3,608 | | | $ | 29,805 | |
| | | | | | | | |
| (a) | Inception date was February 29, 2016. |
| | |
| 42 | | MainStay Unconstrained Bond Fund |
Note 11–Recent Accounting Pronouncement
In October 2016, the U.S. Securities and Exchange Commission adopted new rules and amended existing rules (together, “final rules”) intended to modernize the reporting and disclosure of information by registered investment companies. In part, the final rules amend Regulation S-X and require standardized, enhanced disclosure about derivatives in investment company financial statements, as well as other amendments. The compliance date for the amendments to Regulation S-X is August 1, 2017. Management is currently evaluating the impact that the adoption of the amendments to Regulation S-X will have on the Fund’s financial statements and related disclosures.
Note 12–Subsequent Events
In connection with the preparation of the financial statements of the Fund as of and for the fiscal year ended October 31, 2016, events and transactions subsequent to October 31, 2016, through the date the
financial statements were issued have been evaluated by the Fund’s management for possible adjustment and/or disclosure. No subsequent events requiring financial statement adjustment or disclosure have been identified other then the following:
Effective February 28, 2017, Class B shares of the MainStay Group of Funds will be closed to all new purchases as well as additional investments by existing Class B shareholders. Existing Class B shareholders may continue to reinvest dividends and capital gains distributions, as well as exchange their Class B shares for Class B shares of other Funds as permitted by the current exchange privileges. Class B shareholders will continue to be subject to any applicable contingent deferred sales charge at the time of redemption. All other features of the Class B shares, including but not limited to the fees and expenses applicable to Class B shares, will remain unchanged. Unless redeemed, Class B Shares shareholders will remain in Class B shares of their respective Fund until the Class B shares are converted to Class A or Investor Class shares pursuant to the applicable conversion schedule.
Report of Independent Registered Public Accounting Firm
The Board of Trustees and Shareholders of
The MainStay Funds:
We have audited the accompanying statement of assets and liabilities, including the portfolio of investments, of the MainStay Unconstrained Bond Fund (the “Fund”), one of the funds constituting The MainStay Funds, as of October 31, 2016, and the related statement of operations for the year then ended, the statements of changes in net assets for each of the years in the two-year period then ended, and the financial highlights for each of the years or periods in the five-year period then ended. These financial statements and financial highlights are the responsibility of the Fund’s management. Our responsibility is to express an opinion on these financial statements and financial highlights based on our audits.
We conducted our audits in accordance with the standards of the Public Company Accounting Oversight Board (United States). Those standards require that we plan and perform the audit to obtain reasonable assurance about whether the financial statements and financial highlights are free of material misstatement. An audit includes examining, on a test basis, evidence supporting the amounts and disclosures in the financial statements. Our procedures included confirmation of securities owned as of October 31, 2016, by correspondence with the custodian and brokers or by other appropriate auditing procedures where replies from brokers were not received. An audit also includes assessing the accounting principles used and significant estimates made by management, as well as evaluating the overall financial statement presentation. We believe that our audits provide a reasonable basis for our opinion.
In our opinion, the financial statements and financial highlights referred to above present fairly, in all material respects, the financial position of the MainStay Unconstrained Bond Fund of The MainStay Funds as of October 31, 2016, the results of its operations for the year then ended, the changes in its net assets for each of the years in the two-year period then ended, and the financial highlights for each of the years or periods in the five-year period then ended, in conformity with U.S. generally accepted accounting principles.

Philadelphia, Pennsylvania
December 22, 2016
| | |
| 44 | | MainStay Unconstrained Bond Fund |
Federal Income Tax Information
(Unaudited)
In February 2017, shareholders will receive an IRS Form 1099-DIV or substitute Form 1099 which will show the federal tax status of the distributions received by shareholders in calendar year 2016. The amounts that will be reported on such 1099-DIV or subsitute Form 1099 will be the amounts you are to use on your federal income tax return and will differ from the amounts which we must report for the Fund’s fiscal year ended October 31, 2016.
Proxy Voting Policies and Procedures
and Proxy Voting Record
A description of the policies and procedures that New York Life Investments uses to vote proxies related to the Fund’s securities is available without charge, upon request, (i) by visiting the Fund’s website at mainstayinvestments.com; or (ii) on the SEC’s website at www.sec.gov.
The Fund is required to file with the SEC its proxy voting record for the 12-month period ending June 30 on Form N-PX. The Fund’s most recent Form N-PX or proxy voting record is available free of charge upon request (i) by calling 800-MAINSTAY (624-6782); (ii) by visiting the Fund’s website at mainstayinvestments.com; or (iii) on the SEC’s website at www.sec.gov.
Shareholder Reports and Quarterly
Portfolio Disclosure
The Fund is required to file its complete schedule of portfolio holdings with the SEC for its first and third fiscal quarters on Form N-Q. The Fund’s Form N-Q is available without charge on the SEC’s website at www.sec.gov or by calling MainStay Investments at 800-MAINSTAY (624-6782). You also can obtain and review copies of Form N-Q by visiting the SEC’s Public Reference Room in Washington, DC (information on the operation of the Public Reference Room may be obtained by calling 1-800-SEC-0330).
Board of Trustees and Officers (Unaudited)
The Trustees and officers of the Funds are listed below. The Board oversees the MainStay Group of Funds, MainStay VP Funds Trust, MainStay DefinedTerm Municipal Opportunities Fund, the Manager and the Subadvisors, and elects the officers of the Funds who are responsible for the day-to-day operations of the Funds. Information pertaining to the Trustees and officers is set forth below. Each Trustee serves until his or her successor is elected and qualified or until his or her resignation, death or removal. Under the Retirement Policy, a Trustee must
tender his or her resignation by the end of the calendar year during which he or she reaches the age of 75 (although the Board of Trustees may make exceptions from time to time). Officers serve a term of one year and are elected annually by the Board of Trustees. The business address of each Trustee and officer listed below is 51 Madison Avenue, New York, New York 10010. A majority of the Trustees are not “interested persons” (as defined by the 1940 Act and rules “adopted” by the SEC thereunder) of the Fund (“Independent Trustees”).
| | | | | | | | | | | | |
| | | | | Name and Date of Birth | | Term of Office, Position(s) Held and Length of Service | | Principal Occupation(s) During Past Five Years | | Number of
Portfolios in
Fund Complex
Overseen by
Board Member | | Other Directorships Held By Board Member |
| Interested Trustee | | | | Christopher O. Blunt* 5/13/62 | | MainStay Funds: Trustee since January 2016; MainStay Funds Trust: Trustee since January 2016. | | Executive Vice President (since 2009), President, Investments Group (since 2015), Member of the Executive Management Committee (since 2007), Co-President, Insurance and Agency Group (2012 to 2015), President, Insurance Group (2012 to 2014), Executive Vice President, Retirement Income Security (2008 to 2012), New York Life Insurance Company. | | 83 | | MainStay VP Funds Trust:
Trustee since January 2016 (31 portfolios); and
MainStay DefinedTerm Municipal Opportunities Fund: Trustee since January 2016. |
| | * | This Trustee is considered to be an “interested person” of the MainStay Group of Funds within the meaning of the 1940 Act because of his affiliation with New York Life Insurance Company, New York Life Investment Management LLC, Cornerstone Capital Management Holdings LLC, MacKay Shields LLC, Institutional Capital LLC, NYL Investors LLC, NYLIFE Securities LLC and/or NYLIFE Distributors LLC, as described in detail above in the column entitled “Principal Occupation(s) During Past Five Years.” |
| | |
| 46 | | MainStay Unconstrained Bond Fund |
| | | | | | | | | | | | |
| | | | | Name and Date of Birth | | Term of Office, Position(s) Held and Length of Service | | Principal Occupation(s) During Past Five Years | | Number of Portfolios in Fund Complex Overseen by Board Member | | Other Directorships Held By Board Member |
| Non-Interested Trustee | | | | David H. Chow 12/29/57 | | MainStay Funds: Trustee since January 2016, Advisory Board Member (June 2015 to December 2015); MainStay Funds Trust: Trustee since January 2016, Advisory Board Member (June 2015 to December 2015). | | Founder and CEO, DanCourt Management, LLC (since 1999) | | 83 | | MainStay VP Funds Trust: Trustee since January 2016, Advisory Board Member (June 2015 to December 2015); (31 portfolios);
MainStay DefinedTerm Municipal Opportunities Fund: Trustee since January 2016, Advisory Board Member (June 2015 to December 2015);
Market Vectors Group of Exchange-Traded Funds: Independent Chairman of the Board of Trustees since 2008 and Trustee since 2006 (55 portfolios); and
Berea College of Kentucky: Trustee since 2009. |
| | | | Susan B. Kerley 8/12/51 | | MainStay Funds: Trustee since 2007; MainStay Funds Trust: Trustee since 1990.*** | | President, Strategic Management Advisors LLC (since 1990) | | 83 | | MainStay VP Funds Trust: Trustee since 2007 (31 portfolios)**;
MainStay DefinedTerm Municipal Opportunities Fund: Trustee since 2011; and Legg Mason Partners Funds: Trustee since 1991 (53 portfolios). |
| | | | Alan R. Latshaw 3/27/51 | | MainStay Funds: Trustee and Audit Committee Financial Expert since 2006; MainStay Funds Trust: Trustee and Audit Committee Financial Expert since 2007.*** | | Retired; Partner, Ernst & Young LLP (2002 to 2003); Partner, Arthur Andersen LLP (1989 to 2002); Consultant to the MainStay Funds Audit and Compliance Committee (2004 to 2006) | | 83 | | MainStay VP Funds Trust: Trustee and Audit Committee Financial Expert since 2007 (31 portfolios)**;
MainStay DefinedTerm Municipal Opportunities Fund: Trustee and Audit Committee Financial Expert since 2011;
State Farm Associates Funds Trusts: Trustee since 2005 (4 portfolios);
State Farm Mutual Fund Trust: Trustee since 2005 (15 portfolios); and
State Farm Variable Product Trust: Trustee since 2005 (9 portfolios). |
| | | | Peter Meenan 12/5/41 | | MainStay Funds: Chairman since 2013 and Trustee since 2007; MainStay Funds Trust: Chairman since 2013 and Trustee since 2002.*** | | Retired; Independent Consultant (2004 to 2013); President and Chief Executive Officer, Babson—United, Inc. (financial services firm) (2000 to 2004); Independent Consultant (1999 to 2000); Head of Global Funds, Citicorp (1995 to 1999) | | 83 | | MainStay VP Funds Trust: Chairman since 2013 and Trustee since 2007 (31 portfolios)**; and
MainStay DefinedTerm Municipal Opportunities Fund: Chairman since 2013 and Trustee since 2011. |
| | | | Richard H. Nolan, Jr. 11/16/46 | | MainStay Funds: Trustee since 2007; MainStay Funds Trust: Trustee since 2007.*** | | Managing Director, ICC Capital Management (since 2004); President—Shields/Alliance, Alliance Capital Management (1994 to 2004) | | 83 | | MainStay VP Funds Trust: Trustee since 2006 (31 portfolios)**; and
MainStay DefinedTerm Municipal Opportunities Fund: Trustee since 2011. |
| | | | Jacques P. Perold 5/12/58 | | MainStay Funds: Trustee since January 2016, Advisory Board Member (June 2015 to December 2015); MainStay Funds Trust: Trustee since January 2016, Advisory Board Member (June 2015 to December 2015). | | Retired; President, Fidelity Management & Research Company (2009 to 2014); Founder, President and Chief Executive Officer, Geode Capital Management, LCC (2001 to 2009) | | 83 | | MainStay VP Funds Trust: Trustee since January 2016, Advisory Board Member (June 2015 to December 2015); (31 portfolios);
MainStay DefinedTerm Municipal Opportunities Fund: Trustee since January 2016, Advisory Board Member (June 2015 to December 2015);
Allstate Corporation: Director since 2015; and
Boston University: Trustee since 2014. |
| | | | | | | | | | | | |
| | | | | Name and Date of Birth | | Term of Office, Position(s) Held and Length of Service | | Principal Occupation(s) During Past Five Years | | Number of Portfolios in Fund Complex Overseen by Board Member | | Other Directorships Held By Board Member |
Non-Interested Trustee | | | | Richard S. Trutanic 2/13/52 | | MainStay Funds: Trustee since 1994; MainStay Funds Trust: Trustee since 2007.*** | | Chairman and Chief Executive Officer, Somerset & Company (financial advisory firm) (since 2004); Managing Director, The Carlyle Group (private investment firm) (2002 to 2004); Senior Managing Director, Partner and Board Member, Groupe Arnault S.A. (private investment firm) (1999 to 2002) | | 83 | | MainStay VP Funds Trust: Trustee since 2007 (31 portfolios)**; and
MainStay DefinedTerm Municipal Opportunities Fund: Trustee since 2011. |
| | | | John A. Weisser**** 10/22/41 | | MainStay Funds: Trustee since 2007; MainStay Funds Trust: Trustee since 2007.*** | | Retired; Managing Director of Salomon Brothers, Inc. (1971 to 1995) | | 83 | | MainStay VP Funds Trust: Trustee since 1997 (31 portfolios)**; MainStay DefinedTerm Municipal Opportunities Fund: Trustee since 2011; Direxion Insurance Trust: Trustee since 2007 (1 portfolio); Direxion Funds: Trustee since 2007 (18 portfolios); and Direxion Shares ETF Trust: Trustee since 2008 (52 portfolios). |
| | ** | Includes prior service as a Director of MainStay VP Series Fund, Inc., the predecessor to MainStay VP Funds Trust. |
| | *** | Includes prior service as a Director/Trustee of certain predecessor entities to MainStay Funds Trust. |
| | **** | Pursuant to the Retirement Policy, Mr. Weisser will retire from the Board of Trustees on or about December 31, 2016. |
| | |
| 48 | | MainStay Unconstrained Bond Fund |
| | | | | | | | |
| | | | | Name and Date of Birth | | Position(s) Held and Length of Service | | Principal Occupation(s) During Past Five Years |
Officers (Who Are Not Board Members)* | | | | Stephen P. Fisher 2/22/59 | | President, MainStay Funds (since 2007), MainStay Funds Trust (since 2009) | | Chairman and Chief Executive Officer (since 2014), President and Chief Operating Officer (2008 to 2013), NYLIFE Distributors LLC; Chairman of the Board, NYLIM Service Company LLC (since 2008); President (since May 2015), Co-President (2014 to 2015) and Senior Managing Director (since 2005), New York Life Investment Management LLC; President, MainStay DefinedTerm Municipal Opportunities Fund (since 2011) and MainStay VP Funds Trust (since 2007)** |
| | | | Jack R. Benintende 5/12/64 | | Treasurer and Principal Financial and Accounting Officer, MainStay Funds (since 2007), MainStay Funds Trust (since 2009) | | Managing Director, New York Life Investment Management LLC (since 2007); Treasurer and Principal Financial and Accounting Officer, MainStay DefinedTerm Municipal Opportunities Fund (since 2011) and MainStay VP Funds Trust (since 2007)**; and Assistant Treasurer, New York Life Investment Management Holdings LLC (2008 to 2012) |
| | | | Kevin M. Bopp 2/24/69 | | Vice President and Chief Compliance Officer, MainStay Funds and MainStay Funds Trust (since 2014) | | Chief Compliance Officer (since January 2016), Director and Associate General Counsel (2011 to 2014) and Vice President and Assistant General Counsel (2010 to 2011), New York Life Investment Management LLC; Vice President and Chief Compliance Officer, MainStay VP Funds Trust, MainStay DefinedTerm Municipal Opportunities Fund (since 2014); Assistant Secretary, MainStay Funds, MainStay Funds Trust and MainStay VP Funds Trust (2010 to 2014)**, MainStay DefinedTerm Municipal Opportunities Fund (2011 to 2014) |
| | | | J. Kevin Gao 10/13/67 | | Secretary and Chief Legal Officer, MainStay Funds and MainStay Funds Trust (since 2010) | | Managing Director and Associate General Counsel, New York Life Investment Management LLC (since 2010); Secretary and Chief Legal Officer, MainStay DefinedTerm Municipal Opportunities Fund (since 2011) and MainStay VP Funds Trust (since 2010)** |
| | | | Scott T. Harrington 2/8/59 | | Vice President— Administration, MainStay Funds (since 2005), MainStay Funds Trust (since 2009) | | Director, New York Life Investment Management LLC (including predecessor advisory organizations) (since 2000); Member of the Board of Directors, New York Life Trust Company (since 2009); Vice President—Administration, MainStay DefinedTerm Municipal Opportunities Fund (since 2011) and MainStay VP Funds Trust (since 2005)** |
| | * | The Officers listed above are considered to be “interested persons” of the MainStay Group of Funds within the meaning of the 1940 Act because of their affiliation with the MainStay Group of Funds, New York Life Insurance Company and/or its affiliates, including New York Life Investment Management LLC, NYLIM Service Company LLC, NYLIFE Securities LLC and/or NYLIFE Distributors LLC, as described in detail in the column captioned “Principal Occupation(s) During Past Five Years.” Officers are elected annually by the Board to serve a one year term. |
| | ** | Includes prior service as an Officer of MainStay VP Series Fund, Inc., the predecessor to MainStay VP Funds Trust. |
This page intentionally left blank
MainStay Funds
MainStay offers a wide range of Funds for virtually any investment need. The full array of MainStay open-end offerings is listed here, with information about the manager, subadvisors, legal counsel and independent registered public accounting firm.
Equity
U.S. Equity
MainStay Common Stock Fund
MainStay Cornerstone Growth Fund
MainStay Epoch U.S. All Cap Fund
MainStay Epoch U.S. Equity Yield Fund
MainStay Epoch U.S. Small Cap Fund
MainStay ICAP Equity Fund
MainStay ICAP Select Equity Fund
MainStay Large Cap Growth Fund
MainStay MAP Fund
MainStay S&P 500 Index Fund
MainStay U.S. Equity Opportunities Fund
International/Global Equity
MainStay Emerging Markets Opportunities Fund
MainStay Epoch Capital Growth Fund
MainStay Epoch Global Choice Fund
MainStay Epoch Global Equity Yield Fund
MainStay Epoch International Small Cap Fund
MainStay ICAP International Fund
MainStay International Equity Fund
MainStay International Opportunities Fund
Income
Taxable Bond
MainStay Floating Rate Fund
MainStay Global High Income Fund
MainStay Government Fund
MainStay High Yield Corporate Bond Fund
MainStay High Yield Opportunities Fund
MainStay Indexed Bond Fund
MainStay Short Duration High Yield Fund
MainStay Total Return Bond Fund
MainStay Unconstrained Bond Fund
Municipal/Tax Advantaged Bond
MainStay California Tax Free Opportunities Fund1
MainStay High Yield Municipal Bond Fund
MainStay New York Tax Free Opportunities Fund2
MainStay Tax Advantaged Short Term Bond Fund
MainStay Tax Free Bond Fund
Money Market
MainStay Money Market Fund
Mixed Asset
MainStay Balanced Fund
MainStay Convertible Fund
MainStay Income Builder Fund
Alternative
MainStay Absolute Return Multi-Strategy Fund
MainStay Cushing Energy Income Fund
MainStay Cushing MLP Premier Fund
MainStay Cushing Renaissance Advantage Fund
Asset Allocation/Target Date
MainStay Conservative Allocation Fund
MainStay Growth Allocation Fund
MainStay Moderate Allocation Fund
MainStay Moderate Growth Allocation Fund
MainStay Retirement 2010 Fund
MainStay Retirement 2020 Fund
MainStay Retirement 2030 Fund
MainStay Retirement 2040 Fund
MainStay Retirement 2050 Fund
MainStay Retirement 2060 Fund
Manager
New York Life Investment Management LLC
New York, New York
Subadvisors
Candriam France S.A.S.3
Paris, France
Cornerstone Capital Management Holdings LLC3
New York, New York
Cushing Asset Management, LP
Dallas, Texas
Epoch Investment Partners, Inc.
New York, New York
Institutional Capital LLC3
Chicago, Illinois
MacKay Shields LLC3
New York, New York
Markston International LLC
White Plains, New York
NYL Investors LLC3
New York, New York
Winslow Capital Management, LLC
Minneapolis, Minnesota
Legal Counsel
Dechert LLP
Washington, District of Columbia
Independent Registered Public Accounting Firm
KPMG LLP
Philadelphia, Pennsylvania
1. This Fund is only registered for sale in AZ, CA, MI (Class A and Class I shares only), NV, OR, TX, UT and WA.
2. This Fund is only registered for sale in CA, CT, DE, FL, MA, NJ, NY and VT.
3. An affiliate of New York Life Investment Management LLC.
Not part of the Annual Report
For more information
800-MAINSTAY (624-6782)
mainstayinvestments.com
MainStay Investments® is a registered service mark and name under which New York Life Investment Management LLC does business. MainStay Investments, an indirect subsidiary of New York Life Insurance Company, New York, NY 10010, provides investment advisory products and services. The MainStay Funds® are managed by New York Life Investment Management LLC and distributed by NYLIFE Distributors LLC, 30 Hudson Street, Jersey City, NJ 07302, a wholly owned subsidiary of New York Life Insurance Company. NYLIFE Distributors LLC is a Member FINRA/SIPC.
©2016 NYLIFE Distributors LLC. All rights reserved.
| | | | | | | | |
| Not FDIC/NCUA Insured | | Not a Deposit | | May Lose Value | | No Bank Guarantee | | Not Insured by Any Government Agency |
| | |
| 1717044 MS316-16 | | MSUB11-12/16 (NYLIM) NL217 |
MainStay Government Fund
Message from the President and Annual Report
October 31, 2016


This page intentionally left blank
Message from the President
During the 12 months ended October 31, 2016, the U.S. stock and bond markets were somewhat volatile but generally ended the reporting period in positive territory. In the fall of 2015 and early 2016, the market appeared to be focused on China’s economic weakness and a prolonged decline in oil prices. Although energy-related companies felt the brunt of these setbacks, the stock market as a whole declined until mid-February, when oil prices began to rise and stocks began a relatively steady recovery.
In late June, the United Kingdom voted to leave the European Union in a referendum popularly known as “Brexit.” The news caused a temporary slump in stocks around the world. Although the British pound dropped in value following the vote, stocks generally recovered through the end of the reporting period. As the end of the reporting period approached, speculation about the upcoming U.S. presidential election heightened market volatility.
According to FTSE-Russell data, U.S. stocks as a whole tended to provide positive returns during the reporting period, with large-capitalization stocks generally outperforming stocks of smaller companies. Value stocks outpaced growth stocks at all capitalization levels, with the largest differences among small- to mid-cap stocks.
International and emerging-market stocks provided mixed performance. Rocked by Brexit, European stocks as a whole declined during the reporting period, while stocks in the Asia-Pacific region (with or without Japan) tended to provide positive returns. International stocks as a whole declined, while global stocks advanced slightly. Emerging-market stocks were considerably stronger, boosted by advances in India and Latin America and higher prices for oil, metals and other commodities.
Anticipation of a possible Federal Reserve rate hike led to volatility in the bond market, but the Federal Open Market Committee chose not to raise the federal funds target rate during the reporting period. Short-term U.S. Treasury yields rose during the reporting period, and longer-term U.S. Treasury yields declined. Overall, the U.S. bond market provided positive returns, with longer-term bonds generally outperforming shorter-term securities. High-yield bonds, particularly
longer-term issues, were strong performers. Municipal bonds generally provided positive single-digit total returns for the 12 months ended October 31, 2016.
Central banks around the world remained highly accommodative during the reporting period, particularly in light of Brexit. Shortly after the U.K. referendum, more than a third of all sovereign debt carried negative yields. As an asset class, emerging-market bonds provided double-digit positive returns during the reporting period, and world bonds as a whole provided positive single-digit positive returns.
At MainStay, we know that political, economic and market events may influence the performance of your Fund investments. While our portfolio managers often pay close attention to such events, their primary emphasis is seeking to invest for the long-term investment needs of our shareholders. With this in mind, they seek to pursue the investment objectives of their respective Funds using the principal investment strategies and investment processes outlined in the prospectus. By placing your assets in the care of our investment professionals, you gain access to their extensive market insight, strategic investment discipline and in-depth experience in risk-management over a wide range of market cycles.
The report that follows provides more detailed information about the market forces, portfolio strategies and individual securities that influenced the performance of your MainStay Fund during the 12 months ended October 31, 2016. We invite you to read the report carefully as part of your personal investment-review process.
We thank you for your business, and we look forward to a continuing relationship as you pursue your long-range financial goals.
Sincerely,

Stephen P. Fisher
President
The opinions expressed are as of the date of this report and are subject to change. There is no guarantee that any forecast made will come to pass. This material does not constitute investment advice and is not intended as an endorsement of any specific investment. Past performance is no guarantee of future results.
Not part of the Annual Report
Table of Contents
Investors should refer to the Fund’s Summary Prospectus and/or Prospectus and consider the Fund’s investment objectives, strategies, risks, charges and expenses carefully before investing. The Summary Prospectus and/or Prospectus contain this and other information about the Fund. You may obtain copies of the Fund’s Summary Prospectus, Prospectus and Statement of Additional Information free of charge, upon request, by calling toll-free 800-MAINSTAY (624-6782), by writing to NYLIFE Distributors LLC, Attn: MainStay Marketing Department, 30 Hudson Street, Jersey City, NJ 07302 or by sending an e-mail to MainStayShareholderServices@nylim.com. These documents are also available via the MainStay Funds’ website at mainstayinvestments.com/documents. Please read the Summary Prospectus and/or Prospectus carefully before investing.
Investment and Performance Comparison1 (Unaudited)
Performance data quoted represents past performance. Past performance is no guarantee of future results. Because of market volatility and other factors, current performance may be lower or higher than the figures shown. Investment return and principal value will fluctuate, and as a result, when shares are redeemed, they may be worth more or less than their original cost. The graph below depicts the historical performance of Class B shares of the Fund. Performance will vary from class to class based on differences in class-specific expenses and sales charges. For performance information current to the most recent month-end, please call 800-MAINSTAY (624-6782) or visit mainstayinvestments.com.
(With sales charges)
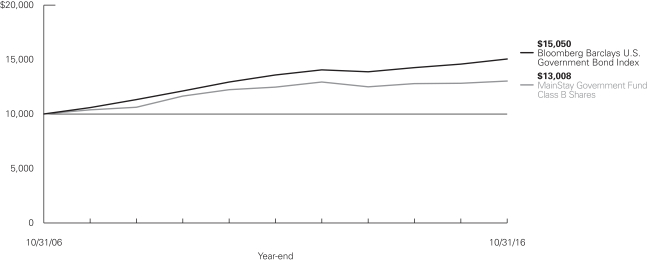
Average Annual Total Returns for the Year Ended October 31, 2016
| | | | | | | | | | | | | | | | | | | | |
| Class | | Sales Charge | | | | One Year | | | Five Years | | | Ten Years | | | Gross
Expense
Ratio2 | |
| Class A Shares | | Maximum 4.5% Initial Sales Charge | | With sales charges Excluding sales charges | |
| –2.01
2.60 | %
| |
| 0.92
1.86 | %
| |
| 3.13
3.60 | %
| |
| 1.00
1.00 | %
|
| Investor Class Shares3 | | Maximum 4.5% Initial Sales Charge | | With sales charges Excluding sales charges | |
| –2.26
2.34 |
| |
| 0.67
1.60 |
| |
| 2.96
3.43 |
| |
| 1.28
1.28 |
|
| Class B Shares | | Maximum 5% CDSC if Redeemed Within the First
Six Years of Purchase | | With sales charges Excluding sales charges | |
| –3.41
1.59 |
| |
| 0.49
0.87 |
| |
| 2.66
2.66 |
| |
| 2.03
2.03 |
|
| Class C Shares | | Maximum 1% CDSC if Redeemed Within One Year of Purchase | | With sales charges Excluding sales charges | |
| 0.59
1.59 |
| |
| 0.84
0.84 |
| |
| 2.67
2.67 |
| |
| 2.03
2.03 |
|
| Class I Shares | | No Sales Charge | | | | | 2.83 | | | | 2.09 | | | | 3.94 | | | | 0.75 | |
| 1. | The performance table and graph do not reflect the deduction of taxes that a shareholder would pay on distributions or Fund share redemptions. Total returns reflect maximum applicable sales charges as indicated in the table above, if any, changes in share price, and reinvestment of dividend and capital gain distributions. The graph assumes the initial investment amount shown above and reflects the deduction of all sales charges that would have applied for the period of investment. Performance figures may reflect certain fee waivers and/or expense limitations, without which total returns may have been lower. For more information on share classes and current fee waivers and/or expense limitations (if any), please refer to the notes to the financial statements. |
| 2. | The gross expense ratios presented reflect the Fund’s “Total Annual Fund Operating Expenses” from the most recent Prospectus and may differ from other expense ratios disclosed in this report. |
| 3. | Performance figures for Investor Class shares, first offered on February 28, 2008, include the historical performance of Class A shares through February 27, 2008, adjusted for differences in certain fees and expenses. Unadjusted, the performance shown for the Investor Class shares would likely have been different. |
The footnotes on the next page are an integral part of the table and graph and should be carefully read in conjunction with them.
| | | | | | | | |
| Benchmark Performance | | One
Year | | Five
Years | | Ten
Years | |
Bloomberg Barclays U.S. Government Bond Index4 | | 3.25% | | 2.09% | | | 4.17 | % |
Morningstar Intermediate Government Category Average5 | | 2.51 | | 1.79 | | | 3.80 | |
| 4. | The Bloomberg Barclays U.S. Government Bond Index is the Fund’s primary broad-based securities market index for comparison purposes. The Bloomberg Barclays U.S. Government Bond Index consists of publicly issued debt of the U.S. Treasury and government agencies. Results assume the reinvestment of all income and capital gains. An investment cannot be made directly in an index. |
| 5. | The Morningstar Intermediate Government Category Average is representative of funds that have at least 90% of their bond holdings in |
| | bonds backed by U.S. government or by U.S. government-linked agencies. These funds have durations between 3.5 and 6 years and/or average effective maturities between 4 and 10 years. Results are based on average total returns of similar funds with all dividends and capital gain distributions reinvested. |
The footnotes on the preceding page are an integral part of the table and graph and should be carefully read in conjunction with them.
| | |
| 6 | | MainStay Government Fund |
Cost in Dollars of a $1,000 Investment in MainStay Government Fund (Unaudited)
The example below is intended to describe the fees and expenses borne by shareholders during the six-month period from May 1, 2016, to October 31, 2016, and the impact of those costs on your investment.
Example
As a shareholder of the Fund, you incur two types of costs: (1) transaction costs, including exchange fees and sales charges (loads) on purchases (as applicable), and (2) ongoing costs, including management fees, distribution and/or service (12b-1) fees, and other Fund expenses (as applicable). This example is intended to help you understand your ongoing costs (in dollars) of investing in the Fund and to compare these costs with the ongoing costs of investing in other mutual funds. The example is based on an investment of $1,000 made at the beginning of the six-month period and held for the entire period from May 1, 2016, to October 31, 2016.
This example illustrates your Fund’s ongoing costs in two ways:
Actual Expenses
The second and third data columns in the table below provide information about actual account values and actual expenses. You may use the information in these columns, together with the amount you invested, to estimate the expenses that you paid during the six months ended October 31, 2016. Simply divide your account value by $1,000 (for example, an $8,600 account value divided by $1,000 = 8.6), then
multiply the result by the number under the heading entitled “Expenses Paid During Period” to estimate the expenses you paid on your account during this period.
Hypothetical Example for Comparison Purposes
The fourth and fifth data columns in the table below provide information about hypothetical account values and hypothetical expenses based on the Fund’s actual expense ratio and an assumed rate of return of 5% per year before expenses, which is not the Fund’s actual return. The hypothetical account values and expenses may not be used to estimate the actual ending account balances or expenses you paid for the six-month period shown. You may use this information to compare the ongoing costs of investing in the Fund with the ongoing costs of investing in other Funds. To do so, compare this 5% hypothetical example with the 5% hypothetical examples that appear in the shareholder reports of the other Funds.
Please note that the expenses shown in the table are meant to highlight your ongoing costs only and do not reflect any transactional costs, such as exchange fees or sales charges (loads). Therefore, the fourth and fifth data columns of the table are useful in comparing ongoing costs only and will not help you determine the relative total costs of owning different funds. In addition, if these transactional costs were included, your costs would have been higher.
| | | | | | | | | | | | | | | | | | | | |
| | | | | | | | | | | | | | | | |
| Share Class | | Beginning
Account
Value
5/1/16 | | | Ending Account
Value (Based
on Actual
Returns and
Expenses)
10/31/16 | | | Expenses
Paid
During
Period1 | | | Ending Account
Value (Based
on Hypothetical
5% Annualized
Return and
Actual Expenses)
10/31/16 | | | Expenses
Paid
During
Period1 | |
| | | | | |
| Class A Shares | | $ | 1,000.00 | | | $ | 1,011.60 | | | $ | 5.01 | | | $ | 1,020.20 | | | $ | 5.03 | |
| | | | | |
| Investor Class Shares | | $ | 1,000.00 | | | $ | 1,010.30 | | | $ | 6.22 | | | $ | 1,019.00 | | | $ | 6.24 | |
| | | | | |
| Class B Shares | | $ | 1,000.00 | | | $ | 1,006.50 | | | $ | 9.99 | | | $ | 1,015.20 | | | $ | 10.03 | |
| | | | | |
| Class C Shares | | $ | 1,000.00 | | | $ | 1,005.30 | | | $ | 9.98 | | | $ | 1,015.20 | | | $ | 10.03 | |
| | | | | |
| Class I Shares | | $ | 1,000.00 | | | $ | 1,012.70 | | | $ | 3.79 | | | $ | 1,021.40 | | | $ | 3.81 | |
| 1. | Expenses are equal to the Fund’s annualized expense ratio of each class (0.99% for Class A, 1.23% for Investor Class, 1.98% for Class B and Class C and 0.75% for Class I) multiplied by the average account value over the period, divided by 366 and multiplied by 184 (to reflect the six-month period). The table above represents the actual expenses incurred during the six-month period. |
Portfolio Composition as of October 31, 2016 (Unaudited)

See Portfolio of Investments beginning on page 11 for specific holdings within these categories.
Top Ten Holdings as of October 31, 2016 (excluding short-term investment) (Unaudited)
| 1. | Tennessee Valley Authority, 4.65%, due 6/15/35 |
| 2. | Federal Home Loan Mortgage Corporation (Mortgage Pass-Through Securities), 4.00%, due 3/1/41 |
| 3. | Federal Home Loan Mortgage Corporation (Mortgage Pass-Through Securities), 3.00%, due 11/1/46 TBA |
| 4. | Federal Home Loan Mortgage Corporation (Mortgage Pass-Through Securities), 4.00%, due 2/1/41 |
| 5. | United States Treasury Notes, 2.00%, due 8/31/21 |
| 6. | Government National Mortgage Association (Mortgage Pass-Through Securities), 4.00%, due 10/15/41 |
| 7. | Federal National Mortgage Association (Mortgage Pass-Through Securities), 3.50%, due 11/1/46 TBA |
| 8. | Federal National Mortgage Association (Mortgage Pass-Through Securities), 4.50%, due 1/1/41 |
| 9. | Federal National Mortgage Association (Mortgage Pass-Through Securities), 3.50%, due 11/1/41 |
| 10. | Federal Home Loan Mortgage Corporation (Mortgage Pass-Through Securities), 3.00%, due 6/1/45 |
| | |
| 8 | | MainStay Government Fund |
Portfolio Management Discussion and Analysis (Unaudited)
Questions answered by portfolio managers Dan Roberts, PhD, Louis N. Cohen, CFA, and Steven H. Rich, PhD, of MacKay Shields LLC, the Fund’s Subadvisor.
How did MainStay Government Fund perform relative to its primary benchmark and peers during the 12 months ended October 31, 2016?
Excluding all sales charges, MainStay Government Fund returned 2.60% for Class A shares, 2.34% for Investor Class shares and 1.59% for Class B and Class C shares for the 12 months ended October 31, 2016. Over the same period, the Fund’s Class I shares returned 2.83%. For the 12 months ended October 31, 2016, all share classes underperformed the 3.25% return of the Bloomberg Barclays U.S. Government Bond Index,1 which is the Fund’s broad-based securities-market index. Over the same period, Class A and Class I shares outperformed—and Investor Class, Class B and Class C shares underperformed—the 2.51% return of the Morningstar Intermediate Government Category Average.2 See page 5 for Fund returns with applicable sales charges.
What factors affected the Fund’s relative performance during the reporting period?
The Fund’s performance relative to the Bloomberg Barclays U.S. Government Bond Index was affected primarily by four factors during the reporting period: duration3 positioning, yield-curve4 posture, sector weightings and issue selection.
The Fund’s duration was shorter than that of the Bloomberg Barclays U.S. Government Bond Index during the reporting period. With a shorter duration, the Fund was less sensitive than the benchmark and longer-duration peers to changes in U.S. Treasury yields. The short duration posture detracted from the Fund’s relative performance as yields fell, on average, across the yield curve.
During the reporting period, the spread5 between the 2- and 30-year U.S. Treasury benchmark yields narrowed, which benefited Fund peers that were more concentrated in longer-duration securities. The flatter yield curve did, however, align well with the Fund’s emphasis on mortgage pass-through securities6 backed by 30-year loans, which have greater sensitivity to longer-duration U.S. Treasury yields than the tighter cash-flow window of a pass-through backed by 15-year loans.
Agency mortgage pass-through securities were the largest class of securities in the Fund. The Fund’s commitment to agency mortgage pass-throughs imparted a yield advantage over lower-yielding U.S. Treasury securities and agency debentures.
This benefit was reinforced by the outperformance of agency mortgage-backed securities relative to comparable-duration U.S. Treasury securities, as investors gravitated toward the sector’s high-quality yield. The Fund’s commitment to mortgage-backed securities helped the Fund’s performance relative to the Bloomberg Barclays U.S. Government Bond Index, which held no mortgage-backed securities, and relative to peers with less exposure to mortgage-backed securities.
The Fund’s mortgage allocation favored mortgage-backed securities issued by Fannie Mae and Freddie Mac. Relative to its peers, the Fund may be underweight Ginnie Mae issues. Given the outperformance of Fannie Mae and Freddie Mac issues during the reporting period, the Fund benefited relative to peers with larger Ginnie Mae commitments. Ginnie Mae securities exhibited faster prepayment speeds than equivalent Fannie Mae and Freddie Mac issues because of policies that accelerated refinancing rates for borrowers eligible for Ginnie Mae loans.
Low portfolio turnover benefited the Fund relative to peers with higher turnover by limiting transaction costs. In an effort to preserve yield, the Fund remained nearly fully invested, which avoided large cash balances that can detract from performance.
What was the Fund’s duration strategy during the reporting period?
The Fund’s 3.5 year-duration at the end of the reporting period was shorter than the duration of the Bloomberg Barclays U.S. Government Bond Index. Under the market conditions during the reporting period, the Fund’s duration favored the shorter side because this positioning typically helps the Fund relative to its benchmark and relative to peer funds with longer durations if U.S. Treasury yields rise. As the reporting period unfolded, however, the Fund’s duration extended by 0.60 years to seek to narrow the distance between the Fund’s duration and that of the benchmark and, in turn, to moderate the effect of U.S. Treasury yield volatility on relative performance. Because the Fund had a shorter duration than the benchmark, it was less sensitive to changes in U.S. Treasury yields. As U.S. Treasury yields declined on average during the reporting period, the short-duration posture detracted from the Fund’s performance relative to the Bloomberg Barclays U.S. Government Bond Index and the Fund’s longer-duration peers.
| 1. | See footnote on page 6 for more information on the Bloomberg Barclays U.S. Government Bond Index. |
| 2. | See footnote on page 6 for more information on the Morningstar Intermediate Government Category Average. |
| 3. | Duration is a measure of the price sensitivity of a fixed-income investment to changes in interest rates. Duration is expressed as a number of years and is considered a more accurate sensitivity gauge than average maturity. |
| 4. | The yield curve is a line that plots the yields of various securities of similar quality—typically U.S. Treasury issues—across a range of maturities. The U.S. Treasury yield curve serves as a benchmark for other debt and is used in economic forecasting. |
| 5. | The terms “spread” and “yield spread” may refer to the difference in yield between a security or type of security and comparable U.S. Treasury issues. The term may also refer to the difference in yield between two specific securities or types of securities at a given time. |
| 6. | Mortgage pass-through securities consist of a pool of residential mortgage loans in which homeowners’ monthly payments of principal, interest and prepayments pass from the original bank through a government agency or an investment bank to investors. |
What specific factors, risks or market forces prompted significant decisions for the Fund during the reporting period?
Most of the Fund’s residential mortgage exposure was attributable to mortgage pass-through securities rather than collateralized mortgage obligations. In our opinion, the compensation demanded by the market for the better predictability of cash flows among collateralized mortgage obligations was excessive.
During the reporting period, the principal driver of the housing market migrated from purchase activity to refinancing, as mortgage rates declined and the peak summer housing season ended. To mute the impact of these changes, the Fund emphasized mortgage pass-through securities whose underlying loan pools were less sensitive to mortgage-rate changes. We believe that these “call-protected” pass-throughs can be a source of better value because the loan pools tend to be less responsive to mortgage-rate volatility, thereby stabilizing prepayment speeds and enabling the investor to preserve more of the security’s yield. A loan pool that consists of smaller-balance loans (e.g., a loan pool where no mortgage is larger than $110,000) is one instance, in our opinion, of a mortgage-backed security with superior call protection. The Fund emphasized pass-through securities backed by 30-year loans, rather than shorter 15-year loans favored by borrowers who are prone to refinance.
Shallow—rather than rapid—macroeconomic improvement prompted the extension of the Fund’s duration. This was accomplished by reinvesting principal runoff from the Fund’s mortgage position into intermediate-duration U.S. Treasury securities.
During the reporting period, which aspects of the Fund’s positioning were the strongest positive contributors to the Fund’s performance and which aspects detracted the most?
Duration was the principal detractor from the Fund’s performance. As previously noted, the Fund was positioned to be less sensitive to changes in U.S. Treasury yields and saw less of an advantage from falling yields during the reporting period. The secondary performance headwind was the flattening of the U.S. Treasury yield curve between the 2-year and 30-year maturities. This likely detracted from the Fund’s performance relative to the Bloomberg Barclays U.S. Government Bond Index and relative to peers with larger concentrations in longer-duration securities.
The yield advantage of mortgage-backed securities relative to comparable-duration U.S. Treasury securities contributed to the Fund’s absolute and relative performance. Issue selection,
specifically the Fund’s underweight positions in Ginnie Mae issues in favor of Fannie Mae and Freddie Mac pass-through securities enhanced the Fund’s relative performance. In addition, the Fund favored 30-year loan terms over shorter (15- and 20-year) loan terms, which also helped performance relative to the Bloomberg Barclays U.S. Government Bond Index. The flattening of the U.S. Treasury yield curve enhanced the inherent value of the wider-window cash flows of mortgage pass-through securities backed by 30-year loan terms. The Fund also benefited by favoring mortgage securities with stable cash flows. These call-protected securities better positioned the Fund to withstand lower mortgage rates.
Did the Fund make any significant purchases or sales during the reporting period?
In prior periods, we tended to recycle mortgage prepayments back to the mortgage sector. During this reporting period, however, rising interest-rate volatility drained some of the value from mortgage-backed securities. For this reason, we began to diversify away from agency residential mortgages by diverting mortgage prepayments to purchase U.S. Treasury securities.
How did the Fund’s sector weightings change during the reporting period?
During the reporting period, the Fund’s U.S. Treasury securities were increased to over 9% of the Fund’s net assets and the Fund’s allocation to mortgage-backed securities was decreased to about 80% of the Fund’s net assets. These changes reflected several investment decisions during the reporting period. The Fund diversified its asset base by reinvesting mortgage prepayments in U.S. Treasury securities and closed its U.S. Treasury futures position to extend the Fund’s duration. The Fund also sought to extend its duration by investing cash contributions in intermediate-duration U.S. Treasury securities.
How was the Fund positioned at the end of the reporting period?
As of October 31, 2016, the Fund held underweight positions relative to the Bloomberg Barclays U.S. Government Bond Index in U.S. Treasury securities and agency debentures and an overweight position in agency mortgage pass-through securities. As of the same date, the Fund held modestly overweight positions relative to the Index in asset-backed securities and commercial mortgage-backed securities. As of October 31, 2016, the Fund’s collective non-government exposure was about 3% of net assets and the Fund held about 3% of net assets in cash.
The opinions expressed are those of the portfolio managers as of the date of this report and are subject to change. There is no guarantee that any forecasts will come to pass. This material does not constitute investment advice and is not intended as an endorsement of any specific investment.
| | |
| 10 | | MainStay Government Fund |
Portfolio of Investments October 31, 2016
| | | | | | | | |
| | | Principal
Amount | | | Value | |
Long-Term Bonds 98.6%† Asset-Backed Securities 1.3% | | | | | |
Other ABS 0.2% | | | | | | | | |
Small Business Administration Participation Certificates
Series 2015-20G, Class 1
2.88%, due 7/1/35 | | $ | 314,546 | | | $ | 325,746 | |
| | | | | | | | |
| | |
Utilities 1.1% | | | | | | | | |
Atlantic City Electric Transition Funding LLC Series 2002-1, Class A4
5.55%, due 10/20/23 | | | 1,678,286 | | | | 1,848,114 | |
| | | | | | | | |
Total Asset-Backed Securities
(Cost $2,007,781) | | | | | | | 2,173,860 | |
| | | | | | | | |
|
| Corporate Bond 0.6% | |
Electric 0.6% | |
Duke Energy Florida Project Finance LLC
2.538%, due 9/1/31 | | | 1,100,000 | | | | 1,093,796 | |
| | | | | | | | |
Total Corporate Bond
(Cost $1,099,956) | | | | | | | 1,093,796 | |
| | | | | | | | |
|
| Mortgage-Backed Securities 1.0% | |
Commercial Mortgage Loan
(Collateralized Mortgage Obligation) 0.4% | |
Four Times Square Trust
Series 2006-4TS, Class A
5.401%, due 12/13/28 (a) | | | 620,000 | | | | 694,078 | |
| | | | | | | | |
|
Residential Mortgages
(Collateralized Mortgage Obligations) 0.6% | |
Citigroup Mortgage Loan Trust, Inc.
Series 2006-AR6, Class 1A1
3.151%, due 8/25/36 (b) | | | 207,892 | | | | 191,371 | |
Mortgage Equity Conversion Asset Trust
Series 2007-FF2, Class A
1.00%, due 2/25/42 (a)(c)(d)(e) | | | 1,095,608 | | | | 931,266 | |
| | | | | | | | |
| | | | 1,122,637 | |
| | | | | | | | |
Total Mortgage-Backed Securities
(Cost $1,890,168) | | | | | | | 1,816,715 | |
| | | | | | | | |
|
| U.S. Government & Federal Agencies 95.7% | |
Fannie Mae Strip (Collateralized Mortgage Obligations) 0.0%‡ | |
Series 360, Class 2, IO 5.00%, due 8/25/35 (f) | | | 203,528 | | | | 34,168 | |
Series 361, Class 2, IO 6.00%, due 10/25/35 (f) | | | 41,908 | | | | 9,439 | |
| | | | | | | | |
| | | | 43,607 | |
| | | | | | | | |
| | | | | | | | |
| | | Principal
Amount | | | Value | |
Federal Home Loan Mortgage Corporation
(Mortgage Pass-Through Securities) 31.1% | |
2.50%, due 8/1/46 | | $ | 1,227,628 | | | $ | 1,225,537 | |
2.653%, due 2/1/37 (c) | | | 74,174 | | | | 78,676 | |
2.707%, due 3/1/35 (c) | | | 31,078 | | | | 32,601 | |
2.755%, due 6/1/35 (c) | | | 152,975 | | | | 161,808 | |
3.00%, due 4/1/45 | | | 2,585,204 | | | | 2,663,708 | |
¨3.00%, due 6/1/45 | | | 3,175,683 | | | | 3,272,118 | |
3.00%, due 7/1/45 | | | 1,419,814 | | | | 1,462,929 | |
3.00%, due 5/1/46 | | | 870,450 | | | | 896,882 | |
¨3.00%, due 11/1/46 TBA (g) | | | 4,690,000 | | | | 4,828,218 | |
3.50%, due 10/1/25 | | | 340,343 | | | | 363,036 | |
3.50%, due 11/1/25 | | | 2,152,071 | | | | 2,290,368 | |
3.50%, due 4/1/42 | | | 916,649 | | | | 973,575 | |
3.50%, due 5/1/42 | | | 735,584 | | | | 774,365 | |
3.50%, due 7/1/42 | | | 362,810 | | | | 381,979 | |
3.50%, due 6/1/43 | | | 937,153 | | | | 986,501 | |
3.50%, due 8/1/43 | | | 2,983,710 | | | | 3,152,110 | |
3.50%, due 1/1/44 | | | 1,003,912 | | | | 1,056,686 | |
3.50%, due 5/1/44 | | | 317,465 | | | | 336,831 | |
3.50%, due 3/1/45 | | | 1,299,416 | | | | 1,363,459 | |
3.50%, due 12/1/45 | | | 533,890 | | | | 560,232 | |
3.50%, due 5/1/46 | | | 762,350 | | | | 800,658 | |
3.50%, due 11/1/46 TBA (g) | | | 1,110,000 | | | | 1,164,936 | |
4.00%, due 3/1/25 | | | 918,988 | | | | 973,964 | |
4.00%, due 7/1/25 | | | 336,870 | | | | 359,611 | |
4.00%, due 8/1/31 | | | 127,617 | | | | 137,714 | |
4.00%, due 8/1/39 | | | 261,396 | | | | 287,966 | |
4.00%, due 12/1/40 | | | 2,706,707 | | | | 2,955,633 | |
¨4.00%, due 2/1/41 | | | 4,431,541 | | | | 4,823,262 | |
¨4.00%, due 3/1/41 | | | 4,850,755 | | | | 5,300,113 | |
4.00%, due 4/1/41 | | | 460,564 | | | | 496,948 | |
4.00%, due 1/1/42 | | | 2,458,836 | | | | 2,688,678 | |
4.00%, due 12/1/42 | | | 750,351 | | | | 814,049 | |
4.00%, due 11/1/43 | | | 244,753 | | | | 261,647 | |
4.00%, due 2/1/46 | | | 1,272,334 | | | | 1,360,523 | |
4.50%, due 3/1/41 | | | 649,871 | | | | 718,230 | |
4.50%, due 8/1/41 | | | 919,930 | | | | 1,020,662 | |
5.00%, due 1/1/20 | | | 56,689 | | | | 58,280 | |
5.00%, due 6/1/33 | | | 414,384 | | | | 462,977 | |
5.00%, due 8/1/33 | | | 338,650 | | | | 378,185 | |
5.00%, due 5/1/36 | | | 336,954 | | | | 374,218 | |
5.00%, due 10/1/39 | | | 838,694 | | | | 946,078 | |
5.50%, due 1/1/21 | | | 198,018 | | | | 210,301 | |
5.50%, due 11/1/35 | | | 356,973 | | | | 407,988 | |
5.50%, due 11/1/36 | | | 96,863 | | | | 112,507 | |
6.50%, due 4/1/37 | | | 78,096 | | | | 93,434 | |
| | | | | | | | |
| | | | 54,070,181 | |
| | | | | | | | |
| † | Percentages indicated are based on Fund net assets. |
| ¨ | | Among the Fund’s 10 largest holdings, as of October 31, 2016, excluding short-term investment. May be subject to change daily. (Unaudited) |
| | | | | | |
The notes to the financial statements are an integral part of,
and should be read in conjunction with, the financial statements. | | | | | 11 | |
Portfolio of Investments October 31, 2016 (continued)
| | | | | | | | |
| | | Principal
Amount | | | Value | |
| U.S. Government & Federal Agencies (continued) | |
Federal National Mortgage Association
(Mortgage Pass-Through Securities) 42.1% | |
2.00%, due 11/1/31 | | $ | 1,000,000 | | | $ | 1,003,543 | |
2.475%, due 11/1/34 (c) | | | 135,167 | | | | 140,682 | |
2.50%, due 2/1/43 | | | 862,727 | | | | 865,095 | |
2.732%, due 4/1/34 (c) | | | 292,849 | | | | 312,296 | |
3.00%, due 10/1/32 | | | 844,425 | | | | 879,513 | |
3.00%, due 4/1/43 | | | 2,937,618 | | | | 3,030,775 | |
3.00%, due 3/1/46 | | | 954,963 | | | | 984,011 | |
3.00%, due 9/1/46 | | | 2,481,980 | | | | 2,528,537 | |
3.00%, due 10/1/46 | | | 1,797,127 | | | | 1,831,186 | |
3.50%, due 11/1/25 | | | 1,033,668 | | | | 1,094,699 | |
3.50%, due 11/1/32 | | | 674,476 | | | | 715,898 | |
3.50%, due 2/1/41 | | | 1,906,558 | | | | 2,009,989 | |
¨3.50%, due 11/1/41 | | | 3,137,328 | | | | 3,337,097 | |
3.50%, due 12/1/41 | | | 312,834 | | | | 334,033 | |
3.50%, due 1/1/42 | | | 1,633,863 | | | | 1,750,290 | |
3.50%, due 3/1/42 | | | 2,060,389 | | | | 2,171,482 | |
3.50%, due 8/1/42 | | | 1,302,635 | | | | 1,382,584 | |
3.50%, due 12/1/42 | | | 762,130 | | | | 812,315 | |
3.50%, due 2/1/43 | | | 1,123,327 | | | | 1,197,275 | |
3.50%, due 5/1/43 | | | 673,784 | | | | 712,671 | |
3.50%, due 6/1/43 | | | 809,718 | | | | 860,039 | |
¨3.50%, due 11/1/46 TBA (g) | | | 3,280,000 | | | | 3,443,488 | |
4.00%, due 9/1/31 | | | 1,251,687 | | | | 1,350,916 | |
4.00%, due 2/1/41 | | | 1,375,625 | | | | 1,492,725 | |
4.00%, due 3/1/41 | | | 2,039,480 | | | | 2,239,194 | |
4.00%, due 10/1/41 | | | 460,423 | | | | 505,569 | |
4.00%, due 3/1/42 | | | 1,349,841 | | | | 1,458,526 | |
4.00%, due 4/1/42 | | | 601,975 | | | | 650,351 | |
4.00%, due 6/1/42 | | | 1,751,987 | | | | 1,902,647 | |
4.00%, due 7/1/42 | | | 1,570,976 | | | | 1,705,762 | |
4.50%, due 11/1/18 | | | 308,743 | | | | 317,339 | |
4.50%, due 6/1/23 | | | 306,724 | | | | 326,635 | |
4.50%, due 5/1/39 | | | 595,912 | | | | 662,876 | |
4.50%, due 6/1/39 | | | 1,788,574 | | | | 1,978,206 | |
4.50%, due 7/1/39 | | | 1,887,084 | | | | 2,111,788 | |
4.50%, due 8/1/39 | | | 1,567,307 | | | | 1,744,482 | |
4.50%, due 9/1/40 | | | 1,239,938 | | | | 1,387,892 | |
4.50%, due 12/1/40 | | | 1,882,737 | | | | 2,074,658 | |
¨4.50%, due 1/1/41 | | | 2,990,592 | | | | 3,347,599 | |
4.50%, due 2/1/41 | | | 1,010,582 | | | | 1,117,780 | |
4.50%, due 8/1/41 | | | 711,787 | | | | 786,975 | |
4.50%, due 12/1/43 | | | 470,350 | | | | 514,053 | |
5.00%, due 9/1/17 | | | 72,475 | | | | 74,318 | |
5.00%, due 9/1/20 | | | 11,686 | | | | 11,983 | |
5.00%, due 11/1/33 | | | 418,821 | | | | 467,815 | |
5.00%, due 6/1/35 | | | 381,642 | | | | 423,202 | |
5.00%, due 10/1/35 | | | 160,038 | | | | 177,610 | |
5.00%, due 1/1/36 | | | 82,669 | | | | 91,734 | |
5.00%, due 2/1/36 | | | 597,408 | | | | 662,960 | |
| | | | | | | | |
| | | Principal
Amount | | | Value | |
Federal National Mortgage Association
(Mortgage Pass-Through Securities) (continued) | |
5.00%, due 5/1/36 | | $ | 407,483 | | | $ | 452,000 | |
5.00%, due 6/1/36 | | | 62,927 | | | | 69,595 | |
5.00%, due 9/1/36 | | | 110,198 | | | | 122,268 | |
5.00%, due 3/1/40 | | | 1,093,831 | | | | 1,233,895 | |
5.00%, due 2/1/41 | | | 2,050,849 | | | | 2,327,354 | |
5.50%, due 1/1/17 | | | 966 | | | | 967 | |
5.50%, due 2/1/17 | | | 22,147 | | | | 22,190 | |
5.50%, due 6/1/19 | | | 209,515 | | | | 217,317 | |
5.50%, due 11/1/19 | | | 251,456 | | | | 261,717 | |
5.50%, due 4/1/21 | | | 400,141 | | | | 424,406 | |
5.50%, due 6/1/33 | | | 1,186,945 | | | | 1,349,023 | |
5.50%, due 11/1/33 | | | 689,982 | | | | 784,751 | |
5.50%, due 12/1/33 | | | 822,606 | | | | 937,312 | |
5.50%, due 6/1/34 | | | 203,182 | | | | 231,399 | |
5.50%, due 12/1/34 | | | 53,195 | | | | 60,522 | |
5.50%, due 3/1/35 | | | 340,938 | | | | 388,116 | |
5.50%, due 12/1/35 | | | 82,877 | | | | 94,253 | |
5.50%, due 4/1/36 | | | 250,898 | | | | 284,657 | |
5.50%, due 9/1/36 | | | 88,965 | | | | 101,326 | |
5.50%, due 7/1/37 | | | 215,908 | | | | 251,121 | |
6.00%, due 12/1/16 | | | 3,347 | | | | 3,349 | |
6.00%, due 11/1/32 | | | 218,341 | | | | 253,595 | |
6.00%, due 1/1/33 | | | 166,016 | | | | 192,350 | |
6.00%, due 3/1/33 | | | 197,837 | | | | 229,249 | |
6.00%, due 9/1/34 | | | 71,956 | | | | 83,048 | |
6.00%, due 9/1/35 | | | 535,060 | | | | 627,010 | |
6.00%, due 10/1/35 | | | 242,565 | | | | 283,773 | |
6.00%, due 6/1/36 | | | 169,884 | | | | 194,664 | |
6.00%, due 11/1/36 | | | 371,089 | | | | 430,291 | |
6.00%, due 4/1/37 | | | 53,478 | | | | 57,953 | |
6.50%, due 10/1/31 | | | 129,790 | | | | 150,550 | |
6.50%, due 2/1/37 | | | 63,924 | | | | 77,221 | |
| | | | | | | | |
| | | | 73,180,335 | |
| | | | | | | | |
Government National Mortgage Association
(Mortgage Pass-Through Securities) 7.0% | |
3.00%, due 6/20/46 | | | 971,862 | | | | 998,197 | |
4.00%, due 7/15/39 | | | 376,705 | | | | 404,050 | |
4.00%, due 9/20/40 | | | 1,581,400 | | | | 1,746,039 | |
4.00%, due 11/20/40 | | | 281,714 | | | | 307,356 | |
4.00%, due 1/15/41 | | | 1,648,982 | | | | 1,774,978 | |
¨4.00%, due 10/15/41 | | | 3,296,780 | | | | 3,619,001 | |
4.50%, due 5/20/40 | | | 1,641,818 | | | | 1,811,500 | |
5.00%, due 2/20/41 | | | 389,569 | | | | 432,223 | |
6.00%, due 8/15/32 | | | 304,574 | | | | 357,334 | |
6.00%, due 12/15/32 | | | 210,523 | | | | 246,148 | |
6.50%, due 8/15/28 | | | 100,959 | | | | 116,051 | |
6.50%, due 4/15/31 | | | 311,321 | | | | 370,073 | |
| | | | | | | | |
| | | | 12,182,950 | |
| | | | | | | | |
| | | | |
| 12 | | MainStay Government Fund | | The notes to the financial statements are an integral part of,
and should be read in conjunction with, the financial statements. |
| | | | | | | | |
| | | Principal
Amount | | | Value | |
| U.S. Government & Federal Agencies (continued) | |
Overseas Private Investment Corporation 1.8% | |
5.142%, due 12/15/23 | | $ | 2,845,054 | | | $ | 3,090,198 | |
| | | | | | | | |
|
¨Tennessee Valley Authority 4.0% | |
4.65%, due 6/15/35 | | | 5,605,000 | | | | 6,887,856 | |
| | | | | | | | |
| | |
United States Treasury Notes 9.7% | | | | | | | | |
1.625%, due 8/15/22 | | | 1,085,000 | | | | 1,094,027 | |
1.75%, due 3/31/22 | | | 2,500,000 | | | | 2,541,405 | |
1.75%, due 9/30/22 | | | 750,000 | | | | 760,342 | |
2.00%, due 11/30/20 | | | 3,000,000 | | | | 3,091,992 | |
¨2.00%, due 8/31/21 | | | 4,110,000 | | | | 4,235,708 | |
2.00%, due 8/15/25 | | | 2,000,000 | | | | 2,034,296 | |
2.375%, due 8/15/24 | | | 3,000,000 | | | | 3,148,944 | |
| | | | | | | | |
| | | | 16,906,714 | |
| | | | | | | | |
Total U.S. Government & Federal Agencies
(Cost $159,049,948) | | | | | | | 166,361,841 | |
| | | | | | | | |
Total Long-Term Bonds
(Cost $164,047,853) | | | | | | | 171,446,212 | |
| | | | | | | | |
| | |
| Short-Term Investment 5.0% | | | | | | | | |
Repurchase Agreement 5.0% | | | | | | | | |
Fixed Income Clearing Corp.
0.03%, dated 10/31/16
due 11/1/16
Proceeds at Maturity $8,713,967 (Collateralized by a United States Treasury Note with a rate of 0.875% and a maturity date of 4/15/19, with a Principal Amount of $8,900,000 and a Market Value of $8,888,875) | | | 8,713,960 | | | | 8,713,960 | |
| | | | | | | | |
Total Short-Term Investment
(Cost $8,713,960) | | | | | | | 8,713,960 | |
| | | | | | | | |
Total Investments
(Cost $172,761,813) (h) | | | 103.6 | % | | | 180,160,172 | |
Other Assets, Less Liabilities | | | (3.6 | ) | | | (6,272,408 | ) |
Net Assets | | | 100.0 | % | | $ | 173,887,764 | |
| ‡ | Less than one-tenth of a percent. |
| (a) | May be sold to institutional investors only under Rule 144A or securities offered pursuant to Section 4(a)(2) of the Securities Act of 1933, as amended. |
| (b) | Collateral strip rate—A bond whose interest was based on the weighted net interest rate of the collateral. The coupon rate adjusts periodically based on a predetermined schedule. Rate shown was the rate in effect as of October 31, 2016. |
| (c) | Floating rate—Rate shown was the rate in effect as of October 31, 2016. |
| (d) | Illiquid security—As of October 31, 2016, the total market value of this security deemed illiquid under procedures approved by the Board of Trustees was $931,266, which represented 0.5% of the Fund’s net assets (unaudited). |
| (e) | Fair valued security—Represents fair value as measured in good faith under procedures approved by the Board of Trustees. As of October 31, 2016, the total market value of this security was $931,266, which represented 0.5% of the Fund’s net assets. |
| (f) | Collateralized Mortgage Obligation Interest Only Strip—Pays a fixed or variable rate of interest based on mortgage loans or mortgage pass-through securities. The principal amount of the underlying pool represents the notional amount on which the current interest was calculated. The value of these stripped securities may be particularly sensitive to changes in prevailing interest rates and are typically more sensitive to changes in prepayment rates than traditional mortgage-backed securities. |
| (g) | TBA—Securities purchased on a forward commitment basis with an approximate principal amount and maturity date. The actual principal amount and maturity date will be determined upon settlement. As of October 31, 2016, the total net market value of these securities was $9,436,642, which represented 5.4% of the Fund’s net assets. All or a portion of these securities are a part of a mortgage dollar roll agreement. |
| (h) | As of October 31, 2016, cost was $172,761,813 for federal income tax purposes and net unrealized appreciation was as follows: |
| | | | |
Gross unrealized appreciation | | $ | 7,747,726 | |
Gross unrealized depreciation | | | (349,367 | ) |
| | | | |
Net unrealized appreciation | | $ | 7,398,359 | |
| | | | |
The following abbreviation is used in the preceding pages:
IO—Interest Only
| | | | | | |
The notes to the financial statements are an integral part of,
and should be read in conjunction with, the financial statements. | | | | | 13 | |
Portfolio of Investments October 31, 2016 (continued)
The following is a summary of the fair valuations according to the inputs used as of October 31, 2016, for valuing the Fund’s assets.
Asset Valuation Inputs
| | | | | | | | | | | | | | | | |
Description | | Quoted
Prices in
Active
Markets for
Identical
Assets (Level 1) | | | Significant
Other
Observable
Inputs (Level 2) | | | Significant
Unobservable
Inputs (Level 3) | | | Total | |
| Investments in Securities (a) | | | | | | | | | | | | | | | | |
| Long-Term Bonds | | | | | | | | | | | | | | | | |
Asset-Backed Securities | | $ | — | | | $ | 2,173,860 | | | $ | — | | | $ | 2,173,860 | |
Corporate Bond | | | — | | | | 1,093,796 | | | | — | | | | 1,093,796 | |
Mortgage-Backed Securities (b) | | | — | | | | 885,449 | | | | 931,266 | | | | 1,816,715 | |
U.S. Government & Federal Agencies | | | — | | | | 166,361,841 | | | | — | | | | 166,361,841 | |
| | | | | | | | | | | | | | | | |
| Total Long-Term Bonds | | | — | | | | 170,514,946 | | | | 931,266 | | | | 171,446,212 | |
| | | | | | | | | | | | | | | | |
| Short-Term Investment | | | | | | | | | | | | | | | | |
Repurchase Agreement | | | — | | | | 8,713,960 | | | | — | | | | 8,713,960 | |
| | | | | | | | | | | | | | | | |
| Total Investments in Securities | | $ | — | | | $ | 179,228,906 | | | $ | 931,266 | | | $ | 180,160,172 | |
| | | | | | | | | | | | | | | | |
| (a) | For a complete listing of investments and their industries, see the Portfolio of Investments. |
| (b) | The Level 3 security valued at $931,266 is held in Residential Mortgages (Collateralized Mortgage Obligations) within the Mortgage-Backed Securities section of the Portfolio of Investments. |
The Fund recognizes transfers between the levels as of the beginning of the year.
For the year ended October 31, 2016, the Fund did not have any transfers between Level 1 and Level 2 fair value measurements. (See Note 2)
The following is a reconciliation of investments in which significant unobservable inputs (Level 3) were used in determining value:
| | | | | | | | | | | | | | | | | | | | | | | | | | | | | | | | | | | | | | | | |
Investments in Securities | | Balance
as of
October 31,
2015 | | | Accrued
Discounts
(Premiums) | | | Realized
Gain
(Loss) | | | Change in
Unrealized
Appreciation
(Depreciation) | | | Purchases | | | Sales (a) | | | Transfers
in to
Level 3 | | | Transfers
out of
Level 3 | | | Balance
as of
October 31,
2016 | | | Change in
Unrealized
Appreciation
(Depreciation)
from
Investments
Still Held at
October 31,
2016 (b) | |
| Long-Term Bonds | | | | | | | | | | | | | | | | | | | | | | | | | | | | | | | | | | | | | | | | |
Mortgage-Backed Securities | | | | | | | | | | | | | | | | | | | | | | | | | | | | | | | | | | | | | | | | |
Residential Mortgages (Collateralized Mortgage Obligations) | | $ | 950,544 | | | $ | 1,172 | | | $ | 2,041 | | | $ | 40,867 | | | $ | — | | | $ | (63,358 | ) | | $ | — | | | $ | — | | | $ | 931,266 | | | $ | 31,514 | |
| | | | | | | | | | | | | | | | | | | | | | | | | | | | | | | | | | | | | | | | |
| Total | | $ | 950,544 | | | $ | 1,172 | | | $ | 2,041 | | | $ | 40,867 | | | $ | — | | | $ | (63,358 | ) | | $ | — | | | $ | — | | | $ | 931,266 | | | $ | 31,514 | |
| | | | | | | | | | | | | | | | | | | | | | | | | | | | | | | | | | | | | | | | |
| (a) | Sales include principal reductions. |
| (b) | Included in “Net change in unrealized appreciation (depreciation) on investments” in the Statement of Operations. |
| | | | |
| 14 | | MainStay Government Fund | | The notes to the financial statements are an integral part of,
and should be read in conjunction with, the financial statements. |
Statement of Assets and Liabilities as of October 31, 2016
| | | | |
| Assets | |
Investment in securities, at value
(identified cost $172,761,813) | | $ | 180,160,172 | |
Cash | | | 4,853,938 | |
Receivables: | | | | |
Investment securities sold | | | 4,850,614 | |
Interest | | | 611,143 | |
Fund shares sold | | | 72,828 | |
Other assets | | | 25,662 | |
| | | | |
Total assets | | | 190,574,357 | |
| | | | |
| |
| Liabilities | | | | |
Payables: | | | | |
Investment securities purchased | | | 16,150,089 | |
Fund shares redeemed | | | 295,799 | |
Manager (See Note 3) | | | 72,842 | |
Transfer agent (See Note 3) | | | 58,657 | |
NYLIFE Distributors (See Note 3) | | | 50,984 | |
Shareholder communication | | | 15,849 | |
Custodian | | | 11,361 | |
Professional fees | | | 10,804 | |
Trustees | | | 456 | |
Accrued expenses | | | 4,341 | |
Dividend payable | | | 15,411 | |
| | | | |
Total liabilities | | | 16,686,593 | |
| | | | |
Net assets | | $ | 173,887,764 | |
| | | | |
| |
| Composition of Net Assets | | | | |
Shares of beneficial interest outstanding (par value of $.01 per share) unlimited number of shares authorized | | $ | 202,907 | |
Additional paid-in capital | | | 166,802,829 | |
| | | | |
| | | 167,005,736 | |
Undistributed net investment income | | | 58,917 | |
Accumulated net realized gain (loss) on investments and futures transactions | | | (575,248 | ) |
Net unrealized appreciation (depreciation) on investments | | | 7,398,359 | |
| | | | |
Net assets | | $ | 173,887,764 | |
| | | | |
| | | | |
Class A | | | | |
Net assets applicable to outstanding shares | | $ | 93,241,633 | |
| | | | |
Shares of beneficial interest outstanding | | | 10,898,931 | |
| | | | |
Net asset value per share outstanding | | $ | 8.56 | |
Maximum sales charge (4.50% of offering price) | | | 0.40 | |
| | | | |
Maximum offering price per share outstanding | | $ | 8.96 | |
| | | | |
Investor Class | | | | |
Net assets applicable to outstanding shares | | $ | 40,094,390 | |
| | | | |
Shares of beneficial interest outstanding | | | 4,666,865 | |
| | | | |
Net asset value per share outstanding | | $ | 8.59 | |
Maximum sales charge (4.50% of offering price) | | | 0.40 | |
| | | | |
Maximum offering price per share outstanding | | $ | 8.99 | |
| | | | |
Class B | | | | |
Net assets applicable to outstanding shares | | $ | 7,153,523 | |
| | | | |
Shares of beneficial interest outstanding | | | 836,180 | |
| | | | |
Net asset value and offering price per share outstanding | | $ | 8.56 | |
| | | | |
Class C | | | | |
Net assets applicable to outstanding shares | | $ | 19,337,702 | |
| | | | |
Shares of beneficial interest outstanding | | | 2,261,387 | |
| | | | |
Net asset value and offering price per share outstanding | | $ | 8.55 | |
| | | | |
Class I | | | | |
Net assets applicable to outstanding shares | | $ | 14,060,516 | |
| | | | |
Shares of beneficial interest outstanding | | | 1,627,381 | |
| | | | |
Net asset value and offering price per share outstanding | | $ | 8.64 | |
| | | | |
| | | | | | |
The notes to the financial statements are an integral part of,
and should be read in conjunction with, the financial statements. | | | | | 15 | |
Statement of Operations for the year ended October 31, 2016
| | | | |
| Investment Income (Loss) | |
Income | | | | |
Interest | | $ | 4,938,827 | |
| | | | |
Expenses | | | | |
Manager (See Note 3) | | | 833,619 | |
Distribution/Service—Class A (See Note 3) | | | 227,591 | |
Distribution/Service—Investor Class (See Note 3) | | | 103,797 | |
Distribution/Service—Class B (See Note 3) | | | 78,069 | |
Distribution/Service—Class C (See Note 3) | | | 203,354 | |
Transfer agent (See Note 3) | | | 341,882 | |
Registration | | | 78,528 | |
Professional fees | | | 75,163 | |
Shareholder communication | | | 37,558 | |
Custodian | | | 21,332 | |
Trustees | | | 4,338 | |
Miscellaneous | | | 12,297 | |
| | | | |
Total expenses | | | 2,017,528 | |
Reimbursement from custodian (a) | | | (17,403 | ) |
| | | | |
Net expenses | | | 2,000,125 | |
| | | | |
Net investment income (loss) | | | 2,938,702 | |
| | | | |
|
| Realized and Unrealized Gain (Loss) on Investments and Futures Contracts | |
Net realized gain (loss) on: | | | | |
Investment transactions | | | 119,383 | |
Futures transactions | | | (29,661 | ) |
| | | | |
Net realized gain (loss) on investments and futures transactions | | | 89,722 | |
| | | | |
Net change in unrealized appreciation (depreciation) on: | | | | |
Investments | | | 808,380 | |
Futures contracts | | | (30,615 | ) |
| | | | |
Net change in unrealized appreciation (depreciation) on investments and futures contracts | | | 777,765 | |
| | | | |
Net realized and unrealized gain (loss) on investments and futures transactions | | | 867,487 | |
| | | | |
Net increase (decrease) in net assets resulting from operations | | $ | 3,806,189 | |
| | | | |
| (a) | Reimbursement from custodian represents a refund for overbilling of prior years’ custody out-of-pocket fees. |
| | | | |
| 16 | | MainStay Government Fund | | The notes to the financial statements are an integral part of,
and should be read in conjunction with, the financial statements. |
Statements of Changes in Net Assets
for the years ended October 31, 2016 and October 31, 2015
| | | | | | | | |
| | | 2016 | | | 2015 | |
| Increase (Decrease) in Net Assets | |
Operations: | | | | | | | | |
Net investment income (loss) | | $ | 2,938,702 | | | $ | 3,589,282 | |
Net realized gain (loss) on investments and futures transactions | | | 89,722 | | | | (792,858 | ) |
Net change in unrealized appreciation (depreciation) on investments and futures contracts | | | 777,765 | | | | (1,149,339 | ) |
| | | | |
Net increase (decrease) in net assets resulting from operations | | | 3,806,189 | | | | 1,647,085 | |
| | | | |
Dividends and distributions to shareholders: | | | | | | | | |
From net investment income: | | | | | | | | |
Class A | | | (1,808,126 | ) | | | (2,214,956 | ) |
Investor Class | | | (717,921 | ) | | | (913,904 | ) |
Class B | | | (77,285 | ) | | | (126,342 | ) |
Class C | | | (200,490 | ) | | | (167,451 | ) |
Class I | | | (135,148 | ) | | | (143,227 | ) |
| | | | |
| | | (2,938,970 | ) | | | (3,565,880 | ) |
| | | | |
From net realized gain on investments: | | | | | | | | |
Class A | | | — | | | | (174,799 | ) |
Investor Class | | | — | | | | (82,736 | ) |
Class B | | | — | | | | (18,280 | ) |
Class C | | | — | | | | (21,724 | ) |
Class I | | | — | | | | (17,272 | ) |
| | | | |
| | | — | | | | (314,811 | ) |
| | | | |
Total dividends and distributions to shareholders | | | (2,938,970 | ) | | | (3,880,691 | ) |
| | | | |
Capital share transactions: | | | | | | | | |
Net proceeds from sale of shares | | | 43,966,459 | | | | 29,631,569 | |
Net asset value of shares issued to shareholders in reinvestment of dividends and distributions | | | 2,705,385 | | | | 3,576,891 | |
Cost of shares redeemed | | | (36,142,554 | ) | | | (46,438,657 | ) |
| | | | |
Increase (decrease) in net assets derived from capital share transactions | | | 10,529,290 | | | | (13,230,197 | ) |
| | | | |
Net increase (decrease) in net assets | | | 11,396,509 | | | | (15,463,803 | ) |
| | |
| Net Assets | | | | | | | | |
Beginning of year | | | 162,491,255 | | | | 177,955,058 | |
| | | | |
End of year | | $ | 173,887,764 | | | $ | 162,491,255 | |
| | | | |
Undistributed (distributions in excess of) net investment income at end of year | | $ | 58,917 | | | $ | (2,390 | ) |
| | | | |
| | | | | | |
The notes to the financial statements are an integral part of,
and should be read in conjunction with, the financial statements. | | | | | 17 | |
Financial Highlights selected per share data and ratios
| | | | | | | | | | | | | | | | | | | | |
| | | Year ended October 31, | |
| Class A | | 2016 | | | 2015 | | | 2014 | | | 2013 | | | 2012 | |
Net asset value at beginning of year | | $ | 8.51 | | | $ | 8.63 | | | $ | 8.57 | | | $ | 9.02 | | | $ | 8.86 | |
| | | | | | | | | | | | | | | | | | | | |
Net investment income (loss) (a) | | | 0.17 | | | | 0.20 | | | | 0.21 | | | | 0.19 | | | | 0.22 | |
Net realized and unrealized gain (loss) on investments | | | 0.05 | | | | (0.10 | ) | | | 0.08 | | | | (0.41 | ) | | | 0.19 | |
| | | | | | | | | | | | | | | | | | | | |
Total from investment operations | | | 0.22 | | | | 0.10 | | | | 0.29 | | | | (0.22 | ) | | | 0.41 | |
| | | | | | | | | | | | | | | | | | | | |
| Less dividends and distributions: | | | | | | | | | | | | | | | | | | | | |
From net investment income | | | (0.17 | ) | | | (0.20 | ) | | | (0.21 | ) | | | (0.20 | ) | | | (0.23 | ) |
From net realized gain on investments | | | — | | | | (0.02 | ) | | | (0.02 | ) | | | (0.03 | ) | | | (0.02 | ) |
| | | | | | | | | | | | | | | | | | | | |
Total dividends and distributions | | | (0.17 | ) | | | (0.22 | ) | | | (0.23 | ) | | | (0.23 | ) | | | (0.25 | ) |
| | | | | | | | | | | | | | | | | | | | |
Net asset value at end of year | | $ | 8.56 | | | $ | 8.51 | | | $ | 8.63 | | | $ | 8.57 | | | $ | 9.02 | |
| | | | | | | | | | | | | | | | | | | | |
Total investment return (b) | | | 2.60 | % | | | 1.17 | % | | | 3.46 | % | | | (2.50 | %) | | | 4.70 | % |
| Ratios (to average net assets)/Supplemental Data: | | | | | | | | | | | | | | | | | | | | |
Net investment income (loss) | | | 1.99 | %(c) | | | 2.38 | % | | | 2.47 | % | | | 2.17 | % | | | 2.46 | % |
Net expenses | | | 0.98 | %(d) | | | 1.00 | % | | | 0.98 | % | | | 1.03 | % | | | 1.03 | % |
Expenses (before waiver/reimbursement) | | | 0.99 | % | | | 1.00 | % | | | 0.98 | % | | | 1.09 | % | | | 1.14 | % |
Portfolio turnover rate (e) | | | 41 | % | | | 13 | % | | | 14 | % | | | 28 | % | | | 37 | % |
Net assets at end of year (in 000’s) | | $ | 93,242 | | | $ | 90,119 | | | $ | 100,212 | | | $ | 143,234 | | | $ | 174,621 | |
| (a) | Per share data based on average shares outstanding during the year. |
| (b) | Total investment return is calculated exclusive of sales charges and assumes the reinvestment of dividends and distributions. |
| (c) | Without the custody fee reimbursement, Net investment income (loss) would have been 1.98%. |
| (d) | Without the custody fee reimbursement, Net expenses would have been 0.99%. |
| (e) | The portfolio turnover rates not including mortgage dollar rolls were 16%, 7% and 16% for the years ended October 31, 2016, 2013 and 2012, respectively. |
| | | | | | | | | | | | | | | | | | | | |
| | | Year ended October 31, | |
| Investor Class | | 2016 | | | 2015 | | | 2014 | | | 2013 | | | 2012 | |
Net asset value at beginning of year | | $ | 8.54 | | | $ | 8.66 | | | $ | 8.60 | | | $ | 9.05 | | | $ | 8.90 | |
| | | | | | | | | | | | | | | | | | | | |
Net investment income (loss) (a) | | | 0.15 | | | | 0.18 | | | | 0.19 | | | | 0.18 | | | | 0.21 | |
Net realized and unrealized gain (loss) on investments | | | 0.05 | | | | (0.10 | ) | | | 0.08 | | | | (0.42 | ) | | | 0.17 | |
| | | | | | | | | | | | | | | | | | | | |
Total from investment operations | | | 0.20 | | | | 0.08 | | | | 0.27 | | | | (0.24 | ) | | | 0.38 | |
| | | | | | | | | | | | | | | | | | | | |
| Less dividends and distributions: | | | | | | | | | | | | | | | | | | | | |
From net investment income | | | (0.15 | ) | | | (0.18 | ) | | | (0.19 | ) | | | (0.18 | ) | | | (0.21 | ) |
From net realized gain on investments | | | — | | | | (0.02 | ) | | | (0.02 | ) | | | (0.03 | ) | | | (0.02 | ) |
| | | | | | | | | | | | | | | | | | | | |
Total dividends and distributions | | | (0.15 | ) | | | (0.20 | ) | | | (0.21 | ) | | | (0.21 | ) | | | (0.23 | ) |
| | | | | | | | | | | | | | | | | | | | |
Net asset value at end of year | | $ | 8.59 | | | $ | 8.54 | | | $ | 8.66 | | | $ | 8.60 | | | $ | 9.05 | |
| | | | | | | | | | | | | | | | | | | | |
Total investment return (b) | | | 2.34 | % | | | 0.88 | % | | | 3.15 | % | | | (2.66 | %) | | | 4.42 | % |
| Ratios (to average net assets)/Supplemental Data: | | | | | | | | | | | | | | | | | | | | |
Net investment income (loss) | | | 1.74 | %(c) | | | 2.11 | % | | | 2.19 | % | | | 2.01 | % | | | 2.32 | % |
Net expenses | | | 1.23 | %(d) | | | 1.28 | % | | | 1.26 | % | | | 1.19 | % | | | 1.17 | % |
Expenses (before waiver/reimbursement) | | | 1.24 | % | | | 1.28 | % | | | 1.26 | % | | | 1.25 | % | | | 1.28 | % |
Portfolio turnover rate (e) | | | 41 | % | | | 13 | % | | | 14 | % | | | 28 | % | | | 37 | % |
Net assets at end of year (in 000’s) | | $ | 40,094 | | | $ | 42,444 | | | $ | 45,947 | | | $ | 50,200 | | | $ | 57,666 | |
| (a) | Per share data based on average shares outstanding during the year. |
| (b) | Total investment return is calculated exclusive of sales charges and assumes the reinvestment of dividends and distributions. |
| (c) | Without the custody fee reimbursement, Net investment income (loss) would have been 1.73%. |
| (d) | Without the custody fee reimbursement, Net expenses would have been 1.24%. |
| (e) | The portfolio turnover rates not including mortgage dollar rolls were 16%, 7% and 16% for the years ended October 31, 2016, 2013 and 2012, respectively. |
| | | | |
| 18 | | MainStay Government Fund | | The notes to the financial statements are an integral part of,
and should be read in conjunction with, the financial statements. |
Financial Highlights selected per share data and ratios
| | | | | | | | | | | | | | | | | | | | |
| | | Year ended October 31, | |
| Class B | | 2016 | | | 2015 | | | 2014 | | | 2013 | | | 2012 | |
Net asset value at beginning of year | | $ | 8.51 | | | $ | 8.63 | | | $ | 8.57 | | | $ | 9.02 | | | $ | 8.86 | |
| | | | | | | | | | | | | | | | | | | | |
Net investment income (loss) (a) | | | 0.08 | | | | 0.12 | | | | 0.12 | | | | 0.11 | | | | 0.14 | |
Net realized and unrealized gain (loss) on investments | | | 0.05 | | | | (0.10 | ) | | | 0.08 | | | | (0.42 | ) | | | 0.19 | |
| | | | | | | | | | | | | | | | | | | | |
Total from investment operations | | | 0.13 | | | | 0.02 | | | | 0.20 | | | | (0.31 | ) | | | 0.33 | |
| | | | | | | | | | | | | | | | | | | | |
| Less dividends and distributions: | | | | | | | | | | | | | | | | | | | | |
From net investment income | | | (0.08 | ) | | | (0.12 | ) | | | (0.12 | ) | | | (0.11 | ) | | | (0.15 | ) |
From net realized gain on investments | | | — | | | | (0.02 | ) | | | (0.02 | ) | | | (0.03 | ) | | | (0.02 | ) |
| | | | | | | | | | | | | | | | | | | | |
Total dividends and distributions | | | (0.08 | ) | | | (0.14 | ) | | | (0.14 | ) | | | (0.14 | ) | | | (0.17 | ) |
| | | | | | | | | | | | | | | | | | | | |
Net asset value at end of year | | $ | 8.56 | | | $ | 8.51 | | | $ | 8.63 | | | $ | 8.57 | | | $ | 9.02 | |
| | | | | | | | | | | | | | | | | | | | |
Total investment return (b) | | | 1.59 | % | | | 0.14 | % | | | 2.38 | % | | | (3.40 | %) | | | 3.77 | % |
| Ratios (to average net assets)/Supplemental Data: | | | | | | | | | | | | | | | | | | | | |
Net investment income (loss) | | | 0.99 | %(c) | | | 1.35 | % | | | 1.44 | % | | | 1.26 | % | | | 1.57 | % |
Net expenses | | | 1.98 | %(d) | | | 2.03 | % | | | 2.01 | % | | | 1.94 | % | | | 1.92 | % |
Expenses (before waiver/reimbursement) | | | 1.99 | % | | | 2.03 | % | | | 2.01 | % | | | 2.00 | % | | | 2.03 | % |
Portfolio turnover rate (e) | | | 41 | % | | | 13 | % | | | 14 | % | | | 28 | % | | | 37 | % |
Net assets at end of year (in 000’s) | | $ | 7,154 | | | $ | 8,363 | | | $ | 10,550 | | | $ | 14,783 | | | $ | 21,826 | |
| (a) | Per share data based on average shares outstanding during the year. |
| (b) | Total investment return is calculated exclusive of sales charges and assumes the reinvestment of dividends and distributions. |
| (c) | Without the custody fee reimbursement, Net investment income (loss) would have been 0.98%. |
| (d) | Without the custody fee reimbursement, Net expenses would have been 1.99%. |
| (e) | The portfolio turnover rates not including mortgage dollar rolls were 16%, 7% and 16% for the years ended October 31, 2016, 2013 and 2012, respectively. |
| | | | | | | | | | | | | | | | | | | | |
| | | Year ended October 31, | |
| Class C | | 2016 | | | 2015 | | | 2014 | | | 2013 | | | 2012 | |
Net asset value at beginning of year | | $ | 8.50 | | | $ | 8.62 | | | $ | 8.56 | | | $ | 9.01 | | | $ | 8.86 | |
| | | | | | | | | | | | | | | | | | | | |
Net investment income (loss) (a) | | | 0.08 | | | | 0.12 | | | | 0.12 | | | | 0.11 | | | | 0.14 | |
Net realized and unrealized gain (loss) on investments | | | 0.05 | | | | (0.10 | ) | | | 0.08 | | | | (0.42 | ) | | | 0.18 | |
| | | | | | | | | | | | | | | | | | | | |
Total from investment operations | | | 0.13 | | | | 0.02 | | | | 0.20 | | | | (0.31 | ) | | | 0.32 | |
| | | | | | | | | | | | | | | | | | | | |
| Less dividends and distributions: | | | | | | | | | | | | | | | | | | | | |
From net investment income | | | (0.08 | ) | | | (0.12 | ) | | | (0.12 | ) | | | (0.11 | ) | | | (0.15 | ) |
From net realized gain on investments | | | — | | | | (0.02 | ) | | | (0.02 | ) | | | (0.03 | ) | | | (0.02 | ) |
| | | | | | | | | | | | | | | | | | | | |
Total dividends and distributions | | | (0.08 | ) | | | (0.14 | ) | | | (0.14 | ) | | | (0.14 | ) | | | (0.17 | ) |
| | | | | | | | | | | | | | | | | | | | |
Net asset value at end of year | | $ | 8.55 | | | $ | 8.50 | | | $ | 8.62 | | | $ | 8.56 | | | $ | 9.01 | |
| | | | | | | | | | | | | | | | | | | | |
Total investment return (b) | | | 1.59 | % | | | 0.14 | % | | | 2.39 | % | | | (3.41 | %) | | | 3.66 | % |
| Ratios (to average net assets)/Supplemental Data: | | | | | | | | | | | | | | | | | | | | |
Net investment income (loss) | | | 0.99 | %(c) | | | 1.34 | % | | | 1.44 | % | | | 1.24 | % | | | 1.57 | % |
Net expenses | | | 1.98 | %(d) | | | 2.03 | % | | | 2.01 | % | | | 1.94 | % | | | 1.92 | % |
Expenses (before waiver/reimbursement) | | | 1.99 | % | | | 2.03 | % | | | 2.01 | % | | | 2.00 | % | | | 2.03 | % |
Portfolio turnover rate (e) | | | 41 | % | | | 13 | % | | | 14 | % | | | 28 | % | | | 37 | % |
Net assets at end of year (in 000’s) | | $ | 19,338 | | | $ | 17,073 | | | $ | 11,226 | | | $ | 12,593 | | | $ | 27,610 | |
| (a) | Per share data based on average shares outstanding during the year. |
| (b) | Total investment return is calculated exclusive of sales charges and assumes the reinvestment of dividends and distributions. |
| (c) | Without the custody fee reimbursement, Net investment income (loss) would have been 0.98%. |
| (d) | Without the custody fee reimbursement, Net expenses would have been 1.99%. |
| (e) | The portfolio turnover rates not including mortgage dollar rolls were 16%, 7% and 16% for the years ended October 31, 2016, 2013 and 2012, respectively. |
| | | | | | |
The notes to the financial statements are an integral part of,
and should be read in conjunction with, the financial statements. | | | | | 19 | |
Financial Highlights selected per share data and ratios
| | | | | | | | | | | | | | | | | | | | |
| | | Year ended October 31, | |
| Class I | | 2016 | | | 2015 | | | 2014 | | | 2013 | | | 2012 | |
Net asset value at beginning of year | | $ | 8.59 | | | $ | 8.71 | | | $ | 8.65 | | | $ | 9.10 | | | $ | 8.94 | |
| | | | | | | | | | | | | | | | | | | | |
Net investment income (loss) (a) | | | 0.19 | | | | 0.22 | | | | 0.23 | | | | 0.21 | | | | 0.24 | |
Net realized and unrealized gain (loss) on investments | | | 0.05 | | | | (0.09 | ) | | | 0.09 | | | | (0.41 | ) | | | 0.19 | |
| | | | | | | | | | | | | | | | | | | | |
Total from investment operations | | | 0.24 | | | | 0.13 | | | | 0.32 | | | | (0.20 | ) | �� | | 0.43 | |
| | | | | | | | | | | | | | | | | | | | |
| Less dividends and distributions: | | | | | | | | | | | | | | | | | | | | |
From net investment income | | | (0.19 | ) | | | (0.23 | ) | | | (0.24 | ) | | | (0.22 | ) | | | (0.25 | ) |
From net realized gain on investments | | | — | | | | (0.02 | ) | | | (0.02 | ) | | | (0.03 | ) | | | (0.02 | ) |
| | | | | | | | | | | | | | | | | | | | |
Total dividends and distributions | | | (0.19 | ) | | | (0.25 | ) | | | (0.26 | ) | | | (0.25 | ) | | | (0.27 | ) |
| | | | | | | | | | | | | | | | | | | | |
Net asset value at end of year | | $ | 8.64 | | | $ | 8.59 | | | $ | 8.71 | | | $ | 8.65 | | | $ | 9.10 | |
| | | | | | | | | | | | | | | | | | | | |
Total investment return (b) | | | 2.83 | % | | | 1.41 | % | | | 3.69 | % | | | (2.24 | %) | | | 4.92 | % |
| Ratios (to average net assets)/Supplemental Data: | | | | | | | | | | | | | | | | | | | | |
Net investment income (loss) | | | 2.16 | %(c) | | | 2.57 | % | | | 2.70 | % | | | 2.42 | % | | | 2.69 | % |
Net expenses | | | 0.73 | %(d) | | | 0.75 | % | | | 0.73 | % | | | 0.78 | % | | | 0.78 | % |
Expenses (before waiver/reimbursement) | | | 0.74 | % | | | 0.75 | % | | | 0.73 | % | | | 0.84 | % | | | 0.89 | % |
Portfolio turnover rate (e) | | | 41 | % | | | 13 | % | | | 14 | % | | | 28 | % | | | 37 | % |
Net assets at end of year (in 000’s) | | $ | 14,061 | | | $ | 4,492 | | | $ | 10,020 | | | $ | 3,561 | | | $ | 5,753 | |
| (a) | Per share data based on average shares outstanding during the year. |
| (b) | Total investment return is calculated exclusive of sales charges and assumes the reinvestment of dividends and distributions. Class I shares are not subject to sales charges. |
| (c) | Without the custody fee reimbursement, Net investment income (loss) would have been 2.15%. |
| (d) | Without the custody fee reimbursement, Net expenses would have been 0.74%. |
| (e) | The portfolio turnover rates not including mortgage dollar rolls were 16%, 7% and 16% for the years ended October 31, 2016, 2013 and 2012, respectively. |
| | | | |
| 20 | | MainStay Government Fund | | The notes to the financial statements are an integral part of,
and should be read in conjunction with, the financial statements. |
Notes to Financial Statements
Note 1–Organization and Business
The MainStay Funds (the “Trust”) was organized on January 9, 1986, as a Massachusetts business trust. The Trust is registered under the Investment Company Act of 1940, as amended (the “1940 Act”), as an open-end management investment company, and is comprised of twelve funds (collectively referred to as the “Funds”). These financial statements and notes relate to the MainStay Government Fund (the “Fund”), a “diversified” fund, as that term is defined in the 1940 Act, as interpreted or modified by regulatory authorities having jurisdiction, from time to time.
The Fund currently offers five classes of shares. Class A shares commenced operations on January 3, 1995. Class B shares commenced operations on May 1, 1986. Class C shares commenced operations on September 1, 1998. Class I shares commenced operations on January 2, 2004. Investor Class shares commenced operations on February 28, 2008. Class A and Investor Class shares are offered at net asset value (“NAV”) per share plus an initial sales charge. No initial sales charge applies to investments of $1 million or more (and certain other qualified purchases) in Class A and Investor Class shares, but a contingent deferred sales charge (“CDSC”) of 1.00% may be imposed on certain redemptions of such shares made within one year of the date of purchase on shares that were purchased without an initial sales charge made before January 1, 2017. Effective January 1, 2017, a CDSC of 1.00% may be imposed on certain redemptions of Class A and Investor Class shares made within 24 months of the date of purchase of such shares that were made without an initial sales charge. Class B and Class C shares are offered at NAV without an initial sales charge, although a CDSC that declines depending on the number of years a shareholder has held its Class B shares may be imposed on redemptions made within six years of the date of purchase of such shares and a 1.00% CDSC may be imposed on redemptions made within one year of the date of purchase of Class C shares. Class I shares are offered at NAV and are not subject to a sales charge. Depending upon eligibility, Class B shares convert to either Class A or Investor Class shares at the end of the calendar quarter eight years after the date they were purchased. Additionally, depending upon eligibility, Class A shares may convert to Investor Class shares and Investor Class shares may convert to Class A shares. Under certain circumstances and as may be permitted by the Trust’s multiple class plan under Rule 18f-3 of the 1940 Act, an exchange/conversion may be made from specified share classes of the Fund to one or more other share classes of the Fund as disclosed in the capital share transactions within these notes. The five classes of shares have the same voting (except for issues that relate solely to one class), dividend, liquidation and other rights, and the same terms and conditions, except that Class B and Class C shares are subject to higher distribution and/or service fee rates than Class A and Investor Class shares under a distribution plan pursuant to Rule 12b-1 under the 1940 Act. Class I shares are not subject to a distribution and/or service fee.
The Fund’s investment objective is to seek current income.
Note 2–Significant Accounting Policies
The Fund is an investment company and accordingly follows the investment company accounting and reporting guidance of the Financial Accounting Standards Board (“FASB”) Accounting Standard Codification
Topic 946 Financial Services—Investment Companies. The Fund prepares its financial statements in accordance with generally accepted accounting principles (“GAAP”) in the United States of America and follows the significant accounting policies described below.
(A) Securities Valuation. Investments are usually valued as of the close of regular trading on the New York Stock Exchange (the “Exchange”) (usually 4:00 p.m. Eastern time) on each day the Fund is open for business (“valuation date”).
The Board of Trustees (the “Board”) adopted procedures establishing methodologies for the valuation of the Fund’s securities and other assets and delegated the responsibility for valuation determinations under those procedures to the Valuation Committee of the Trust (the “Valuation Committee”). The Board authorized the Valuation Committee to appoint a Valuation Sub-Committee (the “Sub-Committee”) to deal in the first instance with establishing the prices of securities for which market quotations are not readily available or the prices of which are not otherwise readily determinable under these procedures. The Sub-Committee meets (in person, via electronic mail or via teleconference) on an as-needed basis. Subsequently, the Valuation Committee meets to ensure that actions taken by the Sub-Committee were appropriate. The procedures recognize that, subject to the oversight of the Board and unless otherwise noted, the responsibility for the day-to-day valuation of portfolio assets (including fair value measurements for the Fund’s assets and liabilities) rests with New York Life Investment Management LLC (“New York Life Investments” or the “Manager”), aided to whatever extent necessary by the Subadvisor (as defined in Note 3(A)) to the Fund.
To assess the appropriateness of security valuations, the Manager, Subadvisor or the Fund’s third party service provider, who is subject to oversight by the Manager, regularly compares prior day prices, prices on comparable securities, and the sale prices to the prior and current day prices and challenges prices with changes exceeding certain tolerance levels with third party pricing services or broker sources. For those securities valued through either a standardized fair valuation methodology or a fair valuation measurement, the Sub-Committee deals in the first instance with such valuation and the Valuation Committee reviews and affirms, if appropriate, the reasonableness of the valuation based on such methodologies and measurements on a regular basis after considering all relevant information that is reasonably available. Any action taken by the Sub-Committee with respect to the valuation of a portfolio security or other asset is submitted by the Valuation Committee to the Board for its review and ratification, if appropriate, at its next regularly scheduled meeting.
“Fair value” is defined as the price the Fund would reasonably expect to receive upon selling an asset or liability in an orderly transaction to an independent buyer in the principal or most advantageous market for the asset or liability. Fair value measurements are determined within a framework that establishes a three-tier hierarchy which maximizes the use of observable market data and minimizes the use of unobservable inputs to establish a classification of fair value measurements for disclosure purposes. “Inputs” refer broadly to the assumptions that market participants would use in pricing the asset or liability, including assumptions about risk, such as the risk inherent in a particular valuation technique used to measure fair value using a pricing model and/or the risk inherent in the inputs for the valuation technique. Inputs may be
Notes to Financial Statements (continued)
observable or unobservable. Observable inputs reflect the assumptions market participants would use in pricing the asset or liability based on market data obtained from sources independent of the Fund. Unobservable inputs reflect the Fund’s own assumptions about the assumptions market participants would use in pricing the asset or liability based on the information available. The inputs or methodology used for valuing assets or liabilities may not be an indication of the risks associated with investing in those assets or liabilities. The three-tier hierarchy of inputs is summarized below.
| • | | Level 1—quoted prices in active markets for an identical asset or liability |
| • | | Level 2—other significant observable inputs (including quoted prices for a similar asset or liability in active markets, interest rates and yield curves, prepayment speeds, credit risk, etc.) |
| • | | Level 3—significant unobservable inputs (including the Fund’s own assumptions about the assumptions that market participants would use in measuring fair value of an asset or liability) |
The level of an asset or liability within the fair value hierarchy is based on the lowest level of an input, both individually and in the aggregate, that is significant to the fair value measurement. As of October 31, 2016, the aggregate value by input level of the Fund’s assets and liabilities is included at the end of the Fund’s Portfolio of Investments.
The Fund may use third party vendor evaluations, whose prices may be derived from one or more of the following standard inputs, among others:
| | |
• Benchmark yields | | • Reported trades |
• Broker/dealer quotes | | • Issuer spreads |
• Two-sided markets | | • Benchmark securities |
• Bids/offers | | • Reference data (corporate actions or material event notices) |
• Industry and economic events | | • Comparable bonds |
• Monthly payment information | | |
An asset or liability for which market values cannot be measured using the methodologies described above is valued by methods deemed reasonable in good faith by the Valuation Committee, following the procedures established by the Board, to represent fair value. Under these procedures, the Fund generally uses a market-based approach which may use related or comparable assets or liabilities, recent transactions, market multiples, book values, and other relevant information. The Fund may also use an income-based valuation approach in which the anticipated future cash flows of the asset or liability are discounted to calculate fair value. Discounts may also be applied due to the nature and/or duration of any restrictions on the disposition of the asset or liability. Fair value represents a good faith approximation of the value of a security. Fair value determinations involve the consideration of a number of subjective factors, an analysis of applicable facts and circumstances and the exercise of judgment. As a result, it is possible that the fair value for a security determined in good faith in accordance with the Fund’s valuation procedures may differ from valuations for the same security determined by other funds using their own valuation procedures. Although the Fund’s valuation procedures are designed to value a security at the price the Fund may reasonably expect to receive upon its sale in an orderly transaction, there can be no assurance that
any fair value determination thereunder would, in fact, approximate the amount that the Fund would actually realize upon the sale of the security or the price at which the security would trade if a reliable market price were readily available. During the year ended October 31, 2016, there were no material changes to the fair value methodologies.
Equity and non-equity securities which may be valued in this manner include, but are not limited to: (i) a security for which trading has been halted or suspended; (ii) a debt security that has recently gone into default and for which there is not a current market quotation; (iii) a security of an issuer that has entered into a restructuring; (iv) a security that has been de-listed from a national exchange; (v) a security for which the market price is not readily available from a third party pricing source or, if so provided, does not, in the opinion of the Manager or Subadvisor reflect the security’s market value; (vi) a security subject to trading collars for which no or limited trading takes place; and (vii) a security whose principal market has been temporarily closed at a time when, under normal conditions, it would be open. Securities for which market quotations or observable inputs are not readily available are generally categorized as Level 3 in the hierarchy. As of October 31, 2016, a security that was fair valued in such a manner is shown in the Portfolio of Investments.
Futures contracts are valued at the last posted settlement price on the market where such futures are primarily traded. Investments in mutual funds, including money market funds, are valued at their respective NAVs as of the close of the Exchange on the valuation date. These securities are generally categorized as Level 1 in the hierarchy.
Debt securities (other than convertible and municipal bonds) are valued at the evaluated bid prices (evaluated mean prices in the case of convertible and municipal bonds) supplied by a pricing agent or brokers selected by the Manager, in consultation with the Subadvisor. Those values reflect broker/dealer supplied prices and electronic data processing techniques, if the evaluated bid or mean prices are deemed by the Manager, in consultation with the Subadvisor, to be representative of market values, at the regular close of trading of the Exchange on each valuation date. Debt securities purchased on a delayed delivery basis are marked to market daily until settlement at the forward settlement date. Debt securities, including corporate bonds, U.S. government & federal agency bonds, municipal bonds, foreign bonds, convertible bonds, asset-backed securities and mortgage-backed securities are generally categorized as Level 2 in the hierarchy.
Temporary cash investments acquired in excess of 60 days to maturity at the time of purchase are valued using the latest bid prices or using valuations based on a matrix system (which considers such factors as security prices, yields, maturities, and ratings), both as furnished by independent pricing services. Other temporary cash investments which mature in 60 days or less at the time of purchase (“Short-Term Investments”) are valued using the amortized cost method of valuation, unless the use of such method would be inappropriate. The amortized cost method involves valuing a security at its cost on the date of purchase and thereafter assuming a constant amortization to maturity of the difference between such cost and the value on maturity date. Amortized cost approximates the current fair value of a security. Securities valued using the amortized cost method are not valued using quoted prices in an active market and are generally categorized as Level 2 in the hierarchy.
| | |
| 22 | | MainStay Government Fund |
The information above is not intended to reflect an exhaustive list of the methodologies that may be used to value portfolio investments. The valuation procedures permit the use of a variety of valuation methodologies in connection with valuing portfolio investments. The methodology used for a specific type of investment may vary based on the market data available or other considerations. The methodologies summarized above may not represent the specific means by which portfolio investments are valued on any particular business day.
A Fund security or other asset may be determined to be illiquid under procedures approved by the Board. Illiquidity of a security might prevent the sale of such security at a time when the Manager or Subadvisor might wish to sell, and these securities could have the effect of decreasing the overall level of the Fund’s liquidity. Further, the lack of an established secondary market may make it more difficult to value illiquid securities, requiring the Fund to rely on judgments that may be somewhat subjective in measuring value, which could vary materially from the amount that the Fund could realize upon disposition. Difficulty in selling illiquid securities may result in a loss or may be costly to the Fund. Under the supervision of the Board, the Manager or Subadvisor determines the liquidity of the Fund’s investments; in doing so, the Manager or Subadvisor may consider various factors, including (i) the frequency of trades and quotations, (ii) the number of dealers and prospective purchasers, (iii) dealer undertakings to make a market, and (iv) the nature of the security and the market in which it trades (e.g., the time needed to dispose of the security, the method of soliciting offers and the mechanics of transfer). Illiquid securities are often valued in accordance with methods deemed by the Board in good faith to be reasonable and appropriate to accurately reflect their fair value. The liquidity of the Fund’s investments, as shown in the Portfolio of Investments, was determined as of October 31, 2016 and can change at any time in response to, among other relevant factors, market conditions or events or developments with respect to an individual issuer or instrument. As of October 31, 2016, securities deemed to be illiquid under procedures approved by the Board are shown in the Portfolio of Investments.
(B) Income Taxes. The Fund’s policy is to comply with the requirements of the Internal Revenue Code of 1986, as amended (the “Internal Revenue Code”), applicable to regulated investment companies and to distribute all of its taxable income to the shareholders of the Fund within the allowable time limits. Therefore, no federal, state and local income tax provisions are required.
Management evaluates the Fund’s tax positions to determine if the tax positions taken meet the minimum recognition threshold in connection with accounting for uncertainties in income tax positions taken or expected to be taken for the purposes of measuring and recognizing tax liabilities in the financial statements. Recognition of tax benefits of an uncertain tax position is permitted only to the extent the position is “more likely than not” to be sustained assuming examination by taxing authorities. Management has analyzed the Fund’s tax positions taken on federal, state and local income tax returns for all open tax years (for up to three tax years), and has concluded that no provisions for federal, state and local income tax are required in the Fund’s financial statements. The Fund’s federal, state and local income and federal excise tax returns for tax years for which the applicable statutes of limitations have not expired are subject to examination by the Internal Revenue Service and state and local departments of revenue.
(C) Dividends and Distributions to Shareholders. Dividends and distributions are recorded on the ex-dividend date. The Fund intends to declare and pay dividends from net investment income, if any, at least monthly and distributions from net realized capital and currency gains, if any, at least annually. Unless the shareholder elects otherwise, all dividends and distributions are reinvested in the same class of shares of the Fund, at NAV. Dividends and distributions to shareholders are determined in accordance with federal income tax regulations and may differ from GAAP.
(D) Security Transactions and Investment Income. The Fund records security transactions on the trade date. Realized gains and losses on security transactions are determined using the identified cost method. Interest income is accrued as earned using the effective interest rate method and includes any realized gains and losses from repayments of principal on mortgage-backed securities. Discounts and premiums on securities purchased, other than Short-Term Investments, for the Fund are accreted and amortized, respectively, on the effective interest rate method over the life of the respective securities. Discounts and premiums on Short-Term Investments are accreted and amortized, respectively, on the straight-line method. The straight-line method approximates the effective interest method for short-term investments.
Investment income and realized and unrealized gains and losses on investments of the Fund are allocated to separate classes of shares pro rata based upon their relative net assets on the date the income is earned or realized and unrealized gains and losses are incurred.
The Fund may place a debt security on non-accrual status and reduce related interest income by ceasing current accruals and writing off all or a portion of any interest receivables when the collection of all or a portion of such interest has become doubtful. A debt security is removed from non-accrual status when the issuer resumes interest payments or when collectability of interest is reasonably assured.
(E) Expenses. Expenses of the Trust are allocated to the individual Funds in proportion to the net assets of the respective Funds when the expenses are incurred, except where direct allocations of expenses can be made. Expenses (other than transfer agent expenses and fees incurred under the shareholder services plans and/or the distribution plans further discussed in Note 3(B)) are allocated to separate classes of shares pro rata based upon their relative net assets on the date the expenses are incurred. The expenses borne by the Fund, including those of related parties to the Fund, are shown in the Statement of Operations.
(F) Use of Estimates. In preparing financial statements in conformity with GAAP, management makes estimates and assumptions that affect the reported amounts and disclosures in the financial statements. Actual results could differ from those estimates.
(G) Repurchase Agreements. The Fund may enter into repurchase agreements to earn income. The Fund may enter into repurchase agreements only with financial institutions that are deemed by the Manager or Subadvisor to be creditworthy, pursuant to guidelines established by the Board. During the term of any repurchase agreement, the Manager or Subadvisor will continue to monitor the creditworthiness of the seller. Under the 1940 Act, repurchase agreements are considered to be collateralized loans by the Fund to the seller secured by the securities transferred to the Fund.
Notes to Financial Statements (continued)
When the Fund enters into repurchase agreements, the Fund’s custodian takes possession of the collateral pledged for investments in the repurchase agreement. The underlying collateral is valued daily on a mark to market basis to determine if the value, including accrued interest, exceeds the repurchase price. In the event of the seller’s default on the obligation to repurchase, the Fund has the right to liquidate the collateral and apply the proceeds in satisfaction of the obligation. Under certain circumstances, such as in the event of default or bankruptcy by the counterparty to the agreement, realization and/or retention of the collateral may be subject to legal proceedings and possible realized loss to the Fund.
(H) Futures Contracts. A futures contract is an agreement to purchase or sell a specified quantity of an underlying instrument at a specified future date and price, or to make or receive a cash payment based on the value of a financial instrument (e.g., foreign currency, interest rate, security, or securities index). The Fund is subject to risks such as market price risk and/or interest rate risk in the normal course of investing in these transactions. Upon entering into a futures contract, the Fund is required to pledge to the broker or futures commission merchant an amount of cash and/or U.S. Government securities equal to a certain percentage of the collateral amount, known as the “initial margin.” During the period the futures contract is open, changes in the value of the contract are recognized as unrealized appreciation or depreciation by marking to market such contract on a daily basis to reflect the market value of the contract at the end of each day’s trading. The Fund agrees to receive from or pay to the broker or futures commission merchant an amount of cash equal to the daily fluctuation in the value of the contract. Such receipts or payments are known as “variation margin.” When the futures contract is closed, the Fund records a realized gain or loss equal to the difference between the proceeds from (or cost of) the closing transaction and the Fund’s basis in the contract.
The use of futures contracts involves, to varying degrees, elements of market risk in excess of the amount recognized in the Statement of Assets and Liabilities. The contract or notional amounts and variation margin reflect the extent of the Fund’s involvement in open futures positions. There are several risks associated with the use of futures contracts as hedging techniques. There can be no assurance that a liquid market will exist at the time when the Fund seeks to close out a futures contract. If no liquid market exists, the Fund would remain obligated to meet margin requirements until the position is closed. Futures may involve a small initial investment relative to the risk assumed, which could result in losses greater than if they had not been used. Futures may be more volatile than direct investments in the instrument underlying the futures, and may not correlate to the underlying instrument, causing a given hedge not to achieve its objectives. The Fund’s activities in futures contracts have minimal counterparty risk as they are conducted through regulated exchanges that guarantee the futures against default by the counterparty. In the event of a bankruptcy or insolvency of a futures commission merchant that holds margin on behalf of the Fund, the Fund may not be entitled to the return of the entire margin owed to the Fund, potentially resulting in a loss. The Fund’s investment in futures contracts and other derivatives may increase the volatility of the Fund’s NAV and may result in a loss to the Fund.
(I) Dollar Rolls. The Fund may enter into dollar roll transactions in which it sells mortgage-backed securities (“MBS”) from its portfolio to a counterparty from whom it simultaneously agrees to buy a similar security on a delayed delivery basis. The Fund generally transfers MBS where the MBS are “to be announced,” therefore, the Fund accounts for these transactions as purchases and sales. The securities sold in connection with the dollar rolls are removed from the portfolio and a realized gain or loss is recognized. The securities the Fund has agreed to acquire are included at market value in the Portfolio of Investments and liabilities for such purchase commitments are included as payables for investments purchased. During the roll period, the Fund foregoes principal and interest paid on the securities. The Fund is compensated by the difference between the current sales price and the forward price for the future as well as by the earnings on the cash proceeds of the initial sale. Dollar rolls may be renewed without physical delivery of the securities subject to the contract. The Fund maintains liquid assets from its portfolio having a value not less than the repurchase price, including accrued interest. Dollar roll transactions involve certain risks, including the risk that the security returned to the Fund at the end of the roll period, while substantially similar, could be inferior to what was initially sold to the counterparty.
The Fund accounts for a dollar roll transaction as a purchase and sale whereby the difference in the sales price and purchase price of the security sold is recorded as a realized gain (loss).
(J) Securities Lending. In order to realize additional income, the Fund may engage in securities lending, subject to the limitations set forth in the 1940 Act and relevant guidance by the staff of the Securities and Exchange Commission (“SEC”). In the event the Fund does engage in securities lending, the Fund will lend through its custodian, State Street Bank and Trust Company (“State Street”). State Street will manage the Fund’s cash collateral in accordance with the lending agreement between the Fund and State Street, and indemnify the Fund against counterparty risk. The loans will be collateralized by cash or securities at least equal at all times to the market value of the securities loaned. Collateral will consist of U.S. government securities, cash equivalents or irrevocable letters of credit. The Fund may bear the risk of delay in recovery of, or loss of rights in, the securities loaned should the borrower of the securities experience financial difficulty. The Fund may also record a realized gain or loss on securities deemed sold due to a borrower’s inability to return securities on loan. The Fund bears the risk of any loss on investment of the collateral. The Fund will receive compensation for lending its securities in the form of fees or it will retain a portion of interest on the investment of any cash received as collateral. The Fund will also continue to receive interest and dividends on the securities loaned and any gain or loss in the market price of the securities loaned that may occur during the term of the loan will be for the account of the Fund. During the year ended October 31, 2016, the Fund did not have any portfolio securities on loan.
(K) Government Securities Risk. Investments in the Fund are not guaranteed, even though some of the Fund’s underlying investments are guaranteed by the U.S. government or its agencies or instrumentalities. The principal risk of mortgage-related and asset-backed securities is that the underlying debt may be prepaid ahead of schedule, if interest rates fall, thereby reducing the value of the fund’s investment. If interest rates rise, less of the debt may be prepaid and
| | |
| 24 | | MainStay Government Fund |
the fund may lose money. Funds that invest in bonds are subject to interest-rate risk and can lose principal value when interest rates rise. Bonds are also subject to credit risk, in which the bond issuer may fail to pay interest and principal in a timely manner.
(L) Indemnifications. Under the Trust’s organizational documents, its officers and trustees are indemnified against certain liabilities that may arise out of performance of their duties to the Trust. Additionally, in the normal course of business, the Fund enters into contracts with third-party service providers that contain a variety of representations and warranties and which may provide general indemnifications. The Fund’s maximum exposure under these arrangements is unknown, as this would involve future claims that may be made against the Fund that have not yet occurred. Based on experience, management is of the view that the risk of loss in connection with these potential indemnification obligations is remote. However, there can be no assurance that material liabilities related to such obligations will not arise in the future, which could adversely impact the Fund.
(M) Quantitative Disclosure of Derivative Holdings. The following tables show additional disclosures related to the Fund’s derivative and hedging activities, including how such activities are accounted for and their effect on the Fund’s financial positions, performance and cash flows. The Fund entered into futures contracts to help manage the duration and yield curve positioning of the portfolio while minimizing the exposure to wider bid/ask spreads in traditional bonds. These derivatives are not accounted for as hedging instruments.
The effect of derivative instruments on the Statement of Operations for the year ended October 31, 2016:
Realized Gain (Loss)
| | | | | | | | | | |
| | | Statement of
Operations
Location | | Interest
Rate
Contracts
Risk | | | Total | |
Futures Contracts | | Net realized gain (loss) on futures transactions | | $ | (29,661 | ) | | $ | (29,661 | ) |
| | | | | | |
Total Realized Gain (Loss) | | | | $ | (29,661 | ) | | $ | (29,661 | ) |
| | | | | | |
Change in Unrealized Appreciation (Depreciation)
| | | | | | | | | | |
| | | Statement of
Operations
Location | | Interest
Rate
Contracts
Risk | | | Total | |
Futures Contracts | | Net change in unrealized appreciation (depreciation) on futures contracts | | $ | (30,615 | ) | | $ | (30,615 | ) |
| | | | | | |
Total Change in Unrealized Appreciation (Depreciation) | | | | $ | (30,615 | ) | | $ | (30,615 | ) |
| | | | | | |
Average Notional Amount
| | | | | | | | |
| | | Interest
Rate
Contracts
Risk | | | Total | |
Futures Contracts Short (a) | | $ | (8,391,169 | ) | | $ | (8,391,169 | ) |
| | | | |
| (a) | Positions were open five months during the reporting period. |
Note 3–Fees and Related Party Transactions
(A) Manager and Subadvisor. New York Life Investments, a registered investment adviser and an indirect, wholly-owned subsidiary of New York Life Insurance Company (“New York Life”), serves as the Fund’s Manager, pursuant to an Amended and Restated Management Agreement (“Management Agreement”). The Manager provides offices, conducts clerical, recordkeeping and bookkeeping services, and keeps most of the financial and accounting records required to be maintained by the Fund. Except for the portion of salaries and expenses that are the responsibility of the Fund, the Manager pays the salaries and expenses of all personnel affiliated with the Fund and certain operational expenses of the Fund. The Fund reimburses New York Life Investments in an amount equal to a portion of the compensation of the Chief Compliance Officer of the Fund. MacKay Shields LLC (“MacKay Shields” or the “Subadvisor”), a registered investment adviser and an indirect, wholly-owned subsidiary of New York Life, serves as Subadvisor to the Fund and is responsible for the day-to-day portfolio management of the Fund. Pursuant to the terms of the Amended and Restated Subadvisory Agreement (“Subadvisory Agreement”) between New York Life Investments and MacKay Shields, New York Life Investments pays for the services of the Subadvisor.
Under the Management Agreement, the Fund pays the Manager a monthly fee for services performed and facilities furnished at an annual rate of its average daily net assets as follows: 0.50% up to $500 million; 0.475% from $500 million to $1 billion; and 0.45% in excess of $1 billion.
During the year ended October 31, 2016, the effective management fee rate was 0.50%.
New York Life Investments has contractually agreed to waive fees and/or reimburse expenses so that Total Annual Fund Operating Expenses for the Fund’s Class A shares do not exceed 1.00% of its average daily net assets. New York Life Investments will apply an equivalent waiver or reimbursement, in an equal number of basis points, to the other share classes of the Fund. This agreement will remain in effect until March 1, 2017, and shall renew automatically for one-year terms unless New York Life Investments provides written notice of termination prior to the start of the next term or upon approval by the Board. Total Annual Fund Operating Expenses excludes taxes, interest, litigation, extraordinary expenses, brokerage and other transaction expenses relating to the purchase or sale of portfolio investments, and acquired (underlying) fund fees and expenses.
During the year ended October 31, 2016, New York Life Investments earned fees from the Fund in the amount of $833,619.
State Street provides sub-administration and sub-accounting services to the Fund pursuant to an agreement with New York Life Investments.
Notes to Financial Statements (continued)
These services include calculating the daily NAVs of the Fund, maintaining the general ledger and sub-ledger accounts for the calculation of the Fund’s NAVs, and assisting New York Life Investments in conducting various aspects of the Fund’s administrative operations. For providing these services to the Fund, State Street is compensated by New York Life Investments.
(B) Distribution and Service Fees. The Trust, on behalf of the Fund, has entered into a distribution agreement with NYLIFE Distributors LLC (the “Distributor”), an indirect, wholly-owned subsidiary of New York Life. The Fund has adopted distribution plans (the “Plans”) in accordance with the provisions of Rule 12b-1 under the 1940 Act.
Pursuant to the Class A and Investor Class Plans, the Distributor receives a monthly distribution fee from the Class A and Investor Class shares at an annual rate of 0.25% of the average daily net assets of the Class A and Investor Class shares for distribution and/or service activities as designated by the Distributor. Pursuant to the Class B and Class C Plans, Class B and Class C shares pay the Distributor a monthly distribution fee at an annual rate of 0.75% of the average daily net assets of the Class B and Class C shares along with a service fee at an annual rate of 0.25% of the average daily net assets of the Class B and Class C shares, for a total 12b-1 fee of 1.00%. Class I shares are not subject to a distribution and/or service fee.
The Plans provide that the distribution and service fees are payable to the Distributor regardless of the amounts actually expended by the Distributor for distribution of the Fund’s shares and service activities.
(C) Sales Charges. During the year ended October 31, 2016, the Fund was advised by the Distributor that the amount of initial sales charges retained on sales of Class A and Investor Class shares were $14,442 and $6,313, respectively. During the year ended October 31, 2016, the Fund was also advised that the Distributor retained CDSCs on redemptions of Class A, Class B and Class C shares of $160, $30,061 and $2,881, respectively.
(D) Transfer, Dividend Disbursing and Shareholder Servicing Agent. NYLIM Service Company LLC, an affiliate of New York Life Investments, is the Fund’s transfer, dividend disbursing and shareholder servicing agent pursuant to an agreement between NYLIM Service Company LLC and the Trust. NYLIM Service Company LLC has entered into an agreement with Boston Financial Data Services, Inc. (“BFDS”) pursuant to which BFDS performs certain transfer agent services on behalf of NYLIM Service Company LLC. During the year ended October 31, 2016, transfer agent expenses incurred by the Fund were as follows:
| | | | |
Class A | | $ | 92,592 | |
Investor Class | | | 144,913 | |
Class B | | | 27,237 | |
Class C | | | 70,981 | |
Class I | | | 6,159 | |
(E) Small Account Fee. Shareholders with small accounts adversely impact the cost of providing transfer agency services. In an effort to reduce total transfer agency expenses, the Fund has implemented a small account fee on certain types of accounts. Certain shareholders with an account balance of less than $1,000 are charged an annual per account fee of $20 (assessed semi-annually), the
proceeds from which offset transfer agent fees as reflected in the Statement of Operations.
Note 4–Federal Income Tax
As of October 31, 2016, the components of accumulated gain (loss) on a tax basis were as follows:
| | | | | | | | | | | | | | | | |
Ordinary
Income | | Accumulated
Capital and Other Gain (Loss) | | | Other
Temporary
Differences | | | Unrealized
Appreciation
(Depreciation) | | | Total
Accumulated Gain (Loss) | |
$74,328 | | $ | (575,248 | ) | | $ | (15,411 | ) | | $ | 7,398,359 | | | $ | 6,882,028 | |
The other temporary differences are primarily due to dividends payable.
The following table discloses the current year reclassifications between undistributed net investment income (loss), accumulated net realized gain (loss) on investments, and additional paid-in capital arising from permanent differences; net assets as of October 31, 2016 were not affected.
| | | | |
Undistributed
Net Investment
Income (Loss) | | Accumulated
Net Realized
Gain (Loss) on
Investments | | Additional
Paid-In
Capital |
| $61,575 | | $(61,575) | | $— |
The reclassifications for the Fund are primarily due to mortage dollar rolls.
As of October 31, 2016, for federal income tax purposes, capital loss carryforwards of $575,248 were available as shown in the table below, to the extent provided by the regulations to offset future realized gains of the Fund through the years indicated. To the extent that these capital loss carryforwards are used to offset future realized gains, it is probable that the capital gains so offset will not be distributed to shareholders. No capital gain distributions shall be made until any capital loss carryforwards have been fully utilized.
| | | | | | | | |
Capital Loss
Available Through | | Short-Term
Capital Loss
Amounts (000’s) | | | Long-Term
Capital Loss
Amounts (000’s) | |
| Unlimited | | $ | 278 | | | $ | 297 | |
During the years ended October 31, 2016 and October 31, 2015, the tax character of distributions paid as reflected in the Statements of Changes in Net Assets was as follows:
| | | | | | | | |
| | | 2016 | | | 2015 | |
Distributions paid from: | | | | | | | | |
Ordinary Income | | $ | 2,938,970 | | | $ | 3,566,075 | |
Long-Term Capital Gain | | | — | | | | 314,616 | |
Total | | $ | 2,938,970 | | | $ | 3,880,691 | |
Note 5–Custodian
State Street is the custodian of cash and securities held by the Fund. Custodial fees are charged to the Fund based on the Fund’s net assets and/or the market value of securities held by the Fund and the number of certain transactions incurred by the Fund.
| | |
| 26 | | MainStay Government Fund |
Note 6–Line of Credit
The Fund and certain other funds managed by New York Life Investments, maintain a line of credit with a syndicate of banks in order to secure a source of funds for temporary purposes to meet unanticipated or excessive redemption requests.
Effective August 2, 2016, under an amended and restated credit agreement (the “Credit Agreement”), the aggregate commitment amount is $600,000,000 with an additional uncommitted amount of $100,000,000. The commitment fee is an annual rate of 0.15% of the average commitment amount payable quarterly, regardless of usage, to Bank of New York Mellon, who serves as the agent to the syndicate. The commitment fee is allocated among the Fund and certain affiliated funds based upon their respective net assets and other factors. Interest on any revolving credit loan is charged based upon the Federal Funds Advances Rate or the one month London InterBank Offered Rate, whichever is higher. The Credit Agreement expires on August 1, 2017, although the Fund, certain affiliated funds and the syndicate of banks may renew the Credit Agreement for an additional year on the same or different terms. Prior to August 2, 2016, the aggregate commitment amount was $600,000,000 with an additional uncommitted amount of $100,000,000, and the commitment fee was at an annual rate of 0.10% of the average commitment amount. During the year ended October 31, 2016, there were no borrowings made or outstanding with respect to the Fund under the Credit Agreement.
Note 7–Interfund Lending Program
Pursuant to an exemptive order issued by the SEC, the Fund, along with certain other funds managed by New York Life Investments, may participate in an interfund lending program. The interfund lending program provides an alternate credit facility that permits the Fund and certain other funds managed by New York Life Investments to lend or borrow money for temporary purposes directly to or from one another, subject to the conditions of the exemptive order. During the year ended October 31, 2016, there were no interfund loans made or outstanding with respect to the Fund.
Note 8–Purchases and Sales of Securities (in 000’s)
During the year ended October 31, 2016, purchases and sales of U.S. government securities were $77,541 and $66,240, respectively. Purchases and sales of securities, other than U.S. government securities and short-term securities, were $1,100 and $708, respectively.
Note 9–Capital Share Transactions
| | | | | | | | |
Class A | | Shares | | | Amount | |
Year ended October 31, 2016: | | | | | | | | |
Shares sold | | | 1,671,833 | | | $ | 14,300,084 | |
Shares issued to shareholders in reinvestment of dividends and distributions | | | 193,141 | | | | 1,650,198 | |
Shares redeemed | | | (1,755,494 | ) | | | (14,999,000 | ) |
| | | | |
Net increase (decrease) in shares outstanding before conversion | | | 109,480 | | | | 951,282 | |
Shares converted into Class A (See Note 1) | | | 281,575 | | | | 2,406,374 | |
Shares converted from Class A (See Note 1) | | | (84,395 | ) | | | (722,690 | ) |
| | | | |
Net increase (decrease) | | | 306,660 | | | $ | 2,634,966 | |
| | | | |
Year ended October 31, 2015: | | | | | | | | |
Shares sold | | | 1,378,750 | | | $ | 11,850,690 | |
Shares issued to shareholders in reinvestment of dividends and distributions | | | 252,146 | | | | 2,165,235 | |
Shares redeemed | | | (2,748,908 | ) | | | (23,655,170 | ) |
| | | | |
Net increase (decrease) in shares outstanding before conversion | | | (1,118,012 | ) | | | (9,639,245 | ) |
Shares converted into Class A (See Note 1) | | | 180,941 | | | | 1,558,245 | |
Shares converted from Class A (See Note 1) | | | (83,343 | ) | | | (716,000 | ) |
| | | | |
Net increase (decrease) | | | (1,020,414 | ) | | $ | (8,797,000 | ) |
| | | | |
|
| |
Investor Class | | Shares | | | Amount | |
Year ended October 31, 2016: | | | | | | | | |
Shares sold | | | 283,003 | | | $ | 2,429,081 | |
Shares issued to shareholders in reinvestment of dividends and distributions | | | 80,330 | | | | 688,984 | |
Shares redeemed | | | (607,459 | ) | | | (5,214,634 | ) |
| | | | |
Net increase (decrease) in shares outstanding before conversion | | | (244,126 | ) | | | (2,096,569 | ) |
Shares converted into Investor Class (See Note 1) | | | 189,526 | | | | 1,626,591 | |
Shares converted from Investor Class (See Note 1) | | | (246,625 | ) | | | (2,116,170 | ) |
| | | | |
Net increase (decrease) | | | (301,225 | ) | | $ | (2,586,148 | ) |
| | | | |
Year ended October 31, 2015: | | | | | | | | |
Shares sold | | | 246,000 | | | $ | 2,120,044 | |
Shares issued to shareholders in reinvestment of dividends and distributions | | | 110,476 | | | | 952,264 | |
Shares redeemed | | | (744,101 | ) | | | (6,422,185 | ) |
| | | | |
Net increase (decrease) in shares outstanding before conversion | | | (387,625 | ) | | | (3,349,877 | ) |
Shares converted into Investor Class (See Note 1) | | | 192,597 | | | | 1,660,405 | |
Shares converted from Investor Class (See Note 1) | | | (139,902 | ) | | | (1,210,648 | ) |
| | | | |
Net increase (decrease) | | | (334,930 | ) | | $ | (2,900,120 | ) |
| | | | |
|
| |
Notes to Financial Statements (continued)
| | | | | | | | |
Class B | | Shares | | | Amount | |
Year ended October 31, 2016: | | | | | | | | |
Shares sold | | | 194,937 | | | $ | 1,665,656 | |
Shares issued to shareholders in reinvestment of dividends and distributions | | | 8,341 | | | | 71,211 | |
Shares redeemed | | | (210,091 | ) | | | (1,795,096 | ) |
| | | | |
Net increase (decrease) in shares outstanding before conversion | | | (6,813 | ) | | | (58,229 | ) |
Shares converted from Class B (See Note 1) | | | (139,939 | ) | | | (1,194,105 | ) |
| | | | |
Net increase (decrease) | | | (146,752 | ) | | $ | (1,252,334 | ) |
| | | | |
Year ended October 31, 2015: | | | | | | | | |
Shares sold | | | 238,206 | | | $ | 2,045,118 | |
Shares issued to shareholders in reinvestment of dividends and distributions | | | 15,391 | | | | 132,174 | |
Shares redeemed | | | (342,745 | ) | | | (2,941,976 | ) |
| | | | |
Net increase (decrease) in shares outstanding before conversion | | | (89,148 | ) | | | (764,684 | ) |
Shares converted from Class B (See Note 1) | | | (150,508 | ) | | | (1,292,002 | ) |
| | | | |
Net increase (decrease) | | | (239,656 | ) | | $ | (2,056,686 | ) |
| | | | |
|
| |
Class C | | Shares | | | Amount | |
Year ended October 31, 2016: | | | | | | | | |
Shares sold | | | 1,197,365 | | | $ | 10,197,898 | |
Shares issued to shareholders in reinvestment of dividends and distributions | | | 19,643 | | | | 167,630 | |
Shares redeemed | | | (963,265 | ) | | | (8,238,085 | ) |
| | | | |
Net increase (decrease) | | | 253,743 | | | $ | 2,127,443 | |
| | | | |
Year ended October 31, 2015: | | | | | | | | |
Shares sold | | | 1,401,812 | | | $ | 12,001,243 | |
Shares issued to shareholders in reinvestment of dividends and distributions | | | 20,421 | | | | 175,131 | |
Shares redeemed | | | (716,200 | ) | | | (6,157,680 | ) |
| | | | |
Net increase (decrease) | | | 706,033 | | | $ | 6,018,694 | |
| | | | |
| | |
| | | | | | | | |
Class I | | Shares | | | Amount | |
Year ended October 31, 2016: | | | | | | | | |
Shares sold | | | 1,769,610 | | | $ | 15,373,740 | |
Shares issued to shareholders in reinvestment of dividends and distributions | | | 14,742 | | | | 127,362 | |
Shares redeemed | | | (679,762 | ) | | | (5,895,739 | ) |
| | | | |
Net increase (decrease) | | | 1,104,590 | | | $ | 9,605,363 | |
| | | | |
Year ended October 31, 2015: | | | | | | | | |
Shares sold | | | 186,316 | | | $ | 1,614,474 | |
Shares issued to shareholders in reinvestment of dividends and distributions | | | 17,516 | | | | 152,087 | |
Shares redeemed | | | (830,984 | ) | | | (7,261,646 | ) |
| | | | |
Net increase (decrease) | | | (627,152 | ) | | $ | (5,495,085 | ) |
| | | | |
Note 10–Recent Accounting Pronouncement
In October 2016, the SEC adopted new rules and amended existing rules (together, “final rules”) intended to modernize the reporting and disclosure of information by registered investment companies. In part, the final rules amend Regulation S-X and require standardized, enhanced disclosure about derivatives in investment company financial statements, as well as other amendments. The compliance date for the amendments to Regulation S-X is August 1, 2017. Management is currently evaluating the impact that the adoption of the amendments to Regulation S-X will have on the Fund’s financial statements and related disclosures.
Note 11–Subsequent Events
In connection with the preparation of the financial statements of the Fund as of and for the fiscal year ended October 31, 2016, events and transactions subsequent to October 31, 2016, through the date the financial statements were issued have been evaluated by the Fund’s management for possible adjustment and/or disclosure. No subsequent events requiring financial statement adjustment or disclosure have been identified other than the following:
Effective February 28, 2017, Class B shares of the MainStay Group of Funds will be closed to all new purchases as well as additional investments by existing Class B shareholders. Existing Class B shareholders may continue to reinvest dividends and capital gains distributions, as well as exchange their Class B shares for Class B shares of other Funds as permitted by the current exchange privileges. Class B shareholders will continue to be subject to any applicable contingent deferred sales charge at the time of redemption. All other features of the Class B shares, including but not limited to the fees and expenses applicable to Class B shares, will remain unchanged. Unless redeemed, Class B Shares shareholders will remain in Class B shares of their respective Fund until the Class B shares are converted to Class A or Investor Class shares pursuant to the applicable conversion schedule.
| | |
| 28 | | MainStay Government Fund |
Report of Independent Registered Public Accounting Firm
The Board of Trustees and Shareholders of
The MainStay Funds:
We have audited the accompanying statement of assets and liabilities, including the portfolio of investments, of the MainStay Government Fund (the “Fund”), one of the funds constituting The MainStay Funds, as of October 31, 2016, and the related statement of operations for the year then ended, the statements of changes in net assets for each of the years in the two-year period then ended, and the financial highlights for each of the years in the five-year period then ended. These financial statements and financial highlights are the responsibility of the Fund’s management. Our responsibility is to express an opinion on these financial statements and financial highlights based on our audits.
We conducted our audits in accordance with the standards of the Public Company Accounting Oversight Board (United States). Those standards require that we plan and perform the audit to obtain reasonable assurance about whether the financial statements and financial highlights are free of material misstatement. An audit includes examining, on a test basis, evidence supporting the amounts and disclosures in the financial statements. Our procedures included confirmation of securities owned as of October 31, 2016, by correspondence with the custodian and brokers or by other appropriate auditing procedures where replies from brokers were not received. An audit also includes assessing the accounting principles used and significant estimates made by management, as well as evaluating the overall financial statement presentation. We believe that our audits provide a reasonable basis for our opinion.
In our opinion, the financial statements and financial highlights referred to above present fairly, in all material respects, the financial position of the MainStay Government Fund of The MainStay Funds as of October 31, 2016, the results of its operations for the year then ended, the changes in its net assets for each of the years in the two-year period then ended, and the financial highlights for each of the years in the five-year period then ended, in conformity with U.S. generally accepted accounting principles.

Philadelphia, Pennsylvania
December 22, 2016
Federal Income Tax Information
(Unaudited)
In February 2017 shareholders will receive an IRS Form 1099-DIV or substitute Form 1099 which will show the federal tax status of the distributions received by shareholders in calendar year 2016. The amounts that will be reported on such 1099-DIV or substitute Form 1099 will be the amounts you are to use on your federal income tax return and will differ from the amounts which we must report for the Fund’s fiscal year ended October 31, 2016.
Proxy Voting Policies and Procedures and Proxy Voting Record
A description of the policies and procedures that New York Life Investments uses to vote proxies related to the Fund’s securities is available without charge, upon request, (i) by visiting the Fund’s website at mainstayinvestments.com; or (ii) on the SEC’s website at www.sec.gov.
The Fund is required to file with the SEC its proxy voting record for the 12-month period ending June 30 on Form N-PX. The Fund’s most recent Form N-PX or proxy voting record is available free of charge upon request (i) by calling 800-MAINSTAY (624-6782); (ii) by visiting the Fund’s website at mainstayinvestments.com; or (iii) on the SEC’s website at www.sec.gov.
Shareholder Reports and Quarterly Portfolio Disclosure
The Fund is required to file its complete schedule of portfolio holdings with the SEC for its first and third fiscal quarters on Form N-Q. The Fund’s Form N-Q is available without charge on the SEC’s website at www.sec.gov or by calling MainStay Investments at 800-MAINSTAY (624-6782). You also can obtain and review copies of Form N-Q by visiting the SEC’s Public Reference Room in Washington, DC (information on the operation of the Public Reference Room may be obtained by calling 1-800-SEC-0330).
| | |
| 30 | | MainStay Government Fund |
Board of Trustees and Officers (Unaudited)
The Trustees and officers of the Funds are listed below. The Board oversees the MainStay Group of Funds, MainStay VP Funds Trust, MainStay DefinedTerm Municipal Opportunities Fund, the Manager and the Subadvisors, and elects the officers of the Funds who are responsible for the day-to-day operations of the Funds. Information pertaining to the Trustees and officers is set forth below. Each Trustee serves until his or her successor is elected and qualified or until his or her resignation, death or removal. Under the Retirement Policy, a Trustee must
tender his or her resignation by the end of the calendar year during which he or she reaches the age of 75 (although the Board of Trustees may make exceptions from time to time). Officers serve a term of one year and are elected annually by the Board of Trustees. The business address of each Trustee and officer listed below is 51 Madison Avenue, New York, New York 10010. A majority of the Trustees are not “interested persons” (as defined by the 1940 Act and rules “adopted” by the SEC thereunder) of the Fund (“Independent Trustees”).
| | | | | | | | | | | | |
| | | | | Name and Date of Birth | | Term of Office, Position(s) Held and Length of Service | | Principal Occupation(s) During Past Five Years | | Number of
Portfolios in
Fund Complex
Overseen by
Board Member | | Other Directorships Held By Board Member |
Interested Trustee | | | | Christopher O. Blunt* 5/13/62 | | MainStay Funds: Trustee since January 2016; MainStay Funds Trust: Trustee since January 2016. | | Executive Vice President (since 2009), President, Investments Group (since 2015), Member of the Executive Management Committee (since 2007), Co-President, Insurance and Agency Group (2012 to 2015), President, Insurance Group (2012 to 2014), Executive Vice President, Retirement Income Security (2008 to 2012), New York Life Insurance Company. | | 83 | | MainStay VP Funds Trust:
Trustee since January 2016 (31 portfolios); and
MainStay DefinedTerm Municipal Opportunities Fund: Trustee since January 2016. |
| | * | This Trustee is considered to be an “interested person” of the MainStay Group of Funds within the meaning of the 1940 Act because of his affiliation with New York Life Insurance Company, New York Life Investment Management LLC, Cornerstone Capital Management Holdings LLC, MacKay Shields LLC, Institutional Capital LLC, NYL Investors LLC, NYLIFE Securities LLC and/or NYLIFE Distributors LLC, as described in detail above in the column entitled “Principal Occupation(s) During Past Five Years.” |
| | | | | | | | | | | | |
| | | | | Name and Date of Birth | | Term of Office, Position(s) Held and Length of Service | | Principal Occupation(s) During Past Five Years | | Number of Portfolios in Fund Complex Overseen by Board Member | | Other Directorships Held By Board Member |
| Non-Interested Trustee | | | | David H. Chow 12/29/57 | | MainStay Funds: Trustee since January 2016, Advisory Board Member (June 2015 to December 2015); MainStay Funds Trust: Trustee since January 2016, Advisory Board Member (June 2015 to December 2015). | | Founder and CEO, DanCourt Management, LLC (since 1999) | | 83 | | MainStay VP Funds Trust: Trustee since January 2016, Advisory Board Member (June 2015 to December 2015); (31 portfolios);
MainStay DefinedTerm Municipal Opportunities Fund: Trustee since January 2016, Advisory Board Member (June 2015 to December 2015);
Market Vectors Group of Exchange-Traded Funds: Independent Chairman of the Board of Trustees since 2008 and Trustee since 2006 (55 portfolios); and
Berea College of Kentucky: Trustee since 2009. |
| | | | Susan B. Kerley 8/12/51 | | MainStay Funds: Trustee since 2007; MainStay Funds Trust: Trustee since 1990.*** | | President, Strategic Management Advisors LLC (since 1990) | | 83 | | MainStay VP Funds Trust: Trustee since 2007 (31 portfolios)**;
MainStay DefinedTerm Municipal Opportunities Fund: Trustee since 2011; and Legg Mason Partners Funds: Trustee since 1991 (53 portfolios). |
| | | | Alan R. Latshaw 3/27/51 | | MainStay Funds: Trustee and Audit Committee Financial Expert since 2006; MainStay Funds Trust: Trustee and Audit Committee Financial Expert since 2007.*** | | Retired; Partner, Ernst & Young LLP (2002 to 2003); Partner, Arthur Andersen LLP (1989 to 2002); Consultant to the MainStay Funds Audit and Compliance Committee (2004 to 2006) | | 83 | | MainStay VP Funds Trust: Trustee and Audit Committee Financial Expert since 2007 (31 portfolios)**;
MainStay DefinedTerm Municipal Opportunities Fund: Trustee and Audit Committee Financial Expert since 2011;
State Farm Associates Funds Trusts: Trustee since 2005 (4 portfolios);
State Farm Mutual Fund Trust: Trustee since 2005 (15 portfolios); and
State Farm Variable Product Trust: Trustee since 2005 (9 portfolios). |
| | | | Peter Meenan 12/5/41 | | MainStay Funds: Chairman since 2013 and Trustee since 2007; MainStay Funds Trust: Chairman since 2013 and Trustee since 2002.*** | | Retired; Independent Consultant (2004 to 2013); President and Chief Executive Officer, Babson—United, Inc. (financial services firm) (2000 to 2004); Independent Consultant (1999 to 2000); Head of Global Funds, Citicorp (1995 to 1999) | | 83 | | MainStay VP Funds Trust: Chairman since 2013 and Trustee since 2007 (31 portfolios)**; and
MainStay DefinedTerm Municipal Opportunities Fund: Chairman since 2013 and Trustee since 2011. |
| | | | Richard H. Nolan, Jr. 11/16/46 | | MainStay Funds: Trustee since 2007; MainStay Funds Trust: Trustee since 2007.*** | | Managing Director, ICC Capital Management (since 2004); President—Shields/Alliance, Alliance Capital Management (1994 to 2004) | | 83 | | MainStay VP Funds Trust: Trustee since 2006 (31 portfolios)**; and
MainStay DefinedTerm Municipal Opportunities Fund: Trustee since 2011. |
| | | | Jacques P. Perold 5/12/58 | | MainStay Funds: Trustee since January 2016, Advisory Board Member (June 2015 to December 2015); MainStay Funds Trust: Trustee since January 2016, Advisory Board Member (June 2015 to December 2015). | | Retired; President, Fidelity Management & Research Company (2009 to 2014); Founder, President and Chief Executive Officer, Geode Capital Management, LCC (2001 to 2009) | | 83 | | MainStay VP Funds Trust: Trustee since January 2016, Advisory Board Member (June 2015 to December 2015); (31 portfolios);
MainStay DefinedTerm Municipal Opportunities Fund: Trustee since January 2016, Advisory Board Member (June 2015 to December 2015);
Allstate Corporation: Director since 2015; and
Boston University: Trustee since 2014. |
| | |
| 32 | | MainStay Government Fund |
| | | | | | | | | | | | |
| | | | | Name and Date of Birth | | Term of Office, Position(s) Held and Length of Service | | Principal Occupation(s) During Past Five Years | | Number of Portfolios in Fund Complex Overseen by Board Member | | Other Directorships Held By Board Member |
Non-Interested Trustee | | | | Richard S. Trutanic 2/13/52 | | MainStay Funds: Trustee since 1994; MainStay Funds Trust: Trustee since 2007.*** | | Chairman and Chief Executive Officer, Somerset & Company (financial advisory firm) (since 2004); Managing Director, The Carlyle Group (private investment firm) (2002 to 2004); Senior Managing Director, Partner and Board Member, Groupe Arnault S.A. (private investment firm) (1999 to 2002) | | 83 | | MainStay VP Funds Trust: Trustee since 2007 (31 portfolios)**; and
MainStay DefinedTerm Municipal Opportunities Fund: Trustee since 2011. |
| | | | John A. Weisser**** 10/22/41 | | MainStay Funds: Trustee since 2007; MainStay Funds Trust: Trustee since 2007.*** | | Retired; Managing Director of Salomon Brothers, Inc. (1971 to 1995) | | 83 | | MainStay VP Funds Trust: Trustee since 1997 (31 portfolios)**; MainStay DefinedTerm Municipal Opportunities Fund: Trustee since 2011; Direxion Insurance Trust: Trustee since 2007 (1 portfolio); Direxion Funds: Trustee since 2007 (18 portfolios); and Direxion Shares ETF Trust: Trustee since 2008 (52 portfolios). |
| | ** | Includes prior service as a Director of MainStay VP Series Fund, Inc., the predecessor to MainStay VP Funds Trust. |
| | *** | Includes prior service as a Director/Trustee of certain predecessor entities to MainStay Funds Trust. |
| | **** | Pursuant to the Retirement Policy, Mr. Weisser will retire from the Board of Trustees on or about December 31, 2016. |
| | | | | | | | |
| | | | | Name and Date of Birth | | Position(s) Held and Length of Service | | Principal Occupation(s) During Past Five Years |
Officers (Who Are Not Board Members)* | | | | Stephen P. Fisher 2/22/59 | | President, MainStay Funds (since 2007), MainStay Funds Trust (since 2009) | | Chairman and Chief Executive Officer (since 2014), President and Chief Operating Officer (2008 to 2013), NYLIFE Distributors LLC; Chairman of the Board, NYLIM Service Company LLC (since 2008); President (since May 2015), Co-President (2014 to 2015) and Senior Managing Director (since 2005), New York Life Investment Management LLC; President, MainStay DefinedTerm Municipal Opportunities Fund (since 2011) and MainStay VP Funds Trust (since 2007)** |
| | | | Jack R. Benintende 5/12/64 | | Treasurer and Principal Financial and Accounting Officer, MainStay Funds (since 2007), MainStay Funds Trust (since 2009) | | Managing Director, New York Life Investment Management LLC (since 2007); Treasurer and Principal Financial and Accounting Officer, MainStay DefinedTerm Municipal Opportunities Fund (since 2011) and MainStay VP Funds Trust (since 2007)**; and Assistant Treasurer, New York Life Investment Management Holdings LLC (2008 to 2012) |
| | | | Kevin M. Bopp 2/24/69 | | Vice President and Chief Compliance Officer, MainStay Funds and MainStay Funds Trust (since 2014) | | Chief Compliance Officer (since January 2016), Director and Associate General Counsel (2011 to 2014) and Vice President and Assistant General Counsel (2010 to 2011), New York Life Investment Management LLC; Vice President and Chief Compliance Officer, MainStay VP Funds Trust, MainStay DefinedTerm Municipal Opportunities Fund (since 2014); Assistant Secretary, MainStay Funds, MainStay Funds Trust and MainStay VP Funds Trust (2010 to 2014)**, MainStay DefinedTerm Municipal Opportunities Fund (2011 to 2014) |
| | | | J. Kevin Gao 10/13/67 | | Secretary and Chief Legal Officer, MainStay Funds and MainStay Funds Trust (since 2010) | | Managing Director and Associate General Counsel, New York Life Investment Management LLC (since 2010); Secretary and Chief Legal Officer, MainStay DefinedTerm Municipal Opportunities Fund (since 2011) and MainStay VP Funds Trust (since 2010)** |
| | | | Scott T. Harrington 2/8/59 | | Vice President— Administration, MainStay Funds (since 2005), MainStay Funds Trust (since 2009) | | Director, New York Life Investment Management LLC (including predecessor advisory organizations) (since 2000); Member of the Board of Directors, New York Life Trust Company (since 2009); Vice President—Administration, MainStay DefinedTerm Municipal Opportunities Fund (since 2011) and MainStay VP Funds Trust (since 2005)** |
| | * | The Officers listed above are considered to be “interested persons” of the MainStay Group of Funds within the meaning of the 1940 Act because of their affiliation with the MainStay Group of Funds, New York Life Insurance Company and/or its affiliates, including New York Life Investment Management LLC, NYLIM Service Company LLC, NYLIFE Securities LLC and/or NYLIFE Distributors LLC, as described in detail in the column captioned “Principal Occupation(s) During Past Five Years.” Officers are elected annually by the Board to serve a one year term. |
| | ** | Includes prior service as an Officer of MainStay VP Series Fund, Inc., the predecessor to MainStay VP Funds Trust. |
| | |
| 34 | | MainStay Government Fund |
MainStay Funds
MainStay offers a wide range of Funds for virtually any investment need. The full array of MainStay open-end offerings is listed here, with information about the manager, subadvisors, legal counsel and independent registered public accounting firm.
Equity
U.S. Equity
MainStay Common Stock Fund
MainStay Cornerstone Growth Fund
MainStay Epoch U.S. All Cap Fund
MainStay Epoch U.S. Equity Yield Fund
MainStay Epoch U.S. Small Cap Fund
MainStay ICAP Equity Fund
MainStay ICAP Select Equity Fund
MainStay Large Cap Growth Fund
MainStay MAP Fund
MainStay S&P 500 Index Fund
MainStay U.S. Equity Opportunities Fund
International/Global Equity
MainStay Emerging Markets Opportunities Fund
MainStay Epoch Capital Growth Fund
MainStay Epoch Global Choice Fund
MainStay Epoch Global Equity Yield Fund
MainStay Epoch International Small Cap Fund
MainStay ICAP International Fund
MainStay International Equity Fund
MainStay International Opportunities Fund
Income
Taxable Bond
MainStay Floating Rate Fund
MainStay Global High Income Fund
MainStay Government Fund
MainStay High Yield Corporate Bond Fund
MainStay High Yield Opportunities Fund
MainStay Indexed Bond Fund
MainStay Short Duration High Yield Fund
MainStay Total Return Bond Fund
MainStay Unconstrained Bond Fund
Municipal/Tax Advantaged Bond
MainStay California Tax Free Opportunities Fund1
MainStay High Yield Municipal Bond Fund
MainStay New York Tax Free Opportunities Fund2
MainStay Tax Advantaged Short Term Bond Fund
MainStay Tax Free Bond Fund
Money Market
MainStay Money Market Fund
Mixed Asset
MainStay Balanced Fund
MainStay Convertible Fund
MainStay Income Builder Fund
Alternative
MainStay Absolute Return Multi-Strategy Fund
MainStay Cushing Energy Income Fund
MainStay Cushing MLP Premier Fund
MainStay Cushing Renaissance Advantage Fund
Asset Allocation/Target Date
MainStay Conservative Allocation Fund
MainStay Growth Allocation Fund
MainStay Moderate Allocation Fund
MainStay Moderate Growth Allocation Fund
MainStay Retirement 2010 Fund
MainStay Retirement 2020 Fund
MainStay Retirement 2030 Fund
MainStay Retirement 2040 Fund
MainStay Retirement 2050 Fund
MainStay Retirement 2060 Fund
Manager
New York Life Investment Management LLC
New York, New York
Subadvisors
Candriam France S.A.S.3
Paris, France
Cornerstone Capital Management Holdings LLC3
New York, New York
Cushing Asset Management, LP
Dallas, Texas
Epoch Investment Partners, Inc.
New York, New York
Institutional Capital LLC3
Chicago, Illinois
MacKay Shields LLC3
New York, New York
Markston International LLC
White Plains, New York
NYL Investors LLC3
New York, New York
Winslow Capital Management, LLC
Minneapolis, Minnesota
Legal Counsel
Dechert LLP
Washington, District of Columbia
Independent Registered Public Accounting Firm
KPMG LLP
Philadelphia, Pennsylvania
1. This Fund is only registered for sale in AZ, CA, MI (Class A and Class I shares only), NV, OR, TX, UT and WA.
2. This Fund is only registered for sale in CA, CT, DE, FL, MA, NJ, NY and VT.
3. An affiliate of New York Life Investment Management LLC.
Not part of the Annual Report
For more information
800-MAINSTAY (624-6782)
mainstayinvestments.com
MainStay Investments® is a registered service mark and name under which New York Life Investment Management LLC does business. MainStay Investments, an indirect subsidiary of New York Life Insurance Company, New York, NY 10010, provides investment advisory products and services. The MainStay Funds® are managed by New York Life Investment Management LLC and distributed by NYLIFE Distributors LLC, 30 Hudson Street, Jersey City, NJ 07302, a wholly owned subsidiary of New York Life Insurance Company. NYLIFE Distributors LLC is a Member FINRA/SIPC.
©2016 NYLIFE Distributors LLC. All rights reserved.
| | | | | | | | |
| Not FDIC/NCUA Insured | | Not a Deposit | | May Lose Value | | No Bank Guarantee | | Not Insured by Any Government Agency |
| | |
| 1716016 MS316-16 | | MSG11-12/16 (NYLIM) NL211 |
MainStay High Yield Corporate Bond Fund
Message from the President and Annual Report
October 31, 2016


This page intentionally left blank
Message from the President
During the 12 months ended October 31, 2016, the U.S. stock and bond markets were somewhat volatile but generally ended the reporting period in positive territory. In the fall of 2015 and early 2016, the market appeared to be focused on China’s economic weakness and a prolonged decline in oil prices. Although energy-related companies felt the brunt of these setbacks, the stock market as a whole declined until mid-February, when oil prices began to rise and stocks began a relatively steady recovery.
In late June, the United Kingdom voted to leave the European Union in a referendum popularly known as “Brexit.” The news caused a temporary slump in stocks around the world. Although the British pound dropped in value following the vote, stocks generally recovered through the end of the reporting period. As the end of the reporting period approached, speculation about the upcoming U.S. presidential election heightened market volatility.
According to FTSE-Russell data, U.S. stocks as a whole tended to provide positive returns during the reporting period, with large-capitalization stocks generally outperforming stocks of smaller companies. Value stocks outpaced growth stocks at all capitalization levels, with the largest differences among small- to mid-cap stocks.
International and emerging-market stocks provided mixed performance. Rocked by Brexit, European stocks as a whole declined during the reporting period, while stocks in the Asia-Pacific region (with or without Japan) tended to provide positive returns. International stocks as a whole declined, while global stocks advanced slightly. Emerging-market stocks were considerably stronger, boosted by advances in India and Latin America and higher prices for oil, metals and other commodities.
Anticipation of a possible Federal Reserve rate hike led to volatility in the bond market, but the Federal Open Market Committee chose not to raise the federal funds target rate during the reporting period. Short-term U.S. Treasury yields rose during the reporting period, and longer-term U.S. Treasury yields declined. Overall, the U.S. bond market provided positive returns, with longer-term bonds generally outperforming shorter-term securities. High-yield bonds, particularly
longer-term issues, were strong performers. Municipal bonds generally provided positive single-digit total returns for the 12 months ended October 31, 2016.
Central banks around the world remained highly accommodative during the reporting period, particularly in light of Brexit. Shortly after the U.K. referendum, more than a third of all sovereign debt carried negative yields. As an asset class, emerging-market bonds provided double-digit positive returns during the reporting period, and world bonds as a whole provided positive single-digit positive returns.
At MainStay, we know that political, economic and market events may influence the performance of your Fund investments. While our portfolio managers often pay close attention to such events, their primary emphasis is seeking to invest for the long-term investment needs of our shareholders. With this in mind, they seek to pursue the investment objectives of their respective Funds using the principal investment strategies and investment processes outlined in the prospectus. By placing your assets in the care of our investment professionals, you gain access to their extensive market insight, strategic investment discipline and in-depth experience in risk-management over a wide range of market cycles.
The report that follows provides more detailed information about the market forces, portfolio strategies and individual securities that influenced the performance of your MainStay Fund during the 12 months ended October 31, 2016. We invite you to read the report carefully as part of your personal investment-review process.
We thank you for your business, and we look forward to a continuing relationship as you pursue your long-range financial goals.
Sincerely,

Stephen P. Fisher
President
The opinions expressed are as of the date of this report and are subject to change. There is no guarantee that any forecast made will come to pass. This material does not constitute investment advice and is not intended as an endorsement of any specific investment. Past performance is no guarantee of future results.
Not part of the Annual Report
Table of Contents
Investors should refer to the Fund’s Summary Prospectus and/or Prospectus and consider the Fund’s investment objectives, strategies, risks, charges and expenses carefully before investing. The Summary Prospectus and/or Prospectus contain this and other information about the Fund. You may obtain copies of the Fund’s Summary Prospectus, Prospectus and Statement of Additional Information free of charge, upon request, by calling toll-free 800-MAINSTAY (624-6782), by writing to NYLIFE Distributors LLC, Attn: MainStay Marketing Department, 30 Hudson Street, Jersey City, NJ 07302 or by sending an e-mail to MainStayShareholderServices@nylim.com. These documents are also available via the MainStay Funds’ website at mainstayinvestments.com/documents. Please read the Summary Prospectus and/or Prospectus carefully before investing.
Investment and Performance Comparison1 (Unaudited)
Performance data quoted represents past performance. Past performance is no guarantee of future results. Because of market volatility and other factors, current performance may be lower or higher than the figures shown. Investment return and principal value will fluctuate, and as a result, when shares are redeemed, they may be worth more or less than their original cost. The graph below depicts the historical performance of Class B shares of the Fund. Performance will vary from class to class based on differences in class-specific expenses and sales charges. For performance information current to the most recent month-end, please call 800-MAINSTAY (624-6782) or visit mainstayinvestments.com.
(With sales charges)
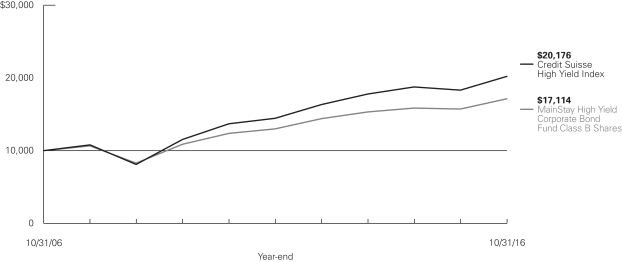
Average Annual Total Returns for the Year Ended October 31, 2016
| | | | | | | | | | | | | | | | | | | | |
| Class | | Sales Charge | | | | One Year | | | Five Years | | | Ten Years | | | Gross
Expense
Ratio2 | |
Class A Shares | | Maximum 4.5% Initial Sales Charge | | With sales charges Excluding sales charges | |
| 5.01
9.96 | %
| |
| 5.55
6.53 | %
| |
| 5.88
6.37 | %
| |
| 0.96
0.96 | %
|
Investor Class Shares3 | | Maximum 4.5% Initial Sales Charge | | With sales charges Excluding sales charges | |
| 4.97
9.91 |
| |
| 5.55
6.52 |
| |
| 5.84
6.33 |
| |
| 1.02
1.02 |
|
Class B Shares | | Maximum 5% CDSC if Redeemed Within the First Six Years of Purchase | | With sales charges Excluding sales charges | |
| 3.85
8.85 |
| |
| 5.38
5.70 |
| |
| 5.52
5.52 |
| |
| 1.77
1.77 |
|
Class C Shares | | Maximum 1% CDSC if Redeemed Within One Year of Purchase | | With sales charges Excluding sales charges | |
| 8.04
9.04 |
| |
| 5.74
5.74 |
| |
| 5.54
5.54 |
| |
| 1.77
1.77 |
|
| Class I Shares | | No Sales Charge | | | | | 10.23 | | | | 6.83 | | | | 6.63 | | | | 0.71 | |
| Class R1 Shares4 | | No Sales Charge | | | | | 10.13 | | | | 6.69 | | | | 6.49 | | | | 0.81 | |
| Class R2 Shares5 | | No Sales Charge | | | | | 9.83 | | | | 6.43 | | | | 6.26 | | | | 1.06 | |
| Class R3 Shares6 | | No Sales Charge | | | | | 9.52 | | | | 6.17 | | | | 5.97 | | | | 1.31 | |
| Class R6 Shares7 | | No Sales Charge | | | | | 10.24 | | | | 6.92 | | | | 6.68 | | | | 0.58 | |
| 1. | The performance table and graph do not reflect the deduction of taxes that a shareholder would pay on distributions or Fund share redemptions. Total returns reflect maximum applicable sales charges as indicated in the table above, if any, changes in share price, and reinvestment of dividend and capital gain distributions. The graph assumes the initial investment amount shown above and reflects the deduction of all sales charges that would have applied for the period of investment. Performance figures may reflect certain fee waivers and/or expense limitations, without which total returns may have been lower. For more information on share classes and current fee waivers and/or expense limitations (if any), please refer to the notes to the financial statements. |
| 2. | The gross expense ratios presented reflect the Fund’s “Total Annual Fund Operating Expenses” from the most recent Prospectus and may differ from other expense ratios disclosed in this report. |
| 3. | Performance figures for Investor Class shares, first offered on February 28, 2008, include the historical performance of Class A shares through February 27, 2008, adjusted for differences in certain fees and expenses. Unadjusted, the performance shown for the Investor Class shares would likely have been different. |
| 4. | Performance figures for Class R1 shares, first offered on June 29, 2012, include the historical performance of Class B shares through June 28, 2012, adjusted for differences in certain fees and expenses. Unadjusted, the performance shown for the Class R1 shares would likely have been different. |
| 5. | Class R2 shares were first offered on December 14, 2007, although this class of shares did not commence investment operations until May 1, 2008. Performance figures for Class R2 shares include the historical performance of Class B shares through April 30, 2008, adjusted for differences in certain fees and expenses. Unadjusted, the performance shown for the Class R2 shares would likely have been different. |
| 6. | Performance figures for Class R3 shares, first offered on February 29, 2016, include the historical performance of Class B shares through February 28, 2016, adjusted for differences in certain fees and expenses. Unadjusted, the performance shown for the Class R3 shares would likely have been different. |
| 7. | Performance figures for Class R6 shares, first offered on June 17, 2013, include the historical performance of Class I shares through June 16, 2013, adjusted for differences in certain fees and expenses. Unadjusted, the performance shown for the Class R6 shares would likely have been different. |
The footnotes on the next page are an integral part of the table and graph and should be carefully read in conjunction with them.
| | | | | | | | | | | | |
| Benchmark Performance | | One Year | | | Five Years | | | Ten Years | |
Credit Suisse High Yield Index8 | | | 10.22 | % | | | 6.91 | % | | | 7.27 | % |
Average Lipper High Yield Fund9 | | | 7.01 | | | | 5.92 | | | | 6.05 | |
| 8. | The Credit Suisse High Yield Index is the Fund’s primary broad-based securities market index for comparison purposes. The Credit Suisse High Yield Index is a market-weighted index that includes publicly traded bonds rated below BBB by Standard & Poor’s and below Baa by Moody’s. Results assume reinvestment of all income and capital gains. An investment cannot be made directly in an index. |
| 9. | The Average Lipper High Yield Fund is representative of funds that, by portfolio practice, aim at high (relative) current yield from fixed income |
| | securities, have no quality or maturity restrictions, and tend to invest in lower-grade debt issues. This benchmark is a product of Lipper Inc. Lipper Inc. is an independent monitor of fund performance. Results are based on average total returns of similar funds with all dividend and capital gain distributions reinvested. |
The footnotes on the preceding page are an integral part of the table and graph and should be carefully read in conjunction with them.
| | |
| 6 | | MainStay High Yield Corporate Bond Fund |
Cost in Dollars of a $1,000 Investment in MainStay High Yield Corporate Bond Fund (Unaudited)
The example below is intended to describe the fees and expenses borne by shareholders during the six-month period from May 1, 2016, to October 31, 2016, and the impact of those costs on your investment.
Example
As a shareholder of the Fund, you incur two types of costs: (1) transaction costs, including exchange fees and sales charges (loads) on purchases (as applicable), and (2) ongoing costs, including management fees, distribution and/or service (12b-1) fees, and other Fund expenses (as applicable). This example is intended to help you understand your ongoing costs (in dollars) of investing in the Fund and to compare these costs with the ongoing costs of investing in other mutual funds. The example is based on an investment of $1,000 made at the beginning of the six-month period and held for the entire period from May 1, 2016, to October 31, 2016.
This example illustrates your Fund’s ongoing costs in two ways:
Actual Expenses
The second and third data columns in the table below provide information about actual account values and actual expenses. You may use the information in these columns, together with the amount you invested, to estimate the expenses that you paid during the six months ended October 31, 2016. Simply divide your account value by $1,000 (for example, an $8,600 account value divided by $1,000 = 8.6), then
multiply the result by the number under the heading entitled “Expenses Paid During Period” to estimate the expenses you paid on your account during this period.
Hypothetical Example for Comparison Purposes
The fourth and fifth data columns in the table below provide information about hypothetical account values and hypothetical expenses based on the Fund’s actual expense ratio and an assumed rate of return of 5% per year before expenses, which is not the Fund’s actual return. The hypothetical account values and expenses may not be used to estimate the actual ending account balances or expenses you paid for the six-month period shown. You may use this information to compare the ongoing costs of investing in the Fund with the ongoing costs of investing in other Funds. To do so, compare this 5% hypothetical example with the 5% hypothetical examples that appear in the shareholder reports of the other Funds.
Please note that the expenses shown in the table are meant to highlight your ongoing costs only and do not reflect any transactional costs, such as exchange fees or sales charges (loads). Therefore, the fourth and fifth data columns of the table are useful in comparing ongoing costs only and will not help you determine the relative total costs of owning different funds. In addition, if these transactional costs were included, your costs would have been higher.
| | | | | | | | | | | | | | | | | | | | |
| | | | | | | | | | | | | | | | |
| Share Class | | Beginning
Account
Value
5/1/16 | | | Ending Account
Value (Based
on Actual
Returns and
Expenses)
10/31/16 | | | Expenses
Paid
During
Period1 | | | Ending Account
Value (Based
on Hypothetical
5% Annualized
Return and
Actual Expenses)
10/31/16 | | | Expenses
Paid
During
Period1 | |
| | | | | |
| Class A Shares | | $ | 1,000.00 | | | $ | 1,078.90 | | | $ | 4.96 | | | $ | 1,020.40 | | | $ | 4.82 | |
| | | | | |
| Investor Class Shares | | $ | 1,000.00 | | | $ | 1,078.50 | | | $ | 5.33 | | | $ | 1,020.00 | | | $ | 5.18 | |
| | | | | |
| Class B Shares | | $ | 1,000.00 | | | $ | 1,074.80 | | | $ | 9.23 | | | $ | 1,016.20 | | | $ | 8.97 | |
| | | | | |
| Class C Shares | | $ | 1,000.00 | | | $ | 1,074.70 | | | $ | 9.23 | | | $ | 1,016.20 | | | $ | 8.97 | |
| | | | | |
| Class I Shares | | $ | 1,000.00 | | | $ | 1,080.20 | | | $ | 3.66 | | | $ | 1,021.60 | | | $ | 3.56 | |
| | | | | |
| Class R1 Shares | | $ | 1,000.00 | | | $ | 1,079.80 | | | $ | 4.18 | | | $ | 1,021.10 | | | $ | 4.06 | |
| | | | | |
| Class R2 Shares | | $ | 1,000.00 | | | $ | 1,078.40 | | | $ | 5.49 | | | $ | 1,019.90 | | | $ | 5.33 | |
| | | | | |
| Class R3 Shares | | $ | 1,000.00 | | | $ | 1,077.30 | | | $ | 6.79 | | | $ | 1,018.60 | | | $ | 6.60 | |
| | | | | |
| Class R6 Shares | | $ | 1,000.00 | | | $ | 1,081.20 | | | $ | 3.09 | | | $ | 1,022.20 | | | $ | 3.00 | |
| 1. | Expenses are equal to the Fund’s annualized expense ratio of each class (0.95% for Class A, 1.02% for Investor Class, 1.77% for Class B and Class C, 0.70% for Class I, 0.80% for Class R1, 1.05% for Class R2, 1.30% for Class R3 and 0.59% for Class R6) multiplied by the average account value over the period, divided by 366 and multiplied by 184 (to reflect the six-month period). The table above represents the actual expenses incurred during the six-month period. |
Portfolio Composition as of October 31, 2016 (Unaudited)
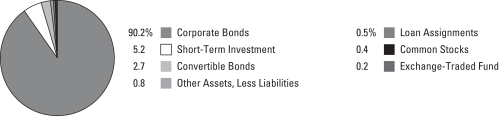
See Portfolio of Investments beginning on page 11 for specific holdings within these categories.
Top Ten Holdings or Issuers Held as of October 31, 2016 (excluding short-term investment) (Unaudited)
| 1. | T-Mobile USA, Inc., 6.00%–6.836%, due 11/15/20–1/15/26 |
| 2. | HCA, Inc., 4.25%–8.36%, due 10/1/18–2/15/26 |
| 3. | Freeport-McMoran Oil & Gas LLC / FCX Oil & Gas, Inc., 6.125%–6.875%, due 6/15/19–2/15/23 |
| 4. | Micron Technology, Inc., 5.25%–7.50%, due 2/15/22–1/15/26 |
| 5. | Comstock Resources, Inc. |
| 7. | Crown Castle International Corp., 4.875%–5.25%, due 4/15/22–1/15/23 |
| 8. | Virgin Media Secured Finance PLC, 5.25%–5.50%, due 1/15/21–8/15/26 |
| 9. | MPLX, L.P., 4.875%–5.50%, due 2/15/23–6/1/25 |
| 10. | CCO Holdings LLC / CCO Holdings Capital Corp., 5.125%–6.625%, due 1/31/22–5/1/27 |
| | |
| 8 | | MainStay High Yield Corporate Bond Fund |
Portfolio Management Discussion and Analysis (Unaudited)
Questions answered by portfolio manager Andrew Susser of MacKay Shields LLC, the Fund’s Subadvisor.
How did MainStay High Yield Corporate Bond Fund perform relative to its primary benchmark and peers during the 12 months ended October 31, 2016?
Excluding all sales charges, MainStay High Yield Corporate Bond Fund returned 9.96% for Class A shares, 9.91% for Investor Class shares, 8.85% for Class B shares and 9.04% for Class C shares for the 12 months ended October 31, 2016. Over the same period, Class I shares returned 10.23%, Class R1 shares returned 10.13%, Class R2 shares returned 9.83%, Class R3 shares1 returned 9.52% and Class R6 shares returned 10.24%. For the 12 months ended October 31, 2016, Class I and Class R6 outperformed—and all other share classes underperformed—the 10.22% return of the Credit Suisse High Yield Index,2 which is the Fund’s broad-based securities-market index. For the same period, all share classes outperformed the 7.01% return of the Average Lipper3 High Yield Fund. See page 5 for Fund returns with applicable sales charges.
What factors affected the Fund’s relative performance during the reporting period?
The Fund is managed in a bottom-up investment style, which focuses on individual credit selection. Security selection and sector positioning made the energy sector the most significant positive contributor to the Fund’s performance relative to the Credit Suisse High Yield Index during the reporting period. (Contributions take weightings and total returns into account.) The Fund’s overweight position in exploration & production companies and favorable security selection in that industry also helped the Fund’s performance relative to the Index. In the health care sector, positioning and favorable security selection were also beneficial, as the Fund held underweight positions relative to the Credit Suisse High Yield Index in pharmaceutical companies and rural hospital operators, which underperformed the Index during the reporting period. Underweight positions relative to the Index and positive security selection in the food/tobacco and media/telecom sectors also helped the Fund’s relative performance.
Positioning in the gaming sector detracted from performance relative to the Credit Suisse High Yield Index, as the Fund did
not own distressed credits that rebounded during the reporting period. An overweight position in transportation negatively affected performance, as the sector underperformed the Index. In addition, the Fund’s underweight position in chemicals detracted from relative performance, as the sector outperformed the Credit Suisse High Yield Index.
What was the Fund’s duration4 strategy during the reporting period?
The Fund is not managed to a duration strategy, and the Fund’s duration positioning resulted from our bottom-up investment process. During the reporting period, the Fund’s duration was shorter than that of the Credit Suisse High Yield Index and slightly detracted from relative performance. As of October 31, 2016, the Fund’s modified duration to worst5 was approximately 3.12 years, which was shorter than the 3.61-year duration of the Credit Suisse High Yield Index on the same date.
What specific factors, risks or market forces prompted significant decisions for the Fund during the reporting period?
Investor sentiment toward high-yield bonds worsened during the fourth quarter of 2015 and ended the year at the most bearish level since 2009. High-yield bonds further sold off in early 2016 because of extreme weakness in global equity markets and continuing declines in commodity prices. Valuations of high-yield commodity-related bonds reflected extreme financial distress. In 2015 and 2016, the Fund invested in select energy and metals/mining credits at attractive risk-adjusted yields and margins of safety. The Fund also invested in select “fallen angels” (securities that had been downgraded to below investment grade). The Fund also incrementally increased its allocation to Risk Group 36 credits as their risk-adjusted yields became more attractive.
After bottoming out on February 11, 2016, the high yield market rebounded sharply, with Credit Suisse High Yield Index returning more than 20% since then. Spreads7 have tightened significantly, especially in commodity-related sectors and among securities rated CCC,8 which significantly outperformed the
| 1. | See footnote on page 5 for more information on Class R3 shares. |
| 2. | See footnote on page 6 for more information on the Credit Suisse High Yield Index. |
| 3. | See footnote on page 6 for more information on Lipper Inc. |
| 4. | Duration is a measure of the price sensitivity of a fixed-income investment to changes in interest rates. Duration is expressed as a number of years and is considered a more accurate sensitivity gauge than average maturity. |
| 5. | Modified duration is inversely related to the approximate percentage change in price for a given change in yield. Duration to worst is the duration of a bond computed using the bond’s nearest call date or maturity, whichever comes first. This measure ignores future cash flow fluctuations due to embedded optionality. |
| 6. | MacKay Shields LLC manages portfolio risk through Risk Groups. The Subadvisor categorizes every security into one of four proprietary Risk Groups based on the holding’s asset coverage, normalized cash flow, and cash flow volatility. Group 3 holdings are considered risk credits, which are securities that may trade at a discount as well as have a minimum of 1.5x asset coverage and higher cash flow volatility. |
| 7. | The terms “spread” and “yield spread” may refer to the difference in yield between a security or type of security and comparable U.S. Treasury issues. The terms may also refer to the difference in yield between two specific securities or types of securities at a given time. |
| 8. | An obligation rated ‘CCC’ by Standard & Poor’s (“S&P”) is deemed by S&P to be currently vulnerable to nonpayment and is dependent upon favorable business, financial and economic conditions for the obligor to meet its financial commitment on the obligation. It is the opinion of S&P that in the event of adverse business, financial or economic conditions, the obligor is not likely to have the capacity to meet its financial commitment on the obligation. When applied to Fund holdings, ratings are based solely on the creditworthiness of the bonds in the portfolio and are not meant to represent the security or safety of the Fund. |
market in 2016. As a result, the Fund began to reduce positions in these sectors, which have appreciated in price because of relative value, and we added to higher-quality positions at relatively attractive risk-adjusted yields.
Did the Fund make any significant purchases or sales during the reporting period?
The Fund purchased bonds of mining company Freeport-McMoRan during the reporting period. The sell-off in the company’s bonds had a strong technical factor, exceeding the increased risk that resulted from the sell-off in commodity prices during the fourth quarter of 2015. We believed that the market was focused on short-term commodity prices and misunderstood the long-term asset value of Freeport-McMoRan. We also believed that the company’s short-term financial flexibility supported our purchase of the company’s bonds at very attractive spreads. Another position that we added to the Fund was MGM Growth Properties. We established the position when the bonds were issued in April 2016. The company is a real estate investment trust (REIT) that was spun off from MGM Resorts International, a gaming company headquartered in Las Vegas. MGM Resorts International owns the majority of the equity of MGM Growth Properties and guarantees the bonds of MGM Growth Properties. We liked the bonds because we believed that they were well covered by the assets of the company. In particular, MGM Growth Properties owns seven properties on the Las Vegas strip as well as three other regional properties. The leases that were put in place with the operator, MGM Resorts International, are well structured and provide cash flow coverage relative to the rent stream. At the time of the new issue, we believed that the valuation was exceptionally compelling relative to comparable bonds. The bonds also contain covenants (limits on debt and liens) that could protect the Fund as the company grows.
During the reporting period, the Fund sold its position in data storage company Seagate Technology. The hard disk drive industry has suffered substantial declines based on weakness in the personal computer segment but also driven by the transition in personal computers and servers to the use of solid state drives, which Seagate Technology does not manufacture.
Western Digital, Seagate Technology’s main competitor in hard disk drives, recently purchased SanDisk to offset this industry transition. We sold the bonds of Seagate Technology because of fundamental business pressures and technical factors resulting from the potential for rating downgrades that could weigh on the price of the company’s bonds. We also felt that distributions to equity could lead to further credit challenges.
The Fund exited its position in Kratos Defense & Security Solutions during the reporting period. The company is a defense and specialized security technology business focused on electronic attack & warfare, radar, satellite, intelligence, reconnaissance, and missile system platforms. The environment for defense contractors has become increasingly competitive, resulting in lower margins, frequent award protests and delays. The company also reported persistently weak operating results, negative free cash flow and continued credit-profile deterioration. With leverage at elevated levels, limited operational visibility in 2016, and concerns over Kratos Defense & Security Solutions’ ability to win future contracts in an uncertain defense budgetary environment, we believed that the downside risks far outweighed the positive business elements that had prompted our original investment decision.
How did the Fund’s sector weightings change during the reporting period?
During the reporting period, there were no material changes to the Fund’s sector weightings, and our position in risk remained consistent. There were small increases in the Fund’s weightings in energy and financials because of attractive valuations and yields. During the reporting period, the Fund reduced its weightings in the industrials and consumer discretionary sectors.
How was the Fund positioned at the end of the reporting period?
As of October 31, 2016, the Fund held overweight positions relative to the Credit Suisse High Yield Index in the financials and industrials sectors. As of the same date, the Fund held underweight positions relative to the Index in the consumer staples, utilities and information technology sectors.
The opinions expressed are those of the portfolio manager as of the date of this report and are subject to change. There is no guarantee that any forecasts will come to pass. This material does not constitute investment advice and is not intended as an endorsement of any specific investment.
| | |
| 10 | | MainStay High Yield Corporate Bond Fund |
Portfolio of Investments October 31, 2016
| | | | | | | | |
| | | Principal
Amount | | | Value | |
Long-Term Bonds 93.4%† Convertible Bonds 2.7% | | | | | | | | |
Auto Parts & Equipment 0.5% | | | | | | | | |
¨Exide Technologies
7.00% (7.00% PIK),
due 4/30/25 (a)(b)(c)(d) | | $ | 74,577,020 | | | $ | 53,695,454 | |
| | | | | | | | |
| | |
Media 0.4% | | | | | | | | |
DISH Network Corp.
3.375%, due 8/15/26 (d) | | | 32,535,000 | | | | 37,435,584 | |
| | | | | | | | |
| | |
Mining 0.6% | | | | | | | | |
Detour Gold Corp.
5.50%, due 11/30/17 | | | 59,539,000 | | | | 61,474,018 | |
| | | | | | | | |
| | |
Oil & Gas 0.7% | | | | | | | | |
¨Comstock Resources, Inc. | | | | | | | | |
7.75% (7.75% PIK),
due 4/1/19 (a) | | | 24,520,000 | | | | 20,918,625 | |
9.50% (9.50% PIK),
due 6/15/20 (a) | | | 38,189,000 | | | | 32,603,859 | |
Stone Energy Corp.
1.75%, due 3/1/17 (e) | | | 29,845,000 | | | | 19,212,719 | |
| | | | | | | | |
| | | | | | | 72,735,203 | |
| | | | | | | | |
Real Estate Investment Trusts 0.5% | | | | | |
VEREIT, Inc. | | | | | | | | |
3.00%, due 8/1/18 | | | 2,020,000 | | | | 2,021,263 | |
3.75%, due 12/15/20 | | | 44,380,000 | | | | 45,240,084 | |
| | | | | | | | |
| | | | | | | 47,261,347 | |
| | | | | | | | |
Total Convertible Bonds
(Cost $279,208,145) | | | | | | | 272,601,606 | |
| | | | | | | | |
|
| Corporate Bonds 90.2% | |
Advertising 0.5% | | | | | | | | |
Lamar Media Corp. | | | | | | | | |
5.00%, due 5/1/23 | | | 2,500,000 | | | | 2,618,750 | |
5.75%, due 2/1/26 | | | 655,000 | | | | 701,276 | |
5.875%, due 2/1/22 | | | 21,972,000 | | | | 22,741,020 | |
Outfront Media Capital LLC / Outfront Media Capital Corp. | | | | | | | | |
5.25%, due 2/15/22 | | | 14,600,000 | | | | 15,111,000 | |
5.625%, due 2/15/24 | | | 6,845,000 | | | | 7,118,800 | |
| | | | | | | | |
| | | | | | | 48,290,846 | |
| | | | | | | | |
Aerospace & Defense 1.2% | | | | | | | | |
KLX, Inc.
5.875%, due 12/1/22 (d) | | | 32,065,000 | | | | 32,632,550 | |
Orbital ATK, Inc. | | | | | | | | |
5.25%, due 10/1/21 | | | 3,190,000 | | | | 3,301,650 | |
5.50%, due 10/1/23 | | | 14,115,000 | | | | 14,679,600 | |
| | | | | | | | |
| | | Principal
Amount | | | Value | |
Aerospace & Defense (continued) | | | | | | | | |
Spirit AeroSystems, Inc.
5.25%, due 3/15/22 | | $ | 18,585,000 | | | $ | 19,459,703 | |
TransDigm, Inc. | | | | | | | | |
5.50%, due 10/15/20 | | | 4,000,000 | | | | 4,110,000 | |
6.00%, due 7/15/22 | | | 4,000,000 | | | | 4,170,000 | |
6.375%, due 6/15/26 (d) | | | 8,740,000 | | | | 8,937,524 | |
6.50%, due 7/15/24 | | | 17,411,000 | | | | 18,325,078 | |
6.50%, due 5/15/25 | | | 11,350,000 | | | | 11,832,375 | |
| | | | | | | | |
| | | | | | | 117,448,480 | |
| | | | | | | | |
Apparel 0.4% | | | | | | | | |
Hanesbrands, Inc. | | | | | | | | |
4.625%, due 5/15/24 (d) | | | 8,280,000 | | | | 8,419,725 | |
4.875%, due 5/15/26 (d) | | | 10,710,000 | | | | 10,897,425 | |
William Carter Co. (The)
5.25%, due 8/15/21 | | | 17,520,000 | | | | 18,220,800 | |
| | | | | | | | |
| | | | | | | 37,537,950 | |
| | | | | | | | |
Auto Manufacturers 1.1% | | | | | | | | |
Allied Specialty Vehicles, Inc.
8.50%, due 11/1/19 (d) | | | 33,560,000 | | | | 34,566,800 | |
BCD Acquisition, Inc.
9.625%, due 9/15/23 (d) | | | 24,065,000 | | | | 24,847,113 | |
Ford Holdings LLC | | | | | | | | |
9.30%, due 3/1/30 | | | 18,155,000 | | | | 25,760,329 | |
9.375%, due 3/1/20 | | | 1,695,000 | | | | 2,059,372 | |
General Motors Financial Co., Inc. | | | | | | | | |
4.75%, due 8/15/17 | | | 3,000,000 | | | | 3,075,129 | |
6.75%, due 6/1/18 | | | 18,000,000 | | | | 19,313,838 | |
| | | | | | | | |
| | | | | | | 109,622,581 | |
| | | | | | | | |
Auto Parts & Equipment 3.0% | | | | | | | | |
Adient Global Holdings, Ltd.
4.875%, due 8/15/26 (d) | | | 25,545,000 | | | | 25,126,062 | |
Allison Transmission, Inc.
5.00%, due 10/1/24 (d) | | | 11,690,000 | | | | 11,923,800 | |
Cooper-Standard Automotive, Inc.
5.625%, due 11/15/26 (d) | | | 10,400,000 | | | | 10,452,000 | |
¨Exide Technologies
11.00% (4.00% Cash and
7.00% PIK), due
4/30/20 (a)(b)(c)(d) | | | 68,735,387 | | | | 59,043,697 | |
¨Exide Technologies
(Escrow Claim Shares)
8.625%, due 2/1/18 (b)(c)(d)(f) | | | 64,863,000 | | | | 64,863 | |
Goodyear Tire & Rubber Co. (The) 5.125%, due 11/15/23 | | | 7,000,000 | | | | 7,227,500 | |
IHO Verwaltungs GmbH | | | | | | | | |
4.125% (4.125% Cash or
4.875% PIK), due 9/15/21 (a)(d) | | | 20,710,000 | | | | 21,201,863 | |
4.50% (4.50% Cash or 5.25% PIK), due 9/15/23 (a)(d) | | | 30,350,000 | | | | 30,729,375 | |
4.75% (4.75% Cash or 5.50% PIK), due 9/15/26 (a)(d) | | | 20,145,000 | | | | 20,094,638 | |
| † | Percentages indicated are based on Fund net assets. |
| ¨ | | Among the Fund’s 10 largest holdings or issuers held, as of October 31, 2016, excluding short-term investment. May be subject to change daily. (Unaudited) |
| | | | | | |
The notes to the financial statements are an integral part of,
and should be read in conjunction with, the financial statements. | | | | | 11 | |
Portfolio of Investments October 31, 2016 (continued)
| | | | | | | | |
| | | Principal
Amount | | | Value | |
| Corporate Bonds (continued) | |
Auto Parts & Equipment (continued) | | | | | |
International Automotive Components Group S.A.
9.125%, due 6/1/18 (d) | | $ | 13,960,000 | | | $ | 13,227,100 | |
Meritor, Inc.
6.75%, due 6/15/21 | | | 11,900,000 | | | | 12,108,250 | |
Nexteer Automotive Group, Ltd. 5.875%, due 11/15/21 (d) | | | 21,000,000 | | | | 22,207,500 | |
Schaeffler Finance B.V. | | | | | | | | |
4.25%, due 5/15/21 (d) | | | 21,610,000 | | | | 22,177,262 | |
4.75%, due 5/15/23 (d) | | | 17,195,000 | | | | 17,732,344 | |
Tenneco, Inc.
5.00%, due 7/15/26 | | | 12,550,000 | | | | 12,612,750 | |
Titan International, Inc.
6.875%, due 10/1/20 | | | 4,442,000 | | | | 4,264,320 | |
ZF North America Capital, Inc. | | | | | | | | |
4.50%, due 4/29/22 (d) | | | 2,000,000 | | | | 2,117,500 | |
4.75%, due 4/29/25 (d) | | | 10,025,000 | | | | 10,576,375 | |
| | | | | | | | |
| | | | | | | 302,887,199 | |
| | | | | | | | |
Banks 0.1% | |
Provident Funding Associates, L.P. / PFG Finance Corp.
6.75%, due 6/15/21 (d) | | | 8,950,000 | | | | 8,994,750 | |
| | | | | | | | |
| | |
Biotechnology 0.2% | | | | | | | | |
AMAG Pharmaceuticals, Inc.
7.875%, due 9/1/23 (d) | | | 24,220,000 | | | | 22,706,250 | |
| | | | | | | | |
| | |
Building Materials 1.8% | | | | | | | | |
BMC East LLC
5.50%, due 10/1/24 (d) | | | 10,285,000 | | | | 10,439,275 | |
Boise Cascade Co.
6.375%, due 11/1/20 | | | 28,065,000 | | | | 28,959,712 | |
Eagle Materials, Inc.
4.50%, due 8/1/26 | | | 2,500,000 | | | | 2,519,915 | |
Gibraltar Industries, Inc.
6.25%, due 2/1/21 | | | 11,580,000 | | | | 11,999,775 | |
James Hardie International Finance, Ltd.
5.875%, due 2/15/23 (d) | | | 27,885,000 | | | | 29,418,675 | |
RSI Home Products, Inc.
6.50%, due 3/15/23 (d) | | | 12,500,000 | | | | 13,250,000 | |
Standard Industries, Inc.
5.125%, due 2/15/21 (d) | | | 7,630,000 | | | | 8,011,500 | |
Summit Materials LLC / Summit Materials Finance Corp. | | | | | | | | |
6.125%, due 7/15/23 | | | 31,085,000 | | | | 31,862,125 | |
8.50%, due 4/15/22 (d) | | | 17,500,000 | | | | 19,250,000 | |
USG Corp. | | | | | | | | |
5.875%, due 11/1/21 (d) | | | 10,000,000 | | | | 10,475,000 | |
7.875%, due 3/30/20 (d) | | | 12,236,000 | | | | 12,740,735 | |
| | | | | | | | |
| | | | | | | 178,926,712 | |
| | | | | | | | |
| | | | | | | | |
| | | Principal
Amount | | | Value | |
Chemicals 1.4% | | | | | | | | |
Blue Cube Spinco, Inc. | | | | | | | | |
9.75%, due 10/15/23 | | $ | 31,550,000 | | | $ | 37,071,250 | |
10.00%, due 10/15/25 | | | 22,945,000 | | | | 27,534,000 | |
GCP Applied Technologies, Inc.
9.50%, due 2/1/23 (d) | | | 19,625,000 | | | | 22,225,312 | |
Olin Corp.
5.50%, due 8/15/22 | | | 18,114,000 | | | | 18,295,140 | |
PolyOne Corp.
5.25%, due 3/15/23 | | | 11,355,000 | | | | 11,621,842 | |
Trinseo Materials Operating SCA / Trinseo Materials Finance, Inc.
6.75%, due 5/1/22 (d) | | | 15,625,000 | | | | 16,484,375 | |
Westlake Chemical Corp.
4.625%, due 2/15/21 (d) | | | 3,650,000 | | | | 3,814,214 | |
| | | | | | | | |
| | | | | | | 137,046,133 | |
| | | | | | | | |
Coal 0.6% | | | | | | | | |
CONSOL Energy, Inc. | | | | | | | | |
5.875%, due 4/15/22 | | | 42,000,000 | | | | 38,823,750 | |
8.00%, due 4/1/23 | | | 24,030,000 | | | | 23,789,700 | |
| | | | | | | | |
| | | | | | | 62,613,450 | |
| | | | | | | | |
Commercial Services 3.8% | | | | | | | | |
Ashtead Capital, Inc. | | | | | | | | |
5.625%, due 10/1/24 (d) | | | 17,000,000 | | | | 17,892,500 | |
6.50%, due 7/15/22 (d) | | | 45,692,000 | | | | 47,919,485 | |
Avis Budget Car Rental LLC / Avis Budget Finance, Inc. | | | | | | | | |
5.50%, due 4/1/23 | | | 40,118,000 | | | | 39,716,820 | |
6.375%, due 4/1/24 (d) | | | 13,295,000 | | | | 13,361,475 | |
Cimpress N.V.
7.00%, due 4/1/22 (d) | | | 37,800,000 | | | | 39,123,000 | |
Flexi-Van Leasing, Inc.
7.875%, due 8/15/18 (d) | | | 14,975,000 | | | | 13,926,750 | |
Great Lakes Dredge & Dock Corp. 7.375%, due 2/1/19 | | | 46,601,000 | | | | 45,727,231 | |
Hertz Corp. (The)
5.50%, due 10/15/24 (d) | | | 9,355,000 | | | | 9,082,770 | |
IHS Markit, Ltd.
5.00%, due 11/1/22 (d) | | | 64,925,000 | | | | 68,658,188 | |
Modular Space Corp.
10.25%, due 1/31/19 (d)(g) | | | 4,270,000 | | | | 1,836,100 | |
Nielsen Co. Luxembourg S.A.R.L. (The)
5.50%, due 10/1/21 (d) | | | 4,500,000 | | | | 4,691,250 | |
Team Health, Inc.
7.25%, due 12/15/23 (d) | | | 26,505,000 | | | | 29,983,781 | |
United Rentals North America, Inc. | | | | | | | | |
4.625%, due 7/15/23 | | | 10,600,000 | | | | 10,944,500 | |
5.50%, due 5/15/27 | | | 10,000,000 | | | | 9,950,000 | |
7.625%, due 4/15/22 | | | 10,572,000 | | | | 11,242,053 | |
WEX, Inc. 4.75%, due 2/1/23 (d) | | | 15,458,000 | | | | 15,380,710 | |
| | | | | | | | |
| | | | | | | 379,436,613 | |
| | | | | | | | |
| | | | |
| 12 | | MainStay High Yield Corporate Bond Fund | | The notes to the financial statements are an integral part of,
and should be read in conjunction with, the financial statements. |
| | | | | | | | |
| | | Principal
Amount | | | Value | |
| Corporate Bonds (continued) | |
Computers 0.3% | | | | | | | | |
NCR Corp. | | | | | | | | |
4.625%, due 2/15/21 | | $ | 3,180,000 | | | $ | 3,219,750 | |
6.375%, due 12/15/23 | | | 25,360,000 | | | | 26,818,200 | |
| | | | | | | | |
| | | | | | | 30,037,950 | |
| | | | | | | | |
Cosmetics & Personal Care 0.7% | | | | | | | | |
Edgewell Personal Care Co. | | | | | | | | |
4.70%, due 5/19/21 | | | 38,105,000 | | | | 40,020,919 | |
4.70%, due 5/24/22 | | | 19,378,000 | | | | 20,310,469 | |
First Quality Finance Co., Inc.
4.625%, due 5/15/21 (d) | | | 6,490,000 | | | | 6,514,338 | |
| | | | | | | | |
| | | | | | | 66,845,726 | |
| | | | | | | | |
Distribution & Wholesale 0.4% | | | | | | | | |
American Tire Distributors, Inc.
10.25%, due 3/1/22 (d) | | | 22,460,000 | | | | 20,649,275 | |
H&E Equipment Services, Inc.
7.00%, due 9/1/22 | | | 15,250,000 | | | | 16,043,000 | |
HD Supply, Inc.
5.75%, due 4/15/24 (d) | | | 3,000,000 | | | | 3,150,000 | |
| | | | | | | | |
| | | | | | | 39,842,275 | |
| | | | | | | | |
Electric 1.7% | | | | | | | | |
Calpine Corp. | | | | | | | | |
5.875%, due 1/15/24 (d) | | | 19,441,000 | | | | 20,510,255 | |
6.00%, due 1/15/22 (d) | | | 34,773,000 | | | | 36,348,565 | |
GenOn Energy, Inc. | | | | | | | | |
7.875%, due 6/15/17 | | | 68,622,000 | | | | 56,270,040 | |
9.50%, due 10/15/18 | | | 43,205,000 | | | | 34,672,012 | |
NRG REMA LLC | | | | | | | | |
Series B
9.237%, due 7/2/17 | | | 2,931,309 | | | | 2,345,047 | |
Series C
9.681%, due 7/2/26 | | | 24,225,000 | | | | 16,715,250 | |
Public Service Co. of New Mexico 7.95%, due 5/15/18 | | | 2,927,000 | | | | 3,196,237 | |
| | | | | | | | |
| | | | | | | 170,057,406 | |
| | | | | | | | |
Electrical Components & Equipment 1.2% | |
Anixter, Inc. | | | | | | | | |
5.50%, due 3/1/23 | | | 1,000,000 | | | | 1,052,500 | |
5.625%, due 5/1/19 | | | 7,715,000 | | | | 8,177,900 | |
Belden, Inc.
5.50%, due 9/1/22 (d) | | | 48,348,000 | | | | 49,435,830 | |
General Cable Corp.
5.75%, due 10/1/22 | | | 44,660,000 | | | | 42,203,700 | |
WESCO Distribution, Inc.
5.375%, due 12/15/21 | | | 20,519,000 | | | | 20,955,029 | |
| | | | | | | | |
| | | | | | | 121,824,959 | |
| | | | | | | | |
| | | | | | | | |
| | | Principal
Amount | | | Value | |
Electronics 0.6% | | | | | | | | |
Allegion PLC
5.875%, due 9/15/23 | | $ | 8,500,000 | | | $ | 9,158,750 | |
Allegion U.S. Holding Co., Inc.
5.75%, due 10/1/21 | | | 19,800,000 | | | | 20,616,750 | |
Kemet Corp.
10.50%, due 5/1/18 | | | 27,014,000 | | | | 27,081,535 | |
| | | | | | | | |
| | | | | | | 56,857,035 | |
| | | | | | | | |
Engineering & Construction 0.8% | | | | | | | | |
Broadspectrum, Ltd.
8.375%, due 5/15/20 (d) | | | 27,490,000 | | | | 29,242,487 | |
New Enterprise Stone & Lime Co., Inc.
11.00%, due 9/1/18 | | | 29,975,000 | | | | 29,675,250 | |
Weekley Homes LLC / Weekley Finance Corp.
6.00%, due 2/1/23 | | | 26,349,000 | | | | 23,977,590 | |
| | | | | | | | |
| | | | | | | 82,895,327 | |
| | | | | | | | |
Entertainment 1.0% | | | | | | | | |
Churchill Downs, Inc. | | | | | | | | |
5.375%, due 12/15/21 | | | 17,605,000 | | | | 18,221,175 | |
5.375%, due 12/15/21 (d) | | | 5,965,000 | | | | 6,173,775 | |
GLP Capital, L.P. / GLP Financing II, Inc. | | | | | | | | |
4.875%, due 11/1/20 | | | 2,000,000 | | | | 2,132,500 | |
5.375%, due 4/15/26 | | | 5,500,000 | | | | 5,843,750 | |
NAI Entertainment Holdings / NAI Entertainment Holdings
Finance Corp.
5.00%, due 8/1/18 (d) | | | 17,990,000 | | | | 18,169,900 | |
Rivers Pittsburgh Borrower, L.P. / Rivers Pittsburgh Finance Corp.
6.125%, due 8/15/21 (d) | | | 14,340,000 | | | | 14,806,050 | |
Sterling Entertainment Enterprises LLC
9.75%, due 12/31/19 (b)(c)(f) | | | 35,000,000 | | | | 36,312,500 | |
| | | | | | | | |
| | | | | | | 101,659,650 | |
| | | | | | | | |
Finance—Auto Loans 0.2% | | | | | | | | |
Credit Acceptance Corp. | | | | | | | | |
6.125%, due 2/15/21 | | | 4,102,000 | | | | 4,122,510 | |
7.375%, due 3/15/23 | | | 18,625,000 | | | | 19,230,313 | |
| | | | | | | | |
| | | | | | | 23,352,823 | |
| | | | | | | | |
Finance—Consumer Loans 0.5% | | | | | | | | |
CFG Holdings, Ltd. / CFG Finance LLC
11.50%, due 11/15/19 (d) | | | 25,895,000 | | | | 26,089,212 | |
OneMain Financial Holdings LLC | | | | | | | | |
6.75%, due 12/15/19 (d) | | | 6,645,000 | | | | 6,877,575 | |
7.25%, due 12/15/21 (d) | | | 2,000,000 | | | | 2,070,000 | |
| | | | | | |
The notes to the financial statements are an integral part of,
and should be read in conjunction with, the financial statements. | | | | | 13 | |
Portfolio of Investments October 31, 2016 (continued)
| | | | | | | | |
| | | Principal
Amount | | | Value | |
| Corporate Bonds (continued) | |
Finance—Consumer Loans (continued) | | | | | |
Speedy Cash Intermediate Holdings Corp.
10.75%, due 5/15/18 (d) | | $ | 12,414,000 | | | $ | 9,838,095 | |
Springleaf Finance Corp.
8.25%, due 12/15/20 | | | 5,075,000 | | | | 5,506,375 | |
| | | | | | | | |
| | | | | | | 50,381,257 | |
| | | | | | | | |
Finance—Credit Card 0.1% | | | | | | | | |
Alliance Data Systems Corp.
6.375%, due 4/1/20 (d) | | | 9,000,000 | | | | 9,168,750 | |
| | | | | | | | |
| |
Finance—Investment Banker/Broker 0.7% | | | | | |
E*TRADE Financial Corp. | | | | | | | | |
4.625%, due 9/15/23 | | | 17,500,000 | | | | 18,156,250 | |
5.375%, due 11/15/22 | | | 20,880,000 | | | | 22,317,692 | |
5.875%, due 12/29/49 (h) | | | 3,525,000 | | | | 3,643,969 | |
KCG Holdings, Inc.
6.875%, due 3/15/20 (d) | | | 27,035,000 | | | | 26,426,713 | |
| | | | | | | | |
| | | | | | | 70,544,624 | |
| | | | | | | | |
Finance—Leasing Companies 0.5% | | | | | |
AerCap Ireland Capital, Ltd. / AerCap Global Aviation Trust | | | | | | | | |
4.625%, due 10/30/20 | | | 9,240,000 | | | | 9,725,100 | |
5.00%, due 10/1/21 | | | 16,320,000 | | | | 17,340,000 | |
Aircastle, Ltd.
5.50%, due 2/15/22 | | | 2,000,000 | | | | 2,145,000 | |
Lincoln Finance, Ltd.
7.375%, due 4/15/21 (d) | | | 18,055,000 | | | | 19,409,125 | |
| | | | | | | | |
| | | | | | | 48,619,225 | |
| | | | | | | | |
Finance—Mortgage Loan/Banker 0.4% | | | | | |
Ladder Capital Finance Holdings LLP/Ladder Capital Finance Corp. | | | | | | | | |
5.875%, due 8/1/21 (d) | | | 25,665,000 | | | | 24,381,750 | |
7.375%, due 10/1/17 | | | 18,385,000 | | | | 18,637,794 | |
| | | | | | | | |
| | | | | | | 43,019,544 | |
| | | | | | | | |
Finance—Other Services 0.5% | | | | | | | | |
Cantor Commercial Real Estate Co., L.P. / CCRE Finance Corp.
7.75%, due 2/15/18 (d) | | | 27,350,000 | | | | 27,350,000 | |
Double Eagle Acquistion Sub, Inc.
7.50%, due 10/1/24 (d) | | | 5,000,000 | | | | 5,150,000 | |
Nationstar Mortgage LLC / Nationstar Capital Corp. | | | | | | | | |
6.50%, due 8/1/18 | | | 12,000,000 | | | | 12,142,500 | |
6.50%, due 7/1/21 | | | 1,500,000 | | | | 1,488,750 | |
7.875%, due 10/1/20 | | | 6,000,000 | | | | 6,120,000 | |
| | | | | | | | |
| | | | | | | 52,251,250 | |
| | | | | | | | |
| | | | | | | | |
| | | Principal
Amount | | | Value | |
Food 2.0% | | | | | | | | |
B&G Foods, Inc.
4.625%, due 6/1/21 | | $ | 16,649,000 | | | $ | 17,106,848 | |
C&S Group Enterprises LLC
5.375%, due 7/15/22 (d) | | | 49,865,000 | | | | 48,369,050 | |
Fresh Market, Inc. (The)
9.75%, due 5/1/23 (d) | | | 20,170,000 | | | | 17,194,925 | |
Ingles Markets, Inc.
5.75%, due 6/15/23 | | | 12,100,000 | | | | 12,523,500 | |
KeHE Distributors LLC / KeHE Finance Corp.
7.625%, due 8/15/21 (d) | | | 23,165,000 | | | | 22,701,700 | |
Land O’Lakes, Inc.
6.00%, due 11/15/22 (d) | | | 26,365,000 | | | | 29,067,412 | |
Land O’Lakes Capital Trust I
7.45%, due 3/15/28 (d) | | | 13,023,000 | | | | 14,911,335 | |
TreeHouse Foods, Inc.
6.00%, due 2/15/24 (d) | | | 11,715,000 | | | | 12,581,910 | |
Wells Enterprises, Inc.
6.75%, due 2/1/20 (d) | | | 21,607,000 | | | | 22,282,219 | |
| | | | | | | | |
| | | | | | | 196,738,899 | |
| | | | | | | | |
Forest Products & Paper 0.6% | | | | | | | | |
Smurfit Kappa Treasury Funding, Ltd.
7.50%, due 11/20/25 | | | 51,820,000 | | | | 61,665,800 | |
| | | | | | | | |
| | |
Gas 0.5% | | | | | | | | |
AmeriGas Partners, L.P. / AmeriGas Finance Corp. | | | | | | | | |
5.625%, due 5/20/24 | | | 23,405,000 | | | | 24,516,737 | |
5.875%, due 8/20/26 | | | 22,255,000 | | | | 23,367,750 | |
| | | | | | | | |
| | | | 47,884,487 | |
| | | | | | | | |
Health Care—Products 0.9% | | | | | | | | |
Alere, Inc.
6.375%, due 7/1/23 (d) | | | 9,970,000 | | | | 10,269,100 | |
ConvaTec Healthcare E S.A.
10.50%, due 12/15/18 (d) | | | 24,859,000 | | | | 25,138,664 | |
Halyard Health, Inc.
6.25%, due 10/15/22 | | | 11,331,000 | | | | 11,600,111 | |
Hill-Rom Holdings, Inc.
5.75%, due 9/1/23 (d) | | | 13,750,000 | | | | 14,437,500 | |
Hologic, Inc.
5.25%, due 7/15/22 (d) | | | 12,715,000 | | | | 13,447,384 | |
Sterigenics-Nordion Holdings LLC 6.50%, due 5/15/23 (d) | | | 8,350,000 | | | | 8,579,625 | |
Universal Hospital Services, Inc. 7.625%, due 8/15/20 | | | 10,855,000 | | | | 10,420,800 | |
| | | | | | | | |
| | | | 93,893,184 | |
| | | | | | | | |
| | | | |
| 14 | | MainStay High Yield Corporate Bond Fund | | The notes to the financial statements are an integral part of,
and should be read in conjunction with, the financial statements. |
| | | | | | | | |
| | | Principal
Amount | | | Value | |
| Corporate Bonds (continued) | |
Health Care—Services 3.9% | | | | | | | | |
Acadia Healthcare Co., Inc. | | | | | | | | |
5.625%, due 2/15/23 | | $ | 13,762,000 | | | $ | 13,779,203 | |
6.50%, due 3/1/24 | | | 11,565,000 | | | | 11,796,300 | |
Centene Corp. | | | | | | | | |
4.75%, due 5/15/22 | | | 4,000,000 | | | | 4,060,000 | |
4.75%, due 1/15/25 | | | 14,425,000 | | | | 14,361,891 | |
5.625%, due 2/15/21 | | | 13,405,000 | | | | 14,061,979 | |
5.75%, due 6/1/17 | | | 9,030,000 | | | | 9,188,025 | |
6.125%, due 2/15/24 | | | 19,320,000 | | | | 20,575,800 | |
Fresenius Medical Care U.S. Finance, Inc.
6.875%, due 7/15/17 | | | 130,000 | | | | 133,900 | |
Fresenius Medical Care U.S. Finance II, Inc. | | | | | | | | |
4.75%, due 10/15/24 (d) | | | 2,000,000 | | | | 2,085,000 | |
5.625%, due 7/31/19 (d) | | | 11,680,000 | | | | 12,643,600 | |
5.875%, due 1/31/22 (d) | | | 4,030,000 | | | | 4,564,781 | |
6.50%, due 9/15/18 (d) | | | 4,730,000 | | | | 5,096,575 | |
¨HCA, Inc. | | | | | | | | |
4.25%, due 10/15/19 | | | 6,000,000 | | | | 6,225,000 | |
5.00%, due 3/15/24 | | | 9,944,000 | | | | 10,356,676 | |
5.25%, due 4/15/25 | | | 19,000,000 | | | | 19,902,500 | |
5.375%, due 2/1/25 | | | 20,495,000 | | | | 20,919,247 | |
5.875%, due 3/15/22 | | | 12,010,000 | | | | 13,211,000 | |
5.875%, due 5/1/23 | | | 2,828,000 | | | | 3,000,338 | |
5.875%, due 2/15/26 | | | 19,470,000 | | | | 20,443,500 | |
6.50%, due 2/15/20 | | | 3,294,000 | | | | 3,648,105 | |
7.50%, due 2/15/22 | | | 9,407,000 | | | | 10,705,166 | |
7.50%, due 12/15/23 | | | 1,500,000 | | | | 1,665,000 | |
7.58%, due 9/15/25 | | | 8,000,000 | | | | 8,920,000 | |
7.69%, due 6/15/25 | | | 18,000,000 | | | | 20,160,000 | |
8.00%, due 10/1/18 | | | 4,984,000 | | | | 5,526,010 | |
8.36%, due 4/15/24 | | | 4,524,000 | | | | 5,270,460 | |
HealthSouth Corp.
5.75%, due 11/1/24 | | | 13,345,000 | | | | 13,762,031 | |
Molina Healthcare, Inc.
5.375%, due 11/15/22 | | | 22,000,000 | | | | 22,893,640 | |
MPH Acquisition Holdings LLC 7.125%, due 6/1/24 (d) | | | 46,985,000 | | | | 50,269,251 | |
Quorum Health Corp.
11.625%, due 4/15/23 (d) | | | 10,000,000 | | | | 7,250,000 | |
Tenet Healthcare Corp. | | | | | | | | |
6.00%, due 10/1/20 | | | 8,000,000 | | | | 8,427,040 | |
6.75%, due 6/15/23 | | | 7,000,000 | | | | 6,431,250 | |
8.125%, due 4/1/22 | | | 19,000,000 | | | | 18,572,500 | |
| | | | | | | | |
| | | | 389,905,768 | |
| | | | | | | | |
Holding Company—Diversified 0.6% | | | | | |
Carlson Travel Holdings, Inc.
7.50% (7.50% Cash or
8.25% PIK), due 8/15/19 (a)(d) | | | 67,601,000 | | | | 65,910,975 | |
| | | | | | | | |
| | | | | | | | |
| | | Principal
Amount | | | Value | |
Home Builders 2.6% | | | | | | | | |
Ashton Woods USA LLC / Ashton Woods Finance Co.
6.875%, due 2/15/21 (d) | | $ | 35,515,000 | | | $ | 34,804,700 | |
AV Homes, Inc.
8.50%, due 7/1/19 | | | 24,860,000 | | | | 25,854,400 | |
Brookfield Residential Properties, Inc. | | | | | | | | |
6.375%, due 5/15/25 (d) | | | 5,665,000 | | | | 5,650,838 | |
6.50%, due 12/15/20 (d) | | | 23,765,000 | | | | 24,477,950 | |
Brookfield Residential Properties, Inc./ Brookfield Residential U.S. Corp.
6.125%, due 7/1/22 (d) | | | 37,941,000 | | | | 38,510,115 | |
Century Communities, Inc.
6.875%, due 5/15/22 | | | 25,336,000 | | | | 25,779,380 | |
D.R. Horton, Inc. | | | | | | | | |
4.75%, due 2/15/23 | | | 2,000,000 | | | | 2,110,000 | |
5.75%, due 8/15/23 | | | 3,605,000 | | | | 4,008,363 | |
Mattamy Group Corp.
6.50%, due 11/15/20 (d) | | | 36,862,000 | | | | 36,769,845 | |
Meritage Homes Corp.
7.00%, due 4/1/22 | | | 1,500,000 | | | | 1,674,000 | |
PulteGroup, Inc. | | | | | | | | |
4.25%, due 3/1/21 | | | 2,000,000 | | | | 2,100,000 | |
5.00%, due 1/15/27 | | | 8,115,000 | | | | 8,054,137 | |
5.50%, due 3/1/26 | | | 4,000,000 | | | | 4,160,000 | |
Toll Brothers Finance Corp. | | | | | | | | |
5.625%, due 1/15/24 | | | 2,000,000 | | | | 2,130,000 | |
5.875%, due 2/15/22 | | | 5,000,000 | | | | 5,512,500 | |
WCI Communities, Inc.
6.875%, due 8/15/21 | | | 12,355,000 | | | | 13,034,525 | |
Woodside Homes Co. LLC / Woodside Homes Finance, Inc.
6.75%, due 12/15/21 (d) | | | 30,741,000 | | | | 29,818,770 | |
| | | | | | | | |
| | | | 264,449,523 | |
| | | | | | | | |
Household Products & Wares 0.5% | | | | | |
Prestige Brands, Inc. | | | | | | | | |
5.375%, due 12/15/21 (d) | | | 4,000,000 | | | | 4,150,000 | |
6.375%, due 3/1/24 (d) | | | 15,088,000 | | | | 16,031,000 | |
Spectrum Brands, Inc. | | | | | | | | |
5.75%, due 7/15/25 | | | 7,000,000 | | | | 7,577,500 | |
6.625%, due 11/15/22 | | | 24,835,000 | | | | 26,620,140 | |
| | | | | | | | |
| | | | 54,378,640 | |
| | | | | | | | |
Housewares 0.4% | | | | | | | | |
American Greetings Corp.
7.375%, due 12/1/21 | | | 9,244,000 | | | | 9,475,100 | |
Radio Systems Corp.
8.375%, due 11/1/19 (d) | | | 33,225,000 | | | | 34,678,594 | |
| | | | | | | | |
| | | | 44,153,694 | |
| | | | | | | | |
| | | | | | |
The notes to the financial statements are an integral part of,
and should be read in conjunction with, the financial statements. | | | | | 15 | |
Portfolio of Investments October 31, 2016 (continued)
| | | | | | | | |
| | | Principal
Amount | | | Value | |
| Corporate Bonds (continued) | |
Insurance 1.5% | | | | | | | | |
American Equity Investment Life
Holding Co.
6.625%, due 7/15/21 | | $ | 31,660,000 | | | $ | 33,084,700 | |
Fairfax Financial Holdings, Ltd. | | | | | | | | |
7.375%, due 4/15/18 | | | 9,092,000 | | | | 9,706,656 | |
8.30%, due 4/15/26 | | | 5,395,000 | | | | 6,507,115 | |
Fidelity & Guaranty Life Holdings, Inc.
6.375%, due 4/1/21 (d) | | | 29,148,000 | | | | 29,075,130 | |
Ironshore Holdings (U.S.), Inc.
8.50%, due 5/15/20 (d) | | | 12,890,000 | | | | 14,581,464 | |
MGIC Investment Corp.
5.75%, due 8/15/23 | | | 22,500,000 | | | | 23,737,500 | |
USI, Inc.
7.75%, due 1/15/21 (d) | | | 29,460,000 | | | | 29,754,600 | |
| | | | | | | | |
| | | | 146,447,165 | |
| | | | | | | | |
Internet 1.5% | | | | | | | | |
Cogent Communications Group, Inc. 5.375%, due 3/1/22 (d) | | | 8,855,000 | | | | 9,098,513 | |
Match Group, Inc. | | | | | | | | |
6.375%, due 6/1/24 | | | 4,500,000 | | | | 4,860,000 | |
6.75%, due 12/15/22 | | | 56,624,000 | | | | 60,233,780 | |
Netflix, Inc. | | | | | | | | |
5.375%, due 2/1/21 | | | 10,580,000 | | | | 11,466,075 | |
5.50%, due 2/15/22 | | | 14,265,000 | | | | 15,441,862 | |
5.75%, due 3/1/24 | | | 23,761,000 | | | | 25,840,087 | |
5.875%, due 2/15/25 | | | 4,401,000 | | | | 4,879,609 | |
VeriSign, Inc.
5.25%, due 4/1/25 | | | 16,582,000 | | | | 17,494,010 | |
| | | | | | | | |
| | | | 149,313,936 | |
| | | | | | | | |
Investment Management/Advisory Services 0.5% | | | | | |
Drawbridge Special Opportunities Fund, L.P. / Drawbridge Special Opportunities Finance
5.00%, due 8/1/21 (d) | | | 24,475,000 | | | | 23,434,813 | |
NFP Corp.
9.00%, due 7/15/21 (d) | | | 22,882,000 | | | | 23,339,640 | |
| | | | | | | | |
| | | | 46,774,453 | |
| | | | | | | | |
Iron & Steel 1.2% | | | | | | | | |
Allegheny Ludlum Corp.
6.95%, due 12/15/25 | | | 10,418,000 | | | | 9,740,830 | |
Allegheny Technologies, Inc. | | | | | | | | |
7.875%, due 8/15/23 | | | 22,970,000 | | | | 21,936,350 | |
9.375%, due 6/1/19 | | | 7,250,000 | | | | 7,612,500 | |
BlueScope Steel Finance, Ltd. / BlueScope Steel Finance USA LLC | | | | | | | | |
6.50%, due 5/15/21 (d) | | | 38,050,000 | | | | 40,146,555 | |
7.125%, due 5/1/18 (d) | | | 15,783,000 | | | | 16,098,660 | |
Evraz, Inc. N.A.
7.50%, due 11/15/19 (d) | | | 22,270,000 | | | | 22,464,862 | |
| | | | | | | | |
| | | | 117,999,757 | |
| | | | | | | | |
| | | | | | | | |
| | | Principal
Amount | | | Value | |
Leisure Time 1.0% | | | | | | | | |
Brunswick Corp.
4.625%, due 5/15/21 (d) | | $ | 19,031,000 | | | $ | 19,625,719 | |
Carlson Wagonlit B.V.
6.875%, due 6/15/19 (d) | | | 70,625,000 | | | | 73,002,096 | |
Vista Outdoor, Inc.
5.875%, due 10/1/23 | | | 6,500,000 | | | | 6,825,650 | |
| | | | | | | | |
| | | | 99,453,465 | |
| | | | | | | | |
Lodging 0.8% | | | | | | | | |
Boyd Gaming Corp.
6.375%, due 4/1/26 (d) | | | 9,000,000 | | | | 9,630,000 | |
Choice Hotels International, Inc. | | | | | | | | |
5.70%, due 8/28/20 | | | 2,000,000 | | | | 2,192,500 | |
5.75%, due 7/1/22 | | | 26,735,000 | | | | 29,241,406 | |
Hilton Domestic Operating Co., Inc.
4.25%, due 9/1/24 (d) | | | 14,200,000 | | | | 14,235,500 | |
Hilton Worldwide Finance LLC / Hilton Worldwide Finance Corp.
5.625%, due 10/15/21 | | | 20,930,000 | | | | 21,557,900 | |
| | | | | | | | |
| | | | 76,857,306 | |
| | | | | | | | |
Machinery—Construction & Mining 0.3% | |
BlueLine Rental Finance Corp.
7.00%, due 2/1/19 (d) | | | 20,610,000 | | | | 17,982,225 | |
Cortes NP Acquisition Corp.
9.25%, due 10/15/24 (d) | | | 5,795,000 | | | | 6,052,153 | |
Vander Intermediate Holding II Corp.
9.75% (9.75% Cash or
10.50% PIK), due 2/1/19 (a)(d) | | | 5,762,437 | | | | 3,025,280 | |
| | | | | | | | |
| | | | 27,059,658 | |
| | | | | | | | |
Machinery—Diversified 0.4% | | | | | | | | |
Briggs & Stratton Corp.
6.875%, due 12/15/20 | | | 8,945,000 | | | | 9,906,588 | |
SPX FLOW, Inc.
5.625%, due 8/15/24 (d) | | | 4,100,000 | | | | 4,156,375 | |
Zebra Technologies Corp.
7.25%, due 10/15/22 | | | 25,185,000 | | | | 27,136,837 | |
| | | | | | | | |
| | | | 41,199,800 | |
| | | | | | | | |
Media 5.7% | | | | | | | | |
Altice Financing S.A.
7.50%, due 5/15/26 (d) | | | 15,300,000 | | | | 15,759,000 | |
Altice U.S. Finance I Corp.
5.375%, due 7/15/23 (d) | | | 20,195,000 | | | | 20,660,495 | |
Cablevision Systems Corp.
7.75%, due 4/15/18 | | | 18,620,000 | | | | 19,620,825 | |
¨CCO Holdings LLC / CCO Holdings Capital Corp. | | | | | | | | |
5.125%, due 2/15/23 | | | 24,000,000 | | | | 24,840,000 | |
5.125%, due 5/1/23 (d) | | | 14,873,000 | | | | 15,356,372 | |
5.25%, due 9/30/22 | | | 3,000,000 | | | | 3,123,750 | |
5.375%, due 5/1/25 (d) | | | 3,880,000 | | | | 3,986,700 | |
| | | | |
| 16 | | MainStay High Yield Corporate Bond Fund | | The notes to the financial statements are an integral part of,
and should be read in conjunction with, the financial statements. |
| | | | | | | | |
| | | Principal
Amount | | | Value | |
| Corporate Bonds (continued) | |
Media (continued) | | | | | | | | |
¨CCO Holdings LLC / CCO Holdings Capital Corp. (continued) | | | | | | | | |
5.75%, due 2/15/26 (d) | | $ | 14,035,000 | | | $ | 14,622,716 | |
5.875%, due 4/1/24 (d) | | | 23,695,000 | | | | 25,057,462 | |
5.875%, due 5/1/27 (d) | | | 9,000,000 | | | | 9,427,500 | |
6.625%, due 1/31/22 | | | 600,000 | | | | 625,500 | |
Charter Communications Operating LLC / Charter Communications Operating Capital Corp. | | | | | | | | |
3.579%, due 7/23/20 (d) | | | 4,000,000 | | | | 4,147,436 | |
4.464%, due 7/23/22 (d) | | | 6,165,000 | | | | 6,566,822 | |
Cogeco Communications, Inc.
4.875%, due 5/1/20 (d) | | | 10,685,000 | | | | 11,032,263 | |
CSC Holdings LLC | | | | | | | | |
7.625%, due 7/15/18 | | | 8,885,000 | | | | 9,529,163 | |
10.125%, due 1/15/23 (d) | | | 5,935,000 | | | | 6,691,713 | |
DISH DBS Corp. | | | | | | | | |
4.625%, due 7/15/17 | | | 2,000,000 | | | | 2,037,500 | |
5.125%, due 5/1/20 | | | 5,000,000 | | | | 5,175,000 | |
Midcontinent Communications / Midcontinent Finance Corp. 6.875%, due 8/15/23 (d) | | | 6,500,000 | | | | 6,922,500 | |
Nielsen Finance LLC / Nielsen Finance Co. | | | | | | | | |
4.50%, due 10/1/20 | | | 13,665,000 | | | | 13,939,803 | |
5.00%, due 4/15/22 (d) | | | 71,860,000 | | | | 73,297,200 | |
Quebecor Media, Inc.
5.75%, due 1/15/23 | | | 49,915,000 | | | | 52,161,175 | |
SFR Group S.A. | | | | | | | | |
6.00%, due 5/15/22 (d) | | | 42,875,000 | | | | 43,960,595 | |
6.25%, due 5/15/24 (d) | | | 8,000,000 | | | | 7,994,960 | |
7.375%, due 5/1/26 (d) | | | 22,000,000 | | | | 22,220,000 | |
Videotron, Ltd. | | | | | | | | |
5.00%, due 7/15/22 | | | 23,754,000 | | | | 24,793,237 | |
5.375%, due 6/15/24 (d) | | | 28,095,000 | | | | 29,394,394 | |
¨Virgin Media Secured Finance PLC | | | | | | | | |
5.25%, due 1/15/21 | | | 83,145,000 | | | | 88,549,425 | |
5.25%, due 1/15/26 (d) | | | 5,000,000 | | | | 4,948,500 | |
5.50%, due 8/15/26 (d) | | | 5,000,000 | | | | 5,043,750 | |
| | | | | | | | |
| | | | 571,485,756 | |
| | | | | | | | |
Metal Fabricate & Hardware 1.3% | | | | | |
Novelis Corp. | | | | | | | | |
5.875%, due 9/30/26 (d) | | | 25,230,000 | | | | 25,545,375 | |
6.25%, due 8/15/24 (d) | | | 20,650,000 | | | | 21,476,000 | |
Optimas OE Solutions Holding LLC / Optimas OE Solutions, Inc. 8.625%, due 6/1/21 (d) | | | 14,155,000 | | | | 10,899,350 | |
Wise Metals Group LLC / Wise Alloys Finance Corp.
8.75%, due 12/15/18 (d) | | | 73,540,000 | | | | 72,804,600 | |
| | | | | | | | |
| | | | 130,725,325 | |
| | | | | | | | |
| | | | | | | | |
| | | Principal
Amount | | | Value | |
Mining 3.0% | | | | | | | | |
Alamos Gold, Inc.
7.75%, due 4/1/20 (d) | | $ | 61,421,000 | | | $ | 63,570,735 | |
Alcoa Nederland Holding B.V. | | | | | | | | |
6.75%, due 9/30/24 (d) | | | 7,875,000 | | | | 8,150,625 | |
7.00%, due 9/30/26 (d) | | | 12,000,000 | | | | 12,357,600 | |
Aleris International, Inc. | | | | | | | | |
7.875%, due 11/1/20 | | | 14,255,000 | | | | 14,255,000 | |
9.50%, due 4/1/21 (d) | | | 31,135,000 | | | | 33,470,125 | |
Constellium N.V.
5.75%, due 5/15/24 (d) | | | 19,135,000 | | | | 16,934,475 | |
First Quantum Minerals, Ltd.
7.25%, due 10/15/19 (d) | | | 27,685,000 | | | | 27,304,331 | |
Hecla Mining Co.
6.875%, due 5/1/21 | | | 42,803,000 | | | | 43,659,060 | |
Joseph T. Ryerson & Son, Inc. 11.00%, due 5/15/22 (d) | | | 4,405,000 | | | | 4,812,463 | |
New Gold, Inc. | | | | | | | | |
6.25%, due 11/15/22 (d) | | | 3,537,000 | | | | 3,572,370 | |
7.00%, due 4/15/20 (d) | | | 42,034,000 | | | | 43,295,020 | |
Petra Diamonds U.S. Treasury PLC 8.25%, due 5/31/20 (d) | | | 19,480,000 | | | | 20,137,450 | |
St. Barbara, Ltd.
8.875%, due 4/15/18 (d) | | | 12,363,000 | | | | 12,826,612 | |
| | | | | | | | |
| | | | 304,345,866 | |
| | | | | | | | |
Miscellaneous—Manufacturing 1.0% | |
Amsted Industries, Inc.
5.00%, due 3/15/22 (d) | | | 18,225,000 | | | | 18,270,562 | |
CTP Transportation Products LLC / CTP Finance, Inc.
8.25%, due 12/15/19 (d) | | | 26,160,000 | | | | 19,881,600 | |
EnPro Industries, Inc.
5.875%, due 9/15/22 | | | 16,365,000 | | | | 17,019,600 | |
Gates Global LLC / Gates Global Co. 6.00%, due 7/15/22 (d) | | | 29,319,000 | | | | 27,706,455 | |
Koppers, Inc.
7.875%, due 12/1/19 | | | 16,144,000 | | | | 16,386,160 | |
| | | | | | | | |
| | | | 99,264,377 | |
| | | | | | | | |
Oil & Gas 8.6% | | | | | | | | |
Antero Resources Corp. | | | | | | | | |
5.125%, due 12/1/22 | | | 3,000,000 | | | | 3,022,500 | |
5.375%, due 11/1/21 | | | 10,000,000 | | | | 10,150,000 | |
California Resources Corp. | | | | | | | | |
5.00%, due 1/15/20 | | | 58,790,000 | | | | 36,449,800 | |
8.00%, due 12/15/22 (d) | | | 12,655,000 | | | | 8,542,125 | |
Callon Petroleum Co.
6.125%, due 10/1/24 (d) | | | 12,930,000 | | | | 13,317,900 | |
Calumet Specialty Products Partners, L.P. / Calumet Finance Corp. | | | | | | | | |
6.50%, due 4/15/21 | | | 32,000,000 | | | | 25,440,000 | |
7.625%, due 1/15/22 | | | 24,680,000 | | | | 19,497,200 | |
| | | | | | |
The notes to the financial statements are an integral part of,
and should be read in conjunction with, the financial statements. | | | | | 17 | |
Portfolio of Investments October 31, 2016 (continued)
| | | | | | | | |
| | | Principal
Amount | | | Value | |
| Corporate Bonds (continued) | |
Oil & Gas (continued) | | | | | | | | |
Calumet Specialty Products Partners, L.P. / Calumet Finance
Corp. (continued) | | | | | | | | |
7.75%, due 4/15/23 | | $ | 4,840,000 | | | $ | 3,775,200 | |
11.50%, due 1/15/21 (d) | | | 33,240,000 | | | | 37,478,100 | |
Carrizo Oil & Gas, Inc. | | | | | | | | |
6.25%, due 4/15/23 | | | 7,000,000 | | | | 7,192,500 | |
7.50%, due 9/15/20 | | | 14,480,000 | | | | 15,041,100 | |
Chesapeake Energy Corp. (Escrow Claim Shares)
6.775%, due 3/15/19 (b)(c)(f) | | | 15,000,000 | | | | 4,800,000 | |
¨Comstock Resources, Inc.
10.00% (10.00% Cash or 12.25% PIK), due 3/15/20 (a) | | | 63,085,000 | | | | 63,400,425 | |
Concho Resources, Inc. | | | | | | | | |
5.50%, due 10/1/22 | | | 16,000,000 | | | | 16,440,000 | |
6.50%, due 1/15/22 | | | 24,386,000 | | | | 25,239,510 | |
Continental Resources, Inc. | | | | | | | | |
5.00%, due 9/15/22 | | | 19,605,000 | | | | 19,212,900 | |
7.125%, due 4/1/21 | | | 25,875,000 | | | | 26,819,438 | |
7.375%, due 10/1/20 | | | 22,095,000 | | | | 22,662,842 | |
EnQuest PLC
7.00%, due 4/15/22 (d)(e) | | | 6,753,000 | | | | 4,300,817 | |
Gulfport Energy Corp.
6.00%, due 10/15/24 (d) | | | 22,965,000 | | | | 23,395,594 | |
Halcon Resources Corp.
8.625%, due 2/1/20 (d) | | | 40,545,000 | | | | 41,355,900 | |
Jones Energy Holdings LLC / Jones Energy Finance Corp.
6.75%, due 4/1/22 | | | 23,415,000 | | | | 21,249,113 | |
Murphy Oil Corp.
6.875%, due 8/15/24 | | | 9,575,000 | | | | 10,101,194 | |
Murphy Oil USA, Inc.
6.00%, due 8/15/23 | | | 22,105,000 | | | | 23,265,513 | |
Newfield Exploration Co. | | | | | | | | |
5.625%, due 7/1/24 | | | 19,360,000 | | | | 20,134,400 | |
5.75%, due 1/30/22 | | | 13,520,000 | | | | 14,094,600 | |
Oasis Petroleum, Inc. | | | | | | | | |
6.50%, due 11/1/21 | | | 17,768,000 | | | | 17,656,950 | |
6.875%, due 3/15/22 | | | 7,500,000 | | | | 7,425,000 | |
6.875%, due 1/15/23 | | | 5,000,000 | | | | 4,900,000 | |
PDC Energy, Inc. | | | | | | | | |
6.125%, due 9/15/24 (d) | | | 4,500,000 | | | | 4,680,000 | |
7.75%, due 10/15/22 | | | 32,655,000 | | | | 34,695,937 | |
PetroQuest Energy, Inc.
10.00% (1.00% Cash and
9.00% PIK), due 2/15/21 (a)(d) | | | 62,800,000 | | | | 42,390,000 | |
Range Resources Corp. | | | | | | | | |
5.75%, due 6/1/21 (d) | | | 21,775,000 | | | | 22,101,625 | |
5.875%, due 7/1/22 (d) | | | 9,000,000 | | | | 9,157,500 | |
| | | | | | | | |
| | | Principal
Amount | | | Value | |
Oil & Gas (continued) | | | | | | | | |
Rex Energy Corp.
1.00%, due 10/1/20 (i) | | $ | 116,325,000 | | | $ | 62,524,687 | |
RSP Permian, Inc.
6.625%, due 10/1/22 | | | 17,780,000 | | | | 18,735,675 | |
SM Energy Co. | | | | | | | | |
6.50%, due 11/15/21 | | | 7,000,000 | | | | 7,105,000 | |
6.50%, due 1/1/23 | | | 2,535,000 | | | | 2,522,325 | |
Stone Energy Corp.
7.50%, due 11/15/22 (e) | | | 87,403,000 | | | | 53,097,322 | |
WPX Energy, Inc. | | | | | | | | |
6.00%, due 1/15/22 | | | 39,250,000 | | | | 39,151,875 | |
7.50%, due 8/1/20 | | | 17,955,000 | | | | 18,920,081 | |
| | | | | | | | |
| | | | 861,442,648 | |
| | | | | | | | |
Oil & Gas Services 1.9% | | | | | | | | |
Forum Energy Technologies, Inc.
6.25%, due 10/1/21 | | | 42,185,000 | | | | 41,763,150 | |
¨Freeport-McMoran Oil & Gas LLC / FCX Oil & Gas, Inc. | | | | | | | | |
6.125%, due 6/15/19 | | | 2,200,000 | | | | 2,244,000 | |
6.50%, due 11/15/20 | | | 34,940,000 | | | | 35,682,475 | |
6.625%, due 5/1/21 | | | 15,620,000 | | | | 15,932,400 | |
6.75%, due 2/1/22 | | | 20,996,000 | | | | 21,468,410 | |
6.875%, due 2/15/23 | | | 68,026,000 | | | | 70,576,975 | |
FTS International, Inc.
8.35%, due 6/15/20 (d)(h) | | | 4,565,000 | | | | 4,416,742 | |
| | | | | | | | |
| | | | 192,084,152 | |
| | | | | | | | |
Packaging & Containers 0.1% | | | | | | | | |
AEP Industries, Inc.
8.25%, due 4/15/19 | | | 11,372,000 | | | | 11,684,730 | |
| | | | | | | | |
| | |
Pharmaceuticals 1.7% | | | | | | | | |
DPx Holdings B.V.
7.50%, due 2/1/22 (d) | | | 19,905,000 | | | | 20,950,012 | |
Endo Finance LLC
5.75%, due 1/15/22 (d) | | | 7,480,000 | | | | 6,732,000 | |
Endo Finance LLC / Endo Finco, Inc. 5.375%, due 1/15/23 (d) | | | 7,300,000 | | | | 6,205,000 | |
Endo Ltd. / Endo Finance LLC / Endo Finco, Inc. | | | | | | | | |
6.00%, due 7/15/23 (d) | | | 8,815,000 | | | | 7,669,050 | |
6.50%, due 2/1/25 (d) | | | 13,945,000 | | | | 11,748,663 | |
Grifols Worldwide Operations, Ltd. 5.25%, due 4/1/22 | | | 12,196,000 | | | | 12,714,330 | |
NBTY, Inc.
7.625%, due 5/15/21 (d) | | | 42,285,000 | | | | 41,333,587 | |
Valeant Pharmaceuticals International, Inc. | | | | | | | | |
6.375%, due 10/15/20 (d) | | | 9,394,000 | | | | 8,102,325 | |
6.75%, due 8/15/18 (d) | | | 13,960,000 | | | | 13,624,960 | |
7.00%, due 10/1/20 (d) | | | 7,000,000 | | | | 6,265,000 | |
| | | | |
| 18 | | MainStay High Yield Corporate Bond Fund | | The notes to the financial statements are an integral part of,
and should be read in conjunction with, the financial statements. |
| | | | | | | | |
| | | Principal
Amount | | | Value | |
| Corporate Bonds (continued) | |
Pharmaceuticals (continued) | | | | | | | | |
Valeant Pharmaceuticals International, Inc. (continued) | | | | | | | | |
7.25%, due 7/15/22 (d) | | $ | 1,690,000 | | | $ | 1,470,300 | |
7.50%, due 7/15/21 (d) | | | 37,600,000 | | | | 33,464,000 | |
| | | | | | | | |
| | | | 170,279,227 | |
| | | | | | | | |
Pipelines 3.3% | | | | | | | | |
ANR Pipeline Co. | | | | | | | | |
7.375%, due 2/15/24 | | | 2,555,000 | | | | 2,977,538 | |
9.625%, due 11/1/21 | | | 10,349,000 | | | | 13,771,456 | |
Antero Midstream Partners L.P. / Antero Midstream Finance Corp.
5.375%, due 9/15/24 (d) | | | 10,115,000 | | | | 10,190,863 | |
EnLink Midstream Partners, L.P. | | | | | | | | |
2.70%, due 4/1/19 | | | 2,500,000 | | | | 2,498,600 | |
4.15%, due 6/1/25 | | | 5,000,000 | | | | 4,871,920 | |
4.40%, due 4/1/24 | | | 4,370,000 | | | | 4,347,521 | |
EnLink Midstream Partners, L.P. / EnLink Midstream Finance Corp.
7.125%, due 6/1/22 | | | 1,765,000 | | | | 1,866,041 | |
Genesis Energy, L.P. / Genesis Energy Finance Corp. | | | | | | | | |
5.75%, due 2/15/21 | | | 4,750,000 | | | | 4,738,125 | |
6.75%, due 8/1/22 | | | 44,620,000 | | | | 45,847,050 | |
Holly Energy Partners, L.P. / Holly Energy Finance Corp.
6.00%, due 8/1/24 (d) | | | 12,350,000 | | | | 12,844,000 | |
¨MPLX, L.P. | |
4.875%, due 12/1/24 | | | 27,465,000 | | | | 28,724,325 | |
4.875%, due 6/1/25 | | | 33,845,000 | | | | 35,305,412 | |
5.50%, due 2/15/23 | | | 31,715,000 | | | | 33,042,875 | |
NuStar Logistics, L.P. | | | | | | | | |
6.75%, due 2/1/21 | | | 11,295,000 | | | | 12,283,312 | |
8.15%, due 4/15/18 | | | 6,454,000 | | | | 6,921,915 | |
Rockies Express Pipeline LLC | | | | | | | | |
5.625%, due 4/15/20 (d) | | | 1,000,000 | | | | 1,048,750 | |
6.00%, due 1/15/19 (d) | | | 17,400,000 | | | | 18,009,000 | |
6.85%, due 7/15/18 (d) | | | 3,000,000 | | | | 3,157,500 | |
Sabine Pass Liquefaction LLC
5.875%, due 6/30/26 (d) | | | 20,290,000 | | | | 21,866,533 | |
Summit Midstream Holdings LLC / Summit Midstream Finance Corp.
7.50%, due 7/1/21 | | | 25,025,000 | | | | 26,026,000 | |
Tesoro Logistics, L.P. / Tesoro Logistics Finance Corp.
6.25%, due 10/15/22 | | | 14,000,000 | | | | 14,840,000 | |
Williams Partners, L.P. / ACMP Finance Corp.
6.125%, due 7/15/22 | | | 22,309,000 | | | | 23,163,033 | |
| | | | | | | | |
| | | | 328,341,769 | |
| | | | | | | | |
| | | | | | | | |
| | | Principal
Amount | | | Value | |
Real Estate 1.6% | | | | | | | | |
AAF Holdings LLC / AAF Finance Co.
12.00% (12.00% Cash or
12.75% PIK), due 7/1/19 (a)(d) | | $ | 33,834,627 | | | $ | 34,680,493 | |
CBRE Services, Inc. | | | | | | | | |
5.00%, due 3/15/23 | | | 40,697,000 | | | | 42,732,176 | |
5.25%, due 3/15/25 | | | 11,490,000 | | | | 12,283,879 | |
Howard Hughes Corp. (The)
6.875%, due 10/1/21 (d) | | | 26,095,000 | | | | 27,569,367 | |
Realogy Group LLC / Realogy Co-Issuer Corp.
4.875%, due 6/1/23 (d) | | | 15,665,000 | | | | 15,665,000 | |
Rialto Holdings LLC / Rialto Corp. 7.00%, due 12/1/18 (d) | | | 32,515,000 | | | | 32,921,437 | |
| | | | | | | | |
| | | | 165,852,352 | |
| | | | | | | | |
Real Estate Investment Trusts 3.3% | | | | | |
¨Crown Castle International Corp. | |
4.875%, due 4/15/22 | | | 4,000,000 | | | | 4,413,200 | |
5.25%, due 1/15/23 | | | 91,468,000 | | | | 102,207,258 | |
Equinix, Inc. | | | | | | | | |
5.375%, due 1/1/22 | | | 20,371,000 | | | | 21,593,260 | |
5.375%, due 4/1/23 | | | 17,500,000 | | | | 18,265,625 | |
5.75%, due 1/1/25 | | | 28,122,000 | | | | 29,739,015 | |
5.875%, due 1/15/26 | | | 22,985,000 | | | | 24,569,126 | |
FelCor Lodging, L.P.
5.625%, due 3/1/23 | | | 13,497,000 | | | | 13,928,769 | |
Host Hotels & Resorts, L.P. | | | | | | | | |
5.25%, due 3/15/22 | | | 2,000,000 | | | | 2,208,534 | |
6.00%, due 10/1/21 | | | 13,000,000 | | | | 14,857,934 | |
MGM Growth Properties Operating Partnership, LP / MGP Finance Co-Issuer, Inc. | | | | | | | | |
4.50%, due 9/1/26 (d) | | | 14,205,000 | | | | 13,956,412 | |
5.625%, due 5/1/24 (d) | | | 55,695,000 | | | | 59,281,758 | |
MPT Operating Partnership, L.P. / MPT Finance Corp.
5.25%, due 8/1/26 | | | 4,500,000 | | | | 4,590,000 | |
Sabra Health Care, L.P. / Sabra Capital Corp. | | | | | | | | |
5.375%, due 6/1/23 | | | 3,005,000 | | | | 3,065,100 | |
5.50%, due 2/1/21 | | | 5,030,000 | | | | 5,243,775 | |
VEREIT Operating Partnership, L.P. | | | | | | | | |
4.125%, due 6/1/21 | | | 4,000,000 | | | | 4,160,000 | |
4.875%, due 6/1/26 | | | 7,395,000 | | | | 7,772,663 | |
| | | | | | | | |
| | | | 329,852,429 | |
| | | | | | | | |
Retail 4.7% | | | | | | | | |
AmeriGas Finance LLC / AmeriGas Finance Corp.
7.00%, due 5/20/22 | | | 43,452,000 | | | | 45,733,230 | |
Asbury Automotive Group, Inc.
6.00%, due 12/15/24 | | | 37,278,000 | | | | 38,396,340 | |
| | | | | | |
The notes to the financial statements are an integral part of,
and should be read in conjunction with, the financial statements. | | | | | 19 | |
Portfolio of Investments October 31, 2016 (continued)
| | | | | | | | |
| | | Principal
Amount | | | Value | |
| Corporate Bonds (continued) | |
Retail (continued) | | | | | | | | |
AutoNation, Inc.
6.75%, due 4/15/18 | | $ | 8,000,000 | | | $ | 8,539,736 | |
Brinker International, Inc.
5.00%, due 10/1/24 (d) | | | 13,465,000 | | | | 13,700,637 | |
CVS Health Corp. | | | | | | | | |
4.75%, due 12/1/22 | | | 2,380,000 | | | | 2,668,251 | |
5.00%, due 12/1/24 | | | 3,900,000 | | | | 4,449,845 | |
Dollar Tree, Inc.
5.75%, due 3/1/23 | | | 29,650,000 | | | | 31,577,250 | |
DriveTime Automotive Group, Inc. / Bridgecrest Acceptance Corp.
8.00%, due 6/1/21 (d) | | | 45,241,000 | | | | 43,205,155 | |
GameStop Corp. | | | | | | | | |
5.50%, due 10/1/19 (d) | | | 10,925,000 | | | | 11,225,438 | |
6.75%, due 3/15/21 (d) | | | 18,000,000 | | | | 18,540,000 | |
Group 1 Automotive, Inc. | | | | | | | | |
5.00%, due 6/1/22 | | | 8,165,000 | | | | 8,144,588 | |
5.25%, due 12/15/23 (d) | | | 8,000,000 | | | | 7,960,000 | |
Guitar Center, Inc.
6.50%, due 4/15/19 (d) | | | 11,505,000 | | | | 10,325,738 | |
KFC Holding Co. / Pizza Hut Holdings LLC / Taco Bell of America LLC | | | | | | | | |
5.00%, due 6/1/24 (d) | | | 14,710,000 | | | | 15,298,400 | |
5.25%, due 6/1/26 (d) | | | 13,000,000 | | | | 13,552,500 | |
L Brands, Inc. | | | | | | | | |
5.625%, due 2/15/22 | | | 7,725,000 | | | | 8,458,875 | |
6.625%, due 4/1/21 | | | 13,980,000 | | | | 16,077,000 | |
6.75%, due 7/1/36 | | | 24,015,000 | | | | 25,491,922 | |
6.875%, due 11/1/35 | | | 7,000,000 | | | | 7,420,000 | |
8.50%, due 6/15/19 | | | 3,395,000 | | | | 3,946,688 | |
Men’s Wearhouse, Inc. (The)
7.00%, due 7/1/22 | | | 78,926,000 | | | | 72,809,235 | |
Penske Automotive Group, Inc.
5.75%, due 10/1/22 | | | 27,481,000 | | | | 28,477,186 | �� |
Sonic Automotive, Inc.
7.00%, due 7/15/22 | | | 13,685,000 | | | | 14,369,250 | |
Yum! Brands, Inc. | | | | | | | | |
3.875%, due 11/1/20 | | | 3,000,000 | | | | 3,090,000 | |
3.875%, due 11/1/23 | | | 10,000,000 | | | | 9,925,000 | |
5.30%, due 9/15/19 | | | 6,500,000 | | | | 7,003,750 | |
| | | | | | | | |
| | | | 470,386,014 | |
| | | | | | | | |
Semiconductors 1.5% | | | | | | | | |
¨Micron Technology, Inc. | |
5.25%, due 8/1/23 (d) | | | 16,800,000 | | | | 16,464,000 | |
5.25%, due 1/15/24 (d) | | | 8,000,000 | | | | 7,800,000 | |
5.50%, due 2/1/25 | | | 27,470,000 | | | | 26,929,116 | |
5.625%, due 1/15/26 (d) | | | 5,000,000 | | | | 4,850,000 | |
5.875%, due 2/15/22 | | | 4,000,000 | | | | 4,131,600 | |
7.50%, due 9/15/23 (d) | | | 66,555,000 | | | | 73,460,081 | |
| | | | | | | | |
| | | Principal
Amount | | | Value | |
Semiconductors (continued) | | | | | | | | |
Qorvo, Inc. | | | | | | | | |
6.75%, due 12/1/23 | | $ | 5,430,000 | | | $ | 5,945,850 | |
7.00%, due 12/1/25 | | | 6,000,000 | | | | 6,570,000 | |
| | | | | | | | |
| | | | 146,150,647 | |
| | | | | | | | |
Software 2.4% | | | | | | | | |
ACI Worldwide, Inc.
6.375%, due 8/15/20 (d) | | | 43,570,000 | | | | 44,877,100 | |
Activision Blizzard, Inc.
6.125%, due 9/15/23 (d) | | | 1,249,000 | | | | 1,375,461 | |
Camelot Finance S.A.
7.875%, due 10/15/24 (d) | | | 10,750,000 | | | | 10,991,875 | |
Change Healthcare Holdings, Inc. | | | | | | | | |
6.00%, due 2/15/21 (d) | | | 13,755,000 | | | | 14,442,750 | |
11.00%, due 12/31/19 | | | 2,000,000 | | | | 2,100,000 | |
Donnelley Financial Solutions, Inc.
8.25%, due 10/15/24 (d) | | | 18,725,000 | | | | 19,333,562 | |
First Data Corp.
7.00%, due 12/1/23 (d) | | | 5,000,000 | | | | 5,237,500 | |
JDA Escrow LLC / JDA Bond
Finance, Inc.
7.375%, due 10/15/24 (d) | | | 5,000,000 | | | | 5,162,500 | |
MSCI, Inc. | | | | | | | | |
4.75%, due 8/1/26 (d) | | | 11,465,000 | | | | 11,550,988 | |
5.25%, due 11/15/24 (d) | | | 24,757,000 | | | | 25,994,850 | |
5.75%, due 8/15/25 (d) | | | 10,000,000 | | | | 10,631,500 | |
PTC, Inc.
6.00%, due 5/15/24 | | | 40,080,000 | | | | 42,384,600 | |
Quintiles IMS, Inc. | | | | | | | | |
4.875%, due 5/15/23 (d) | | | 17,078,000 | | | | 17,611,688 | |
5.00%, due 10/15/26 (d) | | | 26,235,000 | | | | 27,120,431 | |
| | | | | | | | |
| | | | | | | 238,814,805 | |
| | | | | | | | |
Storage & Warehousing 0.2% | | | | | | | | |
Algeco Scotsman Global Finance PLC
8.50%, due 10/15/18 (d) | | | 23,590,000 | | | | 21,407,925 | |
| | | | | | | | |
| | |
Telecommunications 6.0% | | | | | | | | |
CenturyLink, Inc.
5.625%, due 4/1/25 | | | 16,000,000 | | | | 15,000,000 | |
Cogent Communications Finance, Inc.
5.625%, due 4/15/21 (d) | | | 34,970,000 | | | | 35,144,850 | |
DigitalGlobe, Inc.
5.25%, due 2/1/21 (d) | | | 21,276,000 | | | | 21,435,570 | |
Frontier Communications Corp. | | | | | | | | |
6.25%, due 9/15/21 | | | 17,410,000 | | | | 16,539,500 | |
8.875%, due 9/15/20 | | | 2,665,000 | | | | 2,831,563 | |
10.50%, due 9/15/22 | | | 19,880,000 | | | | 20,675,200 | |
Hughes Satellite Systems Corp. | | | | | | | | |
5.25%, due 8/1/26 (d) | | | 16,180,000 | | | | 15,937,300 | |
6.50%, due 6/15/19 | | | 2,627,000 | | | | 2,866,714 | |
6.625%, due 8/1/26 (d) | | | 26,195,000 | | | | 25,933,050 | |
7.625%, due 6/15/21 | | | 36,220,000 | | | | 39,706,175 | |
| | | | |
| 20 | | MainStay High Yield Corporate Bond Fund | | The notes to the financial statements are an integral part of,
and should be read in conjunction with, the financial statements. |
| | | | | | | | |
| | | Principal
Amount | | | Value | |
| Corporate Bonds (continued) | |
Telecommunications (continued) | |
Intelsat Jackson Holdings S.A.
7.25%, due 4/1/19 | | $ | 45,752,000 | | | $ | 36,887,550 | |
NeuStar, Inc.
4.50%, due 1/15/23 | | | 35,670,000 | | | | 33,128,512 | |
Sprint Capital Corp.
6.875%, due 11/15/28 | | | 19,030,000 | | | | 17,507,600 | |
Sprint Communications, Inc. | | | | | | | | |
7.00%, due 3/1/20 (d) | | | 26,870,000 | | | | 29,221,125 | |
9.00%, due 11/15/18 (d) | | | 12,736,000 | | | | 14,009,600 | |
9.25%, due 4/15/22 | | | 16,806,000 | | | | 18,654,660 | |
Sprint Corp. | | | | | | | | |
7.125%, due 6/15/24 | | | 14,335,000 | | | | 13,474,900 | |
7.875%, due 9/15/23 | | | 15,185,000 | | | | 15,033,150 | |
¨T-Mobile USA, Inc. | | | | | | | | |
6.00%, due 4/15/24 | | | 15,315,000 | | | | 16,291,331 | |
6.125%, due 1/15/22 | | | 13,775,000 | | | | 14,532,625 | |
6.25%, due 4/1/21 | | | 20,085,000 | | | | 20,913,506 | |
6.375%, due 3/1/25 | | | 41,842,000 | | | | 44,849,603 | |
6.50%, due 1/15/24 | | | 14,445,000 | | | | 15,456,150 | |
6.50%, due 1/15/26 | | | 28,215,000 | | | | 30,929,283 | |
6.625%, due 11/15/20 | | | 975,000 | | | | 1,001,813 | |
6.625%, due 4/1/23 | | | 30,090,000 | | | | 31,976,041 | |
6.731%, due 4/28/22 | | | 38,575,000 | | | | 40,310,875 | |
6.836%, due 4/28/23 | | | 8,915,000 | | | | 9,521,220 | |
| | | | | | | | |
| | | | | | | 599,769,466 | |
| | | | | | | | |
Transportation 0.9% | | | | | | | | |
Florida East Coast Holdings Corp. | | | | | | | | |
6.75%, due 5/1/19 (d) | | | 50,325,000 | | | | 50,576,625 | |
9.75%, due 5/1/20 (d) | | | 43,920,000 | | | | 43,480,800 | |
| | | | | | | | |
| | | | | | | 94,057,425 | |
| | | | | | | | |
Trucking & Leasing 0.1% | |
TRAC Intermodal LLC / TRAC Intermodal Corp.
11.00%, due 8/15/19 | | | 6,060,000 | | | | 6,408,450 | |
| | | | | | | | |
Total Corporate Bonds
(Cost $8,764,911,889) | | | | 9,039,308,638 | |
| | | | | | | | |
|
| Loan Assignments 0.5% (j) | |
Lodging 0.1% | |
Cannery Casino Resorts LLC
New 2nd Lien Term Loan
12.50%, due 10/2/19 | | | 9,226,964 | | | | 9,246,184 | |
| | | | | | | | |
|
Metal Fabricate & Hardware 0.2% | |
Neenah Foundry Co.
Term Loan
6.75%, due 4/26/17 (c)(f) | | | 14,157,816 | | | | 14,016,238 | |
| | | | | | | | |
| | | | | | | | |
| | | Principal
Amount | | | Value | |
Pharmaceuticals 0.1% | |
Phibro Animal Health Corp.
Term Loan B
4.00%, due 4/16/21 | | $ | 13,196,250 | | | $ | 13,097,278 | |
| | | | | | | | |
|
Software 0.0%‡ | |
Donnelley Financial Solutions, Inc. Term Loan B
5.00%, due 9/30/23 | | | 3,000,000 | | | | 3,007,500 | |
| | | | | | | | |
|
Transportation 0.1% | |
Commercial Barge Line Co.
2015 1st Lien Term Loan
9.75%, due 11/12/20 | | | 12,125,791 | | | | 11,716,546 | |
| | | | | | | | |
Total Loan Assignments
(Cost $50,735,993) | | | | 51,083,746 | |
| | | | | | | | |
Total Long-Term Bonds
(Cost $9,094,856,027) | | | | 9,362,993,990 | |
| | | | | | | | |
| | |
| | | | | | | | |
| | |
Shares | | | | |
| Common Stocks 0.4% | |
Auto Parts & Equipment 0.1% | | | | | | | | |
¨Exide Technologies (Auto Parts & Equipment) (b)(c)(d)(f)(k) | | | 1,416,537 | | | | 4,164,619 | |
| | | | | | | | |
|
Banks 0.0%‡ | |
Rex Energy Corp. (c)(k) | | | 1,515,956 | | | | 697,340 | |
| | | | | | | | |
|
Coal 0.0%‡ | |
Arch Coal, Inc. (k) | | | 10,209 | | | | 749,136 | |
| | | | | | | | |
|
Commercial Services 0.0%‡ | |
Avis Budget Group, Inc. (k) | | | 61,100 | | | | 1,977,196 | |
| | | | | | | | |
|
Electric 0.0%‡ | |
Upstate New York Power Producers, Inc. (b)(c)(f)(k) | | | 343,590 | | | | 412,308 | |
| | | | | | | | |
|
Entertainment 0.0%‡ | |
Affinity Gaming LLC (c)(f)(k) | | | 275,000 | | | | 4,056,250 | |
| | | | | | | | |
|
Lodging 0.1% | |
Majestic Star Casino LLC Membership Units (b)(c)(f)(k) | | | 446,020 | | | | 55,753 | |
Marriott International, Inc. Class A | | | 88,136 | | | | 6,054,943 | |
| | | | | | | | |
| | | | 6,110,696 | |
| | | | | | | | |
| | | | | | |
The notes to the financial statements are an integral part of,
and should be read in conjunction with, the financial statements. | | | | | 21 | |
Portfolio of Investments October 31, 2016 (continued)
| | | | | | | | |
| | |
Shares | | | Value | |
| Common Stocks (continued) | |
Media 0.0%‡ | |
ION Media Networks,
Inc. (b)(c)(f)(k) | | | 2,267 | | | $ | 1,213,706 | |
| | | | | | | | |
|
Metal Fabricate & Hardware 0.1% | |
Neenah Enterprises,
Inc. (b)(c)(f)(k) | | | 717,799 | | | | 7,902,967 | |
| | | | | | | | |
|
Oil & Gas 0.1% | |
¨Comstock Resources, Inc. (k) | | | 173,484 | | | | 1,693,204 | |
PetroQuest Energy, Inc. (k) | | | 907,184 | | | | 3,365,653 | |
Titan Energy LLC (b)(k) | | | 91,131 | | | | 2,712,058 | |
| | | | | | | | |
| | | | 7,770,915 | |
| | | | | | | | |
Total Common Stocks
(Cost $133,193,083) | | | | | | | 35,055,133 | |
| | | | | | | | |
| |
| Exchange-Traded Fund 0.2% (l) | | | | | |
SPDR Gold Shares (k) | | | 189,000 | | | | 23,046,660 | |
| | | | | | | | |
Total Exchange-Traded Fund
(Cost $21,676,206) | | | | 23,046,660 | |
| | | | | | | | |
| | |
| | | | | | | | |
| | | Principal
Amount | | | | |
| Short Term Investment 5.2% | |
Money Market Fund 5.2% | | | | | | | | |
State Street Institutional U.S. Government Money Market Fund, Premier Class
0.25%, due 12/31/30 | | $ | 523,784,863 | | | | 523,784,863 | |
| | | | | | | | |
Total Short-Term Investment
(Cost $523,784,863) | | | | | | | 523,784,863 | |
| | | | | | | | |
Total Investments
(Cost $9,773,510,179) (m) | | | 99.2 | % | | | 9,944,880,646 | |
Other Assets, Less Liabilities | | | 0.8 | | | | 83,431,897 | |
Net Assets | | | 100.0 | % | | $ | 10,028,312,543 | |
| ‡ | Less than one-tenth of a percent. |
| (a) | PIK (“Payment-in-Kind”)—issuer may pay interest or dividends with additional securities and/or in cash. |
| (b) | Fair valued security—Represents fair value as measured in good faith under procedures approved by the Board of Trustees. As of October 31, 2016, the total market value of these securities was $170,377,925, which represented 1.7% of the Fund’s net assets. |
| (c) | Illiquid security—As of October 31, 2016, the total market value of these securities deemed illiquid under procedures approved by the Board of Trustees was $186,435,695, which represented 1.9% of the Fund’s net assets (Unaudted). |
| (d) | May be sold to institutional investors only under Rule 144A or securities offered pursuant to Section 4(a)(2) of the Securities Act of 1933, as amended. |
| (e) | Issue in non-accrual status. |
| (h) | Floating rate—Rate shown was the rate in effect as of October 31, 2016. |
| (i) | Step coupon—Rate shown was the rate in effect as of October 31, 2016. |
| (j) | Floating Rate Loan—generally pays interest at rates which are periodically re-determined at a margin above the London InterBank Offered Rate or other short-term rates. The rate shown was the weighted average interest rate of all contracts within the floating rate loan facility as of October 31, 2016. |
| (k) | Non-income producing security. |
| (l) | Exchange-Traded Fund—An investment vehicle that represents a basket of securities that is traded on an exchange. |
| (m) | As of October 31, 2016, cost was $9,776,976,174 for federal income tax purposes and net unrealized appreciation was as follows: |
| | | | |
Gross unrealized appreciation | | $ | 433,360,086 | |
Gross unrealized depreciation | | | (265,455,614 | ) |
| | | | |
Net unrealized appreciation | | $ | 167,904,472 | |
| | | | |
The following abbreviation is used in the preceding pages:
SPDR—Standard & Poor’s Depositary Receipt
| | | | |
| 22 | | MainStay High Yield Corporate Bond Fund | | The notes to the financial statements are an integral part of,
and should be read in conjunction with, the financial statements. |
The following is a summary of the fair valuations according to the inputs used as of October 31, 2016, for valuing the Fund’s assets.
Asset Valuation Inputs
| | | | | | | | | | | | | | | | |
Description | | Quoted Prices in Active Markets for
Identical Assets (Level 1) | | | Significant Other Observable Inputs (Level 2) | | | Significant
Unobservable
Inputs (Level 3) | | | Total | |
| Investments in Securities (a) | | | | | | | | | | | | | | | | |
| Long-Term Bonds | | | | | | | | | | | | | | | | |
Convertible Bonds (b) | | $ | — | | | $ | 218,906,152 | | | $ | 53,695,454 | | | $ | 272,601,606 | |
Corporate Bonds (c) | | | — | | | | 8,939,087,578 | | | | 100,221,060 | | | | 9,039,308,638 | |
Loan Assignments (d) | | | — | | | | 48,076,246 | | | | 3,007,500 | | | | 51,083,746 | |
| | | | | | | | | | | | | | | | |
| Total Long-Term Bonds | | | — | | | | 9,206,069,976 | | | | 156,924,014 | | | | 9,362,993,990 | |
| | | | | | | | | | | | | | | | |
| Common Stocks (e)(f) | | | 14,537,472 | | | | 4,056,250 | | | | 16,461,411 | | | | 35,055,133 | |
| Exchange-Traded Fund | | | 23,046,660 | | | | — | | | | — | | | | 23,046,660 | |
| Short-Term Investment | | | | | | | | | | | | | | | | |
Money Market Fund | | | 523,784,863 | | | | — | | | | — | | | | 523,784,863 | |
| | | | | | | | | | | | | | | | |
| Total Investments in Securities | | $ | 561,368,995 | | | $ | 9,210,126,226 | | | $ | 173,385,425 | | | $ | 9,944,880,646 | |
| | | | | | | | | | | | | | | | |
| (a) | For a complete listing of investments and their industries, see the Portfolio of Investments. |
| (b) | The Level 3 security valued at $53,695,454 is held in Auto Parts & Equipment within the Convertible Bonds section of the Portfolio of Investments. |
| (c) | The Level 3 securities valued at $59,108,560, $36,312,500, and $4,800,000 are held in Auto Parts & Equipment, Entertainment, and Oil & Gas, respectively, within the Corporate Bonds section of the Portfolio of Investments. |
| (d) | The Level 3 security valued at $3,007,500 is held in Software, within the Loan Assignments section of the Portfolio of Investments. |
| (e) | The Level 2 security valued at $4,056,250 is held in Entertainment within the common stocks section of the Portfolio of Investments. |
| (f) | The Level 3 securities valued at $4,164,619, $412,308, $55,753, $1,213,706, $7,902,967, and $2,712,058 are held in Auto Parts & Equipment, Electric, Lodging, Media, Metal Fabricate & Hardware, and Oil & Gas, respectively, within the Common Stocks section of the Portfolio of Investments. |
The Fund recognizes transfers between the levels as of the beginning of the period.
For the year ended October 31, 2016, the Fund did not have any transfers between Level 1 and Level 2 fair value measurements. (See Note 2)
As of October 31, 2016, a security with a market value of $14,619,375 transferred from Level 3 to Level 2. The transfer occurred as a result of utilizing significant observable inputs. As of October 31, 2015, the fair value obtained for this Loan Assignment from an independent pricing service, utilized significant unobservable inputs.
| | | | | | |
The notes to the financial statements are an integral part of,
and should be read in conjunction with, the financial statements. | | | | | 23 | |
Portfolio of Investments October 31, 2016 (continued)
The following is a reconciliation of investments in which significant unobservable inputs (Level 3) were used in determining value:
| | | | | | | | | | | | | | | | | | | | | | | | | | | | | | | | | | | | | | | | |
Investments in
Securities | | Balance
as of
October 31,
2015 | | | Accrued
Discounts
(Premiums) | | | Realized
Gain
(Loss) | | | Change in
Unrealized
Appreciation
(Depreciation) | | | Purchases | | | Sales (a) | | | Transfers
in to
Level 3 | | | Transfers
out of
Level 3 | | | Balance
as of
October 31,
2016 | | | Change in
Unrealized
Appreciation
(Depreciation)
from
Investments
Still Held as
of October 31,
2016 (b) | |
| Long-Term Bonds | | | | | | | | | | | | | | | | | | | | | | | | | | | | | | | | | | | | | | | | |
Convertible Bonds | | | | | | | | | | | | | | | | | | | | | | | | | | | | | | | | | | | | | | | | |
Auto Parts & Equipment | | $ | 53,295,813 | | | $ | 699,584 | | | $ | — | | | $ | (5,661,623 | ) | | $ | 5,361,680 | (c) | | $ | — | | | $ | — | | | $ | — | | | $ | 53,695,454 | | | $ | (5,661,623 | ) |
Electric | | | 4,369,159 | | | | — | | | | 98,581 | | | | (62,610 | ) | | | 400,840 | (c) | | | (4,805,970 | ) | | | — | | | | — | | | | — | | | | — | |
Corporate Bonds | | | | | | | | | | | | | | | | | | | | | | | | | | | | | | | | | | | | | | | | |
Auto Parts & Equipment | | | 54,289,499 | | | | 806,780 | | | | — | | | | (929,417 | ) | | | 4,941,698 | (c) | | | — | | | | — | | | | — | | | | 59,108,560 | | | | (929,417 | ) |
Entertainment | | | 36,312,500 | | | | — | | | | — | | | | — | | | | — | | | | — | | | | — | | | | — | | | | 36,312,500 | | | | — | |
Oil & Gas | | | 3,900,000 | | | | — | | | | — | | | | 900,000 | | | | — | | | | — | | | | — | | | | — | | | | 4,800,000 | | | | 900,000 | |
Loan Assignments | | | | | | | | | | | | | | | | | | | | | | | | | | | | | | | | | | | | | | | | |
Lodging | | | 14,619,375 | | | | — | | | | — | | | | — | | | | — | | | | — | | | | — | | | | (14,619,375 | ) | | | — | | | | — | |
Retail | | | 6,007,500 | | | | — | | | | (765,000 | ) | | | (7,500 | ) | | | — | | | | (5,235,000 | ) | | | — | | | | — | | | | — | | | | — | |
Software | | | — | | | | 118 | | | | — | | | | 22,382 | | | | 2,985,000 | | | | — | | | | — | | | | — | | | | 3,007,500 | | | | 22,382 | |
Common Stocks | | | | | | | | | | | | | | | | | | | | | | | | | | | | | | | | | | | | | | | | |
Auto Parts & Equipment | | | 5,666,148 | | | | — | | | | — | | | | (1,501,529 | ) | | | — | | | | — | | | | — | | | | — | | | | 4,164,619 | | | | (1,501,529 | ) |
Electric | | | 2,316,285 | | | | — | | | | — | | | | (1,028,935 | ) | | | 3,493,854 | | | | (4,368,896 | ) | | | — | | | | — | | | | 412,308 | | | | (1,028,935 | ) |
Lodging | | | 156,107 | | | | — | | | | — | | | | (100,354 | ) | | | — | | | | — | | | | — | | | | — | | | | 55,753 | | | | (100,354 | ) |
Media | | | 985,125 | | | | — | | | | — | | | | 228,581 | | | | — | | | | — | | | | — | | | | — | | | | 1,213,706 | | | | 228,581 | |
Metal, Fabricate & Hardware | | | 8,728,436 | | | | — | | | | — | | | | (825,469 | ) | | | — | | | | — | | | | — | | | | — | | | | 7,902,967 | | | | (825,469 | ) |
Oil & Gas | | | — | | | | — | | | | — | | | | — | | | | 2,712,058 | (d) | | | — | | | | — | | | | — | | | | 2,712,058 | | | | — | |
| | | | | | | | | | | | | | | | | | | | | | | | | | | | | | | | | | | | | | | | |
| Total | | $ | 190,645,947 | | | $ | 1,506,482 | | | $ | (666,419 | ) | | $ | (8,966,474 | ) | | $ | 19,895,130 | | | $ | (14,409,866 | ) | | $ | — | | | $ | (14,619,375 | ) | | $ | 173,385,425 | | | $ | (8,896,364 | ) |
| | | | | | | | | | | | | | | | | | | | | | | | | | | | | | | | | | | | | | | | |
| (a) | Sales include principal reductions. |
| (b) | Included in “Net change in unrealized appreciation (depreciation) on investments” in the Statement of Operations. |
| (c) | Purchases include PIK securities. |
| (d) | Security received through a restructure. |
| | | | |
| 24 | | MainStay High Yield Corporate Bond Fund | | The notes to the financial statements are an integral part of,
and should be read in conjunction with, the financial statements. |
Statement of Assets and Liabilities as of October 31, 2016
| | | | |
| Assets | |
Investment in securities, at value
(identified cost $9,773,510,179) | | $ | 9,944,880,646 | |
Due from custodian | | | 3,162,250 | |
Receivables: | | | | |
Dividends and interest | | | 160,224,108 | |
Fund shares sold | | | 22,651,252 | |
Investment securities sold | | | 3,931,276 | |
Other assets | | | 156,598 | |
| | | | |
Total assets | | | 10,135,006,130 | |
| | | | |
| |
| Liabilities | | | | |
Payables: | | | | |
Investment securities purchased | | | 53,963,024 | |
Fund shares redeemed | | | 38,951,225 | |
Manager (See Note 3) | | | 4,620,727 | |
Transfer agent (See Note 3) | | | 2,022,339 | |
NYLIFE Distributors (See Note 3) | | | 1,515,281 | |
Shareholder communication | | | 476,568 | |
Professional fees | | | 108,787 | |
Custodian | | | 40,846 | |
Trustees | | | 26,640 | |
Accrued expenses | | | 55,184 | |
Dividend payable | | | 4,912,966 | |
| | | | |
Total liabilities | | | 106,693,587 | |
| | | | |
Net assets | | $ | 10,028,312,543 | |
| | | | |
| |
| Composition of Net Assets | | | | |
Shares of beneficial interest outstanding (par value of $.01 per share) unlimited number of shares authorized | | $ | 17,460,779 | |
Additional paid-in capital | | | 10,119,783,394 | |
| | | | |
| | | 10,137,244,173 | |
Distributions in excess of net investment income | | | (9,109,811 | ) |
Accumulated net realized gain (loss) on investments and foreign currency transactions | | | (271,192,286 | ) |
Net unrealized appreciation (depreciation) on investments | | | 171,370,467 | |
| | | | |
Net assets | | $ | 10,028,312,543 | |
| | | | |
| | | | |
Class A | | | | |
Net assets applicable to outstanding shares | | $ | 3,551,863,791 | |
| | | | |
Shares of beneficial interest outstanding | | | 618,603,951 | |
| | | | |
Net asset value per share outstanding | | $ | 5.74 | |
Maximum sales charge (4.50% of offering price) | | | 0.27 | |
| | | | |
Maximum offering price per share outstanding | | $ | 6.01 | |
| | | | |
Investor Class | | | | |
Net assets applicable to outstanding shares | | $ | 287,492,885 | |
| | | | |
Shares of beneficial interest outstanding | | | 49,660,240 | |
| | | | |
Net asset value per share outstanding | | $ | 5.79 | |
Maximum sales charge (4.50% of offering price) | | | 0.27 | |
| | | | |
Maximum offering price per share outstanding | | $ | 6.06 | |
| | | | |
Class B | | | | |
Net assets applicable to outstanding shares | | $ | 132,508,672 | |
| | | | |
Shares of beneficial interest outstanding | | | 23,191,001 | |
| | | | |
Net asset value and offering price per share outstanding | | $ | 5.71 | |
| | | | |
Class C | | | | |
Net assets applicable to outstanding shares | | $ | 678,364,420 | |
| | | | |
Shares of beneficial interest outstanding | | | 118,674,931 | |
| | | | |
Net asset value and offering price per share outstanding | | $ | 5.72 | |
| | | | |
Class I | | | | |
Net assets applicable to outstanding shares | | $ | 5,313,265,933 | |
| | | | |
Shares of beneficial interest outstanding | | | 924,657,246 | |
| | | | |
Net asset value and offering price per share outstanding | | $ | 5.75 | |
| | | | |
Class R1 | | | | |
Net assets applicable to outstanding shares | | $ | 58,617 | |
| | | | |
Shares of beneficial interest outstanding | | | 10,213 | |
| | | | |
Net asset value and offering price per share outstanding | | $ | 5.74 | |
| | | | |
Class R2 | | | | |
Net assets applicable to outstanding shares | | $ | 10,917,128 | |
| | | | |
Shares of beneficial interest outstanding | | | 1,900,711 | |
| | | | |
Net asset value and offering price per share outstanding | | $ | 5.74 | |
| | | | |
Class R3 | | | | |
Net assets applicable to outstanding shares | | $ | 129,503 | |
| | | | |
Shares of beneficial interest outstanding | | | 22,561 | |
| | | | |
Net asset value and offering price per share outstanding | | $ | 5.74 | |
| | | | |
Class R6 | | | | |
Net assets applicable to outstanding shares | | $ | 53,711,594 | |
| | | | |
Shares of beneficial interest outstanding | | | 9,357,081 | |
| | | | |
Net asset value and offering price per share outstanding | | $ | 5.74 | |
| | | | |
| | | | | | |
The notes to the financial statements are an integral part of,
and should be read in conjunction with, the financial statements. | | | | | 25 | |
Statement of Operations for the year ended October 31, 2016
| | | | |
| Investment Income (Loss) | |
Income | | | | |
Interest | | $ | 631,732,812 | |
Dividends | | | 676,183 | |
| | | | |
Total income | | | 632,408,995 | |
| | | | |
Expenses | | | | |
Manager (See Note 3) | | | 49,795,088 | |
Distribution/Service—Class A (See Note 3) | | | 8,285,033 | |
Distribution/Service—Investor Class (See Note 3) | | | 696,637 | |
Distribution/Service—Class B (See Note 3) | | | 1,302,104 | |
Distribution/Service—Class C (See Note 3) | | | 6,404,633 | |
Distribution/Service—Class R2 (See Note 3) | | | 23,429 | |
Distribution/Service—Class R3 (See Note 3) | | | 258 | |
Transfer agent (See Note 3) | | | 11,803,169 | |
Shareholder communication | | | 1,987,559 | |
Professional fees | | | 554,292 | |
Registration | | | 269,950 | |
Trustees | | | 238,740 | |
Custodian | | | 95,367 | |
Shareholder service (See Note 3) | | | 9,470 | |
Miscellaneous | | | 285,960 | |
| | | | |
Total expenses | | | 81,751,689 | |
Reimbursement from custodian (a) | | | (105,983 | ) |
| | | | |
Net expenses | | | 81,645,706 | |
| | | | |
Net investment income (loss) | | | 550,763,289 | |
| | | | |
|
| Realized and Unrealized Gain (Loss) on Investments and Foreign Currency Transactions | |
Net realized gain (loss) on: | | | | |
Investment transactions | | | (176,343,037 | ) |
Foreign currency transactions | | | 1,797 | |
| | | | |
Net realized gain (loss) on investments and foreign currency transactions | | | (176,341,240 | ) |
| | | | |
Net change in unrealized appreciation (depreciation) on investments | | | 497,852,071 | |
| | | | |
Net realized and unrealized gain (loss) on investments and foreign currency transactions | | | 321,510,831 | |
| | | | |
Net increase (decrease) in net assets resulting from operations | | $ | 872,274,120 | |
| | | | |
| (a) | Reimbursement from custodian represents a refund for overbilling of prior years’ custody out-of-pocket fees. |
| | | | |
| 26 | | MainStay High Yield Corporate Bond Fund | | The notes to the financial statements are an integral part of,
and should be read in conjunction with, the financial statements. |
Statements of Changes in Net Assets
for the years ended October 31, 2016 and October 31, 2015
| | | | | | | | |
| | | 2016 | | | 2015 | |
| Increase (Decrease) in Net Assets | |
Operations: | | | | | | | | |
Net investment income (loss) | | $ | 550,763,289 | | | $ | 486,183,601 | |
Net realized gain (loss) on investment transactions and foreign currency transactions | | | (176,341,240 | ) | | | (89,213,544 | ) |
Net change in unrealized appreciation (depreciation) on investments | | | 497,852,071 | | | | (414,564,174 | ) |
| | | | |
Net increase (decrease) in net assets resulting from operations | | | 872,274,120 | | | | (17,594,117 | ) |
| | | | |
Dividends to shareholders: | | | | | | | | |
From net investment income: | | | | | | | | |
Class A | | | (200,856,443 | ) | | | (189,879,193 | ) |
Investor Class | | | (16,834,723 | ) | | | (15,560,192 | ) |
Class B | | | (6,779,447 | ) | | | (7,176,004 | ) |
Class C | | | (33,383,656 | ) | | | (33,655,695 | ) |
Class I | | | (298,724,674 | ) | | | (237,966,632 | ) |
Class R1 | | | (2,849 | ) | | | (1,824 | ) |
Class R2 | | | (563,018 | ) | | | (535,413 | ) |
Class R3 | | | (3,132 | ) | | | — | |
Class R6 | | | (1,932,527 | ) | | | (744,396 | ) |
| | | | |
| | | (559,080,469 | ) | | | (485,519,349 | ) |
| | | | |
From return of capital: | | | | | | | | |
Class A | | | (14,079,363 | ) | | | (29,948,610 | ) |
Investor Class | | | (1,171,791 | ) | | | (2,469,439 | ) |
Class B | |
| (550,202
| )
| | | (1,333,605 | ) |
Class C | | | (2,721,786 | ) | | | (6,300,642 | ) |
Class I | | | (20,070,724 | ) | | | (37,755,580 | ) |
Class R1 | | | (200 | ) | | | (294 | ) |
Class R2 | | | (39,656 | ) | | | (85,939 | ) |
Class R3 | | | (283 | ) | | | — | |
Class R6 | | | (140,193 | ) | | | (119,429 | ) |
| | | | |
| | | (38,774,198 | ) | | | (78,013,538 | ) |
| | | | |
Total dividends and distributions to shareholders | | | (597,854,667 | ) | | | (563,532,887 | ) |
| | | | |
Capital share transactions: | | | | | | | | |
Net proceeds from sale of shares | | | 3,245,684,029 | | | | 3,627,606,451 | |
Net asset value of shares issued to shareholders in reinvestment of dividends and distributions | | | 541,478,631 | | | | 503,314,254 | |
Cost of shares redeemed | | | (3,369,343,971 | ) | | | (2,929,574,034 | ) |
| | | | |
Increase (decrease) in net assets derived from capital share transactions | | | 417,818,689 | | | | 1,201,346,671 | |
| | | | |
Net increase (decrease) in net assets | | | 692,238,142 | | | | 620,219,667 | |
| | | | | | | | |
| | | 2016 | | | 2015 | |
| Net Assets | |
Beginning of year | | | 9,336,074,401 | | | | 8,715,854,734 | |
| | | | |
End of year | | $ | 10,028,312,543 | | | $ | 9,336,074,401 | |
| | | | |
Distributions in excess of net investment income at end of year | | $ | (9,109,811 | ) | | $ | (5,332,816 | ) |
| | | | |
| | | | | | |
The notes to the financial statements are an integral part of,
and should be read in conjunction with, the financial statements. | | | | | 27 | |
Financial Highlights selected per share data and ratios
| | | | | | | | | | | | | | | | | | | | |
| | | Year ended October 31, | |
| Class A | | 2016 | | | 2015 | | | 2014 | | | 2013 | | | 2012 | |
Net asset value at beginning of year | | $ | 5.57 | | | $ | 5.93 | | | $ | 6.08 | | | $ | 6.08 | | | $ | 5.84 | |
| | | | | | | | | | | | | | | | | | | | |
Net investment income (loss) (a) | | | 0.33 | | | | 0.31 | | | | 0.34 | | | | 0.36 | | | | 0.39 | |
Net realized and unrealized gain (loss) on investments | | | 0.20 | | | | (0.31 | ) | | | (0.09 | ) | | | 0.06 | | | | 0.27 | |
Net realized and unrealized gain (loss) on foreign currency transactions | | | 0.00 | ‡ | | | — | | | | — | | | | — | | | | 0.00 | ‡ |
| | | | | | | | | | | | | | | | | | | | |
Total from investment operations | | | 0.53 | | | | 0.00 | ‡ | | | 0.25 | | | | 0.42 | | | | 0.66 | |
| | | | | | | | | | | | | | | | | | | | |
| Less dividends and distributions: | | | | | | | | | | | | | | | | | | | | |
From net investment income | | | (0.34 | ) | | | (0.31 | ) | | | (0.40 | ) | | | (0.42 | ) | | | (0.42 | ) |
Return of capital | | | (0.02 | ) | | | (0.05 | ) | | | — | | | | — | | | | — | |
| | | | | | | | | | | | | | | | | | | | |
Total dividends and distributions | | | (0.36 | ) | | | (0.36 | ) | | | (0.40 | ) | | | (0.42 | ) | | | (0.42 | ) |
| | | | | | | | | | | | | | | | | | | | |
Net asset value at end of year | | $ | 5.74 | | | $ | 5.57 | | | $ | 5.93 | | | $ | 6.08 | | | $ | 6.08 | |
| | | | | | | | | | | | | | | | | | | | |
Total investment return (b) | | | 9.96 | % | | | 0.06 | % | | | 4.14 | % | | | 7.15 | % | | | 11.76 | % |
| Ratios (to average net assets)/Supplemental Data: | | | | | | | | | | | | | | | | | | | | |
Net investment income (loss) | | | 5.98 | % | | | 5.45 | % | | | 5.52 | % | | | 5.89 | % | | | 6.56 | % |
Net expenses | | | 0.95 | % | | | 0.96 | % | | | 0.99 | % | | | 1.01 | % | | | 1.00 | % |
Portfolio turnover rate | | | 41 | % | | | 38 | % | | | 41 | % | | | 40 | % | | | 29 | % |
Net assets at end of year (in 000’s) | | $ | 3,551,864 | | | $ | 3,364,517 | | | $ | 3,678,466 | | | $ | 4,055,185 | | | $ | 4,086,134 | |
| ‡ | Less than one cent per share. |
| (a) | Per share data based on average shares outstanding during the year. |
| (b) | Total investment return is calculated exclusive of sales charges and assumes the reinvestment of dividends and distributions. |
| | | | | | | | | | | | | | | | | | | | |
| | | Year ended October 31, | |
| Investor Class | | 2016 | | | 2015 | | | 2014 | | | 2013 | | | 2012 | |
Net asset value at beginning of year | | $ | 5.62 | | | $ | 5.99 | | | $ | 6.14 | | | $ | 6.13 | | | $ | 5.88 | |
| | | | | | | | | | | | | | | | | | | | |
Net investment income (loss) (a) | | | 0.33 | | | | 0.31 | | | | 0.34 | | | | 0.36 | | | | 0.39 | |
Net realized and unrealized gain (loss) on investments | | | 0.20 | | | | (0.31 | ) | | | (0.09 | ) | | | 0.07 | | | | 0.28 | |
Net realized and unrealized gain (loss) on foreign currency transactions | | | 0.00 | ‡ | | | — | | | | — | | | | — | | | | 0.00 | ‡ |
| | | | | | | | | | | | | | | | | | | | |
Total from investment operations | | | 0.53 | | | | (0.00 | )‡ | | | 0.25 | | | | 0.43 | | | | 0.67 | |
| | | | | | | | | | | | | | | | | | | | |
| Less dividends and distributions: | | | | | | | | | | | | | | | | | | | | |
From net investment income | | | (0.34 | ) | | | (0.32 | ) | | | (0.40 | ) | | | (0.42 | ) | | | (0.42 | ) |
Return of capital | | | (0.02 | ) | | | (0.05 | ) | | | — | | | | — | | | | — | |
| | | | | | | | | | | | | | | | | | | | |
Total dividends and distributions | | | (0.36 | ) | | | (0.37 | ) | | | (0.40 | ) | | | (0.42 | ) | | | (0.42 | ) |
| | | | | | | | | | | | | | | | | | | | |
Net asset value at end of year | | $ | 5.79 | | | $ | 5.62 | | | $ | 5.99 | | | $ | 6.14 | | | $ | 6.13 | |
| | | | | | | | | | | | | | | | | | | | |
Total investment return (b) | | | 9.91 | % | | | (0.07 | %) | | | 4.13 | % | | | 7.24 | % | | | 11.82 | % |
| Ratios (to average net assets)/Supplemental Data: | | | | | | | | | | | | | | | | | | | | |
Net investment income (loss) | | | 5.90 | % | | | 5.39 | % | | | 5.50 | % | | | 5.88 | % | | | 6.53 | % |
Net expenses | | | 1.03 | % | | | 1.02 | % | | | 1.01 | % | | | 1.02 | % | | | 1.03 | % |
Portfolio turnover rate | | | 41 | % | | | 38 | % | | | 41 | % | | | 40 | % | | | 29 | % |
Net assets at end of year (in 000’s) | | $ | 287,493 | | | $ | 282,451 | | | $ | 296,535 | | | $ | 307,643 | | | $ | 301,074 | |
| ‡ | Less than one cent per share. |
| (a) | Per share data based on average shares outstanding during the year. |
| (b) | Total investment return is calculated exclusive of sales charges and assumes the reinvestment of dividends and distributions. |
| | | | |
| 28 | | MainStay High Yield Corporate Bond Fund | | The notes to the financial statements are an integral part of,
and should be read in conjunction with, the financial statements. |
Financial Highlights selected per share data and ratios
| | | | | | | | | | | | | | | | | | | | |
| | | Year ended October 31, | |
| Class B | | 2016 | | | 2015 | | | 2014 | | | 2013 | | | 2012 | |
Net asset value at beginning of year | | $ | 5.54 | | | $ | 5.90 | | | $ | 6.05 | | | $ | 6.05 | | | $ | 5.81 | |
| | | | | | | | | | | | | | | | | | | | |
Net investment income (loss) (a) | | | 0.28 | | | | 0.27 | | | | 0.29 | | | | 0.31 | | | | 0.34 | |
Net realized and unrealized gain (loss) on investments | | | 0.20 | | | | (0.32 | ) | | | (0.09 | ) | | | 0.06 | | | | 0.27 | |
Net realized and unrealized gain (loss) on foreign currency transactions | | | 0.00 | ‡ | | | — | | | | — | | | | — | | | | 0.00 | ‡ |
| | | | | | | | | | | | | | | | | | | | |
Total from investment operations | | | 0.48 | | | | (0.05 | ) | | | 0.20 | | | | 0.37 | | | | 0.61 | |
| | | | | | | | | | | | | | | | | | | | |
| Less dividends and distributions: | | | | | | | | | | | | | | | | | | | | |
From net investment income | | | (0.29 | ) | | | (0.26 | ) | | | (0.35 | ) | | | (0.37 | ) | | | (0.37 | ) |
Return of capital | | | (0.02 | ) | | | (0.05 | ) | | | — | | | | — | | | | — | |
| | | | | | | | | | | | | | | | | | | | |
Total dividends and distributions | | | (0.31 | ) | | | (0.31 | ) | | | (0.35 | ) | | | (0.37 | ) | | | (0.37 | ) |
| | | | | | | | | | | | | | | | | | | | |
Net asset value at end of year | | $ | 5.71 | | | $ | 5.54 | | | $ | 5.90 | | | $ | 6.05 | | | $ | 6.05 | |
| | | | | | | | | | | | | | | | | | | | |
Total investment return (b) | | | 8.85 | % | | | (0.60 | %) | | | 3.35 | % | | | 6.36 | % | | | 10.94 | % |
| Ratios (to average net assets)/Supplemental Data: | | | | | | | | | | | | | | | | | | | | |
Net investment income (loss) | | | 5.16 | % | | | 4.64 | % | | | 4.75 | % | | | 5.13 | % | | | 5.78 | % |
Net expenses | | | 1.78 | % | | | 1.77 | % | | | 1.76 | % | | | 1.77 | % | | | 1.78 | % |
Portfolio turnover rate | | | 41 | % | | | 38 | % | | | 41 | % | | | 40 | % | | | 29 | % |
Net assets at end of year (in 000’s) | | $ | 132,509 | | | $ | 139,683 | | | $ | 172,640 | | | $ | 197,273 | | | $ | 221,723 | |
| ‡ | Less than one cent per share. |
| (a) | Per share data based on average shares outstanding during the year. |
| (b) | Total investment return is calculated exclusive of sales charges and assumes the reinvestment of dividends and distributions. |
| | | | | | | | | | | | | | | | | | | | |
| | | Year ended October 31, | |
| Class C | | 2016 | | | 2015 | | | 2014 | | | 2013 | | | 2012 | |
Net asset value at beginning of year | | $ | 5.55 | | | $ | 5.90 | | | $ | 6.05 | | | $ | 6.05 | | | $ | 5.81 | |
| | | | | | | | | | | | | | | | | | | | |
Net investment income (loss) (a) | | | 0.28 | | | | 0.27 | | | | 0.29 | | | | 0.31 | | | | 0.34 | |
Net realized and unrealized gain (loss) on investments | | | 0.20 | | | | (0.31 | ) | | | (0.09 | ) | | | 0.06 | | | | 0.27 | |
Net realized and unrealized gain (loss) on foreign currency transactions | | | 0.00 | ‡ | | | — | | | | — | | | | — | | | | 0.00 | ‡ |
| | | | | | | | | | | | | | | | | | | | |
Total from investment operations | | | 0.48 | | | | (0.04 | ) | | | 0.20 | | | | 0.37 | | | | 0.61 | |
| | | | | | | | | | | | | | | | | | | | |
| Less dividends and distributions: | | | | | | | | | | | | | | | | | | | | |
From net investment income | | | (0.29 | ) | | | (0.26 | ) | | | (0.35 | ) | | | (0.37 | ) | | | (0.37 | ) |
Return of capital | | | (0.02 | ) | | | (0.05 | ) | | | — | | | | — | | | | — | |
| | | | | | | | | | | | | | | | | | | | |
Total dividends and distributions | | | (0.31 | ) | | | (0.31 | ) | | | (0.35 | ) | | | (0.37 | ) | | | (0.37 | ) |
| | | | | | | | | | | | | | | | | | | | |
Net asset value at end of year | | $ | 5.72 | | | $ | 5.55 | | | $ | 5.90 | | | $ | 6.05 | | | $ | 6.05 | |
| | | | | | | | | | | | | | | | | | | | |
Total investment return (b) | | | 9.04 | % | | | (0.60 | %) | | | 3.34 | % | | | 6.36 | % | | | 10.93 | % |
| Ratios (to average net assets)/Supplemental Data: | | | | | | | | | | | | | | | | | | | | |
Net investment income (loss) | | | 5.15 | % | | | 4.64 | % | | | 4.75 | % | | | 5.13 | % | | | 5.78 | % |
Net expenses | | | 1.78 | % | | | 1.77 | % | | | 1.76 | % | | | 1.77 | % | | | 1.78 | % |
Portfolio turnover rate | | | 41 | % | | | 38 | % | | | 41 | % | | | 40 | % | | | 29 | % |
Net assets at end of year (in 000’s) | | $ | 678,364 | | | $ | 679,392 | | | $ | 785,873 | | | $ | 814,589 | | | $ | 819,807 | |
| ‡ | Less than one cent per share. |
| (a) | Per share data based on average shares outstanding during the year. |
| (b) | Total investment return is calculated exclusive of sales charges and assumes the reinvestment of dividends and distributions. |
| | | | | | |
The notes to the financial statements are an integral part of,
and should be read in conjunction with, the financial statements. | | | | | 29 | |
Financial Highlights selected per share data and ratios
| | | | | | | | | | | | | | | | | | | | |
| | | Year ended October 31, | |
| Class I | | 2016 | | | 2015 | | | 2014 | | | 2013 | | | 2012 | |
Net asset value at beginning of year | | $ | 5.58 | | | $ | 5.94 | | | $ | 6.08 | | | $ | 6.08 | | | $ | 5.84 | |
| | | | | | | | | | | | | | | | | | | | |
Net investment income (loss) (a) | | | 0.34 | | | | 0.33 | | | | 0.35 | | | | 0.37 | | | | 0.40 | |
Net realized and unrealized gain (loss) on investments | | | 0.20 | | | | (0.31 | ) | | | (0.08 | ) | | | 0.07 | | | | 0.28 | |
Net realized and unrealized gain (loss) on foreign currency transactions | | | 0.00 | ‡ | | | — | | | | — | | | | — | | | | 0.00 | ‡ |
| | | | | | | | | | | | | | | | | | | | |
Total from investment operations | | | 0.54 | | | | 0.02 | | | | 0.27 | | | | 0.44 | | | | 0.68 | |
| | | | | | | | | | | | | | | | | | | | |
| Less dividends and distributions: | | | | | | | | | | | | | | | | | | | | |
From net investment income | | | (0.35 | ) | | | (0.33 | ) | | | (0.41 | ) | | | (0.44 | ) | | | (0.44 | ) |
Return of capital | | | (0.02 | ) | | | (0.05 | ) | | | — | | | | — | | | | — | |
| | | | | | | | | | | | | | | | | | | | |
Total dividends and distributions | | | (0.37 | ) | | | (0.38 | ) | | | (0.41 | ) | | | (0.44 | ) | | | (0.44 | ) |
| | | | | | | | | | | | | | | | | | | | |
Net asset value at end of year | | $ | 5.75 | | | $ | 5.58 | | | $ | 5.94 | | | $ | 6.08 | | | $ | 6.08 | |
| | | | | | | | | | | | | | | | | | | | |
Total investment return (b) | | | 10.23 | % | | | 0.32 | % | | | 4.58 | % | | | 7.40 | % | | | 12.02 | % |
| Ratios (to average net assets)/Supplemental Data: | | | | | | | | | | | | | | | | | | | | |
Net investment income (loss) | | | 6.23 | % | | | 5.70 | % | | | 5.76 | % | | | 6.13 | % | | | 6.81 | % |
Net expenses | | | 0.70 | % | | | 0.71 | % | | | 0.74 | % | | | 0.76 | % | | | 0.75 | % |
Portfolio turnover rate | | | 41 | % | | | 38 | % | | | 41 | % | | | 40 | % | | | 29 | % |
Net assets at end of year (in 000’s) | | $ | 5,313,266 | | | $ | 4,844,891 | | | $ | 3,762,169 | | | $ | 3,393,780 | | | $ | 2,982,526 | |
| ‡ | Less than one cent per share. |
| (a) | Per share data based on average shares outstanding during the year. |
| (b) | Total investment return is calculated exclusive of sales charges and assumes the reinvestment of dividends and distributions. Class I shares are not subject to sales charges. |
| | | | | | | | | | | | | | | | | | | | |
| | | Year ended October 31, | | | June 29,
2012**
through
October 31, | |
| Class R1 | | 2016 | | | 2015 | | | 2014 | | | 2013 | | | 2012 | |
Net asset value at beginning of period | | $ | 5.57 | | | $ | 5.93 | | | $ | 6.08 | | | $ | 6.08 | | | $ | 5.92 | |
| | | | | | | | | | | | | | | | | | | | |
Net investment income (loss) (a) | | | 0.34 | | | | 0.32 | | | | 0.34 | | | | 0.37 | | | | 0.14 | |
Net realized and unrealized gain (loss) on investments | | | 0.19 | | | | (0.31 | ) | | | (0.08 | ) | | | 0.06 | | | | 0.16 | |
Net realized and unrealized gain (loss) on foreign currency transactions | | | 0.00 | ‡ | | | — | | | | — | | | | — | | | | 0.00 | ‡ |
| | | | | | | | | | | | | | | | | | | | |
Total from investment operations | | | 0.53 | | | | 0.01 | | | | 0.26 | | | | 0.43 | | | | 0.30 | |
| | | | | | | | | | | | | | | | | | | | |
| Less dividends and distributions: | | | | | | | | | | | | | | | | | | | | |
From net investment income | | | (0.34 | ) | | | (0.32 | ) | | | (0.41 | ) | | | (0.43 | ) | | | (0.14 | ) |
Return of capital | | | (0.02 | ) | | | (0.05 | ) | | | — | | | | — | | | | — | |
| | | | | | | | | | | | | | | | | | | | |
Total dividends and distributions | | | (0.36 | ) | | | (0.37 | ) | | | (0.41 | ) | | | (0.43 | ) | | | (0.14 | ) |
| | | | | | | | | | | | | | | | | | | | |
Net asset value at end of period | | $ | 5.74 | | | $ | 5.57 | | | $ | 5.93 | | | $ | 6.08 | | | $ | 6.08 | |
| | | | | | | | | | | | | | | | | | | | |
Total investment return (b) | | | 10.13 | % | | | 0.21 | % | | | 4.31 | % | | | 7.32 | % | | | 5.17 | %(c) |
| Ratios (to average net assets)/Supplemental Data: | | | | | | | | | | | | | | | | | | | | |
Net investment income (loss) | | | 6.11 | % | | | 5.60 | % | | | 5.66 | % | | | 6.03 | % | | | 6.49 | %†† |
Net expenses | | | 0.80 | % | | | 0.81 | % | | | 0.84 | % | | | 0.86 | % | | | 0.87 | %†† |
Portfolio turnover rate | | | 41 | % | | | 38 | % | | | 41 | % | | | 40 | % | | | 29 | % |
Net assets at end of period (in 000’s) | | $ | 59 | | | $ | 39 | | | $ | 29 | | | $ | 28 | | | $ | 26 | |
| ‡ | Less than one cent per share. |
| (a) | Per share data based on average shares outstanding during the period. |
| (b) | Total investment return is calculated exclusive of sales charges and assumes the reinvestment of dividends and distributions. Class R1 shares are not subject to sales charges. |
| (c) | Total investment return is not annualized. |
| | | | |
| 30 | | MainStay High Yield Corporate Bond Fund | | The notes to the financial statements are an integral part of,
and should be read in conjunction with, the financial statements. |
Financial Highlights selected per share data and ratios
| | | | | | | | | | | | | | | | | | | | |
| | | Year ended October 31, | |
| Class R2 | | 2016 | | | 2015 | | | 2014 | | | 2013 | | | 2012 | |
Net asset value at beginning of year | | $ | 5.57 | | | $ | 5.93 | | | $ | 6.08 | | | $ | 6.08 | | | $ | 5.84 | |
| | | | | | | | | | | | | | | | | | | | |
Net investment income (loss) (a) | | | 0.32 | | | | 0.31 | | | | 0.33 | | | | 0.35 | | | | 0.38 | |
Net realized and unrealized gain (loss) on investments | | | 0.20 | | | | (0.31 | ) | | | (0.09 | ) | | | 0.07 | | | | 0.28 | |
Net realized and unrealized gain (loss) on foreign currency transactions | | | 0.00 | ‡ | | | — | | | | — | | | | — | | | | 0.00 | ‡ |
| | | | | | | | | | | | | | | | | | | | |
Total from investment operations | | | 0.52 | | | | (0.00 | )‡ | | | 0.24 | | | | 0.42 | | | | 0.66 | |
| | | | | | | | | | | | | | | | | | | | |
| Less dividends and distributions: | | | | | | | | | | | | | | | | | | | | |
From net investment income | | | (0.33 | ) | | | (0.31 | ) | | | (0.39 | ) | | | (0.42 | ) | | | (0.42 | ) |
Return of capital | | | (0.02 | ) | | | (0.05 | ) | | | — | | | | — | | | | — | |
| | | | | | | | | | | | | | | | | | | | |
Total dividends and distributions | | | (0.35 | ) | | | (0.36 | ) | | | (0.39 | ) | | | (0.42 | ) | | | (0.42 | ) |
| | | | | | | | | | | | | | | | | | | | |
Net asset value at end of year | | $ | 5.74 | | | $ | 5.57 | | | $ | 5.93 | | | $ | 6.08 | | | $ | 6.08 | |
| | | | | | | | | | | | | | | | | | | | |
Total investment return (b) | | | 9.83 | % | | | (0.04 | %) | | | 4.04 | % | | | 7.06 | % | | | 11.66 | % |
| Ratios (to average net assets)/Supplemental Data: | | | | | | | | | | | | | | | | | | | | |
Net investment income (loss) | | | 5.89 | % | | | 5.35 | % | | | 5.43 | % | | | 5.79 | % | | | 6.46 | % |
Net expenses | | | 1.05 | % | | | 1.06 | % | | | 1.09 | % | | | 1.11 | % | | | 1.10 | % |
Portfolio turnover rate | | | 41 | % | | | 38 | % | | | 41 | % | | | 40 | % | | | 29 | % |
Net assets at end of year (in 000’s) | | $ | 10,917 | | | $ | 10,084 | | | $ | 11,049 | | | $ | 15,008 | | | $ | 14,280 | |
| ‡ | Less than one cent per share. |
| (a) | Per share data based on average shares outstanding during the year. |
| (b) | Total investment return is calculated exclusive of sales charges and assumes the reinvestment of dividends and distributions. Class R2 shares are not subject to sales charges. |
| | | | | | | | | | | | | | | | | | | | |
| | | February 29,
2016**
through
October 31, | | | | | | | | | | | | | |
| Class R3 | | 2016 | | | | | | | | | | | | | |
Net asset value at beginning of period | | $ | 5.17 | | | | | | | | | | | | | | | | | |
| | | | | | | | | | | | | | | | | | | | |
Net investment income (loss) (a) | | | 0.20 | | | | | | | | | | | | | | | | | |
Net realized and unrealized gain (loss) on investments | | | 0.60 | | | | | | | | | | | | | | | | | |
| | | | | | | | | | | | | | | | | | | | |
Total from investment operations | | | 0.80 | | | | | | | | | | | | | | | | | |
| | | | | | | | | | | | | | | | | | | | |
| Less dividends: | | | | | | | | | | | | | | | | | | | | |
From net investment income | | | (0.21 | ) | | | | | | | | | | | | | | | | |
Return of capital | | | (0.02 | ) | | | | | | | | | | | | | | | | |
| | | | | | | | | | | | | | | | | | | | |
Total dividends and distributions | | | 0.23 | | | | | | | | | | | | | | | | | |
| | | | | | | | | | | | | | | | | | | | |
Net asset value at end of period | | $ | 5.74 | | | | | | | | | | | | | | | | | |
| | | | | | | | | | | | | | | | | | | | |
Total investment return (b)(c) | | | 15.59 | % | | | | | | | | | | | | | | | | |
| Ratios (to average net assets)/Supplemental Data: | | | | | | | | | | | | | | | | | | | | |
Net investment income (loss) | | | 5.40 | %†† | | | | | | | | | | | | | | | | |
Net expenses | | | 1.30 | %†† | | | | | | | | | | | | | | | | |
Portfolio turnover rate | | | 41 | % | | | | | | | | | | | | | | | | |
Net assets at end of period (in 000’s) | | $ | 130 | | | | | | | | | | | | | | | | | |
| (a) | Per share data based on average shares outstanding during the period. |
| (b) | Total investment return is calculated exclusive of sales charges and assumes the reinvestment of dividends. Class R3 shares are not subject to sales charges. |
| (c) | Total investment return is not annualized. |
| | | | | | |
The notes to the financial statements are an integral part of,
and should be read in conjunction with, the financial statements. | | | | | 31 | |
Financial Highlights selected per share data and ratios
| | | | | | | | | | | | | | | | |
| | | Year ended October 31, | | | June 17,
2013**
through
October 31, | |
| Class R6 | | 2016 | | | 2015 | | | 2014 | | | 2013 | |
Net asset value at beginning of period | | $ | 5.58 | | | $ | 5.94 | | | $ | 6.09 | | | $ | 6.11 | |
| | | | | | | | | | | | | | | | |
Net investment income (loss) (a) | | | 0.35 | | | | 0.34 | | | | 0.36 | | | | 0.14 | |
Net realized and unrealized gain (loss) on investments | | | 0.19 | | | | (0.31 | ) | | | (0.08 | ) | | | 0.03 | |
| | | | | | | | | | | | | | | | |
Total from investment operations | | | 0.54 | | | | 0.03 | | | | 0.28 | | | | 0.17 | |
| | | | | | | | | | | | | | | | |
| Less dividends and distributions: | | | | | | | | | | | | | | | | |
From net investment income | | | (0.36 | ) | | | (0.34 | ) | | | (0.43 | ) | | | (0.19 | ) |
Return of capital | | | (0.02 | ) | | | (0.05 | ) | | | — | | | | — | |
| | | | | | | | | | | | | | | | |
Total dividends and distributions | | | (0.38 | ) | | | (0.39 | ) | | | (0.43 | ) | | | (0.19 | ) |
| | | | | | | | | | | | | | | | |
Net asset value at end of period | | $ | 5.74 | | | $ | 5.58 | | | $ | 5.94 | | | $ | 6.09 | |
| | | | | | | | | | | | | | | | |
Total investment return (b) | | | 10.24 | % | | | 0.50 | % | | | 4.60 | % | | | 2.79 | %(c) |
| Ratios (to average net assets)/Supplemental Data: | | | | | | | | | | | | | | | | |
Net investment income (loss) | | | 6.23 | % | | | 5.84 | % | | | 5.88 | % | | | 6.24 | %†† |
Net expenses | | | 0.58 | % | | | 0.58 | % | | | 0.58 | % | | | 0.59 | %†† |
Portfolio turnover rate | | | 41 | % | | | 38 | % | | | 41 | % | | | 40 | % |
Net assets at end of period (in 000’s) | | $ | 53,712 | | | $ | 15,017 | | | $ | 9,093 | | | $ | 26 | |
| (a) | Per share data based on average shares outstanding during the period. |
| (b) | Total investment return is calculated exclusive of sales charges and assumes the reinvestment of dividends and distributions. Class R6 shares are not subject to sales charges. |
| (c) | Total investment return is not annualized. |
| | | | |
| 32 | �� | MainStay High Yield Corporate Bond Fund | | The notes to the financial statements are an integral part of,
and should be read in conjunction with, the financial statements. |
Notes to Financial Statements
Note 1–Organization and Business
The MainStay Funds (the “Trust”) was organized on January 9, 1986, as a Massachusetts business trust. The Trust is registered under the Investment Company Act of 1940, as amended (the “1940 Act”), as an open-end management investment company, and is comprised of twelve funds (collectively referred to as the “Funds”). These financial statements and notes relate to the MainStay High Yield Corporate Bond Fund (the “Fund”), a “diversified” fund, as that term is defined in the 1940 Act, as interpreted or modified by regulatory authorities having jurisdiction, from time to time.
The Fund currently offers nine classes of shares. Class A shares commenced operations on January 3, 1995. Class B shares commenced operations on May 1, 1986. Class C shares commenced operations on September 1, 1998. Class I shares commenced operations on January 2, 2004. Class R2 shares were first offered to the public on December 14, 2007, but did not commence operations until May 1, 2008. Investor Class shares commenced operations on February 28, 2008. Class R1 shares commenced operations on June 29, 2012. Class R6 shares commenced operations on June 17, 2013. Class R3 shares commenced operations on February 29, 2016. Class A and Investor Class shares are offered at net asset value (“NAV”) per share plus an initial sales charge. No initial sales charge applies to investments of $1 million or more (and certain other qualified purchases) in Class A and Investor Class shares, but a contingent deferred sales charge (“CDSC”) of 1.00% may be imposed on certain redemptions of such shares made within one year of the date of purchase on shares that were purchased without an initial sales charge made before January 1, 2017. Effective January 1, 2017, a CDSC of 1.00% may be imposed on certain redemptions of Class A and Investor Class shares made within 24 months of the date of purchase of such shares that were made without an initial sales charge. Class B and Class C shares are offered at NAV without an initial sales charge, although a CDSC that declines depending on the number of years a shareholder has held its Class B shares may be imposed on redemptions made within six years of the date of purchase of such shares and a 1.00% CDSC may be imposed on redemptions made within one year of the date of purchase of Class C shares. Class I, Class R1, Class R2, Class R3 and Class R6 shares are offered at NAV and are not subject to a sales charge. Depending upon eligibility, Class B shares convert to either Class A or Investor Class shares at the end of the calendar quarter eight years after the date they were purchased. Additionally, depending upon eligibility, Class A shares may convert to Investor Class shares and Investor Class shares may convert to Class A shares. Under certain circumstances and as may be permitted by the Trust’s multiple class plan under Rule 18f-3 of the 1940 Act, an exchange/conversion may be made from specified share classes of the Fund to one or more other share classes of the Fund as disclosed in the capital share transactions within these notes. The nine classes of shares have the same voting (except for issues that relate solely to one class), dividend, liquidation and other rights, and the same terms and conditions, except that Class B and Class C shares are subject to higher distribution and/or service fee rates than Class A, Investor Class, Class R2 and Class R3 shares under a distribution plan pursuant to Rule 12b-1 under the 1940 Act. Class I, Class R1 and Class R6 shares are not subject to a distribution and/or service fee. Class R1, Class R2 and Class R3 shares are subject to a shareholder service fee. This is in addition to any fees paid under a distribution plan, where applicable.
The Fund’s investment objective is to seek maximum current income through investment in a diversified portfolio of high-yield debt securities. Capital appreciation is a secondary objective.
Note 2–Significant Accounting Policies
The Fund is an investment company and accordingly follows the investment company accounting and reporting guidance of the Financial Accounting Standards Board (“FASB”) Accounting Standard Codification Topic 946 Financial Services—Investment Companies. The Fund prepares its financial statements in accordance with generally accepted accounting principles (“GAAP”) in the United States of America and follows the significant accounting policies described below.
(A) Securities Valuation. Investments are usually valued as of the close of regular trading on the New York Stock Exchange (the “Exchange”) (usually 4:00 p.m. Eastern time) on each day the Fund is open for business (“valuation date”).
The Board of Trustees (the “Board”) adopted procedures establishing methodologies for the valuation of the Fund’s securities and other assets and delegated the responsibility for valuation determinations under those procedures to the Valuation Committee of the Trust (the “Valuation Committee”). The Board authorized the Valuation Committee to appoint a Valuation Sub-Committee (the “Sub-Committee”) to deal in the first instance with establishing the prices of securities for which market quotations are not readily available or the prices of which are not otherwise readily determinable under these procedures. The Sub-Committee meets (in person, via electronic mail or via teleconference) on an as-needed basis. Subsequently, the Valuation Committee meets to ensure that actions taken by the Sub-Committee were appropriate. The procedures recognize that, subject to the oversight of the Board and unless otherwise noted, the responsibility for the day-to-day valuation of portfolio assets (including fair value measurements for the Fund’s assets and liabilities) rests with New York Life Investment Management LLC (“New York Life Investments” or the “Manager”), aided to whatever extent necessary by the Subadvisor (as defined in Note 3(A)) to the Fund.
To assess the appropriateness of security valuations, the Manager, Subadvisor or the Fund’s third party service provider, who is subject to oversight by the Manager, regularly compares prior day prices, prices on comparable securities, and the sale prices to the prior and current day prices and challenges prices with changes exceeding certain tolerance levels with third party pricing services or broker sources. For those securities valued through either a standardized fair valuation methodology or a fair valuation measurement, the Sub-Committee deals in the first instance with such valuation and the Valuation Committee reviews and affirms, if appropriate, the reasonableness of the valuation based on such methodologies and measurements on a regular basis after considering all relevant information that is reasonably available. Any action taken by the Sub-Committee with respect to the valuation of a portfolio security or other asset is submitted by the Valuation Committee to the Board for its review and ratification, if appropriate, at its next regularly scheduled meeting.
“Fair value” is defined as the price the Fund would reasonably expect to receive upon selling an asset or liability in an orderly transaction to an independent buyer in the principal or most advantageous market for the asset or liability. Fair value measurements are determined within a framework that establishes a three-tier hierarchy which maximizes the
Notes to Financial Statements (continued)
use of observable market data and minimizes the use of unobservable inputs to establish a classification of fair value measurements for disclosure purposes. “Inputs” refer broadly to the assumptions that market participants would use in pricing the asset or liability, including assumptions about risk, such as the risk inherent in a particular valuation technique used to measure fair value using a pricing model and/or the risk inherent in the inputs for the valuation technique. Inputs may be observable or unobservable. Observable inputs reflect the assumptions market participants would use in pricing the asset or liability based on market data obtained from sources independent of the Fund. Unobservable inputs reflect the Fund’s own assumptions about the assumptions market participants would use in pricing the asset or liability based on the information available. The inputs or methodology used for valuing assets or liabilities may not be an indication of the risks associated with investing in those assets or liabilities. The three-tier hierarchy of inputs is summarized below.
| • | | Level 1—quoted prices in active markets for an identical asset or liability |
| • | | Level 2—other significant observable inputs (including quoted prices for a similar asset or liability in active markets, interest rates and yield curves, prepayment speeds, credit risk, etc.) |
| • | | Level 3—significant unobservable inputs (including the Fund’s own assumptions about the assumptions that market participants would use in measuring fair value of an asset or liability) |
The level of an asset or liability within the fair value hierarchy is based on the lowest level of an input, both individually and in the aggregate, that is significant to the fair value measurement. As of October 31, 2016, the aggregate value by input level of the Fund’s assets and liabilities is included at the end of the Fund’s Portfolio of Investments.
The Fund may use third party vendor evaluations, whose prices may be derived from one or more of the following standard inputs, among others:
| | |
• Benchmark yields | | • Reported trades |
• Broker/dealer quotes | | • Issuer spreads |
• Two-sided markets | | • Benchmark securities |
• Bids/offers | | • Reference data (corporate actions or material event notices) |
• Industry and economic events | | • Comparable bonds |
• Monthly payment information | | |
An asset or liability for which market values cannot be measured using the methodologies described above is valued by methods deemed reasonable in good faith by the Valuation Committee, following the procedures established by the Board, to represent fair value. Under these procedures, the Fund generally uses a market-based approach which may use related or comparable assets or liabilities, recent transactions, market multiples, book values, and other relevant information. The Fund may also use an income-based valuation approach in which the anticipated future cash flows of the asset or liability are discounted to calculate fair value. Discounts may also be applied due to the nature and/or duration of any restrictions on the disposition of the asset or liability. Fair value represents a good faith approximation of the value of a security. Fair value determinations involve the consideration of a number of subjective factors, an analysis of applicable facts and circumstances and the exercise of judgment. As a result, it is possible
that the fair value for a security determined in good faith in accordance with the Fund’s valuation procedures may differ from valuations for the same security determined by other funds using their own valuation procedures. Although the Fund’s valuation procedures are designed to value a security at the price the Fund may reasonably expect to receive upon its sale in an orderly transaction, there can be no assurance that any fair value determination thereunder would, in fact, approximate the amount that the Fund would actually realize upon the sale of the security or the price at which the security would trade if a reliable market price were readily available. During the year ended October 31, 2016, there were no material changes to the fair value methodologies.
Equity and non-equity securities which may be valued in this manner include, but are not limited to: (i) a security for which trading has been halted or suspended; (ii) a debt security that has recently gone into default and for which there is not a current market quotation; (iii) a security of an issuer that has entered into a restructuring; (iv) a security that has been de-listed from a national exchange; (v) a security for which the market price is not readily available from a third party pricing source or, if so provided, does not, in the opinion of the Manager or Subadvisor reflect the security’s market value; (vi) a security subject to trading collars for which no or limited trading takes place; and (vii) a security whose principal market has been temporarily closed at a time when, under normal conditions, it would be open. Securities for which market quotations or observable inputs are not readily available are generally categorized as Level 3 in the hierarchy. As of October 31, 2016, securities that were fair valued in such a manner are shown in the Portfolio of Investments.
Equity securities and shares of Exchange-Traded Funds (“ETFs”) are valued at the last quoted sales prices as of the close of regular trading on the relevant exchange on each valuation date. Securities that are not traded on the valuation date are valued at the mean of the last quoted bid and ask prices. Prices are normally taken from the principal market in which each security trades. Investments in mutual funds, including money market funds, are valued at their respective NAVs as of the close of the Exchange on the valuation date. These securities are generally categorized as Level 1 in the hierarchy.
Debt securities (other than convertible and municipal bonds) are valued at the evaluated bid prices (evaluated mean prices in the case of convertible and municipal bonds) supplied by a pricing agent or brokers selected by the Manager, in consultation with the Subadvisor. Those values reflect broker/dealer supplied prices and electronic data processing techniques, if the evaluated bid or mean prices are deemed by the Manager, in consultation with the Subadvisor, to be representative of market values, at the regular close of trading of the Exchange on each valuation date. Debt securities purchased on a delayed delivery basis are marked to market daily until settlement at the forward settlement date. Debt securities, including corporate bonds, U.S. government & federal agency bonds, municipal bonds, foreign bonds, convertible bonds, asset-backed securities and mortgage-backed securities are generally categorized as Level 2 in the hierarchy.
Temporary cash investments acquired in excess of 60 days to maturity at the time of purchase are valued using the latest bid prices or using valuations based on a matrix system (which considers such factors as security prices, yields, maturities, and ratings), both as furnished by independent pricing services. Other temporary cash investments which mature in 60 days or less at the time of purchase (“Short-Term
| | |
| 34 | | MainStay High Yield Corporate Bond Fund |
Investments”) are valued using the amortized cost method of valuation, unless the use of such method would be inappropriate. The amortized cost method involves valuing a security at its cost on the date of purchase and thereafter assuming a constant amortization to maturity of the difference between such cost and the value on maturity date. Amortized cost approximates the current fair value of a security. Securities valued using the amortized cost method are not valued using quoted prices in an active market and are generally categorized as Level 2 in the hierarchy.
Loan assignments, participations and commitments are valued at the average of bid quotations obtained from the engaged independent pricing service and are generally categorized as Level 2 in the hierarchy. Certain loan assignments, participations and commitments may be valued by utilizing significant unobservable inputs obtained from the pricing service and are generally categorized as Level 3 in the hierarchy. As of October 31, 2016, the Fund held a loan assignment categorized as a Level 3 security with a value of $3,007,500 that was valued by utilizing significant unobservable inputs.
The information above is not intended to reflect an exhaustive list of the methodologies that may be used to value portfolio investments. The valuation procedures permit the use of a variety of valuation methodologies in connection with valuing portfolio investments. The methodology used for a specific type of investment may vary based on the market data available or other considerations. The methodologies summarized above may not represent the specific means by which portfolio investments are valued on any particular business day.
The valuation techniques and significant amounts of unobservable inputs used in the fair valuation measurement of the Fund’s Level 3 securities are outlined in the table below. A significant increase or decrease in any of those inputs in isolation would result in a significantly higher or lower fair value measurement.
| | | | | | | | | | | | |
Asset
Class | | Fair Value
at 10/31/16* | | | Valuation
Technique | | Unobservable
Inputs | | Range | |
Convertible Bond (1) | | $ | 53,695,454 | | | Market Approach | | Estimated Enterprise Value | | $ | 520.9m–$604.0m | |
| | | | | | | | Discount Rates | | | 15.26%–19.12% | |
Corporate Bonds (2) | | | 59,043,697 | | | Income Approach | | Estimated Yield | | | 16.31 | % |
| | | | | | | | Spread Adjustment | | | 4.50 | % |
| | | 64,863 | | | Market Approach | | Estimated Remaining Claims/Value | | $ | 0.001 | |
Common Stocks (5) | | | 4,338,072 | | | Income Approach | | Discount Rate | | | 15.00 | % |
| | | | | | | | Liquidity Discount | | | 20.00 | % |
| | | | | | | | Estimated Net Present Value | | $ | 873 | |
| | | 12,067,586 | | | Market Approach | | EBITDA Multiple | | | 5.75 | x |
| | | | | | | | Estimated Enterprise Value | | $ | 580.5m–$679.9m | |
| | | | | | | | Estimated Volatility | | | 22.60 | % |
| | | | | | | | | | | | |
| | $ | 129,209,672 | | | | | | | | | |
| | | | | | | | | | | | |
| * | The table above does not include certain Level 3 investments that were valued by brokers and pricing services without adjustment. As of October 31, 2016, the value of these investments was $44,175,753. The inputs for these investments were not readily available or cannot be reasonably estimated. |
A Fund security or other asset may be determined to be illiquid under procedures approved by the Board. Illiquidity of a security might prevent the sale of such security at a time when the Manager or Subadvisor might wish to sell, and these securities could have the effect of decreasing the overall level of the Fund’s liquidity. Further, the lack of an established secondary market may make it more difficult to value illiquid securities, requiring the Fund to rely on judgments that may be somewhat subjective in measuring value, which could vary materially from the amount that the Fund could realize upon disposition. Difficulty in selling illiquid securities may result in a loss or may be costly to the Fund. Under the supervision of the Board, the Manager or Subadvisor determines the liquidity of the Fund’s investments; in doing so, the Manager or Subadvisor may consider various factors, including (i) the frequency of trades and quotations, (ii) the number of dealers and prospective purchasers, (iii) dealer undertakings to make a market, and (iv) the nature of the security and the market in which it trades (e.g., the time needed to dispose of the security, the method of soliciting offers and the mechanics of transfer). Illiquid securities are often valued in accordance with methods deemed by the Board in good faith to be reasonable and appropriate to accurately reflect their fair value. The liquidity of the Fund’s investments, as shown in the Portfolio of Investments, was determined as of October 31, 2016 and can change at any time in response to, among other relevant factors, market conditions or events or developments with respect to an individual issuer or instrument. As of October 31, 2016, securities deemed to be illiquid under procedures approved by the Board are shown in the Portfolio of Investments.
(B) Income Taxes. The Fund’s policy is to comply with the requirements of the Internal Revenue Code of 1986, as amended (the “Internal Revenue Code”), applicable to regulated investment companies and to distribute all of its taxable income to the shareholders of the Fund within the allowable time limits. Therefore, no federal, state and local income tax provisions are required.
Management evaluates the Fund’s tax positions to determine if the tax positions taken meet the minimum recognition threshold in connection with accounting for uncertainties in income tax positions taken or expected to be taken for the purposes of measuring and recognizing tax liabilities in the financial statements. Recognition of tax benefits of an uncertain tax position is permitted only to the extent the position is “more likely than not” to be sustained assuming examination by taxing authorities. Management has analyzed the Fund’s tax positions taken on federal, state and local income tax returns for all open tax years (for up to three tax years), and has concluded that no provisions for federal, state and local income tax are required in the Fund’s financial statements. The Fund’s federal, state and local income and federal excise tax returns for tax years for which the applicable statutes of limitations have not expired are subject to examination by the Internal Revenue Service and state and local departments of revenue.
(C) Dividends and Distributions to Shareholders. Dividends and distributions are recorded on the ex-dividend date. The Fund intends to declare and pay dividends from net investment income, if any, at least monthly and distributions from net realized capital and currency gains, if any, at least annually. Unless the shareholder elects otherwise, all dividends and distributions are reinvested in the same class of shares of the Fund, at NAV. Dividends and distributions to shareholders are determined in accordance with federal income tax regulations and may differ from GAAP.
Notes to Financial Statements (continued)
(D) Security Transactions and Investment Income. The Fund records security transactions on the trade date. Realized gains and losses on security transactions are determined using the identified cost method. Dividend income is recognized on the ex-dividend date; net of any foreign tax withheld at the source, and interest income is accrued as earned using the effective interest rate method. Discounts and premiums on securities purchased, other than Short-Term Investments, for the Fund are accreted and amortized, respectively, on the effective interest rate method over the life of the respective securities. Discounts and premiums on Short-Term Investments are accreted and amortized, respectively, on the straight-line method. The straight-line method approximates the effective interest method for Short-Term investments. Income from payment-in-kind securities is accreted daily based on the effective interest method.
Investment income and realized and unrealized gains and losses on investments of the Fund are allocated to separate classes of shares pro rata based upon their relative net assets on the date the income is earned or realized and unrealized gains and losses are incurred.
The Fund may place a debt security on non-accrual status and reduce related interest income by ceasing current accruals and writing off all or a portion of any interest receivables when the collection of all or a portion of such interest has become doubtful. A debt security is removed from non-accrual status when the issuer resumes interest payments or when collectability of interest is reasonably assured.
(E) Expenses. Expenses of the Trust are allocated to the individual Funds in proportion to the net assets of the respective Funds when the expenses are incurred, except where direct allocations of expenses can be made. Expenses (other than transfer agent expenses and fees incurred under the shareholder services plans and/or the distribution plans further discussed in Note 3(B)) are allocated to separate classes of shares pro rata based upon their relative net assets on the date the expenses are incurred. The expenses borne by the Fund, including those of related parties to the Fund, are shown in the Statement of Operations.
(F) Use of Estimates. In preparing financial statements in conformity with GAAP, management makes estimates and assumptions that affect the reported amounts and disclosures in the financial statements. Actual results could differ from those estimates.
(G) Repurchase Agreements. The Fund may enter into repurchase agreements to earn income. The Fund may enter into repurchase agreements only with financial institutions that are deemed by the Manager or Subadvisor to be creditworthy, pursuant to guidelines established by the Board. During the term of any repurchase agreement, the Manager or Subadvisor will continue to monitor the creditworthiness of the seller. Under the 1940 Act, repurchase agreements are considered to be collateralized loans by the Fund to the seller secured by the securities transferred to the Fund.
When the Fund enters into repurchase agreements, the Fund’s custodian takes possession of the collateral pledged for investments in the repurchase agreement. The underlying collateral is valued daily on a mark to market basis to determine if the value, including accrued interest, exceeds the repurchase price. In the event of the seller’s default on the obligation to repurchase, the Fund has the right to liquidate the collateral and apply the proceeds in satisfaction of the
obligation. Under certain circumstances, such as in the event of default or bankruptcy by the counterparty to the agreement, realization and/or retention of the collateral may be subject to legal proceedings and possible realized loss to the Fund.
(H) Loan Assignments, Participations and Commitments. The Fund may invest in loan assignments and participations (“loans”). Commitments are agreements to make money available to a borrower in a specified amount, at a specified rate and within a specified time. The Fund records an investment when the borrower withdraws money on a commitment or when a funded loan is purchased (trade date) and records interest as earned. These loans pay interest at rates that are periodically reset by reference to a base lending rate plus a spread. These base lending rates are generally the prime rate offered by a designated U.S. bank or the London InterBank Offered Rate.
The loans in which the Fund may invest are generally readily marketable, but may be subject to some restrictions on resale. For example, the Fund may be contractually obligated to receive approval from the agent bank and/or borrower prior to the sale of these investments. If the Fund purchases an assignment from a lender, the Fund will generally have direct contractual rights against the borrower in favor of the lender. If the Fund purchases a participation interest either from a lender or a participant, the Fund typically will have established a direct contractual relationship with the seller of the participation interest, but not with the borrower. Consequently, the Fund is subject to the credit risk of the lender or participant who sold the participation interest to the Fund, in addition to the usual credit risk of the borrower. In the event that the borrower, selling participant or intermediate participants become insolvent or enters into bankruptcy, the Fund may incur certain costs and delays in realizing payment, or may suffer a loss of principal and/or interest.
Unfunded commitments represent the remaining obligation of the Fund to the borrower. At any point in time, up to the maturity date of the issue, the borrower may demand the unfunded portion. Unfunded amounts, if any, are marked to market and any unrealized gains or losses are recorded in the Statement of Assets and Liabilities. As of October 31, 2016, the Fund did not hold any unfunded commitments.
(I) Foreign Currency Transactions. The Fund’s books and records are maintained in U.S. dollars. Prices of securities denominated in foreign currency amounts are translated into U.S. dollars at the mean between the buying and selling rates last quoted by any major U.S. bank at the following dates:
| (i) | market value of investment securities, other assets and liabilities—at the valuation date; and |
| (ii) | purchases and sales of investment securities, income and expenses—at the date of such transactions. |
The assets and liabilities that are denominated in foreign currency amounts are presented at the exchange rates and market values at the close of the period. The realized and unrealized changes in net assets arising from fluctuations in exchange rates and market prices of securities are not separately presented.
Net realized gain (loss) on foreign currency transactions represents net gains and losses on foreign currency forward contracts, net currency gains or losses realized as a result of differences between the amounts
| | |
| 36 | | MainStay High Yield Corporate Bond Fund |
of securities sale proceeds or purchase cost, dividends, interest and withholding taxes as recorded on the Fund’s books, and the U.S. dollar equivalent amount actually received or paid. Net currency gains or losses from valuing such foreign currency denominated assets and liabilities, other than investments at valuation date exchange rates, are reflected in unrealized foreign exchange gains or losses.
(J) Securities Lending. In order to realize additional income, the Fund may engage in securities lending, subject to the limitations set forth in the 1940 Act and relevant guidance by the staff of the Securities and Exchange Commission (“SEC”). In the event the Fund does engage in securities lending, the Fund will lend through its custodian, State Street Bank and Trust Company (“State Street”). State Street will manage the Fund’s cash collateral in accordance with the lending agreement between the Fund and State Street, and indemnify the Fund against counterparty risk. The loans will be collateralized by cash or securities at least equal at all times to the market value of the securities loaned. Collateral will consist of U.S. government securities, cash equivalents or irrevocable letters of credit. The Fund may bear the risk of delay in recovery of, or loss of rights in, the securities loaned should the borrower of the securities experience financial difficulty. The Fund may also record a realized gain or loss on securities deemed sold due to a borrower’s inability to return securities on loan. The Fund bears the risk of any loss on investment of the collateral. The Fund will receive compensation for lending its securities in the form of fees or it will retain a portion of interest on the investment of any cash received as collateral. The Fund will also continue to receive interest and dividends on the securities loaned and any gain or loss in the market price of the securities loaned that may occur during the term of the loan will be for the account of the Fund. During the year ended October 31, 2016, the Fund did not have any portfolio securities on loan.
(K) Restricted Securities. Restricted securities, as disclosed in Note 5, are securities which have been purchased through a private offering and cannot be resold to the general public without prior registration under the Securities Act of 1933, as amended. Disposal of these securities may involve time-consuming negotiations and expenses, and it may be difficult to obtain a prompt sale at an acceptable price.
(L) Risk. The Fund’s principal investments include high-yield debt securities (commonly referred to as “junk bonds”), which are considered speculative because they present a greater risk of loss, including default, than higher quality debt securities. These securities pay investors a premium—a higher interest rate or yield than investment grade debt securities—because of the increased risk of loss. These securities can also be subject to greater price volatility. In times of unusual or adverse market, economic or political conditions, these securities may experience higher than normal default rates.
The Fund may invest in foreign securities, which carry certain risks that are in addition to the usual risks inherent in domestic securities. These risks include those resulting from currency fluctuations, future adverse political or economic developments and possible imposition of currency exchange blockages or other foreign governmental laws or restrictions. These risks are likely to be greater in emerging markets than in developed markets. The ability of issuers of debt securities held by the Fund to meet their obligations may be affected by economic or political developments in a specific country, industry or region.
The Fund may invest in loans which are usually rated below investment grade and are generally considered speculative because they present a greater risk of loss, including default, than higher rated debt securities. These investments pay investors a higher interest rate than investment grade debt securities because of the increased risk of loss. Although certain loans are collateralized, there is no guarantee that the value of the collateral will be sufficient to repay the loan. In a recession or serious credit event, the value of these investments could decline significantly. As a result, the Fund’s NAV could go down and you could lose money.
In addition, loan assignments generally are subject to the extended settlement periods that may be longer than seven days. As a result, the Fund may be adversely affected by selling other investments at an unfavorable time and/or under unfavorable conditions or engaging in borrowing transactions, such as borrowing against its credit facility, to raise cash to meet redemption obligations or pursue other investment opportunities.
(M) Indemnifications. Under the Trust’s organizational documents, its officers and trustees are indemnified against certain liabilities that may arise out of performance of their duties to the Trust. Additionally, in the normal course of business, the Fund enters into contracts with third-party service providers that contain a variety of representations and warranties and which may provide general indemnifications. The Fund’s maximum exposure under these arrangements is unknown, as this would involve future claims that may be made against the Fund that have not yet occurred. Based on experience, management is of the view that the risk of loss in connection with these potential indemnification obligations is remote. However, there can be no assurance that material liabilities related to such obligations will not arise in the future, which could adversely impact the Fund.
Note 3–Fees and Related Party Transactions
(A) Manager and Subadvisor. New York Life Investments, a registered investment adviser and an indirect, wholly-owned subsidiary of New York Life Insurance Company (“New York Life”), serves as the Fund’s Manager, pursuant to an Amended and Restated Management Agreement (“Management Agreement”). The Manager provides offices, conducts clerical, recordkeeping and bookkeeping services, and keeps most of the financial and accounting records required to be maintained by the Fund. Except for the portion of salaries and expenses that are the responsibility of the Fund, the Manager pays the salaries and expenses of all personnel affiliated with the Fund and certain operational expenses of the Fund. The Fund reimburses New York Life Investments in an amount equal to a portion of the compensation of the Chief Compliance Officer of the Fund. MacKay Shields LLC (“MacKay Shields” or the “Subadvisor”), a registered investment adviser and an indirect, wholly-owned subsidiary of New York Life, serves as Subadvisor to the Fund and is responsible for the day-to-day portfolio management of the Fund. Pursuant to the terms of the Amended and Restated Subadvisory Agreement (“Subadvisory Agreement”) between New York Life Investments and MacKay Shields, New York Life Investments pays for the services of the Subadvisor.
Under the Management Agreement, the Fund pays the Manager a monthly fee for services performed and facilities furnished at an annual rate of the Fund’s average daily net assets as follows: 0.60% up to
Notes to Financial Statements (continued)
$500 million; 0.55% from $500 million up to $5 billion; 0.525% from $5 billion up to $7 billion; and 0.50% in excess of $7 billion, plus a fee for fund accounting services previously provided by New York Life Investments under a separate fund accounting agreement furnished at an annual rate of the Fund’s average daily net assets as follows: 0.05% up to $20 million; 0.0333% from $20 million to $100 million; and 0.01% in excess of $100 million. During the year ended October 31, 2016, the effective management fee rate was 0.55% inclusive of a fee for fund accounting services of 0.01% of the Fund’s average daily net assets.
During the year ended October 31, 2016, New York Life Investments earned fees from the Fund in the amount of $49,795,088.
State Street provides sub-administration and sub-accounting services to the Fund pursuant to an agreement with New York Life Investments. These services include calculating the daily NAVs of the Fund, maintaining the general ledger and sub-ledger accounts for the calculation of the Fund’s NAVs, and assisting New York Life Investments in conducting various aspects of the Fund’s administrative operations. For providing these services to the Fund, State Street is compensated by New York Life Investments.
(B) Distribution, Service and Shareholder Service Fees. The Trust, on behalf of the Fund, has entered into a distribution agreement with NYLIFE Distributors LLC (the “Distributor”), an indirect, wholly-owned subsidiary of New York Life. The Fund has adopted distribution plans (the “Plans”) in accordance with the provisions of Rule 12b-1 under the 1940 Act.
Pursuant to the Class A, Investor Class and Class R2 Plans, the Distributor receives a monthly distribution fee from the Class A, Investor Class and Class R2 shares at an annual rate of 0.25% of the average daily net assets of the Class A, Investor Class and Class R2 shares for distribution and/or service activities as designated by the Distributor. Pursuant to the Class B and Class C Plans, Class B and Class C shares pay the Distributor a monthly distribution fee at an annual rate of 0.75% of the average daily net assets of the Class B and Class C shares, along with a service fee at an annual rate of 0.25% of the average daily net assets of the Class B and Class C shares, for a total 12b-1 fee of 1.00%. Pursuant to the Class R3 Plan, the Distributor receives a monthly distribution and/or service fee from the Class R3 shares at an annual rate of 0.50% of the average daily net assets of the Class R3 shares. Class I, Class R1 and Class R6 shares are not subject to a distribution and/or service fee.
The Plans provide that the distribution and service fees are payable to the Distributor regardless of the amounts actually expended by the Distributor for distribution of the Fund’s shares and service activities.
In accordance with the Shareholder Services Plans for the Class R1, Class R2 and Class R3 shares, the Manager has agreed to provide, through its affiliates or independent third parties, various shareholder and administrative support services to shareholders of the Class R1, Class R2 and Class R3 shares. For its services, the Manager, its affiliates, or independent third party service providers are entitled to a shareholder service fee accrued daily and paid monthly at an annual rate of 0.10% of the average daily net assets of the Class R1, Class R2 and Class R3 shares. This is in addition to any fees paid under a distribution plan, where applicable.
During the year ended October 31, 2016, shareholder service fees incurred by the Fund were as follows:
| | | | |
Class R1 | | $ | 46 | |
Class R2 | | | 9,372 | |
Class R3 | | | 52 | |
(C) Sales Charges. During the year ended October 31, 2016, the Fund was advised by the Distributor that the amount of initial sales charges retained on sales of Class A and Investor Class shares were $746,772 and $88,234, respectively. During the year ended October 31, 2016, the Fund was also advised that the Distributor retained CDSCs on redemptions of Class A, Investor Class, Class B and Class C shares of $26,189, $49, $172,544 and $48,958, respectively.
(D) Transfer, Dividend Disbursing and Shareholder Servicing Agent. NYLIM Service Company LLC, an affiliate of New York Life Investments, is the Fund’s transfer, dividend disbursing and shareholder servicing agent pursuant to an agreement between NYLIM Service Company LLC and the Trust. NYLIM Service Company LLC has entered into an agreement with Boston Financial Data Services, Inc. (“BFDS”) pursuant to which BFDS performs certain transfer agent services on behalf of NYLIM Service Company LLC. During the year ended October 31, 2016, transfer agent expenses incurred by the Fund were as follows:
| | | | |
Class A | | $ | 4,000,611 | |
Investor Class | | | 556,109 | |
Class B | | | 260,167 | |
Class C | | | 1,277,425 | |
Class I | | | 5,697,418 | |
Class R1 | | | 55 | |
Class R2 | | | 11,323 | |
Class R3 | | | 61 | |
(E) Small Account Fee. Shareholders with small accounts adversely impact the cost of providing transfer agency services. In an effort to reduce total transfer agency expenses, the Fund has implemented a small account fee on certain types of accounts. Certain shareholders with an account balance of less than $1,000 are charged an annual per account fee of $20 (assessed semi-annually), the proceeds from which offset transfer agent fees as reflected in the Statement of Operations.
(F) Capital. As of October 31, 2016, New York Life and its affiliates beneficially held shares of the Fund with values and percentages of net assets as follows:
| | | | | | | | |
Class I | | $ | 1,369,580 | | | | 0.0 | %‡ |
Class R1 | | | 32,481 | | | | 55.4 | |
Class R3 | | | 28,897 | | | | 22.3 | |
| ‡ | Less than one-tenth of a percent. |
| | |
| 38 | | MainStay High Yield Corporate Bond Fund |
Note 4–Federal Income Tax
As of October 31, 2016, the components of accumulated gain (loss) on a tax basis were as follows:
| | | | | | | | | | | | | | | | |
Ordinary
Income | | Accumulated Capital and Other Gain (Loss) | | | Other
Temporary
Differences | | | Unrealized
Appreciation
(Depreciation) | | | Total
Accumulated
Gain (Loss) | |
| $— | | $ | (267,684,684) | | | $ | (9,151,418) | | | $ | 167,904,472 | | | $ | (108,931,630) | |
The difference between book-basis and tax-basis unrealized appreciation (depreciation) is primarily due to wash sale adjustments and adjustments on grantor trusts. The other temporary differences are primarily due to dividends payable and defaulted bond income accruals.
The following table discloses the current year reclassifications between undistributed net investment income (loss), accumulated net realized gain (loss) on investments, and additional paid-in capital arising from permanent differences; net assets as of October 31, 2016 were not affected.
| | | | | | | | |
Undistributed
Net Investment
Income (Loss) | | Accumulated
Net Realized
Gain (Loss) on
Investments | | | Additional
Paid-In
Capital | |
| $4,540,185 | | $ | (4,540,185 | ) | | $ | — | |
The reclassifications for the Fund are primarily due to defaulted bonds, return of capital distributions received and trust preferred securities.
As of October 31, 2016, for federal income tax purposes, capital loss carryforwards of $267,684,684 were available as shown in the table below, to the extent provided by the regulations to offset future realized gains of the Fund through the years indicated. To the extent that these capital loss carryforwards are used to offset future capital gains, it is probable that the capital gains so offset will not be distributed to shareholders. No capital gain distributions shall be made until any capital loss carryforwards have been fully utilized.
| | | | | | | | |
Capital Loss
Available Through | | Short-Term
Capital Loss
Amounts (000’s) | | | Long-Term
Capital Loss
Amounts (000’s) | |
| Unlimited | | $ | 55,991 | | | $ | 211,694 | |
During the years ended October 31, 2016 and October 31, 2015, the tax character of distributions paid as reflected in the Statements of Changes in Net Assets was as follows:
| | | | | | | | |
| | | 2016 | | | 2015 | |
Distributions paid from: | | | | | | | | |
Ordinary Income | | $ | 559,080,469 | | | $ | 485,519,349 | |
Return of Capital | | | 38,774,198 | | | | 78,013,538 | |
Total | | $ | 597,854,667 | | | $ | 563,532,887 | |
Note 5–Restricted Securities
As of October 31, 2016, the Fund held the following restricted securities:
| | | | | | | | | | | | | | | | | | | | |
Security | | Date(s) of
Acquisition | | | Principal
Amount/
Shares | | | Cost | | | 10/31/16 Value | | | Percent
of Net
Assets | |
Affinity Gaming LLC
Common Stock | | | 5/4/12 | | | | 275,000 | | | $ | 3,093,750 | | | $ | 4,056,250 | | | | 0.0 | %‡ |
Chesapeake Energy Corp. (Escrow Claim Shares)
Corporate Bond
6.775%, due 3/15/19 | | | 11/26/14 | | | $ | 15,000,000 | | | | — | | | | 4,800,000 | | | | 0.0 | ‡ |
Exide Technologies
Common Stock | | | 4/30/15 | | | | 1,416,537 | | | | 53,286,096 | | | | 4,164,619 | | | | 0.1 | |
Exide Technologies (Escrow Claim Shares)
Corporate Bond
8.625%, due 2/1/18 | | | 8/28/15 | | | $ | 64,863,000 | | | | — | | | | 64,863 | | | | 0.0 | ‡ |
ION Media Networks, Inc.
Common Stock | | | 3/12/10-12/20/10 | | | | 2,267 | | | | 3,435 | | | | 1,213,706 | | | | 0.0 | ‡ |
Majestic Star Casino LLC
Membership Units Common Stock | | | 12/1/11 | | | | 446,020 | | | | 892,040 | | | | 55,753 | | | | 0.0 | ‡ |
Neenah Enterprises, Inc.
Common Stock | | | 7/29/10 | | | | 717,799 | | | | 6,079,758 | | | | 7,902,967 | | | | 0.1 | |
Neenah Foundry Co.
Term Loan Loan Assignment
6.75%, due 4/26/17 | | | 5/10/13 | | | $ | 14,157,816 | | | | 14,080,325 | | | | 14,016,238 | | | | 0.2 | |
Sterling Entertainment Enterprises LLC
Corporate Bond
9.75%, due 12/31/19 | | | 12/21/12 | | | $ | 35,000,000 | | | | 35,000,000 | | | | 36,312,500 | | | | 0.3 | |
Upstate New York Power Producers, Inc.
Common Stock | | | 5/11/99-2/28/11 | | | | 343,590 | | | | — | | | | 412,308 | | | | 0.0 | ‡ |
Total | | | | | | | | | | $ | 112,435,404 | | | $ | 72,999,204 | | | | 0.7 | % |
| ‡ | Less than one-tenth of a percent. |
Notes to Financial Statements (continued)
Note 6–Custodian
State Street is the custodian of cash and securities held by the Fund. Custodial fees are charged to the Fund based on the Fund’s net assets and/or the market value of securities held by the Fund and the number of certain transactions incurred by the Fund.
Note 7–Line of Credit
The Fund and certain other funds managed by New York Life Investments, maintain a line of credit with a syndicate of banks in order to secure a source of funds for temporary purposes to meet unanticipated or excessive redemption requests.
Effective August 2, 2016, under an amended and restated credit agreement (the “Credit Agreement”), the aggregate commitment amount is $600,000,000 with an additional uncommitted amount of $100,000,000. The commitment fee is an annual rate of 0.15% of the average commitment amount payable quarterly, regardless of usage, to Bank of New York Mellon, who serves as the agent to the syndicate. The commitment fee is allocated among the Fund and certain affiliated funds based upon their respective net assets and other factors. Interest on any revolving credit loan is charged based upon the Federal Funds Advances Rate or the one month London InterBank Offered Rate, whichever is higher. The Credit Agreement expires on August 1, 2017, although the Fund, certain affiliated funds and the syndicate of banks may renew the Credit Agreement for an additional year on the same or different terms. Prior to August 2, 2016, the aggregate commitment amount was $600,000,000 with an additional uncommitted amount of $100,000,000, and the commitment fee was at an annual rate of 0.10% of the average commitment amount. During the year ended October 31, 2016, there were no borrowings made or outstanding with respect to the Fund under the Credit Agreement.
Note 8–Interfund Lending Program
Pursuant to an exemptive order issued by the SEC, the Fund, along with certain other funds managed by New York Life Investments, may participate in an interfund lending program. The interfund lending program provides an alternate credit facility that permits the Fund and certain other funds managed by New York Life Investments to lend or borrow money for temporary purposes directly to or from one another, subject to the conditions of the exemptive order. During the year ended October 31, 2016, there were no interfund loans made or outstanding with respect to the Fund.
Note 9–Purchases and Sales of Securities (in 000’s)
During the year ended October 31, 2016, purchases and sales of securities, other than short-term securities, were $3,846,955 and $3,511,844, respectively.
The Fund may purchase securities from or sell to other funds managed by the Subadvisor. These interportfolio transactions are primarily used for cash management purposes and are made pursuant to Rule 17a-7 of the 1940 Act. During the year ended October 31, 2016, such purchases were $52,191.
Note 10–Capital Share Transactions
| | | | | | | | |
Class A | | Shares | | | Amount | |
Year ended October 31, 2016: | | | | | | | | |
Shares sold | | | 130,915,748 | | | $ | 720,686,459 | |
Shares issued to shareholders in reinvestment of dividends and distributions | | | 33,685,999 | | | | 184,730,015 | |
Shares redeemed | | | (153,877,032 | ) | | | (842,188,666 | ) |
| | | | |
Net increase (decrease) in shares outstanding before conversion | | | 10,724,715 | | | | 63,227,808 | |
Shares converted into Class A (See Note 1) | | | 6,586,070 | | | | 36,684,855 | |
Shares converted from Class A (See Note 1) | | | (2,417,783 | ) | | | (13,325,048 | ) |
| | | | |
Net increase (decrease) | | | 14,893,002 | | | $ | 86,587,615 | |
| | | | |
Year ended October 31, 2015: | | | | | | | | |
Shares sold | | | 145,603,396 | | | $ | 843,020,988 | |
Shares issued to shareholders in reinvestment of dividends and distributions | | | 32,920,868 | | | | 188,297,147 | |
Shares redeemed | | | (196,228,275 | ) | | | (1,126,601,715 | ) |
| | | | |
Net increase (decrease) in shares outstanding before conversion | | | (17,704,011 | ) | | | (95,283,580 | ) |
Shares converted into Class A (See Note 1) | | | 3,625,771 | | | | 20,853,918 | |
Shares converted from Class A (See Note 1) | | | (2,424,134 | ) | | | (13,745,855 | ) |
| | | | |
Net increase (decrease) | | | (16,502,374 | ) | | $ | (88,175,517 | ) |
| | | | | | | | |
| | |
| | | | | | | | |
Investor Class | | Shares | | | Amount | |
Year ended October 31, 2016: | | | | | | | | |
Shares sold | | | 5,564,916 | | | $ | 30,690,421 | |
Shares issued to shareholders in reinvestment of dividends
and distributions | | | 3,020,971 | | | | 16,697,863 | |
Shares redeemed | | | (6,767,282 | ) | | | (37,177,796 | ) |
| | | | |
Net increase (decrease) in shares
outstanding before conversion | | | 1,818,605 | | | | 10,210,488 | |
Shares converted into Investor Class (See Note 1) | | | 3,236,349 | | | | 17,925,599 | |
Shares converted from Investor Class (See Note 1) | | | (5,624,893 | ) | | | (31,728,974 | ) |
| | | | |
Net increase (decrease) | | | (569,939 | ) | | $ | (3,592,887 | ) |
| | | | |
Year ended October 31, 2015: | | | | | | | | |
Shares sold | | | 4,131,903 | | | $ | 24,025,968 | |
Shares issued to shareholders in reinvestment of dividends and distributions | | | 2,890,081 | | | | 16,677,878 | |
Shares redeemed | | | (7,353,027 | ) | | | (42,701,530 | ) |
| | | | |
Net increase (decrease) in shares
outstanding before conversion | | | (331,043 | ) | | | (1,997,684 | ) |
Shares converted into Investor Class (See Note 1) | | | 3,683,129 | | | | 21,184,403 | |
Shares converted from Investor Class (See Note 1) | | | (2,652,860 | ) | | | (15,413,711 | ) |
| | | | |
Net increase (decrease) | | | 699,226 | | | $ | 3,773,008 | |
| | | | |
| | |
| | | | | | | | |
| | |
| 40 | | MainStay High Yield Corporate Bond Fund |
| | | | | | | | |
Class B | | Shares | | | Amount | |
Year ended October 31, 2016: | | | | | | | | |
Shares sold | | | 2,688,143 | | | $ | 14,680,378 | |
Shares issued to shareholders in reinvestment of dividends
and distributions | | | 1,205,109 | | | | 6,569,476 | |
Shares redeemed | | | (4,067,471 | ) | | | (22,072,134 | ) |
| | | | |
Net increase (decrease) in shares
outstanding before conversion | | | (174,219 | ) | | | (822,280 | ) |
Shares converted from Class B
(See Note 1) | | | (1,825,863 | ) | | | (9,965,188 | ) |
| | | | |
Net increase (decrease) | | | (2,000,082 | ) | | $ | (10,787,468 | ) |
| | | | |
Year ended October 31, 2015: | | | | | | | | |
Shares sold | | | 2,303,100 | | | $ | 13,186,027 | |
Shares issued to shareholders in reinvestment of dividends
and distributions | | | 1,331,822 | | | | 7,582,582 | |
Shares redeemed | | | (5,447,055 | ) | | | (31,118,556 | ) |
| | | | |
Net increase (decrease) in shares
outstanding before conversion | | | (1,812,133 | ) | | | (10,349,947 | ) |
Shares converted from Class B
(See Note 1) | | | (2,251,668 | ) | | | (12,878,755 | ) |
| | | | |
Net increase (decrease) | | | (4,063,801 | ) | | $ | (23,228,702 | ) |
| | | | |
| | |
| | | | | | | | |
Class C | | Shares | | | Amount | |
Year ended October 31, 2016: | | | | | | | | |
Shares sold | | | 19,993,040 | | | $ | 109,180,450 | |
Shares issued to shareholders in reinvestment of dividends and distributions | | | 5,440,054 | | | | 29,703,583 | |
Shares redeemed | | | (28,986,251 | ) | | | (157,020,782 | ) |
| | | | |
Net increase (decrease) in shares
outstanding before conversion | | | (3,553,157 | ) | | | (18,136,749 | ) |
Shares converted from Class C
(See Note 1) | | | (250,206 | ) | | | (1,309,730 | ) |
| | | | |
Net increase (decrease) | | | (3,803,363 | ) | | $ | (19,446,479 | ) |
| | | | | | | | |
Year ended October 31, 2015: | | | | | | | | |
Shares sold | | | 15,167,686 | | | $ | 86,868,866 | |
Shares issued to shareholders in reinvestment of dividends and distributions | | | 5,650,404 | | | | 32,165,255 | |
Shares redeemed | | | (31,470,366 | ) | | | (179,795,494 | ) |
| | | | |
Net increase (decrease) | | | (10,652,276 | ) | | $ | (60,761,373 | ) |
| | | | |
| | |
| | | | | | | | |
| | | | | | | | |
Class I | | Shares | | | Amount | |
Year ended October 31, 2016: | | | | | | | | |
Shares sold | | | 423,497,847 | | | $ | 2,324,352,976 | |
Shares issued to shareholders in reinvestment of dividends and distributions | | | 54,903,299 | | | | 301,284,721 | |
Shares redeemed | | | (422,665,098 | ) | | | (2,300,125,238 | ) |
| | | | |
Net increase (decrease) in shares
outstanding before conversion | | | 55,736,048 | | | | 325,512,459 | |
Shares converted into Class I
(See Note 1) | | | 307,287 | | | | 1,718,486 | |
| | | | |
Net increase (decrease) | | | 56,043,335 | | | $ | 327,230,945 | |
| | | | |
Year ended October 31, 2015: | | | | | | | | |
Shares sold | | | 457,597,569 | | | $ | 2,647,544,637 | |
Shares issued to shareholders in reinvestment of dividends and distributions | | | 45,040,797 | | | | 257,291,267 | |
Shares redeemed | | | (267,882,426 | ) | | | (1,541,389,780 | ) |
| | | | |
Net increase (decrease) | | | 234,755,940 | | | $ | 1,363,446,124 | |
| | | | |
| | |
| | | | | | | | |
Class R1 | | Shares | | | Amount | |
Year ended October 31, 2016: | | | | | | | | |
Shares sold | | | 2,945 | | | $ | 16,389 | |
Shares issued to shareholders in reinvestment of dividends and distributions | | | 555 | | | | 3,049 | |
Shares redeemed | | | (336 | ) | | | (1,869 | ) |
| | | | |
Net increase (decrease) | | | 3,164 | | | $ | 17,569 | |
| | | | |
Year ended October 31, 2015: | | | | | | | | |
Shares sold | | | 2,132 | | | $ | 12,087 | |
Shares issued to shareholders in reinvestment of dividends and distributions | | | 371 | | | | 2,118 | |
Shares redeemed | | | (417 | ) | | | (2,426 | ) |
| | | | |
Net increase (decrease) | | | 2,086 | | | $ | 11,779 | |
| | | | |
| | |
| | | | | | | | |
Class R2 | | Shares | | | Amount | |
Year ended October 31, 2016: | | | | |
Shares sold | | | 718,136 | | | $ | 3,974,621 | |
Shares issued to shareholders in reinvestment of dividends and distributions | | | 75,552 | | | | 413,789 | |
Shares redeemed | | | (701,992 | ) | | | (3,758,039 | ) |
| | | | |
Net increase (decrease) | | | 91,696 | | | $ | 630,371 | |
| | | | |
Year ended October 31, 2015: | | | | | | | | |
Shares sold | | | 502,307 | | | $ | 2,865,187 | |
Shares issued to shareholders in reinvestment of dividends and distributions | | | 75,932 | | | | 434,182 | |
Shares redeemed | | | (631,881 | ) | | | (3,642,029 | ) |
| | | | | | | | |
Net increase (decrease) | | | (53,642 | ) | | $ | (342,660 | ) |
| | | | |
| | |
| | | | | | | | |
Notes to Financial Statements (continued)
| | | | | | | | |
Class R3 | | Shares | | | Amount | |
Period ended October 31, 2016 (a): | | | | | | | | |
Shares sold | | | 21,955 | | | $ | 120,612 | |
Shares issued to shareholders in reinvestment of dividends and distributions | | | 606 | | | | 3,415 | |
| | | | | | | | |
Net increase (decrease) | | | 22,561 | | | $ | 124,027 | |
| | | | |
|
(a) Inception date was February 29, 2016. | |
| | |
| | | | | | | | |
Class R6 | | Shares | | | Amount | |
Year ended October 31, 2016: | | | | | | | | |
Shares sold | | | 7,558,759 | | | $ | 41,981,723 | |
Shares issued to shareholders in reinvestment of dividends and distributions | | | 372,597 | | | | 2,072,720 | |
Shares redeemed | | | (1,267,059 | ) | | | (6,999,447 | ) |
| | | | | | | | |
Net increase (decrease) | | | 6,664,297 | | | $ | 37,054,996 | |
| | | | | | | | |
Year ended October 31, 2015: | | | | | | | | |
Shares sold | | | 1,759,140 | | | $ | 10,082,691 | |
Shares issued to shareholders in reinvestment of dividends and distributions | | | 151,151 | | | | 863,825 | |
Shares redeemed | | | (749,408 | ) | | | (4,322,504 | ) |
| | | | | | | | |
Net increase (decrease) | | | 1,160,883 | | | $ | 6,624,012 | |
| | | | | | | | |
Note 11–Recent Accounting Pronouncement
In October 2016, the SEC adopted new rules and amended existing rules (together, “final rules”) intended to modernize the reporting and disclosure of information by registered investment companies. In part, the final rules amend Regulation S-X and require standardized, enhanced disclosure about derivatives in investment company financial statements, as well as other amendments. The compliance date for the amendments to Regulation S-X is August 1, 2017. Management is currently evaluating the impact that the adoption of the amendments to Regulation S-X will have on the Fund’s financial statements and related disclosures.
Note 12–Litigation
On December 23, 2014, Cynthia Ann Redus-Tarchis and others filed a complaint against New York Life Investments in the United States District Court for the District of New Jersey. The complaint was brought derivatively on behalf of the MainStay Large Cap Growth Fund, the MainStay High Yield Corporate Bond Fund and another fund previously managed by New York Life Investments and alleges that New York Life Investments violated Section 36(b) of the 1940 Act by charging excessive investment management fees. The plaintiffs seek monetary
damages and other relief from New York Life Investments. New York Life Investments believes the case has no merit, and intends to vigorously defend the matter.
On May 6, 2015, a second amended complaint was filed which, among other things, added MainStay High Yield Opportunities Fund as an additional Fund on whose behalf the complaint was brought. New York Life Investments filed a motion to dismiss the amended complaint. This motion was denied on October 28, 2015. New York Life Investments filed an answer to the amended complaint on November 30, 2015. Discovery in the case has commenced.
Note 13–Subsequent Events
In connection with the preparation of the financial statements of the Fund as of and for the fiscal year ended October 31, 2016, events and transactions subsequent to October 31, 2016, through the date the financial statements were issued have been evaluated by the Fund’s management for possible adjustment and/or disclosure. No subsequent events requiring financial statement adjustment or disclosure have been identified other than the following:
Effective February 28, 2017, Class B shares of the MainStay Group of Funds will be closed to all new purchases as well as additional investments by existing Class B shareholders. Existing Class B shareholders may continue to reinvest dividends and capital gains distributions, as well as exchange their Class B shares for Class B shares of other Funds as permitted by the current exchange privileges. Class B shareholders will continue to be subject to any applicable contingent deferred sales charge at the time of redemption. All other features of the Class B shares, including but not limited to the fees and expenses applicable to Class B shares, will remain unchanged. Unless redeemed, Class B Shares shareholders will remain in Class B shares of their respective Fund until the Class B shares are converted to Class A or Investor Class shares pursuant to the applicable conversion schedule.
At a meeting held on November 1-2, 2016, the Board of Trustees approved an Agreement and Plan of Reorganization providing for the acquisition of the assets and liabilities of the MainStay High Yield Opportunities Fund (the “Fund”) by MainStay High Yield Corporate Bond Fund (the “Acquiring Fund”), a series of The MainStay Funds, in exchange for shares of the Acquiring Fund, followed by the complete liquidation of the Fund (the “Reorganization”).
The Reorganization does not require shareholder approval and you are not being asked to vote on the Reorganization. In December, shareholders who own shares of the Fund as of the record date will receive an Information Statement/Prospectus containing further information regarding the Acquiring Fund and the Reorganization which is scheduled to take place on or about February 17, 2017.
| | |
| 42 | | MainStay High Yield Corporate Bond Fund |
Report of Independent Registered Public Accounting Firm
The Board of Trustees and Shareholders of
The MainStay Funds:
We have audited the accompanying statement of assets and liabilities, including the portfolio of investments, of the MainStay High Yield Corporate Bond Fund (the “Fund”), one of the funds constituting The MainStay Funds, as of October 31, 2016, and the related statement of operations for the year then ended, the statements of changes in net assets for each of the years in the two-year period then ended, and the financial highlights for each of the years or periods in the five-year period then ended. These financial statements and financial highlights are the responsibility of the Fund’s management. Our responsibility is to express an opinion on these financial statements and financial highlights based on our audits.
We conducted our audits in accordance with the standards of the Public Company Accounting Oversight Board (United States). Those standards require that we plan and perform the audit to obtain reasonable assurance about whether the financial statements and financial highlights are free of material misstatement. An audit includes examining, on a test basis, evidence supporting the amounts and disclosures in the financial statements. Our procedures included confirmation of securities owned as of October 31, 2016, by correspondence with the custodian and brokers or by other appropriate auditing procedures where replies from brokers were not received. An audit also includes assessing the accounting principles used and significant estimates made by management, as well as evaluating the overall financial statement presentation. We believe that our audits provide a reasonable basis for our opinion.
In our opinion, the financial statements and financial highlights referred to above present fairly, in all material respects, the financial position of the MainStay High Yield Corporate Bond Fund of The MainStay Funds as of October 31, 2016, the results of its operations for the year then ended, the changes in its net assets for each of the years in the two-year period then ended, and the financial highlights for each of the years or periods in the five-year period then ended, in conformity with U.S. generally accepted accounting principles.

Philadelphia, Pennsylvania
December 22, 2016
Federal Income Tax Information
(Unaudited)
The Fund is required under the Internal Revenue Code to advise shareholders in a written statement as to the federal tax status of dividends paid by the Fund during such fiscal years.
For the fiscal year ended October 31, 2016, the Fund designated approximately $241,574 under the Internal Revenue Code as qualified dividend income eligible for reduced tax rates.
In February 2017, shareholders will receive an IRS Form 1099-DIV or substitute Form 1099 which will show the federal tax status of the distributions received by shareholders in calendar year 2016. The amounts that will be reported on such 1099-DIV or substitute Form 1099 will be the amounts you are to use on your federal income tax return and will differ from the amounts which we must report for the Fund’s fiscal year ended October 31, 2016.
Proxy Voting Policies and Procedures and Proxy Voting Record
A description of the policies and procedures that New York Life Investments uses to vote proxies related to the Fund’s securities is available without charge, upon request, (i) by visiting the Fund’s website at mainstayinvestments.com; or (ii) on the SEC’s website at www.sec.gov.
The Fund is required to file with the SEC its proxy voting record for the 12-month period ending June 30 on Form N-PX. The Fund’s most recent Form N-PX or proxy voting record is available free of charge upon request (i) by calling 800-MAINSTAY (624-6782); (ii) by visiting the Fund’s website at mainstayinvestments.com; or (iii) on the SEC’s website at www.sec.gov.
Shareholder Reports and Quarterly Portfolio Disclosure
The Fund is required to file its complete schedule of portfolio holdings with the SEC for its first and third fiscal quarters on Form N-Q. The Fund’s Form N-Q is available without charge on the SEC’s website at www.sec.gov or by calling MainStay Investments at 800-MAINSTAY (624-6782). You also can obtain and review copies of Form N-Q by visiting the SEC’s Public Reference Room in Washington, DC (information on the operation of the Public Reference Room may be obtained by calling 1-800-SEC-0330).
| | |
| 44 | | MainStay High Yield Corporate Bond Fund |
Board of Trustees and Officers (Unaudited)
The Trustees and officers of the Funds are listed below. The Board oversees the MainStay Group of Funds, MainStay VP Funds Trust, MainStay DefinedTerm Municipal Opportunities Fund, the Manager and the Subadvisors, and elects the officers of the Funds who are responsible for the day-to-day operations of the Funds. Information pertaining to the Trustees and officers is set forth below. Each Trustee serves until his or her successor is elected and qualified or until his or her resignation, death or removal. Under the Retirement Policy, a Trustee must
tender his or her resignation by the end of the calendar year during which he or she reaches the age of 75 (although the Board of Trustees may make exceptions from time to time). Officers serve a term of one year and are elected annually by the Board of Trustees. The business address of each Trustee and officer listed below is 51 Madison Avenue, New York, New York 10010. A majority of the Trustees are not “interested persons” (as defined by the 1940 Act and rules “adopted” by the SEC thereunder) of the Fund (“Independent Trustees”).
| | | | | | | | | | | | |
| | | | | Name and Date of Birth | | Term of Office, Position(s) Held and Length of Service | | Principal Occupation(s) During Past Five Years | | Number of
Portfolios in
Fund Complex
Overseen by
Board Member | | Other Directorships Held By Board Member |
| Interested Trustee | | | | Christopher O. Blunt* 5/13/62 | | MainStay Funds: Trustee since January 2016; MainStay Funds Trust: Trustee since January 2016. | | Executive Vice President (since 2009), President, Investments Group (since 2015), Member of the Executive Management Committee (since 2007), Co-President, Insurance and Agency Group (2012 to 2015), President, Insurance Group (2012 to 2014), Executive Vice President, Retirement Income Security (2008 to 2012), New York Life Insurance Company. | | 83 | | MainStay VP Funds Trust:
Trustee since January 2016 (31 portfolios); and
MainStay DefinedTerm Municipal Opportunities Fund: Trustee since January 2016. |
| | * | This Trustee is considered to be an “interested person” of the MainStay Group of Funds within the meaning of the 1940 Act because of his affiliation with New York Life Insurance Company, New York Life Investment Management LLC, Cornerstone Capital Management Holdings LLC, MacKay Shields LLC, Institutional Capital LLC, NYL Investors LLC, NYLIFE Securities LLC and/or NYLIFE Distributors LLC, as described in detail above in the column entitled “Principal Occupation(s) During Past Five Years.” |
| | | | | | | | | | | | |
| | | | | Name and Date of Birth | | Term of Office, Position(s) Held and Length of Service | | Principal Occupation(s) During Past Five Years | | Number of Portfolios in Fund Complex Overseen by Board Member | | Other Directorships Held By Board Member |
| Non-Interested Trustee | | | | David H. Chow 12/29/57 | | MainStay Funds: Trustee since January 2016, Advisory Board Member (June 2015 to December 2015); MainStay Funds Trust: Trustee since January 2016, Advisory Board Member (June 2015 to December 2015). | | Founder and CEO, DanCourt Management, LLC (since 1999) | | 83 | | MainStay VP Funds Trust: Trustee since January 2016, Advisory Board Member (June 2015 to December 2015); (31 portfolios);
MainStay DefinedTerm Municipal Opportunities Fund: Trustee since January 2016, Advisory Board Member (June 2015 to December 2015);
Market Vectors Group of Exchange-Traded Funds: Independent Chairman of the Board of Trustees since 2008 and Trustee since 2006 (55 portfolios); and
Berea College of Kentucky: Trustee since 2009. |
| | | | Susan B. Kerley 8/12/51 | | MainStay Funds: Trustee since 2007; MainStay Funds Trust: Trustee since 1990.*** | | President, Strategic Management Advisors LLC (since 1990) | | 83 | | MainStay VP Funds Trust: Trustee since 2007 (31 portfolios)**;
MainStay DefinedTerm Municipal Opportunities Fund: Trustee since 2011; and Legg Mason Partners Funds: Trustee since 1991 (53 portfolios). |
| | | | Alan R. Latshaw 3/27/51 | | MainStay Funds: Trustee and Audit Committee Financial Expert since 2006; MainStay Funds Trust: Trustee and Audit Committee Financial Expert since 2007.*** | | Retired; Partner, Ernst & Young LLP (2002 to 2003); Partner, Arthur Andersen LLP (1989 to 2002); Consultant to the MainStay Funds Audit and Compliance Committee (2004 to 2006) | | 83 | | MainStay VP Funds Trust: Trustee and Audit Committee Financial Expert since 2007 (31 portfolios)**;
MainStay DefinedTerm Municipal Opportunities Fund: Trustee and Audit Committee Financial Expert since 2011;
State Farm Associates Funds Trusts: Trustee since 2005 (4 portfolios);
State Farm Mutual Fund Trust: Trustee since 2005 (15 portfolios); and
State Farm Variable Product Trust: Trustee since 2005 (9 portfolios). |
| | | | Peter Meenan 12/5/41 | | MainStay Funds: Chairman since 2013 and Trustee since 2007; MainStay Funds Trust: Chairman since 2013 and Trustee since 2002.*** | | Retired; Independent Consultant (2004 to 2013); President and Chief Executive Officer, Babson—United, Inc. (financial services firm) (2000 to 2004); Independent Consultant (1999 to 2000); Head of Global Funds, Citicorp (1995 to 1999) | | 83 | | MainStay VP Funds Trust: Chairman since 2013 and Trustee since 2007 (31 portfolios)**; and
MainStay DefinedTerm Municipal Opportunities Fund: Chairman since 2013 and Trustee since 2011. |
| | | | Richard H. Nolan, Jr. 11/16/46 | | MainStay Funds: Trustee since 2007; MainStay Funds Trust: Trustee since 2007.*** | | Managing Director, ICC Capital Management (since 2004); President—Shields/Alliance, Alliance Capital Management (1994 to 2004) | | 83 | | MainStay VP Funds Trust: Trustee since 2006 (31 portfolios)**; and
MainStay DefinedTerm Municipal Opportunities Fund: Trustee since 2011. |
| | | | Jacques P. Perold 5/12/58 | | MainStay Funds: Trustee since January 2016, Advisory Board Member (June 2015 to December 2015); MainStay Funds Trust: Trustee since January 2016, Advisory Board Member (June 2015 to December 2015). | | Retired; President, Fidelity Management & Research Company (2009 to 2014); Founder, President and Chief Executive Officer, Geode Capital Management, LCC (2001 to 2009) | | 83 | | MainStay VP Funds Trust: Trustee since January 2016, Advisory Board Member (June 2015 to December 2015); (31 portfolios);
MainStay DefinedTerm Municipal Opportunities Fund: Trustee since January 2016, Advisory Board Member (June 2015 to December 2015);
Allstate Corporation: Director since 2015; and
Boston University: Trustee since 2014. |
| | |
| 46 | | MainStay High Yield Corporate Bond Fund |
| | | | | | | | | | | | |
| | | | | Name and Date of Birth | | Term of Office, Position(s) Held and Length of Service | | Principal Occupation(s) During Past Five Years | | Number of Portfolios in Fund Complex Overseen by Board Member | | Other Directorships Held By Board Member |
Non-Interested Trustee | | | | Richard S. Trutanic 2/13/52 | | MainStay Funds: Trustee since 1994; MainStay Funds Trust: Trustee since 2007.*** | | Chairman and Chief Executive Officer, Somerset & Company (financial advisory firm) (since 2004); Managing Director, The Carlyle Group (private investment firm) (2002 to 2004); Senior Managing Director, Partner and Board Member, Groupe Arnault S.A. (private investment firm) (1999 to 2002) | | 83 | | MainStay VP Funds Trust: Trustee since 2007 (31 portfolios)**; and
MainStay DefinedTerm Municipal Opportunities Fund: Trustee since 2011. |
| | | | John A. Weisser**** 10/22/41 | | MainStay Funds: Trustee since 2007; MainStay Funds Trust: Trustee since 2007.*** | | Retired; Managing Director of Salomon Brothers, Inc. (1971 to 1995) | | 83 | | MainStay VP Funds Trust: Trustee since 1997 (31 portfolios)**; MainStay DefinedTerm Municipal Opportunities Fund: Trustee since 2011; Direxion Insurance Trust: Trustee since 2007 (1 portfolio); Direxion Funds: Trustee since 2007 (18 portfolios); and Direxion Shares ETF Trust: Trustee since 2008 (52 portfolios). |
| | ** | Includes prior service as a Director of MainStay VP Series Fund, Inc., the predecessor to MainStay VP Funds Trust. |
| | *** | Includes prior service as a Director/Trustee of certain predecessor entities to MainStay Funds Trust. |
| | **** | Pursuant to the Retirement Policy, Mr. Weisser will retire from the Board of Trustees on or about December 31, 2016. |
| | | | | | | | |
| | | | | Name and Date of Birth | | Position(s) Held and Length of Service | | Principal Occupation(s) During Past Five Years |
Officers (Who Are Not Board Members)* | | | | Stephen P. Fisher 2/22/59 | | President, MainStay Funds (since 2007), MainStay Funds Trust (since 2009) | | Chairman and Chief Executive Officer (since 2014), President and Chief Operating Officer (2008 to 2013), NYLIFE Distributors LLC; Chairman of the Board, NYLIM Service Company LLC (since 2008); President (since May 2015), Co-President (2014 to 2015) and Senior Managing Director (since 2005), New York Life Investment Management LLC; President, MainStay DefinedTerm Municipal Opportunities Fund (since 2011) and MainStay VP Funds Trust (since 2007)** |
| | | | Jack R. Benintende 5/12/64 | | Treasurer and Principal Financial and Accounting Officer, MainStay Funds (since 2007), MainStay Funds Trust (since 2009) | | Managing Director, New York Life Investment Management LLC (since 2007); Treasurer and Principal Financial and Accounting Officer, MainStay DefinedTerm Municipal Opportunities Fund (since 2011) and MainStay VP Funds Trust (since 2007)**; and Assistant Treasurer, New York Life Investment Management Holdings LLC (2008 to 2012) |
| | | | Kevin M. Bopp 2/24/69 | | Vice President and Chief Compliance Officer, MainStay Funds and MainStay Funds Trust (since 2014) | | Chief Compliance Officer (since January 2016), Director and Associate General Counsel (2011 to 2014) and Vice President and Assistant General Counsel (2010 to 2011), New York Life Investment Management LLC; Vice President and Chief Compliance Officer, MainStay VP Funds Trust, MainStay DefinedTerm Municipal Opportunities Fund (since 2014); Assistant Secretary, MainStay Funds, MainStay Funds Trust and MainStay VP Funds Trust (2010 to 2014)**, MainStay DefinedTerm Municipal Opportunities Fund (2011 to 2014) |
| | | | J. Kevin Gao 10/13/67 | | Secretary and Chief Legal Officer, MainStay Funds and MainStay Funds Trust (since 2010) | | Managing Director and Associate General Counsel, New York Life Investment Management LLC (since 2010); Secretary and Chief Legal Officer, MainStay DefinedTerm Municipal Opportunities Fund (since 2011) and MainStay VP Funds Trust (since 2010)** |
| | | | Scott T. Harrington 2/8/59 | | Vice President— Administration, MainStay Funds (since 2005), MainStay Funds Trust (since 2009) | | Director, New York Life Investment Management LLC (including predecessor advisory organizations) (since 2000); Member of the Board of Directors, New York Life Trust Company (since 2009); Vice President—Administration, MainStay DefinedTerm Municipal Opportunities Fund (since 2011) and MainStay VP Funds Trust (since 2005)** |
| | * | The Officers listed above are considered to be “interested persons” of the MainStay Group of Funds within the meaning of the 1940 Act because of their affiliation with the MainStay Group of Funds, New York Life Insurance Company and/or its affiliates, including New York Life Investment Management LLC, NYLIM Service Company LLC, NYLIFE Securities LLC and/or NYLIFE Distributors LLC, as described in detail in the column captioned “Principal Occupation(s) During Past Five Years.” Officers are elected annually by the Board to serve a one year term. |
| | ** | Includes prior service as an Officer of MainStay VP Series Fund, Inc., the predecessor to MainStay VP Funds Trust. |
| | |
| 48 | | MainStay High Yield Corporate Bond Fund |
This page intentionally left blank
This page intentionally left blank
MainStay Funds
MainStay offers a wide range of Funds for virtually any investment need. The full array of MainStay open-end offerings is listed here, with information about the manager, subadvisors, legal counsel and independent registered public accounting firm.
Equity
U.S. Equity
MainStay Common Stock Fund
MainStay Cornerstone Growth Fund
MainStay Epoch U.S. All Cap Fund
MainStay Epoch U.S. Equity Yield Fund
MainStay Epoch U.S. Small Cap Fund
MainStay ICAP Equity Fund
MainStay ICAP Select Equity Fund
MainStay Large Cap Growth Fund
MainStay MAP Fund
MainStay S&P 500 Index Fund
MainStay U.S. Equity Opportunities Fund
International/Global Equity
MainStay Emerging Markets Opportunities Fund
MainStay Epoch Capital Growth Fund
MainStay Epoch Global Choice Fund
MainStay Epoch Global Equity Yield Fund
MainStay Epoch International Small Cap Fund
MainStay ICAP International Fund
MainStay International Equity Fund
MainStay International Opportunities Fund
Income
Taxable Bond
MainStay Floating Rate Fund
MainStay Global High Income Fund
MainStay Government Fund
MainStay High Yield Corporate Bond Fund
MainStay High Yield Opportunities Fund
MainStay Indexed Bond Fund
MainStay Short Duration High Yield Fund
MainStay Total Return Bond Fund
MainStay Unconstrained Bond Fund
Municipal/Tax Advantaged Bond
MainStay California Tax Free Opportunities Fund1
MainStay High Yield Municipal Bond Fund
MainStay New York Tax Free Opportunities Fund2
MainStay Tax Advantaged Short Term Bond Fund
MainStay Tax Free Bond Fund
Money Market
MainStay Money Market Fund
Mixed Asset
MainStay Balanced Fund
MainStay Convertible Fund
MainStay Income Builder Fund
Alternative
MainStay Absolute Return Multi-Strategy Fund
MainStay Cushing Energy Income Fund
MainStay Cushing MLP Premier Fund
MainStay Cushing Renaissance Advantage Fund
Asset Allocation/Target Date
MainStay Conservative Allocation Fund
MainStay Growth Allocation Fund
MainStay Moderate Allocation Fund
MainStay Moderate Growth Allocation Fund
MainStay Retirement 2010 Fund
MainStay Retirement 2020 Fund
MainStay Retirement 2030 Fund
MainStay Retirement 2040 Fund
MainStay Retirement 2050 Fund
MainStay Retirement 2060 Fund
Manager
New York Life Investment Management LLC
New York, New York
Subadvisors
Candriam France S.A.S.3
Paris, France
Cornerstone Capital Management Holdings LLC3
New York, New York
Cushing Asset Management, LP
Dallas, Texas
Epoch Investment Partners, Inc.
New York, New York
Institutional Capital LLC3
Chicago, Illinois
MacKay Shields LLC3
New York, New York
Markston International LLC
White Plains, New York
NYL Investors LLC3
New York, New York
Winslow Capital Management, LLC
Minneapolis, Minnesota
Legal Counsel
Dechert LLP
Washington, District of Columbia
Independent Registered Public Accounting Firm
KPMG LLP
Philadelphia, Pennsylvania
1. This Fund is only registered for sale in AZ, CA, MI (Class A and Class I shares only), NV, OR, TX, UT and WA.
2. This Fund is only registered for sale in CA, CT, DE, FL, MA, NJ, NY and VT.
3. An affiliate of New York Life Investment Management LLC.
Not part of the Annual Report
For more information
800-MAINSTAY (624-6782)
mainstayinvestments.com
MainStay Investments® is a registered service mark and name under which New York Life Investment Management LLC does business. MainStay Investments, an indirect subsidiary of New York Life Insurance Company, New York, NY 10010, provides investment advisory products and services. The MainStay Funds® are managed by New York Life Investment Management LLC and distributed by NYLIFE Distributors LLC, 30 Hudson Street, Jersey City, NJ 07302, a wholly owned subsidiary of New York Life Insurance Company. NYLIFE Distributors LLC is a Member FINRA/SIPC.
©2016 NYLIFE Distributors LLC. All rights reserved.
| | | | | | | | |
| Not FDIC/NCUA Insured | | Not a Deposit | | May Lose Value | | No Bank Guarantee | | Not Insured by Any Government Agency |
| | |
| 1717584 MS316-16 | | MSHY11-12/16 (NYLIM) NL212 |
MainStay Money Market Fund
Message from the President and Annual Report
October 31, 2016


This page intentionally left blank
Message from the President
During the 12 months ended October 31, 2016, the U.S. stock and bond markets were somewhat volatile but generally ended the reporting period in positive territory. In the fall of 2015 and early 2016, the market appeared to be focused on China’s economic weakness and a prolonged decline in oil prices. Although energy-related companies felt the brunt of these setbacks, the stock market as a whole declined until mid-February, when oil prices began to rise and stocks began a relatively steady recovery.
In late June, the United Kingdom voted to leave the European Union in a referendum popularly known as “Brexit.” The news caused a temporary slump in stocks around the world. Although the British pound dropped in value following the vote, stocks generally recovered through the end of the reporting period. As the end of the reporting period approached, speculation about the upcoming U.S. presidential election heightened market volatility.
According to FTSE-Russell data, U.S. stocks as a whole tended to provide positive returns during the reporting period, with large-capitalization stocks generally outperforming stocks of smaller companies. Value stocks outpaced growth stocks at all capitalization levels, with the largest differences among small- to mid-cap stocks.
International and emerging-market stocks provided mixed performance. Rocked by Brexit, European stocks as a whole declined during the reporting period, while stocks in the Asia-Pacific region (with or without Japan) tended to provide positive returns. International stocks as a whole declined, while global stocks advanced slightly. Emerging-market stocks were considerably stronger, boosted by advances in India and Latin America and higher prices for oil, metals and other commodities.
Anticipation of a possible Federal Reserve rate hike led to volatility in the bond market, but the Federal Open Market Committee chose not to raise the federal funds target rate during the reporting period. Short-term U.S. Treasury yields rose during the reporting period, and longer-term U.S. Treasury yields declined. Overall, the U.S. bond market provided positive returns, with longer-term bonds generally outperforming shorter-term securities. High-yield bonds, particularly
longer-term issues, were strong performers. Municipal bonds generally provided positive single-digit total returns for the 12 months ended October 31, 2016.
Central banks around the world remained highly accommodative during the reporting period, particularly in light of Brexit. Shortly after the U.K. referendum, more than a third of all sovereign debt carried negative yields. As an asset class, emerging-market bonds provided double-digit positive returns during the reporting period, and world bonds as a whole provided positive single-digit positive returns.
At MainStay, we know that political, economic and market events may influence the performance of your Fund investments. While our portfolio managers often pay close attention to such events, their primary emphasis is seeking to invest for the long-term investment needs of our shareholders. With this in mind, they seek to pursue the investment objectives of their respective Funds using the principal investment strategies and investment processes outlined in the prospectus. By placing your assets in the care of our investment professionals, you gain access to their extensive market insight, strategic investment discipline and in-depth experience in risk-management over a wide range of market cycles.
The report that follows provides more detailed information about the market forces, portfolio strategies and individual securities that influenced the performance of your MainStay Fund during the 12 months ended October 31, 2016. We invite you to read the report carefully as part of your personal investment-review process.
We thank you for your business, and we look forward to a continuing relationship as you pursue your long-range financial goals.
Sincerely,

Stephen P. Fisher
President
The opinions expressed are as of the date of this report and are subject to change. There is no guarantee that any forecast made will come to pass. This material does not constitute investment advice and is not intended as an endorsement of any specific investment. Past performance is no guarantee of future results.
Not part of the Annual Report
Table of Contents
An investment in the Fund is not insured or guaranteed by the Federal Deposit Insurance Corporation or any other government agency. Although the Fund seeks to preserve the value of your investment at $1.00 per share, it is possible to lose money by investing in the Fund. The Fund’s sponsor has no legal obligation to provide financial support to the Fund, and you should not expect that the sponsor will provide financial support at any time. The Fund may impose a fee upon the sale of your shares or may temporarily suspend your ability to sell shares if the Fund’s liquidity falls below required minimums because of market conditions or other factors.
Investors should refer to the Fund’s Summary Prospectus and/or Prospectus and consider the Fund’s investment objectives, strategies, risks, charges and expenses carefully before investing. The Summary Prospectus and/or Prospectus contain this and other information about the Fund. You may obtain copies of the Fund’s Summary Prospectus, Prospectus and Statement of Additional Information free of charge, upon request, by calling toll-free 800-MAINSTAY (624-6782), by writing to NYLIFE Distributors LLC, Attn: MainStay Marketing Department, 30 Hudson Street, Jersey City, NJ 07302 or by sending an e-mail to MainStayShareholderServices@nylim.com. These documents are also available via the MainStay Funds’ website at mainstayinvestments.com/documents. Please read the Summary Prospectus and/or Prospectus carefully before investing.
Investment and Performance Comparison1 (Unaudited)
Performance data quoted represents past performance. Past performance is no guarantee of future results. Because of market volatility and other factors, current performance may be lower or higher than the figures shown. Investment return and principal value will fluctuate, and as a result, when shares are redeemed, they may be worth more or less than their original cost. The graph below depicts the historical performance of Class B shares of the Fund. Performance will vary from class to class based on differences in class-specific expenses. For performance information current to the most recent month-end, please call 800-MAINSTAY (624-6782) or visit mainstayinvestments.com.
An investment in the Fund is not insured or guaranteed by the Federal Deposit Insurance Corporation or any other government agency. Although the Fund seeks to preserve the value of your investment at $1.00 per share, it is possible to lose money by investing in the Fund.
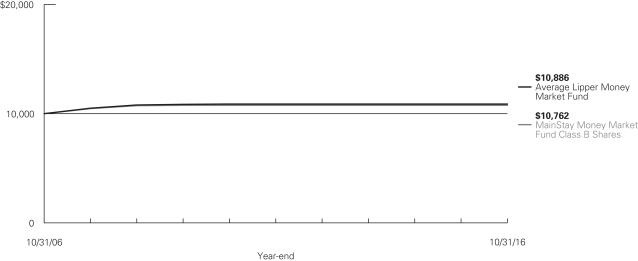
Average Annual Total Returns for the Year Ended October 31, 2016
| | | | | | | | | | | | | | | | | | |
| Class | | Sales Charge | | One Year | | | Five Years | | | Ten Years | | | Gross Expense Ratio2 | |
| Class A Shares3 | | No Sales Charge | | | 0.01 | % | | | 0.01 | % | | | 0.75 | % | | | 0.64 | % |
| Investor Class Shares3,4 | | No Sales Charge | | | 0.01 | | | | 0.01 | | | | 0.73 | | | | 0.87 | |
| Class B Shares3 | | No Sales Charge | | | 0.01 | | | | 0.01 | | | | 0.74 | | | | 0.87 | |
| Class C Shares3 | | No Sales Charge | | | 0.01 | | | | 0.01 | | | | 0.74 | | | | 0.87 | |
| | | | |
| 7-Day Current Yield: 0.02% | | | | | | | | | | | | | | | | |
| 1. | The performance table and graph do not reflect the deduction of taxes that a shareholder would pay on distributions or Fund share redemptions. Total returns reflect maximum applicable sales charges as indicated in the table above, if any, changes in share price, and reinvestment of dividend and capital gain distributions. The graph assumes the initial investment amount shown above and reflects the deduction of all sales charges that would have applied for the period of investment. Performance figures may reflect certain fee waivers and/or expense limitations, without which total returns would have been lower. For more information on share classes and current fee waivers and/or expense limitations (if any), please refer to the notes to the financial statements. |
| 2. | The gross expense ratios presented reflect the Fund’s “Total Annual Fund Operating Expenses” from the most recent Prospectus and may differ from other expense ratios disclosed in this report. |
| 3. | As of October 31, 2016, MainStay Money Market Fund had an effective 7-day yield of 0.02% for Class A, Investor Class, B and C shares. The 7-day |
| | current yield was 0.02% for Class A, Investor Class, Class B and C shares. These yields reflect certain expense limitations. Had these expense limitations not been in effect, the effective 7-day yield would have been –0.33%, –0.49%, –0.49% and –0.49%, for Class A, Investor Class, Class B and C shares, respectively, and the 7-day current yield would have been –0.33%, –0.49%, –0.49% and –0.49%, for Class A, Investor Class, Class B and C shares, respectively. The current yield reflects the Fund’s earnings better than the Fund’s total return. |
| 4. | Performance figures for Investor Class shares, first offered on February 28, 2008, include the historical performance of Class A shares through February 27, 2008, adjusted for differences in certain fees and expenses. Unadjusted, the performance shown for the Investor Class shares would likely have been different. |
The footnote on the next page is an integral part of the table and graph and should be carefully read in conjunction with them.
| | | | | | | | | | | | |
| Benchmark Performance | | One
Year | | | Five
Years | | | Ten
Years | |
Average Lipper Money Market Fund5 | | | 0.11 | % | | | 0.04 | % | | | 0.85 | % |
| 5. | The Average Lipper Money Market Fund is an equally weighted performance average adjusted for capital gains distributions and income dividends of all of the money market funds in the Lipper Universe. Lipper Inc., a wholly-owned subsidiary of Thomson Reuters, is an independent monitor of mutual |
| | fund performance. Results do not reflect any deduction of sales charges. Lipper averages are not class specific. Lipper returns are unaudited. Results are based on average total returns of similar funds with all dividend and capital gain distributions reinvested. |
The footnotes on the preceding page are an integral part of the table and graph and should be carefully read in conjunction with them.
| | |
| 6 | | MainStay Money Market Fund |
Cost in Dollars of a $1,000 Investment in MainStay Money Market Fund (Unaudited)
The example below is intended to describe the fees and expenses borne by shareholders during the six-month period from May 1, 2016, to October 31, 2016, and the impact of those costs on your investment.
Example
As a shareholder of the Fund, you incur two types of costs: (1) transaction costs, including exchange fees and sales charges (loads) on purchases (as applicable), and (2) ongoing costs, including management fees, distribution and/or service (12b-1) fees, and other Fund expenses (as applicable). This example is intended to help you understand your ongoing costs (in dollars) of investing in the Fund and to compare these costs with the ongoing costs of investing in other mutual funds. The example is based on an investment of $1,000 made at the beginning of the six-month period and held for the entire period from May 1, 2016, to October 31, 2016.
This example illustrates your Fund’s ongoing costs in two ways:
Actual Expenses
The second and third data columns in the table below provide information about actual account values and actual expenses. You may use the information in these columns, together with the amount you invested, to estimate the expenses that you paid during the six months ended October 31, 2016. Simply divide your account value by $1,000 (for example, an $8,600 account value divided by $1,000 = 8.6), then
multiply the result by the number under the heading entitled “Expenses Paid During Period” to estimate the expenses you paid on your account during this period.
Hypothetical Example for Comparison Purposes
The fourth and fifth data columns in the table below provide information about hypothetical account values and hypothetical expenses based on the Fund’s actual expense ratio and an assumed rate of return of 5% per year before expenses, which is not the Fund’s actual return. The hypothetical account values and expenses may not be used to estimate the actual ending account balances or expenses you paid for the six-month period shown. You may use this information to compare the ongoing costs of investing in the Fund with the ongoing costs of investing in other Funds. To do so, compare this 5% hypothetical example with the 5% hypothetical examples that appear in the shareholder reports of the other Funds.
Please note that the expenses shown in the table are meant to highlight your ongoing costs only and do not reflect any transactional costs, such as exchange fees or sales charges (loads). Therefore, the fourth and fifth data columns of the table are useful in comparing ongoing costs only and will not help you determine the relative total costs of owning different funds. In addition, if these transactional costs were included, your costs would have been higher.
| | | | | | | | | | | | | | | | | | | | |
| | | | | | | | | | | | | | | | |
| Share Class | | Beginning
Account
Value
5/1/16 | | | Ending Account
Value (Based
on Actual
Returns and
Expenses)
10/31/16 | | | Expenses
Paid
During
Period1 | | | Ending Account
Value (Based
on Hypothetical
5% Annualized
Return and
Actual Expenses)
10/31/16 | | | Expenses
Paid
During
Period1 | |
| | | | | |
| Class A Shares | | $ | 1,000.00 | | | $ | 1,000.10 | | | $ | 2.56 | | | $ | 1,022.60 | | | $ | 2.59 | |
| | | | | |
| Investor Class Shares | | $ | 1,000.00 | | | $ | 1,000.10 | | | $ | 2.56 | | | $ | 1,022.60 | | | $ | 2.59 | |
| | | | | |
| Class B Shares | | $ | 1,000.00 | | | $ | 1,000.10 | | | $ | 2.56 | | | $ | 1,022.60 | | | $ | 2.59 | |
| | | | | |
| Class C Shares | | $ | 1,000.00 | | | $ | 1,000.10 | | | $ | 2.56 | | | $ | 1,022.60 | | | $ | 2.59 | |
| 1. | Expenses are equal to the Fund’s annualized expense ratio of each class (0.51% for Class A, 0.51% for Investor Class, and 0.51% for Class B and Class C) multiplied by the average account value over the period, divided by 366 and multiplied by 184 (to reflect the six-month period). The table above represents the actual expenses incurred during the six-month period. |
Portfolio Composition as of October 31, 2016 (Unaudited)

See Portfolio of Investments beginning on page 10 for specific holdings within these categories.
| ‡ | Less than one-tenth of a percent. |
| | |
| 8 | | MainStay Money Market Fund |
Portfolio Management Discussion and Analysis (Unaudited)
Questions answered by portfolio managers Thomas J. Girard and David E. Clement, CFA, of NYL Investors LLC, the Fund’s Subadvisor.
How did MainStay Money Market Fund perform relative to its peers during the 12 months ended October 31, 2016?
As of October 31, 2016, MainStay Money Market Fund provided a 7-day current yield of 0.02% for Class A, Investor Class, Class B and Class C shares. As of the same date, the Fund provided a 7-day effective yield of 0.02% for all share classes. For the 12 months ended October 31, 2016, all share classes returned 0.01%. All share classes underperformed the 0.11% return of the Average Lipper1 Money Market Fund for the 12 months ended October 31, 2016. Performance figures for the Fund reflect certain fee waivers and/or expense limitations without which total returns would have been lower.
Were there any changes to the Fund during the reporting period?
Effective October 14, 2016, MainStay Money Market Fund began to operate as a “retail money market fund” as defined under Rule 2a-7 under the Investment Company Act of 1940, as amended. As a result, the Fund’s principal investment strategies, principal risks, and certain other shareholder servicing policies were revised to reflect the regulatory requirements for “retail money market funds.” For more information on these changes, please see the prospectus supplements dated June 24, 2016, and August 16, 2016.
What factors affected the Fund’s performance during the reporting period?
The Fund’s performance was affected by the uncertainty surrounding ongoing money-market reform, which continued to create an environment that was challenging for the short-term market: U.S. Treasury bill demand could be materially influenced and altered, funding levels for corporate issuers had the potential to be dramatically changed, and the magnitude of the impact on future money fund cash flows and assets were speculative at best. This uncertainty led the Fund—and many other money market funds—to increase liquidity in preparation for potential outflows. With a yield curve2 that was upward sloping during the reporting period, this increase in liquidity detracted from the overall yield of the Fund.
What was the Fund’s duration3 strategy during the reporting period?
The Fund’s duration strategy during the reporting period was to increase the available liquidity of the Fund. We accomplished
this higher level of liquidity by shortening the Fund’s duration from 46 days to 29 days during the reporting period.
What specific factors, risks or market forces prompted significant decisions for the Fund during the reporting period?
Two factors influenced significant decisions during the reporting period. The first was the widespread anticipation throughout the reporting period that the Federal Reserve might move to tighten interest rates. The second factor was ongoing money-market reform. These factors influenced the Fund’s decision to shorten duration and to increase U.S. Treasury holdings as we sought to take advantage of an anticipated increase in the federal funds target rate. The increase failed to materialize during the reporting period. These factors also led us to increase the Fund’s liquidity.
During the reporting period, which market segments were the strongest contributors to the Fund’s performance and which market segments were particularly weak?
During the reporting period, certificates of deposit were strong contributors to the Fund’s performance. (Contributions take weightings and total returns into account.) U.S. Treasury bills were one of the weaker sectors from a yield perspective. As we increased the Fund’s liquidity, however, we decreased our holdings in these securities because they typically have longer maturities of six months to one year.
Did the Fund make any significant purchases or sales during the reporting period?
The Fund made a number of investments in certificates of deposit during the reporting period. Among these were a State Street Bank and Trust floating-rate CD due 4/13/2017 and a Bank of Montreal Chicago Branch 0.90% coupon due 12/13/2016. There were no significant sales during the reporting period.
How did the Fund’s sector weightings change during the reporting period?
The Fund increased its sector weightings in U.S. Treasury securities and commercial paper during the reporting period. During the 12 months ended October 31, 2016, the Fund decreased its sector weighting in certificates of deposit.
| 1. | See footnote on page 6 for more information on Lipper Inc. |
| 2. | The yield curve is a line that plots the yields of various securities of similar quality—typically U.S. Treasury issues—across a range of maturities. The U.S. Treasury yield curve serves as a benchmark for other debt and is used in economic forecasting. |
| 3. | Duration is a measure of the price sensitivity of a fixed-income investment to changes in interest rates. Duration is expressed as a number of days or years and is considered a more accurate sensitivity gauge than average maturity. |
The opinions expressed are those of the portfolio managers as of the date of this report and are subject to change. There is no guarantee that any forecasts made will come to pass. This material does not constitute investment advice and is not intended as an endorsement of any specific investment.
Portfolio of Investments October 31, 2016
| | | | | | | | |
| | | Principal
Amount | | | Amortized
Cost | |
| Short-Term Investments 100.0%† | | | | | |
Certificates of Deposit 10.3% | | | | | | | | |
Bank of America N.A.
0.886%, due 11/16/16 | | $ | 5,000,000 | | | $ | 5,000,000 | |
Bank of Montreal
0.90%, due 12/13/16 | | | 5,000,000 | | | | 5,000,000 | |
Canadian Imperial Bank of Commerce
1.155%, due 12/5/16 (a) | | | 10,000,000 | | | | 10,000,923 | |
Chase Bank USA N.A.
1.215%, due 5/26/17 (a) | | | 4,000,000 | | | | 4,000,000 | |
State Street Bank & Trust Co. | | | | | | | | |
0.979%, due 3/10/17 (a) | | | 5,000,000 | | | | 5,000,000 | |
1.278%, due 4/13/17 (a) | | | 5,000,000 | | | | 5,000,000 | |
Toronto-Dominion Bank (The)
1.214%, due 4/6/17 (a) | | | 5,000,000 | | | | 5,000,000 | |
| | | | | | | | |
| | | | | | | 39,000,923 | |
| | | | | | | | |
Financial Company Commercial Paper 9.9% | |
Bank Of Nova Scotia (The)
0.396%, due 11/2/16 (b)(c) | | | 5,000,000 | | | | 4,999,903 | |
Commonwealth Bank of Australia
0.98%, due 2/9/17 (a)(b)(c) | | | 5,000,000 | | | | 5,000,000 | |
CPPIB Capital, Inc.
0.436%, due 11/22/16 (b)(c) | | | 5,000,000 | | | | 4,998,746 | |
JPMorgan Securities LLC
1.20%, due 1/17/17 (b)(c) | | | 5,000,000 | | | | 5,000,000 | |
National Rural Utilities Cooperative Finance Corp.
0.406%, due 11/1/16 (b) | | | 5,000,000 | | | | 5,000,000 | |
Nationwide Life Insurance Co. | | | | | | | | |
0.413%, due 11/4/16 (b)(c) | | | 5,000,000 | | | | 4,999,833 | |
0.437%, due 11/14/16 (b)(c) | | | 2,500,000 | | | | 2,499,512 | |
Private Export Funding Corp.
0.766%, due 3/6/17 (b)(c) | | | 5,000,000 | | | | 4,982,639 | |
| | | | | | | | |
| | | | | | | 37,480,633 | |
| | | | | | | | |
Other Commercial Paper 46.1% | | | | | | | | |
American Honda Finance Corp. | | | | | | | | |
0.345%, due 11/4/16 (b) | | | 5,000,000 | | | | 4,999,750 | |
0.568%, due 1/10/17 (b) | | | 4,600,000 | | | | 4,594,187 | |
Apple, Inc.
0.389%, due 12/13/16 (b)(c) | | | 3,000,000 | | | | 2,998,460 | |
Archer-Daniels-Midland Co.
0.426%, due 11/8/16 (b)(c) | | | 6,000,000 | | | | 5,999,510 | |
Archer-Daniels-Midland Co.
0.447%, due 11/17/16 (b)(c) | | | 5,000,000 | | | | 4,999,067 | |
Army and Air Force Exchange Service
0.477%, due 12/5/16 (b)(c) | | | 5,000,000 | | | | 4,997,781 | |
Atmos Energy Corp.
0.531%, due 12/19/16 (b)(c) | | | 3,000,000 | | | | 2,996,800 | |
| | | | | | | | |
| | | Principal
Amount | | | Amortized
Cost | |
Other Commercial Paper (continued) | | | | | | | | |
Automatic Data Processing, Inc.
0.426%, due 11/3/16 (b)(c) | | $ | 5,000,000 | | | $ | 4,999,883 | |
Caterpillar Financial Services Corp. | | | | | | | | |
0.34%, due 11/3/16 (b) | | | 5,000,000 | | | | 4,999,870 | |
0.37%, due 11/9/16 (b) | | | 5,000,000 | | | | 4,999,500 | |
Caterpillar, Inc.
0.42%, due 11/21/16 (b)(c) | | | 5,000,000 | | | | 4,998,639 | |
Coca-Cola Co. (The) | | | | | | | | |
0.436%, due 11/30/16 (b)(c) | | | 5,000,000 | | | | 4,998,268 | |
0.858%, due 5/1/17 (b)(c) | | | 5,000,000 | | | | 4,974,610 | |
Cummins, Inc.
0.446%, due 11/17/16 (b)(c) | | | 1,330,000 | | | | 1,329,740 | |
Eli Lilly & Co.
0.375%, due 11/1/16 (b)(c) | | | 5,000,000 | | | | 5,000,000 | |
Emerson Electric Co. | | | | | | | | |
0.42%, due 11/21/16 (b)(c) | | | 5,000,000 | | | | 4,998,833 | |
0.446%, due 12/5/16 (b)(c) | | | 2,500,000 | | | | 2,498,961 | |
Florida Power & Light Co.
0.70%, due 11/18/16 (b) | | | 5,000,000 | | | | 4,998,701 | |
Henkel of America, Inc. | | | | | | | | |
0.437%, due 11/14/16 (b)(c) | | | 2,500,000 | | | | 2,499,368 | |
0.508%, due 12/6/16 (b)(c) | | | 4,000,000 | | | | 3,997,317 | |
0.519%, due 12/14/16 (b)(c) | | | 6,000,000 | | | | 5,995,700 | |
Hershey Co. (The) | | | | | | | | |
0.36%, due 11/7/16 (b)(c) | | | 5,000,000 | | | | 4,999,650 | |
0.40%, due 11/15/16 (b)(c) | | | 5,000,000 | | | | 4,999,164 | |
Illinois Tool Works, Inc. | | | | | | | | |
0.416%, due 11/7/16 (b)(c) | | | 5,000,000 | | | | 4,999,658 | |
0.426%, due 11/9/16 (b)(c) | | | 5,000,000 | | | | 4,999,533 | |
International Business Machines Corp.
0.373%, due 11/16/16 (b)(c) | | | 5,000,000 | | | | 4,999,000 | |
John Deere Financial, Inc.
0.335%, due 11/2/16 (b)(c) | | | 5,000,000 | | | | 4,999,936 | |
Merck & Co., Inc.
0.305%, due 11/2/16 (b)(c) | | | 2,500,000 | | | | 2,499,974 | |
Northern Il Gas Corp.Northern Illinois Gas Co. | | | | | | | | |
0.477%, due 11/1/16 (b) | | | 5,000,000 | | | | 5,000,000 | |
0.72%, due 11/3/16 (b) | | | 5,000,000 | | | | 4,999,867 | |
0.732%, due 11/8/16 (b) | | | 5,000,000 | | | | 4,999,504 | |
Parker-Hannifin Corp. | | | | | | | | |
0.447%, due 11/17/16 (b)(c) | | | 5,000,000 | | | | 4,998,733 | |
0.537%, due 11/14/16 (b)(c) | | | 5,000,000 | | | | 4,999,043 | |
Praxair, Inc.
0.519%, due 12/14/16 (b) | | | 5,000,000 | | | | 4,997,432 | |
Province of British Columbia
0.305%, due 11/2/16 (b) | | | 4,000,000 | | | | 3,999,966 | |
Province of Quebec
0.511%, due 12/23/16 (b)(c) | | | 2,500,000 | | | | 2,498,231 | |
| † | Percentages indicated are based on Fund net assets. |
| | | | |
| 10 | | MainStay Money Market Fund | | The notes to the financial statements are an integral part of,
and should be read in conjunction with, the financial statements. |
| | | | | | | | |
| | | Principal
Amount | | | Amortized
Cost | |
| Short-Term Investments (continued) | | | | | |
Other Commercial Paper (continued) | | | | | | | | |
UnitedHealth Group, Inc.
0.67%, due 11/7/16 (b)(c) | | $ | 5,000,000 | | | $ | 4,999,375 | |
Washington Gas Light Co.
0.345%, due 11/4/16 (b) | | | 3,000,000 | | | | 2,999,895 | |
WGL Holdings, Inc.
0.662%, due 11/4/16 (b)(c) | | | 2,500,000 | | | | 2,499,858 | |
Wisconsin Public Service Corp.
0.487%, due 11/14/16 (b) | | | 2,700,000 | | | | 2,699,532 | |
| | | | | | | | |
| | | | | | | 175,063,296 | |
| | | | | | | | |
Treasury Debt 17.8% | | | | | | | | |
United States Treasury Bills | | | | | | | | |
0.13%, due 11/10/16 | | | 20,000,000 | | | | 19,998,895 | |
0.18%, due 11/17/16 | | | 5,000,000 | | | | 4,999,644 | |
0.18%, due 12/1/16 | | | 15,000,000 | | | | 14,997,529 | |
United States Treasury Notes | | | | | | | | |
0.50%, due 11/30/16 | | | 3,900,000 | | | | 3,899,955 | |
0.50%, due 1/31/17 | | | 4,000,000 | | | | 3,997,423 | |
0.50%, due 3/31/17 | | | 4,000,000 | | | | 3,996,104 | |
0.625%, due 12/31/16 | | | 3,800,000 | | | | 3,799,322 | |
0.625%, due 5/31/17 | | | 4,000,000 | | | | 4,000,506 | |
0.875%, due 2/28/17 | | | 4,000,000 | | | | 4,003,578 | |
0.875%, due 4/30/17 | | | 4,000,000 | | | | 4,004,965 | |
| | | | | | | | |
| | | | | | | 67,697,921 | |
| | | | | | | | |
Treasury Repurchase Agreements 15.9% | |
Bank of America N.A.
0.31%, dated 10/31/16
due 11/1/16
Proceeds at Maturity $17,500,151 (Collateralized by a United States Treasury Note with a rate of 1.50% and a maturity date of 8/15/26, with a Principal Amount of $18,359,000 and a Market Value of $17,850,063) | | | 17,500,000 | | | | 17,500,000 | |
Bank of Montreal
0.30%, dated 10/31/16
due 11/1/16
Proceeds at Maturity $15,000,125 (Collateralized by United States Treasury securities with rates between 0.125% and 3.125% and maturity dates between 7/15/17 and 8/15/45, with a Principal Amount of $14,593,600 and a Market Value of $15,300,013) | | | 15,000,000 | | | | 15,000,000 | |
| | | | | | | | |
| | | Principal
Amount | | | Amortized
Cost | |
Treasury Repurchase Agreements (continued) | |
RBC Capital Markets
0.29%, dated 10/31/16
due 11/1/16
Proceeds at Maturity $5,367,043 (Collateralized by United States Treasury Notes with rates between 1.625% and 2.00% and a maturity date of 8/31/21 and 5/31/23, with a Principal Amount of $5,326,700 and a Market Value of $5,474,370) | | $ | 5,367,000 | | | $ | 5,367,000 | |
TD Securities (U.S.A.) LLC
0.29%, dated 10/31/16
due 11/1/16
Proceeds at Maturity $22,500,181 (Collateralized by United States Treasury Notes with rates between 0.625% and 0.75% and a maturity date of 2/15/17 and 8/31/18, with a Principal Amount of $22,895,900 and a Market Value of $22,950,034) | | | 22,500,000 | | | | 22,500,000 | |
| | | | | | | | |
| | | | | | | 60,367,000 | |
| | | | | | | | |
Total Short-Term Investments
(Amortized Cost $379,609,773) (d) | | | 100.0 | % | | | 379,609,773 | |
Other Assets, Less Liabilities | | | (0.0 | )‡ | | | (119,066 | ) |
Net Assets | | | 100.0 | % | | $ | 379,490,707 | |
| ‡ | Less than one-tenth of a percent. |
| (a) | Floating rate—Rate shown was the rate in effect as of October 31, 2016. |
| (b) | Interest rate shown represents yield to maturity. |
| (c) | May be sold to institutional investors only under Rule 144A or securities offered pursuant to Section 4(a)(2) of the Securities Act of 1933, as amended. |
| (d) | The amortized cost also represents the aggregate cost for federal income tax purposes. |
| | | | | | |
The notes to the financial statements are an integral part of,
and should be read in conjunction with, the financial statements. | | | | | 11 | |
Portfolio of Investments October 31, 2016 (continued)
The following is a summary of the fair valuations according to the inputs used as of October 31, 2016, for valuing the Fund’s assets and liabilities.
Asset Valuation Inputs
| | | | | | | | | | | | | | | | |
Description | | Quoted
Prices in
Active
Markets for
Identical
Assets (Level 1) | | | Significant
Other
Observable
Inputs (Level 2) | | | Significant
Unobservable
Inputs (Level 3) | | | Total | |
| Investments in Securities (a) | | | | | | | | | | | | | | | | |
| Short-Term Investments | | | | | | | | | | | | | | | | |
Certificates of Deposit | | $ | — | | | $ | 39,000,923 | | | $ | — | | | $ | 39,000,923 | |
Financial Company Commercial Paper | | | — | | | | 37,480,633 | | | | — | | | | 37,480,633 | |
Other Commercial Paper | | | — | | | | 175,063,296 | | | | — | | | | 175,063,296 | |
Treasury Debt | | | — | | | | 67,697,921 | | | | — | | | | 67,697,921 | |
Treasury Repurchase Agreements | | | — | | | | 60,367,000 | | | | — | | | | 60,367,000 | |
| | | | | | | | | | | | | | | | |
| Total Investments in Securities | | $ | — | | | $ | 379,609,773 | | | $ | — | | | $ | 379,609,773 | |
| | | | | | | | | | | | | | | | |
| (a) | For a complete listing of investments and their industries, see the Portfolio of Investments. |
The Fund recognizes transfers between the levels as of the beginning of the year.
For the year ended October 31, 2016, the Fund did not have any transfers between Level 1 and Level 2 fair value measurements. (See Note 2)
As of October 31, 2016, the Fund did not hold any investments with significant unobservable inputs (Level 3). (See Note 2)
The table below sets forth the diversification of MainStay Money Market Fund investments by industry.
Industry Diversification (Unaudited)
| | | | | | | | |
| | | Amortized Cost | | | Percent † | |
Agriculture | | $ | 10,998,577 | | | | 2.9 | % |
Banks | | | 109,367,826 | | | | 28.8 | |
Beverages | | | 9,972,878 | | | | 2.6 | |
Chemicals | | | 4,997,432 | | | | 1.3 | |
Commercial Services | | | 4,999,883 | | | | 1.3 | |
Computers | | | 7,997,460 | | | | 2.1 | |
Diversified Financial Services | | | 29,573,103 | | | | 7.8 | |
Electric | | | 4,998,701 | | | | 1.3 | |
Electrical Equipment | | | 7,497,794 | | | | 2.0 | |
Finance—Investment Banker/Broker | | | 5,000,000 | | | | 1.3 | |
Food | | | 9,998,814 | | | | 2.6 | |
Gas | | | 26,195,456 | | | | 6.9 | |
Health Care—Services | | | 4,999,375 | | | | 1.3 | |
Household Products & Wares | | | 12,492,385 | | | | 3.3 | |
Insurance | | | 7,499,345 | | | | 2.0 | |
Machinery—Construction & Mining | | | 14,998,009 | | | | 3.9 | |
Machinery—Diversified | | | 6,329,676 | | | | 1.7 | |
Miscellaneous Manufacturing | | | 19,996,967 | | | | 5.3 | |
Pharmaceuticals | | | 7,499,974 | | | | 2.0 | |
Sovereign | | | 74,196,118 | | | | 19.6 | |
| | | | | | | | |
| | | 379,609,773 | | | | 100.0 | |
Other Assets, Less Liabilities | | | (119,066 | ) | | | (0.0 | ) |
| | | | | | | | |
Net Assets | | $ | 379,490,707 | | | | 100.0 | % |
| | | | | | | | |
| † | Percentages indicated are based on Fund net assets. |
| | | | |
| 12 | | MainStay Money Market Fund | | The notes to the financial statements are an integral part of,
and should be read in conjunction with, the financial statements. |
Statement of Assets and Liabilities as of October 31, 2016
| | | | |
| Assets | | | | |
Investment in securities, at value (amortized cost $319,242,773) | | $ | 319,242,773 | |
Repurchase agreements, at value (amortized cost $60,367,000) | | | 60,367,000 | |
Cash | | | 1,523 | |
Receivables: | | | | |
Fund shares sold | | | 1,503,352 | |
Interest | | | 90,959 | |
Other assets | | | 39,003 | |
| | | | |
Total assets | | | 381,244,610 | |
| | | | |
| |
| Liabilities | | | | |
Payables: | | | | |
Fund shares redeemed | | | 1,521,990 | |
Transfer agent (See Note 3) | | | 109,083 | |
Manager (See Note 3) | | | 59,692 | |
Shareholder communication | | | 21,969 | |
Custodian | | | 19,081 | |
Professional fees | | | 16,496 | |
Trustees | | | 1,128 | |
Accrued expenses | | | 4,354 | |
Dividend payable | | | 110 | |
| | | | |
Total liabilities | | | 1,753,903 | |
| | | | |
Net assets | | $ | 379,490,707 | |
| | | | |
| |
| Composition of Net Assets | | | | |
Shares of beneficial interest outstanding (par value of $.01 per share) unlimited number of shares authorized | | $ | 3,794,891 | |
Additional paid-in capital | | | 375,643,563 | |
| | | | |
| | | 379,438,454 | |
Undistributed net investment income | | | 52,436 | |
Accumulated net realized gain (loss) on investments | | | (183 | ) |
| | | | |
Net assets | | $ | 379,490,707 | |
| | | | |
| | | | |
Class A | | | | |
Net assets applicable to outstanding shares | | $ | 226,180,791 | |
| | | | |
Shares of beneficial interest outstanding | | | 226,179,514 | |
| | | | |
Net asset value and offering price per share outstanding | | $ | 1.00 | |
| | | | |
Investor Class | | | | |
Net assets applicable to outstanding shares | | $ | 58,657,574 | |
| | | | |
Shares of beneficial interest outstanding | | | 58,659,905 | |
| | | | |
Net asset value and offering price per share outstanding | | $ | 1.00 | |
| | | | |
Class B | | | | |
Net assets applicable to outstanding shares | | $ | 53,340,942 | |
| | | | |
Shares of beneficial interest outstanding | | | 53,341,354 | |
| | | | |
Net asset value and offering price per share outstanding | | $ | 1.00 | |
| | | | |
Class C | | | | |
Net assets applicable to outstanding shares | | $ | 41,311,400 | |
| | | | |
Shares of beneficial interest outstanding | | | 41,308,360 | |
| | | | |
Net asset value and offering price per share outstanding | | $ | 1.00 | |
| | | | |
| | | | | | |
The notes to the financial statements are an integral part of,
and should be read in conjunction with, the financial statements. | | | | | 13 | |
Statement of Operations for the year ended October 31, 2016
| | | | |
| Investment Income (Loss) | | | | |
Income | | | | |
Interest | | $ | 1,840,366 | |
| | | | |
Expenses | | | | |
Manager (See Note 3) | | | 1,910,726 | |
Transfer agent (See Note 3) | | | 636,849 | |
Registration | | | 119,628 | |
Professional fees | | | 117,183 | |
Shareholder communication | | | 61,515 | |
Custodian | | | 43,301 | |
Trustees | | | 10,543 | |
Miscellaneous | | | 14,066 | |
| | | | |
Total expenses before waiver/reimbursement | | | 2,913,811 | |
Expense waiver/reimbursement from Manager (See Note 3) | | | (1,121,182 | ) |
Reimbursement from custodian (a) | | | (48,233 | ) |
| | | | |
Net expenses | | | 1,744,396 | |
| | | | |
Net investment income (loss) | | | 95,970 | |
| | | | |
|
| Realized and Unrealized Gain (Loss) on Investments | |
Net realized gain (loss) on investments | | | 18 | |
| | | | |
Net increase (decrease) in net assets resulting from operations | | $ | 95,988 | |
| | | | |
| (a) | Reimbursement from custodian represents a refund for overbilling of prior years’ custody out-of-pocket fees. |
| | | | |
| 14 | | MainStay Money Market Fund | | The notes to the financial statements are an integral part of,
and should be read in conjunction with, the financial statements. |
Statements of Changes in Net Assets
for the years ended October 31, 2016 and the year ended October 31, 2015
| | | | | | | | |
| | | 2016 | | | 2015 | |
| Increase (Decrease) in Net Assets | |
Operations: | | | | | | | | |
Net investment income (loss) | | $ | 95,970 | | | $ | 38,719 | |
Net realized gain (loss) on investments | | | 18 | | | | (22 | ) |
| | | | |
Net increase (decrease) in net assets resulting from operations | | | 95,988 | | | | 38,697 | |
| | | | |
Dividends to shareholders: | | | | | | | | |
From net investment income: | | | | | | | | |
Class A | | | (29,064 | ) | | | (23,334 | ) |
Investor Class | | | (6,807 | ) | | | (5,446 | ) |
Class B | | | (6,509 | ) | | | (6,058 | ) |
Class C | | | (5,285 | ) | | | (3,881 | ) |
| | | | |
Total dividends to shareholders | | | (47,665 | ) | | | (38,719 | ) |
| | | | |
Capital share transactions: | | | | | | | | |
Net proceeds from sale of shares | | | 492,903,915 | | | | 511,947,321 | |
Net asset value of shares issued to shareholders in reinvestment of dividends | | | 41,934 | | | | 33,254 | |
Cost of shares redeemed | | | (512,734,483 | ) | | | (499,776,922 | ) |
| | | | |
Increase (decrease) in net assets derived from capital share transactions | | | (19,788,634 | ) | | | 12,203,653 | |
| | | | |
Net increase (decrease) in net assets | | | (19,740,311 | ) | | | 12,203,631 | |
|
| Net Assets | |
Beginning of year | | | 399,231,018 | | | | 387,027,387 | |
| | | | |
End of year | | $ | 379,490,707 | | | $ | 399,231,018 | |
| | | | |
Undistributed net investment income at end of year | | $ | 52,436 | | | $ | 3,672 | |
| | | | |
| | | | | | |
The notes to the financial statements are an integral part of,
and should be read in conjunction with, the financial statements. | | | | | 15 | |
Financial Highlights selected per share data and ratios
| | | | | | | | | | | | | | | | | | | | |
| | | Year ended October 31, | |
| Class A | | 2016 | | | 2015 | | | 2014 | | | 2013 | | | 2012 | |
Net asset value at beginning of year | | $ | 1.00 | | | $ | 1.00 | | | $ | 1.00 | | | $ | 1.00 | | | $ | 1.00 | |
| | | | | | | | | | | | | | | | | | | | |
Net investment income (loss) | | | 0.00 | ‡ | | | 0.00 | ‡ | | | 0.00 | ‡ | | | 0.00 | ‡ | | | 0.00 | ‡ |
Net realized and unrealized gain (loss) on investments | | | 0.00 | ‡ | | | (0.00 | )‡ | | | (0.00 | )‡ | | | 0.00 | ‡ | | | 0.00 | ‡ |
| | | | | | | | | | | | | | | | | | | | |
Total from investment operations | | | 0.00 | ‡ | | | 0.00 | ‡ | | | 0.00 | ‡ | | | 0.00 | ‡ | | | 0.00 | ‡ |
| | | | | | | | | | | | | | | | | | | | |
| Less dividends and distributions: | | | | | | | | | | | | | | | | | | | | |
From net investment income | | | (0.00 | )‡ | | | (0.00 | )‡ | | | (0.00 | )‡ | | | (0.00 | )‡ | | | (0.00 | )‡ |
| | | | | | | | | | | | | | | | | | | | |
Net asset value at end of year | | $ | 1.00 | | | $ | 1.00 | | | $ | 1.00 | | | $ | 1.00 | | | $ | 1.00 | |
| | | | | | | | | | | | | | | | | | | | |
Total investment return | | | 0.01 | % | | | 0.01 | % | | | 0.01 | % | | | 0.01 | % | | | 0.01 | % |
| Ratios (to average net assets)/Supplemental Data: | | | | | | | | | | | | | | | | | | | | |
Net investment income (loss) | | | 0.02 | % | | | 0.01 | % | | | 0.01 | % | | | 0.01 | % | | | 0.01 | % |
Net expenses | | | 0.43 | % | | | 0.13 | % | | | 0.11 | % | | | 0.15 | % | | | 0.17 | % |
Expenses (before waiver/reimbursement) | | | 0.64 | % | | | 0.64 | % | | | 0.64 | % | | | 0.65 | % | | | 0.69 | % |
Net assets at end of year (in 000’s) | | $ | 226,181 | | | $ | 243,517 | | | $ | 230,330 | | | $ | 290,028 | | | $ | 259,119 | |
| ‡ | Less than one cent per share. |
| | | | | | | | | | | | | | | | | | | | |
| | | Year ended October 31, | |
| Investor Class | | 2016 | | | 2015 | | | 2014 | | | 2013 | | | 2012 | |
Net asset value at beginning of year | | $ | 1.00 | | | $ | 1.00 | | | $ | 1.00 | | | $ | 1.00 | | | $ | 1.00 | |
| | | | | | | | | | | | | | | | | | | | |
Net investment income (loss) | | | 0.00 | ‡ | | | 0.00 | ‡ | | | 0.00 | ‡ | | | 0.00 | ‡ | | | 0.00 | ‡ |
Net realized and unrealized gain (loss) on investments | | | 0.00 | ‡ | | | (0.00 | )‡ | | | (0.00 | )‡ | | | 0.00 | ‡ | | | 0.00 | ‡ |
| | | | | | | | | | | | | | | | | | | | |
Total from investment operations | | | 0.00 | ‡ | | | 0.00 | ‡ | | | 0.00 | ‡ | | | 0.00 | ‡ | | | 0.00 | ‡ |
| | | | | | | | | | | | | | | | | | | | |
| Less dividends and distributions: | | | | | | | | | | | | | | | | | | | | |
From net investment income | | | (0.00 | )‡ | | | (0.00 | )‡ | | | (0.00 | )‡ | | | (0.00 | )‡ | | | (0.00 | )‡ |
| | | | | | | | | | | | | | | | | | | | |
Net asset value at end of year | | $ | 1.00 | | | $ | 1.00 | | | $ | 1.00 | | | $ | 1.00 | | | $ | 1.00 | |
| | | | | | | | | | | | | | | | | | | | |
Total investment return | | | 0.01 | % | | | 0.01 | % | | | 0.01 | % | | | 0.01 | % | | | 0.01 | % |
| Ratios (to average net assets)/Supplemental Data: | | | | | | | | | | | | | | | | | | | | |
Net investment income (loss) | | | 0.02 | % | | | 0.01 | % | | | 0.01 | % | | | 0.01 | % | | | 0.00 | %‡ |
Net expenses | | | 0.43 | % | | | 0.14 | % | | | 0.11 | % | | | 0.16 | % | | | 0.18 | % |
Expenses (before waiver/reimbursement) | | | 0.83 | % | | | 0.87 | % | | | 0.89 | % | | | 0.90 | % | | | 0.91 | % |
Net assets at end of year (in 000’s) | | $ | 58,658 | | | $ | 56,512 | | | $ | 56,177 | | | $ | 58,774 | | | $ | 59,129 | |
| ‡ | Less than one cent per share. |
| | | | |
| 16 | | MainStay Money Market Fund | | The notes to the financial statements are an integral part of,
and should be read in conjunction with, the financial statements. |
Financial Highlights selected per share data and ratios
| | | | | | | | | | | | | | | | | | | | |
| | | Year ended October 31, | |
| Class B | | 2016 | | | 2015 | | | 2014 | | | 2013 | | | 2012 | |
Net asset value at beginning of year | | $ | 1.00 | | | $ | 1.00 | | | $ | 1.00 | | | $ | 1.00 | | | $ | 1.00 | |
| | | | | | | | | | | | | | | | | | | | |
Net investment income (loss) | | | 0.00 | ‡ | | | 0.00 | ‡ | | | 0.00 | ‡ | | | 0.00 | ‡ | | | 0.00 | ‡ |
Net realized and unrealized gain (loss) on investments | | | 0.00 | ‡ | | | (0.00 | )‡ | | | (0.00 | )‡ | | | 0.00 | ‡ | | | 0.00 | ‡ |
| | | | | | | | | | | | | | | | | | | | |
Total from investment operations | | | 0.00 | ‡ | | | 0.00 | ‡ | | | 0.00 | ‡ | | | 0.00 | ‡ | | | 0.00 | ‡ |
| | | | | | | | | | | | | | | | | | | | |
| Less dividends and distributions: | | | | | | | | | | | | | | | | | | | | |
From net investment income | | | (0.00 | )‡ | | | (0.00 | )‡ | | | (0.00 | )‡ | | | (0.00 | )‡ | | | (0.00 | )‡ |
| | | | | | | | | | | | | | | | | | | | |
Net asset value at end of year | | $ | 1.00 | | | $ | 1.00 | | | $ | 1.00 | | | $ | 1.00 | | | $ | 1.00 | |
| | | | | | | | | | | | | | | | | | | | |
Total investment return | | | 0.01 | % | | | 0.01 | % | | | 0.01 | % | | | 0.01 | % | | | 0.01 | % |
| Ratios (to average net assets)/Supplemental Data: | | | | | | | | | | | | | | | | | | | | |
Net investment income (loss) | | | 0.02 | % | | | 0.01 | % | | | 0.01 | % | | | 0.01 | % | | | 0.01 | % |
Net expenses | | | 0.43 | % | | | 0.14 | % | | | 0.11 | % | | | 0.16 | % | | | 0.18 | % |
Expenses (before waiver/reimbursement) | | | 0.83 | % | | | 0.87 | % | | | 0.89 | % | | | 0.90 | % | | | 0.91 | % |
Net assets at end of year (in 000’s) | | $ | 53,341 | | | $ | 58,152 | | | $ | 63,581 | | | $ | 73,803 | | | $ | 84,982 | |
| ‡ | Less than one cent per share. |
| | | | | | | | | | | | | | | | | | | | |
| | | Year ended October 31, | |
| Class C | | 2016 | | | 2015 | | | 2014 | | | 2013 | | | 2012 | |
Net asset value at beginning of year | | $ | 1.00 | | | $ | 1.00 | | | $ | 1.00 | | | $ | 1.00 | | | $ | 1.00 | |
| | | | | | | | | | | | | | | | | | | | |
Net investment income (loss) | | | 0.00 | ‡ | | | 0.00 | ‡ | | | 0.00 | ‡ | | | 0.00 | ‡ | | | 0.00 | ‡ |
Net realized and unrealized gain (loss) on investments | | | 0.00 | ‡ | | | (0.00 | )‡ | | | (0.00 | )‡ | | | 0.00 | ‡ | | | 0.00 | ‡ |
| | | | | | | | | | | | | | | | | | | | |
Total from investment operations | | | 0.00 | ‡ | | | 0.00 | ‡ | | | 0.00 | ‡ | | | 0.00 | ‡ | | | 0.00 | ‡ |
| | | | | | | | | | | | | | | | | | | | |
| Less dividends: | | | | | | | | | | | | | | | | | | | | |
From net investment income | | | (0.00 | )‡ | | | (0.00 | )‡ | | | (0.00 | )‡ | | | (0.00 | )‡ | | | (0.00 | )‡ |
| | | | | | | | | | | | | | | | | | | | |
Net asset value at end of year | | $ | 1.00 | | | $ | 1.00 | | | $ | 1.00 | | | $ | 1.00 | | | $ | 1.00 | |
| | | | | | | | | | | | | | | | | | | | |
Total investment return | | | 0.01 | % | | | 0.01 | % | | | 0.01 | % | | | 0.01 | % | | | 0.01 | % |
| Ratios (to average net assets)/Supplemental Data: | | | | | | | | | | | | | | | | | | | | |
Net investment income (loss) | | | 0.02 | % | | | 0.01 | % | | | 0.01 | % | | | 0.01 | % | | | 0.01 | % |
Net expenses | | | 0.43 | % | | | 0.13 | % | | | 0.11 | % | | | 0.15 | % | | | 0.18 | % |
Expenses (before waiver/reimbursement) | | | 0.83 | % | | | 0.87 | % | | | 0.89 | % | | | 0.90 | % | | | 0.91 | % |
Net assets at end of year (in 000’s) | | $ | 41,311 | | | $ | 41,050 | | | $ | 36,939 | | | $ | 33,254 | | | $ | 28,212 | |
| ‡ | Less than one cent per share. |
| | | | | | |
The notes to the financial statements are an integral part of,
and should be read in conjunction with, the financial statements. | | | | | 17 | |
Notes to Financial Statements
Note 1–Organization and Business
The MainStay Funds (the “Trust”) was organized on January 9, 1986, as a Massachusetts business trust. The Trust is registered under the Investment Company Act of 1940, as amended (the “1940 Act”), as an open-end management investment company, and is comprised of twelve funds (collectively referred to as the “Funds”). These financial statements and notes relate to the MainStay Money Market Fund (the “Fund”), a “diversified” fund, as that term is defined in the 1940 Act, as interpreted or modified by regulatory authorities having jurisdiction, from time to time.
The Fund currently offers four classes of shares at net asset value (“NAV”) without the imposition of a front-end sales charge or a contingent deferred sales charge (“CDSC”). Class A shares commenced operations on January 3, 1995. Class B shares commenced operations on May 1, 1986. Class C shares commenced operations on September 1, 1998. Investor Class shares commenced operations on February 28, 2008. Depending upon eligibility, Class B shares convert to either Class A or Investor Class shares at the end of the calendar quarter eight years after the date they were purchased. Additionally, depending upon eligibility, Investor Class shares may convert to Class A shares and Class A shares may convert to Investor Class shares. Under certain circumstances and as may be permitted by to the Trust’s multiple class plan under Rule 18f-3 of the 1940 Act, an exchange/conversion may be made from specified share classes of the Fund to one or more other share classes of the Fund as disclosed in the capital share transactions within these notes. The four classes of shares have the same voting (except for issues that relate solely to one class), dividend, liquidation and other rights, and the same terms and conditions.
The Fund’s investment objective is to seek a high level of current income while preserving capital and maintaining liquidity.
Note 2–Significant Accounting Policies
The Fund is an investment company and accordingly follows the investment company accounting and reporting guidance of the Financial Accounting Standards Board (“FASB”) Accounting Standard Codification Topic 946 Financial Services—Investment Companies. The Fund prepares its financial statements in accordance with generally accepted accounting principles (“GAAP”) in the United States of America and follows the significant accounting policies described below.
(A) Valuation of Shares. You could lose money by investing in the Fund. Although the Fund seeks to preserve the value of your investment at $1.00 per share by using the amortized cost method of valuation, it cannot guarantee it will do so. The Fund may impose a fee upon the sale of your shares or may temporarily suspend your ability to sell shares if the Fund’s liquidity falls below required minimums because of market conditions or other factors. An investment in the Fund is not insured or guaranteed by the Federal Deposit Insurance Corporation or any other government agency. The Fund’s sponsor has no legal obligation to provide financial support to the Fund, and you should not expect that the sponsor will provide financial support to the Fund at any time.
(B) Securities Valuation. Securities are valued using the amortized cost method of valuation, unless the use of such method would be inappropriate per the requirements of Rule 2a-7 under the 1940 Act. The amortized cost method involves valuing a security at its cost on the date of purchase and thereafter assuming a constant amortization to
maturity of the difference between such cost and the value on maturity date. Amortized cost approximates the current fair value of a security.
The Board of Trustees (the “Board”) adopted procedures establishing methodologies for the valuation of the Fund’s securities and other assets and delegated the responsibility for valuation determinations under those procedures to the Valuation Committee of the Trust (the “Valuation Committee”). The Board authorized the Valuation Committee to appoint a Valuation Sub-Committee (the “Sub-Committee”) to deal in the first instance with establishing the prices of securities for which market quotations are not readily available or the prices of which are not otherwise readily determinable under these procedures. The Sub-Committee meets (in person, via electronic mail or via teleconference) on an as-needed basis. Subsequently, the Valuation Committee meets to ensure that actions taken by the Sub-Committee were appropriate. The procedures recognize that, subject to the oversight of the Board and unless otherwise noted, the responsibility for the day-to-day valuation of portfolio assets (including fair value measurements for the Fund’s assets and liabilities) rests with New York Life Investment Management LLC (“New York Life Investments” or the “Manager”), aided to whatever extent necessary by the Subadvisor (as defined in Note 3(A)) to the Fund.
To assess the appropriateness of security valuations, the Manager, Subadvisor or the Fund’s third party service provider, who is subject to oversight by the Manager, regularly compares prior day prices, prices on comparable securities, and the sale prices to the prior and current day prices and challenges prices with changes exceeding certain tolerance levels with third party pricing services or broker sources. For those securities valued through either a standardized fair valuation methodology or a fair valuation measurement, the Sub-Committee deals in the first instance with such valuation and the Valuation Committee reviews and affirms, if appropriate, the reasonableness of the valuation based on such methodologies and measurements on a regular basis after considering all relevant information that is reasonably available. Any action taken by the Sub-Committee with respect to the valuation of a portfolio security or other asset is submitted by the Valuation Committee to the Board for its review and ratification, if appropriate, at its next regularly scheduled meeting.
“Fair value” is defined as the price the Fund would reasonably expect to receive upon selling an asset or liability in an orderly transaction to an independent buyer in the principal or most advantageous market for the asset or liability. Fair value measurements are determined within a framework that establishes a three-tier hierarchy which maximizes the use of observable market data and minimizes the use of unobservable inputs to establish a classification of fair value measurements for disclosure purposes. “Inputs” refer broadly to the assumptions that market participants would use in pricing the asset or liability, including assumptions about risk, such as the risk inherent in a particular valuation technique used to measure fair value using a pricing model and/or the risk inherent in the inputs for the valuation technique. Inputs may be observable or unobservable. Observable inputs reflect the assumptions market participants would use in pricing the asset or liability based on market data obtained from sources independent of the Fund. Unobservable inputs reflect the Fund’s own assumptions about the assumptions market participants would use in pricing the asset or liability based on the information available. The inputs or methodology used for valuing assets or liabilities may not be an indication of the risks
| | |
| 18 | | MainStay Money Market Fund |
associated with investing in those assets or liabilities. The three-tier hierarchy of inputs is summarized below.
| • | | Level 1—quoted prices in active markets for an identical asset or liability |
| • | | Level 2—other significant observable inputs (including quoted prices for a similar asset or liability in active markets, interest rates and yield curves, prepayment speeds, credit risk, etc.) |
| • | | Level 3—significant unobservable inputs (including the Fund’s own assumptions about the assumptions that market participants would use in measuring fair value of an asset or liability) |
Securities valued at amortized cost are not obtained from a quoted price in an active market and are generally categorized as Level 2 in the hierarchy. The level of an asset or liability within the fair value hierarchy is based on the lowest level of an input, both individually and in the aggregate, that is significant to the fair value measurement. As of October 31, 2016, the aggregate value by input level of the Fund’s assets and liabilities is included at the end of the Fund’s Portfolio of Investments.
The Fund may use third party vendor evaluations, whose prices may be derived from one or more of the following standard inputs, among others:
| | |
• Benchmark yields | | • Reported trades |
• Broker/dealer quotes | | • Issuer spreads |
• Two-sided markets | | • Benchmark securities |
• Bids/offers | | • Reference data (corporate actions or material event notices) |
• Industry and economic events | | • Comparable bonds |
• Monthly payment information | | |
An asset or liability for which market values cannot be measured using the methodologies described above is valued by methods deemed reasonable in good faith by the Valuation Committee, following the procedures established by the Board, to represent fair value. Under these procedures, the Fund may utilize some of the following fair value techniques: multi-dimensional relational pricing models and option adjusted spread pricing. During the year ended October 31, 2016, there were no material changes to the fair value methodologies.
(C) Income Taxes. The Fund’s policy is to comply with the requirements of the Internal Revenue Code of 1986, as amended (the “Internal Revenue Code”), applicable to regulated investment companies and to distribute all of its taxable income to the shareholders of the Fund within the allowable time limits. Therefore, no federal, state and local income tax provisions are required.
Management evaluates the Fund’s tax positions to determine if the tax positions taken meet the minimum recognition threshold in connection with accounting for uncertainties in income tax positions taken or expected to be taken for the purposes of measuring and recognizing tax liabilities in the financial statements. Recognition of tax benefits of an uncertain tax position is permitted only to the extent the position is “more likely than not” to be sustained assuming examination by taxing authorities. Management has analyzed the Fund’s tax positions taken on federal, state and local income tax returns for all open tax years (for up
to three tax years), and has concluded that no provisions for federal, state and local income tax are required in the Fund’s financial statements. The Fund’s federal, state and local income and federal excise tax returns for tax years for which the applicable statutes of limitations have not expired are subject to examination by the Internal Revenue Service and state and local departments of revenue.
(D) Dividends and Distributions to Shareholders. Dividends and distributions are recorded on the ex-dividend date. Dividends from net investment income, if any, are declared daily and paid monthly and distributions from net realized capital and currency gains, if any, are declared and paid at least annually. Unless the shareholder elects otherwise, all dividends and distributions are reinvested in the same class of shares of the Fund, at NAV. Dividends and distributions to shareholders are determined in accordance with federal income tax regulations and may differ from GAAP.
(E) Security Transactions and Investment Income. The Fund records security transactions on the trade date. Realized gains and losses on security transactions are determined using the identified cost method. Interest income is accrued daily and discounts and premiums on securities purchased for the Fund are accreted and amortized, respectively, on the straight-line method. The straight-line method approximates the effective interest method for Short-Term investments. Income from payment-in-kind securities is recorded daily based on the effective interest method of accrual.
Investment income and realized and unrealized gains and losses on investments of the Fund are allocated to separate classes of shares pro rata based upon their relative net assets on the date the income is earned or realized and unrealized gains and losses are incurred.
(F) Expenses. Expenses of the Trust are allocated to the individual Funds in proportion to the net assets of the respective Funds when the expenses are incurred, except where direct allocations of expenses can be made. Expenses (other than transfer agent expenses) are allocated to separate classes of shares pro rata based upon their relative net assets on the date the expenses are incurred. The expenses borne by the Fund, including those of related parties to the Fund, are shown in the Statement of Operations.
(G) Use of Estimates. In preparing financial statements in conformity with GAAP, management makes estimates and assumptions that affect the reported amounts and disclosures in the financial statements. Actual results could differ from those estimates.
(H) Repurchase Agreements. The Fund may enter into repurchase agreements to earn income. The Fund may enter into repurchase agreements only with financial institutions that are deemed by the Manager or Subadvisor to be creditworthy, pursuant to guidelines established by the Board. During the term of any repurchase agreement, the Manager or Subadvisor will continue to monitor the creditworthiness of the seller. Under the 1940 Act, repurchase agreements are considered to be collateralized loans by the Fund to the seller secured by the securities transferred to the Fund.
When the Fund enters into repurchase agreements, the Fund’s custodian takes possession of the collateral pledged for investments in the repurchase agreement. The underlying collateral is valued daily on a mark to market basis to determine if the value, including accrued
Notes to Financial Statements (continued)
interest, exceeds the repurchase price. In the event of the seller’s default on the obligation to repurchase, the Fund has the right to liquidate the collateral and apply the proceeds in satisfaction of the obligation. Under certain circumstances, such as in the event of default or bankruptcy by the counterparty to the agreement, realization and/or retention of the collateral may be subject to legal proceedings and possible realized loss to the Fund.
(I) Debt Securities Risk. The Fund’s investments may include securities such as variable rate notes, floaters and mortgage-related and asset-backed securities. If expectations about changes in interest rates, or assessments of an issuer’s credit worthiness or market conditions are incorrect, these types of investments could lose money.
The Fund may also invest in U.S. dollar-denominated securities of foreign issuers, which carry certain risks in addition to the usual risks inherent in domestic instruments. These risks include those resulting from future adverse political or economic developments and possible imposition of foreign governmental laws or restrictions. The ability of issuers of debt securities held by the Fund to meet their obligations may be affected by economic or political developments in a specific country, industry or region.
(J) Indemnifications. Under the Trust’s organizational documents, its officers and trustees are indemnified against certain liabilities that may arise out of performance of their duties to the Trust. Additionally, in the normal course of business, the Fund enters into contracts with third-party service providers that contain a variety of representations and warranties and which may provide general indemnifications. The Fund’s maximum exposure under these arrangements is unknown, as this would involve future claims that may be made against the Fund that have not yet occurred. Based on experience, management is of the view that the risk of loss in connection with these potential indemnification obligations is remote. However, there can be no assurance that material liabilities related to such obligations will not arise in the future, which could adversely impact the Fund.
Note 3–Fees and Related Party Transactions
(A) Manager and Subadvisor. New York Life Investments, a registered investment adviser and an indirect, wholly-owned subsidiary of New York Life Insurance Company (“New York Life”), serves as the Fund’s Manager, pursuant to an Amended and Restated Management Agreement (“Management Agreement”). The Manager provides offices, conducts clerical, recordkeeping and bookkeeping services, and keeps most of the financial and accounting records required to be maintained by the Fund. Except for the portion of salaries and expenses that are the responsibility of the Fund, the Manager pays the salaries and expenses of all personnel affiliated with the Fund and certain operational expenses of the Fund. The Fund reimburses New York Life Investments in an amount equal to a portion of the compensation of the Chief Compliance Officer of the Fund. NYL Investors LLC (“NYL Investors” or the “Subadvisor”), a registered investment adviser and a direct, wholly-owned subsidiary of New York Life, serves as Subadvisor to the Fund and is responsible for the day-to-day portfolio management of the Fund. Pursuant to the terms of the Subadvisory Agreement (“Subadvisory Agreement”) between New York Life Investments and NYL Investors, New York Life Investments pays for the services of the Subadvisor.
Under the Management Agreement, the Fund pays the Manager a monthly fee for services performed and facilities furnished at an annual rate of the Fund’s average daily net assets as follows: 0.45% up to $500 million; 0.40% from $500 million to $1 billion; and 0.35% in excess of $1 billion, plus a fee for fund accounting services previously provided by New York Life Investments under a separate fund accounting agreement furnished at an annual rate of the Fund’s average daily net assets as follows: 0.05% up to $20 million; 0.0333% from $20 million to $100 million; and 0.01% in excess of $100 million. During the year ended October 31, 2016, the effective management fee rate (exclusive of any applicable waivers/reimbursement) was 0.47% inclusive of a fee for fund accounting services of 0.02% of the Fund’s average daily net assets.
New York Life Investments has contractually agreed to waive fees and/or reimburse expenses so that Total Annual Fund Operating Expenses do not exceed the following percentages of average daily net assets: Class A, 0.70%; Investor Class, 0.80%; Class B, 0.80%; and Class C, 0.80%. This agreement will remain in effect until March 1, 2017, and shall renew automatically for one-year terms unless New York Life Investments provides written notice of termination prior to the start of the next term or upon approval by the Board.
New York Life Investments may limit expenses of the Fund to the extent it deems appropriate to enhance the yield of the Fund, or a particular class of the Fund, during periods when expenses have a significant impact on the yield of the Fund, or a particular class of the Fund, as applicable, because of low interest rates. This expense limitation policy is voluntary and in addition to any contractual arrangements that may be in place with respect to the Fund and described in the Fund’s prospectus. Total Annual Fund Operating Expenses excludes taxes, interest, litigation, extraordinary expenses, brokerage and other transaction expenses relating to the purchase or sale of portfolio investments, and acquired (underlying) fund fees and expenses.
During the year ended October 31, 2016, New York Life Investments earned fees from the Fund in the amount of $1,910,726 and waived its fees and/or reimbursed expenses in the amount of $43,304. Additionally, New York Life Investments reimbursed fees in the amount of $1,077,878, without which the Fund’s total returns would have been lower.
State Street Bank and Trust Company (“State Street”) provides sub-administration and sub-accounting services to the Fund pursuant to an agreement with New York Life Investments. These services include calculating the daily NAVs of the Fund, maintaining the general ledger and sub-ledger accounts for the calculation of the Fund’s respective NAVs, and assisting New York Life Investments in conducting various aspects of the Fund’s administrative operations. For providing these services to the Fund, State Street is compensated by New York Life Investments.
(B) Sales Charges. During the year ended October 31, 2016, the Fund was advised by the Distributor that the amount of initial sales charges retained on sales of Class A shares were $845. Although the Fund does not assess a CDSC upon redemption of Class B or Class C shares of the Fund, the applicable CDSC will be assessed when shares are redeemed from the Fund if the shareholder previously exchanged his or her investment into the Fund from another fund within the MainStay Group of Funds. During the year ended October 31, 2016, the Fund was advised that NYLIFE Distributors LLC (the “Distributor”), an
| | |
| 20 | | MainStay Money Market Fund |
indirect wholly owned subsidiary of New York Life, received from shareholders the proceeds from CDSCs of Class A, Investor Class, Class B and Class C of $66,599, $605, $61,255 and $28,196, respectively.
(C) Transfer, Dividend Disbursing and Shareholder Servicing Agent. NYLIM Service Company LLC, an affiliate of New York Life Investments, is the Fund’s transfer, dividend disbursing and shareholder servicing agent pursuant to an agreement between NYLIM Service Company LLC and the Trust. NYLIM Service Company LLC has entered into an agreement with Boston Financial Data Services, Inc. (“BFDS”) pursuant to which BFDS performs certain transfer agent services on behalf of NYLIM Service Company LLC. During the year ended October 31, 2016, transfer agent expenses incurred by the Fund were as follows:
| | | | |
Class A | | $ | 204,875 | |
Investor Class | | | 156,977 | |
Class B | | | 151,191 | |
Class C | | | 123,806 | |
(D) Small Account Fee. Shareholders with small accounts adversely impact the cost of providing transfer agency services. In an effort to reduce total transfer agency expenses, the Fund has implemented a small account fee on certain types of accounts. Certain shareholders with an account balance of less than $1,000 are charged an annual per account fee of $20 (assessed semi-annually), the proceeds from which offset transfer agent fees as reflected in the Statement of Operations.
Note 4–Federal Income Tax
As of October 31, 2016, the components of accumulated gain (loss) on a tax basis were as follows:
| | | | | | | | | | | | | | | | |
Ordinary
Income | | Accumulated
Capital and Other Gain (Loss) | | | Other
Temporary
Differences | | | Unrealized
Appreciation
(Depreciation) | | | Total
Accumulated Gain (Loss) | |
$52,546 | | $ | (183 | ) | | $ | (110 | ) | | $ | — | | | $ | 52,253 | |
The other temporary differences are primarily due to dividends payable.
The following table discloses the current year reclassifications between undistributed net investment income (loss), accumulated net realized gain (loss) on investments, and additional paid-in capital arising from permanent differences; net assets as of October 31, 2016 were not affected.
| | | | | | | | |
Undistributed
Net Investment
Income (Loss) | | Accumulated
Net Realized
Gain (Loss) on
Investments | | | Additional
Paid-In
Capital | |
| $459 | | $ | — | | | $ | (459 | ) |
The reclassifications for the Fund are primarily due to nondeductible expenses.
As of October 31, 2016, for federal income tax purposes, capital loss carryforwards of $183 were available as shown in the table below, to the extent provided by the regulations to offset future realized gains of the Fund through the years indicated. To the extent that these capital loss carryforwards are used to offset future realized gains, it is probable
that the capital gains so offset will not be distributed to shareholders. No capital gain distributions shall be made until any capital loss carryforwards have been fully utilized.
| | | | | | | | |
Capital Loss
Available Through | | Short-Term
Capital Loss
Amounts (000’s) | | | Long-Term
Capital Loss
Amounts (000’s) | |
| Unlimited | | $ | — | (a) | | $ | — | |
The Fund utilized $18 of capital loss carryforwards during the year ended October 31, 2016.
During the years ended October 31, 2016 and October 31, 2015, the tax character of distributions paid as reflected in the Statements of Changes in Net Assets was as follows:
| | | | | | | | |
| | | 2016 | | | 2015 | |
Distributions paid from: | | | | | | | | |
Ordinary Income | | $ | 47,665 | | | $ | 38,719 | |
Note 5–Custodian
State Street is the custodian of cash and securities held by the Fund. Custodial fees are charged to the Fund based on the Fund’s net assets and/or the market value of securities held by the Fund and the number of certain transactions incurred by the Fund.
Note 6–Interfund Lending Program
Pursuant to an exemptive order issued by the SEC, the Fund, along with certain other funds managed by New York Life Investments, may participate in an interfund lending program. The interfund lending program provides an alternate credit facility that permits the Fund and certain other funds managed by New York Life Investments to lend or borrow money for temporary purposes directly to or from one another, subject to the conditions of the exemptive order. During the year ended October 31, 2016, there were no interfund loans made or outstanding with respect to the Fund.
Note 7–Capital Share Transactions
| | | | |
Class A (at $1 per share) | | Shares | |
Year ended October 31, 2016: | | | | |
Shares sold | | | 369,603,010 | |
Shares issued to shareholders in reinvestment of dividends and distributions | | | 27,146 | |
Shares redeemed | | | (394,385,308 | ) |
| | | | |
Net increase (decrease) in shares outstanding
before conversion | | | (24,755,152 | ) |
Shares converted into Class A (See Note 1) | | | 12,005,934 | |
Shares converted from Class A (See Note 1) | | | (4,616,215 | ) |
| | | | |
Net increase (decrease) | | | (17,365,433 | ) |
| | | | |
Year ended October 31, 2015: | | | | |
Shares sold | | | 383,202,123 | |
Shares issued to shareholders in reinvestment of dividends and distributions | | | 21,773 | |
Shares redeemed | | | (374,298,971 | ) |
| | | | |
Net increase (decrease) in shares outstanding
before conversion | | | 8,924,925 | |
Shares converted into Class A (See Note 1) | | | 8,664,349 | |
Shares converted from Class A (See Note 1) | | | (4,401,864 | ) |
| | | | |
Net increase (decrease) | | | 13,187,410 | |
| | | | |
Notes to Financial Statements (continued)
| | | | |
Investor Class (at $1 per share) | | Shares | |
Year ended October 31, 2016: | | | | |
Shares sold | | | 47,185,103 | |
Shares issued to shareholders in reinvestment of dividends and distributions | | | 4,957 | |
Shares redeemed | | | (38,170,925 | ) |
| | | | |
Net increase (decrease) in shares outstanding
before conversion | | | 9,019,135 | |
Shares converted into Investor Class (See Note 1) | | | 4,716,440 | |
Shares converted from Investor Class (See Note 1) | | | (11,597,361 | ) |
| | | | |
Net increase (decrease) | | | 2,138,214 | |
| | | | |
Year ended October 31, 2015: | | | | |
Shares sold | | | 47,654,579 | |
Shares issued to shareholders in reinvestment of dividends and distributions | | | 3,579 | |
Shares redeemed | | | (43,279,103 | ) |
| | | | |
Net increase (decrease) in shares outstanding
before conversion | | | 4,379,055 | |
Shares converted into Investor Class (See Note 1) | | | 4,521,490 | |
Shares converted from Investor Class (See Note 1) | | | (8,565,508 | ) |
| | | | |
Net increase (decrease) | | | 335,037 | |
| | | | |
| |
| | | | |
Class B (at $1 per share) | | Shares | |
Year ended October 31, 2016: | | | | |
Shares sold | | | 13,369,067 | |
Shares issued to shareholders in reinvestment of dividends and distributions | | | 5,210 | |
Shares redeemed | | | (17,683,537 | ) |
| | | | |
Net increase (decrease) in shares outstanding
before conversion | | | (4,309,260 | ) |
Shares converted from Class B (See Note 1) | | | (508,789 | ) |
| | | | |
Net increase (decrease) | | | (4,818,049 | ) |
| | | | |
Year ended October 31, 2015: | | | | |
Shares sold | | | 14,563,454 | |
Shares issued to shareholders in reinvestment of dividends and distributions | | | 4,636 | |
Shares redeemed | | | (19,778,547 | ) |
| | | | |
Net increase (decrease) in shares outstanding
before conversion | | | (5,210,457 | ) |
Shares converted from Class B (See Note 1) | | | (218,467 | ) |
| | | | |
Net increase (decrease) | | | (5,428,924 | ) |
| | | | |
| |
| | | | |
Class C (at $1 per share) | | Shares | |
Year ended October 31, 2016: | | | | |
Shares sold | | | 62,746,661 | |
Shares issued to shareholders in reinvestment of dividends and distributions | | | 4,621 | |
Shares redeemed | | | (62,494,713 | ) |
| | | | |
Net increase (decrease) in shares outstanding before conversion | | | 256,569 | |
Shares converted from Class C | | | (9 | ) |
| | | | |
Net increase (decrease) | | | 256,560 | |
| | | | |
Year ended October 31, 2015: | | | | |
Shares sold | | | 66,527,165 | |
Shares issued to shareholders in reinvestment of dividends and distributions | | | 3,266 | |
Shares redeemed | | | (62,420,301 | ) |
| | | | |
Net increase (decrease) | | | 4,110,130 | |
| | | | |
Note 8–Money Market Fund Regulatory Matters
On July 23, 2014, the SEC voted to amend the rules under the 1940 Act that currently govern the operations of the Fund. The majority of these amendments, except for certain disclosure enhancements, took effect on October 14, 2016. Effective on that date, the Fund began operating as a “retail money market fund,” as such term is defined or interpreted under Rule 2a-7 under the 1940 Act. As a “retail money market fund,” the Fund has adopted policies and procedures reasonably designed to limit all beneficial owners of the Fund to natural persons. As a retail money market fund, the Fund will be permitted to continue to seek to maintain a stable $1.00 net asset value by using the amortized cost method of valuation. In addition, effective October 14, 2016, the Fund is subject to the possible imposition of liquidity fees and/or redemption gates on redemptions if the Fund’s weekly liquid assets fall below the regulatory thresholds set forth in Rule 2a-7 because of market conditions or other factors.
Note 9–Recent Accounting Pronouncement
In October 2016, the U.S. Securities and Exchange Commission adopted new rules and amended existing rules (together, “final rules”) intended to modernize the reporting and disclosure of information by registered investment companies. In part, the final rules amend Regulation S-X and require standardized, enhanced disclosure about derivatives in investment company financial statements, as well as other amendments. The compliance date for the amendments to Regulation S-X is August 1, 2017. Management is currently evaluating the impact that the adoption of the amendments to Regulation S-X will have on the Fund’s financial statements and related disclosures.
Note 10–Subsequent Events
In connection with the preparation of the financial statements of the Fund as of and for the fiscal year ended October 31, 2016, events and transactions subsequent to October 31, 2016, through the date the financial statements were issued have been evaluated by the Fund’s management for possible adjustment and/or disclosure. No subsequent events requiring financial statement adjustment or disclosure have been identified other than the following:
Effective February 28, 2017, Class B shares of the MainStay Group of Funds will be closed to all new purchases as well as additional investments by existing Class B shareholders. Existing Class B shareholders may continue to reinvest dividends and capital gains distributions, as well as exchange their Class B shares for Class B shares of other Funds as permitted by the current exchange privileges. Class B shareholders will continue to be subject to any applicable contingent deferred sales charge at the time of redemption. All other features of the Class B shares, including but not limited to the fees and expenses applicable to Class B shares, will remain unchanged. Unless redeemed, Class B Shares shareholders will remain in Class B shares of their respective Fund until the Class B shares are converted to Class A or Investor Class shares pursuant to the applicable conversion schedule.
| | |
| 22 | | MainStay Money Market Fund |
Report of Independent Registered Public Accounting Firm
The Board of Trustees and Shareholders of
The MainStay Funds:
We have audited the accompanying statement of assets and liabilities, including the portfolio of investments, of the MainStay Money Market Fund (the “Fund”), one of the funds constituting The MainStay Funds, as of October 31, 2016, and the related statement of operations for the year then ended, the statements of changes in net assets for each of the years in the two-year period then ended, and the financial highlights for each of the years in the five-year period then ended. These financial statements and financial highlights are the responsibility of the Fund’s management. Our responsibility is to express an opinion on these financial statements and financial highlights based on our audits.
We conducted our audits in accordance with the standards of the Public Company Accounting Oversight Board (United States). Those standards require that we plan and perform the audit to obtain reasonable assurance about whether the financial statements and financial highlights are free of material misstatement. An audit includes examining, on a test basis, evidence supporting the amounts and disclosures in the financial statements. Our procedures included confirmation of securities owned as of October 31, 2016, by correspondence with the custodian and brokers or by other appropriate auditing procedures where replies from brokers were not received. An audit also includes assessing the accounting principles used and significant estimates made by management, as well as evaluating the overall financial statement presentation. We believe that our audits provide a reasonable basis for our opinion.
In our opinion, the financial statements and financial highlights referred to above present fairly, in all material respects, the financial position of the MainStay Money Market Fund of The MainStay Funds as of October 31, 2016, the results of its operations for the year then ended, the changes in its net assets for each of the years in the two-year period then ended, and the financial highlights for each of the years in the five-year period then ended, in conformity with U.S. generally accepted accounting principles.

Philadelphia, Pennsylvania
December 22, 2016
Federal Income Tax Information
(Unaudited)
In February 2017, shareholders will receive an IRS Form 1099-DIV or substitute Form 1099 which will show the federal tax status of the distributions received by shareholders in calendar year 2016. The amounts that will be reported on such 1099-DIV or substitute Form 1099 will be the amounts you are to use on your federal income tax return.
Proxy Voting Policies and Procedures and Proxy Voting Record
A description of the policies and procedures that New York Life Investments uses to vote proxies related to the Fund’s securities is available without charge, upon request, (i) by visiting the Fund’s website at mainstayinvestments.com; or (ii) on the SEC’s website at www.sec.gov.
The Fund is required to file with the SEC its proxy voting record for the 12-month period ending June 30 on Form N-PX. The Fund’s most recent Form N-PX or proxy voting record is available free of charge upon request (i) by calling 800-MAINSTAY (624-6782); (ii) by visiting the Fund’s website at mainstayinvestments.com; or (iii) on the SEC’s website at www.sec.gov.
Shareholder Reports and Quarterly Portfolio Disclosure
The Fund is required to file its complete schedule of portfolio holdings with the SEC for its first and third fiscal quarters on Form N-Q and every month on Form N-MFP. In addition, the Fund will make available its complete schedule of portfolio holdings on its website at www.mainstayinvestments.com, five days after month-end. The Fund’s Form N-Q is available without charge on the SEC’s website at www.sec.gov or by calling MainStay Investments at 800-MAINSTAY (624-6782). Form N-MFP will be made available to the public by the SEC 60 days after the month to which the information pertains, and a link to each of the most recent 12 months of filings on Form N-MFP will be provided on the Fund’s website. You can also obtain and review copies of Forms N-Q and N-MFP by visiting the SEC’s Public Reference Room in Washington, DC (information on the operation of the Public Reference Room may be obtained by calling 1-800-SEC-0330).
| | |
| 24 | | MainStay Money Market Fund |
Board of Trustees and Officers (Unaudited)
The Trustees and officers of the Funds are listed below. The Board oversees the MainStay Group of Funds, MainStay VP Funds Trust, MainStay DefinedTerm Municipal Opportunities Fund, the Manager and the Subadvisors, and elects the officers of the Funds who are responsible for the day-to-day operations of the Funds. Information pertaining to the Trustees and officers is set forth below. Each Trustee serves until his or her successor is elected and qualified or until his or her resignation, death or removal. Under the Retirement Policy, a Trustee must
tender his or her resignation by the end of the calendar year during which he or she reaches the age of 75 (although the Board of Trustees may make exceptions from time to time). Officers serve a term of one year and are elected annually by the Board of Trustees. The business address of each Trustee and officer listed below is 51 Madison Avenue, New York, New York 10010. A majority of the Trustees are not “interested persons” (as defined by the 1940 Act and rules “adopted” by the SEC thereunder) of the Fund (“Independent Trustees”).
| | | | | | | | | | | | |
| | | | | Name and Date of Birth | | Term of Office, Position(s) Held and Length of Service | | Principal Occupation(s) During Past Five Years | | Number of
Portfolios in
Fund Complex
Overseen by
Board Member | | Other Directorships Held By Board Member |
Interested Trustee | | | | Christopher O. Blunt* 5/13/62 | | MainStay Funds: Trustee since January 2016; MainStay Funds Trust: Trustee since January 2016. | | Executive Vice President (since 2009), President, Investments Group (since 2015), Member of the Executive Management Committee (since 2007), Co-President, Insurance and Agency Group (2012 to 2015), President, Insurance Group (2012 to 2014), Executive Vice President, Retirement Income Security (2008 to 2012), New York Life Insurance Company. | | 83 | | MainStay VP Funds Trust:
Trustee since January 2016 (31 portfolios); and
MainStay DefinedTerm Municipal Opportunities Fund: Trustee since January 2016. |
| | * | This Trustee is considered to be an “interested person” of the MainStay Group of Funds within the meaning of the 1940 Act because of his affiliation with New York Life Insurance Company, New York Life Investment Management LLC, Cornerstone Capital Management Holdings LLC, MacKay Shields LLC, Institutional Capital LLC, NYL Investors LLC, NYLIFE Securities LLC and/or NYLIFE Distributors LLC, as described in detail above in the column entitled “Principal Occupation(s) During Past Five Years.” |
| | | | | | | | | | | | |
| | | | | Name and Date of Birth | | Term of Office, Position(s) Held and Length of Service | | Principal Occupation(s) During Past Five Years | | Number of Portfolios in Fund Complex Overseen by Board Member | | Other Directorships Held By Board Member |
| Non-Interested Trustee | | | | David H. Chow 12/29/57 | | MainStay Funds: Trustee since January 2016, Advisory Board Member (June 2015 to December 2015); MainStay Funds Trust: Trustee since January 2016, Advisory Board Member (June 2015 to December 2015). | | Founder and CEO, DanCourt Management, LLC (since 1999) | | 83 | | MainStay VP Funds Trust: Trustee since January 2016, Advisory Board Member (June 2015 to December 2015); (31 portfolios);
MainStay DefinedTerm Municipal Opportunities Fund: Trustee since January 2016, Advisory Board Member (June 2015 to December 2015);
Market Vectors Group of Exchange-Traded Funds: Independent Chairman of the Board of Trustees since 2008 and Trustee since 2006 (55 portfolios); and
Berea College of Kentucky: Trustee since 2009. |
| | | | Susan B. Kerley 8/12/51 | | MainStay Funds: Trustee since 2007; MainStay Funds Trust: Trustee since 1990.*** | | President, Strategic Management Advisors LLC (since 1990) | | 83 | | MainStay VP Funds Trust: Trustee since 2007 (31 portfolios)**;
MainStay DefinedTerm Municipal Opportunities Fund: Trustee since 2011; and Legg Mason Partners Funds: Trustee since 1991 (53 portfolios). |
| | | | Alan R. Latshaw 3/27/51 | | MainStay Funds: Trustee and Audit Committee Financial Expert since 2006; MainStay Funds Trust: Trustee and Audit Committee Financial Expert since 2007.*** | | Retired; Partner, Ernst & Young LLP (2002 to 2003); Partner, Arthur Andersen LLP (1989 to 2002); Consultant to the MainStay Funds Audit and Compliance Committee (2004 to 2006) | | 83 | | MainStay VP Funds Trust: Trustee and Audit Committee Financial Expert since 2007 (31 portfolios)**;
MainStay DefinedTerm Municipal Opportunities Fund: Trustee and Audit Committee Financial Expert since 2011;
State Farm Associates Funds Trusts: Trustee since 2005 (4 portfolios);
State Farm Mutual Fund Trust: Trustee since 2005 (15 portfolios); and
State Farm Variable Product Trust: Trustee since 2005 (9 portfolios). |
| | | | Peter Meenan 12/5/41 | | MainStay Funds: Chairman since 2013 and Trustee since 2007; MainStay Funds Trust: Chairman since 2013 and Trustee since 2002.*** | | Retired; Independent Consultant (2004 to 2013); President and Chief Executive Officer, Babson—United, Inc. (financial services firm) (2000 to 2004); Independent Consultant (1999 to 2000); Head of Global Funds, Citicorp (1995 to 1999) | | 83 | | MainStay VP Funds Trust: Chairman since 2013 and Trustee since 2007 (31 portfolios)**; and
MainStay DefinedTerm Municipal Opportunities Fund: Chairman since 2013 and Trustee since 2011. |
| | | | Richard H. Nolan, Jr. 11/16/46 | | MainStay Funds: Trustee since 2007; MainStay Funds Trust: Trustee since 2007.*** | | Managing Director, ICC Capital Management (since 2004); President—Shields/Alliance, Alliance Capital Management (1994 to 2004) | | 83 | | MainStay VP Funds Trust: Trustee since 2006 (31 portfolios)**; and
MainStay DefinedTerm Municipal Opportunities Fund: Trustee since 2011. |
| | | | Jacques P. Perold 5/12/58 | | MainStay Funds: Trustee since January 2016, Advisory Board Member (June 2015 to December 2015); MainStay Funds Trust: Trustee since January 2016, Advisory Board Member (June 2015 to December 2015). | | Retired; President, Fidelity Management & Research Company (2009 to 2014); Founder, President and Chief Executive Officer, Geode Capital Management, LCC (2001 to 2009) | | 83 | | MainStay VP Funds Trust: Trustee since January 2016, Advisory Board Member (June 2015 to December 2015); (31 portfolios);
MainStay DefinedTerm Municipal Opportunities Fund: Trustee since January 2016, Advisory Board Member (June 2015 to December 2015);
Allstate Corporation: Director since 2015; and
Boston University: Trustee since 2014. |
| | |
| 26 | | MainStay Money Market Fund |
| | | | | | | | | | | | |
| | | | | Name and Date of Birth | | Term of Office, Position(s) Held and Length of Service | | Principal Occupation(s) During Past Five Years | | Number of Portfolios in Fund Complex Overseen by Board Member | | Other Directorships Held By Board Member |
Non-Interested Trustee | | | | Richard S. Trutanic 2/13/52 | | MainStay Funds: Trustee since 1994; MainStay Funds Trust: Trustee since 2007.*** | | Chairman and Chief Executive Officer, Somerset & Company (financial advisory firm) (since 2004); Managing Director, The Carlyle Group (private investment firm) (2002 to 2004); Senior Managing Director, Partner and Board Member, Groupe Arnault S.A. (private investment firm) (1999 to 2002) | | 83 | | MainStay VP Funds Trust: Trustee since 2007 (31 portfolios)**; and
MainStay DefinedTerm Municipal Opportunities Fund: Trustee since 2011. |
| | | | John A. Weisser**** 10/22/41 | | MainStay Funds: Trustee since 2007; MainStay Funds Trust: Trustee since 2007.*** | | Retired; Managing Director of Salomon Brothers, Inc. (1971 to 1995) | | 83 | | MainStay VP Funds Trust: Trustee since 1997 (31 portfolios)**; MainStay DefinedTerm Municipal Opportunities Fund: Trustee since 2011; Direxion Insurance Trust: Trustee since 2007 (1 portfolio); Direxion Funds: Trustee since 2007 (18 portfolios); and Direxion Shares ETF Trust: Trustee since 2008 (52 portfolios). |
| | ** | Includes prior service as a Director of MainStay VP Series Fund, Inc., the predecessor to MainStay VP Funds Trust. |
| | *** | Includes prior service as a Director/Trustee of certain predecessor entities to MainStay Funds Trust. |
| | **** | Pursuant to the Retirement Policy, Mr. Weisser will retire from the Board of Trustees on or about December 31, 2016. |
| | | | | | | | |
| | | | | Name and Date of Birth | | Position(s) Held and Length of Service | | Principal Occupation(s) During Past Five Years |
Officers (Who Are Not Board Members)* | | | | Stephen P. Fisher 2/22/59 | | President, MainStay Funds (since 2007), MainStay Funds Trust (since 2009) | | Chairman and Chief Executive Officer (since 2014), President and Chief Operating Officer (2008 to 2013), NYLIFE Distributors LLC; Chairman of the Board, NYLIM Service Company LLC (since 2008); President (since May 2015), Co-President (2014 to 2015) and Senior Managing Director (since 2005), New York Life Investment Management LLC; President, MainStay DefinedTerm Municipal Opportunities Fund (since 2011) and MainStay VP Funds Trust (since 2007)** |
| | | | Jack R. Benintende 5/12/64 | | Treasurer and Principal Financial and Accounting Officer, MainStay Funds (since 2007), MainStay Funds Trust (since 2009) | | Managing Director, New York Life Investment Management LLC (since 2007); Treasurer and Principal Financial and Accounting Officer, MainStay DefinedTerm Municipal Opportunities Fund (since 2011) and MainStay VP Funds Trust (since 2007)**; and Assistant Treasurer, New York Life Investment Management Holdings LLC (2008 to 2012) |
| | | | Kevin M. Bopp 2/24/69 | | Vice President and Chief Compliance Officer, MainStay Funds and MainStay Funds Trust (since 2014) | | Chief Compliance Officer (since January 2016), Director and Associate General Counsel (2011 to 2014) and Vice President and Assistant General Counsel (2010 to 2011), New York Life Investment Management LLC; Vice President and Chief Compliance Officer, MainStay VP Funds Trust, MainStay DefinedTerm Municipal Opportunities Fund (since 2014); Assistant Secretary, MainStay Funds, MainStay Funds Trust and MainStay VP Funds Trust (2010 to 2014)**, MainStay DefinedTerm Municipal Opportunities Fund (2011 to 2014) |
| | | | J. Kevin Gao 10/13/67 | | Secretary and Chief Legal Officer, MainStay Funds and MainStay Funds Trust (since 2010) | | Managing Director and Associate General Counsel, New York Life Investment Management LLC (since 2010); Secretary and Chief Legal Officer, MainStay DefinedTerm Municipal Opportunities Fund (since 2011) and MainStay VP Funds Trust (since 2010)** |
| | | | Scott T. Harrington 2/8/59 | | Vice President— Administration, MainStay Funds (since 2005), MainStay Funds Trust (since 2009) | | Director, New York Life Investment Management LLC (including predecessor advisory organizations) (since 2000); Member of the Board of Directors, New York Life Trust Company (since 2009); Vice President—Administration, MainStay DefinedTerm Municipal Opportunities Fund (since 2011) and MainStay VP Funds Trust (since 2005)** |
| | * | The Officers listed above are considered to be “interested persons” of the MainStay Group of Funds within the meaning of the 1940 Act because of their affiliation with the MainStay Group of Funds, New York Life Insurance Company and/or its affiliates, including New York Life Investment Management LLC, NYLIM Service Company LLC, NYLIFE Securities LLC and/or NYLIFE Distributors LLC, as described in detail in the column captioned “Principal Occupation(s) During Past Five Years.” Officers are elected annually by the Board to serve a one year term. |
| | ** | Includes prior service as an Officer of MainStay VP Series Fund, Inc., the predecessor to MainStay VP Funds Trust. |
| | |
| 28 | | MainStay Money Market Fund |
This page intentionally left blank
This page intentionally left blank
MainStay Funds
MainStay offers a wide range of Funds for virtually any investment need. The full array of MainStay open-end offerings is listed here, with information about the manager, subadvisors, legal counsel and independent registered public accounting firm.
Equity
U.S. Equity
MainStay Common Stock Fund
MainStay Cornerstone Growth Fund
MainStay Epoch U.S. All Cap Fund
MainStay Epoch U.S. Equity Yield Fund
MainStay Epoch U.S. Small Cap Fund
MainStay ICAP Equity Fund
MainStay ICAP Select Equity Fund
MainStay Large Cap Growth Fund
MainStay MAP Fund
MainStay S&P 500 Index Fund
MainStay U.S. Equity Opportunities Fund
International/Global Equity
MainStay Emerging Markets Opportunities Fund
MainStay Epoch Capital Growth Fund
MainStay Epoch Global Choice Fund
MainStay Epoch Global Equity Yield Fund
MainStay Epoch International Small Cap Fund
MainStay ICAP International Fund
MainStay International Equity Fund
MainStay International Opportunities Fund
Income
Taxable Bond
MainStay Floating Rate Fund
MainStay Global High Income Fund
MainStay Government Fund
MainStay High Yield Corporate Bond Fund
MainStay High Yield Opportunities Fund
MainStay Indexed Bond Fund
MainStay Short Duration High Yield Fund
MainStay Total Return Bond Fund
MainStay Unconstrained Bond Fund
Municipal/Tax Advantaged Bond
MainStay California Tax Free Opportunities Fund1
MainStay High Yield Municipal Bond Fund
MainStay New York Tax Free Opportunities Fund2
MainStay Tax Advantaged Short Term Bond Fund
MainStay Tax Free Bond Fund
Money Market
MainStay Money Market Fund
Mixed Asset
MainStay Balanced Fund
MainStay Convertible Fund
MainStay Income Builder Fund
Alternative
MainStay Absolute Return Multi-Strategy Fund
MainStay Cushing Energy Income Fund
MainStay Cushing MLP Premier Fund
MainStay Cushing Renaissance Advantage Fund
Asset Allocation/Target Date
MainStay Conservative Allocation Fund
MainStay Growth Allocation Fund
MainStay Moderate Allocation Fund
MainStay Moderate Growth Allocation Fund
MainStay Retirement 2010 Fund
MainStay Retirement 2020 Fund
MainStay Retirement 2030 Fund
MainStay Retirement 2040 Fund
MainStay Retirement 2050 Fund
MainStay Retirement 2060 Fund
Manager
New York Life Investment Management LLC
New York, New York
Subadvisors
Candriam France S.A.S.3
Paris, France
Cornerstone Capital Management Holdings LLC3
New York, New York
Cushing Asset Management, LP
Dallas, Texas
Epoch Investment Partners, Inc.
New York, New York
Institutional Capital LLC3
Chicago, Illinois
MacKay Shields LLC3
New York, New York
Markston International LLC
White Plains, New York
NYL Investors LLC3
New York, New York
Winslow Capital Management, LLC
Minneapolis, Minnesota
Legal Counsel
Dechert LLP
Washington, District of Columbia
Independent Registered Public Accounting Firm
KPMG LLP
Philadelphia, Pennsylvania
1. This Fund is only registered for sale in AZ, CA, MI (Class A and Class I shares only), NV, OR, TX, UT and WA.
2. This Fund is only registered for sale in CA, CT, DE, FL, MA, NJ, NY and VT.
3. An affiliate of New York Life Investment Management LLC.
Not part of the Annual Report
For more information
800-MAINSTAY (624-6782)
mainstayinvestments.com
MainStay Investments® is a registered service mark and name under which New York Life Investment Management LLC does business. MainStay Investments, an indirect subsidiary of New York Life Insurance Company, New York, NY 10010, provides investment advisory products and services. The MainStay Funds® are managed by New York Life Investment Management LLC and distributed by NYLIFE Distributors LLC, 30 Hudson Street, Jersey City, NJ 07302, a wholly owned subsidiary of New York Life Insurance Company. NYLIFE Distributors LLC is a Member FINRA/SIPC.
©2016 NYLIFE Distributors LLC. All rights reserved.
| | | | | | | | |
| Not FDIC/NCUA Insured | | Not a Deposit | | May Lose Value | | No Bank Guarantee | | Not Insured by Any Government Agency |
| | |
| 1715987 MS316-16 | | MSMM11-12/16 (NYLIM) NL214 |
MainStay Tax Free Bond Fund
Message from the President and Annual Report
October 31, 2016


This page intentionally left blank
Message from the President
During the 12 months ended October 31, 2016, the U.S. stock and bond markets were somewhat volatile but generally ended the reporting period in positive territory. In the fall of 2015 and early 2016, the market appeared to be focused on China’s economic weakness and a prolonged decline in oil prices. Although energy-related companies felt the brunt of these setbacks, the stock market as a whole declined until mid-February, when oil prices began to rise and stocks began a relatively steady recovery.
In late June, the United Kingdom voted to leave the European Union in a referendum popularly known as “Brexit.” The news caused a temporary slump in stocks around the world. Although the British pound dropped in value following the vote, stocks generally recovered through the end of the reporting period. As the end of the reporting period approached, speculation about the upcoming U.S. presidential election heightened market volatility.
According to FTSE-Russell data, U.S. stocks as a whole tended to provide positive returns during the reporting period, with large-capitalization stocks generally outperforming stocks of smaller companies. Value stocks outpaced growth stocks at all capitalization levels, with the largest differences among small- to mid-cap stocks.
International and emerging-market stocks provided mixed performance. Rocked by Brexit, European stocks as a whole declined during the reporting period, while stocks in the Asia-Pacific region (with or without Japan) tended to provide positive returns. International stocks as a whole declined, while global stocks advanced slightly. Emerging-market stocks were considerably stronger, boosted by advances in India and Latin America and higher prices for oil, metals and other commodities.
Anticipation of a possible Federal Reserve rate hike led to volatility in the bond market, but the Federal Open Market Committee chose not to raise the federal funds target rate during the reporting period. Short-term U.S. Treasury yields rose during the reporting period, and longer-term U.S. Treasury yields declined. Overall, the U.S. bond market provided positive returns, with longer-term bonds generally outperforming shorter-term securities. High-yield bonds, particularly
longer-term issues, were strong performers. Municipal bonds generally provided positive single-digit total returns for the 12 months ended October 31, 2016.
Central banks around the world remained highly accommodative during the reporting period, particularly in light of Brexit. Shortly after the U.K. referendum, more than a third of all sovereign debt carried negative yields. As an asset class, emerging-market bonds provided double-digit positive returns during the reporting period, and world bonds as a whole provided positive single-digit positive returns.
At MainStay, we know that political, economic and market events may influence the performance of your Fund investments. While our portfolio managers often pay close attention to such events, their primary emphasis is seeking to invest for the long-term investment needs of our shareholders. With this in mind, they seek to pursue the investment objectives of their respective Funds using the principal investment strategies and investment processes outlined in the prospectus. By placing your assets in the care of our investment professionals, you gain access to their extensive market insight, strategic investment discipline and in-depth experience in risk-management over a wide range of market cycles.
The report that follows provides more detailed information about the market forces, portfolio strategies and individual securities that influenced the performance of your MainStay Fund during the 12 months ended October 31, 2016. We invite you to read the report carefully as part of your personal investment-review process.
We thank you for your business, and we look forward to a continuing relationship as you pursue your long-range financial goals.
Sincerely,

Stephen P. Fisher
President
The opinions expressed are as of the date of this report and are subject to change. There is no guarantee that any forecast made will come to pass. This material does not constitute investment advice and is not intended as an endorsement of any specific investment. Past performance is no guarantee of future results.
Not part of the Annual Report
Table of Contents
Investors should refer to the Fund’s Summary Prospectus and/or Prospectus and consider the Fund’s investment objectives, strategies, risks, charges and expenses carefully before investing. The Summary Prospectus and/or Prospectus contain this and other information about the Fund. You may obtain copies of the Fund’s Summary Prospectus, Prospectus and Statement of Additional Information free of charge, upon request, by calling toll-free 800-MAINSTAY (624-6782), by writing to NYLIFE Distributors LLC, Attn: MainStay Marketing Department, 30 Hudson Street, Jersey City, NJ 07302 or by sending an e-mail to MainStayShareholderServices@nylim.com. These documents are also available via the MainStay Funds’ website at mainstayinvestments.com/documents. Please read the Summary Prospectus and/or Prospectus carefully before investing.
Investment and Performance Comparison1 (Unaudited)
Performance data quoted represents past performance. Past performance is no guarantee of future results. Because of market volatility and other factors, current performance may be lower or higher than the figures shown. Investment return and principal value will fluctuate, and as a result, when shares are redeemed, they may be worth more or less than their original cost. The graph below depicts the historical performance of Class B shares of the Fund. Performance will vary from class to class based on differences in class-specific expenses and sales charges. For performance information current to the most recent month-end, please call 800-MAINSTAY (624-6782) or visit mainstayinvestments.com.
(With sales charges)
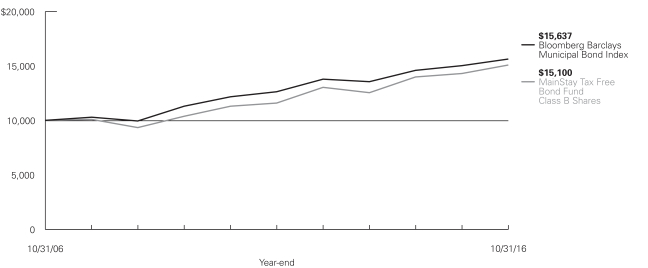
Average Annual Total Returns for the Year Ended October 31, 2016
| | | | | | | | | | | | | | | | | | | | |
| Class | | Sales Charge | | | | One Year | | | Five Years | | | Ten Years | | | Gross Expense Ratio2 | |
| Class A Shares | | Maximum 4.5% Initial Sales Charge | | With sales charges Excluding sales charges | |
| 0.97
5.73 | %
| |
| 4.75
5.72 | %
| |
| 4.05
4.53 | %
| |
| 0.81
0.81 | %
|
| Investor Class Shares3 | | Maximum 4.5% Initial Sales Charge | | With sales charges Excluding sales charges | |
| 1.07
5.83 |
| |
| 4.70
5.67 |
| |
| 4.00
4.48 |
| |
| 0.82
0.82 |
|
| Class B Shares | | Maximum 5% CDSC
if Redeemed Within the First Six Years of Purchase | | With sales charges Excluding sales charges | |
| 0.58
5.58 |
| |
| 5.09
5.41 |
| |
| 4.21
4.21 |
| |
| 1.07
1.07 |
|
| Class C Shares | | Maximum 1% CDSC
if Redeemed Within One Year of Purchase | | With sales charges Excluding sales charges | |
| 4.48
5.48 |
| |
| 5.39
5.39 |
| |
| 4.21
4.21 |
| |
| 1.07
1.07 |
|
| Class I Shares4 | | No Sales Charge | | | | | 5.99 | | | | 5.96 | | | | 4.77 | | | | 0.56 | |
| 1. | The performance table and graph do not reflect the deduction of taxes that a shareholder would pay on distributions or Fund share redemptions. Total returns reflect maximum applicable sales charges as indicated in the table above, if any, changes in share price, and reinvestment of dividend and capital gain distributions. The graph assumes the initial investment amount shown above and reflects the deduction of all sales charges that would have applied for the period of investment. Performance figures may reflect certain fee waivers and/or expense limitations, without which total returns may have been lower. For more information on share classes and current fee waivers and/or expense limitations (if any), please refer to the notes to the financial statements. |
| 2. | The gross expense ratios presented reflect the Fund’s “Total Annual Fund Operating Expenses” from the most recent Prospectus and may differ from other expense ratios disclosed in this report. |
| 3. | Performance figures for Investor Class shares, first offered on February 28, 2008, include the historical performance of Class A shares through February 27, 2008, adjusted for differences in certain fees and expenses. Unadjusted, the performance shown for the Investor Class shares would likely have been different. |
| 4. | Performance figures for Class I shares, first offered on December 21, 2009, include the historical performance of Class B shares through December 20, 2009, adjusted for differences in certain fees and expenses. Unadjusted, the performance shown for the Class I shares would likely have been different. |
The footnotes on the next page are an integral part of the table and graph and should be carefully read in conjunction with them.
| | | | | | | | | | | | |
| Benchmark Performance | | One
Year | | | Five
Years | | | Ten
Years | |
Bloomberg Barclays Municipal Bond Index5 | | | 4.06 | % | | | 4.34 | % | | | 4.57 | % |
Average Lipper General & Insured Municipal Debt Fund6 | | | 4.27 | | | | 4.58 | | | | 3.92 | |
| 5. | The Bloomberg Barclays Municipal Bond Index is the Fund’s primary broad-based securities market index for comparison purposes. The Bloomberg Barclays Municipal Bond Index is considered representative of the broad market for investment-grade, tax-exempt bonds with a maturity of at least one year. Bonds subject to the alternative minimum tax or with floating or zero coupons are excluded. Results assume the reinvestment of all dividends and capital gains. An investment cannot be made directly in an index. |
| 6. | The Average Lipper General & Insured Municipal Debt Fund is representative of funds that, by portfolio practice, either invest primarily in municipal debt issues rated in the top four credit ratings or invest primarily in municipal debt issues insured as to timely payment. This benchmark is a product of Lipper Inc. Lipper Inc. is an independent monitor of fund performance. Results are based on average total returns of similar funds with all dividend and capital gain distributions reinvested. |
The footnotes on the preceding page are an integral part of the table and graph and should be carefully read in conjunction with them.
| | |
| 6 | | MainStay Tax Free Bond Fund |
Cost in Dollars of a $1,000 Investment in MainStay Tax Free Bond Fund (Unaudited)
The example below is intended to describe the fees and expenses borne by shareholders during the six-month period from May 1, 2016, to October 31, 2016, and the impact of those costs on your investment.
Example
As a shareholder of the Fund, you incur two types of costs: (1) transaction costs, including exchange fees and sales charges (loads) on purchases (as applicable), and (2) ongoing costs, including management fees, distribution and/or service (12b-1) fees, and other Fund expenses (as applicable). This example is intended to help you understand your ongoing costs (in dollars) of investing in the Fund and to compare these costs with the ongoing costs of investing in other mutual funds. The example is based on an investment of $1,000 made at the beginning of the six-month period and held for the entire period from May 1, 2016, to October 31, 2016.
This example illustrates your Fund’s ongoing costs in two ways:
Actual Expenses
The second and third data columns in the table below provide information about actual account values and actual expenses. You may use the information in these columns, together with the amount you invested, to estimate the expenses that you paid during the six months ended October 31, 2016. Simply divide your account value by $1,000 (for example, an $8,600 account value divided by $1,000 = 8.6), then
multiply the result by the number under the heading entitled “Expenses Paid During Period” to estimate the expenses you paid on your account during this period.
Hypothetical Example for Comparison Purposes
The fourth and fifth data columns in the table below provide information about hypothetical account values and hypothetical expenses based on the Fund’s actual expense ratio and an assumed rate of return of 5% per year before expenses, which is not the Fund’s actual return. The hypothetical account values and expenses may not be used to estimate the actual ending account balances or expenses you paid for the six-month period shown. You may use this information to compare the ongoing costs of investing in the Fund with the ongoing costs of investing in other Funds. To do so, compare this 5% hypothetical example with the 5% hypothetical examples that appear in the shareholder reports of the other Funds.
Please note that the expenses shown in the table are meant to highlight your ongoing costs only and do not reflect any transactional costs, such as exchange fees or sales charges (loads). Therefore, the fourth and fifth data columns of the table are useful in comparing ongoing costs only and will not help you determine the relative total costs of owning different funds. In addition, if these transactional costs were included, your costs would have been higher.
| | | | | | | | | | | | | | | | | | | | |
| | | | | | | | | | | | | | | | |
| Share Class | | Beginning
Account
Value
5/1/16 | | | Ending Account
Value (Based
on Actual
Returns and
Expenses)
10/31/16 | | | Expenses
Paid
During
Period1 | | | Ending Account
Value (Based
on Hypothetical
5% Annualized
Return and
Actual Expenses)
10/31/16 | | | Expenses
Paid
During
Period1 | |
| | | | | |
| Class A Shares | | $ | 1,000.00 | | | $ | 1,010.60 | | | $ | 4.09 | | | $ | 1,021.10 | | | $ | 4.12 | |
| | | | | |
| Investor Class Shares | | $ | 1,000.00 | | | $ | 1,010.70 | | | $ | 3.99 | | | $ | 1,021.20 | | | $ | 4.01 | |
| | | | | |
| Class B Shares | | $ | 1,000.00 | | | $ | 1,009.50 | | | $ | 5.20 | | | $ | 1,020.00 | | | $ | 5.23 | |
| | | | | |
| Class C Shares | | $ | 1,000.00 | | | $ | 1,008.50 | | | $ | 5.20 | | | $ | 1,020.00 | | | $ | 5.23 | |
| | | | | |
| Class I Shares | | $ | 1,000.00 | | | $ | 1,010.90 | | | $ | 2.83 | | | $ | 1,022.30 | | | $ | 2.85 | |
| 1. | Expenses are equal to the Fund’s annualized expense ratio of each class (0.81% for Class A, 0.79% for Investor Class, 1.03% for Class B and Class C and 0.56% for Class I) multiplied by the average account value over the period, divided by 366 and multiplied by 184 (to reflect the six-month period). The table above represents the actual expenses incurred during the six-month period. |
Portfolio Composition as of October 31, 2016 (Unaudited)
| | | | |
| Illinois | | | 16.0 | % |
| New York | | | 12.0 | |
| California | | | 10.0 | |
| Texas | | | 8.4 | |
| Puerto Rico | | | 6.7 | |
| Michigan | | | 4.6 | |
| New Jersey | | | 4.0 | |
| Pennsylvania | | | 3.8 | |
| Ohio | | | 3.5 | |
| Connecticut | | | 2.8 | |
| Florida | | | 2.6 | |
| U.S. Virgin Islands | | | 2.6 | |
| Rhode Island | | | 2.2 | |
| Missouri | | | 2.1 | |
| Tennessee | | | 2.0 | |
| District of Columbia | | | 1.8 | |
| Guam | | | 1.8 | |
| Massachusetts | | | 1.7 | |
| Nebraska | | | 1.6 | |
| Wisconsin | | | 1.2 | |
| Louisiana | | | 1.0 | |
| South Carolina | | | 1.0 | |
| Utah | | | 0.9 | |
| | | | |
| Alabama | | | 0.7 | % |
| Oklahoma | | | 0.7 | |
| Kentucky | | | 0.6 | |
| Arkansas | | | 0.5 | |
| Colorado | | | 0.5 | |
| Indiana | | | 0.5 | |
| Kansas | | | 0.5 | |
| Georgia | | | 0.4 | |
| South Dakota | | | 0.4 | |
| Hawaii | | | 0.3 | |
| New Hampshire | | | 0.3 | |
| North Carolina | | | 0.3 | |
| Washington | | | 0.3 | |
| Alaska | | | 0.2 | |
| Maryland | | | 0.2 | |
| Mississippi | | | 0.2 | |
| North Dakota | | | 0.2 | |
| Iowa | | | 0.1 | |
| New Mexico | | | 0.1 | |
| Arizona | | | 0.0 | ‡ |
| Wyoming | | | 0.0 | ‡ |
| Other Assets, Less Liabilities | | | –1.3 | |
| | | | |
| | | 100.0 | % |
| | | | |
See Portfolio of Investments beginning on page 11 for specific holdings within these categories.
| ‡ | Less than one-tenth of a percent. |
Top Ten Issuers Held as of October 31, 2016 (Unaudited)
| 1. | North Texas Tollway Authority, Revenue Bonds, 5.00%–6.00%, due 1/1/27–9/1/41 |
| 2. | Puerto Rico Highways & Transportation Authority, Revenue Bonds, 5.00%–5.50%, due 7/1/21–7/1/36 |
| 3. | New York City Transitional Finance Authority, Future Tax Secured, Revenue Bonds, 0.73%–5.00%, due 11/1/22–2/1/41 |
| 4. | Virgin Islands Public Finance Authority, Revenue Bonds, 5.00%, due 10/1/30–10/1/39 |
| 5. | Central Plains Energy, Project No. 3, Revenue Bonds, 5.00%–5.25%, due 9/1/32–9/1/42 |
| 6. | County of Cook IL, Unlimited General Obligation, 5.00%, due 11/15/26–11/15/28 |
| 7. | Chicago Board of Education, Unlimited General Obligation, 5.00%–5.50%, due 12/1/32–12/1/39 |
| 8. | State of Illinois, Unlimited General Obligation, 4.00%–5.00%, due 8/1/20–6/1/41 |
| 9. | Commonwealth of Puerto Rico, Public Improvement, Unlimited General Obligation, 4.00%–6.00%, due 7/1/19–7/1/37 |
| 10. | New York Transportation Development Corp., LaGuardia Airport Terminal B Redevelopment Project, Revenue Bonds, 4.00%, due 7/1/31–7/1/36 |
| | |
| 8 | | MainStay Tax Free Bond Fund |
Portfolio Management Discussion and Analysis (Unaudited)
Questions answered by portfolio managers John Loffredo, CFA, Robert DiMella, CFA, Michael Petty, David Dowden, Scott Sprauer and Frances Lewis of MacKay Shields LLC, the Fund’s Subadvisor.
How did MainStay Tax Free Bond Fund perform relative to its primary benchmark and peers during the 12 months ended October 31, 2016?
Excluding all sales charges, MainStay Tax Free Bond Fund returned 5.73% for Class A shares, 5.83% for Investor Class shares, 5.58% for Class B shares and 5.48% for Class C shares for the 12 months ended October 31, 2016. Over the same period, Class I shares returned 5.99%. For the 12 months ended October 31, 2016, all share classes outperformed the 4.06% return of the Bloomberg Barclays Municipal Bond Index,1 which is the Fund’s broad-based securities-market index, and the 4.27% return of the Average Lipper2 General & Insured Municipal Debt Fund. See page 5 for Fund returns with applicable sales charges.
What factors affected the Fund’s relative performance during the reporting period?
The Fund received positive contributions relative to the Bloomberg Barclays Municipal Bond Index from its emphasis on longer-maturity bonds and medium-quality credits as the municipal yield curve3 flattened and credit spreads4 narrowed during the reporting period. (Contributions take weightings and total returns into account.) Security selection in Puerto Rico–insured bonds, as well as in California and Michigan bonds, also helped performance relative to the Bloomberg Barclays Municipal Bond Index. The Fund’s exposure to Virginia and New Jersey credits, however, detracted slightly from relative performance.
What was the Fund’s duration5 strategy during the reporting period?
During the reporting period, the Fund’s duration was targeted to remain in a neutral range relative to the bonds in which the Fund can invest, as outlined in the prospectus. This target typically places the Fund’s duration within plus or minus 10% of the benchmark’s duration. As of October 31, 2016, the Fund’s modified duration to worst6 was 5.5 years.
What specific factors, risks or market forces prompted significant decisions for the Fund during the reporting period?
We believed that the Federal Reserve’s desire to raise the federal funds target rate would combine with strong demand for
longer-term municipal bonds to produce changes to the shape of the yield curve and alter credit spreads. Our expectation of a flatter yield curve and continued spread tightening were therefore significant drivers of Fund positioning during the reporting period, and the Fund’s positive cash flow was invested accordingly. In the primary and secondary markets, we found attractive opportunities to invest in bonds maturing in 10 to 15 years, with an emphasis on credit-sensitive securities. The Fund continued to increase its exposure to Build America Mutual Insurance Company (BAM) because we believed that spreads for wrapped (insured) bonds would continue to decline, especially for this new entry into the insurance space. Insured Puerto Rico securities performed well during the reporting period as the passage of a debt restructuring law (PROMESA) and establishment of a federal oversight board was viewed constructively by investors who bid prices higher. The Fund maintained its Puerto Rico exposure with heavy emphasis on bonds insured by AA-rated monoline insurance companies. The Fund also maintained elevated liquidity to be well-positioned to seek to take advantage of opportunities during bouts of volatility in the market, as uncertainty over the outcome of the presidential election left many investors trying to discern the market impact of each candidate’s agenda.
During the reporting period, which sectors were the strongest positive contributors to the Fund’s performance and which sectors were particularly weak?
The most substantial positive contributions to the Fund’s performance during the reporting period came from its bonds in the electric utilities, special tax, transportation, and water and sewer sectors. Detracting from performance was the Fund’s exposure to industrial development bonds.
How did the Fund’s sector weightings change during the reporting period?
The Fund’s sector weightings did not materially change from the prior reporting period. We continued to emphasize a well-diversified portfolio and remained committed to individual security selection (as opposed to a top-down approach to portfolio construction). As the municipal yield curve continued to flatten, new purchases have concentrated in bonds maturing in 10 to 15 years, causing the average maturity to decline. Sectors that
| 1. | See footnote on page 6 for more information on the Bloomberg Barclays Municipal Bond Index. |
| 2. | See footnote on page 6 for more information on Lipper Inc. |
| 3. | The yield curve is a line that plots the yields of various securities of similar quality—typically U.S. Treasury issues—across a range of maturities. The U.S. Treasury yield curve serves as a benchmark for other debt and is used in economic forecasting. |
| 4. | The terms “spread” and “yield spread” may refer to the difference in yield between a security or type of security and comparable U.S. Treasury issues. The terms may also refer to the difference in yield between two specific securities or types of securities at a given time. The term “credit spread” typically refers to the difference in yield between corporate or municipal bonds (or a specific category of these bonds) and comparable U.S. Treasury issues. |
| 5. | Duration is a measure of the price sensitivity of a fixed-income investment to changes in interest rates. Duration is expressed as a number of years and is considered a more accurate sensitivity gauge than average maturity. |
| 6. | Modified duration is inversely related to the approximate percentage change in price for a given change in yield. Duration to worst is the duration of a bond computed using the bond’s nearest call date or maturity, whichever comes first. This measure ignores future cash flow fluctuations due to embedded optionality. |
we continued to favor were marginally increased, including special tax, hospitals and insured bonds. We also increased the Fund’s cash reserves for defensive purposes. From a state perspective, we continued to decrease the Fund’s exposure to California securities after their significant outperformance over the past four years. The Fund also reduced its exposure to BBB-rated7 securities.
How was the Fund positioned at the end of the reporting period?
As of October 31, 2016, the Fund was overweight relative to the Bloomberg Barclays Municipal Bond Index in bonds with
maturities of 15 years or longer, although new purchases have concentrated on slightly shorter maturities. As of the same date, the Fund also held an overweight position relative to the Index in credits rated BBB. As of October 31, 2016, the Fund held underweight positions relative to the Index in securities rated AAA8 and in bonds with maturities of less than 10 years.
| 7. | An obligation rated ‘BBB’ by Standard & Poor’s (“S&P”) is deemed by S&P to exhibit adequate protection parameters. In the opinion of S&P, however, adverse economic conditions or changing circumstances are more likely to lead to a weakened capacity of the obligor to meet its financial commitment on the obligation. When applied to Fund holdings, ratings are based solely on the creditworthiness of the bonds in the portfolio and are not meant to represent the security or safety of the Fund. |
| 8. | An obligation rated ‘AAA’ has the highest rating assigned by S&P, and in the opinion of S&P, the obligor’s capacity to meet its financial commitment on the obligation is extremely strong. When applied to Fund holdings, ratings are based solely on the creditworthiness of the bonds in the portfolio and are not meant to represent the security or safety of the Fund. |
The opinions expressed are those of the portfolio managers as of the date of this report and are subject to change. There is no guarantee that any forecasts will come to pass. This material does not constitute investment advice and is not intended as an endorsement of any specific investment.
| | |
| 10 | | MainStay Tax Free Bond Fund |
Portfolio of Investments October 31, 2016
| | | | | | | | |
| | | Principal
Amount | | | Value | |
| Municipal Bonds 101.3%† | | | | | | | | |
Alabama 0.7% | | | | | | | | |
Houston County Health Care Authority, Southeast Alabama Medical, Revenue Bonds | | | | | | | | |
5.00%, due 10/1/25 | | $ | 1,000,000 | | | $ | 1,189,230 | |
5.00%, due 10/1/30 | | | 3,700,000 | | | | 4,223,143 | |
University of South Alabama, Revenue Bonds | | | | | | | | |
Insured: AGM
4.00%, due 11/1/35 | | | 3,000,000 | | | | 3,257,520 | |
Insured: AGM
5.00%, due 11/1/27 | | | 2,000,000 | | | | 2,468,180 | |
Insured: AGM
5.00%, due 11/1/28 | | | 2,105,000 | | | | 2,573,257 | |
Insured: AGM
5.00%, due 11/1/29 | | | 1,110,000 | | | | 1,348,517 | |
Insured: AGM
5.00%, due 11/1/30 | | | 2,000,000 | | | | 2,416,380 | |
| | | | | | | | |
| | | | | | | 17,476,227 | |
| | | | | | | | |
Alaska 0.2% | | | | | | | | |
Alaska Industrial Development & Export Authority, FairBanks Community Hospital, Revenue Bonds
5.00%, due 4/1/32 | | | 3,550,000 | | | | 3,997,939 | |
| | | | | | | | |
| | |
Arizona 0.0%‡ | | | | | | | | |
Arizona Health Facilities Authority, Phoenix Children’s Hospital, Revenue Bonds
Series A
5.00%, due 2/1/42 | | | 1,000,000 | | | | 1,093,130 | |
| | | | | | | | |
| | |
Arkansas 0.5% | | | | | | | | |
County of Pulaski AR, Arkansas Children’s Hospital, Revenue Bonds | | | | | | | | |
5.00%, due 3/1/34 | | | 2,000,000 | | | | 2,358,900 | |
5.00%, due 3/1/35 | | | 1,550,000 | | | | 1,820,894 | |
5.00%, due 3/1/36 | | | 1,155,000 | | | | 1,359,019 | |
Springdale Public Facilities Board, Arkansas Children’s Northwest, Revenue Bonds
5.00%, due 3/1/34 | | | 2,890,000 | | | | 3,446,816 | |
University of Arkansas, UALR Campus, Revenue Bonds | | | | | | | | |
5.00%, due 10/1/29 | | | 1,315,000 | | | | 1,621,961 | |
5.00%, due 10/1/30 | | | 1,110,000 | | | | 1,361,126 | |
5.00%, due 10/1/31 | | | 1,205,000 | | | | 1,469,305 | |
| | | | | | | | |
| | | | | | | 13,438,021 | |
| | | | | | | | |
| | | | | | | | |
| | | Principal
Amount | | | Value | |
California 10.0% | | | | | | | | |
Anaheim Public Financing Authority, Public Improvements Project, Revenue Bonds
Series A-1, Insured: NATL-RE
4.75%, due 9/1/33 | | $ | 15,675,000 | | | $ | 16,177,854 | |
Anaheim, California, School District, Election 2010, Unlimited General Obligation
Insured: AGM
6.25%, due 8/1/40 | | | 4,700,000 | | | | 5,820,762 | |
California Educational Facilities Authority, San Francisco University, Revenue Bonds
6.125%, due 10/1/30 | | | 1,525,000 | | | | 1,869,436 | |
California Health Facilities Financing Authority, Adventist Health System, Revenue Bonds
Series B
0.46%, due 9/1/38 (a) | | | 8,650,000 | | | | 8,650,000 | |
California Health Facilities Financing Authority, Catholic Healthcare, Revenue Bonds
Series H
0.58%, due 7/1/33 (a) | | | 15,000,000 | | | | 15,000,000 | |
California Health Facilities Financing Authority, Dignity Health, Revenue Bonds
Series A
6.00%, due 7/1/34 | | | 3,000,000 | | | | 3,360,750 | |
California Health Facilities Financing Authority, Sutter Health, Revenue Bonds
Series A
5.00%, due 11/15/34 | | | 5,000,000 | | | | 5,943,300 | |
California School Facilities Financing Authority, Azusa Unified School District, Revenue Bonds
Insured: AGM
(zero coupon), due 8/1/49 | | | 15,000,000 | | | | 3,526,350 | |
California State Public Works Board, Various Capital Project, Revenue Bonds | | | | | | | | |
Series G-1
5.75%, due 10/1/30 | | | 1,400,000 | | | | 1,577,394 | |
Series I-1
6.625%, due 11/1/34 | | | 1,060,000 | | | | 1,063,604 | |
California State, Unlimited General Obligation
4.00%, due 9/1/34 | | | 2,000,000 | | | | 2,194,160 | |
| † | Percentages indicated are based on Fund net assets. |
| ¨ | | Among the Fund’s 10 largest issuers held, as of October 31, 2016, excluding short-term investment. May be subject to change daily. (Unaudited) |
| | | | | | |
The notes to the financial statements are an integral part of,
and should be read in conjunction with, the financial statements. | | | | | 11 | |
Portfolio of Investments October 31, 2016 (continued)
| | | | | | | | |
| | | Principal
Amount | | | Value | |
| Municipal Bonds (continued) | | | | | | | | |
California (continued) | | | | | | | | |
California Statewide Communities Development Authority, Aspire Public Schools, Revenue Bonds
6.375%, due 7/1/45 | | $ | 780,000 | | | $ | 869,895 | |
California Statewide Communities Development Authority, Cottage Health Obligation Group, Revenue Bonds
5.25%, due 11/1/30 | | | 1,475,000 | | | | 1,665,378 | |
California Statewide Communities Development Authority, Sweep Loan Program, Revenue Bonds
Series A
0.63%, due 8/1/35 (a) | | | 16,495,000 | | | | 16,495,000 | |
Ceres Unified School District, Capital Appreciation-Election 2008, Unlimited General Obligation
Series A
(zero coupon), due 8/1/37 | | | 4,150,000 | | | | 1,152,538 | |
City of Escondido CA, Unlimited General Obligation
5.00%, due 9/1/36 | | | 5,000,000 | | | | 5,958,850 | |
City of Long Beach CA, Airport System, Revenue Bonds
Series A
5.00%, due 6/1/30 | | | 5,000,000 | | | | 5,589,500 | |
City of Tulare, California, Sewer Revenue Bonds
Insured: AGM
4.00%, due 11/15/41 | | | 5,500,000 | | | | 5,937,085 | |
Colton Joint Unified School District, Unlimited General Obligation | | | | | | | | |
Series B, Insured: BAM
4.00%, due 8/1/30 | | | 3,495,000 | | | | 3,917,091 | |
Series B, Insured: BAM
4.00%, due 8/1/31 | | | 2,500,000 | | | | 2,779,150 | |
Series B, Insured: BAM
4.00%, due 8/1/33 | | | 1,500,000 | | | | 1,648,575 | |
Fontana Public Finance Authority, Revenue Bonds
Series A, Insured: BAM
5.00%, due 9/1/32 | | | 2,640,000 | | | | 3,100,653 | |
Fontana Unified School District, Cabs, Unlimited General Obligation | | | | | | | | |
Series C
(zero coupon), due 8/1/35 | | | 14,800,000 | | | | 6,627,292 | |
Series C
(zero coupon), due 8/1/36 | | | 15,500,000 | | | | 6,443,815 | |
| | | | | | | | |
| | | Principal
Amount | | | Value | |
California (continued) | | | | | | | | |
Fresno California Unified School District, Election 2001, Unlimited General Obligation | | | | | | | | |
Series G
(zero coupon), due 8/1/32 | | $ | 6,000,000 | | | $ | 2,637,420 | |
Series G
(zero coupon), due 8/1/33 | | | 10,000,000 | | | | 4,072,600 | |
Fresno Unified School District, Election 2001, Unlimited General Obligation
Series G
(zero coupon), due 8/1/41 | | | 23,485,000 | | | | 5,451,808 | |
Golden State Tobacco Securitization Corp., Asset Backed, Revenue Bonds
Series A, Insured: AGM
5.00%, due 6/1/40 | | | 5,410,000 | | | | 6,380,175 | |
Irvine Unified School District, Community Facilities District No. 9, Special Tax
0.46%, due 9/1/56 (a) | | | 15,000,000 | | | | 15,000,000 | |
Oakland Unified School District, Alameda County, Unlimited General Obligation | | | | | | | | |
Insured: AGM
5.00%, due 8/1/27 | | | 1,160,000 | | | | 1,453,202 | |
Insured: AGM
5.00%, due 8/1/28 | | | 1,755,000 | | | | 2,178,692 | |
Insured: AGM
5.00%, due 8/1/29 | | | 2,535,000 | | | | 3,118,988 | |
Oceanside Unified School District CA, Unrefunded-Cabs-Election 2008, Unlimited General Obligation
Series B, Insured: AGM
(zero coupon), due 8/1/49 | | | 560,000 | | | | 70,790 | |
Palomar Community College District, CABS-Election, Unlimited General Obligation
Series B
(zero coupon), due 8/1/45 | | | 5,720,000 | | | | 4,348,287 | |
Paramount Unified School District, Unlimited General Obligation
Insured: BAM
(zero coupon), due 8/1/43 | | | 25,000,000 | | | | 5,406,750 | |
Peralta Community College District, Election 2006, Unlimited General Obligation
Series D
4.00%, due 8/1/39 | | | 5,000,000 | | | | 5,410,100 | |
Pomona Unified School District, Election 2008, Unlimited General Obligation
Series E, Insured: AGM
5.00%, due 8/1/30 | | | 3,285,000 | | | | 3,858,659 | |
| | | | |
| 12 | | MainStay Tax Free Bond Fund | | The notes to the financial statements are an integral part of,
and should be read in conjunction with, the financial statements. |
| | | | | | | | |
| | | Principal
Amount | | | Value | |
| Municipal Bonds (continued) | | | | | | | | |
California (continued) | | | | | | | | |
Riverside County Redevelopment Successor Agency, Jurupa Valley Project, Tax Allocation | | | | | | | | |
Series B, Insured: BAM
5.00%, due 10/1/28 | | $ | 2,510,000 | | | $ | 3,054,595 | |
Series B, Insured: BAM
5.00%, due 10/1/29 | | | 875,000 | | | | 1,057,604 | |
Series B, Insured: BAM
5.00%, due 10/1/30 | | | 2,645,000 | | | | 3,177,571 | |
Riverside County Transportation Commission, Limited Tax, Revenue Bonds
Series A
5.25%, due 6/1/30 | | | 3,000,000 | | | | 3,632,070 | |
San Bernardino City Unified School District, Election 2012, Unlimited General Obligation
Series A, Insured: AGM
5.00%, due 8/1/30 | | | 1,000,000 | | | | 1,167,880 | |
San Diego Public Facilities Financing Authority, Capital Improvement Projects, Revenue Bonds
Series A
5.00%, due 10/15/44 | | | 3,000,000 | | | | 3,527,340 | |
San Lorenzo Unified School District, Election 2008, Unlimited General Obligation
Series B
6.00%, due 8/1/41 | | | 4,535,000 | | | | 5,427,216 | |
Santa Ana Unified School District, Capital Appreciation-Election 2008, Unlimited General Obligation
Series B, Insured: AGC
(zero coupon), due 8/1/47 | | | 50,000,000 | | | | 15,785,000 | |
Santa Clara Valley Transportation Authority, Revenue Bonds
Series A
5.00%, due 4/1/35 | | | 3,900,000 | | | | 4,648,878 | |
Southern California Public Power Authority, Apex Power Project, Revenue Bonds
Series A
5.00%, due 7/1/33 | | | 4,500,000 | | | | 5,391,360 | |
State of California, Unlimited General Obligation | | | | | | | | |
6.00%, due 11/1/35 | | | 2,500,000 | | | | 2,855,200 | |
6.25%, due 11/1/34 | | | 4,000,000 | | | | 4,604,120 | |
| | | | | | | | |
| | | Principal
Amount | | | Value | |
California (continued) | | | | | | | | |
Twin Rivers Unified School District, Unrefunded-Cabs-Election 2006, Unlimited General Obligation
Insured: AGM
(zero coupon), due 8/1/32 | | $ | 5,350,000 | | | $ | 3,128,894 | |
Westminster School District, CABS, Election 2008, Unlimited General Obligation
Series B, Insured: BAM
(zero coupon), due 8/1/48 | | | 13,900,000 | | | | 2,108,352 | |
| | | | | | | | |
| | | | | | | 246,321,983 | |
| | | | | | | | |
Colorado 0.5% | | | | | | | | |
Colorado Health Facilities Authority, Evangelical Lutheran Good Samaritan, Revenue Bonds
5.625%, due 6/1/43 | | | 3,280,000 | | | | 3,785,513 | |
Denver Convention Center Hotel Authority, Revenue Bonds | | | | | | | | |
5.00%, due 12/1/30 | | | 1,305,000 | | | | 1,500,972 | |
5.00%, due 12/1/31 | | | 1,395,000 | | | | 1,595,364 | |
5.00%, due 12/1/32 | | | 2,500,000 | | | | 2,843,025 | |
5.00%, due 12/1/36 | | | 1,000,000 | | | | 1,125,390 | |
Park Creek Metropolitan District, Revenue Bonds
Series A, Insured: AGM
6.125%, due 12/1/41 | | | 1,600,000 | | | | 1,914,480 | |
| | | | | | | | |
| | | | | | | 12,764,744 | |
| | | | | | | | |
Connecticut 2.8% | | | | | | | | |
City of Hartford CT, Unlimited General Obligation | | | | | | | | |
Series A
5.00%, due 4/1/28 | | | 2,500,000 | | | | 2,653,725 | |
Series A
5.00%, due 4/1/29 | | | 1,250,000 | | | | 1,370,161 | |
Series A, Insured: AGM
5.00%, due 4/1/32 | | | 275,000 | | | | 312,338 | |
Series C, Insured: AGM
5.00%, due 7/15/32 | | | 7,470,000 | | | | 8,375,738 | |
Series C, Insured: AGM
5.00%, due 7/15/34 | | | 2,500,000 | | | | 2,787,150 | |
Connecticut State Health & Educational Facility Authority, Quinnipiac University, Revenue Bonds
Series L
5.00%, due 7/1/32 | | | 10,425,000 | | | | 12,204,964 | |
State of Connecticut Special Tax, Transportation Infrastructure, Revenue Bonds | | | | | | | | |
Series A
5.00%, due 9/1/26 | | | 10,000,000 | | | | 12,604,500 | |
| | | | | | |
The notes to the financial statements are an integral part of,
and should be read in conjunction with, the financial statements. | | | | | 13 | |
Portfolio of Investments October 31, 2016 (continued)
| | | | | | | | |
| | | Principal
Amount | | | Value | |
| Municipal Bonds (continued) | | | | | | | | |
Connecticut (continued) | | | | | | | | |
State of Connecticut Special Tax, Transportation Infrastructure, Revenue Bonds (continued) | | | | | | | | |
Series A
5.00%, due 9/1/27 | | $ | 12,460,000 | | | $ | 15,516,936 | |
Series A
5.00%, due 9/1/30 | | | 5,000,000 | | | | 5,986,250 | |
State of Connecticut, Unlimited General Obligation
Series B
5.00%, due 6/15/32 | | | 5,000,000 | | | | 5,873,050 | |
| | | | | | | | |
| | | | | | | 67,684,812 | |
| | | | | | | | |
District of Columbia 1.8% | | | | | | | | |
District of Columbia, Carnegie, Revenue Bonds
0.63%, due 11/1/45 (a) | | | 15,000,000 | | | | 15,000,000 | |
District of Columbia, Friendship Public Charter School, Inc., Revenue Bonds | | | | | | | | |
5.00%, due 6/1/32 | | | 1,125,000 | | | | 1,255,309 | |
5.00%, due 6/1/42 | | | 5,500,000 | | | | 6,072,550 | |
District of Columbia, Gallery Place Project, Tax Allocation
5.00%, due 6/1/27 | | | 525,000 | | | | 587,312 | |
District of Columbia, KIPP Charter School, Revenue Bonds | | | | | | | | |
6.00%, due 7/1/43 | | | 1,000,000 | | | | 1,193,330 | |
6.00%, due 7/1/48 | | | 1,575,000 | | | | 1,874,218 | |
Metropolitan Washington Airports Authority Dulles Toll Road, Revenue Bonds | | | | | | | | |
Series B
(zero coupon), due 10/1/44 | | | 7,140,000 | | | | 8,418,203 | |
Series C, Insured: AGC
6.50%, due 10/1/41 | | | 8,000,000 | | | | 10,955,440 | |
| | | | | | | | |
| | | | | | | 45,356,362 | |
| | | | | | | | |
Florida 2.6% | | | | | | | | |
City of Miami Beach FL Parking, Revenue Bonds | | | | | | | | |
Insured: BAM
5.00%, due 9/1/34 | | | 1,000,000 | | | | 1,170,220 | |
Insured: BAM
5.00%, due 9/1/35 | | | 1,990,000 | | | | 2,321,952 | |
Insured: BAM
5.00%, due 9/1/40 | | | 2,500,000 | | | | 2,889,575 | |
City of Orlando FL, Revenue Bonds
Series C, Insured: AGC
5.50%, due 11/1/38 | | | 15,000,000 | | | | 15,584,400 | |
County of Miami-Dade Florida Transit System, Sales Tax, Revenue Bonds
5.00%, due 7/1/42 | | | 8,265,000 | | | | 9,491,113 | |
| | | | | | | | |
| | | Principal
Amount | | | Value | |
Florida (continued) | | | | | | | | |
County of Miami-Dade Florida Water & Sewer System, Revenue Bonds | | | | | | | | |
5.00%, due 10/1/26 | | $ | 6,750,000 | | | $ | 8,385,255 | |
Series A
5.00%, due 10/1/42 | | | 5,000,000 | | | | 5,739,750 | |
County of Miami-Dade Florida, Jackson Health System, Revenue Bonds
Series A, Insured: BAM
5.00%, due 6/1/33 | | | 3,375,000 | | | | 3,951,990 | |
Miami Beach Redevelopment Agency, Tax Increment Revenue City Center, Tax Allocation
5.00%, due 2/1/30 | | | 3,000,000 | | | | 3,507,390 | |
Miami-Dade County Florida Aviation, Miami International Airport, Revenue Bonds
Series A, Insured: AGM
5.25%, due 10/1/41 (b) | | | 10,000,000 | | | | 10,640,100 | |
Miami-Dade County Florida Aviation, Revenue Bonds
5.00%, due 10/1/31 | | | 750,000 | | | | 899,902 | |
| | | | | | | | |
| | | | | | | 64,581,647 | |
| | | | | | | | |
Georgia 0.4% | | | | | | | | |
City of Atlanta, Georgia, Water & Wastewater, Revenue Bonds
5.00%, due 11/1/40 | | | 7,120,000 | | | | 8,326,911 | |
Fulton County Georgia Development Authority, Piedmont Healthcare, Inc., Revenue Bonds
Series A
5.00%, due 6/15/32 | | | 1,700,000 | | | | 1,826,004 | |
| | | | | | | | |
| | | | | | | 10,152,915 | |
| | | | | | | | |
Guam 1.8% | | | | | | | | |
Antonio B Won Pat International Airport Authority, Revenue Bonds
Series C, Insured: AGM
6.125%, due 10/1/43 (b) | | | 5,000,000 | | | | 5,907,650 | |
Guam Government, Waterworks Authority, Revenue Bonds | | | | | | | | |
5.00%, due 7/1/36 | | | 1,750,000 | | | | 2,005,360 | |
5.00%, due 1/1/46 | | | 2,500,000 | | | | 2,846,975 | |
Guam Power Authority, Revenue Bonds | | | | | | | | |
Series A, Insured: AGM
5.00%, due 10/1/30 | | | 5,610,000 | | | | 6,530,994 | |
Series A, Insured: AGM
5.00%, due 10/1/44 | | | 655,000 | | | | 748,174 | |
Territory of Guam, Revenue Bonds | | | | | | | | |
Series A
5.00%, due 12/1/32 | | | 1,250,000 | | | | 1,462,550 | |
Series D
5.00%, due 11/15/35 | | | 8,350,000 | | | | 9,465,476 | |
| | | | |
| 14 | | MainStay Tax Free Bond Fund | | The notes to the financial statements are an integral part of,
and should be read in conjunction with, the financial statements. |
| | | | | | | | |
| | | Principal
Amount | | | Value | |
| Municipal Bonds (continued) | | | | | | | | |
Guam (continued) | | | | | | | | |
Territory of Guam, Revenue Bonds (continued) | | | | | | | | |
Series A
5.125%, due 1/1/42 | | $ | 3,085,000 | | | $ | 3,344,202 | |
Series A
5.25%, due 1/1/36 | | | 2,000,000 | | | | 2,190,740 | |
Series A
6.50%, due 11/1/40 | | | 2,700,000 | | | | 3,244,482 | |
Territory of Guam, Section 30, Revenue Bonds | | | | | | | | |
Series A
5.00%, due 12/1/27 | | | 2,265,000 | | | | 2,731,930 | |
Series A
5.00%, due 12/1/34 | | | 2,290,000 | | | | 2,655,644 | |
Series A
5.00%, due 12/1/36 | | | 1,000,000 | | | | 1,152,200 | |
| | | | | | | | |
| | | | | | | 44,286,377 | |
| | | | | | | | |
Hawaii 0.3% | | | | | | | | |
State of Hawaii Department of Budget & Finance, Hawaiian Electric Co., Revenue Bonds
6.50%, due 7/1/39 | | | 3,000,000 | | | | 3,349,110 | |
State of Hawaii Department of Budget & Finance, Queens Health System, Revenue Bonds
Series A
5.00%, due 7/1/35 | | | 4,500,000 | | | | 5,313,915 | |
| | | | | | | | |
| | | | | | | 8,663,025 | |
| | | | | | | | |
Illinois 16.0% | | | | | | | | |
Carol Stream Park District, Unlimited General Obligation
Insured: BAM
5.00%, due 1/1/37 | | | 4,620,000 | | | | 5,228,870 | |
Chicago Board of Education, School Reform, Unlimited General Obligation
Series A, Insured: NATL-RE
(zero coupon), due 12/1/26 | | | 19,995,000 | | | | 13,112,521 | |
¨Chicago Board of Education, Unlimited General Obligation | | | | | | | | |
Series C, Insured: AGM
5.00%, due 12/1/32 | | | 16,000,000 | | | | 16,760,160 | |
Series A, Insured: AGM
5.50%, due 12/1/39 | | | 11,455,000 | | | | 12,576,215 | |
Series A
5.50%, due 12/1/39 | | | 7,500,000 | | | | 7,069,950 | |
Chicago O’ Hare International Airport, Revenue Bonds | | | | | | | | |
Series A
5.00%, due 1/1/17 (b) | | | 14,955,000 | | | | 15,059,236 | |
| | | | | | | | |
| | | Principal
Amount | | | Value | |
Illinois (continued) | | | | | | | | |
Chicago O’ Hare International Airport, Revenue Bonds (continued) | | | | | | | | |
Series A, Insured: AGM
5.00%, due 1/1/33 | | $ | 7,000,000 | | | $ | 7,283,850 | |
Series A
5.625%, due 1/1/35 | | | 2,250,000 | | | | 2,586,105 | |
Chicago Park District, Limited General Obligation | | | | | | | | |
Series A
5.00%, due 1/1/28 | | | 1,000,000 | | | | 1,165,790 | |
Series A
5.00%, due 1/1/29 | | | 750,000 | | | | 866,528 | |
Series A
5.00%, due 1/1/31 | | | 1,000,000 | | | | 1,139,950 | |
Series A
5.00%, due 1/1/35 | | | 2,000,000 | | | | 2,242,860 | |
City of Chicago IL Motor Fuel Tax, Revenue Bonds
Insured: AGM
5.00%, due 1/1/33 | | | 4,725,000 | | | | 5,291,338 | |
City of Chicago IL Wastewater Transmission, Revenue Bonds | | | | | | | | |
5.00%, due 1/1/28 | | | 1,000,000 | | | | 1,137,050 | |
5.00%, due 1/1/33 | | | 2,000,000 | | | | 2,209,960 | |
5.00%, due 1/1/39 | | | 8,420,000 | | | | 9,230,846 | |
5.00%, due 1/1/44 | | | 14,340,000 | | | | 15,682,798 | |
City of Chicago IL Wastewater, Revenue Bonds | | | | | | | | |
5.00%, due 11/1/27 | | | 1,000,000 | | | | 1,172,200 | |
5.00%, due 11/1/29 | | | 1,700,000 | | | | 1,960,899 | |
City of Chicago IL, Unlimited General Obligation
Series A, Insured: AGM
5.00%, due 1/1/26 | | | 10,000,000 | | | | 10,683,800 | |
City of Country Club Hills IL, Unlimited General Obligation
Insured: BAM
4.50%, due 12/1/31 | | | 455,000 | | | | 486,259 | |
City of Springfield IL Electric, Senior Lien, Revenue Bonds
Insured: AGM
5.00%, due 3/1/40 | | | 10,000,000 | | | | 11,425,000 | |
Cook County Community College District No. 508, City College of Chicago, Unlimited General Obligation
Insured: BAM
5.50%, due 12/1/38 | | | 5,000,000 | | | | 5,799,100 | |
Cook County Community High School District No. 212 Leyden, Revenue Bonds | | | | | | | | |
Series C, Insured: BAM
5.00%, due 12/1/30 | | | 3,370,000 | | | | 3,892,586 | |
| | | | | | |
The notes to the financial statements are an integral part of,
and should be read in conjunction with, the financial statements. | | | | | 15 | |
Portfolio of Investments October 31, 2016 (continued)
| | | | | | | | |
| | | Principal
Amount | | | Value | |
| Municipal Bonds (continued) | | | | | | | | |
Illinois (continued) | | | | | | | | |
Cook County Community High School District No. 212 Leyden, Revenue Bonds (continued) | | | | | | | | |
Series C, Insured: BAM
5.00%, due 12/1/31 | | $ | 2,610,000 | | | $ | 2,996,280 | |
¨County of Cook IL, Unlimited General Obligation | | | | | | | | |
Series A, Insured: AGM
5.00%, due 11/15/26 | | | 8,350,000 | | | | 10,199,441 | |
Series A
5.00%, due 11/15/26 | | | 7,100,000 | | | | 8,530,153 | |
Series A
5.00%, due 11/15/27 | | | 7,080,000 | | | | 8,393,198 | |
Series A
5.00%, due 11/15/28 | | | 8,895,000 | | | | 10,406,172 | |
Illinois Finance Authority, North Park University Project, Revenue Bonds
0.66%, due 10/1/29 (a) | | | 11,500,000 | | | | 11,500,000 | |
Illinois Finance Authority, Rehab Institute of Chicago, Revenue Bonds
Series A
6.00%, due 7/1/43 | | | 9,600,000 | | | | 11,427,072 | |
Illinois Finance Authority, Rosalind Franklin University, Revenue Bonds
0.64%, due 11/1/32 (a) | | | 10,000,000 | | | | 10,000,000 | |
Illinois Finance Authority, Swedish Covenant, Revenue Bonds
Series A
5.75%, due 8/15/29 | | | 6,175,000 | | | | 6,846,655 | |
Illinois Finance Authority, University of Chicago Medical Center, Revenue Bonds | | | | | | | | |
Series B
0.48%, due 8/1/44 (a) | | | 8,870,000 | | | | 8,870,000 | |
Series B
4.00%, due 8/15/41 | | | 25,000,000 | | | | 25,678,750 | |
Illinois Sports Facilities Authority, Revenue Bonds
Insured: AGM
5.25%, due 6/15/31 | | | 5,000,000 | | | | 5,691,850 | |
Knox & Warren Counties Community Unit School District No. 205 Galesburg, Unlimited General Obligation | | | | | | | | |
Series A
4.25%, due 1/1/19 | | | 240,000 | | | | 254,066 | |
Series A
5.00%, due 1/1/20 | | | 205,000 | | | | 226,367 | |
Metropolitan Pier & Exposition Authority, Capital Appreciation, Revenue Bonds
Series A, Insured: AGM
(zero coupon), due 6/15/30 | | | 14,250,000 | | | | 7,944,945 | |
| | | | | | | | |
| | | Principal
Amount | | | Value | |
Illinois (continued) | | | | | | | | |
Metropolitan Pier & Exposition Authority, Capital Appreciation-McCormick, Revenue Bonds
Series A, Insured: NATL-RE
(zero coupon), due 6/15/36 | | $ | 63,190,000 | | | $ | 26,363,500 | |
Northern Illinois Municipal Power Agency, Prairie State Project, Revenue Bonds
Series A, Insured: NATL-RE
5.00%, due 1/1/37 | | | 10,000,000 | | | | 10,483,600 | |
Rock Island County, Public Building Commission, Revenue Bonds | | | | | | | | |
Insured: AGM
5.00%, due 12/1/31 | | | 500,000 | | | | 582,655 | |
Insured: AGM
5.00%, due 12/1/36 | | | 2,645,000 | | | | 3,027,943 | |
Insured: AGM
5.00%, due 12/1/41 | | | 3,360,000 | | | | 3,827,914 | |
Southern Illinois University, Housing & Auxiliary Facilities System, Revenue Bonds | | | | | | | | |
Series B, Insured: BAM
5.00%, due 4/1/26 | | | 1,175,000 | | | | 1,406,064 | |
Series B, Insured: BAM
5.00%, due 4/1/29 | | | 1,620,000 | | | | 1,891,852 | |
Series B, Insured: BAM
5.00%, due 4/1/30 | | | 1,000,000 | | | | 1,157,430 | |
Southwestern Illinois Development Authority, Local Government Program, Revenue Bonds
Series B, Insured: BAM
4.00%, due 10/15/40 | | | 5,500,000 | | | | 5,757,180 | |
¨State of Illinois, Unlimited General Obligation | | | | | | | | |
Insured: BAM
4.00%, due 6/1/41 | | | 15,865,000 | | | | 15,790,752 | |
5.00%, due 8/1/20 | | | 10,890,000 | | | | 11,739,420 | |
5.00%, due 2/1/29 | | | 8,000,000 | | | | 8,698,800 | |
United City of Yorkville, Special Tax
Insured: AGM
5.00%, due 3/1/32 | | | 3,790,000 | | | | 4,389,540 | |
Village of Bellwood IL, Unlimited General Obligation
Insured: AGM
5.00%, due 12/1/29 | | | 1,500,000 | | | | 1,764,870 | |
Village of Crestwood IL, Alternative Revenue Source, Unlimited General Obligation | | | | | | | | |
Series B, Insured: BAM
5.00%, due 12/15/29 | | | 750,000 | | | | 847,665 | |
Series B, Insured: BAM
5.00%, due 12/15/30 | | | 850,000 | | | | 957,100 | |
Series B, Insured: BAM
5.00%, due 12/15/31 | | | 955,000 | | | | 1,068,836 | |
| | | | |
| 16 | | MainStay Tax Free Bond Fund | | The notes to the financial statements are an integral part of,
and should be read in conjunction with, the financial statements. |
| | | | | | | | |
| | | Principal
Amount | | | Value | |
| Municipal Bonds (continued) | | | | | | | | |
Illinois (continued) | | | | | | | | |
Village of Oswego IL, Unlimited General Obligation
5.00%, due 12/15/33 | | $ | 8,570,000 | | | $ | 10,033,156 | |
| | | | | | | | |
| | | | | | | 392,817,097 | |
| | | | | | | | |
Indiana 0.5% | | | | | | | | |
Indiana Finance Authority, Educational Facilities-Butler University, Revenue Bonds | | | | | | | | |
Series B
5.00%, due 2/1/24 | | | 2,100,000 | | | | 2,438,562 | |
Series A
5.00%, due 2/1/25 | | | 2,215,000 | | | | 2,555,468 | |
Series B
5.00%, due 2/1/25 | | | 2,210,000 | | | | 2,549,699 | |
Series B
5.00%, due 2/1/26 | | | 2,320,000 | | | | 2,660,692 | |
Indianapolis, Indiana Public Improvement Bond Bank, Waterworks Project, Revenue Bonds
Series A, Insured: AGC
5.50%, due 1/1/38 | | | 1,100,000 | | | | 1,207,811 | |
| | | | | | | | |
| | | | | | | 11,412,232 | |
| | | | | | | | |
Iowa 0.1% | | | | | | | | |
City of Coralville IA, Certificate of Participation | | | | | | | | |
Series E
4.00%, due 6/1/21 | | | 545,000 | | | | 586,796 | |
Series E
4.00%, due 6/1/22 | | | 1,405,000 | | | | 1,519,887 | |
Series E
4.00%, due 6/1/23 | | | 1,320,000 | | | | 1,437,533 | |
| | | | | | | | |
| | | | | | | 3,544,216 | |
| | | | | | | | |
Kansas 0.5% | | | | | | | | |
University of Kansas Hospital Authority, Revenue Bonds | | | | | | | | |
5.00%, due 9/1/33 | | | 2,500,000 | | | | 2,930,875 | |
5.00%, due 9/1/34 | | | 5,000,000 | | | | 5,844,700 | |
5.00%, due 9/1/35 | | | 2,800,000 | | | | 3,265,892 | |
| | | | | | | | |
| | | | | | | 12,041,467 | |
| | | | | | | | |
Kentucky 0.6% | | | | | | | | |
City of Ashland KY, King’s Daughters Medical Center Project, Revenue Bonds | | | | | | | | |
Series A
4.00%, due 2/1/21 | | | 1,070,000 | | | | 1,157,868 | |
Series A
5.00%, due 2/1/23 | | | 1,525,000 | | | | 1,766,011 | |
| | | | | | | | |
| | | Principal
Amount | | | Value | |
Kentucky (continued) | | | | | | | | |
Kentucky Municipal Power Agency, Revenue Bonds
Series A, Insured: NATL-RE
5.00%, due 9/1/42 | | $ | 11,000,000 | | | $ | 12,521,740 | |
| | | | | | | | |
| | | | | | | 15,445,619 | |
| | | | | | | | |
Louisiana 1.0% | | | | | | | | |
City of New Orleans LA, Sewerage Service Revenue, Revenue Bonds
5.00%, due 6/1/40 | | | 2,745,000 | | | | 3,128,696 | |
Jefferson Parish, Louisiana Hospital Service District No. 1, West Jefferson Medical Center, Revenue Bonds
Series A, Insured: AGM
6.00%, due 1/1/39 | | | 3,695,000 | | | | 4,409,502 | |
Louisiana Local Government Environmental Facilities & Community Development Authority, Mcneese State University Student Parking Co., Revenue Bonds | | | | | | | | |
Insured: AGM
4.00%, due 3/1/22 | | | 335,000 | | | | 369,746 | |
Insured: AGM
4.00%, due 3/1/23 | | | 350,000 | | | | 384,223 | |
Louisiana Public Facilities Authority, Loyola University, Revenue Bonds
5.25%, due 10/1/30 | | | 2,930,000 | | | | 3,307,765 | |
Louisiana Public Facilities Authority, Ochsner Clinic Foundation Project, Revenue Bonds | | | | | | | | |
5.00%, due 5/15/34 | | | 2,030,000 | | | | 2,347,289 | |
6.25%, due 5/15/31 | | | 5,690,000 | | | | 6,973,379 | |
Louisiana Stadium & Exposition District, Revenue Bonds
Series A
5.00%, due 7/1/30 | | | 1,650,000 | | | | 1,881,149 | |
Louisiana State Citizens Property Insurance Corp., Revenue Bonds
Series C-3, Insured: AGC
6.125%, due 6/1/25 | | | 1,000,000 | | | | 1,083,360 | |
| | | | | | | | |
| | | | | | | 23,885,109 | |
| | | | | | | | |
Maryland 0.2% | | | | | | | | |
Maryland Health & Higher Educational Facilities Authority, Peninsula Regional Medical Center, Revenue Bonds
5.00%, due 7/1/39 | | | 3,600,000 | | | | 4,136,220 | |
| | | | | | | | |
| | |
Massachusetts 1.7% | | | | | | | | |
Massachusetts Development Finance Agency, Partners HealthCare System, Revenue Bonds
Series M1
0.45%, due 7/1/48 (a) | | | 15,500,000 | | | | 15,500,000 | |
| | | | | | |
The notes to the financial statements are an integral part of,
and should be read in conjunction with, the financial statements. | | | | | 17 | |
Portfolio of Investments October 31, 2016 (continued)
| | | | | | | | |
| | | Principal
Amount | | | Value | |
| Municipal Bonds (continued) | | | | | | | | |
Massachusetts (continued) | | | | | | | | |
Massachusetts Development Finance Agency, UMass Boston Student Housing Project, Revenue Bonds | | | | | | | | |
5.00%, due 10/1/30 | | $ | 1,200,000 | | | $ | 1,378,692 | |
5.00%, due 10/1/31 | | | 1,200,000 | | | | 1,371,048 | |
5.00%, due 10/1/32 | | | 1,240,000 | | | | 1,410,017 | |
5.00%, due 10/1/33 | | | 1,500,000 | | | | 1,697,565 | |
5.00%, due 10/1/34 | | | 2,170,000 | | | | 2,446,089 | |
Massachusetts Development Finance Agency, WGBH Educational Foundation, Revenue Bonds | | | | | | | | |
4.00%, due 1/1/32 | | | 1,645,000 | | | | 1,805,272 | |
4.00%, due 1/1/33 | | | 1,000,000 | | | | 1,093,890 | |
Massachusetts Educational Financing Authority, Revenue Bonds | | | | | | | | |
Series B
5.70%, due 1/1/31 (b) | | | 1,315,000 | | | | 1,410,324 | |
Series I
6.00%, due 1/1/28 | | | 1,765,000 | | | | 1,872,224 | |
Massachusetts Health & Educational Facilities Authority, Suffolk University, Revenue Bonds | | | | | | | | |
Series A
6.00%, due 7/1/24 | | | 2,000,000 | | | | 2,231,840 | |
Series A
6.25%, due 7/1/30 | | | 6,400,000 | | | | 7,169,280 | |
Metropolitan Boston Transit Parking Corp., Revenue Bonds
5.25%, due 7/1/36 | | | 2,000,000 | | | | 2,321,100 | |
| | | | | | | | |
| | | | | | | 41,707,341 | |
| | | | | | | | |
Michigan 4.6% | | | | | | | | |
City of Detroit MI Sewage Disposal System, Senior Lien, Revenue Bonds | | | | | | | | |
Series A, Insured: NATL-RE
5.25%, due 7/1/20 | | | 2,000,000 | | | | 2,047,620 | |
Series A
5.25%, due 7/1/39 | | | 14,150,000 | | | | 15,820,690 | |
Series C-1, Insured: AGM
7.00%, due 7/1/27 | | | 5,000,000 | | | | 5,696,300 | |
City of Detroit MI Water Supply System, Senior Lien, Revenue Bonds | | | | | | | | |
Series A, Insured: AGM
5.00%, due 7/1/34 | | | 1,600,000 | | | | 1,602,112 | |
Series A
5.25%, due 7/1/41 | | | 5,000,000 | | | | 5,493,150 | |
Series A
5.75%, due 7/1/37 | | | 5,550,000 | | | | 6,204,623 | |
City of Detroit MI, Water Supply System, Revenue Bonds
Series D, Insured: AGM
4.625%, due 7/1/32 | | | 1,535,000 | | | | 1,537,164 | |
| | | | | | | | |
| | | Principal
Amount | | | Value | |
Michigan (continued) | | | | | | | | |
County of Wayne MI, Capital Improvement, Limited General Obligation
Series A, Insured: AGM
5.00%, due 2/1/38 | | $ | 2,500,000 | | | $ | 2,540,425 | |
Detroit City School District, Improvement School Building & Site, Unlimited General Obligation | | | | | | | | |
Series A, Insured: Q-SBLF
5.00%, due 5/1/26 | | | 750,000 | | | | 854,070 | |
Series A, Insured: Q-SBLF
5.00%, due 5/1/27 | | | 7,500,000 | | | | 8,513,025 | |
Series A, Insured: Q-SBLF
5.00%, due 5/1/29 | | | 3,620,000 | | | | 4,046,870 | |
Series A, Insured: Q-SBLF
5.00%, due 5/1/33 | | | 4,535,000 | | | | 5,032,988 | |
Lincoln Consolidated School District, Unlimited General Obligation | | | | | | | | |
Series A, Insured: AGM
5.00%, due 5/1/25 | | | 1,030,000 | | | | 1,254,592 | |
Series A, Insured: AGM
5.00%, due 5/1/26 | | | 1,300,000 | | | | 1,592,240 | |
Series A, Insured: AGM
5.00%, due 5/1/27 | | | 3,985,000 | | | | 4,825,397 | |
Series A, Insured: AGM
5.00%, due 5/1/28 | | | 2,030,000 | | | | 2,439,065 | |
Series A, Insured: AGM
5.00%, due 5/1/30 | | | 1,455,000 | | | | 1,719,504 | |
Series A, Insured: AGM
5.00%, due 5/1/40 | | | 1,500,000 | | | | 1,724,985 | |
Livonia Public School District, Unlimited General Obligation
Insured: AGM
5.00%, due 5/1/40 | | | 2,115,000 | | | | 2,439,737 | |
Michigan Finance Authority Revenue, Local Government Loan Program, Revenue Bonds | | | | | | | | |
Insured: AGM
5.00%, due 7/1/28 | | | 500,000 | | | | 589,190 | |
Series C
5.00%, due 11/1/28 | | | 2,580,000 | | | | 2,716,482 | |
5.00%, due 7/1/33 | | | 500,000 | | | | 574,565 | |
5.00%, due 7/1/34 | | | 500,000 | | | | 572,515 | |
Insured: AGM
5.00%, due 7/1/35 | | | 2,000,000 | | | | 2,285,300 | |
Insured: NATL-RE
5.00%, due 7/1/36 | | | 7,400,000 | | | | 8,368,734 | |
Michigan Finance Authority, Detroit School District,
Revenue Bonds
5.50%, due 6/1/21 | | | 5,000,000 | | | | 5,289,900 | |
| | | | |
| 18 | | MainStay Tax Free Bond Fund | | The notes to the financial statements are an integral part of,
and should be read in conjunction with, the financial statements. |
| | | | | | | | |
| | | Principal
Amount | | | Value | |
| Municipal Bonds (continued) | | | | | | | | |
Michigan (continued) | | | | | | | | |
Michigan Finance Authority, Great Lakes Water, Revenue Bonds | | | | | | | | |
Insured: NATL-RE
5.00%, due 7/1/32 | | $ | 2,500,000 | | | $ | 2,862,175 | |
Insured: AGM
5.00%, due 7/1/33 | | | 3,000,000 | | | | 3,447,960 | |
Series C-1
5.00%, due 7/1/44 | | | 2,500,000 | | | | 2,749,100 | |
Michigan Tobacco Settlement Finance Authority, Revenue Bonds
Series A
6.00%, due 6/1/34 | | | 250,000 | | | | 251,015 | |
Saginaw City School District, Unlimited General Obligation | | | | | | | | |
Insured: Q-SBLF
5.00%, due 5/1/29 | | | 260,000 | | | | 309,738 | |
Insured: Q-SBLF
5.00%, due 5/1/30 | | | 350,000 | | | | 413,627 | |
Insured: Q-SBLF
5.00%, due 5/1/31 | | | 750,000 | | | | 883,155 | |
Insured: Q-SBLF
5.00%, due 5/1/34 | | | 250,000 | | | | 290,840 | |
Insured: Q-SBLF
5.00%, due 5/1/35 | | | 350,000 | | | | 405,923 | |
Insured: Q-SBLF
5.00%, due 5/1/36 | | | 425,000 | | | | 491,768 | |
State of Michigan, Revenue Bonds
5.00%, due 3/15/27 | | | 5,000,000 | | | | 6,246,650 | |
| | | | | | | | |
| | | | 114,133,194 | |
| | | | | | | | |
Mississippi 0.2% | | | | | | | | |
Mississippi Business Finance Corp., Gulf Power Co., Revenue Bonds
0.56%, due 11/1/42 (a)(b) | | | 5,900,000 | | | | 5,900,000 | |
| | | | | | | | |
| | |
Missouri 2.1% | | | | | | | | |
City of Kansas MO, Improvement Downtown Arena Project, Revenue Bonds
Series E
5.00%, due 4/1/40 | | | 10,055,000 | | | | 11,532,683 | |
Joplin Industrial Development Authority, Freeman Health System, Revenue Bonds
5.00%, due 2/15/35 | | | 605,000 | | | | 689,827 | |
Missouri Development Finance Board, St. Louis Convention Center, Revenue Bonds
Series C
0.53%, due 12/1/20 (a) | | | 1,605,000 | | | | 1,605,000 | |
| | | | | | | | |
| | | Principal
Amount | | | Value | |
Missouri (continued) | | | | | | | | |
Missouri Health & Educational Facilities Authority, Bethesda Health Group, Inc., Revenue Bonds
Series B
0.53%, due 8/1/41 (a) | | $ | 1,835,000 | | | $ | 1,835,000 | |
Missouri Health & Educational Facilities Authority, Drury University, Revenue Bonds
0.53%, due 10/15/41 (a) | | | 800,000 | | | | 800,000 | |
Missouri Health & Educational Facilities Authority, SSM Health Care, Revenue Bonds
Series A
5.00%, due 6/1/30 | | | 4,000,000 | | | | 4,715,560 | |
Missouri Health & Educational Facilities Authority, St. Louis University, Revenue Bonds | | | | | | | | |
Series B-2
0.48%, due 10/1/35 (a) | | | 14,500,000 | | | | 14,500,000 | |
Series A
5.00%, due 10/1/38 | | | 5,930,000 | | | | 6,963,184 | |
Missouri Health & Educational Facilities Authority, St. Lukes Health System, Inc., Revenue Bonds | | | | | | | | |
5.00%, due 11/15/30 | | | 5,000,000 | | | | 6,029,050 | |
5.00%, due 11/15/31 | | | 2,300,000 | | | | 2,760,437 | |
| | | | | | | | |
| | | | 51,430,741 | |
| | | | | | | | |
Nebraska 1.6% | | | | | | | | |
¨Central Plains Energy, Project No. 3, Revenue Bonds | | | | | | | | |
5.00%, due 9/1/32 | | | 5,190,000 | | | | 5,874,976 | |
5.00%, due 9/1/42 | | | 13,420,000 | | | | 15,028,924 | |
5.25%, due 9/1/37 | | | 15,535,000 | | | | 17,704,152 | |
| | | | | | | | |
| | | | 38,608,052 | |
| | | | | | | | |
New Hampshire 0.3% | | | | | | | | |
City of Manchester NH, General Airport, Revenue Bonds
Series A, Insured: AGM
5.00%, due 1/1/26 | | | 1,800,000 | | | | 2,051,424 | |
New Hampshire Health & Education Facilities Authority, Southern University, Revenue Bonds | | | | | | | | |
5.00%, due 1/1/31 | | | 905,000 | | | | 1,063,357 | |
5.00%, due 1/1/32 | | | 950,000 | | | | 1,111,205 | |
5.00%, due 1/1/33 | | | 1,000,000 | | | | 1,164,440 | |
5.00%, due 1/1/34 | | | 1,050,000 | | | | 1,218,084 | |
5.00%, due 1/1/35 | | | 1,100,000 | | | | 1,272,271 | |
| | | | | | | | |
| | | | 7,880,781 | |
| | | | | | | | |
| | | | | | |
The notes to the financial statements are an integral part of,
and should be read in conjunction with, the financial statements. | | | | | 19 | |
Portfolio of Investments October 31, 2016 (continued)
| | | | | | | | |
| | | Principal
Amount | | | Value | |
| Municipal Bonds (continued) | | | | | | | | |
New Jersey 4.0% | | | | | | | | |
Atlantic County mprovement Authority, Stockton University-Atlantic City, Revenue Bonds | | | | | | | | |
Series A, Insured: AGM
4.00%, due 7/1/35 | | $ | 1,000,000 | | | $ | 1,055,800 | |
Series A, Insured: AGM
4.00%, due 7/1/36 | | | 1,645,000 | | | | 1,732,613 | |
Series A, Insured: AGM
5.00%, due 7/1/31 | | | 2,670,000 | | | | 3,122,432 | |
Series A, Insured: AGM
5.00%, due 7/1/32 | | | 1,305,000 | | | | 1,517,793 | |
Series A, Insured: AGM
5.00%, due 7/1/33 | | | 1,395,000 | | | | 1,616,135 | |
Series A, Insured: AGM
5.00%, due 7/1/34 | | | 1,855,000 | | | | 2,140,670 | |
New Brunswick Parking Authority, Revenue Bonds | | | | | | | | |
Series A, Insured: BAM
5.00%, due 9/1/28 | | | 5,880,000 | | | | 7,196,356 | |
Series A, Insured: BAM
5.00%, due 9/1/29 | | | 2,370,000 | | | | 2,882,844 | |
Series A, Insured: BAM
5.00%, due 9/1/30 | | | 4,605,000 | | | | 5,576,194 | |
Series A, Insured: BAM
5.00%, due 9/1/31 | | | 6,780,000 | | | | 8,164,069 | |
New Jersey Building Authority, Revenue Bonds | | | | | | | | |
Series A, Insured: BAM
5.00%, due 6/15/25 | | | 3,350,000 | | | | 3,959,901 | |
Series A, Insured: BAM
5.00%, due 6/15/28 | | | 3,000,000 | | | | 3,538,110 | |
New Jersey Economic Development Authority, MSU Student Housing Project, Revenue Bonds
5.375%, due 6/1/25 | | | 4,500,000 | | | | 4,995,000 | |
New Jersey Economic Development Authority, Revenue Bonds | | | | | | | | |
5.00%, due 1/1/28 (b) | | | 1,000,000 | | | | 1,139,830 | |
5.50%, due 1/1/26 (b) | | | 1,000,000 | | | | 1,175,600 | |
New Jersey Educational Facilities Authority, Stockton University, Revenue Bonds | | | | | | | | |
Series A, Insured: BAM
5.00%, due 7/1/29 | | | 1,500,000 | | | | 1,775,640 | |
Series A, Insured: BAM
5.00%, due 7/1/30 | | | 5,000,000 | | | | 5,884,050 | |
Series A, Insured: BAM
5.00%, due 7/1/31 | | | 3,000,000 | | | | 3,511,110 | |
| | | | | | | | |
| | | Principal
Amount | | | Value | |
New Jersey (continued) | | | | | | | | |
New Jersey Health Care Facilities Financing Authority, Barnabas Health, Revenue Bonds
Series A
5.25%, due 7/1/26 | | $ | 3,710,000 | | | $ | 4,400,060 | |
New Jersey Health Care Facilities Financing Authority, Hackensack University Medical Center, Revenue Bonds
Insured: AGC
5.25%, due 1/1/31 | | | 1,510,000 | | | | 1,574,855 | |
New Jersey Higher Education Student Assistance Authority, Revenue Bonds
Series 1
5.50%, due 12/1/26 (b) | | | 3,320,000 | | | | 3,715,578 | |
New Jersey Higher Education Student Assistance Authority, Student Loan, Revenue Bonds
Series A, Insured: AGC
6.125%, due 6/1/30 (b) | | | 2,510,000 | | | | 2,654,576 | |
New Jersey Transportation Trust Fund Authority, Revenue Bonds
Series C, Insured: AGM
(zero coupon), due 12/15/34 | | | 30,000,000 | | | | 14,263,500 | |
Newark Housing Authority, Revenue Bonds | | | | | | | | |
Insured: AGM
4.00%, due 12/1/27 | | | 500,000 | | | | 549,880 | |
Insured: AGM
4.00%, due 12/1/29 | | | 250,000 | | | | 268,753 | |
Insured: AGM
4.00%, due 12/1/30 | | | 250,000 | | | | 267,115 | |
Insured: AGM
4.00%, due 12/1/31 | | | 225,000 | | | | 239,207 | |
Insured: AGM
5.00%, due 12/1/28 | | | 750,000 | | | | 883,230 | |
Insured: AGM
5.00%, due 12/1/38 | | | 1,740,000 | | | | 1,971,159 | |
Newark Housing Authority, South Ward Police Facility, Revenue Bonds | | | | | | | | |
Insured: AGC
5.75%, due 12/1/30 | | | 1,135,000 | | | | 1,297,838 | |
Insured: AGC
6.75%, due 12/1/38 | | | 3,550,000 | | | | 4,166,812 | |
| | | | | | | | |
| | | | 97,236,710 | |
| | | | | | | | |
New Mexico 0.1% | | | | | | | | |
City of Farmington NM, Revenue Bonds
5.90%, due 6/1/40 | | | 2,000,000 | | | | 2,259,140 | |
| | | | | | | | |
| | | | |
| 20 | | MainStay Tax Free Bond Fund | | The notes to the financial statements are an integral part of,
and should be read in conjunction with, the financial statements. |
| | | | | | | | |
| | | Principal
Amount | | | Value | |
| Municipal Bonds (continued) | | | | | | | | |
New York 12.0% | | | | | | | | |
Build NYC Resource Corp., Royal Charter Properties, Revenue Bonds | | | | | | | | |
Insured: AGM
5.00%, due 12/15/19 | | $ | 975,000 | | | $ | 1,081,490 | |
Insured: AGM
5.00%, due 12/15/20 | | | 1,025,000 | | | | 1,168,162 | |
Insured: AGM
5.00%, due 12/15/21 | | | 1,075,000 | | | | 1,252,708 | |
Insured: AGM
5.00%, due 12/15/22 | | | 740,000 | | | | 879,416 | |
City of New York, Unlimited General Obligation
Series H-5
0.73%, due 3/1/34 (a) | | | 5,085,000 | | | | 5,085,000 | |
County of Nassau NY, Limited General Obligation | | | | | | | | |
Series C
5.00%, due 4/1/32 | | | 4,135,000 | | | | 4,909,692 | |
Series C
5.00%, due 4/1/37 | | | 6,625,000 | | | | 7,752,178 | |
Series C
5.00%, due 4/1/38 | | | 6,965,000 | | | | 8,131,289 | |
JPMorgan Chase Putters / Drivers Trust, Battery Park City Authority, Revenue Bonds
Series 4410
0.62%, due 8/1/18 (a)(c) | | | 8,000,000 | | | | 8,000,000 | |
Long Island Power Authority, Electric System, Revenue Bonds
Series A, Insured: BAM
5.00%, due 9/1/44 | | | 10,000,000 | | | | 11,721,600 | |
Long Island Power Authority, Revenue Bonds | | | | | | | | |
Series A, Insured: BAM
5.00%, due 9/1/39 | | | 10,000,000 | | | | 11,783,800 | |
Series A
5.00%, due 9/1/44 | | | 3,470,000 | | | | 4,000,841 | |
Series B
5.00%, due 9/1/45 | | | 8,970,000 | | | | 10,315,141 | |
Metropolitan Transportation Authority, Green, Revenue Bonds
Series B-1
5.00%, due 11/15/36 | | | 4,500,000 | | | | 5,400,360 | |
Metropolitan Transportation Authority, Revenue Bonds
Series F
5.00%, due 11/15/35 | | | 1,500,000 | | | | 1,773,735 | |
New York City Transitional Finance Authority, Building Aid, Revenue Bonds | | | | | | | | |
Series S-1
5.00%, due 7/15/33 | | | 6,060,000 | | | | 7,182,373 | |
| | | | | | | | |
| | | Principal
Amount | | | Value | |
New York (continued) | | | | | | | | |
New York City Transitional Finance Authority, Building Aid, Revenue Bonds (continued) | | | | | | | | |
Series S-1
5.00%, due 7/15/36 | | $ | 10,000,000 | | | $ | 11,722,500 | |
Series S-1
5.00%, due 7/15/43 | | | 2,000,000 | | | | 2,338,880 | |
¨New York City Transitional Finance Authority, Future Tax Secured, Revenue Bonds | | | | | | | | |
Series 2A
0.73%, due 11/1/22 (a) | | | 8,900,000 | | | | 8,900,000 | |
Subseries A-1
5.00%, due 5/1/32 | | | 10,000,000 | | | | 12,102,400 | |
Series B-1
5.00%, due 8/1/32 | | | 10,000,000 | | | | 12,143,600 | |
Series A-1
5.00%, due 8/1/36 | | | 5,100,000 | | | | 6,056,607 | |
Series E-1
5.00%, due 2/1/41 | | | 2,500,000 | | | | 2,908,550 | |
New York City Water & Sewer System, Revenue Bonds | | | | | | | | |
Series AA-3
0.73%, due 6/15/32 (a) | | | 2,000,000 | | | | 2,000,000 | |
Series EE
5.50%, due 6/15/43 | | | 11,400,000 | | | | 13,287,954 | |
New York Liberty Development Corp., Bank of America, Revenue Bonds
Class 3
6.375%, due 7/15/49 | | | 5,000,000 | | | | 5,591,400 | |
New York Liberty Development Corp., Revenue Bonds
5.00%, due 12/15/41 | | | 12,315,000 | | | | 14,143,777 | |
New York Liberty Development Corp., World Trade Center, Revenue Bonds | | | | | | | | |
5.00%, due 11/15/31 | | | 5,000,000 | | | | 5,738,800 | |
5.75%, due 11/15/51 | | | 11,500,000 | | | | 13,502,955 | |
New York State Dormitory Authority, New York Univerisity, Revenue Bonds
Series A
5.00%, due 7/1/35 | | | 6,610,000 | | | | 7,873,237 | |
New York State Dormitory Authority, Revenue Bonds | | | | | | | | |
Series E
5.00%, due 3/15/34 | | | 4,190,000 | | | | 5,029,844 | |
5.50%, due 7/1/40 | | | 465,000 | | | | 531,379 | |
New York State Urban Development Corp., Revenue Bonds | | | | | | | | |
Series A
5.00%, due 3/15/30 | | | 12,350,000 | | | | 15,041,929 | |
Series A
5.00%, due 3/15/34 | | | 12,750,000 | | | | 15,175,177 | |
| | | | | | |
The notes to the financial statements are an integral part of,
and should be read in conjunction with, the financial statements. | | | | | 21 | |
Portfolio of Investments October 31, 2016 (continued)
| | | | | | | | |
| | | Principal
Amount | | | Value | |
| Municipal Bonds (continued) | | | | | | | | |
New York (continued) | | | | | | | | |
¨New York Transportation Development Corp., LaGuardia Airport Terminal B Redevelopment Project, Revenue Bonds | | | | | | | | |
Insured: AGM
4.00%, due 7/1/31 (b) | | $ | 10,925,000 | | | $ | 11,583,341 | |
Series A, Insured: AGM
4.00%, due 7/1/35 (b) | | | 6,500,000 | | | | 6,778,850 | |
Series A, Insured: AGM
4.00%, due 7/1/36 (b) | | | 16,240,000 | | | | 16,880,993 | |
Port Authority of New York & New Jersey, Revenue Bonds
Series 195
5.00%, due 4/1/36 (b) | | | 8,930,000 | | | | 10,544,365 | |
Syracuse Industrial Development Agency, Carousel Center Project, Revenue Bonds | | | | | | | | |
5.00%, due 1/1/29 (b) | | | 1,615,000 | | | | 1,873,529 | |
5.00%, due 1/1/30 (b) | | | 2,100,000 | | | | 2,427,054 | |
| | | | | | | | |
| | | | 294,614,906 | |
| | | | | | | | |
North Carolina 0.3% | | | | |
Charlotte-Mecklenburg Hospital Authority, Carolinas Healthcare System, Revenue Bonds
Series A
5.00%, due 1/15/31 | | | 2,050,000 | | | | 2,304,754 | |
North Carolina Medical Care Commission, North Carolina Baptist Hospital, Revenue Bonds
5.25%, due 6/1/25 | | | 1,000,000 | | | | 1,129,160 | |
North Carolina Turnpike Authority, Revenue Bonds
Series A, Insured: AGC
5.75%, due 1/1/39 | | | 3,000,000 | | | | 3,254,640 | |
| | | | | | | | |
| | | | 6,688,554 | |
| | | | | | | | |
North Dakota 0.2% | | | | | | | | |
Grand Forks Health Care, ND, Altra Health System, Revenue Bonds
5.00%, due 12/1/35 | | | 4,050,000 | | | | 4,438,152 | |
| | | | | | | | |
| | |
Ohio 3.5% | | | | | | | | |
American Municipal Power, Inc., Prairie Energy Campus, Revenue Bonds | | | | | | | | |
Series A, Insured: BAM
5.25%, due 2/15/30 | | | 15,000,000 | | | | 17,624,100 | |
Insured: BAM
5.25%, due 2/15/31 | | | 7,055,000 | | | | 8,258,089 | |
City of Cleveland, OH, Airport System, Revenue Bonds
Series A, Insured: AGM
5.00%, due 1/1/30 | | | 3,000,000 | | | | 3,392,370 | |
| | | | | | | | |
| | | Principal
Amount | | | Value | |
Ohio (continued) | | | | | | | | |
City of Cleveland, OH, Income Tax, Revenue Bonds
Series A-2
5.00%, due 10/1/37 | | $ | 1,500,000 | | | $ | 1,759,680 | |
Clermont County Port Authority, W. Clermont Local School District Project, Revenue Bonds | | | | | | | | |
Insured: BAM
5.00%, due 12/1/31 | | | 650,000 | | | | 766,259 | |
Insured: BAM
5.00%, due 12/1/32 | | | 2,200,000 | | | | 2,579,984 | |
Insured: BAM
5.00%, due 12/1/33 | | | 1,335,000 | | | | 1,559,761 | |
Cleveland-Cuyahoga County Port Authority, Carnegie/89th Garage Project, Revenue Bonds
0.61%, due 1/1/37 (a) | | | 17,340,000 | | �� | | 17,340,000 | |
Cleveland-Cuyahoga County Port Authority, Revenue Bonds
6.00%, due 11/15/25 | | | 1,980,000 | | | | 2,264,803 | |
County of Hamilton OH, Christ Hospital Project, Revenue Bonds
5.50%, due 6/1/42 | | | 2,000,000 | | | | 2,322,700 | |
North Olmsted City School District, Unlimited General Obligation
Series A
5.00%, due 12/1/40 | | | 7,250,000 | | | | 8,501,930 | |
State of Ohio, Solid Waste Revenue, Republic Services, Inc., Revenue Bonds
0.70%, due 11/1/35 (a) | | | 19,000,000 | | | | 19,000,000 | |
| | | | | | | | |
| | | | 85,369,676 | |
| | | | | | | | |
Oklahoma 0.7% | | | | | | | | |
Garfield County Educational Facilities Authority, Enid Public Schools Project, Revenue Bonds | | | | | | | | |
Series A
5.00%, due 9/1/26 | | | 1,800,000 | | | | 2,211,228 | |
Series A
5.00%, due 9/1/27 | | | 1,890,000 | | | | 2,302,663 | |
Series A
5.00%, due 9/1/28 | | | 2,500,000 | | | | 3,017,550 | |
Series A
5.00%, due 9/1/29 | | | 4,620,000 | | | | 5,535,083 | |
Oklahoma State Municipal Power Authority, Revenue Bonds | | | | | | | | |
Series A
5.00%, due 1/1/29 | | | 250,000 | | | | 301,365 | |
Series A
5.00%, due 1/1/30 | | | 900,000 | | | | 1,074,321 | |
Series A
5.00%, due 1/1/32 | | | 805,000 | | | | 950,850 | |
| | | | |
| 22 | | MainStay Tax Free Bond Fund | | The notes to the financial statements are an integral part of,
and should be read in conjunction with, the financial statements. |
| | | | | | | | |
| | | Principal
Amount | | | Value | |
| Municipal Bonds (continued) | | | | | | | | |
Oklahoma (continued) | | | | | | | | |
Oklahoma State Municipal Power Authority, Revenue Bonds (continued) | | | | | | | | |
Series A
5.00%, due 1/1/34 | | $ | 650,000 | | | $ | 762,586 | |
Tulsa Airports Improvement Trust, Revenue Bonds
Series D, Insured: BAM
5.00%, due 6/1/28 | | | 500,000 | | | | 547,920 | |
| | | | | | | | |
| | | | 16,703,566 | |
| | | | | | | | |
Pennsylvania 3.8% | | | | | | | | |
City of Philadelphia PA, Unlimited General Obligation
6.50%, due 8/1/41 | | | 5,125,000 | | | | 6,034,482 | |
County of Lancaster PA, Unlimited General Obligation | | | | | | | | |
Series A, Insured: BAM
4.00%, due 5/1/30 | | | 500,000 | | | | 548,750 | |
Series A, Insured: BAM
4.00%, due 5/1/31 | | | 420,000 | | | | 458,102 | |
Montgomery County Industrial Development Authority, Revenue Bonds
5.25%, due 8/1/33 | | | 175,000 | | | | 201,814 | |
Pennsylvania Economic Development Financing Authority, Capitol Region Parking System, Revenue Bonds
Series B
6.00%, due 7/1/53 | | | 4,600,000 | | | | 5,612,690 | |
Pennsylvania Higher Educational Facilities Authority, Revenue Bonds | | | | | | | | |
Series AT-1, Insured: BAM
5.00%, due 6/15/26 | | | 4,270,000 | | | | 5,353,726 | |
Series AT-1, Insured: BAM
5.00%, due 6/15/27 | | | 9,270,000 | | | | 11,350,837 | |
Pennsylvania Turnpike Commission, Revenue Bonds | | | | | | | | |
Series C
5.00%, due 12/1/43 | | | 10,125,000 | | | | 11,602,946 | |
Series B, Insured: BAM
5.25%, due 12/1/44 | | | 5,000,000 | | | | 5,876,600 | |
Series B
5.75%, due 6/1/39 | | | 4,000,000 | | | | 4,488,760 | |
Philadelphia Gas Works, 1998 General Ordinance, Revenue Bonds | | | | | | | | |
Series 14T
5.00%, due 10/1/31 | | | 2,300,000 | | | | 2,731,066 | |
Series 14T
5.00%, due 10/1/32 | | | 1,280,000 | | | | 1,512,602 | |
State Public School Building Authority, Philadelphia Community College, Revenue Bonds
Insured: BAM
5.00%, due 6/15/28 | | | 5,505,000 | | | | 6,481,807 | |
| | | | | | | | |
| | | Principal
Amount | | | Value | |
Pennsylvania (continued) | | | | | | | | |
State Public School Building Authority, Philadelphia School District, Revenue Bonds
Series A, Insured: AGM
5.00%, due 6/1/31 | | $ | 27,000,000 | | | $ | 31,057,830 | |
| | | | | | | | |
| | | | 93,312,012 | |
| | | | | | | | |
Puerto Rico 6.7% | | | | | | | | |
¨Commonwealth of Puerto Rico, Public Improvement, Unlimited General Obligation | | | | | | | | |
Series A, Insured: AGM
4.00%, due 7/1/22 | | | 470,000 | | | | 487,550 | |
Series A, Insured: AGC
5.00%, due 7/1/26 | | | 375,000 | | | | 381,240 | |
Series A, Insured: AGC
5.00%, due 7/1/27 | | | 150,000 | | | | 150,258 | |
Series A-4, Insured: AGM
5.00%, due 7/1/31 | | | 3,750,000 | | | | 3,982,800 | |
Series A, Insured: AGM
5.00%, due 7/1/35 | | | 15,000,000 | | | | 16,134,000 | |
Insured: AGM
5.25%, due 7/1/20 | | | 1,245,000 | | | | 1,342,645 | |
Series A, Insured: NATL-RE
5.25%, due 7/1/21 | | | 440,000 | | | | 440,752 | |
Series A, Insured: AGM
5.25%, due 7/1/24 | | | 1,220,000 | | | | 1,326,347 | |
Series C, Insured: AGM
5.375%, due 7/1/28 | | | 700,000 | | | | 701,358 | |
Series A, Insured: NATL-RE
5.50%, due 7/1/19 | | | 550,000 | | | | 589,859 | |
Series A, Insured: NATL-RE
5.50%, due 7/1/20 | | | 4,295,000 | | | | 4,697,828 | |
Series A, Insured: NATL-RE
5.50%, due 7/1/21 | | | 1,855,000 | | | | 2,056,323 | |
Series C, Insured: AGM
5.75%, due 7/1/37 | | | 1,020,000 | | | | 1,022,009 | |
Series C-7, Insured: NATL-RE
6.00%, due 7/1/27 | | | 2,490,000 | | | | 2,590,397 | |
Commonwealth of Puerto Rico, Unlimited General Obligation | | | | | | | | |
Insured: AGC
5.00%, due 7/1/34 | | | 145,000 | | | | 145,197 | |
Insured: AGC
5.25%, due 7/1/32 | | | 500,000 | | | | 500,830 | |
Puerto Rico Commonwealth, Aqueduct & Sewer Authority, Revenue Bonds | | | | | | | | |
Series A, Insured: AGC
5.00%, due 7/1/28 | | | 3,675,000 | | | | 3,779,186 | |
Senior Lien—Series A, Insured: AGC
5.125%, due 7/1/47 | | | 8,670,000 | | | | 8,900,969 | |
Series A, Insured: AGC
6.125%, due 7/1/24 | | | 1,000,000 | | | | 1,082,680 | |
| | | | | | |
The notes to the financial statements are an integral part of,
and should be read in conjunction with, the financial statements. | | | | | 23 | |
Portfolio of Investments October 31, 2016 (continued)
| | | | | | | | |
| | | Principal
Amount | | | Value | |
| Municipal Bonds (continued) | | | | | | | | |
Puerto Rico (continued) | | | | | | | | |
Puerto Rico Convention Center District Authority, Revenue Bonds
Series A, Insured: AGC
4.50%, due 7/1/36 | | $ | 1,110,000 | | | $ | 1,110,411 | |
Puerto Rico Electric Power Authority, Revenue Bonds | | | | | | | | |
Series UU, Insured: AGC
4.25%, due 7/1/27 | | | 1,375,000 | | | | 1,383,938 | |
Series NN, Insured: NATL-RE
4.75%, due 7/1/33 | | | 405,000 | | | | 405,255 | |
Series TT, Insured: AGM
5.00%, due 7/1/18 | | | 380,000 | | | | 387,554 | |
Series RR, Insured: NATL-RE
5.00%, due 7/1/21 | | | 1,080,000 | | | | 1,093,694 | |
Series RR, Insured: NATL-RE
5.00%, due 7/1/22 | | | 1,135,000 | | | | 1,139,574 | |
Series SS, Insured: NATL-RE
5.00%, due 7/1/23 | | | 825,000 | | | | 835,461 | |
Series UU, Insured: AGM
5.00%, due 7/1/23 | | | 2,155,000 | | | | 2,188,015 | |
Series PP, Insured: NATL-RE
5.00%, due 7/1/23 | | | 1,105,000 | | | | 1,106,757 | |
Series PP, Insured: NATL-RE
5.00%, due 7/1/24 | | | 2,785,000 | | | | 2,789,066 | |
Series UU, Insured: AGM
5.00%, due 7/1/24 | | | 4,335,000 | | | | 4,392,786 | |
Series UU, Insured: AGC
5.00%, due 7/1/26 | | | 570,000 | | | | 577,558 | |
Series TT, Insured: AGM
5.00%, due 7/1/27 | | | 500,000 | | | | 506,600 | |
Series RR, Insured: AGC
5.00%, due 7/1/28 | | | 1,135,000 | | | | 1,136,827 | |
Series SS, Insured: AGM
5.00%, due 7/1/30 | | | 300,000 | | | | 300,477 | |
Series VV, Insured: NATL-RE
5.25%, due 7/1/26 | | | 510,000 | | | | 549,678 | |
Series VV, Insured: NATL-RE
5.25%, due 7/1/32 | | | 2,000,000 | | | | 2,195,880 | |
¨Puerto Rico Highways & Transportation Authority, Revenue Bonds
Series D, Insured: AGM
5.00%, due 7/1/27 | | | 2,240,000 | | | | 2,264,035 | |
Series J, Insured: NATL-RE
5.00%, due 7/1/29 | | | 650,000 | | | | 650,527 | |
Series L, Insured: NATL-RE
5.25%, due 7/1/24 | | | 1,755,000 | | | | 1,900,805 | |
Series N, Insured: NATL-RE
5.25%, due 7/1/32 | | | 5,525,000 | | | | 6,051,588 | |
Series CC, Insured: AGM
5.25%, due 7/1/33 | | | 1,185,000 | | | | 1,388,417 | |
| | | | | | | | |
| | | Principal
Amount | | | Value | |
Puerto Rico (continued) | | | | | | | | |
¨Puerto Rico Highways & Transportation Authority, Revenue Bonds (continued) | | | | | | | | |
Series N, Insured: NATL-RE
5.25%, due 7/1/33 | | $ | 4,995,000 | | | $ | 5,479,415 | |
Series N, Insured: AGC
5.25%, due 7/1/34 | | | 3,310,000 | | | | 3,892,792 | |
Series CC, Insured: AGM
5.25%, due 7/1/36 | | | 1,540,000 | | | | 1,822,421 | |
Series N, Insured: AGC
5.25%, due 7/1/36 | | | 17,455,000 | | | | 20,656,073 | |
Series E, Insured: AGM
5.50%, due 7/1/21 | | | 520,000 | | | | 569,858 | |
Series N, Insured: AGM
5.50%, due 7/1/26 | | | 405,000 | | | | 465,726 | |
Series N, Insured: AGM
5.50%, due 7/1/29 | | | 10,000,000 | | | | 11,767,800 | |
Series CC, Insured: AGC
5.50%, due 7/1/31 | | | 915,000 | | | | 1,089,189 | |
Puerto Rico Municipal Finance Agency, Revenue Bonds
Series A, Insured: AGM
5.00%, due 8/1/21 | | | 100,000 | | | | 101,552 | |
Series A, Insured: AGM
5.00%, due 8/1/30 | | | 1,445,000 | | | | 1,467,426 | |
Series C, Insured: AGM
5.25%, due 8/1/19 | | | 965,000 | | | | 1,005,665 | |
Series C, Insured: AGC
5.25%, due 8/1/20 | | | 210,000 | | | | 221,115 | |
Series C, Insured: AGC
5.25%, due 8/1/23 | | | 175,000 | | | | 187,903 | |
Puerto Rico Municipal Finance Agency, Unlimited General Obligation
Series A, Insured: AGM
4.75%, due 8/1/22 | | | 710,000 | | | | 720,146 | |
Puerto Rico Public Buildings Authority, Government Facilities, Revenue Bonds
Series F, Insured: NATL-RE
5.25%, due 7/1/23 | | | 220,000 | | | | 242,884 | |
Series K, Insured: AGM
5.25%, due 7/1/27 | | | 245,000 | | | | 257,897 | |
Series M-3, Insured: NATL-RE
6.00%, due 7/1/26 | | | 300,000 | | | | 312,840 | |
Series M-3, Insured: NATL-RE
6.00%, due 7/1/27 | | | 7,465,000 | | | | 7,765,989 | |
Puerto Rico Sales Tax Financing Corp., Revenue Bonds
Series A, Insured: NATL-RE
(zero coupon), due 8/1/45 | | | 59,430,000 | | | | 12,060,724 | |
Series A, Insured: AMBAC
(zero coupon), due 8/1/54 | | | 700,000 | | | | 109,074 | |
Series A, Insured: AGM
5.00%, due 8/1/40 | | | 5,030,000 | | | | 5,287,586 | |
| | | | |
| 24 | | MainStay Tax Free Bond Fund | | The notes to the financial statements are an integral part of,
and should be read in conjunction with, the financial statements. |
| | | | | | | | |
| | | Principal
Amount | | | Value | |
| Municipal Bonds (continued) | | | | | | | | |
Puerto Rico (continued) | | | | | | | | |
Puerto Rico Sales Tax Financing Corp., Revenue Bonds (continued) | | | | | | | | |
Series C, Insured: AGM
5.125%, due 8/1/42 | | $ | 3,605,000 | | | $ | 3,832,079 | |
| | | | | | | | |
| | | | 163,983,285 | |
| | | | | | | | |
Rhode Island 2.2% | | | | | | | | |
Providence Public Buildings Authority, Revenue Bonds
Series A, Insured: AGM
5.875%, due 6/15/26 | | | 1,565,000 | | | | 1,798,263 | |
Rhode Island Commerce Corp., Revenue Bonds | | | | | | | | |
Series B
5.00%, due 6/15/28 | | | 7,165,000 | | | | 8,728,761 | |
Series B
5.00%, due 6/15/29 | | | 12,800,000 | | | | 15,457,280 | |
Rhode Island Health & Educational Building Corp., Hospital Financing-Lifespan Obligated Group, Revenue Bonds
5.00%, due 5/15/26 | | | 5,000,000 | | | | 6,019,900 | |
Tobacco Settlement Financing Corp.,
Revenue Bonds
Series A
5.00%, due 6/1/35 | | | 20,000,000 | | | | 21,697,400 | |
| | | | | | | | |
| | | | | | | 53,701,604 | |
| | | | | | | | |
South Carolina 1.0% | | | | | | | | |
Greenwood Fifty Schools Facilities Inc.,
School District No. 50, Revenue Bonds
Insured: BAM
5.00%, due 12/1/26 | | | 2,225,000 | | | | 2,737,907 | |
Piedmont Municipal Power Agency, Revenue Bonds
Series C, Insured: AGC
5.75%, due 1/1/34 | | | 10,345,000 | | | | 12,135,513 | |
South Carolina Jobs-Economic Development Authority, Palmetto Health, Revenue Bonds | | | | | | | | |
Series A
5.00%, due 8/1/19 | | | 420,000 | | | | 459,782 | |
Series A
5.25%, due 8/1/30 | | | 2,955,000 | | | | 3,410,100 | |
South Carolina State Public Service Authority, Revenue Bonds
Series C
5.00%, due 12/1/36 | | | 3,310,000 | | | | 3,738,082 | |
| | | | | | | | |
| | | Principal
Amount | | | Value | |
South Carolina (continued) | | | | | | | | |
Sumter Two School Facilities Inc.,
Sumter School District Project, Revenue Bonds
Insured: BAM
5.00%, due 12/1/27 | | $ | 1,100,000 | | | $ | 1,320,880 | |
| | | | | | | | |
| | | | | | | 23,802,264 | |
| | | | | | | | |
South Dakota 0.4% | | | | | | | | |
Harrisburg School District No. 41-2, Unlimited General Obligation
5.00%, due 7/15/33 | | | 1,370,000 | | | | 1,522,221 | |
South Dakota Health & Educational Facilities Authority, Sioux Valley Hospitals & Health, Revenue Bonds
Series C
0.62%, due 11/1/19 (a) | | | 7,400,000 | | | | 7,400,000 | |
| | | | | | | | |
| | | | | | | 8,922,221 | |
| | | | | | | | |
Tennessee 2.0% | | | | | | | | |
City of Memphis, TN, Unlimited General Obligation
Series C, Insured: BAM
5.00%, due 4/1/45 | | | 3,660,000 | | | | 4,273,160 | |
Johnson City Health & Educational Facilities Board, Mountain States Health Alliance, Revenue Bonds
6.00%, due 7/1/38 | | | 3,605,000 | | | | 4,043,620 | |
Series A
6.50%, due 7/1/38 | | | 6,500,000 | | | | 7,408,960 | |
Metropolitan Government Nashville Health & Education Facilities, Vanderbilt University Medical Center, Revenue Bonds
5.00%, due 7/1/40 | | | 15,000,000 | | | | 17,466,450 | |
Shelby County Health Educational & Housing Facilities Board, Methodist Le Bonheur Healthcare, Revenue Bonds
Series A, Insured: AGM
0.51%, due 6/1/42 (a) | | | 11,865,000 | | | | 11,865,000 | |
Series B, Insured: AGM
0.52%, due 6/1/42 (a) | | | 4,050,000 | | | | 4,050,000 | |
| | | | | | | | |
| | | | | | | 49,107,190 | |
| | | | | | | | |
Texas 8.4% | | | | | | | | |
Central Texas Regional Mobility Authority, Revenue Bonds
5.75%, due 1/1/31 | | | 2,100,000 | | | | 2,484,804 | |
Central Texas Turnpike System, Revenue Bonds
Series C
5.00%, due 8/15/34 | | | 5,000,000 | | | | 5,742,150 | |
Series B
5.00%, due 8/15/37 | | | 1,945,000 | | | | 2,238,092 | |
| | | | | | |
The notes to the financial statements are an integral part of,
and should be read in conjunction with, the financial statements. | | | | | 25 | |
Portfolio of Investments October 31, 2016 (continued)
| | | | | | | | |
| | | Principal
Amount | | | Value | |
| Municipal Bonds (continued) | | | | | | | | |
Texas (continued) | | | | | | | | |
City of Donna TX, Tax & Toll Bridge, Limited General Obligation
Insured: BAM
5.00%, due 2/15/30 | | $ | 1,035,000 | | | $ | 1,203,405 | |
City of Houston TX, Revenue Bonds
Series B
5.00%, due 9/1/31 | | | 285,000 | | | | 285,921 | |
Clifton Higher Education Finance Corp.,
Idea Public Schools, Revenue Bonds
Series A
4.00%, due 8/15/30 | | | 1,100,000 | | | | 1,221,253 | |
Series A
4.00%, due 8/15/31 | | | 500,000 | | | | 550,595 | |
Series A
4.00%, due 8/15/32 | | | 1,300,000 | | | | 1,424,553 | |
Clifton Higher Education Finance Corp.,
Revenue Bonds
Series A
4.30%, due 12/1/16 | | | 675,000 | | | | 676,809 | |
Dallas Performing Arts Cultural Facilities Corp., Revenue Bonds
0.63%, due 9/1/41 (a) | | | 6,060,000 | | | | 6,060,000 | |
Dallas/Fort Worth International Airport, Revenue Bonds
Series A
5.00%, due 11/1/38 (b) | | | 10,000,000 | | | | 11,008,000 | |
Grand Parkway Transportation Corp.,
Sub Tier Toll, Revenue Bonds
Series B
5.25%, due 10/1/51 | | | 10,000,000 | | | | 11,813,200 | |
Harris County Cultural Education Facilities Finance Corp., Memorial Hermann Health System, Revenue Bonds
5.00%, due 7/1/38 | | | 4,280,000 | | | | 5,007,215 | |
Harris County Cultural Education Facilities Finance Corp., Texas Medical Center, Revenue Bonds
Subseries B-1
0.50%, due 9/1/31 (a) | | | 4,065,000 | | | | 4,065,000 | |
Harris County-Houston Sports Authority, Revenue Bonds
Series A, Insured: AGM
(zero coupon), due 11/15/40 | | | 17,115,000 | | | | 5,829,540 | |
Houston Higher Education Finance Corp.,
Revenue Bonds
6.50%, due 5/15/31 | | | 565,000 | | | | 698,662 | |
Series A
6.875%, due 5/15/41 | | | 6,400,000 | | | | 8,019,968 | |
| | | | | | | | |
| | | Principal
Amount | | | Value | |
Texas (continued) | | | | | | | | |
North Harris County Regional Water Authority, Revenue Bonds
Insured: BAM
5.00%, due 12/15/32 | | $ | 3,215,000 | | | $ | 3,788,395 | |
¨North Texas Tollway Authority, Revenue Bonds
Series A
5.00%, due 1/1/27 | | | 5,000,000 | | | | 6,004,150 | |
Series A
5.00%, due 1/1/34 | | | 1,400,000 | | | | 1,625,624 | |
Series A
5.00%, due 1/1/35 | | | 2,950,000 | | | | 3,416,071 | |
Series A, Insured: BAM
5.00%, due 1/1/38 | | | 9,500,000 | | | | 11,068,735 | |
Series B
5.00%, due 1/1/40 | | | 22,140,000 | | | | 25,366,019 | |
Series A
5.50%, due 9/1/41 | | | 6,695,000 | | | | 7,892,066 | |
Series A
6.00%, due 9/1/41 | | | 3,500,000 | | | | 4,226,740 | |
Port Arthur Independent School District, Unlimited General Obligation
Series E
5.00%, due 2/15/26 | | | 1,520,000 | | | | 1,895,638 | |
Series E
5.00%, due 2/15/27 | | | 1,600,000 | | | | 1,995,952 | |
Series E
5.00%, due 2/15/28 | | | 1,675,000 | | | | 2,071,623 | |
Series E
5.00%, due 2/15/29 | | | 1,765,000 | | | | 2,160,395 | |
Series E
5.00%, due 2/15/30 | | | 1,855,000 | | | | 2,249,818 | |
Series E
5.00%, due 2/15/31 | | | 1,950,000 | | | | 2,350,023 | |
San Juan Higher Education Finance Authority, Idea Public Schools, Revenue Bonds
Series A
6.70%, due 8/15/40 | | | 1,275,000 | | | | 1,529,630 | |
Tarrant County Cultural Education Facilities Finance Corp., Buckner Retirement Services, Revenue Bonds Series A
5.00%, due 11/15/23 | | | 1,245,000 | | | | 1,496,913 | |
Series A
5.00%, due 11/15/24 | | | 1,305,000 | | | | 1,588,851 | |
Series A
5.00%, due 11/15/25 | | | 1,370,000 | | | | 1,678,949 | |
Series A
5.00%, due 11/15/26 | | | 1,440,000 | | | | 1,781,669 | |
| | | | |
| 26 | | MainStay Tax Free Bond Fund | | The notes to the financial statements are an integral part of,
and should be read in conjunction with, the financial statements. |
| | | | | | | | |
| | | Principal
Amount | | | Value | |
| Municipal Bonds (continued) | | | | | | | | |
Texas (continued) | | | | | | | | |
Texas Municipal Gas Acquisition & Supply Corp. III, Revenue Bonds
5.00%, due 12/15/30 | | $ | 17,100,000 | | | $ | 19,233,225 | |
5.00%, due 12/15/31 | | | 4,575,000 | | | | 5,132,052 | |
Texas Private Activity Bond Surface Transportation Corp., NTE Mobility, Revenue Bonds
6.875%, due 12/31/39 | | | 7,965,000 | | | | 9,265,127 | |
Texas Private Activity Bond Surface Transportation Corp., Senior Lien, LBJ Infrastructure, Revenue Bonds
7.00%, due 6/30/40 | | | 4,250,000 | | | | 5,021,502 | |
7.50%, due 6/30/32 | | | 4,095,000 | | | | 4,915,433 | |
7.50%, due 6/30/33 | | | 5,500,000 | | | | 6,598,680 | |
Texas Public Finance Authority, Southern University Financing System, Revenue Bonds
Insured: BAM
5.00%, due 11/1/20 | | | 155,000 | | | | 175,083 | |
Texas Public Finance Authority, Texas Southern University, Revenue Bonds Insured: BAM
4.00%, due 5/1/31 | | | 1,000,000 | | | | 1,067,630 | |
Insured: BAM
4.00%, due 5/1/32 | | | 1,295,000 | | | | 1,373,840 | |
Texas State Public Finance Authority, Charter School Finance Corp.,
Revenue Bonds
Series A
6.20%, due 2/15/40 | | | 1,000,000 | | | | 1,164,270 | |
Viridian Municipal Management District, Unlimited General Obligation
Insured: BAM
6.00%, due 12/1/32 | | | 500,000 | | | | 635,320 | |
| | | | | | | | |
| | | | | | | 207,098,590 | |
| | | | | | | | |
U.S. Virgin Islands 2.6% | | | | | | | | |
Virgin Islands Public Finance Authority, Matching Fund Loan Notes, Revenue Bonds
5.00%, due 9/1/30 (c) | | | 5,000,000 | | | | 5,631,500 | |
Series A
5.00%, due 10/1/32 (c) | | | 5,100,000 | | | | 4,989,738 | |
Virgin Islands Public Finance Authority, Matching Fund Loan, Revenue Bonds
6.625%, due 10/1/29 | | | 6,960,000 | | | | 7,163,789 | |
Series A
6.75%, due 10/1/37 | | | 5,000,000 | | | | 5,133,250 | |
¨Virgin Islands Public Finance Authority, Revenue Bonds
Series C
5.00%, due 10/1/30 | | | 18,500,000 | | | | 18,119,825 | |
| | | | | | | | |
| | | Principal
Amount | | | Value | |
U.S. Virgin Islands (continued) | | | | | | | | |
¨Virgin Islands Public Finance Authority, Revenue Bonds (continued) | | | | | | | | |
Series A, Insured: AGM
5.00%, due 10/1/32 | | $ | 15,125,000 | | | $ | 16,624,341 | |
Series C, Insured: AGM
5.00%, due 10/1/39 | | | 5,800,000 | | | | 6,329,830 | |
| | | | | | | | |
| | | | | | | 63,992,273 | |
| | | | | | | | |
Utah 0.9% | | | | | | | | |
City of Herriman Utah, Special Assessment
5.00%, due 11/1/29 | | | 425,000 | | | | 436,250 | |
County of Utah UT, IHC Health Services, Inc.,
Revenue Bonds
Series B
4.00%, due 5/15/47 | | | 20,000,000 | | | | 21,106,800 | |
| | | | | | | | |
| | | | | | | 21,543,050 | |
| | | | | | | | |
Washington 0.3% | | | | | | | | |
King County Washington Public Hospital District No. 1, Limited General Obligation
Series B
5.25%, due 12/1/37 | | | 6,000,000 | | | | 6,357,360 | |
| | | | | | | | |
| | |
Wisconsin 1.2% | | | | | | | | |
State of Wisconsin, Unlimited General Obligation
Series A
5.00%, due 5/1/35 | | | 8,770,000 | | | | 10,498,918 | |
Wisconsin Center District, Junior Dedicated, Revenue Bonds
Series A
5.00%, due 12/15/31 | | | 3,665,000 | | | | 4,106,889 | |
Series A
5.00%, due 12/15/32 | | | 2,850,000 | | | | 3,181,740 | |
Wisconsin State Health & Educational Facilities Authority, Medical College of Wisconsin, Revenue Bonds
5.00%, due 12/1/41 | | | 10,300,000 | | | | 12,068,407 | |
| | | | | | | | |
| | | | | | | 29,855,954 | |
| | | | | | | | |
Wyoming 0.0%‡ | | | | | | | | |
West Park Hospital District, Revenue Bonds
Series A
6.375%, due 6/1/26 | | | 1,000,000 | | | | 1,160,960 | |
| | | | | | | | |
Total Investments
(Cost $2,421,617,106) (d) | | | 101.3 | % | | | 2,488,906,718 | |
Other Assets, Less Liabilities | | | (1.3 | ) | | | (32,665,220 | ) |
Net Assets | | | 100.0 | % | | $ | 2,456,241,498 | |
| ‡ | Less than one-tenth of a percent. |
| | | | | | |
The notes to the financial statements are an integral part of,
and should be read in conjunction with, the financial statements. | | | | | 27 | |
Portfolio of Investments October 31, 2016 (continued)
| (a) | Variable rate securities that may be tendered back to the issuer at any time prior to maturity at par. Rate shown is the rate in effect as of October 31, 2016. |
| (b) | Interest on these securities was subject to alternative minimum tax. |
| (c) | May be sold to institutional investors only under Rule 144A or securities offered pursuant to Section 4(a)(2) of the Securities Act of 1933, as amended. |
| (d) | As of October 31, 2016, cost was $2,421,781,101 for federal income tax purposes and net unrealized appreciation was as follows: |
| | | | |
Gross unrealized appreciation | | $ | 86,593,970 | |
Gross unrealized depreciation | | | (19,468,353 | ) |
| | | | |
Net unrealized appreciation | | $ | 67,125,617 | |
| | | | |
As of October 31, 2016, the Fund held the following futures contracts1:
| | | | | | | | | | | | | | | | |
Type | | Number of
Contracts
(Short) | | | Expiration
Date | | | Notional
Amount | | | Unrealized
Appreciation (Depreciation)2 | |
| 10-Year United States Treasury Note | | | (2,105 | ) | | | December 2016 | | | $ | (272,860,625 | ) | | $ | 2,843,049 | |
| | | | | | | | | | | | | | | | |
| | | $ | (272,860,625 | ) | | $ | 2,843,049 | |
| | | | | | | | | | | | | | | | |
| 1. | As of October 31, 2016, cash in the amount of $2,841,750 was on deposit with a broker for futures transactions. |
| 2. | Represents the difference between the value of the contracts at the time they were opened and the value as of October 31, 2016. |
The following abbreviations are used in the preceding pages:
AGC—Assured Guaranty Corp.
AGM—Assured Guaranty Municipal Corp.
AMBAC—Ambac Assurance Corp.
BAM—Build America Mutual Assurance Co.
NATL-RE—National Public Finance Guarantee Corp.
Q-SBLF—Qualified School Board Loan Fund
The following is a summary of the fair valuations according to the inputs used as of October 31, 2016, for valuing the Fund’s assets and liabilities.
Asset Valuation Inputs
| | | | | | | | | | | | | | | | |
Description | | Quoted
Prices in
Active
Markets for Identical
Assets (Level 1) | | | Significant
Other
Observable
Inputs (Level 2) | | | Significant
Unobservable
Inputs (Level 3) | | | Total | |
| Investments in Securities (a) | | | | | | | | | | | | | | | | |
| Municipal Bonds | | $ | — | | | $ | 2,488,906,718 | | | $ | — | | | $ | 2,488,906,718 | |
| | | | | | | | | | | | | | | | |
| Total Investments in Securities | | | — | | | | 2,488,906,718 | | | | — | | | | 2,488,906,718 | |
| | | | | | | | | | | | | | | | |
| Other Financial Instruments | | | | | | | | | | | | | | | | |
Futures Contracts (b) | | | 2,843,049 | | | | — | | | | — | | | | 2,843,049 | |
| | | | | | | | | | | | | | | | |
| Total Investments in Securities and Other Financial Instruments | | $ | 2,843,049 | | | $ | 2,488,906,718 | | | $ | — | | | $ | 2,491,749,767 | |
| | | | | | | | | | | | | | | | |
| (a) | For a complete listing of investments and their industries, see the Portfolio of Investments. |
| (b) | The value listed for these securities reflects unrealized appreciation (depreciation) as shown on the Portfolio of Investments. |
The Fund recognizes transfers between the levels as of the beginning of the year.
For the year ended October 31, 2016, the Fund did not have any transfers between Level 1 and Level 2 fair value measurements. (See Note 2)
As of October 31, 2016, the Fund did not hold any investments with significant unobservable inputs (Level 3). (See Note 2)
| | | | |
| 28 | | MainStay Tax Free Bond Fund | | The notes to the financial statements are an integral part of,
and should be read in conjunction with, the financial statements. |
Statement of Assets and Liabilities as of October 31, 2016
| | | | |
| Assets | |
Investment in securities, at value
(identified cost $2,421,617,106) | | $ | 2,488,906,718 | |
Cash | | | 29,388,616 | |
Cash collateral on deposit at broker | | | 2,841,750 | |
Receivables: | | | | |
Interest | | | 26,714,501 | |
Fund shares sold | | | 15,609,510 | |
Other assets | | | 122,435 | |
| | | | |
Total assets | | | 2,563,583,530 | |
| | | | |
| |
| Liabilities | | | | |
Payables: | | | | |
Investment securities purchased | | | 98,452,667 | |
Fund shares redeemed | | | 5,300,653 | |
Manager (See Note 3) | | | 888,007 | |
NYLIFE Distributors (See Note 3) | | | 393,248 | |
Transfer agent (See Note 3) | | | 358,290 | |
Variation margin on futures contracts | | | 164,453 | |
Shareholder communication | | | 41,704 | |
Professional fees | | | 32,295 | |
Custodian | | | 19,719 | |
Trustees | | | 6,648 | |
Accrued expenses | | | 16,198 | |
Dividend payable | | | 1,668,150 | |
| | | | |
Total liabilities | | | 107,342,032 | |
| | | | |
Net assets | | $ | 2,456,241,498 | |
| | | | |
| |
| Composition of Net Assets | | | | |
Shares of beneficial interest outstanding (par value of $.01 per share) unlimited number of shares authorized | | $ | 2,412,127 | |
Additional paid-in capital | | | 2,413,859,006 | |
| | | | |
| | | 2,416,271,133 | |
Distributions in excess of net investment income | | | (590,355 | ) |
Accumulated net realized gain (loss) on investments and futures transactions | | | (29,571,941 | ) |
Net unrealized appreciation (depreciation) on investments and futures contracts | | | 70,132,661 | |
| | | | |
Net assets | | $ | 2,456,241,498 | |
| | | | |
| | | | |
Class A | | | | |
Net assets applicable to outstanding shares | | $ | 1,248,065,412 | |
| | | | |
Shares of beneficial interest outstanding | | | 122,585,491 | |
| | | | |
Net asset value per share outstanding | | $ | 10.18 | |
Maximum sales charge (4.50% of offering price) | | | 0.48 | |
| | | | |
Maximum offering price per share outstanding | | $ | 10.66 | |
| | | | |
Investor Class | | | | |
Net assets applicable to outstanding shares | | $ | 16,344,196 | |
| | | | |
Shares of beneficial interest outstanding | | | 1,598,137 | |
| | | | |
Net asset value per share outstanding | | $ | 10.23 | |
Maximum sales charge (4.50% of offering price) | | | 0.48 | |
| | | | |
Maximum offering price per share outstanding | | $ | 10.71 | |
| �� | | | |
Class B | | | | |
Net assets applicable to outstanding shares | | $ | 19,317,557 | |
| | | | |
Shares of beneficial interest outstanding | | | 1,897,916 | |
| | | | |
Net asset value and offering price per share outstanding | | $ | 10.18 | |
| | | | |
Class C | | | | |
Net assets applicable to outstanding shares | | $ | 273,385,979 | |
| | | | |
Shares of beneficial interest outstanding | | | 26,844,015 | |
| | | | |
Net asset value and offering price per share outstanding | | $ | 10.18 | |
| | | | |
Class I | | | | |
Net assets applicable to outstanding shares | | $ | 899,128,354 | |
| | | | |
Shares of beneficial interest outstanding | | | 88,287,157 | |
| | | | |
Net asset value and offering price per share outstanding | | $ | 10.18 | |
| | | | |
| | | | | | |
The notes to the financial statements are an integral part of,
and should be read in conjunction with, the financial statements. | | | | | 29 | |
Statement of Operations for the year ended October 31, 2016
| | | | |
| Investment Income (Loss) | |
Income | | | | |
Interest | | $ | 75,476,947 | |
| | | | |
Expenses | | | | |
Manager (See Note 3) | | | 8,455,079 | |
Distribution/Service—Class A (See Note 3) | | | 2,462,797 | |
Distribution/Service—Investor Class (See Note 3) | | | 42,142 | |
Distribution/Service—Class B (See Note 3) | | | 90,560 | |
Distribution/Service—Class C (See Note 3) | | | 1,158,034 | |
Transfer agent (See Note 3) | | | 1,748,559 | |
Registration | | | 173,658 | |
Professional fees | | | 152,468 | |
Shareholder communication | | | 97,799 | |
Trustees | | | 52,148 | |
Custodian | | | 35,097 | |
Miscellaneous | | | 67,494 | |
| | | | |
Total expenses | | | 14,535,835 | |
Reimbursement from custodian (a) | | | (15,892 | ) |
| | | | |
Net expenses | | | 14,519,943 | |
| | | | |
Net investment income (loss) | | | 60,957,004 | |
| | | | |
|
| Realized and Unrealized Gain (Loss) on Investments and Futures Contracts | |
Net realized gain (loss) on: | | | | |
Investment transactions | | | 19,678,764 | |
Futures transactions | | | (8,093,795 | ) |
| | | | |
Net realized gain (loss) on investments and futures transactions | | | 11,584,969 | |
| | | | |
Net change in unrealized appreciation (depreciation) on: | | | | |
Investments | | | 18,551,005 | |
Futures contracts | | | 2,214,751 | |
| | | | |
Net change in unrealized appreciation (depreciation) on investments and futures contracts | | | 20,765,756 | |
| | | | |
Net realized and unrealized gain (loss) on investments and futures transactions | | | 32,350,725 | |
| | | | |
Net increase (decrease) in net assets resulting from operations | | $ | 93,307,729 | |
| | | | |
| (a) | Reimbursement from custodian represents a refund for overbilling or prior years’ custody out-of-pocket fees. |
| | | | |
| 30 | | MainStay Tax Free Bond Fund | | The notes to the financial statements are an integral part of,
and should be read in conjunction with, the financial statements. |
Statements of Changes in Net Assets
for the years ended October 31, 2016 and October 31, 2015
| | | | | | | | |
| | | 2016 | | | 2015 | |
| Increase (Decrease) in Net Assets | |
Operations: | | | | | | | | |
Net investment income (loss) | | $ | 60,957,004 | | | $ | 43,792,330 | |
Net realized gain (loss) on investments and futures transactions | | | 11,584,969 | | | | (8,338,708 | ) |
Net change in unrealized appreciation (depreciation) on investments and futures contracts | | | 20,765,756 | | | | (6,941,762 | ) |
| | | | |
Net increase (decrease) in net assets resulting from operations | | | 93,307,729 | | | | 28,511,860 | |
| | | | |
Dividends to shareholders: | | | | | | | | |
From net investment income: | | | | | | | | |
Class A | | | (29,941,632 | ) | | | (21,306,149 | ) |
Investor Class | | | (523,544 | ) | | | (612,453 | ) |
Class B | | | (513,958 | ) | | | (487,154 | ) |
Class C | | | (6,517,375 | ) | | | (5,621,984 | ) |
Class I | | | (23,448,205 | ) | | | (15,774,661 | ) |
| | | | |
Total dividends to shareholders | | | (60,944,714 | ) | | | (43,802,401 | ) |
| | | | |
Capital share transactions: | | | | | | | | |
Net proceeds from sale of shares | | | 1,340,967,616 | | | | 810,261,947 | |
Net asset value of shares issued to shareholders in reinvestment of dividends | | | 40,908,955 | | | | 27,314,088 | |
Cost of shares redeemed | | | (450,743,183 | ) | | | (256,696,846 | ) |
| | | | |
Increase (decrease) in net assets derived from capital share transactions | | | 931,133,388 | | | | 580,879,189 | |
| | | | |
Net increase (decrease) in net assets | | | 963,496,403 | | | | 565,588,648 | |
|
| Net Assets | |
Beginning of year | | | 1,492,745,095 | | | | 927,156,447 | |
| | | | |
End of year | | $ | 2,456,241,498 | | | $ | 1,492,745,095 | |
| | | | |
Distributions in excess of net investment income at end of year | | $ | (590,355 | ) | | $ | (602,645 | ) |
| | | | |
| | | | | | |
The notes to the financial statements are an integral part of,
and should be read in conjunction with, the financial statements. | | | | | 31 | |
Financial Highlights selected per share data and ratios
| | | | | | | | | | | | | | | | | | | | |
| | | Year ended October 31, | |
| Class A | | 2016 | | | 2015 | | | 2014 | | | 2013 | | | 2012 | |
Net asset value at beginning of year | | $ | 9.93 | | | $ | 10.03 | | | $ | 9.33 | | | $ | 10.04 | | | $ | 9.26 | |
| | | | | | | | | | | | | | | | | | | | |
Net investment income (loss) | | | 0.32 | | | | 0.35 | | | | 0.39 | | | | 0.38 | | | | 0.38 | (a) |
Net realized and unrealized gain (loss) on investments | | | 0.25 | | | | (0.10 | ) | | | 0.70 | | | | (0.72 | ) | | | 0.79 | |
| | | | | | | | | | | | | | | | | | | | |
Total from investment operations | | | 0.57 | | | | 0.25 | | | | 1.09 | | | | (0.34 | ) | | | 1.17 | |
| | | | | | | | | | | | | | | | | | | | |
| Less dividends: | | | | | | | | | | | | | | | | | | | | |
From net investment income | | | (0.32 | ) | | | (0.35 | ) | | | (0.39 | ) | | | (0.37 | ) | | | (0.39 | ) |
| | | | | | | | | | | | | | | | | | | | |
Net asset value at end of year | | $ | 10.18 | | | $ | 9.93 | | | $ | 10.03 | | | $ | 9.33 | | | $ | 10.04 | |
| | | | | | | | | | | | | | | | | | | | |
Total investment return (b) | | | 5.73 | % | | | 2.58 | % | | | 11.86 | % | | | (3.52 | %) | | | 12.81 | % |
| Ratios (to average net assets)/Supplemental Data: | | | | | | | | | | | | | | | | | | | | |
Net investment income (loss) | | | 3.04 | % | | | 3.51 | % | | | 3.99 | % | | | 3.72 | % | | | 3.91 | % |
Net expenses | | | 0.80 | % | | | 0.81 | % | | | 0.78 | % | | | 0.78 | % | | | 0.79 | % |
Expenses (before waiver/reimbursement) | | | 0.80 | % | | | 0.82 | % | | | 0.83 | % | | | 0.83 | % | | | 0.84 | % |
Portfolio turnover rate | | | 47 | % | | | 46 | % | | | 68 | % | | | 111 | % | | | 125 | % |
Net assets at end of year (in 000’s) | | $ | 1,248,065 | | | $ | 761,278 | | | $ | 427,586 | | | $ | 417,984 | | | $ | 424,757 | |
| (a) | Per share data based on average shares outstanding during the year. |
| (b) | Total investment return is calculated exclusive of sales charges and assumes the reinvestment of dividends and distributions. |
| | | | | | | | | | | | | | | | | | | | |
| | | Year ended October 31, | |
| Investor Class | | 2016 | | | 2015 | | | 2014 | | | 2013 | | | 2012 | |
Net asset value at beginning of year | | $ | 9.97 | | | $ | 10.08 | | | $ | 9.38 | | | $ | 10.08 | | | $ | 9.31 | |
| | | | | | | | | | | | | | | | | | | | |
Net investment income (loss) | | | 0.32 | | | | 0.35 | | | | 0.39 | | | | 0.36 | | | | 0.38 | (a) |
Net realized and unrealized gain (loss) on investments | | | 0.26 | | | | (0.11 | ) | | | 0.69 | | | | (0.70 | ) | | | 0.77 | |
| | | | | | | | | | | | | | | | | | | | |
Total from investment operations | | | 0.58 | | | | 0.24 | | | | 1.08 | | | | (0.34 | ) | | | 1.15 | |
| | | | | | | | | | | | | | | | | | | | |
| Less dividends: | | | | | | | | | | | | | | | | | | | | |
From net investment income | | | (0.32 | ) | | | (0.35 | ) | | | (0.38 | ) | | | (0.36 | ) | | | (0.38 | ) |
| | | | | | | | | | | | | | | | | | | | |
Net asset value at end of year | | $ | 10.23 | | | $ | 9.97 | | | $ | 10.08 | | | $ | 9.38 | | | $ | 10.08 | |
| | | | | | | | | | | | | | | | | | | | |
Total investment return (b) | | | 5.83 | % | | | 2.47 | % | | | 11.76 | % | | | (3.45 | %) | | | 12.58 | % |
| Ratios (to average net assets)/Supplemental Data: | | | | | | | | | | | | | | | | | | | | |
Net investment income (loss) | | | 3.11 | % | | | 3.54 | % | | | 3.94 | % | | | 3.67 | % | | | 3.92 | % |
Net expenses | | | 0.79 | % | | | 0.82 | % | | | 0.84 | % | | | 0.84 | % | | | 0.86 | % |
Expenses (before waiver/reimbursement) | | | 0.79 | % | | | 0.83 | % | | | 0.89 | % | | | 0.89 | % | | | 0.91 | % |
Portfolio turnover rate | | | 47 | % | | | 46 | % | | | 68 | % | | | 111 | % | | | 125 | % |
Net assets at end of year (in 000’s) | | $ | 16,344 | | | $ | 17,259 | | | $ | 18,264 | | | $ | 19,094 | | | $ | 21,437 | |
| (a) | Per share data based on average shares outstanding during the year. |
| (b) | Total investment return is calculated exclusive of sales charges and assumes the reinvestment of dividends and distributions. |
| | | | |
| 32 | | MainStay Tax Free Bond Fund | | The notes to the financial statements are an integral part of,
and should be read in conjunction with, the financial statements. |
Financial Highlights selected per share data and ratios
| | | | | | | | | | | | | | | | | | | | |
| | | Year ended October 31, | |
| Class B | | 2016 | | | 2015 | | | 2014 | | | 2013 | | | 2012 | |
Net asset value at beginning of year | | $ | 9.92 | | | $ | 10.03 | | | $ | 9.33 | | | $ | 10.03 | | | $ | 9.26 | |
| | | | | | | | | | | | | | | | | | | | |
Net investment income (loss) | | | 0.29 | | | | 0.33 | | | | 0.35 | | | | 0.34 | | | | 0.35 | (a) |
Net realized and unrealized gain (loss) on investments | | | 0.26 | | | | (0.11 | ) | | | 0.71 | | | | (0.70 | ) | | | 0.78 | |
| | | | | | | | | | | | | | | | | | | | |
Total from investment operations | | | 0.55 | | | | 0.22 | | | | 1.06 | | | | (0.36 | ) | | | 1.13 | |
| | | | | | | | | | | | | | | | | | | | |
| Less dividends: | | | | | | | | | | | | | | | | | | | | |
From net investment income | | | (0.29 | ) | | | (0.33 | ) | | | (0.36 | ) | | | (0.34 | ) | | | (0.36 | ) |
| | | | | | | | | | | | | | | | | | | | |
Net asset value at end of year | | $ | 10.18 | | | $ | 9.92 | | | $ | 10.03 | | | $ | 9.33 | | | $ | 10.03 | |
| | | | | | | | | | | | | | | | | | | | |
Total investment return (b) | | | 5.58 | % | | | 2.21 | % | | | 11.52 | % | | | (3.73 | %) | | | 12.34 | % |
| Ratios (to average net assets)/Supplemental Data: | | | | | | | | | | | | | | | | | | | | |
Net investment income (loss) | | | 2.84 | % | | | 3.28 | % | | | 3.69 | % | | | 3.41 | % | | | 3.59 | % |
Net expenses | | | 1.04 | % | | | 1.07 | % | | | 1.09 | % | | | 1.09 | % | | | 1.11 | % |
Expenses (before waiver/reimbursement) | | | 1.04 | % | | | 1.08 | % | | | 1.14 | % | | | 1.14 | % | | | 1.16 | % |
Portfolio turnover rate | | | 47 | % | | | 46 | % | | | 68 | % | | | 111 | % | | | 125 | % |
Net assets at end of year (in 000’s) | | $ | 19,318 | | | $ | 16,806 | | | $ | 12,439 | | | $ | 12,459 | | | $ | 13,230 | |
| (a) | Per share data based on average shares outstanding during the year. |
| (b) | Total investment return is calculated exclusive of sales charges and assumes the reinvestment of dividends and distributions. |
| | | | | | | | | | | | | | | | | | | | |
| | | Year ended October 31, | |
| Class C | | 2016 | | | 2015 | | | 2014 | | | 2013 | | | 2012 | |
Net asset value at beginning of year | | $ | 9.93 | | | $ | 10.03 | | | $ | 9.34 | | | $ | 10.04 | | | $ | 9.27 | |
| | | | | | | | | | | | | | | | | | | | |
Net investment income (loss) | | | 0.29 | | | | 0.33 | | | | 0.36 | | | | 0.35 | | | | 0.35 | (a) |
Net realized and unrealized gain (loss) on investments | | | 0.25 | | | | (0.10 | ) | | | 0.69 | | | | (0.71 | ) | | | 0.78 | |
| | | | | | | | | | | | | | | | | | | | |
Total from investment operations | | | 0.54 | | | | 0.23 | | | | 1.05 | | | | (0.36 | ) | | | 1.13 | |
| | | | | | | | | | | | | | | | | | | | |
| Less dividends: | | | | | | | | | | | | | | | | | | | | |
From net investment income | | | (0.29 | ) | | | (0.33 | ) | | | (0.36 | ) | | | (0.34 | ) | | | (0.36 | ) |
| | | | | | | | | | | | | | | | | | | | |
Net asset value at end of year | | $ | 10.18 | | | $ | 9.93 | | | $ | 10.03 | | | $ | 9.34 | | | $ | 10.04 | |
| | | | | | | | | | | | | | | | | | | | |
Total investment return (b) | | | 5.48 | % | | | 2.31 | % | | | 11.40 | % | | | (3.72 | %) | | | 12.33 | % |
| Ratios (to average net assets)/Supplemental Data: | | | | | | | | | | | | | | | | | | | | |
Net investment income (loss) | | | 2.81 | % | | | 3.28 | % | | | 3.68 | % | | | 3.42 | % | | | 3.58 | % |
Net expenses | | | 1.04 | % | | | 1.07 | % | | | 1.09 | % | | | 1.09 | % | | | 1.11 | % |
Expenses (before waiver/reimbursement) | | | 1.04 | % | | | 1.08 | % | | | 1.14 | % | | | 1.14 | % | | | 1.16 | % |
Portfolio turnover rate | | | 47 | % | | | 46 | % | | | 68 | % | | | 111 | % | | | 125 | % |
Net assets at end of year (in 000’s) | | $ | 273,386 | | | $ | 183,509 | | | $ | 154,863 | | | $ | 150,244 | | | $ | 142,246 | |
| (a) | Per share data based on average shares outstanding during the year. |
| (b) | Total investment return is calculated exclusive of sales charges and assumes the reinvestment of dividends and distributions. |
| | | | | | |
The notes to the financial statements are an integral part of,
and should be read in conjunction with, the financial statements. | | | | | 33 | |
Financial Highlights selected per share data and ratios
| | | | | | | | | | | | | | | | | | | | |
| | | Year ended October 31, | |
| Class I | | 2016 | | | 2015 | | | 2014 | | | 2013 | | | 2012 | |
Net asset value at beginning of year | | $ | 9.93 | | | $ | 10.03 | | | $ | 9.34 | | | $ | 10.04 | | | $ | 9.27 | |
| | | | | | | | | | | | | | | | | | | | |
Net investment income (loss) | | | 0.34 | | | | 0.38 | | | | 0.41 | | | | 0.40 | | | | 0.40 | (a) |
Net realized and unrealized gain (loss) on investments | | | 0.25 | | | | (0.10 | ) | | | 0.69 | | | | (0.71 | ) | | | 0.78 | |
| | | | | | | | | | | | | | | | | | | | |
Total from investment operations | | | 0.59 | | | | 0.28 | | | | 1.10 | | | | (0.31 | ) | | | 1.18 | |
| | | | | | | | | | | | | | | | | | | | |
| Less dividends: | | | | | | | | | | | | | | | | | | | | |
From net investment income | | | (0.34 | ) | | | (0.38 | ) | | | (0.41 | ) | | | (0.39 | ) | | | (0.41 | ) |
| | | | | | | | | | | | | | | | | | | | |
Net asset value at end of year | | $ | 10.18 | | | $ | 9.93 | | | $ | 10.03 | | | $ | 9.34 | | | $ | 10.04 | |
| | | | | | | | | | | | | | | | | | | | |
Total investment return (b) | | | 5.99 | % | | | 2.83 | % | | | 12.02 | % | | | (3.18 | %) | | | 12.97 | % |
| Ratios (to average net assets)/Supplemental Data: | | | | | | | | | | | | | | | | | | | | |
Net investment income (loss) | | | 3.29 | % | | | 3.78 | % | | | 4.21 | % | | | 4.00 | % | | | 4.06 | % |
Net expenses | | | 0.55 | % | | | 0.56 | % | | | 0.53 | % | | | 0.54 | % | | | 0.54 | % |
Expenses (before waiver/reimbursement) | | | 0.55 | % | | | 0.57 | % | | | 0.58 | % | | | 0.59 | % | | | 0.59 | % |
Portfolio turnover rate | | | 47 | % | | | 46 | % | | | 68 | % | | | 111 | % | | | 125 | % |
Net assets at end of year (in 000’s) | | $ | 899,128 | | | $ | 513,893 | | | $ | 314,005 | | | $ | 236,531 | | | $ | 142,603 | |
| (a) | Per share data based on average shares outstanding during the year. |
| (b) | Total investment return is calculated exclusive of sales charges and assumes the reinvestment of dividends and distributions. Class I shares are not subject to sales charges. |
| | | | |
| 34 | | MainStay Tax Free Bond Fund | | The notes to the financial statements are an integral part of,
and should be read in conjunction with, the financial statements. |
Notes to Financial Statements
Note 1–Organization and Business
The MainStay Funds (the “Trust”) was organized on January 9, 1986, as a Massachusetts business trust. The Trust is registered under the Investment Company Act of 1940, as amended (the “1940 Act”), as an open-end management investment company, and is comprised of twelve funds (collectively referred to as the “Funds”). These financial statements and notes relate to the MainStay Tax Free Bond Fund (the “Fund”), a “diversified” fund, as that term is defined in the 1940 Act, as interpreted or modified by regulatory authorities having jurisdiction, from time to time.
The Fund currently offers five classes of shares. Class A shares commenced operations on January 3, 1995. Class B shares commenced operations on May 1, 1986. Class C shares commenced operations on September 1, 1998. Investor Class shares commenced operations on February 28, 2008. Class I shares commenced operations on December 21, 2009. Class A and Investor Class shares are offered at net asset value (“NAV”) per share plus an initial sales charge. No initial sales charge applies to investments of $250,000 or more (and certain other qualified purchases) in Class A and Investor Class shares, but a contingent deferred sales charge (“CDSC”) of 1.00% may be imposed on certain redemptions of such shares made within one year of the date of purchase on shares that were purchased without an initial sales charge made before January 1, 2017. Effective January 1, 2017, a CDSC of 1.00% may be imposed on certain redemptions of Class A and Investor Class shares made within 24 months of the date of purchase of such shares that were made without an initial sales charge. Class B and Class C shares are offered at NAV without an initial sales charge, although a CDSC that declines depending on the number of years a shareholder has held its Class B shares may be imposed on redemptions made within six years of the date of purchase of such shares and a 1.00% CDSC may be imposed on redemptions made within one year of the date of purchase of Class C shares. Class I shares are offered at NAV and are not subject to a sales charge. Depending upon eligibility, Class B shares convert to either Investor Class or Class A shares at the end of the calendar quarter eight years after the date they were purchased. Additionally, depending upon eligibility, Investor Class shares may convert to Class A shares and Class A shares may convert to Investor Class shares. Under certain circumstances and as may be permitted by the Trust’s multiple class plan under Rule 18f-3 of the 1940 Act, an exchange/conversion may be made from specified share classes of the Fund to one or more other share classes of the Fund as disclosed in the capital share transactions within these notes. The five classes of shares have the same voting (except for issues that relate solely to one class), dividend, liquidation and other rights, and the same terms and conditions, except that Class B and Class C shares are subject to higher distribution and/or service fee rates than Class A and Investor Class shares under a distribution plan pursuant to Rule 12b-1 under the 1940 Act. Class I shares are not subject to a distribution and/or service fee.
The Fund’s investment objective is to seek current income exempt from regular federal income tax.
Note 2–Significant Accounting Policies
The Fund is an investment company and accordingly follows the investment company accounting and reporting guidance of the Financial
Accounting Standards Board (“FASB”) Accounting Standard Codification Topic 946 Financial Services—Investment Companies. The Fund prepares its financial statements in accordance with generally accepted accounting principles (“GAAP”) in the United States of America and follows the significant accounting policies described below.
(A) Securities Valuation. Investments are usually valued as of the close of regular trading on the New York Stock Exchange (the “Exchange”) (usually 4:00 p.m. Eastern time) on each day the Fund is open for business (“valuation date”).
The Board of Trustees (the “Board”) adopted procedures establishing methodologies for the valuation of the Fund’s securities and other assets and delegated the responsibility for valuation determinations under those procedures to the Valuation Committee of the Trust (the “Valuation Committee”). The Board authorized the Valuation Committee to appoint a Valuation Sub-Committee (the “Sub-Committee”) to deal in the first instance with establishing the prices of securities for which market quotations are not readily available or the prices of which are not otherwise readily determinable under these procedures. The Sub-Committee meets (in person, via electronic mail or via teleconference) on an as-needed basis. Subsequently, the Valuation Committee meets to ensure that actions taken by the Sub-Committee were appropriate. The procedures recognize that, subject to the oversight of the Board and unless otherwise noted, the responsibility for the day-to-day valuation of portfolio assets (including fair value measurements for the Fund’s assets and liabilities) rests with New York Life Investment Management LLC (“New York Life Investments” or the “Manager”), aided to whatever extent necessary by the Subadvisor (as defined in Note 3(A)) to the Fund.
To assess the appropriateness of security valuations, the Manager, Subadvisor or the Fund’s third party service provider, who is subject to oversight by the Manager, regularly compares prior day prices, prices on comparable securities, and the sale prices to the prior and current day prices and challenges prices with changes exceeding certain tolerance levels with third party pricing services or broker sources. For those securities valued through either a standardized fair valuation methodology or a fair valuation measurement, the Sub-Committee deals in the first instance with such valuation and the Valuation Committee reviews and affirms, if appropriate, the reasonableness of the valuation based on such methodologies and measurements on a regular basis after considering all relevant information that is reasonably available. Any action taken by the Sub-Committee with respect to the valuation of a portfolio security or other asset is submitted by the Valuation Committee to the Board for its review and ratification, if appropriate, at its next regularly scheduled meeting.
“Fair value” is defined as the price the Fund would reasonably expect to receive upon selling an asset or liability in an orderly transaction to an independent buyer in the principal or most advantageous market for the asset or liability. Fair value measurements are determined within a framework that establishes a three-tier hierarchy which maximizes the use of observable market data and minimizes the use of unobservable inputs to establish a classification of fair value measurements for disclosure purposes. “Inputs” refer broadly to the assumptions that market participants would use in pricing the asset or liability, including assumptions about risk, such as the risk inherent in a particular valuation technique used to measure fair value using a pricing model and/or the risk inherent in the inputs for the valuation technique. Inputs may be
Notes to Financial Statements (continued)
observable or unobservable. Observable inputs reflect the assumptions market participants would use in pricing the asset or liability based on market data obtained from sources independent of the Fund. Unobservable inputs reflect the Fund’s own assumptions about the assumptions market participants would use in pricing the asset or liability based on the information available. The inputs or methodology used for valuing assets or liabilities may not be an indication of the risks associated with investing in those assets or liabilities. The three-tier hierarchy of inputs is summarized below.
| • | | Level 1—quoted prices in active markets for an identical asset or liability |
| • | | Level 2—other significant observable inputs (including quoted prices for a similar asset or liability in active markets, interest rates and yield curves, prepayment speeds, credit risk, etc.) |
| • | | Level 3—significant unobservable inputs (including the Fund’s own assumptions about the assumptions that market participants would use in measuring fair value of an asset or liability) |
The level of an asset or liability within the fair value hierarchy is based on the lowest level of an input, both individually and in the aggregate, that is significant to the fair value measurement. As of October 31, 2016, the aggregate value by input level of the Fund’s assets and liabilities is included at the end of the Fund’s Portfolio of Investments.
The Fund may use third party vendor evaluations, whose prices may be derived from one or more of the following standard inputs, among others:
| | |
• Benchmark yields | | • Reported trades |
• Broker/dealer quotes | | • Issuer spreads |
• Two-sided markets | | • Benchmark securities |
• Bids/offers | | • Reference data (corporate actions or material event notices) |
• Industry and economic events | | • Comparable bonds |
• Monthly payment information | | |
An asset or liability for which market values cannot be measured using the methodologies described above is valued by methods deemed reasonable in good faith by the Valuation Committee, following the procedures established by the Board, to represent fair value. Under these procedures, the Fund generally uses a market-based approach which may use related or comparable assets or liabilities, recent transactions, market multiples, book values, and other relevant information. The Fund may also use an income-based valuation approach in which the anticipated future cash flows of the asset or liability are discounted to calculate fair value. Discounts may also be applied due to the nature and/or duration of any restrictions on the disposition of the asset or liability. Fair value represents a good faith approximation of the value of a security. Fair value determinations involve the consideration of a number of subjective factors, an analysis of applicable facts and circumstances and the exercise of judgment. As a result, it is possible that the fair value for a security determined in good faith in accordance with the Fund’s valuation procedures may differ from valuations for the same security determined by other funds using their own valuation procedures. Although the Fund’s valuation procedures are designed to value a security at the price the Fund may reasonably expect to receive
upon its sale in an orderly transaction, there can be no assurance that any fair value determination thereunder would, in fact, approximate the amount that the Fund would actually realize upon the sale of the security or the price at which the security would trade if a reliable market price were readily available. During the year ended October 31, 2016, there were no material changes to the fair value methodologies.
Securities which may be valued in this manner include, but are not limited to: (i) a security for which trading has been halted or suspended; (ii) a debt security that has recently gone into default and for which there is not a current market quotation; (iii) a security of an issuer that has entered into a restructuring; (iv) a security that has been de-listed from a national exchange; (v) a security for which the market price is not readily available from a third party pricing source or, if so provided, does not, in the opinion of the Manager or Subadvisor reflect the security’s market value; (vi) a security subject to trading collars for which no or limited trading takes place; and (vii) a security whose principal market has been temporarily closed at a time when, under normal conditions, it would be open. Securities for which market quotations or observable inputs are not readily available are generally categorized as Level 3 in the hierarchy. As of October 31, 2016, there were no securities held by the Fund that were fair valued in such a manner.
Futures contracts are valued at the last posted settlement price on the market where such futures are primarily traded. Investments in mutual funds, including money market funds, are valued at their respective NAVs as of the close of the Exchange on the valuation date. These securities are generally categorized as Level 1 in the hierarchy.
Municipal debt securities are valued at the evaluated mean prices supplied by a pricing agent or broker selected by the Manager, in consultation with the Subadvisor. Those values reflect broker/dealer supplied prices and electronic data processing techniques, if the evaluated bid or mean prices are deemed by the Manager, in consultation with the Subadvisor, to be representative of market values, at the regular close of trading of the Exchange on each valuation date. Debt securities purchased on a delayed delivery basis are marked to market daily until settlement at the forward settlement date. Municipal debt securities are generally categorized as Level 2 in the hierarchy.
Temporary cash investments acquired in excess of 60 days to maturity at the time of purchase are valued using the latest bid prices or using valuations based on a matrix system (which considers such factors as security prices, yields, maturities, and ratings), both as furnished by independent pricing services. Other temporary cash investments which mature in 60 days or less at the time of purchase (“Short-Term Investments”) are valued using the amortized cost method of valuation, unless the use of such method would be inappropriate. The amortized cost method involves valuing a security at its cost on the date of purchase and thereafter assuming a constant amortization to maturity of the difference between such cost and the value on maturity date. Amortized cost approximates the current fair value of a security. Securities valued using the amortized cost method are not valued using quoted prices in an active market and are generally categorized as Level 2 in the hierarchy.
The information above is not intended to reflect an exhaustive list of the methodologies that may be used to value portfolio investments. The valuation procedures permit the use of a variety of valuation method-
| | |
| 36 | | MainStay Tax Free Bond Fund |
ologies in connection with valuing portfolio investments. The methodology used for a specific type of investment may vary based on the market data available or other considerations. The methodologies summarized above may not represent the specific means by which portfolio investments are valued on any particular business day.
A Fund security or other asset may be determined to be illiquid under procedures approved by the Board. Illiquidity of a security might prevent the sale of such security at a time when the Manager or Subadvisor might wish to sell, and these securities could have the effect of decreasing the overall level of the Fund’s liquidity. Further, the lack of an established secondary market may make it more difficult to value illiquid securities, requiring the Fund to rely on judgments that may be somewhat subjective in measuring value, which could vary materially from the amount that the Fund could realize upon disposition. Difficulty in selling illiquid securities may result in a loss or may be costly to the Fund. Under the supervision of the Board, the Manager or Subadvisor determine the liquidity of the Fund’s investments; in doing so, the Manager or Subadvisor may consider various factors, including (i) the frequency of trades and quotations, (ii) the number of dealers and prospective purchasers, (iii) dealer undertakings to make a market, and (iv) the nature of the security and the market in which it trades (e.g., the time needed to dispose of the security, the method of soliciting offers and the mechanics of transfer). Illiquid securities are often valued in accordance with methods deemed by the Board in good faith to be reasonable and appropriate to accurately reflect their fair value. The liquidity of the Fund’s investments, as shown in the Portfolio of Investments, was determined as of October 31, 2016 and can change at any time in response to, among other relevant factors, market conditions or events or developments with respect to an individual issuer or instrument.
(B) Income Taxes. The Fund’s policy is to comply with the requirements of the Internal Revenue Code of 1986, as amended (the “Internal Revenue Code”), applicable to regulated investment companies and to distribute all of its taxable income to the shareholders of the Fund within the allowable time limits. Therefore, no federal, state and local income tax provisions are required.
Management evaluates the Fund’s tax positions to determine if the tax positions taken meet the minimum recognition threshold in connection with accounting for uncertainties in income tax positions taken or expected to be taken for the purposes of measuring and recognizing tax liabilities in the financial statements. Recognition of tax benefits of an uncertain tax position is permitted only to the extent the position is “more likely than not” to be sustained assuming examination by taxing authorities. Management has analyzed the Fund’s tax positions taken on federal, state and local income tax returns for all open tax years (for up to three tax years), and has concluded that no provisions for federal, state and local income tax are required in the Fund’s financial statements. The Fund’s federal, state and local income and federal excise tax returns for tax years for which the applicable statutes of limitations have not expired are subject to examination by the Internal Revenue Service and state and local departments of revenue.
(C) Dividends and Distributions to Shareholders. Dividends and distributions are recorded on the ex-dividend date. The Fund intends to declare dividends from net investment income, if any, daily and intends to pay them at least monthly and declares and pays
distributions from net realized capital gains, if any, at least annually. Unless the shareholder elects otherwise, all dividends and distributions are reinvested in the same class of shares of the Fund, at NAV. Dividends and distributions to shareholders are determined in accordance with federal income tax regulations and may differ from GAAP.
(D) Security Transactions and Investment Income. The Fund records security transactions on the trade date. Realized gains and losses on security transactions are determined using the identified cost method. Interest income is accrued as earned using the effective interest rate method. Discounts and premiums on securities purchased, other than Short-Term Investments, for the Fund are accreted and amortized, respectively, on the effective interest rate method over the life of the respective securities. Discounts and premiums on Short-Term Investments are accreted and amortized, respectively, on the straight-line method. The straight-line method approximates the effective interest method for short-term investments. Income from payment-in-kind securities is accreted daily based on the effective interest method.
Investment income and realized and unrealized gains and losses on investments of the Fund are allocated to separate classes of shares pro rata based upon their relative net assets on the date the income is earned or realized and unrealized gains and losses are incurred.
The Fund may place a debt security on non-accrual status and reduce related interest income by ceasing current accruals and writing off all or a portion of any interest receivables when the collection of all or a portion of such interest has become doubtful. A debt security is removed from non-accrual status when the issuer resumes interest payments or when collectability of interest is reasonably assured.
(E) Expenses. Expenses of the Trust are allocated to the individual Funds in proportion to the net assets of the respective Funds when the expenses are incurred, except where direct allocations of expenses can be made. Expenses (other than transfer agent expenses and fees incurred under the shareholder services plans and/or the distribution plans further discussed in Note 3(B)) are allocated to separate classes of shares pro rata based upon their relative net assets on the date the expenses are incurred. The expenses borne by the Fund, including those of related parties to the Fund, are shown in the Statement of Operations.
(F) Use of Estimates. In preparing financial statements in conformity with GAAP, management makes estimates and assumptions that affect the reported amounts and disclosures in the financial statements. Actual results could differ from those estimates.
(G) Futures Contracts. A futures contract is an agreement to purchase or sell a specified quantity of an underlying instrument at a specified future date and price, or to make or receive a cash payment based on the value of a financial instrument (e.g., interest rate, security, or securities index). The Fund is subject to risks such as market price risk and/or interest rate risk in the normal course of investing in these transactions. Upon entering into a futures contract, the Fund is required to pledge to the broker or futures commission merchant an amount of cash and/or U.S. Government securities equal to a certain percentage of the collateral amount, known as the “initial margin.” During the period the futures contract is open, changes in the value of the contract are recognized as unrealized appreciation or depreciation by marking to market such contract on a daily basis to reflect the market value of the
Notes to Financial Statements (continued)
contract at the end of each day’s trading. The Fund agrees to receive from or pay to the broker or futures commission merchant an amount of cash equal to the daily fluctuation in the value of the contract. Such receipts or payments are known as “variation margin.” When the futures contract is closed, the Fund records a realized gain or loss equal to the difference between the proceeds from (or cost of) the closing transaction and the Fund’s basis in the contract.
The use of futures contracts involves, to varying degrees, elements of market risk in excess of the amount recognized in the Statement of Assets and Liabilities. The contract or notional amounts and variation margin reflect the extent of the Fund’s involvement in open futures positions. There are several risks associated with the use of futures contracts as hedging techniques. There can be no assurance that a liquid market will exist at the time when the Fund seeks to close out a futures contract. If no liquid market exists, the Fund would remain obligated to meet margin requirements until the position is closed. Futures may involve a small initial investment relative to the risk assumed, which could result in losses greater than if they had not been used. Futures may be more volatile than direct investments in the instrument underlying the futures, and may not correlate to the underlying instrument, causing a given hedge not to achieve its objectives. The Fund’s activities in futures contracts have minimal counterparty risk as they are conducted through regulated exchanges that guarantee the futures against default by the counterparty. In the event of a bankruptcy or insolvency of a futures commission merchant that holds margin on behalf of the Fund, the Fund may not be entitled to the return of the entire margin owed to the Fund, potentially resulting in a loss. The Fund’s investment in futures contracts and other derivatives may increase the volatility of the Fund’s NAV and may result in a loss to the Fund.
(H) Securities Lending. In order to realize additional income, the Fund may engage in securities lending, subject to the limitations set forth in the 1940 Act and relevant guidance by the staff of the Securities and Exchange Commission (“SEC”). In the event the Fund does engage in securities lending, the Fund will lend through its custodian, State Street Bank and Trust Company (“State Street”). State Street will manage the Fund’s cash collateral in accordance with the lending agreement between the Fund and State Street, and indemnify the Fund against counterparty risk. The loans will be collateralized by cash or securities at least equal at all times to the market value of the securities loaned. Collateral will consist of U.S. government securities, cash equivalents or irrevocable letters of credit. The Fund may bear the risk of delay in recovery of, or loss of rights in, the securities loaned should the borrower of the securities experience financial difficulty. The Fund may also record a realized gain or loss on securities deemed sold due to a borrower’s inability to return securities on loan. The Fund bears the risk of any loss on investment of the collateral. The Fund will receive compensation for lending its securities in the form of fees or it will retain a portion of interest on the investment of any cash received as collateral. The Fund will also continue to receive interest and dividends on the securities loaned and any gain or loss in the market price of the securities loaned that may occur during the term of the loan will be for the account of the Fund. During the year ended October 31, 2016, the Fund did not have any portfolio securities on loan.
(I) Municipal Bond Risk. The Fund may invest a substantial amount of its assets in municipal bonds whose interest is paid solely from revenues of similar projects, which presents legal and economic risks relating to such projects that may have a significant impact on the Fund’s investment performance. In addition, the Fund may invest more heavily in bonds from certain cities, states, territories or regions than others, which may increase the Fund’s exposure to losses resulting from economic, political, or regulatory occurrences impacting these particular cities, states, territories or regions. Certain of the issuers in which the Fund may invest have recently experienced, or may experience, significant financial difficulties and repeated credit rating downgrades. For example, in recent years, Puerto Rico has experienced difficult financial and economic conditions, which may negatively affect the value of the Fund’s holdings in Puerto Rico municipal securities. The Fund’s vulnerability to potential losses associated with such developments may be reduced through investing in municipal securities that feature credit enhancements (such as bond insurance).
(J) Indemnifications. Under the Trust’s organizational documents, its officers and trustees are indemnified against certain liabilities that may arise out of performance of their duties to the Trust. Additionally, in the normal course of business, the Fund enters into contracts with third-party service providers that contain a variety of representations and warranties and which may provide general indemnifications. The Fund’s maximum exposure under these arrangements is unknown, as this would involve future claims that may be made against the Fund that have not yet occurred. Based on experience, management is of the view that the risk of loss in connection with these potential indemnification obligations is remote. However, there can be no assurance that material liabilities related to such obligations will not arise in the future, which could adversely impact the Fund.
(K) Quantitative Disclosure of Derivative Holdings. The following tables show additional disclosures related to the Fund’s derivative and hedging activities, including how such activities are accounted for and their effect on the Fund’s financial positions, performance and cash flows. The Fund entered into futures contracts to help manage the duration and yield curve positioning of the portfolio. These derivatives are not accounted for as hedging instruments.
Fair value of derivative instruments as of October 31, 3016:
Asset Derivatives
| | | | | | | | | | |
| | | Statement of
Assets and
Liabilities
Location | | Interest
Rate
Contracts
Risk | | | Total | |
Futures Contracts | | Net Assets—Net unrealized appreciation (depreciation) on investments and futures contracts (a) | | $ | 2,843,049 | | | $ | 2,843,049 | |
| | | | | | |
Total Fair Value | | | | $ | 2,843,049 | | | $ | 2,843,049 | |
| | | | | | | | | | |
| (a) | Includes cumulative appreciation (depreciation) of futures contracts as reported in the Portfolio of Investments. Only current day’s variation margin is reported within the Statement of Assets and Liabilities. |
| | |
| 38 | | MainStay Tax Free Bond Fund |
The effect of derivative instruments on the Statement of Operations for the year ended October 31, 2016:
Realized Gain (Loss)
| | | | | | | | | | |
| | | Statement of
Operations
Location | | Interest
Rate
Contracts
Risk | | | Total | |
Futures Contracts | | Net realized gain (loss) on futures transactions | | $ | (8,093,795 | ) | | $ | (8,093,795 | ) |
| | | | | | |
Total Realized Gain (Loss) | | | | $ | (8,093,795 | ) | | $ | (8,093,795 | ) |
| | | | | | | | | | |
Change in Unrealized Appreciation (Depreciation)
| | | | | | | | | | |
| | | Statement of
Operations
Location | | Interest
Rate
Contracts
Risk | | | Total | |
Futures Contracts | | Net change in unrealized appreciation (depreciation) on futures contracts | | $ | 2,214,751 | | | $ | 2,214,751 | |
| | | | | | |
Total Change in Unrealized Appreciation (Depreciation) | | | | $ | 2,214,751 | | | $ | 2,214,751 | |
| | | | | | | | | | |
Average Notional Amount
| | | | | | | | |
| | | Interest
Rate
Contracts
Risk | | | Total | |
Futures Contracts Short | | $ | (244,236,380 | ) | | $ | (244,236,380 | ) |
| | | | | | | | |
Note 3–Fees and Related Party Transactions
(A) Manager and Subadvisor. New York Life Investments, a registered investment adviser and an indirect, wholly-owned subsidiary of New York Life Insurance Company (“New York Life”), serves as the Fund’s Manager, pursuant to an Amended and Restated Management Agreement (“Management Agreement”). The Manager provides offices, conducts clerical, recordkeeping and bookkeeping services, and keeps most of the financial and accounting records required to be maintained by the Fund. Except for the portion of salaries and expenses that are the responsibility of the Fund, the Manager pays the salaries and expenses of all personnel affiliated with the Fund and certain operational expenses of the Fund. The Fund reimburses New York Life Investments in an amount equal to a portion of the compensation of the Chief Compliance Officer of the Fund. MacKay Shields LLC (“MacKay Shields” or the “Subadvisor”), a registered investment adviser and an indirect, wholly-owned subsidiary of New York Life, serves as Subadvisor to the Fund and is responsible for the day-to-day portfolio management of the Fund. Pursuant to the terms of the Amended and Restated Subadvisory Agreement (“Subadvisory Agreement”) between New York Life Investments and MacKay Shields, New York Life Investments pays for the services of the Subadvisor.
Under the Management Agreement, which came into effect on February 28, 2015, the Fund pays the Manager a monthly fee for services performed and facilities furnished at an annual rate of the Fund’s average daily net assets as follows: 0.45% up to $500 million; 0.425% from $500 million to $1 billion; and 0.40% in excess of $1 billion, plus a fee for fund accounting services, previously provided by New York Life Investments under a separate fund accounting agreement, furnished at an annual rate of the Fund’s average daily net assets as follows: 0.05% up to $20 million; 0.0333% from $20 million to $100 million; and 0.01% in excess of $100 million.
During the year ended October 31, 2016, the effective management fee rate (exclusive of any applicable waivers/reimbursements) was 0.43% inclusive of a fee for fund accounting services of 0.01% of the Fund’s average daily net assets.
New York Life Investments has contractually agreed to waive fees and/or reimburse expenses so that Total Annual Fund Operating Expenses for Class A shares do not exceed 0.82% of its average daily net assets. New York Life Investments will apply an equivalent waiver or reimbursement, in an equal number of basis points, to the other share classes of the Fund. This agreement will remain in effect until March 1, 2017, and shall renew automatically for one year terms unless New York Life Investments provides written notice of termination prior to the start of the next term or upon approval by the Board. Total Annual Fund Operating Expenses excludes taxes, interest, litigation, extraordinary expenses, brokerage and other transaction expenses relating to the purchase or sale of portfolio investments, and acquired (underlying) fund fees and expenses.
During the year ended October 31, 2016, New York Life Investments earned fees from the Fund in the amount of $8,455,079.
State Street provides sub-administration and sub-accounting services to the Fund pursuant to an agreement with New York Life Investments. These services include calculating the daily NAVs of the Fund, maintaining the general ledger and sub-ledger accounts for the calculation of the Fund’s NAVs, and assisting New York Life Investments in conducting various aspects of the Fund’s administrative operations. For providing these services to the Fund, State Street is compensated by New York Life Investments.
(B) Distribution and Service Fees. The Trust, on behalf of the Fund, has entered into a distribution agreement with NYLIFE Distributors LLC (the “Distributor”), an indirect, wholly-owned subsidiary of New York Life. The Fund has adopted distribution plans (the “Plans”) in accordance with the provisions of Rule 12b-1 under the 1940 Act.
Pursuant to the Class A and Investor Class Plans, the Distributor receives a monthly distribution fee from the Class A and Investor Class shares at an annual rate of 0.25% of the average daily net assets of the Class A and Investor Class shares for distribution and/or service activities as designated by the Distributor. Pursuant to the Class B and Class C Plans, Class B and Class C shares pay the Distributor a monthly distribution fee at an annual rate of 0.25% of the average daily net assets of the Class B and Class C shares along with a service fee at an annual rate of 0.25% of the average daily net assets of the Class B and Class C shares, for a total 12b-1 fee of 0.50%. Class I shares are not subject to a distribution and/or service fee.
Notes to Financial Statements (continued)
The Plans provide that the distribution and service fees are payable to the Distributor regardless of the amounts actually expended by the Distributor for distribution of the Fund’s shares and service activities.
(C) Sales Charges. During the year ended October 31, 2016, the Fund was advised by the Distributor that the amount of initial sales charges retained on sales of Class A and Investor Class shares were $98,436 and $10,775, respectively. During the year ended October 31, 2016, the Fund was also advised that the Distributor retained CDSCs on redemptions of Class A, Class B and Class C shares of $206,101, $45,120 and $27,613, respectively.
(D) Transfer, Dividend Disbursing and Shareholder Servicing Agent. NYLIM Service Company LLC, an affiliate of New York Life Investments, is the Fund’s transfer, dividend disbursing and shareholder servicing agent pursuant to an agreement between NYLIM Service Company LLC and the Trust. NYLIM Service Company LLC has entered into an agreement with Boston Financial Data Services, Inc. (“BFDS”) pursuant to which BFDS performs certain transfer agent services on behalf of NYLIM Service Company LLC. During the year ended October 31, 2016, transfer agent expenses incurred by the Fund were as follows:
| | | | |
Class A | | $ | 895,462 | |
Investor Class | | | 13,066 | |
Class B | | | 13,993 | |
Class C | | | 178,536 | |
Class I | | | 647,502 | |
(E) Small Account Fee. Shareholders with small accounts adversely impact the cost of providing transfer agency services. In an effort to reduce total transfer agency expenses, the Fund has implemented a small account fee on certain types of accounts. Certain shareholders with an account balance of less than $1,000 are charged an annual per account fee of $20 (assessed semi-annually), the proceeds from which offset transfer agent fees as reflected in the Statement of Operations.
Note 4–Federal Income Tax
As of October 31, 2016, the components of accumulated gain (loss) on a tax basis were as follows:
| | | | | | | | | | | | | | | | | | | | |
Ordinary
Income | | Undistributed
Tax Exempt
Income | | | Accumulated
Capital and Other Gain (Loss) | | | Other
Temporary
Differences | | | Unrealized
Appreciation
(Depreciation) | | | Total
Accumulated Gain (Loss) | |
| $— | | | 1,077,795 | | | $ | (26,564,897 | ) | | $ | (1,668,150 | ) | | $ | 67,125,617 | | | $ | 39,970,365 | |
The difference between book-basis and tax-basis unrealized appreciation (depreciation) is primarily due to wash sale adjustments and mark to market of futures contracts. The other temporary differences are primarily due to dividends payable.
Under the Regulated Investment Company Modernization Act of 2010, the Fund is permitted to carry forward capital losses incurred in taxable years beginning after December 22, 2010, for an unlimited period. However, any losses incurred during those future years will be required to be utilized prior to the losses incurred in pre-enactment tax years. As a result of this ordering rule, pre-enactment capital loss carryforwards may be more likely to expire unused. Additionally, post-enactment
capital losses that are carried forward will retain their character as either short-term or long-term capital losses rather than being considered all short-term as under previous law.
As of October 31, 2016, for federal income tax purposes, capital loss carryforwards of $26,564,897 were available as shown in the table below, to the extent provided by the regulations to offset future realized gains of the Fund through the years indicated. To the extent that these capital loss carryforwards are used to offset future realized gains, it is probable that the capital gains so offset will not be distributed to shareholders. No capital gain distributions shall be made until any capital loss carryforwards have been fully utilized or expired.
| | | | | | | | |
Capital Loss
Available Through | | Short-Term
Capital Loss
Amounts (000’s) | | | Long-Term
Capital Loss
Amounts (000’s) | |
| 2017 | | $ | 3,951 | | | $ | — | |
| 2019 | | | 2,136 | | | | — | |
| Unlimited | | | 20,478 | | | | — | |
| Total | | $ | 26,565 | | | $ | — | |
The Fund utilized $13,668,043 of capital loss carryforwards during the year ended October 31, 2016.
During the years ended October 31, 2016 and October 31, 2015, the tax character of distributions paid as reflected in the Statements of Changes in Net Assets was as follows:
| | | | | | | | |
| | | 2016 | | | 2015 | |
Distributions paid from: | | | | | | | | |
Ordinary Income | | $ | 407,328 | | | $ | 313,042 | |
Exempt Interest Dividends | | | 60,537,386 | | | | 43,489,359 | |
Total | | $ | 60,944,714 | | | $ | 43,802,401 | |
Note 5–Custodian
State Street is the custodian of cash and securities held by the Fund. Custodial fees are charged to the Fund based on the Fund’s net assets and/or the market value of securities held by the Fund and the number of certain transactions incurred by the Fund.
Note 6–Line of Credit
The Fund and certain other funds managed by New York Life Investments, maintain a line of credit with a syndicate of banks in order to secure a source of funds for temporary purposes to meet unanticipated or excessive redemption requests.
Effective August 2, 2016, under an amended and restated credit agreement (the “Credit Agreement”), the aggregate commitment amount is $600,000,000 with an additional uncommitted amount of $100,000,000. The commitment fee is an annual rate of 0.15% of the average commitment amount payable quarterly, regardless of usage, to Bank of New York Mellon, who serves as the agent to the syndicate. The commitment fee is allocated among the Fund and certain affiliated funds based upon their respective net assets and other factors. Interest on any revolving credit loan is charged based upon the Federal Funds Advances Rate or the one month London InterBank Offered Rate, whichever is higher. The Credit Agreement expires on August 1, 2017, although the
| | |
| 40 | | MainStay Tax Free Bond Fund |
Fund, certain affiliated funds and the syndicate of banks may renew the Credit Agreement for an additional year on the same or different terms. Prior to August 2, 2016, the aggregate commitment amount was $600,000,000 with an additional uncommitted amount of $100,000,000, and the commitment fee was at an annual rate of 0.10% of the average commitment amount. During the year ended October 31, 2016, there were no borrowings made or outstanding with respect to the Fund under the Credit Agreement.
Note 7–Interfund Lending Program
Pursuant to an exemptive order issued by the SEC, the Fund, along with certain other funds managed by New York Life Investments, may participate in an interfund lending program. The interfund lending program provides an alternate credit facility that permits the Fund and certain other funds managed by New York Life Investments to lend or borrow money for temporary purposes directly to or from one another, subject to the conditions of the exemptive order. During the year ended October 31, 2016, there were no interfund loans made or outstanding with respect to the Fund.
Note 8–Purchases and Sales of Securities (in 000’s)
During the year ended October 31, 2016, purchases and sales of securities, other than short-term securities, were $1,920,313 and $897,883, respectively.
Note 9–Capital Share Transactions
| | | | | | | | |
Class A | | Shares | | | Amount | |
Year ended October 31, 2016: | | | | | | | | |
Shares sold | | | 70,104,399 | | | $ | 718,773,459 | |
Shares issued to shareholders in reinvestment of dividends and distributions | | | 2,323,481 | | | | 23,781,700 | |
Shares redeemed | | | (26,748,385 | ) | | | (273,435,455 | ) |
| | | | |
Net increase (decrease) in shares outstanding before conversion | | | 45,679,495 | | | | 469,119,704 | |
Shares converted into Class A (See Note 1) | | | 389,062 | | | | 3,980,913 | |
Shares converted from Class A (See Note 1) | | | (178,665 | ) | | | (1,844,440 | ) |
| | | | |
Net increase (decrease) | | | 45,889,892 | | | $ | 471,256,177 | |
| | | | |
Year ended October 31, 2015: | | | | | | | | |
Shares sold | | | 46,277,057 | | | $ | 463,456,979 | |
Shares issued to shareholders in reinvestment of dividends and distributions | | | 1,508,116 | | | | 15,013,515 | |
Shares redeemed | | | (13,845,124 | ) | | | (137,611,020 | ) |
| | | | |
Net increase (decrease) in shares outstanding before conversion | | | 33,940,049 | | | | 340,859,474 | |
Shares converted into Class A (See Note 1) | | | 204,290 | | | | 2,047,068 | |
Shares converted from Class A (See Note 1) | | | (89,249 | ) | | | (890,021 | ) |
| | | | |
Net increase (decrease) | | | 34,055,090 | | | $ | 342,016,521 | |
| | | | |
| | | | | | | | |
Investor Class | | Shares | | | Amount | |
Year ended October 31, 2016: | | | | | | | | |
Shares sold | | | 298,750 | | | $ | 3,069,918 | |
Shares issued to shareholders in reinvestment of dividends and distributions | | | 45,201 | | | | 463,700 | |
Shares redeemed | | | (167,244 | ) | | | (1,712,234 | ) |
| | | | |
Net increase (decrease) in shares outstanding before conversion | | | 176,707 | | | | 1,821,384 | |
Shares converted into Investor Class (See Note 1) | | | 64,521 | | | | 663,592 | |
Shares converted from Investor Class (See Note 1) | | | (373,924 | ) | | | (3,842,733 | ) |
| | | | |
Net increase (decrease) | | | (132,696 | ) | | $ | (1,357,757 | ) |
| | | | |
Year ended October 31, 2015: | | | | | | | | |
Shares sold | | | 164,904 | | | $ | 1,655,664 | |
Shares issued to shareholders in reinvestment of dividends and distributions | | | 53,875 | | | | 539,748 | |
Shares redeemed | | | (214,189 | ) | | | (2,144,940 | ) |
| | | | |
Net increase (decrease) in shares outstanding before conversion | | | 4,590 | | | | 50,472 | |
Shares converted into Investor Class (See Note 1) | | | 100,312 | | | | 1,004,190 | |
Shares converted from Investor Class (See Note 1) | | | (186,853 | ) | | | (1,882,520 | ) |
| | | | |
Net increase (decrease) | | | (81,951 | ) | | $ | (827,858 | ) |
| | | | |
| | |
| | | | | | | | |
Class B | | Shares | | | Amount | |
Year ended October 31, 2016: | | | | | | | | |
Shares sold | | | 630,080 | | | $ | 6,448,957 | |
Shares issued to shareholders in reinvestment of dividends and distributions | | | 45,024 | | | | 459,842 | |
Shares redeemed | | | (446,357 | ) | | | (4,581,911 | ) |
| | | | |
Net increase (decrease) in shares outstanding before conversion | | | 228,747 | | | | 2,326,888 | |
Shares converted from Class B (See Note 1) | | | (24,509 | ) | | | (250,623 | ) |
| | | | |
Net increase (decrease) | | | 204,238 | | | $ | 2,076,265 | |
| | | | |
Year ended October 31, 2015: | | | | | | | | |
Shares sold | | | 596,022 | | | $ | 5,952,848 | |
Shares issued to shareholders in reinvestment of dividends and distributions | | | 42,430 | | | | 422,592 | |
Shares redeemed | | | (157,372 | ) | | | (1,564,408 | ) |
| | | | |
Net increase (decrease) in shares outstanding before conversion | | | 481,080 | | | | 4,811,032 | |
Shares converted from Class B (See Note 1) | | | (27,983 | ) | | | (278,717 | ) |
| | | | |
Net increase (decrease) | | | 453,097 | | | $ | 4,532,315 | |
| | | | |
| | |
| | | | | | | | |
Notes to Financial Statements (continued)
| | | | | | | | |
Class C | | Shares | | | Amount | |
Year ended October 31, 2016: | | | | | | | | |
Shares sold | | | 10,920,726 | | | $ | 111,687,557 | |
Shares issued to shareholders in reinvestment of dividends and distributions | | | 452,436 | | | | 4,629,198 | |
Shares redeemed | | | (3,007,809 | ) | | | (30,750,636 | ) |
| | | | |
Net increase (decrease) in shares outstanding before conversion | | | 8,365,353 | | | | 85,566,119 | |
Shares converted from Class C (See Note 1) | | | (3,327 | ) | | | (34,435 | ) |
| | | | |
Net increase (decrease) | | | 8,362,026 | | | $ | 85,531,684 | |
| | | | |
Year ended October 31, 2015: | | | | | | | | |
Shares sold | | | 5,178,766 | | | $ | 51,727,202 | |
Shares issued to shareholders in reinvestment of dividends and distributions | | | 377,993 | | | | 3,768,585 | |
Shares redeemed | | | (2,511,041 | ) | | | (25,008,168 | ) |
| | | | |
Net increase (decrease) | | | 3,045,718 | | | $ | 30,487,619 | |
| | | | |
| | |
| | | | | | | | |
Class I | | Shares | | | Amount | |
Year ended October 31, 2016: | | | | | | | | |
Shares sold | | | 48,954,715 | | | $ | 500,987,725 | |
Shares issued to shareholders in reinvestment of dividends and distributions | | | 1,130,288 | | | | 11,574,515 | |
Shares redeemed | | | (13,682,575 | ) | | | (140,262,947 | ) |
| | | | |
Net increase (decrease) in shares outstanding before conversion | | | 36,402,428 | | | | 372,299,293 | |
Shares converted into Class I (See Note 1) | | | 128,216 | | | | 1,327,726 | |
| | | | |
Net increase (decrease) | | | 36,530,644 | | | $ | 373,627,019 | |
| | | | |
Year ended October 31, 2015 : | | | | | | | | |
Shares sold | | | 28,783,951 | | | $ | 287,469,254 | |
Shares issued to shareholders in reinvestment of dividends and distributions | | | 759,448 | | | | 7,569,648 | |
Shares redeemed | | | (9,089,348 | ) | | | (90,368,310 | ) |
| | | | |
Net increase (decrease) | | | 20,454,051 | | | $ | 204,670,592 | |
| | | | |
Note 10–Recent Accounting Pronouncement
In October 2016, the U.S. Securities and Exchange Commission adopted new rules and amended existing rules (together, “final rules”) intended to modernize the reporting and disclosure of information by registered investment companies. In part, the final rules amend Regulation S-X and require standardized, enhanced disclosure about derivatives in investment company financial statements, as well as other amendments. The compliance date for the amendments to Regulation S-X is August 1, 2017. Management is currently evaluating the impact that the adoption of the amendments to Regulation S-X will have on the Fund’s financial statements and related disclosures.
Note 11–Subsequent Events
In connection with the preparation of the financial statements of the Fund as of and for the fiscal year ended October 31, 2016, events and transactions subsequent to October 31, 2016, through the date the financial statements were issued have been evaluated by the Fund’s management for possible adjustment and/or disclosure. No subsequent events requiring financial statement adjustment or disclosure have been identified other than the following:
Effective February 28, 2017, Class B shares of the MainStay Group of Funds will be closed to all new purchases as well as additional investments by existing Class B shareholders. Existing Class B shareholders may continue to reinvest dividends and capital gains distributions, as well as exchange their Class B shares for Class B shares of other Funds as permitted by the current exchange privileges. Class B shareholders will continue to be subject to any applicable contingent deferred sales charge at the time of redemption. All other features of the Class B shares, including but not limited to the fees and expenses applicable to Class B shares, will remain unchanged. Unless redeemed, Class B Shares shareholders will remain in Class B shares of their respective Fund until the Class B shares are converted to Class A or Investor Class shares pursuant to the applicable conversion schedule.
| | |
| 42 | | MainStay Tax Free Bond Fund |
Report of Independent Registered Public Accounting Firm
The Board of Trustees and Shareholders of
The MainStay Funds:
We have audited the accompanying statement of assets and liabilities, including the portfolio of investments, of the MainStay Tax Free Bond Fund (the “Fund”), one of the funds constituting The MainStay Funds, as of October 31, 2016, and the related statement of operations for the year then ended, the statements of changes in net assets for each of the years in the two-year period then ended, and the financial highlights for each of the years in the five-year period then ended. These financial statements and financial highlights are the responsibility of the Fund’s management. Our responsibility is to express an opinion on these financial statements and financial highlights based on our audits.
We conducted our audits in accordance with the standards of the Public Company Accounting Oversight Board (United States). Those standards require that we plan and perform the audit to obtain reasonable assurance about whether the financial statements and financial highlights are free of material misstatement. An audit includes examining, on a test basis, evidence supporting the amounts and disclosures in the financial statements. Our procedures included confirmation of securities owned as of October 31, 2016, by correspondence with the custodian and brokers or by other appropriate auditing procedures where replies from brokers were not received. An audit also includes assessing the accounting principles used and significant estimates made by management, as well as evaluating the overall financial statement presentation. We believe that our audits provide a reasonable basis for our opinion.
In our opinion, the financial statements and financial highlights referred to above present fairly, in all material respects, the financial position of the MainStay Tax Free Bond Fund of The MainStay Funds as of October 31, 2016, the results of its operations for the year then ended, the changes in its net assets for each of the years in the two-year period then ended, and the financial highlights for each of the years in the five-year period then ended, in conformity with U.S. generally accepted accounting principles.

Philadelphia, Pennsylvania
December 22, 2016
Federal Income Tax Information
(Unaudited)
The Fund is required under the Internal Revenue Code to advise shareholders in a written statement as to the federal tax status of dividends paid by the Fund during such fiscal years.
For individual federal income tax purposes, the Fund designated 99.3% of the ordinary income dividends paid during the fiscal year ended October 31, 2016 as attributable to interest income from tax exempt municipal bonds. Such dividends are currently exempt from federal income taxes under Section 103 (a) of the Internal Revenue Code.
In February 2017, shareholders will receive an IRS. Form 1099-DIV or substitute Form 1099 which will show the federal tax status of the distributions received by shareholders in calendar year 2016. The amounts that will be reported on such 1099-DIV or substitute Form 1099 will be the amounts you are to use on your federal income tax return and will differ from the amounts which we must report for the Fund’s fiscal year ended October 31, 2016.
Proxy Voting Policies and Procedures and Proxy Voting Record
A description of the policies and procedures that New York Life Investments uses to vote proxies related to the Fund’s securities is available without charge, upon request, (i) by visiting the Fund’s website at mainstayinvestments.com; or (ii) on the SEC’s website at www.sec.gov.
The Fund is required to file with the SEC its proxy voting record for the 12-month period ending June 30 on Form N-PX. The Fund’s most recent Form N-PX or proxy voting record is available free of charge upon request (i) by calling 800-MAINSTAY (624-6782); (ii) by visiting the Fund’s website at mainstayinvestments.com; or (iii) on the SEC’s website at www.sec.gov.
Shareholder Reports and Quarterly Portfolio Disclosure
The Fund is required to file its complete schedule of portfolio holdings with the SEC for its first and third fiscal quarters on Form N-Q. The Fund’s Form N-Q is available without charge on the SEC’s website at www.sec.gov or by calling MainStay Investments at 800-MAINSTAY (624-6782). You also can obtain and review copies of Form N-Q by visiting the SEC’s Public Reference Room in Washington, DC (information on the operation of the Public Reference Room may be obtained by calling 1-800-SEC-0330).
| | |
| 44 | | MainStay Tax Free Bond Fund |
Board of Trustees and Officers (Unaudited)
The Trustees and officers of the Funds are listed below. The Board oversees the MainStay Group of Funds, MainStay VP Funds Trust, MainStay DefinedTerm Municipal Opportunities Fund, the Manager and the Subadvisors, and elects the officers of the Funds who are responsible for the day-to-day operations of the Funds. Information pertaining to the Trustees and officers is set forth below. Each Trustee serves until his or her successor is elected and qualified or until his or her resignation, death or removal. Under the Retirement Policy, a Trustee must
tender his or her resignation by the end of the calendar year during which he or she reaches the age of 75 (although the Board of Trustees may make exceptions from time to time). Officers serve a term of one year and are elected annually by the Board of Trustees. The business address of each Trustee and officer listed below is 51 Madison Avenue, New York, New York 10010. A majority of the Trustees are not “interested persons” (as defined by the 1940 Act and rules “adopted” by the SEC thereunder) of the Fund (“Independent Trustees”).
| | | | | | | | | | | | |
| | | | | Name and Date of Birth | | Term of Office, Position(s) Held and Length of Service | | Principal Occupation(s) During Past Five Years | | Number of
Portfolios in
Fund Complex
Overseen by
Board Member | | Other Directorships Held By Board Member |
Interested Trustee | | | | Christopher O. Blunt* 5/13/62 | | MainStay Funds: Trustee since January 2016; MainStay Funds Trust: Trustee since January 2016. | | Executive Vice President (since 2009), President, Investments Group (since 2015), Member of the Executive Management Committee (since 2007), Co-President, Insurance and Agency Group (2012 to 2015), President, Insurance Group (2012 to 2014), Executive Vice President, Retirement Income Security (2008 to 2012), New York Life Insurance Company. | | 83 | | MainStay VP Funds Trust:
Trustee since January 2016 (31 portfolios); and
MainStay DefinedTerm Municipal Opportunities Fund: Trustee since January 2016. |
| | * | This Trustee is considered to be an “interested person” of the MainStay Group of Funds within the meaning of the 1940 Act because of his affiliation with New York Life Insurance Company, New York Life Investment Management LLC, Cornerstone Capital Management Holdings LLC, MacKay Shields LLC, Institutional Capital LLC, NYL Investors LLC, NYLIFE Securities LLC and/or NYLIFE Distributors LLC, as described in detail above in the column entitled “Principal Occupation(s) During Past Five Years.” |
| | | | | | | | | | | | |
| | | | | Name and Date of Birth | | Term of Office, Position(s) Held and Length of Service | | Principal Occupation(s) During Past Five Years | | Number of Portfolios in Fund Complex Overseen by Board Member | | Other Directorships Held By Board Member |
| Non-Interested Trustee | | | | David H. Chow 12/29/57 | | MainStay Funds: Trustee since January 2016, Advisory Board Member (June 2015 to December 2015); MainStay Funds Trust: Trustee since January 2016, Advisory Board Member (June 2015 to December 2015). | | Founder and CEO, DanCourt Management, LLC (since 1999) | | 83 | | MainStay VP Funds Trust: Trustee since January 2016, Advisory Board Member (June 2015 to December 2015); (31 portfolios);
MainStay DefinedTerm Municipal Opportunities Fund: Trustee since January 2016, Advisory Board Member (June 2015 to December 2015);
Market Vectors Group of Exchange-Traded Funds: Independent Chairman of the Board of Trustees since 2008 and Trustee since 2006 (55 portfolios); and
Berea College of Kentucky: Trustee since 2009. |
| | | | Susan B. Kerley 8/12/51 | | MainStay Funds: Trustee since 2007; MainStay Funds Trust: Trustee since 1990.*** | | President, Strategic Management Advisors LLC (since 1990) | | 83 | | MainStay VP Funds Trust: Trustee since 2007 (31 portfolios)**;
MainStay DefinedTerm Municipal Opportunities Fund: Trustee since 2011; and Legg Mason Partners Funds: Trustee since 1991 (53 portfolios). |
| | | | Alan R. Latshaw 3/27/51 | | MainStay Funds: Trustee and Audit Committee Financial Expert since 2006; MainStay Funds Trust: Trustee and Audit Committee Financial Expert since 2007.*** | | Retired; Partner, Ernst & Young LLP (2002 to 2003); Partner, Arthur Andersen LLP (1989 to 2002); Consultant to the MainStay Funds Audit and Compliance Committee (2004 to 2006) | | 83 | | MainStay VP Funds Trust: Trustee and Audit Committee Financial Expert since 2007 (31 portfolios)**;
MainStay DefinedTerm Municipal Opportunities Fund: Trustee and Audit Committee Financial Expert since 2011;
State Farm Associates Funds Trusts: Trustee since 2005 (4 portfolios);
State Farm Mutual Fund Trust: Trustee since 2005 (15 portfolios); and
State Farm Variable Product Trust: Trustee since 2005 (9 portfolios). |
| | | | Peter Meenan 12/5/41 | | MainStay Funds: Chairman since 2013 and Trustee since 2007; MainStay Funds Trust: Chairman since 2013 and Trustee since 2002.*** | | Retired; Independent Consultant (2004 to 2013); President and Chief Executive Officer, Babson—United, Inc. (financial services firm) (2000 to 2004); Independent Consultant (1999 to 2000); Head of Global Funds, Citicorp (1995 to 1999) | | 83 | | MainStay VP Funds Trust: Chairman since 2013 and Trustee since 2007 (31 portfolios)**; and
MainStay DefinedTerm Municipal Opportunities Fund: Chairman since 2013 and Trustee since 2011. |
| | | | Richard H. Nolan, Jr. 11/16/46 | | MainStay Funds: Trustee since 2007; MainStay Funds Trust: Trustee since 2007.*** | | Managing Director, ICC Capital Management (since 2004); President—Shields/Alliance, Alliance Capital Management (1994 to 2004) | | 83 | | MainStay VP Funds Trust: Trustee since 2006 (31 portfolios)**; and
MainStay DefinedTerm Municipal Opportunities Fund: Trustee since 2011. |
| | | | Jacques P. Perold 5/12/58 | | MainStay Funds: Trustee since January 2016, Advisory Board Member (June 2015 to December 2015); MainStay Funds Trust: Trustee since January 2016, Advisory Board Member (June 2015 to December 2015). | | Retired; President, Fidelity Management & Research Company (2009 to 2014); Founder, President and Chief Executive Officer, Geode Capital Management, LCC (2001 to 2009) | | 83 | | MainStay VP Funds Trust: Trustee since January 2016, Advisory Board Member (June 2015 to December 2015); (31 portfolios);
MainStay DefinedTerm Municipal Opportunities Fund: Trustee since January 2016, Advisory Board Member (June 2015 to December 2015);
Allstate Corporation: Director since 2015; and
Boston University: Trustee since 2014. |
| | |
| 46 | | MainStay Tax Free Bond Fund |
| | | | | | | | | | | | |
| | | | | Name and Date of Birth | | Term of Office, Position(s) Held and Length of Service | | Principal Occupation(s) During Past Five Years | | Number of Portfolios in Fund Complex Overseen by Board Member | | Other Directorships Held By Board Member |
Non-Interested Trustee | | | | Richard S. Trutanic 2/13/52 | | MainStay Funds: Trustee since 1994; MainStay Funds Trust: Trustee since 2007.*** | | Chairman and Chief Executive Officer, Somerset & Company (financial advisory firm) (since 2004); Managing Director, The Carlyle Group (private investment firm) (2002 to 2004); Senior Managing Director, Partner and Board Member, Groupe Arnault S.A. (private investment firm) (1999 to 2002) | | 83 | | MainStay VP Funds Trust: Trustee since 2007 (31 portfolios)**; and
MainStay DefinedTerm Municipal Opportunities Fund: Trustee since 2011. |
| | | | John A. Weisser**** 10/22/41 | | MainStay Funds: Trustee since 2007; MainStay Funds Trust: Trustee since 2007.*** | | Retired; Managing Director of Salomon Brothers, Inc. (1971 to 1995) | | 83 | | MainStay VP Funds Trust: Trustee since 1997 (31 portfolios)**; MainStay DefinedTerm Municipal Opportunities Fund: Trustee since 2011; Direxion Insurance Trust: Trustee since 2007 (1 portfolio); Direxion Funds: Trustee since 2007 (18 portfolios); and Direxion Shares ETF Trust: Trustee since 2008 (52 portfolios). |
| | ** | Includes prior service as a Director of MainStay VP Series Fund, Inc., the predecessor to MainStay VP Funds Trust. |
| | *** | Includes prior service as a Director/Trustee of certain predecessor entities to MainStay Funds Trust. |
| | **** | Pursuant to the Retirement Policy, Mr. Weisser will retire from the Board of Trustees on or about December 31, 2016. |
| | | | | | | | |
| | | | | Name and Date of Birth | | Position(s) Held and Length of Service | | Principal Occupation(s) During Past Five Years |
Officers (Who Are Not Board Members)* | | | | Stephen P. Fisher 2/22/59 | | President, MainStay Funds (since 2007), MainStay Funds Trust (since 2009) | | Chairman and Chief Executive Officer (since 2014), President and Chief Operating Officer (2008 to 2013), NYLIFE Distributors LLC; Chairman of the Board, NYLIM Service Company LLC (since 2008); President (since May 2015), Co-President (2014 to 2015) and Senior Managing Director (since 2005), New York Life Investment Management LLC; President, MainStay DefinedTerm Municipal Opportunities Fund (since 2011) and MainStay VP Funds Trust (since 2007)** |
| | | | Jack R. Benintende 5/12/64 | | Treasurer and Principal Financial and Accounting Officer, MainStay Funds (since 2007), MainStay Funds Trust (since 2009) | | Managing Director, New York Life Investment Management LLC (since 2007); Treasurer and Principal Financial and Accounting Officer, MainStay DefinedTerm Municipal Opportunities Fund (since 2011) and MainStay VP Funds Trust (since 2007)**; and Assistant Treasurer, New York Life Investment Management Holdings LLC (2008 to 2012) |
| | | | Kevin M. Bopp 2/24/69 | | Vice President and Chief Compliance Officer, MainStay Funds and MainStay Funds Trust (since 2014) | | Chief Compliance Officer (since January 2016), Director and Associate General Counsel (2011 to 2014) and Vice President and Assistant General Counsel (2010 to 2011), New York Life Investment Management LLC; Vice President and Chief Compliance Officer, MainStay VP Funds Trust, MainStay DefinedTerm Municipal Opportunities Fund (since 2014); Assistant Secretary, MainStay Funds, MainStay Funds Trust and MainStay VP Funds Trust (2010 to 2014)**, MainStay DefinedTerm Municipal Opportunities Fund (2011 to 2014) |
| | | | J. Kevin Gao 10/13/67 | | Secretary and Chief Legal Officer, MainStay Funds and MainStay Funds Trust (since 2010) | | Managing Director and Associate General Counsel, New York Life Investment Management LLC (since 2010); Secretary and Chief Legal Officer, MainStay DefinedTerm Municipal Opportunities Fund (since 2011) and MainStay VP Funds Trust (since 2010)** |
| | | | Scott T. Harrington 2/8/59 | | Vice President— Administration, MainStay Funds (since 2005), MainStay Funds Trust (since 2009) | | Director, New York Life Investment Management LLC (including predecessor advisory organizations) (since 2000); Member of the Board of Directors, New York Life Trust Company (since 2009); Vice President—Administration, MainStay DefinedTerm Municipal Opportunities Fund (since 2011) and MainStay VP Funds Trust (since 2005)** |
| | * | The Officers listed above are considered to be “interested persons” of the MainStay Group of Funds within the meaning of the 1940 Act because of their affiliation with the MainStay Group of Funds, New York Life Insurance Company and/or its affiliates, including New York Life Investment Management LLC, NYLIM Service Company LLC, NYLIFE Securities LLC and/or NYLIFE Distributors LLC, as described in detail in the column captioned “Principal Occupation(s) During Past Five Years.” Officers are elected annually by the Board to serve a one year term. |
| | ** | Includes prior service as an Officer of MainStay VP Series Fund, Inc., the predecessor to MainStay VP Funds Trust. |
| | |
| 48 | | MainStay Tax Free Bond Fund |
This page intentionally left blank
This page intentionally left blank
MainStay Funds
MainStay offers a wide range of Funds for virtually any investment need. The full array of MainStay open-end offerings is listed here, with information about the manager, subadvisors, legal counsel and independent registered public accounting firm.
Equity
U.S. Equity
MainStay Common Stock Fund
MainStay Cornerstone Growth Fund
MainStay Epoch U.S. All Cap Fund
MainStay Epoch U.S. Equity Yield Fund
MainStay Epoch U.S. Small Cap Fund
MainStay ICAP Equity Fund
MainStay ICAP Select Equity Fund
MainStay Large Cap Growth Fund
MainStay MAP Fund
MainStay S&P 500 Index Fund
MainStay U.S. Equity Opportunities Fund
International/Global Equity
MainStay Emerging Markets Opportunities Fund
MainStay Epoch Capital Growth Fund
MainStay Epoch Global Choice Fund
MainStay Epoch Global Equity Yield Fund
MainStay Epoch International Small Cap Fund
MainStay ICAP International Fund
MainStay International Equity Fund
MainStay International Opportunities Fund
Income
Taxable Bond
MainStay Floating Rate Fund
MainStay Global High Income Fund
MainStay Government Fund
MainStay High Yield Corporate Bond Fund
MainStay High Yield Opportunities Fund
MainStay Indexed Bond Fund
MainStay Short Duration High Yield Fund
MainStay Total Return Bond Fund
MainStay Unconstrained Bond Fund
Municipal/Tax Advantaged Bond
MainStay California Tax Free Opportunities Fund1
MainStay High Yield Municipal Bond Fund
MainStay New York Tax Free Opportunities Fund2
MainStay Tax Advantaged Short Term Bond Fund
MainStay Tax Free Bond Fund
Money Market
MainStay Money Market Fund
Mixed Asset
MainStay Balanced Fund
MainStay Convertible Fund
MainStay Income Builder Fund
Alternative
MainStay Absolute Return Multi-Strategy Fund
MainStay Cushing Energy Income Fund
MainStay Cushing MLP Premier Fund
MainStay Cushing Renaissance Advantage Fund
Asset Allocation/Target Date
MainStay Conservative Allocation Fund
MainStay Growth Allocation Fund
MainStay Moderate Allocation Fund
MainStay Moderate Growth Allocation Fund
MainStay Retirement 2010 Fund
MainStay Retirement 2020 Fund
MainStay Retirement 2030 Fund
MainStay Retirement 2040 Fund
MainStay Retirement 2050 Fund
MainStay Retirement 2060 Fund
Manager
New York Life Investment Management LLC
New York, New York
Subadvisors
Candriam France S.A.S.3
Paris, France
Cornerstone Capital Management Holdings LLC3
New York, New York
Cushing Asset Management, LP
Dallas, Texas
Epoch Investment Partners, Inc.
New York, New York
Institutional Capital LLC3
Chicago, Illinois
MacKay Shields LLC3
New York, New York
Markston International LLC
White Plains, New York
NYL Investors LLC3
New York, New York
Winslow Capital Management, LLC
Minneapolis, Minnesota
Legal Counsel
Dechert LLP
Washington, District of Columbia
Independent Registered Public Accounting Firm
KPMG LLP
Philadelphia, Pennsylvania
1. This Fund is only registered for sale in AZ, CA, MI (Class A and Class I shares only), NV, OR, TX, UT and WA.
2. This Fund is only registered for sale in CA, CT, DE, FL, MA, NJ, NY and VT.
3. An affiliate of New York Life Investment Management LLC.
Not part of the Annual Report
For more information
800-MAINSTAY (624-6782)
mainstayinvestments.com
MainStay Investments® is a registered service mark and name under which New York Life Investment Management LLC does business. MainStay Investments, an indirect subsidiary of New York Life Insurance Company, New York, NY 10010, provides investment advisory products and services. The MainStay Funds® are managed by New York Life Investment Management LLC and distributed by NYLIFE Distributors LLC, 30 Hudson Street, Jersey City, NJ 07302, a wholly owned subsidiary of New York Life Insurance Company. NYLIFE Distributors LLC is a Member FINRA/SIPC.
©2016 NYLIFE Distributors LLC. All rights reserved.
| | | | | | | | |
| Not FDIC/NCUA Insured | | Not a Deposit | | May Lose Value | | No Bank Guarantee | | Not Insured by Any Government Agency |
| | |
| 1716275 MS316-16 | | MST11-12/16 (NYLIM) NL215 |
MainStay Convertible Fund
Message from the President and Annual Report
October 31, 2016


This page intentionally left blank
Message from the President
During the 12 months ended October 31, 2016, the U.S. stock and bond markets were somewhat volatile but generally ended the reporting period in positive territory. In the fall of 2015 and early 2016, the market appeared to be focused on China’s economic weakness and a prolonged decline in oil prices. Although energy-related companies felt the brunt of these setbacks, the stock market as a whole declined until mid-February, when oil prices began to rise and stocks began a relatively steady recovery.
In late June, the United Kingdom voted to leave the European Union in a referendum popularly known as “Brexit.” The news caused a temporary slump in stocks around the world. Although the British pound dropped in value following the vote, stocks generally recovered through the end of the reporting period. As the end of the reporting period approached, speculation about the upcoming U.S. presidential election heightened market volatility.
According to FTSE-Russell data, U.S. stocks as a whole tended to provide positive returns during the reporting period, with large-capitalization stocks generally outperforming stocks of smaller companies. Value stocks outpaced growth stocks at all capitalization levels, with the largest differences among small- to mid-cap stocks.
International and emerging-market stocks provided mixed performance. Rocked by Brexit, European stocks as a whole declined during the reporting period, while stocks in the Asia-Pacific region (with or without Japan) tended to provide positive returns. International stocks as a whole declined, while global stocks advanced slightly. Emerging-market stocks were considerably stronger, boosted by advances in India and Latin America and higher prices for oil, metals and other commodities.
Anticipation of a possible Federal Reserve rate hike led to volatility in the bond market, but the Federal Open Market Committee chose not to raise the federal funds target rate during the reporting period. Short-term U.S. Treasury yields rose during the reporting period, and longer-term U.S. Treasury yields declined. Overall, the U.S. bond market provided positive returns, with longer-term bonds generally outperforming shorter-term securities. High-yield bonds, particularly
longer-term issues, were strong performers. Municipal bonds generally provided positive single-digit total returns for the 12 months ended October 31, 2016.
Central banks around the world remained highly accommodative during the reporting period, particularly in light of Brexit. Shortly after the U.K. referendum, more than a third of all sovereign debt carried negative yields. As an asset class, emerging-market bonds provided double-digit positive returns during the reporting period, and world bonds as a whole provided positive single-digit positive returns.
At MainStay, we know that political, economic and market events may influence the performance of your Fund investments. While our portfolio managers often pay close attention to such events, their primary emphasis is seeking to invest for the long-term investment needs of our shareholders. With this in mind, they seek to pursue the investment objectives of their respective Funds using the principal investment strategies and investment processes outlined in the prospectus. By placing your assets in the care of our investment professionals, you gain access to their extensive market insight, strategic investment discipline and in-depth experience in risk-management over a wide range of market cycles.
The report that follows provides more detailed information about the market forces, portfolio strategies and individual securities that influenced the performance of your MainStay Fund during the 12 months ended October 31, 2016. We invite you to read the report carefully as part of your personal investment-review process.
We thank you for your business, and we look forward to a continuing relationship as you pursue your long-range financial goals.
Sincerely,

Stephen P. Fisher
President
The opinions expressed are as of the date of this report and are subject to change. There is no guarantee that any forecast made will come to pass. This material does not constitute investment advice and is not intended as an endorsement of any specific investment. Past performance is no guarantee of future results.
Not part of the Annual Report
Table of Contents
Investors should refer to the Fund’s Summary Prospectus and/or Prospectus and consider the Fund’s investment objectives, strategies, risks, charges and expenses carefully before investing. The Summary Prospectus and/or Prospectus contain this and other information about the Fund. You may obtain copies of the Fund’s Summary Prospectus, Prospectus and Statement of Additional Information free of charge, upon request, by calling toll-free 800-MAINSTAY (624-6782), by writing to NYLIFE Distributors LLC, Attn: MainStay Marketing Department, 30 Hudson Street, Jersey City, NJ 07302 or by sending an e-mail to MainStayShareholderServices@nylim.com. These documents are also available via the MainStay Funds’ website at mainstayinvestments.com/documents. Please read the Summary Prospectus and/or Prospectus carefully before investing.
Investment and Performance Comparison1 (Unaudited)
Performance data quoted represents past performance. Past performance is no guarantee of future results. Because of market volatility and other factors, current performance may be lower or higher than the figures shown. Investment return and principal value will fluctuate, and as a result, when shares are redeemed, they may be worth more or less than their original cost. The graph below depicts the historical performance of Class B shares of the Fund. Performance will vary from class to class based on differences in class-specific expenses and sales charges. For performance information current to the most recent month-end, please call 800-MAINSTAY (624-6782) or visit mainstayinvestments.com.
(With sales charges)
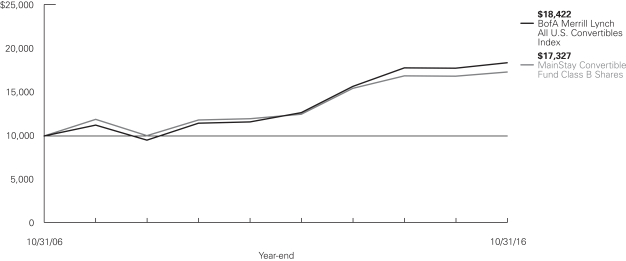
Average Annual Total Returns for the Year Ended October 31, 2016
| | | | | | | | | | | | | | | | | | | | |
| Class | | Sales Charge | | | | One Year | | | Five Years | | | Ten Years | | | Gross
Expense
Ratio2 | |
| Class A Shares | | Maximum 5.5% Initial Sales Charge | | With sales charges Excluding sales charges | |
| –2.00
3.71 | %
| |
| 7.42
8.64 | %
| |
| 6.02
6.62 | %
| |
| 0.99
0.99 | %
|
| Investor Class Shares3 | | Maximum 5.5% Initial Sales Charge | | With sales charges Excluding sales charges | |
| –2.10
3.60 |
| |
| 7.21
8.43 |
| |
| 5.83
6.43 |
| |
| 1.15
1.15 |
|
| Class B Shares | | Maximum 5% CDSC if Redeemed Within the First Six Years of Purchase | | With sales charges Excluding sales charges | |
| –1.94
2.83 |
| |
| 7.33
7.63 |
| |
| 5.65
5.65 |
| |
| 1.90
1.90 |
|
| Class C Shares | | Maximum 1% CDSC
if Redeemed Within One Year of Purchase | | With sales charges Excluding sales charges | |
| 1.82
2.77 |
| |
| 7.62
7.62 |
| |
| 5.65
5.65 |
| |
| 1.90
1.90 |
|
| Class I Shares4 | | No Sales Charge | | | | | 3.96 | | | | 8.91 | | | | 6.88 | | | | 0.74 | |
| 1. | The performance table and graph do not reflect the deduction of taxes that a shareholder would pay on distributions or Fund share redemptions. Total returns reflect maximum applicable sales charges as indicated in the table above, if any, changes in share price, and reinvestment of dividend and capital gain distributions. The graph assumes the initial investment amount shown above and reflects the deduction of all sales charges that would have applied for the period of investment. Performance figures may reflect certain fee waivers and/or expense limitations, without which total returns may have been lower. For more information on share classes and current fee waivers and/or expense limitations (if any), please refer to the notes to the financial statements. |
| 2. | The gross expense ratios presented reflect the Fund’s “Total Annual Fund Operating Expenses” from the most recent Prospectus and may differ from other expense ratios disclosed in this report. |
| 3. | Performance figures for Investor Class shares, first offered on February 28, 2008, include the historical performance of Class A shares through February 27, 2008, adjusted for differences in certain fees and expenses. Unadjusted, the performance shown for the Investor Class shares would likely have been different. |
| 4. | Performance figures for Class I shares, first offered on November 28, 2008, include the historical performance of Class B shares through November 27, 2008, adjusted for differences in certain fees and expenses. Unadjusted, the performance shown for the Class I shares would likely have been different. |
The footnotes on the next page are an integral part of the table and graph and should be carefully read in conjunction with them.
| | | | | | | | | | | | |
| Benchmark Performance | | One
Year | | | Five
Years | | | Ten
Years | |
BofA Merrill Lynch All U.S. Convertibles Index5 | | | 3.49 | % | | | 9.67 | % | | | 6.30 | % |
Average Lipper Convertible Securities Fund6 | | | 2.08 | | | | 6.99 | | | | 4.69 | |
| 5. | The BofA Merrill Lynch All U.S. Convertibles Index is the Fund’s primary broad-based securities market index for comparison purposes. The BofA Merrill Lynch All U.S. Convertibles Index is a market-capitalization weighted index of domestic corporate convertible securities. In order to be included in this Index, bonds and preferred stocks must be convertible only to common stock. Results assume reinvestment of all income and capital gains. An investment cannot be made directly in an index. |
| 6. | The Average Lipper Convertible Securities Fund is representative of funds that invest primarily in convertible bonds and/or convertible preferred stock. This benchmark is a product of Lipper Inc. Lipper Inc. is an independent monitor of fund performance. Results are based on average total returns of similar funds with all dividend and capital gain distributions reinvested. |
The footnotes on the preceding page are an integral part of the table and graph and should be carefully read in conjunction with them.
| | |
| 6 | | MainStay Convertible Fund |
Cost in Dollars of a $1,000 Investment in MainStay Convertible Fund (Unaudited)
The example below is intended to describe the fees and expenses borne by shareholders during the six-month period from May 1, 2016, to October 31, 2016, and the impact of those costs on your investment.
Example
As a shareholder of the Fund, you incur two types of costs: (1) transaction costs, including exchange fees and sales charges (loads) on purchases (as applicable), and (2) ongoing costs, including management fees, distribution and/or service (12b-1) fees, and other Fund expenses (as applicable). This example is intended to help you understand your ongoing costs (in dollars) of investing in the Fund and to compare these costs with the ongoing costs of investing in other mutual funds. The example is based on an investment of $1,000 made at the beginning of the six-month period and held for the entire period from May 1, 2016, to October 31, 2016.
This example illustrates your Fund’s ongoing costs in two ways:
Actual Expenses
The second and third data columns in the table below provide information about actual account values and actual expenses. You may use the information in these columns, together with the amount you invested, to estimate the expenses that you paid during the six months ended October 31, 2016. Simply divide your account value by $1,000 (for example, an $8,600 account value divided by $1,000 = 8.6), then
multiply the result by the number under the heading entitled “Expenses Paid During Period” to estimate the expenses you paid on your account during this period.
Hypothetical Example for Comparison Purposes
The fourth and fifth data columns in the table below provide information about hypothetical account values and hypothetical expenses based on the Fund’s actual expense ratio and an assumed rate of return of 5% per year before expenses, which is not the Fund’s actual return. The hypothetical account values and expenses may not be used to estimate the actual ending account balances or expenses you paid for the six-month period shown. You may use this information to compare the ongoing costs of investing in the Fund with the ongoing costs of investing in other Funds. To do so, compare this 5% hypothetical example with the 5% hypothetical examples that appear in the shareholder reports of the other Funds.
Please note that the expenses shown in the table are meant to highlight your ongoing costs only and do not reflect any transactional costs, such as exchange fees or sales charges (loads). Therefore, the fourth and fifth data columns of the table are useful in comparing ongoing costs only and will not help you determine the relative total costs of owning different funds. In addition, if these transactional costs were included, your costs would have been higher.
| | | | | | | | | | | | | | | | | | | | |
| | | | | | | | | | | | | | | | |
| Share Class | | Beginning
Account
Value
5/1/16 | | | Ending Account
Value (Based
on Actual
Returns and
Expenses)
10/31/16 | | | Expenses
Paid
During
Period1 | | | Ending Account
Value (Based
on Hypothetical
5% Annualized
Return and
Actual Expenses)
10/31/16 | | | Expenses
Paid
During
Period1 | |
| | | | | |
| Class A Shares | | $ | 1,000.00 | | | $ | 1,038.20 | | | $ | 5.17 | | | $ | 1,020.10 | | | $ | 5.13 | |
| | | | | |
| Investor Class Shares | | $ | 1,000.00 | | | $ | 1,037.40 | | | $ | 5.99 | | | $ | 1,019.30 | | | $ | 5.94 | |
| | | | | |
| Class B Shares | | $ | 1,000.00 | | | $ | 1,033.60 | | | $ | 9.81 | | | $ | 1,015.50 | | | $ | 9.73 | |
| | | | | |
| Class C Shares | | $ | 1,000.00 | | | $ | 1,033.60 | | | $ | 9.81 | | | $ | 1,015.50 | | | $ | 9.73 | |
| | | | | |
| Class I Shares | | $ | 1,000.00 | | | $ | 1,039.50 | | | $ | 3.90 | | | $ | 1,021.30 | | | $ | 3.86 | |
| 1. | Expenses are equal to the Fund’s annualized expense ratio of each class (1.01% for Class A, 1.17% for Investor Class, 1.92% for Class B and Class C and 0.76% for Class I) multiplied by the average account value over the period, divided by 366 and multiplied by 184 (to reflect the six-month period). The table above represents the actual expenses incurred during the six-month period. |
Portfolio Composition as of October 31, 2016 (Unaudited)
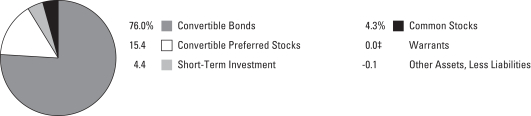
See Portfolio of Investments beginning on page 11 for specific holdings within these categories.
| ‡ | Less than one-tenth of a percent. |
Top Ten Holdings or Issuers Held as of October 31, 2016 (excluding short-term investment) (Unaudited)
| 1. | Priceline Group, Inc. (The), 0.35%–1.00%, due 3/15/18–6/15/20 |
| 2. | Danaher Corp. (zero coupon), due 1/22/21 |
| 3. | Macquarie Infrastructure Corp., 2.875%, due 7/15/19 |
| 4. | Xilinx, Inc., 2.625%, due 6/15/17 |
| 5. | Microchip Technology, Inc., 1.625%, due 2/15/25 |
| 6. | Teleflex, Inc., 3.875%, due 8/1/17 |
| 7. | JPMorgan Chase & Co. (Convertible into Schlumberger, Ltd.) (zero coupon), due 5/3/17 |
| 8. | Air Lease Corp., 3.875%, due 12/1/18 |
| 9. | ON Semiconductor Corp., 1.00%–2.625%, due 12/1/20–12/15/26 |
| 10. | Medidata Solutions, Inc., 1.00%, due 8/1/18 |
| | |
| 8 | | MainStay Convertible Fund |
Portfolio Management Discussion and Analysis (Unaudited)
Questions answered by portfolio manager Edward Silverstein, CFA, of MacKay Shields LLC, the Fund’s Subadvisor.
How did MainStay Convertible Fund perform relative to its primary benchmark and peers during the 12 months ended October 31, 2016?
Excluding all sales charges, MainStay Convertible Fund returned 3.71% for Class A shares, 3.60% for Investor Class shares, 2.83% for Class B shares and 2.77% for Class C shares for the 12 months ended October 31, 2016. Over the same period, Class I shares returned 3.96%. During the reporting period, Class A, Investor Class and Class I shares outperformed—and Class B and Class C shares underperformed—the 3.49% return of the BofA Merrill Lynch All U.S. Convertibles Index,1 which is the Fund’s broad-based securities-market index. During the 12 months ended October 31, 2016, all share classes outperformed the 2.08% return of the Average Lipper2 Convertible Securities Fund. See page 5 for Fund returns with applicable sales charges.
What factors affected the Fund’s relative performance during the reporting period?
The Fund’s relative performance benefited largely from a portfolio composition that differed significantly from that of the BofA Merrill Lynch All U.S. Convertibles Index and most of the Fund’s peers. The Fund’s most significant gainers—such as crude oil producer Hess, health care products company Danaher and transportation company XPO Logistics—did not have large weightings in the Index, which helped the Fund’s relative performance. The Fund’s worst performers during the reporting period, however—such as biotechnology company BioMarin Pharmaceutical, drug companies Teva Pharmaceutical Industries and Allergan, and semiconductor company Micron Technology—are large issues with significant weightings in the BofA Merrill Lynch All U.S. Convertibles Index. The Fund held underweight positions in these poor performers during the reporting period, which contributed positively to the Fund’s performance relative to the Index.
What was the Fund’s duration3 strategy during the reporting period?
The Fund’s duration is relatively short, as most bonds in the Fund have either maturities of less than 10 years or put and call features that will likely result in the bonds being put by holders or called by the issuers well before the stated maturity date. Convertible bond prices tend to vary with changes in the price of the underlying equity security rather than with changes in interest rates. For this reason, duration does not guide our investment decisions regarding the Fund’s convertible security holdings. At the end of the reporting period, the effective duration of the Fund was 3.3 years.
During the reporting period, which sectors were the strongest contributors to the Fund’s absolute performance and which sectors were particularly weak?
The strongest contributions to absolute performance came from the energy and consumer staples sectors. (Contributions take weightings and total returns into account.) The Fund experienced large gains in several energy-related holdings. Convertible preferred shares of Hess were the Fund’s fourth-best performer in terms of dollars earned. While the price of crude oil was virtually unchanged at the end of the reporting period, large price swings during the reporting period likely stimulated investor hopes that crude oil would exceed its year-long trading range. Hess reported a large oil discovery in the waters off Guyana. The Fund also experienced large gains from oil & gas services company Helix Energy Solutions Group and oil & gas company Southwestern Energy. Helix Energy’s bonds rose as investors concluded that the company was very unlikely to face financial distress, and its convertible bonds rose sharply. Convertible bonds of oil & gas company Whiting Petroleum increased during the reporting period as oil prices recovered from their lows, and the bonds rose further when the company refinanced its existing convertible bonds with new ones that had more attractive terms for investors. Convertible securities of several consumer staples companies also provided strong gains during the reporting period. Convertible bonds of household products company Jarden and convertible preferred shares of food companies Post Holdings and Tyson Foods were among the Fund’s best performers. The common shares and convertible bonds of Jarden rose after the company agreed to be acquired by household products company Newell-Rubbermaid to form Newell Brands. Convertible preferred shares of Post Holdings and Tyson Foods rose during the reporting period after each company reported several consecutive quarters of better-than-expected sales and earnings.
The biggest detractors from the Fund’s absolute performance came from the health care and automotive sectors. Convertible bonds of several health care–related companies were poor performers during the reporting period, as investors shunned the sector in the wake of concerns surrounding Canadian pharmaceutical company Valeant Pharmaceuticals International. There were also general concerns related to the valuation of biotechnology companies after the sector had been a top performer for several years. Convertible bonds of BioMarin Pharmaceutical and Teva Pharmaceutical Industries and convertible preferred shares of Allergan were weak performers during the reporting period. In addition to general sector weakness, BioMarin declined after the U.S. Food and Drug
| 1. | See footnote on page 6 for more information on the BofA Merrill Lynch All U.S. Convertibles Index. |
| 2. | See footnote on page 6 for more information on Lipper Inc. |
| 3. | Duration is a measure of the price sensitivity of a fixed-income investment to changes in interest rates. Duration is expressed as a number of years and is considered a more accurate sensitivity gauge than average maturity. |
Administration (FDA) rejected the company’s drug candidate for muscular dystrophy. Allergan declined after the U.S. Treasury added new rules that forced the company to abandon its planned merger with Pfizer. In the automotive sector, convertible bonds of Fiat Chrysler Automobiles and common shares of General Motors and Ferrari, which the Fund received as part of a Ferrari spin-off, were poor performers. Auto sales in the U.S. were generally strong during the reporting period, and the decline in automotive securities may have resulted from concerns that sales would eventually taper off.
Did the Fund make any significant purchases or sales during the reporting period?
During the reporting period, noteworthy purchases included convertible preferred shares of oil & gas company Hess and convertible bonds of oil & gas company Oasis Petroleum, energy equipment & service company Weatherford International, software developer ServiceNow, medical website portal WebMD and convertible bonds of communications company DISH Network.
Several positions in the Fund matured and were sold during the reporting period, including a portion of convertible preferred shares of Stanley Black & Decker and convertible bonds of Gilead Sciences. We also sold several Fund positions because of disappointing results or deteriorating fundamentals. These sales included convertible bonds of drug company Horizon
Pharmaceutical and commercial services company Live Nation. The Fund also lost its convertible bonds of Jarden after the company was acquired by Newell-Rubbermaid to form Newell Brands.
How did the Fund’s sector weightings change during the reporting period?
During the reporting period, the Fund decreased its weightings in the consumer discretionary, financial, information technology and telecommunication sectors. Over the same period, the Fund increased its weighting in the energy, industrials, consumer staples and health care sectors. The Fund’s weightings in the utilities and materials sectors were relatively unchanged during the reporting period.
How was the Fund positioned at the end of the reporting period?
As of October 31, 2016, the Fund held overweight positions relative to the BofA Merrill Lynch U.S. All Convertibles Index in the energy, health care and industrials sectors. As of the same date, the Fund held underweight positions relative to the Index in the financials, utilities, information technology, real estate and telecommunications sectors. The Fund held neutrally weighted positions in the consumer discretionary, consumer staples and materials sectors.
The opinions expressed are those of the portfolio manager as of the date of this report and are subject to change. There is no guarantee that any forecasts will come to pass. This material does not constitute investment advice and is not intended as an endorsement of any specific investment.
| | |
| 10 | | MainStay Convertible Fund |
Portfolio of Investments October 31, 2016
| | | | | | | | |
| | | Principal
Amount | | | Value | |
| | | | | | | | |
Convertible Securities 91.4%† Convertible Bonds 76.0% | |
Auto Manufacturers 1.5% | |
Fiat Chrysler Automobiles N.V.
7.875%, due 12/15/16 | | $ | 7,307,800 | | | $ | 5,142,864 | |
Wabash National Corp.
3.375%, due 5/1/18 | | | 5,555,000 | | | | 6,402,138 | |
| | | | | | | | |
| | | | 11,545,002 | |
| | | | | | | | |
Biotechnology 5.6% | |
BioMarin Pharmaceutical, Inc.
0.75%, due 10/15/18 | | | 15,698,000 | | | | 17,640,627 | |
Illumina, Inc.
(zero coupon), due 6/15/19 | | | 4,300,000 | | | | 4,203,250 | |
0.50%, due 6/15/21 | | | 6,977,000 | | | | 7,007,524 | |
Intercept Pharmaceuticals, Inc.
3.25%, due 7/1/23 | | | 6,684,000 | | | | 6,579,563 | |
Ionis Pharmaceuticals, Inc.
1.00%, due 11/15/21 | | | 4,375,000 | | | | 3,592,969 | |
Medicines Co. (The)
1.375%, due 6/1/17 | | | 4,252,000 | | | | 5,543,545 | |
| | | | | | | | |
| | | | 44,567,478 | |
| | | | | | | | |
Commercial Services 3.9% | |
Carriage Services, Inc.
2.75%, due 3/15/21 | | | 6,573,000 | | | | 7,706,843 | |
¨Macquarie Infrastructure Corp.
2.875%, due 7/15/19 | | | 20,595,000 | | | | 23,761,481 | |
| | | | | | | | |
| | | | 31,468,324 | |
| | | | | | | | |
Finance—Leasing Companies 2.5% | |
¨Air Lease Corp.
3.875%, due 12/1/18 | | | 15,781,000 | | | | 19,943,239 | |
| | | | | | | | |
|
Health Care—Products 7.4% | |
¨Danaher Corp.
(zero coupon), due 1/22/21 | | | 8,558,000 | | | | 25,700,743 | |
Hologic, Inc.
2.00%, due 3/1/42 (a) | | | 9,797,000 | | | | 12,527,914 | |
¨Teleflex, Inc.
3.875%, due 8/1/17 | | | 8,849,000 | | | | 20,634,762 | |
| | | | | | | | |
| | | | 58,863,419 | |
| | | | | | | | |
Health Care—Services 3.0% | |
Anthem, Inc.
2.75%, due 10/15/42 | | | 7,160,000 | | | | 12,328,625 | |
Molina Healthcare, Inc.
1.625%, due 8/15/44 | | | 10,151,000 | | | | 11,800,537 | |
| | | | | | | | |
| | | | 24,129,162 | |
| | | | | | | | |
Home Builders 0.8% | |
Lennar Corp.
3.25%, due 11/15/21 | | | 3,785,000 | | | | 6,718,375 | |
| | | | | | | | |
| | | | | | | | |
| | | Principal
Amount | | | Value | |
| | | | | | | | |
Insurance 1.2% | |
MGIC Investment Corp.
2.00%, due 4/1/20 | | $ | 2,918,000 | | | $ | 3,742,335 | |
Radian Group, Inc.
2.25%, due 3/1/19 | | | 4,321,000 | | | | 5,606,498 | |
| | | | | | | | |
| | | | 9,348,833 | |
| | | | | | | | |
Internet 6.6% | |
¨Priceline Group, Inc. (The) | |
0.35%, due 6/15/20 | | | 7,782,000 | | | | 10,009,598 | |
1.00%, due 3/15/18 | | | 12,338,000 | | | | 19,617,420 | |
Proofpoint, Inc. | |
0.75%, due 6/15/20 | | | 2,051,000 | | | | 2,468,891 | |
1.25%, due 12/15/18 | | | 1,889,000 | | | | 3,822,864 | |
Twitter, Inc.
0.25%, due 9/15/19 | | | 9,161,000 | | | | 8,611,340 | |
WebMD Health Corp. | |
1.50%, due 12/1/20 | | | 3,489,000 | | | | 4,005,808 | |
2.625%, due 6/15/23 (b) | | | 4,482,000 | | | | 4,347,540 | |
| | | | | | | | |
| | | | 52,883,461 | |
| | | | | | | | |
Machinery—Diversified 1.4% | |
Chart Industries, Inc.
2.00%, due 8/1/18 | | | 11,153,000 | | | | 10,957,822 | |
| | | | | | | | |
|
Media 2.1% | |
DISH Network Corp.
3.375%, due 8/15/26 (b) | | | 9,078,000 | | | | 10,445,374 | |
Liberty Media Corp.
1.375%, due 10/15/23 | | | 5,925,000 | | | | 6,091,640 | |
| | | | | | | | |
| | | | 16,537,014 | |
| | | | | | | | |
Oil & Gas 0.9% | |
Oasis Petroleum, Inc.
2.625%, due 9/15/23 | | | 6,648,000 | | | | 7,424,985 | |
| | | | | | | | |
|
Oil & Gas Services 5.8% | |
Helix Energy Solutions Group, Inc.
4.25%, due 5/1/22 | | | 13,111,000 | | | | 13,291,276 | |
¨JPMorgan Chase & Co. (Convertible into Schlumberger, Ltd.)
(zero coupon), due 5/3/17 (b)(c) | | | 14,750,000 | | | | 20,157,350 | |
Newpark Resources, Inc.
4.00%, due 10/1/17 | | | 2,523,000 | | | | 2,470,963 | |
SEACOR Holdings, Inc.
2.50%, due 12/15/27 | | | 2,507,000 | | | | 2,475,663 | |
Weatherford International, Ltd.
5.875%, due 7/1/21 | | | 7,974,000 | | | | 8,477,359 | |
| | | | | | | | |
| | | | 46,872,611 | |
| | | | | | | | |
| † | Percentages indicated are based on Fund net assets. |
| ¨ | | Among the Fund’s 10 largest holdings or issuers held, as of October 31, 2016, excluding short-term investment. May be subject to change daily. (Unaudited) |
| | | | | | |
The notes to the financial statements are an integral part of,
and should be read in conjunction with, the financial statements. | | | | | 11 | |
Portfolio of Investments October 31, 2016 (continued)
| | | | | | | | |
| | | Principal
Amount | | | Value | |
| | | | | | | | |
| Convertible Bonds (continued) | |
Pharmaceuticals 2.5% | |
Depomed, Inc.
2.50%, due 9/1/21 | | $ | 9,909,000 | | | $ | 13,172,777 | |
Teva Pharmaceutical Finance Co. LLC
0.25%, due 2/1/26 | | | 5,832,000 | | | | 6,834,375 | |
| | | | | | | | |
| | | | 20,007,152 | |
| | | | | | | | |
Real Estate Investment Trusts 1.5% | |
SL Green Operating Partnership, L.P.
3.00%, due 10/15/17 (b) | | | 9,324,000 | | | | 11,969,685 | |
| | | | | | | | |
|
Semiconductors 16.1% | |
Advanced Micro Devices, Inc.
2.125%, due 9/1/26 | | | 9,082,000 | | | | 10,256,984 | |
Lam Research Corp.
1.25%, due 5/15/18 | | | 6,444,000 | | | | 10,483,582 | |
¨ Microchip Technology, Inc.
1.625%, due 2/15/25 | | | 17,384,000 | | | | 21,664,810 | |
Micron Technology, Inc.
3.00%, due 11/15/43 | | | 7,770,000 | | | | 6,891,019 | |
NVIDIA Corp.
1.00%, due 12/1/18 | | | 4,357,000 | | | | 15,361,148 | |
NXP Semiconductors N.V.
1.00%, due 12/1/19 | | | 15,332,000 | | | | 17,670,130 | |
¨ON Semiconductor Corp. | |
1.00%, due 12/1/20 | | | 9,913,000 | | | | 9,943,978 | |
2.625%, due 12/15/26 | | | 8,111,000 | | | | 9,342,858 | |
Rambus, Inc.
1.125%, due 8/15/18 | | | 4,377,000 | | | | 5,077,320 | |
¨Xilinx, Inc.
2.625%, due 6/15/17 | | | 12,326,000 | | | | 21,755,390 | |
| | | | | | | | |
| | | | 128,447,219 | |
| | | | | | | | |
Software 9.3% | |
Citrix Systems, Inc.
0.50%, due 4/15/19 | | | 5,382,000 | | | | 6,064,841 | |
CSG Systems International, Inc.
4.25%, due 3/15/36 (b) | | | 1,639,000 | | | | 1,739,389 | |
¨Medidata Solutions, Inc.
1.00%, due 8/1/18 | | | 16,200,000 | | | | 17,860,500 | |
Red Hat, Inc.
0.25%, due 10/1/19 | | | 9,666,000 | | | | 12,016,046 | |
Salesforce.com, Inc.
0.25%, due 4/1/18 | | | 9,409,000 | | | | 11,602,473 | |
ServiceNow, Inc.
(zero coupon), due 11/1/18 | | | 6,825,000 | | | | 8,936,485 | |
Verint Systems, Inc.
1.50%, due 6/1/21 | | | 17,084,000 | | | | 16,187,090 | |
| | | | | | | | |
| | | | 74,406,824 | |
| | | | | | | | |
| | | | | | | | |
| | | Principal
Amount | | | Value | |
| | | | | | | | |
Transportation 3.9% | |
Atlas Air Worldwide Holdings, Inc.
2.25%, due 6/1/22 | | $ | 5,819,000 | | | $ | 5,648,067 | |
Echo Global Logistics, Inc.
2.50%, due 5/1/20 | | | 8,755,000 | | | | 8,043,656 | |
XPO Logistics, Inc.
4.50%, due 10/1/17 | | | 8,452,000 | | | | 17,110,018 | |
| | | | | | | | |
| | | | 30,801,741 | |
| | | | | | | | |
Total Convertible Bonds
(Cost $550,396,298) | | | | 606,892,346 | |
| | | | | | | | |
| | |
| | | | | | | | |
| | |
| | | Shares | | | | |
| Convertible Preferred Stocks 15.4% | |
Chemicals 1.4% | |
A. Schulman, Inc.
6.00% | | | 14,423 | | | | 11,302,151 | |
| | | | | | | | |
|
Food 2.6% | |
Post Holdings, Inc.
3.75% | | | 60,463 | | | | 10,051,974 | |
Tyson Foods, Inc.
4.75% | | | 133,648 | | | | 10,300,251 | |
| | | | | | | | |
| | | | | | | 20,352,225 | |
| | | | | | | | |
Hand & Machine Tools 1.1% | |
Stanley Black & Decker, Inc.
6.25% | | | 75,479 | | | | 8,837,081 | |
| | | | | | | | |
|
Mining 0.3% | |
Alcoa, Inc.
5.375% | | | 88,185 | | | | 2,724,917 | |
| | | | | | | | |
|
Oil & Gas 2.5% | |
Hess Corp.
8.00% | | | 243,681 | | | | 14,413,731 | |
Sanchez Energy Corp.
Series A
4.875% | | | 35,932 | | | | 935,623 | |
Southwestern Energy Co.
Series B
6.25% | | | 184,819 | | | | 4,633,412 | |
| | | | | | | | |
| | | | | | | 19,982,766 | |
| | | | | | | | |
Pharmaceuticals 3.2% | |
Allergan PLC
Series A
5.50% | | | 16,171 | | | | 12,435,499 | |
Teva Pharmaceutical Industries, Ltd.
7.00% | | | 17,557 | | | | 13,308,206 | |
| | | | | | | | |
| | | | | | | 25,743,705 | |
| | | | | | | | |
| | | | |
| 12 | | MainStay Convertible Fund | | The notes to the financial statements are an integral part of,
and should be read in conjunction with, the financial statements. |
| | | | | | | | |
| | |
| | | Shares | | | Value | |
| | | | | | | | |
| Convertible Preferred Stocks (continued) | |
Real Estate Investment Trusts 3.4% | |
American Tower Corp.
Series A
5.25% | | | 109,017 | | | $ | 12,192,461 | |
Crown Castle International Corp.
Series A
4.50% | | | 109,784 | | | | 11,829,226 | |
Welltower, Inc.
Series I
6.50% | | | 47,800 | | | | 2,953,562 | |
| | | | | | | | |
| | | | | | | 26,975,249 | |
| | | | | | | | |
Telecommunications 0.9% | |
T-Mobile U.S., Inc.
5.50% | | | 85,219 | | | | 7,043,351 | |
| | | | | | | | |
Total Convertible Preferred Stocks
(Cost $125,894,562) | | | | | | | 122,961,445 | |
| | | | | | | | |
Total Convertible Securities
(Cost $676,290,860) | | | | | | | 729,853,791 | |
| | | | | | | | |
|
| Common Stocks 4.3% | |
Aerospace & Defense 0.7% | |
United Technologies Corp. | | | 53,105 | | | | 5,427,331 | |
| | | | | | | | |
|
Airlines 1.3% | |
Delta Air Lines, Inc. | | | 252,338 | | | | 10,540,158 | |
| | | | | | | | |
|
Auto Manufacturers 0.5% | |
General Motors Co. | | | 108,269 | | | | 3,421,300 | |
| | | | | | | | |
|
Banks 0.8% | |
Bank of America Corp. | | | 398,621 | | | | 6,577,246 | |
| | | | | | | | |
|
Oil & Gas 0.0%‡ | |
Sanchez Energy Corp. (d) | | | 5,307 | | | | 33,806 | |
| | | | | | | | |
|
Oil & Gas Services 1.0% | |
Baker Hughes, Inc. | | | 51,357 | | | | 2,845,178 | |
Halliburton Co. | | | 113,326 | | | | 5,212,996 | |
| | | | | | | | |
| | | | | | | 8,058,174 | |
| | | | | | | | |
Total Common Stocks
(Cost $34,521,110) | | | | 34,058,015 | |
| | | | | | | | |
| | | | | | | | |
| | | Number of
Warrants | | | Value | |
| | | | | | | | |
| Warrants 0.0%‡ | |
Auto Manufacturers 0.0%‡ | |
General Motors Co.
Strike Price $18.33
Expires 7/10/19 (d) | | | 1,016 | | | $ | 13,919 | |
| | | | | | | | |
Total Warrants
(Cost $436) | | | | | | | 13,919 | |
| | | | | | | | |
| | |
| | | | | | | | |
| | | Principal
Amount | | | | |
| Short-Term Investment 4.4% | |
Repurchase Agreement 4.4% | |
Fixed Income Clearing Corp.
0.03%, dated 10/31/16
due 11/1/16
Proceeds at Maturity $35,387,891 (Collateralized by a United States Treasury Note with a rate of 1.00% and a maturity date of 9/15/18, with a Principal Amount of $35,965,000 and a Market Value of $36,099,869) | | $ | 35,387,862 | | | | 35,387,862 | |
| | | | | | | | |
Total Short-Term Investment
(Cost $35,387,862) | | | | | | | 35,387,862 | |
| | | | | | | | |
Total Investments
(Cost $746,200,268) (e) | | | 100.1 | % | | | 799,313,587 | |
Other Assets, Less Liabilities | | | (0.1 | ) | | | (510,364 | ) |
Net Assets | | | 100.0 | % | | $ | 798,803,223 | |
| ‡ | Less than one-tenth of a percent. |
| (a) | Step coupon—Rate shown was the rate in effect as of October 31, 2016. |
| (b) | May be sold to institutional investors only under Rule 144A or securities offered pursuant to Section 4(a)(2) of the Securities Act of 1933, as amended. |
| (c) | Synthetic Convertible Bond—Security structured by an investment bank that provides exposure to a specific company’s stock. As of October 31, 2016, the total market value of this security was $20,157,350, which represented 2.5% of the Fund’s net assets. |
| (d) | Non-income producing security. |
| (e) | As of October 31, 2016, cost was $758,185,351 for federal income tax purposes and net unrealized appreciation was as follows: |
| | | | |
Gross unrealized appreciation | | $ | 92,302,926 | |
Gross unrealized depreciation | | | (51,174,690 | ) |
| | | | |
Net unrealized appreciation | | $ | 41,128,236 | |
| | | | |
| | | | | | |
The notes to the financial statements are an integral part of,
and should be read in conjunction with, the financial statements. | | | | | 13 | |
Portfolio of Investments October 31, 2016 (continued)
The following is a summary of the fair valuations according to the inputs used as of October 31, 2016, for valuing the Fund’s assets.
Asset Valuation Inputs
| | | | | | | | | | | | | | | | |
Description | | Quoted
Prices in
Active
Markets for
Identical
Assets (Level 1) | | | Significant
Other
Observable
Inputs (Level 2) | | | Significant
Unobservable
Inputs (Level 3) | | | Total | |
| Investments in Securities (a) | | | | | | | | | | | | | | | | |
| Convertible Securities | | | | | | | | | | | | | | | | |
Convertible Bonds | | $ | — | | | $ | 606,892,346 | | | $ | — | | | $ | 606,892,346 | |
Convertible Preferred Stocks (b) | | | 100,671,697 | | | | 22,289,748 | | | | — | | | | 122,961,445 | |
| | | | | | | | | | | | | | | | |
| Total Convertible Securities | | | 100,671,697 | | | | 629,182,094 | | | | — | | | | 729,853,791 | |
| | | | | | | | | | | | | | | | |
| Common Stocks | | | 34,058,015 | | | | — | | | | — | | | | 34,058,015 | |
| Warrants | | | 13,919 | | | | — | | | | — | | | | 13,919 | |
| Short-Term Investment | | | | | | | | | | | | | | | | |
Repurchase Agreement | | | — | | | | 35,387,862 | | | | — | | | | 35,387,862 | |
| | | | | | | | | | | | | | | | |
| Total Investments in Securities | | $ | 134,743,631 | | | $ | 664,569,956 | | | $ | — | | | $ | 799,313,587 | |
| | | | | | | | | | | | | | | | |
| (a) | For a complete listing of investments and their industries, see the Portfolio of Investments. |
| (b) | The level 2 securities valued at $11,302,151, $10,051,974 and $935,623 are held in Chemicals, Food, and Oil & Gas, respectively, in the Convertible Preferred Stocks section of the Portfolio of Investments. |
The Fund recognizes transfers between the levels as of the beginning of the year.
For the year ended October 31, 2016, the Fund did not have any transfers between Level 1 and Level 2 fair value measurements. (See Note 2)
As of October 31, 2016, the Fund did not hold any investments with significant unobservable inputs (Level 3). (See Note 2)
| | | | |
| 14 | | MainStay Convertible Fund | | The notes to the financial statements are an integral part of,
and should be read in conjunction with, the financial statements. |
Statement of Assets and Liabilities as of October 31, 2016
| | | | |
| Assets | |
Investment in securities, at value (identified cost $746,200,268) | | $ | 799,313,587 | |
Cash | | | 40,864 | |
Receivables: | | | | |
Investment securities sold | | | 11,879,127 | |
Dividends and interest | | | 3,109,596 | |
Fund shares sold | | | 479,070 | |
Other assets | | | 32,512 | |
| | | | |
Total assets | | | 814,854,756 | |
| | | | |
| |
| Liabilities | | | | |
Payables: | | | | |
Investment securities purchased | | | 14,504,624 | |
Fund shares redeemed | | | 671,240 | |
Manager (See Note 3) | | | 409,400 | |
Transfer agent (See Note 3) | | | 214,784 | |
NYLIFE Distributors (See Note 3) | | | 182,005 | |
Shareholder communication | | | 33,737 | |
Professional fees | | | 19,228 | |
Custodian | | | 6,528 | |
Trustees | | | 2,304 | |
Accrued expenses | | | 7,683 | |
| | | | |
Total liabilities | | | 16,051,533 | |
| | | | |
Net assets | | $ | 798,803,223 | |
| | | | |
| |
| Composition of Net Assets | | | | |
Shares of beneficial interest outstanding (par value of $.01 per share) unlimited number of shares authorized | | $ | 508,097 | |
Additional paid-in capital | | | 740,073,164 | |
| | | | |
| | | 740,581,261 | |
Distributions in excess of net investment income | | | (8,358,126 | ) |
Accumulated net realized gain (loss) on investments | | | 13,466,769 | |
Net unrealized appreciation (depreciation) on investments | | | 53,113,319 | |
| | | | |
Net assets | | $ | 798,803,223 | |
| | | | |
| | | | |
Class A | | | | |
Net assets applicable to outstanding shares | | $ | 368,583,252 | |
| | | | |
Shares of beneficial interest outstanding | | | 23,441,194 | |
| | | | |
Net asset value per share outstanding | | $ | 15.72 | |
Maximum sales charge (5.50% of offering price) | | | 0.91 | |
| | | | |
Maximum offering price per share outstanding | | $ | 16.63 | |
| | | | |
Investor Class | | | | |
Net assets applicable to outstanding shares | | $ | 79,430,487 | |
| | | | |
Shares of beneficial interest outstanding | | | 5,053,808 | |
| | | | |
Net asset value per share outstanding | | $ | 15.72 | |
Maximum sales charge (5.50% of offering price) | | | 0.91 | |
| | | | |
Maximum offering price per share outstanding | | $ | 16.63 | |
| | | | |
Class B | | | | |
Net assets applicable to outstanding shares | | $ | 21,435,784 | |
| | | | |
Shares of beneficial interest outstanding | | | 1,368,991 | |
| | | | |
Net asset value and offering price per share outstanding | | $ | 15.66 | |
| | | | |
Class C | | | | |
Net assets applicable to outstanding shares | | $ | 76,501,365 | |
| | | | |
Shares of beneficial interest outstanding | | | 4,891,549 | |
| | | | |
Net asset value and offering price per share outstanding | | $ | 15.64 | |
| | | | |
Class I | | | | |
Net assets applicable to outstanding shares | | $ | 252,852,335 | |
| | | | |
Shares of beneficial interest outstanding | | | 16,054,162 | |
| | | | |
Net asset value and offering price per share outstanding | | $ | 15.75 | |
| | | | |
| | | | | | |
The notes to the financial statements are an integral part of,
and should be read in conjunction with, the financial statements. | | | | | 15 | |
Statement of Operations for the year ended October 31, 2016
| | | | |
| Investment Income (Loss) | |
Income | | | | |
Interest | | $ | 11,471,632 | |
Dividends (a) | | | 7,295,595 | |
| | | | |
Total income | | | 18,767,227 | |
| | | | |
Expenses | | | | |
Manager (See Note 3) | | | 4,811,501 | |
Distribution/Service—Class A (See Note 3) | | | 938,343 | |
Distribution/Service—Investor Class (See Note 3) | | | 199,245 | |
Distribution/Service—Class B (See Note 3) | | | 233,505 | |
Distribution/Service—Class C (See Note 3) | | | 828,194 | |
Transfer agent (See Note 3) | | | 1,293,867 | |
Professional fees | | | 110,677 | |
Registration | | | 100,845 | |
Shareholder communication | | | 92,089 | |
Trustees | | | 21,210 | |
Custodian | | | 12,253 | |
Miscellaneous | | | 32,422 | |
| | | | |
Total expenses | | | 8,674,151 | |
Reimbursement from custodian (b) | | | (22,661 | ) |
| | | | |
Net expenses | | | 8,651,490 | |
| | | | |
Net investment income (loss) | | | 10,115,737 | |
| | | | |
|
| Realized and Unrealized Gain (Loss) on Investments | |
Net realized gain (loss) on investments | | | 15,873,363 | |
Net change in unrealized appreciation (depreciation) on investments | | | (1,095,460 | ) |
| | | | |
Net realized and unrealized gain (loss) on investments | | | 14,777,903 | |
| | | | |
Net increase (decrease) in net assets resulting from operations | | $ | 24,893,640 | |
| | | | |
| (a) | Dividends recorded net of foreign withholding taxes in the amount of $133,058. |
| (b) | Reimbursement from custodian represents a refund for overbilling of prior years’ custody out-of-pocket fees. |
| | | | |
| 16 | | MainStay Convertible Fund | | The notes to the financial statements are an integral part of,
and should be read in conjunction with, the financial statements. |
Statements of Changes in Net Assets
for the years ended October 31, 2016 and October 31, 2015
| | | | | | | | |
| | | 2016 | | | 2015 | |
| Increase (Decrease) in Net Assets | |
Operations: | | | | | | | | |
Net investment income (loss) | | $ | 10,115,737 | | | $ | 5,177,856 | |
Net realized gain (loss) on investments | | | 15,873,363 | | | | 69,105,724 | |
Net change in unrealized appreciation (depreciation) on investments | | | (1,095,460 | ) | | | (73,782,641 | ) |
| | | | |
Net increase (decrease) in net assets resulting from operations | | | 24,893,640 | | | | 500,939 | |
| | | | |
Dividends and distributions to shareholders: | | | | | | | | |
From net investment income: | | | | | | | | |
Class A | | | (15,680,249 | ) | | | (9,959,809 | ) |
Investor Class | | | (3,095,349 | ) | | | (2,048,298 | ) |
Class B | | | (783,197 | ) | | | (568,359 | ) |
Class C | | | (2,765,653 | ) | | | (1,754,966 | ) |
Class I | | | (11,214,166 | ) | | | (8,710,964 | ) |
| | | | |
| | | (33,538,614 | ) | | | (23,042,396 | ) |
| | | | |
From net realized gain on investments: | | | | | | | | |
Class A | | | (17,162,761 | ) | | | (30,640,139 | ) |
Investor Class | | | (3,477,638 | ) | | | (6,815,824 | ) |
Class B | | | (1,106,480 | ) | | | (2,397,415 | ) |
Class C | | | (3,897,027 | ) | | | (7,371,727 | ) |
Class I | | | (11,748,242 | ) | | | (24,752,815 | ) |
| | | | |
| | | (37,392,148 | ) | | | (71,977,920 | ) |
| | | | |
Total dividends and distributions to shareholders | | | (70,930,762 | ) | | | (95,020,316 | ) |
| | | | |
Capital share transactions: | | | | | | | | |
Net proceeds from sale of shares | | | 173,063,368 | | | | 331,439,523 | |
Net asset value of shares issued to shareholders in reinvestment of dividends and distributions | | | 60,533,955 | | | | 77,975,989 | |
Cost of shares redeemed | | | (295,260,583 | ) | | | (315,067,713 | ) |
| | | | |
Increase (decrease) in net assets derived from capital share transactions | | | (61,663,260 | ) | | | 94,347,799 | |
| | | | |
Net increase (decrease) in net assets | | | (107,700,382 | ) | | | (171,578 | ) |
|
| Net Assets | |
Beginning of year | | | 906,503,605 | | | | 906,675,183 | |
| | | | |
End of year | | $ | 798,803,223 | | | $ | 906,503,605 | |
| | | | |
Undistributed (distributions in excess of) net investment income at end of year | | $ | (8,358,126 | ) | | $ | 12,684,538 | |
| | | | |
| | | | | | |
The notes to the financial statements are an integral part of,
and should be read in conjunction with, the financial statements. | | | | | 17 | |
Financial Highlights selected per share data and ratios
| | | | | | | | | | | | | | | | | | | | |
| | | Year ended October 31, | |
| Class A | | 2016 | | | 2015 | | | 2014 | | | 2013 | | | 2012 | |
Net asset value at beginning of year | | $ | 16.51 | | | $ | 18.33 | | | $ | 17.33 | | | $ | 14.79 | | | $ | 15.12 | |
| | | | | | | | | | | | | | | | | | | | |
Net investment income (loss) (a) | | | 0.20 | | | | 0.11 | | | | 0.15 | | | | 0.18 | | | | 0.29 | |
Net realized and unrealized gain (loss) on investments | | | 0.35 | | | | (0.00 | )‡ | | | 1.59 | | | | 3.29 | | | | 0.46 | |
| | | | | | | | | | | | | | | | | | | | |
Total from investment operations | | | 0.55 | | | | 0.11 | | | | 1.74 | | | | 3.47 | | | | 0.75 | |
| | | | | | | | | | | | | | | | | | | | |
| Less dividends and distributions: | | | | | | | | | | | | | | | | | | | | |
From net investment income | | | (0.64 | ) | | | (0.47 | ) | | | (0.51 | ) | | | (0.31 | ) | | | (0.31 | ) |
From net realized gain on investments | | | (0.70 | ) | | | (1.46 | ) | | | (0.23 | ) | | | (0.62 | ) | | | (0.77 | ) |
| | | | | | | | | | | | | | | | | | | | |
Total dividends and distributions | | | (1.34 | ) | | | (1.93 | ) | | | (0.74 | ) | | | (0.93 | ) | | | (1.08 | ) |
| | | | | | | | | | | | | | | | | | | | |
Net asset value at end of year | | $ | 15.72 | | | $ | 16.51 | | | $ | 18.33 | | | $ | 17.33 | | | $ | 14.79 | |
| | | | | | | | | | | | | | | | | | | | |
Total investment return (b) | | | 3.71 | % | | | 0.58 | % | | | 10.42 | % | | | 24.78 | % | | | 5.30 | % |
| Ratios (to average net assets)/Supplemental Data: | | | | | | | | | | | | | | | | | | | | |
Net investment income (loss) | | | 1.31 | % | | | 0.62 | % | | | 0.86 | % | | | 1.13 | % | | | 1.96 | % |
Net expenses | | | 1.01 | % | | | 0.99 | % | | | 0.97 | % | | | 0.99 | % | | | 1.00 | % |
Portfolio turnover rate | | | 24 | % | | | 60 | % | | | 59 | % | | | 77 | % | | | 61 | % |
Net assets at end of year (in 000’s) | | $ | 368,583 | | | $ | 408,067 | | | $ | 384,987 | | | $ | 391,577 | | | $ | 317,267 | |
| ‡ | Less than one cent per share. |
| (a) | Per share data based on average shares outstanding during the year. |
| (b) | Total investment return is calculated exclusive of sales charges and assumes the reinvestment of dividends and distributions. |
| | | | | | | | | | | | | | | | | | | | |
| | | Year ended October 31, | |
| Investor Class | | 2016 | | | 2015 | | | 2014 | | | 2013 | | | 2012 | |
Net asset value at beginning of year | | $ | 16.50 | | | $ | 18.33 | | | $ | 17.32 | | | $ | 14.79 | | | $ | 15.11 | |
| | | | | | | | | | | | | | | | | | | | |
Net investment income (loss) (a) | | | 0.18 | | | | 0.08 | | | | 0.12 | | | | 0.15 | | | | 0.26 | |
Net realized and unrealized gain (loss) on investments | | | 0.36 | | | | (0.01 | ) | | | 1.60 | | | | 3.28 | | | | 0.47 | |
| | | | | | | | | | | | | | | | | | | | |
Total from investment operations | | | 0.54 | | | | 0.07 | | | | 1.72 | | | | 3.43 | | | | 0.73 | |
| | | | | | | | | | | | | | | | | | | | |
| Less dividends and distributions: | | | | | | | | | | | | | | | | | | | | |
From net investment income | | | (0.62 | ) | | | (0.44 | ) | | | (0.48 | ) | | | (0.28 | ) | | | (0.28 | ) |
From net realized gain on investments | | | (0.70 | ) | | | (1.46 | ) | | | (0.23 | ) | | | (0.62 | ) | | | (0.77 | ) |
| | | | | | | | | | | | | | | | | | | | |
Total dividends and distributions | | | (1.32 | ) | | | (1.90 | ) | | | (0.71 | ) | | | (0.90 | ) | | | (1.05 | ) |
| | | | | | | | | | | | | | | | | | | | |
Net asset value at end of year | | $ | 15.72 | | | $ | 16.50 | | | $ | 18.33 | | | $ | 17.32 | | | $ | 14.79 | |
| | | | | | | | | | | | | | | | | | | | |
Total investment return (b) | | | 3.60 | % | | | 0.40 | % | | | 10.21 | % | | | 24.42 | % | | | 5.07 | % |
| Ratios (to average net assets)/Supplemental Data: | | | | | | | | | | | | | | | | | | | | |
Net investment income (loss) | | | 1.14 | % | | | 0.45 | % | | | 0.67 | % | | | 0.93 | % | | | 1.74 | % |
Net expenses | | | 1.18 | % | | | 1.15 | % | | | 1.16 | % | | | 1.22 | % | | | 1.22 | % |
Portfolio turnover rate | | | 24 | % | | | 60 | % | | | 59 | % | | | 77 | % | | | 61 | % |
Net assets at end of year (in 000’s) | | $ | 79,430 | | | $ | 82,052 | | | $ | 85,850 | | | $ | 86,136 | | | $ | 80,378 | |
| (a) | Per share data based on average shares outstanding during the year. |
| (b) | Total investment return is calculated exclusive of sales charges and assumes the reinvestment of dividends and distributions. |
| | | | |
| 18 | | MainStay Convertible Fund | | The notes to the financial statements are an integral part of,
and should be read in conjunction with, the financial statements. |
Financial Highlights selected per share data and ratios
| | | | | | | | | | | | | | | | | | | | |
| | | Year ended October 31, | |
| Class B | | 2016 | | | 2015 | | | 2014 | | | 2013 | | | 2012 | |
Net asset value at beginning of year | | $ | 16.45 | | | $ | 18.30 | | | $ | 17.37 | | | $ | 14.84 | | | $ | 15.15 | |
| | | | | | | | | | | | | | | | | | | | |
Net investment income (loss) (a) | | | 0.06 | | | | (0.05 | ) | | | (0.01 | ) | | | 0.03 | | | | 0.15 | |
Net realized and unrealized gain (loss) on investments | | | 0.35 | | | | 0.01 | | | | 1.59 | | | | 3.29 | | | | 0.47 | |
| | | | | | | | | | | | | | | | | | | | |
Total from investment operations | | | 0.41 | | | | (0.04 | ) | | | 1.58 | | | | 3.32 | | | | 0.62 | |
| | | | | | | | | | | | | | | | | | | | |
| Less dividends and distributions: | | | | | | | | | | | | | | | | | | | | |
From net investment income | | | (0.50 | ) | | | (0.35 | ) | | | (0.42 | ) | | | (0.17 | ) | | | (0.16 | ) |
From net realized gain on investments | | | (0.70 | ) | | | (1.46 | ) | | | (0.23 | ) | | | (0.62 | ) | | | (0.77 | ) |
| | | | | | | | | | | | | | | | | | | | |
Total dividends and distributions | | | (1.20 | ) | | | (1.81 | ) | | | (0.65 | ) | | | (0.79 | ) | | | (0.93 | ) |
| | | | | | | | | | | | | | | | | | | | |
Net asset value at end of year | | $ | 15.66 | | | $ | 16.45 | | | $ | 18.30 | | | $ | 17.37 | | | $ | 14.84 | |
| | | | | | | | | | | | | | | | | | | | |
Total investment return (b) | | | 2.83 | % | | | (0.36 | %) | | | 9.41 | % | | | 23.50 | % | | | 4.31 | % |
| Ratios (to average net assets)/Supplemental Data: | | | | | | | | | | | | | | | | | | | | |
Net investment income (loss) | | | 0.39 | % | | | (0.30 | %) | | | (0.08 | %) | | | 0.19 | % | | | 0.99 | % |
Net expenses | | | 1.93 | % | | | 1.90 | % | | | 1.91 | % | | | 1.97 | % | | | 1.97 | % |
Portfolio turnover rate | | | 24 | % | | | 60 | % | | | 59 | % | | | 77 | % | | | 61 | % |
Net assets at end of year (in 000’s) | | $ | 21,436 | | | $ | 26,537 | | | $ | 29,765 | | | $ | 32,629 | | | $ | 33,103 | |
| (a) | Per share data based on average shares outstanding during the year. |
| (b) | Total investment return is calculated exclusive of sales charges and assumes the reinvestment of dividends and distributions. |
| | | | | | | | | | | | | | | | | | | | |
| | | Year ended October 31, | |
| Class C | | 2016 | | | 2015 | | | 2014 | | | 2013 | | | 2012 | |
Net asset value at beginning of year | | $ | 16.43 | | | $ | 18.29 | | | $ | 17.36 | | | $ | 14.82 | | | $ | 15.14 | |
| | | | | | | | | | | | | | | | | | | | |
Net investment income (loss) (a) | | | 0.06 | | | | (0.05 | ) | | | (0.01 | ) | | | 0.03 | | | | 0.15 | |
Net realized and unrealized gain (loss) on investments | | | 0.35 | | | | (0.00 | )‡ | | | 1.59 | | | | 3.30 | | | | 0.46 | |
| | | | | | | | | | | | | | | | | | | | |
Total from investment operations | | | 0.41 | | | | (0.05 | ) | | | 1.58 | | | | 3.33 | | | | 0.61 | |
| | | | | | | | | | | | | | | | | | | | |
| Less dividends and distributions: | | | | | | | | | | | | | | | | | | | | |
From net investment income | | | (0.50 | ) | | | (0.35 | ) | | | (0.42 | ) | | | (0.17 | ) | | | (0.16 | ) |
From net realized gain on investments | | | (0.70 | ) | | | (1.46 | ) | | | (0.23 | ) | | | (0.62 | ) | | | (0.77 | ) |
| | | | | | | | | | | | | | | | | | | | |
Total dividends and distributions | | | (1.20 | ) | | | (1.81 | ) | | | (0.65 | ) | | | (0.79 | ) | | | (0.93 | ) |
| | | | | | | | | | | | | | | | | | | | |
Net asset value at end of year | | $ | 15.64 | | | $ | 16.43 | | | $ | 18.29 | | | $ | 17.36 | | | $ | 14.82 | |
| | | | | | | | | | | | | | | | | | | | |
Total investment return (b) | | | 2.77 | % | | | (0.30 | %) | | | 9.35 | % | | | 23.60 | % | | | 4.24 | % |
| Ratios (to average net assets)/Supplemental Data: | | | | | | | | | | | | | | | | | | | | |
Net investment income (loss) | | | 0.39 | % | | | (0.30 | %) | | | (0.08 | %) | | | 0.19 | % | | | 0.98 | % |
Net expenses | | | 1.93 | % | | | 1.90 | % | | | 1.91 | % | | | 1.97 | % | | | 1.97 | % |
Portfolio turnover rate | | | 24 | % | | | 60 | % | | | 59 | % | | | 77 | % | | | 61 | % |
Net assets at end of year (in 000’s) | | $ | 76,501 | | | $ | 91,833 | | | $ | 92,118 | | | $ | 78,135 | | | $ | 75,372 | |
| ‡ | Less than one cent per share. |
| (a) | Per share data based on average shares outstanding during the year. |
| (b) | Total investment return is calculated exclusive of sales charges and assumes the reinvestment of dividends and distributions. |
| | | | | | |
The notes to the financial statements are an integral part of,
and should be read in conjunction with, the financial statements. | | | | | 19 | |
Financial Highlights selected per share data and ratios
| | | | | | | | | | | | | | | | | | | | |
| | | Year ended October 31, | |
| Class I | | 2016 | | | 2015 | | | 2014 | | | 2013 | | | 2012 | |
Net asset value at beginning of year | | $ | 16.54 | | | $ | 18.36 | | | $ | 17.35 | | | $ | 14.81 | | | $ | 15.13 | |
| | | | | | | | | | | | | | | | | | | | |
Net investment income (loss) (a) | | | 0.24 | | | | 0.15 | | | | 0.20 | | | | 0.22 | | | | 0.33 | |
Net realized and unrealized gain (loss) on investments | | | 0.35 | | | | (0.00 | )‡ | | | 1.60 | | | | 3.29 | | | | 0.47 | |
| | | | | | | | | | | | | | | | | | | | |
Total from investment operations | | | 0.59 | | | | 0.15 | | | | 1.80 | | | | 3.51 | | | | 0.80 | |
| | | | | | | | | | | | | | | | | | | | |
| Less dividends and distributions: | | | | | | | | | | | | | | | | | | | | |
From net investment income | | | (0.68 | ) | | | (0.51 | ) | | | (0.56 | ) | | | (0.35 | ) | | | (0.35 | ) |
From net realized gain on investments | | | (0.70 | ) | | | (1.46 | ) | | | (0.23 | ) | | | (0.62 | ) | | | (0.77 | ) |
| | | | | | | | | | | | | | | | | | | | |
Total dividends and distributions | | | (1.38 | ) | | | (1.97 | ) | | | (0.79 | ) | | | (0.97 | ) | | | (1.12 | ) |
| | | | | | | | | | | | | | | | | | | | |
Net asset value at end of year | | $ | 15.75 | | | $ | 16.54 | | | $ | 18.36 | | | $ | 17.35 | | | $ | 14.81 | |
| | | | | | | | | | | | | | | | | | | | |
Total investment return (b) | | | 3.96 | % | | | 0.84 | % | | | 10.74 | % | | | 25.05 | % | | | 5.56 | % |
| Ratios (to average net assets)/Supplemental Data: | | | | | | | | | | | | | | | | | | | | |
Net investment income (loss) | | | 1.56 | % | | | 0.87 | % | | | 1.11 | % | | | 1.37 | % | | | 2.21 | % |
Net expenses | | | 0.76 | % | | | 0.74 | % | | | 0.72 | % | | | 0.74 | % | | | 0.75 | % |
Portfolio turnover rate | | | 24 | % | | | 60 | % | | | 59 | % | | | 77 | % | | | 61 | % |
Net assets at end of year (in 000’s) | | $ | 252,852 | | | $ | 298,015 | | | $ | 313,955 | | | $ | 258,279 | | | $ | 180,257 | |
| ‡ | Less than one cent per share. |
| (a) | Per share data based on average shares outstanding during the year. |
| (b) | Total investment return is calculated exclusive of sales charges and assumes the reinvestment of dividends and distributions. Class I shares are not subject to sales charges. |
| | | | |
| 20 | | MainStay Convertible Fund | | The notes to the financial statements are an integral part of,
and should be read in conjunction with, the financial statements. |
Notes to Financial Statements
Note 1–Organization and Business
The MainStay Funds (the “Trust”) was organized on January 9, 1986, as a Massachusetts business trust. The Trust is registered under the Investment Company Act of 1940, as amended (the “1940 Act”), as an open-end management investment company, and is comprised of twelve funds (collectively referred to as the “Funds”). These financial statements and notes relate to the MainStay Convertible Fund (the “Fund”), a “diversified” fund, as that term is defined in the 1940 Act, as interpreted or modified by regulatory authorities having jurisdiction, from time to time.
The Fund currently offers five classes of shares. Class A shares commenced operations on January 3, 1995. Class B shares commenced operations on May 1, 1986. Class C shares commenced operations on September 1, 1998. Investor Class shares commenced operations on February 28, 2008. Class I shares commenced operations on November 28, 2008. Class A and Investor Class shares are offered at net asset value (“NAV”) per share plus an initial sales charge. No initial sales charge applies to investments of $1 million or more (and certain other qualified purchases) in Class A and Investor Class shares, but a contingent deferred sales charge (“CDSC”) of 1.00% may be imposed on certain redemptions of such shares made within one year of the date of purchase on shares that were purchased without an initial sales charge made before January 1, 2017. Effective January 1, 2017, a CDSC of 1.00% may be imposed on certain redemptions of Class A and Investor Class shares made within 24 months of the date of purchase of such shares that were made without an initial sales charge. Class B and Class C shares are offered at NAV without an initial sales charge, although a CDSC that declines depending on the number of years a shareholder has held its Class B shares may be imposed on redemptions made within six years of the date of purchase of such shares and a 1.00% CDSC may be imposed on redemptions made within one year of the date of purchase of Class C shares. Class I shares are offered at NAV and are not subject to a sales charge. Depending upon eligibility, Class B shares convert to either Class A or Investor Class shares at the end of the calendar quarter eight years after the date they were purchased. Additionally, depending upon eligibility, Class A shares may convert to Investor Class shares and Investor Class shares may convert to Class A shares. Under certain circumstances and as may be permitted by the Trust’s multiple class plan under Rule 18f-3 of the 1940 Act, an exchange/conversion may be made from specified share classes of the Fund to one or more other share classes of the Fund as disclosed in the capital share transactions within these notes. The five classes of shares have the same voting (except for issues that relate solely to one class), dividend, liquidation and other rights, and the same terms and conditions, except that Class B and Class C shares are subject to higher distribution and/or service fee rates than Class A and Investor Class shares under a distribution plan pursuant to Rule 12b-1 under the 1940 Act. Class I shares are not subject to a distribution and/or service fee.
The Fund’s investment objective is to seek capital appreciation together with current income.
Note 2–Significant Accounting Policies
The Fund is an investment company and accordingly follows the investment company accounting and reporting guidance of the Financial
Accounting Standards Board (“FASB”) Accounting Standard Codification Topic 946 Financial Services—Investment Companies. The Fund prepares its financial statements in accordance with generally accepted accounting principles (“GAAP”) in the United States of America and follows the significant accounting policies described below.
(A) Securities Valuation. Investments are usually valued as of the close of regular trading on the New York Stock Exchange (the “Exchange”) (usually 4:00 p.m. Eastern time) on each day the Fund is open for business (“valuation date”).
The Board of Trustees (the “Board”) adopted procedures establishing methodologies for the valuation of the Fund’s securities and other assets and delegated the responsibility for valuation determinations under those procedures to the Valuation Committee of the Trust (the “Valuation Committee”). The Board authorized the Valuation Committee to appoint a Valuation Sub-Committee (the “Sub-Committee”) to deal in the first instance with establishing the prices of securities for which market quotations are not readily available or the prices of which are not otherwise readily determinable under these procedures. The Sub-Committee meets (in person, via electronic mail or via teleconference) on an as-needed basis. Subsequently, the Valuation Committee meets to ensure that actions taken by the Sub-Committee were appropriate. The procedures recognize that, subject to the oversight of the Board and unless otherwise noted, the responsibility for the day-to-day valuation of portfolio assets (including fair value measurements for the Fund’s assets and liabilities) rests with New York Life Investment Management LLC (“New York Life Investments” or the “Manager”), aided to whatever extent necessary by the Subadvisor (as defined in Note 3(A)) to the Fund.
To assess the appropriateness of security valuations, the Manager, Subadvisor or the Fund’s third party service provider, who is subject to oversight by the Manager, regularly compares prior day prices, prices on comparable securities, and the sale prices to the prior and current day prices and challenges prices with changes exceeding certain tolerance levels with third party pricing services or broker sources. For those securities valued through either a standardized fair valuation methodology or a fair valuation measurement, the Sub-Committee deals in the first instance with such valuation and the Valuation Committee reviews and affirms, if appropriate, the reasonableness of the valuation based on such methodologies and measurements on a regular basis after considering all relevant information that is reasonably available. Any action taken by the Sub-Committee with respect to the valuation of a portfolio security or other asset is submitted by the Valuation Committee to the Board for its review and ratification, if appropriate, at its next regularly scheduled meeting.
“Fair value” is defined as the price the Fund would reasonably expect to receive upon selling an asset or liability in an orderly transaction to an independent buyer in the principal or most advantageous market for the asset or liability. Fair value measurements are determined within a framework that establishes a three-tier hierarchy which maximizes the use of observable market data and minimizes the use of unobservable inputs to establish a classification of fair value measurements for disclosure purposes. “Inputs” refer broadly to the assumptions that market participants would use in pricing the asset or liability, including assumptions about risk, such as the risk inherent in a particular valuation technique used to measure fair value using a pricing model and/or the risk
Notes to Financial Statements (continued)
inherent in the inputs for the valuation technique. Inputs may be observable or unobservable. Observable inputs reflect the assumptions market participants would use in pricing the asset or liability based on market data obtained from sources independent of the Fund. Unobservable inputs reflect the Fund’s own assumptions about the assumptions market participants would use in pricing the asset or liability based on the information available. The inputs or methodology used for valuing assets or liabilities may not be an indication of the risks associated with investing in those assets or liabilities. The three-tier hierarchy of inputs is summarized below.
| • | | Level 1—quoted prices in active markets for an identical asset or liability |
| • | | Level 2—other significant observable inputs (including quoted prices for a similar asset or liability in active markets, interest rates and yield curves, prepayment speeds, credit risk, etc.) |
| • | | Level 3—significant unobservable inputs (including the Fund’s own assumptions about the assumptions that market participants would use in measuring fair value of an asset or liability) |
The level of an asset or liability within the fair value hierarchy is based on the lowest level of an input, both individually and in the aggregate, that is significant to the fair value measurement. As of October 31, 2016, the aggregate value by input level of the Fund’s assets and liabilities is included at the end of the Fund’s Portfolio of Investments.
The Fund may use third party vendor evaluations, whose prices may be derived from one or more of the following standard inputs, among others:
| | |
• Benchmark yields | | • Reported trades |
• Broker/dealer quotes | | • Issuer spreads |
• Two-sided markets | | • Benchmark securities |
• Bids/offers | | • Reference data (corporate actions or material event notices) |
• Industry and economic events | | • Comparable bonds |
• Monthly payment information | | |
An asset or liability for which market values cannot be measured using the methodologies described above is valued by methods deemed reasonable in good faith by the Valuation Committee, following the procedures established by the Board, to represent fair value. Under these procedures, the Fund generally uses a market-based approach which may use related or comparable assets or liabilities, recent transactions, market multiples, book values, and other relevant information. The Fund may also use an income-based valuation approach in which the anticipated future cash flows of the asset or liability are discounted to calculate fair value. Discounts may also be applied due to the nature and/or duration of any restrictions on the disposition of the asset or liability. Fair value represents a good faith approximation of the value of a security. Fair value determinations involve the consideration of a number of subjective factors, an analysis of applicable facts and circumstances and the exercise of judgment. As a result, it is possible that the fair value for a security determined in good faith in accordance with the Fund’s valuation procedures may differ from valuations for the same security determined by other funds using their own valuation procedures. Although the Fund’s valuation procedures are designed to value a security at the price the Fund may reasonably expect to receive
upon its sale in an orderly transaction, there can be no assurance that any fair value determination thereunder would, in fact, approximate the amount that the Fund would actually realize upon the sale of the security or the price at which the security would trade if a reliable market price were readily available. During the year ended October 31, 2016, there were no material changes to the fair value methodologies.
Equity and non-equity securities which may be valued in this manner include, but are not limited to: (i) a security for which trading has been halted or suspended; (ii) a debt security that has recently gone into default and for which there is not a current market quotation; (iii) a security of an issuer that has entered into a restructuring; (iv) a security that has been de-listed from a national exchange; (v) a security for which the market price is not readily available from a third party pricing source or, if so provided, does not, in the opinion of the Manager or Subadvisor reflect the security’s market value; (vi) a security subject to trading collars for which no or limited trading takes place; and (vii) a security whose principal market has been temporarily closed at a time when, under normal conditions, it would be open. Securities for which market quotations or observable inputs are not readily available are generally categorized as Level 3 in the hierarchy. As of October 31, 2016, there were no securities held by the Fund that were fair valued in such a manner.
Equity securities and shares of Exchange-Traded Funds (“ETFs”) are valued at the last quoted sales prices as of the close of regular trading on the relevant exchange on each valuation date. Securities that are not traded on the valuation date are valued at the mean of the last quoted bid and ask prices. Prices are normally taken from the principal market in which each security trades. Investments in mutual funds, including money market funds, are valued at their respective NAVs as of the close of the Exchange on the valuation date. These securities are generally categorized as Level 1 in the hierarchy.
Debt securities (other than convertible and municipal bonds) are valued at the evaluated bid prices (evaluated mean prices in the case of convertible and municipal bonds) supplied by a pricing agent or brokers selected by the Manager, in consultation with the Subadvisor. Those values reflect broker/dealer supplied prices and electronic data processing techniques, if the evaluated bid or mean prices are deemed by the Manager, in consultation with the Subadvisor, to be representative of market values, at the regular close of trading of the Exchange on each valuation date. Debt securities purchased on a delayed delivery basis are marked to market daily until settlement at the forward settlement date. Debt securities, including corporate bonds, U.S. government & federal agency bonds, municipal bonds, foreign bonds, convertible bonds, asset-backed securities and mortgage-backed securities are generally categorized as Level 2 in the hierarchy.
Temporary cash investments acquired in excess of 60 days to maturity at the time of purchase are valued using the latest bid prices or using valuations based on a matrix system (which considers such factors as security prices, yields, maturities, and ratings), both as furnished by independent pricing services. Other temporary cash investments which mature in 60 days or less at the time of purchase (“Short-Term Investments”) are valued using the amortized cost method of valuation, unless the use of such method would be inappropriate. The amortized cost method involves valuing a security at its cost on the date of purchase and thereafter assuming a constant amortization to maturity of
| | |
| 22 | | MainStay Convertible Fund |
the difference between such cost and the value on maturity date. Amortized cost approximates the current fair value of a security. Securities valued using the amortized cost method are not valued using quoted prices in an active market and are generally categorized as Level 2 in the hierarchy.
The information above is not intended to reflect an exhaustive list of the methodologies that may be used to value portfolio investments. The valuation procedures permit the use of a variety of valuation methodologies in connection with valuing portfolio investments. The methodology used for a specific type of investment may vary based on the market data available or other considerations. The methodologies summarized above may not represent the specific means by which portfolio investments are valued on any particular business day.
A Fund security or other asset may be determined to be illiquid under procedures approved by the Board. Illiquidity of a security might prevent the sale of such security at a time when the Manager or Subadvisor might wish to sell, and these securities could have the effect of decreasing the overall level of the Fund’s liquidity. Further, the lack of an established secondary market may make it more difficult to value illiquid securities, requiring the Fund to rely on judgments that may be somewhat subjective in measuring value, which could vary materially from the amount that the Fund could realize upon disposition. Difficulty in selling illiquid securities may result in a loss or may be costly to the Fund. Under the supervision of the Board, the Manager or Subadvisor determines the liquidity of the Fund’s investments; in doing so, the Manager or Subadvisor may consider various factors, including (i) the frequency of trades and quotations, (ii) the number of dealers and prospective purchasers, (iii) dealer undertakings to make a market, and (iv) the nature of the security and the market in which it trades (e.g., the time needed to dispose of the security, the method of soliciting offers and the mechanics of transfer). Illiquid securities are often valued in accordance with methods deemed by the Board in good faith to be reasonable and appropriate to accurately reflect their fair value. The liquidity of the Fund’s investments, as shown in the Portfolio of Investments, was measured as of October 31, 2016 and can change at any time in response to, among other relevant factors, market conditions or events or developments with respect to an individual issuer or instrument. As of October 31, 2016, the Fund did not hold any securities deemed to be illiquid under procedures approved by the Board.
(B) Income Taxes. The Fund’s policy is to comply with the requirements of the Internal Revenue Code of 1986, as amended (the “Internal Revenue Code”), applicable to regulated investment companies and to distribute all of its taxable income to the shareholders of the Fund within the allowable time limits. Therefore, no federal, state and local income tax provisions are required.
Management evaluates the Fund’s tax positions to determine if the tax positions taken meet the minimum recognition threshold in connection with accounting for uncertainties in income tax positions taken or expected to be taken for the purposes of measuring and recognizing tax liabilities in the financial statements. Recognition of tax benefits of an uncertain tax position is permitted only to the extent the position is “more likely than not” to be sustained assuming examination by taxing authorities. Management has analyzed the Fund’s tax positions taken on federal, state and local income tax returns for all open tax years (for up to three tax years), and has concluded that no provisions for federal,
state and local income tax are required in the Fund’s financial statements. The Fund’s federal, state and local income and federal excise tax returns for tax years for which the applicable statutes of limitations have not expired are subject to examination by the Internal Revenue Service and state and local departments of revenue.
(C) Dividends and Distributions to Shareholders. Dividends and distributions are recorded on the ex-dividend date. The Fund intends to declare and pay dividends from net investment income, if any, at least quarterly and distributions from net realized capital and currency gains, if any, at least annually. Unless the shareholder elects otherwise, all dividends and distributions are reinvested in the same class of shares of the Fund, at NAV. Dividends and distributions to shareholders are determined in accordance with federal income tax regulations and may differ from GAAP.
(D) Security Transactions and Investment Income. The Fund records security transactions on the trade date. Realized gains and losses on security transactions are determined using the identified cost method. Dividend income is recognized on the ex-dividend date; net of any foreign tax withheld at the source, and interest income is accrued as earned using the effective interest rate method. Discounts and premiums on securities purchased, other than Short-Term Investments, for the Fund are accreted and amortized, respectively, on the effective interest rate method over the life of the respective securities. Discounts and premiums on Short-Term Investments are accreted and amortized, respectively, on the straight-line method. The straight-line method approximates the effective interest method for Short-Term investments.
Investment income and realized and unrealized gains and losses on investments of the Fund are allocated to separate classes of shares pro rata based upon their relative net assets on the date the income is earned or realized and unrealized gains and losses are incurred.
The Fund may place a debt security on non-accrual status and reduce related interest income by ceasing current accruals and writing off all or a portion of any interest receivables when the collection of all or a portion of such interest has become doubtful. A debt security is removed from non-accrual status when the issuer resumes interest payments or when collectability of interest is reasonably assured.
(E) Expenses. Expenses of the Trust are allocated to the individual Funds in proportion to the net assets of the respective Funds when the expenses are incurred, except where direct allocations of expenses can be made. Expenses (other than transfer agent expenses and fees incurred under the shareholder services plans and/or the distribution plans further discussed in Note 3(B)) are allocated to separate classes of shares pro rata based upon their relative net assets on the date the expenses are incurred. The expenses borne by the Fund, including those of related parties to the Fund, are shown in the Statement of Operations.
(F) Use of Estimates. In preparing financial statements in conformity with GAAP, management makes estimates and assumptions that affect the reported amounts and disclosures in the financial statements. Actual results could differ from those estimates.
(G) Repurchase Agreements. The Fund may enter into repurchase agreements to earn income. The Fund may enter into
Notes to Financial Statements (continued)
repurchase agreements only with financial institutions that are deemed by the Manager or Subadvisor to be creditworthy, pursuant to guidelines established by the Board. During the term of any repurchase agreement, the Manager or Subadvisor will continue to monitor the creditworthiness of the seller. Under the 1940 Act, repurchase agreements are considered to be collateralized loans by the Fund to the seller secured by the securities transferred to the Fund.
When the Fund enters into repurchase agreements, the Fund’s custodian takes possession of the collateral pledged for investments in the repurchase agreement. The underlying collateral is valued daily on a mark to market basis to determine if the value, including accrued interest, exceeds the repurchase price. In the event of the seller’s default on the obligation to repurchase, the Fund has the right to liquidate the collateral and apply the proceeds in satisfaction of the obligation. Under certain circumstances, such as in the event of default or bankruptcy by the counterparty to the agreement, realization and/or retention of the collateral may be subject to legal proceedings and possible realized loss to the Fund.
(H) Rights and Warrants. Rights are certificates that permit the holder to purchase a certain number of shares, or a fractional share, of a new stock from the issuer at a specific price. Warrants are instruments that entitle the holder to buy an equity security at a specific price for a specific period of time. These investments can provide a greater potential for profit or loss than an equivalent investment in the underlying security. Prices of these investments do not necessarily move in tandem with the prices of the underlying securities.
There is risk involved in the purchase of rights and warrants in that these investments are speculative investments. The Fund could also lose the entire value of its investment in warrants if such warrants are not exercised by the date of its expiration. The Fund is exposed to risk until the sale or exercise of each right or warrant is completed. As of October 31, 2016, the Fund did not hold any rights.
(I) Securities Lending. In order to realize additional income, the Fund may engage in securities lending, subject to the limitations set forth in the 1940 Act and relevant guidance by the staff of the Securities and Exchange Commission (“SEC”). In the event the Fund does engage in securities lending, the Fund will lend through its custodian, State Street Bank and Trust Company (“State Street”). State Street will manage the Fund’s cash collateral in accordance with the lending agreement between the Fund and State Street, and indemnify the Fund against counterparty risk. The loans will be collateralized by cash or securities at least equal at all times to the market value of the securities loaned. Collateral will consist of U.S. government securities, cash equivalents or irrevocable letters of credit. The Fund may bear the risk of delay in recovery of, or loss of rights in, the securities loaned should the borrower of the securities experience financial difficulty. The Fund may also record a realized gain or loss on securities deemed sold due to a borrower’s inability to return securities on loan. The Fund bears the risk of any loss on investment of the collateral. The Fund will receive compensation for lending its securities in the form of fees or it will retain a portion of interest on the investment of any cash received as collateral. The Fund will also continue to receive interest and dividends on the securities loaned and any gain or loss in the market price of the securities loaned that may occur during the term of the loan will be for
the account of the Fund. During the year ended October 31, 2016, the Fund did not have any portfolio securities on loan.
(J) Convertible Securities Risk. Convertible securities may be subordinate to other securities. In part, the total return for a convertible security depends upon the performance of the underlying stock into which it can be converted. Also, issuers of convertible securities are often not as strong financially as those issuing securities with higher credit ratings, are more likely to encounter financial difficulties and typically are more vulnerable to changes in the economy, such as a recession or a sustained period of rising interest rates, which could affect their ability to make interest and principal payments. If an issuer stops making interest and/or principal payments, the Fund could lose its entire investment.
(K) Indemnifications. Under the Trust’s organizational documents, its officers and trustees are indemnified against certain liabilities that may arise out of performance of their duties to the Trust. Additionally, in the normal course of business, the Fund enters into contracts with third-party service providers that contain a variety of representations and warranties and which may provide general indemnifications. The Fund’s maximum exposure under these arrangements is unknown, as this would involve future claims that may be made against the Fund that have not yet occurred. Based on experience, management is of the view that the risk of loss in connection with these potential indemnification obligations is remote. However, there can be no assurance that material liabilities related to such obligations will not arise in the future, which could adversely impact the Fund.
Note 3–Fees and Related Party Transactions
(A) Manager and Subadvisor. New York Life Investments, a registered investment adviser and an indirect, wholly-owned subsidiary of New York Life Insurance Company (“New York Life”), serves as the Fund’s Manager, pursuant to an Amended and Restated Management Agreement (“Management Agreement”). The Manager provides offices, conducts clerical, recordkeeping and bookkeeping services, and keeps most of the financial and accounting records required to be maintained by the Fund. Except for the portion of salaries and expenses that are the responsibility of the Fund, the Manager pays the salaries and expenses of all personnel affiliated with the Fund and certain operational expenses of the Fund. The Fund reimburses New York Life Investments in an amount equal to a portion of the compensation of the Chief Compliance Officer of the Fund. MacKay Shields LLC (“MacKay Shields” or the “Subadvisor”), a registered investment adviser and an indirect, wholly-owned subsidiary of New York Life, serves as Subadvisor to the Fund and is responsible for the day-to-day portfolio management of the Fund. Pursuant to the terms of the Amended and Restated Subadvisory Agreement (“Subadvisory Agreement”) between New York Life Investments and MacKay Shields, New York Life Investments pays for the services of the Subadvisor.
Under the Management Agreement, the Fund pays the Manager a monthly fee for services performed and facilities furnished at an annual rate of the Fund’s average daily net assets as follows: 0.60% up to $500 million; 0.55% from $500 million to $1 billion; and 0.50% in excess of $1 billion, plus a fee for fund accounting services, previously provided by New York Life Investments under a separate fund accounting agreement, furnished at an annual rate of the Fund’s
| | |
| 24 | | MainStay Convertible Fund |
average daily net assets as follows: 0.05% up to $20 million; 0.0333% from $20 million to $100 million; and 0.01% in excess of $100 million. During the year ended October 31, 2016, the effective management fee rate was 0.59%, inclusive of a fee for fund accounting services of 0.01% of the Fund’s average daily net assets.
During the year ended October 31, 2016, New York Life Investments earned fees from the Fund in the amount of $4,811,501.
State Street provides sub-administration and sub-accounting services to the Fund pursuant to an agreement with New York Life Investments. These services include calculating the daily NAVs of the Fund, maintaining the general ledger and sub-ledger accounts for the calculation of the Fund’s NAVs, and assisting New York Life Investments in conducting various aspects of the Fund’s administrative operations. For providing these services to the Fund, State Street is compensated by New York Life Investments.
(B) Distribution and Service Fees. The Trust, on behalf of the Fund, has entered into a distribution agreement with NYLIFE Distributors LLC (the “Distributor”), an indirect, wholly-owned subsidiary of New York Life. The Fund has adopted distribution plans (the “Plans”) in accordance with the provisions of Rule 12b-1 under the 1940 Act.
Pursuant to the Class A and Investor Class Plans, the Distributor receives a monthly distribution fee from the Class A and Investor Class shares at an annual rate of 0.25% of the average daily net assets of the Class A and Investor Class shares for distribution and/or service activities as designated by the Distributor. Pursuant to the Class B and Class C Plans, Class B and Class C shares pay the Distributor a monthly distribution fee at an annual rate of 0.75% of the average daily net assets of the Class B and Class C shares along with a service fee at an annual rate of 0.25% of the average daily net assets of the Class B and Class C shares, for a total 12b-1 fee of 1.00%. Class I shares are not subject to a distribution and/or service fee.
The Plans provide that the distribution and service fees are payable to the Distributor regardless of the amounts actually expended by the Distributor for distribution of the Fund’s shares and service activities.
(C) Sales Charges. During the year ended October 31, 2016, the Fund was advised by the Distributor that the amount of initial sales charges retained on sales of Class A and Investor Class shares were $53,154 and $17,408, respectively. During the year ended October 31, 2016, the Fund was also advised that the Distributor retained CDSCs on redemptions of Class A, Investor Class, Class B and Class C shares of $2,286, $3, $22,065 and $4,672, respectively.
(D) Transfer, Dividend Disbursing and Shareholder Servicing Agent. NYLIM Service Company LLC, an affiliate of New York Life Investments, is the Fund’s transfer, dividend disbursing and shareholder servicing agent pursuant to an agreement between NYLIM Service Company LLC and the Trust. NYLIM Service Company LLC has entered into an agreement with Boston Financial Data Services, Inc. (“BFDS”) pursuant to which BFDS performs certain transfer agent services on behalf of NYLIM Service Company LLC. During the year ended
October 31, 2016, transfer agent expenses incurred by the Fund were as follows:
| | | | |
Class A | | $ | 456,711 | |
Investor Class | | | 229,286 | |
Class B | | | 67,272 | |
Class C | | | 238,564 | |
Class I | | | 302,034 | |
(E) Small Account Fee. Shareholders with small accounts adversely impact the cost of providing transfer agency services. In an effort to reduce total transfer agency expenses, the Fund has implemented a small account fee on certain types of accounts. Certain shareholders with an account balance of less than $1,000 are charged an annual per account fee of $20 (assessed semi-annually), the proceeds from which offset transfer agent fees as reflected in the Statement of Operations.
Note 4–Federal Income Tax
As of October 31, 2016, the components of accumulated gain (loss) on a tax basis were as follows:
| | | | | | | | | | | | | | | | |
Ordinary
Income | | Accumulated
Capital and Other Gain
(Loss) | | | Other
Temporary
Differences | | | Unrealized
Appreciation
(Depreciation) | | | Total
Accumulated Gain (Loss) | |
$3,615,402 | | $ | 13,478,324 | | | $ | — | | | $ | 41,128,236 | | | $ | 58,221,962 | |
The difference between book-basis and tax-basis unrealized appreciation (depreciation) is primarily due to wash sale adjustments, trust preferred securities, deemed dividends, and Contingent Payment Debt Instruments (CPDI).
The following table discloses the current year reclassifications between undistributed net investment income (loss), accumulated net realized gain (loss) on investments, and additional paid-in capital arising from permanent differences; net assets as of October 31, 2016 were not affected.
| | | | | | | | |
Undistributed
Net Investment
Income (Loss) | | Accumulated
Net Realized
Gain (Loss) on
Investments | | | Additional
Paid-In
Capital | |
| $2,380,213 | | $ | (2,380,213 | ) | | $ | — | |
The reclassifications for the Fund are primarily due to CPDI adjustments, deemed dividends, adjustments on trust preferred securities, and capital gain distributions from Real Estate Investment Trusts (REITs).
During the years ended October 31, 2016 and October 31, 2015, the tax character of distributions paid as reflected in the Statements of Changes in Net Assets was as follows:
| | | | | | | | |
| | | 2016 | | | 2015 | |
Distributions paid from: | | | | | | | | |
Ordinary Income | | $ | 41,495,561 | | | $ | 36,755,541 | |
Long-Term Capital Gain | | | 29,435,201 | | | | 58,264,775 | |
Total | | $ | 70,930,762 | | | $ | 95,020,316 | |
Notes to Financial Statements (continued)
Note 5–Custodian
State Street is the custodian of cash and securities held by the Fund. Custodial fees are charged to the Fund based on the Fund’s net assets and/or the market value of securities held by the Fund and the number of certain transactions incurred by the Fund.
Note 6–Line of Credit
The Fund and certain other funds managed by New York Life Investments, maintain a line of credit with a syndicate of banks in order to secure a source of funds for temporary purposes to meet unanticipated or excessive redemption requests.
Effective August 2, 2016, under an amended and restated credit agreement (the “Credit Agreement”), the aggregate commitment amount is $600,000,000 with an additional uncommitted amount of $100,000,000. The commitment fee is an annual rate of 0.15% of the average commitment amount payable quarterly, regardless of usage, to Bank of New York Mellon, who serves as the agent to the syndicate. The commitment fee is allocated among the Fund and certain affiliated funds based upon their respective net assets and other factors. Interest on any revolving credit loan is charged based upon the Federal Funds Advances Rate or the one month London InterBank Offered Rate, whichever is higher. The Credit Agreement expires on August 1, 2017, although the Fund, certain affiliated funds and the syndicate of banks may renew the Credit Agreement for an additional year on the same or different terms. Prior to August 2, 2016, the aggregate commitment amount was $600,000,000 with an additional uncommitted amount of $100,000,000, and the commitment fee was at an annual rate of 0.10% of the average commitment amount. During the year ended October 31, 2016, there were no borrowings made or outstanding with respect to the Fund under the Credit Agreement.
Note 7–Interfund Lending Program
Pursuant to an exemptive order issued by the SEC, the Fund, along with certain other funds managed by New York Life Investments, may participate in an interfund lending program. The interfund lending program provides an alternate credit facility that permits the Fund and certain other funds managed by New York Life Investments to lend or borrow money for temporary purposes directly to or from one another, subject to the conditions of the exemptive order. During the year ended October 31, 2016, there were no interfund loans made or outstanding with respect to the Fund.
Note 8–Purchases and Sales of Securities (in 000’s)
During the year ended October 31, 2016, purchases and sales of securities, other than short-term securities, were $188,243 and $240,663, respectively.
Note 9–Capital Share Transactions
| | | | | | | | |
Class A | | Shares | | | Amount | |
Year ended October 31, 2016: | | | | | | | | |
Shares sold | | | 3,284,280 | | | $ | 50,403,497 | |
Shares issued to shareholders in reinvestment of dividends and distributions | | | 2,082,474 | | | | 31,629,994 | |
Shares redeemed | | | (6,883,719 | ) | | | (104,854,396 | ) |
| | | | |
Net increase (decrease) in shares outstanding before conversion | | | (1,516,965 | ) | | | (22,820,905 | ) |
Shares converted into Class A (See Note 1) | | | 396,841 | | | | 6,120,797 | |
Shares converted from Class A (See Note 1) | | | (154,110 | ) | | | (2,355,927 | ) |
| | | | | | | | |
Net increase (decrease) | | | (1,274,234 | ) | | $ | (19,056,035 | ) |
| | | | | | | | |
Year ended October 31, 2015: | | | | | | | | |
Shares sold | | | 7,918,892 | | | $ | 135,337,499 | |
Shares issued to shareholders in reinvestment of dividends and distributions | | | 2,343,504 | | | | 38,922,718 | |
Shares redeemed | | | (6,688,098 | ) | | | (113,357,313 | ) |
| | | | | | | | |
Net increase (decrease) in shares outstanding before conversion | | | 3,574,298 | | | | 60,902,904 | |
Shares converted into Class A (See Note 1) | | | 373,695 | | | | 6,443,999 | |
Shares converted from Class A (See Note 1) | | | (233,476 | ) | | | (3,800,236 | ) |
| | | | | | | | |
Net increase (decrease) | | | 3,714,517 | | | $ | 63,546,667 | |
| | | | | | | | |
| | |
| | | | | | | | |
Investor Class | | Shares | | | Amount | |
Year ended October 31, 2016: | | | | | | | | |
Shares sold | | | 327,950 | | | $ | 5,043,298 | |
Shares issued to shareholders in reinvestment of dividends and distributions | | | 430,056 | | | | 6,531,000 | |
Shares redeemed | | | (586,510 | ) | | | (8,999,265 | ) |
| | | | | | | | |
Net increase (decrease) in shares outstanding before conversion | | | 171,496 | | | | 2,575,033 | |
Shares converted into Investor Class (See Note 1) | | | 255,273 | | | | 3,925,439 | |
Shares converted from Investor Class (See Note 1) | | | (344,452 | ) | | | (5,327,822 | ) |
| | | | | | | | |
Net increase (decrease) | | | 82,317 | | | $ | 1,172,650 | |
| | | | | | | | |
Year ended October 31, 2015: | | | | | | | | |
Shares sold | | | 374,666 | | | $ | 6,375,908 | |
Shares issued to shareholders in reinvestment of dividends and distributions | | | 531,485 | | | | 8,827,165 | |
Shares redeemed | | | (643,508 | ) | | | (10,933,067 | ) |
| | | | | | | | |
Net increase (decrease) in shares outstanding before conversion | | | 262,643 | | | | 4,270,006 | |
Shares converted into Investor Class (See Note 1) | | | 349,784 | | | | 5,751,160 | |
Shares converted from Investor Class (See Note 1) | | | (325,667 | ) | | | (5,629,332 | ) |
| | | | | | | | |
Net increase (decrease) | | | 286,760 | | | $ | 4,391,834 | |
| | | | | | | | |
| | |
| 26 | | MainStay Convertible Fund |
| | | | | | | | |
Class B | | Shares | | | Amount | |
Year ended October 31, 2016: | | | | | | | | |
Shares sold | | | 128,418 | | | $ | 1,958,707 | |
Shares issued to shareholders in reinvestment of dividends and distributions | | | 110,154 | | | | 1,666,215 | |
Shares redeemed | | | (305,286 | ) | | | (4,642,547 | ) |
| | | | | | | | |
Net increase (decrease) in shares outstanding before conversion | | | (66,714 | ) | | | (1,017,625 | ) |
Shares converted from Class B (See Note 1) | | | (177,956 | ) | | | (2,732,887 | ) |
| | | | | | | | |
Net increase (decrease) | | | (244,670 | ) | | $ | (3,750,512 | ) |
| | | | | | | | |
Year ended October 31, 2015: | | | | | | | | |
Shares sold | | | 228,782 | | | $ | 3,884,262 | |
Shares issued to shareholders in reinvestment of dividends and distributions | | | 158,187 | | | | 2,627,544 | |
Shares redeemed | | | (234,772 | ) | | | (3,951,978 | ) |
| | | | | | | | |
Net increase (decrease) in shares outstanding before conversion | | | 152,197 | | | | 2,559,828 | |
Shares converted from Class B (See Note 1) | | | (164,819 | ) | | | (2,765,591 | ) |
| | | | | | | | |
Net increase (decrease) | | | (12,622 | ) | | $ | (205,763 | ) |
| | | | | | | | |
| | |
| | | | | | | | |
Class C | | Shares | | | Amount | |
Year ended October 31, 2016: | | | | | | | | |
Shares sold | | | 705,686 | | | $ | 10,787,840 | |
Shares issued to shareholders in reinvestment of dividends and distributions | | | 345,750 | | | | 5,223,109 | |
Shares redeemed | | | (1,744,065 | ) | | | (26,501,422 | ) |
| | | | | | | | |
Net increase (decrease) in shares outstanding before conversion | | | (692,629 | ) | | | (10,490,473 | ) |
Shares converted from Class C (See Note 1) | | | (6,021 | ) | | | (84,656 | ) |
| | | | | | | | |
Net increase (decrease) | | | (698,650 | ) | | $ | (10,575,129 | ) |
| | | | | | | | |
Year ended October 31, 2015: | | | | | | | | |
Shares sold | | | 1,186,806 | | | $ | 19,988,767 | |
Shares issued to shareholders in reinvestment of dividends and distributions | | | 423,024 | | | | 7,017,965 | |
Shares redeemed | | | (1,057,378 | ) | | | (17,837,122 | ) |
| | | | | | | | |
Net increase (decrease) | | | 552,452 | | | $ | 9,169,610 | |
| | | | | | | | |
| | |
| | | | | | | | |
Class I | | Shares | | | Amount | |
Year ended October 31, 2016: | | | | | | | | |
Shares sold | | | 6,838,634 | | | $ | 104,870,026 | |
Shares issued to shareholders in reinvestment of dividends and distributions | | | 1,017,672 | | | | 15,483,637 | |
Shares redeemed | | | (9,853,762 | ) | | | (150,262,953 | ) |
| | | | | | | | |
Net increase (decrease) in shares outstanding before conversion | | | (1,997,456 | ) | | | (29,909,290 | ) |
Shares converted into Class I (See Note 1) | | | 29,411 | | | | 455,056 | |
| | | | | | | | |
Net increase (decrease) | | | (1,968,045 | ) | | $ | (29,454,234 | ) |
| | | | | | | | |
Year ended October 31, 2015: | | | | | | | | |
Shares sold | | | 9,725,437 | | | $ | 165,853,087 | |
Shares issued to shareholders in reinvestment of dividends and distributions | | | 1,237,516 | | | | 20,580,597 | |
Shares redeemed | | | (10,042,852 | ) | | | (168,988,233 | ) |
| | | | | | | | |
Net increase (decrease) | | | 920,101 | | | $ | 17,445,451 | |
| | | | | | | | |
Note 10–Recent Accounting Pronouncement
In October 2016, the SEC adopted new rules and amended existing rules (together, “final rules”) intended to modernize the reporting and disclosure of information by registered investment companies. In part, the final rules amend Regulation S-X and require standardized, enhanced disclosure about derivatives in investment company financial statements, as well as other amendments. The compliance date for the amendments to Regulation S-X is August 1, 2017. Management is currently evaluating the impact that the adoption of the amendments to Regulation S-X will have on the Fund’s financial statements and related disclosures.
Note 11–Subsequent Events
In connection with the preparation of the financial statements of the Fund as of and for the fiscal year ended October 31, 2016, events and transactions subsequent to October 31, 2016, through the date the financial statements were issued have been evaluated by the Fund’s management for possible adjustment and/or disclosure. No subsequent events requiring financial statement adjustment or disclosure have been identified other than the following:
Effective February 28, 2017, Class B shares of the MainStay Group of Funds will be closed to all new purchases as well as additional investments by existing Class B shareholders. Existing Class B shareholders may continue to reinvest dividends and capital gains distributions, as well as exchange their Class B shares for Class B shares of other Funds as permitted by the current exchange privileges. Class B shareholders will continue to be subject to any applicable contingent deferred sales charge at the time of redemption. All other features of the Class B shares, including but not limited to the fees and expenses applicable to Class B shares, will remain unchanged. Unless redeemed, Class B Shares shareholders will remain in Class B shares of their respective Fund until the Class B shares are converted to Class A or Investor Class shares pursuant to the applicable conversion schedule.
Report of Independent Registered Public Accounting Firm
The Board of Trustees and Shareholders of
The MainStay Funds:
We have audited the accompanying statement of assets and liabilities, including the portfolio of investments, of the MainStay Convertible Fund (the “Fund”), one of the funds constituting The MainStay Funds, as of October 31, 2016, and the related statement of operations for the year then ended, the statements of changes in net assets for each of the years in the two-year period then ended, and the financial highlights for each of the years in the five-year period then ended. These financial statements and financial highlights are the responsibility of the Fund’s management. Our responsibility is to express an opinion on these financial statements and financial highlights based on our audits.
We conducted our audits in accordance with the standards of the Public Company Accounting Oversight Board (United States). Those standards require that we plan and perform the audit to obtain reasonable assurance about whether the financial statements and financial highlights are free of material misstatement. An audit includes examining, on a test basis, evidence supporting the amounts and disclosures in the financial statements. Our procedures included confirmation of securities owned as of October 31, 2016 by correspondence with the custodian and brokers or by other appropriate auditing procedures where replies from brokers were not received. An audit also includes assessing the accounting principles used and significant estimates made by management, as well as evaluating the overall financial statement presentation. We believe that our audits provide a reasonable basis for our opinion.
In our opinion, the financial statements and financial highlights referred to above present fairly, in all material respects, the financial position of the MainStay Convertible Fund of The MainStay Funds as of October 31, 2016, the results of its operations for the year then ended, the changes in its net assets for each of the years in the two-year period then ended, and the financial highlights for each of the years in the five-year period then ended, in conformity with U.S. generally accepted accounting principles.

Philadelphia, Pennsylvania
December 22, 2016
| | |
| 28 | | MainStay Convertible Fund |
Federal Income Tax Information
(Unaudited)
The Fund is required under the Internal Revenue Code to advise shareholders in a written statement as to the federal tax status of dividends paid by the Fund during such fiscal years. Accordingly, the Fund paid $29,435,201 as long term capital gain distributions.
For the fiscal year ended October 31, 2016, the Fund designated approximately $10,451,697 under the Internal Revenue Code as qualified dividend income eligible for reduced tax rates.
The dividends paid by the Fund during the fiscal year ended October 31, 2016, should be multiplied by 12.6% to arrive at the amount eligible for the corporate dividends received deduction.
In February 2017, shareholders will receive an IRS Form 1099-DIV or substitute Form 1099 which will show the federal tax status of the distributions received by shareholders in calendar year 2016. The amounts that will be reported on such 1099-DIV or substitute Form 1099 will be the amounts you are to use on your federal income tax return and will differ from the amounts which we must report for the Fund’s fiscal year ended October 31, 2016.
Proxy Voting Policies and Procedures and Proxy Voting Record
A description of the policies and procedures that New York Life Investments uses to vote proxies related to the Fund’s securities is available without charge, upon request, (i) by visiting the Fund’s website at mainstayinvestments.com; or (ii) on the SEC’s website at www.sec.gov.
The Fund is required to file with the SEC its proxy voting record for the 12-month period ending June 30 on Form N-PX. The Fund’s most recent Form N-PX or proxy voting record is available free of charge upon request (i) by calling 800-MAINSTAY (624-6782); (ii) by visiting the Fund’s website at mainstayinvestments.com; or (iii) on the SEC’s website at www.sec.gov.
Shareholder Reports and Quarterly Portfolio Disclosure
The Fund is required to file its complete schedule of portfolio holdings with the SEC for its first and third fiscal quarters on Form N-Q. The Fund’s Form N-Q is available without charge on the SEC’s website at www.sec.gov or by calling MainStay Investments at 800-MAINSTAY (624-6782). You also can obtain and review copies of Form N-Q by visiting the SEC’s Public Reference Room in Washington, DC (information on the operation of the Public Reference Room may be obtained by calling 1-800-SEC-0330).
Board of Trustees and Officers (Unaudited)
The Trustees and officers of the Funds are listed below. The Board oversees the MainStay Group of Funds, MainStay VP Funds Trust, MainStay DefinedTerm Municipal Opportunities Fund, the Manager and the Subadvisors, and elects the officers of the Funds who are responsible for the day-to-day operations of the Funds. Information pertaining to the Trustees and officers is set forth below. Each Trustee serves until his or her successor is elected and qualified or until his or her resignation, death or removal. Under the Retirement Policy, a Trustee must
tender his or her resignation by the end of the calendar year during which he or she reaches the age of 75 (although the Board of Trustees may make exceptions from time to time). Officers serve a term of one year and are elected annually by the Board of Trustees. The business address of each Trustee and officer listed below is 51 Madison Avenue, New York, New York 10010. A majority of the Trustees are not “interested persons” (as defined by the 1940 Act and rules “adopted” by the SEC thereunder) of the Fund (“Independent Trustees”).
| | | | | | | | | | | | |
| | | | | Name and Date of Birth | | Term of Office, Position(s) Held and Length of Service | | Principal Occupation(s) During Past Five Years | | Number of
Portfolios in
Fund Complex
Overseen by
Board Member | | Other Directorships Held By Board Member |
Interested Trustee | | | | Christopher O. Blunt* 5/13/62 | | MainStay Funds: Trustee since January 2016; MainStay Funds Trust: Trustee since January 2016. | | Executive Vice President (since 2009), President, Investments Group (since 2015), Member of the Executive Management Committee (since 2007), Co-President, Insurance and Agency Group (2012 to 2015), President, Insurance Group (2012 to 2014), Executive Vice President, Retirement Income Security (2008 to 2012), New York Life Insurance Company. | | 83 | | MainStay VP Funds Trust:
Trustee since January 2016 (31 portfolios); and
MainStay DefinedTerm Municipal Opportunities Fund: Trustee since January 2016. |
| | * | This Trustee is considered to be an “interested person” of the MainStay Group of Funds within the meaning of the 1940 Act because of his affiliation with New York Life Insurance Company, New York Life Investment Management LLC, Cornerstone Capital Management Holdings LLC, MacKay Shields LLC, Institutional Capital LLC, NYL Investors LLC, NYLIFE Securities LLC and/or NYLIFE Distributors LLC, as described in detail above in the column entitled “Principal Occupation(s) During Past Five Years.” |
| | |
| 30 | | MainStay Convertible Fund |
| | | | | | | | | | | | |
| | | | | Name and Date of Birth | | Term of Office, Position(s) Held and Length of Service | | Principal Occupation(s) During Past Five Years | | Number of Portfolios in Fund Complex Overseen by Board Member | | Other Directorships Held By Board Member |
| Non-Interested Trustee | | | | David H. Chow 12/29/57 | | MainStay Funds: Trustee since January 2016, Advisory Board Member (June 2015 to December 2015); MainStay Funds Trust: Trustee since January 2016, Advisory Board Member (June 2015 to December 2015). | | Founder and CEO, DanCourt Management, LLC (since 1999) | | 83 | | MainStay VP Funds Trust: Trustee since January 2016, Advisory Board Member (June 2015 to December 2015); (31 portfolios);
MainStay DefinedTerm Municipal Opportunities Fund: Trustee since January 2016, Advisory Board Member (June 2015 to December 2015);
Market Vectors Group of Exchange-Traded Funds: Independent Chairman of the Board of Trustees since 2008 and Trustee since 2006 (55 portfolios); and
Berea College of Kentucky: Trustee since 2009. |
| | | | Susan B. Kerley 8/12/51 | | MainStay Funds: Trustee since 2007; MainStay Funds Trust: Trustee since 1990.*** | | President, Strategic Management Advisors LLC (since 1990) | | 83 | | MainStay VP Funds Trust: Trustee since 2007 (31 portfolios)**;
MainStay DefinedTerm Municipal Opportunities Fund: Trustee since 2011; and Legg Mason Partners Funds: Trustee since 1991 (53 portfolios). |
| | | | Alan R. Latshaw 3/27/51 | | MainStay Funds: Trustee and Audit Committee Financial Expert since 2006; MainStay Funds Trust: Trustee and Audit Committee Financial Expert since 2007.*** | | Retired; Partner, Ernst & Young LLP (2002 to 2003); Partner, Arthur Andersen LLP (1989 to 2002); Consultant to the MainStay Funds Audit and Compliance Committee (2004 to 2006) | | 83 | | MainStay VP Funds Trust: Trustee and Audit Committee Financial Expert since 2007 (31 portfolios)**;
MainStay DefinedTerm Municipal Opportunities Fund: Trustee and Audit Committee Financial Expert since 2011;
State Farm Associates Funds Trusts: Trustee since 2005 (4 portfolios);
State Farm Mutual Fund Trust: Trustee since 2005 (15 portfolios); and
State Farm Variable Product Trust: Trustee since 2005 (9 portfolios). |
| | | | Peter Meenan 12/5/41 | | MainStay Funds: Chairman since 2013 and Trustee since 2007; MainStay Funds Trust: Chairman since 2013 and Trustee since 2002.*** | | Retired; Independent Consultant (2004 to 2013); President and Chief Executive Officer, Babson—United, Inc. (financial services firm) (2000 to 2004); Independent Consultant (1999 to 2000); Head of Global Funds, Citicorp (1995 to 1999) | | 83 | | MainStay VP Funds Trust: Chairman since 2013 and Trustee since 2007 (31 portfolios)**; and
MainStay DefinedTerm Municipal Opportunities Fund: Chairman since 2013 and Trustee since 2011. |
| | | | Richard H. Nolan, Jr. 11/16/46 | | MainStay Funds: Trustee since 2007; MainStay Funds Trust: Trustee since 2007.*** | | Managing Director, ICC Capital Management (since 2004); President—Shields/Alliance, Alliance Capital Management (1994 to 2004) | | 83 | | MainStay VP Funds Trust: Trustee since 2006 (31 portfolios)**; and
MainStay DefinedTerm Municipal Opportunities Fund: Trustee since 2011. |
| | | | Jacques P. Perold 5/12/58 | | MainStay Funds: Trustee since January 2016, Advisory Board Member (June 2015 to December 2015); MainStay Funds Trust: Trustee since January 2016, Advisory Board Member (June 2015 to December 2015). | | Retired; President, Fidelity Management & Research Company (2009 to 2014); Founder, President and Chief Executive Officer, Geode Capital Management, LCC (2001 to 2009) | | 83 | | MainStay VP Funds Trust: Trustee since January 2016, Advisory Board Member (June 2015 to December 2015); (31 portfolios);
MainStay DefinedTerm Municipal Opportunities Fund: Trustee since January 2016, Advisory Board Member (June 2015 to December 2015);
Allstate Corporation: Director since 2015; and
Boston University: Trustee since 2014. |
| | | | | | | | | | | | |
| | | | | Name and Date of Birth | | Term of Office, Position(s) Held and Length of Service | | Principal Occupation(s) During Past Five Years | | Number of Portfolios in Fund Complex Overseen by Board Member | | Other Directorships Held By Board Member |
Non-Interested Trustee | | | | Richard S. Trutanic 2/13/52 | | MainStay Funds: Trustee since 1994; MainStay Funds Trust: Trustee since 2007.*** | | Chairman and Chief Executive Officer, Somerset & Company (financial advisory firm) (since 2004); Managing Director, The Carlyle Group (private investment firm) (2002 to 2004); Senior Managing Director, Partner and Board Member, Groupe Arnault S.A. (private investment firm) (1999 to 2002) | | 83 | | MainStay VP Funds Trust: Trustee since 2007 (31 portfolios)**; and
MainStay DefinedTerm Municipal Opportunities Fund: Trustee since 2011. |
| | | | John A. Weisser**** 10/22/41 | | MainStay Funds: Trustee since 2007; MainStay Funds Trust: Trustee since 2007.*** | | Retired; Managing Director of Salomon Brothers, Inc. (1971 to 1995) | | 83 | | MainStay VP Funds Trust: Trustee since 1997 (31 portfolios)**; MainStay DefinedTerm Municipal Opportunities Fund: Trustee since 2011; Direxion Insurance Trust: Trustee since 2007 (1 portfolio); Direxion Funds: Trustee since 2007 (18 portfolios); and Direxion Shares ETF Trust: Trustee since 2008 (52 portfolios). |
| | ** | Includes prior service as a Director of MainStay VP Series Fund, Inc., the predecessor to MainStay VP Funds Trust. |
| | *** | Includes prior service as a Director/Trustee of certain predecessor entities to MainStay Funds Trust. |
| | **** | Pursuant to the Retirement Policy, Mr. Weisser will retire from the Board of Trustees on or about December 31, 2016. |
| | |
| 32 | | MainStay Convertible Fund |
| | | | | | | | |
| | | | | Name and Date of Birth | | Position(s) Held and Length of Service | | Principal Occupation(s) During Past Five Years |
Officers (Who Are Not Board Members)* | | | | Stephen P. Fisher 2/22/59 | | President, MainStay Funds (since 2007), MainStay Funds Trust (since 2009) | | Chairman and Chief Executive Officer (since 2014), President and Chief Operating Officer (2008 to 2013), NYLIFE Distributors LLC; Chairman of the Board, NYLIM Service Company LLC (since 2008); President (since May 2015), Co-President (2014 to 2015) and Senior Managing Director (since 2005), New York Life Investment Management LLC; President, MainStay DefinedTerm Municipal Opportunities Fund (since 2011) and MainStay VP Funds Trust (since 2007)** |
| | | | Jack R. Benintende 5/12/64 | | Treasurer and Principal Financial and Accounting Officer, MainStay Funds (since 2007), MainStay Funds Trust (since 2009) | | Managing Director, New York Life Investment Management LLC (since 2007); Treasurer and Principal Financial and Accounting Officer, MainStay DefinedTerm Municipal Opportunities Fund (since 2011) and MainStay VP Funds Trust (since 2007)**; and Assistant Treasurer, New York Life Investment Management Holdings LLC (2008 to 2012) |
| | | | Kevin M. Bopp 2/24/69 | | Vice President and Chief Compliance Officer, MainStay Funds and MainStay Funds Trust (since 2014) | | Chief Compliance Officer (since January 2016), Director and Associate General Counsel (2011 to 2014) and Vice President and Assistant General Counsel (2010 to 2011), New York Life Investment Management LLC; Vice President and Chief Compliance Officer, MainStay VP Funds Trust, MainStay DefinedTerm Municipal Opportunities Fund (since 2014); Assistant Secretary, MainStay Funds, MainStay Funds Trust and MainStay VP Funds Trust (2010 to 2014)**, MainStay DefinedTerm Municipal Opportunities Fund (2011 to 2014) |
| | | | J. Kevin Gao 10/13/67 | | Secretary and Chief Legal Officer, MainStay Funds and MainStay Funds Trust (since 2010) | | Managing Director and Associate General Counsel, New York Life Investment Management LLC (since 2010); Secretary and Chief Legal Officer, MainStay DefinedTerm Municipal Opportunities Fund (since 2011) and MainStay VP Funds Trust (since 2010)** |
| | | | Scott T. Harrington 2/8/59 | | Vice President— Administration, MainStay Funds (since 2005), MainStay Funds Trust (since 2009) | | Director, New York Life Investment Management LLC (including predecessor advisory organizations) (since 2000); Member of the Board of Directors, New York Life Trust Company (since 2009); Vice President—Administration, MainStay DefinedTerm Municipal Opportunities Fund (since 2011) and MainStay VP Funds Trust (since 2005)** |
| | * | The Officers listed above are considered to be “interested persons” of the MainStay Group of Funds within the meaning of the 1940 Act because of their affiliation with the MainStay Group of Funds, New York Life Insurance Company and/or its affiliates, including New York Life Investment Management LLC, NYLIM Service Company LLC, NYLIFE Securities LLC and/or NYLIFE Distributors LLC, as described in detail in the column captioned “Principal Occupation(s) During Past Five Years.” Officers are elected annually by the Board to serve a one year term. |
| | ** | Includes prior service as an Officer of MainStay VP Series Fund, Inc., the predecessor to MainStay VP Funds Trust. |
This page intentionally left blank
MainStay Funds
MainStay offers a wide range of Funds for virtually any investment need. The full array of MainStay open-end offerings is listed here, with information about the manager, subadvisors, legal counsel and independent registered public accounting firm.
Equity
U.S. Equity
MainStay Common Stock Fund
MainStay Cornerstone Growth Fund
MainStay Epoch U.S. All Cap Fund
MainStay Epoch U.S. Equity Yield Fund
MainStay Epoch U.S. Small Cap Fund
MainStay ICAP Equity Fund
MainStay ICAP Select Equity Fund
MainStay Large Cap Growth Fund
MainStay MAP Fund
MainStay S&P 500 Index Fund
MainStay U.S. Equity Opportunities Fund
International/Global Equity
MainStay Emerging Markets Opportunities Fund
MainStay Epoch Capital Growth Fund
MainStay Epoch Global Choice Fund
MainStay Epoch Global Equity Yield Fund
MainStay Epoch International Small Cap Fund
MainStay ICAP International Fund
MainStay International Equity Fund
MainStay International Opportunities Fund
Income
Taxable Bond
MainStay Floating Rate Fund
MainStay Global High Income Fund
MainStay Government Fund
MainStay High Yield Corporate Bond Fund
MainStay High Yield Opportunities Fund
MainStay Indexed Bond Fund
MainStay Short Duration High Yield Fund
MainStay Total Return Bond Fund
MainStay Unconstrained Bond Fund
Municipal/Tax Advantaged Bond
MainStay California Tax Free Opportunities Fund1
MainStay High Yield Municipal Bond Fund
MainStay New York Tax Free Opportunities Fund2
MainStay Tax Advantaged Short Term Bond Fund
MainStay Tax Free Bond Fund
Money Market
MainStay Money Market Fund
Mixed Asset
MainStay Balanced Fund
MainStay Convertible Fund
MainStay Income Builder Fund
Alternative
MainStay Absolute Return Multi-Strategy Fund
MainStay Cushing Energy Income Fund
MainStay Cushing MLP Premier Fund
MainStay Cushing Renaissance Advantage Fund
Asset Allocation/Target Date
MainStay Conservative Allocation Fund
MainStay Growth Allocation Fund
MainStay Moderate Allocation Fund
MainStay Moderate Growth Allocation Fund
MainStay Retirement 2010 Fund
MainStay Retirement 2020 Fund
MainStay Retirement 2030 Fund
MainStay Retirement 2040 Fund
MainStay Retirement 2050 Fund
MainStay Retirement 2060 Fund
Manager
New York Life Investment Management LLC
New York, New York
Subadvisors
Candriam France S.A.S.3
Paris, France
Cornerstone Capital Management Holdings LLC3
New York, New York
Cushing Asset Management, LP
Dallas, Texas
Epoch Investment Partners, Inc.
New York, New York
Institutional Capital LLC3
Chicago, Illinois
MacKay Shields LLC3
New York, New York
Markston International LLC
White Plains, New York
NYL Investors LLC3
New York, New York
Winslow Capital Management, LLC
Minneapolis, Minnesota
Legal Counsel
Dechert LLP
Washington, District of Columbia
Independent Registered Public Accounting Firm
KPMG LLP
Philadelphia, Pennsylvania
1. This Fund is only registered for sale in AZ, CA, MI (Class A and Class I shares only), NV, OR, TX, UT and WA.
2. This Fund is only registered for sale in CA, CT, DE, FL, MA, NJ, NY and VT.
3. An affiliate of New York Life Investment Management LLC.
Not part of the Annual Report
For more information
800-MAINSTAY (624-6782)
mainstayinvestments.com
MainStay Investments® is a registered service mark and name under which New York Life Investment Management LLC does business. MainStay Investments, an indirect subsidiary of New York Life Insurance Company, New York, NY 10010, provides investment advisory products and services. The MainStay Funds® are managed by New York Life Investment Management LLC and distributed by NYLIFE Distributors LLC, 30 Hudson Street, Jersey City, NJ 07302, a wholly owned subsidiary of New York Life Insurance Company. NYLIFE Distributors LLC is a Member FINRA/SIPC.
©2016 NYLIFE Distributors LLC. All rights reserved.
| | | | | | | | |
| Not FDIC/NCUA Insured | | Not a Deposit | | May Lose Value | | No Bank Guarantee | | Not Insured by Any Government Agency |
| | |
| 1716013 MS316-16 | | MSC11-12/16 (NYLIM) NL210 |
MainStay Income Builder Fund
Message from the President and Annual Report
October 31, 2016


This page intentionally left blank
Message from the President
During the 12 months ended October 31, 2016, the U.S. stock and bond markets were somewhat volatile but generally ended the reporting period in positive territory. In the fall of 2015 and early 2016, the market appeared to be focused on China’s economic weakness and a prolonged decline in oil prices. Although energy-related companies felt the brunt of these setbacks, the stock market as a whole declined until mid-February, when oil prices began to rise and stocks began a relatively steady recovery.
In late June, the United Kingdom voted to leave the European Union in a referendum popularly known as “Brexit.” The news caused a temporary slump in stocks around the world. Although the British pound dropped in value following the vote, stocks generally recovered through the end of the reporting period. As the end of the reporting period approached, speculation about the upcoming U.S. presidential election heightened market volatility.
According to FTSE-Russell data, U.S. stocks as a whole tended to provide positive returns during the reporting period, with large-capitalization stocks generally outperforming stocks of smaller companies. Value stocks outpaced growth stocks at all capitalization levels, with the largest differences among small- to mid-cap stocks.
International and emerging-market stocks provided mixed performance. Rocked by Brexit, European stocks as a whole declined during the reporting period, while stocks in the Asia-Pacific region (with or without Japan) tended to provide positive returns. International stocks as a whole declined, while global stocks advanced slightly. Emerging-market stocks were considerably stronger, boosted by advances in India and Latin America and higher prices for oil, metals and other commodities.
Anticipation of a possible Federal Reserve rate hike led to volatility in the bond market, but the Federal Open Market Committee chose not to raise the federal funds target rate during the reporting period. Short-term U.S. Treasury yields rose during the reporting period, and longer-term U.S. Treasury yields declined. Overall, the U.S. bond market provided positive returns, with longer-term bonds generally outperforming shorter-term securities. High-yield bonds, particularly
longer-term issues, were strong performers. Municipal bonds generally provided positive single-digit total returns for the 12 months ended October 31, 2016.
Central banks around the world remained highly accommodative during the reporting period, particularly in light of Brexit. Shortly after the U.K. referendum, more than a third of all sovereign debt carried negative yields. As an asset class, emerging-market bonds provided double-digit positive returns during the reporting period, and world bonds as a whole provided positive single-digit positive returns.
At MainStay, we know that political, economic and market events may influence the performance of your Fund investments. While our portfolio managers often pay close attention to such events, their primary emphasis is seeking to invest for the long-term investment needs of our shareholders. With this in mind, they seek to pursue the investment objectives of their respective Funds using the principal investment strategies and investment processes outlined in the prospectus. By placing your assets in the care of our investment professionals, you gain access to their extensive market insight, strategic investment discipline and in-depth experience in risk-management over a wide range of market cycles.
The report that follows provides more detailed information about the market forces, portfolio strategies and individual securities that influenced the performance of your MainStay Fund during the 12 months ended October 31, 2016. We invite you to read the report carefully as part of your personal investment-review process.
We thank you for your business, and we look forward to a continuing relationship as you pursue your long-range financial goals.
Sincerely,

Stephen P. Fisher
President
The opinions expressed are as of the date of this report and are subject to change. There is no guarantee that any forecast made will come to pass. This material does not constitute investment advice and is not intended as an endorsement of any specific investment. Past performance is no guarantee of future results.
Not part of the Annual Report
Table of Contents
Investors should refer to the Fund’s Summary Prospectus and/or Prospectus and consider the Fund’s investment objectives, strategies, risks, charges and expenses carefully before investing. The Summary Prospectus and/or Prospectus contain this and other information about the Fund. You may obtain copies of the Fund’s Summary Prospectus, Prospectus and Statement of Additional Information free of charge, upon request, by calling toll-free 800-MAINSTAY (624-6782), by writing to NYLIFE Distributors LLC, Attn: MainStay Marketing Department, 30 Hudson Street, Jersey City, NJ 07302 or by sending an e-mail to MainStayShareholderServices@nylim.com. These documents are also available via the MainStay Funds’ website at mainstayinvestments.com/documents. Please read the Summary Prospectus and/or Prospectus carefully before investing.
Investment and Performance Comparison1 (Unaudited)
Performance data quoted represents past performance. Past performance is no guarantee of future results. Because of market volatility and other factors, current performance may be lower or higher than the figures shown. Investment return and principal value will fluctuate, and as a result, when shares are redeemed, they may be worth more or less than their original cost. The graph below depicts the historical performance of Class B shares of the Fund. Performance will vary from class to class based on differences in class-specific expenses and sales charges. For performance information current to the most recent month-end, please call 800-MAINSTAY (624-6782) or visit mainstayinvestments.com.
(With sales charges)
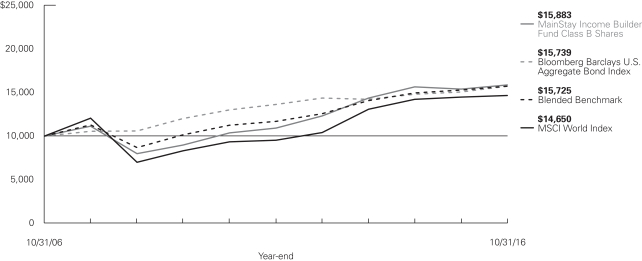
Average Annual Total Returns for the Year Ended October 31, 2016
| | | | | | | | | | | | | | | | | | | | |
| Class | | Sales Charge | | | | One Year | | | Five Years | | | Ten Years | | | Gross
Expense
Ratio2 | |
| Class A Shares | | Maximum 5.5% Initial Sales Charge | | With sales charges
Excluding sales charges | |
| –1.64
4.08 | %
| |
| 7.65
8.87 | %
| |
| 5.14
5.74 | %
| |
| 1.02
1.02 | %
|
| Investor Class Shares3 | | Maximum 5.5% Initial Sales Charge | | With sales charges
Excluding sales charges | |
| –1.79
3.93 |
| |
| 7.40
8.62 |
| |
| 4.92
5.52 |
| |
| 1.18
1.18 |
|
| Class B Shares | | Maximum 5% CDSC
if Redeemed Within the First Six Years of Purchase | | With sales charges Excluding sales charges | |
| –1.68
3.20 |
| |
| 7.52
7.82 |
| |
| 4.74
4.74 |
| |
| 1.93
1.93 |
|
| Class C Shares | | Maximum 1% CDSC
if Redeemed Within One Year of Purchase | | With sales charges
Excluding sales charges | |
| 2.17
3.15 |
| |
| 7.82
7.82 |
| |
| 4.73
4.73 |
| |
| 1.93
1.93 |
|
| Class I Shares | | No Sales Charge | | | | | 4.30 | | | | 9.15 | | | | 6.04 | | | | 0.77 | |
| Class R2 Shares4 | | No Sales Charge | | | | | 3.99 | | | | 8.82 | | | | 5.46 | | | | 1.12 | |
| Class R3 Shares5 | | No Sales Charge | | | | | 3.67 | | | | 8.26 | | | | 5.16 | | | | 1.37 | |
| 1. | The performance table and graph do not reflect the deduction of taxes that a shareholder would pay on distributions or Fund share redemptions. Total returns reflect maximum applicable sales charges as indicated in the table above, if any, changes in share price, and reinvestment of dividend and capital gain distributions. The graph assumes the initial investment amount shown above and reflects the deduction of all sales charges that would have applied for the period of investment. Performance figures may reflect certain fee waivers and/or expense limitations, without which total returns may have been lower. For more information on share classes and current fee waivers and/or expense limitations (if any), please refer to the notes to the financial statements. |
| 2. | The gross expense ratios presented reflect the Fund’s “Total Annual Fund Operating Expenses” from the most recent Prospectus and may differ from other expense ratios disclosed in this report. |
| 3. | Performance figures for Investor Class shares, first offered on February 28, 2008, include the historical performance of Class A shares through February 27, 2008, adjusted for differences in certain fees and expenses. Unadjusted, the performance shown for the Investor Class shares would likely have been different. |
| 4. | Performance figures for Class R2 shares, first offered on February 27, 2015, include the historical performance of Class B shares through February 26, 2015, adjusted for differences in certain fees and expenses. Unadjusted, the performance shown for these newer share classes would likely have been different. |
| 5. | Performance figures for Class R3 shares, first offered on February 29, 2016, include the historical performance of Class B shares through February 28, 2016, adjusted for differences in certain fees and expenses. Unadjusted, the performance shown for the Class R3 shares would likely have been different. |
The footnotes on the next page are an integral part of the table and graph and should be carefully read in conjunction with them.
| | | | | | | | | | | | |
| Benchmark Performance | | One
Year | | | Five
Years | | | Ten
Years | |
MSCI World Index6 | | | 1.18 | % | | | 9.03 | % | | | 3.89 | % |
Bloomberg Barclays U.S. Aggregate Bond Index7 | | | 4.37 | | | | 2.90 | | | | 4.64 | |
Blended Benchmark Index8 | | | 2.92 | | | | 6.10 | | | | 4.63 | |
Average Lipper Flexible Portfolio Fund9 | | | 2.59 | | | | 5.06 | | | | 4.00 | |
| 6. | The MSCI World Index is the Fund’s primary broad-based securities market index for comparison purposes. The MSCI World Index is a free float-adjusted market capitalization weighted index that is designed to measure the equity market performance of developed markets. Results assume reinvestment of all dividends and capital gains. An investment cannot be made directly in an index. |
| 7. | The Fund has selected the Bloomberg Barclays U.S. Aggregate Bond Index as a secondary benchmark. The Bloomberg Barclays U.S. Aggregate Bond Index is a broad-based benchmark that measures the investment grade, U.S. dollar-denominated, fixed-rate taxable bond market, including Treasurys, government-related and corporate securities, mortgage-backed securities (agency fixed-rate and hybrid adjustable rate mortgage pass-throughs), asset-backed securities, and commercial mortgage-backed securities. Results assume reinvestment of all dividends and capital gains. An investment cannot be made directly in an index. |
| 8. | The Fund has selected the Blended Benchmark Index as an additional benchmark. The Blended Benchmark Index consists of the MSCI World Index and the Bloomberg Barclays U.S. Aggregate Bond Index weighted 50%/50%, respectively. Results assume reinvestment of all dividends and capital gains. An investment cannot be made directly in an index. |
| 9. | The Average Lipper Flexible Portfolio Fund is representative of funds that allocate their investments across various asset classes, including domestic common stocks, bonds, and money market instruments, with a focus on total return. This benchmark is a product of Lipper Inc. Lipper Inc. is an independent monitor of fund performance. Results are based on average total returns of similar funds with all dividend and capital-gain distributions reinvested. |
The footnotes on the preceding page are an integral part of the table and graph and should be carefully read in conjunction with them.
| | |
| 6 | | MainStay Income Builder Fund |
Cost in Dollars of a $1,000 Investment in MainStay Income Builder Fund (Unaudited)
The example below is intended to describe the fees and expenses borne by shareholders during the six-month period from May 1, 2016, to October 31, 2016, and the impact of those costs on your investment.
Example
As a shareholder of the Fund, you incur two types of costs: (1) transaction costs, including exchange fees and sales charges (loads) on purchases (as applicable), and (2) ongoing costs, including management fees, distribution and/or service (12b-1) fees, and other Fund expenses (as applicable). This example is intended to help you understand your ongoing costs (in dollars) of investing in the Fund and to compare these costs with the ongoing costs of investing in other mutual funds. The example is based on an investment of $1,000 made at the beginning of the six-month period and held for the entire period from May 1, 2016, to October 31, 2016.
This example illustrates your Fund’s ongoing costs in two ways:
Actual Expenses
The second and third data columns in the table below provide information about actual account values and actual expenses. You may use the information in these columns, together with the amount you invested, to estimate the expenses that you paid during the six months ended October 31, 2016. Simply divide your account value by $1,000 (for example, an $8,600 account value divided by $1,000 = 8.6), then
multiply the result by the number under the heading entitled “Expenses Paid During Period” to estimate the expenses you paid on your account during this period.
Hypothetical Example for Comparison Purposes
The fourth and fifth data columns in the table below provide information about hypothetical account values and hypothetical expenses based on the Fund’s actual expense ratio and an assumed rate of return of 5% per year before expenses, which is not the Fund’s actual return. The hypothetical account values and expenses may not be used to estimate the actual ending account balances or expenses you paid for the six-month period shown. You may use this information to compare the ongoing costs of investing in the Fund with the ongoing costs of investing in other Funds. To do so, compare this 5% hypothetical example with the 5% hypothetical examples that appear in the shareholder reports of the other Funds.
Please note that the expenses shown in the table are meant to highlight your ongoing costs only and do not reflect any transactional costs, such as exchange fees or sales charges (loads). Therefore, the fourth and fifth data columns of the table are useful in comparing ongoing costs only and will not help you determine the relative total costs of owning different funds. In addition, if these transactional costs were included, your costs would have been higher.
| | | | | | | | | | | | | | | | | | | | |
| | | | | | | | | | | | | | | | |
| Share Class | | Beginning
Account
Value
5/1/16 | | | Ending Account
Value (Based
on Actual
Returns and
Expenses)
10/31/16 | | | Expenses
Paid
During
Period1 | | | Ending Account
Value (Based
on Hypothetical
5% Annualized
Return and
Actual Expenses)
10/31/16 | | | Expenses
Paid
During
Period1 | |
| | | | | |
| Class A Shares | | $ | 1,000.00 | | | $ | 1,031.90 | | | $ | 5.16 | | | $ | 1,020.10 | | | $ | 5.13 | |
| | | | | |
| Investor Class Shares | | $ | 1,000.00 | | | $ | 1,031.70 | | | $ | 5.82 | | | $ | 1,019.40 | | | $ | 5.79 | |
| | | | | |
| Class B Shares | | $ | 1,000.00 | | | $ | 1,027.80 | | | $ | 9.63 | | | $ | 1,015.60 | | | $ | 9.58 | |
| | | | | |
| Class C Shares | | $ | 1,000.00 | | | $ | 1,027.30 | | | $ | 9.63 | | | $ | 1,015.60 | | | $ | 9.58 | |
| | | | | |
| Class I Shares | | $ | 1,000.00 | | | $ | 1,033.50 | | | $ | 3.88 | | | $ | 1,021.30 | | | $ | 3.86 | |
| | | | | |
| Class R2 Shares | | $ | 1,000.00 | | | $ | 1,031.50 | | | $ | 5.72 | | | $ | 1,019.50 | | | $ | 5.69 | |
| | | | | |
| Class R3 Shares | | $ | 1,000.00 | | | $ | 1,030.20 | | | $ | 6.94 | | | $ | 1,018.30 | | | $ | 6.90 | |
| 1. | Expenses are equal to the Fund’s annualized expense ratio of each class (1.01% for Class A, 1.14% for Investor Class, 1.89% for Class B and Class C, 0.76% for Class I, 1.12% for Class R2 and 1.36% for Class R3) multiplied by the average account value over the period, divided by 366 and multiplied by 184 (to reflect the six-month period). The table above represents the actual expenses incurred during the six-month period. |
Portfolio Composition as of October 31, 2016 (Unaudited)
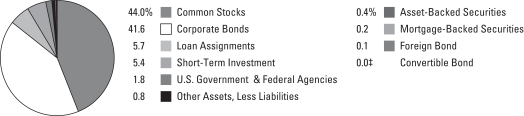
See Portfolio of Investments beginning on page 12 for specific holdings within these categories.
| ‡ | Less than one-tenth of a percent. |
Top Ten Holdings or Issuers Held as of October 31, 2016 (excluding short-term investment) (Unaudited)
| 1. | United States Treasury Notes, 2.00%–2.25%, due 7/31/21–8/15/25 |
| 2. | Verizon Communications, Inc. |
| 5. | Goldman Sachs Group, Inc. (The), 3.625%–6.75%, due 1/22/23–12/29/49 |
| 6. | Reynolds American, Inc. |
| 7. | Philip Morris International, Inc. |
| | |
| 8 | | MainStay Income Builder Fund |
Portfolio Management Discussion and Analysis (Unaudited)
Questions answered by portfolio managers Dan Roberts, PhD, Michael Kimble, CFA, Louis N. Cohen, CFA, and Taylor Wagenseil1 of MacKay Shields LLC (“MacKay Shields”), the Subadvisor for the fixed-income portion of the Fund, and Eric Sappenfield, William Priest, CFA, Michael Welhoelter, CFA, John Tobin, PhD, CFA, and Kera Van Valen, CFA, of Epoch Investment Partners, Inc. (“Epoch”), the Subadvisor for the equity portion of the Fund.
How did MainStay Income Builder Fund perform relative to its benchmarks and peers during the 12 months ended October 31, 2016?
Excluding all sales charges, MainStay Income Builder Fund returned 4.08% for Class A shares, 3.93% for Investor Class shares, 3.20% for Class B shares and 3.15% for Class C shares for the 12 months ended October 31, 2016. Over the same period, Class I shares returned 4.30%, Class R2 shares returned 3.99% and Class R3 shares2 returned 3.67%. For the 12 months ended October 31, 2016, all share classes outperformed the 1.18% return of the MSCI World Index,3 which is the Fund’s primary benchmark, and underperformed the 4.37% return of the Bloomberg Barclays U.S. Aggregate Bond Index,3 which is a secondary benchmark for the Fund (formerly an additional benchmark). For the 12 months ended October 31, 2016, all share classes outperformed the 2.92% return of the Blended Benchmark Index (formerly known as the Income Builder Composite Index),3 which is an additional benchmark for the Fund. Over the same period, all share classes outperformed the 2.59% return of the Average Lipper4 Flexible Portfolio Fund. See page 5 for Fund returns with applicable sales charges.
During the reporting period, how was the Fund’s performance materially affected by investments in derivatives?
During the reporting period, the fixed-income portion of the Fund maintained several equity futures positions that yielded a positive return (0.25%) and U.S. Treasury futures positions that yielded a negative return (–0.21%). The Fund also maintained foreign currency forward contracts that yielded a positive return (1.18%).
What factors affected the relative performance of the equity portion of the Fund during the reporting period?
The equity portion of the Fund held a diversified portfolio of companies that continued to grow free cash flow and remained committed to consistently returning cash to shareholders through a combination of cash dividends, share buybacks and debt reduction. The vast majority of stocks in the equity portion of the Fund were able to achieve this and increase their dividends during the reporting period. Among the sectors where stock selection made the strongest positive contributions to the performance of the equity portion of the Fund relative to the MSCI World Index were financials, information technology, telecommunication services, health care and consumer staples. (Contributions take weightings and total returns into account.) The equity portion of the Fund held an overweight position relative to the Index in the
outperforming utilities sector, which helped relative performance. Stock selection in the energy and materials sectors and underweight positions relative to the MSCI World Index in the information technology and materials sectors offset some of the relative gains in the equity portion of the Fund.
During the reporting period, which individual stocks made the strongest contributions to the absolute performance in the equity portion of the Fund and which stocks detracted the most?
Among the stocks that made the strongest contributions to the absolute performance of the equity portion of the Fund were WEC Energy, Taiwan Semiconductor and AT&T. WEC Energy is a regulated utility company that provides electricity and natural gas services to customers in Wisconsin, Illinois, Minnesota and Michigan. Shares outperformed as the company continued to execute well on its integration plan following the acquisition of Integrys in June 2015. We believe that WEC may deliver above-peer earnings and cash flow growth, which the company may use to reward its shareholders with an attractive and growing dividend. Taiwan Semiconductor is one of the largest semiconductor manufacturers in the world. Shares appreciated following better-than-expected cellular demand during the reporting period. The company also provided in our view, a positive long-term road map for continued cash flow growth and reduced capital intensity over the near term as it continued to reuse equipment and improve efficiency. Taiwan Semiconductor has paid a well-covered dividend. AT&T is the largest pay TV and second-largest mobile telecommunication services provider in the United States. The stock benefited as investors focused on the company’s increased cash-generation profile after its DirecTV closure and on the cash-generating power of the company’s telecommunication services unit. The recently announced acquisition of Time Warner by AT&T has been less well received, but we believed that the acquisition could increase free cash flow generation, improve AT&T’s payout ratios and raise the overall growth profile of the company. If so, excess cash could be returned through a healthy dividend, debt pay down and opportunistic share repurchases.
Among the stocks that detracted from results in the equity portion of the Fund were Kinder Morgan, ConocoPhillips and Seagate. Kinder Morgan is the largest energy infrastructure company in the United States, providing pipeline transportation, storage, CO2 supply, and terminals services to other energy companies. The Fund held Kinder Morgan–controlled pipeline companies for many years, as these entities had paid
| 1. | Mr. Wagenseil served as a portfolio manager for the Fund until August 6, 2016. |
| 2. | See footnote on page 5 for more information on Class R3 shares. |
| 3. | See footnote on page 6 for more information on this index. |
| 4. | See footnote on page 6 for more information on Lipper Inc. |
substantial and growing dividends. In October 2015, the company raised its dividend and continued to guide to a mid to high single-digit dividend growth rate. In late November 2015, however, Kinder Morgan increased its equity stake in a highly leveraged affiliate, which led Moody’s to change the company’s outlook to negative. This resulted in an increased cost of capital to fund growth projects. As a result, in December 2015, the company’s guidance for over $5 billion of cash flow after maintenance capital expenditures was unchanged, but management chose to significantly reduce the cash dividend and redirect the cash flow to fund growth. We subsequently sold the position that the equity portion of the Fund held in the company. ConocoPhillips, an independent exploration and production company that operates in North America, Europe, Asia and the Middle East, explores, produces, transports and markets crude oil, natural gas, natural gas liquids, liquefied natural gas and bitumen. Falling energy prices in 2015 continued into February 2016 and significantly reduced the company’s cash flow and dividend coverage. While the company stated that it was dedicated to preserving its dividend, we exited the position in the equity portion of the Fund as we believed the company’s balance-sheet capacity weakened and the risk of a dividend cut rose. ConocoPhillips did cut its dividend after the Fund sold its shares. Shares of Seagate, the world’s second-largest hard disk drive manufacturer, fell because of prereleased operating results, which highlighted the challenging conditions in the data storage device industry. While the company remained committed to its dividend and shareholder yield policies, we felt the visibility into near-term cash generation was significantly diminished, and we sold the position that the equity portion of the Fund held in the stock.
Did the equity portion of the Fund make any significant purchases or sales during the reporting period?
The equity portion of the Fund made several significant purchases during the reporting period. Among them were pharmaceutical company AbbVie, advanced wireless technologies company Qualcomm and capital markets company BlackRock, each of which was added to the Fund because of the company’s favorable shareholder-yield attributes.
Among the positions that were eliminated from the equity portion of the Fund during the reporting period were Canadian media company Shaw Communications, French electric utility company Electricite de France and crop nutrient company Potash.
How did sector weightings change in the equity portion of the Fund during the reporting period?
Sector weights are generally a function of our bottom-up stock- selection process. Among the sectors to which the equity portion of the Fund reduced its weightings during the reporting period were energy and materials. Over the same period, the equity portion of the Fund increased its exposure to the health care, information technology and industrials sectors, among others.
How was the equity portion of the Fund positioned at the end of the reporting period?
The equity portion of the Fund continues to seek attractive returns through a diversified group of companies focused on generating significant free cash flow and returning it to shareholders through a combination of dividends, share repurchases and debt reduction. This stock-by-stock process often results in the equity portion of the Fund having a different composition than the MSCI World Index in terms of types of companies held and sector weights.
As of October 31, 2016, the most significantly overweight sector positions relative to the MSCI World Index in the equity portion of the Fund included utilities and telecommunication services. As of the same date, the most significantly underweight sectors in the equity portion of the Fund included information technology and consumer discretionary.
What factors affected the relative performance of the fixed-income portion of the Fund during the reporting period?
Throughout the reporting period, the strategy of the fixed-income portion of the Fund was to maintain overweight positions relative to the Bloomberg Barclays U.S. Aggregate Bond Index in spread product,5 including high-yield bonds, bank loans and investment-grade corporate credit. Although this positioning fell out of favor at the beginning of the reporting period, credit rebounded strongly from mid-February 2016 to the end of the reporting period, moving up from a low point as oil prices rebounded and fears of a slowing U.S. economy diminished. This sharp correction in the credit markets, coupled with the Fund’s overweight in credit compared to the benchmark, was the driving force behind the Fund’s outperformance of the Bloomberg Barclays U.S. Aggregate Bond Index. In a stressed market, investors typically seek safe harbors and the market generally demands more compensation for risk, creating an opportunity for defensively-postured funds to outperform as prices for riskier assets fall. Conditions like these were seen early in the reporting period, and they detracted from the Fund’s credit bias. In a market with an appetite for risk, the risk
| 5. | The terms “spread” and “yield spread” may refer to the difference in yield between a security or type of security and comparable U.S. Treasury issues. The terms may also refer to the difference in yield between two specific securities or types of securities at a given time. The term “spread product” refers to asset classes that typically trade at a spread to comparable U.S. Treasury securities. |
| | |
| 10 | | MainStay Income Builder Fund |
premium for spread product falls, leading to tighter spreads and higher prices for risk assets. Conditions like these were seen in the second half of the reporting period, and they were beneficial for the Fund’s credit bias.
What was the duration6 strategy of the fixed-income portion of the Fund during the reporting period?
The duration of the fixed-income portion of the Fund was generally shorter than that of the Bloomberg Barclays U.S. Aggregate Bond Index during the reporting period. At the end of the reporting period, the Fund’s duration was approximately 5.3 years, which was shorter than the duration of the Bloomberg Barclays U.S. Aggregate Bond Index.
What specific factors, risks or market forces prompted significant decisions for the fixed-income portion of the Fund during the reporting period?
Throughout the reporting period, a number of factors were considered in positioning the Fund. These factors included inconsistent economic data, global central-bank monetary policy, volatility in energy prices and the impact of the U.K.’s decision to leave the European Union (“Brexit”). Nevertheless, we did not make any significant shifts in the Fund’s positioning during the reporting period. We believed that corporate bonds (both investment grade and high yield) and bank loans warranted overweight positions in the Fund compared to government-related securities. This positioning reflected the current low-interest-rate environment, significant refinancing in the credit markets, generally improved balance sheet fundamentals and a more favorable supply/demand balance for corporate debt.
During the reporting period, the fixed-income portion of the Fund did, however, reduce its positions in energy and high-yield bonds as a whole and moderately increased exposure to investment-grade credit. We also closed out an interest-rate hedge in the fixed-income portion of the Fund, but this portion of the Fund maintained a shorter duration than the Bloomberg Barclays U.S. Aggregate Bond Index largely because of exposure to high-yield bonds and to a lesser degree because of exposure to bank loans.
Which market segments were the strongest contributors to the performance of the fixed-income portion of the Fund, and which market segments were particularly weak?
The high-yield credit component was the largest contributor to the performance of the fixed-income portion of the Fund during the reporting period, as lower-quality credits performed better
than higher-quality credits. Bank loans and investment-grade credit also contributed positively to the performance of the fixed-income portion of the Fund.
Within the high-yield position in the fixed-income portion of the Fund, home builders, wireless communications and some commodity-related securities helped performance. Within the investment-grade credit market, financial holdings contributed positively to performance in the fixed-income portion of the Fund, but underperformed high-yield returns.
Did the fixed-income portion of the Fund make any significant purchases or sales during the reporting period?
During the reporting period, the fixed-income portion of the Fund bought bonds of wireless provider Sprint and consumer goods company Mondelez. Both positions were new issues and offered attractive yields for this portion of the Fund, and the Sprint bonds were secured by the company’s wireless spectrum. The fixed-income portion of the Fund sold its position in energy company Denbury Resources. The bonds rallied with the run-up in energy bond prices and were sold to promote risk-reduction in the fixed-income portion of the Fund. Within high-yield, the Fund’s energy positions were positive contributors during the reporting period, but the Fund’s underweight in energy detracted from performance. The transportation sector also underperformed.
How did sector weightings change in the fixed-income portion of the Fund during the reporting period?
During the reporting period, the fixed-income portion of the Fund slightly trimmed its high-yield credit position and slightly increased its exposure to investment-grade credit. As previously noted, the fixed-income portion of the Fund reduced its high-yield energy exposure.
How was the fixed-income portion of the Fund positioned at the end of the reporting period?
As of October 31, 2016, the fixed-income portion of the Fund maintained overweight positions relative to the Bloomberg Barclays U.S. Aggregate Bond Index in spread product, specifically in high-yield bonds and bank loans. The increased volatility experienced in the third quarter of 2015 created a wider disparity between spreads and defaults, increasing our conviction in the overweight position the fixed-income portion of the Fund held in high-yield securities. As of the same date, the fixed-income portion of the Fund held underweight positions relative to the Index in sectors that are more rate sensitive, such as U.S. Treasury securities and agency securities.
| 6. | Duration is a measure of the price sensitivity of a fixed-income investment to changes in interest rates. Duration is expressed as a number of years and is considered a more accurate sensitivity gauge than average maturity. |
The opinions expressed are those of the portfolio managers as of the date of this report and are subject to change. There is no guarantee that any forecasts will come to pass. This material does not constitute investment advice and is not intended as an endorsement of any specific investment.
Portfolio of Investments October 31, 2016
| | | | | | | | |
| | | Principal
Amount | | | Value | |
Long-Term Bonds 49.8%† Asset-Backed Securities 0.4% | | | | | | | | |
Home Equity 0.4% | | | | | | | | |
Ameriquest Mortgage Securities, Inc.
Series 2003-8, Class AF5
5.14%, due 10/25/33 (a) | | $ | 32,264 | | | $ | 32,501 | |
Carrington Mortgage Loan Trust
Series 2006-NC4, Class A5
0.585%, due 10/25/36 (b) | | | 154,073 | | | | 150,516 | |
Chase Funding Trust
Series 2002-2, Class 1A5
6.333%, due 4/25/32 (a) | | | 133,051 | | | | 134,964 | |
CIT Group Home Equity Loan Trust
Series 2003-1, Class A4
4.43%, due 3/20/32 (a) | | | 3,263 | | | | 3,266 | |
Citigroup Mortgage Loan Trust
Series 2007-AHL2, Class A3A
0.595%, due 5/25/37 (b) | | | 561,771 | | | | 408,252 | |
Countrywide Asset-Backed Certificates
Series 2003-5, Class AF5
5.383%, due 2/25/34 (a) | | | 484,334 | | | | 484,738 | |
Equity One Mortgage Pass-Through Trust | | | | | | | | |
Series 2003-4, Class AF6
5.333%, due 10/25/34 (a) | | | 48,852 | | | | 48,953 | |
Series 2003-3, Class AF4
5.495%, due 12/25/33 (a) | | | 279,455 | | | | 277,062 | |
GSAA Home Equity Trust
Series 2006-14, Class A1
0.575%, due 9/25/36 (b) | | | 5,243,201 | | | | 2,662,889 | |
HSI Asset Securitization Corp. Trust
Series 2007-NC1, Class A1
0.625%, due 4/25/37 (b) | | | 2,930 | | | | 2,094 | |
JPMorgan Mortgage Acquisition Trust
Series 2007-HE1, Class AF1
0.625%, due 3/25/47 (b) | | | 519,976 | | | | 302,987 | |
MASTR Asset Backed Securities Trust
Series 2006-HE4, Class A1
0.575%, due 11/25/36 (b) | | | 689,878 | | | | 324,661 | |
RAMP Trust | | | | | | | | |
Series 2003-RS7, Class AI6
5.34%, due 8/25/33 (b) | | | 9,524 | | | | 9,544 | |
Series 2003-RZ5, Class A7
5.47%, due 9/25/33 (a) | | | 19,522 | | | | 20,040 | |
RASC Trust
Series 2002-KS2, Class AI6
6.228%, due 4/25/32 (b) | | | 18,871 | | | | 19,062 | |
Saxon Asset Securities Trust
Series 2003-1, Class AF5
5.118%, due 6/25/33 (a) | | | 93,019 | | | | 94,333 | |
| | | | | | | | |
| | | Principal
Amount | | | Value | |
Home Equity (continued) | | | | | | | | |
Soundview Home Equity Loan Trust
Series 2006-EQ2, Class A2
0.635%, due 1/25/37 (b) | | $ | 1,057,849 | | | $ | 756,101 | |
Specialty Underwriting & Residential Finance Trust
Series 2006-BC4, Class A2B
0.635%, due 9/25/37 (b) | | | 731,227 | | | | 367,738 | |
Terwin Mortgage Trust
Series 2005-14HE, Class AF2
4.849%, due 8/25/36 (a) | | | 58,698 | | | | 59,653 | |
| | | | | | | | |
| | | | | | | 6,159,354 | |
| | | | | | | | |
Student Loans 0.0%‡ | | | | | | | | |
KeyCorp Student Loan Trust
Series 2000-A, Class A2
0.982%, due 5/25/29 (b) | | | 415,335 | | | | 400,096 | |
| | | | | | | | |
Total Asset-Backed Securities
(Cost $7,761,659) | | | | | | | 6,559,450 | |
| | | | | | | | |
| | |
| Convertible Bond 0.0%‡ | | | | | | | | |
Transportation 0.0%‡ | | | | | | | | |
Hornbeck Offshore Services, Inc.
1.50%, due 9/1/19 | | | 760,000 | | | | 481,175 | |
| | | | | | | | |
Total Convertible Bond
(Cost $831,935) | | | | | | | 481,175 | |
| | | | | | | | |
| | |
| Corporate Bonds 41.6% | | | | | | | | |
Advertising 0.1% | | | | | | | | |
Lamar Media Corp.
5.375%, due 1/15/24 | | | 625,000 | | | | 657,813 | |
| | | | | | | | |
| | |
Aerospace & Defense 0.5% | | | | | | | | |
KLX, Inc.
5.875%, due 12/1/22 (c) | | | 3,485,000 | | | | 3,546,684 | |
Triumph Group, Inc.
4.875%, due 4/1/21 | | | 3,875,000 | | | | 3,584,375 | |
| | | | | | | | |
| | | | | | | 7,131,059 | |
| | | | | | | | |
Agriculture 0.0%‡ | | | | | | | | |
¨Reynolds American, Inc.
8.125%, due 6/23/19 | | | 255,000 | | | | 296,525 | |
| | | | | | | | |
| | |
Airlines 1.0% | | | | | | | | |
American Airlines Group, Inc.
4.625%, due 3/1/20 (c) | | | 3,700,000 | | | | 3,723,125 | |
| † | Percentages indicated are based on Fund net assets. |
| ¨ | | Among the Fund’s 10 largest holdings or issuers held, as of October 31, 2016, excluding short-term investment. May be subject to change daily. (Unaudited) |
| | | | |
| 12 | | MainStay Income Builder Fund | | The notes to the financial statements are an integral part of,
and should be read in conjunction with, the financial statements. |
| | | | | | | | |
| | | Principal
Amount | | | Value | |
| Corporate Bonds (continued) | | | | | |
Airlines (continued) | | | | | | | | |
American Airlines, Inc. | | | | | | | | |
Series 2016-2, Class AA, Pass Through Trust 3.20%, due 6/15/28 | | $ | 680,000 | | | $ | 691,900 | |
Series 2015-2, Class AA, Pass Through Trust
3.60%, due 9/22/27 | | | 3,417,213 | | | | 3,617,974 | |
Series 2016-2, Class A, Pass Through Trust
3.65%, due 6/15/28 | | | 240,000 | | | | 249,600 | |
Continental Airlines, Inc. | | | | | | | | |
Series 2009-2, Class A, Pass Through Trust
7.25%, due 11/10/19 | | | 1,543,998 | | | | 1,736,998 | |
Series 2003-ERJ1
7.875%, due 7/2/18 | | | 408,589 | | | | 426,212 | |
U.S. Airways Group, Inc. | | | | | | | | |
Series 2012-1, Class A, Pass Through Trust
5.90%, due 10/1/24 | | | 1,899,635 | | | | 2,177,457 | |
Series 2010-1 Class A, Pass Through Trust
6.25%, due 4/22/23 | | | 967,388 | | | | 1,095,567 | |
United Airlines, Inc. | | | | | | | | |
Series 2007-1, Pass-Through Trust
6.636%, due 7/2/22 | | | 1,698,327 | | | | 1,812,965 | |
Series 2009-1, Pass-Through Trust
10.40%, due 11/1/16 | | | 279,970 | | | | 280,836 | |
| | | | | | | | |
| | | | | | | 15,812,634 | |
| | | | | | | | |
Apparel 0.2% | | | | | |
Hanesbrands, Inc.
4.625%, due 5/15/24 (c) | | | 3,575,000 | | | | 3,635,328 | |
| | | | | | | | |
| | |
Auto Manufacturers 0.6% | | | | | | | | |
Ford Motor Co. | | | | | | | | |
6.625%, due 10/1/28 | | | 1,500,000 | | | | 1,864,581 | |
7.45%, due 7/16/31 | | | 450,000 | | | | 591,271 | |
8.90%, due 1/15/32 | | | 215,000 | | | | 294,541 | |
Ford Motor Credit Co. LLC
5.875%, due 8/2/21 | | | 350,000 | | | | 397,435 | |
General Motors Financial Co., Inc. | | | | | | | | |
3.20%, due 7/13/20 | | | 1,800,000 | | | | 1,830,704 | |
3.25%, due 5/15/18 | | | 325,000 | | | | 330,786 | |
3.45%, due 4/10/22 | | | 3,800,000 | | | | 3,842,366 | |
| | | | | | | | |
| | | | 9,151,684 | |
| | | | | | | | |
Auto Parts & Equipment 1.1% | | | | | | | | |
Dana, Inc.
5.375%, due 9/15/21 | | | 3,780,000 | | | | 3,919,387 | |
| | | | | | | | |
| | | Principal
Amount | | | Value | |
Auto Parts & Equipment (continued) | | | | | | | | |
Goodyear Tire & Rubber Co. (The)
5.125%, due 11/15/23 | | $ | 5,250,000 | | | $ | 5,420,625 | |
MPG Holdco I, Inc.
7.375%, due 10/15/22 | | | 3,370,000 | | | | 3,433,188 | |
Schaeffler Finance B.V.
4.75%, due 5/15/23 (Germany) (c) | | | 3,345,000 | | | | 3,449,531 | |
Tenneco, Inc.
5.00%, due 7/15/26 | | | 1,660,000 | | | | 1,668,300 | |
| | | | | | | | |
| | | | 17,891,031 | |
| | | | | | | | |
Banks 5.3% | | | | | |
Bank of America Corp. | | | | | | | | |
4.875%, due 4/1/44 | | | 1,845,000 | | | | 2,083,346 | |
5.00%, due 1/21/44 | | | 1,440,000 | | | | 1,648,924 | |
5.125%, due 12/29/49 (b) | | | 575,000 | | | | 566,835 | |
5.42%, due 3/15/17 | | | 135,000 | | | | 137,034 | |
5.625%, due 7/1/20 | | | 645,000 | | | | 721,905 | |
5.875%, due 2/7/42 | | | 500,000 | | | | 632,313 | |
6.11%, due 1/29/37 | | | 1,505,000 | | | | 1,827,023 | |
6.30%, due 12/29/49 (b) | | | 2,085,000 | | | | 2,275,048 | |
7.625%, due 6/1/19 | | | 1,015,000 | | | | 1,158,819 | |
8.57%, due 11/15/24 | | | 485,000 | | | | 623,055 | |
Bank of New York Mellon Corp. (The)
4.625%, due 12/29/49 (b) | | | 2,150,000 | | | | 2,099,045 | |
Barclays PLC
5.20%, due 5/12/26 (United Kingdom) | | | 1,590,000 | | | | 1,636,473 | |
Capital One Financial Corp. | | | | | | | | |
4.20%, due 10/29/25 | | | 435,000 | | | | 451,697 | |
5.55%, due 12/29/49 (b) | | | 3,720,000 | | | | 3,761,326 | |
Citigroup, Inc. | | | | | | | | |
4.05%, due 7/30/22 | | | 105,000 | | | | 110,976 | |
4.65%, due 7/30/45 | | | 1,685,000 | | | | 1,843,655 | |
5.30%, due 5/6/44 | | | 1,555,000 | | | | 1,715,146 | |
6.25%, due 12/29/49 (b) | | | 2,080,000 | | | | 2,239,432 | |
6.625%, due 6/15/32 | | | 770,000 | | | | 955,391 | |
6.875%, due 6/1/25 | | | 1,715,000 | | | | 2,111,403 | |
Citizens Bank N.A.
2.55%, due 5/13/21 | | | 1,050,000 | | | | 1,063,297 | |
Citizens Financial Group, Inc.
4.30%, due 12/3/25 | | | 3,405,000 | | | | 3,551,041 | |
Discover Bank
8.70%, due 11/18/19 | | | 1,064,000 | | | | 1,234,026 | |
¨Goldman Sachs Group, Inc. (The) | | | | | |
3.625%, due 1/22/23 | | | 3,045,000 | | | | 3,203,757 | |
4.80%, due 7/8/44 | | | 2,385,000 | | | | 2,598,286 | |
5.30%, due 12/29/49 (b) | | | 2,756,000 | | | | 2,807,675 | |
6.75%, due 10/1/37 | | | 3,815,000 | | | | 4,811,627 | |
Huntington Bancshares, Inc.
3.15%, due 3/14/21 | | | 3,535,000 | | | | 3,647,565 | |
JPMorgan Chase & Co. | | | | | | | | |
4.95%, due 6/1/45 | | | 730,000 | | | | 802,255 | |
5.15%, due 12/29/49 (b) | | | 3,150,000 | | | | 3,142,125 | |
6.40%, due 5/15/38 | | | 820,000 | | | | 1,105,168 | |
| | | | | | |
The notes to the financial statements are an integral part of,
and should be read in conjunction with, the financial statements. | | | | | 13 | |
Portfolio of Investments October 31, 2016 (continued)
| | | | | | | | |
| | | Principal
Amount | | | Value | |
| Corporate Bonds (continued) | | | | | |
Banks (continued) | | | | | |
Lloyds Banking Group PLC
4.65%, due 3/24/26 | | $ | 1,605,000 | | | $ | 1,651,988 | |
Morgan Stanley | | | | | | | | |
4.30%, due 1/27/45 | | | 3,075,000 | | | | 3,220,100 | |
4.875%, due 11/1/22 | | | 1,125,000 | | | | 1,235,655 | |
5.00%, due 11/24/25 | | | 2,535,000 | | | | 2,803,981 | |
5.45%, due 12/31/49 (b) | | | 2,310,000 | | | | 2,316,006 | |
6.375%, due 7/24/42 | | | 490,000 | | | | 654,628 | |
Royal Bank of Scotland Group PLC | | | | | | | | |
6.00%, due 12/19/23 | | | 190,000 | | | | 196,125 | |
6.125%, due 12/15/22 | | | 1,530,000 | | | | 1,615,441 | |
Santander Holdings USA, Inc.
2.65%, due 4/17/20 | | | 3,875,000 | | | | 3,872,105 | |
Toronto-Dominion Bank (The)
1.80%, due 7/13/21 (Canada) | | | 4,295,000 | | | | 4,269,771 | |
Wachovia Corp.
5.50%, due 8/1/35 | | | 315,000 | | | | 359,267 | |
Wells Fargo & Co. | | | | | | | | |
4.90%, due 11/17/45 | | | 55,000 | | | | 59,123 | |
5.375%, due 11/2/43 | | | 690,000 | | | | 788,493 | |
5.90%, due 12/29/49 (b) | | | 2,520,000 | | | | 2,636,550 | |
Wells Fargo Bank N.A.
5.85%, due 2/1/37 | | | 140,000 | | | | 171,921 | |
Wells Fargo Capital X
5.95%, due 12/15/36 | | | 715,000 | | | | 765,050 | |
| | | | | | | | |
| | | | 83,181,872 | |
| | | | | | | | |
Beverages 0.7% | | | | | | | | |
Anheuser-Busch InBev Finance, Inc.
3.65%, due 2/1/26 (Belgium) | | | 4,000,000 | | | | 4,209,048 | |
Constellation Brands, Inc.
4.25%, due 5/1/23 | | | 2,100,000 | | | | 2,221,170 | |
PepsiCo Inc. | | | | | | | | |
1.35%, due 10/4/19 (France) | | | 2,225,000 | | | | 2,223,892 | |
2.375%, due 10/6/26 (France) | | | 2,225,000 | | | | 2,181,519 | |
| | | | | | | | |
| | | | 10,835,629 | |
| | | | | | | | |
Biotechnology 0.5% | | | | | | | | |
Biogen, Inc.
3.625%, due 9/15/22 | | | 3,480,000 | | | | 3,708,841 | |
Celgene Corp.
3.625%, due 5/15/24 | | | 3,600,000 | | | | 3,709,678 | |
| | | | | | | | |
| | | | 7,418,519 | |
| | | | | | | | |
Building Materials 1.2% | | | | | | | | |
Fortune Brands Home & Security, Inc.
4.00%, due 6/15/25 | | | 4,420,000 | | | | 4,726,297 | |
Masco Corp.
4.375%, due 4/1/26 | | | 1,575,000 | | | | 1,638,000 | |
Masonite International Corp.
5.625%, due 3/15/23 (c) | | | 3,725,000 | | | | 3,855,375 | |
| | | | | | | | |
| | | Principal
Amount | | | Value | |
Building Materials (continued) | | | | | | | | |
Standard Industries, Inc.
5.375%, due 11/15/24 (c) | | $ | 2,940,000 | | | $ | 3,039,225 | |
USG Corp. | | | | | | | | |
6.30%, due 11/15/16 | | | 4,695,000 | | | | 4,689,836 | |
9.50%, due 1/15/18 | | | 1,330,000 | | | | 1,433,075 | |
| | | | | | | | |
| | | | 19,381,808 | |
| | | | | | | | |
Chemicals 0.6% | | | | | | | | |
Air Liquide Finance S.A. | | | | | | | | |
1.375%, due 9/27/19 (c) | | | 2,535,000 | | | | 2,520,426 | |
1.75%, due 9/27/21 (c) | | | 1,725,000 | | | | 1,703,098 | |
Ashland LLC
4.75%, due 8/15/22 | | | 1,890,000 | | | | 1,952,597 | |
Dow Chemical Co. (The) | | | | | | | | |
4.125%, due 11/15/21 | | | 1,605,000 | | | | 1,741,784 | |
8.55%, due 5/15/19 | | | 75,000 | | | | 87,389 | |
WR Grace & Co.
5.125%, due 10/1/21 (c) | | | 1,885,000 | | | | 2,007,525 | |
| | | | | | | | |
| | | | | | | 10,012,819 | |
| | | | | | | | |
Commercial Services 0.8% | | | | | | | | |
Herc Rentals, Inc.
7.75%, due 6/1/24 (c) | | | 2,120,000 | | | | 2,130,600 | |
Hertz Corp. (The) | | | | | | | | |
5.875%, due 10/15/20 | | | 450,000 | | | | 462,375 | |
7.375%, due 1/15/21 | | | 2,245,000 | | | | 2,312,350 | |
Service Corporation International
5.375%, due 1/15/22 | | | 3,600,000 | | | | 3,735,000 | |
United Rentals North America, Inc. | | | | | | | | |
4.625%, due 7/15/23 | | | 1,350,000 | | | | 1,393,875 | |
5.75%, due 11/15/24 | | | 1,600,000 | | | | 1,660,000 | |
6.125%, due 6/15/23 | | | 710,000 | | | | 741,950 | |
| | | | | | | | |
| | | | | | | 12,436,150 | |
| | | | | | | | |
Computers 0.6% | | | | | | | | |
Apple, Inc. | | | | | | | | |
1.55%, due 8/4/21 | | | 1,500,000 | | | | 1,483,861 | |
3.85%, due 8/4/46 | | | 1,090,000 | | | | 1,061,427 | |
International Business Machines Corp.
7.00%, due 10/30/25 | | | 2,050,000 | | | | 2,725,936 | |
NCR Corp.
5.00%, due 7/15/22 | | | 3,530,000 | | | | 3,585,139 | |
| | | | | | | | |
| | | | | | | 8,856,363 | |
| | | | | | | | |
Diversified Financial Services 0.3% | | | | | | | | |
Alterra Finance LLC
6.25%, due 9/30/20 | | | 200,000 | | | | 227,335 | |
GE Capital International Funding Co. Unlimited Co.
2.342%, due 11/15/20 (Ireland) | | | 4,000,000 | | | | 4,079,820 | |
Peachtree Corners Funding Trust
3.976%, due 2/15/25 (c) | | | 940,000 | | | | 943,403 | |
| | | | | | | | |
| | | | | | | 5,250,558 | |
| | | | | | | | |
| | | | |
| 14 | | MainStay Income Builder Fund | | The notes to the financial statements are an integral part of,
and should be read in conjunction with, the financial statements. |
| | | | | | | | |
| | | Principal
Amount | | | Value | |
| Corporate Bonds (continued) | | | | | |
Electric 0.8% | | | | | | | | |
CMS Energy Corp. | | | | | | | | |
3.875%, due 3/1/24 | | $ | 1,540,000 | | | $ | 1,652,320 | |
5.05%, due 3/15/22 | | | 1,220,000 | | | | 1,379,829 | |
6.25%, due 2/1/20 | | | 1,225,000 | | | | 1,387,561 | |
FirstEnergy Transmission LLC
5.45%, due 7/15/44 (c) | | | 2,555,000 | | | | 2,819,064 | |
Great Plains Energy, Inc.
5.292%, due 6/15/22 (a) | | | 1,130,000 | | | | 1,252,428 | |
MidAmerican Energy Co.
4.40%, due 10/15/44 (France) | | | 2,200,000 | | | | 2,475,273 | |
Puget Energy, Inc.
5.625%, due 7/15/22 | | | 815,000 | | | | 929,482 | |
WEC Energy Group, Inc.
6.25%, due 5/15/67 (b) | | | 1,095,000 | | | | 958,125 | |
| | | | | | | | |
| | | | | | | 12,854,082 | |
| | | | | | | | |
Electronics 0.3% | | | | | |
Honeywell International, Inc.
1.40%, due 10/30/19 (France) | | | 4,970,000 | | | | 4,964,140 | |
| | | | | | | | |
| | |
Finance—Auto Loans 0.3% | | | | | | | | |
Ally Financial, Inc. | | | | | | | | |
3.50%, due 1/27/19 | | | 3,250,000 | | | | 3,258,125 | |
8.00%, due 11/1/31 | | | 770,000 | | | | 920,150 | |
| | | | | | | | |
| | | | | | | 4,178,275 | |
| | | | | | | | |
Finance—Commercial 0.3% | | | | | | | | |
CIT Group, Inc. | | | | | | | | |
3.875%, due 2/19/19 | | | 1,740,000 | | | | 1,766,639 | |
4.25%, due 8/15/17 | | | 340,000 | | | | 344,352 | |
5.00%, due 8/15/22 | | | 1,175,000 | | | | 1,252,844 | |
5.25%, due 3/15/18 | | | 310,000 | | | | 321,055 | |
6.625%, due 4/1/18 (c) | | | 750,000 | | | | 787,500 | |
| | | | | | | | |
| | | | | | | 4,472,390 | |
| | | | | | | | |
Finance—Consumer Loans 0.9% | | | | | |
Navient Corp.
8.00%, due 3/25/20 | | | 2,005,000 | | | | 2,175,425 | |
OneMain Financial Holdings LLC
7.25%, due 12/15/21 (c) | | | 3,305,000 | | | | 3,420,675 | |
Springleaf Finance Corp. | | | | | | | | |
5.25%, due 12/15/19 | | | 700,000 | | | | 702,625 | |
6.00%, due 6/1/20 | | | 775,000 | | | | 781,781 | |
7.75%, due 10/1/21 | | | 1,765,000 | | | | 1,838,954 | |
Synchrony Financial
4.25%, due 8/15/24 | | | 5,000,000 | | | | 5,211,725 | |
| | | | | | | | |
| | | | | | | 14,131,185 | |
| | | | | | | | |
Finance—Credit Card 0.1% | | | | | |
Discover Financial Services
3.85%, due 11/21/22 | | | 1,491,000 | | | | 1,538,626 | |
| | | | | | | | |
| | | | | | | | |
| | | Principal
Amount | | | Value | |
Finance—Investment Banker/Broker 0.0%‡ | | | | | |
Jefferies Group LLC
6.45%, due 6/8/27 | | $ | 200,000 | | | $ | 223,142 | |
| | | | | | | | |
| | |
Finance—Leasing Companies 0.4% | | | | | | | | |
AerCap Ireland Capital, Ltd. / AerCap Global Aviation Trust
4.625%, due 10/30/20 (Netherlands) | | | 3,265,000 | | | | 3,436,413 | |
Air Lease Corp.
2.125%, due 1/15/20 | | | 1,950,000 | | | | 1,947,252 | |
International Lease Finance Corp.
5.875%, due 4/1/19 | | | 1,255,000 | | | | 1,348,723 | |
| | | | | | | | |
| | | | | | | 6,732,388 | |
| | | | | | | | |
Food 2.1% | | | | | |
J.M. Smucker Co. (The)
1.75%, due 3/15/18 | | | 3,500,000 | | | | 3,513,706 | |
Kerry Group Financial Services
3.20%, due 4/9/23 (Ireland) (c) | | | 2,899,000 | | | | 2,856,736 | |
Kraft Heinz Foods Co. | | | | | | | | |
3.00%, due 6/1/26 | | | 1,000,000 | | | | 988,756 | |
4.875%, due 2/15/25 (c) | | | 2,123,000 | | | | 2,332,551 | |
5.00%, due 6/4/42 | | | 1,600,000 | | | | 1,772,410 | |
Kroger Co. (The)
1.50%, due 9/30/19 | | | 2,555,000 | | | | 2,541,331 | |
Mondelez International Holdings Netherlands B.V. | | | | | | | | |
1.625%, due 10/28/19 (Netherlands) (c) | | | 2,790,000 | | | | 2,780,182 | |
2.00%, due 10/28/21 (Netherlands) (c) | | | 3,050,000 | | | | 3,019,744 | |
Pilgrim’s Pride Corp.
5.75%, due 3/15/25 (c) | | | 2,530,000 | | | | 2,586,925 | |
Smithfield Foods, Inc. | | | | | | | | |
6.625%, due 8/15/22 | | | 575,000 | | | | 605,906 | |
7.75%, due 7/1/17 | | | 925,000 | | | | 958,531 | |
Tyson Foods, Inc.
3.95%, due 8/15/24 | | | 4,235,000 | | | | 4,495,109 | |
Whole Foods Market, Inc.
5.20%, due 12/3/25 | | | 4,125,000 | | | | 4,441,239 | |
| | | | | | | | |
| | | | | | | 32,893,126 | |
| | | | | | | | |
Food Services 0.3% | | | | | | | | |
Aramark Services, Inc. | | | | | | | | |
4.75%, due 6/1/26 (c) | | | 2,535,000 | | | | 2,535,000 | |
5.125%, due 1/15/24 (c) | | | 1,465,000 | | | | 1,534,588 | |
5.75%, due 3/15/20 | | | 572,000 | | | | 588,445 | |
| | | | | | | | |
| | | | | | | 4,658,033 | |
| | | | | | | | |
Gas 0.1% | | | | | | | | |
AmeriGas Partners, L.P. / AmeriGas Finance Corp.
5.625%, due 5/20/24 | | | 1,140,000 | | | | 1,194,150 | |
| | | | | | | | |
| | | | | | |
The notes to the financial statements are an integral part of,
and should be read in conjunction with, the financial statements. | | | | | 15 | |
Portfolio of Investments October 31, 2016 (continued)
| | | | | | | | |
| | | Principal
Amount | | | Value | |
| Corporate Bonds (continued) | | | | | |
Hand & Machine Tools 0.2% | | | | | | | | |
Milacron LLC / Mcron Finance Corp.
7.75%, due 2/15/21 (c) | | $ | 2,950,000 | | | $ | 3,016,375 | |
| | | | | | | | |
| | |
Health Care—Products 1.4% | | | | | | | | |
Alere, Inc.
7.25%, due 7/1/18 | | | 2,600,000 | | | | 2,645,500 | |
Baxter International, Inc.
3.50%, due 8/15/46 | | | 4,330,000 | | | | 3,909,063 | |
Boston Scientific Corp.
2.85%, due 5/15/20 | | | 3,740,000 | | | | 3,841,066 | |
Hologic, Inc.
5.25%, due 7/15/22 (c) | | | 3,545,000 | | | | 3,749,192 | |
Mallinckrodt International Finance S.A. / Mallinckrodt CB LLC | | | | | | | | |
4.875%, due 4/15/20 (c) | | | 1,275,000 | | | | 1,279,781 | |
5.75%, due 8/1/22 (c) | | | 1,120,000 | | | | 1,061,200 | |
Stryker Corp.
2.625%, due 3/15/21 | | | 3,395,000 | | | | 3,459,047 | |
Thermo Fisher Scientific, Inc.
3.00%, due 4/15/23 | | | 1,425,000 | | | | 1,446,414 | |
| | | | | | | | |
| | | | | | | 21,391,263 | |
| | | | | | | | |
Health Care—Services 1.0% | | | | | |
CHS / Community Health Systems, Inc.
5.125%, due 8/1/21 | | | 1,835,000 | | | | 1,711,138 | |
Cigna Corp.
4.375%, due 12/15/20 | | | 270,000 | | | | 291,823 | |
DaVita, Inc.
5.00%, due 5/1/25 | | | 2,370,000 | | | | 2,287,050 | |
Fresenius Medical Care U.S. Finance II, Inc.
5.875%, due 1/31/22 (Germany) (c) | | | 1,985,000 | | | | 2,248,409 | |
HCA, Inc.
5.00%, due 3/15/24 | | | 3,750,000 | | | | 3,905,625 | |
Tenet Healthcare Corp. | | | | | | | | |
4.35%, due 6/15/20 (b) | | | 2,950,000 | | | | 2,972,125 | |
6.00%, due 10/1/20 | | | 2,750,000 | | | | 2,896,795 | |
| | | | | | | | |
| | | | | | | 16,312,965 | |
| | | | | | | | |
Home Builders 1.3% | | | | | |
Beazer Homes USA, Inc.
5.75%, due 6/15/19 | | | 885,000 | | | | 913,763 | |
CalAtlantic Group, Inc. | | | | | | | | |
5.875%, due 11/15/24 | | | 1,345,000 | | | | 1,435,787 | |
8.375%, due 5/15/18 | | | 2,000,000 | | | | 2,180,000 | |
KB Home
7.50%, due 9/15/22 | | | 1,660,000 | | | | 1,796,950 | |
Lennar Corp. | | | | | | | | |
4.50%, due 6/15/19 | | | 2,400,000 | | | | 2,514,000 | |
4.50%, due 11/15/19 | | | 750,000 | | | | 790,313 | |
| | | | | | | | |
| | | Principal
Amount | | | Value | |
Home Builders (continued) | | | | | |
MDC Holdings, Inc.
5.625%, due 2/1/20 | | $ | 2,750,000 | | | $ | 2,949,375 | |
Shea Homes, L.P. / Shea Homes Funding Corp.
5.875%, due 4/1/23 (c) | | | 2,435,000 | | | | 2,392,387 | |
Toll Brothers Finance Corp.
5.875%, due 2/15/22 | | | 1,340,000 | | | | 1,477,350 | |
TRI Pointe Group, Inc. / TRI Pointe Homes, Inc. | | | | | | | | |
4.375%, due 6/15/19 | | | 1,000,000 | | | | 1,022,500 | |
5.875%, due 6/15/24 | | | 2,935,000 | | | | 3,041,394 | |
| | | | | | | | |
| | | | | | | 20,513,819 | |
| | | | | | | | |
Household Products & Wares 0.3% | | | | | |
Spectrum Brands, Inc.
5.75%, due 7/15/25 | | | 4,394,000 | | | | 4,756,505 | |
| | | | | | | | |
| | |
Housewares 0.4% | | | | | | | | |
Newell Brands, Inc.
3.85%, due 4/1/23 | | | 5,750,000 | | | | 6,101,958 | |
| | | | | | | | |
| | |
Insurance 2.6% | | | | | | | | |
Allstate Corp. (The)
6.50%, due 5/15/57 (b) | | | 3,790,000 | | | | 4,453,250 | |
Berkshire Hathaway Finance Corp.
1.45%, due 3/7/18 | | | 3,515,000 | | | | 3,532,477 | |
Chubb Corp. (The)
6.375%, due 4/15/37 (b) | | | 1,660,000 | | | | 1,564,550 | |
Genworth Holdings, Inc.
4.90%, due 8/15/23 | | | 1,910,000 | | | | 1,566,200 | |
Hartford Financial Services Group, Inc. (The)
6.10%, due 10/1/41 | | | 760,000 | | | | 909,306 | |
Liberty Mutual Group, Inc. | | | | | | | | |
4.25%, due 6/15/23 (c) | | | 250,000 | | | | 270,048 | |
6.50%, due 3/15/35 (c) | | | 220,000 | | | | 269,236 | |
7.80%, due 3/15/37 (c) | | | 1,760,000 | | | | 2,068,000 | |
10.75%, due 6/15/58 (b)(c) | | | 750,000 | | | | 1,134,375 | |
Markel Corp.
5.00%, due 4/5/46 | | | 2,350,000 | | | | 2,488,845 | |
MassMutual Global Funding II | | | | | | | | |
2.10%, due 8/2/18 (c) | | | 1,200,000 | | | | 1,216,913 | |
2.50%, due 10/17/22 (c) | | | 3,347,000 | | | | 3,378,301 | |
Oil Insurance, Ltd.
3.82%, due 12/29/49 (b)(c) | | | 1,320,000 | | | | 1,049,400 | |
Pacific Life Insurance Co.
7.90%, due 12/30/23 (c) | | | 2,575,000 | | | | 3,167,240 | |
Protective Life Corp.
8.45%, due 10/15/39 | | | 1,640,000 | | | | 2,278,099 | |
Provident Cos., Inc.
7.25%, due 3/15/28 | | | 2,115,000 | | | | 2,609,967 | |
| | | | |
| 16 | | MainStay Income Builder Fund | | The notes to the financial statements are an integral part of,
and should be read in conjunction with, the financial statements. |
| | | | | | | | |
| | | Principal
Amount | | | Value | |
| Corporate Bonds (continued) | | | | | |
Insurance (continued) | | | | | | | | |
Prudential Financial, Inc.
5.625%, due 6/15/43 (b) | | $ | 1,760,000 | | | $ | 1,892,000 | |
Validus Holdings, Ltd.
8.875%, due 1/26/40 | | | 1,690,000 | | | | 2,303,215 | |
Voya Financial, Inc.
3.65%, due 6/15/26 | | | 690,000 | | | | 685,310 | |
XLIT, Ltd. | | | | | | | | |
4.45%, due 3/31/25 (Ireland) | | | 2,615,000 | | | | 2,657,507 | |
6.50%, due 10/29/49 (Ireland) (b) | | | 2,120,000 | | | | 1,625,775 | |
| | | | | | | | |
| | | | | | | 41,120,014 | |
| | | | | | | | |
Internet 0.5% | | | | | | | | |
eBay, Inc.
3.80%, due 3/9/22 | | | 3,840,000 | | | | 4,073,265 | |
Match Group, Inc.
6.375%, due 6/1/24 | | | 3,995,000 | | | | 4,314,600 | |
| | | | | | | | |
| | | | | | | 8,387,865 | |
| | | | | | | | |
Iron & Steel 0.3% | | | | | | | | |
ArcelorMittal | | | | | | | | |
7.25%, due 2/25/22 (Luxembourg) | | | 1,500,000 | | | | 1,702,500 | |
8.00%, due 10/15/39 (Luxembourg) | | | 2,300,000 | | | | 2,472,500 | |
Cliffs Natural Resources, Inc.
5.90%, due 3/15/20 | | | 1,085,000 | | | | 968,363 | |
| | | | | | | | |
| | | | | | | 5,143,363 | |
| | | | | | | | |
Lodging 1.5% | | | | | | | | |
Boyd Gaming Corp. | | | | | | | | |
6.375%, due 4/1/26 (c) | | | 1,465,000 | | | | 1,567,550 | |
6.875%, due 5/15/23 | | | 1,800,000 | | | | 1,926,000 | |
Choice Hotels International, Inc.
5.75%, due 7/1/22 | | | 3,260,000 | | | | 3,565,625 | |
Hilton Domestic Operating Co., Inc.
4.25%, due 9/1/24 (c) | | | 2,390,000 | | | | 2,395,975 | |
Marriott International, Inc.
2.30%, due 1/15/22 | | | 2,450,000 | | | | 2,450,701 | |
MGM Resorts International | | | | | | | | |
6.75%, due 10/1/20 | | | 4,600,000 | | | | 5,106,000 | |
8.625%, due 2/1/19 | | | 80,000 | | | | 89,750 | |
Starwood Hotels & Resorts Worldwide LLC | | | | | | | | |
6.75%, due 5/15/18 | | | 265,000 | | | | 285,364 | |
7.15%, due 12/1/19 | | | 1,900,000 | | | | 2,170,590 | |
Wynn Las Vegas LLC / Wynn Las Vegas Capital Corp. | | | | | | | | |
4.25%, due 5/30/23 (c) | | | 1,850,000 | | | | 1,785,250 | |
5.50%, due 3/1/25 (c) | | | 1,905,000 | | | | 1,909,763 | |
| | | | | | | | |
| | | | | | | 23,252,568 | |
| | | | | | | | |
Machinery—Construction & Mining 0.0%‡ | | | | | |
Terex Corp.
6.00%, due 5/15/21 | | | 205,000 | | | | 208,588 | |
| | | | | | | | |
| | | | | | | | |
| | | Principal
Amount | | | Value | |
Machinery—Diversified 0.5% | | | | | | | | |
CNH Industrial Capital LLC
4.875%, due 4/1/21 | | $ | 3,945,000 | | | $ | 4,092,937 | |
Zebra Technologies Corp.
7.25%, due 10/15/22 | | | 3,210,000 | | | | 3,458,775 | |
| | | | | | | | |
| | | | | | | 7,551,712 | |
| | | | | | | | |
Media 0.8% | | | | | | | | |
Clear Channel Worldwide Holdings, Inc.
Series B
6.50%, due 11/15/22 | | | 3,150,000 | | | | 3,208,275 | |
DISH DBS Corp.
5.875%, due 7/15/22 | | | 2,050,000 | | | | 2,116,625 | |
NBC Universal Media LLC
5.15%, due 4/30/20 | | | 160,000 | | | | 178,181 | |
Time Warner Entertainment Co., L.P.
8.375%, due 3/15/23 | | | 800,000 | | | | 1,033,745 | |
Time Warner, Inc. | | | | | | | | |
3.60%, due 7/15/25 | | | 2,500,000 | | | | 2,597,987 | |
7.70%, due 5/1/32 | | | 300,000 | | | | 414,442 | |
UPCB Finance IV, Ltd.
5.375%, due 1/15/25 (Netherlands) (c) | | | 2,050,000 | | | | 2,080,750 | |
| | | | | | | | |
| | | | | | | 11,630,005 | |
| | | | | | | | |
Mining 0.3% | | | | | | | | |
Aleris International, Inc.
7.875%, due 11/1/20 | | | 1,285,000 | | | | 1,285,000 | |
FMG Resources (August 2006) Pty, Ltd.
9.75%, due 3/1/22 (Australia) (c) | | | 3,185,000 | | | | 3,694,600 | |
| | | | | | | | |
| | | | | | | 4,979,600 | |
| | | | | | | | |
Miscellaneous—Manufacturing 0.5% | | | | | |
Amsted Industries, Inc.
5.00%, due 3/15/22 (c) | | | 3,785,000 | | | | 3,794,462 | |
Gates Global LLC / Gates Global Co.
6.00%, due 7/15/22 (c) | | | 1,100,000 | | | | 1,039,500 | |
Textron Financial Corp.
6.00%, due 2/15/67 (b)(c) | | | 3,540,000 | | | | 2,557,650 | |
| | | | | | | | |
| | | | | | | 7,391,612 | |
| | | | | | | | |
Oil & Gas 0.4% | | | | | | | | |
CITGO Petroleum Corp.
6.25%, due 8/15/22 (c) | | | 1,980,000 | | | | 2,024,550 | |
SM Energy Co.
5.00%, due 1/15/24 | | | 1,970,000 | | | | 1,832,100 | |
Sunoco, L.P. / Sunoco Finance Corp. | | | | | | | | |
5.50%, due 8/1/20 (France) | | | 2,000,000 | | | | 2,030,000 | |
6.375%, due 4/1/23 (France) | | | 400,000 | | | | 409,000 | |
| | | | | | | | |
| | | | | | | 6,295,650 | |
| | | | | | | | |
Packaging & Containers 1.3% | | | | | | | | |
Albea Beauty Holdings S.A.
8.375%, due 11/1/19 (France) (c) | | | 1,850,000 | | | | 1,924,000 | |
Ball Corp.
5.00%, due 3/15/22 | | | 3,700,000 | | | | 3,977,500 | |
| | | | | | |
The notes to the financial statements are an integral part of,
and should be read in conjunction with, the financial statements. | | | | | 17 | |
Portfolio of Investments October 31, 2016 (continued)
| | | | | | | | |
| | | Principal
Amount | | | Value | |
| Corporate Bonds (continued) | | | | | |
Packaging & Containers (continued) | | | | | |
Crown Americas LLC / Crown Americas Capital Corp. IV
4.50%, due 1/15/23 | | $ | 1,400,000 | | | $ | 1,435,000 | �� |
Crown European Holdings S.A.
4.00%, due 7/15/22 (France) (c) | | EUR | 2,150,000 | | | | 2,584,379 | |
Kloeckner Pentaplast of America, Inc.
7.125%, due 11/1/20 (c) | | | 1,045,000 | | | | 1,201,639 | |
Owens-Brockway Glass Container, Inc.
5.00%, due 1/15/22 (c) | | $ | 3,890,000 | | | | 4,069,912 | |
Reynolds Group Issuer, Inc. | | | | | | | | |
5.125%, due 7/15/23 (New Zealand) (c) | | | 845,000 | | | | 867,443 | |
5.75%, due 10/15/20 (New Zealand) | | | 2,000,000 | | | | 2,052,560 | |
9.875%, due 8/15/19 (New Zealand) | | | 230,000 | | | | 235,750 | |
Sealed Air Corp. | | | | | | | | |
4.875%, due 12/1/22 (c) | | | 475,000 | | | | 500,531 | |
5.50%, due 9/15/25 (c) | | | 1,900,000 | | | | 2,025,875 | |
| | | | | | | | |
| | | | | | | 20,874,589 | |
| | | | | | | | |
Pharmaceuticals 0.3% | | | | | | | | |
Actavis Funding SCS
3.45%, due 3/15/22 | | | 4,050,000 | | | | 4,204,714 | |
| | | | | | | | |
| | |
Pipelines 1.2% | | | | | | | | |
Columbia Pipeline Group, Inc.
3.30%, due 6/1/20 | | | 2,995,000 | | | | 3,092,805 | |
Crestwood Midstream Partners, L.P. / Crestwood Midstream Finance Corp.
6.25%, due 4/1/23 | | | 2,710,000 | | | | 2,743,875 | |
Hiland Partners Holdings LLC / Hiland Partners Finance Corp.
5.50%, due 5/15/22 (c) | | | 1,710,000 | | | | 1,773,381 | |
MPLX, L.P. | | | | | | | | |
4.875%, due 6/1/25 | | | 100,000 | | | | 104,315 | |
5.50%, due 2/15/23 | | | 1,975,000 | | | | 2,057,691 | |
Plains All American Pipeline, L.P. / PAA Finance Corp.
4.70%, due 6/15/44 | | | 1,520,000 | | | | 1,401,060 | |
Spectra Energy Partners, L.P.
4.75%, due 3/15/24 | | | 1,740,000 | | | | 1,901,453 | |
Targa Resources Partners, L.P. / Targa Resources Partners Finance Corp.
5.25%, due 5/1/23 | | | 2,120,000 | | | | 2,104,312 | |
Tesoro Logistics, L.P. / Tesoro Logistics Finance Corp. | | | | | | | | |
5.50%, due 10/15/19 | | | 1,845,000 | | | | 1,969,538 | |
5.875%, due 10/1/20 | | | 1,725,000 | | | | 1,768,125 | |
| | | | | | | | |
| | | | | | | 18,916,555 | |
| | | | | | | | |
| | | | | | | | |
| | | Principal
Amount | | | Value | |
Private Equity 0.2% | | | | | | | | |
Icahn Enterprises, L.P. / Icahn Enterprises Finance Corp. | | | | | | | | |
5.875%, due 2/1/22 | | $ | 1,195,000 | | | $ | 1,136,744 | |
6.00%, due 8/1/20 | | | 1,775,000 | | | | 1,743,937 | |
| | | | | | | | |
| | | | | | | 2,880,681 | |
| | | | | | | | |
Real Estate Investment Trusts 1.3% | | | | | | | | |
American Tower Corp.
3.375%, due 10/15/26 | | | 2,945,000 | | | | 2,930,749 | |
Corrections Corporation of America | | | | | | | | |
4.625%, due 5/1/23 | | | 810,000 | | | | 710,775 | |
5.00%, due 10/15/22 | | | 2,260,000 | | | | 2,039,650 | |
Crown Castle International Corp. | | | | | | | | |
3.40%, due 2/15/21 | | | 2,080,000 | | | | 2,161,397 | |
5.25%, due 1/15/23 | | | 3,510,000 | | | | 3,922,109 | |
Essex Portfolio, L.P.
3.375%, due 4/15/26 | | | 1,490,000 | | | | 1,506,229 | |
GEO Group, Inc. (The)
5.875%, due 1/15/22 | | | 4,000,000 | | | | 3,770,000 | |
Iron Mountain, Inc.
5.75%, due 8/15/24 | | | 3,300,000 | | | | 3,382,500 | |
¨Welltower, Inc.
4.70%, due 9/15/17 | | | 290,000 | | | | 298,084 | |
| | | | | | | | |
| | | | | | | 20,721,493 | |
| | | | | | | | |
Retail 2.4% | | | | | | | | |
AmeriGas Finance LLC / AmeriGas Finance Corp.
7.00%, due 5/20/22 | | | 1,400,000 | | | | 1,473,500 | |
Brinker International, Inc.
2.60%, due 5/15/18 | | | 1,885,000 | | | | 1,893,247 | |
CVS Health Corp.
4.00%, due 12/5/23 | | | 3,725,000 | | | | 4,035,088 | |
CVS Pass-Through Trust
5.789%, due 1/10/26 (c)(d) | | | 194,333 | | | | 218,434 | |
Dollar Tree, Inc.
5.75%, due 3/1/23 | | | 3,550,000 | | | | 3,780,750 | |
Macy’s Retail Holdings, Inc.
3.875%, due 1/15/22 | | | 1,085,000 | | | | 1,132,714 | |
QVC, Inc.
4.85%, due 4/1/24 | | | 4,800,000 | | | | 4,869,345 | |
Signet UK Finance PLC
4.70%, due 6/15/24 (United Kingdom) | | | 3,200,000 | | | | 3,106,656 | |
Starbucks Corp.
2.45%, due 6/15/26 | | | 2,220,000 | | | | 2,222,349 | |
Suburban Propane Partners, L.P. / Suburban Energy Finance Corp.
5.50%, due 6/1/24 | | | 2,465,000 | | | | 2,514,300 | |
Tiffany & Co.
3.80%, due 10/1/24 | | | 4,715,000 | | | | 4,882,114 | |
TJX Cos., Inc. (The)
2.25%, due 9/15/26 | | | 6,450,000 | | | | 6,203,403 | |
| | | | |
| 18 | | MainStay Income Builder Fund | | The notes to the financial statements are an integral part of,
and should be read in conjunction with, the financial statements. |
| | | | | | | | |
| | | Principal
Amount | | | Value | |
| Corporate Bonds (continued) | | | | | |
Retail (continued) | | | | | | | | |
Wal-Mart Stores, Inc.
6.75%, due 10/15/23 | | $ | 314,000 | | | $ | 402,862 | |
| | | | | | | | |
| | | | | | | 36,734,762 | |
| | | | | | | | |
Semiconductors 0.8% | | | | | |
NXP B.V. / NXP Funding LLC | | | | | | | | |
4.625%, due 6/15/22 (New Zealand) (c) | | | 1,610,000 | | | | 1,754,900 | |
4.625%, due 6/1/23 (New Zealand) (c) | | | 3,850,000 | | | | 4,215,750 | |
Qorvo, Inc.
7.00%, due 12/1/25 | | | 3,740,000 | | | | 4,095,300 | |
Sensata Technologies B.V.
5.00%, due 10/1/25 (c) | | | 2,990,000 | | | | 3,064,750 | |
| | | | | | | | |
| | | | | | | 13,130,700 | |
| | | | | | | | |
Software 0.7% | | | | | | | | |
First Data Corp. | | | | | | | | |
5.00%, due 1/15/24 (c) | | | 2,725,000 | | | | 2,765,875 | |
5.375%, due 8/15/23 (c) | | | 1,150,000 | | | | 1,190,250 | |
Microsoft Corp.
3.70%, due 8/8/46 | | | 2,060,000 | | | | 2,012,974 | |
MSCI, Inc.
5.75%, due 8/15/25 (c) | | | 3,610,000 | | | | 3,837,971 | |
PTC, Inc.
6.00%, due 5/15/24 | | | 1,415,000 | | | | 1,496,363 | |
| | | | | | | | |
| | | | | | | 11,303,433 | |
| | | | | | | | |
Telecommunications 2.0% | | | | | | | | |
¨AT&T, Inc.
3.60%, due 2/17/23 | | | 3,800,000 | | | | 3,912,355 | |
CenturyLink, Inc.
5.80%, due 3/15/22 | | | 4,000,000 | | | | 4,060,000 | |
CommScope Technologies Finance LLC
6.00%, due 6/15/25 (c) | | | 850,000 | | | | 892,500 | |
CommScope, Inc.
5.00%, due 6/15/21 (c) | | | 3,090,000 | | | | 3,159,525 | |
Hughes Satellite Systems Corp. | | | | | | | | |
5.25%, due 8/1/26 (c) | | | 670,000 | | | | 659,950 | |
6.50%, due 6/15/19 | | | 990,000 | | | | 1,080,337 | |
7.625%, due 6/15/21 | | | 460,000 | | | | 504,275 | |
Inmarsat Finance PLC
4.875%, due 5/15/22
(United Kingdom) (c) | | | 1,070,000 | | | | 1,009,117 | |
Sprint Spectrum Co. LLC / Sprint Spectrum Co. II LLC / Sprint Spectrum Co. III LLC
3.36%, due 9/20/21 (c) | | | 2,675,000 | | | | 2,681,687 | |
T-Mobile USA, Inc.
6.125%, due 1/15/22 | | | 3,515,000 | | | | 3,708,325 | |
Telecom Italia Capital S.A.
7.721%, due 6/4/38 (Italy) | | | 315,000 | | | | 347,288 | |
| | | | | | | | |
| | | Principal
Amount | | | Value | |
Telecommunications (continued) | | | | | | | | |
Telefonica Emisiones SAU | | | | | | | | |
4.57%, due 4/27/23 (Spain) | | $ | 2,552,000 | | | $ | 2,793,700 | |
5.462%, due 2/16/21 (Spain) | | | 395,000 | | | | 444,884 | |
¨Verizon Communications, Inc. | | | | | | | | |
4.862%, due 8/21/46 | | | 2,250,000 | | | | 2,383,148 | |
5.15%, due 9/15/23 | | | 2,325,000 | | | | 2,659,474 | |
5.85%, due 9/15/35 | | | 1,005,000 | | | | 1,194,866 | |
| | | | | | | | |
| | | | | | | 31,491,431 | |
| | | | | | | | |
Transportation 0.3% | | | | | | | | |
Hapag-Lloyd A.G.
9.75%, due 10/15/17 (Germany) (c) | | | 186,000 | | | | 185,070 | |
XPO Logistics, Inc.
6.50%, due 6/15/22 (c) | | | 3,950,000 | | | | 4,108,000 | |
| | | | | | | | |
| | | | | | | 4,293,070 | |
| | | | | | | | |
Total Corporate Bonds
(Cost $637,265,505) | | | | | | | 652,394,619 | |
| | | | | | | | |
| |
| Foreign Bond 0.1% | | | | | |
Banks 0.1% | | | | | | | | |
Barclays Bank PLC
Series Reg S
10.00%, due 5/21/21 (United Kingdom) | | | GBP1,186,000 | | | | 1,830,889 | |
| | | | | | | | |
Total Foreign Bond
(Cost $1,965,599) | | | | | | | 1,830,889 | |
| | | | | | | | |
| |
| Loan Assignments 5.7% (e) | | | | | |
Advertising 0.2% | | | | | | | | |
USAGM HoldCo. LLC | | | | | | | | |
2016 Incremental Delayed Draw Term Loan
5.50%, due 7/28/22 (f) | | $ | 229,753 | | | | 230,441 | |
2016 Incremental Term Loan
5.50%, due 7/28/22 | | | 2,279,438 | | | | 2,286,276 | |
| | | | | | | | |
| | | | | | | 2,516,717 | |
| | | | | | | | |
Auto Parts & Equipment 0.1% | |
Allison Transmission, Inc.
New Term Loan B3
3.25%, due 9/23/22 | | | 989,302 | | | | 996,227 | |
| | | | | | | | |
|
Building Materials 0.2% | |
Forterra, Inc.
Term Loan B
6.00%, due 10/18/23 | | | 2,950,000 | | | | 2,946,313 | |
| | | | | | | | |
|
Commercial Services 0.5% | |
ExamWorks Group, Inc.
Term Loan
4.75%, due 7/27/23 | | | 3,660,000 | | | | 3,674,871 | |
| | | | | | |
The notes to the financial statements are an integral part of,
and should be read in conjunction with, the financial statements. | | | | | 19 | |
Portfolio of Investments October 31, 2016 (continued)
| | | | | | | | |
| | | Principal
Amount | | | Value | |
| Loan Assignments (continued) | | | | | |
Commercial Services (continued) | |
U.S. Security Associates Holdings, Inc. 2016 Term Loan
6.00%, due 7/14/23 | | $ | 4,000,000 | | | $ | 4,011,668 | |
| | | | | | | | |
| | | | | | | 7,686,539 | |
| | | | | | | | |
Containers, Packaging & Glass 0.1% | |
Reynolds Group Holdings, Inc.
2016 USD Term Loan
TBD, due 2/5/23 (New Zealand) | | | 875,000 | | | | 876,691 | |
| | | | | | | | |
|
Electric 0.3% | |
Calpine Corp.
Term Loan B7
3.84%, due 5/31/23 | | | 4,987,500 | | | | 5,017,634 | |
| | | | | | | | |
|
Entertainment 0.1% | |
Scientific Games International, Inc.
2014 Term Loan B1
6.00%, due 10/18/20 | | | 2,431,250 | | | | 2,443,406 | |
| | | | | | | | |
|
Environmental Controls 0.2% | |
GFL Environmental, Inc.
USD Term Loan B
3.75%, due 9/23/23 | | | 3,500,000 | | | | 3,495,625 | |
| | | | | | | | |
|
Food & Staples Retailing 0.3% | |
U.S. Foods, Inc.
2016 Term Loan B
4.00%, due 6/27/23 | | | 5,301,713 | | | | 5,332,956 | |
| | | | | | | | |
|
Health Care—Products 0.1% | |
Ortho-Clinical Diagnostics, Inc.
Term Loan B
4.75%, due 6/30/21 | | | 2,292,238 | | | | 2,229,918 | |
| | | | | | | | |
|
Health Care—Services 0.7% | |
Inventiv Health, Inc.
2016 Term Loan B
TBD, due 9/28/23 | | | 4,480,000 | | | | 4,477,599 | |
MPH Acquisition Holdings LLC
2016 Term Loan B
5.00%, due 6/7/23 | | | 4,257,637 | | | | 4,305,535 | |
U.S. Renal Care, Inc.
2015 2nd Lien Term Loan
9.00%, due 12/31/23 | | | 1,700,000 | | | | 1,623,500 | |
| | | | | | | | |
| | | | | | | 10,406,634 | |
| | | | | | | | |
Household Products & Wares 0.8% | |
KIK Custom Products, Inc.
2015 Term Loan B
6.00%, due 8/26/22 | | | 9,900,000 | | | | 9,862,875 | |
| | | | | | | | |
| | | Principal
Amount | | | Value | |
Household Products & Wares (continued) | |
Prestige Brands, Inc.
Term Loan B3
3.50%, due 9/3/21 | | $ | 2,848,819 | | | $ | 2,858,613 | |
| | | | | | | | |
| | | | | | | 12,721,488 | |
| | | | | | | | |
Iron & Steel 0.5% | |
Signode Industrial Group U.S., Inc.
USD Term Loan B
3.75%, due 5/1/21 | | | 7,450,981 | | | | 7,418,383 | |
| | | | | | | | |
|
Media 0.1% | |
Virgin Media Investment Holdings, Ltd.
USD Term Loan F
3.50%, due 6/30/23 (United Kingdom) | | | 1,009,982 | | | | 1,013,348 | |
| | | | | | | | |
|
Packaging & Containers 0.5% | |
Berry Plastics Holding Corp.
Term Loan H
3.75%, due 10/1/22 | | | 7,713,271 | | | | 7,735,446 | |
| | | | | | | | |
|
Retail 0.2% | |
ADS Waste Holdings, Inc.
Term Loan B2
3.75%, due 10/9/19 | | | 3,575,000 | | | | 3,576,491 | |
| | | | | | | | |
|
Semiconductors 0.2% | |
Avago Technologies Cayman, Ltd.
USD Term Loan B3
3.53%, due 2/1/23 (Singapore) | | | 2,715,745 | | | | 2,742,902 | |
| | | | | | | | |
| | |
Telecommunications 0.6% | | | | | | | | |
Level 3 Financing, Inc.
2015 Term Loan B2
3.50%, due 5/31/22 | | | 10,000,000 | | | | 10,032,500 | |
| | | | | | | | |
Total Loan Assignments
(Cost $88,850,454) | | | | | | | 89,189,218 | |
| | | | | | | | |
| |
| Mortgage-Backed Securities 0.2% | | | | | |
Commercial Mortgage Loans
(Collateralized Mortgage Obligations) 0.1% | |
Banc of America Commercial Mortgage Trust
Series 2007-2, Class A4
5.80%, due 4/10/49 (g) | | | 220,056 | | | | 220,886 | |
Bayview Commercial Asset Trust
Series 2006-4A, Class A1
0.764%, due 12/25/36 (b)(c) | | | 155,917 | | | | 134,400 | |
| | | | |
| 20 | | MainStay Income Builder Fund | | The notes to the financial statements are an integral part of,
and should be read in conjunction with, the financial statements. |
| | | | | | | | |
| | | Principal
Amount | | | Value | |
| Mortgage-Backed Securities (continued) | | | | | |
Commercial Mortgage Loans
(Collateralized Mortgage Obligations) (continued) | |
Bear Stearns Commercial Mortgage Securities Trust
Series 2007-PW16, Class A4
5.717%, due 6/11/40 (g) | | $ | 268,256 | | | $ | 271,758 | |
Citigroup Commercial Mortgage Trust
Series 2008-C7, Class A4
6.129%, due 12/10/49 (g) | | | 164,205 | | | | 168,343 | |
Four Times Square Trust
Series 2006-4TS, Class A
5.401%, due 12/13/28 (c) | | | 860,000 | | | | 962,753 | |
Morgan Stanley Capital I Trust
Series 2007-IQ14, Class AAB
5.654%, due 4/15/49 (b) | | | 9,553 | | | | 9,545 | |
Wachovia Bank Commercial Mortgage Trust
Series 2006-C29, Class AM
5.339%, due 11/15/48 | | | 374,066 | | | | 373,936 | |
| | | | | | | | |
| | | | | | | 2,141,621 | |
| | | | | | | | |
Residential Mortgages (Collateralized Mortgage Obligations) 0.1% | |
Mortgage Equity Conversion Asset Trust
Series 2007-FF2, Class A
1.00%, due 2/25/42 (b)(c)(d)(h) | | | 496,915 | | | | 422,378 | |
WaMu Mortgage Pass-Through Certificates
Series 2006-AR14, Class 1A1
2.338%, due 11/25/36 (g) | | | 476,528 | | | | 422,331 | |
| | | | | | | | |
| | | | | | | 844,709 | |
| | | | | | | | |
Total Mortgage-Backed Securities
(Cost $2,803,716) | | | | 2,986,330 | |
| | | | | | | | |
|
| U.S. Government & Federal Agencies 1.8% | |
Federal Home Loan Mortgage Corporation
(Mortgage Pass-Through Securities) 0.0%‡ | |
6.50%, due 11/1/16 | | | 21 | | | | 20 | |
6.50%, due 2/1/27 | | | 69 | | | | 80 | |
6.50%, due 5/1/29 | | | 26,765 | | | | 30,663 | |
6.50%, due 6/1/29 | | | 8,284 | | | | 9,490 | |
6.50%, due 7/1/29 | | | 32,476 | | | | 37,204 | |
6.50%, due 8/1/29 | | | 9,355 | | | | 10,718 | |
6.50%, due 9/1/29 | | | 706 | | | | 809 | |
6.50%, due 6/1/32 | | | 2,810 | | | | 3,219 | |
6.50%, due 1/1/37 | | | 2,634 | | | | 3,166 | |
7.00%, due 9/1/26 | | | 5,277 | | | | 5,897 | |
7.00%, due 7/1/32 | | | 12,310 | | | | 14,215 | |
7.50%, due 5/1/32 | | | 4,777 | | | | 5,020 | |
| | | | | | | | |
| | | | | | | 120,501 | |
| | | | | | | | |
| | | | | | | | |
| | | Principal
Amount | | | Value | |
Federal National Mortgage Association
(Mortgage Pass-Through Securities) 0.0%‡ | |
4.50%, due 7/1/20 | | $ | 1,308 | | | $ | 1,345 | |
4.50%, due 3/1/21 | | | 2,407 | | | | 2,474 | |
6.00%, due 4/1/19 | | | 499 | | | | 571 | |
7.00%, due 10/1/37 | | | 687 | | | | 843 | |
7.00%, due 11/1/37 | | | 16,413 | | | | 18,340 | |
| | | | | | | | |
| | | | | | | 23,573 | |
| | | | | | | | |
Government National Mortgage Association
(Mortgage Pass-Through Securities) 0.0%‡ | |
5.00%, due 12/15/37 | | | 2,550 | | | | 2,833 | |
5.50%, due 9/15/35 | | | 6,790 | | | | 7,720 | |
6.50%, due 4/15/29 | | | 14 | | | | 16 | |
6.50%, due 8/15/29 | | | 12 | | | | 14 | |
6.50%, due 10/15/31 | | | 2,728 | | | | 3,248 | |
7.00%, due 12/15/25 | | | 3,497 | | | | 3,541 | |
7.00%, due 11/15/27 | | | 9,423 | | | | 10,464 | |
7.00%, due 12/15/27 | | | 48,255 | | | | 54,081 | |
7.00%, due 6/15/28 | | | 3,938 | | | | 4,049 | |
7.50%, due 6/15/26 | | | 368 | | | | 410 | |
7.50%, due 10/15/30 | | | 16,927 | | | | 17,732 | |
8.00%, due 10/15/26 | | | 4,243 | | | | 4,676 | |
8.50%, due 11/15/26 | | | 19,168 | | | | 19,505 | |
| | | | | | | | |
| | | | | | | 128,289 | |
| | | | | | | | |
United States Treasury Bond 0.4% | |
3.125%, due 11/15/41 | | | 5,340,000 | | | | 5,938,454 | |
| | | | | | | | |
|
¨United States Treasury Notes 1.4% | |
2.00%, due 8/15/25 | | | 15,530,000 | | | | 15,796,309 | |
2.25%, due 7/31/21 | | | 5,575,000 | | | | 5,809,105 | |
| | | | | | | | |
| | | | | | | 21,605,414 | |
| | | | | | | | |
Total U.S. Government & Federal Agencies
(Cost $28,086,491) | | | | 27,816,231 | |
| | | | | | | | |
Total Long-Term Bonds
(Cost $767,565,359) | | | | 781,257,912 | |
| | | | | | | | |
| | |
| | | | | | | | |
| | |
| | | Shares | | | | |
| Common Stocks 44.0% | |
Aerospace & Defense 0.9% | |
BAE Systems PLC (United Kingdom) | | | 1,225,280 | | | | 8,136,109 | |
Lockheed Martin Corp. | | | 25,600 | | | | 6,307,328 | |
| | | | | | | | |
| | | | | | | 14,443,437 | |
| | | | | | | | |
Agriculture 3.7% | |
Altria Group, Inc. | | | 178,433 | | | | 11,797,990 | |
British American Tobacco PLC (United Kingdom) | | | 169,930 | | | | 9,758,059 | |
Imperial Brands PLC (United Kingdom) | | | 220,165 | | | | 10,659,365 | |
| | | | | | |
The notes to the financial statements are an integral part of,
and should be read in conjunction with, the financial statements. | | | | | 21 | |
Portfolio of Investments October 31, 2016 (continued)
| | | | | | | | |
| | |
| | | Shares | | | Value | |
| Common Stocks (continued) | |
Agriculture (continued) | |
¨Philip Morris International, Inc. | | | 133,448 | | | $ | 12,869,725 | |
¨Reynolds American, Inc. | | | 228,942 | | | | 12,610,125 | |
| | | | | | | | |
| | | | | | | 57,695,264 | |
| | | | | | | | |
Auto Manufacturers 0.5% | |
Daimler A.G. Registered Shares (Germany) | | | 119,935 | | | | 8,545,965 | |
| | | | | | | | |
|
Auto Parts & Equipment 0.4% | |
Compagnie Generale des Etablissements Michelin (France) | | | 54,370 | | | | 5,886,700 | |
| | | | | | | | |
|
Banks 1.5% | |
Commonwealth Bank of Australia (Australia) | | | 84,960 | | | | 4,743,126 | |
Svenska Handelsbanken AB Class A (Sweden) | | | 495,640 | | | | 6,760,611 | |
Wells Fargo & Co. | | | 117,000 | | | | 5,383,170 | |
Westpac Banking Corp. (Australia) | | | 289,844 | | | | 6,718,156 | |
| | | | | | | | |
| | | | | | | 23,605,063 | |
| | | | | | | | |
Beverages 0.9% | |
Coca-Cola Co. (The) | | | 99,950 | | | | 4,237,880 | |
Diageo PLC (United Kingdom) | | | 193,750 | | | | 5,168,687 | |
PepsiCo., Inc. | | | 44,960 | | | | 4,819,712 | |
| | | | | | | | |
| | | | | | | 14,226,279 | |
| | | | | | | | |
Chemicals 1.3% | |
Agrium, Inc. (Canada) | | | 46,845 | | | | 4,301,308 | |
BASF S.E. (Germany) | | | 92,014 | | | | 8,110,974 | |
Dow Chemical Co. (The) | | | 162,255 | | | | 8,730,941 | |
| | | | | | | | |
| | | | | | | 21,143,223 | |
| | | | | | | | |
Commercial Services 0.3% | |
Automatic Data Processing, Inc. | | | 52,920 | | | | 4,607,215 | |
RR Donnelley & Sons Co. | | | 1 | | | | 18 | |
| | | | | | | | |
| | | | | | | 4,607,233 | |
| | | | | | | | |
Cosmetics & Personal Care 0.8% | |
Procter & Gamble Co. (The) | | | 67,595 | | | | 5,867,246 | |
Unilever PLC (United Kingdom) | | | 153,460 | | | | 6,420,205 | |
| | | | | | | | |
| | | | | | | 12,287,451 | |
| | | | | | | | |
Electric 5.4% | |
Ameren Corp. | | | 181,105 | | | | 9,046,195 | |
Dominion Resources, Inc. | | | 73,495 | | | | 5,526,824 | |
¨Duke Energy Corp. | | | 157,253 | | | | 12,583,385 | |
Entergy Corp. | | | 136,695 | | | | 10,071,688 | |
PPL Corp. | | | 363,640 | | | | 12,487,397 | |
Southern Co. (The) | | | 121,095 | | | | 6,244,869 | |
SSE PLC (United Kingdom) | | | 341,315 | | | | 6,646,717 | |
Terna Rete Elettrica Nazionale S.p.A. (Italy) | | | 2,201,570 | | | | 10,783,646 | |
WEC Energy Group, Inc. | | | 177,861 | | | | 10,621,859 | |
| | | | | | | | |
| | | | | | | 84,012,580 | |
| | | | | | | | |
| | | | | | | | |
| | |
| | | Shares | | | Value | |
Electrical Components & Equipment 0.3% | |
Emerson Electric Co. | | | 99,370 | | | $ | 5,036,072 | |
| | | | | | | | |
|
Engineering & Construction 0.3% | |
Vinci S.A. (France) | | | 72,335 | | | | 5,239,192 | |
| | | | | | | | |
|
Entertainment 0.4% | |
Regal Entertainment Group Class A | | | 266,950 | | | | 5,742,095 | |
| | | | | | | | |
|
Environmental Controls 0.4% | |
Waste Management, Inc. | | | 87,620 | | | | 5,753,129 | |
| | | | | | | | |
|
Finance—Other Services 0.6% | |
CME Group, Inc. | | | 60,540 | | | | 6,060,054 | |
Singapore Exchange, Ltd. (Singapore) | | | 773,686 | | | | 3,942,810 | |
| | | | | | | | |
| | | | | | | 10,002,864 | |
| | | | | | | | |
Food 0.7% | |
Nestle S.A. Registered (Switzerland) | | | 57,015 | | | | 4,134,027 | |
Orkla ASA (Norway) | | | 711,720 | | | | 6,723,238 | |
| | | | | | | | |
| | | | | | | 10,857,265 | |
| | | | | | | | |
Gas 1.4% | |
Gas Natural SDG S.A. (Spain) | | | 248,130 | | | | 4,896,116 | |
¨National Grid PLC (United Kingdom) | | | 978,060 | | | | 12,749,606 | |
Snam S.p.A. (Italy) | | | 928,050 | | | | 4,892,120 | |
| | | | | | | | |
| | | | | | | 22,537,842 | |
| | | | | | | | |
Health Care—Services 0.3% | |
Sonic Healthcare, Ltd. (Australia) | | | 271,320 | | | | 4,228,994 | |
| | | | | | | | |
|
Household Products & Wares 0.4% | |
Kimberly-Clark Corp. | | | 59,965 | | | | 6,860,596 | |
| | | | | | | | |
|
Insurance 2.1% | |
Allianz S.E. Registered (Germany) | | | 35,290 | | | | 5,501,024 | |
Arthur J. Gallagher & Co. | | | 83,790 | | | | 4,041,192 | |
AXA S.A. (France) | | | 299,550 | | | | 6,752,547 | |
Muenchener Rueckversicherungs-Gesellschaft A.G. Registered (Germany) | | | 62,620 | | | | 12,139,682 | |
SCOR S.E. (France) | | | 149,316 | | | | 4,833,755 | |
| | | | | | | | |
| | | | | | | 33,268,200 | |
| | | | | | | | |
Investment Management/Advisory Services 0.3% | |
BlackRock, Inc. | | | 13,225 | | | | 4,512,899 | |
| | | | | | | | |
|
Media 0.3% | |
ION Media Networks, Inc. (d)(h)(i)(j) | | | 12 | | | | 6,425 | |
Sky PLC (United Kingdom) | | | 458,016 | | | | 4,585,805 | |
| | | | | | | | |
| | | | | | | 4,592,230 | |
| | | | | | | | |
| | | | |
| 22 | | MainStay Income Builder Fund | | The notes to the financial statements are an integral part of,
and should be read in conjunction with, the financial statements. |
| | | | | | | | |
| | |
| | | Shares | | | Value | |
| Common Stocks (continued) | |
Miscellaneous—Manufacturing 1.0% | |
Eaton Corp. PLC | | | 87,885 | | | $ | 5,604,426 | |
Siemens A.G. Registered (Germany) | | | 83,209 | | | | 9,449,403 | |
| | | | | | | | |
| | | | | | | 15,053,829 | |
| | | | | | | | |
Oil & Gas 3.0% | |
Exxon Mobil Corp. | | | 106,990 | | | | 8,914,407 | |
Occidental Petroleum Corp. | | | 135,830 | | | | 9,903,365 | |
Royal Dutch Shell PLC Class A, Sponsored ADR (Netherlands) | | | 192,245 | | | | 9,575,723 | |
Statoil ASA (Norway) | | | 455,091 | | | | 7,457,845 | |
Total S.A. (France) | | | 219,588 | | | | 10,538,828 | |
| | | | | | | | |
| | | | | | | 46,390,168 | |
| | | | | | | | |
Pharmaceuticals 3.8% | |
AbbVie, Inc. | | | 126,705 | | | | 7,067,605 | |
AstraZeneca PLC, Sponsored ADR (United Kingdom) | | | 308,090 | | | | 8,725,109 | |
GlaxoSmithKline PLC (United Kingdom) | | | 507,120 | | | | 10,046,276 | |
Johnson & Johnson | | | 43,505 | | | | 5,046,145 | |
Merck & Co., Inc. | | | 96,709 | | | | 5,678,753 | |
Novartis A.G. Registered (Switzerland) | | | 67,605 | | | | 4,809,653 | |
Pfizer, Inc. | | | 134,320 | | | | 4,259,287 | |
Roche Holding A.G. (Switzerland) | | | 33,508 | | | | 7,703,572 | |
Sanofi (France) | | | 72,045 | | | | 5,612,043 | |
| | | | | | | | |
| | | | | | | 58,948,443 | |
| | | | | | | | |
Pipelines 0.4% | |
Enterprise Products Partners, L.P. | | | 273,990 | | | | 6,915,508 | |
| | | | | | | | |
|
Real Estate Investment Trusts 2.0% | |
Corrections Corporation of America | | | 84,197 | | | | 1,216,647 | |
Iron Mountain, Inc. | | | 226,350 | | | | 7,634,785 | |
Unibail-Rodamco S.E. (France) | | | 36,140 | | | | 8,608,975 | |
¨Welltower, Inc. | | | 193,010 | | | | 13,226,975 | |
| | | | | | | | |
| | | | | | | 30,687,382 | |
| | | | | | | | |
Retail 0.6% | |
McDonald’s Corp. | | | 77,042 | | | | 8,672,618 | |
| | | | | | | | |
|
Savings & Loans 0.3% | |
People’s United Financial, Inc. | | | 328,640 | | | | 5,337,114 | |
| | | | | | | | |
|
Semiconductors 2.1% | |
Microchip Technology, Inc. | | | 110,230 | | | | 6,674,426 | |
QUALCOMM, Inc. | | | 150,225 | | | | 10,323,462 | |
Taiwan Semiconductor Manufacturing Co., Ltd., Sponsored ADR (Taiwan) | | | 256,940 | | | | 7,990,834 | |
Texas Instruments, Inc. | | | 108,760 | | | | 7,705,646 | |
| | | | | | | | |
| | | | | | | 32,694,368 | |
| | | | | | | | |
Software 0.3% | |
Microsoft Corp. | | | 88,468 | | | | 5,301,003 | |
| | | | | | | | |
| | | | | | | | |
| | |
| | | Shares | | | Value | |
Telecommunications 6.4% | |
¨AT&T, Inc. | | | 330,412 | | | $ | 12,155,857 | |
¨BCE, Inc. (Canada) | | | 279,560 | | | | 12,701,399 | |
CenturyLink, Inc. | | | 169,136 | | | | 4,495,635 | |
Cisco Systems, Inc. | | | 195,800 | | | | 6,007,144 | |
Deutsche Telekom A.G. Registered (Germany) | | | 425,360 | | | | 6,931,710 | |
Rogers Communications, Inc. Class B (Canada) | | | 205,220 | | | | 8,255,924 | |
Singapore Telecommunications, Ltd. (Singapore) | | | 1,763,815 | | | | 4,920,239 | |
Swisscom A.G. Registered (Switzerland) | | | 19,713 | | | | 9,018,317 | |
Telstra Corp., Ltd. (Australia) | | | 2,160,680 | | | | 8,185,272 | |
TELUS Corp. (Canada) | | | 155,846 | | | | 5,046,143 | |
¨Verizon Communications, Inc. | | | 240,449 | | | | 11,565,597 | |
Vodafone Group PLC (United Kingdom) | | | 4,194,098 | | | | 11,540,285 | |
| | | | | | | | |
| | | | | | | 100,823,522 | |
| | | | | | | | |
Transportation 0.9% | |
Deutsche Post A.G. Registered (Germany) | | | 241,620 | | | | 7,487,681 | |
United Parcel Service, Inc. Class B | | | 54,100 | | | | 5,829,816 | |
| | | | | | | | |
| | | | 13,317,497 | |
| | | | | | | | |
Total Common Stocks
(Cost $658,655,328) | | | | 689,226,025 | |
| | | | | | | | |
| | |
| | | | | | | | |
| | | Principal
Amount | | | | |
| Short-Term Investment 5.4% | | | | | | | | |
Repurchase Agreement 5.4% | | | | | | | | |
Fixed Income Clearing Corp.
0.03%, dated 10/31/16
due 11/1/16
Proceeds at Maturity $84,291,956 (Collateralized by a United States Treasury Note with a rate of 1.75% and maturity date of 10/31/18, with a Principal Amount of $84,500,000 and a Market Value of $85,978,750) | | $ | 84,291,885 | | | | 84,291,885 | |
| | | | | | | | |
Total Short-Term Investment
(Cost $84,291,885) | | | | | | | 84,291,885 | |
| | | | | | | | |
Total Investments
(Cost $1,510,512,572) (k) | | | 99.2 | % | | | 1,554,775,822 | |
Other Assets, Less Liabilities | | | 0.8 | | | | 12,523,146 | |
Net Assets | | | 100.0 | % | | $ | 1,567,298,968 | |
| ‡ | Less than one-tenth of a percent. |
| (a) | Step coupon—Rate shown was the rate in effect as of October 31, 2016. |
| (b) | Floating rate—Rate shown was the rate in effect as of October 31, 2016. |
| | | | | | |
The notes to the financial statements are an integral part of,
and should be read in conjunction with, the financial statements. | | | | | 23 | |
Portfolio of Investments October 31, 2016 (continued)
| (c) | May be sold to institutional investors only under Rule 144A or securities offered pursuant to Section 4(a)(2) of the Securities Act of 1933, as amended. |
| (d) | Fair valued security—Represents fair value as measured in good faith under procedures approved by the Board of Trustees. As of October 31, 2016, the total market value of these securities was $647,237, which represented less than one-tenth of a percent of the Fund’s net assets. |
| (e) | Floating Rate Loan—generally pays interest at rates which are periodically re-determined at a margin above the London InterBank Offered Rate or other short-term rates. The rate shown was the weighted average interest rate of all contracts within the floating rate loan facility as of October 31, 2016. |
| (f) | Represents a security which has additional commitments and contingencies. Principal amount and value excludes unfunded commitments. |
| (g) | Collateral strip rate—A bond whose interest was based on the weighted net interest rate of the collateral. The coupon rate adjusts periodically |
| | based on a predetermined schedule. Rate shown was the rate in effect as of October 31, 2016. |
| (h) | Illiquid security—As of October 31, 2016, the total market value of these securities deemed illiquid under procedures approved by the Board of Trustees was $428,803, which represented less than one-tenth of a percent of the Fund’s net assets. (Unaudited) |
| (i) | Non-income producing security. |
| (k) | As of October 31, 2016, cost was $1,510,473,098 for federal income tax purposes and net unrealized appreciation was as follows: |
| | | | |
Gross unrealized appreciation | | $ | 86,370,722 | |
Gross unrealized depreciation | | | (42,067,998 | ) |
| | | | |
Net unrealized appreciation | | $ | 44,302,724 | |
| | | | |
| | | | | | | | | | | | | | | | | | | | | | |
Foreign Currency Buy Contracts | | Expiration
Date | | | Counterparty | | Contract
Amount
Purchased | | | Contract
Amount
Sold | | | Unrealized
Appreciation
(Depreciation) | |
Canadian Dollar vs. U.S. Dollar | | | 11/1/16 | | | JPMorgan Chase Bank | | | CAD | | | | 19,524,000 | | | $ | 14,833,503 | | | $ | (277,475 | ) |
Euro vs. U.S. Dollar | | | 11/1/16 | | | JPMorgan Chase Bank | | | EUR | | | | 80,236,000 | | | | 87,920,787 | | | | 158,304 | |
Pound Sterling vs. U.S. Dollar | | | 11/1/16 | | | JPMorgan Chase Bank | | | GBP | | | | 36,549,000 | | | | 44,722,672 | | | | 13,329 | |
| | | | | | |
| | | | | | | | | | | | | | | | | | | | | | |
Foreign Currency Sales Contracts | | | | | | | Contract
Amount
Sold | | | Contract
Amount
Purchased | | | | |
Canadian Dollar vs. U.S. Dollar | | | 2/1/17 | | | JPMorgan Chase Bank | | | CAD | | | | 17,225,000 | | | | 13,062,117 | | | | 210,036 | |
Canadian Dollar vs. U.S. Dollar | | | 11/1/16 | | | JPMorgan Chase Bank | | | | | | | 19,524,000 | | | | 14,969,064 | | | | 413,036 | |
Euro vs. U.S. Dollar | | | 11/1/16 | | | JPMorgan Chase Bank | | | EUR | | | | 80,236,000 | | | | 88,826,001 | | | | 746,911 | |
Euro vs. U.S. Dollar | | | 2/1/17 | | | JPMorgan Chase Bank | | | | | | | 80,168,000 | | | | 88,176,543 | | | | (203,082 | ) |
Pound Sterling vs. U.S. Dollar | | | 11/1/16 | | | JPMorgan Chase Bank | | | GBP | | | | 36,549,000 | | | | 48,313,916 | | | | 3,577,915 | |
Pound Sterling vs. U.S. Dollar | | | 2/1/17 | | | JPMorgan Chase Bank | | | | | | | 36,947,000 | | | | 45,290,889 | | | | (28,585 | ) |
Net unrealized appreciation (depreciation) on foreign currency forward contracts | | | | | | | | | | | $ | 4,610,389 | |
As of October 31, 2016, the Fund held the following futures contracts1:
| | | | | | | | | | | | | | | | |
Type | | Number of
Contracts
Long
(Short) | | | Expiration
Date | | | Notional
Amount | | | Unrealized
Appreciation
(Depreciation)2 | |
| 2-Year United States Treasury Note | | | 239 | | | | December 2016 | | | $ | 52,135,610 | | | $ | (34,125 | ) |
| 10-Year United States Treasury Note | | | (672 | ) | | | December 2016 | | | | (87,108,000 | ) | | | 1,148,231 | |
| Euro Stoxx 50 | | | 1,965 | | | | December 2016 | | | | 65,855,630 | | | | (146,164 | ) |
| Nikkei 225 | | | 595 | | | | December 2016 | | | | 49,346,930 | | | | 1,118,557 | |
| Standard & Poor’s 500 Index Mini | | | 1,480 | | | | December 2016 | | | | 156,887,400 | | | | (3,758,682 | ) |
| United States Treasury Bond | | | 507 | | | | December 2016 | | | | 82,498,406 | | | | (4,046,296 | ) |
| | | | | | | | | | | | | | | | |
| | | $ | 319,615,976 | | | $ | (5,718,479 | ) |
| | | | | | | | | | | | | | | | |
| 1. | As of October 31, 2016, cash in the amount of $16,030,548 was on deposit with brokers for futures transactions. |
| 2. | Represents the difference between the value of the contracts at the time they were opened and the value as of October 31, 2016. |
| | | | |
| 24 | | MainStay Income Builder Fund | | The notes to the financial statements are an integral part of,
and should be read in conjunction with, the financial statements. |
The following abbreviations are used in the preceding pages:
ADR—American Depositary Receipt
CAD—Canadian Dollar
EUR—Euro
GBP—British Pound Sterling
TBD—To Be Determined
The following is a summary of the fair valuations according to the inputs used as of October 31, 2016, for valuing the Fund’s assets and liabilities.
Asset Valuation Inputs
| | | | | | | | | | | | | | | | |
Description | | Quoted
Prices in
Active
Markets for
Identical
Assets (Level 1) | | | Significant
Other
Observable
Inputs (Level 2) | | | Significant
Unobservable
Inputs (Level 3) | | | Total | |
| Investments in Securities (a) | | | | | | | | | | | | | | | | |
| Long-Term Bonds | | | | | | | | | | | | | | | | |
Asset-Backed Securities | | $ | — | | | $ | 6,559,450 | | | $ | — | | | $ | 6,559,450 | |
Convertible Bond | | | — | | | | 481,175 | | | | — | | | | 481,175 | |
Corporate Bonds | | | — | | | | 652,394,619 | | | | — | | | | 652,394,619 | |
Foreign Bond | | | — | | | | 1,830,889 | | | | — | | | | 1,830,889 | |
Loan Assignments (b) | | | — | | | | 87,565,718 | | | | 1,623,500 | | | | 89,189,218 | |
Mortgage-Backed Securities (c) | | | — | | | | 2,563,952 | | | | 422,378 | | | | 2,986,330 | |
U.S. Government & Federal Agencies | | | — | | | | 27,816,231 | | | | — | | | | 27,816,231 | |
| | | | | | | | | | | | | | | | |
| Total Long-Term Bonds | | | — | | | | 779,212,034 | | | | 2,045,878 | | | | 781,257,912 | |
| | | | | | | | | | | | | | | | |
| Common Stocks (d) | | | 689,219,600 | | | | — | | | | 6,425 | | | | 689,226,025 | |
| Short-Term Investment | | | | | | | | | | | | | | | | |
Repurchase Agreement | | | — | | | | 84,291,885 | | | | — | | | | 84,291,885 | |
| | | | | | | | | | | | | | | | |
| Total Investments in Securities | | | 689,219,600 | | | | 863,503,919 | | | | 2,052,303 | | | | 1,554,775,822 | |
| | | | | | | | | | | | | | | | |
| Other Financial Instruments | | | | | | | | | | | | | | | | |
Foreign Currency Forward Contracts (e) | | | — | | | | 5,119,531 | | | | — | | | | 5,119,531 | |
Futures Contracts (e) | | | 2,266,788 | | | | — | | | | — | | | | 2,266,788 | |
| | | | | | | | | | | | | | | | |
| Total Other Financial Instruments | | | 2,266,788 | | | | 5,119,531 | | | | — | | | | 7,386,319 | |
| | | | | | | | | | | | | | | | |
| Total Investments in Securities and Other Financial Instruments | | $ | 691,486,388 | | | $ | 868,623,450 | | | $ | 2,052,303 | | | $ | 1,562,162,141 | |
| | | | | | | | | | | | | | | | |
Liability Valuation Inputs
| | | | | | | | | | | | | | | | |
Description | | Quoted
Prices in
Active
Markets for
Identical
Assets (Level 1) | | | Significant
Other
Observable
Inputs (Level 2) | | | Significant
Unobservable
Inputs (Level 3) | | | Total | |
| Other Financial Instruments | | | | | | | | | | | | | | | | |
Foreign Currency Forward Contracts (e) | | $ | — | | | $ | (509,142 | ) | | $ | — | | | $ | (509,142 | ) |
Futures Contracts (e) | | | (7,985,267 | ) | | | — | | | | — | | | | (7,985,267 | ) |
| | | | | | | | | | | | | | | | |
| Total Other Financial Instruments | | $ | (7,985,267 | ) | | $ | (509,142 | ) | | $ | — | | | $ | (8,494,409 | ) |
| | | | | | | | | | | | | | | | |
| (a) | For a complete listing of investments and their industries, see the Portfolio of Investments. |
| (b) | The Level 3 security valued at $1,623,500 is held in Health Care—Services within the Loan Assignments section of the Portfolio of Investments. |
| (c) | The Level 3 security valued at $422,378 is held in Residential Mortgage (Collateralized Mortgage Obligation) within the Mortgage-Backed Securities section of the Portfolio of Investments. |
| (d) | The Level 3 security valued at $6,425 is held in Media within the Common Stocks section of the Portfolio of Investments. |
| (e) | The value listed for these securities reflects unrealized appreciation (depreciation) as shown on the Portfolio of Investments. |
| | | | | | |
The notes to the financial statements are an integral part of,
and should be read in conjunction with, the financial statements. | | | | | 25 | |
Portfolio of Investments October 31, 2016 (continued)
The Fund recognizes transfers between the levels as of the beginning of the period.
For the year ended October 31, 2016, the Fund did not have any transfers between Level 1 and Level 2 fair value measurements. (See Note 2)
The following is a reconciliation of investments in which significant unobservable inputs (Level 3) were used in determining value:
| | | | | | | | | | | | | | | | | | | | | | | | | | | | | | | | | | | | | | | | |
Investments in Securities | | Balance
as of
October 31,
2015 | | | Accrued
Discounts
(Premiums) | | | Realized
Gain
(Loss) | | | Change in
Unrealized
Appreciation
(Depreciation) | | | Purchases | | | Sales (a) | | | Transfers
in to
Level 3 | | | Transfers
out of
Level 3 | | | Balance
as of
October 31,
2016 | | | Change in
Unrealized
Appreciation
(Depreciation)
from
Investments
Still Held at
October 31,
2016 (b) | |
| Long-Term Bonds | | | | | | | | | | | | | | | | | | | | | | | | | | | | | | | | | | | | | | | | |
Loan Assignments | | | | | | | | | | | | | | | | | | | | | | | | | | | | | | | | | | | | | | | | |
Health Care—Services | | $ | — | | | $ | 3,508 | | | $ | — | | | $ | (46,008 | ) | | $ | 1,666,000 | | | $ | — | | | $ | — | | | $ | — | | | $ | 1,623,500 | | | $ | (46,008 | ) |
Mortgage-Backed Securities | | | | | | | | | | | | | | | | | | | | | | | | | | | | | | | | | | | | | | | | |
Residential Mortgages (Collateralized Mortgage Obligations) | | | 431,121 | | | | — | | | | — | | | | 19,993 | | | | — | | | | (28,736 | ) | | | — | | | | — | | | | 422,378 | | | | 24,846 | |
| Common Stocks | | | | | | | | | | | | | | | | | | | | | | | | | | | | | | | | | | | | | | | | |
Media | | | 5,215 | | | | — | | | | — | | | | 1,210 | | | | — | | | | | | | | — | | | | — | | | | 6,425 | | | | 1,210 | |
| | | | | | | | | | | | | | | | | | | | | | | | | | | | | | | | | | | | | | | | |
| Total | | $ | 436,336 | | | $ | 3,508 | | | $ | — | | | $ | (24,805 | ) | | $ | 1,666,000 | | | $ | (28,736 | ) | | $ | — | | | $ | — | | | $ | 2,052,303 | | | $ | (19,952 | ) |
| | | | | | | | | | | | | | | | | | | | | | | | | | | | | | | | | | | | | | | | |
| (a) | Sales include principal reductions. |
| (b) | Included in “Net change in unrealized appreciation (depreciation) on investments” in the Statement of Operations. |
| | | | |
| 26 | | MainStay Income Builder Fund | | The notes to the financial statements are an integral part of,
and should be read in conjunction with, the financial statements. |
Statement of Assets and Liabilities as of October 31, 2016
| | | | |
| Assets | |
Investment in securities, at value
(identified cost $1,510,512,572) | | $ | 1,554,775,822 | |
Cash collateral on deposit at broker | | | 16,030,548 | |
Cash denominated in foreign currencies
(identified cost $2,899,755) | | | 2,559,656 | |
Unrealized appreciation on unfunded commitments (See Note 6) | | | 668 | |
Receivables: | | | | |
Investment securities sold | | | 11,485,588 | |
Dividends and interest | | | 10,141,061 | |
Fund shares sold | | | 2,734,984 | |
Other assets | | | 57,913 | |
Unrealized appreciation on foreign currency forward contracts | | | 5,119,531 | |
| | | | |
Total assets | | | 1,602,905,771 | |
| | | | |
| |
| Liabilities | | | | |
Due to custodian | | | 4,417,361 | |
Payables: | | | | |
Investment securities purchased | | | 26,433,854 | |
Fund shares redeemed | | | 2,096,651 | |
Manager (See Note 3) | | | 839,891 | |
NYLIFE Distributors (See Note 3) | | | 406,100 | |
Transfer agent (See Note 3) | | | 368,768 | |
Variation margin on futures contracts | | | 365,288 | |
Shareholder communication | | | 73,749 | |
Custodian | | | 46,106 | |
Professional fees | | | 29,624 | |
Trustees | | | 4,488 | |
Accrued expenses | | | 15,781 | |
Unrealized depreciation on foreign currency forward contracts | | | 509,142 | |
| | | | |
Total liabilities | | | 35,606,803 | |
| | | | |
Net assets | | $ | 1,567,298,968 | |
| | | | |
| |
| Composition of Net Assets | | | | |
Shares of beneficial interest outstanding (par value of $.01 per share) unlimited number of shares authorized | | $ | 853,127 | |
Additional paid-in capital | | | 1,562,858,706 | |
| | | | |
| | | 1,563,711,833 | |
Undistributed net investment income | | | 8,674,281 | |
Accumulated net realized gain (loss) on investments, futures transactions and foreign currency transactions | | | (47,764,977 | ) |
Net unrealized appreciation (depreciation) on investments and futures contracts | | | 38,544,771 | |
Net unrealized appreciation (depreciation) on translation of other assets and liabilities in foreign currencies and foreign currency forward contracts | | | 4,132,392 | |
Net unrealized appreciation (depreciation) on unfunded commitments | | | 668 | |
| | | | |
Net assets | | $ | 1,567,298,968 | |
| | | | |
| | | | |
Class A | | | | |
Net assets applicable to outstanding shares | | $ | 574,389,669 | |
| | | | |
Shares of beneficial interest outstanding | | | 31,385,168 | |
| | | | |
Net asset value per share outstanding | | $ | 18.30 | |
Maximum sales charge (5.50% of offering price) | | | 1.07 | |
| | | | |
Maximum offering price per share outstanding | | $ | 19.37 | |
| | | | |
Investor Class | | | | |
Net assets applicable to outstanding shares | | $ | 153,136,812 | |
| | | | |
Shares of beneficial interest outstanding | | | 8,363,747 | |
| | | | |
Net asset value per share outstanding | | $ | 18.31 | |
Maximum sales charge (5.50% of offering price) | | | 1.07 | |
| | | | |
Maximum offering price per share outstanding | | $ | 19.38 | |
| | | | |
Class B | | | | |
Net assets applicable to outstanding shares | | $ | 42,252,752 | |
| | | | |
Shares of beneficial interest outstanding | | | 2,295,737 | |
| | | | |
Net asset value and offering price per share outstanding | | $ | 18.40 | |
| | | | |
Class C | | | | |
Net assets applicable to outstanding shares | | $ | 254,311,712 | |
| | | | |
Shares of beneficial interest outstanding | | | 13,842,683 | |
| | | | |
Net asset value and offering price per share outstanding | | $ | 18.37 | |
| | | | |
Class I | | | | |
Net assets applicable to outstanding shares | | $ | 542,330,439 | |
| | | | |
Shares of beneficial interest outstanding | | | 29,377,362 | |
| | | | |
Net asset value and offering price per share outstanding | | $ | 18.46 | |
| | | | |
Class R2 | | | | |
Net assets applicable to outstanding shares | | $ | 838,168 | |
| | | | |
Shares of beneficial interest outstanding | | | 45,829 | |
| | | | |
Net asset value and offering price per share outstanding | | $ | 18.29 | |
| | | | |
Class R3 | | | | |
Net assets applicable to outstanding shares | | $ | 39,416 | |
| | | | |
Shares of beneficial interest outstanding | | | 2,154 | |
| | | | |
Net asset value and offering price per share outstanding | | $ | 18.30 | |
| | | | |
| | | | | | |
The notes to the financial statements are an integral part of,
and should be read in conjunction with, the financial statements. | | | | | 27 | |
Statement of Operations for the year ended October 31, 2016
| | | | |
| Investment Income (Loss) | |
Income | | | | |
Interest | | $ | 36,019,635 | |
Dividends (a) | | | 27,826,419 | |
| | | | |
Total income | | | 63,846,054 | |
| | | | |
Expenses | | | | |
Manager (See Note 3) | | | 9,309,748 | |
Distribution/Service—Class A (See Note 3) | | | 1,398,774 | |
Distribution/Service—Investor Class (See Note 3) | | | 387,179 | |
Distribution/Service—Class B (See Note 3) | | | 416,823 | |
Distribution/Service—Class C (See Note 3) | | | 2,357,212 | |
Distribution/Service—Class R2 (See Note 3) | | | 766 | |
Distribution/Service—Class R3 (See Note 3) | | | 119 | |
Transfer agent (See Note 3) | | | 2,130,597 | |
Shareholder communication | | | 190,529 | |
Registration | | | 154,678 | |
Professional fees | | | 153,703 | |
Custodian | | | 118,596 | |
Trustees | | | 39,692 | |
Shareholder service (See Note 3) | | | 330 | |
Miscellaneous | | | 77,967 | |
| | | | |
Total expenses | | | 16,736,713 | |
Reimbursement from custodian (b) | | | (36,547 | ) |
| | | | |
Net expenses | | | 16,700,166 | |
| | | | |
Net investment income (loss) | | | 47,145,888 | |
| | | | |
|
| Realized and Unrealized Gain (Loss) on Investments, Futures Contracts and Foreign Currency Transactions | |
Net realized gain (loss) on: | | | | |
Investment transactions | | | (60,633,981 | ) |
Futures transactions | | | 25,919,211 | |
Foreign currency transactions | | | 11,720,991 | |
| | | | |
Net realized gain (loss) on investments, futures transactions and foreign currency transactions | | | (22,993,779 | ) |
| | | | |
Net change in unrealized appreciation (depreciation) on: | | | | |
Investments and unfunded commitments | | | 51,243,410 | |
Futures contracts | | | (24,740,146 | ) |
Translation of other assets and liabilities in foreign currencies and foreign currency forward contracts | | | 2,608,206 | |
| | | | |
Net change in unrealized appreciation (depreciation) on investments, unfunded commitments, futures contracts and foreign currency transactions | | | 29,111,470 | |
| | | | |
Net realized and unrealized gain (loss) on investments, unfunded commitments, futures transactions and foreign currency transactions | | | 6,117,691 | |
| | | | |
Net increase (decrease) in net assets resulting from operations | | $ | 53,263,579 | |
| | | | |
| (a) | Dividends recorded net of foreign withholding taxes in the amount of $1,532,507. |
| (b) | Reimbursement from custodian represents a refund for overbilling of prior years’ custody out-of-pocket fees. |
| | | | |
| 28 | | MainStay Income Builder Fund | | The notes to the financial statements are an integral part of,
and should be read in conjunction with, the financial statements. |
Statements of Changes in Net Assets
for the years ended October 31, 2016 and October 31, 2015
| | | | | | | | |
| | | 2016 | | | 2015 | |
| Increase (Decrease) in Net Assets | |
Operations: | | | | | | | | |
Net investment income (loss) | | $ | 47,145,888 | | | $ | 50,533,559 | |
Net realized gain (loss) on investments, futures transactions and foreign currency transactions | | | (22,993,779 | ) | | | 36,547,082 | |
Net change in unrealized appreciation (depreciation) on investments, unfunded commitments, futures contracts and foreign currency transactions | | | 29,111,470 | | | | (106,496,141 | ) |
| | | | |
Net increase (decrease) in net assets resulting from operations | | | 53,263,579 | | | | (19,415,500 | ) |
| | | | |
Dividends and distributions to shareholders: | | | | | | | | |
From net investment income: | | | | | |
Class A | | | (18,845,332 | ) | | | (20,260,907 | ) |
Investor Class | | | (4,941,822 | ) | | | (5,497,054 | ) |
Class B | | | (1,008,072 | ) | | | (1,264,373 | ) |
Class C | | | (5,780,002 | ) | | | (5,462,078 | ) |
Class I | | | (18,612,750 | ) | | | (18,919,025 | ) |
Class R2 | | | (9,899 | ) | | | (1,946 | ) |
Class R3 | | | (767 | ) | | | — | |
| | | | |
| | | (49,198,644 | ) | | | (51,405,383 | ) |
| | | | |
From net realized gain on investments: | | | | | |
Class A | | | (18,546,003 | ) | | | (21,407,906 | ) |
Investor Class | | | (4,978,803 | ) | | | (6,933,839 | ) |
Class B | | | (1,339,617 | ) | | | (2,085,743 | ) |
Class C | | | (7,349,774 | ) | | | (6,203,537 | ) |
Class I | | | (15,949,233 | ) | | | (18,852,587 | ) |
Class R2 | | | (6,680 | ) | | | — | |
| | | | |
| | | (48,170,110 | ) | | | (55,483,612 | ) |
| | | | |
Total dividends and distributions to shareholders | | | (97,368,754 | ) | | | (106,888,995 | ) |
| | | | |
Capital share transactions: | | | | | | | | |
Net proceeds from sale of shares | | | 482,452,593 | | | | 665,174,116 | |
Net asset value of shares issued to shareholders in reinvestment of dividends and distributions | | | 88,232,030 | | | | 97,104,538 | |
Cost of shares redeemed | | | (495,069,609 | ) | | | (373,579,040 | ) |
| | | | |
Increase (decrease) in net assets derived from capital share transactions | | | 75,615,014 | | | | 388,699,614 | |
| | | | |
Net increase (decrease) in net assets | | | 31,509,839 | | | | 262,395,119 | |
|
| Net Assets | |
Beginning of year | | | 1,535,789,129 | | | | 1,273,394,010 | |
| | | | |
End of year | | $ | 1,567,298,968 | | | $ | 1,535,789,129 | |
| | | | |
Undistributed net investment income at end of year | | $ | 8,674,281 | | | $ | 4,797,693 | |
| | | | |
| | | | | | |
The notes to the financial statements are an integral part of,
and should be read in conjunction with, the financial statements. | | | | | 29 | |
Financial Highlights selected per share data and ratios
| | | | | | | | | | | | | | | | | | | | |
| | | Year ended October 31, | |
| Class A | | 2016 | | | 2015 | | | 2014 | | | 2013 | | | 2012 | |
Net asset value at beginning of year | | $ | 18.79 | | | $ | 20.51 | | | $ | 19.83 | | | $ | 17.46 | | | $ | 15.92 | |
| | | | | | | | | | | | | | | | | | | | |
Net investment income (loss) (a) | | | 0.58 | | | | 0.68 | | | | 0.82 | | | | 0.69 | | | | 0.67 | |
Net realized and unrealized gain (loss) on investments | | | (0.17 | ) | | | (0.98 | ) | | | 0.96 | | | | 2.43 | | | | 1.40 | |
Net realized and unrealized gain (loss) on foreign currency transactions | | | 0.30 | | | | 0.15 | | | | 0.14 | | | | (0.06 | ) | | | 0.14 | |
| | | | | | | | | | | | | | | | | | | | |
Total from investment operations | | | 0.71 | | | | (0.15 | ) | | | 1.92 | | | | 3.06 | | | | 2.21 | |
| | | | | | | | | | | | | | | | | | | | |
| Less dividends and distributions: | | | | | | | | | | | | | | | | | | | | |
From net investment income | | | (0.61 | ) | | | (0.70 | ) | | | (0.72 | ) | | | (0.69 | ) | | | (0.67 | ) |
From net realized gain on investments | | | (0.59 | ) | | | (0.87 | ) | | | (0.52 | ) | | | — | | | | — | |
| | | | | | | | | | | | | | | | | | | | |
Total dividends and distributions | | | (1.20 | ) | | | (1.57 | ) | | | (1.24 | ) | | | (0.69 | ) | | | (0.67 | ) |
| | | | | | | | | | | | | | | | | | | | |
Net asset value at end of year | | $ | 18.30 | | | $ | 18.79 | | | $ | 20.51 | | | $ | 19.83 | | | $ | 17.46 | |
| | | | | | | | | | | | | | | | | | | | |
Total investment return (b) | | | 4.08 | % | | | (0.81 | %) | | | 10.08 | % | | | 17.90 | % | | | 14.16 | % |
| Ratios (to average net assets)/Supplemental Data: | | | | | | | | | | | | | | | | | | | | |
Net investment income (loss) | | | 3.21 | % | | | 3.49 | % | | | 4.06 | % | | | 3.71 | % | | | 4.03 | % |
Net expenses | | | 1.02 | % | | | 1.02 | % | | | 1.01 | % | | | 1.04 | % | | | 1.06 | % |
Portfolio turnover rate | | | 27 | % | | | 30 | % | | | 15 | % | | | 31 | % | | | 25 | % |
Net assets at end of year (in 000’s) | | $ | 574,390 | | | $ | 581,920 | | | $ | 497,591 | | | $ | 397,101 | | | $ | 292,603 | |
| (a) | Per share data based on average shares outstanding during the year. |
| (b) | Total investment return is calculated exclusive of sales charges and assumes the reinvestment of dividends and distributions. |
| | | | | | | | | | | | | | | | | | | | |
| | | Year ended October 31, | |
| Investor Class | | 2016 | | | 2015 | | | 2014 | | | 2013 | | | 2012 | |
Net asset value at beginning of year | | $ | 18.80 | | | $ | 20.52 | | | $ | 19.84 | | | $ | 17.46 | | | $ | 15.93 | |
| | | | | | | | | | | | | | | | | | | | |
Net investment income (loss) (a) | | | 0.56 | | | | 0.65 | | | | 0.78 | | | | 0.64 | | | | 0.62 | |
Net realized and unrealized gain (loss) on investments | | | (0.16 | ) | | | (0.99 | ) | | | 0.95 | | | | 2.44 | | | | 1.39 | |
Net realized and unrealized gain (loss) on foreign currency transactions | | | 0.28 | | | | 0.15 | | | | 0.14 | | | | (0.06 | ) | | | 0.14 | |
| | | | | | | | | | | | | | | | | | | | |
Total from investment operations | | | 0.68 | | | | (0.19 | ) | | | 1.87 | | | | 3.02 | | | | 2.15 | |
| | | | | | | | | | | | | | | | | | | | |
| Less dividends and distributions: | | | | | | | | | | | | | | | | | | | | |
From net investment income | | | (0.58 | ) | | | (0.66 | ) | | | (0.67 | ) | | | (0.64 | ) | | | (0.62 | ) |
From net realized gain on investments | | | (0.59 | ) | | | (0.87 | ) | | | (0.52 | ) | | | — | | | | — | |
| | | | | | | | | | | | | | | | | | | | |
Total dividends and distributions | | | (1.17 | ) | | | (1.53 | ) | | | (1.19 | ) | | | (0.64 | ) | | | (0.62 | ) |
| | | | | | | | | | | | | | | | | | | | |
Net asset value at end of year | | $ | 18.31 | | | $ | 18.80 | | | $ | 20.52 | | | $ | 19.84 | | | $ | 17.46 | |
| | | | | | | | | | | | | | | | | | | | |
Total investment return (b) | | | 3.93 | % | | | (0.97 | %) | | | 9.83 | % | | | 17.62 | % | | | 13.72 | % |
| Ratios (to average net assets)/Supplemental Data: | | | | | | | | | | | | | | | | | | | | |
Net investment income (loss) | | | 3.09 | % | | | 3.34 | % | | | 3.89 | % | | | 3.46 | % | | | 3.73 | % |
Net expenses | | | 1.16 | % | | | 1.18 | % | | | 1.23 | % | | | 1.32 | % | | | 1.37 | % |
Portfolio turnover rate | | | 27 | % | | | 30 | % | | | 15 | % | | | 31 | % | | | 25 | % |
Net assets at end of year (in 000’s) | | $ | 153,137 | | | $ | 159,798 | | | $ | 165,088 | | | $ | 168,097 | | | $ | 160,758 | |
| (a) | Per share data based on average shares outstanding during the year. |
| (b) | Total investment return is calculated exclusive of sales charges and assumes the reinvestment of dividends and distributions. |
| | | | |
| 30 | | MainStay Income Builder Fund | | The notes to the financial statements are an integral part of,
and should be read in conjunction with, the financial statements. |
Financial Highlights selected per share data and ratios
| | | | | | | | | | | | | | | | | | | | |
| | | Year ended October 31, | |
| Class B | | 2016 | | | 2015 | | | 2014 | | | 2013 | | | 2012 | |
Net asset value at beginning of year | | $ | 18.89 | | | $ | 20.61 | | | $ | 19.93 | | | $ | 17.54 | | | $ | 15.99 | |
| | | | | | | | | | | | | | | | | | | | |
Net investment income (loss) (a) | | | 0.42 | | | | 0.51 | | | | 0.63 | | | | 0.51 | | | | 0.50 | |
Net realized and unrealized gain (loss) on investments | | | (0.17 | ) | | | (0.99 | ) | | | 0.96 | | | | 2.44 | | | | 1.40 | |
Net realized and unrealized gain (loss) on foreign currency transactions | | | 0.30 | | | | 0.15 | | | | 0.14 | | | | (0.06 | ) | | | 0.14 | |
| | | | | | | | | | | | | | | | | | | | |
Total from investment operations | | | 0.55 | | | | (0.33 | ) | | | 1.73 | | | | 2.89 | | | | 2.04 | |
| | | | | | | | | | | | | | | | | | | | |
| Less dividends and distributions: | | | | | | | | | | | | | | | | | | | | |
From net investment income | | | (0.45 | ) | | | (0.52 | ) | | | (0.53 | ) | | | (0.50 | ) | | | (0.49 | ) |
From net realized gain on investments | | | (0.59 | ) | | | (0.87 | ) | | | (0.52 | ) | | | — | | | | — | |
| | | | | | | | | | | | | | | | | | | | |
Total dividends and distributions | | | (1.04 | ) | | | (1.39 | ) | | | (1.05 | ) | | | (0.50 | ) | | | (0.49 | ) |
| | | | | | | | | | | | | | | | | | | | |
Net asset value at end of year | | $ | 18.40 | | | $ | 18.89 | | | $ | 20.61 | | | $ | 19.93 | | | $ | 17.54 | |
| | | | | | | | | | | | | | | | | | | | |
Total investment return (b) | | | 3.20 | % | | | (1.70 | %) | | | 8.99 | % | | | 16.74 | % | | | 12.87 | % |
| Ratios (to average net assets)/Supplemental Data: | | | | | | | | | | | | | | | | | | | | |
Net investment income (loss) | | | 2.34 | % | | | 2.60 | % | | | 3.14 | % | | | 2.73 | % | | | 2.99 | % |
Net expenses | | | 1.91 | % | | | 1.93 | % | | | 1.98 | % | | | 2.07 | % | | | 2.12 | % |
Portfolio turnover rate | | | 27 | % | | | 30 | % | | | 15 | % | | | 31 | % | | | 25 | % |
Net assets at end of year (in 000’s) | | $ | 42,253 | | | $ | 44,441 | | | $ | 49,283 | | | $ | 51,138 | | | $ | 51,233 | |
| (a) | Per share data based on average shares outstanding during the year. |
| (b) | Total investment return is calculated exclusive of sales charges and assumes the reinvestment of dividends and distributions. |
| | | | | | | | | | | | | | | | | | | | |
| | | Year ended October 31, | |
| Class C | | 2016 | | | 2015 | | | 2014 | | | 2013 | | | 2012 | |
Net asset value at beginning of year | | $ | 18.86 | | | $ | 20.58 | | | $ | 19.90 | | | $ | 17.52 | | | $ | 15.97 | |
| | | | | | | | | | | | | | | | | | | | |
Net investment income (loss) (a) | | | 0.42 | | | | 0.50 | | | | 0.60 | | | | 0.49 | | | | 0.49 | |
Net realized and unrealized gain (loss) on investments | | | (0.17 | ) | | | (0.98 | ) | | | 0.98 | | | | 2.45 | | | | 1.41 | |
Net realized and unrealized gain (loss) on foreign currency transactions | | | 0.30 | | | | 0.15 | | | | 0.15 | | | | (0.06 | ) | | | 0.14 | |
| | | | | | | | | | | | | | | | | | | | |
Total from investment operations | | | 0.55 | | | | (0.33 | ) | | | 1.73 | | | | 2.88 | | | | 2.04 | |
| | | | | | | | | | | | | | | | | | | | |
| Less dividends and distributions: | | | | | | | | | | | | | | | | | | | | |
From net investment income | | | (0.45 | ) | | | (0.52 | ) | | | (0.53 | ) | | | (0.50 | ) | | | (0.49 | ) |
From net realized gain on investments | | | (0.59 | ) | | | (0.87 | ) | | | (0.52 | ) | | | — | | | | — | |
| | | | | | | | | | | | | | | | | | | | |
Total dividends and distributions | | | (1.04 | ) | | | (1.39 | ) | | | (1.05 | ) | | | (0.50 | ) | | | (0.49 | ) |
| | | | | | | | | | | | | | | | | | | | |
Net asset value at end of year | | $ | 18.37 | | | $ | 18.86 | | | $ | 20.58 | | | $ | 19.90 | | | $ | 17.52 | |
| | | | | | | | | | | | | | | | | | | | |
Total investment return (b) | | | 3.15 | % | | | (1.70 | %) | | | 9.01 | % | | | 16.70 | % | | | 12.96 | % |
| Ratios (to average net assets)/Supplemental Data: | | | | | | | | | | | | | | | | | | | | |
Net investment income (loss) | | | 2.32 | % | | | 2.58 | % | | | 3.00 | % | | | 2.61 | % | | | 2.88 | % |
Net expenses | | | 1.91 | % | | | 1.93 | % | | | 1.98 | % | | | 2.07 | % | | | 2.12 | % |
Portfolio turnover rate | | | 27 | % | | | 30 | % | | | 15 | % | | | 31 | % | | | 25 | % |
Net assets at end of year (in 000’s) | | $ | 254,312 | | | $ | 235,811 | | | $ | 131,023 | | | $ | 55,889 | | | $ | 22,444 | |
| (a) | Per share data based on average shares outstanding during the year. |
| (b) | Total investment return is calculated exclusive of sales charges and assumes the reinvestment of dividends and distributions. |
| | | | | | |
The notes to the financial statements are an integral part of,
and should be read in conjunction with, the financial statements. | | | | | 31 | |
Financial Highlights selected per share data and ratios
| | | | | | | | | | | | | | | | | | | | |
| | | Year ended October 31, | |
| Class I | | 2016 | | | 2015 | | | 2014 | | | 2013 | | | 2012 | |
Net asset value at beginning of year | | $ | 18.95 | | | $ | 20.66 | | | $ | 19.97 | | | $ | 17.57 | | | $ | 16.02 | |
| | | | | | | | | | | | | | | | | | | | |
Net investment income (loss) (a) | | | 0.63 | | | | 0.73 | | | | 0.87 | | | | 0.74 | | | | 0.72 | |
Net realized and unrealized gain (loss) on investments | | | (0.16 | ) | | | (0.98 | ) | | | 0.96 | | | | 2.46 | | | | 1.40 | |
Net realized and unrealized gain (loss) on foreign currency transactions | | | 0.28 | | | | 0.15 | | | | 0.15 | | | | (0.06 | ) | | | 0.14 | |
| | | | | | | | | | | | | | | | | | | | |
Total from investment operations | | | 0.75 | | | | (0.10 | ) | | | 1.98 | | | | 3.14 | | | | 2.26 | |
| | | | | | | | | | | | | | | | | | | | |
| Less dividends and distributions: | | | | | | | | | | | | | | | | | | | | |
From net investment income | | | (0.65 | ) | | | (0.74 | ) | | | (0.77 | ) | | | (0.74 | ) | | | (0.71 | ) |
From net realized gain on investments | | | (0.59 | ) | | | (0.87 | ) | | | (0.52 | ) | | | — | | | | — | |
| | | | | | | | | | | | | | | | | | | | |
Total dividends and distributions | | | (1.24 | ) | | | (1.61 | ) | | | (1.29 | ) | | | (0.74 | ) | | | (0.71 | ) |
| | | | | | | | | | | | | | | | | | | | |
Net asset value at end of year | | $ | 18.46 | | | $ | 18.95 | | | $ | 20.66 | | | $ | 19.97 | | | $ | 17.57 | |
| | | | | | | | | | | | | | | | | | | | |
Total investment return (b) | | | 4.30 | % | | | (0.51 | %) | | | 10.33 | % | | | 18.25 | % | | | 14.41 | % |
| Ratios (to average net assets)/Supplemental Data: | | | | | | | | | | | | | | | | | | | | |
Net investment income (loss) | | | 3.44 | % | | | 3.75 | % | | | 4.29 | % | | | 3.97 | % | | | 4.28 | % |
Net expenses | | | 0.77 | % | | | 0.77 | % | | | 0.76 | % | | | 0.79 | % | | | 0.81 | % |
Portfolio turnover rate | | | 27 | % | | | 30 | % | | | 15 | % | | | 31 | % | | | 25 | % |
Net assets at end of year (in 000’s) | | $ | 542,330 | | | $ | 513,629 | | | $ | 430,408 | | | $ | 286,425 | | | $ | 204,611 | |
| (a) | Per share data based on average shares outstanding during the year. |
| (b) | Total investment return is calculated exclusive of sales charges and assumes the reinvestment of dividends and distributions. Class I shares are not subject to sales charges. |
| | | | | | | | |
| Class R2 | | Year ended
October 31, 2016 | | | February 27,
2015**
through
October 31,
2015 | |
Net asset value at beginning of period | | $ | 18.78 | | | $ | 20.08 | |
| | | | | | | | |
Net investment income (loss) (a) | | | 0.55 | | | | 0.36 | |
Net realized and unrealized gain (loss) on investments | | | (0.19 | ) | | | (1.35 | ) |
Net realized and unrealized gain (loss) on foreign currency transactions | | | 0.33 | | | | 0.20 | |
| | | | | | | | |
Total from investment operations | | | 0.69 | | | | (0.79 | ) |
| | | | | | | | |
| Less dividends and distributions: | | | | | | | | |
From net investment income | | | (0.59 | ) | | | (0.51 | ) |
From net realized gain on investments | | | (0.59 | ) | | | — | |
| | | | | | | | |
Total dividends and distributions | | | (1.18 | ) | | | (0.51 | ) |
| | | | | | | | |
Net asset value at end of period | | $ | 18.29 | | | $ | 18.78 | |
| | | | | | | | |
Total investment return (b) | | | 3.99 | % | | | (3.92 | %)(c) |
| Ratios (to average net assets)/Supplemental Data: | | | | | | | | |
Net investment income (loss) | | | 3.03 | % | | | 2.90 | % †† |
Net expenses | | | 1.12 | % | | | 1.12 | % †† |
Portfolio turnover rate | | | 27 | % | | | 30 | % |
Net assets at end of period (in 000’s) | | $ | 838 | | | $ | 190 | |
| (a) | Per share data based on average shares outstanding during the period. |
| (b) | Total investment return is calculated exclusive of sales charges and assumes the reinvestment of dividends and distributions. Class R2 shares are not subject to sales charges. |
| (c) | Total investment return is not annualized. |
| | | | |
| 32 | | MainStay Income Builder Fund | | The notes to the financial statements are an integral part of,
and should be read in conjunction with, the financial statements. |
Financial Highlights selected per share data and ratios
| | | | |
| Class R3 | | February 29,
2016**
through
October 31,
2016 | |
Net asset value at beginning of period | | $ | 17.10 | |
| | | | |
Net investment income (loss) (a) | | | 0.35 | |
Net realized and unrealized gain (loss) on investments | | | (1.69 | ) |
Net realized and unrealized gain (loss) on foreign currency transactions | | | 2.95 | |
| | | | |
Total from investment operations | | | 1.61 | |
| | | | |
| Less dividends: | | | | |
From net investment income | | | (0.41 | ) |
| | | | |
Net asset value at end of period | | $ | 18.30 | |
| | | | |
Total investment return (b)(c) | | | 9.42 | % |
| Ratios (to average net assets)/Supplemental Data: | | | | |
Net investment income (loss) | | | 2.81 | %†† |
Net expenses | | | 1.36 | %†† |
Portfolio turnover rate | | | 27 | % |
Net assets at end of period (in 000’s) | | $ | 39 | |
| (a) | Per share data based on average shares outstanding during the period. |
| (b) | Total investment return is calculated exclusive of sales charges and assumes the reinvestment of dividends and distributions. Class R3 shares are not subject to sales charges. |
| (c) | Total investment return is not annualized. |
| | | | | | |
The notes to the financial statements are an integral part of,
and should be read in conjunction with, the financial statements. | | | | | 33 | |
Notes to Financial Statements
Note 1–Organization and Business
The MainStay Funds (the “Trust”) was organized on January 9, 1986, as a Massachusetts business trust. The Trust is registered under the Investment Company Act of 1940, as amended (the “1940 Act”), as an open-end management investment company, and is comprised of twelve funds (collectively referred to as the “Funds”). These financial statements and notes relate to the MainStay Income Builder Fund (the “Fund”), a “diversified” fund, as that term is defined in the 1940 Act, as interpreted or modified by regulatory authorities having jurisdiction, from time to time.
The Fund currently offers seven classes of shares. Class A shares commenced operations on January 3, 1995. Class B shares commenced operations on December 29, 1987. Class C shares commenced operations on September 1, 1998. Class I shares commenced operations on January 2, 2004. Investor Class shares commenced operations on February 28, 2008. Class R2 shares commenced operations on February 27, 2015. Class R3 shares commenced operations on February 29, 2016.
Class A and Investor Class shares are offered at net asset value (“NAV”) per share plus an initial sales charge. No initial sales charge applies to investments of $1 million or more (and certain other qualified purchases) in Class A and Investor Class shares, but a contingent deferred sales charge (“CDSC”) of 1.00% may be imposed on certain redemptions of such shares made within one year of the date of purchase on shares that were purchased without an initial sales charge made before January 1, 2017. Effective January 1, 2017, a CDSC of 1.00% may be imposed on certain redemptions of Class A and Investor Class shares made within 24 months of the date of purchase of such shares that were made without an initial sales charge. Class B and Class C shares are offered at NAV without an initial sales charge, although a CDSC that declines depending on the number of years a shareholder has held its Class B shares may be imposed on redemptions made within six years of the date of purchase of such shares and a 1.00% CDSC may be imposed on redemptions made within one year of the date of purchase of Class C shares. Class I, Class R2 and Class R3 shares are offered at NAV and are not subject to a sales charge. Depending upon eligibility, Class B shares convert to either Class A or Investor Class shares at the end of the calendar quarter eight years after the date they were purchased. Additionally, depending upon eligibility, Class A shares may convert to Investor Class shares and Investor Class shares may convert to Class A shares. Under certain circumstances and as may be permitted by the Trust’s multiple class plan under Rule 18f-3 of the 1940 Act, an exchange/conversion may be made from specified share classes of the Fund to one or more other share classes of the Fund as disclosed in the capital share transactions within these notes. The seven classes of shares have the same voting (except for issues that relate solely to one class), dividend, liquidation and other rights, and the same terms and conditions, except that Class B and Class C shares are subject to higher distribution and/or service fee rates than Class A, Investor Class, Class R2 and Class R3 shares under a distribution plan pursuant to Rule 12b-1 under the 1940 Act. Class I shares are not subject to a distribution and/or service fee. Class R2 and Class R3 shares are subject to a shareholder service fee. This is in addition to any fees paid under a distribution plan, where applicable.
The Fund’s investment objective is to seek current income consistent with reasonable opportunity for future growth of capital and income.
Note 2–Significant Accounting Policies
The Fund is an investment company and accordingly follows the investment company accounting and reporting guidance of the Financial Accounting Standards Board (“FASB”) Accounting Standard Codification Topic 946 Financial Services—Investment Companies. The Fund prepares its financial statements in accordance with generally accepted accounting principles (“GAAP”) in the United States of America and follows the significant accounting policies described below.
(A) Securities Valuation. Investments are usually valued as of the close of regular trading on the New York Stock Exchange (the “Exchange”) (usually 4:00 p.m. Eastern time) on each day the Fund is open for business (“valuation date”).
The Board of Trustees (the “Board”) adopted procedures establishing methodologies for the valuation of the Fund’s securities and other assets and delegated the responsibility for valuation determinations under those procedures to the Valuation Committee of the Trust (the “Valuation Committee”). The Board authorized the Valuation Committee to appoint a Valuation Sub-Committee (the “Sub-Committee”) to deal in the first instance with establishing the prices of securities for which market quotations are not readily available or the prices of which are not otherwise readily determinable under these procedures. The Sub-Committee meets (in person, via electronic mail or via teleconference) on an as-needed basis. Subsequently, the Valuation Committee meets to ensure that actions taken by the Sub-Committee were appropriate. The procedures recognize that, subject to the oversight of the Board and unless otherwise noted, the responsibility for the day-to-day valuation of portfolio assets (including fair value measurements for the Fund’s assets and liabilities) rests with New York Life Investment Management LLC (“New York Life Investments” or the “Manager”), aided to whatever extent necessary by the Subadvisors (as defined in Note 3(A)) to the Fund.
To assess the appropriateness of security valuations, the Manager, Subadvisors or the Fund’s third party service provider, who is subject to oversight by the Manager, regularly compares prior day prices, prices on comparable securities, and the sale prices to the prior and current day prices and challenges prices with changes exceeding certain tolerance levels with third party pricing services or broker sources. For those securities valued through either a standardized fair valuation methodology or a fair valuation measurement, the Sub-Committee deals in the first instance with such valuation and the Valuation Committee reviews and affirms, if appropriate, the reasonableness of the valuation based on such methodologies and measurements on a regular basis after considering all relevant information that is reasonably available. Any action taken by the Sub-Committee with respect to the valuation of a portfolio security or other asset is submitted by the Valuation Committee to the Board for its review and ratification, if appropriate, at its next regularly scheduled meeting.
“Fair value” is defined as the price the Fund would reasonably expect to receive upon selling an asset or liability in an orderly transaction to an independent buyer in the principal or most advantageous market for the asset or liability. Fair value measurements are determined within a framework that establishes a three-tier hierarchy which maximizes the use of observable market data and minimizes the use of unobservable
| | |
| 34 | | MainStay Income Builder Fund |
inputs to establish a classification of fair value measurements for disclosure purposes. “Inputs” refer broadly to the assumptions that market participants would use in pricing the asset or liability, including assumptions about risk, such as the risk inherent in a particular valuation technique used to measure fair value using a pricing model and/or the risk inherent in the inputs for the valuation technique. Inputs may be observable or unobservable. Observable inputs reflect the assumptions market participants would use in pricing the asset or liability based on market data obtained from sources independent of the Fund. Unobservable inputs reflect the Fund’s own assumptions about the assumptions market participants would use in pricing the asset or liability based on the information available. The inputs or methodology used for valuing assets or liabilities may not be an indication of the risks associated with investing in those assets or liabilities. The three-tier hierarchy of inputs is summarized below.
| • | | Level 1—quoted prices in active markets for an identical asset or liability |
| • | | Level 2—other significant observable inputs (including quoted prices for a similar asset or liability in active markets, interest rates and yield curves, prepayment speeds, credit risk, etc.) |
| • | | Level 3—significant unobservable inputs (including the Fund’s own assumptions about the assumptions that market participants would use in measuring fair value of an asset or liability) |
The level of an asset or liability within the fair value hierarchy is based on the lowest level of an input, both individually and in the aggregate, that is significant to the fair value measurement. As of October 31, 2016, the aggregate value by input level of the Fund’s assets and liabilities is included at the end of the Fund’s Portfolio of Investments.
The Fund may use third party vendor evaluations, whose prices may be derived from one or more of the following standard inputs, among others:
| | |
• Benchmark yields | | • Reported trades |
• Broker/dealer quotes | | • Issuer spreads |
• Two-sided markets | | • Benchmark securities |
• Bids/offers | | • Reference data (corporate actions or material event notices) |
• Industry and economic events | | • Comparable bonds |
• Equity and credit default swap curves | | • Monthly payment information |
An asset or liability for which market values cannot be measured using the methodologies described above is valued by methods deemed reasonable in good faith by the Valuation Committee, following the procedures established by the Board, to represent fair value. Under these procedures, the Fund generally uses a market-based approach which may use related or comparable assets or liabilities, recent transactions, market multiples, book values, and other relevant information. The Fund may also use an income-based valuation approach in which the anticipated future cash flows of the asset or liability are discounted to calculate fair value. Discounts may also be applied due to the nature and/or duration of any restrictions on the disposition of the asset or liability. Fair value represents a good faith approximation of the value of a security. Fair value determinations involve the consideration of a number of subjective factors, an analysis of applicable facts and
circumstances and the exercise of judgment. As a result, it is possible that the fair value for a security determined in good faith in accordance with the Fund’s valuation procedures may differ from valuations for the same security determined by other funds using their own valuation procedures. Although the Fund’s valuation procedures are designed to value a security at the price the Fund may reasonably expect to receive upon its sale in an orderly transaction, there can be no assurance that any fair value determination thereunder would, in fact, approximate the amount that the Fund would actually realize upon the sale of the security or the price at which the security would trade if a reliable market price were readily available. During the year ended October 31, 2016, there were no material changes to the fair value methodologies.
Equity and non-equity securities which may be valued in this manner include, but are not limited to: (i) a security for which trading has been halted or suspended; (ii) a debt security that has recently gone into default and for which there is not a current market quotation; (iii) a security of an issuer that has entered into a restructuring; (iv) a security that has been de-listed from a national exchange; (v) a security for which the market price is not readily available from a third party pricing source or, if so provided, does not, in the opinion of the Manager or Subadvisors reflect the security’s market value; (vi) a security subject to trading collars for which no or limited trading takes place; and (vii) a security whose principal market has been temporarily closed at a time when, under normal conditions, it would be open. Securities for which market quotations or observable inputs are not readily available are generally categorized as Level 3 in the hierarchy. As of October 31, 2016, securities that were fair valued in such a manner are shown in the Portfolio of Investments.
Certain securities held by the Fund may principally trade in foreign markets. Events may occur between the time the foreign markets close and the time at which the Fund’s NAV is calculated. These events may include, but are not limited to, situations relating to a single issuer in a market sector, significant fluctuations in U.S. or foreign markets, natural disasters, armed conflicts, governmental actions or other developments not tied directly to the securities markets. Should the Manager or Subadvisors conclude that such events may have affected the accuracy of the last price of such securities reported on the local foreign market, the Sub-Committee may, pursuant to procedures adopted by the Board, adjust the value of the local price to reflect the estimated impact on the price of such securities as a result of such events. In this instance, securities are generally categorized as Level 3 in the hierarchy. Additionally, certain foreign equity securities are also fair valued whenever the movement of a particular index exceeds certain thresholds. In such cases, the securities are fair valued by applying factors provided by a third party vendor in accordance with valuation procedures adopted by the Board and are generally categorized as Level 2 in the hierarchy. As of October 31, 2016, no foreign equity securities held by the Fund were fair valued in such a manner.
Equity securities and shares of Exchange-Traded Funds (“ETFs”) are valued at the last quoted sales prices as of the close of regular trading on the relevant exchange on each valuation date. Securities that are not traded on the valuation date are valued at the mean of the last quoted bid and ask prices. Prices are normally taken from the principal market in which each security trades. Futures contracts are valued at the last posted settlement price on the market where such futures are primarily traded. These securities are generally categorized as Level 1 in the hierarchy.
Notes to Financial Statements (continued)
Debt securities (other than convertible and municipal bonds) are valued at the evaluated bid prices (evaluated mean prices in the case of convertible and municipal bonds) supplied by a pricing agent or brokers selected by the Manager in consultation with the Subadvisors. Those values reflect broker/dealer supplied prices and electronic data processing techniques, if the evaluated bid or mean prices are deemed by the Manager, in consultation with the Subadvisors to be representative of market values, at the regular close of trading of the Exchange on each valuation date. Debt securities purchased on a delayed delivery basis are marked to market daily until settlement at the forward settlement date. Debt securities, including corporate bonds, U.S. government & federal agency bonds, municipal bonds, foreign bonds, convertible bonds, asset-backed securities and mortgage-backed securities are generally categorized as Level 2 in the hierarchy.
Temporary cash investments acquired in excess of 60 days to maturity at the time of purchase are valued using the latest bid prices or using valuations based on a matrix system (which considers such factors as security prices, yields, maturities, and ratings), both as furnished by independent pricing services. Other temporary cash investments which mature in 60 days or less at the time of purchase (“Short-Term Investments”) are valued using the amortized cost method of valuation, unless the use of such method would be inappropriate. The amortized cost method involves valuing a security at its cost on the date of purchase and thereafter assuming a constant amortization to maturity of the difference between such cost and the value on maturity date. Amortized cost approximates the current fair value of a security. Securities valued using the amortized cost method are not valued using quoted prices in an active market and are generally categorized as Level 2 in the hierarchy.
Foreign currency forward contracts are valued at their fair market values measured on the basis of the mean between the last current bid and ask prices based on dealer or exchange quotations and are generally categorized as Level 2 in the hierarchy.
Loan assignments, participations and commitments are valued at the average of bid quotations obtained from the engaged independent pricing service and are generally categorized as Level 2 in the hierarchy. Certain loan assignments, participations and commitments may be valued by utilizing significant unobservable inputs obtained from the pricing service and are generally categorized as Level 3 in the hierarchy. As of October 31, 2016, the Fund did not hold any securities that were valued by utilizing significant unobservable inputs.
The information above is not intended to reflect an exhaustive list of the methodologies that may be used to value portfolio investments. The valuation procedures permit the use of a variety of valuation methodologies in connection with valuing portfolio investments. The methodology used for a specific type of investment may vary based on the market data available or other considerations. The methodologies summarized above may not represent the specific means by which portfolio investments are valued on any particular business day.
A Fund security or other asset may be determined to be illiquid under procedures approved by the Board. Illiquidity of a security might prevent the sale of such security at a time when the Manager or Subadvisors might wish to sell, and these securities could have the effect of decreasing the overall level of the Fund’s liquidity. Further, the lack of
an established secondary market may make it more difficult to value illiquid securities, requiring the Fund to rely on judgments that may be somewhat subjective in measuring value, which could vary materially from the amount that the Fund could realize upon disposition. Difficulty in selling illiquid securities may result in a loss or may be costly to the Fund. Under the supervision of the Board, the Manager or Subadvisors determine the liquidity of the Fund’s investments; in doing so, the Manager or Subadvisors may consider various factors, including (i) the frequency of trades and quotations, (ii) the number of dealers and prospective purchasers, (iii) dealer undertakings to make a market, and (iv) the nature of the security and the market in which it trades (e.g., the time needed to dispose of the security, the method of soliciting offers and the mechanics of transfer). Illiquid securities are often valued in accordance with methods deemed by the Board in good faith to be reasonable and appropriate to accurately reflect their fair value. The liquidity of the Fund’s investments, as shown in the Portfolio of Investments, was determined as of October 31, 2016 and can change at any time in response to, among other relevant factors, market conditions or events or developments with respect to an individual issuer or instrument.
(B) Income Taxes. The Fund’s policy is to comply with the requirements of the Internal Revenue Code of 1986, as amended (the “Internal Revenue Code”), applicable to regulated investment companies and to distribute all of its taxable income to the shareholders of the Fund within the allowable time limits. Therefore, no federal, state and local income tax provisions are required.
Management evaluates the Fund’s tax positions to determine if the tax positions taken meet the minimum recognition threshold in connection with accounting for uncertainties in income tax positions taken or expected to be taken for the purposes of measuring and recognizing tax liabilities in the financial statements. Recognition of tax benefits of an uncertain tax position is permitted only to the extent the position is “more likely than not” to be sustained assuming examination by taxing authorities. Management has analyzed the Fund’s tax positions taken on federal, state and local income tax returns for all open tax years (for up to three tax years), and has concluded that no provisions for federal, state and local income tax are required in the Fund’s financial statements. The Fund’s federal, state and local income and federal excise tax returns for tax years for which the applicable statutes of limitations have not expired are subject to examination by the Internal Revenue Service and state and local departments of revenue.
(C) Foreign Taxes. The Fund may be subject to foreign taxes on income and other transaction-based taxes imposed by certain countries in which it invests. A portion of the taxes on gains on investments or currency purchases/repatriation may be recoverable. The Fund will accrue such taxes and recoveries as applicable, based upon its current interpretation of tax rules and regulations that exist in the markets in which it invests.
The Fund may be subject to taxation on realized capital gains, repatriation proceeds and other transaction-based taxes imposed by certain countries in which it invests. The Fund will accrue such taxes as applicable based upon its current interpretation of tax rules and regulations that exist in the market in which it invests. Capital gains taxes relating to positions still held are reflected as a liability on the Statement of Assets and Liabilities, as well as an adjustment to the Fund’s net unrealized
| | |
| 36 | | MainStay Income Builder Fund |
appreciation (depreciation). Taxes related to capital gains realized during the year ended October 31, 2016, if any, are reflected as part of net realized gain (loss) in the Statement of Operations. Changes in tax liabilities related to capital gains taxes on unrealized investment gains, if any, are reflected as part of the change in net unrealized appreciation (depreciation) on investments in the Statement of Operations. Transaction-based charges are generally assessed as a percentage of the transaction amount.
(D) Dividends and Distributions to Shareholders. Dividends and distributions are recorded on the ex-dividend date. The Fund intends to declare and pay dividends from net investment income, if any, at least quarterly through December 31, 2016, and then monthly, effective January 1, 2017, and distributions from net realized capital and currency gains, if any, at least annually. Unless the shareholder elects otherwise, all dividends and distributions are reinvested in the same class of shares of the Fund, at NAV. Dividends and distributions to shareholders are determined in accordance with federal income tax regulations and may differ from GAAP.
(E) Security Transactions and Investment Income. The Fund records security transactions on the trade date. Realized gains and losses on security transactions are determined using the identified cost method. Dividend income is recognized on the ex-dividend date; net of any foreign tax withheld at the source, and interest income is accrued as earned using the effective interest rate method and includes any realized gains and losses from repayments of principal on mortgage-backed securities. Discounts and premiums on securities purchased, other than Short-Term Investments, for the Fund are accreted and amortized, respectively, on the effective interest rate method over the life of the respective securities. Discounts and premiums on Short-Term Investments are accreted and amortized, respectively, on the straight-line method. The straight-line method approximates the effective interest method for short-term investments. Income from payment-in-kind securities is accreted daily based on the effective interest method.
Investment income and realized and unrealized gains and losses on investments of the Fund are allocated to separate classes of shares pro rata based upon their relative net assets on the date the income is earned or realized and unrealized gains and losses are incurred.
The Fund may place a debt security on non-accrual status and reduce related interest income by ceasing current accruals and writing off all or a portion of any interest receivables when the collection of all or a portion of such interest has become doubtful. A debt security is removed from non-accrual status when the issuer resumes interest payments or when collectability of interest is reasonably assured.
(F) Expenses. Expenses of the Trust are allocated to the individual Funds in proportion to the net assets of the respective Funds when the expenses are incurred, except where direct allocations of expenses can be made. Expenses (other than transfer agent expenses and fees incurred under the shareholder services plans and/or the distribution plans further discussed in Note 3(B)) are allocated to separate classes of shares pro rata based upon their relative net assets on the date the expenses are incurred. The expenses borne by the Fund, including those of related parties to the Fund, are shown in the Statement of Operations.
(G) Use of Estimates. In preparing financial statements in conformity with GAAP, management makes estimates and assumptions that affect the reported amounts and disclosures in the financial statements. Actual results could differ from those estimates.
(H) Repurchase Agreements. The Fund may enter into repurchase agreements to earn income. The Fund may enter into repurchase agreements only with financial institutions that are deemed by the Manager or Subadvisors to be creditworthy, pursuant to guidelines established by the Board. During the term of any repurchase agreement, the Manager or Subadvisors will continue to monitor the creditworthiness of the seller. Under the 1940 Act, repurchase agreements are considered to be collateralized loans by the Fund to the seller secured by the securities transferred to the Fund.
When the Fund enters into repurchase agreements, the Fund’s custodian takes possession of the collateral pledged for investments in the repurchase agreement. The underlying collateral is valued daily on a mark to market basis to determine if the value, including accrued interest, exceeds the repurchase price. In the event of the seller’s default on the obligation to repurchase, the Fund has the right to liquidate the collateral and apply the proceeds in satisfaction of the obligation. Under certain circumstances, such as in the event of default or bankruptcy by the counterparty to the agreement, realization and/or retention of the collateral may be subject to legal proceedings and possible realized loss to the Fund.
(I) Loan Assignments, Participations and Commitments. The Fund may invest in loan assignments and participations (“loans”). Commitments are agreements to make money available to a borrower in a specified amount, at a specified rate and within a specified time. The Fund records an investment when the borrower withdraws money on a commitment or when a funded loan is purchased (trade date) and records interest as earned. These loans pay interest at rates that are periodically reset by reference to a base lending rate plus a spread. These base lending rates are generally the prime rate offered by a designated U.S. bank or the London InterBank Offered Rate.
The loans in which the Fund may invest are generally readily marketable, but may be subject to some restrictions on resale. For example, the Fund may be contractually obligated to receive approval from the agent bank and/or borrower prior to the sale of these investments. If the Fund purchases an assignment from a lender, the Fund will generally have direct contractual rights against the borrower in favor of the lender. If the Fund purchases a participation interest either from a lender or a participant, the Fund typically will have established a direct contractual relationship with the seller of the participation interest, but not with the borrower. Consequently, the Fund is subject to the credit risk of the lender or participant who sold the participation interest to the Fund, in addition to the usual credit risk of the borrower. In the event that the borrower, selling participant or intermediate participants become insolvent or enters into bankruptcy, the Fund may incur certain costs and delays in realizing payment, or may suffer a loss of principal and/or interest.
Unfunded commitments represent the remaining obligation of the Fund to the borrower. At any point in time, up to the maturity date of the issue, the borrower may demand the unfunded portion. Unfunded amounts, if any, are marked to market and any unrealized gains or
Notes to Financial Statements (continued)
losses are recorded in the Statement of Assets and Liabilities. As of October 31, 2016, the Fund held an unfunded commitment. (See Note 6)
(J) Futures Contracts. A futures contract is an agreement to purchase or sell a specified quantity of an underlying instrument at a specified future date and price, or to make or receive a cash payment based on the value of a financial instrument (e.g., foreign currency, interest rate, security, or securities index). The Fund is subject to risks such as market price risk and/or interest rate risk in the normal course of investing in these transactions. Upon entering into a futures contract, the Fund is required to pledge to the broker or futures commission merchant an amount of cash and/or U.S. Government securities equal to a certain percentage of the collateral amount, known as the “initial margin.” During the period the futures contract is open, changes in the value of the contract are recognized as unrealized appreciation or depreciation by marking to market such contract on a daily basis to reflect the market value of the contract at the end of each day’s trading. The Fund agrees to receive from or pay to the broker or futures commission merchant an amount of cash equal to the daily fluctuation in the value of the contract. Such receipts or payments are known as ‘‘variation margin.’’ When the futures contract is closed, the Fund records a realized gain or loss equal to the difference between the proceeds from (or cost of) the closing transaction and the Fund’s basis in the contract.
The use of futures contracts involves, to varying degrees, elements of market risk in excess of the amount recognized in the Statement of Assets and Liabilities. The contract or notional amounts and variation margin reflect the extent of the Fund’s involvement in open futures positions. There are several risks associated with the use of futures contracts as hedging techniques. There can be no assurance that a liquid market will exist at the time when the Fund seeks to close out a futures contract. If no liquid market exists, the Fund would remain obligated to meet margin requirements until the position is closed. Futures may involve a small initial investment relative to the risk assumed, which could result in losses greater than if they had not been used. Futures may be more volatile than direct investments in the instrument underlying the futures, and may not correlate to the underlying instrument, causing a given hedge not to achieve its objectives. The Fund’s activities in futures contracts have minimal counterparty risk as they are conducted through regulated exchanges that guarantee the futures against default by the counterparty. In the event of a bankruptcy or insolvency of a futures commission merchant that holds margin on behalf of the Fund, the Fund may not be entitled to the return of the entire margin owed to the Fund, potentially resulting in a loss. The Fund may invest in futures contracts in order to hedge against anticipated changes in interest rates that might otherwise have an adverse effect upon the value of the Fund’s securities. The Fund may also use equity index futures contracts to increase the equity sensitivity to the Fund. The Fund’s investment in futures contracts and other derivatives may increase the volatility of the Fund’s NAV and may result in a loss to the Fund.
(K) Foreign Currency Forward Contracts. The Fund may enter into foreign currency forward contracts, which are agreements to buy or sell foreign currencies on a specified future date at a specified rate. The Fund is subject to foreign currency exchange rate risk in the normal course of investing in these transactions. During the period the forward
contract is open, changes in the value of the contract are recognized as unrealized appreciation or depreciation by marking to market such contract on a daily basis to reflect the market value of the contract at the end of each day’s trading. Cash movement occurs on settlement date. When the forward contract is closed, the Fund records a realized gain or loss equal to the difference between the proceeds from (or cost of) the closing transaction and the Fund’s basis in the contract. The Fund may purchase and sell foreign currency forward contracts for purposes of seeking to enhance portfolio returns and manage portfolio risk more efficiently. Foreign currency forward contracts may also be used to gain exposure to a particular currency or to hedge against the risk of loss due to changing currency exchange rates. Foreign currency forward contracts to purchase or sell a foreign currency may also be used in anticipation of future purchases or sales of securities denominated in foreign currency, even if the specific investments have not yet been selected.
The use of foreign currency forward contracts involves, to varying degrees, elements of risk in excess of the amount recognized in the Statement of Assets and Liabilities, including counterparty risk, market risk, and illiquidity risk. Counterparty risk is heightened for these instruments because foreign currency forward contracts are not exchange-traded and therefore no clearinghouse or exchange stands ready to meet the obligations under such contracts. Thus, the Fund faces the risk that its counterparties under such contracts may not perform their obligations. Market risk is the risk that the value of a foreign currency forward contract will depreciate due to unfavorable changes in exchange rates. Illiquidity risk arises because the secondary market for foreign currency forward contracts may have less liquidity relative to markets for other securities and financial instruments. Risks also arise from the possible movements in the foreign exchange rates underlying these instruments. While the Fund may enter into forward contracts to reduce currency exchange risks, changes in currency exchange rates may result in poorer overall performance for the Fund than if it had not engaged in such transactions. Exchange rate movements can be large, depending on the currency, and can last for extended periods of time, affecting the value of the Fund’s assets. Moreover, there may be an imperfect correlation between the Fund’s holdings of securities denominated in a particular currency and the forward contracts entered into by the Fund. Such imperfect correlation may prevent the Fund from achieving the intended hedge or expose the Fund to the risk of currency exchange loss. The unrealized appreciation (depreciation) on forward contracts also reflects the Fund’s exposure at the valuation date to credit loss in the event of a counterparty’s failure to perform its obligations.
(L) Foreign Currency Transactions. The Fund’s books and records are maintained in U.S. dollars. Prices of securities denominated in foreign currency amounts are translated into U.S. dollars at the mean between the buying and selling rates last quoted by any major U.S. bank at the following dates:
| (i) | market value of investment securities, other assets and liabilities—at the valuation date; and |
| (ii) | purchases and sales of investment securities, income and expenses—at the date of such transactions. |
The assets and liabilities that are denominated in foreign currency amounts are presented at the exchange rates and market values at the
| | |
| 38 | | MainStay Income Builder Fund |
close of the period. The realized and unrealized changes in net assets arising from fluctuations in exchange rates and market prices of securities are not separately presented.
Net realized gain (loss) on foreign currency transactions represents net gains and losses on foreign currency forward contracts, net currency gains or losses realized as a result of differences between the amounts of securities sale proceeds or purchase cost, dividends, interest and withholding taxes as recorded on the Fund’s books, and the U.S. dollar equivalent amount actually received or paid. Net currency gains or losses from valuing such foreign currency denominated assets and liabilities, other than investments at valuation date exchange rates, are reflected in unrealized foreign exchange gains or losses.
(M) Securities Lending. In order to realize additional income, the Fund may engage in securities lending, subject to the limitations set forth in the 1940 Act and relevant guidance by the staff of the Securities and Exchange Commission (“SEC”). In the event the Fund does engage in securities lending, the Fund will lend through its custodian, State Street Bank and Trust Company (“State Street”). State Street will manage the Fund’s cash collateral in accordance with the lending agreement between the Fund and State Street, and indemnify the Fund against counterparty risk. The loans will be collateralized by cash or securities at least equal at all times to the market value of the securities loaned. Collateral will consist of U.S. government securities, cash equivalents or irrevocable letters of credit. The Fund may bear the risk of delay in recovery of, or loss of rights in, the securities loaned should the borrower of the securities experience financial difficulty. The Fund may also record a realized gain or loss on securities deemed sold due to a borrower’s inability to return securities on loan. The Fund bears the risk of any loss on investment of the collateral. The Fund will receive compensation for lending its securities in the form of fees or it will retain a portion of interest on the investment of any cash received as collateral. The Fund will also continue to receive interest and dividends on the securities loaned and any gain or loss in the market price of the securities loaned that may occur during the term of the loan will be for the account of the Fund. During the year ended October 31, 2016, the Fund did not have any portfolio securities on loan.
(N) Restricted Securities. Restricted securities, as disclosed in Note 5, are securities which have been purchased through a private offering and cannot be resold to the general public without prior registration under the Securities Act of 1933, as amended. Disposal of these securities may involve time-consuming negotiations and expenses, and it may be difficult to obtain a prompt sale at an acceptable price.
(O) Securities Risk. The Fund may invest in high-yield debt securities (commonly referred to as ‘‘junk bonds’’), which are considered speculative because they present a greater risk of loss, including default, than higher quality debt securities. These securities pay investors a premium — a higher interest rate or yield than investment grade debt securities — because of the increased risk of loss. These securities can also be subject to greater price volatility. In times of unusual or adverse market, economic or political conditions, these securities may experience higher than normal default rates.
The Fund may invest in foreign securities, which carry certain risks that are in addition to the usual risks inherent in domestic securities. These
risks include those resulting from currency fluctuations, future adverse political or economic developments and possible imposition of currency exchange blockages or other foreign governmental laws or restrictions. These risks are likely to be greater in emerging markets than in developed markets. The ability of issuers of debt securities held by the Fund to meet their obligations may be affected by economic or political developments in a specific country, industry or region.
The Fund may invest in loans which are usually rated below investment grade and are generally considered speculative because they present a greater risk of loss, including default, than higher rated debt securities. These investments pay investors a higher interest rate than investment grade debt securities because of the increased risk of loss. Although certain loans are collateralized, there is no guarantee that the value of the collateral will be sufficient to repay the loan. In a recession or serious credit event, the value of these investments could decline significantly. As a result, the Fund’s NAV could go down and you could lose money.
In addition, loan assignments generally are subject to the extended settlement periods that may be longer than seven days. As a result, the Fund may be adversely affected by selling other investments at an unfavorable time and/or under unfavorable conditions or engaging in borrowing transactions, such as borrowing against its credit facility, to raise cash to meet redemption obligations or pursue other investment opportunities.
(P) Indemnifications. Under the Trust’s organizational documents, its officers and trustees are indemnified against certain liabilities that may arise out of performance of their duties to the Trust. Additionally, in the normal course of business, the Fund enters into contracts with third-party service providers that contain a variety of representations and warranties and which may provide general indemnifications. The Fund’s maximum exposure under these arrangements is unknown, as this would involve future claims that may be made against the Fund that have not yet occurred. Based on experience, management is of the view that the risk of loss in connection with these potential indemnification obligations is remote. However, there can be no assurance that material liabilities related to such obligations will not arise in the future, which could adversely impact the Fund.
(Q) Quantitative Disclosure of Derivative Holdings. The following tables show additional disclosures related to the Fund’s derivative and hedging activities, including how such activities are accounted for and their effect on the Fund’s financial positions, performance and cash flows. The Fund invested in Treasury futures contracts in order to hedge against anticipated changes in interest rates that might otherwise have an adverse effect upon the value of the Fund’s securities. The Fund also invested in domestic and foreign equity index futures contracts to increase the equity sensitivity to the Fund. Foreign currency forward contracts were used to gain exposure to a particular currency or to hedge against the risk of loss due to changing currency exchange rates. These derivatives are not accounted for as hedging instruments.
Notes to Financial Statements (continued)
Fair value of derivative instruments as of October 31, 2016:
Asset Derivatives
| | | | | | | | | | | | | | | | | | |
| | | Statement of Assets and Liabilities Location | | Foreign
Exchange
Contracts
Risk | | | Equity
Contracts
Risk | | | Interest
Rate
Contracts
Risk | | | Total | |
Futures Contracts | | Net Assets-Net unrealized appreciation (depreciation) on investments and futures contracts (a) | | $ | — | | | $ | 1,118,557 | | | $ | 1,148,231 | | | $ | 2,266,788 | |
Forward Contracts | | Unrealized appreciation on foreign currency forward contracts | | | 5,119,531 | | | | — | | | | — | | | | 5,119,531 | |
| | | | | | |
Total Fair Value | | $ | 5,119,531 | | | $ | 1,118,557 | | | $ | 1,148,231 | | | $ | 7,386,319 | |
| | | | | | |
Liability Derivatives
| | | | | | | | | | | | | | | | | | |
| | | Statement of Assets and Liabilities Location | | Foreign
Exchange
Contracts
Risk | | | Equity
Contracts
Risk | | | Interest
Rate
Contracts
Risk | | | Total | |
Futures Contracts | | Net Assets-Net unrealized appreciation (depreciation) on investments and futures contracts (a) | | $ | — | | | $ | (3,904,846 | ) | | $ | (4,080,421 | ) | | $ | (7,985,267 | ) |
Forward Contracts | | Unrealized depreciation on foreign currency forward contracts | | | (509,142 | ) | | | — | | | | — | | | | (509,142 | ) |
| | | | | | |
Total Fair Value | | $ | (509,142 | ) | | $ | (3,904,846 | ) | | $ | (4,080,421 | ) | | $ | (8,494,409 | ) |
| | | | | | |
| (a) | Includes cumulative appreciation (depreciation) of futures contracts as reported in the Portfolio of Investments. Only current day’s variation margin is reported within the Statement of Assets and Liabilities. |
The effect of derivative instruments on the Statement of Operations for the year ended October 31, 2016:
Realized Gain (Loss)
| | | | | | | | | | | | | | | | | | |
| | | Statement of Operations Location | | Foreign
Exchange
Contracts
Risk | | | Equity
Contracts
Risk | | | Interest
Rate
Contracts
Risk | | | Total | |
Futures Contracts | | Net realized gain (loss) on futures transactions | | $ | — | | | $ | 20,089,671 | | | $ | 5,829,540 | | | $ | 25,919,211 | |
Forward Contracts | | Net realized gain (loss) on foreign currency transactions | | | 12,362,045 | | | | — | | | | — | | | | 12,362,045 | |
| | | | | | |
Total Realized Gain (Loss) | | $ | 12,362,045 | | | $ | 20,089,671 | | | $ | 5,829,540 | | | $ | 38,281,256 | |
| | | | | | |
Change in Unrealized Appreciation (Depreciation)
| | | | | | | | | | | | | | | | | | |
| | | Statement of Operations Location | | Foreign
Exchange
Contracts
Risk | | | Equity
Contracts
Risk | | | Interest
Rate
Contracts
Risk | | | Total | |
Futures Contracts | | Net change in unrealized appreciation (depreciation) on futures contracts | | $ | — | | | $ | (21,677,368 | ) | | $ | (3,062,778 | ) | | $ | (24,740,146 | ) |
Forward Contracts | | Net change in unrealized appreciation (depreciation) on translation of other assets and liabilities in foreign currencies and foreign currency forward contracts | | | 3,053,842 | | | | — | | | | — | | | | 3,053,842 | |
| | | | | | |
Total Change in Unrealized Appreciation (Depreciation) | | $ | 3,053,842 | | | $ | (21,677,368 | ) | | $ | (3,062,778 | ) | | $ | (21,686,304 | ) |
| | | | | | |
| | |
| 40 | | MainStay Income Builder Fund |
Average Notional Amount
| | | | | | | | | | | | | | | | |
| | | Foreign
Exchange
Contracts Risk | | | Equity Contracts Risk | | | Interest Rate
Contracts
Risk | | | Total | |
Futures Contracts Long | | $ | — | | | $ | 281,345,275 | | | $ | 67,405,723 | | | $ | 348,750,998 | |
Futures Contracts Short (a) | | $ | — | | | $ | — | | | $ | (136,917,507 | ) | | $ | (136,917,507 | ) |
Forward Contracts Long (b) | | $ | 49,427,013 | | | $ | — | | | $ | — | | | $ | 49,427,013 | |
Forward Contracts Short | | $ | (176,377,579 | ) | | $ | — | | | $ | — | | | $ | (176,377,579 | ) |
| | | | |
| (a) | Positions were open five month during the reporting period. |
| (b) | Positions were open seven months during the reporting period. |
Note 3–Fees and Related Party Transactions
(A) Manager and Subadvisors. New York Life Investments, a registered investment adviser and an indirect, wholly-owned subsidiary of New York Life Insurance Company (“New York Life”), serves as the Fund’s Manager, pursuant to an Amended and Restated Management Agreement (“Management Agreement”). The Manager provides offices, conducts clerical, recordkeeping and bookkeeping services, and keeps most of the financial and accounting records required to be maintained by the Fund. Except for the portion of salaries and expenses that are the responsibility of the Fund, the Manager pays the salaries and expenses of all personnel affiliated with the Fund and certain operational expenses of the Fund. The Fund reimburses New York Life Investments in an amount equal to a portion of the compensation of the Chief Compliance Officer of the Fund. MacKay Shields LLC (‘‘MacKay Shields’’ or “Subadvisor”), a registered investment adviser and an indirect, wholly-owned subsidiary of New York Life, serves as a Subadvisor, pursuant to the terms of the Amended and Restated Subadvisory Agreement (“Subadvisory Agreement”) between New York Life Investments and MacKay Shields, is responsible for the overall asset allocation decisions of the Fund and is responsible for the day-to-day portfolio management of the fixed-income portion of the Fund. Epoch Investment Partners, Inc. (“Epoch” or “Subadvisor” and, together with MacKay Shields, the “Subadvisors”), a registered investment advisor, also serves as a Subadvisor pursuant to the terms of a Subadvisory Agreement between New York Life Investments and Epoch and is responsible for the day-to-day portfolio management of the equity portion of the Fund. New York Life Investments pays for the services of the Subadvisors.
Under the Management Agreement, the Fund pays the Manager a monthly fee for services performed and facilities furnished at an annual rate of the Fund’s average daily net assets as follows: 0.64% up to $500 million; 0.60% from $500 million to $1 billion; and 0.575% in excess of $1 billion, plus a fee for fund accounting services previously provided by New York Life Investments under a separate fund accounting agreement furnished at an annual rate of the Fund’s average daily net assets as follows: 0.05% up to $20 million; 0.0333% from $20 million to $100 million; and 0.01% in excess of $100 million. During the year ended October 31, 2016, the effective management fee rate was 0.62% inclusive of a fee for fund accounting services of 0.01% of the Fund’s average daily net assets.
During the year ended October 31, 2016, New York Life Investments earned fees from the Fund in the amount of $9,309,748.
State Street provides sub-administration and sub-accounting services to the Fund pursuant to an agreement with New York Life Investments. These services include calculating the daily NAVs of the Fund, maintaining the general ledger and sub-ledger accounts for the calculation of the Fund’s NAVs, and assisting New York Life Investments in conducting various aspects of the Fund’s administrative operations. For providing these services to the Fund, State Street is compensated by New York Life Investments.
(B) Distribution, Service and Shareholder Service Fees. The Trust, on behalf of the Fund, has entered into a distribution agreement with NYLIFE Distributors LLC (the “Distributor”), an indirect, wholly-owned subsidiary of New York Life. The Fund has adopted distribution plans (the “Plans”) in accordance with the provisions of Rule 12b-1 under the 1940 Act.
Pursuant to the Class A, Investor Class and Class R2 Plans, the Distributor receives a monthly distribution fee from the Class A, Investor Class and Class R2 shares at an annual rate of 0.25% of the average daily net assets of the Class A, Investor Class and Class R2 shares for distribution and/or service activities as designated by the Distributor. Pursuant to the Class B and Class C Plans, Class B and Class C shares pay the Distributor a monthly distribution fee at an annual rate of 0.75% of the average daily net assets of the Class B and Class C shares, along with a service fee at an annual rate of 0.25% of the average daily net assets of the Class B and Class C shares, for a total 12b-1 fee of 1.00%. Pursuant to the Class R3 Plan, the Distributor receives a monthly distribution and/or service fee from the Class R3 shares at an annual rate of 0.50% of the average daily net assets of the Class R3 shares. Class I shares are not subject to a distribution and/or service fee.
The Plans provide that the distribution and service fees are payable to the Distributor regardless of the amounts actually expended by the Distributor for distribution of the Fund’s shares and service activities.
In accordance with the Shareholder Services Plan for the Class R2 and Class R3 shares, the Manager has agreed to provide, through its affiliates or independent third parties, various shareholder and administrative support services to shareholders of the Class R2 and Class R3 shares. For its services, the Manager, its affiliates or independent third party service providers are entitled to a Shareholder Service Fee accrued daily and paid monthly at an annual rate of 0.10% of the
Notes to Financial Statements (continued)
average daily net assets of the Class R2 and Class R3 shares. This is in addition to any fees paid under a distribution plan, where applicable.
| | | | |
Class R2 | | $ | 306 | |
Class R3 | | | 24 | |
(C) Sales Charges. During the year ended October 31, 2016, the Fund was advised by the Distributor that the amount of initial sales charges retained on sales of Class A and Investor Class shares were $168,036 and $31,063, respectively.
During the year ended October 31, 2016, the Fund was also advised that the Distributor retained CDSCs on redemptions of Class A, Investor Class, Class B and Class C shares of $5,425, $8, $55,157 and $55,730, respectively.
(D) Transfer, Dividend Disbursing and Shareholder Servicing Agent. NYLIM Service Company LLC, an affiliate of New York Life Investments, is the Fund’s transfer, dividend disbursing and shareholder servicing agent pursuant to an agreement between NYLIM Service Company LLC and the Trust. NYLIM Service Company LLC has entered into an agreement with Boston Financial Data Services, Inc. (“BFDS”) pursuant to which BFDS performs certain transfer agent services on behalf of NYLIM Service Company LLC. During the year ended October 31, 2016, transfer agent expenses incurred by the Fund were as follows:
| | | | |
Class A | | $ | 561,378 | |
Investor Class | | | 376,407 | |
Class B | | | 101,318 | |
Class C | | | 572,045 | |
Class I | | | 519,119 | |
Class R2 | | | 307 | |
Class R3 | | | 23 | |
(E) Small Account Fee. Shareholders with small accounts adversely impact the cost of providing transfer agency services. In an effort to reduce total transfer agency expenses, the Fund has implemented a small account fee on certain types of accounts. Certain shareholders with an account balance of less than $1,000 are charged an annual per account fee of $20 (assessed semi-annually), the proceeds from which offset transfer agent fees as reflected in the Statement of Operations.
(F) Capital. As of October 31, 2016, New York Life and its affiliates beneficially held shares of the Fund with values and percentages of net assets as follows:
| | | | | | | | |
Class I | | $ | 99,153,502 | | |
| 18.3
| %
|
Class R2 | |
| 24,979
|
| |
| 3.0
|
|
Class R3 | | | 27,355 | | |
| 69.4
|
|
Note 4–Federal Income Tax
As of October 31, 2016, the components of accumulated gain (loss) on a tax basis were as follows:
| | | | | | | | | | | | | | |
Ordinary
Income | | Accumulated
Capital and Other Gain (Loss) | | Other
Temporary
Differences | | | Unrealized
Appreciation
(Depreciation) | | | Total
Accumulated Gain (Loss) | |
$ 8,674,281 | | $(48,912,541) | | $ | — | | | $ | 43,825,395 | | | $ | 3,587,135 | |
The difference between book-basis and tax-basis unrealized appreciation (depreciation) is primarily due to wash sale adjustments, return of capital distributions received , mark to market of foreign forward contracts, and mark to market of futures contracts.
The following table discloses the current year reclassifications between undistributed net investment income (loss), accumulated net realized gain (loss) on investments, and additional paid-in capital arising from permanent differences; net assets as of October 31, 2016 were not affected.
| | | | | | | | |
Undistributed
Net Investment
Income (Loss) | | Accumulated
Net Realized
Gain (Loss) on
Investments | | | Additional
Paid-In
Capital | |
| $ 5,929,344 | | $ | (5,927,812 | ) | | $ | (1,532 | ) |
The reclassifications for the Fund are primarily due to foreign currency gain (loss), partnerships, Real Estate Investment Trusts (REITs) and return of capital distributions received.
As of October 31, 2016, for federal income tax purposes, capital loss carryforwards of $48,912,541 were available as shown in the table below, to the extent provided by the regulations to offset future realized gains of the Fund through the years indicated. To the extent that these capital loss carryforwards are used to offset future capital gains, it is probable that the capital gains so offset will not be distributed to shareholders. No capital gain distributions shall be made until any capital loss carryforwards have been fully utilized or expired.
| | | | | | | | |
Capital Loss
Available Through | | Short-Term
Capital Loss
Amounts (000’s) | | | Long-Term
Capital Loss
Amounts (000’s) | |
| Unlimited | | $ | 13,265 | | | $ | 35,648 | |
During the years ended October 31, 2016 and October 31, 2015, the tax character of distributions paid as reflected in the Statements of Changes in Net Assets was as follows:
| | | | | | | | |
| | | 2016 | | | 2015 | |
Distributions paid from: | | | | | | | | |
Ordinary Income | | $ | 49,199,426 | | | $ | 62,132,602 | |
Long-Term Capital Gain | | | 48,169,328 | | | | 44,756,393 | |
Total | | $ | 97,368,754 | | | $ | 106,888,995 | |
| | |
| 42 | | MainStay Income Builder Fund |
Note 5–Restricted Securities
As of October 31, 2016, the Fund held the following restricted security:
| | | | | | | | | | | | | | | | | | | | |
Security | | Date of
Acquisition | | | Shares | | | Cost | | | 10/31/16
Value | | | Percent of
Net Assets | |
ION Media Networks, Inc. | | | | | | | | | | | | | | | | | | | | |
Common Stock | | | 3/11/14 | | | | 12 | | | $ | 21 | | | $ | 6,425 | | | | 0.0 | %‡ |
| ‡ | Less than one-tenth of a percent. |
Note 6–Commitments and Contingencies
As of October 31, 2016, the Fund had unfunded commitments pursuant to the following loan agreement:
| | | | | | | | |
Borrower | | Unfunded
Commitments | | | Unrealized
Appreciation | |
USAGM Hold Co. LLC 2016 Incremental Delayed Draw Term Loan | | $ | 222,517 | | | $ | 668 | |
Commitments are available until maturity date.
Note 7–Custodian
State Street is the custodian of cash and securities held by the Fund. Custodial fees are charged to the Fund based on the Fund’s net assets and/or the market value of securities held by the Fund and the number of certain transactions incurred by the Fund.
Note 8–Line of Credit
The Fund and certain other funds managed by New York Life Investments, maintain a line of credit with a syndicate of banks in order to secure a source of funds for temporary purposes to meet unanticipated or excessive redemption requests.
Effective August 2, 2016, under an amended and restated credit agreement (the “Credit Agreement”), the aggregate commitment amount is $600,000,000 with an additional uncommitted amount of $100,000,000. The commitment fee is an annual rate of 0.15% of the average commitment amount payable quarterly, regardless of usage, to Bank of New York Mellon, who serves as the agent to the syndicate. The commitment fee is allocated among the Fund and certain affiliated funds based upon their respective net assets and other factors. Interest on any revolving credit loan is charged based upon the Federal Funds Advances Rate or the one month London InterBank Offered Rate, whichever is higher. The Credit Agreement expires on August 1, 2017, although the Fund, certain affiliated funds and the syndicate of banks may renew the Credit Agreement for an additional year on the same or different terms. Prior to August 2, 2016, the aggregate commitment amount was $600,000,000 with an additional uncommitted amount of $100,000,000, and the commitment fee was at an annual rate of 0.10% of the average commitment amount. During the year ended October 31, 2016, there were no borrowings made or outstanding with respect to the Fund under the Credit Agreement.
Note 9–Interfund Lending Program
Pursuant to an exemptive order issued by the SEC, the Fund, along with certain other funds managed by New York Life Investments, may participate in an interfund lending program. The interfund lending program
provides an alternate credit facility that permits the Fund and certain other funds managed by New York Life Investments to lend or borrow money for temporary purposes directly to or from one another, subject to the conditions of the exemptive order. During the year ended October 31, 2016, there were no interfund loans made or outstanding with respect to the Fund.
Note 10–Purchases and Sales of Securities (in 000’s)
During the year ended October 31, 2016, purchases and sales of U.S. government securities were $27,853 and $52, respectively. Purchases and sales of securities, other than U.S. government securities and short-term securities, were $492,378 and $369,823, respectively.
Note 11–Capital Share Transactions
| | | | | | | | |
Class A | | Shares | | | Amount | |
Year ended October 31, 2016: | | | | | | | | |
Shares sold | | | 7,841,617 | | | $ | 142,036,049 | |
Shares issued to shareholders in reinvestment of dividends and distributions | | | 1,961,889 | | | | 34,764,982 | |
Shares redeemed | | | (9,816,306 | ) | | | (174,240,150 | ) |
| | | | |
Net increase (decrease) in shares outstanding before conversion | | | (12,800 | ) | | | (2,560,881 | ) |
Shares converted into Class A (See Note 1) | | | 770,848 | | | | 13,985,721 | |
Shares converted from Class A (See Note 1) | | | (334,784 | ) | | | (6,143,586 | ) |
| | | | |
Net increase (decrease) | | | 423,264 | | | $ | 10,403,016 | |
| | | | |
Year ended October 31, 2015: | | | | | | | | |
Shares sold | | | 11,978,815 | | | $ | 232,564,766 | |
Shares issued to shareholders in reinvestment of dividends and distributions | | | 2,021,817 | | | | 38,907,148 | |
Shares redeemed | | | (7,481,252 | ) | | | (142,177,899 | ) |
| | | | |
Net increase (decrease) in shares outstanding before conversion | | | 6,519,380 | | | | 129,294,015 | |
Shares converted into Class A (See Note 1) | | | 449,992 | | | | 8,798,801 | |
Shares converted from Class A (See Note 1) | | | (270,070 | ) | | | (4,969,208 | ) |
| | | | |
Net increase (decrease) | | | 6,699,302 | | | $ | 133,123,608 | |
| | | | |
| | |
| | | | | | | | |
Notes to Financial Statements (continued)
| | | | | | | | |
Investor Class | | Shares | | | Amount | |
Year ended October 31, 2016: | | | | | | | | |
Shares sold | | | 494,203 | | | $ | 8,903,534 | |
Shares issued to shareholders in reinvestment of dividends and distributions | | | 556,615 | | | | 9,868,926 | |
Shares redeemed | | | (859,909 | ) | | | (15,490,433 | ) |
| | | | |
Net increase (decrease) in shares outstanding before conversion | | | 190,909 | | | | 3,282,027 | |
Shares converted into Investor Class (See Note 1) | | | 342,484 | | | | 6,227,403 | |
Shares converted from Investor Class (See Note 1) | | | (668,460 | ) | | | (12,156,033 | ) |
| | | | |
Net increase (decrease) | | | (135,067 | ) | | $ | (2,646,603 | ) |
| | | | |
Year ended October 31, 2015: | | | | | | | | |
Shares sold | | | 597,695 | | | $ | 11,699,385 | |
Shares issued to shareholders in reinvestment of dividends and distributions | | | 641,610 | | | | 12,377,490 | |
Shares redeemed | | | (928,125 | ) | | | (17,999,879 | ) |
| | | | |
Net increase (decrease) in shares outstanding before conversion | | | 311,180 | | | | 6,076,996 | |
Shares converted into Investor Class (See Note 1) | | | 482,009 | | | | 9,039,006 | |
Shares converted from Investor Class (See Note 1) | | | (340,710 | ) | | | (6,701,508 | ) |
| | | | |
Net increase (decrease) | | | 452,479 | | | $ | 8,414,494 | |
| | | | |
| | |
| | | | | | | | |
Class B | | Shares | | | Amount | |
Year ended October 31, 2016: | | | | | | | | |
Shares sold | | | 458,845 | | | $ | 8,357,411 | |
Shares issued to shareholders in reinvestment of dividends and distributions | | | 120,201 | | | | 2,138,960 | |
Shares redeemed | | | (331,239 | ) | | | (5,985,764 | ) |
| | | | |
Net increase (decrease) in shares outstanding before conversion | | | 247,807 | | | | 4,510,607 | |
Shares converted from Class B (See Note 1) | | | (304,298 | ) | | | (5,518,950 | ) |
| | | | |
Net increase (decrease) | | | (56,491 | ) | | $ | (1,008,343 | ) |
| | | | |
Year ended October 31, 2015: | | | | | | | | |
Shares sold | | | 502,947 | | | $ | 9,852,271 | |
Shares issued to shareholders in reinvestment of dividends and distributions | | | 160,035 | | | | 3,114,276 | |
Shares redeemed | | | (382,243 | ) | | | (7,404,379 | ) |
| | | | |
Net increase (decrease) in shares outstanding before conversion | | | 280,739 | | | | 5,562,168 | |
Shares converted from Class B (See Note 1) | | | (319,725 | ) | | | (6,167,091 | ) |
| | | | |
Net increase (decrease) | | | (38,986 | ) | | $ | (604,923 | ) |
| | | | |
| | |
| | | | | | | | |
| | | | | | | | |
Class C | | Shares | | | Amount | |
Year ended October 31, 2016: | | | | | | | | |
Shares sold | | | 5,044,698 | | | $ | 91,363,749 | |
Shares issued to shareholders in reinvestment of dividends and distributions | | | 608,097 | | | | 10,807,452 | |
Shares redeemed | | | (4,294,052 | ) | | | (77,182,470 | ) |
| | | | |
Net increase (decrease) in shares outstanding before conversion | | | 1,358,743 | | | | 24,988,731 | |
Shares converted from Class C (See Note 1) | | | (17,464 | ) | | | (313,665 | ) |
| | | | |
Net increase (decrease) | | | 1,341,279 | | | $ | 24,675,066 | |
| | | | |
Year ended October 31, 2015: | | | | | | | | |
Shares sold | | | 8,160,384 | | | $ | 160,686,108 | |
Shares issued to shareholders in reinvestment of dividends and distributions | | | 495,350 | | | | 9,573,666 | |
Shares redeemed | | | (2,521,438 | ) | | | (48,605,712 | ) |
| | | | |
Net increase (decrease) | | | 6,134,296 | | | $ | 121,654,062 | |
| | | | |
| | |
| | | | | | | | |
Class I | | Shares | | | Amount | |
Year ended October 31, 2016: | | | | | | | | |
Shares sold | | | 12,617,583 | | | $ | 231,090,238 | |
Shares issued to shareholders in reinvestment of dividends and distributions | | | 1,712,441 | | | | 30,646,033 | |
Shares redeemed | | | (12,272,978 | ) | | | (222,155,199 | ) |
| | | | |
Net increase (decrease) in shares outstanding before conversion | | | 2,057,046 | | | | 39,581,072 | |
Shares converted into Class I (See Note 1) | | | 211,252 | | | | 3,919,110 | |
| | | | |
Net increase (decrease) | | | 2,268,298 | | | $ | 43,500,182 | |
| | | | |
Year ended October 31, 2015: | | | | | | | | |
Shares sold | | | 12,690,081 | | | $ | 250,178,297 | |
Shares issued to shareholders in reinvestment of dividends and distributions | | | 1,709,758 | | | | 33,131,319 | |
Shares redeemed | | | (8,122,322 | ) | | | (157,391,171 | ) |
| | | | |
Net increase (decrease) | | | 6,277,517 | | | $ | 125,918,445 | |
| | | | |
| | |
| | | | | | | | |
Class R2 | | Shares | | | Amount | |
Year ended October 31, 2016 : | | | | | | | | |
Shares sold | | | 36,303 | | | $ | 664,922 | |
Shares issued to shareholders in reinvestment of dividends and distributions | | | 273 | | | | 4,910 | |
Shares redeemed | | | (851 | ) | | | (15,593 | ) |
| | | | |
Net increase (decrease) | | | 35,725 | | | $ | 654,239 | |
| | | | |
Period ended October 31, 2015 (a): | | | | | | | | |
Shares sold | | | 10,070 | | | $ | 193,289 | |
Shares issued to shareholders in reinvestment of dividends and distributions | | | 34 | | | | 639 | |
| | | | |
Net increase (decrease) | | | 10,104 | | | $ | 193,928 | |
| | | | |
| | |
| | | | | | | | |
| | |
| 44 | | MainStay Income Builder Fund |
| | | | | | | | |
Class R3 | | Shares | | | Amount | |
Period ended October 31, 2016 (b): | | | | | | | | |
Shares sold | | | 2,112 | | | $ | 36,690 | |
Shares issued to shareholders in reinvestment of dividends and distributions | | | 42 | | | | 767 | |
| | | | |
Net increase (decrease) | | | 2,154 | | | $ | 37,457 | |
| | | | |
| (a) | Inception date was February 27, 2015. |
| (b) | Inception date was February 29, 2016. |
Note 12–Recent Accounting Pronouncement
In October 2016, the U.S. Securities and Exchange Commission adopted new rules and amended existing rules (together, “final rules”) intended to modernize the reporting and disclosure of information by registered investment companies. In part, the final rules amend Regulation S-X and require standardized, enhanced disclosure about derivatives in investment company financial statements, as well as other amendments. The compliance date for the amendments to Regulation S-X is August 1, 2017. Management is currently evaluating the impact that the adoption of the amendments to Regulation S-X will have on the Fund’s financial statements and related disclosures.
Note 13–Subsequent Events
In connection with the preparation of the financial statements of the Fund as of and for the fiscal year ended October 31, 2016, events and transactions subsequent to October 31, 2016, through the date the financial statements were issued have been evaluated by the Fund’s management for possible adjustment and/or disclosure. No subsequent events requiring financial statement adjustment or disclosure have been identified other than the following:
Effective February 28, 2017, Class B shares of the MainStay Group of Funds will be closed to all new purchases as well as additional investments by existing Class B shareholders. Existing Class B shareholders may continue to reinvest dividends and capital gains distributions, as well as exchange their Class B shares for Class B shares of other Funds as permitted by the current exchange privileges. Class B shareholders will continue to be subject to any applicable contingent deferred sales charge at the time of redemption. All other features of the Class B shares, including but not limited to the fees and expenses applicable to Class B shares, will remain unchanged. Unless redeemed, Class B Shares shareholders will remain in Class B shares of their respective Fund until the Class B shares are converted to Class A or Investor Class shares pursuant to the applicable conversion schedule.
Report of Independent Registered Public Accounting Firm
The Board of Trustees and Shareholders of
The MainStay Funds:
We have audited the accompanying statement of assets and liabilities, including the portfolio of investments, of the MainStay Income Builder Fund (the “Fund”), one of the funds constituting The MainStay Funds, as of October 31, 2016, and the related statement of operations for the year then ended, the statements of changes in net assets for each of the years in the two-year period then ended, and the financial highlights for each of the years or periods in the five-year period then ended. These financial statements and financial highlights are the responsibility of the Fund’s management. Our responsibility is to express an opinion on these financial statements and financial highlights based on our audits.
We conducted our audits in accordance with the standards of the Public Company Accounting Oversight Board (United States). Those standards require that we plan and perform the audit to obtain reasonable assurance about whether the financial statements and financial highlights are free of material misstatement. An audit includes examining, on a test basis, evidence supporting the amounts and disclosures in the financial statements. Our procedures included confirmation of securities owned as of October 31, 2016, by correspondence with the custodian and brokers or by other appropriate auditing procedures where replies from brokers were not received. An audit also includes assessing the accounting principles used and significant estimates made by management, as well as evaluating the overall financial statement presentation. We believe that our audits provide a reasonable basis for our opinion.
In our opinion, the financial statements and financial highlights referred to above present fairly, in all material respects, the financial position of the MainStay Income Builder Fund of The MainStay Funds as of October 31, 2016, the results of its operations for the year then ended, the changes in its net assets for each of the years in the two-year period then ended, and the financial highlights for each of the years or the periods in the five-year period then ended, in conformity with U.S. generally accepted accounting principles.

Philadelphia, Pennsylvania
December 22, 2016
| | |
| 46 | | MainStay Income Builder Fund |
Federal Income Tax Information
(Unaudited)
The Fund is required under the Internal Revenue Code to advise shareholders in a written statement as to the federal tax status of dividends paid by the Fund during such fiscal years. Accordingly, the Fund paid $48,169,328 as long term capital gain distributions.
For the fiscal year ended October 31, 2016, the Fund designated approximately $25,416,148 under the Internal Revenue Code as qualified dividend income eligible for reduced tax rates.
The dividends paid by the Fund during the fiscal year ended October 31, 2016, should be multiplied by 21.1% to arrive at the corporate dividends received deduction.
In February 2017, shareholders will receive an IRS Form 1099-DIV or substitute Form 1099 which will show the federal tax status of the distributions received by shareholders in calendar year 2016. The amounts that will be reported on such 1099-DIV or substitute Form 1099 will be the amounts you are to use on your federal income tax return and will differ from the amounts which we must report for the Fund’s fiscal year ended October 31, 2016.
Proxy Voting Policies and Procedures
and Proxy Voting Record
A description of the policies and procedures that New York Life Investments uses to vote proxies related to the Fund’s securities is available without charge, upon request, (i) by visiting the Fund’s website at mainstayinvestments.com; or (ii) on the SEC’s website at www.sec.gov.
The Fund is required to file with the SEC its proxy voting record for the 12-month period ending June 30 on Form N-PX. The Fund’s most recent Form N-PX or proxy voting record is available free of charge upon request (i) by calling 800-MAINSTAY (624-6782); (ii) by visiting the Fund’s website at mainstayinvestments.com; or (iii) on the SEC’s website at www.sec.gov.
Shareholder Reports and Quarterly
Portfolio Disclosure
The Fund is required to file its complete schedule of portfolio holdings with the SEC for its first and third fiscal quarters on Form N-Q. The Fund’s Form N-Q is available without charge on the SEC’s website at www.sec.gov or by calling MainStay Investments at 800-MAINSTAY (624-6782). You also can obtain and review copies of Form N-Q by visiting the SEC’s Public Reference Room in Washington, DC (information on the operation of the Public Reference Room may be obtained by calling (1-800-SEC-0330).
Board of Trustees and Officers (Unaudited)
The Trustees and officers of the Funds are listed below. The Board oversees the MainStay Group of Funds, MainStay VP Funds Trust, MainStay DefinedTerm Municipal Opportunities Fund, the Manager and the Subadvisors, and elects the officers of the Funds who are responsible for the day-to-day operations of the Funds. Information pertaining to the Trustees and officers is set forth below. Each Trustee serves until his or her successor is elected and qualified or until his or her resignation, death or removal. Under the Retirement Policy, a Trustee must
tender his or her resignation by the end of the calendar year during which he or she reaches the age of 75 (although the Board of Trustees may make exceptions from time to time). Officers serve a term of one year and are elected annually by the Board of Trustees. The business address of each Trustee and officer listed below is 51 Madison Avenue, New York, New York 10010. A majority of the Trustees are not “interested persons” (as defined by the 1940 Act and rules “adopted” by the SEC thereunder) of the Fund (“Independent Trustees”).
| | | | | | | | | | | | |
| | | | | Name and Date of Birth | | Term of Office, Position(s) Held and Length of Service | | Principal Occupation(s) During Past Five Years | | Number of
Portfolios in
Fund Complex
Overseen by
Board Member | | Other Directorships Held By Board Member |
Interested Trustee | | | | Christopher O. Blunt* 5/13/62 | | MainStay Funds: Trustee since January 2016; MainStay Funds Trust: Trustee since January 2016. | | Executive Vice President (since 2009), President, Investments Group (since 2015), Member of the Executive Management Committee (since 2007), Co-President, Insurance and Agency Group (2012 to 2015), President, Insurance Group (2012 to 2014), Executive Vice President, Retirement Income Security (2008 to 2012), New York Life Insurance Company. | | 83 | | MainStay VP Funds Trust:
Trustee since January 2016 (31 portfolios); and
MainStay DefinedTerm Municipal Opportunities Fund: Trustee since January 2016. |
| | * | This Trustee is considered to be an “interested person” of the MainStay Group of Funds within the meaning of the 1940 Act because of his affiliation with New York Life Insurance Company, New York Life Investment Management LLC, Cornerstone Capital Management Holdings LLC, MacKay Shields LLC, Institutional Capital LLC, NYL Investors LLC, NYLIFE Securities LLC and/or NYLIFE Distributors LLC, as described in detail above in the column entitled “Principal Occupation(s) During Past Five Years.” |
| | |
| 48 | | MainStay Income Builder Fund |
| | | | | | | | | | | | |
| | | | | Name and Date of Birth | | Term of Office, Position(s) Held and Length of Service | | Principal Occupation(s) During Past Five Years | | Number of Portfolios in Fund Complex Overseen by Board Member | | Other Directorships Held By Board Member |
| Non-Interested Trustee | | | | David H. Chow 12/29/57 | | MainStay Funds: Trustee since January 2016, Advisory Board Member (June 2015 to December 2015); MainStay Funds Trust: Trustee since January 2016, Advisory Board Member (June 2015 to December 2015). | | Founder and CEO, DanCourt Management, LLC (since 1999) | | 83 | | MainStay VP Funds Trust: Trustee since January 2016, Advisory Board Member (June 2015 to December 2015); (31 portfolios);
MainStay DefinedTerm Municipal Opportunities Fund: Trustee since January 2016, Advisory Board Member (June 2015 to December 2015);
Market Vectors Group of Exchange-Traded Funds: Independent Chairman of the Board of Trustees since 2008 and Trustee since 2006 (55 portfolios); and
Berea College of Kentucky: Trustee since 2009. |
| | | | Susan B. Kerley 8/12/51 | | MainStay Funds: Trustee since 2007; MainStay Funds Trust: Trustee since 1990.*** | | President, Strategic Management Advisors LLC (since 1990) | | 83 | | MainStay VP Funds Trust: Trustee since 2007 (31 portfolios)**;
MainStay DefinedTerm Municipal Opportunities Fund: Trustee since 2011; and Legg Mason Partners Funds: Trustee since 1991 (53 portfolios). |
| | | | Alan R. Latshaw 3/27/51 | | MainStay Funds: Trustee and Audit Committee Financial Expert since 2006; MainStay Funds Trust: Trustee and Audit Committee Financial Expert since 2007.*** | | Retired; Partner, Ernst & Young LLP (2002 to 2003); Partner, Arthur Andersen LLP (1989 to 2002); Consultant to the MainStay Funds Audit and Compliance Committee (2004 to 2006) | | 83 | | MainStay VP Funds Trust: Trustee and Audit Committee Financial Expert since 2007 (31 portfolios)**;
MainStay DefinedTerm Municipal Opportunities Fund: Trustee and Audit Committee Financial Expert since 2011;
State Farm Associates Funds Trusts: Trustee since 2005 (4 portfolios);
State Farm Mutual Fund Trust: Trustee since 2005 (15 portfolios); and
State Farm Variable Product Trust: Trustee since 2005 (9 portfolios). |
| | | | Peter Meenan 12/5/41 | | MainStay Funds: Chairman since 2013 and Trustee since 2007; MainStay Funds Trust: Chairman since 2013 and Trustee since 2002.*** | | Retired; Independent Consultant (2004 to 2013); President and Chief Executive Officer, Babson—United, Inc. (financial services firm) (2000 to 2004); Independent Consultant (1999 to 2000); Head of Global Funds, Citicorp (1995 to 1999) | | 83 | | MainStay VP Funds Trust: Chairman since 2013 and Trustee since 2007 (31 portfolios)**; and
MainStay DefinedTerm Municipal Opportunities Fund: Chairman since 2013 and Trustee since 2011. |
| | | | Richard H. Nolan, Jr. 11/16/46 | | MainStay Funds: Trustee since 2007; MainStay Funds Trust: Trustee since 2007.*** | | Managing Director, ICC Capital Management (since 2004); President—Shields/Alliance, Alliance Capital Management (1994 to 2004) | | 83 | | MainStay VP Funds Trust: Trustee since 2006 (31 portfolios)**; and
MainStay DefinedTerm Municipal Opportunities Fund: Trustee since 2011. |
| | | | Jacques P. Perold 5/12/58 | | MainStay Funds: Trustee since January 2016, Advisory Board Member (June 2015 to December 2015); MainStay Funds Trust: Trustee since January 2016, Advisory Board Member (June 2015 to December 2015). | | Retired; President, Fidelity Management & Research Company (2009 to 2014); Founder, President and Chief Executive Officer, Geode Capital Management, LCC (2001 to 2009) | | 83 | | MainStay VP Funds Trust: Trustee since January 2016, Advisory Board Member (June 2015 to December 2015); (31 portfolios);
MainStay DefinedTerm Municipal Opportunities Fund: Trustee since January 2016, Advisory Board Member (June 2015 to December 2015);
Allstate Corporation: Director since 2015; and
Boston University: Trustee since 2014. |
| | | | | | | | | | | | |
| | | | | Name and Date of Birth | | Term of Office, Position(s) Held and Length of Service | | Principal Occupation(s) During Past Five Years | | Number of Portfolios in Fund Complex Overseen by Board Member | | Other Directorships Held By Board Member |
Non-Interested Trustee | | | | Richard S. Trutanic 2/13/52 | | MainStay Funds: Trustee since 1994; MainStay Funds Trust: Trustee since 2007.*** | | Chairman and Chief Executive Officer, Somerset & Company (financial advisory firm) (since 2004); Managing Director, The Carlyle Group (private investment firm) (2002 to 2004); Senior Managing Director, Partner and Board Member, Groupe Arnault S.A. (private investment firm) (1999 to 2002) | | 83 | | MainStay VP Funds Trust: Trustee since 2007 (31 portfolios)**; and
MainStay DefinedTerm Municipal Opportunities Fund: Trustee since 2011. |
| | | | John A. Weisser**** 10/22/41 | | MainStay Funds: Trustee since 2007; MainStay Funds Trust: Trustee since 2007.*** | | Retired; Managing Director of Salomon Brothers, Inc. (1971 to 1995) | | 83 | | MainStay VP Funds Trust: Trustee since 1997 (31 portfolios)**; MainStay DefinedTerm Municipal Opportunities Fund: Trustee since 2011; Direxion Insurance Trust: Trustee since 2007 (1 portfolio); Direxion Funds: Trustee since 2007 (18 portfolios); and Direxion Shares ETF Trust: Trustee since 2008 (52 portfolios). |
| | ** | Includes prior service as a Director of MainStay VP Series Fund, Inc., the predecessor to MainStay VP Funds Trust. |
| | *** | Includes prior service as a Director/Trustee of certain predecessor entities to MainStay Funds Trust. |
| | **** | Pursuant to the Retirement Policy, Mr. Weisser will retire from the Board of Trustees on or about December 31, 2016. |
| | |
| 50 | | MainStay Income Builder Fund |
| | | | | | | | |
| | | | | Name and Date of Birth | | Position(s) Held and Length of Service | | Principal Occupation(s) During Past Five Years |
Officers (Who Are Not Board Members)* | | | | Stephen P. Fisher 2/22/59 | | President, MainStay Funds (since 2007), MainStay Funds Trust (since 2009) | | Chairman and Chief Executive Officer (since 2014), President and Chief Operating Officer (2008 to 2013), NYLIFE Distributors LLC; Chairman of the Board, NYLIM Service Company LLC (since 2008); President (since May 2015), Co-President (2014 to 2015) and Senior Managing Director (since 2005), New York Life Investment Management LLC; President, MainStay DefinedTerm Municipal Opportunities Fund (since 2011) and MainStay VP Funds Trust (since 2007)** |
| | | | Jack R. Benintende 5/12/64 | | Treasurer and Principal Financial and Accounting Officer, MainStay Funds (since 2007), MainStay Funds Trust (since 2009) | | Managing Director, New York Life Investment Management LLC (since 2007); Treasurer and Principal Financial and Accounting Officer, MainStay DefinedTerm Municipal Opportunities Fund (since 2011) and MainStay VP Funds Trust (since 2007)**; and Assistant Treasurer, New York Life Investment Management Holdings LLC (2008 to 2012) |
| | | | Kevin M. Bopp 2/24/69 | | Vice President and Chief Compliance Officer, MainStay Funds and MainStay Funds Trust (since 2014) | | Chief Compliance Officer (since January 2016), Director and Associate General Counsel (2011 to 2014) and Vice President and Assistant General Counsel (2010 to 2011), New York Life Investment Management LLC; Vice President and Chief Compliance Officer, MainStay VP Funds Trust, MainStay DefinedTerm Municipal Opportunities Fund (since 2014); Assistant Secretary, MainStay Funds, MainStay Funds Trust and MainStay VP Funds Trust (2010 to 2014)**, MainStay DefinedTerm Municipal Opportunities Fund (2011 to 2014) |
| | | | J. Kevin Gao 10/13/67 | | Secretary and Chief Legal Officer, MainStay Funds and MainStay Funds Trust (since 2010) | | Managing Director and Associate General Counsel, New York Life Investment Management LLC (since 2010); Secretary and Chief Legal Officer, MainStay DefinedTerm Municipal Opportunities Fund (since 2011) and MainStay VP Funds Trust (since 2010)** |
| | | | Scott T. Harrington 2/8/59 | | Vice President— Administration, MainStay Funds (since 2005), MainStay Funds Trust (since 2009) | | Director, New York Life Investment Management LLC (including predecessor advisory organizations) (since 2000); Member of the Board of Directors, New York Life Trust Company (since 2009); Vice President—Administration, MainStay DefinedTerm Municipal Opportunities Fund (since 2011) and MainStay VP Funds Trust (since 2005)** |
| | * | The Officers listed above are considered to be “interested persons” of the MainStay Group of Funds within the meaning of the 1940 Act because of their affiliation with the MainStay Group of Funds, New York Life Insurance Company and/or its affiliates, including New York Life Investment Management LLC, NYLIM Service Company LLC, NYLIFE Securities LLC and/or NYLIFE Distributors LLC, as described in detail in the column captioned “Principal Occupation(s) During Past Five Years.” Officers are elected annually by the Board to serve a one year term. |
| | ** | Includes prior service as an Officer of MainStay VP Series Fund, Inc., the predecessor to MainStay VP Funds Trust. |
This page intentionally left blank
This page intentionally left blank
This page intentionally left blank
MainStay Funds
MainStay offers a wide range of Funds for virtually any investment need. The full array of MainStay open-end offerings is listed here, with information about the manager, subadvisors, legal counsel and independent registered public accounting firm.
Equity
U.S. Equity
MainStay Common Stock Fund
MainStay Cornerstone Growth Fund
MainStay Epoch U.S. All Cap Fund
MainStay Epoch U.S. Equity Yield Fund
MainStay Epoch U.S. Small Cap Fund
MainStay ICAP Equity Fund
MainStay ICAP Select Equity Fund
MainStay Large Cap Growth Fund
MainStay MAP Fund
MainStay S&P 500 Index Fund
MainStay U.S. Equity Opportunities Fund
International/Global Equity
MainStay Emerging Markets Opportunities Fund
MainStay Epoch Capital Growth Fund
MainStay Epoch Global Choice Fund
MainStay Epoch Global Equity Yield Fund
MainStay Epoch International Small Cap Fund
MainStay ICAP International Fund
MainStay International Equity Fund
MainStay International Opportunities Fund
Income
Taxable Bond
MainStay Floating Rate Fund
MainStay Global High Income Fund
MainStay Government Fund
MainStay High Yield Corporate Bond Fund
MainStay High Yield Opportunities Fund
MainStay Indexed Bond Fund
MainStay Short Duration High Yield Fund
MainStay Total Return Bond Fund
MainStay Unconstrained Bond Fund
Municipal/Tax Advantaged Bond
MainStay California Tax Free Opportunities Fund1
MainStay High Yield Municipal Bond Fund
MainStay New York Tax Free Opportunities Fund2
MainStay Tax Advantaged Short Term Bond Fund
MainStay Tax Free Bond Fund
Money Market
MainStay Money Market Fund
Mixed Asset
MainStay Balanced Fund
MainStay Convertible Fund
MainStay Income Builder Fund
Alternative
MainStay Absolute Return Multi-Strategy Fund
MainStay Cushing Energy Income Fund
MainStay Cushing MLP Premier Fund
MainStay Cushing Renaissance Advantage Fund
Asset Allocation/Target Date
MainStay Conservative Allocation Fund
MainStay Growth Allocation Fund
MainStay Moderate Allocation Fund
MainStay Moderate Growth Allocation Fund
MainStay Retirement 2010 Fund
MainStay Retirement 2020 Fund
MainStay Retirement 2030 Fund
MainStay Retirement 2040 Fund
MainStay Retirement 2050 Fund
MainStay Retirement 2060 Fund
Manager
New York Life Investment Management LLC
New York, New York
Subadvisors
Candriam France S.A.S.3
Paris, France
Cornerstone Capital Management Holdings LLC3
New York, New York
Cushing Asset Management, LP
Dallas, Texas
Epoch Investment Partners, Inc.
New York, New York
Institutional Capital LLC3
Chicago, Illinois
MacKay Shields LLC3
New York, New York
Markston International LLC
White Plains, New York
NYL Investors LLC3
New York, New York
Winslow Capital Management, LLC
Minneapolis, Minnesota
Legal Counsel
Dechert LLP
Washington, District of Columbia
Independent Registered Public Accounting Firm
KPMG LLP
Philadelphia, Pennsylvania
1. This Fund is only registered for sale in AZ, CA, MI (Class A and Class I shares only), NV, OR, TX, UT and WA.
2. This Fund is only registered for sale in CA, CT, DE, FL, MA, NJ, NY and VT.
3. An affiliate of New York Life Investment Management LLC.
Not part of the Annual Report
For more information
800-MAINSTAY (624-6782)
mainstayinvestments.com
MainStay Investments® is a registered service mark and name under which New York Life Investment Management LLC does business. MainStay Investments, an indirect subsidiary of New York Life Insurance Company, New York, NY 10010, provides investment advisory products and services. The MainStay Funds® are managed by New York Life Investment Management LLC and distributed by NYLIFE Distributors LLC, 30 Hudson Street, Jersey City, NJ 07302, a wholly owned subsidiary of New York Life Insurance Company. NYLIFE Distributors LLC is a Member FINRA/SIPC.
©2016 NYLIFE Distributors LLC. All rights reserved.
| | | | | | | | |
| Not FDIC/NCUA Insured | | Not a Deposit | | May Lose Value | | No Bank Guarantee | | Not Insured by Any Government Agency |
| | |
| 1717042 MS316-16 | | MSIB11-12/16 (NYLIM) NL216 |
MainStay Global High Income Fund
Message from the President and Annual Report
October 31, 2016


This page intentionally left blank
Message from the President
During the 12 months ended October 31, 2016, the U.S. stock and bond markets were somewhat volatile but generally ended the reporting period in positive territory. In the fall of 2015 and early 2016, the market appeared to be focused on China’s economic weakness and a prolonged decline in oil prices. Although energy-related companies felt the brunt of these setbacks, the stock market as a whole declined until mid-February, when oil prices began to rise and stocks began a relatively steady recovery.
In late June, the United Kingdom voted to leave the European Union in a referendum popularly known as “Brexit.” The news caused a temporary slump in stocks around the world. Although the British pound dropped in value following the vote, stocks generally recovered through the end of the reporting period. As the end of the reporting period approached, speculation about the upcoming U.S. presidential election heightened market volatility.
According to FTSE-Russell data, U.S. stocks as a whole tended to provide positive returns during the reporting period, with large-capitalization stocks generally outperforming stocks of smaller companies. Value stocks outpaced growth stocks at all capitalization levels, with the largest differences among small- to mid-cap stocks.
International and emerging-market stocks provided mixed performance. Rocked by Brexit, European stocks as a whole declined during the reporting period, while stocks in the Asia-Pacific region (with or without Japan) tended to provide positive returns. International stocks as a whole declined, while global stocks advanced slightly. Emerging-market stocks were considerably stronger, boosted by advances in India and Latin America and higher prices for oil, metals and other commodities.
Anticipation of a possible Federal Reserve rate hike led to volatility in the bond market, but the Federal Open Market Committee chose not to raise the federal funds target rate during the reporting period. Short-term U.S. Treasury yields rose during the reporting period, and longer-term U.S. Treasury yields declined. Overall, the U.S. bond market provided positive returns, with longer-term bonds generally outperforming shorter-term securities. High-yield bonds, particularly
longer-term issues, were strong performers. Municipal bonds generally provided positive single-digit total returns for the 12 months ended October 31, 2016.
Central banks around the world remained highly accommodative during the reporting period, particularly in light of Brexit. Shortly after the U.K. referendum, more than a third of all sovereign debt carried negative yields. As an asset class, emerging-market bonds provided double-digit positive returns during the reporting period, and world bonds as a whole provided positive single-digit positive returns.
At MainStay, we know that political, economic and market events may influence the performance of your Fund investments. While our portfolio managers often pay close attention to such events, their primary emphasis is seeking to invest for the long-term investment needs of our shareholders. With this in mind, they seek to pursue the investment objectives of their respective Funds using the principal investment strategies and investment processes outlined in the prospectus. By placing your assets in the care of our investment professionals, you gain access to their extensive market insight, strategic investment discipline and in-depth experience in risk-management over a wide range of market cycles.
The report that follows provides more detailed information about the market forces, portfolio strategies and individual securities that influenced the performance of your MainStay Fund during the 12 months ended October 31, 2016. We invite you to read the report carefully as part of your personal investment-review process.
We thank you for your business, and we look forward to a continuing relationship as you pursue your long-range financial goals.
Sincerely,

Stephen P. Fisher
President
The opinions expressed are as of the date of this report and are subject to change. There is no guarantee that any forecast made will come to pass. This material does not constitute investment advice and is not intended as an endorsement of any specific investment. Past performance is no guarantee of future results.
Not part of the Annual Report
Table of Contents
Investors should refer to the Fund’s Summary Prospectus and/or Prospectus and consider the Fund’s investment objectives, strategies, risks, charges and expenses carefully before investing. The Summary Prospectus and/or Prospectus contain this and other information about the Fund. You may obtain copies of the Fund’s Summary Prospectus, Prospectus and Statement of Additional Information free of charge, upon request, by calling toll-free 800-MAINSTAY (624-6782), by writing to NYLIFE Distributors LLC, Attn: MainStay Marketing Department, 30 Hudson Street, Jersey City, NJ 07302 or by sending an e-mail to MainStayShareholderServices@nylim.com. These documents are also available via the MainStay Funds’ website at mainstayinvestments.com/documents. Please read the Summary Prospectus and/or Prospectus carefully before investing.
Investment and Performance Comparison1 (Unaudited)
Performance data quoted represents past performance. Past performance is no guarantee of future results. Because of market volatility and other factors, current performance may be lower or higher than the figures shown. Investment return and principal value will fluctuate, and as a result, when shares are redeemed, they may be worth more or less than their original cost. The graph below depicts the historical performance of Class B shares of the Fund. Performance will vary from class to class based on differences in class-specific expenses and sales charges. For performance information current to the most recent month-end, please call 800-MAINSTAY (624-6782) or visit mainstayinvestments.com.
(With sales charges)
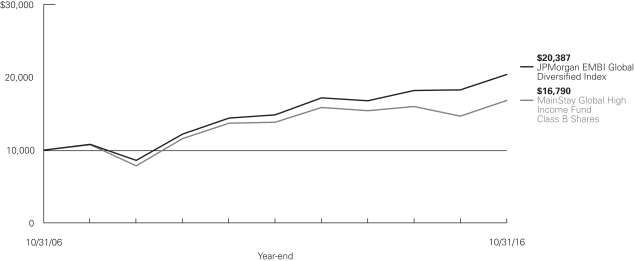
Average Annual Total Returns for the Year Ended October 31, 2016
| | | | | | | | | | | | | | | | | | | | |
| Class | | Sales Charge | | | | One Year | | | Five Years | | | Ten Years | | | Gross
Expense
Ratio2 | |
| Class A Shares | | Maximum 4.5% Initial Sales Charge | | With sales charges Excluding sales charges | |
| 10.43
15.63 | %
| |
| 3.95
4.91 | %
| |
| 5.76
6.25 | %
| |
| 1.23
1.23 | %
|
| Investor Class Shares3 | | Maximum 4.5% Initial Sales Charge | | With sales charges Excluding sales charges | |
| 10.19
15.38 |
| |
| 3.77
4.73 |
| |
| 5.61
6.10 |
| |
| 1.41
1.41 |
|
| Class B Shares | | Maximum 5% CDSC if Redeemed Within the First Six Years of Purchase | | With sales charges Excluding sales charges | |
| 9.60
14.60 |
| |
| 3.65
3.96 |
| |
| 5.32
5.32 |
| |
| 2.16
2.16 |
|
| Class C Shares | | Maximum 1% CDSC if Redeemed Within One Year of Purchase | | With sales charges Excluding sales charges | |
| 13.58
14.58 |
| |
| 3.95
3.95 |
| |
| 5.32
5.32 |
| |
| 2.16
2.16 |
|
| Class I Shares4 | | No Sales Charge | | | | | 15.90 | | | | 5.17 | | | | 6.51 | | | | 0.98 | |
| 1. | The performance table and graph do not reflect the deduction of taxes that a shareholder would pay on distributions or Fund share redemptions. Total returns reflect maximum applicable sales charges as indicated in the table above, if any, changes in share price, and reinvestment of dividend and capital gain distributions. The graph assumes the initial investment amount shown above and reflects the deduction of all sales charges that would have applied for the period of investment. Performance figures may reflect certain fee waivers and/or expense limitations, without which total returns may have been lower. For more information on share classes and current fee waivers and/or expense limitations (if any), please refer to the notes to the financial statements. |
| 2. | The gross expense ratios presented reflect the Fund’s “Total Annual Fund Operating Expenses” from the most recent Prospectus and may differ from other expense ratios disclosed in this report. |
| 3. | Performance figures for Investor Class shares, first offered on February 28, 2008, include the historical performance of Class A shares through February 27, 2008, adjusted for differences in certain fees and expenses. Unadjusted, the performance shown for the Investor Class shares would likely have been different. |
| 4. | Performance figures for Class I shares, first offered on August 31, 2007, include the historical performance of Class A shares through August 30, 2007, adjusted for certain fees and expenses. Unadjusted, the performance shown for the Class I shares would likely have been different. |
The footnotes on the next page are an integral part of the table and graph and should be carefully read in conjunction with them.
| | | | | | | | | | | | |
| Benchmark Performance | | One
Year | | | Five
Years | | | Ten
Years | |
JPMorgan EMBI Global Diversified Index5 | | | 11.70 | % | | | 6.56 | % | | | 7.38 | % |
Average Lipper Emerging Markets Hard Currency Debt Fund6 | | | 10.53 | | | | 4.25 | | | | 6.22 | |
| 5. | The JPMorgan EMBI Global Diversified Index is the Fund’s primary broad-based securities market index for comparison purposes. The JPMorgan EMBI Global Diversified Index is a market-capitalization weighted, total return index tracking the traded market for U.S. dollar-denominated Brady Bonds, Eurobonds, traded loans and local market debt instruments issued by sovereign and quasi-sovereign entities. Results assume reinvestment of all dividends and capital gains. An investment cannot be made directly in an index. |
| 6. | The Average Lipper Emerging Markets Hard Currency Debt Fund is representative of funds that seek either current income or total return by investing at least 65% of total assets in emerging market debt securities, where “emerging market” is defined by a country’s GNP per capita or other economic measures. This benchmark is a product of Lipper Inc. Lipper Inc. is an independent monitor of fund performance. Results are based on average total returns of similar funds with all dividend and capital gain distributions reinvested. |
The footnotes on the preceding page are an integral part of the table and graph and should be carefully read in conjunction with them.
| | |
| 6 | | MainStay Global High Income Fund |
Cost in Dollars of a $1,000 Investment in MainStay Global High Income Fund (Unaudited)
The example below is intended to describe the fees and expenses borne by shareholders during the six-month period from May 1, 2016, to October 31, 2016, and the impact of those costs on your investment.
Example
As a shareholder of the Fund, you incur two types of costs: (1) transaction costs, including exchange fees and sales charges (loads) on purchases (as applicable), and (2) ongoing costs, including management fees, distribution and/or service (12b-1) fees, and other Fund expenses (as applicable). This example is intended to help you understand your ongoing costs (in dollars) of investing in the Fund and to compare these costs with the ongoing costs of investing in other mutual funds. The example is based on an investment of $1,000 made at the beginning of the six-month period and held for the entire period from May 1, 2016, to October 31, 2016.
This example illustrates your Fund’s ongoing costs in two ways:
Actual Expenses
The second and third data columns in the table below provide information about actual account values and actual expenses. You may use the information in these columns, together with the amount you invested, to estimate the expenses that you paid during the six months ended October 31, 2016. Simply divide your account value by $1,000 (for example, an $8,600 account value divided by $1,000 = 8.6), then
multiply the result by the number under the heading entitled “Expenses Paid During Period” to estimate the expenses you paid on your account during this period.
Hypothetical Example for Comparison Purposes
The fourth and fifth data columns in the table below provide information about hypothetical account values and hypothetical expenses based on the Fund’s actual expense ratio and an assumed rate of return of 5% per year before expenses, which is not the Fund’s actual return. The hypothetical account values and expenses may not be used to estimate the actual ending account balances or expenses you paid for the six-month period shown. You may use this information to compare the ongoing costs of investing in the Fund with the ongoing costs of investing in other Funds. To do so, compare this 5% hypothetical example with the 5% hypothetical examples that appear in the shareholder reports of the other Funds.
Please note that the expenses shown in the table are meant to highlight your ongoing costs only and do not reflect any transactional costs, such as exchange fees or sales charges (loads). Therefore, the fourth and fifth data columns of the table are useful in comparing ongoing costs only and will not help you determine the relative total costs of owning different funds. In addition, if these transactional costs were included, your costs would have been higher.
| | | | | | | | | | | | | | | | | | | | |
| | | | | | | | | | | | | | | | |
| Share Class | | Beginning
Account
Value
5/1/16 | | | Ending Account
Value (Based
on Actual
Returns and
Expenses)
10/31/16 | | | Expenses
Paid
During
Period1 | | | Ending Account
Value (Based
on Hypothetical
5% Annualized
Return and
Actual Expenses)
10/31/16 | | | Expenses
Paid
During
Period1 | |
| | | | | |
| Class A Shares | | $ | 1,000.00 | | | $ | 1,085.50 | | | $ | 6.40 | | | $ | 1,019.00 | | | $ | 6.19 | |
| | | | | |
| Investor Class Shares | | $ | 1,000.00 | | | $ | 1,083.70 | | | $ | 7.33 | | | $ | 1,018.10 | | | $ | 7.10 | |
| | | | | |
| Class B Shares | | $ | 1,000.00 | | | $ | 1,079.80 | | | $ | 11.24 | | | $ | 1,014.30 | | | $ | 10.89 | |
| | | | | |
| Class C Shares | | $ | 1,000.00 | | | $ | 1,079.70 | | | $ | 11.24 | | | $ | 1,014.30 | | | $ | 10.89 | |
| | | | | |
| Class I Shares | | $ | 1,000.00 | | | $ | 1,085.60 | | | $ | 5.09 | | | $ | 1,020.30 | | | $ | 4.93 | |
| 1. | Expenses are equal to the Fund’s annualized expense ratio of each class (1.22% for Class A, 1.40% for Investor Class, 2.15% for Class B and Class C and 0.97% for Class I) multiplied by the average account value over the period, divided by 366 and multiplied by 184 (to reflect the six-month period). The table above represents the actual expenses incurred during the six-month period. |
Country Composition as of October 31, 2016 (Unaudited)
| | | | |
| Mexico | | | 8.4 | % |
| Russia | | | 6.8 | |
| Indonesia | | | 5.7 | |
| Brazil | | | 5.5 | |
| Peru | | | 5.3 | |
| Kazakhstan | | | 4.6 | |
| Venezuela | | | 4.1 | |
| India | | | 4.0 | |
| China | | | 3.4 | |
| Sri Lanka | | | 3.4 | |
| Turkey | | | 3.1 | |
| Croatia | | | 3.0 | |
| Dominican Republic | | | 2.8 | |
| United States | | | 2.8 | |
| Costa Rica | | | 2.4 | |
| Hungary | | | 2.3 | |
| El Salvador | | | 2.2 | |
| Paraguay | | | 2.2 | |
| Saudi Arabia | | | 2.1 | |
| Uruguay | | | 2.1 | |
| Panama | | | 2.0 | |
| Ukraine | | | 1.9 | |
| | | | |
| Guatemala | | | 1.5 | % |
| Argentina | | | 1.4 | |
| Pakistan | | | 1.4 | |
| United Arab Emirates | | | 1.4 | |
| Ghana | | | 1.2 | |
| Luxembourg | | | 1.2 | |
| Belarus | | | 1.1 | |
| Georgia | | | 1.1 | |
| Vietnam | | | 1.1 | |
| Ivory Coast | | | 1.0 | |
| Nigeria | | | 1.0 | |
| South Africa | | | 1.0 | |
| Hong Kong | | | 0.8 | |
| Senegal | | | 0.7 | |
| Cameroon, United Republic of | | | 0.6 | |
| Gabon | | | 0.6 | |
| Israel | | | 0.5 | |
| Kenya | | | 0.5 | |
| Netherlands | | | 0.5 | |
| Other Assets, Less Liabilities | | | 1.3 | |
| | | | |
| | | 100.0 | % |
| | | | |
See Portfolio of Investments beginning on page 11 for specific holdings within these categories.
Top Ten Issuers Held as of October 31, 2016 (excluding short-term investment) (Unaudited)
| 1. | KazMunayGas National Co. JSC, 4.40%–5.75%, due 4/30/23–4/30/43 |
| 2. | Peruvian Government International Bond, 7.35%, due 7/21/25 |
| 3. | Sri Lanka Government International Bond, 6.25%, due 10/4/20 |
| 4. | Pertamina Persero PT, 5.625%, due 5/20/43 |
| 5. | Petrobras Global Finance B.V., 5.375%–8.75%, due 1/27/21–6/5/2115 |
| 6. | Croatia Government International Bond, 6.00%–6.375%, due 3/24/21–1/26/24 |
| 7. | Dominican Republic International Bond, 6.875%–7.50%, due 5/6/21–1/29/26 |
| 8. | Venezuela Government International Bond, 9.25%, due 5/7/28 |
| 9. | Turkey Government International Bond, 6.625%–7.375%, due 2/5/25–2/17/45 |
| 10. | Hungary Government International Bond, 7.625%, due 3/29/41 |
| | |
| 8 | | MainStay Global High Income Fund |
Portfolio Management Discussion and Analysis (Unaudited)
Questions answered by portfolio managers Dan Roberts, PhD, Michael Kimble, CFA, and Jakob Bak, PhD, CFA, of MacKay Shields LLC, the Fund’s Subadvisor.
How did MainStay Global High Income Fund perform relative to its primary benchmark and peers during the 12 months ended October 31, 2016?
Excluding all sales charges, MainStay Global High Income Fund returned 15.63% for Class A shares, 15.38% for Investor Class shares, 14.60% for Class B shares and 14.58% for Class C shares for the 12 months ended October 31, 2016. Over the same period, the Fund’s Class I shares returned 15.90%. For the 12 months ended October 31, 2016, all share classes outperformed the 11.70% return of the JPMorgan EMBI Global Diversified Index,1 which is the Fund’s broad-based securities-market index, and the 10.53% return of the Average Lipper2 Emerging Markets Hard Currency Debt Fund. See page 5 for Fund returns with applicable sales charges.
What factors affected the Fund’s relative performance during the reporting period?
The Fund’s outperformance relative to the JPMorgan EMBI Global Diversified Index resulted primarily from its higher beta,3 as well as its local-currency bonds and forwards. In particular, the Fund’s long foreign exchange positions in the Brazilian real, Uruguayan peso, Turkish lira, Russian ruble and Indonesian rupee as well as a short position in the English pound contributed positively to the Fund’s relative performance. (Contributions take weightings and total returns into account.) In contrast, a long position in the Mexican peso modestly detracted from the Fund’s relative performance.
The Fund’s long corporate position in Brazil also added to performance as the political uncertainty surrounding the possible impeachment of the nation’s president was mostly resolved and commodity prices rebounded. Higher commodity prices also helped the Fund’s bond returns in Russia, Venezuela, Indonesia and Kazakhstan. On the other hand, the Fund’s underweight allocations to the Philippines, Ecuador and Malaysia, coupled with an overweight allocation to Mexico, detracted from the Fund’s performance relative to the JPMorgan EMBI Global Diversified Index.
What was the Fund’s duration4 strategy during the reporting period?
Throughout the reporting period, our goal was to maintain the Fund’s duration in line with that of the JPMorgan EMBI Global Diversified Index. As of October 31, 2016, the Fund’s duration was 6.98 years, just slightly longer than the 6.52-year duration of the JPMorgan EMBI Global Diversified Index.
What specific factors, risks or market forces prompted significant decisions for the Fund during the reporting period?
Throughout the reporting period, there were many events that had to be considered in positioning the Fund. Among these were inconsistent economic data, global central bank monetary policy, volatility in energy prices, China’s slowing economy and a flattening yield curve.5
The most important decision was to keep the Fund’s beta high despite the large sell-off in emerging markets during the first few months of the reporting period. Commodity prices, especially oil prices, had collapsed to levels that seemed to us to be entirely unsustainable for very long, as they were well below most production costs. We took this as an opportunity to purchase some low-cost producers, such as Southern Copper and Norilsk Nickel.
Another important decision was how to handle the political situation in Brazil, which had plunged the country into the worst recession in its history and eventually caused the impeachment of the nation’s president. By the beginning of 2016, the Brazilian real had lost almost half of its value and the interest rate on the local 10-year bond was more than 16%. With an implied real yield of around 8% and a dwindling current account deficit, we felt that the Fund was more than adequately paid for the risk of holding Brazilian local bonds, and we made a purchase for the Fund. We also increased the Fund’s exposure to the national oil company Petrobras, as we felt that the sell-off had been much too severe.
The election of a pragmatic president in Argentina and the subsequent settlement with holders of previously defaulted bonds provided us with the opportunity to invest in both sovereign and provincial bonds at attractive yields. After the sovereign bonds tightened to less attractive yields and economic reforms started to falter somewhat, we sold the bonds at a profit.
A surprise coup attempt in Turkey required us to make some fairly quick decisions. Although it was soon clear that the coup had failed, we determined that the uprising would end up strengthening the president’s power. Given his previous comments on monetary policy, we felt that it would be best to unwind all of the Fund’s local Turkish lira positions.
| 1. | See footnote on page 6 for more information on the JPMorgan EMBI Global Diversified Index. |
| 2. | See footnote on page 6 for more information on Lipper Inc. |
| 3. | Beta is a measure of volatility in relation to the market as a whole. A beta higher than 1 indicates that a security or portfolio will tend to exhibit higher volatility than the market. A beta lower than 1 indicates that a security or portfolio will tend to exhibit lower volatility than the market. |
| 4. | Duration is a measure of the price sensitivity of a fixed-income investment to changes in interest rates. Duration is expressed as a number of years and is considered a more accurate sensitivity gauge than average maturity. |
| 5. | The yield curve is a line that plots the yields of various securities of similar quality—typically U.S. Treasury issues—across a range of maturities. The U.S. Treasury yield curve serves as a benchmark for other debt and is used in economic forecasting. |
During the reporting period, which market segments were the strongest positive contributors to the Fund’s performance and which market segments were particularly weak?
The strongest positive contributors to the Fund’s absolute performance during the reporting period were Brazilian, Venezuelan, Indonesian, Kazakh and Russian bonds. The only bond that caused a significant loss for the Fund during the reporting period was CGG, an oil and geophysical services provider.
Did the Fund make any significant purchases or sales during the reporting period?
The Fund purchased local Brazilian bonds in early 2016 and sold them after they had rallied significantly. The Fund also purchased sovereign dollar denominated bonds from Croatia, Ivory Coast, Ukraine, Saudi Arabia, Pakistan, Guatemala and El Salvador, as well as some high-quality Chinese U.S. dollar-denominated corporate bonds.
Significant sales included corporate bonds issued by Vimplecom, Novatek, Grupo Bimbo, Colombia Telecomm, Banco Continental and some of the Fund’s positions in Pemex and Alrosa. We also sold some of the Fund’s long-dated Hungarian bonds. After the Turkish coup attempt, we sold all of the Fund’s local-currency Turkish bonds and unwound the Fund’s Turkish lira forward position.
How did the Fund’s sector and country weightings change during the reporting period?
The biggest change was the aforementioned reduction of the Fund’s exposure to Turkey because of increased risk. The Fund also significantly reduced its exposure to Hungary and Paraguay as part of our duration-management strategy. During the reporting period, the Fund significantly increased its weightings in Croatia, Saudi Arabia, China and Ukraine.
How was the Fund positioned at the end of the reporting period?
As of October 31, 2016, the Fund held an overweight position relative to the JPMorgan EMBI Global Diversified Index in credit risk. As of the same date, the Fund had a close-to-neutral duration in relation to the Index.
In spite of volatility in the markets, our baseline view on Federal Reserve policy, economic fundamentals and valuations in the credit markets did not change. We believed that economic growth in the United States would continue to be moderate and that the Federal Reserve would remain highly accommodative (though we believed that a future Federal Reserve increase in the federal funds target range remained likely). Our central belief was that monetary policy would play a critical role in the creation of credit and that the Federal Reserve retained the ability to control monetary policy through its influence on short-term interest rates.
The opinions expressed are those of the portfolio managers as of the date of this report and are subject to change. There is no guarantee that any forecasts will come to pass. This material does not constitute investment advice and is not intended as an endorsement of any specific investment.
| | |
| 10 | | MainStay Global High Income Fund |
Portfolio of Investments October 31, 2016
| | | | | | | | |
| | | Principal
Amount | | | Value | |
| | | | | | | | |
Long-Term Bonds 95.9%† Corporate Bonds 45.0% | |
Brazil 5.5% | | | | | | | | |
Banco Bradesco S.A.
5.90%, due 1/16/21 (a) | | $ | 1,500,000 | | | $ | 1,557,000 | |
Braskem America Finance Co.
7.125%, due 7/22/41 (a) | | | 1,500,000 | | | | 1,555,320 | |
¨Petrobras Global Finance B.V. | | | | | | | | |
5.375%, due 1/27/21 | | | 3,000,000 | | | | 2,970,600 | |
6.85%, due 6/5/2115 | | | 1,000,000 | | | | 850,000 | |
8.75%, due 5/23/26 | | | 2,000,000 | | | | 2,253,000 | |
Vale Overseas, Ltd.
6.875%, due 11/21/36 | | | 1,800,000 | | | | 1,815,210 | |
| | | | | | | | |
| | | | | | | 11,001,130 | |
| | | | | | | | |
China 3.4% | | | | | | | | |
Alibaba Group Holding, Ltd.
4.50%, due 11/28/34 | | | 2,000,000 | | | | 2,107,300 | |
JD.com, Inc.
3.875%, due 4/29/26 | | | 1,500,000 | | | | 1,458,431 | |
Proven Honour Capital, Ltd.
Series Reg S
4.125%, due 5/19/25 | | | 1,500,000 | | | | 1,569,960 | |
Tencent Holdings, Ltd.
Series Reg S
3.80%, due 2/11/25 | | | 1,500,000 | | | | 1,585,855 | |
| | | | | | | | |
| | | | | | | 6,721,546 | |
| | | | | | | | |
Hong Kong 0.8% | | | | | | | | |
MCE Finance, Ltd.
5.00%, due 2/15/21 (a) | | | 1,500,000 | | | | 1,499,886 | |
| | | | | | | | |
| | |
India 4.0% | | | | | | | | |
Bharti Airtel International Netherlands B.V.
Series Reg S
5.125%, due 3/11/23 | | | 2,000,000 | | | | 2,150,298 | |
Glenmark Pharmaceuticals, Ltd.
Series Reg S
4.50%, due 8/2/21 | | | 1,000,000 | | | | 1,004,847 | |
ICICI Bank, Ltd.
6.375%, due 4/30/22 (a)(b) | | | 1,000,000 | | | | 1,013,613 | |
Reliance Holding USA, Inc.
5.40%, due 2/14/22 (a) | | | 1,000,000 | | | | 1,116,173 | |
Tata Motors, Ltd.
Series Reg S
5.75%, due 10/30/24 | | | 1,500,000 | | | | 1,623,750 | |
Vedanta Resources PLC
8.25%, due 6/7/21 (a) | | | 1,005,000 | | | | 1,028,919 | |
| | | | | | | | |
| | | | | | | 7,937,600 | |
| | | | | | | | |
| | | | | | | | |
| | | Principal
Amount | | | Value | |
| | | | | | | | |
Indonesia 4.9% | | | | | | | | |
¨Pertamina Persero PT
5.625%, due 5/20/43 (a) | | $ | 6,700,000 | | | $ | 6,720,683 | |
Perusahaan Listrik Negara PT
Series Reg S
5.25%, due 10/24/42 | | | 3,000,000 | | | | 2,983,500 | |
| | | | | | | | |
| | | | | | | 9,704,183 | |
| | | | | | | | |
Israel 0.5% | | | | | | | | |
Delek & Avner Tamar Bond, Ltd.
5.412%, due 12/30/25 (a) | | | 1,000,000 | | | | 1,065,000 | |
| | | | | | | | |
| | |
Kazakhstan 4.6% | | | | | | | | |
Kazakhstan Temir Zholy Finance B.V.
6.375%, due 10/6/20 (a) | | | 1,000,000 | | | | 1,062,500 | |
¨KazMunayGas National Co. JSC | | | | | | | | |
4.40%, due 4/30/23 (a) | | | 6,000,000 | | | | 6,063,000 | |
5.75%, due 4/30/43 (a) | | | 2,000,000 | | | | 2,005,000 | |
| | | | | | | | |
| | | | | | | 9,130,500 | |
| | | | | | | | |
Luxembourg 1.2% | | | | | | | | |
Minerva Luxembourg S.A.
6.50%, due 9/20/26 (a) | | | 2,375,000 | | | | 2,326,075 | |
| | | | | | | | |
| | |
Mexico 7.6% | | | | | | | | |
Banco Nacional de Comercio Exterior SNC
3.80%, due 8/11/26 (a)(b) | | | 4,000,000 | | | | 3,960,000 | |
Cemex Finance LLC
6.00%, due 4/1/24 (a) | | | 2,000,000 | | | | 2,070,000 | |
Comision Federal de Electricidad
4.875%, due 1/15/24 (a) | | | 2,000,000 | | | | 2,080,000 | |
Grupo Televisa S.A.B. | | | | | | | | |
4.625%, due 1/30/26 | | | 1,500,000 | | | | 1,600,036 | |
6.125%, due 1/31/46 | | | 1,000,000 | | | | 1,091,315 | |
Petroleos Mexicanos
5.625%, due 1/23/46 | | | 5,000,000 | | | | 4,323,750 | |
| | | | | | | | |
| | | | | | | 15,125,101 | |
| | | | | | | | |
Netherlands 0.5% | | | | | | | | |
Samvardhana Motherson Automotive Systems Group B.V.
Series Reg S
4.875%, due 12/16/21 | | | 1,000,000 | | | | 1,017,500 | |
| | | | | | | | |
| | |
Peru 1.3% | | | | | | | | |
Banco de Credito del
4.25%, due 4/1/23 (a) | | | 1,000,000 | | | | 1,072,500 | |
Southern Copper Corp.
5.875%, due 4/23/45 | | | 1,500,000 | | | | 1,498,581 | |
| | | | | | | | |
| | | | | | | 2,571,081 | |
| | | | | | | | |
| † | Percentages indicated are based on Fund net assets. |
| ¨ | | Among the Fund’s 10 largest issuers held, as of October 31, 2016, excluding short-term investment. May be subject to change daily. (Unaudited) |
| | | | | | |
The notes to the financial statements are an integral part of,
and should be read in conjunction with, the financial statements. | | | | | 11 | |
Portfolio of Investments October 31, 2016 (continued)
| | | | | | | | |
| | | Principal
Amount | | | Value | |
| | | | | | | | |
| Corporate Bonds (continued) | |
Russia 5.1% | | | | | | | | |
ALROSA Finance S.A.
7.75%, due 11/3/20 (a) | | $ | 1,500,000 | | | $ | 1,702,725 | |
Gazprom OAO via Gaz Capital S.A.
Series Reg S
8.625%, due 4/28/34 | | | 1,500,000 | | | | 1,925,625 | |
Lukoil International Finance B.V.
6.656%, due 6/7/22 (a) | | | 1,000,000 | | | | 1,122,256 | |
Metalloinvest Finance DAC
Series Reg S
5.625%, due 4/17/20 | | | 2,000,000 | | | | 2,080,000 | |
MMC Norilsk Nickel OJSC via MMC Finance DAC
6.625%, due 10/14/22 (a) | | | 1,500,000 | | | | 1,672,500 | |
VimpelCom Holdings B.V.
7.504%, due 3/1/22 (a) | | | 1,500,000 | | | | 1,656,015 | |
| | | | | | | | |
| | | | | | | 10,159,121 | |
| | | | | | | | |
Saudi Arabia 1.0% | | | | | | | | |
Saudi Electricity Global Sukuk Co.
4.00%, due 4/8/24 (a) | | | 2,000,000 | | | | 2,068,400 | |
| | | | | | | | |
| | |
South Africa 1.0% | | | | | | | | |
Eskom Holdings SOC, Ltd.
7.125%, due 2/11/25 (a) | | | 2,000,000 | | | | 2,069,280 | |
| | | | | | | | |
| | |
Turkey 0.7% | | | | | | | | |
Arcelik A.S.
5.00%, due 4/3/23 (a) | | | 1,500,000 | | | | 1,472,700 | |
| | | | | | | | |
| | |
United Arab Emirates 1.4% | | | | | | | | |
Abu Dhabi National Energy Co. PJSC
3.625%, due 1/12/23 (a) | | | 2,750,000 | | | | 2,802,377 | |
| | | | | | | | |
| | |
Venezuela 1.5% | | | | | | | | |
Petroleos de Venezuela S.A.
Series Reg S
12.75%, due 2/17/22 | | | 5,000,000 | | | | 2,962,500 | |
| | | | | | | | |
Total Corporate Bonds
(Cost $89,025,939) | | | | | | | 89,633,980 | |
| | | | | | | | |
|
| Government & Federal Agencies 50.9% | |
Argentina 1.4% | | | | | | | | |
City of Buenos Aires Argentina
8.95%, due 2/19/21 (a) | | | 1,000,000 | | | | 1,127,500 | |
Provincia de Buenos Aires
9.125%, due 3/16/24 (a) | | | 1,500,000 | | | | 1,661,250 | |
| | | | | | | | |
| | | | | | | 2,788,750 | |
| | | | | | | | |
| | | | | | | | |
| | | Principal Amount | | | Value | |
| | | | | | | | |
Belarus 1.1% | | | | | | | | |
Republic of Belarus International Bond
Series Reg S
8.95%, due 1/26/18 | | $ | 2,000,000 | | | $ | 2,099,172 | |
| | | | | | | | |
| |
Cameroon, United Republic Of 0.6% | | | | | |
Republic of Cameroon International Bond
9.50%, due 11/19/25 (a) | | | 1,000,000 | | | | 1,112,820 | |
| | | | | | | | |
| | |
Costa Rica 2.4% | | | | | | | | |
Costa Rica Government International Bond
7.158%, due 3/12/45 (a) | | | 2,000,000 | | | | 2,090,000 | |
Instituto Costarricense de Electricidad
6.375%, due 5/15/43 (a) | | | 3,000,000 | | | | 2,590,950 | |
| | | | | | | | |
| | | | | | | 4,680,950 | |
| | | | | | | | |
Croatia 3.0% | | | | | | | | |
¨Croatia Government International Bond
Series Reg S
6.00%, due 1/26/24 | | | 3,250,000 | | | | 3,667,625 | |
6.375%, due 3/24/21 (a) | | | 2,000,000 | | | | 2,220,000 | |
| | | | | | | | |
| | | | | | | 5,887,625 | |
| | | | | | | | |
Dominican Republic 2.8% | | | | | | | | |
¨Dominican Republic International Bond | | | | | | | | |
6.875%, due 1/29/26 (a) | | | 1,500,000 | | | | 1,661,250 | |
Series Reg S
7.50%, due 5/6/21 | | | 3,500,000 | | | | 3,850,700 | |
| | | | | | | | |
| | | | | | | 5,511,950 | |
| | | | | | | | |
El Salvador 2.2% | | | | | | | | |
El Salvador Government International Bond
7.75%, due 1/24/23 (a) | | | 4,000,000 | | | | 4,370,000 | |
| | | | | | | | |
| | |
Gabon 0.6% | | | | | | | | |
Gabon Government International Bond
6.375%, due 12/12/24 (a) | | | 1,296,000 | | | | 1,188,147 | |
| | | | | | | | |
| | |
Georgia 1.1% | | | | | | | | |
Georgia Government International Bond
Series Reg S
6.875%, due 4/12/21 | | | 2,000,000 | | | | 2,230,080 | |
| | | | | | | | |
| | |
Ghana 1.2% | | | | | | | | |
Ghana Government International Bond
10.75%, due 10/14/30 (a) | | | 2,000,000 | | | | 2,354,600 | |
| | | | | | | | |
| | | | |
| 12 | | MainStay Global High Income Fund | | The notes to the financial statements are an integral part of,
and should be read in conjunction with, the financial statements. |
| | | | | | | | |
| | | Principal Amount | | | Value | |
| | | | | | | | |
| Government & Federal Agencies (continued) | |
Guatemala 1.5% | | | | | | | | |
Guatemala Government Bond
4.50%, due 5/3/26 (a) | | $ | 3,000,000 | | | $ | 3,075,000 | |
| | | | | | | | |
| | |
Hungary 2.3% | | | | | | | | |
¨Hungary Government International Bond
7.625%, due 3/29/41 | | | 3,000,000 | | | | 4,572,000 | |
| | | | | | | | |
| | |
Indonesia 0.8% | | | | | | | | |
Indonesia Government International Bond
5.125%, due 1/15/45 (a) | | | 1,500,000 | | | | 1,632,420 | |
| | | | | | | | |
| | |
Ivory Coast 1.0% | | | | | | | | |
Ivory Coast Government International Bond
Series Reg S
5.75%, due 12/31/32 (c) | | | 1,980,000 | | | | 1,939,529 | |
| | | | | | | | |
| | |
Kenya 0.5% | | | | | | | | |
Kenya Government International Bond
6.875%, due 6/24/24 (a) | | | 1,000,000 | | | | 997,500 | |
| | | | | | | | |
| | |
Mexico 0.8% | | | | | | | | |
Mexican Bonos
7.75%, due 11/13/42 | | MXN | 27,500,000 | | | | 1,629,079 | |
| | | | | | | | |
| | |
Nigeria 1.0% | | | | | | | | |
Nigeria Government International Bond
Series Reg S
6.75%, due 1/28/21 | | $ | 2,000,000 | | | | 1,988,880 | |
| | | | | | | | |
| | |
Pakistan 1.4% | | | | | | | | |
Pakistan Government International Bond
8.25%, due 9/30/25 (a) | | | 2,500,000 | | | | 2,837,735 | |
| | | | | | | | |
| | |
Panama 2.0% | | | | | | | | |
Panama Government International Bond
6.70%, due 1/26/36 | | | 3,058,000 | | | | 4,063,318 | |
| | | | | | | | |
| | |
Paraguay 2.2% | | | | | | | | |
Paraguay Government International Bond
6.10%, due 8/11/44 (a) | | | 4,000,000 | | | | 4,420,000 | |
| | | | | | | | |
| | | | | | | | |
| | | Principal Amount | | | Value | |
| | | | | | | | |
Peru 4.0% | | | | | | | | |
¨Peruvian Government International Bond
7.35%, due 7/21/25 | | $ | 5,800,000 | | | $ | 7,931,500 | |
| | | | | | | | |
| | |
Russia 1.7% | | | | | | | | |
Russian Federal Bond-OFZ
7.00%, due 1/25/23 | | RUB | 230,000,000 | | | | 3,360,430 | |
| | | | | | | | |
| | |
Saudi Arabia 1.1% | | | | | | | | |
Saudi Government International Bond
4.50%, due 10/26/46 (a) | | $ | 2,200,000 | | | | 2,164,250 | |
| | | | | | | | |
| | |
Senegal 0.7% | | | | | | | | |
Senegal Government International Bond
8.75%, due 5/13/21 (a) | | | 1,250,000 | | | | 1,411,300 | |
| | | | | | | | |
| | |
Sri Lanka 3.4% | | | | | | | | |
¨ Sri Lanka Government International Bond
6.25%, due 10/4/20 (a) | | | 6,500,000 | | | | 6,792,506 | |
| | | | | | | | |
| | |
Turkey 2.4% | | | | | | | | |
¨Turkey Government International Bond | | | | | | | | |
6.625%, due 2/17/45 | | | 2,000,000 | | | | 2,241,820 | |
7.375%, due 2/5/25 | | | 2,225,000 | | | | 2,606,096 | |
| | | | | | | | |
| | | | | | | 4,847,916 | |
| | | | | | | | |
Ukraine 1.9% | | | | | | | | |
Ukraine Government International Bond Series Reg S
7.75%, due 9/1/26 | | | 4,000,000 | | | | 3,813,200 | |
| | | | | | | | |
| | |
Uruguay 2.1% | | | | | | | | |
Uruguay Government International Bond 4.375%, due 12/15/28 | | UYU | 128,564,292 | | | | 4,169,101 | |
| | | | | | | | |
| | |
Venezuela 2.6% | | | | | | | | |
¨Venezuela Government International Bond
Series Reg S
9.25%, due 5/7/28 | | $ | 11,095,000 | | | | 5,142,532 | |
| | | | | | | | |
| | |
Vietnam 1.1% | | | | | | | | |
Vietnam Government International Bond
6.75%, due 1/29/20 (a) | | | 2,000,000 | | | | 2,227,710 | |
| | | | | | | | |
Total Government & Federal Agencies
(Cost $102,099,506) | | | | | | | 101,240,000 | |
| | | | | | | | |
Total Long-Term Bonds
(Cost $191,125,445) | | | | | | | 190,873,980 | |
| | | | | | | | |
| | | | | | |
The notes to the financial statements are an integral part of,
and should be read in conjunction with, the financial statements. | | | | | 13 | |
Portfolio of Investments October 31, 2016 (continued)
| | | | | | | | |
| | | Principal
Amount | | | Value | |
| | | | | | | | |
| Short-Term Investment 2.8% | |
Repurchase Agreement 2.8% | | | | | | | | |
Fixed Income Clearing Corp.
0.03%, dated 10/31/16
due 11/1/16
Proceeds at Maturity $5,516,865 (Collateralized by a United States Treasury Note with a rate of 1.50% and a maturity date of 12/31/18, with a Principal Amount of $5,525,000 and a Market Value of $5,628,594) | | $ | 5,516,860 | | | $ | 5,516,860 | |
| | | | | | | | |
Total Short-Term Investment
(Cost $5,516,860) | | | | | | | 5,516,860 | |
| | | | | | | | |
Total Investments
(Cost $196,642,305) (d) | | | 98.7 | % | | | 196,390,840 | |
Other Assets, Less Liabilities | | | 1.3 | | | | 2,637,762 | |
Net Assets | | | 100.0 | % | | $ | 199,028,602 | |
| (a) | May be sold to institutional investors only under Rule 144A or securities offered pursuant to Section 4(a)(2) of the Securities Act of 1933, as amended. |
| (b) | Floating rate—Rate shown was the rate in effect as of October 31, 2016. |
| (c) | Step coupon—Rate shown was the rate in effect as of October 31, 2016. |
| (d) | As of October 31, 2016, cost was $196,642,305 for federal income tax purposes and net unrealized depreciation was as follows: |
| | | | |
Gross unrealized appreciation | | $ | 10,243,411 | |
Gross unrealized depreciation | | | (10,494,876 | ) |
| | | | |
Net unrealized depreciation | | $ | (251,465 | ) |
| | | | |
As of October 31, 2016, the Fund held the following foreign currency forward contracts:
| | | | | | | | | | | | | | | | | | | | | | |
Foreign Currency Buy Contracts | | Expiration
Date | | | Counterparty | | Contract
Amount
Purchased | | | Contract
Amount
Sold | | | Unrealized
Appreciation
(Depreciation) | |
Argentine Peso vs. U.S. Dollar | | | 1/12/17 | | | Barclays Bank PLC | | | ARS | | | | 33,100,000 | | | $ | 2,000,000 | | | $ | 94,605 | |
The following abbreviations are used in the preceding pages:
ARS—Argentine Peso
MXN—Mexican Peso
RUB—New Russian Ruble
UYU—Uruguayam Peso
The following is a summary of the fair valuations according to the inputs used as of October 31, 2016, for valuing the Fund’s assets.
Asset Valuation Inputs
| | | | | | | | | | | | | | | | |
Description | | Quoted
Prices in
Active
Markets for
Identical
Assets (Level 1) | | | Significant
Other
Observable
Inputs (Level 2) | | | Significant
Unobservable
Inputs (Level 3) | | | Total | |
| Investments in Securities (a) | | | | | | | | | | | | | | | | |
| Long-Term Bonds | | | | | | | | | | | | | | | | |
Corporate Bonds | | $ | — | | | $ | 89,633,980 | | | $ | — | | | $ | 89,633,980 | |
Government & Federal Agencies | | | — | | | | 101,240,000 | | | | — | | | | 101,240,000 | |
| | | | | | | | | | | | | | | | |
| Total Long-Term Bonds | | | — | | | | 190,873,980 | | | | — | | | | 190,873,980 | |
| | | | | | | | | | | | | | | | |
| Short-Term Investment | | | | | | | | | | | | | | | | |
Repurchase Agreement | | | — | | | | 5,516,860 | | | | — | | | | 5,516,860 | |
| | | | | | | | | | | | | | | | |
| Total Investments in Securities | | | — | | | | 196,390,840 | | | | — | | | | 196,390,840 | |
| | | | | | | | | | | | | | | | |
| Other Financial Investments | | | | | | | | | | | | | | | | |
Foreign Currency Forward Contracts (b) | | | — | | | | 94,605 | | | | — | | | | 94,605 | |
| | | | | | | | | | | | | | | | |
| Total Investments in Securities and Other Financial Instruments | | $ | — | | | $ | 196,485,445 | | | $ | — | | | $ | 196,485,445 | |
| | | | | | | | | | | | | | | | |
| | | | |
| 14 | | MainStay Global High Income Fund | | The notes to the financial statements are an integral part of,
and should be read in conjunction with, the financial statements. |
| (a) | For a complete listing of investments and their industries, see the Portfolio of Investments. |
| (b) | The value listed for these securities reflects unrealized appreciation (depreciation) as shown on the Portfolio of Investments. |
The Fund recognizes transfers between the levels as of the beginning of the period.
For the year ended October 31, 2016, the Fund did not have any transfers between Level 1 and Level 2 fair value measurements. (See Note 2)
As of October 31, 2016, the Fund did not hold any investments with significant unobservable inputs (Level 3). (See Note 2)
| | | | | | |
The notes to the financial statements are an integral part of,
and should be read in conjunction with, the financial statements. | | | | | 15 | |
Statement of Assets and Liabilities as of October 31, 2016
| | | | |
| Assets | |
Investment in securities, at value
(identified cost $196,642,305) | | $ | 196,390,840 | |
Cash denominated in foreign currencies
(identified cost $273,675) | | | 277,841 | |
Cash | | | 15,938 | |
Due from custodian | | | 1,005,281 | |
Receivables: | | | | |
Interest | | | 3,164,919 | |
Fund shares sold | | | 134,372 | |
Other assets | | | 33,199 | |
Unrealized appreciation on foreign currency forward contracts | | | 94,605 | |
| | | | |
Total assets | | | 201,116,995 | |
| | | | |
| |
| Liabilities | | | | |
Payables: | | | | |
Investment securities purchased | | | 1,005,281 | |
Fund shares redeemed | | | 695,785 | |
Manager (See Note 3) | | | 123,653 | |
NYLIFE Distributors (See Note 3) | | | 68,005 | |
Transfer agent (See Note 3) | | | 63,011 | |
Shareholder communication | | | 20,072 | |
Professional fees | | | 14,012 | |
Custodian | | | 6,505 | |
Trustees | | | 576 | |
Accrued expenses | | | 4,467 | |
Dividend payable | | | 87,026 | |
| | | | |
Total liabilities | | | 2,088,393 | |
| | | | |
Net assets | | $ | 199,028,602 | |
| | | | |
| |
| Composition of Net Assets | | | | |
Shares of beneficial interest outstanding (par value of $.01 per share) unlimited number of shares authorized | | $ | 189,621 | |
Additional paid-in capital | | | 209,998,880 | |
| | | | |
| | | 210,188,501 | |
Distributions in excess of net investment income | | | (87,026 | ) |
Accumulated net realized gain (loss) on investments and foreign currency transactions | | | (10,922,661 | ) |
Net unrealized appreciation (depreciation) on investments | | | (251,465 | ) |
Net unrealized appreciation (depreciation) on translation of other assets and liabilities in foreign currencies and foreign currency forward contracts | | | 101,253 | |
| | | | |
Net assets | | $ | 199,028,602 | |
| | | | |
| | | | |
Class A | | | | |
Net assets applicable to outstanding shares | | $ | 109,656,536 | |
| | | | |
Shares of beneficial interest outstanding | | | 10,425,319 | |
| | | | |
Net asset value per share outstanding | | $ | 10.52 | |
Maximum sales charge (4.50% of offering price) | | | 0.50 | |
| | | | |
Maximum offering price per share outstanding | | $ | 11.02 | |
| | | | |
Investor Class | | | | |
Net assets applicable to outstanding shares | | $ | 32,317,528 | |
| | | | |
Shares of beneficial interest outstanding | | | 3,045,356 | |
| | | | |
Net asset value per share outstanding | | $ | 10.61 | |
Maximum sales charge (4.50% of offering price) | | | 0.50 | |
| | | | |
Maximum offering price per share outstanding | | $ | 11.11 | |
| | | | |
Class B | | | | |
Net assets applicable to outstanding shares | | $ | 7,506,041 | |
| | | | |
Shares of beneficial interest outstanding | | | 726,260 | |
| | | | |
Net asset value and offering price per share outstanding | | $ | 10.34 | |
| | | | |
Class C | | | | |
Net assets applicable to outstanding shares | | $ | 35,789,003 | |
| | | | |
Shares of beneficial interest outstanding | | | 3,458,384 | |
| | | | |
Net asset value and offering price per share outstanding | | $ | 10.35 | |
| | | | |
Class I | | | | |
Net assets applicable to outstanding shares | | $ | 13,759,494 | |
| | | | |
Shares of beneficial interest outstanding | | | 1,306,757 | |
| | | | |
Net asset value and offering price per share outstanding | | $ | 10.53 | |
| | | | |
| | | | |
| 16 | | MainStay Global High Income Fund | | The notes to the financial statements are an integral part of,
and should be read in conjunction with, the financial statements. |
Statement of Operations for the year ended October 31, 2016
| | | | |
| Investment Income (Loss) | |
Income | | | | |
Interest | | $ | 12,870,558 | |
| | | | |
Expenses | | | | |
Manager (See Note 3) | | | 1,345,743 | |
Distribution/Service—Class A (See Note 3) | | | 255,403 | |
Distribution/Service—Investor Class (See Note 3) | | | 65,278 | |
Distribution/Service—Class B (See Note 3) | | | 75,236 | |
Distribution/Service—Class C (See Note 3) | | | 359,899 | |
Transfer agent (See Note 3) | | | 367,206 | |
Professional fees | | | 85,741 | |
Registration | | | 75,928 | |
Shareholder communication | | | 51,444 | |
Custodian | | | 18,113 | |
Trustees | | | 4,881 | |
Miscellaneous | | | 12,875 | |
| | | | |
Total expenses | | | 2,717,747 | |
Reimbursement from custodian (a) | | | (16,225 | ) |
| | | | |
Net expenses | | | 2,701,522 | |
| | | | |
Net investment income (loss) | | | 10,169,036 | |
| | | | |
|
| Realized and Unrealized Gain (Loss) on Investments and Foreign Currency Transactions | |
Net realized gain (loss) on: | | | | |
Investment transactions | | | (5,453,643 | ) |
Foreign currency transactions | | | 601,208 | |
| | | | |
Net realized gain (loss) on investments and foreign currency transactions | | | (4,852,435 | ) |
| | | | |
Net change in unrealized appreciation (depreciation) on: | | | | |
Investments | | | 21,197,702 | |
Translation of other assets and liabilities in foreign currencies and foreign currency forward contracts | | | (335,229 | ) |
| | | | |
Net change in unrealized appreciation (depreciation) on investments and foreign currency transactions | | | 20,862,473 | |
| | | | |
Net realized and unrealized gain (loss) on investments and foreign currency transactions | | | 16,010,038 | |
| | | | |
Net increase (decrease) in net assets resulting from operations | | $ | 26,179,074 | |
| | | | |
| (a) | Reimbursement from custodian represents a refund for overbilling of prior years’ custody out-of-pocket fees. |
| | | | | | |
The notes to the financial statements are an integral part of,
and should be read in conjunction with, the financial statements. | | | | | 17 | |
Statements of Changes in Net Assets
for the years ended October 31, 2016 and October 31, 2015
| | | | | | | | |
| | | 2016 | | | 2015 | |
| Increase (Decrease) in Net Assets | |
Operations: | | | | | | | | |
Net investment income (loss) | | $ | 10,169,036 | | | $ | 12,881,395 | |
Net realized gain (loss) on investments and foreign currency transactions | | | (4,852,435 | ) | | | (12,918,028 | ) |
Net change in unrealized appreciation (depreciation) on investments and foreign currency transactions | | | 20,862,473 | | | | (20,477,578 | ) |
| | | | |
Net increase (decrease) in net assets resulting from operations | | | 26,179,074 | | | | (20,514,211 | ) |
| | | | |
Dividends and distributions to shareholders: | | | | | | | | |
From net investment income: | | | | | | | | |
Class A | | | (3,052,218 | ) | | | (6,877,345 | ) |
Investor Class | | | (720,130 | ) | | | (1,500,044 | ) |
Class B | | | (159,726 | ) | | | (518,158 | ) |
Class C | | | (761,686 | ) | | | (2,408,638 | ) |
Class I | | | (461,915 | ) | | | (1,867,520 | ) |
| | | | |
| | | (5,155,675 | ) | | | (13,171,705 | ) |
| | | | |
From net realized gain on investments: | | | | | | | | |
Class A | | | — | | | | (2,501,548 | ) |
Investor Class | | | — | | | | (521,541 | ) |
Class B | | | — | | | | (226,277 | ) |
Class C | | | — | | | | (1,063,929 | ) |
Class I | | | — | | | | (766,119 | ) |
| | | | |
| | | — | | | | (5,079,414 | ) |
| | | | |
From return of capital: | | | | | | | | |
Class A | | | (2,444,690 | ) | | | (641,964 | ) |
Investor Class | | | (614,458 | ) | | | (149,976 | ) |
Class B | | | (178,909 | ) | | | (55,741 | ) |
Class C | | | (856,147 | ) | | | (257,923 | ) |
Class I | | | (323,340 | ) | | | (152,478 | ) |
| | | | |
| | | (4,417,544 | ) | | | (1,258,082 | ) |
| | | | |
Total dividends and distributions to shareholders | | | (9,573,219 | ) | | | (19,509,201 | ) |
| | | | |
Capital share transactions: | | | | | | | | |
Net proceeds from sale of shares | | | 57,677,054 | | | | 31,891,380 | |
Net asset value of shares issued to shareholders in reinvestment of dividends and distributions | | | 8,162,955 | | | | 15,588,807 | |
Cost of shares redeemed | | | (69,864,186 | ) | | | (90,178,570 | ) |
| | | | |
Increase (decrease) in net assets derived from capital share transactions | | | (4,024,177 | ) | | | (42,698,383 | ) |
| | | | |
Net increase (decrease) in net assets | | | 12,581,678 | | | | (82,721,795 | ) |
| | | | | | | | |
| | | 2016 | | | 2015 | |
| Net Assets | |
Beginning of year | | | 186,446,924 | | | | 269,168,719 | |
| | | | |
End of year | | $ | 199,028,602 | | | $ | 186,446,924 | |
| | | | |
Distributions in excess of net investment income at end of year | | $ | (87,026 | ) | | $ | (576,802 | ) |
| | | | |
| | | | |
| 18 | | MainStay Global High Income Fund | | The notes to the financial statements are an integral part of,
and should be read in conjunction with, the financial statements. |
Financial Highlights selected per share data and ratios
| | | | | | | | | | | | | | | | | | | | |
| | | Year ended October 31, | |
| Class A | | 2016 | | | 2015 | | | 2014 | | | 2013 | | | 2012 | |
Net asset value at beginning of year | | $ | 9.60 | | | $ | 11.38 | | | $ | 11.52 | | | $ | 12.62 | | | $ | 11.83 | |
| | | | | | | | | | | | | | | | | | | | |
Net investment income (loss) (a) | | | 0.57 | | | | 0.62 | | | | 0.68 | | | | 0.68 | | | | 0.62 | |
Net realized and unrealized gain (loss) on investments | | | 0.87 | | | | (1.51 | ) | | | (0.14 | ) | | | (0.93 | ) | | | 1.11 | |
Net realized and unrealized gain (loss) on foreign currency transactions | | | 0.01 | | | | 0.02 | | | | (0.00 | )‡ | | | 0.01 | | | | 0.02 | |
| | | | | | | | | | | | | | | | | | | | |
Total from investment operations | | | 1.45 | | | | (0.87 | ) | | | 0.54 | | | | (0.24 | ) | | | 1.75 | |
| | | | | | | | | | | | | | | | | | | | |
| Less dividends and distributions: | | | | | | | | | | | | | | | | | | | | |
From net investment income | | | (0.29 | ) | | | (0.63 | ) | | | (0.65 | ) | | | (0.86 | ) | | | (0.64 | ) |
From net realized gain on investments | | | — | | | | (0.22 | ) | | | (0.03 | ) | | | — | | | | (0.32 | ) |
Return of capital | | | (0.24 | ) | | | (0.06 | ) | | | — | | | | — | | | | — | |
| | | | | | | | | | | | | | | | | | | | |
Total dividends and distributions | | | (0.53 | ) | | | (0.91 | ) | | | (0.68 | ) | | | (0.86 | ) | | | (0.96 | ) |
| | | | | | | | | | | | | | | | | | | | |
Net asset value at end of year | | $ | 10.52 | | | $ | 9.60 | | | $ | 11.38 | | | $ | 11.52 | | | $ | 12.62 | |
| | | | | | | | | | | | | | | | | | | | |
Total investment return (b) | | | 15.63 | % | | | (7.54 | %) | | | 4.85 | % | | | (1.98 | %) | | | 15.68 | % |
| Ratios (to average net assets)/Supplemental Data: | | | | | | | | | | | | | | | | | | | | |
Net investment income (loss) | | | 5.70 | %(c) | | | 6.18 | % | | | 5.88 | % | | | 5.58 | % | | | 5.22 | % |
Net expenses | | | 1.22 | %(d) | | | 1.23 | % | | | 1.17 | % | | | 1.16 | % | | | 1.17 | % |
Portfolio turnover rate | | | 38 | % | | | 19 | % | | | 20 | % | | | 36 | % | | | 31 | % |
Net assets at end of year (in 000’s) | | $ | 109,657 | | | $ | 98,573 | | | $ | 132,654 | | | $ | 152,832 | | | $ | 179,430 | |
| ‡ | Less than one cent per share. |
| (a) | Per share data based on average shares outstanding during the year. |
| (b) | Total investment return is calculated exclusive of sales charges and assumes the reinvestment of dividends and distributions. |
| (c) | Without the custody fee reimbursement, net investment income (loss) would have been 5.69%. |
| (d) | Without the custody fee reimbursement, net expenses would have been 1.23%. |
| | | | | | | | | | | | | | | | | | | | |
| | | Year ended October 31, | |
| Investor Class | | 2016 | | | 2015 | | | 2014 | | | 2013 | | | 2012 | |
Net asset value at beginning of year | | $ | 9.68 | | | $ | 11.46 | | | $ | 11.60 | | | $ | 12.71 | | | $ | 11.90 | |
| | | | | | | | | | | | | | | | | | | | |
Net investment income (loss) (a) | | | 0.55 | | | | 0.61 | | | | 0.66 | | | | 0.67 | | | | 0.61 | |
Net realized and unrealized gain (loss) on investments | | | 0.88 | | | | (1.52 | ) | | | (0.14 | ) | | | (0.94 | ) | | | 1.12 | |
Net realized and unrealized gain (loss) on foreign currency transactions | | | 0.01 | | | | 0.02 | | | | (0.00 | )‡ | | | 0.01 | | | | 0.02 | |
| | | | | | | | | | | | | | | | | | | | |
Total from investment operations | | | 1.44 | | | | (0.89 | ) | | | 0.52 | | | | (0.26 | ) | | | 1.75 | |
| | | | | | | | | | | | | | | | | | | | |
| Less dividends and distributions: | | | | | | | | | | | | | | | | | | | | |
From net investment income | | | (0.27 | ) | | | (0.61 | ) | | | (0.63 | ) | | | (0.85 | ) | | | (0.62 | ) |
From net realized gain on investments | | | — | | | | (0.22 | ) | | | (0.03 | ) | | | — | | | | (0.32 | ) |
Return of capital | | | (0.24 | ) | | | (0.06 | ) | | | — | | | | — | | | | — | |
| | | | | | | | | | | | | | | | | | | | |
Total dividends and distributions | | | (0.51 | ) | | | (0.89 | ) | | | (0.66 | ) | | | (0.85 | ) | | | (0.94 | ) |
| | | | | | | | | | | | | | | | | | | | |
Net asset value at end of year | | $ | 10.61 | | | $ | 9.68 | | | $ | 11.46 | | | $ | 11.60 | | | $ | 12.71 | |
| | | | | | | | | | | | | | | | | | | | |
Total investment return (b) | | | 15.38 | % | | | (7.66 | %) | | | 4.64 | % | | | (2.18 | %) | | | 15.52 | % |
| Ratios (to average net assets)/Supplemental Data: | | | | | | | | | | | | | | | | | | | | |
Net investment income (loss) | | | 5.50 | %(c) | | | 6.01 | % | | | 5.71 | % | | | 5.49 | % | | | 5.10 | % |
Net expenses | | | 1.42 | %(d) | | | 1.41 | % | | | 1.34 | % | | | 1.30 | % | | | 1.29 | % |
Portfolio turnover rate | | | 38 | % | | | 19 | % | | | 20 | % | | | 36 | % | | | 31 | % |
Net assets at end of year (in 000’s) | | $ | 32,318 | | | $ | 25,130 | | | $ | 27,033 | | | $ | 27,918 | | | $ | 27,165 | |
| ‡ | Less than one cent per share. |
| (a) | Per share data based on average shares outstanding during the year. |
| (b) | Total investment return is calculated exclusive of sales charges and assumes the reinvestment of dividends and distributions. |
| (c) | Without the custody fee reimbursement, net investment income (loss) would have been 5.49%. |
| (d) | Without the custody fee reimbursement, net expenses would have been 1.43%. |
| | | | | | |
The notes to the financial statements are an integral part of,
and should be read in conjunction with, the financial statements. | | | | | 19 | |
Financial Highlights selected per share data and ratios
| | | | | | | | | | | | | | | | | | | | |
| | | Year ended October 31, | |
| Class B | | 2016 | | | 2015 | | | 2014 | | | 2013 | | | 2012 | |
Net asset value at beginning of year | | $ | 9.44 | | | $ | 11.20 | | | $ | 11.35 | | | $ | 12.45 | | | $ | 11.68 | |
| | | | | | | | | | | | | | | | | | | | |
Net investment income (loss) (a) | | | 0.47 | | | | 0.52 | | | | 0.56 | | | | 0.56 | | | | 0.51 | |
Net realized and unrealized gain (loss) on investments | | | 0.86 | | | | (1.48 | ) | | | (0.13 | ) | | | (0.91 | ) | | | 1.09 | |
Net realized and unrealized gain (loss) on foreign currency transactions | | | 0.01 | | | | 0.02 | | | | (0.00 | )‡ | | | 0.01 | | | | 0.02 | |
| | | | | | | | | | | | | | | | | | | | |
Total from investment operations | | | 1.34 | | | | (0.94 | ) | | | 0.43 | | | | (0.34 | ) | | | 1.62 | |
| | | | | | | | | | | | | | | | | | | | |
| Less dividends and distributions: | | | | | | | | | | | | | | | | | | | | |
From net investment income | | | (0.20 | ) | | | (0.54 | ) | | | (0.55 | ) | | | (0.76 | ) | | | (0.53 | ) |
From net realized gain on investments | | | — | | | | (0.22 | ) | | | (0.03 | ) | | | — | | | | (0.32 | ) |
Return of capital | | | (0.24 | ) | | | (0.06 | ) | | | — | | | | — | | | | — | |
| | | | | | | | | | | | | | | | | | | | |
Total dividends and distributions | | | (0.44 | ) | | | (0.82 | ) | | | (0.58 | ) | | | (0.76 | ) | | | (0.85 | ) |
| | | | | | | | | | | | | | | | | | | | |
Net asset value at end of year | | $ | 10.34 | | | $ | 9.44 | | | $ | 11.20 | | | $ | 11.35 | | | $ | 12.45 | |
| | | | | | | | | | | | | | | | | | | | |
Total investment return (b) | | | 14.60 | % | | | (8.36 | %) | | | 3.87 | % | | | (2.89 | %) | | | 14.60 | % |
| Ratios (to average net assets)/Supplemental Data: | | | | | | | | | | | | | | | | | | | | |
Net investment income (loss) | | | 4.78 | %(c) | | | 5.24 | % | | | 4.97 | % | | | 4.70 | % | | | 4.35 | % |
Net expenses | | | 2.17 | %(d) | | | 2.16 | % | | | 2.09 | % | | | 2.05 | % | | | 2.04 | % |
Portfolio turnover rate | | | 38 | % | | | 19 | % | | | 20 | % | | | 36 | % | | | 31 | % |
Net assets at end of year (in 000’s) | | $ | 7,506 | | | $ | 8,111 | | | $ | 12,109 | | | $ | 15,290 | | | $ | 20,101 | |
| ‡ | Less than one cent per share. |
| (a) | Per share data based on average shares outstanding during the year. |
| (b) | Total investment return is calculated exclusive of sales charges and assumes the reinvestment of dividends and distributions. |
| (c) | Without the custody fee reimbursement, net investment income (loss) would have been 4.77%. |
| (d) | Without the custody fee reimbursement, net expenses would have been 2.18%. |
| | | | | | | | | | | | | | | | | | | | |
| | | Year ended October 31, | |
| Class C | | 2016 | | | 2015 | | | 2014 | | | 2013 | | | 2012 | |
Net asset value at beginning of year | | $ | 9.45 | | | $ | 11.22 | | | $ | 11.37 | | | $ | 12.46 | | | $ | 11.69 | |
| | | | | | | | | | | | | | | | | | | | |
Net investment income (loss) (a) | | | 0.47 | | | | 0.52 | | | | 0.56 | | | | 0.56 | | | | 0.51 | |
Net realized and unrealized gain (loss) on investments | | | 0.86 | | | | (1.49 | ) | | | (0.13 | ) | | | (0.90 | ) | | | 1.09 | |
Net realized and unrealized gain (loss) on foreign currency transactions | | | 0.01 | | | | 0.02 | | | | (0.00 | )‡ | | | 0.01 | | | | 0.02 | |
| | | | | | | | | | | | | | | | | | | | |
Total from investment operations | | | 1.34 | | | | (0.95 | ) | | | 0.43 | | | | (0.33 | ) | | | 1.62 | |
| | | | | | | | | | | | | | | | | | | | |
| Less dividends and distributions: | | | | | | | | | | | | | | | | | | | | |
From net investment income | | | (0.20 | ) | | | (0.54 | ) | | | (0.55 | ) | | | (0.76 | ) | | | (0.53 | ) |
From net realized gain on investments | | | — | | | | (0.22 | ) | | | (0.03 | ) | | | — | | | | (0.32 | ) |
Return of capital | | | (0.24 | ) | | | (0.06 | ) | | | — | | | | — | | | | — | |
| | | | | | | | | | | | | | | | | | | | |
Total dividends and distributions | | | (0.44 | ) | | | (0.82 | ) | | | (0.58 | ) | | | (0.76 | ) | | | (0.85 | ) |
| | | | | | | | | | | | | | | | | | | | |
Net asset value at end of year | | $ | 10.35 | | | $ | 9.45 | | | $ | 11.22 | | | $ | 11.37 | | | $ | 12.46 | |
| | | | | | | | | | | | | | | | | | | | |
Total investment return (b) | | | 14.58 | % | | | (8.43 | %) | | | 3.87 | % | | | (2.80 | %) | | | 14.59 | % |
| Ratios (to average net assets)/Supplemental Data: | | | | | | | | | | | | | | | | | | | | |
Net investment income (loss) | | | 4.77 | %(c) | | | 5.24 | % | | | 4.97 | % | | | 4.69 | % | | | 4.35 | % |
Net expenses | | | 2.17 | %(d) | | | 2.16 | % | | | 2.09 | % | | | 2.05 | % | | | 2.04 | % |
Portfolio turnover rate | | | 38 | % | | | 19 | % | | | 20 | % | | | 36 | % | | | 31 | % |
Net assets at end of year (in 000’s) | | $ | 35,789 | | | $ | 37,808 | | | $ | 56,199 | | | $ | 68,629 | | | $ | 91,002 | |
| ‡ | Less than one cent per share. |
| (a) | Per share data based on average shares outstanding during the year. |
| (b) | Total investment return is calculated exclusive of sales charges and assumes the reinvestment of dividends and distributions. |
| (c) | Without the custody fee reimbursement, net investment income (loss) would have been 4.76%. |
| (d) | Without the custody fee reimbursement, net expenses would have been 2.18%. |
| | | | |
| 20 | | MainStay Global High Income Fund | | The notes to the financial statements are an integral part of,
and should be read in conjunction with, the financial statements. |
Financial Highlights selected per share data and ratios
| | | | | | | | | | | | | | | | | | | | |
| | | Year ended October 31, | |
| Class I | | 2016 | | | 2015 | | | 2014 | | | 2013 | | | 2012 | |
Net asset value at beginning of year | | $ | 9.61 | | | $ | 11.39 | | | $ | 11.53 | | | $ | 12.63 | | | $ | 11.84 | |
| | | | | | | | | | | | | | | | | | | | |
Net investment income (loss) (a) | | | 0.59 | | | | 0.65 | | | | 0.71 | | | | 0.71 | | | | 0.66 | |
Net realized and unrealized gain (loss) on investments | | | 0.88 | | | | (1.52 | ) | | | (0.14 | ) | | | (0.93 | ) | | | 1.10 | |
Net realized and unrealized gain (loss) on foreign currency transactions | | | 0.01 | | | | 0.02 | | | | (0.00 | )‡ | | | 0.01 | | | | 0.02 | |
| | | | | | | | | | | | | | | | | | | | |
Total from investment operations | | | 1.48 | | | | (0.85 | ) | | | 0.57 | | | | (0.21 | ) | | | 1.78 | |
| | | | | | | | | | | | | | | | | | | | |
| Less dividends and distributions: | | | | | | | | | | | | | | | | | | | | |
From net investment income | | | (0.32 | ) | | | (0.65 | ) | | | (0.68 | ) | | | (0.89 | ) | | | (0.67 | ) |
From net realized gain on investments | | | — | | | | (0.22 | ) | | | (0.03 | ) | | | — | | | | (0.32 | ) |
Return of capital | | | (0.24 | ) | | | (0.06 | ) | | | — | | | | — | | | | — | |
| | | | | | | | | | | | | | | | | | | | |
Total dividends and distributions | | | (0.56 | ) | | | (0.93 | ) | | | (0.71 | ) | | | (0.89 | ) | | | (0.99 | ) |
| | | | | | | | | | | | | | | | | | | | |
Net asset value at end of year | | $ | 10.53 | | | $ | 9.61 | | | $ | 11.39 | | | $ | 11.53 | | | $ | 12.63 | |
| | | | | | | | | | | | | | | | | | | | |
Total investment return (b) | | | 15.90 | % | | | (7.30 | %) | | | 5.11 | % | | | (1.73 | %) | | | 15.95 | % |
| Ratios (to average net assets)/Supplemental Data: | | | | | | | | | | | | | | | | | | | | |
Net investment income (loss) | | | 5.96 | %(c) | | | 6.38 | % | | | 6.13 | % | | | 5.86 | % | | | 5.47 | % |
Net expenses | | | 0.97 | %(d) | | | 0.98 | % | | | 0.92 | % | | | 0.91 | % | | | 0.92 | % |
Portfolio turnover rate | | | 38 | % | | | 19 | % | | | 20 | % | | | 36 | % | | | 31 | % |
Net assets at end of year (in 000’s) | | $ | 13,759 | | | $ | 16,825 | | | $ | 41,174 | | | $ | 43,678 | | | $ | 48,852 | |
| ‡ | Less than one cent per share. |
| (a) | Per share data based on average shares outstanding during the year. |
| (b) | Total investment return is calculated exclusive of sales charges and assumes the reinvestment of dividends and distributions. Class I shares are not subject to sales charges. |
| (c) | Without the custody fee reimbursement, net investment income (loss) would have been 5.95%. |
| (d) | Without the custody fee reimbursement, net expenses would have been 0.98%. |
| | | | | | |
The notes to the financial statements are an integral part of,
and should be read in conjunction with, the financial statements. | | | | | 21 | |
Notes to Financial Statements
Note 1–Organization and Business
The MainStay Funds (the “Trust”) was organized on January 9, 1986, as a Massachusetts business trust. The Trust is registered under the Investment Company Act of 1940, as amended (the “1940 Act”), as an open-end management investment company, and is comprised of twelve funds (collectively referred to as the “Funds”). These financial statements and notes relate to the MainStay Global High Income Fund (the “Fund”), a diversified fund as that term is defined in the 1940 Act as Interpreted or modified by regulatory authorities having jurisdiction from time to time.
The Fund currently offers five classes of shares. Class A and Class B shares commenced operations on June 1, 1998. Class C shares commenced operations on September 1, 1998. Class I shares commenced operations on August 31, 2007. Investor Class shares commenced operations on February 28, 2008. Class A and Investor Class shares are offered at net asset value (“NAV”) per share plus an initial sales charge. No initial sales charge applies to investments of $1 million or more (and certain other qualified purchases) in Class A and Investor Class shares, but a contingent deferred sales charge (“CDSC”) of 1.00% may be imposed on certain redemptions of such shares made within one year of the date of purchase on shares that were purchased without an initial sales charge made before January 1, 2017. Effective January 1, 2017, a CDSC of 1.00% may be imposed on certain redemptions of Class A and Investor Class shares made within 24 months of the date of purchase of such shares that were made without an initial sales charge. Class B and Class C shares are offered at NAV without an initial sales charge, although a CDSC that declines depending on the number of years a shareholder has held its Class B shares may be imposed on redemptions made within six years of the date of purchase of such shares and a 1.00% CDSC may be imposed on redemptions made within one year of the date of purchase of Class C shares. Class I shares are offered at NAV and are not subject to a sales charge. Depending upon eligibility, Class B shares convert to either Class A or Investor Class shares at the end of the calendar quarter eight years after the date they were purchased. Additionally, depending upon eligibility, Class A shares may convert to Investor Class shares and Investor Class shares may convert to Class A shares. Under certain circumstances and as may be permitted by the Trust’s multiple class plan under Rule 18f-3 of the 1940 Act, an exchange/conversion may be made from specified share classes of the Fund to one or more other share classes of the Fund as disclosed in the capital share transactions within these notes. The five classes of shares have the same voting (except for issues that relate solely to one class), dividend, liquidation and other rights, and the same terms and conditions, except that Class B and Class C shares are subject to higher distribution and/or service fee rates than Class A and Investor Class shares under a distribution plan pursuant to Rule 12b-1 under the 1940 Act. Class I shares are not subject to a distribution and/or service fee.
The Fund’s investment objective is to seek maximum current income by investing in high-yield debt securities of non-U.S. issuers. Capital appreciation is a secondary objective.
Note 2–Significant Accounting Policies
The Fund is an investment company and accordingly follows the investment company accounting and reporting guidance of the Financial Accounting Standards Board (“FASB”) Accounting Standard Codification
Topic 946 Financial Services—Investment Companies. The Fund prepares its financial statements in accordance with generally accepted accounting principles (“GAAP”) in the United States of America and follows the significant accounting policies described below.
(A) Securities Valuation. Investments are usually valued as of the close of regular trading on the New York Stock Exchange (the “Exchange”) (usually 4:00 p.m. Eastern time) on each day the Fund is open for business (“valuation date”).
The Board of Trustees (the “Board”) adopted procedures establishing methodologies for the valuation of the Fund’s securities and other assets and delegated the responsibility for valuation determinations under those procedures to the Valuation Committee of the Trust (the “Valuation Committee”). The Board authorized the Valuation Committee to appoint a Valuation Sub-Committee (the “Sub-Committee”) to deal in the first instance with establishing the prices of securities for which market quotations are not readily available or the prices of which are not otherwise readily determinable under these procedures. The Sub-Committee meets (in person, via electronic mail or via teleconference) on an as-needed basis. Subsequently, the Valuation Committee meets to ensure that actions taken by the Sub-Committee were appropriate. The procedures recognize that, subject to the oversight of the Board and unless otherwise noted, the responsibility for the day-to-day valuation of portfolio assets (including fair value measurements for the Fund’s assets and liabilities) rests with New York Life Investment Management LLC (“New York Life Investments” or the “Manager”), aided to whatever extent necessary by the Subadvisor (as defined in Note 3(A)) to the Fund.
To assess the appropriateness of security valuations, the Manager, Subadvisor or the Fund’s third party service provider, who is subject to oversight by the Manager, regularly compares prior day prices, prices on comparable securities, and the sale prices to the prior and current day prices and challenges prices with changes exceeding certain tolerance levels with third party pricing services or broker sources. For those securities valued through either a standardized fair valuation methodology or a fair valuation measurement, the Sub-Committee deals in the first instance with such valuation and the Valuation Committee reviews and affirms, if appropriate, the reasonableness of the valuation based on such methodologies and measurements on a regular basis after considering all relevant information that is reasonably available. Any action taken by the Sub-Committee with respect to the valuation of a portfolio security or other asset is submitted by the Valuation Committee to the Board for its review and ratification, if appropriate, at its next regularly scheduled meeting.
“Fair value” is defined as the price the Fund would reasonably expect to receive upon selling an asset or liability in an orderly transaction to an independent buyer in the principal or most advantageous market for the asset or liability. Fair value measurements are determined within a framework that establishes a three-tier hierarchy which maximizes the use of observable market data and minimizes the use of unobservable inputs to establish a classification of fair value measurements for disclosure purposes. “Inputs” refer broadly to the assumptions that market participants would use in pricing the asset or liability, including assumptions about risk, such as the risk inherent in a particular valuation technique used to measure fair value using a pricing model and/or the risk inherent in the inputs for the valuation technique. Inputs may be
| | |
| 22 | | MainStay Global High Income Fund |
observable or unobservable. Observable inputs reflect the assumptions market participants would use in pricing the asset or liability based on market data obtained from sources independent of the Fund. Unobservable inputs reflect the Fund’s own assumptions about the assumptions market participants would use in pricing the asset or liability based on the information available. The inputs or methodology used for valuing assets or liabilities may not be an indication of the risks associated with investing in those assets or liabilities. The three-tier hierarchy of inputs is summarized below.
| • | | Level 1—quoted prices in active markets for an identical asset or liability |
| • | | Level 2—other significant observable inputs (including quoted prices for a similar asset or liability in active markets, interest rates and yield curves, prepayment speeds, credit risk, etc.) |
| • | | Level 3—significant unobservable inputs (including the Fund’s own assumptions about the assumptions that market participants would use in measuring fair value of an asset or liability) |
The level of an asset or liability within the fair value hierarchy is based on the lowest level of an input, both individually and in the aggregate, that is significant to the fair value measurement. As of October 31, 2016, the aggregate value by input level of the Fund’s assets and liabilities is included at the end of the Fund’s Portfolio of Investments.
The Fund may use third party vendor evaluations, whose prices may be derived from one or more of the following standard inputs, among others:
| | |
• Benchmark yields | | • Reported trades |
• Broker/dealer quotes | | • Issuer spreads |
• Two-sided markets | | • Benchmark securities |
• Bids/offers | | • Reference data (corporate actions or material event notices) |
• Industry and economic events | | • Comparable bonds |
• Equity and credit default swap curves | | • Monthly payment information |
An asset or liability for which market values cannot be measured using the methodologies described above is valued by methods deemed reasonable in good faith by the Valuation Committee, following the procedures established by the Board, to represent fair value. Under these procedures, the Fund generally uses a market-based approach which may use related or comparable assets or liabilities, recent transactions, market multiples, book values, and other relevant information. The Fund may also use an income-based valuation approach in which the anticipated future cash flows of the asset or liability are discounted to calculate fair value. Discounts may also be applied due to the nature and/or duration of any restrictions on the disposition of the asset or liability. Fair value represents a good faith approximation of the value of a security. Fair value determinations involve the consideration of a number of subjective factors, an analysis of applicable facts and circumstances and the exercise of judgment. As a result, it is possible that the fair value for a security determined in good faith in accordance with the Fund’s valuation procedures may differ from valuations for the same security determined by other funds using their own valuation procedures. Although the Fund’s valuation procedures are designed to value a security at the price the Fund may reasonably expect to receive
upon its sale in an orderly transaction, there can be no assurance that any fair value determination thereunder would, in fact, approximate the amount that the Fund would actually realize upon the sale of the security or the price at which the security would trade if a reliable market price were readily available. During the year ended October 31, 2016, there were no material changes to the fair value methodologies.
Equity and non-equity securities which may be valued in this manner include, but are not limited to: (i) a security for which trading has been halted or suspended; (ii) a debt security that has recently gone into default and for which there is not a current market quotation; (iii) a security of an issuer that has entered into a restructuring; (iv) a security that has been de-listed from a national exchange; (v) a security for which the market price is not readily available from a third party pricing source or, if so provided, does not, in the opinion of the Manager or Subadvisor reflect the security’s market value; (vi) a security subject to trading collars for which no or limited trading takes place; and (vii) a security whose principal market has been temporarily closed at a time when, under normal conditions, it would be open. Securities for which market quotations or observable inputs are not readily available are generally categorized as Level 3 in the hierarchy. As of October 31, 2016, there were no securities held by the Fund that were fair valued in such a manner.
Options contracts are valued at the last posted settlement price on the market where such options are primarily traded. Futures contracts are valued at the last posted settlement price on the market where such futures are primarily traded. Investments in mutual funds, including money market funds, are valued at their respective NAVs as of the close of the Exchange on the valuation date. These securities are generally categorized as Level 1 in the hierarchy.
Debt securities (other than convertible and municipal bonds) are valued at the evaluated bid prices (evaluated mean prices in the case of convertible and municipal bonds) supplied by a pricing agent or brokers selected by the Manager, in consultation with the Subadvisor. Those values reflect broker/dealer supplied prices and electronic data processing techniques, if the evaluated bid or mean prices are deemed by the Manager, in consultation with the Subadvisor, to be representative of market values, at the regular close of trading of the Exchange on each valuation date. Debt securities purchased on a delayed delivery basis are marked to market daily until settlement at the forward settlement date. Debt securities, including corporate bonds, U.S. government & federal agency bonds, municipal bonds, foreign bonds, convertible bonds, asset-backed securities and mortgage-backed securities are generally categorized as Level 2 in the hierarchy.
Temporary cash investments acquired in excess of 60 days to maturity at the time of purchase are valued using the latest bid prices or using valuations based on a matrix system (which considers such factors as security prices, yields, maturities, and ratings), both as furnished by independent pricing services. Other temporary cash investments which mature in 60 days or less at the time of purchase (“Short-Term Investments”) are valued using the amortized cost method of valuation, unless the use of such method would be inappropriate. The amortized cost method involves valuing a security at its cost on the date of purchase and thereafter assuming a constant amortization to maturity of the difference between such cost and the value on maturity date. Amortized cost approximates the current fair value of a security. Securities
Notes to Financial Statements (continued)
valued using the amortized cost method are not valued using quoted prices in an active market and are generally categorized as Level 2 in the hierarchy.
Foreign currency forward contracts are valued at their fair market values measured on the basis of the mean between the last current bid and ask prices based on dealer or exchange quotations and are generally categorized as Level 2 in the hierarchy.
The information above is not intended to reflect an exhaustive list of the methodologies that may be used to value portfolio investments. The valuation procedures permit the use of a variety of valuation methodologies in connection with valuing portfolio investments. The methodology used for a specific type of investment may vary based on the market data available or other considerations. The methodologies summarized above may not represent the specific means by which portfolio investments are valued on any particular business day.
A Fund security or other asset may be determined to be illiquid under procedures approved by the Board. Illiquidity of a security might prevent the sale of such security at a time when the Manager or Subadvisor might wish to sell, and these securities could have the effect of decreasing the overall level of the Fund’s liquidity. Further, the lack of an established secondary market may make it more difficult to value illiquid securities, requiring the Fund to rely on judgments that may be somewhat subjective in measuring value, which could vary materially from the amount that the Fund could realize upon disposition. Difficulty in selling illiquid securities may result in a loss or may be costly to the Fund. Under the supervision of the Board, the Manager or Subadvisor determines the liquidity of the Fund’s investments; in doing so, the Manager or Subadvisor may consider various factors, including (i) the frequency of trades and quotations, (ii) the number of dealers and prospective purchasers, (iii) dealer undertakings to make a market, and (iv) the nature of the security and the market in which it trades (e.g., the time needed to dispose of the security, the method of soliciting offers and the mechanics of transfer). Illiquid securities often are valued in accordance with methods deemed by the Board in good faith to be reasonable and appropriate to accurately reflect their fair value. The liquidity of the Fund’s investments, as shown in the Portfolio of Investments, was measured as of October 31, 2016 and can change at any time in response to, among other relevant factors, market conditions or events or developments with respect to an individual issuer or instrument.
(B) Income Taxes. The Fund’s policy is to comply with the requirements of the Internal Revenue Code of 1986, as amended (the “Internal Revenue Code”), applicable to regulated investment companies and to distribute all of its taxable income to the shareholders of the Fund within the allowable time limits. Therefore, no federal, state and local income tax provisions are required.
Management evaluates the Fund’s tax positions to determine if the tax positions taken meet the minimum recognition threshold in connection with accounting for uncertainties in income tax positions taken or expected to be taken for the purposes of measuring and recognizing tax liabilities in the financial statements. Recognition of tax benefits of an uncertain tax position is permitted only to the extent the position is “more likely than not” to be sustained assuming examination by taxing authorities. Management has analyzed the Fund’s tax positions taken on
federal, state and local income tax returns for all open tax years (for up to three tax years), and has concluded that no provisions for federal, state and local income tax are required in the Fund’s financial statements. The Fund’s federal, state and local income and federal excise tax returns for tax years for which the applicable statutes of limitations have not expired are subject to examination by the Internal Revenue Service and state and local departments of revenue.
(C) Foreign Taxes. The Fund may be subject to foreign taxes on income and other transaction-based taxes imposed by certain countries in which it invests. A portion of the taxes on gains on investments or currency purchases/repatriation may be recoverable. The Fund will accrue such taxes and recoveries as applicable, based upon its current interpretation of tax rules and regulations that exist in the markets in which it invests.
(D) Dividends and Distributions to Shareholders. Dividends and distributions are recorded on the ex-dividend date. The Fund intends to declare and pay dividends from net investment income, if any, at least monthly and distributions from net realized capital and currency gains, if any, at least annually. Unless the shareholder elects otherwise, all dividends and distributions are reinvested in the same class of shares of the Fund, at NAV. Dividends and distributions to shareholders are determined in accordance with federal income tax regulations and may differ from GAAP.
(E) Security Transactions and Investment Income. The Fund records security transactions on the trade date. Realized gains and losses on security transactions are determined using the identified cost method. Interest income is accrued as earned using the effective interest rate method. Discounts and premiums on securities purchased, other than Short-Term Investments, for the Fund are accreted and amortized, respectively, on the effective interest rate method over the life of the respective securities. Discounts and premiums on Short-Term Investments are accreted and amortized, respectively, on the straight-line method. The straight-line method approximates the effective interest method for Short-Term investments. Income from payment-in-kind securities is accreted daily based on the effective interest method.
Investment income and realized and unrealized gains and losses on investments of the Fund are allocated to separate classes of shares pro rata based upon their relative net assets on the date the income is earned or realized and unrealized gains and losses are incurred.
The Fund may place a debt security on non-accrual status and reduce related interest income by ceasing current accruals and writing off all or a portion of any interest receivables when the collection of all or a portion of such interest has become doubtful. A debt security is removed from non-accrual status when the issuer resumes interest payments or when collectability of interest is reasonably assured.
(F) Expenses. Expenses of the Trust are allocated to the individual Funds in proportion to the net assets of the respective Funds when the expenses are incurred, except where direct allocations of expenses can be made. Expenses (other than transfer agent expenses and fees incurred under the shareholder services plans and/or the distribution plans further discussed in Note 3(B)) are allocated to separate classes of shares pro rata based upon their relative net assets on the date the expenses are incurred. The expenses borne by the Fund, including those of related parties to the Fund, are shown in the Statement of Operations.
| | |
| 24 | | MainStay Global High Income Fund |
(G) Use of Estimates. In preparing financial statements in conformity with GAAP, management makes estimates and assumptions that affect the reported amounts and disclosures in the financial statements. Actual results could differ from those estimates.
(H) Repurchase Agreements. The Fund may enter into repurchase agreements to earn income. The Fund may enter into repurchase agreements only with financial institutions that are deemed by the Manager or Subadvisor to be creditworthy, pursuant to guidelines established by the Board. During the term of any repurchase agreement, the Manager or Subadvisor will continue to monitor the creditworthiness of the seller. Under the 1940 Act, repurchase agreements are considered to be collateralized loans by the Fund to the seller secured by the securities transferred to the Fund.
When the Fund enters into repurchase agreements, the Fund’s custodian takes possession of the collateral pledged for investments in the repurchase agreement. The underlying collateral is valued daily on a mark to market basis to determine if the value, including accrued interest, exceeds the repurchase price. In the event of the seller’s default on the obligation to repurchase, the Fund has the right to liquidate the collateral and apply the proceeds in satisfaction of the obligation. Under certain circumstances, such as in the event of default or bankruptcy by the counterparty to the agreement, realization and/or retention of the collateral may be subject to legal proceedings and possible realized loss to the Fund.
(I) Futures Contracts. A futures contract is an agreement to purchase or sell a specified quantity of an underlying instrument at a specified future date and price, or to make or receive a cash payment based on the value of a financial instrument (e.g., foreign currency, interest rate, security, or securities index). The Fund is subject to risks such as market price risk and/or interest rate risk in the normal course of investing in these transactions. Upon entering into a futures contract, the Fund is required to pledge to the broker or futures commission merchant an amount of cash and/or U.S. Government securities equal to a certain percentage of the collateral amount, known as the “initial margin.” During the period the futures contract is open, changes in the value of the contract are recognized as unrealized appreciation or depreciation by marking to market such contract on a daily basis to reflect the market value of the contract at the end of each day’s trading. The Fund agrees to receive from or pay to the broker or futures commission merchant an amount of cash equal to the daily fluctuation in the value of the contract. Such receipts or payments are known as “variation margin.” When the futures contract is closed, the Fund records a realized gain or loss equal to the difference between the proceeds from (or cost of) the closing transaction and the Fund’s basis in the contract.
The use of futures contracts involves, to varying degrees, elements of market risk in excess of the amount recognized in the Statement of Assets and Liabilities. The contract or notional amounts and variation margin reflect the extent of the Fund’s involvement in open futures positions. There are several risks associated with the use of futures contracts as hedging techniques. There can be no assurance that a liquid market will exist at the time when the Fund seeks to close out a futures contract. If no liquid market exists, the Fund would remain obligated to meet margin requirements until the position is closed. Futures may involve a small initial investment relative to the risk assumed, which
could result in losses greater than if they had not been used. Futures may be more volatile than direct investments in the instrument underlying the futures, and may not correlate to the underlying instrument, causing a given hedge not to achieve its objectives. The Fund’s activities in futures contracts have minimal counterparty risk as they are conducted through regulated exchanges that guarantee the futures against default by the counterparty. In the event of a bankruptcy or insolvency of a futures commission merchant that holds margin on behalf of the Fund, the Fund may not be entitled to the return of the entire margin owed to the Fund, potentially resulting in a loss. The Fund’s investment in futures contracts and other derivatives may increase the volatility of the Fund’s NAV and may result in a loss to the Fund.
(J) Foreign Currency Forward Contracts. The Fund may enter into foreign currency forward contracts, which are agreements to buy or sell foreign currencies on a specified future date at a specified rate. The Fund is subject to foreign currency exchange rate risk in the normal course of investing in these transactions. During the period the forward contract is open, changes in the value of the contract are recognized as unrealized appreciation or depreciation by marking to market such contract on a daily basis to reflect the market value of the contract at the end of each day’s trading. Cash movement occurs on settlement date. When the forward contract is closed, the Fund records a realized gain or loss equal to the difference between the proceeds from (or cost of) the closing transaction and the Fund’s basis in the contract. The Fund may purchase and sell foreign currency forward contracts for purposes of seeking to enhance portfolio returns and manage portfolio risk more efficiently. Foreign currency forward contracts may also be used to gain exposure to a particular currency or to hedge against the risk of loss due to changing currency exchange rates. Foreign currency forward contracts to purchase or sell a foreign currency may also be used in anticipation of future purchases or sales of securities denominated in foreign currency, even if the specific investments have not yet been selected.
The use of foreign currency forward contracts involves, to varying degrees, elements of risk in excess of the amount recognized in the Statement of Assets and Liabilities, including counterparty risk, market risk, and illiquidity risk. Counterparty risk is heightened for these instruments because foreign currency forward contracts are not exchange-traded and therefore no clearinghouse or exchange stands ready to meet the obligations under such contracts. Thus, the Fund faces the risk that its counterparties under such contracts may not perform their obligations. Market risk is the risk that the value of a foreign currency forward contract will depreciate due to unfavorable changes in exchange rates. Illiquidity risk arises because the secondary market for foreign currency forward contracts may have less liquidity relative to markets for other securities and financial instruments. Risks also arise from the possible movements in the foreign exchange rates underlying these instruments. While the Fund may enter into forward contracts to reduce currency exchange risks, changes in currency exchange rates may result in poorer overall performance for the Fund than if it had not engaged in such transactions. Exchange rate movements can be large, depending on the currency, and can last for extended periods of time, affecting the value of the Fund’s assets. Moreover, there may be an imperfect correlation between the Fund’s holdings of securities denominated in a particular currency and the
Notes to Financial Statements (continued)
forward contracts entered into by the Fund. Such imperfect correlation may prevent the Fund from achieving the intended hedge or expose the Fund to the risk of currency exchange loss. The unrealized appreciation (depreciation) on forward contracts also reflects the Fund’s exposure at the valuation date to credit loss in the event of a counterparty’s failure to perform its obligations.
(K) Foreign Currency Transactions. The Fund’s books and records are maintained in U.S. dollars. Prices of securities denominated in foreign currency amounts are translated into U.S. dollars at the mean between the buying and selling rates last quoted by any major U.S. bank at the following dates:
| (i) | market value of investment securities, other assets and liabilities—at the valuation date; and |
| (ii) | purchases and sales of investment securities, income and expenses—at the date of such transactions. |
The assets and liabilities that are denominated in foreign currency amounts are presented at the exchange rates and market values at the close of the period. The realized and unrealized changes in net assets arising from fluctuations in exchange rates and market prices of securities are not separately presented.
Net realized gain (loss) on foreign currency transactions represents net gains and losses on foreign currency forward contracts, net currency gains or losses realized as a result of differences between the amounts of securities sale proceeds or purchase cost, dividends, interest and withholding taxes as recorded on the Fund’s books, and the U.S. dollar equivalent amount actually received or paid. Net currency gains or losses from valuing such foreign currency denominated assets and liabilities, other than investments at valuation date exchange rates, are reflected in unrealized foreign exchange gains or losses.
(L) Securities Lending. In order to realize additional income, the Fund may engage in securities lending, subject to the limitations set forth in the 1940 Act and relevant guidance by the staff of the Securities and Exchange Commission (“SEC”). In the event the Fund does engage in securities lending, the Fund will lend through its custodian, State Street Bank and Trust Company (“State Street”). State Street will manage the Fund’s cash collateral in accordance with the lending agreement between the Fund and State Street, and indemnify the Fund against counterparty risk. The loans will be collateralized by cash or securities at least equal at all times to the market value of the securities loaned. Collateral will consist of U.S. government securities, cash equivalents or irrevocable letters of credit. The Fund may bear the risk of delay in recovery of, or loss of rights in, the securities loaned should the borrower of the securities experience financial difficulty. The Fund may also record a realized gain or loss on securities deemed sold due to a borrower’s inability to return securities on loan. The Fund bears the risk of any loss on investment of the collateral. The Fund will receive compensation for lending its securities in the form of fees or it will retain a portion of interest on the investment of any cash received as collateral. The Fund will also continue to receive interest and dividends on the securities loaned and any gain or loss in the market price of the securities loaned that may occur during the term of the loan will be for the account of the Fund. During the year ended October 31, 2016, the Fund did not have any portfolio securities on loan.
(M) High Yield and General Debt Securities Risk. The Fund’s principal investments include high yield debt securities (commonly referred to as “junk bonds”), which are considered speculative because they present a greater risk of loss, including default, than higher quality debt securities. These securities pay investors a premium—a higher interest rate or yield than investment grade debt securities—because of the increased risk of loss. These securities can also be subject to greater price volatility. In times of unusual or adverse market economic or political conditions, these securities may experience higher than normal default rates.
The Fund may invest in foreign securities, which carry certain risks that are in addition to the usual risks inherent in domestic securities. These risks include those resulting from currency fluctuations, future adverse political or economic developments and possible imposition of currency exchange blockages or other foreign governmental laws or restrictions. These risks are likely to be greater in emerging markets than in developed markets. The ability of issuers of debt securities held by the Fund to meet their obligations may be affected by economic or political developments in a specific country, industry or region.
(N) Indemnifications. Under the Trust’s organizational documents, its officers and trustees are indemnified against certain liabilities that may arise out of performance of their duties to the Trust. Additionally, in the normal course of business, the Fund enters into contracts with third-party service providers that contain a variety of representations and warranties and which may provide general indemnifications. The Fund’s maximum exposure under these arrangements is unknown, as this would involve future claims that may be made against the Fund that have not yet occurred. Based on experience, management is of the view that the risk of loss in connection with these potential indemnification obligations is remote. However, there can be no assurance that material liabilities related to such obligations will not arise in the future, which could adversely impact the Fund.
(O) Quantitative Disclosure of Derivative Holdings. The following tables show additional disclosures related to the Fund’s derivative and hedging activities, including how such activities are accounted for and their effect on the Fund’s financial positions, performance and cash flows. The Fund entered into futures contracts to help manage the duration and yield curve positioning of the portfolio while minimizing the exposure to wider bid/ask spreads in traditional bonds. The Fund also entered into foreign currency forward contracts to hedge against the risk of loss due to changing currency exchange rates. These derivatives are not accounted for as hedging instruments.
Fair value of derivatives instruments as of October 31, 2016:
Asset Derivatives
| | | | | | | | |
| | | Statement of
Assets and
Liabilities
Location | | Foreign
Exchange
Contracts
Risk | | Total | |
Forward Contracts | | Unrealized appreciation on
foreign currency forward contracts | | $94,605 | | $ | 94,605 | |
| | | | | |
Total Fair Value | | $94,605 | | $ | 94,605 | |
| | | | | |
| | |
| 26 | | MainStay Global High Income Fund |
The effect of derivative instruments on the Statement of Operations for the year ended October 310, 2016:
Realized Gain (Loss)
| | | | | | | | |
| | | Statement of
Operations
Location | | Foreign
Exchange
Contracts
Risk | | Total | |
Forward Contracts | | Net realized gain (loss) on foreign currency transactions | | $1,106,789 | | $ | 1,106,789 | |
| | | | | |
Total Realized Gain (Loss) | | $1,106,789 | | $ | 1,106,789 | |
| | | | | |
| | | | | | | | |
Change in Unrealized Appreciation (Depreciation)
| | | | | | | | | | |
| | | Statement of
Operations
Location | | Foreign
Exchange
Contracts
Risk | | | Total | |
Forward Contracts | | Net change in unrealized appreciation (depreciation) on translation of other assets and liabilities in foreign currencies and foreign currency forward contracts | | $ | (345,053 | ) | | $ | (345,053 | ) |
| | | | | | |
Total Change in Unrealized Appreciation (Depreciation) | | $ | (345,053 | ) | | $ | (345,053 | ) |
| | | | | | |
| | | | | | | | | | |
Average Notional Amount
| | | | | | | | |
| | | Foreign
Exchange
Contracts
Risk | | | Total | |
Forward Contracts Long | | $ | 14,545,469 | | | $ | 14,545,469 | |
Forward Contracts Short | | $ | (14,453,747 | ) | | $ | (14,453,747 | ) |
| | | | |
Note 3–Fees and Related Party Transactions
(A) Manager and Subadvisor. New York Life Investments, a registered investment adviser and an indirect, wholly-owned subsidiary of New York Life Insurance Company (“New York Life”), serves as the Fund’s Manager, pursuant to an Amended and Restated Management Agreement (“Management Agreement”). The Manager provides offices, conducts clerical, recordkeeping and bookkeeping services, and keeps most of the financial and accounting records required to be maintained by the Fund. Except for the portion of salaries and expenses that are the responsibility of the Fund, the Manager pays the salaries and expenses of all personnel affiliated with the Fund and certain operational expenses of the Fund. The Fund reimburses New York Life Investments in an amount equal to a portion of the compensation of the Chief Compliance Officer of the Fund. MacKay Shields LLC (“MacKay Shields” or the “Subadvisor”), a registered investment adviser and an indirect,
wholly-owned subsidiary of New York Life, serves as Subadvisor to the Fund and is responsible for the day-to-day portfolio management of the Fund. Pursuant to the terms of the Amended and Restated Subadvisory Agreement (“Subadvisory Agreement”) between New York Life Investments and MacKay Shields, New York Life Investments pays for the services of the Subadvisor.
Under the Management Agreement, the Fund pays the Manager a monthly fee for services performed and facilities furnished at an annual rate of the Fund’s average daily net assets as follows: 0.70% to $500 million and 0.65% in excess of $500 million, plus a fee for fund accounting services previously provided by New York Life Investments under a separate fund accounting agreement furnished at an annual rate of the Fund’s average net assets as follows: 0.05% up to $20 million; 0.0333% from $20 million to $100 million; and 0.01% in excess of $100 million. During the year ended October 31, 2016, the effective management fee rate was 0.72% inclusive of a fee for fund accounting services of 0.02% of the Fund’s average daily net assets.
During the year ended October 31, 2016 New York Life Investments earned fees from the Fund in the amount of $1,345,743.
State Street provides sub-administration and sub-accounting services to the Fund pursuant to an agreement with New York Life Investments. These services include calculating the daily NAVs of the Fund, maintaining the general ledger and sub-ledger accounts for the calculation of the Fund’s NAVs, and assisting New York Life Investments in conducting various aspects of the Fund’s administrative operations. For providing these services to the Fund, State Street is compensated by New York Life Investments.
(B) Distribution and Service Fees. The Trust, on behalf of the Fund, has entered into a distribution agreement with NYLIFE Distributors LLC (the “Distributor”), an indirect, wholly-owned subsidiary of New York Life. The Fund has adopted distribution plans (the “Plans”) in accordance with the provisions of Rule 12b-1 under the 1940 Act.
Pursuant to the Class A and Investor Class Plans, the Distributor receives a monthly distribution fee from the Class A and Investor Class shares at an annual rate of 0.25% of the average daily net assets of the Class A and Investor Class shares for distribution and/or service activities as designated by the Distributor. Pursuant to the Class B and Class C Plans, Class B and Class C shares pay the Distributor a monthly distribution fee at an annual rate of 0.75% of the average daily net assets of the Class B and Class C shares along with a service fee at an annual rate of 0.25% of the average daily net assets of the Class B and Class C shares, for a total 12b-1 fee of 1.00%. Class I shares are not subject to a distribution and/or service fee.
The Plans provide that the distribution and service fees are payable to the Distributor regardless of the amounts actually expended by the Distributor for distribution of the Fund’s shares and service activities.
(C) Sales Charges. During the year ended October 31, 2016, the Fund was advised by the Distributor that the amount of initial sales charges retained on sales of Class A and Investor Class shares were $25,580 and $6,547, respectively. During the year ended October 31, 2016, the Fund was also advised that the Distributor retained CDSCs on redemptions of Class A, Investor Class, Class B and Class C shares of $3,779, $14, $22,722 and $6,921, respectively.
Notes to Financial Statements (continued)
(D) Transfer, Dividend Disbursing and Shareholder Servicing Agent. NYLIM Service Company LLC, an affiliate of New York Life Investments, is the Fund’s transfer, dividend disbursing and shareholder servicing agent pursuant to an agreement between NYLIM Service Company LLC and the Trust. NYLIM Service Company LLC has entered into an agreement with Boston Financial Data Services, Inc. (“BFDS”) pursuant to which BFDS performs certain transfer agent services on behalf of NYLIM Service Company LLC. During the year ended October 31, 2016, transfer agent expenses incurred by the Fund were as follows:
| | | | |
Class A | | $ | 128,312 | |
Investor Class | | | 82,613 | |
Class B | | | 23,981 | |
Class C | | | 114,626 | |
Class I | | | 17,674 | |
(E) Small Account Fee. Shareholders with small accounts adversely impact the cost of providing transfer agency services. In an effort to reduce total transfer agency expenses, the Fund has implemented a small account fee on certain types of accounts. Certain shareholders with an account balance of less than $1,000 are charged an annual per account fee of $20 (assessed semi-annually), the proceeds from which offset transfer agent fees as reflected in the Statement of Operations.
(F) Capital. As of October 31, 2016, New York Life and its affiliates beneficially held shares of the Fund with values and percentages of net assets as follows:
Note 4–Federal Income Tax
As of October 31, 2016, the components of accumulated gain (loss) on a tax basis were as follows:
| | | | | | | | | | | | | | | | |
Ordinary Income | | Accumulated
Capital and
Other Gain
(Loss) | | | Other
Temporary
Differences | | | Unrealized
Appreciation
(Depreciation) | | | Total
Accumulated
Gain (Loss) | |
$— | | $ | (10,922,661 | ) | | $ | (87,026 | ) | | $ | (150,212 | ) | | $ | (11,159,899 | ) |
The other temporary differences are primarily due to dividends payable.
The following table discloses the current year reclassifications between undistributed net investment income (loss), accumulated net realized gain (loss) on investments, and additional paid-in capital arising from permanent differences; net assets as of October 31, 2016 were not affected.
| | | | | | | | | | |
Undistributed
Net Investment
Income (Loss) | | | Accumulated
Net Realized
Gain (Loss)
on Investments | | | Additional
Paid-In
Capital | |
| | $(4,523,585) | | | $ | 4,523,585 | | | $ | — | |
The reclassifications for the Fund are primarily due to foreign currency gain (loss).
As of October 31, 2016, for federal income tax purposes, capital loss carryforwards of $10,922,661 were available as shown in the table below, to the extent provided by the regulations to offset future realized gains of the Fund through the years indicated. To the extent that these capital loss carryforwards are used to offset future capital gains, it is probable that the capital gains so offset will not be distributed to shareholders. No capital gain distributions shall be made until any capital loss carryforwards have been fully utilized or expired.
| | | | | | | | |
Capital Loss
Available Through | | Short-Term
Capital Loss
Amounts (000’s) | | | Long-Term
Capital Loss
Amounts (000’s) | |
| Unlimited | | $ | 416 | | | $ | 10,507 | |
During the years ended October 31, 2016 and October 31, 2015, the tax character of distributions paid as reflected in the Statements of Changes in Net Assets was as follows:
| | | | | | | | |
| | | 2016 | | | 2015 | |
Distributions paid from: | | | | | | | | |
Ordinary Income | | $ | 5,155,675 | | | $ | 13,171,711 | |
Long-Term Capital Gain | | | — | | | | 5,079,408 | |
Return of Capital | | | 4,417,544 | | | | 1,258,082 | |
Total | | $ | 9,573,219 | | | $ | 19,509,201 | |
Note 5–Custodian
State Street is the custodian of cash and securities held by the Fund. Custodial fees are charged to the Fund based on the Fund’s net assets and/or the market value of securities held by the Fund and the number of certain transactions incurred by the Fund.
Note 6–Line of Credit
The Fund and certain other funds managed by New York Life Investments, maintain a line of credit with a syndicate of banks in order to secure a source of funds for temporary purposes to meet unanticipated or excessive redemption requests.
Effective August 2, 2016, under an amended and restated credit agreement (the “Credit Agreement”), the aggregate commitment amount is $600,000,000 with an additional uncommitted amount of $100,000,000. The commitment fee is an annual rate of 0.15% of the average commitment amount payable quarterly, regardless of usage, to Bank of New York Mellon, who serves as the agent to the syndicate. The commitment fee is allocated among the Fund and certain affiliated funds based upon their respective net assets and other factors. Interest on any revolving credit loan is charged based upon the Federal Funds Advances Rate or the one month London InterBank Offered Rate, whichever is higher. The Credit Agreement expires on August 1, 2017, although the Fund, certain affiliated funds and the syndicate of banks may renew the Credit Agreement for an additional year on the same or different terms. Prior to August 2, 2016, the aggregate commitment amount was $600,000,000 with an additional uncommitted amount of $100,000,000, and the commitment fee was at an annual rate of 0.10% of the average commitment amount. During the year ended October 31, 2016, there were no borrowings made or outstanding with respect to the Fund under the Credit Agreement.
| | |
| 28 | | MainStay Global High Income Fund |
Note 7–Interfund Lending Program
Pursuant to an exemptive order issued by the SEC, the Fund, along with certain other funds managed by New York Life Investments, may participate in an interfund lending program. The interfund lending program provides an alternate credit facility that permits the Fund and certain other funds managed by New York Life Investments to lend or borrow money for temporary purposes directly to or from one another, subject to the conditions of the exemptive order. During the year ended October 31, 2016, there were no interfund loans made or outstanding with respect to the Fund.
Note 8–Purchases and Sales of Securities (in 000’s)
During the year ended October 31, 2016, purchases and sales of securities, other than short-term securities, were $67,922 and $68,941, respectively.
Note 9–Capital Share Transactions
| | | | | | | | |
Class A | | Shares | | | Amount | |
Year ended October 31, 2016: | | | | | | | | |
Shares sold | | | 3,503,620 | | | $ | 35,621,956 | |
Shares issued to shareholders in reinvestment of dividends and distributions | | | 481,703 | | | | 4,776,515 | |
Shares redeemed | | | (4,050,073 | ) | | | (40,976,204 | ) |
| | | | |
Net increase (decrease) in shares outstanding before conversion | | | (64,750 | ) | | | (577,733 | ) |
Shares converted into Class A (See Note 1) | | | 279,282 | | | | 2,834,047 | |
Shares converted from Class A (See Note 1) | | | (57,052 | ) | | | (572,828 | ) |
| | | | |
Net increase (decrease) | | | 157,480 | | | $ | 1,683,486 | |
| | | | |
Year ended October 31, 2015: | | | | | | | | |
Shares sold | | | 1,799,031 | | | $ | 17,961,990 | |
Shares issued to shareholders in reinvestment of dividends and distributions | | | 893,305 | | | | 8,785,725 | |
Shares redeemed | | | (3,940,974 | ) | | | (39,369,178 | ) |
| | | | |
Net increase (decrease) in shares outstanding before conversion | | | (1,248,638 | ) | | | (12,621,463 | ) |
Shares converted into Class A (See Note 1) | | | 67,815 | | | | 673,223 | |
Shares converted from Class A (See Note 1) | | | (211,447 | ) | | | (2,045,040 | ) |
| | | | |
Net increase (decrease) | | | (1,392,270 | ) | | $ | (13,993,280 | ) |
| | | | |
| | | | | | | | |
Investor Class | | Shares | | | Amount | |
Year ended October 31, 2016: | | | | | | | | |
Shares sold | | | 855,021 | | | $ | 9,110,002 | |
Shares issued to shareholders in reinvestment of dividends and distributions | | | 130,823 | | | | 1,308,977 | |
Shares redeemed | | | (389,117 | ) | | | (3,894,045 | ) |
| | | | |
Net increase (decrease) in shares outstanding before conversion | | | 596,727 | | | | 6,524,934 | |
Shares converted into Investor Class (See Note 1) | | | 123,330 | | | | 1,238,250 | |
Shares converted from Investor Class (See Note 1) | | | (270,240 | ) | | | (2,767,491 | ) |
| | | | |
Net increase (decrease) | | | 449,817 | | | $ | 4,995,693 | |
| | | | |
Year ended October 31, 2015: | | | | | | | | |
Shares sold | | | 232,196 | | | $ | 2,336,797 | |
Shares issued to shareholders in reinvestment of dividends and distributions | | | 215,625 | | | | 2,135,643 | |
Shares redeemed | | | (453,712 | ) | | | (4,564,154 | ) |
| | | | |
Net increase (decrease) in shares outstanding before conversion | | | (5,891 | ) | | | (91,714 | ) |
Shares converted into Investor Class (See Note 1) | | | 297,117 | | | | 2,924,492 | |
Shares converted from Investor Class (See Note 1) | | | (53,620 | ) | | | (537,370 | ) |
| | | | |
Net increase (decrease) | | | 237,606 | | | $ | 2,295,408 | |
| | | | |
| | |
| | | | | | | | |
Class B | | Shares | | | Amount | |
Year ended October 31, 2016: | | | | | | | | |
Shares sold | | | 98,628 | | | $ | 964,043 | |
Shares issued to shareholders in reinvestment of dividends and distributions | | | 31,332 | | | | 304,370 | |
Shares redeemed | | | (186,521 | ) | | | (1,794,524 | ) |
| | | | |
Net increase (decrease) in shares outstanding before conversion | | | (56,561 | ) | | | (526,111 | ) |
Shares converted from Class B (See Note 1) | | | (76,204 | ) | | | (739,652 | ) |
| | | | |
Net increase (decrease) | | | (132,765 | ) | | $ | (1,265,763 | ) |
| | | | |
Year ended October 31, 2015: | | | | | | | | |
Shares sold | | | 108,157 | | | $ | 1,065,045 | |
Shares issued to shareholders in reinvestment of dividends and distributions | | | 70,065 | | | | 677,601 | |
Shares redeemed | | | (296,341 | ) | | | (2,928,296 | ) |
| | | | |
Net increase (decrease) in shares outstanding before conversion | | | (118,119 | ) | | | (1,185,650 | ) |
Shares converted from Class B (See Note 1) | | | (103,561 | ) | | | (1,015,305 | ) |
| | | | |
Net increase (decrease) | | | (221,680 | ) | | $ | (2,200,955 | ) |
| | | | |
Notes to Financial Statements (continued)
| | | | | | | | |
Class C | | Shares | | | Amount | |
Year ended October 31, 2016: | | | | | | | | |
Shares sold | | | 519,985 | | | $ | 5,052,581 | |
Shares issued to shareholders in reinvestment of dividends and distributions | | | 137,661 | | | | 1,340,368 | |
Shares redeemed | | | (1,198,526 | ) | | | (11,609,014 | ) |
| | | | |
Net increase (decrease) | | | (540,880 | ) | | $ | (5,216,065 | ) |
| | | | |
Year ended October 31, 2015: | | | | | | | | |
Shares sold | | | 480,190 | | | $ | 4,783,294 | |
Shares issued to shareholders in reinvestment of dividends and distributions | | | 302,893 | | | | 2,932,707 | |
Shares redeemed | | | (1,794,067 | ) | | | (17,761,085 | ) |
| | | | |
Net increase (decrease) | | | (1,010,984 | ) | | $ | (10,045,084 | ) |
| | | | |
| | |
| | | | | | | | |
Class I | | Shares | | | Amount | |
Year ended October 31, 2016: | | | | | | | | |
Shares sold | | | 685,551 | | | $ | 6,928,472 | |
Shares issued to shareholders in reinvestment of dividends and distributions | | | 43,563 | | | | 432,725 | |
Shares redeemed | | | (1,174,000 | ) | | | (11,590,399 | ) |
| | | | |
Net increase (decrease) in shares outstanding before conversion | | | (444,886 | ) | | | (4,229,202 | ) |
Shares converted into class I (See Note 1) | | | 764 | | | | 7,674 | |
| | | | |
Net increase (decrease) | | | (444,122 | ) | | $ | (4,221,528 | ) |
| | | | |
Year ended October 31, 2015: | | | | | | | | |
Shares sold | | | 575,348 | | | $ | 5,744,254 | |
Shares issued to shareholders in reinvestment of dividends and distributions | | | 107,215 | | | | 1,057,131 | |
Shares redeemed | | | (2,547,102 | ) | | | (25,555,857 | ) |
| | | | |
Net increase (decrease) | | | (1,864,539 | ) | | $ | (18,754,472 | ) |
| | | | |
Note 10–Recent Accounting Pronouncement
In October 2016, the U.S. Securities and Exchange Commission adopted new rules and amended existing rules (together, “final rules”)
intended to modernize the reporting and disclosure of information by registered investment companies. In part, the final rules amend Regulation S-X and require standardized, enhanced disclosure about derivatives in investment company financial statements, as well as other amendments. The compliance date for the amendments to Regulation S-X is August 1, 2017. Management is currently evaluating the impact that the adoption of the amendments to Regulation S-X will have on the Fund’s financial statements and related disclosures.
Note 11–Subsequent Events
In connection with the preparation of the financial statements of the Fund as of and for the fiscal year ended October 31, 2016, events and transactions subsequent to October 31, 2016, through the date the financial statements were issued have been evaluated by the Fund’s management for possible adjustment and/or disclosure. No subsequent events requiring financial statement adjustment or disclosure have been identified other than the following:
Effective February 28, 2017, Class B shares of the MainStay Group of Funds will be closed to all new purchases as well as additional investments by existing Class B shareholders. Existing Class B shareholders may continue to reinvest dividends and capital gains distributions, as well as exchange their Class B shares for Class B shares of other Funds as permitted by the current exchange privileges. Class B shareholders will continue to be subject to any applicable contingent deferred sales charge at the time of redemption. All other features of the Class B shares, including but not limited to the fees and expenses applicable to Class B shares, will remain unchanged. Unless redeemed, Class B Shares shareholders will remain in Class B shares of their respective Fund until the Class B shares are converted to Class A or Investor Class shares pursuant to the applicable conversion schedule.
| | |
| 30 | | MainStay Global High Income Fund |
Report of Independent Registered Public Accounting Firm
The Board of Trustees and Shareholders of
The MainStay Funds:
We have audited the accompanying statement of assets and liabilities, including the portfolio of investments, of the MainStay Global High Income Fund (the “Fund”), one of the funds constituting The MainStay Funds, as of October 31, 2016, and the related statement of operations for the year then ended, the statements of changes in net assets for each of the years in the two-year period then ended, and the financial highlights for each of the years in the five-year period then ended. These financial statements and financial highlights are the responsibility of the Fund’s management. Our responsibility is to express an opinion on these financial statements and financial highlights based on our audits.
We conducted our audits in accordance with the standards of the Public Company Accounting Oversight Board (United States). Those standards require that we plan and perform the audit to obtain reasonable assurance about whether the financial statements and financial highlights are free of material misstatement. An audit includes examining, on a test basis, evidence supporting the amounts and disclosures in the financial statements. Our procedures included confirmation of securities owned as of October 31, 2016, by correspondence with the custodian and brokers or by other appropriate auditing procedures where replies from brokers were not received. An audit also includes assessing the accounting principles used and significant estimates made by management, as well as evaluating the overall financial statement presentation. We believe that our audits provide a reasonable basis for our opinion.
In our opinion, the financial statements and financial highlights referred to above present fairly, in all material respects, the financial position of the MainStay Global High Income Fund of The MainStay Funds as of October 31, 2016, the results of its operations for the year then ended, the changes in its net assets for each of the years in the two-year period then ended, and the financial highlights for each of the years in the five-year period then ended, in conformity with U.S. generally accepted accounting principles.

Philadelphia, Pennsylvania
December 22, 2016
Federal Income Tax Information
(Unaudited)
In February 2017, shareholders will receive an IRS Form 1099-DIV or substitute Form 1099 which will show the federal tax status of the distributions received by shareholders in calendar year 2016. The amounts that will be reported on such 1099-DIV or substitute Form 1099 will be the amounts you are to use on your federal income tax return and will differ from the amounts which we must report for the Fund’s fiscal year ended October 31, 2016.
Proxy Voting Policies and Procedures and Proxy Voting Record
A description of the policies and procedures that New York Life Investments uses to vote proxies related to the Fund’s securities is available without charge, upon request, (i) by visiting the Fund’s website at mainstayinvestments.com; or (ii) on the SEC’s website at www.sec.gov.
The Fund is required to file with the SEC its proxy voting record for the 12-month period ending June 30 on Form N-PX. The Fund’s most recent Form N-PX or proxy voting record is available free of charge upon request (i) by calling 800-MAINSTAY (624-6782); (ii) by visiting the Fund’s website at mainstayinvestments.com; or (iii) on the SEC’s website at www.sec.gov.
Shareholder Reports and Quarterly Portfolio Disclosure
The Fund is required to file its complete schedule of portfolio holdings with the SEC for its first and third fiscal quarters on Form N-Q. The Fund’s Form N-Q is available without charge on the SEC’s website at www.sec.gov or by calling MainStay Investments at 800-MAINSTAY (624-6782). You also can obtain and review copies of Form N-Q by visiting the SEC’s Public Reference Room in Washington, DC (information on the operation of the Public Reference Room may be obtained by calling 1-800-SEC-0330).
| | |
| 32 | | MainStay Global High Income Fund |
Board of Trustees and Officers (Unaudited)
The Trustees and officers of the Funds are listed below. The Board oversees the MainStay Group of Funds, MainStay VP Funds Trust, MainStay DefinedTerm Municipal Opportunities Fund, the Manager and the Subadvisors, and elects the officers of the Funds who are responsible for the day-to-day operations of the Funds. Information pertaining to the Trustees and officers is set forth below. Each Trustee serves until his or her successor is elected and qualified or until his or her resignation, death or removal. Under the Retirement Policy, a Trustee must
tender his or her resignation by the end of the calendar year during which he or she reaches the age of 75 (although the Board of Trustees may make exceptions from time to time). Officers serve a term of one year and are elected annually by the Board of Trustees. The business address of each Trustee and officer listed below is 51 Madison Avenue, New York, New York 10010. A majority of the Trustees are not “interested persons” (as defined by the 1940 Act and rules “adopted” by the SEC thereunder) of the Fund (“Independent Trustees”).
| | | | | | | | | | | | |
| | | | | Name and Date of Birth | | Term of Office, Position(s) Held and Length of Service | | Principal Occupation(s) During Past Five Years | | Number of
Portfolios in
Fund Complex
Overseen by
Board Member | | Other Directorships Held By Board Member |
| Interested Trustee | | | | Christopher O. Blunt* 5/13/62 | | MainStay Funds: Trustee since January 2016; MainStay Funds Trust: Trustee since January 2016. | | Executive Vice President (since 2009), President, Investments Group (since 2015), Member of the Executive Management Committee (since 2007), Co-President, Insurance and Agency Group (2012 to 2015), President, Insurance Group (2012 to 2014), Executive Vice President, Retirement Income Security (2008 to 2012), New York Life Insurance Company. | | 83 | | MainStay VP Funds Trust:
Trustee since January 2016 (31 portfolios); and
MainStay DefinedTerm Municipal Opportunities Fund: Trustee since January 2016. |
| | * | This Trustee is considered to be an “interested person” of the MainStay Group of Funds within the meaning of the 1940 Act because of his affiliation with New York Life Insurance Company, New York Life Investment Management LLC, Cornerstone Capital Management Holdings LLC, MacKay Shields LLC, Institutional Capital LLC, NYL Investors LLC, NYLIFE Securities LLC and/or NYLIFE Distributors LLC, as described in detail above in the column entitled “Principal Occupation(s) During Past Five Years.” |
| | | | | | | | | | | | |
| | | | | Name and Date of Birth | | Term of Office, Position(s) Held and Length of Service | | Principal Occupation(s) During Past Five Years | | Number of Portfolios in Fund Complex Overseen by Board Member | | Other Directorships Held By Board Member |
| Non-Interested Trustee | | | | David H. Chow 12/29/57 | | MainStay Funds: Trustee since January 2016, Advisory Board Member (June 2015 to December 2015); MainStay Funds Trust: Trustee since January 2016, Advisory Board Member (June 2015 to December 2015). | | Founder and CEO, DanCourt Management, LLC (since 1999) | | 83 | | MainStay VP Funds Trust: Trustee since January 2016, Advisory Board Member (June 2015 to December 2015); (31 portfolios);
MainStay DefinedTerm Municipal Opportunities Fund: Trustee since January 2016, Advisory Board Member (June 2015 to December 2015);
Market Vectors Group of Exchange-Traded Funds: Independent Chairman of the Board of Trustees since 2008 and Trustee since 2006 (55 portfolios); and
Berea College of Kentucky: Trustee since 2009. |
| | | | Susan B. Kerley 8/12/51 | | MainStay Funds: Trustee since 2007; MainStay Funds Trust: Trustee since 1990.*** | | President, Strategic Management Advisors LLC (since 1990) | | 83 | | MainStay VP Funds Trust: Trustee since 2007 (31 portfolios)**;
MainStay DefinedTerm Municipal Opportunities Fund: Trustee since 2011; and Legg Mason Partners Funds: Trustee since 1991 (53 portfolios). |
| | | | Alan R. Latshaw 3/27/51 | | MainStay Funds: Trustee and Audit Committee Financial Expert since 2006; MainStay Funds Trust: Trustee and Audit Committee Financial Expert since 2007.*** | | Retired; Partner, Ernst & Young LLP (2002 to 2003); Partner, Arthur Andersen LLP (1989 to 2002); Consultant to the MainStay Funds Audit and Compliance Committee (2004 to 2006) | | 83 | | MainStay VP Funds Trust: Trustee and Audit Committee Financial Expert since 2007 (31 portfolios)**;
MainStay DefinedTerm Municipal Opportunities Fund: Trustee and Audit Committee Financial Expert since 2011;
State Farm Associates Funds Trusts: Trustee since 2005 (4 portfolios);
State Farm Mutual Fund Trust: Trustee since 2005 (15 portfolios); and
State Farm Variable Product Trust: Trustee since 2005 (9 portfolios). |
| | | | Peter Meenan 12/5/41 | | MainStay Funds: Chairman since 2013 and Trustee since 2007; MainStay Funds Trust: Chairman since 2013 and Trustee since 2002.*** | | Retired; Independent Consultant (2004 to 2013); President and Chief Executive Officer, Babson—United, Inc. (financial services firm) (2000 to 2004); Independent Consultant (1999 to 2000); Head of Global Funds, Citicorp (1995 to 1999) | | 83 | | MainStay VP Funds Trust: Chairman since 2013 and Trustee since 2007 (31 portfolios)**; and
MainStay DefinedTerm Municipal Opportunities Fund: Chairman since 2013 and Trustee since 2011. |
| | | | Richard H. Nolan, Jr. 11/16/46 | | MainStay Funds: Trustee since 2007; MainStay Funds Trust: Trustee since 2007.*** | | Managing Director, ICC Capital Management (since 2004); President—Shields/Alliance, Alliance Capital Management (1994 to 2004) | | 83 | | MainStay VP Funds Trust: Trustee since 2006 (31 portfolios)**; and
MainStay DefinedTerm Municipal Opportunities Fund: Trustee since 2011. |
| | | | Jacques P. Perold 5/12/58 | | MainStay Funds: Trustee since January 2016, Advisory Board Member (June 2015 to December 2015); MainStay Funds Trust: Trustee since January 2016, Advisory Board Member (June 2015 to December 2015). | | Retired; President, Fidelity Management & Research Company (2009 to 2014); Founder, President and Chief Executive Officer, Geode Capital Management, LCC (2001 to 2009) | | 83 | | MainStay VP Funds Trust: Trustee since January 2016, Advisory Board Member (June 2015 to December 2015); (31 portfolios);
MainStay DefinedTerm Municipal Opportunities Fund: Trustee since January 2016, Advisory Board Member (June 2015 to December 2015);
Allstate Corporation: Director since 2015; and
Boston University: Trustee since 2014. |
| | |
| 34 | | MainStay Global High Income Fund |
| | | | | | | | | | | | |
| | | | | Name and Date of Birth | | Term of Office, Position(s) Held and Length of Service | | Principal Occupation(s) During Past Five Years | | Number of Portfolios in Fund Complex Overseen by Board Member | | Other Directorships Held By Board Member |
Non-Interested Trustee | | | | Richard S. Trutanic 2/13/52 | | MainStay Funds: Trustee since 1994; MainStay Funds Trust: Trustee since 2007.*** | | Chairman and Chief Executive Officer, Somerset & Company (financial advisory firm) (since 2004); Managing Director, The Carlyle Group (private investment firm) (2002 to 2004); Senior Managing Director, Partner and Board Member, Groupe Arnault S.A. (private investment firm) (1999 to 2002) | | 83 | | MainStay VP Funds Trust: Trustee since 2007 (31 portfolios)**; and
MainStay DefinedTerm Municipal Opportunities Fund: Trustee since 2011. |
| | | | John A. Weisser**** 10/22/41 | | MainStay Funds: Trustee since 2007; MainStay Funds Trust: Trustee since 2007.*** | | Retired; Managing Director of Salomon Brothers, Inc. (1971 to 1995) | | 83 | | MainStay VP Funds Trust: Trustee since 1997 (31 portfolios)**; MainStay DefinedTerm Municipal Opportunities Fund: Trustee since 2011; Direxion Insurance Trust: Trustee since 2007 (1 portfolio); Direxion Funds: Trustee since 2007 (18 portfolios); and Direxion Shares ETF Trust: Trustee since 2008 (52 portfolios). |
| | ** | Includes prior service as a Director of MainStay VP Series Fund, Inc., the predecessor to MainStay VP Funds Trust. |
| | *** | Includes prior service as a Director/Trustee of certain predecessor entities to MainStay Funds Trust. |
| | **** | Pursuant to the Retirement Policy, Mr. Weisser will retire from the Board of Trustees on or about December 31, 2016. |
| | | | | | | | |
| | | | | Name and Date of Birth | | Position(s) Held and Length of Service | | Principal Occupation(s) During Past Five Years |
Officers (Who Are Not Board Members)* | | | | Stephen P. Fisher 2/22/59 | | President, MainStay Funds (since 2007), MainStay Funds Trust (since 2009) | | Chairman and Chief Executive Officer (since 2014), President and Chief Operating Officer (2008 to 2013), NYLIFE Distributors LLC; Chairman of the Board, NYLIM Service Company LLC (since 2008); President (since May 2015), Co-President (2014 to 2015) and Senior Managing Director (since 2005), New York Life Investment Management LLC; President, MainStay DefinedTerm Municipal Opportunities Fund (since 2011) and MainStay VP Funds Trust (since 2007)** |
| | | | Jack R. Benintende 5/12/64 | | Treasurer and Principal Financial and Accounting Officer, MainStay Funds (since 2007), MainStay Funds Trust (since 2009) | | Managing Director, New York Life Investment Management LLC (since 2007); Treasurer and Principal Financial and Accounting Officer, MainStay DefinedTerm Municipal Opportunities Fund (since 2011) and MainStay VP Funds Trust (since 2007)**; and Assistant Treasurer, New York Life Investment Management Holdings LLC (2008 to 2012) |
| | | | Kevin M. Bopp 2/24/69 | | Vice President and Chief Compliance Officer, MainStay Funds and MainStay Funds Trust (since 2014) | | Chief Compliance Officer (since January 2016), Director and Associate General Counsel (2011 to 2014) and Vice President and Assistant General Counsel (2010 to 2011), New York Life Investment Management LLC; Vice President and Chief Compliance Officer, MainStay VP Funds Trust, MainStay DefinedTerm Municipal Opportunities Fund (since 2014); Assistant Secretary, MainStay Funds, MainStay Funds Trust and MainStay VP Funds Trust (2010 to 2014)**, MainStay DefinedTerm Municipal Opportunities Fund (2011 to 2014) |
| | | | J. Kevin Gao 10/13/67 | | Secretary and Chief Legal Officer, MainStay Funds and MainStay Funds Trust (since 2010) | | Managing Director and Associate General Counsel, New York Life Investment Management LLC (since 2010); Secretary and Chief Legal Officer, MainStay DefinedTerm Municipal Opportunities Fund (since 2011) and MainStay VP Funds Trust (since 2010)** |
| | | | Scott T. Harrington 2/8/59 | | Vice President— Administration, MainStay Funds (since 2005), MainStay Funds Trust (since 2009) | | Director, New York Life Investment Management LLC (including predecessor advisory organizations) (since 2000); Member of the Board of Directors, New York Life Trust Company (since 2009); Vice President—Administration, MainStay DefinedTerm Municipal Opportunities Fund (since 2011) and MainStay VP Funds Trust (since 2005)** |
| | * | The Officers listed above are considered to be “interested persons” of the MainStay Group of Funds within the meaning of the 1940 Act because of their affiliation with the MainStay Group of Funds, New York Life Insurance Company and/or its affiliates, including New York Life Investment Management LLC, NYLIM Service Company LLC, NYLIFE Securities LLC and/or NYLIFE Distributors LLC, as described in detail in the column captioned “Principal Occupation(s) During Past Five Years.” Officers are elected annually by the Board to serve a one year term. |
| | ** | Includes prior service as an Officer of MainStay VP Series Fund, Inc., the predecessor to MainStay VP Funds Trust. |
| | |
| 36 | | MainStay Global High Income Fund |
This page intentionally left blank
This page intentionally left blank
MainStay Funds
MainStay offers a wide range of Funds for virtually any investment need. The full array of MainStay open-end offerings is listed here, with information about the manager, subadvisors, legal counsel and independent registered public accounting firm.
Equity
U.S. Equity
MainStay Common Stock Fund
MainStay Cornerstone Growth Fund
MainStay Epoch U.S. All Cap Fund
MainStay Epoch U.S. Equity Yield Fund
MainStay Epoch U.S. Small Cap Fund
MainStay ICAP Equity Fund
MainStay ICAP Select Equity Fund
MainStay Large Cap Growth Fund
MainStay MAP Fund
MainStay S&P 500 Index Fund
MainStay U.S. Equity Opportunities Fund
International/Global Equity
MainStay Emerging Markets Opportunities Fund
MainStay Epoch Capital Growth Fund
MainStay Epoch Global Choice Fund
MainStay Epoch Global Equity Yield Fund
MainStay Epoch International Small Cap Fund
MainStay ICAP International Fund
MainStay International Equity Fund
MainStay International Opportunities Fund
Income
Taxable Bond
MainStay Floating Rate Fund
MainStay Global High Income Fund
MainStay Government Fund
MainStay High Yield Corporate Bond Fund
MainStay High Yield Opportunities Fund
MainStay Indexed Bond Fund
MainStay Short Duration High Yield Fund
MainStay Total Return Bond Fund
MainStay Unconstrained Bond Fund
Municipal/Tax Advantaged Bond
MainStay California Tax Free Opportunities Fund1
MainStay High Yield Municipal Bond Fund
MainStay New York Tax Free Opportunities Fund2
MainStay Tax Advantaged Short Term Bond Fund
MainStay Tax Free Bond Fund
Money Market
MainStay Money Market Fund
Mixed Asset
MainStay Balanced Fund
MainStay Convertible Fund
MainStay Income Builder Fund
Alternative
MainStay Absolute Return Multi-Strategy Fund
MainStay Cushing Energy Income Fund
MainStay Cushing MLP Premier Fund
MainStay Cushing Renaissance Advantage Fund
Asset Allocation/Target Date
MainStay Conservative Allocation Fund
MainStay Growth Allocation Fund
MainStay Moderate Allocation Fund
MainStay Moderate Growth Allocation Fund
MainStay Retirement 2010 Fund
MainStay Retirement 2020 Fund
MainStay Retirement 2030 Fund
MainStay Retirement 2040 Fund
MainStay Retirement 2050 Fund
MainStay Retirement 2060 Fund
Manager
New York Life Investment Management LLC
New York, New York
Subadvisors
Candriam France S.A.S.3
Paris, France
Cornerstone Capital Management Holdings LLC3
New York, New York
Cushing Asset Management, LP
Dallas, Texas
Epoch Investment Partners, Inc.
New York, New York
Institutional Capital LLC3
Chicago, Illinois
MacKay Shields LLC3
New York, New York
Markston International LLC
White Plains, New York
NYL Investors LLC3
New York, New York
Winslow Capital Management, LLC
Minneapolis, Minnesota
Legal Counsel
Dechert LLP
Washington, District of Columbia
Independent Registered Public Accounting Firm
KPMG LLP
Philadelphia, Pennsylvania
1. This Fund is only registered for sale in AZ, CA, MI (Class A and Class I shares only), NV, OR, TX, UT and WA.
2. This Fund is only registered for sale in CA, CT, DE, FL, MA, NJ, NY and VT.
3. An affiliate of New York Life Investment Management LLC.
Not part of the Annual Report
For more information
800-MAINSTAY (624-6782)
mainstayinvestments.com
MainStay Investments® is a registered service mark and name under which New York Life Investment Management LLC does business. MainStay Investments, an indirect subsidiary of New York Life Insurance Company, New York, NY 10010, provides investment advisory products and services. The MainStay Funds® are managed by New York Life Investment Management LLC and distributed by NYLIFE Distributors LLC, 30 Hudson Street, Jersey City, NJ 07302, a wholly owned subsidiary of New York Life Insurance Company. NYLIFE Distributors LLC is a Member FINRA/SIPC.
©2016 NYLIFE Distributors LLC. All rights reserved.
| | | | | | | | |
| Not FDIC/NCUA Insured | | Not a Deposit | | May Lose Value | | No Bank Guarantee | | Not Insured by Any Government Agency |
| | |
| 1717391 MS316-16 | | MSGH11-12/16 (NYLIM) NL218 |
MainStay International Equity Fund
Message from the President and Annual Report
October 31, 2016


This page intentionally left blank
Message from the President
During the 12 months ended October 31, 2016, the U.S. stock and bond markets were somewhat volatile but generally ended the reporting period in positive territory. In the fall of 2015 and early 2016, the market appeared to be focused on China’s economic weakness and a prolonged decline in oil prices. Although energy-related companies felt the brunt of these setbacks, the stock market as a whole declined until mid-February, when oil prices began to rise and stocks began a relatively steady recovery.
In late June, the United Kingdom voted to leave the European Union in a referendum popularly known as “Brexit.” The news caused a temporary slump in stocks around the world. Although the British pound dropped in value following the vote, stocks generally recovered through the end of the reporting period. As the end of the reporting period approached, speculation about the upcoming U.S. presidential election heightened market volatility.
According to FTSE-Russell data, U.S. stocks as a whole tended to provide positive returns during the reporting period, with large-capitalization stocks generally outperforming stocks of smaller companies. Value stocks outpaced growth stocks at all capitalization levels, with the largest differences among small- to mid-cap stocks.
International and emerging-market stocks provided mixed performance. Rocked by Brexit, European stocks as a whole declined during the reporting period, while stocks in the Asia-Pacific region (with or without Japan) tended to provide positive returns. International stocks as a whole declined, while global stocks advanced slightly. Emerging-market stocks were considerably stronger, boosted by advances in India and Latin America and higher prices for oil, metals and other commodities.
Anticipation of a possible Federal Reserve rate hike led to volatility in the bond market, but the Federal Open Market Committee chose not to raise the federal funds target rate during the reporting period. Short-term U.S. Treasury yields rose during the reporting period, and longer-term U.S. Treasury yields declined. Overall, the U.S. bond market provided positive returns, with longer-term bonds generally outperforming shorter-term securities. High-yield bonds, particularly
longer-term issues, were strong performers. Municipal bonds generally provided positive single-digit total returns for the 12 months ended October 31, 2016.
Central banks around the world remained highly accommodative during the reporting period, particularly in light of Brexit. Shortly after the U.K. referendum, more than a third of all sovereign debt carried negative yields. As an asset class, emerging-market bonds provided double-digit positive returns during the reporting period, and world bonds as a whole provided positive single-digit positive returns.
At MainStay, we know that political, economic and market events may influence the performance of your Fund investments. While our portfolio managers often pay close attention to such events, their primary emphasis is seeking to invest for the long-term investment needs of our shareholders. With this in mind, they seek to pursue the investment objectives of their respective Funds using the principal investment strategies and investment processes outlined in the prospectus. By placing your assets in the care of our investment professionals, you gain access to their extensive market insight, strategic investment discipline and in-depth experience in risk-management over a wide range of market cycles.
The report that follows provides more detailed information about the market forces, portfolio strategies and individual securities that influenced the performance of your MainStay Fund during the 12 months ended October 31, 2016. We invite you to read the report carefully as part of your personal investment-review process.
We thank you for your business, and we look forward to a continuing relationship as you pursue your long-range financial goals.
Sincerely,

Stephen P. Fisher
President
The opinions expressed are as of the date of this report and are subject to change. There is no guarantee that any forecast made will come to pass. This material does not constitute investment advice and is not intended as an endorsement of any specific investment. Past performance is no guarantee of future results.
Not part of the Annual Report
Table of Contents
Investors should refer to the Fund’s Summary Prospectus and/or Prospectus and consider the Fund’s investment objectives, strategies, risks, charges and expenses carefully before investing. The Summary Prospectus and/or Prospectus contain this and other information about the Fund. You may obtain copies of the Fund’s Summary Prospectus, Prospectus and Statement of Additional Information free of charge, upon request, by calling toll-free 800-MAINSTAY (624-6782), by writing to NYLIFE Distributors LLC, Attn: MainStay Marketing Department, 30 Hudson Street, Jersey City, NJ 07302 or by sending an e-mail to MainStayShareholderServices@nylim.com. These documents are also available via the MainStay Funds’ website at mainstayinvestments.com/documents. Please read the Summary Prospectus and/or Prospectus carefully before investing.
Investment and Performance Comparison1 (Unaudited)
Performance data quoted represents past performance. Past performance is no guarantee of future results. Because of market volatility and other factors, current performance may be lower or higher than the figures shown. Investment return and principal value will fluctuate, and as a result, when shares are redeemed, they may be worth more or less than their original cost. The graph below depicts the historical performance of Class B shares of the Fund. Performance will vary from class to class based on differences in class-specific expenses and sales charges. For performance information current to the most recent month-end, please call 800-MAINSTAY (624-6782) or visit mainstayinvestments.com.
(With sales charges)
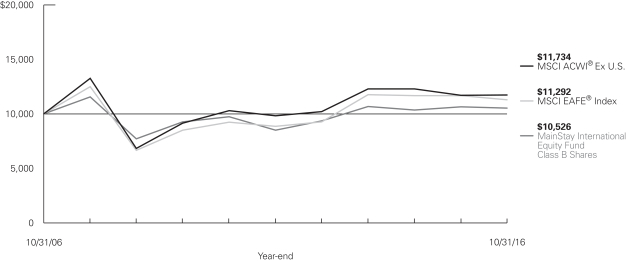
Average Annual Total Returns for the Year Ended October 31, 2016
| | | | | | | | | | | | | | | | | | | | |
| Class | | Sales Charge | | | | One Year | | | Five Years | | | Ten Years | | | Gross
Expense
Ratio2 | |
| Class A Shares | | Maximum 5.5% Initial Sales Charge | | With sales charges Excluding sales charges | |
| –5.46
0.05 | %
| |
| 4.36
5.55 | %
| |
| 0.99
1.56 | %
| |
| 1.33
1.33 | %
|
| Investor Class Shares3 | | Maximum 5.5% Initial Sales Charge | | With sales charges Excluding sales charges | |
| –5.78
–0.30 |
| |
| 4.00
5.18 |
| |
| 0.71
1.29 |
| |
| 1.68
1.68 |
|
| Class B Shares | | Maximum 5% CDSC
if Redeemed Within the
First Six Years of Purchase | | With sales charges Excluding sales charges | |
| –6.01
–1.06 |
| |
| 4.06
4.39 |
| |
| 0.51
0.51 |
| |
| 2.43
2.43 |
|
| Class C Shares | | Maximum 1% CDSC if Redeemed Within One Year of Purchase | | With sales charges Excluding sales charges | |
| –2.05
–1.06 |
| |
| 4.39
4.39 |
| |
| 0.52
0.52 |
| |
| 2.43
2.43 |
|
| Class I Shares | | No Sales Charge | | | | | 0.29 | | | | 5.80 | | | | 1.86 | | | | 1.08 | |
| Class R1 Shares | | No Sales Charge | | | | | 0.18 | | | | 5.71 | | | | 1.77 | | | | 1.18 | |
| Class R2 Shares | | No Sales Charge | | | | | –0.07 | | | | 5.44 | | | | 1.51 | | | | 1.43 | |
| Class R3 Shares | | No Sales Charge | | | | | –0.30 | | | | 5.18 | | | | 1.26 | | | | 1.68 | |
| 1. | The performance table and graph do not reflect the deduction of taxes that a shareholder would pay on distributions or Fund share redemptions. Total returns reflect maximum applicable sales charges as indicated in the table above (if any) changes in share price, and reinvestment of dividend and capital gain distributions. The graph assumes the initial investment amount shown above and reflects the deduction of all sales charges that would have applied for the periods of investment. Performance figures may reflect certain fee waivers and/or expense limitations, without which total returns may have been lower. For more information on share classes and current fee waivers and/or expense limitations (if any), please refer to the notes to the financial statements. |
| 2. | The gross expense ratios presented reflect the Fund’s “Total Annual Fund Operating Expenses” from the most recent Prospectus and may differ from other expense ratios disclosed in this report. |
| 3. | Performance figures for Investor Class shares, first offered on February 28, 2008, include the historical performance of Class A shares through February 27, 2008, adjusted for differences in certain fees and expenses. Unadjusted, the performance shown for the Investor Class shares would likely have been different. |
The footnotes on the next page are an integral part of the table and graph and should be carefully read in conjunction with them.
| | | | | | | | | | | | |
| Benchmark Performance | | One
Year | | | Five
Years | | | Ten
Years | |
MSCI ACWI® Ex U.S.4 | | | 0.22 | % | | | 3.64 | % | | | 1.61 | % |
MSCI EAFE® Index5 | | | –3.23 | | | | 4.99 | | | | 1.22 | |
Average Lipper International Multi-Cap Growth Fund6 | | | –1.42 | | | | 5.19 | | | | 1.66 | |
| 4. | The Fund has selected the MSCI ACWI® Ex U.S. as its primary broad-based securities market index. The MSCI ACWI® Ex U.S. is a free float-adjusted market capitalization weighted index that is designed to measure the equity market performance of developed and emerging markets, excluding the U.S. Results assume reinvestment of all income and capital gains. An investment cannot be made directly in an index. |
| 5. | The MSCI EAFE® Index is the Fund’s secondary benchmark. The MSCI EAFE® Index consists of international stocks representing the developed world outside of North America. Results assume reinvestment of all income and capital gains. An investment cannot be made directly in an index. |
| 6. | The Average Lipper International Multi-Cap Growth Fund is representative of funds that, by portfolio practice, invest in a variety of market capitalization ranges without concentrating 75% of their equity assets in any one market capitalization range over an extended period of time. International multi-cap growth funds typically have above-average characteristics compared to the MSCI EAFE® Index. This benchmark is a product of Lipper Inc. Lipper Inc. is an independent monitor of fund performance. Results are based on average total returns of similar funds with all dividend and capital gain distributions reinvested. |
The footnotes on the preceding page are an integral part of the table and graph and should be carefully read in conjunction with them.
| | |
| 6 | | MainStay International Equity Fund |
Cost in Dollars of a $1,000 Investment in MainStay International Equity Fund (Unaudited)
The example below is intended to describe the fees and expenses borne by shareholders during the six-month period from May 1, 2016, to October 31, 2016, and the impact of those costs on your investment.
Example
As a shareholder of the Fund, you incur two types of costs: (1) transaction costs, including exchange fees and sales charges (loads) on purchases (as applicable), and (2) ongoing costs, including management fees, distribution and/or service (12b-1) fees, and other Fund expenses (as applicable). This example is intended to help you understand your ongoing costs (in dollars) of investing in the Fund and to compare these costs with the ongoing costs of investing in other mutual funds. The example is based on an investment of $1,000 made at the beginning of the six-month period and held for the entire period from May 1, 2016, to October 31, 2016.
This example illustrates your Fund’s ongoing costs in two ways:
Actual Expenses
The second and third data columns in the table below provide information about actual account values and actual expenses. You may use the information in these columns, together with the amount you invested, to estimate the expenses that you paid during the six months ended October 31, 2016. Simply divide your account value by $1,000 (for example, an $8,600 account value divided by $1,000 = 8.6), then
multiply the result by the number under the heading entitled “Expenses Paid During Period” to estimate the expenses you paid on your account during this period.
Hypothetical Example for Comparison Purposes
The fourth and fifth data columns in the table below provide information about hypothetical account values and hypothetical expenses based on the Fund’s actual expense ratio and an assumed rate of return of 5% per year before expenses, which is not the Fund’s actual return. The hypothetical account values and expenses may not be used to estimate the actual ending account balances or expenses you paid for the six-month period shown. You may use this information to compare the ongoing costs of investing in the Fund with the ongoing costs of investing in other Funds. To do so, compare this 5% hypothetical example with the 5% hypothetical examples that appear in the shareholder reports of the other Funds.
Please note that the expenses shown in the table are meant to highlight your ongoing costs only and do not reflect any transactional costs, such as exchange fees or sales charges (loads). Therefore, the fourth and fifth data columns of the table are useful in comparing ongoing costs only and will not help you determine the relative total costs of owning different funds. In addition, if these transactional costs were included, your costs would have been higher.
| | | | | | | | | | | | | | | | | | | | |
| | | | | | | | | | | | | | | | |
| Share Class | | Beginning
Account
Value
5/1/16 | | | Ending Account
Value (Based
on Actual
Returns and
Expenses)
10/31/16 | | | Expenses
Paid
During
Period1 | | | Ending Account
Value (Based
on Hypothetical
5% Annualized
Return and
Actual Expenses)
10/31/16 | | | Expenses
Paid
During
Period1 | |
| | | | | |
| Class A Shares | | $ | 1,000.00 | | | $ | 1,012.70 | | | $ | 6.73 | | | $ | 1,018.50 | | | $ | 6.75 | |
| | | | | |
| Investor Class Shares | | $ | 1,000.00 | | | $ | 1,011.30 | | | $ | 8.54 | | | $ | 1,016.60 | | | $ | 8.57 | |
| | | | | |
| Class B Shares | | $ | 1,000.00 | | | $ | 1,007.50 | | | $ | 12.31 | | | $ | 1,012.90 | | | $ | 12.35 | |
| | | | | |
| Class C Shares | | $ | 1,000.00 | | | $ | 1,006.70 | | | $ | 12.31 | | | $ | 1,012.90 | | | $ | 12.35 | |
| | | | | |
| Class I Shares | | $ | 1,000.00 | | | $ | 1,014.20 | | | $ | 5.47 | | | $ | 1,019.70 | | | $ | 5.48 | |
| | | | | |
| Class R1 Shares | | $ | 1,000.00 | | | $ | 1,013.50 | | | $ | 5.97 | | | $ | 1,019.20 | | | $ | 5.99 | |
| | | | | |
| Class R2 Shares | | $ | 1,000.00 | | | $ | 1,012.70 | | | $ | 7.23 | | | $ | 1,017.90 | | | $ | 7.25 | |
| | | | | |
| Class R3 Shares | | $ | 1,000.00 | | | $ | 1,011.30 | | | $ | 8.49 | | | $ | 1,016.70 | | | $ | 8.52 | |
| 1. | Expenses are equal to the Fund’s annualized expense ratio of each class (1.33% for Class A, 1.69% for Investor Class, 2.44% for Class B and Class C, 1.08% for Class I, 1.18% for Class R1, 1.43% for Class R2 and 1.68% for Class R3) multiplied by the average account value over the period, divided by 366 and multiplied by 184 (to reflect the six-month period). The table above represents the actual expenses incurred during the six-month period. |
Country Composition as of October 31, 2016 (Unaudited)
| | | | |
| Japan | | | 16.3 | % |
| United Kingdom | | | 12.1 | |
| United States | | | 11.7 | |
| China | | | 8.1 | |
| Germany | | | 7.4 | |
| Switzerland | | | 7.3 | |
| India | | | 6.1 | |
| Israel | | | 4.9 | |
| Ireland | | | 4.8 | |
| Belgium | | | 3.3 | |
| Jordan | | | 2.6 | |
| | | | |
| Sweden | | | 2.1 | % |
| Denmark | | | 2.0 | |
| Italy | | | 1.8 | |
| Spain | | | 1.8 | |
| South Africa | | | 1.6 | |
| Thailand | | | 1.5 | |
| Netherlands | | | 1.4 | |
| Australia | | | 0.6 | |
| Other Assets, Less Liabilities | | | 2.6 | |
| | | | |
| | | 100.0 | % |
| | | | |
See Portfolio of Investments beginning on page 11 for specific holdings within these categories.
Top Ten Holdings as of October 31, 2016 (excluding short-term investment) (Unaudited)
| 1. | Check Point Software Technologies, Ltd. |
| 3. | Fresenius Medical Care A.G. & Co. KGaA |
| | |
| 8 | | MainStay International Equity Fund |
Portfolio Management Discussion and Analysis (Unaudited)
Questions answered by portfolio managers Edward Ramos, CFA, Carlos Garcia-Tunon, CFA, and Eve Glatt of Cornerstone Capital Management Holdings LLC, the Fund’s Subadvisor.
How did MainStay International Equity Fund perform relative to its benchmarks and peers during the 12 months ended October 31, 2016?
Excluding all sales charges, MainStay International Equity Fund returned 0.05% for Class A shares, –0.30% for Investor Class shares and –1.06% for Class B and Class C shares for the 12 months ended October 31, 2016. Over the same period, the Fund’s Class I shares returned 0.29%, Class R1 shares returned 0.18%, Class R2 shares returned –0.07% and Class R3 shares returned –0.30%. For the 12 months ended October 31, 2016, Class I shares outperformed—and all other share classes underperformed—the 0.22% return of the MSCI ACWI® Ex U.S.,1 which is the Fund’s primary benchmark. Over the same period, all share classes outperformed the –3.23% return of the MSCI EAFE® Index,1 which is the Fund’s secondary benchmark. For the 12 months ended October 31, 2016, all share classes outperformed the –1.42% return of the Average Lipper2 International Multi-Cap Growth Fund. See page 5 for Fund returns with sales charges.
What factors affected the Fund’s relative performance during the reporting period?
The Fund’s relative performance benefited from positive stock selection, while country and sector allocation detracted from performance relative to the MSCI ACWI® Ex U.S. The positive effect of stock selection on a country basis was driven by notable strength in Japan, China and Switzerland. Stock selection on a sector basis also had a positive impact on the Fund’s relative performance, with the consumer discretionary, financials and consumer staples sectors being the largest alpha3 contributors. (Contributions take weightings and total returns into account.) The negative effect from sector allocation was mainly the result of the Fund’s overweight allocation relative to the MSCI ACWI® Ex U.S. in the health care sector, though underweight positions in the energy and materials sectors also detracted from relative performance. The negative effect from country allocation resulted primarily from the Fund’s overweight position relative to the Index in Ireland, though overweight exposure to Israel and underweight (zero) exposure to Canada also detracted from the Fund’s relative performance.
During the reporting period, which sectors were the strongest contributors to the Fund’s relative performance and which sectors were particularly weak?
The sectors that made the strongest contributions to the Fund’s performance relative to the MSCI ACWI® Ex U.S. were the
consumer discretionary, financials and consumer staples sectors. All three sectors benefited from favorable stock selection. The financials and consumer staples sectors also benefited from favorable allocation effects, while the allocation effect for consumer discretionary was modestly negative. The Fund held underweight positions in the financials and consumer staples sectors, both of which underperformed the MSCI ACWI® Ex U.S. The Fund held an overweight position in the consumer discretionary sector, which also underperformed the benchmark.
The sectors that made the weakest contributions to the Fund’s performance relative to the MSCI ACWI® Ex U.S. were health care, energy and materials. All three sectors suffered from unfavorable allocation effects, even though stock selection was positive in health care and materials. The effect of stock selection was zero for the energy sector, since the Fund had no exposure to that sector. The Fund held an overweight position relative to the MSCI ACWI® Ex U.S. in the underperforming health care sector—and underweight positions in the energy and materials sectors, both of which outperformed the Index.
During the reporting period, which individual stocks made the strongest contributions to the Fund’s absolute performance and which stocks detracted the most?
The stocks that made the strongest positive contributions to the Fund’s absolute performance were Chinese online gaming and services company NetEase, Japanese online apparel shopping-site operator Start Today and Japanese drug store chain manager Tsuruha Holdings. All three companies outperformed the MSCI ACWI® Ex U.S. as they continued to provide strong growth and strategy execution relative to market expectations.
The most significant detractors from the Fund’s absolute performance were Irish private label over-the-counter pharmaceutical company Perrigo, U.K. hospitality group Whitbread and Danish diabetes care provider Novo Nordisk. Perrigo suffered from weak earnings guidance and the surprise departure of the company’s CEO. Whitbread’s underperformance resulted from concern over the group’s organic growth potential, particularly in the wake of Britain’s decision to leave the European Union. Novo Nordisk suffered after the company reduced its earnings outlook on the back of pricing pressure in its key U.S. market.
Did the Fund make any significant purchases or sales during the reporting period?
Notable purchases during the reporting period included U.K. medical device company LivaNova and Belgian biopharma-ceutical company UCB.
| 1. | See footnote on page 6 for more information on this index. |
| 2. | See footnote on page 6 for more information on Lipper Inc. |
| 3. | Alpha measures the relationship between a mutual fund’s return and its beta over a three-year period. Often, alpha is viewed as the excess return (positive or negative) or the value added by the portfolio manager. Beta is a measure of volatility in relation to the market as a whole. A beta higher than 1 indicates that a security or portfolio will tend to exhibit higher volatility than the market. A beta lower than 1 indicates that a security or portfolio will tend to exhibit lower volatility than the market. |
During the reporting period, the Fund sold its position in U.K.-listed international brewer SABMiller when the company was acquired by peer Anheuser-Busch InBev. The Fund also sold U.K. microprocessor intellectual property developer ARM Holdings when the company was acquired by Japanese multinational telecommunications and Internet company SoftBank.
How did the Fund’s sector weightings change during the reporting period?
During the reporting period, the Fund increased its exposure to the health care and financials sectors. Over the same period, the Fund reduced its exposure to the industrials and information technology sectors.
How was the Fund positioned at the end of the reporting period?
As of October 31, 2016, the Fund held overweight positions relative to the MSCI ACWI® Ex U.S. in the health care, information technology and consumer discretionary sectors. As of the same date, the Fund held underweight positions in the financials, industrials and energy sectors.
The opinions expressed are those of the portfolio managers as of the date of this report and are subject to change. There is no guarantee that any forecasts made will come to pass. This material does not constitute investment advice and is not intended as an endorsement of any specific investment.
| | |
| 10 | | MainStay International Equity Fund |
Portfolio of Investments October 31, 2016
| | | | | | | | |
| | |
| | | Shares | | | Value | |
| Common Stocks 95.9%† | |
Australia 0.6% | |
Gateway Lifestyle (Real Estate Management & Development) | | | 857,875 | | | $ | 1,513,998 | |
| | | | | | | | |
| | |
Belgium 3.3% | | | | | | | | |
Ontex Group N.V. (Personal Products) | | | 120,870 | | | | 3,654,810 | |
UCB S.A. (Pharmaceuticals) | | | 79,694 | | | | 5,396,895 | |
| | | | | | | | |
| | | | | | | 9,051,705 | |
| | | | | | | | |
China 8.1% | | | | | | | | |
Baidu, Inc., Sponsored ADR (Internet Software & Services) (a) | | | 26,557 | | | | 4,696,871 | |
China Biologic Products, Inc. (Biotechnology) (a) | | | 45,159 | | | | 5,333,730 | |
CT Environmental Group, Ltd. (Water Utilities) | | | 4,256,000 | | | | 1,196,315 | |
¨NetEase, Inc., ADR (Internet Software & Services) | | | 42,387 | | | | 10,893,035 | |
| | | | | | | | |
| | | | | | | 22,119,951 | |
| | | | | | | | |
Denmark 2.0% | | | | | | | | |
Novo Nordisk A/S Class B (Pharmaceuticals) | | | 150,676 | | | | 5,390,339 | |
| | | | | | | | |
| | |
Germany 7.4% | | | | | | | | |
¨Fresenius Medical Care A.G. & Co. KGaA (Health Care Providers & Services) | | | 152,476 | | | | 12,421,312 | |
United Internet A.G. Registered (Internet Software & Services) | | | 186,617 | | | | 7,659,673 | |
| | | | | | | | |
| | | | | | | 20,080,985 | |
| | | | | | | | |
India 6.1% | | | | | | | | |
Housing Development Finance Corp., Ltd. (Thrifts & Mortgage Finance) | | | 250,006 | | | | 5,154,608 | |
Lupin, Ltd. (Pharmaceuticals) | | | 153,547 | | | | 3,494,590 | |
¨Yes Bank, Ltd. (Banks) | | | 424,552 | | | | 8,027,435 | |
| | | | | | | | |
| | | | | | | 16,676,633 | |
| | | | | | | | |
Ireland 4.8% | | | | | | | | |
Experian PLC (Professional Services) | | | 329,754 | | | | 6,348,929 | |
Paddy Power Betfair PLC (Hotels, Restaurants & Leisure) | | | 33,862 | | | | 3,505,321 | |
Shire PLC (Biotechnology) | | | 56,992 | | | | 3,243,759 | |
| | | | | | | | |
| | | | | | | 13,098,009 | |
| | | | | | | | |
Israel 4.9% | | | | | | | | |
¨Check Point Software Technologies, Ltd. (Software) (a) | | | 158,471 | | | | 13,400,308 | |
| | | | | | | | |
| | |
Italy 1.8% | | | | | | | | |
De’Longhi S.p.A. (Household Durables) | | | 80,375 | | | | 1,881,100 | |
| | | | | | | | |
| | |
| | | Shares | | | Value | |
Italy (continued) | | | | | | | | |
DiaSorin S.p.A. (Health Care Equipment & Supplies) | | | 50,482 | | | $ | 3,103,331 | |
| | | | | | | | |
| | | | | | | 4,984,431 | |
| | | | | | | | |
Japan 16.3% | | | | | | | | |
¨CyberAgent, Inc. (Media) | | | 319,400 | | | | 9,304,539 | |
¨Start Today Co., Ltd. (Internet & Catalog Retail) | | | 693,696 | | | | 12,197,725 | |
Suruga Bank, Ltd. (Banks) | | | 73,400 | | | | 1,795,280 | |
Sysmex Corp. (Health Care Equipment & Supplies) | | | 112,974 | | | | 7,853,346 | |
¨Tsuruha Holdings, Inc. (Food & Staples Retailing) | | | 113,788 | | | | 13,150,668 | |
| | | | | | | | |
| | | | | | | 44,301,558 | |
| | | | | | | | |
Jordan 2.6% | | | | | | | | |
Hikma Pharmaceuticals PLC (Pharmaceuticals) | | | 324,973 | | | | 6,976,836 | |
| | | | | | | | |
| | |
Netherlands 1.4% | | | | | | | | |
GrandVision N.V. (Specialty Retail) (b) | | | 112,831 | | | | 2,584,344 | |
IMCD Group N.V. (Trading Companies & Distributors) | | | 25,450 | | | | 1,100,887 | |
| | | | | | | | |
| | | | | | | 3,685,231 | |
| | | | | | | | |
South Africa 1.6% | | | | | | | | |
Mediclinic International PLC (Health Care Providers & Services) | | | 385,656 | | | | 4,279,072 | |
| | | | | | | | |
| | |
Spain 1.8% | | | | | | | | |
Almirall S.A. (Pharmaceuticals) | | | 142,072 | | | | 2,044,630 | |
Grifols S.A. (Biotechnology) | | | 148,691 | | | | 2,939,693 | |
| | | | | | | | |
| | | | | | | 4,984,323 | |
| | | | | | | | |
Sweden 2.1% | | | | | | | | |
Hexagon AB Class B (Electronic Equipment, Instruments & Components) | | | 161,823 | | | | 5,665,144 | |
| | | | | | | | |
| | |
Switzerland 7.3% | | | | | | | | |
DKSH Holding A.G. (Professional Services) | | | 48,726 | | | | 3,377,903 | |
Syngenta A.G. Registered (Chemicals) | | | 5,954 | | | | 2,380,276 | |
¨TE Connectivity, Ltd. (Electronic Equipment, Instruments & Components) | | | 184,342 | | | | 11,589,582 | |
Tecan Group A.G. Registered (Life Sciences Tools & Services) | | | 15,588 | | | | 2,567,676 | |
| | | | | | | | |
| | | | | | | 19,915,437 | |
| | | | | | | | |
Thailand 1.5% | | | | | | | | |
Kasikornbank PCL (Banks) | | | 854,344 | | | | 4,198,790 | |
| | | | | | | | |
| † | Percentages indicated are based on Fund net assets. |
| ¨ | | Among the Fund’s 10 largest holdings, as of October 31, 2016, excluding short-term investment. May be subject to change daily. (Unaudited) |
| | | | | | |
The notes to the financial statements are an integral part of,
and should be read in conjunction with, the financial statements. | | | | | 11 | |
Portfolio of Investments October 31, 2016 (continued)
| | | | | | | | |
| | |
| | | Shares | | | Value | |
| Common Stocks (continued) | |
United Kingdom 12.1% | | | | | | | | |
Big Yellow Group PLC (Real Estate Investment Trusts) | | | 92,116 | | | $ | 780,230 | |
HomeServe PLC (Commercial Services & Supplies) | | | 289,180 | | | | 2,157,365 | |
Johnson Matthey PLC (Chemicals) | | | 107,995 | | | | 4,507,541 | |
¨LivaNova PLC (Health Care Equipment & Supplies) (a) | | | 170,338 | | | | 9,654,758 | |
Prudential PLC (Insurance) | | | 407,417 | | | | 6,654,867 | |
Sage Group PLC (The) (Software) | | | 330,202 | | | | 2,916,069 | |
Whitbread PLC (Hotels, Restaurants & Leisure) | | | 142,143 | | | | 6,289,490 | |
| | | | | | | | |
| | | | | | | 32,960,320 | |
| | | | | | | | |
United States 10.2% | | | | | | | | |
¨Accenture PLC Class A (IT Services) | | | 86,966 | | | | 10,108,928 | |
ICON PLC (Life Sciences Tools & Services) (a) | | | 84,285 | | | | 6,766,400 | |
Perrigo Co. PLC (Pharmaceuticals) | | | 59,156 | | | | 4,921,188 | |
Samsonite International S.A. (Textiles, Apparel & Luxury Goods) | | | 1,846,200 | | | | 5,796,490 | |
| | | | | | | | |
| | | | | | | 27,593,006 | |
| | | | | | | | |
Total Common Stocks
(Cost $235,426,311) | | | | | | | 260,876,076 | |
| | | | | | | | |
| | |
| | | | | | | | |
| | | Principal
Amount | | | | |
| Short-Term Investment 1.5% | |
Repurchase Agreement 1.5% | | | | | | | | |
United States 1.5% | | | | | | | | |
Fixed Income Clearing Corp.
0.03%, dated 10/31/16
due 11/1/16
Proceeds at Maturity $3,975,615 (Collateralized by a Federal Home Loan Mortgage Corp. security with a rate of 1.25% and a maturity date of 10/2/19, with a Principal Amount of $4,035,000 and a Market Value of $4,055,161) (Capital Markets) | | $ | 3,975,612 | | | $ | 3,975,612 | |
| | | | | | | | |
Total Short-Term Investment
(Cost $3,975,612) | | | | | | | 3,975,612 | |
| | | | | | | | |
Total Investments
(Cost $239,401,923) (c) | | | 97.4 | % | | | 264,851,688 | |
Other Assets, Less Liabilities | | | 2.6 | | | | 7,109,661 | |
Net Assets | | | 100.0 | % | | $ | 271,961,349 | |
| (a) | Non-income producing security. |
| (b) | May be sold to institutional investors only under Rule 144A or securities offered pursuant to Section 4(a)(2) of the Securities Act of 1933, as amended. |
| (c) | As of October 31, 2016, cost was $241,323,998 for federal income tax purposes and net unrealized appreciation was as follows: |
| | | | |
Gross unrealized appreciation | | $ | 43,400,193 | |
Gross unrealized depreciation | | | (19,872,503 | ) |
| | | | |
Net unrealized appreciation | | $ | 23,527,690 | |
| | | | |
The following abbreviation is used in the preceding pages:
ADR—American Depositary Receipt
| | | | |
| 12 | | MainStay International Equity Fund | | The notes to the financial statements are an integral part of,
and should be read in conjunction with, the financial statements. |
The following is a summary of the fair valuations according to the inputs used as of October 31, 2016, for valuing the Fund’s assets.
Asset Valuation Inputs
| | | | | | | | | | | | | | | | |
Description | | Quoted Prices in Active Markets for Identical Assets (Level 1) | | | Significant
Other
Observable
Inputs (Level 2) | | | Significant
Unobservable
Inputs (Level 3) | | | Total | |
| Investments in Securities (a) | | | | | | | | | | | | | | | | |
| Common Stocks | | $ | 260,876,076 | | | $ | — | | | $ | — | | | $ | 260,876,076 | |
| Short-Term Investment | | | | | | | | | | | | | | | | |
Repurchase Agreement | | | — | | | | 3,975,612 | | | | — | | | | 3,975,612 | |
| | | | | | | | | | | | | | | | |
| Total Investments in Securities | | $ | 260,876,076 | | | $ | 3,975,612 | | | $ | — | | | $ | 264,851,688 | |
| | | | | | | | | | | | | | | | |
| (a) | For a complete listing of investments and their industries, see the Portfolio of Investments. |
The Fund recognizes transfers between the levels as of the beginning of the period.
For the year ended October 31, 2016, the Fund did not have any transfers between Level 1 and Level 2 fair value measurements. (See Note 2)
As of October 31, 2016, the Fund did not hold any investments with significant unobservable inputs (Level 3). (See Note 2)
| | | | | | |
The notes to the financial statements are an integral part of,
and should be read in conjunction with, the financial statements. | | | | | 13 | |
Portfolio of Investments October 31, 2016 (continued)
The table below sets forth the diversification of MainStay International Equity Fund investments by industry.
Industry Diversification (Unaudited)
| | | | | | | | |
| | | Value | | | Percent † | |
Banks | | $ | 14,021,505 | | | | 5.2 | % |
Biotechnology | | | 11,517,182 | | | | 4.2 | |
Capital Markets | | | 3,975,612 | | | | 1.5 | |
Chemicals | | | 6,887,817 | | | | 2.5 | |
Commercial Services & Supplies | | | 2,157,365 | | | | 0.8 | |
Electronic Equipment, Instruments & Components | | | 17,254,726 | | | | 6.3 | |
Food & Staples Retailing | | | 13,150,668 | | | | 4.8 | |
Health Care Equipment & Supplies | | | 20,611,435 | | | | 7.6 | |
Health Care Providers & Services | | | 16,700,384 | | | | 6.1 | |
Hotels, Restaurants & Leisure | | | 9,794,811 | | | | 3.6 | |
Household Durables | | | 1,881,100 | | | | 0.7 | |
Insurance | | | 6,654,867 | | | | 2.5 | |
Internet & Catalog Retail | | | 12,197,725 | | | | 4.5 | |
Internet Software & Services | | | 23,249,579 | | | | 8.6 | |
IT Services | | | 10,108,928 | | | | 3.7 | |
Life Sciences Tools & Services | | | 9,334,076 | | | | 3.4 | |
Media | | | 9,304,539 | | | | 3.4 | |
Personal Products | | | 3,654,810 | | | | 1.3 | |
Pharmaceuticals | | | 28,224,478 | | | | 10.4 | |
Professional Services | | | 9,726,832 | | | | 3.6 | |
Real Estate Investment Trusts | | | 780,230 | | | | 0.3 | |
Real Estate Management & Development | | | 1,513,998 | | | | 0.6 | |
Software | | | 16,316,377 | | | | 6.0 | |
Specialty Retail | | | 2,584,344 | | | | 1.0 | |
Textiles, Apparel & Luxury Goods | | | 5,796,490 | | | | 2.1 | |
Thrifts & Mortgage Finance | | | 5,154,608 | | | | 1.9 | |
Trading Companies & Distributors | | | 1,100,887 | | | | 0.4 | |
Water Utilities | | | 1,196,315 | | | | 0.4 | |
| | | | | | | | |
| | | 264,851,688 | | | | 97.4 | |
Other Assets, Less Liabilities | | | 7,109,661 | | | | 2.6 | |
| | | | | | | | |
Net Assets | | $ | 271,961,349 | | | | 100.0 | % |
| | | | | | | | |
| † | Percentages indicated are based on Fund net assets. |
| | | | |
| 14 | | MainStay International Equity Fund | | The notes to the financial statements are an integral part of,
and should be read in conjunction with, the financial statements. |
Statement of Assets and Liabilities as of October 31, 2016
| | | | |
| Assets | |
Investment in securities, at value
(identified cost $239,401,923) | | $ | 264,851,688 | |
Cash denominated in foreign currencies
(identified cost $3,688,161) | | | 3,681,567 | |
Receivables: | | | | |
Investment securities sold | | | 3,503,756 | |
Dividends and interest | | | 517,132 | |
Fund shares sold | | | 56,523 | |
Other assets | | | 35,946 | |
| | | | |
Total assets | | | 272,646,612 | |
| | | | |
| |
| Liabilities | | | | |
Payables: | | | | |
Foreign capital gains tax (See Note 2(C)) | | | 223,869 | |
Manager (See Note 3) | | | 211,880 | |
Fund shares redeemed | | | 99,749 | |
Transfer agent (See Note 3) | | | 68,033 | |
NYLIFE Distributors (See Note 3) | | | 29,665 | |
Shareholder communication | | | 20,027 | |
Custodian | | | 16,223 | |
Professional fees | | | 13,821 | |
Trustees | | | 816 | |
Investment securities purchased | | | 322 | |
Accrued expenses | | | 858 | |
| | | | |
Total liabilities | | | 685,263 | |
| | | | |
Net assets | | $ | 271,961,349 | |
| | | | |
| |
| Composition of Net Assets | | | | |
Shares of beneficial interest outstanding (par value of $.01 per share) unlimited number of shares authorized | | $ | 201,894 | |
Additional paid-in capital | | | 314,317,359 | |
| | | | |
| | | 314,519,253 | |
Distributions in excess of net investment income | | | (508,194 | ) |
Accumulated net realized gain (loss) on investments and foreign currency transactions (a) | | | (67,250,163 | ) |
Net unrealized appreciation (depreciation) on investments (b) | | | 25,225,896 | |
Net unrealized appreciation (depreciation) on translation of other assets and liabilities in foreign currencies | | | (25,443 | ) |
| | | | |
Net assets | | $ | 271,961,349 | |
| | | | |
| | | | |
Class A | | | | |
Net assets applicable to outstanding shares | | $ | 41,891,430 | |
| | | | |
Shares of beneficial interest outstanding | | | 3,100,163 | |
| | | | |
Net asset value per share outstanding | | $ | 13.51 | |
Maximum sales charge (5.50% of offering price) | | | 0.79 | |
| | | | |
Maximum offering price per share outstanding | | $ | 14.30 | |
| | | | |
Investor Class | | | | |
Net assets applicable to outstanding shares | | $ | 31,522,820 | |
| | | | |
Shares of beneficial interest outstanding | | | 2,347,596 | |
| | | | |
Net asset value per share outstanding | | $ | 13.43 | |
Maximum sales charge (5.50% of offering price) | | | 0.78 | |
| | | | |
Maximum offering price per share outstanding | | $ | 14.21 | |
| | | | |
Class B | | | | |
Net assets applicable to outstanding shares | | $ | 6,990,814 | |
| | | | |
Shares of beneficial interest outstanding | | | 577,549 | |
| | | | |
Net asset value and offering price per share outstanding | | $ | 12.10 | |
| | | | |
Class C | | | | |
Net assets applicable to outstanding shares | | $ | 7,849,608 | |
| | | | |
Shares of beneficial interest outstanding | | | 648,478 | |
| | | | |
Net asset value and offering price per share outstanding | | $ | 12.10 | |
| | | | |
Class I | | | | |
Net assets applicable to outstanding shares | | $ | 179,273,839 | |
| | | | |
Shares of beneficial interest outstanding | | | 13,187,287 | |
| | | | |
Net asset value and offering price per share outstanding | | $ | 13.59 | |
| | | | |
Class R1 | | | | |
Net assets applicable to outstanding shares | | $ | 2,477,698 | |
| | | | |
Shares of beneficial interest outstanding | | | 183,346 | |
| | | | |
Net asset value and offering price per share outstanding | | $ | 13.51 | |
| | | | |
Class R2 | | | | |
Net assets applicable to outstanding shares | | $ | 847,259 | |
| | | | |
Shares of beneficial interest outstanding | | | 62,558 | |
| | | | |
Net asset value and offering price per share outstanding | | $ | 13.54 | |
| | | | |
Class R3 | | | | |
Net assets applicable to outstanding shares | | $ | 1,107,881 | |
| | | | |
Shares of beneficial interest outstanding | | | 82,419 | |
| | | | |
Net asset value and offering price per share outstanding | | $ | 13.44 | |
| | | | |
| (a) | Realized gain (loss) on security transactions recorded net of foreign capital gains tax. |
| (b) | Unrealized appreciation (depreciation) on investments recorded net of foreign capital gains tax in the amount of $223,869. |
| | | | | | |
The notes to the financial statements are an integral part of,
and should be read in conjunction with, the financial statements. | | | | | 15 | |
Statement of Operations for the year ended October 31, 2016
| | | | |
| Investment Income (Loss) | |
Income | | | | |
Dividends (a) | | $ | 4,983,588 | |
Interest | | | 843 | |
| | | | |
Total income | | | 4,984,431 | |
| | | | |
Expenses | | | | |
Manager (See Note 3) | | | 2,771,378 | |
Transfer agent (See Note 3) | | | 403,640 | |
Distribution/Service—Class A (See Note 3) | | | 111,958 | |
Distribution/Service—Investor Class (See Note 3) | | | 82,635 | |
Distribution/Service—Class B (See Note 3) | | | 78,051 | |
Distribution/Service—Class C (See Note 3) | | | 84,727 | |
Distribution/Service—Class R2 (See Note 3) | | | 3,024 | |
Distribution/Service—Class R3 (See Note 3) | | | 5,432 | |
Registration | | | 95,647 | |
Professional fees | | | 90,027 | |
Custodian | | | 84,017 | |
Shareholder communication | | | 48,512 | |
Trustees | | | 8,140 | |
Shareholder service (See Note 3) | | | 5,078 | |
Miscellaneous | | | 28,247 | |
| | | | |
Total expenses | | | 3,900,513 | |
Reimbursement from custodian (b) | | | (28,449 | ) |
| | | | |
Net expenses | | | 3,872,064 | |
| | | | |
Net investment income (loss) | | | 1,112,367 | |
| | | | |
|
Realized and Unrealized Gain (Loss)
on Investments and Foreign Currency Transactions | |
Net realized gain (loss) on: | | | | |
Investment transactions (c) | | | 17,450,836 | |
Foreign currency transactions | | | (431,857 | ) |
| | | | |
Net realized gain (loss) on investments and foreign currency transactions | | | 17,018,979 | |
| | | | |
Net change in unrealized appreciation (depreciation) on: Investments (d) | | | (16,744,215 | ) |
Translation of other assets and liabilities in foreign currencies | | | 245,341 | |
| | | | |
Net change in unrealized appreciation (depreciation) on investments and foreign currency transactions | | | (16,498,874 | ) |
| | | | |
Net realized and unrealized gain (loss) on investments and foreign currency transactions | | | 520,105 | |
| | | | |
Net increase (decrease) in net assets resulting from operations | | $ | 1,632,472 | |
| | | | |
| (a) | Dividends recorded net of foreign withholding taxes in the amount of $273,090. |
| (b) | Reimbursement from custodian represents a refund for overbilling of prior years’ custody out-of-pocket fees. |
| (c) | Realized gain (loss) on security transactions recorded net of foreign capital gains tax in the amount of $22,130. |
| (d) | Unrealized appreciation (depreciation) on investments recorded net of foreign capital gains tax in the amount of $223,869. |
| | | | |
| 16 | | MainStay International Equity Fund | | The notes to the financial statements are an integral part of,
and should be read in conjunction with, the financial statements. |
Statements of Changes in Net Assets
for the years ended October 31, 2016 and October 31, 2015
| | | | | | | | |
| | | 2016 | | | 2015 | |
| Increase (Decrease) in Net Assets | |
Operations: | | | | | | | | |
Net investment income (loss) | | $ | 1,112,367 | | | $ | 890,489 | |
Net realized gain (loss) on investments and foreign currency transactions | | | 17,018,979 | | | | 11,006,954 | |
Net change in unrealized appreciation (depreciation) on investments and foreign currency transactions | | | (16,498,874 | ) | | | 1,162,090 | |
| | | | |
Net increase (decrease) in net assets resulting from operations | | | 1,632,472 | | | | 13,059,533 | |
| | | | |
Dividends to shareholders: | | | | | | | | |
From net investment income: | | | | | | | | |
Class A | | | (21,107 | ) | | | (317,497 | ) |
Investor Class | | | — | | | | (121,482 | ) |
Class I | | | (653,743 | ) | | | (2,065,815 | ) |
Class R1 | | | (5,305 | ) | | | (30,669 | ) |
Class R2 | | | — | | | | (20,968 | ) |
Class R3 | | | — | | | | (3,390 | ) |
| | | | |
Total dividends to shareholders | | | (680,155 | ) | | | (2,559,821 | ) |
| | | | |
Capital share transactions: | | | | | | | | |
Net proceeds from sale of shares | | | 38,503,958 | | | | 64,841,375 | |
Net asset value of shares issued to shareholders in reinvestment of dividends | | | 677,340 | | | | 2,539,275 | |
Cost of shares redeemed | | | (94,035,967 | ) | | | (83,909,814 | ) |
| | | | |
Increase (decrease) in net assets derived from capital share transactions | | | (54,854,669 | ) | | | (16,529,164 | ) |
| | | | |
Net increase (decrease) in net assets | | | (53,902,352 | ) | | | (6,029,452 | ) |
|
| Net Assets | |
Beginning of year | | | 325,863,701 | | | | 331,893,153 | |
| | | | |
End of year | | $ | 271,961,349 | | | $ | 325,863,701 | |
| | | | |
Distributions in excess of net investment income at end of year | | $ | (508,194 | ) | | $ | (613,962 | ) |
| | | | |
| | | | | | |
The notes to the financial statements are an integral part of,
and should be read in conjunction with, the financial statements. | | | | | 17 | |
Financial Highlights selected per share data and ratios
| | | | | | | | | | | | | | | | | | | | |
| | | Year ended October 31, | |
| Class A | | 2016 | | | 2015 | | | 2014 | | | 2013 | | | 2012 | |
Net asset value at beginning of year | | $ | 13.51 | | | $ | 13.11 | | | $ | 13.37 | | | $ | 11.68 | | | $ | 10.82 | |
| | | | | | | | | | | | | | | | | | | | |
Net investment income (loss) (a) | | | 0.04 | | | | 0.03 | | | | 0.07 | | | | 0.05 | | | | 0.10 | |
Net realized and unrealized gain (loss) on investments | | | (0.04 | ) | | | 0.49 | | | | (0.26 | ) | | | 1.75 | | | | 1.07 | |
Net realized and unrealized gain (loss) on foreign currency transactions | | | 0.01 | | | | (0.03 | ) | | | (0.04 | ) | | | (0.01 | ) | | | 0.00 | ‡ |
| | | | | | | | | | | | | | | | | | | | |
Total from investment operations | | | 0.01 | | | | 0.49 | | | | (0.23 | ) | | | 1.79 | | | | 1.17 | |
| | | | | | | | | | | | | | | | | | | | |
| Less dividends: | | | | | | | | | | | | | | | | | | | | |
From net investment income | | | (0.01 | ) | | | (0.09 | ) | | | (0.03 | ) | | | (0.10 | ) | | | (0.31 | ) |
| | | | | | | | | | | | | | | | | | | | |
Net asset value at end of year | | $ | 13.51 | | | $ | 13.51 | | | $ | 13.11 | | | $ | 13.37 | | | $ | 11.68 | |
| | | | | | | | | | | | | | | | | | | | |
Total investment return (b) | | | 0.05 | % | | | 3.78 | % | | | (1.76 | %) | | | 15.43 | % | | | 11.27 | % |
| Ratios (to average net assets)/Supplemental Data: | | | | | | | | | | | | | | | | | | | | |
Net investment income (loss) | | | 0.28 | %(c) | | | 0.20 | % | | | 0.51 | % | | | 0.38 | % | | | 0.87 | % |
Net expenses | | | 1.32 | %(d) | | | 1.33 | % | | | 1.34 | % | | | 1.40 | % | | | 1.43 | % |
Portfolio turnover rate | | | 33 | % | | | 42 | % | | | 37 | % | | | 29 | % | | | 43 | % |
Net assets at end of year (in 000’s) | | $ | 41,891 | | | $ | 43,405 | | | $ | 45,882 | | | $ | 57,948 | | | $ | 60,303 | |
| ‡ | Less than one cent per share. |
| (a) | Per share data based on average shares outstanding during the year. |
| (b) | Total investment return is calculated exclusive of sales charges and assumes the reinvestment of dividends and distributions. |
| (c) | Without the custody fee reimbursement, net investment income (loss) would have been 0.27%. |
| (d) | Without the custody fee reimbursement, net expenses would have been 1.33%. |
| | | | | | | | | | | | | | | | | | | | |
| | | Year ended October 31, | |
| Investor Class | | 2016 | | | 2015 | | | 2014 | | | 2013 | | | 2012 | |
Net asset value at beginning of year | | $ | 13.47 | | | $ | 13.07 | | | $ | 13.35 | | | $ | 11.66 | | | $ | 10.81 | |
| | | | | | | | | | | | | | | | | | | | |
Net investment income (loss) (a) | | | (0.01 | ) | | | (0.02 | ) | | | 0.03 | | | | 0.01 | | | | 0.06 | |
Net realized and unrealized gain (loss) on investments | | | (0.04 | ) | | | 0.50 | | | | (0.27 | ) | | | 1.75 | | | | 1.07 | |
Net realized and unrealized gain (loss) on foreign currency transactions | | | 0.01 | | | | (0.03 | )�� | | | (0.04 | ) | | | (0.01 | ) | | | 0.00 | ‡ |
| | | | | | | | | | | | | | | | | | | | |
Total from investment operations | | | (0.04 | ) | | | 0.45 | | | | (0.28 | ) | | | 1.75 | | | | 1.13 | |
| | | | | | | | | | | | | | | | | | | | |
| Less dividends: | | | | | | | | | | | | | | | | | | | | |
From net investment income | | | — | | | | (0.05 | ) | | | — | | | | (0.06 | ) | | | (0.28 | ) |
| | | | | | | | | | | | | | | | | | | | |
Net asset value at end of year | | $ | 13.43 | | | $ | 13.47 | | | $ | 13.07 | | | $ | 13.35 | | | $ | 11.66 | |
| | | | | | | | | | | | | | | | | | | | |
Total investment return (b) | | | (0.30 | %) | | | 3.43 | % | | | (2.10 | %) | | | 15.07 | % | | | 10.81 | % |
| Ratios (to average net assets)/Supplemental Data: | | | | | | | | | | | | | | | | | | | | |
Net investment income (loss) | | | (0.11 | %)(c) | | | (0.14 | %) | | | 0.19 | % | | | 0.05 | % | | | 0.54 | % |
Net expenses | | | 1.69 | % (d) | | | 1.68 | % | | | 1.67 | % | | | 1.72 | % | | | 1.77 | % |
Portfolio turnover rate | | | 33 | % | | | 42 | % | | | 37 | % | | | 29 | % | | | 43 | % |
Net assets at end of year (in 000’s) | | $ | 31,523 | | | $ | 34,329 | | | $ | 34,377 | | | $ | 37,457 | | | $ | 34,822 | |
| ‡ | Less than one cent per share. |
| (a) | Per share data based on average shares outstanding during the year. |
| (b) | Total investment return is calculated exclusive of sales charges and assumes the reinvestment of dividends and distributions. |
| (c) | Without the custody fee reimbursement, net investment income (loss) would have been (0.12%). |
| (d) | Without the custody fee reimbursement, net expenses would have been 1.70%. |
| | | | |
| 18 | | MainStay International Equity Fund | | The notes to the financial statements are an integral part of,
and should be read in conjunction with, the financial statements. |
Financial Highlights selected per share data and ratios
| | | | | | | | | | | | | | | | | | | | |
| | | Year ended October 31, | |
| Class B | | 2016 | | | 2015 | | | 2014 | | | 2013 | | | 2012 | |
Net asset value at beginning of year | | $ | 12.23 | | | $ | 11.91 | | | $ | 12.26 | | | $ | 10.73 | | | $ | 9.95 | |
| | | | | | | | | | | | | | | | | | | | |
Net investment income (loss) (a) | | | (0.10 | ) | | | (0.11 | ) | | | (0.07 | ) | | | (0.08 | ) | | | (0.02 | ) |
Net realized and unrealized gain (loss) on investments | | | (0.04 | ) | | | 0.46 | | | | (0.24 | ) | | | 1.62 | | | | 0.99 | |
Net realized and unrealized gain (loss) on foreign currency transactions | | | 0.01 | | | | (0.03 | ) | | | (0.04 | ) | | | (0.01 | ) | | | 0.00 | ‡ |
| | | | | | | | | | | | | | | | | | | | |
Total from investment operations | | | (0.13 | ) | | | 0.32 | | | | (0.35 | ) | | | 1.53 | | | | 0.97 | |
| | | | | | | | | | | | | | | | | | | | |
| Less dividends: | | | | | | | | | | | | | | | | | | | | |
From net investment income | | | — | | | | — | | | | — | | | | — | | | | (0.19 | ) |
| | | | | | | | | | | | | | | | | | | | |
Net asset value at end of year | | $ | 12.10 | | | $ | 12.23 | | | $ | 11.91 | | | $ | 12.26 | | | $ | 10.73 | |
| | | | | | | | | | | | | | | | | | | | |
Total investment return (b) | | | (1.06 | %) | | | 2.69 | % | | | (2.85 | %) | | | 14.26 | % (c) | | | 10.05 | % |
| Ratios (to average net assets)/Supplemental Data: | | | | | | | | | | | | | | | | | | | | |
Net investment income (loss) | | | (0.86 | %)(d) | | | (0.91 | %) | | | (0.57 | %) | | | (0.73 | %) | | | (0.22 | %) |
Net expenses | | | 2.44 | % (e) | | | 2.43 | % | | | 2.42 | % | | | 2.47 | % | | | 2.52 | % |
Portfolio turnover rate | | | 33 | % | | | 42 | % | | | 37 | % | | | 29 | % | | | 43 | % |
Net assets at end of year (in 000’s) | | $ | 6,991 | | | $ | 8,982 | | | $ | 11,058 | | | $ | 13,981 | | | $ | 16,186 | |
| ‡ | Less than one cent per share. |
| (a) | Per share data based on average shares outstanding during the year. |
| (b) | Total investment return is calculated exclusive of sales charges and assumes the reinvestment of dividends and distributions. |
| (c) | Total investment return may reflect adjustments to conform to generally accepted accounting principles. |
| (d) | Without the custody fee reimbursement, net investment income (loss) would have been (0.87%). |
| (e) | Without the custody fee reimbursement, net expenses would have been 2.45%. |
| | | | | | | | | | | | | | | | | | | | |
| | | Year ended October 31, | |
| Class C | | 2016 | | | 2015 | | | 2014 | | | 2013 | | | 2012 | |
Net asset value at beginning of year | | $ | 12.23 | | | $ | 11.92 | | | $ | 12.26 | | | $ | 10.74 | | | $ | 9.96 | |
| | | | | | | | | | | | | | | | | | | | |
Net investment income (loss) (a) | | | (0.10 | ) | | | (0.11 | ) | | | (0.07 | ) | | | (0.08 | ) | | | (0.02 | ) |
Net realized and unrealized gain (loss) on investments | | | (0.04 | ) | | | 0.45 | | | | (0.24 | ) | | | 1.61 | | | | 0.99 | |
Net realized and unrealized gain (loss) on foreign currency transactions | | | 0.01 | | | | (0.03 | ) | | | (0.03 | ) | | | (0.01 | ) | | | 0.00 | ‡ |
| | | | | | | | | | | | | | | | | | | | |
Total from investment operations | | | (0.13 | ) | | | 0.31 | | | | (0.34 | ) | | | 1.52 | | | | 0.97 | |
| | | | | | | | | | | | | | | | | | | | |
| Less dividends: | | | | | | | | | | | | | | | | | | | | |
From net investment income | | | — | | | | — | | | | — | | | | — | | | | (0.19 | ) |
| | | | | | | | | | | | | | | | | | | | |
Net asset value at end of year | | $ | 12.10 | | | $ | 12.23 | | | $ | 11.92 | | | $ | 12.26 | | | $ | 10.74 | |
| | | | | | | | | | | | | | | | | | | | |
Total investment return (b) | | | (1.06 | %) | | | 2.60 | % | | | (2.77 | %) | | | 14.15 | % | | | 10.05 | % |
| Ratios (to average net assets)/Supplemental Data: | | | | | | | | | | | | | | | | | | | | |
Net investment income (loss) | | | (0.84 | %)(c) | | | (0.90 | %) | | | (0.57 | %) | | | (0.71 | %) | | | (0.21 | %) |
Net expenses | | | 2.44 | % (d) | | | 2.43 | % | | | 2.42 | % | | | 2.47 | % | | | 2.52 | % |
Portfolio turnover rate | | | 33 | % | | | 42 | % | | | 37 | % | | | 29 | % | | | 43 | % |
Net assets at end of year (in 000’s) | | $ | 7,850 | | | $ | 8,292 | | | $ | 8,383 | | | $ | 10,088 | | | $ | 11,111 | |
| ‡ | Less than one cent per share. |
| (a) | Per share data based on average shares outstanding during the year. |
| (b) | Total investment return is calculated exclusive of sales charges and assumes the reinvestment of dividends and distributions. |
| (c) | Without the custody fee reimbursement, net investment income (loss) would have been (0.85%). |
| (d) | Without the custody fee reimbursement, net expenses would have been 2.45%. |
| | | | | | |
The notes to the financial statements are an integral part of,
and should be read in conjunction with, the financial statements. | | | | | 19 | |
Financial Highlights selected per share data and ratios
| | | | | | | | | | | | | | | | | | | | |
| | | Year ended October 31, | |
| Class I | | 2016 | | | 2015 | | | 2014 | | | 2013 | | | 2012 | |
Net asset value at beginning of year | | $ | 13.59 | | | $ | 13.19 | | | $ | 13.45 | | | $ | 11.75 | | | $ | 10.89 | |
| | | | | | | | | | | | | | | | | | | | |
Net investment income (loss) (a) | | | 0.07 | | | | 0.06 | | | | 0.11 | | | | 0.08 | | | | 0.13 | |
Net realized and unrealized gain (loss) on investments | | | (0.04 | ) | | | 0.50 | | | | (0.27 | ) | | | 1.76 | | | | 1.07 | |
Net realized and unrealized gain (loss) on foreign currency transactions | | | 0.01 | | | | (0.03 | ) | | | (0.04 | ) | | | (0.01 | ) | | | 0.00 | ‡ |
| | | | | | | | | | | | | | | | | | | | |
Total from investment operations | | | 0.04 | | | | 0.53 | | | | (0.20 | ) | | | 1.83 | | | | 1.20 | |
| | | | | | | | | | | | | | | | | | | | |
| Less dividends: | | | | | | | | | | | | | | | | | | | | |
From net investment income | | | (0.04 | ) | | | (0.13 | ) | | | (0.06 | ) | | | (0.13 | ) | | | (0.34 | ) |
| | | | | | | | | | | | | | | | | | | | |
Net asset value at end of year | | $ | 13.59 | | | $ | 13.59 | | | $ | 13.19 | | | $ | 13.45 | | | $ | 11.75 | |
| | | | | | | | | | | | | | | | | | | | |
Total investment return (b) | | | 0.29 | % | | | 4.04 | % | | | (1.49 | %) | | | 15.72 | % | | | 11.45 | % |
| Ratios (to average net assets)/Supplemental Data: | | | | | | | | | | | | | | | | | | | | |
Net investment income (loss) | | | 0.54 | %(c) | | | 0.46 | % | | | 0.79 | % | | | 0.62 | % | | | 1.15 | % |
Net expenses | | | 1.07 | %(d) | | | 1.08 | % | | | 1.09 | % | | | 1.14 | % | | | 1.18 | % |
Portfolio turnover rate | | | 33 | % | | | 42 | % | | | 37 | % | | | 29 | % | | | 43 | % |
Net assets at end of year (in 000’s) | | $ | 179,274 | | | $ | 224,307 | | | $ | 223,797 | | | $ | 202,289 | | | $ | 177,726 | |
| ‡ | Less than one cent per share. |
| (a) | Per share data based on average shares outstanding during the year. |
| (b) | Total investment return is calculated exclusive of sales charges and assumes the reinvestment of dividends and distributions. Class I shares are not subject to sales charges. |
| (c) | Without the custody fee reimbursement, net investment income (loss) would have been 0.53%. |
| (d) | Without the custody fee reimbursement, net expenses would have been 1.08%. |
| | | | | | | | | | | | | | | | | | | | |
| | | Year ended October 31, | |
| Class R1 | | 2016 | | | 2015 | | | 2014 | | | 2013 | | | 2012 | |
Net asset value at beginning of year | | $ | 13.51 | | | $ | 13.11 | | | $ | 13.37 | | | $ | 11.67 | | | $ | 10.82 | |
| | | | | | | | | | | | | | | | | | | | |
Net investment income (loss) (a) | | | 0.06 | | | | 0.04 | | | | 0.09 | | | | 0.06 | | | | 0.11 | |
Net realized and unrealized gain (loss) on investments | | | (0.05 | ) | | | 0.50 | | | | (0.27 | ) | | | 1.76 | | | | 1.07 | |
Net realized and unrealized gain (loss) on foreign currency transactions | | | 0.01 | | | | (0.03 | ) | | | (0.04 | ) | | | (0.01 | ) | | | 0.00 | ‡ |
| | | | | | | | | | | | | | | | | | | | |
Total from investment operations | | | 0.02 | | | | 0.51 | | | | (0.22 | ) | | | 1.81 | | | | 1.18 | |
| | | | | | | | | | | | | | | | | | | | |
| Less dividends: | | | | | | | | | | | | | | | | | | | | |
From net investment income | | | (0.02 | ) | | | (0.11 | ) | | | (0.04 | ) | | | (0.11 | ) | | | (0.33 | ) |
| | | | | | | | | | | | | | | | | | | | |
Net asset value at end of year | | $ | 13.51 | | | $ | 13.51 | | | $ | 13.11 | | | $ | 13.37 | | | $ | 11.67 | |
| | | | | | | | | | | | | | | | | | | | |
Total investment return (b) | | | 0.18 | % | | | 3.95 | % | | | (1.63 | %) | | | 15.68 | % | | | 11.41 | % |
| Ratios (to average net assets)/Supplemental Data: | | | | | | | | | | | | | | | | | | | | |
Net investment income (loss) | | | 0.41 | %(c) | | | 0.33 | % | | | 0.66 | % | | | 0.49 | % | | | 1.04 | % |
Net expenses | | | 1.17 | %(d) | | | 1.18 | % | | | 1.19 | % | | | 1.25 | % | | | 1.28 | % |
Portfolio turnover rate | | | 33 | % | | | 42 | % | | | 37 | % | | | 29 | % | | | 43 | % |
Net assets at end of year (in 000’s) | | $ | 2,478 | | | $ | 3,032 | | | $ | 3,597 | | | $ | 4,003 | | | $ | 4,677 | |
| ‡ | Less than one cent per share. |
| (a) | Per share data based on average shares outstanding during the year. |
| (b) | Total investment return is calculated exclusive of sales charges and assumes the reinvestment of dividends and distributions. Class R1 shares are not subject to sales charges. |
| (c) | Without the custody fee reimbursement, net investment income (loss) would have been 0.40%. |
| (d) | Without the custody fee reimbursement, net expenses would have been 1.18%. |
| | | | |
| 20 | | MainStay International Equity Fund | | The notes to the financial statements are an integral part of,
and should be read in conjunction with, the financial statements. |
Financial Highlights selected per share data and ratios
| | | | | | | | | | | | | | | | | | | | |
| | | Year ended October 31, | |
| Class R2 | | 2016 | | | 2015 | | | 2014 | | | 2013 | | | 2012 | |
Net asset value at beginning of year | | $ | 13.54 | | | $ | 13.14 | | | $ | 13.40 | | | $ | 11.70 | | | $ | 10.84 | |
| | | | | | | | | | | | | | | | | | | | |
Net investment income (loss) (a) | | | 0.01 | | | | 0.01 | | | | 0.05 | | | | 0.03 | | | | 0.09 | |
Net realized and unrealized gain (loss) on investments | | | (0.01 | ) | | | 0.50 | | | | (0.26 | ) | | | 1.76 | | | | 1.06 | |
Net realized and unrealized gain (loss) on foreign currency transactions | | | 0.00 | ‡ | | | (0.03 | ) | | | (0.04 | ) | | | (0.01 | ) | | | 0.00 | ‡ |
| | | | | | | | | | | | | | | | | | | | |
Total from investment operations | | | 0.00 | ‡ | | | 0.48 | | | | (0.25 | ) | | | 1.78 | | | | 1.15 | |
| | | | | | | | | | | | | | | | | | | | |
| Less dividends: | | | | | | | | | | | | | | | | | | | | |
From net investment income | | | — | | | | (0.08 | ) | | | (0.01 | ) | | | (0.08 | ) | | | (0.29 | ) |
| | | | | | | | | | | | | | | | | | | | |
Net asset value at end of year | | $ | 13.54 | | | $ | 13.54 | | | $ | 13.14 | | | $ | 13.40 | | | $ | 11.70 | |
| | | | | | | | | | | | | | | | | | | | |
Total investment return (b) | | | (0.07 | %) | | | 3.73 | % | | | (1.88 | %) | | | 15.34 | % | | | 11.12 | % |
| Ratios (to average net assets)/Supplemental Data: | | | | | | | | | | | | | | | | | | | | |
Net investment income (loss) | | | 0.08 | % | | | 0.11 | % | | | 0.36 | % | | | 0.26 | % | | | 0.82 | % |
Net expenses | | | 1.42 | % | | | 1.43 | % | | | 1.44 | % | | | 1.49 | % | | | 1.53 | % |
Portfolio turnover rate | | | 33 | % | | | 42 | % | | | 37 | % | | | 29 | % | | | 43 | % |
Net assets at end of year (in 000’s) | | $ | 847 | | | $ | 2,313 | | | $ | 3,509 | | | $ | 8,487 | | | $ | 10,545 | |
| ‡ | Less than one cent per share. |
| (a) | Per share data based on average shares outstanding during the year. |
| (b) | Total investment return is calculated exclusive of sales charges and assumes the reinvestment of dividends and distributions. Class R2 shares are not subject to sales charges. |
| | | | | | | | | | | | | | | | | | | | |
| | | Year ended October 31, | |
| Class R3 | | 2016 | | | 2015 | | | 2014 | | | 2013 | | | 2012 | |
Net asset value at beginning of year | | $ | 13.48 | | | $ | 13.07 | | | $ | 13.35 | | | $ | 11.64 | | | $ | 10.79 | |
| | | | | | | | | | | | | | | | | | | | |
Net investment income (loss) (a) | | | (0.01 | ) | | | (0.02 | ) | | | 0.02 | | | | (0.01 | ) | | | 0.06 | |
Net realized and unrealized gain (loss) on investments | | | (0.04 | ) | | | 0.50 | | | | (0.26 | ) | | | 1.76 | | | | 1.06 | |
Net realized and unrealized gain (loss) on foreign currency transactions | | | 0.01 | | | | (0.03 | ) | | | (0.04 | ) | | | (0.01 | ) | | | 0.00 | ‡ |
| | | | | | | | | | | | | | | | | | | | |
Total from investment operations | | | (0.04 | ) | | | 0.45 | | | | (0.28 | ) | | | 1.74 | | | | 1.12 | |
| | | | | | | | | | | | | | | | | | | | |
| Less dividends: | | | | | | | | | | | | | | | | | | | | |
From net investment income | | | — | | | | (0.04 | ) | | | — | | | | (0.03 | ) | | | (0.27 | ) |
| | | | | | | | | | | | | | | | | | | | |
Net asset value at end of year | | $ | 13.44 | | | $ | 13.48 | | | $ | 13.07 | | | $ | 13.35 | | | $ | 11.64 | |
| | | | | | | | | | | | | | | | | | | | |
Total investment return (b) | | | (0.30 | %) | | | 3.44 | % | | | (2.10 | %) | | | 15.02 | % | | | 10.82 | % |
| Ratios (to average net assets)/Supplemental Data: | | | | | | | | | | | | | | | | | | | | |
Net investment income (loss) | | | (0.11 | %)(c) | | | (0.15 | %) | | | 0.17 | % | | | (0.05 | %) | | | 0.56 | % |
Net expenses | | | 1.67 | % (d) | | | 1.68 | % | | | 1.69 | % | | | 1.74 | % | | | 1.78 | % |
Portfolio turnover rate | | | 33 | % | | | 42 | % | | | 37 | % | | | 29 | % | | | 43 | % |
Net assets at end of year (in 000’s) | | $ | 1,108 | | | $ | 1,204 | | | $ | 1,291 | | | $ | 1,365 | | | $ | 2,218 | |
| ‡ | Less than one cent per share. |
| (a) | Per share data based on average shares outstanding during the year. |
| (b) | Total investment return is calculated exclusive of sales charges and assumes the reinvestment of dividends and distributions. Class R3 shares are not subject to sales charges. |
| (c) | Without the custody fee reimbursement, net investment income (loss) would have been (0.12%). |
| (d) | Without the custody fee reimbursement, net expenses would have been 1.68%. |
| | | | | | |
The notes to the financial statements are an integral part of,
and should be read in conjunction with, the financial statements. | | | | | 21 | |
Notes to Financial Statements
Note 1–Organization and Business
The MainStay Funds (the “Trust”) was organized on January 9, 1986, as a Massachusetts business trust. The Trust is registered under the Investment Company Act of 1940, as amended (the “1940 Act”), as an open-end management investment company, and is comprised of twelve funds (collectively referred to as the “Funds”). These financial statements and notes relate to the MainStay International Equity Fund (the “Fund”), a “diversified” fund, as that term is defined in the 1940 Act, as interpreted or modified by regulatory authorities having jurisdiction, from time to time.
The Fund currently offers eight classes of shares. Class A shares commenced operations on January 3, 1995. Class B shares commenced operations on September 13, 1994. Class C shares commenced operations on September 1, 1998. Class I, Class R1 and Class R2 shares commenced operations on January 2, 2004. Class R3 shares commenced operations on April 28, 2006. Investor Class shares commenced operations on February 28, 2008. Class A and Investor Class shares are offered at net asset value (“NAV”) per share plus an initial sales charge. No initial sales charge applies to investments of $1 million or more (and certain other qualified purchases) in Class A and Investor Class shares, but a contingent deferred sales charge (“CDSC”) of 1.00% may be imposed on certain redemptions of such shares made within one year of the date of purchase on shares that were purchased without an initial sales charge made before January 1, 2017. Effective January 1, 2017, a CDSC of 1.00% may be imposed on certain redemptions of Class A and Investor Class shares made within 24 months of the date of purchase of such shares that were made without an initial sales charge. Class B and Class C shares are offered at NAV without an initial sales charge, although a CDSC that declines depending on the number of years a shareholder has held its Class B shares may be imposed on redemptions made within six years of the date of purchase of such shares and a 1.00% CDSC may be imposed on redemptions made within one year of the date of purchase of Class C shares. Class I, Class R1, Class R2 and Class R3 shares are offered at NAV and are not subject to a sales charge. Depending upon eligibility, Class B shares convert to either Class A or Investor Class shares at the end of the calendar quarter eight years after the date they were purchased. Additionally, depending upon eligibility, Class A shares may convert to Investor Class shares and Investor Class shares may convert to Class A shares. Under certain circumstances and as may be permitted by the Trust’s multiple class plan under Rule 18f-3 of the 1940 Act, an exchange/conversion may be made from specified share classes of the Fund to one or more other share classes of the Fund as disclosed in the capital share transactions within these notes. The eight classes of shares have the same voting (except for issues that relate solely to one class), dividend, liquidation and other rights, and the same terms and conditions, except that Class B and Class C shares are subject to higher distribution and/or service fee rates than Class A, Investor Class, Class R2 and Class R3 shares under a distribution plan pursuant to Rule 12b-1 under the 1940 Act. Class I and Class R1 shares are not subject to a distribution and/or service fee. Class R1, Class R2 and Class R3 shares are subject to a shareholder service fee. This is in addition to any fees paid under a distribution plan, where applicable.
The Fund’s investment objective is to seek long-term growth of capital.
Note 2–Significant Accounting Policies
The Fund is an investment company and accordingly follows the investment company accounting and reporting guidance of the Financial Accounting Standards Board (“FASB”) Accounting Standard Codification Topic 946 Financial Services—Investment Companies. The Fund prepares its financial statements in accordance with generally accepted accounting principles (“GAAP”) in the United States of America and follows the significant accounting policies described below.
(A) Securities Valuation. Investments are usually valued as of the close of regular trading on the New York Stock Exchange (the “Exchange”) (usually 4:00 p.m. Eastern time) on each day the Fund is open for business (“valuation date”).
The Board of Trustees (the “Board”) adopted procedures establishing methodologies for the valuation of the Fund’s securities and other assets and delegated the responsibility for valuation determinations under those procedures to the Valuation Committee of the Trust (the “Valuation Committee”). The Board authorized the Valuation Committee to appoint a Valuation Sub-Committee (the “Sub-Committee”) to deal in the first instance with establishing the prices of securities for which market quotations are not readily available or the prices of which are not otherwise readily determinable under these procedures. The Sub-Committee meets (in person, via electronic mail or via teleconference) on an as-needed basis. Subsequently, the Valuation Committee meets to ensure that actions taken by the Sub-Committee were appropriate. The procedures recognize that, subject to the oversight of the Board and unless otherwise noted, the responsibility for the day-to-day valuation of portfolio assets (including fair value measurements for the Fund’s assets and liabilities) rests with New York Life Investment Management LLC (“New York Life Investments” or the “Manager”), aided to whatever extent necessary by the Subadvisor (as defined in Note 3(A)) to the Fund.
To assess the appropriateness of security valuations, the Manager, Subadvisor or the Fund’s third party service provider, who is subject to oversight by the Manager, regularly compares prior day prices, prices on comparable securities, and the sale prices to the prior and current day prices and challenges prices with changes exceeding certain tolerance levels with third party pricing services or broker sources. For those securities valued through either a standardized fair valuation methodology or a fair valuation measurement, the Sub-Committee deals in the first instance with such valuation and the Valuation Committee reviews and affirms, if appropriate, the reasonableness of the valuation based on such methodologies and measurements on a regular basis after considering all relevant information that is reasonably available. Any action taken by the Sub-Committee with respect to the valuation of a portfolio security or other asset is submitted by the Valuation Committee to the Board for its review and ratification, if appropriate, at its next regularly scheduled meeting.
“Fair value” is defined as the price the Fund would reasonably expect to receive upon selling an asset or liability in an orderly transaction to an independent buyer in the principal or most advantageous market for the asset or liability. Fair value measurements are determined within a framework that establishes a three-tier hierarchy which maximizes the use of observable market data and minimizes the use of unobservable inputs to establish a classification of fair value measurements for
| | |
| 22 | | MainStay International Equity Fund |
disclosure purposes. “Inputs” refer broadly to the assumptions that market participants would use in pricing the asset or liability, including assumptions about risk, such as the risk inherent in a particular valuation technique used to measure fair value using a pricing model and/or the risk inherent in the inputs for the valuation technique. Inputs may be observable or unobservable. Observable inputs reflect the assumptions market participants would use in pricing the asset or liability based on market data obtained from sources independent of the Fund. Unobservable inputs reflect the Fund’s own assumptions about the assumptions market participants would use in pricing the asset or liability based on the information available. The inputs or methodology used for valuing assets or liabilities may not be an indication of the risks associated with investing in those assets or liabilities. The three-tier hierarchy of inputs is summarized below.
| • | | Level 1—quoted prices in active markets for an identical asset or liability |
| • | | Level 2—other significant observable inputs (including quoted prices for a similar asset or liability in active markets, interest rates and yield curves, prepayment speeds, credit risk, etc.) |
| • | | Level 3—significant unobservable inputs (including the Fund’s own assumptions about the assumptions that market participants would use in measuring fair value of an asset or liability) |
The level of an asset or liability within the fair value hierarchy is based on the lowest level of an input, both individually and in the aggregate, that is significant to the fair value measurement. As of October 31, 2016, the aggregate value by input level of the Fund’s assets and liabilities is included at the end of the Fund’s Portfolio of Investments.
The Fund may use third party vendor evaluations, whose prices may be derived from one or more of the following standard inputs, among others:
| | |
• Broker/dealer quotes | | • Issuer spreads |
• Two-sided markets | | • Benchmark securities |
• Bids/offers | | • Reference data (corporate actions or material event notices) |
• Industry and economic events | | • Monthly payment information |
• Reported trades | | |
An asset or liability for which market values cannot be measured using the methodologies described above is valued by methods deemed reasonable in good faith by the Valuation Committee, following the procedures established by the Board, to represent fair value. Under these procedures, the Fund generally uses a market-based approach which may use related or comparable assets or liabilities, recent transactions, market multiples, book values, and other relevant information. The Fund may also use an income-based valuation approach in which the anticipated future cash flows of the asset or liability are discounted to calculate fair value. Discounts may also be applied due to the nature and/or duration of any restrictions on the disposition of the asset or liability. Fair value represents a good faith approximation of the value of a security. Fair value determinations involve the consideration of a number of subjective factors, an analysis of applicable facts and circumstances and the exercise of judgment. As a result, it is possible that the fair value for a security determined in good faith in accordance
with the Fund’s valuation procedures may differ from valuations for the same security determined by other funds using their own valuation procedures. Although the Fund’s valuation procedures are designed to value a security at the price the Fund may reasonably expect to receive upon its sale in an orderly transaction, there can be no assurance that any fair value determination thereunder would, in fact, approximate the amount that the Fund would actually realize upon the sale of the security or the price at which the security would trade if a reliable market price were readily available. During the year ended October 31, 2016, there were no material changes to the fair value methodologies.
Equity and non-equity securities which may be valued in this manner include, but are not limited to: (i) a security for which trading has been halted or suspended; (ii) a debt security that has recently gone into default and for which there is not a current market quotation; (iii) a security of an issuer that has entered into a restructuring; (iv) a security that has been de-listed from a national exchange; (v) a security for which the market price is not readily available from a third party pricing source or, if so provided, does not, in the opinion of the Manager or Subadvisor reflect the security’s market value; (vi) a security subject to trading collars for which no or limited trading takes place; and (vii) a security whose principal market has been temporarily closed at a time when, under normal conditions, it would be open. Securities for which market quotations or observable inputs are not readily available are generally categorized as Level 3 in the hierarchy. As of October 31, 2016, there were no securities held by the Fund that were fair valued in such a manner.
Certain securities held by the Fund may principally trade in foreign markets. Events may occur between the time the foreign markets close and the time at which the Fund’s NAV is calculated. These events may include, but are not limited to, situations relating to a single issuer in a market sector, significant fluctuations in U.S. or foreign markets, natural disasters, armed conflicts, governmental actions or other developments not tied directly to the securities markets. Should the Manager or Subadvisor conclude that such events may have affected the accuracy of the last price of such securities reported on the local foreign market, the Sub-Committee may, pursuant to procedures adopted by the Board, adjust the value of the local price to reflect the estimated impact on the price of such securities as a result of such events. In this instance, securities are generally categorized as Level 3 in the hierarchy. Additionally, certain foreign equity securities are also fair valued whenever the movement of a particular index exceeds certain thresholds. In such cases, the securities are fair valued by applying factors provided by a third party vendor in accordance with valuation procedures adopted by the Board and are generally categorized as Level 2 in the hierarchy. As of October 31, 2016, no foreign equity securities held by the Fund were fair valued in such a manner.
Equity securities and shares of Exchange-Traded Funds (“ETFs”) are valued at the last quoted sales prices as of the close of regular trading on the relevant exchange on each valuation date. Securities that are not traded on the valuation date are valued at the mean of the last quoted bid and ask prices. Prices are normally taken from the principal market in which each security trades. Investments in mutual funds, including money market funds, are valued at their respective NAVs as of the close of the Exchange on the valuation date. These securities are generally categorized as Level 1 in the hierarchy.
Notes to Financial Statements (continued)
Temporary cash investments acquired in excess of 60 days to maturity at the time of purchase are valued using the latest bid prices or using valuations based on a matrix system (which considers such factors as security prices, yields, maturities, and ratings), both as furnished by independent pricing services. Other temporary cash investments which mature in 60 days or less at the time of purchase (“Short-Term Investments”) are valued using the amortized cost method of valuation, unless the use of such method would be inappropriate. The amortized cost method involves valuing a security at its cost on the date of purchase and thereafter assuming a constant amortization to maturity of the difference between such cost and the value on maturity date. Amortized cost approximates the current fair value of a security. Securities valued using the amortized cost method are not valued using quoted prices in an active market and are generally categorized as Level 2 in the hierarchy.
Foreign currency forward contracts are valued at their fair market values measured on the basis of the mean between the last current bid and ask prices based on dealer or exchange quotations and are generally categorized as Level 2 in the hierarchy.
The information above is not intended to reflect an exhaustive list of the methodologies that may be used to value portfolio investments. The valuation procedures permit the use of a variety of valuation methodologies in connection with valuing portfolio investments. The methodology used for a specific type of investment may vary based on the market data available or other considerations. The methodologies summarized above may not represent the specific means by which portfolio investments are valued on any particular business day.
(B) Income Taxes. The Fund’s policy is to comply with the requirements of the Internal Revenue Code of 1986, as amended (the “Internal Revenue Code”), applicable to regulated investment companies and to distribute all of its taxable income to the shareholders of the Fund within the allowable time limits. Therefore, no federal, state and local income tax provisions are required.
Management evaluates the Fund’s tax positions to determine if the tax positions taken meet the minimum recognition threshold in connection with accounting for uncertainties in income tax positions taken or expected to be taken for the purposes of measuring and recognizing tax liabilities in the financial statements. Recognition of tax benefits of an uncertain tax position is permitted only to the extent the position is “more likely than not” to be sustained assuming examination by taxing authorities. Management has analyzed the Fund’s tax positions taken on federal, state and local income tax returns for all open tax years (for up to three tax years), and has concluded that no provisions for federal, state and local income tax are required in the Fund’s financial statements. The Fund’s federal, state and local income and federal excise tax returns for tax years for which the applicable statutes of limitations have not expired are subject to examination by the Internal Revenue Service and state and local departments of revenue.
(C) Foreign Taxes. The Fund may be subject to foreign taxes on income and other transaction-based taxes imposed by certain countries in which it invests. A portion of the taxes on gains on investments or currency purchases/repatriation may be recoverable. The Fund will accrue such taxes and recoveries as applicable, based upon its current interpretation of tax rules and regulations that exist in the markets in which it invests.
The Fund may be subject to taxation on realized capital gains, repatriation proceeds and other transaction-based taxes imposed by certain countries in which it invests. The Fund will accrue such taxes as applicable based upon its current interpretation of tax rules and regulations that exist in the market in which it invests. Capital gains taxes relating to positions still held are reflected as a liability on the Statement of Assets and Liabilities, as well as an adjustment to the Fund’s net unrealized appreciation (depreciation). Taxes related to capital gains realized during the year ended October 31, 2016, if any, are reflected as part of net realized gain (loss) in the Statement of Operations. Changes in tax liabilities related to capital gains taxes on unrealized investment gains, if any, are reflected as part of the change in net unrealized appreciation (depreciation) on investments in the Statement of Operations. Transaction-based charges are generally assessed as a percentage of the transaction amount.
(D) Dividends and Distributions to Shareholders. Dividends and distributions are recorded on the ex-dividend date. The Fund intends to declare and pay dividends from net investment income and distributions from net realized capital and currency gains, if any, at least annually. Unless the shareholder elects otherwise, all dividends and distributions are reinvested in the same class of shares of the Fund, at NAV. Dividends and distributions to shareholders are determined in accordance with federal income tax regulations and may differ from GAAP.
(E) Security Transactions and Investment Income. The Fund records security transactions on the trade date. Realized gains and losses on security transactions are determined using the identified cost method. Dividend income is recognized on the ex-dividend date; net of any foreign tax withheld at the source, and interest income is accrued as earned using the effective interest rate method. Discounts and premiums on securities purchased, other than Short-Term Investments, for the Fund are accreted and amortized, respectively, on the effective interest rate method over the life of the respective securities. Discounts and premiums on Short-Term Investments are accreted and amortized, respectively, on the straight-line method. The straight-line method approximates the effective interest method for Short-Term investments.
Investment income and realized and unrealized gains and losses on investments of the Fund are allocated to separate classes of shares pro rata based upon their relative net assets on the date the income is earned or realized and unrealized gains and losses are incurred.
(F) Expenses. Expenses of the Trust are allocated to the individual Funds in proportion to the net assets of the respective Funds when the expenses are incurred, except where direct allocations of expenses can be made. Expenses (other than transfer agent expenses and fees incurred under the shareholder services plans and/or the distribution plans further discussed in Note 3(B)) are allocated to separate classes of shares pro rata based upon their relative net assets on the date the expenses are incurred. The expenses borne by the Fund, including those of related parties to the Fund, are shown in the Statement of Operations.
(G) Use of Estimates. In preparing financial statements in conformity with GAAP, management makes estimates and assumptions that affect the reported amounts and disclosures in the financial statements. Actual results could differ from those estimates.
| | |
| 24 | | MainStay International Equity Fund |
(H) Repurchase Agreements. The Fund may enter into repurchase agreements to earn income. The Fund may enter into repurchase agreements only with financial institutions that are deemed by the Manager or Subadvisor to be creditworthy, pursuant to guidelines established by the Board. During the term of any repurchase agreement, the Manager or Subadvisor will continue to monitor the creditworthiness of the seller. Under the 1940 Act, repurchase agreements are considered to be collateralized loans by the Fund to the seller secured by the securities transferred to the Fund.
When the Fund enters into repurchase agreements, the Fund’s custodian takes possession of the collateral pledged for investments in the repurchase agreement. The underlying collateral is valued daily on a mark to market basis to determine if the value, including accrued interest, exceeds the repurchase price. In the event of the seller’s default on the obligation to repurchase, the Fund has the right to liquidate the collateral and apply the proceeds in satisfaction of the obligation. Under certain circumstances, such as in the event of default or bankruptcy by the counterparty to the agreement, realization and/or retention of the collateral may be subject to legal proceedings and possible realized loss to the Fund.
(I) Foreign Currency Transactions. The Fund’s books and records are maintained in U.S. dollars. Prices of securities denominated in foreign currency amounts are translated into U.S. dollars at the mean between the buying and selling rates last quoted by any major U.S. bank at the following dates:
| (i) | market value of investment securities, other assets and liabilities—at the valuation date; and |
| (ii) | purchases and sales of investment securities, income and expenses—at the date of such transactions. |
The assets and liabilities that are denominated in foreign currency amounts are presented at the exchange rates and market values at the close of the period. The realized and unrealized changes in net assets arising from fluctuations in exchange rates and market prices of securities are not separately presented.
Net realized gain (loss) on foreign currency transactions represents net gains and losses on foreign currency forward contracts, net currency gains or losses realized as a result of differences between the amounts of securities sale proceeds or purchase cost, dividends, interest and withholding taxes as recorded on the Fund’s books, and the U.S. dollar equivalent amount actually received or paid. Net currency gains or losses from valuing such foreign currency denominated assets and liabilities, other than investments at valuation date exchange rates, are reflected in unrealized foreign exchange gains or losses.
(J) Securities Lending. In order to realize additional income, the Fund may engage in securities lending, subject to the limitations set forth in the 1940 Act and relevant guidance by the staff of the Securities and Exchange Commission (“SEC”). In the event the Fund does engage in securities lending, the Fund will lend through its custodian, State Street Bank and Trust Company (“State Street”). State Street will manage the Fund’s cash collateral in accordance with the lending agreement between the Fund and State Street, and indemnify the Fund against counterparty risk. The loans will be collateralized by cash or securities at least equal at all times to the market value of the securities
loaned. Collateral will consist of U.S. government securities, cash equivalents or irrevocable letters of credit. The Fund may bear the risk of delay in recovery of, or loss of rights in, the securities loaned should the borrower of the securities experience financial difficulty. The Fund may also record a realized gain or loss on securities deemed sold due to a borrower’s inability to return securities on loan. The Fund bears the risk of any loss on investment of the collateral. The Fund will receive compensation for lending its securities in the form of fees or it will retain a portion of interest on the investment of any cash received as collateral. The Fund will also continue to receive interest and dividends on the securities loaned and any gain or loss in the market price of the securities loaned that may occur during the term of the loan will be for the account of the Fund. During the year ended October 31, 2016, the Fund did not have any portfolio securities on loan.
(K) Risk. The Fund invests in foreign securities, which carry certain risks that are in addition to the usual risks inherent in domestic securities. These risks include those resulting from currency fluctuations, future adverse political or economic developments and possible imposition of currency exchange blockages or other foreign governmental laws or restrictions. These risks are likely to be greater in emerging markets than in developed markets. The ability of issuers of securities held by the Fund to meet their obligations may be affected by economic and political developments in a specific country, industry or region.
(L) Indemnifications. Under the Trust’s organizational documents, its officers and trustees are indemnified against certain liabilities that may arise out of performance of their duties to the Trust. Additionally, in the normal course of business, the Fund enters into contracts with third-party service providers that contain a variety of representations and warranties and which may provide general indemnifications. The Fund’s maximum exposure under these arrangements is unknown, as this would involve future claims that may be made against the Fund that have not yet occurred. Based on experience, management is of the view that the risk of loss in connection with these potential indemnification obligations is remote. However, there can be no assurance that material liabilities related to such obligations will not arise in the future, which could adversely impact the Fund.
Note 3–Fees and Related Party Transactions
(A) Manager and Subadvisor. New York Life Investments, a registered investment adviser and an indirect, wholly-owned subsidiary of New York Life Insurance Company (“New York Life”), serves as the Fund’s Manager, pursuant to an Amended and Restated Management Agreement (“Management Agreement”). The Manager provides offices, conducts clerical, recordkeeping and bookkeeping services, and keeps most of the financial and accounting records required to be maintained by the Fund. Except for the portion of salaries and expenses that are the responsibility of the Fund, the Manager pays the salaries and expenses of all personnel affiliated with the Fund and certain operational expenses of the Fund. The Fund reimburses New York Life Investments in an amount equal to a portion of the compensation of the Chief Compliance Officer of the Fund. Cornerstone Capital Management Holdings LLC (“Cornerstone Holdings” or “Subadvisor”), a registered investment adviser and an indirect, wholly-owned subsidiary of New York Life, serves as Subadvisor to the Fund and is responsible for the day-to-day
Notes to Financial Statements (continued)
portfolio management of the Fund. Pursuant to the terms of an amended and restated Subadvisory Agreement (“Subadvisory Agreement”) between New York Life Investments and Cornerstone Holdings, New York Life Investments pays for the services of the Subadvisor.
Under the Management Agreement, the Fund pays the Manager a monthly fee for services performed and facilities furnished at an annual rate of the Fund’s average daily net assets as follows: 0.89% up to $500 million and 0.85% in excess of $500 million.
During the year ended October 31, 2016, the effective management fee rate (exclusive of any applicable waivers/reimbursements) was 0.89%.
New York Life Investments has voluntarily agreed to waive fees and/or reimburse expenses so that Total Annual Fund Operating Expenses of a class do not exceed the following percentages of average daily net assets: Investor Class, 1.85%; Class B, 2.60%; and Class C, 2.60%. These voluntary waivers or reimbursements may be discontinued at any time. Total Annual Fund Operating Expenses excludes taxes, interest, litigation, extraordinary expenses, brokerage and other transaction expenses relating to the purchase or sale of portfolio investments, and acquired (underlying) fund fees and expenses.
During the year ended October 31, 2016, New York Life Investments earned fees from the Fund in the amount of $2,771,378.
State Street provides sub-administration and sub-accounting services to the Fund pursuant to an agreement with New York Life Investments. These services include calculating the daily NAVs of the Fund, maintaining the general ledger and sub-ledger accounts for the calculation of the Fund’s NAVs, and assisting New York Life Investments in conducting various aspects of the Fund’s administrative operations. For providing these services to the Fund, State Street is compensated by New York Life Investments.
(B) Distribution, Service and Shareholder Service Fees. The Trust, on behalf of the Fund, has entered into a distribution agreement with NYLIFE Distributors LLC (the “Distributor”), an indirect, wholly-owned subsidiary of New York Life. The Fund has adopted distribution plans (the ‘‘Plans’’) in accordance with the provisions of Rule 12b-1 under the 1940 Act.
Pursuant to the Class A, Investor Class and Class R2 Plans, the Distributor receives a monthly distribution fee from the Class A, Investor Class and Class R2 shares at an annual rate of 0.25% of the average daily net assets of the Class A, Investor Class and Class R2 shares for distribution and/or service activities as designated by the Distributor. Pursuant to the Class B and Class C Plans, Class B and Class C shares pay the Distributor a monthly distribution fee at an annual rate of 0.75% of the average daily net assets of the Class B and Class C shares, along with a service fee at an annual rate of 0.25% of the average daily net assets of the Class B and Class C shares, for a total 12b-1 fee of 1.00%. Pursuant to the Class R3 Plan, the Distributor receives a monthly distribution and/or service fee from the Class R3 shares at an annual rate of 0.50% of the average daily net assets of the Class R3 shares. Class I and Class R1 shares are not subject to a distribution and/or service fee.
The Plans provide that the distribution and service fees are payable to the Distributor regardless of the amounts actually expended by the Distributor for distribution of the Fund’s shares and service activities.
In accordance with the Shareholder Services Plans for the Class R1, Class R2 and Class R3 shares, the Manager has agreed to provide, through its affiliates or independent third parties, various shareholder and administrative support services to shareholders of the Class R1, Class R2 and Class R3 shares. For its services, the Manager, its affiliates, or independent third party service providers are entitled to a shareholder service fee accrued daily and paid monthly at an annual rate of 0.10% of the average daily net assets of the Class R1, Class R2 and Class R3 shares. This is in addition to any fees paid under a distribution plan, where applicable.
During the year ended October 31, 2016, shareholder service fees incurred by the Fund were as follows:
| | | | |
Class R1 | | $ | 2,781 | |
Class R2 | | | 1,210 | |
Class R3 | | | 1,087 | |
(C) Sales Charges. During the year ended October 31, 2016, the Fund was advised by the Distributor that the amount of initial sales charges retained on sales of Class A and Investor Class shares were $2,748 and $7,317, respectively. During the year ended October 31, 2016, the Fund was also advised that the Distributor retained CDSCs on redemptions of Class A, Investor Class, Class B and Class C shares of $132, $4, $13,952 and $873, respectively.
(D) Transfer, Dividend Disbursing and Shareholder Servicing Agent. NYLIM Service Company LLC, an affiliate of New York Life Investments, is the Fund’s transfer, dividend disbursing and shareholder servicing agent pursuant to an agreement between NYLIM Service Company LLC and the Trust. NYLIM Service Company LLC has entered into an agreement with Boston Financial Data Services, Inc. (“BFDS”) pursuant to which BFDS performs certain transfer agent services on behalf of NYLIM Service Company LLC. During the year ended October 31, 2016, transfer agent expenses incurred by the Fund were as follows:
| | | | |
Class A | | $ | 31,760 | |
Investor Class | | | 145,995 | |
Class B | | | 34,496 | |
Class C | | | 37,431 | |
Class I | | | 150,365 | |
Class R1 | | | 1,970 | |
Class R2 | | | 853 | |
Class R3 | | | 770 | |
(E) Small Account Fee. Shareholders with small accounts adversely impact the cost of providing transfer agency services. In an effort to reduce total transfer agency expenses, the Fund has implemented a small account fee on certain types of accounts. Certain shareholders with an account balance of less than $1,000 are charged an annual per account fee of $20 (assessed semi-annually), the proceeds from which offset transfer agent fees as reflected in the Statement of Operations.
| | |
| 26 | | MainStay International Equity Fund |
(F) Capital. As of October 31, 2016, New York Life and its affiliates beneficially held shares of the Fund with values and percentages of net assets as follows:
| | | | | | | | |
Class I | | $ | 66,581,169 | | | | 37.1 | % |
Note 4–Federal Income Tax
As of October 31, 2016, the components of accumulated gain (loss) on a tax basis were as follows:
| | | | | | | | | | | | | | | | |
Ordinary
Income | | Accumulated
Capital and
Other Gain
(Loss) | | | Other
Temporary
Differences | | | Unrealized
Appreciation
(Depreciation) | | | Total
Accumulated Gain (Loss) | |
$1,059,830 | | $ | (66,878,629 | ) | | $ | (17,483 | ) | | $ | 23,278,378 | | | $ | (42,557,904 | ) |
The difference between book-basis and tax-basis unrealized appreciation (depreciation) is primarily due to wash sale adjustments and Passive Foreign Investment Company (PFIC) adjustments. The other temporary differences are primarily due to foreign taxes payable.
The following table discloses the current year reclassifications between undistributed net investment income (loss), accumulated net realized gain (loss) on investments, and additional paid-in capital arising from permanent differences; net assets as of October 31, 2016 were not affected.
| | | | | | | | |
Undistributed Net Investment Income (Loss) | | Accumulated
Net Realized
Gain (Loss) on
Investments | | | Additional
Paid-In
Capital | |
| $(326,444) | | $ | 326,444 | | | $ | — | |
The reclassifications for the Fund are primarily due to foreign currency transactions and PFIC adjustments.
Under the Regulated Investment Company Modernization Act of 2010, the Fund is permitted to carry forward capital losses incurred in taxable years beginning after December 22, 2010, for an unlimited period. However, any losses incurred during those future years will be required to be utilized prior to the losses incurred in pre-enactment tax years. As a result of this ordering rule, pre-enactment capital loss carryforwards may be more likely to expire unused. Additionally, post-enactment capital losses that are carried forward will retain their character as either short-term or long-term capital losses rather than being considered all short-term as under previous law.
As of October 31, 2016, for federal income tax purposes, capital loss carryforwards of $66,878,629 were available as shown in the table below, to the extent provided by the regulations to offset future realized gains of the Fund through the years indicated. To the extent that these capital loss carryforwards are used to offset future realized gains, it is probable that the capital gains so offset will not be distributed to shareholders. No capital gain distributions shall be made until any capital loss carryforwards have been fully utilized or expired.
| | | | | | | | |
Capital Loss
Available Through | | Short-Term
Capital Loss
Amounts (000’s) | | | Long-Term
Capital Loss
Amounts (000’s) | |
| 2017 | | $ | 31,286 | | | $ | — | |
| 2019 | | | 35,593 | | | | — | |
| Total | | $ | 66,879 | | | $ | — | |
The Fund utilized $17,488,395 of capital loss carryforwards during the year ended October 31, 2016.
During the years ended October 31, 2016 and October 31, 2015, the tax character of distributions paid as reflected in the Statements of Changes in Net Assets was as follows:
| | | | | | | | |
| | | 2016 | | | 2015 | |
Distributions paid from: | | | | | | | | |
Ordinary Income | | $ | 680,155 | | | $ | 2,559,821 | |
Note 5–Custodian
State Street is the custodian of cash and securities held by the Fund. Custodial fees are charged to the Fund based on the Fund’s net assets and/or the market value of securities held by the Fund and the number of certain transactions incurred by the Fund.
Note 6–Line of Credit
The Fund and certain other funds managed by New York Life Investments, maintain a line of credit with a syndicate of banks in order to secure a source of funds for temporary purposes to meet unanticipated or excessive redemption requests.
Effective August 2, 2016, under an amended and restated credit agreement (the “Credit Agreement”), the aggregate commitment amount is $600,000,000 with an additional uncommitted amount of $100,000,000. The commitment fee is an annual rate of 0.15% of the average commitment amount payable quarterly, regardless of usage, to Bank of New York Mellon, who serves as the agent to the syndicate. The commitment fee is allocated among the Fund and certain affiliated funds based upon their respective net assets and other factors. Interest on any revolving credit loan is charged based upon the Federal Funds Advances Rate or the one month London InterBank Offered Rate, whichever is higher. The Credit Agreement expires on August 1, 2017, although the Fund, certain affiliated funds and the syndicate of banks may renew the Credit Agreement for an additional year on the same or different terms. Prior to August 2, 2016, the aggregate commitment amount was $600,000,000 with an additional uncommitted amount of $100,000,000, and the commitment fee was at an annual rate of 0.10% of the average commitment amount. During the year ended October 31, 2016, there were no borrowings made or outstanding with respect to the Fund under the Credit Agreement.
Note 7–Interfund Lending Program
Pursuant to an exemptive order issued by the SEC, the Fund, along with certain other funds managed by New York Life Investments, may participate in an interfund lending program. The interfund lending program provides an alternate credit facility that permits the Fund and certain other funds managed by New York Life Investments to lend or borrow money for temporary purposes directly to or from one another, subject to the conditions of the exemptive order. During the year ended October 31, 2016, there were no interfund loans made or outstanding with respect to the Fund.
Notes to Financial Statements (continued)
Note 8–Purchases and Sales of Securities (in 000’s)
During the year ended October 31, 2016, purchases and sales of securities, other than short-term securities, were $99,891 and $140,449, respectively.
Note 9–Capital Share Transactions
| | | | | | | | |
Class A | | Shares | | | Amount | |
Year ended October 31, 2016: | | | | | | | | |
Shares sold | | | 682,885 | | | $ | 9,152,419 | |
Shares issued to shareholders in reinvestment of dividends and distributions | | | 1,533 | | | | 20,613 | |
Shares redeemed | | | (905,522 | ) | | | (12,201,735 | ) |
| | | | |
Net increase (decrease) in shares outstanding before conversion | | | (221,104 | ) | | | (3,028,703 | ) |
Shares converted into Class A (See Note 1) | | | 124,559 | | | | 1,701,280 | |
Shares converted from Class A (See Note 1) | | | (16,464 | ) | | | (217,568 | ) |
| | | | |
Net increase (decrease) | | | (113,009 | ) | | $ | (1,544,991 | ) |
| | | | |
Year ended October 31, 2015: | | | | | | | | |
Shares sold | | | 302,518 | | | $ | 4,092,444 | |
Shares issued to shareholders in reinvestment of dividends and distributions | | | 23,755 | | | | 309,772 | |
Shares redeemed | | | (624,933 | ) | | | (8,392,693 | ) |
| | | | |
Net increase (decrease) in shares outstanding before conversion | | | (298,660 | ) | | | (3,990,477 | ) |
Shares converted into Class A (See Note 1) | | | 74,760 | | | | 1,029,344 | |
Shares converted from Class A (See Note 1) | | | (63,497 | ) | | | (819,811 | ) |
| | | | |
Net increase (decrease) | | | (287,397 | ) | | $ | (3,780,944 | ) |
| | | | |
| | |
| | | | | | | | |
Investor Class | | Shares | | | Amount | |
Year ended October 31, 2016: | | | | | | | | |
Shares sold | | | 120,057 | | | $ | 1,600,542 | |
Shares redeemed | | | (308,815 | ) | | | (4,142,432 | ) |
| | | | |
Net increase (decrease) in shares outstanding before conversion | | | (188,758 | ) | | | (2,541,890 | ) |
Shares converted into Investor Class
(See Note 1) | | | 100,778 | | | | 1,352,914 | |
Shares converted from Investor Class (See Note 1) | | | (113,873 | ) | | | (1,551,578 | ) |
| | | | |
Net increase (decrease) | | | (201,853 | ) | | $ | (2,740,554 | ) |
| | | | |
Year ended October 31, 2015: | | | | | | | | |
Shares sold | | | 195,518 | | | $ | 2,668,808 | |
Shares issued to shareholders in reinvestment of dividends and distributions | | | 9,279 | | | | 120,881 | |
Shares redeemed | | | (400,764 | ) | | | (5,396,160 | ) |
| | | | |
Net increase (decrease) in shares outstanding before conversion | | | (195,967 | ) | | | (2,606,471 | ) |
Shares converted into Investor Class
(See Note 1) | | | 176,655 | | | | 2,322,611 | |
Shares converted from Investor Class (See Note 1) | | | (62,066 | ) | | | (856,812 | ) |
| | | | |
Net increase (decrease) | | | (81,378 | ) | | $ | (1,140,672 | ) |
| | | | |
| | |
| | | | | | | | |
| | | | | | | | |
Class B | | Shares | | | Amount | |
Year ended October 31, 2016: | | | | | | | | |
Shares sold | | | 87,362 | | | $ | 1,061,625 | |
Shares redeemed | | | (138,782 | ) | | | (1,685,117 | ) |
| | | | |
Net increase (decrease) in shares outstanding before conversion | | | (51,420 | ) | | | (623,492 | ) |
Shares converted from Class B (See Note 1) | | | (105,505 | ) | | | (1,285,048 | ) |
| | | | |
Net increase (decrease) | | | (156,925 | ) | | $ | (1,908,540 | ) |
| | | | |
Year ended October 31, 2015: | | | | | | | | |
Shares sold | | | 108,404 | | | $ | 1,336,817 | |
Shares redeemed | | | (164,147 | ) | | | (2,014,384 | ) |
| | | | |
Net increase (decrease) in shares outstanding before conversion | | | (55,743 | ) | | | (677,567 | ) |
Shares converted from Class B (See Note 1) | | | (138,057 | ) | | | (1,675,332 | ) |
| | | | |
Net increase (decrease) | | | (193,800 | ) | | $ | (2,352,899 | ) |
| | | | |
| | |
| | | | | | | | |
Class C | | Shares | | | Amount | |
Year ended October 31, 2016: | | | | | | | | |
Shares sold | | | 166,359 | | | $ | 1,959,543 | |
Shares redeemed | | | (195,770 | ) | | | (2,387,072 | ) |
| | | | |
Net increase (decrease) | | | (29,411 | ) | | $ | (427,529 | ) |
| | | | | | | | |
Year ended October 31, 2015: | | | | | | | | |
Shares sold | | | 135,870 | | | $ | 1,677,175 | |
Shares redeemed | | | (161,511 | ) | | | (1,962,676 | ) |
| | | | |
Net increase (decrease) | | | (25,641 | ) | | $ | (285,501 | ) |
| | | | |
| | |
| | | | | | | | |
Class I | | Shares | | | Amount | |
Year ended October 31, 2016: | | | | | | | | |
Shares sold | | | 1,821,203 | | | $ | 24,276,645 | |
Shares issued to shareholders in reinvestment of dividends and distributions | | | 48,253 | | | | 651,422 | |
Shares redeemed | | | (5,189,521 | ) | | | (71,048,636 | ) |
| | | | |
Net increase (decrease) | | | (3,320,065 | ) | | $ | (46,120,569 | ) |
| | | | |
Year ended October 31, 2015: | | | | | | | | |
Shares sold | | | 4,094,035 | | | $ | 54,177,807 | |
Shares issued to shareholders in reinvestment of dividends and distributions | | | 157,158 | | | | 2,057,192 | |
Shares redeemed | | | (4,713,469 | ) | | | (63,115,495 | ) |
| | | | |
Net increase (decrease) | | | (462,276 | ) | | $ | (6,880,496 | ) |
| | | | |
| | |
| | | | | | | | |
Class R1 | | Shares | | | Amount | |
Year ended October 31, 2016: | | | | | | | | |
Shares sold | | | 4,825 | | | $ | 65,501 | |
Shares issued to shareholders in reinvestment of dividends and distributions | | | 395 | | | | 5,305 | |
Shares redeemed | | | (46,398 | ) | | | (630,744 | ) |
| | | | |
Net increase (decrease) | | | (41,178 | ) | | $ | (559,938 | ) |
| | | | |
Year ended October 31, 2015: | | | | | | | | |
Shares sold | | | 5,528 | | | $ | 73,763 | |
Shares issued to shareholders in reinvestment of dividends and distributions | | | 2,356 | | | | 30,669 | |
Shares redeemed | | | (57,830 | ) | | | (764,078 | ) |
| | | | |
Net increase (decrease) | | | (49,946 | ) | | $ | (659,646 | ) |
| | | | |
| | |
| | | | | | | | |
| | |
| 28 | | MainStay International Equity Fund |
| | | | | | | | |
Class R2 | | Shares | | | Amount | |
Year ended October 31, 2016: | | | | | | | | |
Shares sold | | | 12,594 | | | $ | 168,776 | |
Shares issued to shareholders in reinvestment of dividends and distributions | | | — | | | | — | |
Shares redeemed | | | (120,810 | ) | | | (1,618,498 | ) |
| | | | |
Net increase (decrease) | | | (108,216 | ) | | $ | (1,449,722 | ) |
| | | | |
Year ended October 31, 2015: | | | | | | | | |
Shares sold | | | 42,772 | | | $ | 579,450 | |
Shares issued to shareholders in reinvestment of dividends and distributions | | | 1,329 | | | | 17,371 | |
Shares redeemed | | | (140,321 | ) | | | (1,905,460 | ) |
| | | | |
Net increase (decrease) | | | (96,220 | ) | | $ | (1,308,639 | ) |
| | | | |
| | |
| | | | | | | | |
Class R3 | | Shares | | | Amount | |
Year ended October 31, 2016: | | | | | | | | |
Shares sold | | | 16,664 | | | $ | 218,907 | |
Shares issued to shareholders in reinvestment of dividends and distributions | | | — | | | | — | |
Shares redeemed | | | (23,564 | ) | | | (321,733 | ) |
| | | | |
Net increase (decrease) | | | (6,900 | ) | | $ | (102,826 | ) |
| | | | |
Year ended October 31, 2015: | | | | | | | | |
Shares sold | | | 17,470 | | | $ | 235,111 | |
Shares issued to shareholders in reinvestment of dividends and distributions | | | 260 | | | | 3,390 | |
Shares redeemed | | | (27,157 | ) | | | (358,868 | ) |
| | | | |
Net increase (decrease) | | | (9,427 | ) | | $ | (120,367 | ) |
| | | | |
Note 10–Recent Accounting Pronouncement
In October 2016, the U.S. Securities and Exchange Commission adopted new rules and amended existing rules (together, “final rules”) intended to modernize the reporting and disclosure of information by registered
investment companies. In part, the final rules amend Regulation S-X and require standardized, enhanced disclosure about derivatives in investment company financial statements, as well as other amendments. The compliance date for the amendments to Regulation S-X is August 1, 2017. Management is currently evaluating the impact that the adoption of the amendments to Regulation S-X will have on the Fund’s financial statements and related disclosures.
Note 11–Subsequent Events
In connection with the preparation of the financial statements of the Fund as of and for the fiscal year ended October 31, 2016, events and transactions subsequent to October 31, 2016, through the date the financial statements were issued have been evaluated by the Fund’s management for possible adjustment and/or disclosure. No subsequent events requiring financial statement adjustment or disclosure have been identified other than the following:
Effective February 28, 2017, Class B shares of the MainStay Group of Funds will be closed to all new purchases as well as additional investments by existing Class B shareholders. Existing Class B shareholders may continue to reinvest dividends and capital gains distributions, as well as exchange their Class B shares for Class B shares of other Funds as permitted by the current exchange privileges. Class B shareholders will continue to be subject to any applicable contingent deferred sales charge at the time of redemption. All other features of the Class B shares, including but not limited to the fees and expenses applicable to Class B shares, will remain unchanged. Unless redeemed, Class B Shares shareholders will remain in Class B shares of their respective Fund until the Class B shares are converted to Class A or Investor Class shares pursuant to the applicable conversion schedule.
Report of Independent Registered Public Accounting Firm
The Board of Trustees and Shareholders of
The MainStay Funds:
We have audited the accompanying statement of assets and liabilities, including the portfolio of investments, of the MainStay International Equity Fund (the “Fund”), one of the funds constituting The MainStay Funds, as of October 31, 2016, and the related statement of operations for the year then ended, the statements of changes in net assets for each of the years in the two-year period then ended, and the financial highlights for each of the years in the five-year period then ended. These financial statements and financial highlights are the responsibility of the Fund’s management. Our responsibility is to express an opinion on these financial statements and financial highlights based on our audits.
We conducted our audits in accordance with the standards of the Public Company Accounting Oversight Board (United States). Those standards require that we plan and perform the audit to obtain reasonable assurance about whether the financial statements and financial highlights are free of material misstatement. An audit includes examining, on a test basis, evidence supporting the amounts and disclosures in the financial statements. Our procedures included confirmation of securities owned as of October 31, 2016, by correspondence with the custodian and brokers or by other appropriate auditing procedures where replies from brokers were not received. An audit also includes assessing the accounting principles used and significant estimates made by management, as well as evaluating the overall financial statement presentation. We believe that our audits provide a reasonable basis for our opinion.
In our opinion, the financial statements and financial highlights referred to above present fairly, in all material respects, the financial position of the MainStay International Equity Fund of The MainStay Funds as of October 31, 2016, the results of its operations for the year then ended, the changes in its net assets for each of the years in the two-year period then ended, and the financial highlights for each of the years in the five-year period then ended, in conformity with U.S. generally accepted accounting principles.

Philadelphia, Pennsylvania
December 22, 2016
| | |
| 30 | | MainStay International Equity Fund |
Federal Income Tax Information
(Unaudited)
The Fund is required under the Internal Revenue Code to advise shareholders in a written statement as to the federal tax status of dividends paid by the Fund during such fiscal years.
For the fiscal year ended October 31, 2016, the Fund designated approximately $974,214 under the Internal Revenue Code as qualified dividend income eligible for reduced tax rates.
In accordance with federal tax law, the Fund elects to provide each shareholder with their portion of the Fund’s foreign taxes paid and the income sourced from foreign countries. Accordingly, the Fund made the following designations regarding its fiscal year ended October 31, 2016:
| • | | the total amount of taxes paid to foreign countries was $294,059 |
| • | | the total amount of income sourced from foreign countries was $5,256,678 |
In February 2017, shareholders will receive an IRS Form 1099-DIV or substitute Form 1099 which will show the federal tax status of the distributions received by shareholders in calendar year 2016. The amounts that will be reported on such 1099-DIV or substitute Form 1099 will be the amounts you are to use on your federal income tax return and will differ from the amounts which we must report for the Fund’s fiscal year ended October 31, 2016.
Proxy Voting Policies and Procedures and Proxy Voting Record
A description of the policies and procedures that New York Life Investments uses to vote proxies related to the Fund’s securities is available without charge, upon request, (i) by visiting the Fund’s website at mainstayinvestments.com; or (ii) on the SEC’s website at www.sec.gov.
The Fund is required to file with the SEC its proxy voting record for the 12-month period ending June 30 on Form N-PX. The Fund’s most recent Form N-PX or proxy voting record is available free of charge upon request (i) by calling 800-MAINSTAY (624-6782); (ii) by visiting the Fund’s website at mainstayinvestments.com; or (iii) on the SEC’s website at www.sec.gov.
Shareholder Reports and Quarterly Portfolio Disclosure
The Fund is required to file its complete schedule of portfolio holdings with the SEC for its first and third fiscal quarters on Form N-Q. The Fund’s Form N-Q is available without charge on the SEC’s website at www.sec.gov or by calling MainStay Investments at 800-MAINSTAY (624-6782). You also can obtain and review copies of Form N-Q by visiting the SEC’s Public Reference Room in Washington, DC (information on the operation of the Public Reference Room may be obtained by calling 1-800-SEC-0330).
Board of Trustees and Officers (Unaudited)
The Trustees and officers of the Funds are listed below. The Board oversees the MainStay Group of Funds, MainStay VP Funds Trust, MainStay DefinedTerm Municipal Opportunities Fund, the Manager and the Subadvisors, and elects the officers of the Funds who are responsible for the day-to-day operations of the Funds. Information pertaining to the Trustees and officers is set forth below. Each Trustee serves until his or her successor is elected and qualified or until his or her resignation, death or removal. Under the Retirement Policy, a Trustee must
tender his or her resignation by the end of the calendar year during which he or she reaches the age of 75 (although the Board of Trustees may make exceptions from time to time). Officers serve a term of one year and are elected annually by the Board of Trustees. The business address of each Trustee and officer listed below is 51 Madison Avenue, New York, New York 10010. A majority of the Trustees are not “interested persons” (as defined by the 1940 Act and rules “adopted” by the SEC thereunder) of the Fund (“Independent Trustees”).
| | | | | | | | | | | | |
| | | | | Name and Date of Birth | | Term of Office, Position(s) Held and Length of Service | | Principal Occupation(s) During Past Five Years | | Number of
Portfolios in
Fund Complex
Overseen by
Board Member | | Other Directorships Held By Board Member |
Interested Trustee | | | | Christopher O. Blunt* 5/13/62 | | MainStay Funds: Trustee since January 2016; MainStay Funds Trust: Trustee since January 2016. | | Executive Vice President (since 2009), President, Investments Group (since 2015), Member of the Executive Management Committee (since 2007), Co-President, Insurance and Agency Group (2012 to 2015), President, Insurance Group (2012 to 2014), Executive Vice President, Retirement Income Security (2008 to 2012), New York Life Insurance Company. | | 83 | | MainStay VP Funds Trust:
Trustee since January 2016 (31 portfolios); and
MainStay DefinedTerm Municipal Opportunities Fund: Trustee since January 2016. |
| | * | This Trustee is considered to be an “interested person” of the MainStay Group of Funds within the meaning of the 1940 Act because of his affiliation with New York Life Insurance Company, New York Life Investment Management LLC, Cornerstone Capital Management Holdings LLC, MacKay Shields LLC, Institutional Capital LLC, NYL Investors LLC, NYLIFE Securities LLC and/or NYLIFE Distributors LLC, as described in detail above in the column entitled “Principal Occupation(s) During Past Five Years.” |
| | |
| 32 | | MainStay International Equity Fund |
| | | | | | | | | | | | |
| | | | | Name and Date of Birth | | Term of Office, Position(s) Held and Length of Service | | Principal Occupation(s) During Past Five Years | | Number of Portfolios in Fund Complex Overseen by Board Member | | Other Directorships Held By Board Member |
| Non-Interested Trustee | | | | David H. Chow 12/29/57 | | MainStay Funds: Trustee since January 2016, Advisory Board Member (June 2015 to December 2015); MainStay Funds Trust: Trustee since January 2016, Advisory Board Member (June 2015 to December 2015). | | Founder and CEO, DanCourt Management, LLC (since 1999) | | 83 | | MainStay VP Funds Trust: Trustee since January 2016, Advisory Board Member (June 2015 to December 2015); (31 portfolios);
MainStay DefinedTerm Municipal Opportunities Fund: Trustee since January 2016, Advisory Board Member (June 2015 to December 2015);
Market Vectors Group of Exchange-Traded Funds: Independent Chairman of the Board of Trustees since 2008 and Trustee since 2006 (55 portfolios); and
Berea College of Kentucky: Trustee since 2009. |
| | | | Susan B. Kerley 8/12/51 | | MainStay Funds: Trustee since 2007; MainStay Funds Trust: Trustee since 1990.*** | | President, Strategic Management Advisors LLC (since 1990) | | 83 | | MainStay VP Funds Trust: Trustee since 2007 (31 portfolios)**;
MainStay DefinedTerm Municipal Opportunities Fund: Trustee since 2011; and Legg Mason Partners Funds: Trustee since 1991 (53 portfolios). |
| | | | Alan R. Latshaw 3/27/51 | | MainStay Funds: Trustee and Audit Committee Financial Expert since 2006; MainStay Funds Trust: Trustee and Audit Committee Financial Expert since 2007.*** | | Retired; Partner, Ernst & Young LLP (2002 to 2003); Partner, Arthur Andersen LLP (1989 to 2002); Consultant to the MainStay Funds Audit and Compliance Committee (2004 to 2006) | | 83 | | MainStay VP Funds Trust: Trustee and Audit Committee Financial Expert since 2007 (31 portfolios)**;
MainStay DefinedTerm Municipal Opportunities Fund: Trustee and Audit Committee Financial Expert since 2011;
State Farm Associates Funds Trusts: Trustee since 2005 (4 portfolios);
State Farm Mutual Fund Trust: Trustee since 2005 (15 portfolios); and
State Farm Variable Product Trust: Trustee since 2005 (9 portfolios). |
| | | | Peter Meenan 12/5/41 | | MainStay Funds: Chairman since 2013 and Trustee since 2007; MainStay Funds Trust: Chairman since 2013 and Trustee since 2002.*** | | Retired; Independent Consultant (2004 to 2013); President and Chief Executive Officer, Babson—United, Inc. (financial services firm) (2000 to 2004); Independent Consultant (1999 to 2000); Head of Global Funds, Citicorp (1995 to 1999) | | 83 | | MainStay VP Funds Trust: Chairman since 2013 and Trustee since 2007 (31 portfolios)**; and
MainStay DefinedTerm Municipal Opportunities Fund: Chairman since 2013 and Trustee since 2011. |
| | | | Richard H. Nolan, Jr. 11/16/46 | | MainStay Funds: Trustee since 2007; MainStay Funds Trust: Trustee since 2007.*** | | Managing Director, ICC Capital Management (since 2004); President—Shields/Alliance, Alliance Capital Management (1994 to 2004) | | 83 | | MainStay VP Funds Trust: Trustee since 2006 (31 portfolios)**; and
MainStay DefinedTerm Municipal Opportunities Fund: Trustee since 2011. |
| | | | Jacques P. Perold 5/12/58 | | MainStay Funds: Trustee since January 2016, Advisory Board Member (June 2015 to December 2015); MainStay Funds Trust: Trustee since January 2016, Advisory Board Member (June 2015 to December 2015). | | Retired; President, Fidelity Management & Research Company (2009 to 2014); Founder, President and Chief Executive Officer, Geode Capital Management, LCC (2001 to 2009) | | 83 | | MainStay VP Funds Trust: Trustee since January 2016, Advisory Board Member (June 2015 to December 2015); (31 portfolios);
MainStay DefinedTerm Municipal Opportunities Fund: Trustee since January 2016, Advisory Board Member (June 2015 to December 2015);
Allstate Corporation: Director since 2015; and
Boston University: Trustee since 2014. |
| | | | | | | | | | | | |
| | | | | Name and Date of Birth | | Term of Office, Position(s) Held and Length of Service | | Principal Occupation(s) During Past Five Years | | Number of Portfolios in Fund Complex Overseen by Board Member | | Other Directorships Held By Board Member |
Non-Interested Trustee | | | | Richard S. Trutanic 2/13/52 | | MainStay Funds: Trustee since 1994; MainStay Funds Trust: Trustee since 2007.*** | | Chairman and Chief Executive Officer, Somerset & Company (financial advisory firm) (since 2004); Managing Director, The Carlyle Group (private investment firm) (2002 to 2004); Senior Managing Director, Partner and Board Member, Groupe Arnault S.A. (private investment firm) (1999 to 2002) | | 83 | | MainStay VP Funds Trust: Trustee since 2007 (31 portfolios)**; and
MainStay DefinedTerm Municipal Opportunities Fund: Trustee since 2011. |
| | | | John A. Weisser**** 10/22/41 | | MainStay Funds: Trustee since 2007; MainStay Funds Trust: Trustee since 2007.*** | | Retired; Managing Director of Salomon Brothers, Inc. (1971 to 1995) | | 83 | | MainStay VP Funds Trust: Trustee since 1997 (31 portfolios)**; MainStay DefinedTerm Municipal Opportunities Fund: Trustee since 2011; Direxion Insurance Trust: Trustee since 2007 (1 portfolio); Direxion Funds: Trustee since 2007 (18 portfolios); and Direxion Shares ETF Trust: Trustee since 2008 (52 portfolios). |
| | ** | Includes prior service as a Director of MainStay VP Series Fund, Inc., the predecessor to MainStay VP Funds Trust. |
| | *** | Includes prior service as a Director/Trustee of certain predecessor entities to MainStay Funds Trust. |
| | **** | Pursuant to the Retirement Policy, Mr. Weisser will retire from the Board of Trustees on or about December 31, 2016. |
| | |
| 34 | | MainStay International Equity Fund |
| | | | | | | | |
| | | | | Name and Date of Birth | | Position(s) Held and Length of Service | | Principal Occupation(s) During Past Five Years |
Officers (Who Are Not Board Members)* | | | | Stephen P. Fisher 2/22/59 | | President, MainStay Funds (since 2007), MainStay Funds Trust (since 2009) | | Chairman and Chief Executive Officer (since 2014), President and Chief Operating Officer (2008 to 2013), NYLIFE Distributors LLC; Chairman of the Board, NYLIM Service Company LLC (since 2008); President (since May 2015), Co-President (2014 to 2015) and Senior Managing Director (since 2005), New York Life Investment Management LLC; President, MainStay DefinedTerm Municipal Opportunities Fund (since 2011) and MainStay VP Funds Trust (since 2007)** |
| | | | Jack R. Benintende 5/12/64 | | Treasurer and Principal Financial and Accounting Officer, MainStay Funds (since 2007), MainStay Funds Trust (since 2009) | | Managing Director, New York Life Investment Management LLC (since 2007); Treasurer and Principal Financial and Accounting Officer, MainStay DefinedTerm Municipal Opportunities Fund (since 2011) and MainStay VP Funds Trust (since 2007)**; and Assistant Treasurer, New York Life Investment Management Holdings LLC (2008 to 2012) |
| | | | Kevin M. Bopp 2/24/69 | | Vice President and Chief Compliance Officer, MainStay Funds and MainStay Funds Trust (since 2014) | | Chief Compliance Officer (since January 2016), Director and Associate General Counsel (2011 to 2014) and Vice President and Assistant General Counsel (2010 to 2011), New York Life Investment Management LLC; Vice President and Chief Compliance Officer, MainStay VP Funds Trust, MainStay DefinedTerm Municipal Opportunities Fund (since 2014); Assistant Secretary, MainStay Funds, MainStay Funds Trust and MainStay VP Funds Trust (2010 to 2014)**, MainStay DefinedTerm Municipal Opportunities Fund (2011 to 2014) |
| | | | J. Kevin Gao 10/13/67 | | Secretary and Chief Legal Officer, MainStay Funds and MainStay Funds Trust (since 2010) | | Managing Director and Associate General Counsel, New York Life Investment Management LLC (since 2010); Secretary and Chief Legal Officer, MainStay DefinedTerm Municipal Opportunities Fund (since 2011) and MainStay VP Funds Trust (since 2010)** |
| | | | Scott T. Harrington 2/8/59 | | Vice President— Administration, MainStay Funds (since 2005), MainStay Funds Trust (since 2009) | | Director, New York Life Investment Management LLC (including predecessor advisory organizations) (since 2000); Member of the Board of Directors, New York Life Trust Company (since 2009); Vice President—Administration, MainStay DefinedTerm Municipal Opportunities Fund (since 2011) and MainStay VP Funds Trust (since 2005)** |
| | * | The Officers listed above are considered to be “interested persons” of the MainStay Group of Funds within the meaning of the 1940 Act because of their affiliation with the MainStay Group of Funds, New York Life Insurance Company and/or its affiliates, including New York Life Investment Management LLC, NYLIM Service Company LLC, NYLIFE Securities LLC and/or NYLIFE Distributors LLC, as described in detail in the column captioned “Principal Occupation(s) During Past Five Years.” Officers are elected annually by the Board to serve a one year term. |
| | ** | Includes prior service as an Officer of MainStay VP Series Fund, Inc., the predecessor to MainStay VP Funds Trust. |
This page intentionally left blank
This page intentionally left blank
This page intentionally left blank
MainStay Funds
MainStay offers a wide range of Funds for virtually any investment need. The full array of MainStay open-end offerings is listed here, with information about the manager, subadvisors, legal counsel and independent registered public accounting firm.
Equity
U.S. Equity
MainStay Common Stock Fund
MainStay Cornerstone Growth Fund
MainStay Epoch U.S. All Cap Fund
MainStay Epoch U.S. Equity Yield Fund
MainStay Epoch U.S. Small Cap Fund
MainStay ICAP Equity Fund
MainStay ICAP Select Equity Fund
MainStay Large Cap Growth Fund
MainStay MAP Fund
MainStay S&P 500 Index Fund
MainStay U.S. Equity Opportunities Fund
International/Global Equity
MainStay Emerging Markets Opportunities Fund
MainStay Epoch Capital Growth Fund
MainStay Epoch Global Choice Fund
MainStay Epoch Global Equity Yield Fund
MainStay Epoch International Small Cap Fund
MainStay ICAP International Fund
MainStay International Equity Fund
MainStay International Opportunities Fund
Income
Taxable Bond
MainStay Floating Rate Fund
MainStay Global High Income Fund
MainStay Government Fund
MainStay High Yield Corporate Bond Fund
MainStay High Yield Opportunities Fund
MainStay Indexed Bond Fund
MainStay Short Duration High Yield Fund
MainStay Total Return Bond Fund
MainStay Unconstrained Bond Fund
Municipal/Tax Advantaged Bond
MainStay California Tax Free Opportunities Fund1
MainStay High Yield Municipal Bond Fund
MainStay New York Tax Free Opportunities Fund2
MainStay Tax Advantaged Short Term Bond Fund
MainStay Tax Free Bond Fund
Money Market
MainStay Money Market Fund
Mixed Asset
MainStay Balanced Fund
MainStay Convertible Fund
MainStay Income Builder Fund
Alternative
MainStay Absolute Return Multi-Strategy Fund
MainStay Cushing Energy Income Fund
MainStay Cushing MLP Premier Fund
MainStay Cushing Renaissance Advantage Fund
Asset Allocation/Target Date
MainStay Conservative Allocation Fund
MainStay Growth Allocation Fund
MainStay Moderate Allocation Fund
MainStay Moderate Growth Allocation Fund
MainStay Retirement 2010 Fund
MainStay Retirement 2020 Fund
MainStay Retirement 2030 Fund
MainStay Retirement 2040 Fund
MainStay Retirement 2050 Fund
MainStay Retirement 2060 Fund
Manager
New York Life Investment Management LLC
New York, New York
Subadvisors
Candriam France S.A.S.3
Paris, France
Cornerstone Capital Management Holdings LLC3
New York, New York
Cushing Asset Management, LP
Dallas, Texas
Epoch Investment Partners, Inc.
New York, New York
Institutional Capital LLC3
Chicago, Illinois
MacKay Shields LLC3
New York, New York
Markston International LLC
White Plains, New York
NYL Investors LLC3
New York, New York
Winslow Capital Management, LLC
Minneapolis, Minnesota
Legal Counsel
Dechert LLP
Washington, District of Columbia
Independent Registered Public Accounting Firm
KPMG LLP
Philadelphia, Pennsylvania
1. This Fund is only registered for sale in AZ, CA, MI (Class A and Class I shares only), NV, OR, TX, UT and WA.
2. This Fund is only registered for sale in CA, CT, DE, FL, MA, NJ, NY and VT.
3. An affiliate of New York Life Investment Management LLC.
Not part of the Annual Report
For more information
800-MAINSTAY (624-6782)
mainstayinvestments.com
MainStay Investments® is a registered service mark and name under which New York Life Investment Management LLC does business. MainStay Investments, an indirect subsidiary of New York Life Insurance Company, New York, NY 10010, provides investment advisory products and services. The MainStay Funds® are managed by New York Life Investment Management LLC and distributed by NYLIFE Distributors LLC, 30 Hudson Street, Jersey City, NJ 07302, a wholly owned subsidiary of New York Life Insurance Company. NYLIFE Distributors LLC is a Member FINRA/SIPC.
©2016 NYLIFE Distributors LLC. All rights reserved.
| | | | | | | | |
| Not FDIC/NCUA Insured | | Not a Deposit | | May Lose Value | | No Bank Guarantee | | Not Insured by Any Government Agency |
| | |
| 1715994 MS316-16 | | MSIE11-12/16 (NYLIM) NL213 |
MainStay Common Stock Fund
Message from the President and Annual Report
October 31, 2016


This page intentionally left blank
Message from the President
During the 12 months ended October 31, 2016, the U.S. stock and bond markets were somewhat volatile but generally ended the reporting period in positive territory. In the fall of 2015 and early 2016, the market appeared to be focused on China’s economic weakness and a prolonged decline in oil prices. Although energy-related companies felt the brunt of these setbacks, the stock market as a whole declined until mid-February, when oil prices began to rise and stocks began a relatively steady recovery.
In late June, the United Kingdom voted to leave the European Union in a referendum popularly known as “Brexit.” The news caused a temporary slump in stocks around the world. Although the British pound dropped in value following the vote, stocks generally recovered through the end of the reporting period. As the end of the reporting period approached, speculation about the upcoming U.S. presidential election heightened market volatility.
According to FTSE-Russell data, U.S. stocks as a whole tended to provide positive returns during the reporting period, with large-capitalization stocks generally outperforming stocks of smaller companies. Value stocks outpaced growth stocks at all capitalization levels, with the largest differences among small- to mid-cap stocks.
International and emerging-market stocks provided mixed performance. Rocked by Brexit, European stocks as a whole declined during the reporting period, while stocks in the Asia-Pacific region (with or without Japan) tended to provide positive returns. International stocks as a whole declined, while global stocks advanced slightly. Emerging-market stocks were considerably stronger, boosted by advances in India and Latin America and higher prices for oil, metals and other commodities.
Anticipation of a possible Federal Reserve rate hike led to volatility in the bond market, but the Federal Open Market Committee chose not to raise the federal funds target rate during the reporting period. Short-term U.S. Treasury yields rose during the reporting period, and longer-term U.S. Treasury yields declined. Overall, the U.S. bond market provided positive returns, with longer-term bonds generally outperforming shorter-term securities. High-yield bonds, particularly
longer-term issues, were strong performers. Municipal bonds generally provided positive single-digit total returns for the 12 months ended October 31, 2016.
Central banks around the world remained highly accommodative during the reporting period, particularly in light of Brexit. Shortly after the U.K. referendum, more than a third of all sovereign debt carried negative yields. As an asset class, emerging-market bonds provided double-digit positive returns during the reporting period, and world bonds as a whole provided positive single-digit positive returns.
At MainStay, we know that political, economic and market events may influence the performance of your Fund investments. While our portfolio managers often pay close attention to such events, their primary emphasis is seeking to invest for the long-term investment needs of our shareholders. With this in mind, they seek to pursue the investment objectives of their respective Funds using the principal investment strategies and investment processes outlined in the prospectus. By placing your assets in the care of our investment professionals, you gain access to their extensive market insight, strategic investment discipline and in-depth experience in risk-management over a wide range of market cycles.
The report that follows provides more detailed information about the market forces, portfolio strategies and individual securities that influenced the performance of your MainStay Fund during the 12 months ended October 31, 2016. We invite you to read the report carefully as part of your personal investment-review process.
We thank you for your business, and we look forward to a continuing relationship as you pursue your long-range financial goals.
Sincerely,

Stephen P. Fisher
President
The opinions expressed are as of the date of this report and are subject to change. There is no guarantee that any forecast made will come to pass. This material does not constitute investment advice and is not intended as an endorsement of any specific investment. Past performance is no guarantee of future results.
Not part of the Annual Report
Table of Contents
Investors should refer to the Fund’s Summary Prospectus and/or Prospectus and consider the Fund’s investment objectives, strategies, risks, charges and expenses carefully before investing. The Summary Prospectus and/or Prospectus contain this and other information about the Fund. You may obtain copies of the Fund’s Summary Prospectus, Prospectus and Statement of Additional Information free of charge, upon request, by calling toll-free 800-MAINSTAY (624-6782), by writing to NYLIFE Distributors LLC, Attn: MainStay Marketing Department, 30 Hudson Street, Jersey City, NJ 07302 or by sending an e-mail to MainStayShareholderServices@nylim.com. These documents are also available via the MainStay Funds’ website at mainstayinvestments.com/documents. Please read the Summary Prospectus and/or Prospectus carefully before investing.
Investment and Performance Comparison1 (Unaudited)
Performance data quoted represents past performance. Past performance is no guarantee of future results. Because of market volatility and other factors, current performance may be lower or higher than the figures shown. Investment return and principal value will fluctuate, and as a result, when shares are redeemed, they may be worth more or less than their original cost. The graph below depicts the historical performance of Class B shares of the Fund. Performance will vary from class to class based on differences in class-specific expenses and sales charges. For performance information current to the most recent month-end, please call 800-MAINSTAY (624-6782) or visit mainstayinvestments.com.
(With sales charges)
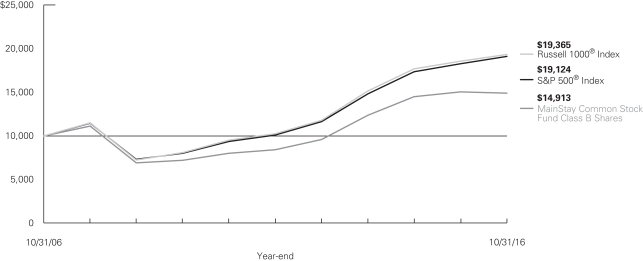
Average Annual Total Returns for the Year Ended October 31, 2016
| | | | | | | | | | | | | | | | | | | | |
| Class | | Sales Charge | | | | One Year | | | Five Years | | | Ten Years | | | Gross
Expense
Ratio2 | |
| Class A Shares | | Maximum 5.5%
Initial Sales Charge | | With sales charges Excluding sales charges | |
| –5.62
–0.13 | %
| |
| 12.05
13.33 | %
| |
| 4.64
5.23 | %
| |
| 0.99
0.99 | %
|
| Investor Class Shares3 | | Maximum 5.5%
Initial Sales Charge | | With sales charges Excluding sales charges | |
| –5.87
–0.39 |
| |
| 11.69
12.96 |
| |
| 4.27
4.86 |
| |
| 1.20
1.20 |
|
| Class B Shares | | Maximum 5% CDSC
if Redeemed Within the
First Six Years of Purchase | | With sales charges Excluding sales charges | |
| –6.05
–1.12 |
| |
| 11.86
12.12 |
| |
| 4.08
4.08 |
| |
| 1.95
1.95 |
|
| Class C Shares | | Maximum 1% CDSC
if Redeemed Within
One Year of Purchase | | With sales charges Excluding sales charges | |
| –2.10
–1.12 |
| |
| 12.10
12.10 |
| |
| 4.08
4.08 |
| |
| 1.95
1.95 |
|
| Class I Shares | | No Sales Charge | | | | | 0.12 | | | | 13.60 | | | | 5.57 | | | | 0.74 | |
| Class R2 Shares4 | | No Sales Charge | | | | | –0.23 | | | | 13.21 | | | | 5.13 | | | | 1.09 | |
| Class R3 Shares5 | | No Sales Charge | | | | | –0.49 | | | | 12.93 | | | | 4.86 | | | | 1.34 | |
| 1. | The performance table and graph do not reflect the deduction of taxes that a shareholder would pay on distributions or Fund share redemptions. Total returns reflect maximum applicable sales charges as indicated in the table above, if any, changes in share price, and reinvestment of dividend and capital gain distributions. The graph assumes the initial investment amount shown above and reflects the deduction of all sales charges that would have applied for the period of investment. Performance figures may reflect certain fee waivers and/or expense limitations, without which total returns may have been lower. For more information on share classes and current fee waivers and/or expense limitations (if any), please refer to the notes to the financial statements. |
| 2. | The gross expense ratios presented reflect the Fund’s “Total Annual Fund Operating Expenses” from the most recent Prospectus and may differ from other expense ratios disclosed in this report. |
| 3. | Performance figures for Investor Class shares, first offered on February 28, 2008, include the historical performance of Class A shares through February 27, 2008, adjusted for differences in certain fees and expenses. Unadjusted, the performance shown for the Investor Class shares would likely have been different. |
| 4. | Performance figures for Class R2 shares, first offered on December 14, 2007, include the historical performance of Class A shares through October 31, 2016, adjusted for differences in certain fees and expenses. Unadjusted, the performance shown for the Class R2 shares would likely have been different. As of October 31, 2016, Class R2 shares had yet to commence investment operations. |
| 5. | Performance figures for Class R3 shares, first offered on February 29, 2016, include the historical performance of Class A shares through February 28, 2016, adjusted for differences in certain fees and expenses. Unadjusted, the performance shown for the Class R3 shares would likely have been different. |
The footnotes on the next page are an integral part of the table and graph and should be carefully read in conjunction with them.
| | | | | | | | | | | | |
| Benchmark Performance | | One
Year | | | Five
Years | | | Ten
Years | |
| S&P 500® Index6 | | | 4.51 | % | | | 13.57 | % | | | 6.70 | % |
Russell 1000® Index7 | | | 4.26 | | | | 13.51 | | | | 6.83 | |
Average Lipper Multi-Cap Core Fund8 | | | 1.54 | | | | 11.54 | | | | 5.63 | |
| 6. | The S&P 500® Index is the Fund’s primary broad-based securities market index for comparison purposes. “S&P 500®” is a trademark of the McGraw-Hill Companies, Inc. The S&P 500® Index is widely regarded as the standard index for measuring large-cap U.S. stock market performance. Results assume reinvestment of all dividends and capital gains. An investment cannot be made directly in an index. |
| 7. | The Russell 1000® Index is the Fund’s secondary benchmark. The Russell 1000® Index measures the performance of the large-cap segment of the U.S. equity universe. It is a subset of the Russell 3000® Index and includes approximately 1,000 of the largest securities based on a combination of their market cap and current index membership. Results assume |
| | reinvestment of all dividends and capital gains. An investment cannot be made directly in an index. |
| 8. | The Average Lipper Multi-Cap Core Fund is representative of funds that, by portfolio practice, invest in a variety of market capitalization ranges without concentrating 75% of their equity assets in any one market capitalization range over an extended period of time. These funds typically have average characteristics compared to the S&P Super Composite 1500 Index. This benchmark is a product of Lipper Inc. Lipper Inc. is an independent monitor of fund performance. Results are based on average total returns of similar funds with all dividend and capital gain distributions reinvested. |
The footnotes on the preceding page are an integral part of the table and graph and should be carefully read in conjunction with them.
| | |
| 6 | | MainStay Common Stock Fund |
Cost in Dollars of a $1,000 Investment in MainStay Common Stock Fund (Unaudited)
The example below is intended to describe the fees and expenses borne by shareholders during the six-month period from May 1, 2016, to October 31, 2016, and the impact of those costs on your investment.
Example
As a shareholder of the Fund, you incur two types of costs: (1) transaction costs, including exchange fees and sales charges (loads) on purchases (as applicable), and (2) ongoing costs, including management fees, distribution and/or service (12b-1) fees, and other Fund expenses (as applicable). This example is intended to help you understand your ongoing costs (in dollars) of investing in the Fund and to compare these costs with the ongoing costs of investing in other mutual funds. The example is based on an investment of $1,000 made at the beginning of the six-month period and held for the entire period from May 1, 2016, to October 31, 2016.
This example illustrates your Fund’s ongoing costs in two ways:
Actual Expenses
The second and third data columns in the table below provide information about actual account values and actual expenses. You may use the information in these columns, together with the amount you invested, to estimate the expenses that you paid during the six months ended October 31, 2016. Simply divide your account value by $1,000 (for example, an $8,600 account value divided by $1,000 = 8.6), then
multiply the result by the number under the heading entitled “Expenses Paid During Period” to estimate the expenses you paid on your account during this period.
Hypothetical Example for Comparison Purposes
The fourth and fifth data columns in the table below provide information about hypothetical account values and hypothetical expenses based on the Fund’s actual expense ratio and an assumed rate of return of 5% per year before expenses, which is not the Fund’s actual return. The hypothetical account values and expenses may not be used to estimate the actual ending account balances or expenses you paid for the six-month period shown. You may use this information to compare the ongoing costs of investing in the Fund with the ongoing costs of investing in other Funds. To do so, compare this 5% hypothetical example with the 5% hypothetical examples that appear in the shareholder reports of the other Funds.
Please note that the expenses shown in the table are meant to highlight your ongoing costs only and do not reflect any transactional costs, such as exchange fees or sales charges (loads). Therefore, the fourth and fifth data columns of the table are useful in comparing ongoing costs only and will not help you determine the relative total costs of owning different funds. In addition, if these transactional costs were included, your costs would have been higher.
| | | | | | | | | | | | | | | | | | | | |
| | | | | | | | | | | | | | | | |
| Share Class | | Beginning
Account
Value
5/1/16 | | | Ending Account
Value (Based
on Actual
Returns and
Expenses)
10/31/16 | | | Expenses
Paid
During
Period1 | | | Ending Account
Value (Based
on Hypothetical
5% Annualized
Return and
Actual Expenses)
10/31/16 | | | Expenses
Paid
During
Period1 | |
| | | | | |
| Class A Shares | | $ | 1,000.00 | | | $ | 1,028.40 | | | $ | 4.95 | | | $ | 1,020.30 | | | $ | 4.93 | |
| | | | | |
| Investor Class Shares | | $ | 1,000.00 | | | $ | 1,026.80 | | | $ | 6.32 | | | $ | 1,018.90 | | | $ | 6.29 | |
| | | | | |
| Class B Shares | | $ | 1,000.00 | | | $ | 1,023.60 | | | $ | 10.12 | | | $ | 1,015.10 | | | $ | 10.08 | |
| | | | | |
| Class C Shares | | $ | 1,000.00 | | | $ | 1,023.00 | | | $ | 10.07 | | | $ | 1,015.20 | | | $ | 10.03 | |
| | | | | |
| Class I Shares | | $ | 1,000.00 | | | $ | 1,029.80 | | | $ | 3.67 | | | $ | 1,021.50 | | | $ | 3.66 | |
| | | | | |
| Class R3 Shares | | $ | 1,000.00 | | | $ | 1,026.30 | | | $ | 6.72 | | | $ | 1,018.50 | | | $ | 6.70 | |
| 1. | Expenses are equal to the Fund’s annualized expense ratio of each class (0.97% for Class A, 1.24% for Investor Class, 1.99% for Class B, 1.98% for Class C, 0.72% for Class I and 1.32% for Class R3) multiplied by the average account value over the period, divided by 366 and multiplied by 184 (to reflect the six-month period). The table above represents the actual expenses incurred during the six-month period. See page 5 for more information on Class R2 shares. |
Industry Composition as of October 31, 2016 (Unaudited)
| | | | |
| Internet Software & Services | | | 5.7 | % |
| Oil, Gas & Consumable Fuels | | | 5.6 | |
| Technology Hardware, Storage & Peripherals | | | 5.4 | |
| Semiconductors & Semiconductor Equipment | | | 5.3 | |
| Pharmaceuticals | | | 5.1 | |
| Specialty Retail | | | 4.8 | |
| Banks | | | 4.4 | |
| Software | | | 3.9 | |
| Health Care Providers & Services | | | 3.7 | |
| Diversified Telecommunication Services | | | 3.5 | |
| Insurance | | | 3.4 | |
| Aerospace & Defense | | | 3.3 | |
| Health Care Equipment & Supplies | | | 3.1 | |
| IT Services | | | 2.9 | |
| Internet & Catalog Retail | | | 2.6 | |
| Food Products | | | 2.4 | |
| Beverages | | | 2.1 | |
| Diversified Financial Services | | | 2.1 | |
| Tobacco | | | 2.1 | |
| Biotechnology | | | 2.0 | |
| Household Products | | | 1.9 | |
| Industrial Conglomerates | | | 1.8 | |
| Media | | | 1.8 | |
| Capital Markets | | | 1.6 | |
| Exchange-Traded Fund | | | 1.6 | |
| Food & Staples Retailing | | | 1.6 | |
| Machinery | | | 1.6 | |
| | | | |
| Metals & Mining | | | 1.6 | % |
| Real Estate Investment Trusts | | | 1.5 | |
| Electric Utilities | | | 1.4 | |
| Chemicals | | | 1.0 | |
| Hotels, Restaurants & Leisure | | | 1.0 | |
| Communications Equipment | | | 0.9 | |
| Energy Equipment & Services | | | 0.9 | |
| Containers & Packaging | | | 0.8 | |
| Life Sciences Tools & Services | | | 0.8 | |
| Textiles, Apparel & Luxury Goods | | | 0.7 | |
| Multiline Retail | | | 0.6 | |
| Air Freight & Logistics | | | 0.5 | |
| Household Durables | | | 0.5 | |
| Multi-Utilities | | | 0.5 | |
| Trading Companies & Distributors | | | 0.5 | |
| Commercial Services & Supplies | | | 0.4 | |
| Construction & Engineering | | | 0.3 | |
| Distributors | | | 0.3 | |
| Electronic Equipment, Instruments & Components | | | 0.2 | |
| Consumer Finance | | | 0.1 | |
| Independent Power & Renewable Electricity Producers | | | 0.1 | |
| Professional Services | | | 0.1 | |
| Airlines | | | 0.0 | ‡ |
| Building Products | | | 0.0 | ‡ |
| Other Assets, Less Liabilities | | | 0.0 | ‡ |
| | | | |
| | | 100.0 | % |
| | | | |
See Portfolio of Investments beginning on page 10 for specific holdings within these categories.
| ‡ | Less than one-tenth of a percent. |
Top Ten Holdings or Issuers as of October 31, 2016 (Unaudited)
| 5. | Berkshire Hathaway, Inc. Class B |
| 8. | Procter & Gamble Co. (The) |
| | |
| 8 | | MainStay Common Stock Fund |
Portfolio Management Discussion and Analysis (Unaudited)
Questions answered by Migene Kim, CFA, Andrew Ver Planck, CFA, and Mona Patni of Cornerstone Capital Management Holdings LLC, the Fund’s Subadvisor.
How did MainStay Common Stock Fund perform relative to its benchmarks and peers during the 12 months ended October 31, 2016?
Excluding all sales charges, MainStay Common Stock Fund returned –0.13% for Class A shares, –0.39% for Investor Class shares and –1.12% for Class B and Class C shares for the 12 months ended October 31, 2016. Over the same period, the Fund’s Class I shares returned 0.12%, Class R2 shares1 returned –0.23% and Class R3 shares1 returned –0.49%. For the 12 months ended October 31, 2016, all share classes underperformed the 4.51% return of the S&P 500® Index,2 which is the Fund’s primary benchmark, and the 4.26% return of the Russell 1000® Index,2 which is the Fund’s secondary benchmark. Over the same period, all share classes underperformed the 1.54% return of the Average Lipper3 Multi-Cap Core Fund. See page 5 for Fund returns with applicable sales charges.
What factors affected the Fund’s relative performance during the reporting period?
The Fund’s underperformance relative to the S&P 500® Index resulted primarily from stock selection. Allocation effects—being overweight or underweight relative to the benchmark in specific sectors as a result of the Fund’s bottom-up stock-selection process—detracted modestly from relative performance.
During the reporting period, which sectors were the strongest positive contributors to the Fund’s relative performance and which sectors were particularly weak?
The strongest positive sector contributions to the Fund’s performance relative to the S&P 500® Index came from materials and consumer staples. (Contributions take weightings and total returns into account.) In both sectors, stock selection was the main driver of the positive contributions to performance.
The weakest sector contributions to the Fund’s relative performance came from industrials, consumer discretionary and energy. In each case, stock selection detracted from the Fund’s relative performance. An overweight position relative to the S&P 500® Index in the consumer discretionary sector and an underweight position in the energy sector also detracted from the Fund’s relative performance.
During the reporting period, which individual stocks made the strongest positive contributions to the Fund’s absolute performance and which stocks detracted the most?
During the reporting period, the strongest positive contributor to absolute performance was online retailer and web services provider Amazon.com. The company reported strong earnings,
driven by the performance of its cloud computing business and continued sales growth in its general merchandise business abroad. Well-known software and hardware maker Microsoft was also a positive contributor to the Fund’s absolute performance, on the strength of the company’s cloud computing business. Meat and food processing company Tyson Foods, also a positive contributor, benefited from strong earnings prompted by growing demand and lower feed prices.
On an absolute basis, the Fund’s weakest performer was personal computing and mobile device maker Apple, which faced slowing growth trends in its handsets. Biotechnology company Gilead Sciences declined because of sinking sales of its Hepatitis C treatment, Harvoni. Video game and consumer electronics retailer GameStop also detracted from the Fund’s absolute performance. The company provided negative returns because of increased competition from downloadable digital gaming.
Did the Fund make any significant purchases or sales during the reporting period?
The Fund established new positions that grew to overweight positions relative to the S&P 500® Index in telecommunications software and integrated circuits maker QUALCOMM and military defense company Lockheed Martin. The Fund’s investment process viewed both companies as attractive because of improving earnings trends and attractive cash flows.
The Fund exited positions in diversified financial services company Bank of New York Mellon and enterprise software and hardware product company Oracle, moving from overweight positions relative to the Index to zero-weight positions. The Fund’s investment process viewed both companies as unattractive because of weak valuations and deteriorating earnings trends.
How did the Fund’s sector weightings change during the reporting period?
During the reporting period, the Fund modestly increased its weightings relative to the S&P 500® Index in the materials and consumer staples sectors. Over the same period, the Fund modestly reduced its weightings relative to the benchmark in the financials and consumer discretionary sectors.
How was the Fund positioned at the end of the reporting period?
As of October 31, 2016, the Fund’s most substantially overweight sectors relative to the S&P 500® Index were information technology and health care. As of the same date, the Fund held modestly underweight positions relative to the Index in the financials and industrials sectors.
| 1. | See footnote on page 5 for more information on Class R2 and Class R3 shares. |
| 2. | See footnote on page 6 for more information on this index. |
| 3. | See footnote on page 6 for more information on Lipper Inc. |
The opinions expressed are those of the portfolio managers as of the date of this report and are subject to change. There is no guarantee that any forecasts will come to pass. This material does not constitute investment advice and is not intended as an endorsement of any specific investment.
Portfolio of Investments October 31, 2016
| | | | | | | | |
| | |
Shares | | | Value | |
| Common Stocks 98.4%† | |
Aerospace & Defense 3.3% | | | | | | | | |
Boeing Co. (The) | | | 14,090 | | | $ | 2,006,839 | |
Huntington Ingalls Industries, Inc. | | | 5,121 | | | | 826,325 | |
L-3 Communications Holdings, Inc. | | | 8,383 | | | | 1,147,968 | |
Lockheed Martin Corp. | | | 6,895 | | | | 1,698,790 | |
Raytheon Co. | | | 440 | | | | 60,108 | |
| | | | | | | | |
| | | | | | | 5,740,030 | |
| | | | | | | | |
Air Freight & Logistics 0.5% | | | | | | | | |
United Parcel Service, Inc. Class B | | | 8,422 | | | | 907,555 | |
| | | | | | | | |
| | |
Airlines 0.0%‡ | | | | | | | | |
JetBlue Airways Corp. (a) | | | 3,563 | | | | 62,281 | |
| | | | | | | | |
| | |
Banks 4.4% | | | | | | | | |
Bank of America Corp. | | | 168,666 | | | | 2,782,989 | |
Citigroup, Inc. | | | 11,657 | | | | 572,942 | |
¨JPMorgan Chase & Co. | | | 51,075 | | | | 3,537,454 | |
Wells Fargo & Co. | | | 17,698 | | | | 814,285 | |
| | | | | | | | |
| | | | | | | 7,707,670 | |
| | | | | | | | |
Beverages 2.1% | | | | | | | | |
Coca-Cola Co. (The) | | | 9,706 | | | | 411,534 | |
Constellation Brands, Inc. Class A | | | 1,243 | | | | 207,730 | |
Dr. Pepper Snapple Group, Inc. | | | 5,628 | | | | 494,082 | |
PepsiCo., Inc. | | | 24,373 | | | | 2,612,786 | |
| | | | | | | | |
| | | | | | | 3,726,132 | |
| | | | | | | | |
Biotechnology 2.0% | | | | | | | | |
AbbVie, Inc. | | | 15,385 | | | | 858,175 | |
Amgen, Inc. | | | 4,955 | | | | 699,448 | |
Gilead Sciences, Inc. | | | 27,186 | | | | 2,001,705 | |
| | | | | | | | |
| | | | | | | 3,559,328 | |
| | | | | | | | |
Building Products 0.0%‡ | | | | | | | | |
Masco Corp. | | | 2,357 | | | | 72,784 | |
| | | | | | | | |
| | |
Capital Markets 1.6% | | | | | | | | |
Donnelley Financial Solutions, Inc. (a) | | | 4,445 | | | | 95,345 | |
Nasdaq, Inc. | | | 17,958 | | | | 1,148,773 | |
Raymond James Financial, Inc. | | | 11,907 | | | | 715,849 | |
State Street Corp. | | | 11,465 | | | | 804,958 | |
| | | | | | | | |
| | | | | | | 2,764,925 | |
| | | | | | | | |
Chemicals 1.0% | | | | | | | | |
AdvanSix, Inc. (a) | | | 54 | | | | 862 | |
Dow Chemical Co. (The) | | | 14,289 | | | | 768,891 | |
LyondellBasell Industries N.V. Class A | | | 12,975 | | | | 1,032,161 | |
| | | | | | | | |
| | | | | | | 1,801,914 | |
| | | | | | | | |
| | | | | | | | |
| | |
Shares | | | Value | |
Commercial Services & Supplies 0.4% | | | | | | | | |
LSC Communications, Inc. (a) | | | 4,445 | | | $ | 107,747 | |
RR Donnelley & Sons Co. | | | 11,853 | | | | 210,391 | |
Waste Management, Inc. | | | 5,581 | | | | 366,448 | |
| | | | | | | | |
| | | | | | | 684,586 | |
| | | | | | | | |
Communications Equipment 0.9% | | | | | | | | |
Cisco Systems, Inc. | | | 11,036 | | | | 338,585 | |
F5 Networks, Inc. (a) | | | 9,102 | | | | 1,257,987 | |
| | | | | | | | |
| | | | | | | 1,596,572 | |
| | | | | | | | |
Construction & Engineering 0.3% | | | | | | | | |
Quanta Services, Inc. (a) | | | 21,392 | | | | 615,020 | |
| | | | | | | | |
| | |
Consumer Finance 0.1% | | | | | | | | |
Synchrony Financial | | | 7,488 | | | | 214,082 | |
| | | | | | | | |
| | |
Containers & Packaging 0.8% | | | | | | | | |
International Paper Co. | | | 17,121 | | | | 770,959 | |
Packaging Corp. of America | | | 7,295 | | | | 601,837 | |
| | | | | | | | |
| | | | | | | 1,372,796 | |
| | | | | | | | |
Distributors 0.3% | | | | | | | | |
Genuine Parts Co. | | | 5,573 | | | | 504,858 | |
| | | | | | | | |
| | |
Diversified Financial Services 2.1% | | | | | | | | |
¨Berkshire Hathaway, Inc. Class B (a) | | | 25,849 | | | | 3,730,011 | |
| | | | | | | | |
|
Diversified Telecommunication Services 3.5% | |
¨AT&T, Inc. | | | 86,951 | | | | 3,198,927 | |
Verizon Communications, Inc. | | | 61,030 | | | | 2,935,543 | |
| | | | | | | | |
| | | | | | | 6,134,470 | |
| | | | | | | | |
Electric Utilities 1.4% | | | | | | | | |
American Electric Power Co., Inc. | | | 973 | | | | 63,089 | |
Duke Energy Corp. | | | 3,091 | | | | 247,342 | |
Edison International | | | 6,374 | | | | 468,362 | |
Exelon Corp. | | | 11,271 | | | | 384,003 | |
NextEra Energy, Inc. | | | 5,790 | | | | 741,120 | |
Southern Co. (The) | | | 9,034 | | | | 465,883 | |
Xcel Energy, Inc. | | | 1,181 | | | | 49,071 | |
| | | | | | | | |
| | | | | | | 2,418,870 | |
| | | | | | | | |
Electronic Equipment, Instruments & Components 0.2% | |
Ingram Micro, Inc. Class A | | | 7,978 | | | | 296,782 | |
| | | | | | | | |
| | |
Energy Equipment & Services 0.9% | | | | | | | | |
Baker Hughes, Inc. | | | 18,439 | | | | 1,021,521 | |
National Oilwell Varco, Inc. | | | 17,959 | | | | 576,484 | |
| | | | | | | | |
| | | | | | | 1,598,005 | |
| | | | | | | | |
| † | Percentages indicated are based on Fund net assets. |
| ¨ | | Among the Fund’s 10 largest holdings, as of October 31, 2016. May be subject to change daily. (Unaudited) |
| | | | |
| 10 | | MainStay Common Stock Fund | | The notes to the financial statements are an integral part of,
and should be read in conjunction with, the financial statements. |
| | | | | | | | |
| | |
Shares | | | Value | |
| Common Stocks (continued) | |
Food & Staples Retailing 1.6% | | | | | | | | |
CVS Health Corp. | | | 8,584 | | | $ | 721,914 | |
Wal-Mart Stores, Inc. | | | 30,781 | | | | 2,155,286 | |
| | | | | | | | |
| | | | | | | 2,877,200 | |
| | | | | | | | |
Food Products 2.4% | | | | | | | | |
Archer-Daniels-Midland Co. | | | 15,206 | | | | 662,526 | |
Campbell Soup Co. | | | 17,480 | | | | 949,863 | |
Ingredion, Inc. | | | 2,410 | | | | 316,120 | |
J.M. Smucker Co. (The) | | | 868 | | | | 113,977 | |
Post Holdings, Inc. (a) | | | 11,365 | | | | 866,354 | |
Tyson Foods, Inc. Class A | | | 18,505 | | | | 1,311,079 | |
| | | | | | | | |
| | | | | | | 4,219,919 | |
| | | | | | | | |
Health Care Equipment & Supplies 3.1% | | | | | | | | |
Baxter International, Inc. | | | 10,324 | | | | 491,319 | |
Becton Dickinson & Co. | | | 8,112 | | | | 1,362,086 | |
Boston Scientific Corp. (a) | | | 7,331 | | | | 161,282 | |
Danaher Corp. | | | 5,743 | | | | 451,113 | |
Hill-Rom Holdings, Inc. | | | 14,125 | | | | 782,666 | |
Hologic, Inc. (a) | | | 31,839 | | | | 1,146,522 | |
Medtronic PLC | | | 10,158 | | | | 833,159 | |
ResMed, Inc. | | | 3,314 | | | | 198,078 | |
| | | | | | | | |
| | | | | | | 5,426,225 | |
| | | | | | | | |
Health Care Providers & Services 3.7% | | | | | | | | |
Aetna, Inc. | | | 13,271 | | | | 1,424,642 | |
AmerisourceBergen Corp. | | | 5,730 | | | | 402,934 | |
Anthem, Inc. | | | 9,348 | | | | 1,139,147 | |
Express Scripts Holding Co. (a) | | | 6,806 | | | | 458,724 | |
UnitedHealth Group, Inc. | | | 17,262 | | | | 2,439,638 | |
WellCare Health Plans, Inc. (a) | | | 5,156 | | | | 585,258 | |
| | | | | | | | |
| | | | | | | 6,450,343 | |
| | | | | | | | |
Hotels, Restaurants & Leisure 1.0% | | | | | | | | |
Marriott International, Inc. Class A | | | 5,320 | | | | 365,484 | |
McDonald’s Corp. | | | 1,349 | | | | 151,857 | |
Starbucks Corp. | | | 2,700 | | | | 143,289 | |
Wyndham Worldwide Corp. | | | 17,042 | | | | 1,122,045 | |
Yum! Brands, Inc. | | | 250 | | | | 21,570 | |
| | | | | | | | |
| | | | | | | 1,804,245 | |
| | | | | | | | |
Household Durables 0.5% | | | | | | | | |
Garmin, Ltd. | | | 17,681 | | | | 855,053 | |
Newell Brands, Inc. | | | 260 | | | | 12,485 | |
Tempur Sealy International, Inc. (a) | | | 243 | | | | 13,139 | |
| | | | | | | | |
| | | | | | | 880,677 | |
| | | | | | | | |
Household Products 1.9% | | | | | | | | |
¨Procter & Gamble Co. (The) | | | 37,495 | | | | 3,254,566 | |
| | | | | | | | |
|
Independent Power & Renewable Electricity Producers 0.1% | |
NRG Energy, Inc. | | | 18,839 | | | | 200,259 | |
| | | | | | | | |
| | | | | | | | |
| | |
Shares | | | Value | |
Industrial Conglomerates 1.8% | | | | | | | | |
3M Co. | | | 3,432 | | | $ | 567,310 | |
General Electric Co. | | | 84,684 | | | | 2,464,304 | |
Honeywell International, Inc. | | | 1,362 | | | | 149,384 | |
| | | | | | | | |
| | | | | | | 3,180,998 | |
| | | | | | | | |
Insurance 3.4% | | | | | | | | |
Aflac, Inc. | | | 11,631 | | | | 801,027 | |
Allstate Corp. (The) | | | 1,520 | | | | 103,208 | |
American International Group, Inc. | | | 11,342 | | | | 699,801 | |
Everest Re Group, Ltd. | | | 280 | | | | 56,986 | |
First American Financial Corp. | | | 9,259 | | | | 361,657 | |
Lincoln National Corp. | | | 3,470 | | | | 170,342 | |
MetLife, Inc. | | | 4,948 | | | | 232,358 | |
Principal Financial Group, Inc. | | | 16,632 | | | | 908,107 | |
Prudential Financial, Inc. | | | 14,985 | | | | 1,270,578 | |
Reinsurance Group of America, Inc. | | | 2,948 | | | | 317,971 | |
Travelers Cos., Inc. (The) | | | 8,388 | | | | 907,414 | |
Unum Group | | | 4,040 | | | | 143,016 | |
| | | | | | | | |
| | | | | | | 5,972,465 | |
| | | | | | | | |
Internet & Catalog Retail 2.6% | | | | | | | | |
¨Amazon.com, Inc. (a) | | | 4,567 | | | | 3,607,108 | |
Expedia, Inc. | | | 7,995 | | | | 1,033,194 | |
| | | | | | | | |
| | | | | | | 4,640,302 | |
| | | | | | | | |
Internet Software & Services 5.7% | | | | | | | | |
Akamai Technologies, Inc. (a) | | | 4,213 | | | | 292,677 | |
¨Alphabet, Inc.
Class A (a) | | | 3,260 | | | | 2,640,274 | |
Class C (a) | | | 3,281 | | | | 2,574,076 | |
eBay, Inc. (a) | | | 45,799 | | | | 1,305,730 | |
¨Facebook, Inc. Class A (a) | | | 24,771 | | | | 3,244,753 | |
| | | | | | | | |
| | | | | | | 10,057,510 | |
| | | | | | | | |
IT Services 2.9% | | | | | | | | |
Fidelity National Information Services, Inc. | | | 1,555 | | | | 114,945 | |
Global Payments, Inc. | | | 3,244 | | | | 235,255 | |
International Business Machines Corp. | | | 4,884 | | | | 750,622 | |
MasterCard, Inc. Class A | | | 9,065 | | | | 970,136 | |
Teradata Corp. (a) | | | 38,881 | | | | 1,048,232 | |
Visa, Inc. Class A | | | 17,828 | | | | 1,470,988 | |
Xerox Corp. | | | 55,106 | | | | 538,386 | |
| | | | | | | | |
| | | | | | | 5,128,564 | |
| | | | | | | | |
Life Sciences Tools & Services 0.8% | | | | | | | | |
Charles River Laboratories International, Inc. (a) | | | 8,152 | | | | 618,574 | |
PAREXEL International Corp. (a) | | | 12,351 | | | | 719,569 | |
| | | | | | | | |
| | | | | | | 1,338,143 | |
| | | | | | | | |
Machinery 1.6% | | | | | | | | |
Cummins, Inc. | | | 2,868 | | | | 366,588 | |
PACCAR, Inc. | | | 21,873 | | | | 1,201,265 | |
Trinity Industries, Inc. | | | 42,193 | | | | 900,821 | |
Woodward, Inc. | | | 6,400 | | | | 377,472 | |
| | | | | | | | |
| | | | | | | 2,846,146 | |
| | | | | | | | |
| | | | | | |
The notes to the financial statements are an integral part of,
and should be read in conjunction with, the financial statements. | | | | | 11 | |
Portfolio of Investments October 31, 2016 (continued)
| | | | | | | | |
| | |
Shares | | | Value | |
| Common Stocks (continued) | |
Media 1.8% | | | | | | | | |
AMC Networks, Inc. Class A (a) | | | 3,099 | | | $ | 151,634 | |
Comcast Corp. Class A | | | 40,027 | | | | 2,474,469 | |
Omnicom Group, Inc. | | | 3,262 | | | | 260,373 | |
Walt Disney Co. (The) | | | 3,781 | | | | 350,461 | |
| | | | | | | | |
| | | | | | | 3,236,937 | |
| | | | | | | | |
Metals & Mining 1.6% | | | | | | | | |
Newmont Mining Corp. | | | 36,162 | | | | 1,339,441 | |
Nucor Corp. | | | 6,064 | | | | 296,226 | |
Reliance Steel & Aluminum Co. | | | 4,486 | | | | 308,547 | |
Steel Dynamics, Inc. | | | 29,860 | | | | 819,956 | |
| | | | | | | | |
| | | | | | | 2,764,170 | |
| | | | | | | | |
Multi-Utilities 0.5% | | | | | | | | |
CenterPoint Energy, Inc. | | | 27,119 | | | | 618,313 | |
Consolidated Edison, Inc. | | | 683 | | | | 51,601 | |
DTE Energy Co. | | | 2,355 | | | | 226,103 | |
| | | | | | | | |
| | | | | | | 896,017 | |
| | | | | | | | |
Multiline Retail 0.6% | | | | | | | | |
Kohl’s Corp. | | | 11,107 | | | | 485,931 | |
Nordstrom, Inc. | | | 9,560 | | | | 497,120 | |
| | | | | | | | |
| | | | | | | 983,051 | |
| | | | | | | | |
Oil, Gas & Consumable Fuels 5.6% | | | | | | | | |
Apache Corp. | | | 5,416 | | | | 322,144 | |
Chevron Corp. | | | 6,612 | | | | 692,607 | |
ConocoPhillips | | | 1,323 | | | | 57,484 | |
Devon Energy Corp. | | | 6,886 | | | | 260,910 | |
EOG Resources, Inc. | | | 536 | | | | 48,465 | |
Exxon Mobil Corp. | | | 37,169 | | | | 3,096,921 | |
Kinder Morgan, Inc. | | | 7,416 | | | | 151,509 | |
Marathon Petroleum Corp. | | | 16,574 | | | | 722,461 | |
Murphy Oil Corp. | | | 8,452 | | | | 218,653 | |
Newfield Exploration Co. (a) | | | 5,864 | | | | 238,020 | |
ONEOK, Inc. | | | 25,049 | | | | 1,213,123 | |
QEP Resources, Inc. | | | 11,474 | | | | 184,387 | |
SM Energy Co. | | | 5,537 | | | | 186,209 | |
Southwestern Energy Co. (a) | | | 36,305 | | | | 377,209 | |
Tesoro Corp. | | | 7,248 | | | | 615,863 | |
Valero Energy Corp. | | | 20,620 | | | | 1,221,529 | |
WPX Energy, Inc. (a) | | | 16,588 | | | | 180,146 | |
| | | | | | | | |
| | | | | | | 9,787,640 | |
| | | | | | | | |
Pharmaceuticals 5.1% | | | | | | | | |
¨Johnson & Johnson | | | 35,488 | | | | 4,116,253 | |
Mallinckrodt PLC (a) | | | 16,925 | | | | 1,002,976 | |
Merck & Co., Inc. | | | 14,023 | | | | 823,431 | |
Mylan N.V. (a) | | | 32,747 | | | | 1,195,265 | |
Pfizer, Inc. | | | 55,565 | | | | 1,761,966 | |
| | | | | | | | |
| | | | | | | 8,899,891 | |
| | | | | | | | |
| | | | | | | | |
| | |
Shares | | | Value | |
Professional Services 0.1% | | | | | | | | |
Dun & Bradstreet Corp. (The) | | | 413 | | | $ | 51,563 | |
ManpowerGroup, Inc. | | | 2,288 | | | | 175,718 | |
| | | | | | | | |
| | | | | | | 227,281 | |
| | | | | | | | |
Real Estate Investment Trusts 1.5% | | | | | | | | |
American Tower Corp. | | | 3,875 | | | | 454,111 | |
Communications Sales & Leasing, Inc. | | | 15,292 | | | | 434,751 | |
HCP, Inc. | | | 11,769 | | | | 403,088 | |
Hospitality Properties Trust | | | 4,763 | | | | 130,316 | |
Host Hotels & Resorts, Inc. | | | 31,883 | | | | 493,549 | |
Senior Housing Properties Trust | | | 18,022 | | | | 383,328 | |
Ventas, Inc. | | | 3,309 | | | | 224,185 | |
Welltower, Inc. | | | 1,198 | | | | 82,099 | |
| | | | | | | | |
| | | | | | | 2,605,427 | |
| | | | | | | | |
Semiconductors & Semiconductor Equipment 5.3% | |
Applied Materials, Inc. | | | 48,875 | | | | 1,421,285 | |
Intel Corp. | | | 75,189 | | | | 2,621,841 | |
Lam Research Corp. | | | 13,357 | | | | 1,293,759 | |
Micron Technology, Inc. (a) | | | 75,491 | | | | 1,295,426 | |
Qorvo, Inc. (a) | | | 16,942 | | | | 942,822 | |
QUALCOMM, Inc. | | | 24,770 | | | | 1,702,194 | |
| | | | | | | | |
| | | | | | | 9,277,327 | |
| | | | | | | | |
Software 3.9% | | | | | | | | |
Activision Blizzard, Inc. | | | 15,647 | | | | 675,481 | |
Citrix Systems, Inc. (a) | | | 15,041 | | | | 1,275,477 | |
¨Microsoft Corp. | | | 80,969 | | | | 4,851,662 | |
| | | | | | | | |
| | | | | | | 6,802,620 | |
| | | | | | | | |
Specialty Retail 4.8% | | | | | | | | |
Best Buy Co., Inc. | | | 32,370 | | | | 1,259,517 | |
Dick’s Sporting Goods, Inc. | | | 19,373 | | | | 1,078,107 | |
Foot Locker, Inc. | | | 13,108 | | | | 875,221 | |
Gap, Inc. (The) | | | 34,071 | | | | 940,019 | |
Home Depot, Inc. (The) | | | 14,438 | | | | 1,761,580 | |
Lowe’s Cos., Inc. | | | 22,274 | | | | 1,484,562 | |
Ross Stores, Inc. | | | 2,680 | | | | 167,607 | |
TJX Cos., Inc. (The) | | | 346 | | | | 25,518 | |
Urban Outfitters, Inc. (a) | | | 23,104 | | | | 772,829 | |
| | | | | | | | |
| | | | | | | 8,364,960 | |
| | | | | | | | |
Technology Hardware, Storage & Peripherals 5.4% | |
¨Apple, Inc. | | | 59,733 | | | | 6,782,085 | |
Hewlett Packard Enterprise Co. | | | 15,700 | | | | 352,779 | |
HP, Inc. | | | 16,255 | | | | 235,535 | |
NCR Corp. (a) | | | 10,458 | | | | 366,553 | |
NetApp, Inc. | | | 35,287 | | | | 1,197,641 | |
Seagate Technology PLC | | | 17,118 | | | | 587,318 | |
| | | | | | | | |
| | | | | | | 9,521,911 | |
| | | | | | | | |
Textiles, Apparel & Luxury Goods 0.7% | | | | | | | | |
PVH Corp. | | | 11,098 | | | | 1,187,264 | |
| | | | | | | | |
| | | | |
| 12 | | MainStay Common Stock Fund | | The notes to the financial statements are an integral part of,
and should be read in conjunction with, the financial statements. |
| | | | | | | | |
| | |
Shares | | | Value | |
| Common Stocks (continued) | |
Tobacco 2.1% | | | | | | | | |
Altria Group, Inc. | | | 36,796 | | | $ | 2,432,952 | |
Philip Morris International, Inc. | | | 13,439 | | | | 1,296,057 | |
| | | | | | | | |
| | | | | | | 3,729,009 | |
| | | | | | | | |
Trading Companies & Distributors 0.5% | | | | | | | | |
United Rentals, Inc. (a) | | | 10,464 | | | | 791,706 | |
| | | | | | | | |
Total Common Stocks
(Cost $163,948,906) | | | | | | | 172,861,444 | |
| | | | | | | | |
| | |
| Exchange-Traded Fund 1.6% (b) | | | | | | | | |
SPDR S&P 500 ETF Trust | | | 13,140 | | | | 2,792,907 | |
| | | | | | | | |
Total Exchange-Traded Fund
(Cost $2,818,419) | | | | | | | 2,792,907 | |
| | | | | | | | |
Total Investments
(Cost $166,767,325) (c) | | | 100.0 | % | | | 175,654,351 | |
Other Assets, Less Liabilities | | | 0.0 | ‡ | | | 69,112 | |
Net Assets | | | 100.0 | % | | $ | 175,723,463 | |
| ‡ | Less than one-tenth of a percent. |
| (a) | Non-income producing security. |
| (b) | Exchange-Traded Fund—An investment vehicle that represents a basket of securities that is traded on an exchange. |
| (c) | As of October 31, 2016, cost was $167,783,423 for federal income tax purposes and net unrealized appreciation was as follows: |
| | | | |
Gross unrealized appreciation | | $ | 13,550,366 | |
Gross unrealized depreciation | | | (5,679,438 | ) |
| | | | |
Net unrealized appreciation | | $ | 7,870,928 | |
| | | | |
The following abbreviations are used in the preceding pages:
ETF—Exchange-Traded Fund
SPDR—Standard & Poor’s Depositary Receipt
The following is a summary of the fair valuations according to the inputs used as of October 31, 2016, for valuing the Fund’s assets.
Asset Valuation Inputs
| | | | | | | | | | | | | | | | |
Description | | Quoted
Prices in
Active
Markets for
Identical
Assets (Level 1) | | | Significant
Other
Observable
Inputs (Level 2) | | | Significant
Unobservable
Inputs (Level 3) | | | Total | |
| Investments in Securities (a) | | | | | | | | | | | | | | | | |
| Common Stocks | | $ | 172,861,444 | | | $ | — | | | $ | — | | | $ | 172,861,444 | |
| Exchange-Traded Fund | | | 2,792,907 | | | | — | | | | — | | | | 2,792,907 | |
| | | | | | | | | | | | | | | | |
| Total Investments in Securities | | $ | 175,654,351 | | | $ | — | | | $ | — | | | $ | 175,654,351 | |
| | | | | | | | | | | | | | | | |
| (a) | For a complete listing of investments and their industries, see the Portfolio of Investments. |
The Fund recognizes transfers between the levels at the beginning of the year.
For the year ended October 31, 2016, the Fund did not have any transfers between Level 1 and Level 2 fair value measurements. (See Note 2)
As of October 31, 2016, the Fund did not hold any investments with significant unobservable inputs (Level 3). (See Note 2)
| | | | | | |
The notes to the financial statements are an integral part of,
and should be read in conjunction with, the financial statements. | | | | | 13 | |
Statement of Assets and Liabilities as of October 31, 2016
| | | | |
| Assets | |
Investment in securities, at value
(identified cost $166,767,325) | | $ | 175,654,351 | |
Cash | | | 67,252 | |
Receivables: | | | | |
Fund shares sold | | | 273,014 | |
Dividends and Interest | | | 157,787 | |
Other assets | | | 34,939 | |
| | | | |
Total assets | | | 176,187,343 | |
| | | | |
| |
| Liabilities | | | | |
Payables: | | | | |
Investment securities purchased | | | 213,252 | |
Manager (See Note 3) | | | 82,990 | |
Fund shares redeemed | | | 62,138 | |
NYLIFE Distributors (See Note 3) | | | 34,105 | |
Transfer agent (See Note 3) | | | 33,122 | |
Professional fees | | | 11,043 | |
Shareholder communication | | | 11,008 | |
Custodian | | | 10,791 | |
Trustees | | | 528 | |
Accrued expenses | | | 4,903 | |
| | | | |
Total liabilities | | | 463,880 | |
| | | | |
Net assets | | $ | 175,723,463 | |
| | | | |
| |
| Composition of Net Assets | | | | |
Shares of beneficial interest outstanding (par value of $.01 per share) unlimited number of shares authorized | | $ | 88,968 | |
Additional paid-in capital | | | 195,039,041 | |
| | | | |
| | | 195,128,009 | |
Undistributed net investment income | | | 1,857,580 | |
Accumulated net realized gain (loss) on investments | | | (30,149,152 | ) |
Net unrealized appreciation (depreciation) on investments | | | 8,887,026 | |
| | | | |
Net assets | | $ | 175,723,463 | |
| | | | |
| | | | |
Class A | | | | |
Net assets applicable to outstanding shares | | $ | 42,927,764 | |
| | | | |
Shares of beneficial interest outstanding | | | 2,151,379 | |
| | | | |
Net asset value per share outstanding | | $ | 19.95 | |
Maximum sales charge (5.50% of offering price) | | | 1.16 | |
| | | | |
Maximum offering price per share outstanding | | $ | 21.11 | |
| | | | |
Investor Class | | | | |
Net assets applicable to outstanding shares | | $ | 21,880,409 | |
| | | | |
Shares of beneficial interest outstanding | | | 1,097,830 | |
| | | | |
Net asset value per share outstanding | | $ | 19.93 | |
Maximum sales charge (5.50% of offering price) | | | 1.16 | |
| | | | |
Maximum offering price per share outstanding | | $ | 21.09 | |
| | | | |
Class B | | | | |
Net assets applicable to outstanding shares | | $ | 6,603,676 | |
| | | | |
Shares of beneficial interest outstanding | | | 361,883 | |
| | | | |
Net asset value and offering price per share outstanding | | $ | 18.25 | |
| | | | |
Class C | | | | |
Net assets applicable to outstanding shares | | $ | 16,508,722 | |
| | | | |
Shares of beneficial interest outstanding | | | 905,152 | |
| | | | |
Net asset value and offering price per share outstanding | | $ | 18.24 | |
| | | | |
Class I | | | | |
Net assets applicable to outstanding shares | | $ | 87,774,375 | |
| | | | |
Shares of beneficial interest outstanding | | | 4,379,157 | |
| | | | |
Net asset value and offering price per share outstanding | | $ | 20.04 | |
| | | | |
Class R3 | | | | |
Net assets applicable to outstanding shares | | $ | 28,517 | |
| | | | |
Shares of beneficial interest outstanding | | | 1,433 | |
| | | | |
Net asset value and offering price per share outstanding | | $ | 19.90 | |
| | | | |
| | | | |
| 14 | | MainStay Common Stock Fund | | The notes to the financial statements are an integral part of,
and should be read in conjunction with, the financial statements. |
Statement of Operations for the year ended October 31, 2016
| | | | |
| Investment Income (Loss) | |
Income | | | | |
Dividends | | $ | 4,248,323 | |
Interest | | | 60 | |
| | | | |
Total Income | | | 4,248,383 | |
| | | | |
Expenses | | | | |
Manager (See Note 3) | | | 1,036,352 | |
Distribution/Service—Class A (See Note 3) | | | 120,769 | |
Distribution/Service—Investor Class (See Note 3) | | | 55,398 | |
Distribution/Service—Class B (See Note 3) | | | 65,812 | |
Distribution/Service—Class C (See Note 3) | | | 210,989 | |
Distribution/Service—Class R3 (See Note 3) | | | 92 | |
Transfer agent (See Note 3) | | | 195,396 | |
Registration | | | 96,017 | |
Professional fees | | | 69,517 | |
Shareholder communication | | | 27,363 | |
Custodian | | | 21,002 | |
Trustees | | | 4,880 | |
Shareholder service (See Note 3) | | | 19 | |
Miscellaneous | | | 14,841 | |
| | | | |
Total expenses | | | 1,918,447 | |
Reimbursement from custodian (a) | | | (16,852 | ) |
| | | | |
Net expenses | | | 1,901,595 | |
| | | | |
Net investment income (loss) | | | 2,346,788 | |
| | | | |
|
| Realized and Unrealized Gain (Loss) on Investments | |
Net realized gain (loss) on investments | | | 4,451,239 | |
Net change in unrealized appreciation (depreciation) on investments | | | (6,715,636 | ) |
| | | | |
Net realized and unrealized gain (loss) on investments | | | (2,264,397 | ) |
| | | | |
Net increase (decrease) in net assets resulting from operations | | $ | 82,391 | |
| | | | |
| (a) | Reimbursement from custodian represents a refund for overbilling of prior years’ custody out-of-pocket fees. |
| | | | | | |
The notes to the financial statements are an integral part of,
and should be read in conjunction with, the financial statements. | | | | | 15 | |
Statements of Changes in Net Assets
for the years ended October 31, 2016 and October 31, 2015
| | | | | | | | |
| | | 2016 | | | 2015 | |
| Increase (Decrease) in Net Assets | |
Operations: | | | | | | | | |
Net investment income (loss) | | $ | 2,346,788 | | | $ | 1,887,006 | |
Net realized gain (loss) on investments | | | 4,451,239 | | | | 10,462,143 | |
Net change in unrealized appreciation (depreciation) on investments | | | (6,715,636 | ) | | | (2,884,385 | ) |
| | | | |
Net increase (decrease) in net assets resulting from operations | | | 82,391 | | | | 9,464,764 | |
| | | | |
Dividends to shareholders: | | | | | | | | |
From net investment income: | | | | | |
Class A | | | (546,900 | ) | | | (317,306 | ) |
Investor Class | | | (202,195 | ) | | | (124,211 | ) |
Class B | | | (12,079 | ) | | | (14,009 | ) |
Class C | | | (44,949 | ) | | | (42,750 | ) |
Class I | | | (1,194,013 | ) | | | (951,731 | ) |
| | | | |
Total dividends to shareholders | | | (2,000,136 | ) | | | (1,450,007 | ) |
| | | | |
Capital share transactions: | | | | | | | | |
Net proceeds from sale of shares | | | 47,224,998 | | | | 67,834,602 | |
Net asset value of shares issued to shareholders in reinvestment of dividends | | | 1,936,763 | | | | 1,415,184 | |
Cost of shares redeemed | | | (71,596,871 | ) | | | (64,302,117 | ) |
| | | | |
Increase (decrease) in net assets derived from capital share transactions | | | (22,435,110 | ) | | | 4,947,669 | |
| | | | |
Net increase (decrease) in net assets | | | (24,352,855 | ) | | | 12,962,426 | |
|
| Net Assets | |
Beginning of year | | | 200,076,318 | | | | 187,113,892 | |
| | | | |
End of year | | $ | 175,723,463 | | | $ | 200,076,318 | |
| | | | |
Undistributed net investment income at end of year | | $ | 1,857,580 | | | $ | 1,568,829 | |
| | | | |
| | | | |
| 16 | | MainStay Common Stock Fund | | The notes to the financial statements are an integral part of,
and should be read in conjunction with, the financial statements. |
Financial Highlights selected per share data and ratios
| | | | | | | | | | | | | | | | | | | | |
| | | Year ended October 31, | |
| Class A | | 2016 | | | 2015 | | | 2014 | | | 2013 | | | 2012 | |
Net asset value at beginning of year | | $ | 20.20 | | | $ | 19.39 | | | $ | 16.59 | | | $ | 12.90 | | | $ | 11.34 | |
| | | | | | | | | | | | | | | | | | | | |
Net investment income (loss) (a) | | | 0.25 | | | | 0.20 | | | | 0.18 | | | | 0.16 | | | | 0.15 | |
Net realized and unrealized gain (loss) on investments | | | (0.28 | ) | | | 0.76 | | | | 2.83 | | | | 3.71 | | | | 1.60 | |
| | | | | | | | | | | | | | | | | | | | |
Total from investment operations | | | (0.03 | ) | | | 0.96 | | | | 3.01 | | | | 3.87 | | | | 1.75 | |
| | | | | | | | | | | | | | | | | | | | |
| Less dividends: | | | | | | | | | | | | | | | | | | | | |
From net investment income | | | (0.22 | ) | | | (0.15 | ) | | | (0.21 | ) | | | (0.18 | ) | | | (0.19 | ) |
| | | | | | | | | | | | | | | | | | | | |
Net asset value at end of year | | $ | 19.95 | | | $ | 20.20 | | | $ | 19.39 | | | $ | 16.59 | | | $ | 12.90 | |
| | | | | | | | | | | | | | | | | | | | |
Total investment return (b) | | | (0.13 | %) | | | 4.95 | % | | | 18.30 | % | | | 30.35 | % | | | 15.64 | % |
| Ratios (to average net assets)/Supplemental Data: | | | | | | | | | | | | | | | | | | | | |
Net investment income (loss) | | | 1.29 | % (c) | | | 1.01 | % | | | 0.98 | % | | | 1.11 | % | | | 1.22 | % |
Net expenses | | | 0.95 | % (d) | | | 0.96 | % | | | 1.00 | % | | | 1.05 | % | | | 1.06 | % |
Portfolio turnover rate | | | 164 | % | | | 158 | % | | | 165 | % | | | 150 | % | | | 182 | % |
Net assets at end of year (in 000’s) | | $ | 42,928 | | | $ | 52,985 | | | $ | 34,139 | | | $ | 19,011 | | | $ | 12,402 | |
| (a) | Per share data based on average shares outstanding during the year. |
| (b) | Total investment return is calculated exclusive of sales charges and assumes the reinvestment of dividends and distributions. |
| (c) | Without the custody fee reimbursement, net investment income (loss) would have been 1.28 %. |
| (d) | Without the custody fee reimbursement, net expenses would have been 0.96%. |
| | | | | | | | | | | | | | | | | | | | |
| | | Year ended October 31, | |
| Investor Class | | 2016 | | | 2015 | | | 2014 | | | 2013 | | | 2012 | |
Net asset value at beginning of year | | $ | 20.19 | | | $ | 19.38 | | | $ | 16.58 | | | $ | 12.89 | | | $ | 11.32 | |
| | | | | | | | | | | | | | | | | | | | |
Net investment income (loss) (a) | | | 0.21 | | | | 0.16 | | | | 0.13 | | | | 0.10 | | | | 0.09 | |
Net realized and unrealized gain (loss) on investments | | | (0.29 | ) | | | 0.76 | | | | 2.82 | | | | 3.70 | | | | 1.61 | |
| | | | | | | | | | | | | | | | | | | | |
Total from investment operations | | | (0.08 | ) | | | 0.92 | | | | 2.95 | | | | 3.80 | | | | 1.70 | |
| | | | | | | | | | | | | | | | | | | | |
| Less dividends: | | | | | | | | | | | | | | | | | | | | |
From net investment income | | | (0.18 | ) | | | (0.11 | ) | | | (0.15 | ) | | | (0.11 | ) | | | (0.13 | ) |
| | | | | | | | | | | | | | | | | | | | |
Net asset value at end of year | | $ | 19.93 | | | $ | 20.19 | | | $ | 19.38 | | | $ | 16.58 | | | $ | 12.89 | |
| | | | | | | | | | | | | | | | | | | | |
Total investment return (b) | | | (0.39 | %) | | | 4.77 | % | | | 17.94 | % | | | 29.75 | % | | | 15.15 | % |
| Ratios (to average net assets)/Supplemental Data: | | | | | | | | | | | | | | | | | | | | |
Net investment income (loss) | | | 1.05 | % (c) | | | 0.82 | % | | | 0.71 | % | | | 0.72 | % | | | 0.72 | % |
Net expenses | | | 1.20 | % (d) | | | 1.17 | % | | | 1.28 | % | | | 1.46 | % | | | 1.56 | % |
Portfolio turnover rate | | | 164 | % | | | 158 | % | | | 165 | % | | | 150 | % | | | 182 | % |
Net assets at end of year (in 000’s) | | $ | 21,880 | | | $ | 22,939 | | | $ | 20,856 | | | $ | 18,436 | | | $ | 15,093 | |
| (a) | Per share data based on average shares outstanding during the year. |
| (b) | Total investment return is calculated exclusive of sales charges and assumes the reinvestment of dividends and distributions. |
| (c) | Without the custody fee reimbursement, net investment income (loss) would have been 1.04%. |
| (d) | Without the custody fee reimbursement, net expenses would have been 1.21%. |
| | | | | | |
The notes to the financial statements are an integral part of,
and should be read in conjunction with, the financial statements. | | | | | 17 | |
Financial Highlights selected per share data and ratios
| | | | | | | | | | | | | | | | | | | | |
| | | Year ended October 31, | |
| Class B | | 2016 | | | 2015 | | | 2014 | | | 2013 | | | 2012 | |
Net asset value at beginning of year | | $ | 18.49 | | | $ | 17.81 | | | $ | 15.27 | | | $ | 11.87 | | | $ | 10.43 | |
| | | | | | | | | | | | | | | | | | | | |
Net investment income (loss) (a) | | | 0.05 | | | | 0.02 | | | | (0.00 | )‡ | | | (0.00 | )‡ | | | (0.00 | )‡ |
Net realized and unrealized gain (loss) on investments | | | (0.26 | ) | | | 0.69 | | | | 2.59 | | | | 3.42 | | | | 1.48 | |
| | | | | | | | | | | | | | | | | | | | |
Total from investment operations | | | (0.21 | ) | | | 0.71 | | | | 2.59 | | | | 3.42 | | | | 1.48 | |
| | | | | | | | | | | | | | | | | | | | |
| Less dividends: | | | | | | | | | | | | | | | | | | | | |
From net investment income | | | (0.03 | ) | | | (0.03 | ) | | | (0.05 | ) | | | (0.02 | ) | | | (0.04 | ) |
| | | | | | | | | | | | | | | | | | | | |
Net asset value at end of year | | $ | 18.25 | | | $ | 18.49 | | | $ | 17.81 | | | $ | 15.27 | | | $ | 11.87 | |
| | | | | | | | | | | | | | | | | | | | |
Total investment return (b) | | | (1.12 | %) | | | 4.01 | % | | | 17.00 | % | | | 28.87 | % | | | 14.23 | % |
| Ratios (to average net assets)/Supplemental Data: | | | | | | | | | | | | | | | | | | | | |
Net investment income (loss) | | | 0.30 | % (c) | | | 0.09 | % | | | (0.03 | %) | | | (0.03 | %) | | | (0.02 | %) |
Net expenses | | | 1.95 | % (d) | | | 1.92 | % | | | 2.03 | % | | | 2.21 | % | | | 2.31 | % |
Portfolio turnover rate | | | 164 | % | | | 158 | % | | | 165 | % | | | 150 | % | | | 182 | % |
Net assets at end of year (in 000’s) | | $ | 6,604 | | | $ | 6,816 | | | $ | 7,240 | | | $ | 6,760 | | | $ | 5,836 | |
| ‡ | Less than one cent per share. |
| (a) | Per share data based on average shares outstanding during the year. |
| (b) | Total investment return is calculated exclusive of sales charges and assumes the reinvestment of dividends and distributions. |
| (c) | Without the custody fee reimbursement, net investment income (loss) would have been 0.29%. |
| (d) | Without the custody fee reimbursement, net expenses would have been 1.96%. |
| | | | | | | | | | | | | | | | | | | | |
| | | Year ended October 31, | |
| Class C | | 2016 | | | 2015 | | | 2014 | | | 2013 | | | 2012 | |
Net asset value at beginning of year | | $ | 18.48 | | | $ | 17.80 | | | $ | 15.26 | | | $ | 11.87 | | | $ | 10.43 | |
| | | | | | | | | | | | | | | | | | | | |
Net investment income (loss) (a) | | | 0.06 | | | | 0.01 | | | | (0.02 | ) | | | (0.01 | ) | | | (0.00 | )‡ |
Net realized and unrealized gain (loss) on investments | | | (0.27 | ) | | | 0.70 | | | | 2.61 | | | | 3.42 | | | | 1.48 | |
| | | | | | | | | | | | | | | | | | | | |
Total from investment operations | | | (0.21 | ) | | | 0.71 | | | | 2.59 | | | | 3.41 | | | | 1.48 | |
| | | | | | | | | | | | | | | | | | | | |
| Less dividends: | | | | | | | | | | | | | | | | | | | | |
From net investment income | | | (0.03 | ) | | | (0.03 | ) | | | (0.05 | ) | | | (0.02 | ) | | | (0.04 | ) |
| | | | | | | | | | | | | | | | | | | | |
Net asset value at end of year | | $ | 18.24 | | | $ | 18.48 | | | $ | 17.80 | | | $ | 15.26 | | | $ | 11.87 | |
| | | | | | | | | | | | | | | | | | | | |
Total investment return (b) | | | (1.12 | %) | | | 4.01 | % | | | 17.01 | % | | | 28.78 | % | | | 14.23 | % |
| Ratios (to average net assets)/Supplemental Data: | | | | | | | | | | | | | | | | | | | | |
Net investment income (loss) | | | 0.34 | % (c) | | | 0.06 | % | | | (0.10 | %) | | | (0.10 | %) | | | (0.02 | %) |
Net expenses | | | 1.95 | % (d) | | | 1.92 | % | | | 2.03 | % | | | 2.21 | % | | | 2.31 | % |
Portfolio turnover rate | | | 164 | % | | | 158 | % | | | 165 | % | | | 150 | % | | | 182 | % |
Net assets at end of year (in 000’s) | | $ | 16,509 | | | $ | 25,775 | | | $ | 16,536 | | | $ | 3,441 | | | $ | 1,575 | |
| ‡ | Less than one cent per share. |
| (a) | Per share data based on average shares outstanding during the year. |
| (b) | Total investment return is calculated exclusive of sales charges and assumes the reinvestment of dividends and distributions. |
| (c) | Without the custody fee reimbursement, net investment income (loss) would have been 0.33%. |
| (d) | Without the custody fee reimbursement, net expenses would have been 1.96%. |
| | | | |
| 18 | | MainStay Common Stock Fund | | The notes to the financial statements are an integral part of,
and should be read in conjunction with, the financial statements. |
Financial Highlights selected per share data and ratios
| | | | | | | | | | | | | | | | | | | | |
| | | Year ended October 31, | |
| Class I | | 2016 | | | 2015 | | | 2014 | | | 2013 | | | 2012 | |
Net asset value at beginning of year | | $ | 20.29 | | | $ | 19.45 | | | $ | 16.64 | | | $ | 12.94 | | | $ | 11.38 | |
| | | | | | | | | | | | | | | | | | | | |
Net investment income (loss) (a) | | | 0.31 | | | | 0.26 | | | | 0.22 | | | | 0.20 | | | | 0.18 | |
Net realized and unrealized gain (loss) on investments | | | (0.29 | ) | | | 0.76 | | | | 2.83 | | | | 3.71 | | | | 1.60 | |
| | | | | | | | | | | | | | | | | | | | |
Total from investment operations | | | 0.02 | | | | 1.02 | | | | 3.05 | | | | 3.91 | | | | 1.78 | |
| | | | | | | | | | | | | | | | | | | | |
| Less dividends: | | | | | | | | | | | | | | | | | | | | |
From net investment income | | | (0.27 | ) | | | (0.18 | ) | | | (0.24 | ) | | | (0.21 | ) | | | (0.22 | ) |
| | | | | | | | | | | | | | | | | | | | |
Net asset value at end of year | | $ | 20.04 | | | $ | 20.29 | | | $ | 19.45 | | | $ | 16.64 | | | $ | 12.94 | |
| | | | | | | | | | | | | | | | | | | | |
Total investment return (b) | | | 0.12 | % | | | 5.26 | % | | | 18.55 | % | | | 30.65 | % | | | 15.89 | % |
| Ratios (to average net assets)/Supplemental Data: | | | | | | | | | | | | | | | | | | | | |
Net investment income (loss) | | | 1.55 | %(c) | | | 1.30 | % | | | 1.24 | % | | | 1.40 | % | | | 1.48 | % |
Net expenses | | | 0.70 | %(d) | | | 0.71 | % | | | 0.75 | % | | | 0.80 | % | | | 0.81 | % |
Portfolio turnover rate | | | 164 | % | | | 158 | % | | | 165 | % | | | 150 | % | | | 182 | % |
Net assets at end of year (in 000’s) | | $ | 87,774 | | | $ | 91,561 | | | $ | 108,343 | | | $ | 77,476 | | | $ | 75,985 | |
| (a) | Per share data based on average shares outstanding during the year. |
| (b) | Total investment return is calculated exclusive of sales charges and assumes the reinvestment of dividends and distributions. Class I shares are not subject to sales charges. |
| (c) | Without the custody fee reimbursement, net investment income (loss) would have been 1.54%. |
| (d) | Without the custody fee reimbursement, net expenses would have been 0.71%. |
| | | | | | | | |
| Class R3 | | February 29,
2016**
through
October 31,
2016 | | | | |
Net asset value at beginning of period | | $ | 18.44 | | | | | |
| | | | | | | | |
Net investment income (loss) (a) | | | 0.10 | | | | | |
Net realized and unrealized gain (loss) on investments | | | 1.36 | | | | | |
| | | | | | | | |
Total from investment operations | | | 1.46 | | | | | |
| | | | | | | | |
Net asset value at end of period | | $ | 19.90 | | | | | |
| | | | | | | | |
Total investment return (b) | | | 7.92 | %(c)(d) | | | | |
| Ratios (to average net assets)/Supplemental Data: | | | | | | | | |
Net investment income (loss) | | | 0.74 | %††(e) | | | | |
Net expenses | | | 1.31 | %††(f) | | | | |
Portfolio turnover rate | | | 164 | % | | | | |
Net assets at end of period (in 000’s) | | $ | 29 | | | | | |
| ** | Commencement of operations. |
| (a) | Per share data based on average shares outstanding during the period. |
| (b) | Total investment return is calculated exclusive of sales charges and assumes the reinvestment of dividends and distributions. Class R3 shares are not subject to sales charges. |
| (c) | Total investment return is not annualized. |
| (d) | Total investment return may reflect adjustments to conform to generally accepted accounting principles. |
| (e) | Without the custody fee reimbursement, net investment income (loss) would have been 0.73%. |
| (f) | Without the custody fee reimbursement, net expenses would have been 1.32%. |
| | | | | | |
The notes to the financial statements are an integral part of,
and should be read in conjunction with, the financial statements. | | | | | 19 | |
Notes to Financial Statements
Note 1–Organization and Business
The MainStay Funds (the “Trust”) was organized on January 9, 1986, as a Massachusetts business trust. The Trust is registered under the Investment Company Act of 1940, as amended (the “1940 Act”), as an open-end management investment company, and is comprised of twelve funds (collectively referred to as the “Funds”). These financial statements and notes relate to the MainStay Common Stock Fund (the “Fund”), a “diversified fund”, as that term is defined in the 1940 Act, as interpreted or modified by regulatory authorities having jurisdiction, from time to time.
The Fund currently offers seven classes of shares. Class A and Class B shares commenced operations on June 1, 1998. Class C shares commenced operations on September 1, 1998. Class I shares commenced operations on December 28, 2004. Class R2 shares were first effective on December 14, 2007. There were no investment operations for Class R2 during the year ended October 31, 2016 or in any period since Class R2’s effectiveness. Investor Class shares commenced operations on February 28, 2008. Class R3 shares commenced operations on February 29, 2016. Class A and Investor Class shares are offered at net asset value (“NAV”) per share plus an initial sales charge. No initial sales charge applies to investments of $1 million or more (and certain other qualified purchases) in Class A and Investor Class shares, but a contingent deferred sales charge (“CDSC”) of 1.00% may be imposed on certain redemptions of such shares made within one year of the date of purchase on shares that were purchased without an initial sales charge made before January 1, 2017. Effective January 1, 2017, a CDSC of 1.00% may be imposed on certain redemptions of Class A and Investor Class shares made within 24 months of the date of purchase of such shares that were made without an initial sales charge. Class B and Class C shares are offered at NAV without an initial sales charge, although a CDSC that declines depending on the number of years a shareholder has held its Class B shares may be imposed on redemptions made within six years of the date of purchase of such shares and a 1.00% CDSC may be imposed on redemptions made within one year of the date of purchase of Class C shares. Class I, Class R2 and Class R3 shares are offered at NAV and are not subject to a sales charge. Depending upon eligibility, Class B shares convert to either Class A or Investor Class shares at the end of the calendar quarter eight years after the date they were purchased. Additionally, depending upon eligibility, Class A shares may convert to Investor Class shares and Investor Class shares may convert to Class A shares. Under certain circumstances and as may be permitted by the Trust’s multiple class plan under Rule 18f-3 of the 1940 Act, an exchange/conversion may be made from specified share classes of the Fund to one or more other share classes of the Fund as disclosed in the capital share transactions within these notes. The seven classes of shares have the same voting (except for issues that relate solely to one class), dividend, liquidation and other rights, and the same terms and conditions, except that Class B and Class C shares are subject to higher distribution and/or service fee rates than Class A, Investor Class, Class R2 and Class R3 shares under a distribution plan pursuant to Rule 12b-1 under the 1940 Act. Class I shares are not subject to a distribution and/or service fee. Class R2 and Class R3 shares are subject to a shareholder service fee. This is in addition to any fees paid under a distribution plan, where applicable.
The Fund’s investment objective is to seek long-term growth of capital.
Note 2–Significant Accounting Policies
The Fund is an investment company and accordingly follows the investment company accounting and reporting guidance of the Financial Accounting Standards Board (“FASB”) Accounting Standard Codification Topic 946 Financial Services—Investment Companies. The Fund prepares its financial statements in accordance with generally accepted accounting principles (“GAAP”) in the United States of America and follows the significant accounting policies described below.
(A) Securities Valuation. Investments are usually valued as of the close of regular trading on the New York Stock Exchange (the “Exchange”) (usually 4:00 p.m. Eastern time) on each day the Fund is open for business (“valuation date”).
The Board of Trustees (the “Board”) adopted procedures establishing methodologies for the valuation of the Fund’s securities and other assets and delegated the responsibility for valuation determinations under those procedures to the Valuation Committee of the Trust (the “Valuation Committee”). The Board authorized the Valuation Committee to appoint a Valuation Sub-Committee (the “Sub-Committee”) to deal in the first instance with establishing the prices of securities for which market quotations are not readily available or the prices of which are not otherwise readily determinable under these procedures. The Sub-Committee meets (in person, via electronic mail or via teleconference) on an as-needed basis. Subsequently, the Valuation Committee meets to ensure that actions taken by the Sub-Committee were appropriate. The procedures recognize that, subject to the oversight of the Board and unless otherwise noted, the responsibility for the day-to-day valuation of portfolio assets (including fair value measurements for the Fund’s assets and liabilities) rests with New York Life Investment Management LLC (“New York Life Investments” or the “Manager”), aided to whatever extent necessary by the Subadvisor (as defined in Note 3(A)) to the Fund.
To assess the appropriateness of security valuations, the Manager, Subadvisor or the Fund’s third party service provider, who is subject to oversight by the Manager, regularly compares prior day prices, prices on comparable securities, and the sale prices to the prior and current day prices and challenges prices with changes exceeding certain tolerance levels with third party pricing services or broker sources. For those securities valued through either a standardized fair valuation methodology or a fair valuation measurement, the Sub-Committee deals in the first instance with such valuation and the Valuation Committee reviews and affirms, if appropriate, the reasonableness of the valuation based on such methodologies and measurements on a regular basis after considering all relevant information that is reasonably available. Any action taken by the Sub-Committee with respect to the valuation of a portfolio security or other asset is submitted by the Valuation Committee to the Board for its review and ratification, if appropriate, at its next regularly scheduled meeting.
“Fair value” is defined as the price the Fund would reasonably expect to receive upon selling an asset or liability in an orderly transaction to an independent buyer in the principal or most advantageous market for the asset or liability. Fair value measurements are determined within a framework that establishes a three-tier hierarchy which maximizes the use of observable market data and minimizes the use of unobservable inputs to establish a classification of fair value measurements for disclosure purposes. “Inputs” refer broadly to the assumptions that market
| | |
| 20 | | MainStay Common Stock Fund |
participants would use in pricing the asset or liability, including assumptions about risk, such as the risk inherent in a particular valuation technique used to measure fair value using a pricing model and/or the risk inherent in the inputs for the valuation technique. Inputs may be observable or unobservable. Observable inputs reflect the assumptions market participants would use in pricing the asset or liability based on market data obtained from sources independent of the Fund. Unobservable inputs reflect the Fund’s own assumptions about the assumptions market participants would use in pricing the asset or liability based on the information available. The inputs or methodology used for valuing assets or liabilities may not be an indication of the risks associated with investing in those assets or liabilities. The three-tier hierarchy of inputs is summarized below.
| • | | Level 1—quoted prices in active markets for an identical asset or liability |
| • | | Level 2—other significant observable inputs (including quoted prices for a similar asset or liability in active markets, interest rates and yield curves, prepayment speeds, credit risk, etc.) |
| • | | Level 3—significant unobservable inputs (including the Fund’s own assumptions about the assumptions that market participants would use in measuring fair value of an asset or liability) |
The level of an asset or liability within the fair value hierarchy is based on the lowest level of an input, both individually and in the aggregate, that is significant to the fair value measurement. As of October 31, 2016, the aggregate value by input level of the Fund’s assets and liabilities is included at the end of the Fund’s Portfolio of Investments.
The Fund may use third party vendor evaluations, whose prices may be derived from one or more of the following standard inputs, among others:
| | |
• Broker/dealer quotes | | • Issuer spreads |
• Two-sided markets | | • Benchmark securities |
• Bids/offers | | • Reference data (corporate actions or material event notices) |
• Industry and economic events | | • Monthly payment information |
• Reported trades | | |
An asset or liability for which market values cannot be measured using the methodologies described above is valued by methods deemed reasonable in good faith by the Valuation Committee, following the procedures established by the Board, to represent fair value. Under these procedures, the Fund generally uses a market-based approach which may use related or comparable assets or liabilities, recent transactions, market multiples, book values, and other relevant information. The Fund may also use an income-based valuation approach in which the anticipated future cash flows of the asset or liability are discounted to calculate fair value. Discounts may also be applied due to the nature and/or duration of any restrictions on the disposition of the asset or liability. Fair value represents a good faith approximation of the value of a security. Fair value determinations involve the consideration of a number of subjective factors, an analysis of applicable facts and circumstances and the exercise of judgment. As a result, it is possible that the fair value for a security determined in good faith in accordance with the Fund’s valuation procedures may differ from valuations for the same security determined by other funds using their own valuation
procedures. Although the Fund’s valuation procedures are designed to value a security at the price the Fund may reasonably expect to receive upon its sale in an orderly transaction, there can be no assurance that any fair value determination thereunder would, in fact, approximate the amount that the Fund would actually realize upon the sale of the security or the price at which the security would trade if a reliable market price were readily available. During the year ended October 31, 2016, there were no material changes to the fair value methodologies.
Equity and non-equity securities which may be valued in this manner include, but are not limited to: (i) a security for which trading has been halted or suspended; (ii) a debt security that has recently gone into default and for which there is not a current market quotation; (iii) a security of an issuer that has entered into a restructuring; (iv) a security that has been de-listed from a national exchange; (v) a security for which the market price is not readily available from a third party pricing source or, if so provided, does not, in the opinion of the Manager or Subadvisor reflect the security’s market value; (vi) a security subject to trading collars for which no or limited trading takes place; and (vii) a security whose principal market has been temporarily closed at a time when, under normal conditions, it would be open. Securities for which market quotations or observable inputs are not readily available are generally categorized as Level 3 in the hierarchy. As of October 31, 2016, there were no securities held by the Fund that were fair valued in such a manner.
Equity securities and shares of Exchange-Traded Funds (“ETFs”) are valued at the last quoted sales prices as of the close of regular trading on the relevant exchange on each valuation date. Securities that are not traded on the valuation date are valued at the mean of the last quoted bid and ask prices. Prices are normally taken from the principal market in which each security trades. Investments in mutual funds, including money market funds, are valued at their respective NAVs as of the close of the Exchange on the valuation date. These securities are generally categorized as Level 1 in the hierarchy.
Temporary cash investments acquired in excess of 60 days to maturity at the time of purchase are valued using the latest bid prices or using valuations based on a matrix system (which considers such factors as security prices, yields, maturities, and ratings), both as furnished by independent pricing services. Other temporary cash investments which mature in 60 days or less at the time of purchase (“Short-Term Investments”) are valued using the amortized cost method of valuation, unless the use of such method would be inappropriate. The amortized cost method involves valuing a security at its cost on the date of purchase and thereafter assuming a constant amortization to maturity of the difference between such cost and the value on maturity date. Amortized cost approximates the current fair value of a security. Securities valued using the amortized cost method are not valued using quoted prices in an active market and are generally categorized as Level 2 in the hierarchy.
The information above is not intended to reflect an exhaustive list of the methodologies that may be used to value portfolio investments. The valuation procedures permit the use of a variety of valuation methodologies in connection with valuing portfolio investments. The methodology used for a specific type of investment may vary based on the market data available or other considerations. The methodologies summarized above may not represent the specific means by which portfolio investments are valued on any particular business day.
Notes to Financial Statements (continued)
(B) Income Taxes. The Fund’s policy is to comply with the requirements of the Internal Revenue Code of 1986, as amended (the “Internal Revenue Code”), applicable to regulated investment companies and to distribute all of its taxable income to the shareholders of the Fund within the allowable time limits. Therefore, no federal, state and local income tax provisions are required.
Management evaluates the Fund’s tax positions to determine if the tax positions taken meet the minimum recognition threshold in connection with accounting for uncertainties in income tax positions taken or expected to be taken for the purposes of measuring and recognizing tax liabilities in the financial statements. Recognition of tax benefits of an uncertain tax position is permitted only to the extent the position is “more likely than not” to be sustained assuming examination by taxing authorities. Management has analyzed the Fund’s tax positions taken on federal, state and local income tax returns for all open tax years (for up to three tax years), and has concluded that no provisions for federal, state and local income tax are required in the Fund’s financial statements. The Fund’s federal, state and local income and federal excise tax returns for tax years for which the applicable statutes of limitations have not expired are subject to examination by the Internal Revenue Service and state and local departments of revenue.
(C) Dividends and Distributions to Shareholders. Dividends and distributions are recorded on the ex-dividend date. The Fund intends to declare and pay dividends from net investment income and distributions from net realized capital and currency gains, if any, at least annually. Unless the shareholder elects otherwise, all dividends and distributions are reinvested in the same class of shares of the Fund, at NAV. Dividends and distributions to shareholders are determined in accordance with federal income tax regulations and may differ from GAAP.
(D) Security Transactions and Investment Income. The Fund records security transactions on the trade date. Realized gains and losses on security transactions are determined using the identified cost method. Dividend income is recognized on the ex-dividend date; net of any foreign tax withheld at the source, and interest income is accrued as earned using the effective interest rate method. Discounts and premiums on Short-Term Investments are accreted and amortized, respectively, on the straight-line method. The straight-line method approximates the effective interest method for Short-Term investments. Income from payment-in-kind securities is accreted daily based on the effective interest method.
Investment income and realized and unrealized gains and losses on investments of the Fund are allocated to separate classes of shares pro rata based upon their relative net assets on the date the income is earned or realized and unrealized gains and losses are incurred.
(E) Expenses. Expenses of the Trust are allocated to the individual Funds in proportion to the net assets of the respective Funds when the expenses are incurred, except where direct allocations of expenses can be made. Expenses (other than transfer agent expenses and fees incurred under the shareholder services plans and/or the distribution plans further discussed in Note 3(B)) are allocated to separate classes of shares pro rata based upon their relative net assets on the date the expenses are incurred. The expenses borne by the Fund, including
those of related parties to the Fund, are shown in the Statement of Operations.
(F) Use of Estimates. In preparing financial statements in conformity with GAAP, management makes estimates and assumptions that affect the reported amounts and disclosures in the financial statements. Actual results could differ from those estimates.
(G) Repurchase Agreements. The Fund may enter into repurchase agreements to earn income. The Fund may enter into repurchase agreements only with financial institutions that are deemed by the Manager or Subadvisor to be creditworthy, pursuant to guidelines established by the Board. During the term of any repurchase agreement, the Manager or Subadvisor will continue to monitor the creditworthiness of the seller. Under the 1940 Act, repurchase agreements are considered to be collateralized loans by the Fund to the seller secured by the securities transferred to the Fund.
When the Fund enters into repurchase agreements, the Fund’s custodian takes possession of the collateral pledged for investments in the repurchase agreement. The underlying collateral is valued daily on a mark to market basis to determine if the value, including accrued interest, exceeds the repurchase price. In the event of the seller’s default on the obligation to repurchase, the Fund has the right to liquidate the collateral and apply the proceeds in satisfaction of the obligation. Under certain circumstances, such as in the event of default or bankruptcy by the counterparty to the agreement, realization and/or retention of the collateral may be subject to legal proceedings and possible realized loss to the Fund.
(H) Securities Lending. In order to realize additional income, the Fund may engage in securities lending, subject to the limitations set forth in the 1940 Act and relevant guidance by the staff of the Securities and Exchange Commission (“SEC”). In the event the Fund does engage in securities lending, the Fund will lend through its custodian, State Street Bank and Trust Company (“State Street”). State Street will manage the Fund’s cash collateral in accordance with the lending agreement between the Fund and State Street, and indemnify the Fund against counterparty risk. The loans will be collateralized by cash or securities at least equal at all times to the market value of the securities loaned. Collateral will consist of U.S. government securities, cash equivalents or irrevocable letters of credit. The Fund may bear the risk of delay in recovery of, or loss of rights in, the securities loaned should the borrower of the securities experience financial difficulty. The Fund may also record a realized gain or loss on securities deemed sold due to a borrower’s inability to return securities on loan. The Fund bears the risk of any loss on investment of the collateral. The Fund will receive compensation for lending its securities in the form of fees or it will retain a portion of interest on the investment of any cash received as collateral. The Fund will also continue to receive interest and dividends on the securities loaned and any gain or loss in the market price of the securities loaned that may occur during the term of the loan will be for the account of the Fund. During the year ended October 31, 2016, the Fund did not have any portfolio securities on loan.
(I) Indemnifications. Under the Trust’s organizational documents, its officers and trustees are indemnified against certain liabilities that may arise out of performance of their duties to the Trust. Additionally, in the normal course of business, the Fund enters into contracts with third-party service providers that contain a variety of representations and warranties and which may provide general indemnifications. The Fund’s maximum exposure under these arrangements is unknown, as this
| | |
| 22 | | MainStay Common Stock Fund |
would involve future claims that may be made against the Fund that have not yet occurred. Based on experience, management is of the view that the risk of loss in connection with these potential indemnification obligations is remote. However, there can be no assurance that material liabilities related to such obligations will not arise in the future, which could adversely impact the Fund.
Note 3–Fees and Related Party Transactions
(A) Manager and Subadvisor. New York Life Investments, a registered investment adviser and an indirect, wholly-owned subsidiary of New York Life Insurance Company (“New York Life”), serves as the Fund’s Manager, pursuant to an Amended and Restated Management Agreement (“Management Agreement”). The Manager provides offices, conducts clerical, recordkeeping and bookkeeping services, and keeps most of the financial and accounting records required to be maintained by the Fund. Except for the portion of salaries and expenses that are the responsibility of the Fund, the Manager pays the salaries and expenses of all personnel affiliated with the Fund and certain operational expenses of the Fund. The Fund reimburses New York Life Investments in an amount equal to a portion of the compensation of the Chief Compliance Officer of the Fund. Cornerstone Capital Management Holdings LLC (“Cornerstone Holdings” or “Subadvisor”), a registered investment adviser and an indirect, wholly-owned subsidiary of New York Life, serves as Subadvisor to the Fund and is responsible for the day-to-day portfolio management of the Fund. Pursuant to the terms of the Amended and Restated Subadvisory Agreement (“Subadvisory Agreement”) between New York Life Investments and Cornerstone Holdings, New York Life Investments pays for the services of the Subadvisor.
Under the Management Agreement, the Fund pays the Manager a monthly fee for services performed and facilities furnished at an annual rate of the Fund’s average daily net assets as follows: 0.55% up to $500 million; 0.525% from $500 million to $1 billion; and 0.50% on assets in excess of $1 billion. During the year ended October 31, 2016, the effective management fee rate was 0.55%.
New York Life Investments has agreed to voluntarily waive fees and/or reimburse expenses so that Total Annual Fund Operating Expenses of a class do not exceed the following percentages of average daily net assets: Investor Class, 1.85%; Class B, 2.60%; and Class C, 2.60%. Total Annual Fund Operating Expenses excludes taxes, interest, litigation, extraordinary expenses, brokerage and other transaction expenses relating to the purchase or sale of portfolio investments, and acquired (underlying) fund fees and expenses. These voluntary waivers or reimbursements may be discontinued at any time.
During the year ended October 31, 2016, New York Life Investments earned fees from the Fund in the amount of $1,036,352.
State Street provides sub-administration and sub-accounting services to the Fund pursuant to an agreement with New York Life Investments. These services include calculating the daily NAVs of the Fund, maintaining the general ledger and sub-ledger accounts for the calculation of the Fund’s NAVs, and assisting New York Life Investments in conducting various aspects of the Fund’s administrative operations. For providing these services to the Fund, State Street is compensated by New York Life Investments.
(B) Distribution, Service and Shareholder Service Fees. The Trust, on behalf of the Fund, has entered into a distribution agreement with NYLIFE Distributors LLC (the “Distributor”), an indirect, wholly-owned subsidiary of New York Life. The Fund has adopted distribution plans (the “Plans”) in accordance with the provisions of Rule 12b-1 under the 1940 Act.
Pursuant to the Class A, Investor Class and Class R2 Plans, the Distributor receives a monthly distribution fee from the Class A, Investor Class and Class R2 shares at an annual rate of 0.25% of the average daily net assets of the Class A, Investor Class and Class R2 shares for distribution and/or service activities as designated by the Distributor. Pursuant to the Class B and Class C Plans, Class B and Class C shares pay the Distributor a monthly distribution fee at an annual rate of 0.75% of the average daily net assets of the Class B and Class C shares, along with a service fee at an annual rate of 0.25% of the average daily net assets of the Class B and Class C shares, for a total 12b-1 fee of 1.00%. Pursuant to the Class R3 Plan, the Distributor receives a monthly distribution and/or service fee from the Class R3 shares at an annual rate of 0.50% of the average daily net assets of the Class R3 shares. Class I shares are not subject to a distribution and/or service fee.
The Plans provide that the distribution and service fees are payable to the Distributor regardless of the amounts actually expended by the Distributor for distribution of the Fund’s shares and service activities.
In accordance with the Shareholder Services Plan for the Class R2 and Class R3 shares, the Manager has agreed to provide, through its affiliates or independent third parties, various shareholder and administrative support services to shareholders of the Class R2 and Class R3 shares. For its services, the Manager, its affiliates or independent third party service providers are entitled to a Shareholder Service Fee accrued daily and paid monthly at an annual rate of 0.10% of the average daily net assets of the Class R2 and Class R3 shares. This is in addition to any fees paid under a distribution plan, where applicable.
(C) Sales Charges. During the year ended October 31, 2016, the Fund was advised by the Distributor that the amount of initial sales charges retained on sales of Class A and Investor Class shares were $7,171 and $8,381, respectively. During the year ended October 31, 2016, the Fund was also advised that the Distributor retained CDSCs on redemptions of Class A, Class B and Class C shares of $308, $28,076 and $3,632, respectively.
(D) Transfer, Dividend Disbursing and Shareholder Servicing Agent. NYLIM Service Company LLC, an affiliate of New York Life Investments, is the Fund’s transfer, dividend disbursing and shareholder servicing agent pursuant to an agreement between NYLIM Service Company LLC and the Trust. NYLIM Service Company LLC has entered into an agreement with Boston Financial Data Services, Inc. (“BFDS”) pursuant to which BFDS performs certain transfer agent services on behalf of NYLIM Service Company LLC. During the year
Notes to Financial Statements (continued)
ended October 31, 2016, transfer agent expenses incurred by the Fund were as follows:
| | | | |
Class A | | $ | 18,102 | |
Investor Class | | | 63,895 | |
Class B | | | 18,978 | |
Class C | | | 60,532 | |
Class I | | | 33,882 | |
Class R3 | | | 7 | |
(E) Small Account Fee. Shareholders with small accounts adversely impact the cost of providing transfer agency services. In an effort to reduce total transfer agency expenses, the Fund has implemented a small account fee on certain types of accounts. Certain shareholders with an account balance of less than $1,000 are charged an annual per account fee of $20 (assessed semi-annually), the proceeds from which offset transfer agent fees as reflected in the Statement of Operations.
(F) Capital. As of October 31, 2016, New York Life and its affiliates beneficially held shares of the Fund with values and percentages of net assets as follows:
Note 4–Federal Income Tax
As of October 31, 2016, the components of accumulated gain (loss) on a tax basis were as follows:
| | | | | | | | | | | | | | | | |
Ordinary
Income | | Accumulated
Capital and Other Gain (Loss) | | | Other
Temporary
Differences | | | Unrealized
Appreciation
(Depreciation) | | | Total
Accumulated Gain (Loss) | |
$1,857,580 | | $ | (29,133,054 | ) | | $ | — | | | $ | 7,870,928 | | | $ | (19,404,546 | ) |
The difference between book-basis and tax-basis unrealized appreciation (depreciation) is primarily due to wash sale adjustments and return of capital distributions received.
The following table discloses the current year reclassifications between undistributed net investment income (loss), accumulated net realized gain (loss) on investments, and additional paid-in capital arising from permanent differences; net assets as of October 31, 2016 were not affected.
| | | | | | | | | | |
Undistributed
Net Investment
Income (Loss) | | | Accumulated
Net Realized
Gain (Loss) on
Investments | | | Additional
Paid-In
Capital | |
| $ | (57,901 | ) | | $ | 57,901 | | | $ | — | |
The reclassifications for the Fund are primarily due to return of capital distributions received, and capital gain distributions from Real Estate Investment Trusts (“REITs”).
Under the Regulated Investment Company Modernization Act of 2010, the Fund is permitted to carry forward capital losses incurred in taxable years beginning after December 22, 2010, for an unlimited period. However, any losses incurred during those future years will be required
to be utilized prior to the losses incurred in pre-enactment tax years. As a result of this ordering rule, pre-enactment capital loss carryforwards may be more likely to expire unused. Additionally, post-enactment capital losses that are carried forward will retain their character as either short-term or long-term capital losses rather than being considered all short-term as under previous law.
As of October 31, 2016, for federal income tax purposes, capital loss carryforwards of $29,133,054 were available as shown in the table below, to the extent provided by the regulations to offset future realized gains of the Fund through the years indicated. To the extent that these capital loss carryforwards are used to offset future realized gains, it is probable that the capital gains so offset will not be distributed to shareholders. No capital gain distributions shall be made until any capital loss carryforwards have been fully utilized or expired.
| | | | | | | | |
Capital Loss
Available Through | | Short-Term
Capital Loss
Amounts (000’s) | | | Long-Term
Capital Loss
Amounts (000’s) | |
| 2017 | | $ | 29,133 | | | $ | — | |
The Fund utilized $4,490,810 of capital loss carryforwards during the year ended October 31, 2016.
During the years ended October 31, 2016 and October 31, 2015, the tax character of distributions paid as reflected in the Statements of Changes in Net Assets was as follows:
| | | | | | | | |
| | | 2016 | | | 2015 | |
Distributions paid from: | | | | | | | | |
Ordinary Income | | $ | 2,000,136 | | | $ | 1,450,007 | |
Note 5–Custodian
State Street is the custodian of cash and securities held by the Fund. Custodial fees are charged to the Fund based on the Fund’s net assets and/or the market value of securities held by the Fund and the number of certain transactions incurred by the Fund.
Note 6–Line of Credit
The Fund and certain other funds managed by New York Life Investments, maintain a line of credit with a syndicate of banks in order to secure a source of funds for temporary purposes to meet unanticipated or excessive redemption requests.
Effective August 2, 2016, under an amended and restated credit agreement (the “Credit Agreement”), the aggregate commitment amount is $600,000,000 with an additional uncommitted amount of $100,000,000. The commitment fee is an annual rate of 0.15% of the average commitment amount payable quarterly, regardless of usage, to Bank of New York Mellon, who serves as the agent to the syndicate. The commitment fee is allocated among the Fund and certain affiliated funds based upon their respective net assets and other factors. Interest on any revolving credit loan is charged based upon the Federal Funds Advances Rate or the one month London InterBank Offered Rate, whichever is higher. The Credit Agreement expires on August 1, 2017, although the Fund, certain affiliated funds and the syndicate of banks may renew the Credit Agreement for an additional year on the same or different terms. Prior to August 2, 2016, the aggregate commitment amount was
| | |
| 24 | | MainStay Common Stock Fund |
$600,000,000 with an additional uncommitted amount of $100,000,000, and the commitment fee was at an annual rate of 0.10% of the average commitment amount. During the year ended October 31, 2016, there were no borrowings made or outstanding with respect to the Fund under the Credit Agreement.
Note 7–Interfund Lending Program
Pursuant to an exemptive order issued by the SEC, the Fund, along with certain other funds managed by New York Life Investments, may participate in an interfund lending program. The interfund lending program provides an alternate credit facility that permits the Fund and certain other funds managed by New York Life Investments to lend or borrow money for temporary purposes directly to or from one another, subject to the conditions of the exemptive order. During the year ended October 31, 2016, there were no interfund loans made or outstanding with respect to the Fund.
Note 8–Purchases and Sales of Securities (in 000’s)
During the year ended October 31, 2016, purchases and sales of securities, other than short-term securities, were $310,163 and $332,019, respectively.
Note 9–Capital Share Transactions
| | | | | | | | |
Class A | | Shares | | | Amount | |
Year ended October 31, 2016: | | | | | | | | |
Shares sold | | | 1,251,418 | | | $ | 24,675,950 | |
Shares issued to shareholders in reinvestment of dividends and distributions | | | 26,849 | | | | 520,878 | |
Shares redeemed | | | (1,802,139 | ) | | | (36,048,711 | ) |
| | | | |
Net increase (decrease) in shares outstanding before conversion | | | (523,872 | ) | | | (10,851,883 | ) |
Shares converted into Class A (See Note 1) | | | 66,498 | | | | 1,308,332 | |
Shares converted from Class A (See Note 1) | | | (13,967 | ) | | | (280,865 | ) |
| | | | |
Net increase (decrease) | | | (471,341 | ) | | $ | (9,824,416 | ) |
| | | | |
Year ended October 31, 2015: | | | | | | | | |
Shares sold | | | 1,548,299 | | | $ | 30,351,618 | |
Shares issued to shareholders in reinvestment of dividends and distributions | | | 15,457 | | | | 306,971 | |
Shares redeemed | | | (713,232 | ) | | | (14,201,162 | ) |
| | | | |
Net increase (decrease) in shares outstanding before conversion | | | 850,524 | | | | 16,457,427 | |
Shares converted into Class A (See Note 1) | | | 44,372 | | | | 894,606 | |
Shares converted from Class A (See Note 1) | | | (33,201 | ) | | | (635,327 | ) |
| | | | |
Net increase (decrease) | | | 861,695 | | | $ | 16,716,706 | |
| | | | |
| | | | | | | | |
Investor Class | | Shares | | | Amount | |
Year ended October 31, 2016: | | | | | | | | |
Shares sold | | | 122,624 | | | $ | 2,385,551 | |
Shares issued to shareholders in reinvestment of dividends and distributions | | | 10,373 | | | | 201,445 | |
Shares redeemed | | | (153,115 | ) | | | (3,008,109 | ) |
| | | | |
Net increase (decrease) in shares outstanding before conversion | | | (20,118 | ) | | | (421,113 | ) |
Shares converted into Investor Class (See Note 1) | | | 45,097 | | | | 893,686 | |
Shares converted from Investor Class (See Note 1) | | | (63,429 | ) | | | (1,248,269 | ) |
| | | | |
Net increase (decrease) | | | (38,450 | ) | | $ | (775,696 | ) |
| | | | |
Year ended October 31, 2015: | | | | | | | | |
Shares sold | | | 197,188 | | | $ | 3,922,117 | |
Shares issued to shareholders in reinvestment of dividends and distributions | | | 6,158 | | | | 122,419 | |
Shares redeemed | | | (177,345 | ) | | | (3,531,519 | ) |
| | | | |
Net increase (decrease) in shares outstanding before conversion | | | 26,001 | | | | 513,017 | |
Shares converted into Investor Class (See Note 1) | | | 73,603 | | | | 1,428,217 | |
Shares converted from Investor Class (See Note 1) | | | (39,541 | ) | | | (799,054 | ) |
| | | | |
Net increase (decrease) | | | 60,063 | | | $ | 1,142,180 | |
| | | | |
|
| |
Class B | | Shares | | | Amount | |
Year ended October 31, 2016: | | | | | | | | |
Shares sold | | | 119,948 | | | $ | 2,140,730 | |
Shares issued to shareholders in reinvestment of dividends and distributions | | | 638 | | | | 11,415 | |
Shares redeemed | | | (88,530 | ) | | | (1,573,401 | ) |
| | | | |
Net increase (decrease) in shares outstanding before conversion | | | 32,056 | | | | 578,744 | |
Shares converted from Class B (See Note 1) | | | (38,808 | ) | | | (701,777 | ) |
| | | | |
Net increase (decrease) | | | (6,752 | ) | | $ | (123,033 | ) |
| | | | |
Year ended October 31, 2015: | | | | | | | | |
Shares sold | | | 107,365 | | | $ | 1,963,256 | |
Shares issued to shareholders in reinvestment of dividends and distributions | | | 718 | | | | 13,151 | |
Shares redeemed | | | (96,625 | ) | | | (1,755,078 | ) |
| | | | |
Net increase (decrease) in shares outstanding before conversion | | | 11,458 | | | | 221,329 | |
Shares converted from Class B (See Note 1) | | | (49,207 | ) | | | (888,442 | ) |
| | | | |
Net increase (decrease) | | | (37,749 | ) | | $ | (667,113 | ) |
| | | | |
|
| |
Class C | | Shares | | | Amount | |
Year ended October 31, 2016: | | | | | | | | |
Shares sold | | | 219,476 | | | $ | 3,963,348 | |
Shares issued to shareholders in reinvestment of dividends and distributions | | | 1,795 | | | | 32,117 | |
Shares redeemed | | | (710,934 | ) | | | (12,699,832 | ) |
| | | | |
Net increase (decrease) | | | (489,663 | ) | | $ | (8,704,367 | ) |
| | | | |
Year ended October 31, 2015: | | | | | | | | |
Shares sold | | | 861,851 | | | $ | 15,727,727 | |
Shares issued to shareholders in reinvestment of dividends and distributions | | | 1,704 | | | | 31,194 | |
Shares redeemed | | | (397,517 | ) | | | (7,188,101 | ) |
| | | | |
Net increase (decrease) | | | 466,038 | | | $ | 8,570,820 | |
| | | | |
Notes to Financial Statements (continued)
| | | | | | | | |
Class I | | Shares | | | Amount | |
Year ended October 31, 2016: | | | | | | | | |
Shares sold | | | 716,226 | | | $ | 14,032,867 | |
Shares issued to shareholders in reinvestment of dividends and distributions | | | 60,232 | | | | 1,170,908 | |
Shares redeemed | | | (910,950 | ) | | | (18,266,818 | ) |
| | | | |
Net increase (decrease) before Shares conversion | | | (134,492 | ) | | | (3,063,043 | ) |
Shares converted into Class I (See Note 1) | | | 1,423 | | | | 28,893 | |
| | | | |
Net increase (decrease) | | | (133,069 | ) | | $ | (3,034,150 | ) |
| | | | |
Year ended October 31, 2015: | | | | | | | | |
Shares sold | | | 798,357 | | | $ | 15,869,884 | |
Shares issued to shareholders in reinvestment of dividends and distributions | | | 47,309 | | | | 941,449 | |
Shares redeemed | | | (1,902,965 | ) | | | (37,626,257 | ) |
| | | | |
Net increase (decrease) | | | (1,057,299 | ) | | $ | (20,814,924 | ) |
| | | | |
|
| |
Class R3 | | Shares | | | Amount | |
Period ended October 31, 2016 (a): | | | | | | | | |
Shares sold | | | 1,433 | | | $ | 26,552 | |
| | | | |
Net increase (decrease) | | | 1,433 | | | $ | 26,552 | |
| | | | |
| (a) | Inception date was February 29, 2016. |
Note 10–Litigation
The Fund has been named as a defendant in the case entitled Kirschner v. FitzSimons, No. 12-2652 (S.D.N.Y.) (the “FitzSimons action”) as a result of its ownership of shares in the Tribune Company (“Tribune”) in 2007 when Tribune effected a leveraged buyout transaction (“LBO”) by which Tribune converted to a privately-held company. In its complaint, the plaintiff asserts claims against certain insiders, shareholders, professional advisers, and others involved in the LBO. Separately, the complaint also seeks to obtain from former Tribune shareholders, including the Fund, any proceeds they received in connection with the LBO. The sole claim and cause of action brought against the Fund is for fraudulent conveyance pursuant to United States Bankruptcy Code Section 548(a)(1)(A).
In June 2011, certain Tribune creditors filed numerous additional actions asserting state law constructive fraudulent conveyance claims (the “SLCFC actions”) against specifically-named former Tribune shareholders and, in some cases, putative defendant classes comprised of former Tribune shareholders. One of the SLCFC actions, entitled Deutsche Bank Trust Co. Americas v. Blackrock Institutional Trust Co., No. 11-9319 (S.D.N.Y.) (the “Deutsche Bank action”), named the Fund as a defendant.
The FitzSimons action and Deutsche Bank action have been consolidated with the majority of the other Tribune LBO-related lawsuits in a multidistrict litigation proceeding entitled In re Tribune Co. Fraudulent Conveyance Litig., No. 11-md-2296 (S.D.N.Y.) (the “MDL Proceeding”).
On September 23, 2013, the District Court granted the defendants’ motion to dismiss the SLCFC actions, including the Deutsche Bank action, on the basis that the plaintiffs did not have standing to pursue their claims. On September 30, 2013, the plaintiffs in the SLCFC actions filed a notice of appeal to the United States Court of Appeals for the Second Circuit. On October 28, 2013, the defendants filed a joint notice of cross-appeal of that same order. On March 29, 2016, the
United States Court of Appeals for the Second Circuit issued its opinion on the appeal of the SLCFC actions. The appeals court affirmed the district court’s dismissal of those lawsuits, but on different grounds than the district court. The appeals court held that while the plaintiffs have standing under the U.S. Bankruptcy Code, their claims were preempted by Section 546(e) of the Bankruptcy Code—the statutory safe harbor for settlement payments. On April 12, 2016, the plaintiffs in the SLCFC actions filed a petition seeking rehearing en banc before the appeals court. On July 22, 2016, the appeals court denied the petition. On September 9, 2016, the plaintiffs filed a petition for writ of certiorari in the U.S. Supreme Court challenging the Second Circuit’s decision that the safe harbor of Section 546(e) applied to their claims. Certain shareholder defendants filed a joint brief in opposition to the petition for certiorari on October 24, 2016. The plaintiffs filed a reply in support of the petition on November 4, 2016. The Supreme Court has not yet granted or denied the petition for certiorari.
On August 2, 2013, the plaintiff in the FitzSimons action filed a Fifth Amended Complaint. On May 23, 2014, the defendants filed motions to dismiss the FitzSimons action, including a global motion to dismiss Count I, which is the claim brought against former Tribune shareholders for intentional fraudulent conveyance under U.S. federal law. The Court has not yet issued a decision on any of these motions.
The value of the proceeds received by the Fund in connection with the LBO and the Fund’s cost basis in shares of Tribune was as follows:
| | | | | | | | |
Fund | | Proceeds | | | Cost Basis | |
MainStay Common Stock Fund | | $ | 751,774 | | | $ | 729,369 | |
At this stage of the proceedings, it would be difficult to assess with any reasonable certainty the probable outcome of the pending litigation or the effect, if any, on the Fund’s net asset value.
Note 11–Recent Accounting Pronouncement
In October 2016, the SEC adopted new rules and amended existing rules (together, “final rules”) intended to modernize the reporting and disclosure of information by registered investment companies. In part, the final rules amend Regulation S-X and require standardized, enhanced disclosure about derivatives in investment company financial statements, as well as other amendments. The compliance date for the amendments to Regulation S-X is August 1, 2017. Management is currently evaluating the impact that the adoption of the amendments to Regulation S-X will have on the Fund’s financial statements and related disclosures.
Note 12–Subsequent Events
In connection with the preparation of the financial statements of the Fund as of and for the fiscal year ended October 31, 2016, events and transactions subsequent to October 31, 2016, through the date the financial statements were issued have been evaluated by the Fund’s management for possible adjustment and/or disclosure. No subsequent events requiring financial statement adjustment or disclosure have been identified other than the following:
Effective February 28, 2017, Class B shares of the MainStay Group of Funds will be closed to all new purchases as well as additional investments by existing Class B shareholders. Existing Class B shareholders may continue to reinvest dividends and capital gains distributions, as
| | |
| 26 | | MainStay Common Stock Fund |
well as exchange their Class B shares for Class B shares of other Funds as permitted by the current exchange privileges. Class B shareholders will continue to be subject to any applicable contingent deferred sales charge at the time of redemption. All other features of the Class B shares, including but not limited to the fees and expenses applicable to Class B shares, will remain unchanged. Unless redeemed, Class B Shares shareholders will remain in Class B shares of their respective Fund until the Class B shares are converted to Class A or Investor Class shares pursuant to the applicable conversion schedule.
Report of Independent Registered Public Accounting Firm
The Board of Trustees and Shareholders of
The MainStay Funds:
We have audited the accompanying statement of assets and liabilities, including the portfolio of investments, of the MainStay Common Stock Fund (the “Fund”), one of the funds constituting The MainStay Funds, as of October 31, 2016, and the related statement of operations for the year then ended, the statements of changes in net assets for each of the years in the two-year period then ended, and the financial highlights for each of the years or periods in the five-year period then ended. These financial statements and financial highlights are the responsibility of the Fund’s management. Our responsibility is to express an opinion on these financial statements and financial highlights based on our audits.
We conducted our audits in accordance with the standards of the Public Company Accounting Oversight Board (United States). Those standards require that we plan and perform the audit to obtain reasonable assurance about whether the financial statements and financial highlights are free of material misstatement. An audit includes examining, on a test basis, evidence supporting the amounts and disclosures in the financial statements. Our procedures included confirmation of securities owned as of October 31, 2016, by correspondence with the custodian and brokers or by other appropriate auditing procedures where replies from brokers were not received. An audit also includes assessing the accounting principles used and significant estimates made by management, as well as evaluating the overall financial statement presentation. We believe that our audits provide a reasonable basis for our opinion.
In our opinion, the financial statements and financial highlights referred to above present fairly, in all material respects, the financial position of the MainStay Common Stock Fund of The MainStay Funds as of October 31, 2016, the results of its operations for the year then ended, the changes in its net assets for each of the years in the two-year period then ended, and the financial highlights for each of the years or periods in the five-year period then ended, in conformity with U.S. generally accepted accounting principles.

Philadelphia, Pennsylvania
December 22, 2016
| | |
| 28 | | MainStay Common Stock Fund |
Federal Income Tax Information
(Unaudited)
The Fund is required under the Internal Revenue Code to advise shareholders in a written statement as to the federal tax status of dividends paid by the Fund during such fiscal years.
For the fiscal year ended October 31, 2016, the Fund designated approximately $2,000,136 under the Internal Revenue Code as qualified dividend income eligible for reduced tax rates.
The dividends paid by the Fund during the fiscal year ended October 31, 2016, should be multiplied by 100% to arrive at the amount eligible for the corporate dividends received deduction.
In February 2017, shareholders will receive an IRS Form 1099-DIV or substitute Form 1099 which will show the federal tax status of the distributions received by shareholders in calendar year 2016. The amounts that will be reported on such 1099-DIV or substitute Form 1099 will be the amounts you are to use on your federal income tax return and will differ from the amounts which we must report for the Fund’s fiscal year ended October 31, 2016.
Proxy Voting Policies and Procedures and Proxy Voting Record
A description of the policies and procedures that New York Life Investments uses to vote proxies related to the Fund’s securities is available without charge, upon request, (i) by visiting the Fund’s website at mainstayinvestments.com; or (ii) on the SEC’s website at www.sec.gov.
The Fund is required to file with the SEC its proxy voting record for the 12-month period ending June 30 on Form N-PX. The Fund’s most recent Form N-PX or proxy voting record is available free of charge upon request (i) by calling 800-MAINSTAY (624-6782); (ii) by visiting the Fund’s website at mainstayinvestments.com; or (iii) on the SEC’s website at www.sec.gov.
Shareholder Reports and Quarterly Portfolio Disclosure
The Fund is required to file its complete schedule of portfolio holdings with the SEC for its first and third fiscal quarters on Form N-Q. The Fund’s Form N-Q is available without charge on the SEC’s website at www.sec.gov or by calling MainStay Investments at 800-MAINSTAY (624-6782). You also can obtain and review copies of Form N-Q by visiting the SEC’s Public Reference Room in Washington, DC (information on the operation of the Public Reference Room may be obtained by calling 1-800-SEC-0330).
Board of Trustees and Officers (Unaudited)
The Trustees and officers of the Funds are listed below. The Board oversees the MainStay Group of Funds, MainStay VP Funds Trust, MainStay DefinedTerm Municipal Opportunities Fund, the Manager and the Subadvisors, and elects the officers of the Funds who are responsible for the day-to-day operations of the Funds. Information pertaining to the Trustees and officers is set forth below. Each Trustee serves until his or her successor is elected and qualified or until his or her resignation, death or removal. Under the Retirement Policy, a Trustee must
tender his or her resignation by the end of the calendar year during which he or she reaches the age of 75 (although the Board of Trustees may make exceptions from time to time). Officers serve a term of one year and are elected annually by the Board of Trustees. The business address of each Trustee and officer listed below is 51 Madison Avenue, New York, New York 10010. A majority of the Trustees are not “interested persons” (as defined by the 1940 Act and rules “adopted” by the SEC thereunder) of the Fund (“Independent Trustees”).
| | | | | | | | | | | | |
| | | | | Name and Date of Birth | | Term of Office, Position(s) Held and Length of Service | | Principal Occupation(s) During Past Five Years | | Number of
Portfolios in
Fund Complex
Overseen by
Board Member | | Other Directorships Held By Board Member |
Interested Trustee | | | | Christopher O. Blunt* 5/13/62 | | MainStay Funds: Trustee since January 2016; MainStay Funds Trust: Trustee since January 2016. | | Executive Vice President (since 2009), President, Investments Group (since 2015), Member of the Executive Management Committee (since 2007), Co-President, Insurance and Agency Group (2012 to 2015), President, Insurance Group (2012 to 2014), Executive Vice President, Retirement Income Security (2008 to 2012), New York Life Insurance Company. | | 83 | | MainStay VP Funds Trust:
Trustee since January 2016 (31 portfolios); and
MainStay DefinedTerm Municipal Opportunities Fund: Trustee since January 2016. |
| | * | This Trustee is considered to be an “interested person” of the MainStay Group of Funds within the meaning of the 1940 Act because of his affiliation with New York Life Insurance Company, New York Life Investment Management LLC, Cornerstone Capital Management Holdings LLC, MacKay Shields LLC, Institutional Capital LLC, NYL Investors LLC, NYLIFE Securities LLC and/or NYLIFE Distributors LLC, as described in detail above in the column entitled “Principal Occupation(s) During Past Five Years.” |
| | |
| 30 | | MainStay Common Stock Fund |
| | | | | | | | | | | | |
| | | | | Name and Date of Birth | | Term of Office, Position(s) Held and Length of Service | | Principal Occupation(s) During Past Five Years | | Number of Portfolios in Fund Complex Overseen by Board Member | | Other Directorships Held By Board Member |
| Non-Interested Trustee | | | | David H. Chow 12/29/57 | | MainStay Funds: Trustee since January 2016, Advisory Board Member (June 2015 to December 2015); MainStay Funds Trust: Trustee since January 2016, Advisory Board Member (June 2015 to December 2015). | | Founder and CEO, DanCourt Management, LLC (since 1999) | | 83 | | MainStay VP Funds Trust: Trustee since January 2016, Advisory Board Member (June 2015 to December 2015); (31 portfolios);
MainStay DefinedTerm Municipal Opportunities Fund: Trustee since January 2016, Advisory Board Member (June 2015 to December 2015);
Market Vectors Group of Exchange-Traded Funds: Independent Chairman of the Board of Trustees since 2008 and Trustee since 2006 (55 portfolios); and
Berea College of Kentucky: Trustee since 2009. |
| | | | Susan B. Kerley 8/12/51 | | MainStay Funds: Trustee since 2007; MainStay Funds Trust: Trustee since 1990.*** | | President, Strategic Management Advisors LLC (since 1990) | | 83 | | MainStay VP Funds Trust: Trustee since 2007 (31 portfolios)**;
MainStay DefinedTerm Municipal Opportunities Fund: Trustee since 2011; and Legg Mason Partners Funds: Trustee since 1991 (53 portfolios). |
| | | | Alan R. Latshaw 3/27/51 | | MainStay Funds: Trustee and Audit Committee Financial Expert since 2006; MainStay Funds Trust: Trustee and Audit Committee Financial Expert since 2007.*** | | Retired; Partner, Ernst & Young LLP (2002 to 2003); Partner, Arthur Andersen LLP (1989 to 2002); Consultant to the MainStay Funds Audit and Compliance Committee (2004 to 2006) | | 83 | | MainStay VP Funds Trust: Trustee and Audit Committee Financial Expert since 2007 (31 portfolios)**;
MainStay DefinedTerm Municipal Opportunities Fund: Trustee and Audit Committee Financial Expert since 2011;
State Farm Associates Funds Trusts: Trustee since 2005 (4 portfolios);
State Farm Mutual Fund Trust: Trustee since 2005 (15 portfolios); and
State Farm Variable Product Trust: Trustee since 2005 (9 portfolios). |
| | | | Peter Meenan 12/5/41 | | MainStay Funds: Chairman since 2013 and Trustee since 2007; MainStay Funds Trust: Chairman since 2013 and Trustee since 2002.*** | | Retired; Independent Consultant (2004 to 2013); President and Chief Executive Officer, Babson—United, Inc. (financial services firm) (2000 to 2004); Independent Consultant (1999 to 2000); Head of Global Funds, Citicorp (1995 to 1999) | | 83 | | MainStay VP Funds Trust: Chairman since 2013 and Trustee since 2007 (31 portfolios)**; and
MainStay DefinedTerm Municipal Opportunities Fund: Chairman since 2013 and Trustee since 2011. |
| | | | Richard H. Nolan, Jr. 11/16/46 | | MainStay Funds: Trustee since 2007; MainStay Funds Trust: Trustee since 2007.*** | | Managing Director, ICC Capital Management (since 2004); President—Shields/Alliance, Alliance Capital Management (1994 to 2004) | | 83 | | MainStay VP Funds Trust: Trustee since 2006 (31 portfolios)**; and
MainStay DefinedTerm Municipal Opportunities Fund: Trustee since 2011. |
| | | | Jacques P. Perold 5/12/58 | | MainStay Funds: Trustee since January 2016, Advisory Board Member (June 2015 to December 2015); MainStay Funds Trust: Trustee since January 2016, Advisory Board Member (June 2015 to December 2015). | | Retired; President, Fidelity Management & Research Company (2009 to 2014); Founder, President and Chief Executive Officer, Geode Capital Management, LCC (2001 to 2009) | | 83 | | MainStay VP Funds Trust: Trustee since January 2016, Advisory Board Member (June 2015 to December 2015); (31 portfolios);
MainStay DefinedTerm Municipal Opportunities Fund: Trustee since January 2016, Advisory Board Member (June 2015 to December 2015);
Allstate Corporation: Director since 2015; and
Boston University: Trustee since 2014. |
| | | | | | | | | | | | |
| | | | | Name and Date of Birth | | Term of Office, Position(s) Held and Length of Service | | Principal Occupation(s) During Past Five Years | | Number of Portfolios in Fund Complex Overseen by Board Member | | Other Directorships Held By Board Member |
Non-Interested Trustee | | | | Richard S. Trutanic 2/13/52 | | MainStay Funds: Trustee since 1994; MainStay Funds Trust: Trustee since 2007.*** | | Chairman and Chief Executive Officer, Somerset & Company (financial advisory firm) (since 2004); Managing Director, The Carlyle Group (private investment firm) (2002 to 2004); Senior Managing Director, Partner and Board Member, Groupe Arnault S.A. (private investment firm) (1999 to 2002) | | 83 | | MainStay VP Funds Trust: Trustee since 2007 (31 portfolios)**; and
MainStay DefinedTerm Municipal Opportunities Fund: Trustee since 2011. |
| | | | John A. Weisser**** 10/22/41 | | MainStay Funds: Trustee since 2007; MainStay Funds Trust: Trustee since 2007.*** | | Retired; Managing Director of Salomon Brothers, Inc. (1971 to 1995) | | 83 | | MainStay VP Funds Trust: Trustee since 1997 (31 portfolios)**; MainStay DefinedTerm Municipal Opportunities Fund: Trustee since 2011; Direxion Insurance Trust: Trustee since 2007 (1 portfolio); Direxion Funds: Trustee since 2007 (18 portfolios); and Direxion Shares ETF Trust: Trustee since 2008 (52 portfolios). |
| | ** | Includes prior service as a Director of MainStay VP Series Fund, Inc., the predecessor to MainStay VP Funds Trust. |
| | *** | Includes prior service as a Director/Trustee of certain predecessor entities to MainStay Funds Trust. |
| | **** | Pursuant to the Retirement Policy, Mr. Weisser will retire from the Board of Trustees on or about December 31, 2016. |
| | |
| 32 | | MainStay Common Stock Fund |
| | | | | | | | |
| | | | | Name and Date of Birth | | Position(s) Held and Length of Service | | Principal Occupation(s) During Past Five Years |
Officers (Who Are Not Board Members)* | | | | Stephen P. Fisher 2/22/59 | | President, MainStay Funds (since 2007), MainStay Funds Trust (since 2009) | | Chairman and Chief Executive Officer (since 2014), President and Chief Operating Officer (2008 to 2013), NYLIFE Distributors LLC; Chairman of the Board, NYLIM Service Company LLC (since 2008); President (since May 2015), Co-President (2014 to 2015) and Senior Managing Director (since 2005), New York Life Investment Management LLC; President, MainStay DefinedTerm Municipal Opportunities Fund (since 2011) and MainStay VP Funds Trust (since 2007)** |
| | | | Jack R. Benintende 5/12/64 | | Treasurer and Principal Financial and Accounting Officer, MainStay Funds (since 2007), MainStay Funds Trust (since 2009) | | Managing Director, New York Life Investment Management LLC (since 2007); Treasurer and Principal Financial and Accounting Officer, MainStay DefinedTerm Municipal Opportunities Fund (since 2011) and MainStay VP Funds Trust (since 2007)**; and Assistant Treasurer, New York Life Investment Management Holdings LLC (2008 to 2012) |
| | | | Kevin M. Bopp 2/24/69 | | Vice President and Chief Compliance Officer, MainStay Funds and MainStay Funds Trust (since 2014) | | Chief Compliance Officer (since January 2016), Director and Associate General Counsel (2011 to 2014) and Vice President and Assistant General Counsel (2010 to 2011), New York Life Investment Management LLC; Vice President and Chief Compliance Officer, MainStay VP Funds Trust, MainStay DefinedTerm Municipal Opportunities Fund (since 2014); Assistant Secretary, MainStay Funds, MainStay Funds Trust and MainStay VP Funds Trust (2010 to 2014)**, MainStay DefinedTerm Municipal Opportunities Fund (2011 to 2014) |
| | | | J. Kevin Gao 10/13/67 | | Secretary and Chief Legal Officer, MainStay Funds and MainStay Funds Trust (since 2010) | | Managing Director and Associate General Counsel, New York Life Investment Management LLC (since 2010); Secretary and Chief Legal Officer, MainStay DefinedTerm Municipal Opportunities Fund (since 2011) and MainStay VP Funds Trust (since 2010)** |
| | | | Scott T. Harrington 2/8/59 | | Vice President— Administration, MainStay Funds (since 2005), MainStay Funds Trust (since 2009) | | Director, New York Life Investment Management LLC (including predecessor advisory organizations) (since 2000); Member of the Board of Directors, New York Life Trust Company (since 2009); Vice President—Administration, MainStay DefinedTerm Municipal Opportunities Fund (since 2011) and MainStay VP Funds Trust (since 2005)** |
| | * | The Officers listed above are considered to be “interested persons” of the MainStay Group of Funds within the meaning of the 1940 Act because of their affiliation with the MainStay Group of Funds, New York Life Insurance Company and/or its affiliates, including New York Life Investment Management LLC, NYLIM Service Company LLC, NYLIFE Securities LLC and/or NYLIFE Distributors LLC, as described in detail in the column captioned “Principal Occupation(s) During Past Five Years.” Officers are elected annually by the Board to serve a one year term. |
| | ** | Includes prior service as an Officer of MainStay VP Series Fund, Inc., the predecessor to MainStay VP Funds Trust. |
This page intentionally left blank
MainStay Funds
MainStay offers a wide range of Funds for virtually any investment need. The full array of MainStay open-end offerings is listed here, with information about the manager, subadvisors, legal counsel and independent registered public accounting firm.
Equity
U.S. Equity
MainStay Common Stock Fund
MainStay Cornerstone Growth Fund
MainStay Epoch U.S. All Cap Fund
MainStay Epoch U.S. Equity Yield Fund
MainStay Epoch U.S. Small Cap Fund
MainStay ICAP Equity Fund
MainStay ICAP Select Equity Fund
MainStay Large Cap Growth Fund
MainStay MAP Fund
MainStay S&P 500 Index Fund
MainStay U.S. Equity Opportunities Fund
International/Global Equity
MainStay Emerging Markets Opportunities Fund
MainStay Epoch Capital Growth Fund
MainStay Epoch Global Choice Fund
MainStay Epoch Global Equity Yield Fund
MainStay Epoch International Small Cap Fund
MainStay ICAP International Fund
MainStay International Equity Fund
MainStay International Opportunities Fund
Income
Taxable Bond
MainStay Floating Rate Fund
MainStay Global High Income Fund
MainStay Government Fund
MainStay High Yield Corporate Bond Fund
MainStay High Yield Opportunities Fund
MainStay Indexed Bond Fund
MainStay Short Duration High Yield Fund
MainStay Total Return Bond Fund
MainStay Unconstrained Bond Fund
Municipal/Tax Advantaged Bond
MainStay California Tax Free Opportunities Fund1
MainStay High Yield Municipal Bond Fund
MainStay New York Tax Free Opportunities Fund2
MainStay Tax Advantaged Short Term Bond Fund
MainStay Tax Free Bond Fund
Money Market
MainStay Money Market Fund
Mixed Asset
MainStay Balanced Fund
MainStay Convertible Fund
MainStay Income Builder Fund
Alternative
MainStay Absolute Return Multi-Strategy Fund
MainStay Cushing Energy Income Fund
MainStay Cushing MLP Premier Fund
MainStay Cushing Renaissance Advantage Fund
Asset Allocation/Target Date
MainStay Conservative Allocation Fund
MainStay Growth Allocation Fund
MainStay Moderate Allocation Fund
MainStay Moderate Growth Allocation Fund
MainStay Retirement 2010 Fund
MainStay Retirement 2020 Fund
MainStay Retirement 2030 Fund
MainStay Retirement 2040 Fund
MainStay Retirement 2050 Fund
MainStay Retirement 2060 Fund
Manager
New York Life Investment Management LLC
New York, New York
Subadvisors
Candriam France S.A.S.3
Paris, France
Cornerstone Capital Management Holdings LLC3
New York, New York
Cushing Asset Management, LP
Dallas, Texas
Epoch Investment Partners, Inc.
New York, New York
Institutional Capital LLC3
Chicago, Illinois
MacKay Shields LLC3
New York, New York
Markston International LLC
White Plains, New York
NYL Investors LLC3
New York, New York
Winslow Capital Management, LLC
Minneapolis, Minnesota
Legal Counsel
Dechert LLP
Washington, District of Columbia
Independent Registered Public Accounting Firm
KPMG LLP
Philadelphia, Pennsylvania
1. This Fund is only registered for sale in AZ, CA, MI (Class A and Class I shares only), NV, OR, TX, UT and WA.
2. This Fund is only registered for sale in CA, CT, DE, FL, MA, NJ, NY and VT.
3. An affiliate of New York Life Investment Management LLC.
Not part of the Annual Report
For more information
800-MAINSTAY (624-6782)
mainstayinvestments.com
MainStay Investments® is a registered service mark and name under which New York Life Investment Management LLC does business. MainStay Investments, an indirect subsidiary of New York Life Insurance Company, New York, NY 10010, provides investment advisory products and services. The MainStay Funds® are managed by New York Life Investment Management LLC and distributed by NYLIFE Distributors LLC, 30 Hudson Street, Jersey City, NJ 07302, a wholly owned subsidiary of New York Life Insurance Company. NYLIFE Distributors LLC is a Member FINRA/SIPC.
©2016 NYLIFE Distributors LLC. All rights reserved.
| | | | | | | | |
| Not FDIC/NCUA Insured | | Not a Deposit | | May Lose Value | | No Bank Guarantee | | Not Insured by Any Government Agency |
| | |
| 1716826 MS316-16 | | MSCS11-12/16 (NYLIM) NL219 |
MainStay Large Cap Growth Fund
Message from the President and Annual Report
October 31, 2016


This page intentionally left blank
Message from the President
During the 12 months ended October 31, 2016, the U.S. stock and bond markets were somewhat volatile but generally ended the reporting period in positive territory. In the fall of 2015 and early 2016, the market appeared to be focused on China’s economic weakness and a prolonged decline in oil prices. Although energy-related companies felt the brunt of these setbacks, the stock market as a whole declined until mid-February, when oil prices began to rise and stocks began a relatively steady recovery.
In late June, the United Kingdom voted to leave the European Union in a referendum popularly known as “Brexit.” The news caused a temporary slump in stocks around the world. Although the British pound dropped in value following the vote, stocks generally recovered through the end of the reporting period. As the end of the reporting period approached, speculation about the upcoming U.S. presidential election heightened market volatility.
According to FTSE-Russell data, U.S. stocks as a whole tended to provide positive returns during the reporting period, with large-capitalization stocks generally outperforming stocks of smaller companies. Value stocks outpaced growth stocks at all capitalization levels, with the largest differences among small- to mid-cap stocks.
International and emerging-market stocks provided mixed performance. Rocked by Brexit, European stocks as a whole declined during the reporting period, while stocks in the Asia-Pacific region (with or without Japan) tended to provide positive returns. International stocks as a whole declined, while global stocks advanced slightly. Emerging-market stocks were considerably stronger, boosted by advances in India and Latin America and higher prices for oil, metals and other commodities.
Anticipation of a possible Federal Reserve rate hike led to volatility in the bond market, but the Federal Open Market Committee chose not to raise the federal funds target rate during the reporting period. Short-term U.S. Treasury yields rose during the reporting period, and longer-term U.S. Treasury yields declined. Overall, the U.S. bond market provided positive returns, with longer-term bonds generally outperforming shorter-term securities. High-yield bonds, particularly
longer-term issues, were strong performers. Municipal bonds generally provided positive single-digit total returns for the 12 months ended October 31, 2016.
Central banks around the world remained highly accommodative during the reporting period, particularly in light of Brexit. Shortly after the U.K. referendum, more than a third of all sovereign debt carried negative yields. As an asset class, emerging-market bonds provided double-digit positive returns during the reporting period, and world bonds as a whole provided positive single-digit positive returns.
At MainStay, we know that political, economic and market events may influence the performance of your Fund investments. While our portfolio managers often pay close attention to such events, their primary emphasis is seeking to invest for the long-term investment needs of our shareholders. With this in mind, they seek to pursue the investment objectives of their respective Funds using the principal investment strategies and investment processes outlined in the prospectus. By placing your assets in the care of our investment professionals, you gain access to their extensive market insight, strategic investment discipline and in-depth experience in risk-management over a wide range of market cycles.
The report that follows provides more detailed information about the market forces, portfolio strategies and individual securities that influenced the performance of your MainStay Fund during the 12 months ended October 31, 2016. We invite you to read the report carefully as part of your personal investment-review process.
We thank you for your business, and we look forward to a continuing relationship as you pursue your long-range financial goals.
Sincerely,

Stephen P. Fisher
President
The opinions expressed are as of the date of this report and are subject to change. There is no guarantee that any forecast made will come to pass. This material does not constitute investment advice and is not intended as an endorsement of any specific investment. Past performance is no guarantee of future results.
Not part of the Annual Report
Table of Contents
Investors should refer to the Fund’s Summary Prospectus and/or Prospectus and consider the Fund’s investment objectives, strategies, risks, charges and expenses carefully before investing. The Summary Prospectus and/or Prospectus contain this and other information about the Fund. You may obtain copies of the Fund’s Summary Prospectus, Prospectus and Statement of Additional Information free of charge, upon request, by calling toll-free 800-MAINSTAY (624-6782), by writing to NYLIFE Distributors LLC, Attn: MainStay Marketing Department, 30 Hudson Street, Jersey City, NJ 07302 or by sending an e-mail to MainStayShareholderServices@nylim.com. These documents are also available via the MainStay Funds’ website at mainstayinvestments.com/documents. Please read the Summary Prospectus and/or Prospectus carefully before investing.
Investment and Performance Comparison1 (Unaudited)
Performance data quoted represents past performance. Past performance is no guarantee of future results. Because of market volatility and other factors, current performance may be lower or higher than the figures shown. Investment return and principal value will fluctuate, and as a result, when shares are redeemed, they may be worth more or less than their original cost. The graph below depicts the historical performance of Class A shares of the Fund. Performance will vary from class to class based on differences in class-specific expenses and sales charges. For performance information current to the most recent month-end, please call 800-MAINSTAY (624-6782) or visit mainstayinvestments.com.
(With sales charges)
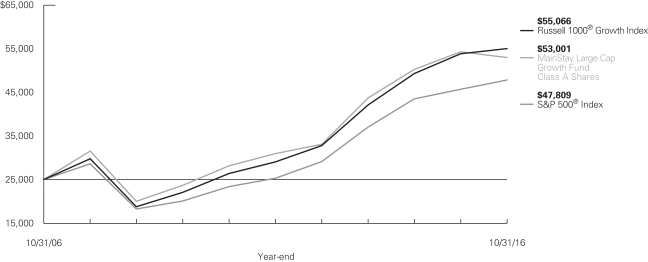
Average Annual Total Returns for the Year Ended October 31, 2016
| | | | | | | | | | | | | | | | | | | | |
| Class | | Sales Charge | | | | One Year | | | Five Years | | | Ten Years | | | Gross
Expense
Ratio2 | |
| Class A Shares | | Maximum 5.5% Initial Sales Charge | | With sales charges Excluding sales charges | |
| –7.81
–2.44 | %
| |
| 10.08
11.33 | %
| |
| 7.20
7.80 | %
| |
| 0.99
0.99 | %
|
| Investor Class Shares3 | | Maximum 5.5% Initial Sales Charge | | With sales charges Excluding sales charges | |
| –7.93
–2.57 |
| |
| 10.02
11.27 |
| |
| 7.12
7.73 |
| |
| 1.04
1.04 |
|
| Class B Shares | | Maximum 5% CDSC if Redeemed Within the
First Six Years of Purchase | | With sales charges Excluding sales charges | |
| –7.52
–3.32 |
| |
| 10.17
10.44 |
| |
| 6.92
6.92 |
| |
| 1.79
1.79 |
|
| Class C Shares | | Maximum 1% CDSC if Redeemed Within One Year of Purchase | | With sales charges Excluding sales charges | |
| –4.15
–3.31 |
| |
| 10.45
10.45 |
| |
| 6.92
6.92 |
| |
| 1.79
1.79 |
|
| Class I Shares | | No Sales Charge | | | | | –2.23 | | | | 11.62 | | | | 8.16 | | | | 0.74 | |
| Class R1 Shares | | No Sales Charge | | | | | –2.37 | | | | 11.50 | | | | 8.04 | | | | 0.84 | |
| Class R2 Shares | | No Sales Charge | | | | | –2.66 | | | | 11.22 | | | | 7.78 | | | | 1.09 | |
| Class R3 Shares | | No Sales Charge | | | | | –2.83 | | | | 10.95 | | | | 7.52 | | | | 1.34 | |
| Class R6 Shares4 | | No Sales Charge | | | | | –2.12 | | | | 11.70 | | | | 8.20 | | | | 0.62 | |
| 1. | The performance table and graph do not reflect the deduction of taxes that a shareholder would pay on distributions or Fund share redemptions. Total returns reflect maximum applicable sales charges as indicated in the table above, if any, changes in share price, and reinvestment of dividend and capital gain distributions. The graph assumes the initial investment amount shown above and reflects the deduction of all sales charges that would have applied for the period of investment. Performance figures may reflect certain fee waivers and/or expense limitations, without which total returns may have been lower. For more information on share classes and current fee waivers and/or expense limitations (if any), please refer to the notes to the financial statements. |
| 2. | The gross expense ratios presented reflect the Fund’s “Total Annual Fund Operating Expenses” from the most recent Prospectus and may differ from other expense ratios disclosed in this report. |
| 3. | Performance figures for Investor Class shares, first offered on February 28, 2008, include the historical performance of Class A shares through February 27, 2008, adjusted for differences in certain fees and expenses. Unadjusted, the performance shown for the Investor Class shares would likely have been different. |
| 4. | Performance figures for Class R6 shares, first offered on June 17, 2013, include the historical performance of Class I shares through June 16, 2013. Performance for Class R6 shares would also likely have been different because of differences in expenses attributable to each share class. |
The footnotes on the next page are an integral part of the table and graph and should be carefully read in conjunction with them.
| | | | | | | | | | | | |
| Benchmark Performance | | One
Year | | | Five
Years | | | Ten
Years | |
Russell 1000® Growth Index5 | | | 2.28 | % | | | 13.65 | % | | | 8.22 | % |
S&P 500® Index6 | | | 4.51 | | | | 13.57 | | | | 6.70 | |
Average Lipper Large-Cap Growth Fund7 | | | –0.21 | | | | 12.30 | | | | 7.24 | |
| 5. | The Russell 1000® Growth Index is the Fund’s primary broad-based securities market index for comparison purposes. The Russell 1000® Growth Index measures the performance of the large-cap growth segment of the U.S. equity universe. It includes those Russell 1000® Index companies with higher price-to-book ratios and higher forecasted growth values. Results assume reinvestment of all dividends and capital gains. An investment cannot be made directly in an index. |
| 6. | The S&P 500® Index is the Fund’s secondary benchmark. “S&P 500®” is a trademark of The McGraw-Hill Companies, Inc. The S&P 500® Index is widely regarded as the standard index for measuring large-cap U.S. stock- |
| | market performance. Results assume reinvestment of all income and capital gains. An investment cannot be made directly in an index. |
| 7. | The Average Lipper Large-Cap Growth Fund is representative of funds that, by portfolio practice, invest at least 75% of their equity assets in companies with market capitalizations (on a three-year weighted basis) above Lipper’s U.S. Diversified Equity large-cap floor. Large-cap growth funds typically have above-average characteristics compared to the S&P 500® Index. This benchmark is a product of Lipper Inc. Lipper Inc. is an independent monitor of fund performance. Results are based on average total returns of similar funds with all dividend and capital gain distributions reinvested. |
The footnotes on the preceding page are an integral part of the table and graph and should be carefully read in conjunction with them.
| | |
| 6 | | MainStay Large Cap Growth Fund |
Cost in Dollars of a $1,000 Investment in MainStay Large Cap Growth Fund (Unaudited)
The example below is intended to describe the fees and expenses borne by shareholders during the six-month period from May 1, 2016, to October 31, 2016, and the impact of those costs on your investment.
Example
As a shareholder of the Fund, you incur two types of costs: (1) transaction costs, including exchange fees and sales charges (loads) on purchases (as applicable), and (2) ongoing costs, including management fees, distribution and/or service (12b-1) fees, and other Fund expenses (as applicable). This example is intended to help you understand your ongoing costs (in dollars) of investing in the Fund and to compare these costs with the ongoing costs of investing in other mutual funds. The example is based on an investment of $1,000 made at the beginning of the six-month period and held for the entire period from May 1, 2016, to October 31, 2016.
This example illustrates your Fund’s ongoing costs in two ways:
Actual Expenses
The second and third data columns in the table below provide information about actual account values and actual expenses. You may use the information in these columns, together with the amount you invested, to estimate the expenses that you paid during the six months ended October 31, 2016. Simply divide your account value by $1,000 (for example, an $8,600 account value divided by $1,000 = 8.6), then
multiply the result by the number under the heading entitled “Expenses Paid During Period” to estimate the expenses you paid on your account during this period.
Hypothetical Example for Comparison Purposes
The fourth and fifth data columns in the table below provide information about hypothetical account values and hypothetical expenses based on the Fund’s actual expense ratio and an assumed rate of return of 5% per year before expenses, which is not the Fund’s actual return. The hypothetical account values and expenses may not be used to estimate the actual ending account balances or expenses you paid for the six-month period shown. You may use this information to compare the ongoing costs of investing in the Fund with the ongoing costs of investing in other Funds. To do so, compare this 5% hypothetical example with the 5% hypothetical examples that appear in the shareholder reports of the other Funds.
Please note that the expenses shown in the table are meant to highlight your ongoing costs only and do not reflect any transactional costs, such as exchange fees or sales charges (loads). Therefore, the fourth and fifth data columns of the table are useful in comparing ongoing costs only and will not help you determine the relative total costs of owning different funds. In addition, if these transactional costs were included, your costs would have been higher.
| | | | | | | | | | | | | | | | | | | | |
| | | | | | | | | | | | | | | | |
| Share Class | | Beginning
Account
Value
5/1/16 | | | Ending Account
Value (Based
on Actual
Returns and
Expenses)
10/31/16 | | | Expenses
Paid
During
Period1 | | | Ending Account
Value (Based
on Hypothetical
5% Annualized
Return and
Actual Expenses)
10/31/16 | | | Expenses
Paid
During
Period1 | |
| | | | | |
| Class A Shares | | $ | 1,000.00 | | | $ | 1,037.30 | | | $ | 5.02 | | | $ | 1,020.20 | | | $ | 4.98 | |
| | | | | |
| Investor Class Shares | | $ | 1,000.00 | | | $ | 1,037.70 | | | $ | 5.38 | | | $ | 1,019.90 | | | $ | 5.33 | |
| | | | | |
| Class B Shares | | $ | 1,000.00 | | | $ | 1,033.10 | | | $ | 9.20 | | | $ | 1,016.10 | | | $ | 9.12 | |
| | | | | |
| Class C Shares | | $ | 1,000.00 | | | $ | 1,033.20 | | | $ | 9.20 | | | $ | 1,016.10 | | | $ | 9.12 | |
| | | | | |
| Class I Shares | | $ | 1,000.00 | | | $ | 1,038.80 | | | $ | 3.74 | | | $ | 1,021.50 | | | $ | 3.71 | |
| | | | | |
| Class R1 Shares | | $ | 1,000.00 | | | $ | 1,038.30 | | | $ | 4.30 | | | $ | 1,020.90 | | | $ | 4.27 | |
| | | | | |
| Class R2 Shares | | $ | 1,000.00 | | | $ | 1,036.20 | | | $ | 5.53 | | | $ | 1,019.70 | | | $ | 5.48 | |
| | | | | |
| Class R3 Shares | | $ | 1,000.00 | | | $ | 1,036.30 | | | $ | 6.81 | | | $ | 1,018.50 | | | $ | 6.75 | |
| | | | | |
| Class R6 Shares | | $ | 1,000.00 | | | $ | 1,039.70 | | | $ | 3.18 | | | $ | 1,022.00 | | | $ | 3.15 | |
| 1. | Expenses are equal to the Fund’s annualized expense ratio of each class (0.98% for Class A, 1.05% for Investor Class, 1.80% for Class B and Class C, 0.73% for Class I, 0.84% for Class R1, 1.08% for Class R2, 1.33% for Class R3 and 0.62% for Class R6) multiplied by the average account value over the period, divided by 366 and multiplied by 184 (to reflect the six-month period). The table above represents the actual expenses incurred during the six-month period. |
Industry Composition as of October 31, 2016 (Unaudited)
| | | | |
| IT Services | | | 11.5 | % |
| Internet Software & Services | | | 10.7 | |
| Software | | | 10.3 | |
| Internet & Catalog Retail | | | 9.2 | |
| Health Care Equipment & Supplies | | | 6.9 | |
| Technology Hardware, Storage & Peripherals | | | 3.9 | |
| Health Care Providers & Services | | | 3.8 | |
| Pharmaceuticals | | | 3.8 | |
| Semiconductors & Semiconductor Equipment | | | 3.6 | |
| Biotechnology | | | 3.5 | |
| Textiles, Apparel & Luxury Goods | | | 3.3 | |
| Media | | | 2.7 | |
| Real Estate Investment Trusts | | | 2.7 | |
| Specialty Retail | | | 2.7 | |
| Hotels, Restaurants & Leisure | | | 2.4 | |
| Oil, Gas & Consumable Fuels | | | 2.1 | |
| | | | |
| Chemicals | | | 2.0 | % |
| Food & Staples Retailing | | | 2.0 | |
| Industrial Conglomerates | | | 1.7 | |
| Aerospace & Defense | | | 1.6 | |
| Multiline Retail | | | 1.4 | |
| Life Sciences Tools & Services | | | 1.2 | |
| Banks | | | 1.0 | |
| Beverages | | | 1.0 | |
| Capital Markets | | | 1.0 | |
| Professional Services | | | 1.0 | |
| Road & Rail | | | 1.0 | |
| Machinery | | | 0.7 | |
| Short-Term Investment | | | 0.9 | |
| Other Assets, Less Liabilities | | | 0.4 | |
| | | | |
| | | 100.0 | % |
| | | | |
See Portfolio of Investments beginning on page 11 for specific holdings within these categories.
Top Ten Holdings or Issuers as of October 31, 2016 (excluding short-term investment) (Unaudited)
| 6. | UnitedHealth Group, Inc. |
| | |
| 8 | | MainStay Large Cap Growth Fund |
Portfolio Management Discussion and Analysis (Unaudited)
Questions answered by portfolio managers Clark J. Winslow,1 Justin H. Kelly, CFA, and Patrick M. Burton, CFA, of Winslow Capital Management, LLC, the Fund’s Subadvisor.
How did MainStay Large Cap Growth Fund perform relative to its benchmarks and peers during the 12 months ended October 31, 2016?
Excluding all sales charges, MainStay Large Cap Growth Fund returned –2.44% for Class A shares, –2.57% for Investor Class shares, –3.32% for Class B shares and –3.31% for Class C shares for the 12 months ended October 31, 2016. Over the same period, the Fund returned –2.23% for Class I shares, –2.37% for Class R1 shares, –2.66% for Class R2 shares, –2.83% for Class R3 shares and –2.12% for Class R6 shares. For the 12 months ended October 31, 2016, all share classes underperformed the 2.28% return of the Russell 1000® Growth Index,2 which is the Fund’s primary benchmark. Over the same period, all share classes also underperformed the 4.51% return of the S&P 500® Index,2 which is the Fund’s secondary benchmark. For the 12 months ended October 31, 2016, all share classes underperformed the –0.21% return of the Average Lipper3 Large-Cap Growth Fund. See page 5 for Fund returns with applicable sales charges.
What factors affected the Fund’s relative performance during the reporting period?
At the end of 2015, large-cap growth was the best-performing major equity asset class for the previous one-, five-, seven-, and 10-year periods. In early 2016, however, market sentiment shifted, and stock performance started to reflect yield and value factors. As interest rates declined, companies with the highest yields outperformed those with the lowest yields, and most active large-cap growth managers underperformed their respective indexes. While the Fund’s performance was strong after the first quarter of 2016, relative performance for the 12 months ended October 31, 2016, was disappointing.
The Fund underperformed the Russell 1000® Growth Index during the reporting period, primarily because of stock selection in the information technology sector and an overweight position in the weak-performing health care sector. The Fund’s underweight position in consumer staples also detracted from performance, as higher-yielding consumer staples stocks outperformed in the Index. In the telecommunication services sector, the Fund focused on growth rather than yield and did not own any slower-growth companies, such as Verizon Communications. Not owning Verizon Communications detracted from the Fund’s relative performance.
During the reporting period, which sectors were the strongest contributors to the Fund’s relative performance and which sectors were particularly weak?
The sectors that made the strongest contributions to the Fund’s performance relative to the Russell 1000® Growth Index were
energy, real estate and financials. (Contributions take weightings and total returns into account.) Stock selection was strong in the energy sector. In the real estate sector, a slightly overweight position relative to the Index helped relative performance. The financials sector was also strong relative to other sectors in the Fund.
The sectors that detracted the most from the Fund’s performance relative to the Russell 1000® Growth Index were consumer staples, health care and information technology. The yield factor helped performance in the consumer staples sector, but an underweight position in the sector detracted. During the reporting period, our research indicated that many consumer staples stocks continued to have challenged fundamentals and unattractive valuations. As a result, the Fund did not own some strong performers, including Philip Morris and Altria.
Within the Russell 1000® Growth Index, health care stocks overall declined nearly 10% during the reporting period. The Fund’s overweight position in the sector detracted from relative performance. In our opinion, positive fundamentals have been overshadowed by political concerns related to the election cycle. Negative press coverage—including stories about Mylan’s price increases on its EpiPen—contributed to weak sentiment in the sector. The Fund did not own Mylan during the reporting period.
While the Fund’s overweight position in the strong-performing information technology sector helped relative performance, stock selection within the sector detracted.
During the reporting period, which individual stocks made the strongest contributions to the Fund’s absolute performance and which stocks detracted the most?
The strongest contributions to the Fund’s absolute performance during the reporting period came from managed care provider UnitedHealth Group, Internet catalog and retail company Amazon.com and medical device manufacturer Boston Scientific. UnitedHealth Group saw strong revenue and earnings growth because of the company’s scale and its diverse array of health and well-being services. Amazon.com continued to dominate the Internet retailing industry. The company’s cloud computing business, Amazon Web Services, added to revenue and earnings growth during the reporting period. Boston Scientific saw accelerating top-line growth driven by new products in its cardiology and urology units.
The most significant detractor from the Fund’s absolute performance was online professional networking company LinkedIn. The company reported strong results in the first quarter of 2016 but provided guidance that its Talent Solutions business was experiencing slowing growth and advised that the company’s once promising off-network advertising business would be
| 1. | Mr. Winslow will serve as portfolio manager until December 31, 2016. |
| 2. | See footnote on page 6 for more information on this index. |
| 3. | See footnote on page 6 for more information on Lipper Inc. |
discontinued. These factors undermined the company’s forward growth prospects.
A position in specialty pharmaceutical company Allergan also detracted from the Fund’s absolute performance after the company’s acquisition by Pfizer was called off. Although we viewed the stock as attractively valued, the health care sector in general—and pharmaceutical companies in particular—were largely out of favor during the reporting period.
Athletic footwear and apparel company Nike also detracted from the Fund’s absolute performance. Investor’s appeared to be concerned about slower revenue growth in Europe and China, which were among some of the company’s highest-margin regions. We viewed the company as well-positioned, with better inventory levels and several product launches during the summer Olympics.
Did the Fund make any significant purchases or sales during the reporting period?
The Fund’s largest new purchases during the reporting period were media company Comcast, aerospace and defense company Lockheed Martin and payment processing company Fidelity National Information Services.
The vertical integration of Comcast’s leading broadcast units, cable networks and content studios—along with with the largest domestic cable and broadband distribution networks—have, in our opinion, positioned the company for future growth in an evolving industry. After several years of flat-to-declining defense spending, Lockheed Martin has finally moved higher, with solid growth prospects for several years in light of the tense geopolitical environment. In this environment, we believe that Lockheed Martin is poised to increase its revenues. The Fund purchased a position in Fidelity National Information Services because the company was benefiting from the secular shift to electronic payments and from the integration of a recent acquisition.
The Fund’s most significant sales during the reporting period included eliminating positions in online professional networking company LinkedIn and medical device manufacturer Medtronic, as well as trimming the Fund’s position in social media company Facebook. We sold the Fund’s position in LinkedIn because of slowing growth in the company’s talent solutions business and the discontinuation of the company’s once-promising off-network advertising business. We sold the Fund’s position in Medtronic to pursue other health care holdings that we found more compelling. Medtronic’s margins were below our expectations, and we believed that foreign-exchange headwinds could challenge the company’s future growth. Facebook was a large holding in the Fund; but during the reporting period, we
sold some of the Fund’s shares as we sought to manage position size.
How did the Fund’s sector weightings change during the reporting period?
During the reporting period, we increased the Fund’s weightings relative to the Russell 1000® Growth Index in the energy and industrials sectors. In 2015, we essentially owned no energy holdings, anticipating that oil prices would remain low for an extended period. By February 2016, oil prices had declined to $26 per barrel, a level we viewed as unsustainably low, and the Fund has since added two holdings in the sector.
During the reporting period, we reduced the degree to which the Fund was underweight in the industrials sector. We expect that slow global growth may challenge the sector overall. Nevertheless, we believe that idiosyncratic factors can benefit certain companies—such as increased shipments from Mexico (Kansas City Southern) or higher defense spending (Raytheon).
Several major indexes have added real estate as a sector. As of October 31, 2016, real estate accounted for 3% of the Fund’s net assets. The Fund has positions in two cellular tower companies, both structured as real estate investment trusts (REITs).
The Fund maintained an overweight position in the consumer discretionary and health care sectors but reduced the size of these positions during the reporting period. We continued to find compelling opportunities relative to the benchmark in both sectors but also noted that certain subsectors—such as retailing in the consumer space and drug companies in the health care sector—may face meaningful challenges in the current environment.
Finally, the Fund held a benchmark weight in materials in 2015 and ended the reporting period at 2% underweight.
How was the Fund positioned at the end of the reporting period?
As of October 31, 2016, the Fund held overweight positions relative to the Russell 1000® Growth Index in information technology, consumer discretionary and health care sectors. Despite recent weakness in the health care sector, we sought to invest in health care companies with strong fundamentals and attractive valuations.
As of the same date, the Fund held underweight positions in consumer staples, industrials and financials. This positioning reflected our view that consumer staples companies were expensive on historical basis and that low interest rates may continue to challenge industrial and financial companies.
The opinions expressed are those of the portfolio managers as of the date of this report and are subject to change. There is no guarantee that any forecasts made will come to pass. This material does not constitute investment advice and is not intended as an endorsement of any specific investment.
| | |
| 10 | | MainStay Large Cap Growth Fund |
Portfolio of Investments October 31, 2016
| | | | | | | | |
| | |
Shares | | | Value | |
| Common Stocks 98.7%† | |
Aerospace & Defense 1.6% | | | | | | | | |
Raytheon Co. | | | 1,684,000 | | | $ | 230,051,240 | |
| | | | | | | | |
| | |
Banks 1.0% | | | | | | | | |
JPMorgan Chase & Co. | | | 2,009,300 | | | | 139,164,118 | |
| | | | | | | | |
| | |
Beverages 1.0% | | | | | | | | |
PepsiCo., Inc. | | | 1,362,600 | | | | 146,070,720 | |
| | | | | | | | |
| | |
Biotechnology 3.5% | | | | | | | | |
¨Celgene Corp. (a) | | | 3,288,470 | | | | 336,015,865 | |
Regeneron Pharmaceuticals, Inc. (a) | | | 464,400 | | | | 160,227,288 | |
| | | | | | | | |
| | | | | | | 496,243,153 | |
| | | | | | | | |
Capital Markets 1.0% | | | | | | | | |
Moody’s Corp. | | | 1,418,600 | | | | 142,597,672 | |
| | | | | | | | |
| | |
Chemicals 2.0% | | | | | | | | |
Ecolab, Inc. | | | 1,144,900 | | | | 130,713,233 | |
Sherwin-Williams Co. (The) | | | 593,725 | | | | 145,379,503 | |
| | | | | | | | |
| | | | | | | 276,092,736 | |
| | | | | | | | |
Food & Staples Retailing 2.0% | | | | | | | | |
Costco Wholesale Corp. | | | 1,201,700 | | | | 177,695,379 | |
CVS Health Corp. | | | 1,333,900 | | | | 112,180,990 | |
| | | | | | | | |
| | | | | | | 289,876,369 | |
| | | | | | | | |
Health Care Equipment & Supplies 6.9% | |
Boston Scientific Corp. (a) | | | 6,194,200 | | | | 136,272,400 | |
Danaher Corp. | | | 3,440,600 | | | | 270,259,130 | |
Edwards Lifesciences Corp. (a) | | | 1,695,250 | | | | 161,421,705 | |
Intuitive Surgical, Inc. (a) | | | 224,650 | | | | 150,982,772 | |
Stryker Corp. | | | 868,600 | | | | 100,193,010 | |
Zimmer Biomet Holdings, Inc. | | | 1,525,000 | | | | 160,735,000 | |
| | | | | | | | |
| | | | | | | 979,864,017 | |
| | | | | | | | |
Health Care Providers & Services 3.8% | | | | | |
Centene Corp. (a) | | | 2,564,800 | | | | 160,248,704 | |
¨UnitedHealth Group, Inc. | | | 2,719,400 | | | | 384,332,802 | |
| | | | | | | | |
| | | | | | | 544,581,506 | |
| | | | | | | | |
Hotels, Restaurants & Leisure 2.4% | | | | | | | | |
¨Starbucks Corp. | | | 6,476,600 | | | | 343,713,162 | |
| | | | | | | | |
| | |
Industrial Conglomerates 1.7% | | | | | | | | |
Honeywell International, Inc. | | | 2,181,100 | | | | 239,223,048 | |
| | | | | | | | |
| | |
Internet & Catalog Retail 9.2% | | | | | | | | |
¨Amazon.com, Inc. (a) | | | 810,140 | | | | 639,864,775 | |
| | | | | | | | |
| | |
Shares | | | Value | |
Internet & Catalog Retail (continued) | |
Ctrip.com International, Ltd., ADR (a) | | | 3,457,850 | | | $ | 152,664,077 | |
Expedia, Inc. | | | 741,550 | | | | 95,830,507 | |
Netflix, Inc. (a) | | | 1,293,800 | | | | 161,556,806 | |
Priceline Group, Inc. (The) (a) | | | 171,240 | | | | 252,447,145 | |
| | | | | | | | |
| | | | | | | 1,302,363,310 | |
| | | | | | | | |
Internet Software & Services 10.7% | | | | | | | | |
Alibaba Group Holding, Ltd., Sponsored ADR (a) | | | 1,757,600 | | | | 178,730,344 | |
¨Alphabet, Inc. | | | | | | | | |
Class A (a) | | | 452,860 | | | | 366,771,314 | |
Class C (a) | | | 404,131 | | | | 317,056,935 | |
CoStar Group, Inc. (a) | | | 744,315 | | | | 139,276,223 | |
¨Facebook, Inc. Class A (a) | | | 3,961,500 | | | | 518,916,885 | |
| | | | | | | | |
| | | | | | | 1,520,751,701 | |
| | | | | | | | |
IT Services 11.5% | | | | | | | | |
Fidelity National Information Services, Inc. | | | 2,685,000 | | | | 198,475,200 | |
FleetCor Technologies, Inc. (a) | | | 1,462,650 | | | | 256,402,545 | |
MasterCard, Inc. Class A | | | 2,802,400 | | | | 299,912,848 | |
PayPal Holdings, Inc. (a) | | | 6,624,750 | | | | 275,987,085 | |
¨Visa, Inc. Class A | | | 7,293,500 | | | | 601,786,685 | |
| | | | | | | | |
| | | | | | | 1,632,564,363 | |
| | | | | | | | |
Life Sciences Tools & Services 1.2% | | | | | | | | |
Thermo Fisher Scientific, Inc. | | | 1,144,900 | | | | 168,334,647 | |
| | | | | | | | |
| | |
Machinery 0.7% | | | | | | | | |
Fortive Corp. | | | 2,009,350 | | | | 102,577,318 | |
| | | | | | | | |
| | |
Media 2.7% | | | | | | | | |
Charter Communications, Inc. Class A (a) | | | 533,822 | | | | 133,396,780 | |
Comcast Corp. Class A | | | 2,312,800 | | | | 142,977,296 | |
Time Warner, Inc. | | | 1,244,150 | | | | 110,716,908 | |
| | | | | | | | |
| | | | | | | 387,090,984 | |
| | | | | | | | |
Multiline Retail 1.4% | | | | | | | | |
Dollar Tree, Inc. (a) | | | 2,659,300 | | | | 200,910,115 | |
| | | | | | | | |
| | |
Oil, Gas & Consumable Fuels 2.1% | | | | | | | | |
Diamondback Energy, Inc. (a) | | | 1,580,000 | | | | 144,238,200 | |
Pioneer Natural Resources Co. | | | 816,100 | | | | 146,098,222 | |
| | | | | | | | |
| | | | | | | 290,336,422 | |
| | | | | | | | |
Pharmaceuticals 3.8% | | | | | | | | |
Allergan PLC (a) | | | 756,810 | | | | 158,127,881 | |
Eli Lilly & Co. | | | 1,399,600 | | | | 103,346,464 | |
Zoetis, Inc. | | | 5,919,600 | | | | 282,956,880 | |
| | | | | | | | |
| | | | | | | 544,431,225 | |
| | | | | | | | |
| † | Percentages indicated are based on Fund net assets. |
| ¨ | | Among the Fund’s 10 largest holdings or issuers, as of October 31, 2016, excluding short-term investment. May be subject to change daily. (Unaudited) |
| | | | | | |
The notes to the financial statements are an integral part of,
and should be read in conjunction with, the financial statements. | | | | | 11 | |
Portfolio of Investments October 31, 2016 (continued)
| | | | | | | | |
| | |
Shares | | | Value | |
| Common Stocks (continued) | |
Professional Services 1.0% | | | | | | | | |
Nielsen Holdings PLC | | | 3,131,500 | | | $ | 140,980,130 | |
| | | | | | | | |
| | |
Real Estate Investment Trusts 2.7% | | | | | | | | |
American Tower Corp. | | | 2,049,600 | | | | 240,192,624 | |
Crown Castle International Corp. | | | 1,499,900 | | | | 136,475,901 | |
| | | | | | | | |
| | | | | | | 376,668,525 | |
| | | | | | | | |
Road & Rail 1.0% | | | | | | | | |
Kansas City Southern | | | 1,637,300 | | | | 143,689,448 | |
| | | | | | | | |
|
Semiconductors & Semiconductor Equipment 3.6% | |
Applied Materials, Inc. | | | 4,076,200 | | | | 118,535,896 | |
Broadcom, Ltd. | | | 1,568,500 | | | | 267,084,180 | |
Micron Technology, Inc. (a) | | | 7,671,300 | | | | 131,639,508 | |
| | | | | | | | |
| | | | | | | 517,259,584 | |
| | | | | | | | |
Software 10.3% | | | | | | | | |
Activision Blizzard, Inc. | | | 2,988,400 | | | | 129,009,228 | |
Adobe Systems, Inc. (a) | | | 2,072,400 | | | | 222,803,724 | |
Microsoft Corp. | | | 4,654,500 | | | | 278,897,640 | |
Mobileye N.V. (a) | | | 3,574,300 | | | | 132,892,474 | |
¨salesforce.com, Inc. (a) | | | 4,161,900 | | | | 312,808,404 | |
ServiceNow, Inc. (a) | | | 2,215,500 | | | | 194,764,605 | |
Splunk, Inc. (a) | | | 3,089,700 | | | | 185,969,043 | |
| | | | | | | | |
| | | | | | | 1,457,145,118 | |
| | | | | | | | |
Specialty Retail 2.7% | | | | | | | | |
Home Depot, Inc. (The) | | | 1,846,400 | | | | 225,279,264 | |
O’Reilly Automotive, Inc. (a) | | | 569,550 | | | | 150,611,802 | |
| | | | | | | | |
| | | | | | | 375,891,066 | |
| | | | | | | | |
Technology Hardware, Storage & Peripherals 3.9% | |
¨Apple, Inc. | | | 4,828,085 | | | | 548,180,771 | |
| | | | | | | | |
|
Textiles, Apparel & Luxury Goods 3.3% | |
lululemon athletica, Inc. (a) | | | 1,901,350 | | | | 108,852,287 | |
¨NIKE, Inc. Class B | | | 7,171,400 | | | | 359,860,852 | |
| | | | | | | | |
| | | | | | | 468,713,139 | |
| | | | | | | | |
Total Common Stocks
(Cost $9,925,156,862) | | | | | | | 14,005,365,607 | |
| | | | | | | | |
| | | | | | | | |
| | | Principal
Amount | | | Value | |
| Short-Term Investment 0.9% | | | | | |
Repurchase Agreement 0.9% | | | | | | | | |
Fixed Income Clearing Corp.
0.03%, dated 10/31/16
due 11/1/16
Proceeds at Maturity $131,120,876 (Collateralized by United States Treasury and Government Agency securities with rates between 1.00% and 1.25% and maturity dates between 10/2/19 and 10/15/19, with a Principal Amount of $133,520,000 and a Market Value of $133,744,366) | | $ | 131,120,767 | | | $ | 131,120,767 | |
| | | | | | | | |
Total Short-Term Investment
(Cost $131,120,767) | | | | | | | 131,120,767 | |
| | | | | | | | |
Total Investments
(Cost $10,056,277,629) (b) | | | 99.6 | % | | | 14,136,486,374 | |
Other Assets, Less Liabilities | | | 0.4 | | | | 60,143,097 | |
Net Assets | | | 100.0 | % | | $ | 14,196,629,471 | |
| (a) | Non-income producing security. |
| (b) | As of October 31, 2016, cost was $10,098,165,039 for federal income tax purposes and net unrealized appreciation was as follows: |
| | | | |
Gross unrealized appreciation | | $ | 4,292,288,088 | |
Gross unrealized depreciation | | | (253,966,753 | ) |
| | | | |
Net unrealized appreciation | | $ | 4,038,321,335 | |
| | | | |
The following abbreviation is used in the preceding pages:
ADR—American Depositary Receipt
| | | | |
| 12 | | MainStay Large Cap Growth Fund | | The notes to the financial statements are an integral part of,
and should be read in conjunction with, the financial statements. |
The following is a summary of the fair valuations according to the inputs used as of October 31, 2016, for valuing the Fund’s assets.
Asset Valuation Inputs
| | | | | | | | | | | | | | | | |
Description | | Quoted
Prices in
Active
Markets for
Identical
Assets (Level 1) | | | Significant
Other
Observable
Inputs (Level 2) | | | Significant
Unobservable
Inputs (Level 3) | | | Total | |
| Investments in Securities (a) | | | | | | | | | | | | | | | | |
| Common Stocks | | $ | 14,005,365,607 | | | $ | — | | | $ | — | | | $ | 14,005,365,607 | |
| Short-Term Investment | | | | | | | | | | | | | | | | |
Repurchase Agreement | | | — | | | | 131,120,767 | | | | — | | | | 131,120,767 | |
| | | | | | | | | | | | | | | | |
| Total Investments in Securities | | $ | 14,005,365,607 | | | $ | 131,120,767 | | | $ | — | | | $ | 14,136,486,374 | |
| | | | | | | | | | | | | | | | |
| (a) | For a complete listing of investments and their industries, see the Portfolio of Investments. |
The Fund recognizes transfers between the levels as of the beginning of the period.
For the period ended October 31, 2016, the Fund did not have any transfers between Level 1 and Level 2 fair value measurements. (See Note 2)
As of October 31, 2016, the Fund did not hold any investments with significant unobservable inputs (Level 3). (See Note 2)
| | | | | | |
The notes to the financial statements are an integral part of,
and should be read in conjunction with, the financial statements. | | | | | 13 | |
Statement of Assets and Liabilities as of October 31, 2016
| | | | |
| Assets | |
Investment in securities, at value
(identified cost $10,056,277,629) | | $ | 14,136,486,374 | |
Receivables: | | | | |
Investment securities sold | | | 331,114,382 | |
Fund shares sold | | | 34,083,615 | |
Dividends and interest | | | 2,930,565 | |
Other assets | | | 97,876 | |
| | | | |
Total assets | | | 14,504,712,812 | |
| | | | |
| |
| Liabilities | | | | |
Payables: | | | | |
Investment securities purchased | | | 234,900,485 | |
Fund shares redeemed | | | 61,349,221 | |
Manager (See Note 3) | | | 7,642,921 | |
Transfer agent (See Note 3) | | | 2,893,503 | |
NYLIFE Distributors (See Note 3) | | | 659,289 | |
Shareholder communication | | | 232,602 | |
Professional fees | | | 158,398 | |
Custodian | | | 122,720 | |
Trustees | | | 41,928 | |
Accrued expenses | | | 82,274 | |
| | | | |
Total liabilities | | | 308,083,341 | |
| | | | |
Net assets | | $ | 14,196,629,471 | |
| | | | |
| |
| Composition of Net Assets | | | | |
Shares of beneficial interest outstanding (par value of $.01 per share) unlimited number of shares authorized | | $ | 14,891,938 | |
Additional paid-in capital | | | 8,617,100,681 | |
| | | | |
| | | 8,631,992,619 | |
Accumulated net realized gain (loss) on investments | | | 1,484,428,107 | |
Net unrealized appreciation (depreciation) on investments | | | 4,080,208,745 | |
| | | | |
Net assets | | $ | 14,196,629,471 | |
| | | | |
| | | | |
Class A | | | | |
Net assets applicable to outstanding shares | | $ | 882,020,811 | |
| | | | |
Shares of beneficial interest outstanding | | | 96,202,904 | |
| | | | |
Net asset value per share outstanding | | $ | 9.17 | |
Maximum sales charge (5.50% of offering price) | | | 0.53 | |
| | | | |
Maximum offering price per share outstanding | | $ | 9.70 | |
| | | | |
Investor Class | | | | |
Net assets applicable to outstanding shares | | $ | 167,631,454 | |
| | | | |
Shares of beneficial interest outstanding | | | 18,444,626 | |
| | | | |
Net asset value per share outstanding | | $ | 9.09 | |
Maximum sales charge (5.50% of offering price) | | | 0.53 | |
| | | | |
Maximum offering price per share outstanding | | $ | 9.62 | |
| | | | |
Class B | | | | |
Net assets applicable to outstanding shares | | $ | 36,548,758 | |
| | | | |
Shares of beneficial interest outstanding | | | 4,506,025 | |
| | | | |
Net asset value and offering price per share outstanding | | $ | 8.11 | |
| | | | |
Class C | | | | |
Net assets applicable to outstanding shares | | $ | 306,409,087 | |
| | | | |
Shares of beneficial interest outstanding | | | 37,829,932 | |
| | | | |
Net asset value and offering price per share outstanding | | $ | 8.10 | |
| | | | |
Class I | | | | |
Net assets applicable to outstanding shares | | $ | 8,994,996,652 | |
| | | | |
Shares of beneficial interest outstanding | | | 932,127,036 | |
| | | | |
Net asset value and offering price per share outstanding | | $ | 9.65 | |
| | | | |
Class R1 | | | | |
Net assets applicable to outstanding shares | | $ | 1,636,560,343 | |
| | | | |
Shares of beneficial interest outstanding | | | 172,657,944 | |
| | | | |
Net asset value and offering price per share outstanding | | $ | 9.48 | |
| | | | |
Class R2 | | | | |
Net assets applicable to outstanding shares | | $ | 391,534,515 | |
| | | | |
Shares of beneficial interest outstanding | | | 42,771,273 | |
| | | | |
Net asset value and offering price per share outstanding | | $ | 9.15 | |
| | | | |
Class R3 | | | | |
Net assets applicable to outstanding shares | | $ | 87,059,982 | |
| | | | |
Shares of beneficial interest outstanding | | | 9,841,140 | |
| | | | |
Net asset value and offering price per share outstanding | | $ | 8.85 | |
| | | | |
Class R6 | | | | |
Net assets applicable to outstanding shares | | $ | 1,693,867,869 | |
| | | | |
Shares of beneficial interest outstanding | | | 174,812,966 | |
| | | | |
Net asset value and offering price per share outstanding | | $ | 9.69 | |
| | | | |
| | | | |
| 14 | | MainStay Large Cap Growth Fund | | The notes to the financial statements are an integral part of,
and should be read in conjunction with, the financial statements. |
Statement of Operations for the year ended October 31, 2016
| | | | |
| Investment Income (Loss) | |
Income | | | | |
Dividends | | $ | 134,577,490 | |
Interest | | | 28,252 | |
| | | | |
Total income | | | 134,605,742 | |
| | | | |
Expenses | | | | |
Manager (See Note 3) | | | 95,392,023 | |
Transfer agent (See Note 3) | | | 18,088,295 | |
Distribution/Service—Class A (See Note 3) | | | 2,555,498 | |
Distribution/Service—Investor Class (See Note 3) | | | 435,122 | |
Distribution/Service—Class B (See Note 3) | | | 410,445 | |
Distribution/Service—Class C (See Note 3) | | | 3,542,923 | |
Distribution/Service—Class R2 (See Note 3) | | | 1,316,064 | |
Distribution/Service—Class R3 (See Note 3) | | | 490,240 | |
Shareholder service (See Note 3) | | | 2,451,302 | |
Professional fees | | | 780,893 | |
Shareholder communication | | | 645,755 | |
Trustees | | | 407,754 | |
Registration | | | 263,325 | |
Custodian | | | 262,011 | |
Interest expense | | | 3,025 | |
Miscellaneous | | | 496,525 | |
| | | | |
Total expenses before waiver/reimbursement | | | 127,541,200 | |
Expense waiver/reimbursement from Manager (See Note 3) | | | (1,077,461 | ) |
Reimbursement from custodian (a) | | | (83,489 | ) |
| | | | |
Net expenses | | | 126,380,250 | |
| | | | |
Net investment income (loss) | | | 8,225,492 | |
| | | | |
|
Realized and Unrealized Gain (Loss)
on Investments | |
Net realized gain (loss) on investments | | | 1,723,956,661 | |
Net change in unrealized appreciation (depreciation) on investments | | | (2,190,510,484 | ) |
| | | | |
Net realized and unrealized gain (loss) on investments | | | (466,553,823 | ) |
| | | | |
Net increase (decrease) in net assets resulting from operations | | $ | (458,328,331 | ) |
| | | | |
| (a) | Reimbursement from custodian represents a refund for overbilling of prior years’ custody out-of-pocket fees. |
| | | | | | |
The notes to the financial statements are an integral part of,
and should be read in conjunction with, the financial statements. | | | | | 15 | |
Statements of Changes in Net Assets
for the years ended October 31, 2016 and October 31, 2015
| | | | | | | | |
| | | 2016 | | | 2015 | |
| Increase (Decrease) in Net Assets | |
Operations: | | | | | | | | |
Net investment income (loss) | | $ | 8,225,492 | | | $ | (9,676,580 | ) |
Net realized gain (loss) on investments | | | 1,723,956,661 | | | | 2,381,897,095 | |
Net change in unrealized appreciation (depreciation) on investments | | | (2,190,510,484 | ) | | | (812,353,846 | ) |
| | | | |
Net increase (decrease) in net assets resulting from operations | | | (458,328,331 | ) | | | 1,559,866,669 | |
| | | | |
Distributions to shareholders: | | | | | | | | |
From net realized gain on investments: | | | | | |
Class A | | | (142,419,821 | ) | | | (125,570,603 | ) |
Investor Class | | | (22,800,549 | ) | | | (19,330,344 | ) |
Class B | | | (6,317,895 | ) | | | (5,511,858 | ) |
Class C | | | (53,490,540 | ) | | | (42,270,495 | ) |
Class I | | | (1,353,826,295 | ) | | | (1,298,539,884 | ) |
Class R1 | | | (243,267,444 | ) | | | (207,982,444 | ) |
Class R2 | | | (77,201,297 | ) | | | (92,684,573 | ) |
Class R3 | | | (13,765,123 | ) | | | (15,451,512 | ) |
Class R6 | | | (148,689,366 | ) | | | (69,346,873 | ) |
| | | | |
Total distributions to shareholders | | | (2,061,778,330 | ) | | | (1,876,688,586 | ) |
| | | | |
Capital share transactions: | | | | | | | | |
Net proceeds from sale of shares | | | 3,454,173,773 | | | | 3,835,563,572 | |
Net asset value of shares issued to shareholders in reinvestment of distributions | | | 1,630,820,951 | | | | 1,486,839,316 | |
Cost of shares redeemed | | | (6,409,403,860 | ) | | | (7,392,003,445 | ) |
| | | | |
Increase (decrease) in net assets derived from capital share transactions | | | (1,324,409,136 | ) | | | (2,069,600,557 | ) |
| | | | |
Net increase (decrease) in net assets | | | (3,844,515,797 | ) | | | (2,386,422,474 | ) |
|
| Net Assets | |
Beginning of year | | | 18,041,145,268 | | | | 20,427,567,742 | |
| | | | |
End of year | | $ | 14,196,629,471 | | | $ | 18,041,145,268 | |
| | | | |
Net investment income (loss) | | $ | — | | | $ | (9,676,580 | ) |
| | | | |
| | | | |
| 16 | | MainStay Large Cap Growth Fund | | The notes to the financial statements are an integral part of,
and should be read in conjunction with, the financial statements. |
Financial Highlights selected per share data and ratios
| | | | | | | | | | | | | | | | | | | | |
| | | Year ended October 31, | |
| Class A | | 2016 | | | 2015 | | | 2014 | | | 2013 | | | 2012 | |
Net asset value at beginning of year | | $ | 10.68 | | | $ | 10.91 | | | $ | 9.98 | | | $ | 7.55 | | | $ | 7.24 | |
| | | | | | | | | | | | | | | | | | | | |
Net investment income (loss) (a) | | | (0.01 | ) | | | (0.02 | ) | | | (0.02 | ) | | | 0.01 | | | | (0.02 | ) |
Net realized and unrealized gain (loss) on investments | | | (0.23 | ) | | | 0.85 | | | | 1.45 | | | | 2.42 | | | | 0.49 | |
| | | | | | | | | | | | | | | | | | | | |
Total from investment operations | | | (0.24 | ) | | | 0.83 | | | | 1.43 | | | | 2.43 | | | | 0.47 | |
| | | | | | | | | | | | | | | | | | | | |
| Less dividends and distributions: | | | | | | | | | | | | | | | | | | | | |
From net investment income | | | — | | | | — | | | | — | | | | (0.00 | )‡ | | | — | |
From net realized gain on investments | | | (1.27 | ) | | | (1.06 | ) | | | (0.50 | ) | | | — | | | | (0.16 | ) |
| | | | | | | | | | | | | | | | | | | | |
Total dividends and distributions | | | (1.27 | ) | | | (1.06 | ) | | | (0.50 | ) | | | (0.00 | )‡ | | | (0.16 | ) |
| | | | | | | | | | | | | | | | | | | | |
Net asset value at end of year | | $ | 9.17 | | | $ | 10.68 | | | $ | 10.91 | | | $ | 9.98 | | | $ | 7.55 | |
| | | | | | | | | | | | | | | | | | | | |
Total investment return (b) | | | (2.44 | %) | | | 8.10 | % | | | 14.95 | % | | | 32.09 | % | | | 6.79 | % |
| Ratios (to average net assets)/Supplemental Data: | | | | | | | | | | | | | | | | | | | | |
Net investment income (loss) | | | (0.13 | %) | | | (0.23 | %) | | | (0.22 | %) | | | 0.17 | % | | | (0.20 | %) |
Net expenses | | | 0.99 | % | | | 0.99 | % | | | 0.99 | % | | | 1.02 | % | | | 1.04 | % |
Expenses (before waiver/reimbursement) | | | 1.00 | % | | | 0.99 | % | | | 0.99 | % | | | 1.02 | % | | | 1.04 | % |
Portfolio turnover rate | | | 84 | % | | | 66 | % | | | 67 | % | | | 74 | % | | | 60 | % |
Net assets at end of year (in 000’s) | | $ | 882,021 | | | $ | 1,202,852 | | | $ | 1,304,641 | | | $ | 1,615,768 | | | $ | 1,611,374 | |
| ‡ | Less than one cent per share. |
| (a) | Per share data based on average shares outstanding during the year. |
| (b) | Total investment return is calculated exclusive of sales charges and assumes the reinvestment of dividends and distributions. |
| | | | | | | | | | | | | | | | | | | | |
| | | Year ended October 31, | |
| Investor Class | | 2016 | | | 2015 | | | 2014 | | | 2013 | | | 2012 | |
Net asset value at beginning of year | | $ | 10.61 | | | $ | 10.84 | | | $ | 9.93 | | | $ | 7.52 | | | $ | 7.21 | |
| | | | | | | | | | | | | | | | | | | | |
Net investment income (loss) (a) | | | (0.02 | ) | | | (0.03 | ) | | | (0.03 | ) | | | 0.01 | | | | (0.02 | ) |
Net realized and unrealized gain (loss) on investments | | | (0.23 | ) | | | 0.86 | | | | 1.44 | | | | 2.40 | | | | 0.49 | |
| | | | | | | | | | | | | | | | | | | | |
Total from investment operations | | | (0.25 | ) | | | 0.83 | | | | 1.41 | | | | 2.41 | | | | 0.47 | |
| | | | | | | | | | | | | | | | | | | | |
| Less dividends and distributions: | | | | | | | | | | | | | | | | | | | | |
From net investment income | | | — | | | | — | | | | — | | | | (0.00 | )‡ | | | — | |
From net realized gain on investments | | | (1.27 | ) | | | (1.06 | ) | | | (0.50 | ) | | | — | | | | (0.16 | ) |
| | | | | | | | | | | | | | | | | | | | |
Total dividends and distributions | | | (1.27 | ) | | | (1.06 | ) | | | (0.50 | ) | | | (0.00 | )‡ | | | (0.16 | ) |
| | | | | | | | | | | | | | | | | | | | |
Net asset value at end of year | | $ | 9.09 | | | $ | 10.61 | | | $ | 10.84 | | | $ | 9.93 | | | $ | 7.52 | |
| | | | | | | | | | | | | | | | | | | | |
Total investment return (b) | | | (2.57 | %) | | | 8.16 | % | | | 14.82 | % | | | 32.13 | % | | | 6.68 | % |
| Ratios (to average net assets)/Supplemental Data: | | | | | | | | | | | | | | | | | | | | |
Net investment income (loss) | | | (0.19 | %) | | | (0.28 | %) | | | (0.28 | %) | | | 0.09 | % | | | (0.28 | %) |
Net expenses | | | 1.05 | % | | | 1.04 | % | | | 1.04 | % | | | 1.08 | % | | | 1.10 | % |
Expenses (before waiver/reimbursement) | | | 1.06 | % | | | 1.04 | % | | | 1.04 | % | | | 1.08 | % | | | 1.10 | % |
Portfolio turnover rate | | | 84 | % | | | 66 | % | | | 67 | % | | | 74 | % | | | 60 | % |
Net assets at end of year (in 000’s) | | $ | 167,631 | | | $ | 180,154 | | | $ | 199,826 | | | $ | 211,111 | | | $ | 199,156 | |
| ‡ | Less than one cent per share. |
| (a) | Per share data based on average shares outstanding during the year. |
| (b) | Total investment return is calculated exclusive of sales charges and assumes the reinvestment of dividends and distributions. |
| | | | | | |
The notes to the financial statements are an integral part of,
and should be read in conjunction with, the financial statements. | | | | | 17 | |
Financial Highlights selected per share data and ratios
| | | | | | | | | | | | | | | | | | | | |
| | | Year ended October 31, | |
| Class B | | 2016 | | | 2015 | | | 2014 | | | 2013 | | | 2012 | |
Net asset value at beginning of year | | $ | 9.67 | | | $ | 10.04 | | | $ | 9.29 | | | $ | 7.09 | | | $ | 6.86 | |
| | | | | | | | | | | | | | | | | | | | |
Net investment income (loss) (a) | | | (0.08 | ) | | | (0.10 | ) | | | (0.10 | ) | | | (0.05 | ) | | | (0.07 | ) |
Net realized and unrealized gain (loss) on investments | | | (0.21 | ) | | | 0.79 | | | | 1.35 | | | | 2.25 | | | | 0.46 | |
| | | | | | | | | | | | | | | | | | | | |
Total from investment operations | | | (0.29 | ) | | | 0.69 | | | | 1.25 | | | | 2.20 | | | | 0.39 | |
| | | | | | | | | | | | | | | | | | | | |
| Less dividends and distributions: | | | | | | | | | | | | | | | | | | | | |
From net investment income | | | — | | | | — | | | | — | | | | (0.00 | )‡ | | | — | |
From net realized gain on investments | | | (1.27 | ) | | | (1.06 | ) | | | (0.50 | ) | | | — | | | | (0.16 | ) |
| | | | | | | | | | | | | | | | | | | | |
Total dividends and distributions | | | (1.27 | ) | | | (1.06 | ) | | | (0.50 | ) | | | (0.00 | )‡ | | | (0.16 | ) |
| | | | | | | | | | | | | | | | | | | | |
Net asset value at end of year | | $ | 8.11 | | | $ | 9.67 | | | $ | 10.04 | | | $ | 9.29 | | | $ | 7.09 | |
| | | | | | | | | | | | | | | | | | | | |
Total investment return (b) | | | (3.32 | %) | | | 7.34 | % | | | 14.08 | % | | | 30.93 | % | | | 5.98 | % |
| Ratios (to average net assets)/Supplemental Data: | | | | | | | | | | | | | | | | | | | | |
Net investment income (loss) | | | (0.94 | %) | | | (1.03 | %) | | | (1.02 | %) | | | (0.65 | %) | | | (1.01 | %) |
Net expenses | | | 1.80 | % | | | 1.79 | % | | | 1.79 | % | | | 1.83 | % | | | 1.84 | % |
Expenses (before waiver/reimbursement) | | | 1.81 | % | | | 1.79 | % | | | 1.79 | % | | | 1.83 | % | | | 1.85 | % |
Portfolio turnover rate | | | 84 | % | | | 66 | % | | | 67 | % | | | 74 | % | | | 60 | % |
Net assets at end of year (in 000’s) | | $ | 36,549 | | | $ | 47,779 | | | $ | 52,737 | | | $ | 59,671 | | | $ | 58,392 | |
| ‡ | Less than one cent per share. |
| (a) | Per share data based on average shares outstanding during the year. |
| (b) | Total investment return is calculated exclusive of sales charges and assumes the reinvestment of dividends and distributions. |
| | | | | | | | | | | | | | | | | | | | |
| | | Year ended October 31, | |
| Class C | | 2016 | | | 2015 | | | 2014 | | | 2013 | | | 2012 | |
Net asset value at beginning of year | | $ | 9.66 | | | $ | 10.03 | | | $ | 9.29 | | | $ | 7.09 | | | $ | 6.85 | |
| | | | | | | | | | | | | | | | | | | | |
Net investment income (loss) (a) | | | (0.08 | ) | | | (0.10 | ) | | | (0.10 | ) | | | (0.05 | ) | | | (0.07 | ) |
Net realized and unrealized gain (loss) on investments | | | (0.21 | ) | | | 0.79 | | | | 1.34 | | | | 2.25 | | | | 0.47 | |
| | | | | | | | | | | | | | | | | | | | |
Total from investment operations | | | (0.29 | ) | | | 0.69 | | | | 1.24 | | | | 2.20 | | | | 0.40 | |
| | | | | | | | | | | | | | | | | | | | |
| Less dividends and distributions: | | | | | | | | | | | | | | | | | | | | |
From net investment income | | | — | | | | — | | | | — | | | | (0.00 | )‡ | | | — | |
From net realized gain on investments | | | (1.27 | ) | | | (1.06 | ) | �� | | (0.50 | ) | | | — | | | | (0.16 | ) |
| | | | | | | | | | | | | | | | | | | | |
Total dividends and distributions | | | (1.27 | ) | | | (1.06 | ) | | | (0.50 | ) | | | (0.00 | )‡ | | | (0.16 | ) |
| | | | | | | | | | | | | | | | | | | | |
Net asset value at end of year | | $ | 8.10 | | | $ | 9.66 | | | $ | 10.03 | | | $ | 9.29 | | | $ | 7.09 | |
| | | | | | | | | | | | | | | | | | | | |
Total investment return (b) | | | (3.31 | %) | | | 7.35 | % | | | 13.96 | % | | | 31.12 | % | | | 5.99 | % |
| Ratios (to average net assets)/Supplemental Data: | | | | | | | | | | | | | | | | | | | | |
Net investment income (loss) | | | (0.94 | %) | | | (1.04 | %) | | | (1.02 | %) | | | (0.66 | %) | | | (1.02 | %) |
Net expenses | | | 1.80 | % | | | 1.79 | % | | | 1.79 | % | | | 1.83 | % | | | 1.85 | % |
Expenses (before waiver/reimbursement) | | | 1.81 | % | | | 1.79 | % | | | 1.79 | % | | | 1.83 | % | | | 1.85 | % |
Portfolio turnover rate | | | 84 | % | | | 66 | % | | | 67 | % | | | 74 | % | | | 60 | % |
Net assets at end of year (in 000’s) | | $ | 306,409 | | | $ | 408,078 | | | $ | 402,714 | | | $ | 403,968 | | | $ | 375,521 | |
| ‡ | Less than one cent per share. |
| (a) | Per share data based on average shares outstanding during the year. |
| (b) | Total investment return is calculated exclusive of sales charges and assumes the reinvestment of dividends and distributions. |
| | | | |
| 18 | | MainStay Large Cap Growth Fund | | The notes to the financial statements are an integral part of,
and should be read in conjunction with, the financial statements. |
Financial Highlights selected per share data and ratios
| | | | | | | | | | | | | | | | | | | | |
| | | Year ended October 31, | |
| Class I | | 2016 | | | 2015 | | | 2014 | | | 2013 | | | 2012 | |
Net asset value at beginning of year | | $ | 11.15 | | | $ | 11.32 | | | $ | 10.31 | | | $ | 7.80 | | | $ | 7.45 | |
| | | | | | | | | | | | | | | | | | | | |
Net investment income (loss) (a) | | | 0.01 | | | | 0.00 | ‡ | | | 0.00 | ‡ | | | 0.03 | | | | 0.00 | ‡ |
Net realized and unrealized gain (loss) on investments | | | (0.24 | ) | | | 0.89 | | | | 1.51 | | | | 2.50 | | | | 0.51 | |
| | | | | | | | | | | | | | | | | | | | |
Total from investment operations | | | (0.23 | ) | | | 0.89 | | | | 1.51 | | | | 2.53 | | | | 0.51 | |
| | | | | | | | | | | | | | | | | | | | |
| Less dividends and distributions: | | | | | | | | | | | | | | | | | | | | |
From net investment income | | | — | | | | — | | | | — | | | | (0.02 | ) | | | — | |
From net realized gain on investments | | | (1.27 | ) | | | (1.06 | ) | | | (0.50 | ) | | | — | | | | (0.16 | ) |
| | | | | | | | | | | | | | | | | | | | |
Total dividends and distributions | | | (1.27 | ) | | | (1.06 | ) | | | (0.50 | ) | | | (0.02 | ) | | | (0.16 | ) |
| | | | | | | | | | | | | | | | | | | | |
Net asset value at end of year | | $ | 9.65 | | | $ | 11.15 | | | $ | 11.32 | | | $ | 10.31 | | | $ | 7.80 | |
| | | | | | | | | | | | | | | | | | | | |
Total investment return (b) | | | (2.23 | %) | | | 8.36 | % | | | 15.26 | % | | | 32.41 | % | | | 7.15 | % |
| Ratios (to average net assets)/Supplemental Data: | | | | | | | | | | | | | | | | | | | | |
Net investment income (loss) | | | 0.12 | % | | | 0.02 | % | | | 0.02 | % | | | 0.38 | % | | | 0.03 | % |
Net expenses | | | 0.74 | % | | | 0.74 | % | | | 0.74 | % | | | 0.77 | % | | | 0.79 | % |
Expenses (before waiver/reimbursement) | | | 0.75 | % | | | 0.74 | % | | | 0.74 | % | | | 0.77 | % | | | 0.79 | % |
Portfolio turnover rate | | | 84 | % | | | 66 | % | | | 67 | % | | | 74 | % | | | 60 | % |
Net assets at end of year (in 000’s) | | $ | 8,994,997 | | | $ | 12,150,253 | | | $ | 14,361,006 | | | $ | 13,254,459 | | | $ | 11,215,464 | |
| ‡ | Less than one cent per share. |
| (a) | Per share data based on average shares outstanding during the year. |
| (b) | Total investment return is calculated exclusive of sales charges and assumes the reinvestment of dividends and distributions. Class I shares are not subject to sales charges. |
| | | | | | | | | | | | | | | | | | | | |
| | | Year ended October 31, | |
| Class R1 | | 2016 | | | 2015 | | | 2014 | | | 2013 | | | 2012 | |
Net asset value at beginning of year | | $ | 10.99 | | | $ | 11.17 | | | $ | 10.19 | | | $ | 7.72 | | | $ | 7.38 | |
| | | | | | | | | | | | | | | | | | | | |
Net investment income (loss) (a) | | | 0.00 | ‡ | | | (0.01 | ) | | | (0.01 | ) | | | 0.02 | | | | (0.01 | ) |
Net realized and unrealized gain (loss) on investments | | | (0.24 | ) | | | 0.89 | | | | 1.49 | | | | 2.47 | | | | 0.51 | |
| | | | | | | | | | | | | | | | | | | | |
Total from investment operations | | | (0.24 | ) | | | 0.88 | | | | 1.48 | | | | 2.49 | | | | 0.50 | |
| | | | | | | | | | | | | | | | | | | | |
| Less dividends and distributions: | | | | | | | | | | | | | | | | | | | | |
From net investment income | | | — | | | | — | | | | — | | | | (0.02 | ) | | | — | |
From net realized gain on investments | | | (1.27 | ) | | | (1.06 | ) | | | (0.50 | ) | | | — | | | | (0.16 | ) |
| | | | | | | | | | | | | | | | | | | | |
Total dividends and distributions | | | (1.27 | ) | | | (1.06 | ) | | | (0.50 | ) | | | (0.02 | ) | | | (0.16 | ) |
| | | | | | | | | | | | | | | | | | | | |
Net asset value at end of year | | $ | 9.48 | | | $ | 10.99 | | | $ | 11.17 | | | $ | 10.19 | | | $ | 7.72 | |
| | | | | | | | | | | | | | | | | | | | |
Total investment return (b) | | | (2.37 | %) | | | 8.39 | % | | | 15.14 | % | | | 32.27 | % | | | 6.94 | % |
| Ratios (to average net assets)/Supplemental Data: | | | | | | | | | | | | | | | | | | | | |
Net investment income (loss) | | | 0.02 | % | | | (0.08 | %) | | | (0.08 | %) | | | 0.28 | % | | | (0.08 | %) |
Net expenses | | | 0.84 | % | | | 0.84 | % | | | 0.84 | % | | | 0.87 | % | | | 0.89 | % |
Expenses (before waiver/reimbursement) | | | 0.85 | % | | | 0.84 | % | | | 0.84 | % | | | 0.87 | % | | | 0.89 | % |
Portfolio turnover rate | | | 84 | % | | | 66 | % | | | 67 | % | | | 74 | % | | | 60 | % |
Net assets at end of year (in 000’s) | | $ | 1,636,560 | | | $ | 1,952,248 | | | $ | 2,225,940 | | | $ | 2,287,242 | | | $ | 1,950,015 | |
| ‡ | Less than one cent per share. |
| (a) | Per share data based on average shares outstanding during the year. |
| (b) | Total investment return is calculated exclusive of sales charges and assumes the reinvestment of dividends and distributions. Class R1 shares are not subject to sales charges. |
| | | | | | |
The notes to the financial statements are an integral part of,
and should be read in conjunction with, the financial statements. | | | | | 19 | |
Financial Highlights selected per share data and ratios
| | | | | | | | | | | | | | | | | | | | |
| | | Year ended October 31, | |
| Class R2 | | 2016 | | | 2015 | | | 2014 | | | 2013 | | | 2012 | |
Net asset value at beginning of year | | $ | 10.68 | | | $ | 10.92 | | | $ | 9.99 | | | $ | 7.57 | | | $ | 7.26 | |
| | | | | | | | | | | | | | | | | | | | |
Net investment income (loss) (a) | | | (0.02 | ) | | | (0.03 | ) | | | (0.03 | ) | | | 0.00 | (b) | | | (0.02 | ) |
Net realized and unrealized gain (loss) on investments | | | (0.24 | ) | | | 0.85 | | | | 1.46 | | | | 2.42 | | | | 0.49 | |
| | | | | | | | | | | | | | | | | | | | |
Total from investment operations | | | (0.26 | ) | | | 0.82 | | | | 1.43 | | | | 2.42 | | | | 0.47 | |
| | | | | | | | | | | | | | | | | | | | |
| Less dividends and distributions: | | | | | | | | | | | | | | | | | | | | |
From net investment income | | | — | | | | — | | | | — | | | | (0.00 | )(b) | | | — | |
From net realized gain on investments | | | (1.27 | ) | | | (1.06 | ) | | | (0.50 | ) | | | — | | | | (0.16 | ) |
| | | | | | | | | | | | | | | | | | | | |
Total dividends and distributions | | | (1.27 | ) | | | (1.06 | ) | | | (0.50 | ) | | | (0.00 | )(b) | | | (0.16 | ) |
| | | | | | | | | | | | | | | | | | | | |
Net asset value at end of year | | $ | 9.15 | | | $ | 10.68 | | | $ | 10.92 | | | $ | 9.99 | | | $ | 7.57 | |
| | | | | | | | | | | | | | | | | | | | |
Total investment return (c) | | | (2.66 | %) | | | 8.00 | % | | | 14.93 | % | | | 31.88 | % | | | 6.77 | % |
| Ratios (to average net assets)/Supplemental Data: | | | | | | | | | | | | | | | | | | | | |
Net investment income (loss) | | | (0.23 | %) | | | (0.32 | %) | | | (0.33 | %) | | | 0.03 | % | | | (0.32 | %) |
Net expenses | | | 1.09 | % | | | 1.09 | % | | | 1.09 | % | | | 1.12 | % | | | 1.14 | % |
Expenses (before waiver/reimbursement) | | | 1.10 | % | | | 1.09 | % | | | 1.09 | % | | | 1.12 | % | | | 1.14 | % |
Portfolio turnover rate | | | 84 | % | | | 66 | % | | | 67 | % | | | 74 | % | | | 60 | % |
Net assets at end of year (in 000’s) | | $ | 391,535 | | | $ | 674,630 | | | $ | 984,295 | | | $ | 1,014,655 | | | $ | 854,119 | |
| (a) | Per share data based on average shares outstanding during the year. |
| (b) | Less than one percent. |
| (c) | Total investment return is calculated exclusive of sales charges and assumes the reinvestment of dividends and distributions. Class R2 shares are not subject to sales charges. |
| | | | | | | | | | | | | | | | | | | | |
| | | Year ended October 31, | |
| Class R3 | | 2016 | | | 2015 | | | 2014 | | | 2013 | | | 2012 | |
Net asset value at beginning of year | | $ | 10.39 | | | $ | 10.67 | | | $ | 9.80 | | | $ | 7.45 | | | $ | 7.16 | |
| | | | | | | | | | | | | | | | | | | | |
Net investment income (loss) (a) | | | (0.04 | ) | | | (0.06 | ) | | | (0.06 | ) | | | (0.02 | ) | | | (0.04 | ) |
Net realized and unrealized gain (loss) on investments | | | (0.23 | ) | | | 0.84 | | | | 1.43 | | | | 2.37 | | | | 0.49 | |
| | | | | | | | | | | | | | | | | | | | |
Total from investment operations | | | (0.27 | ) | | | 0.78 | | | | 1.37 | | | | 2.35 | | | | 0.45 | |
| | | | | | | | | | | | | | | | | | | | |
| Less dividends and distributions: | | | | | | | | | | | | | | | | | | | | |
From net investment income | | | — | | | | — | | | | — | | | | (0.00 | )‡ | | | — | |
From net realized gain on investments | | | (1.27 | ) | | | (1.06 | ) | | | (0.50 | ) | | | — | | | | (0.16 | ) |
| | | | | | | | | | | | | | | | | | | | |
Total dividends and distributions | | | (1.27 | ) | | | (1.06 | ) | | | (0.50 | ) | | | (0.00 | )‡ | | | (0.16 | ) |
| | | | | | | | | | | | | | | | | | | | |
Net asset value at end of year | | $ | 8.85 | | | $ | 10.39 | | | $ | 10.67 | | | $ | 9.80 | | | $ | 7.45 | |
| | | | | | | | | | | | | | | | | | | | |
Total investment return (b) | | | (2.83 | %) | | | 7.79 | % | | | 14.59 | % | | | 31.63 | % | | | 6.44 | % |
| Ratios (to average net assets)/Supplemental Data: | | | | | | | | | | | | | | | | | | | | |
Net investment income (loss) | | | (0.48 | %) | | | (0.57 | %) | | | (0.57 | %) | | | (0.20 | %) | | | (0.57 | %) |
Net expenses | | | 1.34 | % | | | 1.34 | % | | | 1.34 | % | | | 1.37 | % | | | 1.39 | % |
Expenses (before reimbursement/waiver) | | | 1.35 | % | | | 1.34 | % | | | 1.34 | % | | | 1.37 | % | | | 1.39 | % |
Portfolio turnover rate | | | 84 | % | | | 66 | % | | | 67 | % | | | 74 | % | | | 60 | % |
Net assets at end of year (in 000’s) | | $ | 87,060 | | | $ | 114,118 | | | $ | 158,222 | | | $ | 219,158 | | | $ | 205,329 | |
| ‡ | Less than one cent per share. |
| (a) | Per share data based on average shares outstanding during the year. |
| (b) | Total investment return is calculated exclusive of sales charges and assumes the reinvestment of dividends and distributions. Class R3 shares are not subject to sales charges. |
| | | | |
| 20 | | MainStay Large Cap Growth Fund | | The notes to the financial statements are an integral part of,
and should be read in conjunction with, the financial statements. |
Financial Highlights selected per share data and ratios
| | | | | | | | | | | | | | | | |
| | | Year ended October 31, | | | June 17,
2013**
through
October 31, | |
| Class R6 | | 2016 | | | 2015 | | | 2014 | | | 2013 | |
Net asset value at beginning of period | | $ | 11.18 | | | $ | 11.33 | | | $ | 10.31 | | | $ | 9.02 | |
| | | | | | | | | | | | | | | | |
Net investment income (loss) (a) | | | 0.02 | | | | 0.01 | | | | 0.01 | | | | 0.00 | ‡ |
Net realized and unrealized gain (loss) on investments | | | (0.24 | ) | | | 0.90 | | | | 1.51 | | | | 1.29 | |
| | | | | | | | | | | | | | | | |
Total from investment operations | | | (0.22 | ) | | | 0.91 | | | | 1.52 | | | | 1.29 | |
| | | | | | | | | | | | | | | | |
| Less distributions: | | | | | | | | | | | | | | | | |
From net realized gain on investments | | | (1.27 | ) | | | (1.06 | ) | | | (0.50 | ) | | | — | |
| | | | | | | | | | | | | | | | |
Net asset value at end of period | | $ | 9.69 | | | $ | 11.18 | | | $ | 11.33 | | | $ | 10.31 | |
| | | | | | | | | | | | | | | | |
Total investment return (b) | | | (2.12 | %) | | | 8.55 | % | | | 15.36 | % | | | 14.30 | %(c) |
| Ratios (to average net assets)/Supplemental Data: | | | | | | | | | | | | | | | | |
Net investment income (loss) | | | 0.23 | % | | | 0.11 | % | | | 0.10 | % | | | 0.04 | %†† |
Net expenses | | | 0.62 | % | | | 0.62 | % | | | 0.62 | % | | | 0.62 | %†† |
Expenses (before waiver/reimbursement) | | | 0.63 | % | | | 0.62 | % | | | 0.62 | % | | | 0.62 | % |
Portfolio turnover rate | | | 84 | % | | | 66 | % | | | 67 | % | | | 74 | % |
Net assets at end of period (in 000’s) | | $ | 1,693,868 | | | $ | 1,311,034 | | | $ | 738,186 | | | $ | 147,625 | |
| ‡ | Less than one cent per share. |
| (a) | Per share data based on average shares outstanding during the period. |
| (b) | Total investment return is calculated exclusive of sales charges and assumes the reinvestment of dividends and distributions. Class R6 shares are not subject to sales charges. |
| (c) | Total investment return is not annualized. |
| | | | | | |
The notes to the financial statements are an integral part of,
and should be read in conjunction with, the financial statements. | | | | | 21 | |
Notes to Financial Statements
Note 1–Organization and Business
The MainStay Funds (the “Trust”) was organized on January 9, 1986, as a Massachusetts business trust. The Trust is registered under the Investment Company Act of 1940, as amended (the “1940 Act”), as an open-end management investment company, and is comprised of twelve funds (collectively referred to as the “Funds”). These financial statements and notes relate to the MainStay Large Cap Growth Fund (the “Fund”), a “diversified” fund, as that term is defined in the 1940 Act, as interpreted or modified by regulatory authorities having jurisdiction, from time to time.
The Fund currently offers nine classes of shares. Class A shares commenced operations on July 1, 1995. Class B, Class C, Class I, Class R1 and Class R2 shares commenced operations on April 1, 2005. Class R3 shares commenced operations on April 28, 2006. Investor Class shares commenced operations on February 28, 2008. Class R6 shares commenced operations on June 17, 2013. Class A and Investor Class shares are offered at net asset value (“NAV”) per share plus an initial sales charge. No initial sales charge applies to investments of $1 million or more (and certain other qualified purchases) in Class A and Investor Class shares, but a contingent deferred sales charge (“CDSC”) of 1.00% may be imposed on certain redemptions of such shares made within one year of the date of purchase on shares that were purchased without an initial sales charge made before January 1, 2017. Effective January 1, 2017, a CDSC of 1.00% may be imposed on certain redemptions of Class A and Investor Class shares made within 24 months of the date of purchase of such shares that were made without an initial sales charge. Class B and Class C shares are offered at NAV without an initial sales charge, although a CDSC that declines depending on the number of years a shareholder has held its Class B shares may be imposed on redemptions made within six years of the date of purchase of such shares and a 1.00% CDSC may be imposed on redemptions made within one year of the date of purchase of Class C shares. Class I, Class R1, Class R2, Class R3 and Class R6 shares are offered at NAV and are not subject to a sales charge. Depending upon eligibility, Class B shares convert to either Class A or Investor Class shares at the end of the calendar quarter eight years after the date they were purchased. Additionally, depending upon eligibility, Class A shares may convert to Investor Class shares and Investor Class shares may convert to Class A shares. Under certain circumstances and as may be permitted by the Trust’s multiple class plan under Rule 18f-3 of the 1940 Act, an exchange/conversion may be made from specified share classes of the Fund to one or more other share classes of the Fund as disclosed in the capital share transactions within these notes. The nine classes of shares have the same voting (except for issues that relate solely to one class), dividend, liquidation and other rights, and the same terms and conditions, except that Class B and Class C shares are subject to higher distribution and/or service fee rates than Class A, Investor Class, Class R2 and Class R3 shares under a distribution plan pursuant to Rule 12b-1 under the 1940 Act. Class I, Class R1 and Class R6 shares are not subject to a distribution and/or service fee. Class R1, Class R2 and Class R3 shares are subject to a shareholder service fee. This is in addition to any fees paid under a distribution plan, where applicable.
The Fund’s investment objective is to seek long-term growth of capital.
Note 2–Significant Accounting Policies
The Fund is an investment company and accordingly follows the investment company accounting and reporting guidance of the Financial Accounting Standards Board (“FASB”) Accounting Standard Codification Topic 946 Financial Services—Investment Companies. The Fund prepares its financial statements in accordance with generally accepted accounting principles (“GAAP”) in the United States of America and follows the significant accounting policies described below.
(A) Securities Valuation. Investments are usually valued as of the close of regular trading on the New York Stock Exchange (the “Exchange”) (usually 4:00 p.m. Eastern time) on each day the Fund is open for business (“valuation date”).
The Board of Trustees (the “Board”) adopted procedures establishing methodologies for the valuation of the Fund’s securities and other assets and delegated the responsibility for valuation determinations under those procedures to the Valuation Committee of the Trust (the “Valuation Committee”). The Board authorized the Valuation Committee to appoint a Valuation Sub-Committee (the “Sub-Committee”) to deal in the first instance with establishing the prices of securities for which market quotations are not readily available or the prices of which are not otherwise readily determinable under these procedures. The Sub-Committee meets (in person, via electronic mail or via teleconference) on an as-needed basis. Subsequently, the Valuation Committee meets to ensure that actions taken by the Sub-Committee were appropriate. The procedures recognize that, subject to the oversight of the Board and unless otherwise noted, the responsibility for the day-to-day valuation of portfolio assets (including fair value measurements for the Fund’s assets and liabilities) rests with New York Life Investment Management LLC (“New York Life Investments” or the “Manager”), aided to whatever extent necessary by the Subadvisor (as defined in Note 3(A)) to the Fund.
To assess the appropriateness of security valuations, the Manager, Subadvisor or the Fund’s third party service provider, who is subject to oversight by the Manager, regularly compares prior day prices, prices on comparable securities, and the sale prices to the prior and current day prices and challenges prices with changes exceeding certain tolerance levels with third party pricing services or broker sources. For those securities valued through either a standardized fair valuation methodology or a fair valuation measurement, the Sub-Committee deals in the first instance with such valuation and the Valuation Committee reviews and affirms, if appropriate, the reasonableness of the valuation based on such methodologies and measurements on a regular basis after considering all relevant information that is reasonably available. Any action taken by the Sub-Committee with respect to the valuation of a portfolio security or other asset is submitted by the Valuation Committee to the Board for its review and ratification, if appropriate, at its next regularly scheduled meeting.
“Fair value” is defined as the price the Fund would reasonably expect to receive upon selling an asset or liability in an orderly transaction to an independent buyer in the principal or most advantageous market for the asset or liability. Fair value measurements are determined within a framework that establishes a three-tier hierarchy which maximizes the use of observable market data and minimizes the use of unobservable inputs to establish a classification of fair value measurements for disclosure purposes. “Inputs” refer broadly to the assumptions that market participants would use in pricing the asset or liability, including
| | |
| 22 | | MainStay Large Cap Growth Fund |
assumptions about risk, such as the risk inherent in a particular valuation technique used to measure fair value using a pricing model and/or the risk inherent in the inputs for the valuation technique. Inputs may be observable or unobservable. Observable inputs reflect the assumptions market participants would use in pricing the asset or liability based on market data obtained from sources independent of the Fund. Unobservable inputs reflect the Fund’s own assumptions about the assumptions market participants would use in pricing the asset or liability based on the information available. The inputs or methodology used for valuing assets or liabilities may not be an indication of the risks associated with investing in those assets or liabilities. The three-tier hierarchy of inputs is summarized below.
| • | | Level 1—quoted prices in active markets for an identical asset or liability |
| • | | Level 2—other significant observable inputs (including quoted prices for a similar asset or liability in active markets, interest rates and yield curves, prepayment speeds, credit risk, etc.) |
| • | | Level 3—significant unobservable inputs (including the Fund’s own assumptions about the assumptions that market participants would use in measuring fair value of an asset or liability) |
The level of an asset or liability within the fair value hierarchy is based on the lowest level of an input, both individually and in the aggregate, that is significant to the fair value measurement. As of October 31, 2016, the aggregate value by input level of the Fund’s assets and liabilities is included at the end of the Fund’s Portfolio of Investments.
The Fund may use third party vendor evaluations, whose prices may be derived from one or more of the following standard inputs, among others:
| | |
• Broker/dealer quotes | | • Issuer spreads |
• Two-sided markets | | • Benchmark securities |
• Bids/offers | | • Reference data (corporate actions or material event notices) |
• Industry and economic events | | • Monthly payment information |
• Reported trades | | |
An asset or liability for which market values cannot be measured using the methodologies described above is valued by methods deemed reasonable in good faith by the Valuation Committee, following the procedures established by the Board, to represent fair value. Under these procedures, the Fund generally uses a market-based approach which may use related or comparable assets or liabilities, recent transactions, market multiples, book values, and other relevant information. The Fund may also use an income-based valuation approach in which the anticipated future cash flows of the asset or liability are discounted to calculate fair value. Discounts may also be applied due to the nature and/or duration of any restrictions on the disposition of the asset or liability. Fair value represents a good faith approximation of the value of a security. Fair value determinations involve the consideration of a number of subjective factors, an analysis of applicable facts and circumstances and the exercise of judgment. As a result, it is possible that the fair value for a security determined in good faith in accordance with the Fund’s valuation procedures may differ from valuations for the same security determined by other funds using their own valuation procedures. Although the Fund’s valuation procedures are designed to
value a security at the price the Fund may reasonably expect to receive upon its sale in an orderly transaction, there can be no assurance that any fair value determination thereunder would, in fact, approximate the amount that the Fund would actually realize upon the sale of the security or the price at which the security would trade if a reliable market price were readily available. During the year ended October 31, 2016, there were no material changes to the fair value methodologies.
Equity and non-equity securities which may be valued in this manner include, but are not limited to: (i) a security for which trading has been halted or suspended; (ii) a debt security that has recently gone into default and for which there is not a current market quotation; (iii) a security of an issuer that has entered into a restructuring; (iv) a security that has been de-listed from a national exchange; (v) a security for which the market price is not readily available from a third party pricing source or, if so provided, does not, in the opinion of the Manager or Subadvisor reflect the security’s market value; (vi) a security subject to trading collars for which no or limited trading takes place; and (vii) a security whose principal market has been temporarily closed at a time when, under normal conditions, it would be open. Securities for which market quotations or observable inputs are not readily available are generally categorized as Level 3 in the hierarchy. As of October 31, 2016, there were no securities held by the Fund that were fair valued in such a manner.
Equity securities and shares of Exchange-Traded Funds (“ETFs”) are valued at the last quoted sales prices as of the close of regular trading on the relevant exchange on each valuation date. Securities that are not traded on the valuation date are valued at the mean of the last quoted bid and ask prices. Prices are normally taken from the principal market in which each security trades. Investments in mutual funds, including money market funds, are valued at their respective NAVs as of the close of the Exchange on the valuation date. These securities are generally categorized as Level 1 in the hierarchy.
Temporary cash investments acquired in excess of 60 days to maturity at the time of purchase are valued using the latest bid prices or using valuations based on a matrix system (which considers such factors as security prices, yields, maturities, and ratings), both as furnished by independent pricing services. Other temporary cash investments which mature in 60 days or less at the time of purchase (“Short-Term Investments”) are valued using the amortized cost method of valuation, unless the use of such method would be inappropriate. The amortized cost method involves valuing a security at its cost on the date of purchase and thereafter assuming a constant amortization to maturity of the difference between such cost and the value on maturity date. Amortized cost approximates the current fair value of a security. Securities valued using the amortized cost method are not valued using quoted prices in an active market and are generally categorized as Level 2 in the hierarchy.
The information above is not intended to reflect an exhaustive list of the methodologies that may be used to value portfolio investments. The valuation procedures permit the use of a variety of valuation methodologies in connection with valuing portfolio investments. The methodology used for a specific type of investment may vary based on the market data available or other considerations. The methodologies summarized above may not represent the specific means by which portfolio investments are valued on any particular business day.
Notes to Financial Statements (continued)
(B) Income Taxes. The Fund’s policy is to comply with the requirements of the Internal Revenue Code of 1986, as amended (the “Internal Revenue Code”), applicable to regulated investment companies and to distribute all of its taxable income to the shareholders of the Fund within the allowable time limits. Therefore, no federal, state and local income tax provisions are required.
Management evaluates the Fund’s tax positions to determine if the tax positions taken meet the minimum recognition threshold in connection with accounting for uncertainties in income tax positions taken or expected to be taken for the purposes of measuring and recognizing tax liabilities in the financial statements. Recognition of tax benefits of an uncertain tax position is permitted only to the extent the position is “more likely than not” to be sustained assuming examination by taxing authorities. Management has analyzed the Fund’s tax positions taken on federal, state and local income tax returns for all open tax years (for up to three tax years), and has concluded that no provisions for federal, state and local income tax are required in the Fund’s financial statements. The Fund’s federal, state and local income and federal excise tax returns for tax years for which the applicable statutes of limitations have not expired are subject to examination by the Internal Revenue Service and state and local departments of revenue.
(C) Dividends and Distributions to Shareholders. Dividends and distributions are recorded on the ex-dividend date. The Fund intends to declare and pay dividends from net investment income and distributions from net realized capital and currency gains, if any, at least annually. Unless the shareholder elects otherwise, all dividends and distributions are reinvested in the same class of shares of the Fund, at NAV. Dividends and distributions to shareholders are determined in accordance with federal income tax regulations and may differ from GAAP.
(D) Security Transactions and Investment Income. The Fund records security transactions on the trade date. Realized gains and losses on security transactions are determined using the identified cost method. Dividend income is recognized on the ex-dividend date; net of any foreign tax withheld at the source, and interest income is accrued as earned using the effective interest rate method. Discounts and premiums on Short-Term Investments are accreted and amortized, respectively, on the straight-line method.
Investment income and realized and unrealized gains and losses on investments of the Fund are allocated to separate classes of shares pro rata based upon their relative net assets on the date the income is earned or realized and unrealized gains and losses are incurred.
(E) Expenses. Expenses of the Trust are allocated to the individual Funds in proportion to the net assets of the respective Funds when the expenses are incurred, except where direct allocations of expenses can be made. Expenses (other than transfer agent expenses and fees incurred under the shareholder services plans and/or the distribution plans further discussed in Note 3(B)) are allocated to separate classes of shares pro rata based upon their relative net assets on the date the expenses are incurred. The expenses borne by the Fund, including those of related parties to the Fund, are shown in the Statement of Operations.
(F) Use of Estimates. In preparing financial statements in conformity with GAAP, management makes estimates and assumptions that
affect the reported amounts and disclosures in the financial statements. Actual results could differ from those estimates.
(G) Repurchase Agreements. The Fund may enter into repurchase agreements to earn income. The Fund may enter into repurchase agreements only with financial institutions that are deemed by the Manager or Subadvisor to be creditworthy, pursuant to guidelines established by the Board. During the term of any repurchase agreement, the Manager or Subadvisor will continue to monitor the creditworthiness of the seller. Under the 1940 Act, repurchase agreements are considered to be collateralized loans by the Fund to the seller secured by the securities transferred to the Fund.
When the Fund enters into repurchase agreements, the Fund’s custodian takes possession of the collateral pledged for investments in the repurchase agreement. The underlying collateral is valued daily on a mark to market basis to determine if the value, including accrued interest, exceeds the repurchase price. In the event of the seller’s default on the obligation to repurchase, the Fund has the right to liquidate the collateral and apply the proceeds in satisfaction of the obligation. Under certain circumstances, such as in the event of default or bankruptcy by the counterparty to the agreement, realization and/or retention of the collateral may be subject to legal proceedings and possible realized loss to the Fund.
(H) Securities Lending. In order to realize additional income, the Fund may engage in securities lending, subject to the limitations set forth in the 1940 Act and relevant guidance by the staff of the Securities and Exchange Commission (“SEC”). In the event the Fund does engage in securities lending, the Fund will lend through its custodian, State Street Bank and Trust Company (“State Street”). State Street will manage the Fund’s cash collateral in accordance with the lending agreement between the Fund and State Street, and indemnify the Fund against counterparty risk. The loans will be collateralized by cash or securities at least equal at all times to the market value of the securities loaned. Collateral will consist of U.S. government securities, cash equivalents or irrevocable letters of credit. The Fund may bear the risk of delay in recovery of, or loss of rights in, the securities loaned should the borrower of the securities experience financial difficulty. The Fund may also record a realized gain or loss on securities deemed sold due to a borrower’s inability to return securities on loan. The Fund bears the risk of any loss on investment of the collateral. The Fund will receive compensation for lending its securities in the form of fees or it will retain a portion of interest on the investment of any cash received as collateral. The Fund will also continue to receive interest and dividends on the securities loaned and any gain or loss in the market price of the securities loaned that may occur during the term of the loan will be for the account of the Fund. During the year ended October 31, 2016, the Fund did not have any portfolio securities on loan.
(I) Indemnifications. Under the Trust’s organizational documents, its officers and trustees are indemnified against certain liabilities that may arise out of performance of their duties to the Trust. Additionally, in the normal course of business, the Fund enters into contracts with third-party service providers that contain a variety of representations and warranties and which may provide general indemnifications. The Fund’s maximum exposure under these arrangements is unknown, as this would involve future claims that may be made against the Fund that have not yet occurred. Based on experience, management is of the view
| | |
| 24 | | MainStay Large Cap Growth Fund |
that the risk of loss in connection with these potential indemnification obligations is remote. However, there can be no assurance that material liabilities related to such obligations will not arise in the future, which could adversely impact the Fund.
Note 3–Fees and Related Party Transactions
(A) Manager and Subadvisor. New York Life Investments, a registered investment adviser and an indirect, wholly-owned subsidiary of New York Life Insurance Company (“New York Life”), serves as the Fund’s Manager, pursuant to an Amended and Restated Management Agreement (“Management Agreement”). The Manager provides offices, conducts clerical, recordkeeping and bookkeeping services, and keeps most of the financial and accounting records required to be maintained by the Fund. Except for the portion of salaries and expenses that are the responsibility of the Fund, the Manager pays the salaries and expenses of all personnel affiliated with the Fund and certain operational expenses of the Fund. The Fund reimburses New York Life Investments in an amount equal to a portion of the compensation of the Chief Compliance Officer of the Fund. Winslow Capital Management, LLC (“Winslow” or “Subadvisor”), a registered investment adviser, serves as Subadvisor to the Fund and is responsible for the day-to-day portfolio management of the Fund. Pursuant to the terms of a Subadvisory Agreement (“Subadvisory Agreement”) between New York Life Investments and Winslow, New York Life Investments pays for the services of the Subadvisor.
Under the Management Agreement, the Fund pays the Manager a monthly fee for services performed and facilities furnished at an annual rate of the Fund’s average daily net assets as follows: 0.75% up to $500 million; 0.725% from $500 million to $750 million; 0.71% from $750 million to $1 billion; 0.70% from $1 billion to $2 billion; 0.66% from $2 billion to $3 billion; 0.61% from $3 billion to $7 billion; 0.585% from $7 billion to $9 billion; and 0.575% in excess of $9 billion.
New York Life Investments has contractually agreed to waive a portion of its management fee so that the management fee does not exceed 0.55% of the Fund’s average daily net assets from $11 billion to $13 billion; and 0.525% of the Fund’s average daily net assets over $13 billion. This agreement will remain in effect until March 1, 2017, and shall renew automatically for one-year terms unless New York Life Investments provides written notice of termination prior to the start of the next term or upon approval by the Board.
New York Life Investments has contractually agreed to waive fees and/or reimburse expenses of Class I shares so that Total Annual Fund Operating Expenses of Class I shares do not exceed 0.88% of the Fund’s average daily net assets. This agreement will remain in effect until March 1, 2017, and shall renew automatically for one-year terms unless New York Life Investments provides written notice of termination prior to the start of the next term or upon approval of the Board.
Additionally, New York Life Investments has agreed to further voluntarily waive fees and/or reimburse the expenses of Class R1 shares so that Total Annual Fund Operating Expenses do not exceed 0.95% of its average daily net assets. This voluntary waiver or reimbursement may be discontinued at any time. Total Annual Fund Operating Expenses excludes taxes, interest, litigation, extraordinary expenses, brokerage and other transaction expenses relating to the purchase or sale of portfolio investments, and acquired (underlying) fund fees and expenses.
During the year ended October 31, 2016, the effective management fee rate was 0.60%.
During the year ended October 31, 2016, New York Life Investments earned fees from the Fund in the amount of $95,392,023.
State Street provides sub-administration and sub-accounting services to the Fund pursuant to an agreement with New York Life Investments. These services include calculating the daily NAVs of the Fund, maintaining the general ledger and sub-ledger accounts for the calculation of the Fund’s NAVs, and assisting New York Life Investments in conducting various aspects of the Fund’s administrative operations. For providing these services to the Fund, State Street is compensated by New York Life Investments.
(B) Distribution, Service and Shareholder Service Fees. The Trust, on behalf of the Fund, has entered into a distribution agreement with NYLIFE Distributors LLC (the “Distributor”), an indirect, wholly-owned subsidiary of New York Life. The Fund has adopted distribution plans (the “Plans”) in accordance with the provisions of Rule 12b-1 under the 1940 Act.
Pursuant to the Class A, Investor Class and Class R2 Plans, the Distributor receives a monthly distribution fee from the Class A, Investor Class and Class R2 shares, at an annual rate of 0.25% of the average daily net assets of the Class A, Investor Class and Class R2 shares for distribution and/or service activities as designated by the Distributor. Pursuant to the Class B and Class C Plans, Class B and Class C shares pay the Distributor a monthly distribution fee at an annual rate of 0.75% of the average daily net assets of the Class B and Class C shares, along with a service fee at an annual rate of 0.25% of the average daily net assets of the Class B and Class C shares, for a total 12b-1 fee of 1.00%. Pursuant to the Class R3 Plan, the Distributor receives a monthly distribution and/or service fee from the Class R3 shares at an annual rate of 0.50% of the average daily net assets of the Class R3 shares. Class I, Class R1 and Class R6 shares are not subject to a distribution and/or service fee.
The Plans provide that the distribution and service fees are payable to the Distributor regardless of the amounts actually expended by the Distributor for distribution of the Fund’s shares and service activities.
In accordance with the Shareholder Services Plans for the Class R1, Class R2 and Class R3 shares, the Manager has agreed to provide, through its affiliates or independent third parties, various shareholder and administrative support services to shareholders of the Class R1, Class R2 and Class R3 shares. For its services, the Manager, its affiliates, or independent third party service providers are entitled to a shareholder service fee accrued daily and paid monthly at an annual rate of 0.10% of the average daily net assets of the Class R1, Class R2 and Class R3 shares. This is in addition to any fees paid under a distribution plan, where applicable.
During the year ended October 31, 2016, shareholder service fees incurred by the Fund were as follows:
| | | | |
Class R1 | | $ | 1,826,828 | |
Class R2 | | | 526,426 | |
Class R3 | | | 98,048 | |
Notes to Financial Statements (continued)
(C) Sales Charges. During the year ended October 31, 2016, the Fund was advised by the Distributor that the amount of initial sales charges retained on sales of Class A and Investor Class shares were $72,138 and $39,739, respectively.
During the year ended October 31, 2016, the Fund was also advised that the Distributor retained CDSCs on redemptions of Class A, Investor Class, Class B and Class C shares of $7,004, $207, $80,774 and $31,503, respectively.
(D) Transfer, Dividend Disbursing and Shareholder Servicing Agent. NYLIM Service Company LLC, an affiliate of New York Life Investments, is the Fund’s transfer, dividend disbursing and shareholder servicing agent pursuant to an agreement between NYLIM Service Company LLC and the Trust. NYLIM Service Company LLC has entered into an agreement with Boston Financial Data Services, Inc. (“BFDS”) pursuant to which BFDS performs certain transfer agent services on behalf of NYLIM Service Company LLC. During the year ended October 31, 2016, transfer agent expenses incurred by the Fund were as follows:
| | | | |
Class A | | $ | 1,276,742 | |
Investor Class | | | 316,405 | |
Class B | | | 74,475 | |
Class C | | | 643,037 | |
Class I | | | 12,718,343 | |
Class R1 | | | 2,279,277 | |
Class R2 | | | 657,780 | |
Class R3 | | | 122,236 | |
(E) Small Account Fee. Shareholders with small accounts adversely impact the cost of providing transfer agency services. In an effort to reduce total transfer agency expenses, the Fund has implemented a small account fee on certain types of accounts. Certain shareholders with an account balance of less than $1,000 are charged an annual per account fee of $20 (assessed semi-annually), the proceeds from which offset transfer agent fees as reflected in the Statement of Operations.
Note 4–Federal Income Tax
As of October 31, 2016, the components of accumulated gain (loss) on a tax basis were as follows:
| | | | | | | | | | | | | | | | |
Ordinary
Income | | Accumulated
Capital and
Other Gain
(Loss) | | | Other
Temporary
Differences | | | Unrealized
Appreciation
(Depreciation) | | | Total
Accumulated Gain (Loss) | |
$— | | $ | 1,526,315,517 | | | $ | — | | | $ | 4,038,321,335 | | | $ | 5,564,636,852 | |
The difference between book-basis and tax-basis unrealized appreciation (depreciation) is primarily due to wash sale adjustments, and return of capital distributions received.
The following table discloses the current year reclassifications between undistributed net investment income (loss), accumulated net realized gain (loss) on investments, and additional paid-in capital arising from
permanent differences; net assets as of October 31, 2016 were not affected.
| | | | |
Undistributed
Net Investment
Income (Loss) | | Accumulated
Net Realized
Gain (Loss) on
Investments | | Additional
Paid-In
Capital |
| $1,451,088 | | $(218,543,590) | | $217,092,502 |
The reclassifications for the Fund are primarily due to return of capital distributions, capital gain distributions from Real Estate Investment Trusts (“REITs”), a net operating loss, and distributions in connection with redemption of fund shares.
During the years ended October 31, 2016 and October 31, 2015, the tax character of distributions paid as reflected in the Statements of Changes in Net Assets was as follows:
| | | | | | | | |
| | | 2016 | | | 2015 | |
Distributions paid from: | | | | | | | | |
Ordinary Income | | $ | — | | | $ | 206,173,770 | |
Long-Term Capital Gain | | | 2,061,778,330 | | | | 1,670,514,816 | |
Total | | $ | 2,061,778,330 | | | $ | 1,876,688,586 | |
Note 5–Custodian
State Street is the custodian of cash and securities held by the Fund. Custodial fees are charged to the Fund based on the Fund’s net assets and/or the market value of securities held by the Fund and the number of certain transactions incurred by the Fund.
Note 6–Line of Credit
The Fund and certain other funds managed by New York Life Investments, maintain a line of credit with a syndicate of banks in order to secure a source of funds for temporary purposes to meet unanticipated or excessive redemption requests.
Effective August 2, 2016, under an amended and restated credit agreement (the “Credit Agreement”), the aggregate commitment amount is $600,000,000 with an additional uncommitted amount of $100,000,000. The commitment fee is an annual rate of 0.15% of the average commitment amount payable quarterly, regardless of usage, to Bank of New York Mellon, who serves as the agent to the syndicate. The commitment fee is allocated among the Fund and certain affiliated funds based upon their respective net assets and other factors. Interest on any revolving credit loan is charged based upon the Federal Funds Advances Rate or the one month London InterBank Offered Rate, whichever is higher. The Credit Agreement expires on August 1, 2017, although the Fund, certain affiliated funds and the syndicate of banks may renew the Credit Agreement for an additional year on the same or different terms. Prior to August 2, 2016, the aggregate commitment amount was $600,000,000 with an additional uncommitted amount of $100,000,000, and the commitment fee was at an annual rate of 0.10% of the average commitment amount. During the year ended October 31, 2016, the Fund utilized the line of credit for one day, maintained an average daily balance of $82,000,000 at a weighted average interest rate of 1.328% and incurred interest expense in the amount of $3,025. As of October 31, 2016 there were no borrowings outstanding.
| | |
| 26 | | MainStay Large Cap Growth Fund |
Note 7–Interfund Lending Program
Pursuant to an exemptive order issued by the SEC, the Fund, along with certain other funds managed by New York Life Investments, may participate in an interfund lending program. The interfund lending program provides an alternate credit facility that permits the Fund and certain other funds managed by New York Life Investments to lend or borrow money for temporary purposes directly to or from one another, subject to the conditions of the exemptive order. During the year ended October 31, 2016, there were no interfund loans made or outstanding with respect to the Fund.
Note 8–Purchases and Sales of Securities (in 000’s)
During the year ended October 31, 2016, purchases and sales of securities, other than short-term securities, were $13,051,922 and $16,451,542, respectively.
Note 9–Capital Share Transactions
| | | | | | | | |
Class A | | Shares | | | Amount | |
Year ended October 31, 2016: | | | | | | | | |
Shares sold | | | 19,646,050 | | | $ | 180,253,666 | |
Shares issued to shareholders in reinvestment of dividends and distributions | | | 13,179,543 | | | | 123,228,727 | |
Shares redeemed | | | (49,582,926 | ) | | | (450,652,369 | ) |
| | | | | | | | |
Net increase (decrease) in shares outstanding before conversion | | | (16,757,333 | ) | | | (147,169,976 | ) |
Shares converted into Class A (See Note 1) | | | 912,123 | | | | 8,373,746 | |
Shares converted from Class A (See Note 1) | | | (540,607 | ) | | | (4,964,348 | ) |
| | | | | | | | |
Net increase (decrease) | | | (16,385,817 | ) | | $ | (143,760,578 | ) |
| | | | | | | | |
Year ended October 31, 2015: | | | | | | | | |
Shares sold | | | 21,810,581 | | | $ | 226,524,859 | |
Shares issued to shareholders in reinvestment of dividends and distributions | | | 10,872,016 | | | | 110,133,517 | |
Shares redeemed | | | (40,165,642 | ) | | | (416,439,846 | ) |
| | | | | | | | |
Net increase (decrease) in shares outstanding before conversion | | | (7,483,045 | ) | | | (79,781,470 | ) |
Shares converted into Class A (See Note 1) | | | 813,049 | | | | 8,547,122 | |
Shares converted from Class A
(See Note 1) | | | (317,270 | ) | | | (3,204,527 | ) |
| | | | | | | | |
Net increase (decrease) | | | (6,987,266 | ) | | $ | (74,438,875 | ) |
| | | | | | | | |
| | |
| | | | | | | | |
| | | | | | | | |
Investor Class | | Shares | | | Amount | |
Year ended October 31, 2016: | | | | | | | | |
Shares sold | | | 3,054,848 | | | $ | 29,040,842 | |
Shares issued to shareholders in reinvestment of dividends and distributions | | | 2,443,289 | | | | 22,671,507 | |
Shares redeemed | | | (3,993,991 | ) | | | (36,160,957 | ) |
| | | | | | | | |
Net increase (decrease) in shares outstanding before conversion | | | 1,504,146 | | | | 15,551,392 | |
Shares converted into Investor Class
(See Note 1) | | | 729,663 | | | | 6,486,575 | |
Shares converted from Investor Class
(See Note 1) | | | (775,431 | ) | | | (7,037,036 | ) |
| | | | | | | | |
Net increase (decrease) | | | 1,458,378 | | | $ | 15,000,931 | |
| | | | | | | | |
Year ended October 31, 2015: | | | | | | | | |
Shares sold | | | 2,274,877 | | | $ | 23,481,303 | |
Shares issued to shareholders in reinvestment of dividends and distributions | | | 1,911,381 | | | | 19,228,420 | |
Shares redeemed | | | (5,699,442 | ) | | | (58,869,533 | ) |
| | | | | | | | |
Net increase (decrease) in shares outstanding before conversion | | | (1,513,184 | ) | | | (16,159,810 | ) |
Shares converted into Investor Class
(See Note 1) | | | 792,362 | | | | 8,017,661 | |
Shares converted from Investor Class
(See Note 1) | | | (718,721 | ) | | | (7,522,265 | ) |
| | | | | | | | |
Net increase (decrease) | | | (1,439,543 | ) | | $ | (15,664,414 | ) |
| | | | | | | | |
| | |
| | | | | | | | |
Class B | | Shares | | | Amount | |
Year ended October 31, 2016: | | | | | | | | |
Shares sold | | | 890,898 | | | $ | 7,233,362 | |
Shares issued to shareholders in reinvestment of dividends and distributions | | | 659,856 | | | | 5,503,197 | |
Shares redeemed | | | (1,331,450 | ) | | | (10,681,689 | ) |
| | | | | | | | |
Net increase (decrease) in shares outstanding before conversion | | | 219,304 | | | | 2,054,870 | |
Shares converted from Class B
(See Note 1) | | | (655,437 | ) | | | (5,255,731 | ) |
| | | | | | | | |
Net increase (decrease) | | | (436,133 | ) | | $ | (3,200,861 | ) |
| | | | | | | | |
Year ended October 31, 2015: | | | | | | | | |
Shares sold | | | 770,715 | | | $ | 7,275,764 | |
Shares issued to shareholders in reinvestment of dividends and distributions | | | 519,992 | | | | 4,802,784 | |
Shares redeemed | | | (974,250 | ) | | | (9,169,284 | ) |
| | | | | | | | |
Net increase (decrease) in shares outstanding before conversion | | | 316,457 | | | | 2,909,264 | |
Shares converted from Class B
(See Note 1) | | | (625,907 | ) | | | (5,837,991 | ) |
| | | | | | | | |
Net increase (decrease) | | | (309,450 | ) | | $ | (2,928,727 | ) |
| | | | | | | | |
| | |
| | | | | | | | |
Notes to Financial Statements (continued)
| | | | | | | | |
Class C | | Shares | | | Amount | |
Year ended October 31, 2016: | | | | | | | | |
Shares sold | | | 6,466,704 | | | $ | 53,327,639 | |
Shares issued to shareholders in reinvestment of dividends and distributions | | | 3,001,163 | | | | 24,969,681 | |
Shares redeemed | | | (13,880,349 | ) | | | (112,066,791 | ) |
| | | | | | | | |
Net increase (decrease) in shares outstanding before conversion | | | (4,412,482 | ) | | | (33,769,471 | ) |
Shares converted from Class C (See Note 1) | | | (19,380 | ) | | | (187,794 | ) |
| | | | | | | | |
Net increase (decrease) | | | (4,431,862 | ) | | $ | (33,957,265 | ) |
| | | | | | | | |
Year ended October 31, 2015: | | | | | | | | |
Shares sold | | | 8,009,787 | | | $ | 75,101,486 | |
Shares issued to shareholders in reinvestment of dividends and distributions | | | 2,080,388 | | | | 19,181,176 | |
Shares redeemed | | | (7,968,035 | ) | | | (75,209,893 | ) |
| | | | | | | | |
Net increase (decrease) | | | 2,122,140 | | | $ | 19,072,769 | |
| | | | | | | | |
| | |
| | | | | | | | |
Class I | | Shares | | | Amount | |
Year ended October 31, 2016: | | | | | | | | |
Shares sold | | | 191,040,579 | | | $ | 1,819,498,431 | |
Shares issued to shareholders in reinvestment of dividends and distributions | | | 101,900,227 | | | | 1,000,660,228 | |
Shares redeemed | | | (448,840,581 | ) | | | (4,303,660,859 | ) |
| | | | | | | | |
Net increase (decrease) in shares outstanding before conversion | | | (155,899,775 | ) | | | (1,483,502,200 | ) |
Shares converted into Class I (See Note 1) | | | 59,930 | | | | 575,114 | |
Shares converted from Class I (See Note 1) | | | (1,499,308 | ) | | | (14,935,248 | ) |
| | | | | | | | |
Net increase (decrease) | | | (157,339,153 | ) | | $ | (1,497,862,334 | ) |
| | | | | | | | |
Year ended October 31, 2015: | | | | | | | | |
Shares sold | | | 217,439,008 | | | $ | 2,348,916,340 | |
Shares issued to shareholders in reinvestment of dividends and distributions | | | 92,488,739 | | | | 975,756,195 | |
Shares redeemed | | | (489,304,127 | ) | | | (5,312,636,978 | ) |
| | | | | | | | |
Net increase (decrease) | | | (179,376,380 | ) | | $ | (1,987,964,443 | ) |
| | | | | | | | |
| | |
| | | | | | | | |
| | | | | | | | |
Class R1 | | Shares | | | Amount | |
Year ended October 31, 2016: | | | | | | | | |
Shares sold | | | 39,644,707 | | | $ | 393,845,632 | |
Shares issued to shareholders in reinvestment of dividends and distributions | | | 25,181,545 | | | | 243,253,726 | |
Shares redeemed | | | (69,843,936 | ) | | | (657,384,425 | ) |
| | | | | | | | |
Net increase (decrease) in shares outstanding before conversion | | | (5,017,684 | ) | | | (20,285,067 | ) |
Shares converted from Class R1 (See Note 1) | | | (28,360 | ) | | | (272,130 | ) |
| | | | | | | | |
Net increase (decrease) | | | (5,046,044 | ) | | $ | (20,557,197 | ) |
| | | | | | | | |
Year ended October 31, 2015: | | | | | | | | |
Shares sold | | | 26,569,433 | | | $ | 284,821,244 | |
Shares issued to shareholders in reinvestment of dividends and distributions | | | 19,995,031 | | | | 207,948,321 | |
Shares redeemed | | | (68,052,816 | ) | | | (728,357,325 | ) |
| | | | | | | | |
Net increase (decrease) | | | (21,488,352 | ) | | $ | (235,587,760 | ) |
| | | | | | | | |
| | |
| | | | | | | | |
Class R2 | | Shares | | | Amount | |
Year ended October 31, 2016: | | | | | | | | |
Shares sold | | | 12,411,385 | | | $ | 113,556,899 | |
Shares issued to shareholders in reinvestment of dividends and distributions | | | 5,403,725 | | | | 50,524,831 | |
Shares redeemed | | | (38,220,678 | ) | | | (350,766,615 | ) |
| | | | | | | | |
Net increase (decrease) in shares outstanding before conversion | | | (20,405,568 | ) | | | (186,684,885 | ) |
Shares converted from Class R2 (See Note 1) | | | (1,720 | ) | | | (18,555 | ) |
| | | | | | | | |
Net increase (decrease) | | | (20,407,288 | ) | | $ | (186,703,440 | ) |
| | | | | | | | |
Year ended October 31, 2015: | | | | | | | | |
Shares sold | | | 15,855,834 | | | $ | 164,291,461 | |
Shares issued to shareholders in reinvestment of dividends and distributions | | | 6,586,660 | | | | 66,722,868 | |
Shares redeemed | | | (49,429,038 | ) | | | (520,943,135 | ) |
| | | | | | | | |
Net increase (decrease) | | | (26,986,544 | ) | | $ | (289,928,806 | ) |
| | | | | | | | |
| | |
| | | | | | | | |
| | |
| 28 | | MainStay Large Cap Growth Fund |
| | | | | | | | |
Class R3 | | Shares | | | Amount | |
Year ended October 31, 2016: | | | | | | | | |
Shares sold | | | 1,933,053 | | | $ | 16,989,537 | |
Shares issued to shareholders in reinvestment of dividends and distributions | | | 1,377,717 | | | | 12,468,332 | |
Shares redeemed | | | (4,449,259 | ) | | | (39,154,792 | ) |
| | | | | | | | |
Net increase (decrease) in shares outstanding before conversion | | | (1,138,489 | ) | | | (9,696,923 | ) |
Shares converted from Class R3 (See Note 1) | | | (8,312 | ) | | | (73,440 | ) |
| | | | | | | | |
Net increase (decrease) | | | (1,146,801 | ) | | $ | (9,770,363 | ) |
| | | | | | | | |
Year ended October 31, 2015: | | | | | | | | |
Shares sold | | | 2,585,484 | | | $ | 26,221,607 | |
Shares issued to shareholders in reinvestment of dividends and distributions | | | 1,388,579 | | | | 13,719,161 | |
Shares redeemed | | | (7,816,197 | ) | | | (79,215,887 | ) |
| | | | | | | | |
Net increase (decrease) | | | (3,842,134 | ) | | $ | (39,275,119 | ) |
| | | | | | | | |
| | |
| | | | | | | | |
Class R6 | | Shares | | | Amount | |
Year ended October 31, 2016: | | | | | | | | |
Shares sold | | | 85,459,078 | | | $ | 840,427,765 | |
Shares issued to shareholders in reinvestment of dividends and distributions | | | 14,978,754 | | | | 147,540,722 | |
Shares redeemed | | | (44,612,772 | ) | | | (448,875,363 | ) |
| | | | | | | | |
Net increase (decrease) in shares outstanding before conversion | | | 55,825,060 | | | | 539,093,124 | |
Shares converted into Class R6 (See Note 1) | | | 1,730,198 | | | | 17,308,847 | |
| | | | | | | | |
Net increase (decrease) | | | 57,555,258 | | | $ | 556,401,971 | |
| | | | | | | | |
Year ended October 31, 2015: | | | | | | | | |
Shares sold | | | 63,215,922 | | | $ | 678,929,508 | |
Shares issued to shareholders in reinvestment of dividends and distributions | | | 6,566,938 | | | | 69,346,874 | |
Shares redeemed | | | (17,665,445 | ) | | | (191,161,564 | ) |
| | | | | | | | |
Net increase (decrease) | | | 52,117,415 | | | $ | 557,114,818 | |
| | | | | | | | |
Note 10–Litigation
On December 23, 2014, Cynthia Ann Redus-Tarchis and others filed a complaint against New York Life Investments in the United States District Court for the District of New Jersey. The complaint was brought derivatively on behalf of the MainStay Large Cap Growth Fund, the MainStay High Yield Corporate Bond Fund and another fund previously managed by New York Life Investments and alleges that New York Life Investments violated Section 36(b) of the 1940 Act by charging
excessive investment management fees. The plaintiffs seek monetary damages and other relief from New York Life Investments. New York Life Investments believes the case has no merit, and intends to vigorously defend the matter.
On May 6, 2015, a second amended complaint was filed which, among other things, added MainStay High Yield Opportunities Fund as an additional Fund on whose behalf the complaint was brought. New York Life Investments filed a motion to dismiss the amended complaint. This motion was denied on October 28, 2015. New York Life Investments filed an answer to the amended complaint on November 30, 2015. Discovery in the case has commenced.
Note 11–Recent Accounting Pronouncement
In October 2016, the U.S. Securities and Exchange Commission adopted new rules and amended existing rules (together, “final rules”) intended to modernize the reporting and disclosure of information by registered investment companies. In part, the final rules amend Regulation S-X and require standardized, enhanced disclosure about derivatives in investment company financial statements, as well as other amendments. The compliance date for the amendments to Regulation S-X is August 1, 2017. Management is currently evaluating the impact that the adoption of the amendments to Regulation S-X will have on the Fund’s financial statements and related disclosures.
Note 12–Subsequent Events
In connection with the preparation of the financial statements of the Fund as of and for the fiscal year ended October 31, 2016, events and transactions subsequent to October 31, 2016, through the date the financial statements were issued have been evaluated by the Fund’s management for possible adjustment and/or disclosure. No subsequent events requiring financial statement adjustment or disclosure have been identified other than the following:
Effective February 28, 2017, Class B shares of the MainStay Group of Funds will be closed to all new purchases as well as additional investments by existing Class B shareholders. Existing Class B shareholders may continue to reinvest dividends and capital gains distributions, as well as exchange their Class B shares for Class B shares of other Funds as permitted by the current exchange privileges. Class B shareholders will continue to be subject to any applicable contingent deferred sales charge at the time of redemption. All other features of the Class B shares, including but not limited to the fees and expenses applicable to Class B shares, will remain unchanged. Unless redeemed, Class B Shares shareholders will remain in Class B shares of their respective Fund until the Class B shares are converted to Class A or Investor Class shares pursuant to the applicable conversion schedule.
Report of Independent Registered Public Accounting Firm
The Board of Trustees and Shareholders of
The MainStay Funds:
We have audited the accompanying statement of assets and liabilities, including the portfolio of investments, of the MainStay Large Cap Growth Fund (the “Fund”), one of the funds constituting The MainStay Funds, as of October 31, 2016, and the related statement of operations for the year then ended, the statements of changes in net assets for each of the years in the two-year period then ended, and the financial highlights for each of the years or periods in the five-year period then ended. These financial statements and financial highlights are the responsibility of the Fund’s management. Our responsibility is to express an opinion on these financial statements and financial highlights based on our audits.
We conducted our audits in accordance with the standards of the Public Company Accounting Oversight Board (United States). Those standards require that we plan and perform the audit to obtain reasonable assurance about whether the financial statements and financial highlights are free of material misstatement. An audit includes examining, on a test basis, evidence supporting the amounts and disclosures in the financial statements. Our procedures included confirmation of securities owned as of October 31, 2016, by correspondence with the custodian and brokers or by other appropriate auditing procedures where replies from brokers were not received. An audit also includes assessing the accounting principles used and significant estimates made by management, as well as evaluating the overall financial statement presentation. We believe that our audits provide a reasonable basis for our opinion.
In our opinion, the financial statements and financial highlights referred to above present fairly, in all material respects, the financial position of the MainStay Large Cap Growth Fund of The MainStay Funds as of October 31, 2016, and the results of its operations for the year then ended, the changes in its net assets for each of the years in the two-year period then ended, and the financial highlights for each of the years or periods in the five-year period then ended, in conformity with U.S. generally accepted accounting principles.

Philadelphia, Pennsylvania
December 22, 2016
| | |
| 30 | | MainStay Large Cap Growth Fund |
Federal Income Tax Information
(Unaudited)
The Fund is required under the Internal Revenue Code to advise shareholders in a written statement as to the federal tax status of dividends paid by the Fund during such fiscal years. Accordingly, the Fund paid $2,284,315,702 as long term capital distribution.
In February 2017, shareholders will receive an IRS Form 1099-DIV or substitute Form 1099 which will show the federal tax status of the distributions received by shareholders in calendar year 2016. The amounts that will be reported on such 1099-DIV or substitute Form 1099 will be the amounts you are to use on your federal income tax return and will differ from the amounts which we must report for the Fund’s fiscal year ended October 31, 2016.
Proxy Voting Policies and Procedures and Proxy Voting Record
A description of the policies and procedures that New York Life Investments uses to vote proxies related to the Fund’s securities is available without charge, upon request, (i) by visiting the Fund’s website at mainstayinvestments.com; or (ii) on the SEC’s website at www.sec.gov.
The Fund is required to file with the SEC its proxy voting record for the 12-month period ending June 30 on Form N-PX. The Fund’s most recent Form N-PX or proxy voting record is available free of charge upon request (i) by calling 800-MAINSTAY (624-6782); (ii) by visiting the Fund’s website at mainstayinvestments.com; or (iii) on the SEC’s website at www.sec.gov.
Shareholder Reports and Quarterly Portfolio Disclosure
The Fund is required to file its complete schedule of portfolio holdings with the SEC for its first and third fiscal quarters on Form N-Q. The Fund’s Form N-Q is available without charge, on the SEC’s website at www.sec.gov or by calling MainStay Investments at 800-MAINSTAY (624-6782). You also can obtain and review copies of Form N-Q by visiting the SEC’s Public Reference Room in Washington, DC (information on the operation of the Public Reference Room may be obtained by calling 1-800-SEC-0330).
Board of Trustees and Officers (Unaudited)
The Trustees and officers of the Funds are listed below. The Board oversees the MainStay Group of Funds, MainStay VP Funds Trust, MainStay DefinedTerm Municipal Opportunities Fund, the Manager and the Subadvisors, and elects the officers of the Funds who are responsible for the day-to-day operations of the Funds. Information pertaining to the Trustees and officers is set forth below. Each Trustee serves until his or her successor is elected and qualified or until his or her resignation, death or removal. Under the Retirement Policy, a Trustee must
tender his or her resignation by the end of the calendar year during which he or she reaches the age of 75 (although the Board of Trustees may make exceptions from time to time). Officers serve a term of one year and are elected annually by the Board of Trustees. The business address of each Trustee and officer listed below is 51 Madison Avenue, New York, New York 10010. A majority of the Trustees are not “interested persons” (as defined by the 1940 Act and rules “adopted” by the SEC thereunder) of the Fund (“Independent Trustees”).
| | | | | | | | | | | | |
| | | | | Name and Date of Birth | | Term of Office, Position(s) Held and Length of Service | | Principal Occupation(s) During Past Five Years | | Number of
Portfolios in
Fund Complex
Overseen by
Board Member | | Other Directorships Held By Board Member |
Interested Trustee | | | | Christopher O. Blunt* 5/13/62 | | MainStay Funds: Trustee since January 2016; MainStay Funds Trust: Trustee since January 2016. | | Executive Vice President (since 2009), President, Investments Group (since 2015), Member of the Executive Management Committee (since 2007), Co-President, Insurance and Agency Group (2012 to 2015), President, Insurance Group (2012 to 2014), Executive Vice President, Retirement Income Security (2008 to 2012), New York Life Insurance Company. | | 83 | | MainStay VP Funds Trust:
Trustee since January 2016 (31 portfolios); and
MainStay DefinedTerm Municipal Opportunities Fund: Trustee since January 2016. |
| | * | This Trustee is considered to be an “interested person” of the MainStay Group of Funds within the meaning of the 1940 Act because of his affiliation with New York Life Insurance Company, New York Life Investment Management LLC, Cornerstone Capital Management Holdings LLC, MacKay Shields LLC, Institutional Capital LLC, NYL Investors LLC, NYLIFE Securities LLC and/or NYLIFE Distributors LLC, as described in detail above in the column entitled “Principal Occupation(s) During Past Five Years.” |
| | |
| 32 | | MainStay Large Cap Growth Fund |
| | | | | | | | | | | | |
| | | | | Name and Date of Birth | | Term of Office, Position(s) Held and Length of Service | | Principal Occupation(s) During Past Five Years | | Number of Portfolios in Fund Complex Overseen by Board Member | | Other Directorships Held By Board Member |
| Non-Interested Trustee | | | | David H. Chow 12/29/57 | | MainStay Funds: Trustee since January 2016, Advisory Board Member (June 2015 to December 2015); MainStay Funds Trust: Trustee since January 2016, Advisory Board Member (June 2015 to December 2015). | | Founder and CEO, DanCourt Management, LLC (since 1999) | | 83 | | MainStay VP Funds Trust: Trustee since January 2016, Advisory Board Member (June 2015 to December 2015); (31 portfolios);
MainStay DefinedTerm Municipal Opportunities Fund: Trustee since January 2016, Advisory Board Member (June 2015 to December 2015);
Market Vectors Group of Exchange-Traded Funds: Independent Chairman of the Board of Trustees since 2008 and Trustee since 2006 (55 portfolios); and
Berea College of Kentucky: Trustee since 2009. |
| | | | Susan B. Kerley 8/12/51 | | MainStay Funds: Trustee since 2007; MainStay Funds Trust: Trustee since 1990.*** | | President, Strategic Management Advisors LLC (since 1990) | | 83 | | MainStay VP Funds Trust: Trustee since 2007 (31 portfolios)**;
MainStay DefinedTerm Municipal Opportunities Fund: Trustee since 2011; and Legg Mason Partners Funds: Trustee since 1991 (53 portfolios). |
| | | | Alan R. Latshaw 3/27/51 | | MainStay Funds: Trustee and Audit Committee Financial Expert since 2006; MainStay Funds Trust: Trustee and Audit Committee Financial Expert since 2007.*** | | Retired; Partner, Ernst & Young LLP (2002 to 2003); Partner, Arthur Andersen LLP (1989 to 2002); Consultant to the MainStay Funds Audit and Compliance Committee (2004 to 2006) | | 83 | | MainStay VP Funds Trust: Trustee and Audit Committee Financial Expert since 2007 (31 portfolios)**;
MainStay DefinedTerm Municipal Opportunities Fund: Trustee and Audit Committee Financial Expert since 2011;
State Farm Associates Funds Trusts: Trustee since 2005 (4 portfolios);
State Farm Mutual Fund Trust: Trustee since 2005 (15 portfolios); and
State Farm Variable Product Trust: Trustee since 2005 (9 portfolios). |
| | | | Peter Meenan 12/5/41 | | MainStay Funds: Chairman since 2013 and Trustee since 2007; MainStay Funds Trust: Chairman since 2013 and Trustee since 2002.*** | | Retired; Independent Consultant (2004 to 2013); President and Chief Executive Officer, Babson—United, Inc. (financial services firm) (2000 to 2004); Independent Consultant (1999 to 2000); Head of Global Funds, Citicorp (1995 to 1999) | | 83 | | MainStay VP Funds Trust: Chairman since 2013 and Trustee since 2007 (31 portfolios)**; and
MainStay DefinedTerm Municipal Opportunities Fund: Chairman since 2013 and Trustee since 2011. |
| | | | Richard H. Nolan, Jr. 11/16/46 | | MainStay Funds: Trustee since 2007; MainStay Funds Trust: Trustee since 2007.*** | | Managing Director, ICC Capital Management (since 2004); President—Shields/Alliance, Alliance Capital Management (1994 to 2004) | | 83 | | MainStay VP Funds Trust: Trustee since 2006 (31 portfolios)**; and
MainStay DefinedTerm Municipal Opportunities Fund: Trustee since 2011. |
| | | | Jacques P. Perold 5/12/58 | | MainStay Funds: Trustee since January 2016, Advisory Board Member (June 2015 to December 2015); MainStay Funds Trust: Trustee since January 2016, Advisory Board Member (June 2015 to December 2015). | | Retired; President, Fidelity Management & Research Company (2009 to 2014); Founder, President and Chief Executive Officer, Geode Capital Management, LCC (2001 to 2009) | | 83 | | MainStay VP Funds Trust: Trustee since January 2016, Advisory Board Member (June 2015 to December 2015); (31 portfolios);
MainStay DefinedTerm Municipal Opportunities Fund: Trustee since January 2016, Advisory Board Member (June 2015 to December 2015);
Allstate Corporation: Director since 2015; and
Boston University: Trustee since 2014. |
| | | | | | | | | | | | |
| | | | | Name and Date of Birth | | Term of Office, Position(s) Held and Length of Service | | Principal Occupation(s) During Past Five Years | | Number of Portfolios in Fund Complex Overseen by Board Member | | Other Directorships Held By Board Member |
Non-Interested Trustee | | | | Richard S. Trutanic 2/13/52 | | MainStay Funds: Trustee since 1994; MainStay Funds Trust: Trustee since 2007.*** | | Chairman and Chief Executive Officer, Somerset & Company (financial advisory firm) (since 2004); Managing Director, The Carlyle Group (private investment firm) (2002 to 2004); Senior Managing Director, Partner and Board Member, Groupe Arnault S.A. (private investment firm) (1999 to 2002) | | 83 | | MainStay VP Funds Trust: Trustee since 2007 (31 portfolios)**; and
MainStay DefinedTerm Municipal Opportunities Fund: Trustee since 2011. |
| | | | John A. Weisser**** 10/22/41 | | MainStay Funds: Trustee since 2007; MainStay Funds Trust: Trustee since 2007.*** | | Retired; Managing Director of Salomon Brothers, Inc. (1971 to 1995) | | 83 | | MainStay VP Funds Trust: Trustee since 1997 (31 portfolios)**; MainStay DefinedTerm Municipal Opportunities Fund: Trustee since 2011; Direxion Insurance Trust: Trustee since 2007 (1 portfolio); Direxion Funds: Trustee since 2007 (18 portfolios); and Direxion Shares ETF Trust: Trustee since 2008 (52 portfolios). |
| | ** | Includes prior service as a Director of MainStay VP Series Fund, Inc., the predecessor to MainStay VP Funds Trust. |
| | *** | Includes prior service as a Director/Trustee of certain predecessor entities to MainStay Funds Trust. |
| | **** | Pursuant to the Retirement Policy, Mr. Weisser will retire from the Board of Trustees on or about December 31, 2016. |
| | |
| 34 | | MainStay Large Cap Growth Fund |
| | | | | | | | |
| | | | | Name and Date of Birth | | Position(s) Held and Length of Service | | Principal Occupation(s) During Past Five Years |
Officers (Who Are Not Board Members)* | | | | Stephen P. Fisher 2/22/59 | | President, MainStay Funds (since 2007), MainStay Funds Trust (since 2009) | | Chairman and Chief Executive Officer (since 2014), President and Chief Operating Officer (2008 to 2013), NYLIFE Distributors LLC; Chairman of the Board, NYLIM Service Company LLC (since 2008); President (since May 2015), Co-President (2014 to 2015) and Senior Managing Director (since 2005), New York Life Investment Management LLC; President, MainStay DefinedTerm Municipal Opportunities Fund (since 2011) and MainStay VP Funds Trust (since 2007)** |
| | | | Jack R. Benintende 5/12/64 | | Treasurer and Principal Financial and Accounting Officer, MainStay Funds (since 2007), MainStay Funds Trust (since 2009) | | Managing Director, New York Life Investment Management LLC (since 2007); Treasurer and Principal Financial and Accounting Officer, MainStay DefinedTerm Municipal Opportunities Fund (since 2011) and MainStay VP Funds Trust (since 2007)**; and Assistant Treasurer, New York Life Investment Management Holdings LLC (2008 to 2012) |
| | | | Kevin M. Bopp 2/24/69 | | Vice President and Chief Compliance Officer, MainStay Funds and MainStay Funds Trust (since 2014) | | Chief Compliance Officer (since January 2016), Director and Associate General Counsel (2011 to 2014) and Vice President and Assistant General Counsel (2010 to 2011), New York Life Investment Management LLC; Vice President and Chief Compliance Officer, MainStay VP Funds Trust, MainStay DefinedTerm Municipal Opportunities Fund (since 2014); Assistant Secretary, MainStay Funds, MainStay Funds Trust and MainStay VP Funds Trust (2010 to 2014)**, MainStay DefinedTerm Municipal Opportunities Fund (2011 to 2014) |
| | | | J. Kevin Gao 10/13/67 | | Secretary and Chief Legal Officer, MainStay Funds and MainStay Funds Trust (since 2010) | | Managing Director and Associate General Counsel, New York Life Investment Management LLC (since 2010); Secretary and Chief Legal Officer, MainStay DefinedTerm Municipal Opportunities Fund (since 2011) and MainStay VP Funds Trust (since 2010)** |
| | | | Scott T. Harrington 2/8/59 | | Vice President— Administration, MainStay Funds (since 2005), MainStay Funds Trust (since 2009) | | Director, New York Life Investment Management LLC (including predecessor advisory organizations) (since 2000); Member of the Board of Directors, New York Life Trust Company (since 2009); Vice President—Administration, MainStay DefinedTerm Municipal Opportunities Fund (since 2011) and MainStay VP Funds Trust (since 2005)** |
| | * | The Officers listed above are considered to be “interested persons” of the MainStay Group of Funds within the meaning of the 1940 Act because of their affiliation with the MainStay Group of Funds, New York Life Insurance Company and/or its affiliates, including New York Life Investment Management LLC, NYLIM Service Company LLC, NYLIFE Securities LLC and/or NYLIFE Distributors LLC, as described in detail in the column captioned “Principal Occupation(s) During Past Five Years.” Officers are elected annually by the Board to serve a one year term. |
| | ** | Includes prior service as an Officer of MainStay VP Series Fund, Inc., the predecessor to MainStay VP Funds Trust. |
This page intentionally left blank
This page intentionally left blank
This page intentionally left blank
MainStay Funds
MainStay offers a wide range of Funds for virtually any investment need. The full array of MainStay open-end offerings is listed here, with information about the manager, subadvisors, legal counsel and independent registered public accounting firm.
Equity
U.S. Equity
MainStay Common Stock Fund
MainStay Cornerstone Growth Fund
MainStay Epoch U.S. All Cap Fund
MainStay Epoch U.S. Equity Yield Fund
MainStay Epoch U.S. Small Cap Fund
MainStay ICAP Equity Fund
MainStay ICAP Select Equity Fund
MainStay Large Cap Growth Fund
MainStay MAP Fund
MainStay S&P 500 Index Fund
MainStay U.S. Equity Opportunities Fund
International/Global Equity
MainStay Emerging Markets Opportunities Fund
MainStay Epoch Capital Growth Fund
MainStay Epoch Global Choice Fund
MainStay Epoch Global Equity Yield Fund
MainStay Epoch International Small Cap Fund
MainStay ICAP International Fund
MainStay International Equity Fund
MainStay International Opportunities Fund
Income
Taxable Bond
MainStay Floating Rate Fund
MainStay Global High Income Fund
MainStay Government Fund
MainStay High Yield Corporate Bond Fund
MainStay High Yield Opportunities Fund
MainStay Indexed Bond Fund
MainStay Short Duration High Yield Fund
MainStay Total Return Bond Fund
MainStay Unconstrained Bond Fund
Municipal/Tax Advantaged Bond
MainStay California Tax Free Opportunities Fund1
MainStay High Yield Municipal Bond Fund
MainStay New York Tax Free Opportunities Fund2
MainStay Tax Advantaged Short Term Bond Fund
MainStay Tax Free Bond Fund
Money Market
MainStay Money Market Fund
Mixed Asset
MainStay Balanced Fund
MainStay Convertible Fund
MainStay Income Builder Fund
Alternative
MainStay Absolute Return Multi-Strategy Fund
MainStay Cushing Energy Income Fund
MainStay Cushing MLP Premier Fund
MainStay Cushing Renaissance Advantage Fund
Asset Allocation/Target Date
MainStay Conservative Allocation Fund
MainStay Growth Allocation Fund
MainStay Moderate Allocation Fund
MainStay Moderate Growth Allocation Fund
MainStay Retirement 2010 Fund
MainStay Retirement 2020 Fund
MainStay Retirement 2030 Fund
MainStay Retirement 2040 Fund
MainStay Retirement 2050 Fund
MainStay Retirement 2060 Fund
Manager
New York Life Investment Management LLC
New York, New York
Subadvisors
Candriam France S.A.S.3
Paris, France
Cornerstone Capital Management Holdings LLC3
New York, New York
Cushing Asset Management, LP
Dallas, Texas
Epoch Investment Partners, Inc.
New York, New York
Institutional Capital LLC3
Chicago, Illinois
MacKay Shields LLC3
New York, New York
Markston International LLC
White Plains, New York
NYL Investors LLC3
New York, New York
Winslow Capital Management, LLC
Minneapolis, Minnesota
Legal Counsel
Dechert LLP
Washington, District of Columbia
Independent Registered Public Accounting Firm
KPMG LLP
Philadelphia, Pennsylvania
1. This Fund is only registered for sale in AZ, CA, MI (Class A and Class I shares only), NV, OR, TX, UT and WA.
2. This Fund is only registered for sale in CA, CT, DE, FL, MA, NJ, NY and VT.
3. An affiliate of New York Life Investment Management LLC.
Not part of the Annual Report
For more information
800-MAINSTAY (624-6782)
mainstayinvestments.com
MainStay Investments® is a registered service mark and name under which New York Life Investment Management LLC does business. MainStay Investments, an indirect subsidiary of New York Life Insurance Company, New York, NY 10010, provides investment advisory products and services. The MainStay Funds® are managed by New York Life Investment Management LLC and distributed by NYLIFE Distributors LLC, 30 Hudson Street, Jersey City, NJ 07302, a wholly owned subsidiary of New York Life Insurance Company. NYLIFE Distributors LLC is a Member FINRA/SIPC.
©2016 NYLIFE Distributors LLC. All rights reserved.
| | | | | | | | |
| Not FDIC/NCUA Insured | | Not a Deposit | | May Lose Value | | No Bank Guarantee | | Not Insured by Any Government Agency |
| | |
| 1715995 MS316-16 | | MSLG11-12/16 (NYLIM) NL221 |
MainStay MAP Fund
Message from the President and Annual Report
October 31, 2016


This page intentionally left blank
Message from the President
During the 12 months ended October 31, 2016, the U.S. stock and bond markets were somewhat volatile but generally ended the reporting period in positive territory. In the fall of 2015 and early 2016, the market appeared to be focused on China’s economic weakness and a prolonged decline in oil prices. Although energy-related companies felt the brunt of these setbacks, the stock market as a whole declined until mid-February, when oil prices began to rise and stocks began a relatively steady recovery.
In late June, the United Kingdom voted to leave the European Union in a referendum popularly known as “Brexit.” The news caused a temporary slump in stocks around the world. Although the British pound dropped in value following the vote, stocks generally recovered through the end of the reporting period. As the end of the reporting period approached, speculation about the upcoming U.S. presidential election heightened market volatility.
According to FTSE-Russell data, U.S. stocks as a whole tended to provide positive returns during the reporting period, with large-capitalization stocks generally outperforming stocks of smaller companies. Value stocks outpaced growth stocks at all capitalization levels, with the largest differences among small- to mid-cap stocks.
International and emerging-market stocks provided mixed performance. Rocked by Brexit, European stocks as a whole declined during the reporting period, while stocks in the Asia-Pacific region (with or without Japan) tended to provide positive returns. International stocks as a whole declined, while global stocks advanced slightly. Emerging-market stocks were considerably stronger, boosted by advances in India and Latin America and higher prices for oil, metals and other commodities.
Anticipation of a possible Federal Reserve rate hike led to volatility in the bond market, but the Federal Open Market Committee chose not to raise the federal funds target rate during the reporting period. Short-term U.S. Treasury yields rose during the reporting period, and longer-term U.S. Treasury yields declined. Overall, the U.S. bond market provided positive returns, with longer-term bonds generally outperforming shorter-term securities. High-yield bonds, particularly
longer-term issues, were strong performers. Municipal bonds generally provided positive single-digit total returns for the 12 months ended October 31, 2016.
Central banks around the world remained highly accommodative during the reporting period, particularly in light of Brexit. Shortly after the U.K. referendum, more than a third of all sovereign debt carried negative yields. As an asset class, emerging-market bonds provided double-digit positive returns during the reporting period, and world bonds as a whole provided positive single-digit positive returns.
At MainStay, we know that political, economic and market events may influence the performance of your Fund investments. While our portfolio managers often pay close attention to such events, their primary emphasis is seeking to invest for the long-term investment needs of our shareholders. With this in mind, they seek to pursue the investment objectives of their respective Funds using the principal investment strategies and investment processes outlined in the prospectus. By placing your assets in the care of our investment professionals, you gain access to their extensive market insight, strategic investment discipline and in-depth experience in risk-management over a wide range of market cycles.
The report that follows provides more detailed information about the market forces, portfolio strategies and individual securities that influenced the performance of your MainStay Fund during the 12 months ended October 31, 2016. We invite you to read the report carefully as part of your personal investment-review process.
We thank you for your business, and we look forward to a continuing relationship as you pursue your long-range financial goals.
Sincerely,

Stephen P. Fisher
President
The opinions expressed are as of the date of this report and are subject to change. There is no guarantee that any forecast made will come to pass. This material does not constitute investment advice and is not intended as an endorsement of any specific investment. Past performance is no guarantee of future results.
Not part of the Annual Report
Table of Contents
Investors should refer to the Fund’s Summary Prospectus and/or Prospectus and consider the Fund’s investment objectives, strategies, risks, charges and expenses carefully before investing. The Summary Prospectus and/or Prospectus contain this and other information about the Fund. You may obtain copies of the Fund’s Summary Prospectus, Prospectus and Statement of Additional Information free of charge, upon request, by calling toll-free 800-MAINSTAY (624-6782), by writing to NYLIFE Distributors LLC, Attn: MainStay Marketing Department, 30 Hudson Street, Jersey City, NJ 07302 or by sending an e-mail to MainStayShareholderServices@nylim.com. These documents are also available via the MainStay Funds’ website at mainstayinvestments.com/documents. Please read the Summary Prospectus and/or Prospectus carefully before investing.
Investment and Performance Comparison1 (Unaudited)
Performance data quoted represents past performance. Past performance is no guarantee of future results. Because of market volatility and other factors, current performance may be lower or higher than the figures shown. Investment return and principal value will fluctuate, and as a result, when shares are redeemed, they may be worth more or less than their original cost. The graph below depicts the historical performance of Class I shares of the Fund. Performance will vary from class to class based on differences in class-specific expenses and sales charges. For performance information current to the most recent month-end, please call 800-MAINSTAY (624-6782) or visit mainstayinvestments.com.
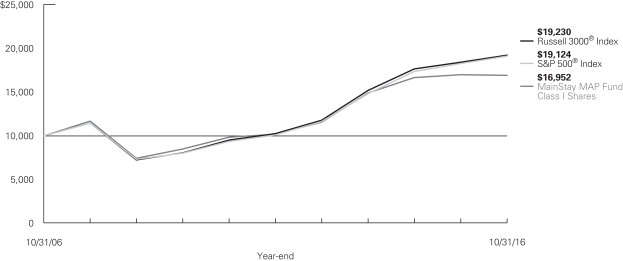
Average Annual Total Returns for the Year Ended October 31, 2016
| | | | | | | | | | | | | | | | | | | | |
| Class | | Sales Charge | | | | One Year | | | Five Years | | | Ten Years | | | Gross
Expense
Ratio2 | |
| Class A Shares | | Maximum 5.5% Initial Sales Charge | | With sales charges Excluding sales charges | |
| –6.04
–0.57 | %
| |
| 9.17
10.41 | %
| |
| 4.55
5.14 | %
| |
| 1.11
1.11 | %
|
| Investor Class Shares3 | | Maximum 5.5% Initial Sales Charge | | With sales charges Excluding sales charges | |
| –6.24
–0.79 |
| |
| 8.97
10.21 |
| |
| 4.38
4.98 |
| |
| 1.25
1.25 |
|
| Class B Shares | | Maximum 5% CDSC if Redeemed Within the First Six Years of Purchase | | With sales charges Excluding sales charges | |
| –5.60
–1.52 |
| |
| 9.11
9.39 |
| |
| 4.19
4.19 |
| |
| 2.00
2.00 |
|
| Class C Shares | | Maximum 1% CDSC if Redeemed Within One Year of Purchase | | With sales charges Excluding sales charges | |
| –2.34
–1.52 |
| |
| 9.39
9.39 |
| |
| 4.19
4.19 |
| |
| 2.00
2.00 |
|
| Class I Shares | | No Sales Charge | | | | | –0.33 | | | | 10.69 | | | | 5.42 | | | | 0.86 | |
| Class R1 Shares | | No Sales Charge | | | | | –0.43 | | | | 10.56 | | | | 5.30 | | | | 0.96 | |
| Class R2 Shares | | No Sales Charge | | | | | –0.68 | | | | 10.29 | | | | 5.06 | | | | 1.21 | |
| Class R3 Shares | | No Sales Charge | | | | | –0.91 | | | | 10.03 | | | | 4.79 | | | | 1.46 | |
| 1. | The performance table and graph do not reflect the deduction of taxes that a shareholder would pay on distributions or Fund share redemptions. Total returns reflect maximum applicable sales charges as indicated in the table above, if any, changes in share price, and reinvestment of dividend and capital gain distributions. The graph assumes the initial investment amount shown above and reflects the deduction of all sales charges that would have applied for the period of investment. Performance figures may reflect certain fee waivers and/or expense limitations, without which total returns may have been lower. For more information on share classes and current fee waivers and/or expense limitations (if any), please refer to the notes to the financial statements. |
| 2. | The gross expense ratios presented reflect the Fund’s “Total Annual Fund Operating Expenses” from the most recent Prospectus and may differ from other expense ratios disclosed in this report. |
| 3. | Performance figures for Investor Class shares, first offered on February 28, 2008, include the historical performance of Class A shares through February 27, 2008, adjusted for differences in certain fees and expenses. Unadjusted, the performance shown for the Investor Class shares would likely have been different. |
The footnotes on the next page are an integral part of the table and graph and should be carefully read in conjunction with them.
| | | | | | | | | | | | |
| Benchmark Performance | | One Year | | | Five Years | | | Ten Years | |
Russell 3000® Index4 | | | 4.24 | % | | | 13.35 | % | | | 6.76 | % |
S&P 500® Index5 | | | 4.51 | | | | 13.57 | | | | 6.70 | |
Average Lipper Large-Cap Core Fund6 | | | 2.53 | | | | 11.98 | | | | 5.90 | |
| 4. | The Russell 3000® Index is the Fund’s primary broad-based securities market index for comparison purposes. The Russell 3000® Index measures the performance of the largest 3,000 U.S. companies representing approximately 98% of the investable U.S. equity market. Results assume reinvestment of all dividends and capital gains. An investment cannot be made directly in an index. |
| 5. | The S&P 500® Index is the Fund’s secondary benchmark. “S&P 500®” is a trademark of The McGraw-Hill Companies, Inc. The S&P 500® Index is widely regarded as the standard index for measuring large-cap U.S. stock market performance. Results assume reinvestment of all income and capital gains. An investment cannot be made directly in an index. |
| 6. | The Average Lipper Large-Cap Core Fund is representative of funds that, by portfolio practice, invest at least 75% of their equity assets in companies with market capitalizations (on a three-year weighted basis) above Lipper’s U.S. Diversified Equity large-cap floor. Large-cap core funds have more latitude in the companies in which they invest. These funds typically have average characteristics compared to the S&P 500® Index. This benchmark is a product of Lipper Inc. Lipper Inc. is an independent monitor of fund performance. Results are based on average total returns of similar funds with all dividend and capital gain distributions reinvested. |
The footnotes on the preceding page are an integral part of the table and graph and should be carefully read in conjunction with them.
Cost in Dollars of a $1,000 Investment in MainStay MAP Fund (Unaudited)
The example below is intended to describe the fees and expenses borne by shareholders during the six-month period from May 1, 2016, to October 31, 2016, and the impact of those costs on your investment.
Example
As a shareholder of the Fund, you incur two types of costs: (1) transaction costs, including exchange fees and sales charges (loads) on purchases (as applicable), and (2) ongoing costs, including management fees, distribution and/or service (12b-1) fees, and other Fund expenses (as applicable). This example is intended to help you understand your ongoing costs (in dollars) of investing in the Fund and to compare these costs with the ongoing costs of investing in other mutual funds. The example is based on an investment of $1,000 made at the beginning of the six-month period and held for the entire period from May 1, 2016, to October 31, 2016.
This example illustrates your Fund’s ongoing costs in two ways:
Actual Expenses
The second and third data columns in the table below provide information about actual account values and actual expenses. You may use the information in these columns, together with the amount you invested, to estimate the expenses that you paid during the six months ended October 31, 2016. Simply divide your account value by $1,000 (for example, an $8,600 account value divided by $1,000 = 8.6), then
multiply the result by the number under the heading entitled “Expenses Paid During Period” to estimate the expenses you paid on your account during this period.
Hypothetical Example for Comparison Purposes
The fourth and fifth data columns in the table below provide information about hypothetical account values and hypothetical expenses based on the Fund’s actual expense ratio and an assumed rate of return of 5% per year before expenses, which is not the Fund’s actual return. The hypothetical account values and expenses may not be used to estimate the actual ending account balances or expenses you paid for the six-month period shown. You may use this information to compare the ongoing costs of investing in the Fund with the ongoing costs of investing in other Funds. To do so, compare this 5% hypothetical example with the 5% hypothetical examples that appear in the shareholder reports of the other Funds.
Please note that the expenses shown in the table are meant to highlight your ongoing costs only and do not reflect any transactional costs, such as exchange fees or sales charges (loads). Therefore, the fourth and fifth data columns of the table are useful in comparing ongoing costs only and will not help you determine the relative total costs of owning different funds. In addition, if these transactional costs were included, your costs would have been higher.
| | | | | | | | | | | | | | | | | | | | |
| | | | | | | | | | | | | | | | |
| Share Class | | Beginning
Account
Value
5/1/16 | | | Ending Account
Value (Based
on Actual
Returns and
Expenses)
10/31/16 | | | Expenses
Paid
During
Period1 | | | Ending Account
Value (Based
on Hypothetical
5% Annualized
Return and
Actual Expenses)
10/31/16 | | | Expenses
Paid
During
Period1 | |
| | | | | |
| Class A Shares | | $ | 1,000.00 | | | $ | 1,031.30 | | | $ | 5.46 | | | $ | 1,019.80 | | | $ | 5.43 | |
| | | | | |
| Investor Class Shares | | $ | 1,000.00 | | | $ | 1,030.20 | | | $ | 6.58 | | | $ | 1,018.70 | | | $ | 6.55 | |
| | | | | |
| Class B Shares | | $ | 1,000.00 | | | $ | 1,026.30 | | | $ | 10.39 | | | $ | 1,014.90 | | | $ | 10.33 | |
| | | | | |
| Class C Shares | | $ | 1,000.00 | | | $ | 1,026.30 | | | $ | 10.39 | | | $ | 1,014.90 | | | $ | 10.33 | |
| | | | | |
| Class I Shares | | $ | 1,000.00 | | | $ | 1,032.70 | | | $ | 4.19 | | | $ | 1,021.00 | | | $ | 4.17 | |
| | | | | |
| Class R1 Shares | | $ | 1,000.00 | | | $ | 1,032.00 | | | $ | 4.70 | | | $ | 1,020.50 | | | $ | 4.67 | |
| | | | | |
| Class R2 Shares | | $ | 1,000.00 | | | $ | 1,030.90 | | | $ | 5.97 | | | $ | 1,019.30 | | | $ | 5.94 | |
| | | | | |
| Class R3 Shares | | $ | 1,000.00 | | | $ | 1,029.60 | | | $ | 7.24 | | | $ | 1,018.00 | | | $ | 7.20 | |
| 1. | Expenses are equal to the Fund’s annualized expense ratio of each class (1.07% for Class A, 1.29% for Investor Class, 2.04% for Class B and Class C, 0.82% for Class I, 0.92% for Class R1, 1.17% for Class R2 and 1.42% for Class R3) multiplied by the average account value over the period, divided by 366 and multiplied by 184 (to reflect the six-month period). The table above represents the actual expenses incurred during the six-month period. |
Industry Composition as of October 31, 2016 (Unaudited)
| | | | |
| Media | | | 12.0 | % |
| Banks | | | 6.9 | |
| Oil, Gas & Consumable Fuels | | | 5.3 | |
| Technology Hardware, Storage & Peripherals | | | 5.2 | |
| Aerospace & Defense | | | 4.8 | |
| Internet Software & Services | | | 4.5 | |
| Software | | | 4.0 | |
| Capital Markets | | | 3.9 | |
| Insurance | | | 3.8 | |
| Health Care Equipment & Supplies | | | 3.7 | |
| Pharmaceuticals | | | 3.7 | |
| Consumer Finance | | | 3.4 | |
| Health Care Providers & Services | | | 3.4 | |
| Chemicals | | | 3.2 | |
| Food & Staples Retailing | | | 3.2 | |
| Industrial Conglomerates | | | 2.9 | |
| IT Services | | | 2.5 | |
| Real Estate Investment Trusts | | | 2.1 | |
| Semiconductors & Semiconductor Equipment | | | 2.1 | |
| Beverages | | | 1.9 | |
| Specialty Retail | | | 1.8 | |
| Road & Rail | | | 1.5 | |
| Biotechnology | | | 1.4 | |
| Household Durables | | | 1.0 | |
| | | | |
| Building Products | | | 0.9 | % |
| Diversified Telecommunication Services | | | 0.9 | |
| Electrical Equipment | | | 0.9 | |
| Construction Materials | | | 0.7 | |
| Electronic Equipment, Instruments & Components | | | 0.7 | |
| Internet & Catalog Retail | | | 0.7 | |
| Food Products | | | 0.6 | |
| Hotels, Restaurants & Leisure | | | 0.6 | |
| Airlines | | | 0.5 | |
| Real Estate Management & Development | | | 0.5 | |
| Energy Equipment & Services | | | 0.4 | |
| Wireless Telecommunication Services | | | 0.4 | |
| Diversified Financial Services | | | 0.3 | |
| Machinery | | | 0.3 | |
| Tobacco | | | 0.3 | |
| Commercial Services & Supplies | | | 0.2 | |
| Construction & Engineering | | | 0.2 | |
| Household Products | | | 0.2 | |
| Auto Components | | | 0.1 | |
| Communications Equipment | | | 0.0 | ‡ |
| Short-Term Investment | | | 2.7 | |
| Other Assets, Less Liabilities | | | –0.3 | |
| | | | |
| | | 100.0 | % |
| | | | |
See Portfolio of Investments beginning on page 12 for specific holdings within these categories.
| ‡ | Less than one-tenth of a percent. |
Top Ten Holdings as of October 31, 2016 (Unaudited)
| 6. | Liberty SiriusXM Group. |
| 7. | Twenty-First Century Fox, Inc. |
Portfolio Management Discussion and Analysis (Unaudited)
Questions answered by portfolio managers Christopher Mullarkey and James Mulvey of the Fund’s Subadvisor Markston International LLC (“Markston International”) and by portfolio managers Jerrold K. Senser, CFA,1 Thomas M. Cole, CFA, Andrew P. Starr, CFA, Matthew T. Swanson, CFA, and J. Christian Kirtley, CFA, of the Fund’s Subadvisor Institutional Capital LLC (“ICAP”).
How did MainStay MAP Fund perform relative to its benchmarks and peers during the 12 months ended October 31, 2016?
Excluding all sales charges, MainStay MAP Fund returned –0.57% for Class A shares, –0.79% for Investor Class shares and –1.52% for Class B and Class C shares for the 12 months ended October 31, 2016. Over the same period, Class I shares returned –0.33%, Class R1 shares returned –0.43%, Class R2 shares returned –0.68% and Class R3 shares returned –0.91%. For the 12 months ended October 31, 2016, all share classes underperformed the 4.24% return of the Russell 3000® Index,2 which is the Fund’s primary benchmark, and the 4.51% return of the S&P 500® Index,2 which is the Fund’s secondary benchmark. For the 12 months ended October 31, 2016, all share classes underperformed the 2.53% return of the Average Lipper3 Large-Cap Core Fund. See page 5 for Fund returns with applicable sales charges.
Were there any changes to the Fund during the reporting period?
Effective on October 1, 2016, Mr. Roger Lob no longer served as a portfolio manager for the Fund. Mr. Lob will remain as Senior Advisor at Markston International through December 31, 2016. For more information on this change, please see the Supplement dated August 19, 2016.
What factors affected the Fund’s relative performance during the reporting period?
Markston International
While our portion of the Fund exhibited strong performance from stock selection, it held underweight positions in sectors that were highly correlated with the 10-year U.S. Treasury bond (i.e., consumer staples, telecommunication services and utilities).
During the reporting period, the sectors that drove the performance of our portion of the Fund relative to the Russell 3000® Index were the consumer discretionary and materials sectors. In addition, our underweight position in the health care sector contributed positively to relative performance. (Contributions take weightings and total returns into account.) Our underweight positions in the utilities, telecommunication services and consumer staples sectors detracted from performance relative to the Russell 3000® Index.
ICAP
In our portion of the Fund that invests in U.S. equities, a number of key drivers affected performance relative to the S&P 500®
Index. Stock selection in the health care, information technology and financials sectors detracted from relative performance, as did an underweight position in consumer staples. Favorable stock selection in the consumer discretionary and energy sectors added to relative performance, while an overweight position in the materials sector also added to relative performance.
In our portion of the Fund that invests in global equities, information technology, consumer discretionary and industrials were the best-performing sectors on an absolute basis. In this portion of the Fund, the weakest-performing sectors on an absolute basis were financials, telecommunication services and health care.
During the reporting period, which individual stocks made the strongest contributions to the Fund’s absolute performance and which stocks detracted the most?
Markston International
During the reporting period, the stocks in our portion of the Fund that made the strongest positive contributions to the Fund’s absolute performance were satellite radio tracking company Liberty SiriusXM Group, media and entertainment company Time Warner and pipeline company Spectra Energy. Liberty Sirius benefited from continuing to deliver on its solid execution and from John Malone’s public announcement that he wanted to own 100% of SiriusXM. Time Warner’s stock advanced when the company announced that it had agreed to be acquired by AT&T. Spectra energy announced that it would be acquired by Enbridge, Canada’s largest pipeline company.
During the reporting period, the stocks in our portion of the Fund that detracted the most from absolute performance were pharmacy and pharmacy benefits manager CVS Health, personal computer and peripheral device maker Apple, and Internet & catalog retail company Liberty Interactive. CVS Health suffered from severe competition. Apple continued to be viewed as a mature electronics manufacturer incapable of delivering a refreshed product cycle. Liberty Interactive, the tracking stock for QVC Group and Liberty Ventures Group, declined after QVC surprised investors with a loss and a poor outlook after it acquired the flash-sale site Zulily.
ICAP
In our portion of the Fund that invests in U.S. equities, the stocks that made the strongest positive contributions to the Fund’s absolute performance were satellite TV provider DISH Network, diversified consumer products manufacturer Newell
| 1. | Mr. Senser served as a portfolio manager for the Fund until September 30, 2016. |
| 2. | See footnote on page 6 for more information on this index. |
| 3. | See footnote on page 6 for more information about Lipper Inc. |
Brands and semiconductor manufacturer Intel. In our view, the market implied that DISH’s TV business was impaired despite an improving free cash flow profile. The market also appeared to assign little value to the company’s spectrum, providing an asymmetric risk/reward scenario. We believed that DISH could monetize its spectrum over time, which could benefit the stock. We believed that Newell Brands could deliver greater-than-expected synergies from its Jarden acquisition and pay down debt faster than expected. We also believed that the company’s portfolio of brands would prove more defensive than investors perceived. We believed that Intel could generate sustainable mid-single-digit revenue growth and earnings growth in the 10% range driven by growth in the company’s data center (servers and networking), Internet of Things, and memory segments, if coupled with lower mobile losses.
Primary detractors from the Fund’s absolute performance during the reporting period included specialty pharmaceutical company Allergan, pharmaceutical and medical supplies distributor McKesson, and wealth manager Ameriprise Financial. Allergan lagged after the announced merger with Pfizer was called off. We continued to like Allergan as a stand-alone company, however, and we added to our position during the reporting period. In our view, the company represented high-margin, high-return, durable branded pharmaceuticals. We believed that the company had an attractive product pipeline, was growing revenue and was reducing costs to increase margins. McKesson lagged because of pressure on generic drug prices which hurt the company’s profit margins and outlook. We continued to find the stock attractively valued at a price-earnings ratio of around 10:1, but we have trimmed the size of the Fund’s position. Ameriprise lagged because of a difficult market and lower-than-expected net flows in its wealth management business. We sold the position during the reporting period in favor of stocks with stronger investment catalysts.
In our portion of the Fund that invests in global equities, the stocks that made the strongest positive contributions to absolute performance were Danish biotechnology company Genmab; Korean technology manufacturer Samsung Elecronics; and Dutch health, nutrition and materials company DSM. Genmab performed strongly as it progressed on its launch of its new cancer treatments, and we sold the stock as it neared our target price. Samsung continued to deliver on operating, financial and restructuring results, which helped the company’s stock performance. We continued to like the stock, which at the end of the reporting period was valued around nine times 2017 estimated earnings. Regarding DSM, we believed that investors had undervalued the stock, giving a low implied value for the nutrition business and no credit for the company’s joint ventures. In our view, the nutrition business could garner a higher value if the company were to see improved performance from
cost-savings programs and if the company could move past the collapse in vitamin E prices that masked the company’s underlying business strengths in recent years.
In our portion of the Fund that invests in global equities, the primary detractors from absolute performance during the reporting period included two European banks—Royal Bank of Scotland and Deutsche Bank—and Swiss health care company Novartis. Royal Bank of Scotland continued its turnaround, seeking to completely remake itself from a global universal bank to one focused only on retail & commercial banking in the U.K. and Ireland. After several false starts under previous management, current CEO Ross McEwan has defined what the bank intends to look like going forward. We expected that core earnings power could stabilize and start growing in 2016, which would help address investor concerns regarding profitability. We believe that substantial capital may be returned to shareholders once these concerns are addressed. Deutsche Bank was hindered by operational and environmental issues. We sold our position because of lowered conviction in the investment thesis. In our opinion, increased political and economic uncertainty in Europe could impede management’s ability to implement its turnaround plan. Novartis faced pressure because of results at the company’s eye care division, Alcon, and a slower-than-expected ramp-up of sales for its heart failure drug, Entresto. We believed that the recent controversies offered an attractive valuation opportunity in a high-quality, growing health care company and that Novartis could ultimately resolve these issues.
Did the Fund make any significant purchases or sales during the reporting period?
Markston International
In our portion of the Fund, the largest purchases during the reporting period were positions in global pharmaceutical company Allergan and defense contractor Raytheon. We purchased Allergan after the proposed acquisition with Pfizer failed to take place. At the time, Allergan met our value parameters and had announced plans to divest its generics business, deleverage its balance sheet and buy back stock. We added to our position in Raytheon after the company acquired Websense and formed a joint venture with Vista Equity Partners to expand Raytheon’s global cyber offerings.
During the reporting period, the largest sales in our portion of the Fund were chemicals company Monsanto and insurance company Chubb. In both cases, we sold some of our positions after mergers were announced and the deals became subject to approval by government regulators.
ICAP
In our portion of the Fund that invests in U.S. equities, we continued to look for stocks with attractive valuations and specific catalysts that we believed could trigger appreciation over 12 to 18 months. We initiated a new position in Royal Dutch Shell, a large integrated oil & gas company. We believed that investors had underestimated the free cash flow improvement potential from lower capital and operating expenditures. In our view, while the company has been slow to address costs, the recently acquired BG Group could be at a free cash inflection point and synergies from the deal could create upside potential. The company’s dividend yield of approximately 7% indicates possible investor skepticism. In financials, we added Wells Fargo. The stock has pulled back with the rest of the large-cap banks because of Federal Reserve rate-hike expectations and credit-quality issues in the energy lending space. We found the current valuation level attractive for what we believed to be a very high-quality bank.
Wells Fargo was also added in our portion of the Fund that invests in global equities. Semiconductor manufacturer Intel was added to both of our portions of the Fund. We believed that the company could generate sustainable mid-single-digit revenue growth and low double-digit earnings growth driven by growth in the data center (servers and networking), Internet of Things, and memory segments, if coupled with better performance in mobile. In our view, the company’s valuation assumed no revenue growth and continued mobile losses.
In addition to the positions already mentioned, our portion of the Fund that invests in U.S. equities sold its positions in diversified pharmaceutical company Novartis and diversified industrial company General Electric (“GE”) in favor of stocks that we believed had greater potential upside and were more attractive on a relative-valuation basis. GE was sold from the global equity portion of the Fund, while Novartis remained in our portion of the Fund that invests in global equities.
How did the Fund’s sector weightings change during the reporting period?
Markston International
During the reporting period, our portion of the Fund slightly increased its exposure to the consumer discretionary and health care sectors. Over the same period, we reduced our exposure to the utilities and energy sectors.
ICAP
Our portion of the Fund that invests in U.S. equities increased its exposure relative to the S&P 500® Index in the information technology and industrials sectors. This portion of the Fund also increased its allocation to the information technology sector but remained underweight relative to the Index. In the industrials sector, this portion of the Fund moved from a slightly underweight to an overweight position relative to the S&P 500® Index. During the reporting period, this portion of the Fund decreased its sector weightings relative to the Index in health care and materials. In both sectors, the Fund moved from an overweight position relative to the Index to a slightly underweight position.
In our portion of the Fund that invests in global equities, we increased our absolute weightings in the information technology and consumer staples sectors, and we decreased our weightings in the consumer discretionary and energy sectors.
How was the Fund positioned at the end of the reporting period?
Markston International
As of October 31, 2016, our portion of the Fund held positions that were overweight relative to the Russell 3000® Index by a few percentage points in the financials and consumer discretionary sectors. As of the same date, our portion of the Fund held positions that were underweight relative to the Index by a couple of percentage points in the real estate and utilities sectors.
ICAP
As of October 31, 2016, our portion of the Fund that invests in U.S. equities was most significantly overweight relative to the S&P 500® Index in the consumer discretionary and financials sectors. As of the same date, our domestic equity portion of the Fund was most significantly underweight relative to the Index in the consumer staples and information technology sectors.
In our portion of the Fund that invests in global equities, the most substantial weightings as of October 31, 2016, were in the financials and information technology sectors. As of the same date, the least substantial weightings were in the utilities and telecommunication services sectors.
This positioning reflected our view on the prospects for economic growth and the relative attractiveness of individual holdings in these sectors.
The opinions expressed are those of the portfolio managers as of the date of this report and are subject to change. There is no guarantee that any forecasts made will come to pass. This material does not constitute investment advice and is not intended as an endorsement of any specific investment.
Portfolio of Investments October 31, 2016
| | | | | | | | |
| | |
| | | Shares | | | Value | |
| | | | | | | | |
| Common Stocks 97.5%† | |
Aerospace & Defense 4.8% | |
Boeing Co. (The) | | | 147,319 | | | $ | 20,982,645 | |
Northrop Grumman Corp. | | | 28,313 | | | | 6,483,677 | |
Orbital ATK, Inc. | | | 34,400 | | | | 2,557,984 | |
Raytheon Co. | | | 117,235 | | | | 16,015,474 | |
Safran S.A. | | | 66,070 | | | | 4,542,451 | |
United Technologies Corp. | | | 154,340 | | | | 15,773,548 | |
| | | | | | | | |
| | | | | | | 66,355,779 | |
| | | | | | | | |
Airlines 0.5% | |
Delta Air Lines, Inc. | | | 116,300 | | | | 4,857,851 | |
Ryanair Holdings PLC, Sponsored ADR (a) | | | 31,300 | | | | 2,350,317 | |
| | | | | | | | |
| | | | | | | 7,208,168 | |
| | | | | | | | |
Auto Components 0.1% | |
Adient PLC (a) | | | 30,017 | | | | 1,366,074 | |
| | | | | | | | |
|
Banks 6.9% | |
Bank of America Corp. | | | 650,219 | | | | 10,728,614 | |
Citigroup, Inc. | | | 296,405 | | | | 14,568,306 | |
ICICI Bank, Ltd., Sponsored ADR | | | 456,340 | | | | 3,783,059 | |
JPMorgan Chase & Co. | | | 124,092 | | | | 8,594,612 | |
M&T Bank Corp. | | | 133,850 | | | | 16,427,410 | |
Royal Bank of Scotland Group PLC (a) | | | 2,826,710 | | | | 6,542,661 | |
U.S. Bancorp | | | 201,712 | | | | 9,028,629 | |
¨Wells Fargo & Co. | | | 534,115 | | | | 24,574,631 | |
| | | | | | | | |
| | | | | | | 94,247,922 | |
| | | | | | | | |
Beverages 1.9% | |
Coca-Cola Co. (The) | | | 157,135 | | | | 6,662,524 | |
PepsiCo., Inc. | | | 129,466 | | | | 13,878,755 | |
Pernod Ricard S.A. | | | 50,490 | | | | 6,005,343 | |
| | | | | | | | |
| | | | | | | 26,546,622 | |
| | | | | | | | |
Biotechnology 1.4% | |
AbbVie, Inc. | | | 179,543 | | | | 10,014,909 | |
Celgene Corp. (a) | | | 89,400 | | | | 9,134,892 | |
| | | | | | | | |
| | | | | | | 19,149,801 | |
| | | | | | | | |
Building Products 0.9% | |
Johnson Controls International PLC | | | 300,183 | | | | 12,103,379 | |
| | | | | | | | |
|
Capital Markets 3.9% | |
Bank of New York Mellon Corp. (The) | | | 81,900 | | | | 3,543,813 | |
Goldman Sachs Group, Inc. (The) | | | 34,024 | | | | 6,064,438 | |
Intercontinental Exchange, Inc. | | | 64,350 | | | | 17,399,597 | |
Julius Baer Group, Ltd. (a) | | | 212,310 | | | | 8,605,683 | |
Morgan Stanley | | | 121,790 | | | | 4,088,490 | |
State Street Corp. | | | 202,544 | | | | 14,220,614 | |
| | | | | | | | |
| | | | | | | 53,922,635 | |
| | | | | | | | |
| | | | | | | | |
| | |
| | | Shares | | | Value | |
Chemicals 3.2% | |
AdvanSix, Inc. (a) | | | 2,458 | | | $ | 39,230 | |
Akzo Nobel N.V. | | | 100,358 | | | | 6,486,693 | |
E.I. du Pont de Nemours & Co. | | | 248,968 | | | | 17,126,509 | |
Koninklijke DSM N.V. | | | 82,997 | | | | 5,337,222 | |
Monsanto Co. | | | 91,462 | | | | 9,216,626 | |
PPG Industries, Inc. | | | 65,140 | | | | 6,066,488 | |
| | | | | | | | |
| | | | | | | 44,272,768 | |
| | | | | | | | |
Commercial Services & Supplies 0.2% | |
Covanta Holding Corp. | | | 180,600 | | | | 2,709,000 | |
| | | | | | | | |
|
Communications Equipment 0.0%‡ | |
Infinera Corp. (a) | | | 46,800 | | | | 365,040 | |
| | | | | | | | |
|
Construction & Engineering 0.2% | |
Jacobs Engineering Group, Inc. (a) | | | 52,982 | | | | 2,732,812 | |
| | | | | | | | |
|
Construction Materials 0.7% | |
LafargeHolcim, Ltd. Registered (a) | | | 186,765 | | | | 9,974,767 | |
| | | | | | | | |
|
Consumer Finance 3.4% | |
Ally Financial, Inc. | | | 361,300 | | | | 6,528,691 | |
¨American Express Co. | | | 509,769 | | | | 33,858,857 | |
Discover Financial Services | | | 99,344 | | | | 5,596,047 | |
| | | | | | | | |
| | | | | | | 45,983,595 | |
| | | | | | | | |
Diversified Financial Services 0.3% | |
Berkshire Hathaway, Inc. Class B (a) | | | 29,979 | | | | 4,325,970 | |
| | | | | | | | |
|
Diversified Telecommunication Services 0.9% | |
AT&T, Inc. | | | 111,592 | | | | 4,105,470 | |
Nippon Telegraph & Telephone Corp. | | | 129,860 | | | | 5,770,455 | |
Verizon Communications, Inc. | | | 54,806 | | | | 2,636,168 | |
| | | | | | | | |
| | | | | | | 12,512,093 | |
| | | | | | | | |
Electrical Equipment 0.9% | |
Rockwell Automation, Inc. | | | 59,397 | | | | 7,111,009 | |
Sensata Technologies Holding N.V. (a) | | | 125,110 | | | | 4,470,180 | |
| | | | | | | | |
| | | | | | | 11,581,189 | |
| | | | | | | | |
Electronic Equipment, Instruments & Components 0.7% | |
Corning, Inc. | | | 73,600 | | | | 1,671,456 | |
TE Connectivity, Ltd. | | | 125,074 | | | | 7,863,402 | |
| | | | | | | | |
| | | | | | | 9,534,858 | |
| | | | | | | | |
Energy Equipment & Services 0.4% | |
Schlumberger, Ltd. | | | 73,045 | | | | 5,714,310 | |
| | | | | | | | |
| † | Percentages indicated are based on Fund net assets. |
| ¨ | | Among the Fund’s 10 largest holdings, as of October 31, 2016, excluding short-term investment. May be subject to change daily. (Unaudited) |
| | | | |
| 12 | | MainStay MAP Fund | | The notes to the financial statements are an integral part of,
and should be read in conjunction with, the financial statements. |
| | | | | | | | |
| | |
| | | Shares | | | Value | |
| Common Stocks (continued) | |
Food & Staples Retailing 3.2% | |
¨CVS Health Corp. | | | 315,318 | | | $ | 26,518,244 | |
Wal-Mart Stores, Inc. | | | 65,215 | | | | 4,566,354 | |
Walgreens Boots Alliance, Inc. | | | 153,255 | | | | 12,678,786 | |
| | | | | | | | |
| | | | | | | 43,763,384 | |
| | | | | | | | |
Food Products 0.6% | |
Danone S.A. | | | 70,770 | | | | 4,900,546 | |
Mondelez International, Inc. Class A | | | 68,200 | | | | 3,064,908 | |
| | | | | | | | |
| | | | | | | 7,965,454 | |
| | | | | | | | |
Health Care Equipment & Supplies 3.7% | |
Abbott Laboratories | | | 581,607 | | | | 22,822,259 | |
Baxter International, Inc. | | | 38,250 | | | | 1,820,317 | |
LivaNova PLC (a) | | | 75,560 | | | | 4,282,741 | |
Medtronic PLC | | | 268,820 | | | | 22,048,616 | |
| | | | | | | | |
| | | | | | | 50,973,933 | |
| | | | | | | | |
Health Care Providers & Services 3.4% | |
Aetna, Inc. | | | 224,681 | | | | 24,119,506 | |
Laboratory Corporation of America Holdings (a) | | | 90,730 | | | | 11,372,098 | |
McKesson Corp. | | | 89,100 | | | | 11,330,847 | |
| | | | | | | | |
| | | | | | | 46,822,451 | |
| | | | | | | | |
Hotels, Restaurants & Leisure 0.6% | |
ILG, Inc. | | | 33,902 | | | | 555,315 | |
Marriott International, Inc. Class A | | | 62,936 | | | | 4,323,703 | |
McDonald’s Corp. | | | 29,151 | | | | 3,281,528 | |
| | | | | | | | |
| | | | | | | 8,160,546 | |
| | | | | | | | |
Household Durables 1.0% | |
Newell Brands, Inc. | | | 74,160 | | | | 3,561,163 | |
Whirlpool Corp. | | | 64,440 | | | | 9,654,401 | |
| | | | | | | | |
| | | | | | | 13,215,564 | |
| | | | | | | | |
Household Products 0.2% | |
Procter & Gamble Co. (The) | | | 33,856 | | | | 2,938,701 | |
| | | | | | | | |
|
Industrial Conglomerates 2.9% | |
3M Co. | | | 17,596 | | | | 2,908,619 | |
CK Hutchison Holdings, Ltd. | | | 683,770 | | | | 8,459,456 | |
General Electric Co. | | | 182,300 | | | | 5,304,930 | |
Honeywell International, Inc. | | | 211,220 | | | | 23,166,609 | |
| | | | | | | | |
| | | | | | | 39,839,614 | |
| | | | | | | | |
Insurance 3.8% | |
American International Group, Inc. | | | 118,873 | | | | 7,334,464 | |
Chubb, Ltd. | | | 81,587 | | | | 10,361,549 | |
Fairfax Financial Holdings, Ltd. | | | 9,380 | | | | 4,803,990 | |
Industrial Alliance Insurance & Financial Services, Inc. | | | 99,980 | | | | 3,871,588 | |
MetLife, Inc. | | | 123,166 | | | | 5,783,875 | |
Travelers Cos., Inc. (The) | | | 141,198 | | | | 15,274,800 | |
W.R. Berkley Corp. | | | 76,123 | | | | 4,346,623 | |
| | | | | | | | |
| | | | | | | 51,776,889 | |
| | | | | | | | |
| | | | | | | | |
| | |
| | | Shares | | | Value | |
Internet & Catalog Retail 0.7% | |
Liberty Interactive Corp. QVC Group Class A (a) | | | 377,244 | | | $ | 6,975,241 | |
Liberty TripAdvisor Holdings, Inc. Class A (a) | | | 44,715 | | | | 992,673 | |
Liberty Ventures (a) | | | 50,701 | | | | 2,022,970 | |
| | | | | | | | |
| | | | | | | 9,990,884 | |
| | | | | | | | |
Internet Software & Services 4.5% | |
Alibaba Group Holding, Ltd., Sponsored ADR (a) | | | 10,363 | | | | 1,053,813 | |
¨Alphabet, Inc. | | | | | | | | |
Class A (a) | | | 13,250 | | | | 10,731,175 | |
Class C (a) | | | 43,731 | | | | 34,308,719 | |
Baidu, Inc., Sponsored ADR (a) | | | 31,400 | | | | 5,553,404 | |
CommerceHub, Inc. (Internet Software & Services) (a) | | | 15,210 | | | | 228,758 | |
eBay, Inc. (a) | | | 175,556 | | | | 5,005,102 | |
VeriSign, Inc. (a) | | | 61,385 | | | | 5,157,568 | |
| | | | | | | | |
| | | | | | | 62,038,539 | |
| | | | | | | | |
IT Services 2.5% | |
Automatic Data Processing, Inc. | | | 142,748 | | | | 12,427,641 | |
International Business Machines Corp. | | | 59,864 | | | | 9,200,498 | |
PayPal Holdings, Inc. (a) | | | 304,081 | | | | 12,668,014 | |
| | | | | | | | |
| | | | | | | 34,296,153 | |
| | | | | | | | |
Machinery 0.3% | |
Caterpillar, Inc. | | | 50,255 | | | | 4,194,282 | |
| | | | | | | | |
|
Media 12.0% | |
¨Comcast Corp. Class A | | | 391,943 | | | | 24,229,916 | |
DISH Network Corp. Class A (a) | | | 272,350 | | | | 15,948,816 | |
Grupo Televisa S.A.B., Sponsored ADR | | | 369,420 | | | | 9,061,873 | |
Liberty Braves Group | | | | | | | | |
Class A (a) | | | 21,459 | | | | 363,730 | |
Class C (a) | | | 56,850 | | | | 947,689 | |
Liberty Broadband Corp. | | | | | | | | |
Class A (a) | | | 23,879 | | | | 1,550,941 | |
Class C (a) | | | 122,898 | | | | 8,191,152 | |
Liberty Global PLC LiLAC Class A (a) | | | 73,549 | | | | 2,032,894 | |
Liberty Media Group | | | | | | | | |
Class A (a) | | | 53,649 | | | | 1,493,052 | |
Class C (a) | | | 142,126 | | | | 3,895,674 | |
¨Liberty SiriusXM Group. | | | | | | | | |
Class A (a) | | | 214,597 | | | | 7,139,642 | |
Class C (a) | | | 568,506 | | | | 18,868,714 | |
Madison Square Garden Co. (The) Class A (a) | | | 56,943 | | | | 9,423,497 | |
MSG Networks, Inc. Class A (a) | | | 188,843 | | | | 3,606,901 | |
NOS SGPS S.A. | | | 550,070 | | | | 3,654,437 | |
Omnicom Group, Inc. | | | 76,930 | | | | 6,140,553 | |
Starz Class A (a) | | | 81,377 | | | | 2,560,120 | |
Time Warner, Inc. | | | 155,140 | | | | 13,805,909 | |
¨Twenty-First Century Fox, Inc. | | | | | | | | |
Class A | | | 717,880 | | | | 18,858,708 | |
Class B | | | 266,350 | | | | 7,028,976 | |
| | | | | | |
The notes to the financial statements are an integral part of,
and should be read in conjunction with, the financial statements. | | | | | 13 | |
Portfolio of Investments October 31, 2016 (continued)
| | | | | | | | |
| | |
| | | Shares | | | Value | |
| Common Stocks (continued) | |
Media (continued) | |
Walt Disney Co. (The) | | | 69,000 | | | $ | 6,395,610 | |
| | | | | | | | |
| | | | | | | 165,198,804 | |
| | | | | | | | |
Oil, Gas & Consumable Fuels 5.3% | |
Anadarko Petroleum Corp. | | | 61,013 | | | | 3,626,613 | |
Apache Corp. | | | 73,813 | | | | 4,390,397 | |
ConocoPhillips | | | 99,606 | | | | 4,327,881 | |
Devon Energy Corp. | | | 56,260 | | | | 2,131,691 | |
EOG Resources, Inc. | | | 57,112 | | | | 5,164,067 | |
Hess Corp. | | | 70,555 | | | | 3,384,523 | |
Marathon Oil Corp. | | | 56,914 | | | | 750,127 | |
Marathon Petroleum Corp. | | | 267,865 | | | | 11,676,235 | |
Phillips 66 | | | 46,378 | | | | 3,763,575 | |
Royal Dutch Shell PLC Class A,
Sponsored ADR | | | 251,646 | | | | 12,534,487 | |
Royal Dutch Shell PLC Class A | | | 145,346 | | | | 3,626,565 | |
Spectra Energy Corp. | | | 206,876 | | | | 8,649,486 | |
Total S.A. | | | 125,250 | | | | 6,011,204 | |
Williams Cos., Inc. (The) | | | 98,546 | | | | 2,877,543 | |
| | | | | | | | |
| | | | | | | 72,914,394 | |
| | | | | | | | |
Pharmaceuticals 3.6% | |
¨Allergan PLC (a) | | | 112,755 | | | | 23,559,030 | |
Johnson & Johnson | | | 73,450 | | | | 8,519,465 | |
Merck & Co., Inc. | | | 94,390 | | | | 5,542,581 | |
Novartis A.G. Registered | | | 94,000 | | | | 6,687,484 | |
Pfizer, Inc. | | | 135,114 | | | | 4,284,465 | |
Teva Pharmaceutical Industries, Ltd., Sponsored ADR | | | 27,249 | | | | 1,164,622 | |
| | | | | | | | |
| | | | | | | 49,757,647 | |
| | | | | | | | |
Real Estate Investment Trusts 2.1% | |
American Tower Corp. | | | 90,430 | | | | 10,597,492 | |
HCP, Inc. | | | 207,941 | | | | 7,121,979 | |
UDR, Inc. | | | 286,224 | | | | 10,009,253 | |
Weyerhaeuser Co. | | | 42,800 | | | | 1,281,004 | |
| | | | | | | | |
| | | | | | | 29,009,728 | |
| | | | | | | | |
Real Estate Management & Development 0.5% | |
Mitsubishi Estate Co., Ltd. | | | 352,550 | | | | 6,997,548 | |
| | | | | | | | |
|
Road & Rail 1.5% | |
CSX Corp. | | | 216,125 | | | | 6,593,974 | |
Union Pacific Corp. | | | 163,505 | | | | 14,417,871 | |
| | | | | | | | |
| | | | | | | 21,011,845 | |
| | | | | | | | |
Semiconductors & Semiconductor Equipment 2.1% | |
ASML Holding N.V. | | | 46,050 | | | | 4,878,210 | |
Intel Corp. | | | 565,571 | | | | 19,721,461 | |
Texas Instruments, Inc. | | | 52,440 | | | | 3,715,374 | |
| | | | | | | | |
| | | | | | | 28,315,045 | |
| | | | | | | | |
| | | | | | | | |
| | |
| | | Shares | | | Value | |
Software 4.0% | |
Microsoft Corp. | | | 389,115 | | | $ | 23,315,771 | |
¨Oracle Corp. | | | 800,662 | | | | 30,761,434 | |
| | | | | | | | |
| | | | | | | 54,077,205 | |
| | | | | | | | |
Specialty Retail 1.8% | |
Home Depot, Inc. (The) | | | 71,258 | | | | 8,694,189 | |
Lowe’s Cos., Inc. | | | 227,822 | | | | 15,184,336 | |
| | | | | | | | |
| | | | | | | 23,878,525 | |
| | | | | | | | |
Technology Hardware, Storage & Peripherals 5.2% | |
¨Apple, Inc. | | | 543,169 | | | | 61,671,408 | |
Samsung Electronics Co., Ltd., GDR | | | 13,990 | | | | 9,869,945 | |
| | | | | | | | |
| | | | | | | 71,541,353 | |
| | | | | | | | |
Tobacco 0.3% | |
Philip Morris International, Inc. | | | 47,159 | | | | 4,548,014 | |
| | | | | | | | |
|
Wireless Telecommunication Services 0.4% | |
Vodafone Group PLC, Sponsored ADR | | | 181,638 | | | | 5,056,802 | |
| | | | | | | | |
Total Common Stocks
(Cost $1,029,884,782) | | | | | | | 1,338,890,086 | |
| | | | | | | | |
|
| Convertible Preferred Stock 0.1% | |
Pharmaceuticals 0.1% | |
¨Allergan PLC 5.50% Series A | | | 1,875 | | | | 1,441,875 | |
| | | | | | | | |
Total Convertible Preferred Stock
(Cost $1,482,182) | | | | | | | 1,441,875 | |
| | | | | | | | |
| | |
| | | | | | | | |
| | | Principal
Amount | | | | |
| Short-Term Investment 2.7% | |
Repurchase Agreement 2.7% | |
Fixed Income Clearing Corp.
0.03%, dated 10/31/16
due 11/1/16
Proceeds at Maturity $36,952,724 (Collateralized by United States Treasury and Government Agency securities with rates between 1.00% and 1.25% and maturity dates between 10/2/19 and 10/15/19, with a Principal Amount of $37,690,000 and a Market Value of $37,701,217) | | $ | 36,952,693 | | | | 36,952,693 | |
| | | | | | | | |
Total Short-Term Investment
(Cost $36,952,693) | | | | | | | 36,952,693 | |
| | | | | | | | |
Total Investments
(Cost $1,068,319,657) (b) | | | 100.3 | % | | | 1,377,284,654 | |
Other Assets, Less Liabilities | | | (0.3 | ) | | | (4,116,453 | ) |
Net Assets | | | 100.0 | % | | $ | 1,373,168,201 | |
| | | | |
| 14 | | MainStay MAP Fund | | The notes to the financial statements are an integral part of,
and should be read in conjunction with, the financial statements. |
| ‡ | Less than one-tenth of a percent. |
| (a) | Non-income producing security. |
| (b) | As of October 31, 2016, cost was $1,082,046,614 for federal income tax purposes and net unrealized appreciation was as follows: |
| | | | |
Gross unrealized appreciation | | $ | 354,076,380 | |
Gross unrealized depreciation | | | (58,838,340 | ) |
| | | | |
Net unrealized appreciation | | $ | 295,238,040 | |
| | | | |
The following abbreviations are used in the preceding pages:
ADR—American Depositary Receipt
GDR—Global Depositary Receipt
The following is a summary of the fair valuations according to the inputs used as of October 31, 2016, for valuing the Fund’s assets.
Asset Valuation Inputs
| | | | | | | | | | | | | | | | |
Description | | Quoted Prices in Active Markets for Identical Assets (Level 1) | | | Significant
Other
Observable
Inputs (Level 2) | | | Significant
Unobservable
Inputs (Level 3) | | | Total | |
| Investments in Securities (a) | | | | | | | | | | | | | | | | |
| Common Stocks | | $ | 1,338,890,086 | | | $ | — | | | $ | — | | | $ | 1,338,890,086 | |
| Convertible Preferred Stocks | | | 1,441,875 | | | | — | | | | — | | | | 1,441,875 | |
| Short-Term Investment | | | | | | | | | | | | | | | | |
Repurchase Agreement | | | — | | | | 36,952,693 | | | | — | | | | 36,952,693 | |
| | | | | | | | | | | | | | | | |
| Total Investments in Securities | | $ | 1,340,331,961 | | | $ | 36,952,693 | | | $ | — | | | $ | 1,377,284,654 | |
| | | | | | | | | | | | | | | | |
| (a) | For a complete listing of investments and their industries, see the Portfolio of Investments. |
The Fund recognizes transfers between the levels as of the beginning of the period.
For the year ended October 31, 2016, the Fund did not have any transfers between Level 1 and Level 2 fair value measurements. (See Note 2)
As of October 31, 2016, the Fund did not hold any investments with significant unobservable inputs (Level 3). (See Note 2)
| | | | | | |
The notes to the financial statements are an integral part of,
and should be read in conjunction with, the financial statements. | | | | | 15 | |
Statement of Assets and Liabilities as of October 31, 2016
| | | | |
| Assets | |
Investment in securities, at value
(identified cost $1,068,319,657) | | $ | 1,377,284,654 | |
Cash denominated in foreign currencies
(identified cost $7,935) | | | 7,923 | |
Cash | | | 102 | |
Due from custodian | | | 38,362 | |
Receivables: | | | | |
Investment securities sold | | | 9,592,187 | |
Dividends and interest | | | 1,604,053 | |
Fund shares sold | | | 444,708 | |
Other assets | | | 35,860 | |
| | | | |
Total assets | | | 1,389,007,849 | |
| | | | |
| |
| Liabilities | | | | |
Payables: | | | | |
Investment securities purchased | | | 12,744,406 | |
Fund shares redeemed | | | 1,651,864 | |
Manager (See Note 3) | | | 890,764 | |
Transfer agent (See Note 3) | | | 250,068 | |
NYLIFE Distributors (See Note 3) | | | 208,493 | |
Shareholder communication | | | 40,720 | |
Professional fees | | | 23,433 | |
Custodian | | | 20,547 | |
Trustees | | | 4,104 | |
Accrued expenses | | | 5,249 | |
| | | | |
Total liabilities | | | 15,839,648 | |
| | | | |
Net assets | | $ | 1,373,168,201 | |
| | | | |
| |
| Composition of Net Assets | | | | |
Shares of beneficial interest outstanding (par value of $.01 per share) unlimited number of shares authorized | | $ | 380,292 | |
Additional paid-in capital | | | 1,048,507,312 | |
| | | | |
| | | 1,048,887,604 | |
Undistributed net investment income | | | 13,809,474 | |
Accumulated net realized gain (loss) on investments and foreign currency transactions | | | 1,516,181 | |
Net unrealized appreciation (depreciation) on investments | | | 308,964,997 | |
Net unrealized appreciation (depreciation) on translation of other assets and liabilities in foreign currencies | | | (10,055 | ) |
| | | | |
Net assets | | $ | 1,373,168,201 | |
| | | | |
| | | | |
Class A | | | | |
Net assets applicable to outstanding shares | | $ | 285,430,574 | |
| | | | |
Shares of beneficial interest outstanding | | | 7,946,635 | |
| | | | |
Net asset value per share outstanding | | $ | 35.92 | |
Maximum sales charge (5.50% of offering price) | | | 2.09 | |
| | | | |
Maximum offering price per share outstanding | | $ | 38.01 | |
| | | | |
Investor Class | | | | |
Net assets applicable to outstanding shares | | $ | 139,774,717 | |
| | | | |
Shares of beneficial interest outstanding | | | 3,898,368 | |
| | | | |
Net asset value per share outstanding | | $ | 35.85 | |
Maximum sales charge (5.50% of offering price) | | | 2.09 | |
| | | | |
Maximum offering price per share outstanding | | $ | 37.94 | |
| | | | |
Class B | | | | |
Net assets applicable to outstanding shares | | $ | 40,977,456 | |
| | | | |
Shares of beneficial interest outstanding | | | 1,263,935 | |
| | | | |
Net asset value and offering price per share outstanding | | $ | 32.42 | |
| | | | |
Class C | |
Net assets applicable to outstanding shares | | $ | 92,457,115 | |
| | | | |
Shares of beneficial interest outstanding | | | 2,851,790 | |
| | | | |
Net asset value and offering price per share outstanding | | $ | 32.42 | |
| | | | |
Class I | | | | |
Net assets applicable to outstanding shares | | $ | 807,693,897 | |
| | | | |
Shares of beneficial interest outstanding | | | 21,879,032 | |
| | | | |
Net asset value and offering price per share outstanding | | $ | 36.92 | |
| | | | |
Class R1 | | | | |
Net assets applicable to outstanding shares | | $ | 2,499,835 | |
| | | | |
Shares of beneficial interest outstanding | | | 69,131 | |
| | | | |
Net asset value and offering price per share outstanding | | $ | 36.16 | |
| | | | |
Class R2 | | | | |
Net assets applicable to outstanding shares | | $ | 3,528,408 | |
| | | | |
Shares of beneficial interest outstanding | | | 97,877 | |
| | | | |
Net asset value and offering price per share outstanding | | $ | 36.05 | |
| | | | |
Class R3 | | | | |
Net assets applicable to outstanding shares | | $ | 806,199 | |
| | | | |
Shares of beneficial interest outstanding | | | 22,478 | |
| | | | |
Net asset value and offering price per share outstanding | | $ | 35.87 | |
| | | | |
| | | | |
| 16 | | MainStay MAP Fund | | The notes to the financial statements are an integral part of,
and should be read in conjunction with, the financial statements. |
Statement of Operations for the year ended October 31, 2016
| | | | |
| Investment Income (Loss) | |
Income | | | | |
Dividends (a) | | $ | 30,612,625 | |
Interest | | | 10,241 | |
| | | | |
Total income | | | 30,622,866 | |
| | | | |
Expenses | | | | |
Manager (See Note 3) | | | 11,335,661 | |
Distribution/Service—Class A (See Note 3) | | | 750,614 | |
Distribution/Service—Investor Class (See Note 3) | | | 356,337 | |
Distribution/Service—Class B (See Note 3) | | | 460,307 | |
Distribution/Service—Class C (See Note 3) | | | 1,052,323 | |
Distribution/Service—Class R2 (See Note 3) | | | 14,746 | |
Distribution/Service—Class R3 (See Note 3) | | | 4,630 | |
Transfer agent (See Note 3) | | | 1,590,023 | |
Professional fees | | | 138,727 | |
Shareholder communication | | | 107,981 | |
Registration | | | 103,091 | |
Custodian | | | 63,076 | |
Trustees | | | 39,487 | |
Shareholder service (See Note 3) | | | 9,609 | |
Interest expense (See Note 6) | | | 3,372 | |
Miscellaneous | | | 67,667 | |
| | | | |
Total expenses | | | 16,097,651 | |
Reimbursement from custodian (b) | | | (44,594 | ) |
| | | | |
Net expenses | | | 16,053,057 | |
| | | | |
Net investment income (loss) | | | 14,569,809 | |
| | | | |
|
| Realized and Unrealized Gain (Loss) on Investments and Foreign Currency Transactions | |
Net realized gain (loss) on: | | | | |
Investment transactions | | | 13,286,226 | |
Foreign currency transactions | | | (57,245 | ) |
| | | | |
Net realized gain (loss) on investments and foreign currency transactions | | | 13,228,981 | |
| | | | |
Net change in unrealized appreciation (depreciation) on: | | | | |
Investments | | | (53,855,517 | ) |
Translation of other assets and liabilities in foreign currencies | | | 15,869 | |
| | | | |
Net change in unrealized appreciation (depreciation) on investments and foreign currency transactions | | | (53,839,648 | ) |
| | | | |
Net realized and unrealized gain (loss) on investments and foreign currency transactions | | | (40,610,667 | ) |
| | | | |
Net increase (decrease) in net assets resulting from operations | | $ | (26,040,858 | ) |
| | | | |
| (a) | Dividends recorded net of foreign withholding taxes in the amount of $409,990. |
| (b) | Reimbursement from custodian represents a refund for overbilling of prior years’ custody out-of-pocket fees. |
| | | | | | |
The notes to the financial statements are an integral part of,
and should be read in conjunction with, the financial statements. | | | | | 17 | |
Statements of Changes in Net Assets
for the years ended October 31, 2016 and October 31, 2015
| | | | | | | | |
| | | 2016 | | | 2015 | |
| Increase (Decrease) in Net Assets | |
Operations: | | | | | | | | |
Net investment income (loss) | | $ | 14,569,809 | | | $ | 19,186,634 | |
Net realized gain (loss) on investments and foreign currency transactions | | | 13,228,981 | | | | 314,552,795 | |
Net change in unrealized appreciation (depreciation) on investments and foreign currency transactions | | | (53,839,648 | ) | | | (294,096,738 | ) |
| | | | |
Net increase (decrease) in net assets resulting from operations | | | (26,040,858 | ) | | | 39,642,691 | |
| | | | |
Dividends and distributions to shareholders: | | | | | | | | |
From net investment income: | | | | | | | | |
Class A | | | (3,061,205 | ) | | | (5,197,213 | ) |
Investor Class | | | (1,189,702 | ) | | | (1,972,392 | ) |
Class B | | | (17,692 | ) | | | (450,841 | ) |
Class C | | | (46,546 | ) | | | (903,543 | ) |
Class I | | | (12,582,733 | ) | | | (24,145,735 | ) |
Class R1 | | | (38,388 | ) | | | (56,485 | ) |
Class R2 | | | (79,075 | ) | | | (200,863 | ) |
Class R3 | | | (5,958 | ) | | | (14,757 | ) |
| | | | |
| | | (17,021,299 | ) | | | (32,941,829 | ) |
| | | | |
From net realized gain on investments: | | | | | | | | |
Class A | | | (51,337,913 | ) | | | (28,567,209 | ) |
Investor Class | | | (23,271,135 | ) | | | (11,968,176 | ) |
Class B | | | (9,123,617 | ) | | | (6,073,597 | ) |
Class C | | | (20,855,020 | ) | | | (12,124,005 | ) |
Class I | | | (164,507,595 | ) | | | (113,212,950 | ) |
Class R1 | | | (559,032 | ) | | | (285,824 | ) |
Class R2 | | | (1,526,398 | ) | | | (1,208,532 | ) |
Class R3 | | | (175,776 | ) | | | (111,793 | ) |
| | | | |
| | | (271,356,486 | ) | | | (173,552,086 | ) |
| | | | |
Total dividends and distributions to shareholders | | | (288,377,785 | ) | | | (206,493,915 | ) |
| | | | |
Capital share transactions: | | | | | | | | |
Net proceeds from sale of shares | | | 109,406,231 | | | | 177,192,328 | |
Net asset value of shares issued to shareholders in reinvestment of dividends and distributions | | | 280,617,480 | | | | 201,308,974 | |
Cost of shares redeemed | | | (505,441,284 | ) | | | (670,919,606 | ) |
| | | | |
Increase (decrease) in net assets derived from capital share transactions | | | (115,417,573 | ) | | | (292,418,304 | ) |
| | | | |
Net increase (decrease) in net assets | | | (429,836,216 | ) | | | (459,269,528 | ) |
| | | | | | | | |
| | | 2016 | | | 2015 | |
| Net Assets | |
Beginning of year | | $ | 1,803,004,417 | | | $ | 2,262,273,945 | |
| | | | |
End of year | | $ | 1,373,168,201 | | | $ | 1,803,004,417 | |
| | | | |
Undistributed net investment income at end of year | | $ | 13,809,474 | | | $ | 17,020,980 | |
| | | | |
| | | | |
| 18 | | MainStay MAP Fund | | The notes to the financial statements are an integral part of,
and should be read in conjunction with, the financial statements. |
Financial Highlights selected per share data and ratios
| | | | | | | | | | | | | | | | | | | | |
| | | Year ended October 31, | |
| Class A | | 2016 | | | 2015 | | | 2014 | | | 2013 | | | 2012 | |
Net asset value at beginning of year | | $ | 43.32 | | | $ | 46.81 | | | $ | 43.28 | | | $ | 34.07 | | | $ | 30.47 | |
| | | | | | | | | | | | | | | | | | | | |
Net investment income (loss) (a) | | | 0.33 | | | | 0.38 | | | | 0.67 | | | | 0.41 | | | | 0.40 | |
Net realized and unrealized gain (loss) on investments | | | (0.63 | ) | | | 0.50 | | | | 4.21 | | | | 9.19 | | | | 3.56 | |
Net realized and unrealized gain (loss) on foreign currency transactions ‡ | | | (0.00 | ) | | | (0.00 | ) | | | (0.00 | ) | | | (0.00 | ) | | | (0.00 | ) |
| | | | | | | | | | | | | | | | | | | | |
Total from investment operations | | | (0.30 | ) | | | 0.88 | | | | 4.88 | | | | 9.60 | | | | 3.96 | |
| | | | | | | | | | | | | | | | | | | | |
| Less dividends and distributions: | | | | | | | | | | | | | | | | | | | | |
From net investment income | | | (0.40 | ) | | | (0.67 | ) | | | (0.45 | ) | | | (0.39 | ) | | | (0.36 | ) |
From net realized gain on investments | | | (6.70 | ) | | | (3.70 | ) | | | (0.90 | ) | | | — | | | | — | |
| | | | | | | | | | | | | | | | | | | | |
Total dividends and distributions | | | (7.10 | ) | | | (4.37 | ) | | | (1.35 | ) | | | (0.39 | ) | | | (0.36 | ) |
| | | | | | | | | | | | | | | | | | | | |
Net asset value at end of year | | $ | 35.92 | | | $ | 43.32 | | | $ | 46.81 | | | $ | 43.28 | | | $ | 34.07 | |
| | | | | | | | | | | | | | | | | | | | |
Total investment return (b) | | | (0.57 | %) | | | 1.80 | % | | | 11.55 | % | | | 28.47 | % | | | 13.14 | % |
| Ratios (to average net assets)/Supplemental Data: | | | | | | | | | | | | | | | | | | | | |
Net investment income (loss) | | | 0.92 | % | | | 0.85 | % | | | 1.49 | % | | | 1.07 | % | | | 1.24 | % |
Net expenses | | | 1.09 | % (c) | | | 1.11 | % | | | 1.11 | % | | | 1.11 | % | | | 1.14 | % |
Portfolio turnover rate | | | 42 | % | | | 51 | % | | | 32 | % | | | 29 | % | | | 40 | % |
Net assets at end of year (in 000’s) | | $ | 285,431 | | | $ | 336,812 | | | $ | 364,162 | | | $ | 356,657 | | | $ | 294,247 | |
| ‡ | Less than one cent per share. |
| (a) | Per share data based on average shares outstanding during the year. |
| (b) | Total investment return is calculated exclusive of sales charges and assumes the reinvestment of dividends and distributions. |
| (c) | Net of interest expense which is less than one-tenth of a percent. (See Note 6) |
| | | | | | | | | | | | | | | | | | | | |
| | | Year ended October 31, | |
| Investor Class | | 2016 | | | 2015 | | | 2014 | | | 2013 | | | 2012 | |
Net asset value at beginning of year | | $ | 43.27 | | | $ | 46.77 | | | $ | 43.24 | | | $ | 34.04 | | | $ | 30.44 | |
| | | | | | | | | | | | | | | | | | | | |
Net investment income (loss) (a) | | | 0.25 | | | | 0.31 | | | | 0.60 | | | | 0.34 | | | | 0.34 | |
Net realized and unrealized gain (loss) on investments | | | (0.63 | ) | | | 0.50 | | | | 4.21 | | | | 9.18 | | | | 3.55 | |
Net realized and unrealized gain (loss) on foreign currency transactions ‡ | | | (0.00 | ) | | | (0.00 | ) | | | (0.00 | ) | | | (0.00 | ) | | | (0.00 | ) |
| | | | | | | | | | | | | | | | | | | | |
Total from investment operations | | | (0.38 | ) | | | 0.81 | | | | 4.81 | | | | 9.52 | | | | 3.89 | |
| | | | | | | | | | | | | | | | | | | | |
| Less dividends and distributions: | | | | | | | | | | | | | | | | | | | | |
From net investment income | | | (0.34 | ) | | | (0.61 | ) | | | (0.38 | ) | | | (0.32 | ) | | | (0.29 | ) |
From net realized gain on investments | | | (6.70 | ) | | | (3.70 | ) | | | (0.90 | ) | | | — | | | | — | |
| | | | | | | | | | | | | | | | | | | | |
Total dividends and distributions | | | (7.04 | ) | | | (4.31 | ) | | | (1.28 | ) | | | (0.32 | ) | | | (0.29 | ) |
| | | | | | | | | | | | | | | | | | | | |
Net asset value at end of year | | $ | 35.85 | | | $ | 43.27 | | | $ | 46.77 | | | $ | 43.24 | | | $ | 34.04 | |
| | | | | | | | | | | | | | | | | | | | |
Total investment return (b) | | | (0.79 | %) | | | 1.63 | % | | | 11.38 | % | | | 28.26 | % | | | 12.88 | % |
| Ratios (to average net assets)/Supplemental Data: | | | | | | | | | | | | | | | | | | | | |
Net investment income (loss) | | | 0.71 | % | | | 0.71 | % | | | 1.34 | % | | | 0.88 | % | | | 1.04 | % |
Net expenses | | | 1.29 | % (c) | | | 1.25 | % | | | 1.26 | % | | | 1.30 | % | | | 1.34 | % |
Portfolio turnover rate | | | 42 | % | | | 51 | % | | | 32 | % | | | 29 | % | | | 40 | % |
Net assets at end of year (in 000’s) | | $ | 139,775 | | | $ | 151,582 | | | $ | 152,202 | | | $ | 144,892 | | | $ | 120,771 | |
| ‡ | Less than one cent per share. |
| (a) | Per share data based on average shares outstanding during the year. |
| (b) | Total investment return is calculated exclusive of sales charges and assumes the reinvestment of dividends and distributions. |
| (c) | Net of interest expense which is less than one-tenth of a percent. (See Note 6) |
| | | | | | |
The notes to the financial statements are an integral part of,
and should be read in conjunction with, the financial statements. | | | | | 19 | |
Financial Highlights selected per share data and ratios
| | | | | | | | | | | | | | | | | | | | |
| | | Year ended October 31, | |
| Class B | | 2016 | | | 2015 | | | 2014 | | | 2013 | | | 2012 | |
Net asset value at beginning of year | | $ | 39.74 | | | $ | 43.25 | | | $ | 40.08 | | | $ | 31.55 | | | $ | 28.21 | |
| | | | | | | | | | | | | | | | | | | | |
Net investment income (loss) (a) | | | (0.01 | ) | | | (0.01 | ) | | | 0.26 | | | | 0.06 | | | | 0.10 | |
Net realized and unrealized gain (loss) on investments | | | (0.60 | ) | | | 0.48 | | | | 3.89 | | | | 8.54 | | | | 3.29 | |
Net realized and unrealized gain (loss) on foreign currency transactions ‡ | | | (0.00 | ) | | | (0.00 | ) | | | (0.00 | ) | | | (0.00 | ) | | | (0.00 | ) |
| | | | | | | | | | | | | | | | | | | | |
Total from investment operations | | | (0.61 | ) | | | 0.47 | | | | 4.15 | | | | 8.60 | | | | 3.39 | |
| | | | | | | | | | | | | | | | | | | | |
| Less dividends and distributions: | | | | | | | | | | | | | | | | | | | | |
From net investment income | | | (0.01 | ) | | | (0.28 | ) | | | (0.08 | ) | | | (0.07 | ) | | | (0.05 | ) |
From net realized gain on investments | | | (6.70 | ) | | | (3.70 | ) | | | (0.90 | ) | | | — | | | | — | |
| | | | | | | | | | | | | | | | | | | | |
Total dividends and distributions | | | (6.71 | ) | | | (3.98 | ) | | | (0.98 | ) | | | (0.07 | ) | | | (0.05 | ) |
| | | | | | | | | | | | | | | | | | | | |
Net asset value at end of year | | $ | 32.42 | | | $ | 39.74 | | | $ | 43.25 | | | $ | 40.08 | | | $ | 31.55 | |
| | | | | | | | | | | | | | | | | | | | |
Total investment return (b) | | | (1.52 | %) | | | 0.89 | % | | | 10.55 | % | | | 27.30 | % | | | 12.04 | % |
| Ratios (to average net assets)/Supplemental Data: | | | | | | | | | | | | | | | | | | | | |
Net investment income (loss) | | | (0.03 | %) | | | (0.03 | %) | | | 0.63 | % | | | 0.16 | % | | | 0.33 | % |
Net expenses | | | 2.04 | % (c) | | | 2.00 | % | | | 2.01 | % | | | 2.05 | % | | | 2.09 | % |
Portfolio turnover rate | | | 42 | % | | | 51 | % | | | 32 | % | | | 29 | % | | | 40 | % |
Net assets at end of year (in 000’s) | | $ | 40,977 | | | $ | 54,423 | | | $ | 71,195 | | | $ | 82,695 | | | $ | 86,613 | |
| ‡ | Less than one cent per share. |
| (a) | Per share data based on average shares outstanding during the year. |
| (b) | Total investment return is calculated exclusive of sales charges and assumes the reinvestment of dividends and distributions. |
| (c) | Net of interest expense which is less than one-tenth of a percent. (See Note 6) |
| | | | | | | | | | | | | | | | | | | | |
| | | Year ended October 31, | |
| Class C | | 2016 | | | 2015 | | | 2014 | | | 2013 | | | 2012 | |
Net asset value at beginning of year | | $ | 39.73 | | | $ | 43.25 | | | $ | 40.08 | | | $ | 31.56 | | | $ | 28.21 | |
| | | | | | | | | | | | | | | | | | | | |
Net investment income (loss) (a) | | | (0.01 | ) | | | (0.02 | ) | | | 0.25 | | | | 0.05 | | | | 0.09 | |
Net realized and unrealized gain (loss) on investments | | | (0.59 | ) | | | 0.48 | | | | 3.90 | | | | 8.54 | | | | 3.31 | |
Net realized and unrealized gain (loss) on foreign currency transactions ‡ | | | (0.00 | ) | | | (0.00 | ) | | | (0.00 | ) | | | (0.00 | ) | | | (0.00 | ) |
| | | | | | | | | | | | | | | | | | | | |
Total from investment operations | | | (0.60 | ) | | | 0.46 | | | | 4.15 | | | | 8.59 | | | | 3.40 | |
| | | | | | | | | | | | | | | | | | | | |
| Less dividends and distributions: | | | | | | | | | | | | | | | | | | | | |
From net investment income | | | (0.01 | ) | | | (0.28 | ) | | | (0.08 | ) | | | (0.07 | ) | | | (0.05 | ) |
From net realized gain on investments | | | (6.70 | ) | | | (3.70 | ) | | | (0.90 | ) | | | — | | | | — | |
| | | | | | | | | | | | | | | | | | | | |
Total dividends and distributions | | | (6.71 | ) | | | (3.98 | ) | | | (0.98 | ) | | | (0.07 | ) | | | (0.05 | ) |
| | | | | | | | | | | | | | | | | | | | |
Net asset value at end of year | | $ | 32.42 | | | $ | 39.73 | | | $ | 43.25 | | | $ | 40.08 | | | $ | 31.56 | |
| | | | | | | | | | | | | | | | | | | | |
Total investment return (b) | | | (1.52 | %) | | | 0.89 | % | | | 10.55 | % | | | 27.26 | % | | | 12.07 | % |
| Ratios (to average net assets)/Supplemental Data: | | | | | | | | | | | | | | | | | | | | |
Net investment income (loss) | | | (0.03 | %) | | | (0.04 | %) | | | 0.60 | % | | | 0.14 | % | | | 0.31 | % |
Net expenses | | | 2.04 | % (c) | | | 2.00 | % | | | 2.01 | % | | | 2.05 | % | | | 2.09 | % |
Portfolio turnover rate | | | 42 | % | | | 51 | % | | | 32 | % | | | 29 | % | | | 40 | % |
Net assets at end of year (in 000’s) | | $ | 92,457 | | | $ | 125,642 | | | $ | 143,427 | | | $ | 141,628 | | | $ | 125,700 | |
| ‡ | Less than one cent per share. |
| (a) | Per share data based on average shares outstanding during the year. |
| (b) | Total investment return is calculated exclusive of sales charges and assumes the reinvestment of dividends and distributions. |
| (c) | Net of interest expense which is less than one-tenth of a percent. (See Note 6) |
| | | | |
| 20 | | MainStay MAP Fund | | The notes to the financial statements are an integral part of,
and should be read in conjunction with, the financial statements. |
Financial Highlights selected per share data and ratios
| | | | | | | | | | | | | | | | | | | | |
| | | Year ended October 31, | |
| Class I | | 2016 | | | 2015 | | | 2014 | | | 2013 | | | 2012 | |
Net asset value at beginning of year | | $ | 44.35 | | | $ | 47.82 | | | $ | 44.18 | | | $ | 34.77 | | | $ | 31.10 | |
| | | | | | | | | | | | | | | | | | | | |
Net investment income (loss) (a) | | | 0.43 | | | | 0.50 | | | | 0.80 | | | | 0.52 | | | | 0.49 | |
Net realized and unrealized gain (loss) on investments | | | (0.65 | ) | | | 0.52 | | | | 4.29 | | | | 9.37 | | | | 3.62 | |
Net realized and unrealized gain (loss) on foreign currency transactions ‡ | | | (0.00 | ) | | | (0.00 | ) | | | (0.00 | ) | | | (0.00 | ) | | | (0.00 | ) |
| | | | | | | | | | | | | | | | | | | | |
Total from investment operations | | | (0.22 | ) | | | 1.02 | | | | 5.09 | | | | 9.89 | | | | 4.11 | |
| | | | | | | | | | | | | | | | | | | | |
| Less dividends and distributions: | | | | | | | | | | | | | | | | | | | | |
From net investment income | | | (0.51 | ) | | | (0.79 | ) | | | (0.55 | ) | | | (0.48 | ) | | | (0.44 | ) |
From net realized gain on investments | | | (6.70 | ) | | | (3.70 | ) | | | (0.90 | ) | | | — | | | | — | |
| | | | | | | | | | | | | | | | | | | | |
Total dividends and distributions | | | (7.21 | ) | | | (4.49 | ) | | | (1.45 | ) | | | (0.48 | ) | | | (0.44 | ) |
| | | | | | | | | | | | | | | | | | | | |
Net asset value at end of year | | $ | 36.92 | | | $ | 44.35 | | | $ | 47.82 | | | $ | 44.18 | | | $ | 34.77 | |
| | | | | | | | | | | | | | | | | | | | |
Total investment return (b) | | | (0.33 | %) | | | 2.06 | % | | | 11.82 | % | | | 28.79 | % | | | 13.40 | % |
| Ratios (to average net assets)/Supplemental Data: | | | | | | | | | | | | | | | | | | | | |
Net investment income (loss) | | | 1.17 | % | | | 1.10 | % | | | 1.76 | % | | | 1.33 | % | | | 1.48 | % |
Net expenses | | | 0.84 | % (c) | | | 0.86 | % | | | 0.86 | % | | | 0.86 | % | | | 0.89 | % |
Portfolio turnover rate | | | 42 | % | | | 51 | % | | | 32 | % | | | 29 | % | | | 40 | % |
Net assets at end of year (in 000’s) | | $ | 807,694 | | | $ | 1,119,884 | | | $ | 1,506,564 | | | $ | 1,417,814 | | | $ | 1,358,999 | |
| ‡ | Less than one cent per share. |
| (a) | Per share data based on average shares outstanding during the year. |
| (b) | Total investment return is calculated exclusive of sales charges and assumes the reinvestment of dividends and distributions. Class I shares are not subject to sales charges. |
| (c) | Net of interest expense which is less than one-tenth of a percent. (See Note 6) |
| | | | | | | | | | | | | | | | | | | | |
| | | Year ended October 31, | |
| Class R1 | | 2016 | | | 2015 | | | 2014 | | | 2013 | | | 2012 | |
Net asset value at beginning of year | | $ | 43.57 | | | $ | 47.05 | | | $ | 43.49 | | | $ | 34.23 | | | $ | 30.63 | |
| | | | | | | | | | | | | | | | | | | | |
Net investment income (loss) (a) | | | 0.38 | | | | 0.45 | | | | 0.73 | | | | 0.54 | | | | 0.44 | |
Net realized and unrealized gain (loss) on investments | | | (0.63 | ) | | | 0.50 | | | | 4.24 | | | | 9.14 | | | | 3.58 | |
Net realized and unrealized gain (loss) on foreign currency transactions ‡ | | | (0.00 | ) | | | (0.00 | ) | | | (0.00 | ) | | | (0.00 | ) | | | (0.00 | ) |
| | | | | | | | | | | | | | | | | | | | |
Total from investment operations | | | (0.25 | ) | | | 0.95 | | | | 4.97 | | | | 9.68 | | | | 4.02 | |
| | | | | | | | | | | | | | | | | | | | |
| Less dividends and distributions: | | | | | | | | | | | | | | | | | | | | |
From net investment income | | | (0.46 | ) | | | (0.73 | ) | | | (0.51 | ) | | | (0.42 | ) | | | (0.42 | ) |
From net realized gain on investments | | | (6.70 | ) | | | (3.70 | ) | | | (0.90 | ) | | | — | | | | — | |
| | | | | | | | | | | | | | | | | | | | |
Total dividends and distributions | | | (7.16 | ) | | | (4.43 | ) | | | (1.41 | ) | | | (0.42 | ) | | | (0.42 | ) |
| | | | | | | | | | | | | | | | | | | | |
Net asset value at end of year | | $ | 36.16 | | | $ | 43.57 | | | $ | 47.05 | | | $ | 43.49 | | | $ | 34.23 | |
| | | | | | | | | | | | | | | | | | | | |
Total investment return (b) | | | (0.43 | %) | | | 1.94 | % | | | 11.71 | % | | | 28.63 | % | | | 13.26 | % |
| Ratios (to average net assets)/Supplemental Data: | | | | | | | | | | | | | | | | | | | | |
Net investment income (loss) | | | 1.06 | % | | | 1.02 | % | | | 1.63 | % | | | 1.43 | % | | | 1.37 | % |
Net expenses | | | 0.94 | % (c) | | | 0.96 | % | | | 0.96 | % | | | 0.96 | % | | | 0.99 | % |
Portfolio turnover rate | | | 42 | % | | | 51 | % | | | 32 | % | | | 29 | % | | | 40 | % |
Net assets at end of year (in 000’s) | | $ | 2,500 | | | $ | 3,607 | | | $ | 7,368 | | | $ | 6,737 | | | $ | 21,761 | |
| ‡ | Less than one cent per share. |
| (a) | Per share data based on average shares outstanding during the year. |
| (b) | Total investment return is calculated exclusive of sales charges and assumes the reinvestment of dividends and distributions. Class R1 shares are not subject to sales charges. |
| (c) | Net of interest expense which is less than one-tenth of a percent. (See Note 6) |
| | | | | | |
The notes to the financial statements are an integral part of,
and should be read in conjunction with, the financial statements. | | | | | 21 | |
Financial Highlights selected per share data and ratios
| | | | | | | | | | | | | | | | | | | | |
| | | Year ended October 31, | |
| Class R2 | | 2016 | | | 2015 | | | 2014 | | | 2013 | | | 2012 | |
Net asset value at beginning of year | | $ | 43.44 | | | $ | 46.92 | | | $ | 43.38 | | | $ | 34.12 | | | $ | 30.53 | |
| | | | | | | | | | | | | | | | | | | | |
Net investment income (loss) (a) | | | 0.29 | | | | 0.34 | | | | 0.63 | | | | 0.38 | | | | 0.38 | |
Net realized and unrealized gain (loss) on investments | | | (0.63 | ) | | | 0.49 | | | | 4.22 | | | | 9.21 | | | | 3.54 | |
Net realized and unrealized gain (loss) on foreign currency transactions ‡ | | | (0.00 | ) | | | (0.00 | ) | | | (0.00 | ) | | | (0.00 | ) | | | (0.00 | ) |
| | | | | | | | | | | | | | | | | | | | |
Total from investment operations | | | (0.34 | ) | | | 0.83 | | | | 4.85 | | | | 9.59 | | | | 3.92 | |
| | | | | | | | | | | | | | | | | | | | |
| Less dividends and distributions: | | | | | | | | | | | | | | | | | | | | |
From net investment income | | | (0.35 | ) | | | (0.61 | ) | | | (0.41 | ) | | | (0.33 | ) | | | (0.33 | ) |
From net realized gain on investments | | | (6.70 | ) | | | (3.70 | ) | | | (0.90 | ) | | | — | | | | — | |
| | | | | | | | | | | | | | | | | | | | |
Total dividends and distributions | | | (7.05 | ) | | | (4.31 | ) | | | (1.31 | ) | | | (0.33 | ) | | | (0.33 | ) |
| | | | | | | | | | | | | | | | | | | | |
Net asset value at end of year | | $ | 36.05 | | | $ | 43.44 | | | $ | 46.92 | | | $ | 43.38 | | | $ | 34.12 | |
| | | | | | | | | | | | | | | | | | | | |
Total investment return (b) | | | (0.68 | %) | | | 1.68 | % | | | 11.43 | % | | | 28.36 | % | | | 12.99 | % |
| Ratios (to average net assets)/Supplemental Data: | | | | | | | | | | | | | | | | | | | | |
Net investment income (loss) | | | 0.80 | % | | | 0.76 | % | | | 1.42 | % | | | 0.98 | % | | | 1.16 | % |
Net expenses | | | 1.20 | % (c) | | | 1.21 | % | | | 1.21 | % | | | 1.21 | % | | | 1.24 | % |
Portfolio turnover rate | | | 42 | % | | | 51 | % | | | 32 | % | | | 29 | % | | | 40 | % |
Net assets at end of year (in 000’s) | | $ | 3,528 | | | $ | 9,993 | | | $ | 15,956 | | | $ | 20,140 | | | $ | 19,072 | |
| ‡ | Less than one cent per share. |
| (a) | Per share data based on average shares outstanding during the year. |
| (b) | Total investment return is calculated exclusive of sales charges and assumes the reinvestment of dividends and distributions. Class R2 shares are not subject to sales charges. |
| (c) | Net of interest expense which is less than one-tenth of a percent. (See Note 6) |
| | | | | | | | | | | | | | | | | | | | |
| | | Year ended October 31, | |
| Class R3 | | 2016 | | | 2015 | | | 2014 | | | 2013 | | | 2012 | |
Net asset value at beginning of year | | $ | 43.22 | | | $ | 46.68 | | | $ | 43.16 | | | $ | 33.94 | | | $ | 30.38 | |
| | | | | | | | | | | | | | | | | | | | |
Net investment income (loss) (a) | | | 0.20 | | | | 0.22 | | | | 0.54 | | | | 0.29 | | | | 0.30 | |
Net realized and unrealized gain (loss) on investments | | | (0.62 | ) | | | 0.51 | | | | 4.17 | | | | 9.16 | | | | 3.53 | |
Net realized and unrealized gain (loss) on foreign currency transactions ‡ | | | (0.00 | ) | | | (0.00 | ) | | | (0.00 | ) | | | (0.00 | ) | | | (0.00 | ) |
| | | | | | | | | | | | | | | | | | | | |
Total from investment operations | | | (0.42 | ) | | | 0.73 | | | | 4.71 | | | | 9.45 | | | | 3.83 | |
| | | | | | | | | | | | | | | | | | | | |
| Less dividends and distributions: | | | | | | | | | | | | | | | | | | | | |
From net investment income | | | (0.23 | ) | | | (0.49 | ) | | | (0.29 | ) | | | (0.23 | ) | | | (0.27 | ) |
From net realized gain on investments | | | (6.70 | ) | | | (3.70 | ) | | | (0.90 | ) | | | — | | | | — | |
| | | | | | | | | | | | | | | | | | | | |
Total dividends and distributions | | | (6.93 | ) | | | (4.19 | ) | | | (1.19 | ) | | | (0.23 | ) | | | (0.27 | ) |
| | | | | | | | | | | | | | | | | | | | |
Net asset value at end of year | | $ | 35.87 | | | $ | 43.22 | | | $ | 46.68 | | | $ | 43.16 | | | $ | 33.94 | |
| | | | | | | | | | | | | | | | | | | | |
Total investment return (b) | | | (0.91 | %) | | | 1.42 | % | | | 11.18 | % | | | 28.03 | % | | | 12.72 | % |
| Ratios (to average net assets)/Supplemental Data: | | | | | | | | | | | | | | | | | | | | |
Net investment income (loss) | | | 0.57 | % | | | 0.51 | % | | | 1.20 | % | | | 0.74 | % | | | 0.94 | % |
Net expenses | | | 1.44 | % (c) | | | 1.46 | % | | | 1.46 | % | | | 1.46 | % | | | 1.49 | % |
Portfolio turnover rate | | | 42 | % | | | 51 | % | | | 32 | % | | | 29 | % | | | 40 | % |
Net assets at end of year (in 000’s) | | $ | 806 | | | $ | 1,062 | | | $ | 1,400 | | | $ | 1,696 | | | $ | 1,809 | |
| ‡ | Less than one cent per share. |
| (a) | Per share data based on average shares outstanding during the year. |
| (b) | Total investment return is calculated exclusive of sales charges and assumes the reinvestment of dividends and distributions. Class R3 shares are not subject to sales charges. |
| (c) | Net of interest expense which is less than one-tenth of a percent. (See Note 6) |
| | | | |
| 22 | | MainStay MAP Fund | | The notes to the financial statements are an integral part of,
and should be read in conjunction with, the financial statements. |
Notes to Financial Statements
Note 1–Organization and Business
The MainStay Funds (the “Trust”) was organized on January 9, 1986, as a Massachusetts business trust. The Trust is registered under the Investment Company Act of 1940, as amended (the “1940 Act”), as an open-end management investment company, and is comprised of twelve funds (collectively referred to as the “Funds”). These financial statements and notes relate to the MainStay MAP Fund (the “Fund”), a “diversified” fund, as that term is defined in the 1940 Act, as interpreted or modified by regulatory authorities having jurisdiction, from time to time.
The Fund currently offers eight classes of shares. Class A, Class B and Class C shares commenced operations on June 9, 1999. Class I shares commenced operations in 1970 (under a former class designation) and were redesignated as Class I shares on June 9, 1999. Class R1 and Class R2 shares commenced operations on January 2, 2004. Class R3 shares commenced operations on April 28, 2006. Investor Class shares commenced operations on February 28, 2008. Class A and Investor Class shares are offered at net asset value (“NAV”) per share plus an initial sales charge. No initial sales charge applies to investments of $1 million or more (and certain other qualified purchases) in Class A and Investor Class shares, but a contingent deferred sales charge (“CDSC”) of 1.00% may be imposed on certain redemptions of such shares made within one year of the date of purchase on shares that were purchased without an initial sales charge made before January 1, 2017. Effective January 1, 2017, a CDSC of 1.00% may be imposed on certain redemptions of Class A and Investor Class shares made within 24 months of the date of purchase of such shares that were made without an initial sales charge. Class B and Class C shares are offered at NAV without an initial sales charge, although a CDSC that declines depending on the number of years a shareholder has held its Class B shares may be imposed on redemptions made within six years of the date of purchase of such shares and a 1.00% CDSC may be imposed on redemptions made within one year of the date of purchase of Class C shares. Class I, Class R1, Class R2 and Class R3 shares are offered at NAV and are not subject to a sales charge. Depending upon eligibility, Class B shares convert to either Class A or Investor Class shares at the end of the calendar quarter eight years after the date they were purchased. Additionally, depending upon eligibility, Class A shares may convert to Investor Class shares and Investor Class shares may convert to Class A shares. Under certain circumstances and as may be permitted by the Trust’s multiple class plan under Rule 18f-3 of the 1940 Act, an exchange/conversion may be made from specified share classes of the fund to one or more other share classes of the Fund as disclosed in the capital share transaction within these notes. The eight classes of shares have the same voting (except for issues that relate solely to one class), dividend, liquidation and other rights, and the same terms and conditions, except that Class B and Class C shares are subject to higher distribution and/or service fee rates than Class A, Investor Class, Class R2 and Class R3 shares under a distribution plan pursuant to Rule 12b-1 under the 1940 Act. Class I and Class R1 shares are not subject to a distribution and/or service fee. Class R1, Class R2 and Class R3 shares are subject to a shareholder service fee. This is in addition to any fees paid under a distribution plan, where applicable.
The Fund’s investment objective is to seek long-term appreciation of capital.
Note 2–Significant Accounting Policies
The Fund is an investment company and accordingly follows the investment company accounting and reporting guidance of the Financial Accounting Standards Board (“FASB”) Accounting Standard Codification Topic 946 Financial Services—Investment Companies. The Fund prepares its financial statements in accordance with generally accepted accounting principles (“GAAP”) in the United States of America and follows the significant accounting policies described below.
(A) Securities Valuation. Investments are usually valued as of the close of regular trading on the New York Stock Exchange (the “Exchange”) (usually 4:00 p.m. Eastern time) on each day the Fund is open for business (“valuation date”).
The Board of Trustees (the “Board”) adopted procedures establishing methodologies for the valuation of the Fund’s securities and other assets and delegated the responsibility for valuation determinations under those procedures to the Valuation Committee of the Trust (the “Valuation Committee”). The Board authorized the Valuation Committee to appoint a Valuation Sub-Committee (the “Sub-Committee”) to deal in the first instance with establishing the prices of securities for which market quotations are not readily available or the prices of which are not otherwise readily determinable under these procedures. The Sub-Committee meets (in person, via electronic mail or via teleconference) on an as-needed basis. Subsequently, the Valuation Committee meets to ensure that actions taken by the Sub-Committee were appropriate. The procedures recognize that, subject to the oversight of the Board and unless otherwise noted, the responsibility for the day-to-day valuation of portfolio assets (including fair value measurements for the Fund’s assets and liabilities) rests with New York Life Investment Management LLC (“New York Life Investments” or the “Manager”), aided to whatever extent necessary by the Subadvisors (as defined in Note 3(A)) to the Fund.
To assess the appropriateness of security valuations, the Manager, Subadvisors or the Fund’s third party service provider, who is subject to oversight by the Manager, regularly compares prior day prices, prices on comparable securities, and the sale prices to the prior and current day prices and challenges prices with changes exceeding certain tolerance levels with third party pricing services or broker sources. For those securities valued through either a standardized fair valuation methodology or a fair valuation measurement, the Sub-Committee deals in the first instance with such valuation and the Valuation Committee reviews and affirms, if appropriate, the reasonableness of the valuation based on such methodologies and measurements on a regular basis after considering all relevant information that is reasonably available. Any action taken by the Sub-Committee with respect to the valuation of a portfolio security or other asset is submitted by the Valuation Committee to the Board for its review and ratification, if appropriate, at its next regularly scheduled meeting.
“Fair value” is defined as the price the Fund would reasonably expect to receive upon selling an asset or liability in an orderly transaction to an independent buyer in the principal or most advantageous market for the asset or liability. Fair value measurements are determined within a framework that establishes a three-tier hierarchy which maximizes the use of observable market data and minimizes the use of unobservable inputs to establish a classification of fair value measurements for disclosure purposes. “Inputs” refer broadly to the assumptions that market
Notes to Financial Statements (continued)
participants would use in pricing the asset or liability, including assumptions about risk, such as the risk inherent in a particular valuation technique used to measure fair value using a pricing model and/or the risk inherent in the inputs for the valuation technique. Inputs may be observable or unobservable. Observable inputs reflect the assumptions market participants would use in pricing the asset or liability based on market data obtained from sources independent of the Fund. Unobservable inputs reflect the Fund’s own assumptions about the assumptions market participants would use in pricing the asset or liability based on the information available. The inputs or methodology used for valuing assets or liabilities may not be an indication of the risks associated with investing in those assets or liabilities. The three-tier hierarchy of inputs is summarized below.
| • | | Level 1—quoted prices in active markets for an identical asset or liability |
| • | | Level 2—other significant observable inputs (including quoted prices for a similar asset or liability in active markets, interest rates and yield curves, prepayment speeds, credit risk, etc.) |
| • | | Level 3—significant unobservable inputs (including the Fund’s own assumptions about the assumptions that market participants would use in measuring fair value of an asset or liability) |
The level of an asset or liability within the fair value hierarchy is based on the lowest level of an input, both individually and in the aggregate, that is significant to the fair value measurement. As of October 31, 2016, the aggregate value by input level of the Fund’s assets and liabilities is included at the end of the Fund’s Portfolio of Investments.
The Fund may use third party vendor evaluations, whose prices may be derived from one or more of the following standard inputs, among others:
| | |
• Reported trades | | • Industry and economic events |
• Broker/dealer quotes | | • Monthly payment information |
• Two-sided markets | | • Benchmark securities |
• Bids/offers | | • Reference data (corporate actions or material event notices) |
An asset or liability for which market values cannot be measured using the methodologies described above is valued by methods deemed reasonable in good faith by the Valuation Committee, following the procedures established by the Board, to represent fair value. Under these procedures, the Fund generally uses a market-based approach which may use related or comparable assets or liabilities, recent transactions, market multiples, book values, and other relevant information. The Fund may also use an income-based valuation approach in which the anticipated future cash flows of the asset or liability are discounted to calculate fair value. Discounts may also be applied due to the nature and/or duration of any restrictions on the disposition of the asset or liability. Fair value represents a good faith approximation of the value of a security. Fair value determinations involve the consideration of a number of subjective factors, an analysis of applicable facts and circumstances and the exercise of judgment. As a result, it is possible that the fair value for a security determined in good faith in accordance with the Fund’s valuation procedures may differ from valuations for the same security determined by other funds using their own valuation procedures. Although the Fund’s valuation procedures are designed to
value a security at the price the Fund may reasonably expect to receive upon its sale in an orderly transaction, there can be no assurance that any fair value determination thereunder would, in fact, approximate the amount that the Fund would actually realize upon the sale of the security or the price at which the security would trade if a reliable market price were readily available. During the year ended October 31, 2016, there were no material changes to the fair value methodologies.
Equity and non-equity securities which may be valued in this manner include, but are not limited to: (i) a security for which trading has been halted or suspended; (ii) a debt security that has recently gone into default and for which there is not a current market quotation; (iii) a security of an issuer that has entered into a restructuring; (iv) a security that has been de-listed from a national exchange; (v) a security for which the market price is not readily available from a third party pricing source or, if so provided, does not, in the opinion of the Manager or Subadvisors reflect the security’s market value; (vi) a security subject to trading collars for which no or limited trading takes place; and (vii) a security whose principal market has been temporarily closed at a time when, under normal conditions, it would be open. Securities for which market quotations or observable inputs are not readily available are generally categorized as Level 3 in the hierarchy. As of October 31, 2016, there were no securities held by the Fund that were fair valued in such a manner.
Certain securities held by the Fund may principally trade in foreign markets. Events may occur between the time the foreign markets close and the time at which the Fund’s NAV is calculated. These events may include, but are not limited to, situations relating to a single issuer in a market sector, significant fluctuations in U.S. or foreign markets, natural disasters, armed conflicts, governmental actions or other developments not tied directly to the securities markets. Should the Manager or Subadvisors conclude that such events may have affected the accuracy of the last price of such securities reported on the local foreign market, the Sub-Committee may, pursuant to procedures adopted by the Board, adjust the value of the local price to reflect the estimated impact on the price of such securities as a result of such events. In this instance, securities are generally categorized as Level 3 in the hierarchy. Additionally, certain foreign equity securities are also fair valued whenever the movement of a particular index exceeds certain thresholds. In such cases, the securities are fair valued by applying factors provided by a third party vendor in accordance with valuation procedures adopted by the Board and are generally categorized as Level 2 in the hierarchy. As of October 31, 2016, no foreign equity securities held by the Fund were fair valued in such a manner.
Equity securities and shares of Exchange-Traded Funds (“ETFs”) are valued at the last quoted sales prices as of the close of regular trading on the relevant exchange on each valuation date. Securities that are not traded on the valuation date are valued at the mean of the last quoted bid and ask prices. Prices are normally taken from the principal market in which each security trades. Investments in mutual funds, including money market funds, are valued at their respective NAVs as of the close of the Exchange on the valuation date. These securities are generally categorized as Level 1 in the hierarchy.
Temporary cash investments acquired in excess of 60 days to maturity at the time of purchase are valued using the latest bid prices or using valuations based on a matrix system (which considers such factors as
security prices, yields, maturities, and ratings), both as furnished by independent pricing services. Other temporary cash investments which mature in 60 days or less at the time of purchase (“Short-Term Investments”) are valued using the amortized cost method of valuation, unless the use of such method would be inappropriate. The amortized cost method involves valuing a security at its cost on the date of purchase and thereafter assuming a constant amortization to maturity of the difference between such cost and the value on maturity date. Amortized cost approximates the current fair value of a security. Securities valued using the amortized cost method are not valued using quoted prices in an active market and are generally categorized as Level 2 in the hierarchy.
Foreign currency forward contracts are valued at their fair market values measured on the basis of the mean between the last current bid and ask prices based on dealer or exchange quotations and are generally categorized as Level 2 in the hierarchy.
The information above is not intended to reflect an exhaustive list of the methodologies that may be used to value portfolio investments. The valuation procedures permit the use of a variety of valuation methodologies in connection with valuing portfolio investments. The methodology used for a specific type of investment may vary based on the market data available or other considerations. The methodologies summarized above may not represent the specific means by which portfolio investments are valued on any particular business day.
A Fund security or other asset may be determined to be illiquid under procedures approved by the Board. Illiquidity of a security might prevent the sale of such security at a time when the Manager or Subadvisors might wish to sell, and these securities could have the effect of decreasing the overall level of the Fund’s liquidity. Further, the lack of an established secondary market may make it more difficult to value illiquid securities, requiring the Fund to rely on judgments that may be somewhat subjective in measuring value, which could vary materially from the amount that the Fund could realize upon disposition. Difficulty in selling illiquid securities may result in a loss or may be costly to the Fund. Under the supervision of the Board, the Manager or Subadvisors determine the liquidity of the Fund’s investments; in doing so, the Manager or Subadvisors may consider various factors, including (i) the frequency of trades and quotations, (ii) the number of dealers and prospective purchasers, (iii) dealer undertakings to make a market, and (iv) the nature of the security and the market in which it trades (e.g., the time needed to dispose of the security, the method of soliciting offers and the mechanics of transfer). Illiquid securities are often valued in accordance with methods deemed by the Board in good faith to be reasonable and appropriate to accurately reflect their fair value. The liquidity of the Fund’s investments, as shown in the Portfolio of Investments, was determined as of October 31, 2016 and can change at any time in response to, among other relevant factors, market conditions or events or developments with respect to an individual issuer or instrument. As of October 31, 2016, the Fund did not hold any securities deemed to be illiquid under procedures approved by the Board.
(B) Income Taxes. The Fund’s policy is to comply with the requirements of the Internal Revenue Code of 1986, as amended (the “Internal Revenue Code”), applicable to regulated investment companies and to distribute all of its taxable income to the shareholders of the Fund within the allowable time limits. Therefore, no federal, state and local income tax provisions are required.
Management evaluates the Fund’s tax positions to determine if the tax positions taken meet the minimum recognition threshold in connection with accounting for uncertainties in income tax positions taken or expected to be taken for the purposes of measuring and recognizing tax liabilities in the financial statements. Recognition of tax benefits of an uncertain tax position is permitted only to the extent the position is “more likely than not” to be sustained assuming examination by taxing authorities. Management has analyzed the Fund’s tax positions taken on federal, state and local income tax returns for all open tax years (for up to three tax years), and has concluded that no provisions for federal, state and local income tax are required in the Fund’s financial statements. The Fund’s federal, state and local income and federal excise tax returns for tax years for which the applicable statutes of limitations have not expired are subject to examination by the Internal Revenue Service and state and local departments of revenue.
(C) Foreign Taxes. The Fund may be subject to foreign taxes on income and other transaction-based taxes imposed by certain countries in which it invests. A portion of the taxes on gains on investments or currency purchases/repatriation may be recoverable. The Fund will accrue such taxes and recoveries as applicable, based upon its current interpretation of tax rules and regulations that exist in the markets in which it invests.
The Fund may be subject to taxation on realized capital gains, repatriation proceeds and other transaction-based taxes imposed by certain countries in which it invests. The Fund will accrue such taxes as applicable based upon its current interpretation of tax rules and regulations that exist in the market in which it invests. Capital gains taxes relating to positions still held are reflected as a liability on the Statement of Assets and Liabilities, as well as an adjustment to the Fund’s net unrealized appreciation (depreciation). Taxes related to capital gains realized during the year ended October 31, 2016, if any, are reflected as part of net realized gain (loss) in the Statement of Operations. Changes in tax liabilities related to capital gains taxes on unrealized investment gains, if any, are reflected as part of the change in net unrealized appreciation (depreciation) on investments in the Statement of Operations. Transaction-based charges are generally assessed as a percentage of the transaction amount.
(D) Dividends and Distributions to Shareholders. Dividends and distributions are recorded on the ex-dividend date. The Fund intends to declare and pay dividends from net investment income and distributions from net realized capital and currency gains, if any, at least annually. Unless the shareholder elects otherwise, all dividends and distributions are reinvested in the same class of shares of the Fund, at NAV. Dividends and distributions to shareholders are determined in accordance with federal income tax regulations and may differ from GAAP.
(E) Security Transactions and Investment Income. The Fund records security transactions on the trade date. Realized gains and losses on security transactions are determined using the identified cost method. Dividend income is recognized on the ex-dividend date; net of any foreign tax withheld at the source, and interest income is accrued as earned using the effective interest rate method. Discounts and premiums on securities purchased, other than Short-Term Investments, for the Fund are accreted and amortized, respectively, on the effective interest rate method over the life of the respective securities. Discounts
Notes to Financial Statements (continued)
and premiums on Short-Term Investments are accreted and amortized, respectively, on the straight-line method. The straight-line method approximates the effective interest method for Short-Term investments. Income from payment-in-kind securities is accreted daily based on the effective interest method.
Investment income and realized and unrealized gains and losses on investments of the Fund are allocated to separate classes of shares pro rata based upon their relative net assets on the date the income is earned or realized and unrealized gains and losses are incurred.
(F) Expenses. Expenses of the Trust are allocated to the individual Funds in proportion to the net assets of the respective Funds when the expenses are incurred, except where direct allocations of expenses can be made. Expenses (other than transfer agent expenses and fees incurred under the shareholder services plans and/or the distribution plans further discussed in Note 3(B)) are allocated to separate classes of shares pro rata based upon their relative net assets on the date the expenses are incurred. The expenses borne by the Fund, including those of related parties to the Fund, are shown in the Statement of Operations.
(G) Use of Estimates. In preparing financial statements in conformity with GAAP, management makes estimates and assumptions that affect the reported amounts and disclosures in the financial statements. Actual results could differ from those estimates.
(H) Repurchase Agreements. The Fund may enter into repurchase agreements to earn income. The Fund may enter into repurchase agreements only with financial institutions that are deemed by the Manager or Subadvisors to be creditworthy, pursuant to guidelines established by the Board. During the term of any repurchase agreement, the Manager or Subadvisors will continue to monitor the creditworthiness of the seller. Under the 1940 Act, repurchase agreements are considered to be collateralized loans by the Fund to the seller secured by the securities transferred to the Fund.
When the Fund enters into repurchase agreements, the Fund’s custodian takes possession of the collateral pledged for investments in the repurchase agreement. The underlying collateral is valued daily on a mark to market basis to determine if the value, including accrued interest, exceeds the repurchase price. In the event of the seller’s default on the obligation to repurchase, the Fund has the right to liquidate the collateral and apply the proceeds in satisfaction of the obligation. Under certain circumstances, such as in the event of default or bankruptcy by the counterparty to the agreement, realization and/or retention of the collateral may be subject to legal proceedings and possible realized loss to the Fund.
(I) Rights and Warrants. Rights are certificates that permit the holder to purchase a certain number of shares, or a fractional share, of a new stock from the issuer at a specific price. Warrants are instruments that entitle the holder to buy an equity security at a specific price for a specific period of time. These investments can provide a greater potential for profit or loss than an equivalent investment in the underlying security. Prices of these investments do not necessarily move in tandem with the prices of the underlying securities.
There is risk involved in the purchase of rights and warrants in that these investments are speculative investments. The Fund could also lose the entire value of its investment in warrants if such warrants are
not exercised by the date of its expiration. The Fund is exposed to risk until the sale or exercise of each right or warrant is completed. As of October 31, 2016, the Fund did not hold any rights or warrants.
(J) Securities Lending. In order to realize additional income, the Fund may engage in securities lending, subject to the limitations set forth in the 1940 Act and relevant guidance by the staff of the Securities and Exchange Commission (“SEC”). In the event the Fund does engage in securities lending, the Fund will lend through its custodian, State Street Bank and Trust Company (“State Street”). State Street will manage the Fund’s cash collateral in accordance with the lending agreement between the Fund and State Street, and indemnify the Fund against counterparty risk. The loans will be collateralized by cash or securities at least equal at all times to the market value of the securities loaned. Collateral will consist of U.S. government securities, cash equivalents or irrevocable letters of credit. The Fund may bear the risk of delay in recovery of, or loss of rights in, the securities loaned should the borrower of the securities experience financial difficulty. The Fund may also record a realized gain or loss on securities deemed sold due to a borrower’s inability to return securities on loan. The Fund bears the risk of any loss on investment of the collateral. The Fund will receive compensation for lending its securities in the form of fees or it will retain a portion of interest on the investment of any cash received as collateral. The Fund will also continue to receive interest and dividends on the securities loaned and any gain or loss in the market price of the securities loaned that may occur during the term of the loan will be for the account of the Fund. During the year ended October 31, 2016, the Fund did not have any portfolio securities on loan.
(K) Foreign Currency Transactions. The Fund’s books and records are maintained in U.S. dollars. Prices of securities denominated in foreign currency amounts are translated into U.S. dollars at the mean between the buying and selling rates last quoted by any major U.S. bank at the following dates:
| (i) | market value of investment securities, other assets and liabilities—at the valuation date; and |
| (ii) | purchases and sales of investment securities, income and expenses—at the date of such transactions. |
The assets and liabilities that are denominated in foreign currency amounts are presented at the exchange rates and market values at the close of the period. The realized and unrealized changes in net assets arising from fluctuations in exchange rates and market prices of securities are not separately presented.
Net realized gain (loss) on foreign currency transactions represents net gains and losses on foreign currency forward contracts, net currency gains or losses realized as a result of differences between the amounts of securities sale proceeds or purchase cost, dividends, interest and withholding taxes as recorded on the Fund’s books, and the U.S. dollar equivalent amount actually received or paid. Net currency gains or losses from valuing such foreign currency denominated assets and liabilities, other than investments at valuation date exchange rates, are reflected in unrealized foreign exchange gains or losses.
(L) Risk. The Fund may invest in foreign securities, which carry certain risks that are in addition to the usual risks inherent in domestic securities. These risks include those resulting from currency fluctuations, future adverse political or economic developments and possible
imposition of currency exchange blockages or other foreign governmental laws or restrictions. These risks are likely to be greater in emerging markets than in developed markets. The ability of issuers of debt securities held by the Fund to meet their obligations may be affected by economic or political developments in a specific country, industry or region.
(M) Indemnifications. Under the Trust’s organizational documents, its officers and trustees are indemnified against certain liabilities that may arise out of performance of their duties to the Trust. Additionally, in the normal course of business, the Fund enters into contracts with third-party service providers that contain a variety of representations and warranties and which may provide general indemnifications. The Fund’s maximum exposure under these arrangements is unknown, as this would involve future claims that may be made against the Fund that have not yet occurred. Based on experience, management is of the view that the risk of loss in connection with these potential indemnification obligations is remote. However, there can be no assurance that material liabilities related to such obligations will not arise in the future, which could adversely impact the Fund.
Note 3–Fees and Related Party Transactions
(A) Manager and Subadvisors. New York Life Investments, a registered investment adviser and an indirect, wholly-owned subsidiary of New York Life Insurance Company (“New York Life”), serves as the Fund’s Manager, pursuant to an Amended and Restated Management Agreement (“Management Agreement”). The Manager provides offices, conducts clerical, recordkeeping and bookkeeping services, and keeps most of the financial and accounting records required to be maintained by the Fund. Except for the portion of salaries and expenses that are the responsibility of the Fund, the Manager pays the salaries and expenses of all personnel affiliated with the Fund and certain operational expenses of the Fund. The Fund reimburses New York Life Investments in an amount equal to a portion of the compensation of the Chief Compliance Officer of the Fund. Markston International LLC (“Markston” or “Subadvisor”) and Institutional Capital LLC (“ICAP” or “Subadvisor”), each registered investment advisers, serve as Subadvisors to the Fund and manage a portion of the Fund’s assets, as designated by New York Life Investments from time to time, subject to the oversight of New York Life Investments. ICAP is a wholly-owned subsidiary of New York Life. Each Subadvisor is responsible for the day-to-day portfolio management of the Fund with respect to its allocated portion of the Fund’s assets. Pursuant to the terms of an Amended and Restated Subadvisory Agreement between New York Life Investments and ICAP, and pursuant to the terms of a Subadvisory Agreement between New York Life Investments and Markston (“Subadvisory Agreements”), New York Life Investments pays for the services of the Subadvisors.
Under the Management Agreement, the Fund pays the Manager a monthly fee for services performed and facilities furnished at an annual rate of the Fund’s average daily net assets as follows: 0.75% up to $1 billion; 0.70% from $1 billion to $3 billion; and 0.675% in excess of $3 billion, plus a fee for fund accounting services previously provided by New York Life Investments under a separate fund accounting agreement furnished at an annual rate of the Fund’s average daily net assets as follows: 0.05% up to $20 million; 0.0333% from $20 million to $100 million; and 0.01% in excess of $100 million.
During the year ended October 31, 2016, the effective management fee rate (exclusive of any applicable waivers/reimbursements) was 0.74% inclusive of a fee for fund accounting services of 0.01% of the Fund’s average daily net assets.
During the year ended October 31, 2016, New York Life Investments earned fees from the Fund in the amount of $11,335,661.
State Street provides sub-administration and sub-accounting services to the Fund pursuant to an agreement with New York Life Investments. These services include calculating the daily NAVs of the Fund, maintaining the general ledger and sub-ledger accounts for the calculation of the Fund’s NAVs, and assisting New York Life Investments in conducting various aspects of the Fund’s administrative operations. For providing these services to the Fund, State Street is compensated by New York Life Investments.
(B) Distribution, Service and Shareholder Service Fees. The Trust, on behalf of the Fund, has entered into a distribution agreement with NYLIFE Distributors LLC (the “Distributor”), an indirect, wholly-owned subsidiary of New York Life. The Fund has adopted distribution plans (the “Plans”) in accordance with the provisions of Rule 12b-1 under the 1940 Act.
Pursuant to the Class A, Investor Class and Class R2 Plans, the Distributor receives a monthly distribution fee from the Class A, Investor Class and Class R2 shares at an annual rate of 0.25% of the average daily net assets of the Class A, Investor Class and Class R2 shares for distribution and/or service activities as designated by the Distributor. Pursuant to the Class B and Class C Plans, Class B and Class C shares pay the Distributor a monthly distribution fee at an annual rate of 0.75% of the average daily net assets of the Class B and Class C shares, along with a service fee at an annual rate of 0.25% of the average daily net assets of the Class B and Class C shares, for a total 12b-1 fee of 1.00%. Pursuant to the Class R3 Plan, the Distributor receives a monthly distribution and/or service fee from the Class R3 shares at an annual rate of 0.50% of the average daily net assets of the Class R3 shares. Class I and Class R1 shares are not subject to a distribution and/or service fee.
The Plans provide that the distribution and service fees are payable to the Distributor regardless of the amounts actually expended by the Distributor for distribution of the Fund’s shares and service activities.
In accordance with the Shareholder Services Plans for the Class R1, Class R2 and Class R3 shares, the Manager has agreed to provide, through its affiliates or independent third parties, various shareholder and administrative support services to shareholders of the Class R1, Class R2 and Class R3 shares. For its services, the Manager, its affiliates, or independent third party service providers are entitled to a shareholder service fee accrued daily and paid monthly at an annual rate of 0.10% of the average daily net assets of the Class R1, Class R2 and Class R3 shares. This is in addition to any fees paid under a distribution plan, where applicable.
During the year ended October 31, 2016, shareholder service fees incurred by the Fund were as follows:
| | | | |
Class R1 | | $ | 2,784 | |
Class R2 | | | 5,899 | |
Class R3 | | | 926 | |
Notes to Financial Statements (continued)
(C) Sales Charges. During the year ended October 31, 2016, the Fund was advised by the Distributor that the amount of initial sales charges retained on sales of Class A and Investor Class shares were $20,564 and $30,728, respectively.
During the year ended October 31, 2016, the Fund was also advised that the Distributor retained CDSCs on redemptions of Class A, Investor Class, Class B and Class C shares of $1,843, $84, $51,306 and $2,345, respectively.
(D) Transfer, Dividend Disbursing and Shareholder Servicing Agent. NYLIM Service Company LLC, an affiliate of New York Life Investments, is the Fund’s transfer, dividend disbursing and shareholder servicing agent pursuant to an agreement between NYLIM Service Company LLC and the Trust. NYLIM Service Company LLC has entered into an agreement with Boston Financial Data Services, Inc. (“BFDS”) pursuant to which BFDS performs certain transfer agent services on behalf of NYLIM Service Company LLC. During the year ended October 31, 2016, transfer agent expenses incurred by the Fund were as follows:
| | | | |
Class A | | $ | 193,707 | |
Investor Class | | | 379,703 | |
Class B | | | 122,731 | |
Class C | | | 280,555 | |
Class I | | | 606,571 | |
Class R1 | | | 1,876 | |
Class R2 | | | 4,269 | |
Class R3 | | | 611 | |
(E) Small Account Fee. Shareholders with small accounts adversely impact the cost of providing transfer agency services. In an effort to reduce total transfer agency expenses, the Fund has implemented a small account fee on certain types of accounts. Certain shareholders with an account balance of less than $1,000 are charged an annual per account fee of $20 (assessed semi-annually), the proceeds from which offset transfer agent fees as reflected in the Statement of Operations.
(F) Capital. As of October 31, 2016, New York Life and its affiliates beneficially held shares of the Fund with values and percentages of net assets as follows:
| | | | | | | | |
Class I | | $ | 84,454,935 | | | | 10.5 | % |
Note 4–Federal Income Tax
As of October 31, 2016, the components of accumulated gain (loss) on a tax basis were as follows:
| | | | | | | | | | | | | | | | |
Ordinary
Income | | Accumulated
Capital and Other Gain (Loss) | | | Other
Temporary
Differences | | | Unrealized
Appreciation
(Depreciation) | | | Total
Accumulated Gain (Loss) | |
$15,221,759 | | $ | 13,832,339 | | | $ | — | | | $ | 295,226,499 | | | $ | 324,280,597 | |
The difference between book-basis and tax-basis unrealized appreciation (depreciation) is primarily due to wash sale adjustments, corporate actions, and return of capital distributions received.
The following table discloses the current year reclassifications between undistributed net investment income (loss), accumulated net realized gain (loss) on investments, and additional paid-in capital arising from permanent differences; net assets as of October 31, 2016 were not affected.
| | | | |
Undistributed
Net Investment
Income (Loss) | | Accumulated
Net Realized
Gain (Loss) on
Investments | | Additional
Paid-In
Capital |
| $(760,016) | | $(482,754) | | $1,242,770 |
The reclassifications for the Fund are primarily due to foreign currency gain (loss), Passive Foreign Investment Company (PFIC) adjustments, return of capital distributions, capital gain distributions from Real Estate Investment Trusts (REITs) and distributions in connection with redemption of fund shares.
During the years ended October 31, 2016 and October 31, 2015, the tax character of distributions paid as reflected in the Statements of Changes in Net Assets was as follows:
| | | | | | | | |
| | | 2016 | | | 2015 | |
Distributions paid from: | | | | | | | | |
Ordinary Income | | $ | 39,745,053 | | | $ | 42,577,199 | |
Long-Term Capital Gain | | | 248,632,732 | | | | 163,916,716 | |
Total | | $ | 288,377,785 | | | $ | 206,493,915 | |
Note 5–Custodian
State Street is the custodian of cash and securities held by the Fund. Custodial fees are charged to the Fund based on the Fund’s net assets and/or the market value of securities held by the Fund and the number of certain transactions incurred by the Fund.
Note 6–Line of Credit
The Fund and certain other funds managed by New York Life Investments, maintain a line of credit with a syndicate of banks in order to secure a source of funds for temporary purposes to meet unanticipated or excessive redemption requests.
Effective August 2, 2016, under an amended and restated credit agreement (the “Credit Agreement”), the aggregate commitment amount is $600,000,000 with an additional uncommitted amount of $100,000,000. The commitment fee is an annual rate of 0.15% of the average commitment amount payable quarterly, regardless of usage, to Bank of New York Mellon, who serves as the agent to the syndicate. The commitment fee is allocated among the Fund and certain affiliated funds based upon their respective net assets and other factors. Interest on any revolving credit loan is charged based upon the Federal Funds Advances Rate or the one month London InterBank Offered Rate, whichever is higher. The Credit Agreement expires on August 1, 2017, although the Fund, certain affiliated funds and the syndicate of banks may renew the Credit Agreement for an additional year on the same or different terms. Prior to August 2, 2016, the aggregate commitment amount was $600,000,000 with an additional uncommitted amount of $100,000,000, and the commitment fee was at an annual rate of 0.10% of the average commitment amount. During the year ended October 31, 2016, the Fund utilized the line of credit for three days,
maintained an average daily balance of $30,255,787 at a weighted average interest rate of 1.337% and incurred interest expense in the amount of $3,372. As of October 31, 2016, there was no borrowings outstanding.
Note 7–Interfund Lending Program
Pursuant to an exemptive order issued by the SEC, the Fund, along with certain other funds managed by New York Life Investments, may participate in an interfund lending program. The interfund lending program provides an alternate credit facility that permits the Fund and certain other funds managed by New York Life Investments to lend or borrow money for temporary purposes directly to or from one another, subject to the conditions of the exemptive order. During the year ended October 31, 2016, there were no interfund loans made or outstanding with respect to the Fund.
Note 8–Purchases and Sales of Securities (in 000’s)
During the year ended October 31, 2016, purchases and sales of securities, other than short-term securities, were $617,862 and $993,676, respectively.
Note 9–Capital Share Transactions
| | | | | | | | |
Class A | | Shares | | | Amount | |
Year ended October 31, 2016: | | | | | | | | |
Shares sold | | | 362,850 | | | $ | 12,838,848 | |
Shares issued to shareholders in reinvestment of dividends and distributions | | | 1,473,310 | | | | 52,494,049 | |
Shares redeemed | | | (1,857,101 | ) | | | (66,067,001 | ) |
| | | | |
Net increase (decrease) in shares outstanding before conversion | | | (20,941 | ) | | | (734,104 | ) |
Shares converted into Class A (See Note 1) | | | 239,631 | | | | 8,456,352 | |
Shares converted from Class A (See Note 1) | | | (46,690 | ) | | | (1,643,409 | ) |
| | | | |
Net increase (decrease) | | | 172,000 | | | $ | 6,078,839 | |
| | | | |
Year ended October 31, 2015: | | | | | | | | |
Shares sold | | | 564,044 | | | $ | 24,857,281 | |
Shares issued to shareholders in reinvestment of dividends and distributions | | | 742,410 | | | | 32,465,588 | |
Shares redeemed | | | (1,406,032 | ) | | | (61,791,301 | ) |
| | | | |
Net increase (decrease) in shares outstanding before conversion | | | (99,578 | ) | | | (4,468,432 | ) |
Shares converted into Class A (See Note 1) | | | 232,747 | | | | 10,333,172 | |
Shares converted from Class A (See Note 1) | | | (138,252 | ) | | | (5,611,127 | ) |
| | | | |
Net increase (decrease) | | | (5,083 | ) | | $ | 253,613 | |
| | | | |
| | | | | | | | |
Investor Class | | Shares | | | Amount | |
Year ended October 31, 2016: | | | | | | | | |
Shares sold | | | 180,779 | | | $ | 6,371,079 | |
Shares issued to shareholders in reinvestment of dividends and distributions | | | 685,316 | | | | 24,417,822 | |
Shares redeemed | | | (499,592 | ) | | | (17,764,615 | ) |
| | | | |
Net increase (decrease) in shares outstanding before conversion | | | 366,503 | | | | 13,024,286 | |
Shares converted into Investor Class (See Note 1) | | | 228,134 | | | | 8,005,153 | |
Shares converted from Investor Class (See Note 1) | | | (199,147 | ) | | | (7,035,547 | ) |
| | | | |
Net increase (decrease) | | | 395,490 | | | $ | 13,993,892 | |
| | | | |
Year ended October 31, 2015: | | | | | | | | |
Shares sold | | | 211,158 | | | $ | 9,286,777 | |
Shares issued to shareholders in reinvestment of dividends and distributions | | | 318,159 | | | | 13,916,248 | |
Shares redeemed | | | (425,477 | ) | | | (18,734,580 | ) |
| | | | |
Net increase (decrease) in shares outstanding before conversion | | | 103,840 | | | | 4,468,445 | |
Shares converted into Investor Class (See Note 1) | | | 324,377 | | | | 13,698,186 | |
Shares converted from Investor Class (See Note 1) | | | (179,819 | ) | | | (8,030,386 | ) |
| | | | |
Net increase (decrease) | | | 248,398 | | | $ | 10,136,245 | |
| | | | |
|
| |
Class B | | Shares | | | Amount | |
Year ended October 31, 2016: | | | | | | | | |
Shares sold | | | 141,309 | | | $ | 4,536,887 | |
Shares issued to shareholders in reinvestment of dividends and distributions | | | 275,209 | | | | 8,927,759 | |
Shares redeemed | | | (276,365 | ) | | | (8,916,909 | ) |
| | | | |
Net increase (decrease) in shares outstanding before conversion | | | 140,153 | | | | 4,547,737 | |
Shares converted from Class B (See Note 1) | | | (245,858 | ) | | | (7,821,715 | ) |
| | | | |
Net increase (decrease) | | | (105,705 | ) | | $ | (3,273,978 | ) |
| | | | |
Year ended October 31, 2015: | | | | | | | | |
Shares sold | | | 127,959 | | | $ | 5,186,970 | |
Shares issued to shareholders in reinvestment of dividends and distributions | | | 156,623 | | | | 6,332,294 | |
Shares redeemed | | | (301,739 | ) | | | (12,195,306 | ) |
| | | | |
Net increase (decrease) in shares outstanding before conversion | | | (17,157 | ) | | | (676,042 | ) |
Shares converted from Class B (See Note 1) | | | (259,251 | ) | | | (10,389,845 | ) |
| | | | |
Net increase (decrease) | | | (276,408 | ) | | $ | (11,065,887 | ) |
| | | | |
|
| |
Notes to Financial Statements (continued)
| | | | | | | | |
Class C | | Shares | | | Amount | |
Year ended October 31, 2016: | | | | | | | | |
Shares sold | | | 186,119 | | | $ | 6,047,511 | |
Shares issued to shareholders in reinvestment of dividends and distributions | | | 526,965 | | | | 17,094,739 | |
Shares redeemed | | | (1,023,378 | ) | | | (32,804,609 | ) |
| | | | |
Net increase (decrease) in shares outstanding before conversion | | | (310,294 | ) | | | (9,662,359 | ) |
Shares converted from Class C (See Note 1) | | | (90 | ) | | | (2,648 | ) |
| | | | |
Net increase (decrease) | | | (310,384 | ) | | $ | (9,665,007 | ) |
| | | | |
Year ended October 31, 2015: | | | | | | | | |
Shares sold | | | 275,014 | | | $ | 11,149,629 | |
Shares issued to shareholders in reinvestment of dividends and distributions | | | 260,869 | | | | 10,546,917 | |
Shares redeemed | | | (689,780 | ) | | | (27,913,347 | ) |
| | | | |
Net increase (decrease) | | | (153,897 | ) | | $ | (6,216,801 | ) |
| | | | |
| | |
| | | | | | | | |
Class I | | Shares | | | Amount | |
Year ended October 31, 2016: | | | | | | | | |
Shares sold | | | 2,153,901 | | | $ | 77,929,229 | |
Shares issued to shareholders in reinvestment of dividends and distributions | | | 4,802,003 | | | | 175,417,157 | |
Shares redeemed | | | (10,330,996 | ) | | | (371,051,100 | ) |
| | | | |
Net increase (decrease) in shares outstanding before conversion | | | (3,375,092 | ) | | | (117,704,714 | ) |
Shares converted into Class I (See Note 1) | | | 1,153 | | | | 41,814 | |
| | | | |
Net increase (decrease) | | | (3,373,939 | ) | | $ | (117,662,900 | ) |
| | | | |
Year ended October 31, 2015: | | | | | | | | |
Shares sold | | | 2,796,007 | | | $ | 124,713,395 | |
Shares issued to shareholders in reinvestment of dividends and distributions | | | 3,050,915 | | | | 136,253,853 | |
Shares redeemed | | | (12,097,821 | ) | | | (537,781,237 | ) |
| | | | |
Net increase (decrease) | | | (6,250,899 | ) | | $ | (276,813,989 | ) |
| | | | |
|
| |
Class R1 | | Shares | | | Amount | |
Year ended October 31, 2016: | | | | | | | | |
Shares sold | | | 17,200 | | | $ | 614,851 | |
Shares issued to shareholders in reinvestment of dividends and distributions | | | 16,678 | | | | 597,420 | |
Shares redeemed | | | (47,520 | ) | | | (1,667,148 | ) |
| | | | |
Net increase (decrease) | | | (13,642 | ) | | $ | (454,877 | ) |
| | | | |
Year ended October 31, 2015: | | | | | | | | |
Shares sold | | | 16,703 | | | $ | 732,583 | |
Shares issued to shareholders in reinvestment of dividends and distributions | | | 7,794 | | | | 342,310 | |
Shares redeemed | | | (98,330 | ) | | | (4,612,672 | ) |
| | | | |
Net increase (decrease) | | | (73,833 | ) | | $ | (3,537,779 | ) |
| | | | |
|
| |
Class R2 | | Shares | | | Amount | |
Year ended October 31, 2016: | | | | | | | | |
Shares sold | | | 23,607 | | | $ | 846,159 | |
Shares issued to shareholders in reinvestment of dividends and distributions | | | 41,542 | | | | 1,486,800 | |
Shares redeemed | | | (197,299 | ) | | | (6,705,795 | ) |
| | | | |
Net increase (decrease) | | | (132,150 | ) | | $ | (4,372,836 | ) |
| | | | |
Year ended October 31, 2015: | | | | | | | | |
Shares sold | | | 25,166 | | | $ | 1,118,113 | |
Shares issued to shareholders in reinvestment of dividends and distributions | | | 30,194 | | | | 1,325,214 | |
Shares redeemed | | | (165,432 | ) | | | (7,381,264 | ) |
| | | | |
Net increase (decrease) | | | (110,072 | ) | | $ | (4,937,937 | ) |
| | | | |
| | | | | | | | |
Class R3 | | Shares | | | Amount | |
Year ended October 31, 2016: | | | | | | | | |
Shares sold | | | 5,978 | | | $ | 221,667 | |
Shares issued to shareholders in reinvestment of dividends and distributions | | | 5,092 | | | | 181,734 | |
Shares redeemed | | | (13,173 | ) | | | (464,107 | ) |
| | | | |
Net increase (decrease) | | | (2,103 | ) | | $ | (60,706 | ) |
| | | | |
Year ended October 31, 2015: | | | | | | | | |
Shares sold | | | 3,330 | | | $ | 147,580 | |
Shares issued to shareholders in reinvestment of dividends and distributions | | | 2,892 | | | | 126,550 | |
Shares redeemed | | | (11,622 | ) | | | (509,899 | ) |
| | | | |
Net increase (decrease) | | | (5,400 | ) | | $ | (235,769 | ) |
| | | | |
Note 10–Recent Accounting Pronouncement
In October 2016, the U.S. Securities and Exchange Commission adopted new rules and amended existing rules (together, “final rules”) intended to modernize the reporting and disclosure of information by registered investment companies. In part, the final rules amend Regulation S-X and require standardized, enhanced disclosure about derivatives in investment company financial statements, as well as other amendments. The compliance date for the amendments to Regulation S-X is August 1, 2017. Management is currently evaluating the impact that the adoption of the amendments to Regulation S-X will have on the Fund’s financial statements and related disclosures.
Note 11–Subsequent Events
In connection with the preparation of the financial statements of the Fund as of and for the fiscal year ended October 31, 2016, events and transactions subsequent to October 31, 2016, through the date the financial statements were issued have been evaluated by the Fund’s management for possible adjustment and/or disclosure. No subsequent events requiring financial statement adjustment or disclosure have been identified other than the following:
Effective February 28, 2017, Class B shares of the MainStay Group of Funds will be closed to all new purchases as well as additional investments by existing Class B shareholders. Existing Class B shareholders may continue to reinvest dividends and capital gains distributions, as well as exchange their Class B shares for Class B shares of other Funds as permitted by the current exchange privileges. Class B shareholders will continue to be subject to any applicable contingent deferred sales charge at the time of redemption. All other features of the Class B shares, including but not limited to the fees and expenses applicable to Class B shares, will remain unchanged. Unless redeemed, Class B Shares shareholders will remain in Class B shares of their respective Fund until the Class B shares are converted to Class A or Investor Class shares pursuant to the applicable conversion schedule.
Report of Independent Registered Public Accounting Firm
The Board of Trustees and Shareholders of
The MainStay Funds:
We have audited the accompanying statement of assets and liabilities, including the portfolio of investments, of the MainStay MAP Fund (the “Fund”), one of the funds constituting The MainStay Funds, as of October 31, 2016, and the related statement of operations for the year then ended, the statements of changes in net assets for each of the years in the two-year period then ended, and the financial highlights for each of the years in the five-year period then ended. These financial statements and financial highlights are the responsibility of the Fund’s management. Our responsibility is to express an opinion on these financial statements and financial highlights based on our audits.
We conducted our audits in accordance with the standards of the Public Company Accounting Oversight Board (United States). Those standards require that we plan and perform the audit to obtain reasonable assurance about whether the financial statements and financial highlights are free of material misstatement. An audit includes examining, on a test basis, evidence supporting the amounts and disclosures in the financial statements. Our procedures included confirmation of securities owned as of October 31, 2016, by correspondence with the custodian and brokers or by other appropriate auditing procedures where replies from brokers were not received. An audit also includes assessing the accounting principles used and significant estimates made by management, as well as evaluating the overall financial statement presentation. We believe that our audits provide a reasonable basis for our opinion.
In our opinion, the financial statements and financial highlights referred to above present fairly, in all material respects, the financial position of the MainStay MAP Fund of The MainStay Funds as of October 31, 2016, the results of its operations for the year then ended, the changes in its net assets for each of the years in the two-year period then ended, and the financial highlights for each of the years in the five-year period then ended, in conformity with U.S. generally accepted accounting principles.

Philadelphia, Pennsylvania
December 22, 2016
Federal Income Tax Information
(Unaudited)
The Fund is required under the Internal Revenue Code to advise shareholders in a written statement as to the federal tax status of dividends paid by the Fund during such fiscal years. Accordingly, the Fund paid $249,875,502 as long term capital gain distributions.
For the fiscal year ended October 31, 2016, the Fund designated approximately $33,741,033 under the Internal Revenue Code as qualified dividend income eligible for reduced tax rates.
The dividends paid by the Fund during the fiscal year ended October 31, 2016, should be multiplied by 68.9% to arrive at the amount eligible for the corporate dividends received deduction.
In February 2017, shareholders will receive an IRS Form 1099-DIV or substitute Form 1099 which will show the federal tax status of the distributions received by shareholders in calendar year 2016. The amounts that will be reported on such 1099-DIV or substitute Form 1099 will be the amounts you are to use on your federal income tax return and will differ from the amounts which we must report for the Fund’s fiscal year ended October 31, 2016.
Proxy Voting Policies and Procedures and Proxy Voting Record
A description of the policies and procedures that New York Life Investments uses to vote proxies related to the Fund’s securities is available without charge, upon request, (i) by visiting the Fund’s website at mainstayinvestments.com; or (ii) on the SEC’s website at www.sec.gov.
The Fund is required to file with the SEC its proxy voting record for the 12-month period ending June 30 on Form N-PX. The Fund’s most recent Form N-PX or proxy voting record is available free of charge upon request (i) by calling 800-MAINSTAY (624-6782); (ii) by visiting the Fund’s website at mainstayinvestments.com; or (iii) on the SEC’s website at www.sec.gov.
Shareholder Reports and Quarterly Portfolio Disclosure
The Fund is required to file its complete schedule of portfolio holdings with the SEC for its first and third fiscal quarters on Form N-Q. The Fund’s Form N-Q is available without charge on the SEC’s website at www.sec.gov or by calling MainStay Investments at 800-MAINSTAY (624-6782). You also can obtain and review copies of Form N-Q by visiting the SEC’s Public Reference Room in Washington, DC (information on the operation of the Public Reference Room may be obtained by calling 1-800-SEC-0330).
Board Members and Officers (Unaudited)
The Trustees and officers of the Funds are listed below. The Board oversees the MainStay Group of Funds, MainStay VP Funds Trust, MainStay DefinedTerm Municipal Opportunities Fund, the Manager and the Subadvisors, and elects the officers of the Funds who are responsible for the day-to-day operations of the Funds. Information pertaining to the Trustees and officers is set forth below. Each Trustee serves until his or her successor is elected and qualified or until his or her resignation, death or removal. Under the Retirement Policy, a Trustee must
tender his or her resignation by the end of the calendar year during which he or she reaches the age of 75 (although the Board of Trustees may make exceptions from time to time). Officers serve a term of one year and are elected annually by the Board of Trustees. The business address of each Trustee and officer listed below is 51 Madison Avenue, New York, New York 10010. A majority of the Trustees are not “interested persons” (as defined by the 1940 Act and rules “adopted” by the SEC thereunder) of the Fund (“Independent Trustees”).
| | | | | | | | | | | | |
| | | | | Name and Date of Birth | | Term of Office, Position(s) Held and Length of Service | | Principal Occupation(s) During Past Five Years | | Number of
Portfolios in
Fund Complex
Overseen by
Board Member | | Other Directorships Held By Board Member |
Interested Trustee | | | | Christopher O. Blunt* 5/13/62 | | MainStay Funds: Trustee since January 2016; MainStay Funds Trust: Trustee since January 2016. | | Executive Vice President (since 2009), President, Investments Group (since 2015), Member of the Executive Management Committee (since 2007), Co-President, Insurance and Agency Group (2012 to 2015), President, Insurance Group (2012 to 2014), Executive Vice President, Retirement Income Security (2008 to 2012), New York Life Insurance Company. | | 83 | | MainStay VP Funds Trust:
Trustee since January 2016 (31 portfolios); and
MainStay DefinedTerm Municipal Opportunities Fund: Trustee since January 2016. |
| | * | This Trustee is considered to be an “interested person” of the MainStay Group of Funds within the meaning of the 1940 Act because of his affiliation with New York Life Insurance Company, New York Life Investment Management LLC, Cornerstone Capital Management Holdings LLC, MacKay Shields LLC, Institutional Capital LLC, NYL Investors LLC, NYLIFE Securities LLC and/or NYLIFE Distributors LLC, as described in detail above in the column entitled “Principal Occupation(s) During Past Five Years.” |
| | | | | | | | | | | | |
| | | | | Name and Date of Birth | | Term of Office, Position(s) Held and Length of Service | | Principal Occupation(s) During Past Five Years | | Number of Portfolios in Fund Complex Overseen by Board Member | | Other Directorships Held By Board Member |
| Non-Interested Trustee | | | | David H. Chow 12/29/57 | | MainStay Funds: Trustee since January 2016, Advisory Board Member (June 2015 to December 2015); MainStay Funds Trust: Trustee since January 2016, Advisory Board Member (June 2015 to December 2015). | | Founder and CEO, DanCourt Management, LLC (since 1999) | | 83 | | MainStay VP Funds Trust: Trustee since January 2016, Advisory Board Member (June 2015 to December 2015); (31 portfolios);
MainStay DefinedTerm Municipal Opportunities Fund: Trustee since January 2016, Advisory Board Member (June 2015 to December 2015);
Market Vectors Group of Exchange-Traded Funds: Independent Chairman of the Board of Trustees since 2008 and Trustee since 2006 (55 portfolios); and
Berea College of Kentucky: Trustee since 2009. |
| | | | Susan B. Kerley 8/12/51 | | MainStay Funds: Trustee since 2007; MainStay Funds Trust: Trustee since 1990.*** | | President, Strategic Management Advisors LLC (since 1990) | | 83 | | MainStay VP Funds Trust: Trustee since 2007 (31 portfolios)**;
MainStay DefinedTerm Municipal Opportunities Fund: Trustee since 2011; and Legg Mason Partners Funds: Trustee since 1991 (53 portfolios). |
| | | | Alan R. Latshaw 3/27/51 | | MainStay Funds: Trustee and Audit Committee Financial Expert since 2006; MainStay Funds Trust: Trustee and Audit Committee Financial Expert since 2007.*** | | Retired; Partner, Ernst & Young LLP (2002 to 2003); Partner, Arthur Andersen LLP (1989 to 2002); Consultant to the MainStay Funds Audit and Compliance Committee (2004 to 2006) | | 83 | | MainStay VP Funds Trust: Trustee and Audit Committee Financial Expert since 2007 (31 portfolios)**;
MainStay DefinedTerm Municipal Opportunities Fund: Trustee and Audit Committee Financial Expert since 2011;
State Farm Associates Funds Trusts: Trustee since 2005 (4 portfolios);
State Farm Mutual Fund Trust: Trustee since 2005 (15 portfolios); and
State Farm Variable Product Trust: Trustee since 2005 (9 portfolios). |
| | | | Peter Meenan 12/5/41 | | MainStay Funds: Chairman since 2013 and Trustee since 2007; MainStay Funds Trust: Chairman since 2013 and Trustee since 2002.*** | | Retired; Independent Consultant (2004 to 2013); President and Chief Executive Officer, Babson—United, Inc. (financial services firm) (2000 to 2004); Independent Consultant (1999 to 2000); Head of Global Funds, Citicorp (1995 to 1999) | | 83 | | MainStay VP Funds Trust: Chairman since 2013 and Trustee since 2007 (31 portfolios)**; and
MainStay DefinedTerm Municipal Opportunities Fund: Chairman since 2013 and Trustee since 2011. |
| | | | Richard H. Nolan, Jr. 11/16/46 | | MainStay Funds: Trustee since 2007; MainStay Funds Trust: Trustee since 2007.*** | | Managing Director, ICC Capital Management (since 2004); President—Shields/Alliance, Alliance Capital Management (1994 to 2004) | | 83 | | MainStay VP Funds Trust: Trustee since 2006 (31 portfolios)**; and
MainStay DefinedTerm Municipal Opportunities Fund: Trustee since 2011. |
| | | | Jacques P. Perold 5/12/58 | | MainStay Funds: Trustee since January 2016, Advisory Board Member (June 2015 to December 2015); MainStay Funds Trust: Trustee since January 2016, Advisory Board Member (June 2015 to December 2015). | | Retired; President, Fidelity Management & Research Company (2009 to 2014); Founder, President and Chief Executive Officer, Geode Capital Management, LCC (2001 to 2009) | | 83 | | MainStay VP Funds Trust: Trustee since January 2016, Advisory Board Member (June 2015 to December 2015); (31 portfolios);
MainStay DefinedTerm Municipal Opportunities Fund: Trustee since January 2016, Advisory Board Member (June 2015 to December 2015);
Allstate Corporation: Director since 2015; and
Boston University: Trustee since 2014. |
| | | | | | | | | | | | |
| | | | | Name and Date of Birth | | Term of Office, Position(s) Held and Length of Service | | Principal Occupation(s) During Past Five Years | | Number of Portfolios in Fund Complex Overseen by Board Member | | Other Directorships Held By Board Member |
Non-Interested Trustee | | | | Richard S. Trutanic 2/13/52 | | MainStay Funds: Trustee since 1994; MainStay Funds Trust: Trustee since 2007.*** | | Chairman and Chief Executive Officer, Somerset & Company (financial advisory firm) (since 2004); Managing Director, The Carlyle Group (private investment firm) (2002 to 2004); Senior Managing Director, Partner and Board Member, Groupe Arnault S.A. (private investment firm) (1999 to 2002) | | 83 | | MainStay VP Funds Trust: Trustee since 2007 (31 portfolios)**; and
MainStay DefinedTerm Municipal Opportunities Fund: Trustee since 2011. |
| | | | John A. Weisser**** 10/22/41 | | MainStay Funds: Trustee since 2007; MainStay Funds Trust: Trustee since 2007.*** | | Retired; Managing Director of Salomon Brothers, Inc. (1971 to 1995) | | 83 | | MainStay VP Funds Trust: Trustee since 1997 (31 portfolios)**; MainStay DefinedTerm Municipal Opportunities Fund: Trustee since 2011; Direxion Insurance Trust: Trustee since 2007 (1 portfolio); Direxion Funds: Trustee since 2007 (18 portfolios); and Direxion Shares ETF Trust: Trustee since 2008 (52 portfolios). |
| | ** | Includes prior service as a Director of MainStay VP Series Fund, Inc., the predecessor to MainStay VP Funds Trust. |
| | *** | Includes prior service as a Director/Trustee of certain predecessor entities to MainStay Funds Trust. |
| | **** | Pursuant to the Retirement Policy, Mr. Weisser will retire from the Board of Trustees on or about December 31, 2016. |
| | | | | | | | |
| | | | | Name and Date of Birth | | Position(s) Held and Length of Service | | Principal Occupation(s) During Past Five Years |
Officers (Who Are Not Board Members)* | | | | Stephen P. Fisher 2/22/59 | | President, MainStay Funds (since 2007), MainStay Funds Trust (since 2009) | | Chairman and Chief Executive Officer (since 2014), President and Chief Operating Officer (2008 to 2013), NYLIFE Distributors LLC; Chairman of the Board, NYLIM Service Company LLC (since 2008); President (since May 2015), Co-President (2014 to 2015) and Senior Managing Director (since 2005), New York Life Investment Management LLC; President, MainStay DefinedTerm Municipal Opportunities Fund (since 2011) and MainStay VP Funds Trust (since 2007)** |
| | | | Jack R. Benintende 5/12/64 | | Treasurer and Principal Financial and Accounting Officer, MainStay Funds (since 2007), MainStay Funds Trust (since 2009) | | Managing Director, New York Life Investment Management LLC (since 2007); Treasurer and Principal Financial and Accounting Officer, MainStay DefinedTerm Municipal Opportunities Fund (since 2011) and MainStay VP Funds Trust (since 2007)**; and Assistant Treasurer, New York Life Investment Management Holdings LLC (2008 to 2012) |
| | | | Kevin M. Bopp 2/24/69 | | Vice President and Chief Compliance Officer, MainStay Funds and MainStay Funds Trust (since 2014) | | Chief Compliance Officer (since January 2016), Director and Associate General Counsel (2011 to 2014) and Vice President and Assistant General Counsel (2010 to 2011), New York Life Investment Management LLC; Vice President and Chief Compliance Officer, MainStay VP Funds Trust, MainStay DefinedTerm Municipal Opportunities Fund (since 2014); Assistant Secretary, MainStay Funds, MainStay Funds Trust and MainStay VP Funds Trust (2010 to 2014)**, MainStay DefinedTerm Municipal Opportunities Fund (2011 to 2014) |
| | | | J. Kevin Gao 10/13/67 | | Secretary and Chief Legal Officer, MainStay Funds and MainStay Funds Trust (since 2010) | | Managing Director and Associate General Counsel, New York Life Investment Management LLC (since 2010); Secretary and Chief Legal Officer, MainStay DefinedTerm Municipal Opportunities Fund (since 2011) and MainStay VP Funds Trust (since 2010)** |
| | | | Scott T. Harrington 2/8/59 | | Vice President— Administration, MainStay Funds (since 2005), MainStay Funds Trust (since 2009) | | Director, New York Life Investment Management LLC (including predecessor advisory organizations) (since 2000); Member of the Board of Directors, New York Life Trust Company (since 2009); Vice President—Administration, MainStay DefinedTerm Municipal Opportunities Fund (since 2011) and MainStay VP Funds Trust (since 2005)** |
| | * | The Officers listed above are considered to be “interested persons” of the MainStay Group of Funds within the meaning of the 1940 Act because of their affiliation with the MainStay Group of Funds, New York Life Insurance Company and/or its affiliates, including New York Life Investment Management LLC, NYLIM Service Company LLC, NYLIFE Securities LLC and/or NYLIFE Distributors LLC, as described in detail in the column captioned “Principal Occupation(s) During Past Five Years.” Officers are elected annually by the Board to serve a one year term. |
| | ** | Includes prior service as an Officer of MainStay VP Series Fund, Inc., the predecessor to MainStay VP Funds Trust. |
This page intentionally left blank
This page intentionally left blank
MainStay Funds
MainStay offers a wide range of Funds for virtually any investment need. The full array of MainStay open-end offerings is listed here, with information about the manager, subadvisors, legal counsel and independent registered public accounting firm.
Equity
U.S. Equity
MainStay Common Stock Fund
MainStay Cornerstone Growth Fund
MainStay Epoch U.S. All Cap Fund
MainStay Epoch U.S. Equity Yield Fund
MainStay Epoch U.S. Small Cap Fund
MainStay ICAP Equity Fund
MainStay ICAP Select Equity Fund
MainStay Large Cap Growth Fund
MainStay MAP Fund
MainStay S&P 500 Index Fund
MainStay U.S. Equity Opportunities Fund
International/Global Equity
MainStay Emerging Markets Opportunities Fund
MainStay Epoch Capital Growth Fund
MainStay Epoch Global Choice Fund
MainStay Epoch Global Equity Yield Fund
MainStay Epoch International Small Cap Fund
MainStay ICAP International Fund
MainStay International Equity Fund
MainStay International Opportunities Fund
Income
Taxable Bond
MainStay Floating Rate Fund
MainStay Global High Income Fund
MainStay Government Fund
MainStay High Yield Corporate Bond Fund
MainStay High Yield Opportunities Fund
MainStay Indexed Bond Fund
MainStay Short Duration High Yield Fund
MainStay Total Return Bond Fund
MainStay Unconstrained Bond Fund
Municipal/Tax Advantaged Bond
MainStay California Tax Free Opportunities Fund1
MainStay High Yield Municipal Bond Fund
MainStay New York Tax Free Opportunities Fund2
MainStay Tax Advantaged Short Term Bond Fund
MainStay Tax Free Bond Fund
Money Market
MainStay Money Market Fund
Mixed Asset
MainStay Balanced Fund
MainStay Convertible Fund
MainStay Income Builder Fund
Alternative
MainStay Absolute Return Multi-Strategy Fund
MainStay Cushing Energy Income Fund
MainStay Cushing MLP Premier Fund
MainStay Cushing Renaissance Advantage Fund
Asset Allocation/Target Date
MainStay Conservative Allocation Fund
MainStay Growth Allocation Fund
MainStay Moderate Allocation Fund
MainStay Moderate Growth Allocation Fund
MainStay Retirement 2010 Fund
MainStay Retirement 2020 Fund
MainStay Retirement 2030 Fund
MainStay Retirement 2040 Fund
MainStay Retirement 2050 Fund
MainStay Retirement 2060 Fund
Manager
New York Life Investment Management LLC
New York, New York
Subadvisors
Candriam France S.A.S.3
Paris, France
Cornerstone Capital Management Holdings LLC3
New York, New York
Cushing Asset Management, LP
Dallas, Texas
Epoch Investment Partners, Inc.
New York, New York
Institutional Capital LLC3
Chicago, Illinois
MacKay Shields LLC3
New York, New York
Markston International LLC
White Plains, New York
NYL Investors LLC3
New York, New York
Winslow Capital Management, LLC
Minneapolis, Minnesota
Legal Counsel
Dechert LLP
Washington, District of Columbia
Independent Registered Public Accounting Firm
KPMG LLP
Philadelphia, Pennsylvania
1. This Fund is only registered for sale in AZ, CA, MI (Class A and Class I shares only), NV, OR, TX, UT and WA.
2. This Fund is only registered for sale in CA, CT, DE, FL, MA, NJ, NY and VT.
3. An affiliate of New York Life Investment Management LLC.
Not part of the Annual Report
For more information
800-MAINSTAY (624-6782)
mainstayinvestments.com
MainStay Investments® is a registered service mark and name under which New York Life Investment Management LLC does business. MainStay Investments, an indirect subsidiary of New York Life Insurance Company, New York, NY 10010, provides investment advisory products and services. The MainStay Funds® are managed by New York Life Investment Management LLC and distributed by NYLIFE Distributors LLC, 30 Hudson Street, Jersey City, NJ 07302, a wholly owned subsidiary of New York Life Insurance Company. NYLIFE Distributors LLC is a Member FINRA/SIPC.
©2016 NYLIFE Distributors LLC. All rights reserved.
| | | | | | | | |
| Not FDIC/NCUA Insured | | Not a Deposit | | May Lose Value | | No Bank Guarantee | | Not Insured by Any Government Agency |
| | |
| 1717394 MS316-16 | | MSMP11-12/16 (NYLIM) NL220 |
As of the end of the period covered by this report, the Registrant has adopted a code of ethics (the “Code”) that applies to the Registrant’s principal executive officer (“PEO”) and principal financial officer (“PFO��). A copy of the Code is filed herewith. The Registrant did not grant any waivers, including implicit waivers, from any provisions of the Code to the PEO or PFO during the period covered by this report.
| Item 3. | Audit Committee Financial Expert. |
The Board of Trustees has determined that the Registrant has one audit committee financial expert serving on its Audit Committee. The Audit Committee financial expert is Alan R. Latshaw. Mr. Latshaw is “independent” within the meaning of that term under the Investment Company Act of 1940.
| Item 4. | Principal Accountant Fees and Services. |
The aggregate fees billed for the fiscal year ended October 31, 2016 for professional services rendered by KPMG for the audit of the Registrant’s annual financial statements or services that are normally provided by KPMG in connection with statutory and regulatory filings or engagements for that fiscal year were $690,100.
The aggregate fees billed for the fiscal year ended October 31, 2015 for professional services rendered by KPMG LLP (“KPMG”) for the audit of the Registrant’s annual financial statements or services that are normally provided by KPMG in connection with statutory and regulatory filings or engagements for that fiscal year were $656,500.
The aggregate fees billed for assurance and related services by KPMG that are reasonably related to the performance of the audit of the Registrant’s financial statements and are not reported under paragraph (a) of this Item were: (i) $2,500 for the fiscal year ended October 31, 2016, and (ii) $0 for the fiscal year ended October 31, 2015. These audit-related services include review of financial highlights for Registrant’s registration statements and issuance of consents to use the auditor’s reports.
The aggregate fees billed for professional services rendered by KPMG for tax compliance, tax advice, and tax planning were: (i) $0 during the fiscal year ended October 31, 2016, and (ii) $0 during the fiscal year ended October 31, 2015. These services primarily included preparation of federal, state and local income tax returns and excise tax returns, as well as services relating to excise tax distribution requirements.
The aggregate fees billed for products and services provided by KPMG, other than the services reported in paragraphs (a) through (c) of this Item were: (i) $0 during the fiscal year ended October 31, 2016, and (ii) $0 during the fiscal year ended October 31, 2015.
| (e) | Pre-Approval Policies and Procedures |
| | (1) | The Registrant’s Audit and Compliance Committee has adopted pre-approval policies and procedures (the “Procedures”) to govern the Committee’s pre-approval of (i) all audit services and permissible non-audit services to be provided to the Registrant by its independent accountant, and (ii) all permissible non-audit services to be provided by such independent accountant to the Registrant’s investment adviser and to any entity controlling, controlled by or under common control with the investment adviser that provides ongoing services to the Registrant (collectively, the “Service Affiliates”) if the services directly relate to the Registrant’s operations and financial reporting. In accordance with the Procedures, the Audit and Compliance Committee is responsible for the engagement of the independent accountant to certify the Registrant’s financial statements for each fiscal year. With respect to the pre-approval of non-audit services provided to the Registrant and its Service Affiliates, the Procedures provide that the Audit and Compliance Committee may annually pre-approve a list of the types of services that may be provided to the Registrant or its Service Affiliates, or the Audit and Compliance Committee may pre-approve such services on a project-by-project basis as they arise. Unless a type of service has received general pre-approval, it will require specific pre-approval by the Audit and Compliance Committee if it is to be provided by the independent accountant. The Procedures also permit the Audit and Compliance Committee to delegate authority to one or more of its members to pre-approve any proposed non-audit services that have not been previously pre-approved by the Audit and Compliance Committee, subject to the ratification by the full Audit and Compliance Committee no later than its next scheduled meeting. To date, the Audit and Compliance Committee has not delegated such authority. |
| | (2) | With respect to the services described in paragraphs (b) through (d) of this Item 4, no amount was approved by the Audit and Compliance Committee pursuant to paragraph (c)(7)(i)(C) of Rule 2-01 of Regulation S-X. |
(f) There were no hours expended on KPMG’s engagement to audit the Registrant’s financial statements for the most recent fiscal year attributable to work performed by persons other than KPMG’s full-time, permanent employees.
(g) All non-audit fees billed by KPMG for services rendered to the Registrant for the fiscal years ended October 31, 2016 and October 31, 2015 are disclosed in 4(b)-(d) above.
The aggregate non-audit fees billed by KPMG for services rendered to the Registrant’s investment adviser (not including any sub-adviser whose role is primarily portfolio management and is subcontracted with or overseen by another investment adviser), and any entity controlling, controlled by, or under common control with the adviser that provides ongoing services to the Registrant were approximately: (i) $0 for the fiscal year ended October 31, 2016, and (ii) $0 for the fiscal year ended October 31, 2015.
(h) The Registrant’s Audit and Compliance Committee has determined that the non-audit services rendered by KPMG for the fiscal year ended October 31, 2016 to the Registrant’s investment adviser and any entity controlling, controlled by, or under common control with the Registrant’s investment adviser that provides ongoing services to the Registrant that were not required to be pre-approved by the Audit and Compliance Committee because they did not relate directly to the operations and financial reporting of the
registrant were compatible with maintaining the respective independence of KPMG during the relevant time period.
| Item 5. | Audit Committee of Listed Registrants |
Not applicable.
| Item 6. | Schedule of Investments |
The Schedule of Investments is included as part of Item 1 of this report.
| Item 7. | Disclosure of Proxy Voting Policies and Procedures for Closed-End Management Investment Companies. |
Not applicable.
| Item 8. | Portfolio Managers of Closed-End Management Investment Companies. |
Not applicable.
| Item 9. | Purchases of Equity Securities by Closed-End Management Investment Company and Affiliated Purchasers. |
Not Applicable.
| Item 10. | Submission of Matters to a Vote of Security Holders. |
Since the Registrant’s last response to this Item, there have been no material changes to the procedures by which shareholders may recommend nominees to the Registrant’s Board of Trustees.
Item 11. Controls and Procedures.
(a) Based on an evaluation of the Registrant’s Disclosure Controls and Procedures (as defined in Rule 30a-3(c) under the Investment Company Act of 1940) (the “Disclosure Controls”), as of a date within 90 days prior to the filing date (the “Filing Date”) of this Form N-CSR (the “Report”), the Registrant’s principal executive officer and principal financial officer have concluded that the Disclosure Controls are reasonably designed to ensure that information required to be disclosed by the Registrant in the Report is recorded, processed, summarized and reported by the Filing Date, including ensuring that information required to be disclosed in the Report is accumulated and communicated to the Registrant’s management, including the Registrant’s principal executive officer and principal financial officer, as appropriate to allow timely decisions regarding required disclosure.
(b) There were no changes in the Registrant’s internal control over financial reporting (as defined in Rule 30a-3(d)) under the Investment Company Act of 1940 that occurred during the second fiscal quarter of the period covered by this report that has materially affected, or is reasonably likely to materially affect, the Registrant’s internal control over financial reporting.
Item 12. Exhibits.
| (a)(2) | Certifications of principal executive officer and principal financial officer as required by Rule 30a-2 under the Investment Company Act of 1940. |
| (b) | Certifications of principal executive officer and principal financial officer as required by Section 906 of the Sarbanes-Oxley Act of 2002. |
SIGNATURES
Pursuant to the requirements of the Securities Exchange Act of 1934 and the Investment Company Act of 1940, the Registrant has duly caused this Report to be signed on its behalf by the undersigned, thereunto duly authorized.
THE MAINSTAY FUNDS
| | |
By: | | /s/ Stephen P. Fisher |
| | Stephen P. Fisher |
| | President and Principal Executive Officer |
Date: January 6, 2017
Pursuant to the requirements of the Securities Exchange Act of 1934 and the Investment Company Act of 1940, this Report has been signed below by the following persons on behalf of the Registrant and in the capacities and on the dates indicated.
| | |
By: | | /s/ Stephen P. Fisher |
| | Stephen P. Fisher |
| | President and Principal Executive Officer |
Date: January 6, 2017
| | |
By: | | /s/ Jack R. Benintende |
| | Jack R. Benintende |
| | Treasurer and Principal Financial and Accounting Officer |
Date: January 6, 2017
EXHIBIT INDEX
| | |
| (a)(1) | | Code of Ethics |
| |
| (a)(2) | | Certifications of principal executive officer and principal financial officer as required by Rule 30a-2 under the Investment Company Act of 1940. |
| |
| (b) | | Certification of principal executive officer and principal financial officer as required by Section 906 of the Sarbanes-Oxley Act of 2002. |